ALPHATEC HOLDINGS, INC.
10-Ks and 10-Qs
|
|
|
|
|
|
|
|
|
|
|
|
|
|
|
|
|
|
|
|
|
|
|
|
|
|
|
|
|
|
|
|
|
|
|
|
|
|
|
|
|
|
|
|
|
|
|
|
|
|
|
|
|
|
|
|
|
|
|
UNITED STATES
SECURITIES AND EXCHANGE COMMISSION
WASHINGTON, DC 20549
_________________________________
Form 10-K
_________________________________
(Mark One)
|
ý
|
ANNUAL REPORT PURSUANT TO SECTION 13 OR 15(d) OF THE SECURITIES EXCHANGE ACT OF 1934
|
For the fiscal year ended
December 31, 2015
or
|
¨
|
TRANSITION REPORT PURSUANT TO SECTION 13 OR 15(d) OF THE SECURITIES EXCHANGE ACT OF 1934
|
For the transition period from to
Commission file number: 000-52024
_________________________________
ALPHATEC HOLDINGS, INC.
(Exact Name of Registrant as Specified in its Charter)
_________________________________
|
Delaware
|
|
20-2463898
|
|
(State or Other Jurisdiction of
Incorporation or Organization)
|
|
(I.R.S. Employer
Identification No.)
|
|
5818 El Camino Real, Carlsbad,
California
|
|
92008
|
|
(Address of Principal Executive Offices)
|
|
(Zip Code)
|
(760) 431-9286
(Registrant’s Telephone Number, Including Area Code)
_________________________________
Securities registered pursuant to Section 12(b) of the Exchange Act:
_________________________________
|
Title of Each Class
|
|
Name of Each Exchange on Which Registered
|
|
Common Stock, par value $0.0001 per share
|
|
The NASDAQ Global Select Market
|
Securities registered pursuant to Section 12(g) of the Exchange Act: None
_________________________________
Indicate by check mark if the registrant is a well-known seasoned issuer, as defined in Rule 405 of the Securities Act. Yes
¨
No
ý
Indicate by check mark if the registrant is not required to file reports pursuant to Section 13 or 15(d) of the Exchange Act. Yes
¨
No
ý
Indicate by check mark whether the registrant: (1) has filed all reports required to be filed by Section 13 or 15(d) of the Securities Exchange Act of 1934 during the preceding 12 months (or for such shorter period that the registrant was required to file such reports), and (2) has been subject to such filing requirements for the past 90 days. Yes
ý
No
¨
Indicate by check mark whether the registrant has submitted electronically and posted on its corporate Web site, if any, every Interactive Data File required to be submitted and posted pursuant to Rule 405 of Regulation S-T during the preceding 12 months (or for such shorter period that the registrant was required to submit and post such files). Yes
ý
No
¨
Indicate by check mark if disclosure of delinquent filers pursuant to Item 405 of Regulation S-K is not contained herein, and will not be contained, to the best of the registrant’s knowledge, in definitive proxy or information statements incorporated by reference in Part III of this Form 10-K or any amendment to this Form 10-K.
¨
Indicate by check mark whether the registrant is a large accelerated filer, an accelerated filer, a non-accelerated filer, or a smaller reporting company. See definitions of “large accelerated filer,” “accelerated filer” and “smaller reporting company” in Rule 12b-2 of the Exchange Act. (Check one):
|
Large accelerated filer
¨
|
Accelerated filer
x
|
|
|
|
Non-accelerated filer
¨
|
(Do not check if a smaller reporting company)
|
Smaller reporting company
|
¨
|
Indicate by a check mark whether the registrant is a shell company (as defined in Rule 12b-2 of the Exchange Act). Yes
¨
No
ý
The aggregate market value of the registrant’s common stock held by non-affiliates of the registrant (without admitting that any person whose shares are not included in such calculation is an affiliate) computed by reference to the price at which the common stock was last sold as of the last business day of the registrant's most recently completed second fiscal quarter (June 30,
2015
), was approximately $88.1 million.
The number of outstanding shares of the registrant’s common stock, par value $0.0001 per share, as of
March 14, 2016
was
102,150,232
.
DOCUMENTS INCORPORATED BY REFERENCE
The following documents (or parts thereof) are incorporated by reference into the following parts of this Form 10-K: Certain information required in Part III of this Annual Report on Form 10-K is incorporated from the Registrant’s Proxy Statement for the
2016
Annual Meeting of Stockholders.
ALPHATEC HOLDINGS, INC.
FORM 10-K—ANNUAL REPORT
For the Fiscal Year Ended
December 31, 2015
Table of Contents
|
|
|
Page
|
|
Business
|
||
|
Risk Factors
|
||
|
Unresolved Staff Comments
|
||
|
Properties
|
||
|
Legal Proceedings
|
||
|
Mine Safety Disclosures
|
||
|
Market for Registrant’s Common Equity, Related Stockholder Matters and Issuer Purchases of Equity Securities
|
||
|
Selected Financial Data
|
||
|
Management’s Discussion and Analysis of Financial Condition and Results of Operations
|
||
|
Quantitative and Qualitative Disclosures About Market Risk
|
||
|
Financial Statements and Supplementary Data
|
||
|
Changes in and Disagreements with Accountants on Accounting and Financial Disclosure
|
||
|
Controls and Procedures
|
||
|
Other Information
|
||
|
Directors, Executive Officers and Corporate Governance
|
||
|
Executive Compensation
|
||
|
Security Ownership of Certain Beneficial Owners and Management and Related Stockholder Matters
|
||
|
Certain Relationships and Related Transactions, and Director Independence
|
||
|
Principal Accounting Fees and Services
|
||
|
Exhibits, Financial Statement Schedules
|
||
In this Annual Report on Form 10-K, the terms “we,” “us,” “our,” “Alphatec Holdings” and “Alphatec” mean Alphatec Holdings, Inc. and our subsidiaries and their subsidiaries. “Alphatec Spine” refers to our wholly-owned operating subsidiary Alphatec Spine, Inc. “Scient’x” refers to our operating affiliate, Scient’x S.A.S., which is wholly-owned by several of our subsidiaries, and Scient’x’s subsidiaries.
|
Item 1.
|
Business
|
Overview
We are a medical technology company focused on the design, development and promotion of products for the surgical treatment of spine disorders. We have a comprehensive product portfolio and pipeline that addresses the cervical, thoracolumbar and intervertebral regions of the spine and covers a variety of spinal disorders and surgical procedures. Our principal product offerings are focused on the global market for fusion-based spinal disorder solutions. We believe that our products and systems are attractive to surgeons and patients due to enhanced product features and benefits that are designed to simplify surgical procedures and improve patient outcomes.
Strategy
Our strategy is focused on improving lives by delivering advancements in spinal fusion technologies. Our broad line of spinal products is used to treat many spinal disorders and facilitate the spinal procedures necessary to correct them. Spinal fusion surgery is designed to stabilize the spine after the correction of a defect until fusion occurs. Additionally, we offer a broad line of biologic products that help promote or accelerate the spinal fusion process. To further differentiate our solutions, we have incorporated minimally invasive surgical, or MIS, devices and techniques into our portfolio to improve patient outcomes by reducing blood loss and the length of hospital stays. We believe that we have developed a strong platform of spinal fusion products to drive consistent growth.
The three strategic pillars of our strategy are as follows:
|
•
|
Strategic Pillar #1: Deliver Advancements in our “Go-to-Market” Product Portfolio and our R&D Pipeline Strategy to Compete More Effectively.
|
We are dedicated to the development, launch and promotion of spinal fusion products that simplify procedures and improve patient outcomes. We support these products through comprehensive surgeon training and technical support. Our short-term and long-term pipeline is designed to offer us increased revenue opportunities by addressing the core market segments of spinal fusion, including both open and MIS pedicle screw systems, interbody devices, cervical plates and a comprehensive biologics offering.
We estimate that the core stabilization and fixation business, including pedicle screw platforms and interbody systems, represents approximately $5.5 billion, or two-thirds, of the worldwide spinal fusion market. To capture a greater portion of this opportunity, we are focused on innovating and launching differentiated products in these large market segments. Our focus on a spinal fusion platform allows us to reduce the time of the product development cycle and accelerate our speed to market. We plan to expand our core product offerings and techniques in the major product segments within the spinal fusion market in order to increase our market penetration and revenue globally. We also plan to ensure that we have a complementary biologics platform to aid in the fusion process. We intend to continue to enhance our product offerings by developing, licensing and acquiring technologies that we can market broadly through our global sales organization. While investing in these opportunities, we remain focused on those technologies that we believe can enhance spinal fusion and are aligned with our strategy of having a competitive product offering in the major spinal fusion market segments.
|
•
|
Strategic Pillar #2: Transform our Manufacturing Operations and Physical Distribution
|
We are well-underway with the transformation of our manufacturing and distribution capabilities with the goal of reducing ongoing costs and improving return on invested capital. Our key transformation initiatives underway include: outsourcing implant manufacturing, outsourcing product and instrument set distribution, and reducing the overall cost of instrument sets. Over time, we believe that achieving these goals will reduce the amount of fixed assets on our balance sheet, while improving our margins and free cash flow.
1
We have made significant progress to move to an outsourced manufacturing model for our implants with the goal of reducing costs and capital expenditures. In July 2015, we announced a restructuring of our manufacturing operations in an effort to improve our business operations and manufacturing cost structure. The restructuring included a reduction in workforce and closing our manufacturing facility. In early 2016 we successfully discontinued implant manufacturing in accordance with our plan. We are also rolling out our instrument set distribution model with the goal of increasing our set usage per month and reducing our overall capital investment in instrument sets. We have partnered with UPS to leverage their large distribution network and includes set cleaning, implant replenishment and distribution to customers. We are actively engaged in implementing processes aimed at significantly reducing the costs of our instrument sets over the next few years. We have successfully achieved savings on our Arsenal instrument sets and are looking to expand that across other products as appropriate. We believe that the implementation of these initiatives will strengthen our ability to compete globally in an increasingly price-sensitive healthcare industry.
|
•
|
Strategic Pillar #3: Transform our Commercial Execution and Global Participation.
|
Our products are sold in the U.S. through a network of independent distributors and direct sales representatives. We actively seek opportunities to increase the size and quality of this sales and distribution network in order to reach a broader base of surgeons, hospitals, and national accounts across the U.S. and also deepen penetration in existing accounts and territories.
With recent product approvals in key global markets, we are poised for international growth. We believe that our well-established international platform provides a strong foundation for us to grow our business globally. In addition to our established subsidiaries and/or affiliates in Japan, Germany, Brazil, Italy and the U.K., we also have independent distributors in over 50 countries throughout the world. We plan to continue to increase our international presence by expanding our distribution network in several key markets and to increase our sales penetration in certain other markets.
We believe that our global expansion combined with our planned product launches in target geographies will allow us to compete more effectively and gain greater market share.
Spine Anatomy
The human spine is the core of the human skeleton and provides important structural support while remaining flexible to allow movement. The human spine is a column of 33 bones that protects the spinal cord and enables people to stand upright. Each bony segment of the spine is referred to as a vertebra (two or more are called vertebrae). The spine has five regions containing groups of similar bones, listed from top to bottom: seven cervical vertebrae in the neck, twelve thoracic vertebrae in the mid-back (each attached to a rib), five lumbar vertebrae in the lower back, five sacral vertebrae fused together to form one bone in the hip region, and four coccygeal bones fused together that form the tailbone. At the front of each vertebra is a block of bone called the vertebral body. The vertebral body consists of an inner core of soft cancellous bone, surrounded by a thin outer layer of hard cortical bone. Vertebrae are stacked on top of each other and enable people to sit and stand upright. Vertebrae in the cervical, thoracic and lumbar regions are separated from each other and cushioned by a rubbery soft tissue called the intervertebral disc. Segments of bone that extend outward at the back of each cervical, thoracic and lumbar vertebral body surround and protect the spinal cord and its nerve roots. These bones, known as the posterior spinous processes, can be felt along the middle of a person’s back.
The Alphatec Solution
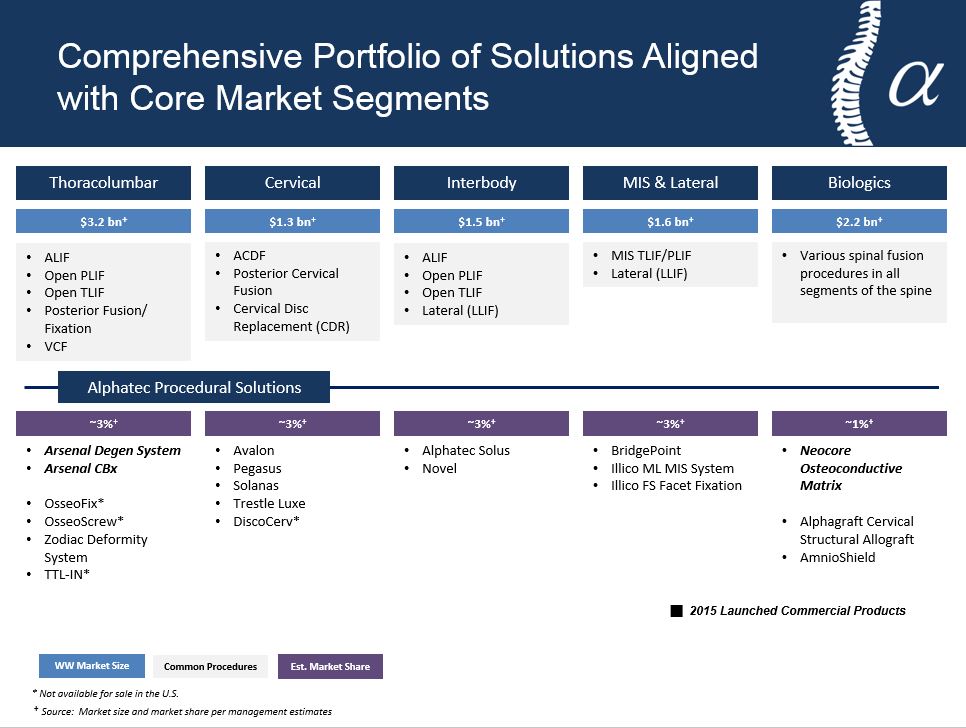
Our principal product offering includes a wide variety of systems comprised of components such as spine screws and rods, spinal spacers, plates, and various biologics offerings all designed to enhance and promote spinal fusion. Our business is focused on treating degenerative and deformity conditions.
2
The chart below illustrates the principal products in our broad portfolio of spine systems currently available for sale by market segment. Certain systems and products are described in greater detail below the chart. Items marked with an asterisk are not available for sale in the U.S.
Cervical and Cervico-Thoracic Products
Trestle Luxe Anterior Cervical Plate System
Our Trestle Luxe Anterior Cervical Plate System has a large window that enables the surgeon to have improved graft site and end plate visualization, which is designed to allow for better placement of the plate. The Trestle Luxe Anterior Cervical Plate System also has a low-profile design, which we believe is among the lowest in the spine market. Low-profile cervical plates are intended to reduce the irritation of the tissue adjacent to the plate following surgery. Other key features of the Trestle Luxe Anterior Cervical Plate system include a self-retaining screw-locking mechanism that is designed to ensure quick and easy locking of the plate and a flush profile after the screws are inserted.
3
Solanas Posterior Cervico/Thoracic Fixation System and Avalon Occipital Plate
Our Solanas Posterior Cervico/Thoracic Fixation System consists of rods, polyaxial screws, hooks, and connectors that provide a solution for posterior cervico/thoracic fusion procedures. We also designed the Solanas Posterior Cervico/Thoracic System to be used in combination with our existing Zodiac Degenerative Spinal Fixation System and our Avalon Occipital Plate, thereby providing surgeons with a solution for occipito-cervico-thoracic fixation. The Avalon Occipital Plate has a unique buttress design for optimal bone graft placement and superior fusion, including three points of plate rotation and translation, which is designed to ease the placement of the plate.
Pegasus Anchored Cervical Interbody
The Pegasus Anchored Cervical Interbody, or ACI, System provides surgeons a simplified approach to traditional anterior cervical disectomy and fusion, or ACDF. It features a single-step delivery of a spacer with an integrated anchoring mechanism. The single-step, non-impaction and locking mechanism reduces operative time and simplifies a standard technique.
Thoracolumbar Fixation Products
Arsenal Degenerative System
Arsenal Degenerative Spinal Fixation System is a comprehensive system for both simple and complex degenerative spinal fusion procedures. The Arsenal Degenerative Spinal Fixation System was designed to provide operational efficiency, biomechanical strength, and surgical simplicity while providing a complete solution to combat most complex degenerative pathologies. We believe the combination of low-profile implants, intuitive instrumentation and proven strength of this system are significant advantages.
The Arsenal Degenerative System was designed to be the platform for future development in other spinal fusion segments of the market including the deformity, MIS and cervico-thoracic segments of the market.
Arsenal CBx Cortical Bone Fixation System
Arsenal CBx is the first extension to the Arsenal platform. An alternative to traditional pedicle screw placement, Arsenal CBx Cortical Bone Fixation System utilizes a midline approach and cortical bone trajectory to achieve maximum fixation through a less-invasive procedure. This system leverages the strengths of the Arsenal product platform with the benefits of a minimally disruptive procedure to enhance patient outcomes.
Due to the midline approach and inward-outward screw trajectory, soft tissue and muscle exposure requirements are greatly reduced compared to the traditional approach while still retaining direct visualization and access to the disc space. Arsenal CBx is a compatible fixation option for both posterior lateral interbody fusion or transforaminal lumbar interbody fusion, or PLIF and TLIF, respectively, applications in addition to being a unique muscle sparing approach to revision surgery.
Zodiac Degenerative Spinal Fixation System
Our Zodiac Degenerative Spinal Fixation System is a comprehensive spinal system that offers polyaxial pedicle screws, accompanying implants and advanced instruments for the stabilization of the thoracolumbar spine.
Zodiac Deformity Spinal Fixation System
Our Zodiac Deformity Spinal Fixation System is a comprehensive system of instrumentation and implants designed to enable the surgeon to address patient-specific spinal deformity correction procedures. The Zodiac Deformity Spinal Fixation System contains polyaxial screws that are similar in design to those in the Zodiac Degenerative Spinal Fixation System, along with components that are frequently used in deformity correction procedures and deformity specific instrumentation.
OsseoScrew Spinal Fixation System
The OsseoScrew Spinal Fixation System is an innovative pedicle screw system that is designed to provide a solution for patients who have poor bone density. The OsseoScrew System is designed to be implanted into the pedicle and then expanded after implementation to achieve increased screw fixation in bone with poor density. The OsseoScrew Spinal Fixation System is not available for sale in the U.S.
Spinal Spacers
Battalion Universal Spacer System
4
The Battalion Universal Spacer System offers comfort, control and innovative design for surgeons performing PLIF/TLIF procedures. The Battalion implants introduce a new alternative to interbody fusion by combining the elasticity and radiolucency of PEEK with a titanium coating for potential osseointegration.
The implants, which come in both a straight and curved footprint, feature a bulleted nose for easy insertion. The Battalion System also features an intuitive and innovative 180-degree locking inserter that assists with protection of neural elements during insertion of the implant. To further market potential, the Battalion System features state-of-the-art instrumentation for disc prep, access and implantation.
Novel PEEK and Titanium Spinal Spacers
Our family of Novel spinal spacers addresses the surgical need to accommodate varying patient anatomies, surgical approaches and composite material options. We offer multiple unique implant designs, each of which is available in numerous shapes and heights. Certain of our Novel spinal spacers are made of titanium and others are made of polyetheretherketone, or PEEK. Our Novel PEEK spinal spacers have been approved for use in both the lumbar and cervical regions of the spine.
Alphatec Solus Locking ALIF Spinal Spacer
Our Alphatec Solus locking ALIF spinal spacer, or Alphatec Solus, is a zero-profile PEEK and titanium device offering four points of fixation for improved stability. Alphatec Solus features a one-step insertion and deployment feature and is used in ALIF procedures. We believe that Alphatec Solus’ locking mechanism is a substantial improvement over similar products currently on the market.
MIS Products
Illico Minimally Invasive Surgery System
The Illico Minimally Invasive Surgery System is a cannulated pedicle screw system that is designed to be inserted via a minimally invasive surgical procedure. Access to the spine is gained through a small incision. The surgeon is then able to see the surgical site by using a small canal through which implants are inserted into the patient with a minimum amount of disruption to the surrounding tissue. We believe that the Illico Minimally Invasive System limits trauma to the tissue surrounding the location of the surgery, which is designed to enable patients to recover faster.
BridgePoint Spinous Process Fixation System
The BridgePoint system is a spinous process fixation system that was developed to address the disadvantages of traditional stabilization devices. The system allows surgeons to fixate the spine using a less invasive approach by attaching a plate to the spinous process of the vertebral body during spinal fusion surgery.
Biologics
Neocore Osteoconductive Matrix
In 2015, we launched our Neocore Osteoconductive Matrix, a synthetic scaffold for the regeneration of bone. With the Neocore platform, we will have the ability to expand our biologics opportunity in the U.S. and internationally, bringing a compelling synthetic bone regeneration solution and competitive pricing to our surgeon and hospital customers worldwide.
Neocore Osteoconductive Matrix is designed to provide an effective core environment for bone growth through a synthetic scaffold. When hydrated with patient bone marrow aspirate, or BMA, Neocore becomes a complete bone graft, which possesses all the necessary components of bone growth. Engineered to perform like natural bone, Neocore's composition and porosity provide the benefits of rapid revascularization throughout graft and supports replacement of three-dimensional matrix with healthy new bone growth. Offering excellent handling characteristics, these pre-formed strips are flexible to conform to adjacent structures, compressible, and moldable. They can also be cut to fit.
We believe that this new synthetic biologics product will provide surgeons with the handling characteristics and osteoconductive composition they've been looking for in bone grafting products.
Sales and Marketing
In the U.S., we sell our products through a sales force consisting of employee direct sales representatives and independent sales agents. Although surgeons in the U.S. typically make the ultimate decision to use our products, we generally bill the
5
hospital for the products that are used and pay commissions to sales representative or sales agent based on payment received from the hospital. We compensate our direct sales employees through salaries and incentive bonuses based on performance measures. In 2015, we expanded our U.S. sales coverage by adding additional distributors and direct sales representatives and we focused this expansion on geographical areas where we previously had little or no sales coverage. We believe this expansion, coupled with robust new products, will support the continued adoption of our products by surgeons who do not currently use our products and the increased use of our products by surgeons who currently use our products. We plan on continuing to expand our sales coverage through existing distributors, direct sales representatives and adding new distributors with an established customer base in order to promote further uptake of our products by new and existing surgeon customers.
Internationally, we sell our products both through independent distributors who resell the products to the hospital and also through employees that sell directly to the hospital on behalf of the Company. We plan to continue expanding our direct sales and distribution network and product offerings throughout the world. Internationally, we are focusing our expansion into large markets. We market our products at various international industry conferences, organized surgical training courses, and in industry trade journals and periodicals. In addition, we host several international educational conferences throughout the world.
We select our sales force based on their expertise in selling spinal devices, reputation within the surgeon community, geographical coverage and established sales network. We market our products at various industry conferences, organized surgical training courses, and in industry trade journals and periodicals.
Surgeon Training and Education
We focus our surgeon training efforts on the entire spinal fusion procedure and utilize a peer-to-peer training approach with surgeons. We devote significant resources to train and educate surgeons in the proper use of our products. We believe that one of the most effective ways to introduce and build market demand for our products is by training and educating spine surgeons, independent distributors, and direct sales representatives worldwide in the benefits and use of our products. Separate from ongoing product training and education programs, we also conduct product roadshows at a surgeon’s office with the objective of introducing new products to existing and new surgeon customers in order to drive adoption of our products by these surgeons. In 2015, to support the launch of the Arsenal Degenerative System, we completed over 100 Arsenal-specific roadshows across various locations in the U.S. and internationally. We believe this is an effective way to increase overall surgeon adoption of our new products.
Given our global focus, we host several training events throughout the year in the U.S. and internationally. We believe that surgeons, independent distributors, and direct sales representatives will become exposed to the merits and distinguishing features of our products through our training and education programs, and in doing so, will increase the use and promotion of our products. With a focus on the entire procedure, we expect to build awareness of the breadth of our product offering.
Research and Development
Our research and development department seeks to continually improve our core product offering and introduce new products to increase our penetration in the global spine market. We are focused on developing technology platforms that span the largest market segments: spinal fusion fixation and biologic products. We have transformed our development process by focusing our resources on two major development programs per year and leveraging integrated teams focused on the key platforms to reduce the time frame from product concept to market commercialization. We also collaborate with our surgeon partners to design products to enhance the surgeon experience, simplify surgical techniques, and reduce overall costs, while improving patient outcomes.
Manufacture and Supply
In 2015, we began implementing our implant manufacturing outsourcing initiative, which we successfully executed in early 2016. This included organizational restructuring, machine disposition, and building closure. Outsourcing implant manufacturing reduces our need for capital investment and reduces operational expense. Additionally, the transformation will also provide expertise and capacity necessary to scale up or down based on demand for our products.
As a result of this transformation, we rely on third-party suppliers for the manufacture of our implants and instruments, including biologics. We select our suppliers to ensure that all of our products are safe, effective, adhere to all applicable regulations, are of the highest quality, and meet our supply needs. We employ a rigorous supplier assessment, qualification, and selection process targeted to suppliers that meet the requirements of the U.S. Food and Drug Administration, or FDA, and International Organization for Standardization, or ISO, and quality standards supported by internal policies and procedures. Our quality assurance process monitors and maintains supplier performance through qualification and periodic supplier reviews and audits.
6
The raw materials used in the manufacture of our non-biologic products are principally titanium, titanium alloys, stainless steel, cobalt chrome, ceramic, allograft, and PEEK. With the exception of PEEK, none of our raw material requirements is limited to any significant extent by critical supply. We are subject to the risk that Invibio, one of a limited number of PEEK suppliers, will fail to supply PEEK in adequate amounts and in a timely manner. We believe our supplier relationships and quality processes will support our potential capacity needs for the foreseeable future.
With respect to biologics products, we are FDA-registered and licensed in the states of California, New York, and Florida, the only states that currently require licenses. Our facility and the facilities of the third-party suppliers we use are subject to periodic unannounced inspections by regulatory authorities and may undergo compliance inspections conducted by the FDA and corresponding state and foreign agencies. Because our biologics products are processed from human tissue, maintaining a steady supply can sometimes be challenging. We have not experienced significant difficulty in locating and obtaining the materials necessary to fulfill our production requirements, and we have not experienced a meaningful disruption to sales orders.
In 2015, we also began implementing our distribution transformation initiative. After an extensive due diligence review, we partnered with UPS to outsource the physical distribution of implant and instrument sets to enhance customer service and drive set utilization improvements with our continued commitment to on-time delivery. We opened two forward stocking locations in 2015 in Lyndhurst, New Jersey and Tampa, Florida to service our customers. These forward stocking locations are intended to provide on-time delivery to our customers in the nearby regions and improve set turns. We are in the process of opening a full-service set cleaning, replenishment, and distribution hub at the UPS multi-client facility in Swedesboro, New Jersey. The hub facility will perform similar inventory administration and processing activities as to what is currently done in our Carlsbad headquarters, while expanding shipment cut-off times due to the east coast location. The improvement in set turns should reduce future capital investment in set purchases. International shipments and west coast regions will continue to be serviced from our Carlsbad facility.
Competition
Although we believe that our current broad product portfolio and development pipeline is differentiated and has numerous competitive advantages, the spinal implant industry is highly competitive, subject to rapid technological change, and significantly affected by new product introductions. We believe that the principal competitive factors in our market include:
|
•
|
improved outcomes for spine pathology procedures;
|
|
•
|
ease of use, quality and reliability;
|
|
•
|
effective and efficient sales, marketing and distribution;
|
|
•
|
quality service and an educated and knowledgeable sales network;
|
|
•
|
technical leadership and superiority;
|
|
•
|
surgeon services, such as training and education;
|
|
•
|
responsiveness to the needs of surgeons;
|
|
•
|
acceptance by spine surgeons;
|
|
•
|
product price and qualification for reimbursement; and
|
|
•
|
speed to market.
|
Both our currently marketed products and any future products we commercialize are subject to intense competition. We believe that our most significant competitors are Medtronic Sofamor Danek, Johnson & Johnson (DePuy/Synthes), Stryker, NuVasive, Zimmer, Biomet, Orthofix, Globus Medical, Sea Spine, LDR Spine, K2 Medical and others, many of which have substantially greater financial resources than we do. In addition, these companies may have more established distribution networks, entrenched relationships with physicians, and greater experience in developing, launching, marketing, distributing and selling spinal implant products.
Our competitors also include providers of non-operative therapies for spine disorder conditions. While these non-operative treatments are considered to be an alternative to surgery, surgery is typically performed in the event that non-operative treatments are unsuccessful. We believe that, to date, these non-operative treatments have not caused a material reduction in the demand for surgical treatment of spinal disorders.
Intellectual Property
7
We rely on a combination of patent, trademark, copyright, trade secret and other intellectual property laws, nondisclosure agreements, proprietary information ownership agreements and other measures to protect our intellectual property rights. We believe that in order to have a competitive advantage, we must develop, maintain and enforce the proprietary aspects of our technologies. We require our employees, consultants, co-developers, distributors and advisors to execute agreements governing the ownership of proprietary information and use and disclosure of confidential information in connection with their relationship with us. In general, these agreements require these individuals and entities to agree to disclose and assign to us all inventions that were conceived on our behalf or which relate to our property or business and to keep our confidential information confidential and only use such confidential information in connection with our business.
Despite any measures taken to protect our intellectual property, unauthorized parties may attempt to copy aspects of our products or to obtain and use information that we regard as proprietary. In addition, our competitors may independently develop similar technologies. Further, as described in “Item 3 Legal Proceedings,” others may attempt to obtain royalties based on the net sales of our products or other payments from us, which may impact our revenues. We may lose market share to our competitors if we fail to protect our intellectual property rights.
Patents
As of
March 14, 2016
, we and our affiliates owned, or exclusively owned 100 issued U.S. patents, 104 pending U.S. patent applications and 183 issued or pending foreign patents. We own multiple patents relating to unique aspects and improvements for several of our products. We do not believe that the expiration of any single patent is likely to significantly affect our intellectual property position.
The medical device industry is characterized by the existence of a large number of patents and frequent litigation based on allegations of patent infringement. Patent litigation can involve complex factual and legal questions and its outcome is uncertain. Any claim relating to infringement of patents that is successfully asserted against us may require us to pay substantial damages (including treble damages if our infringement is found to be willful) or may require us to remove our infringing product from the market. Even if we were to prevail, any litigation could be costly and time-consuming and would divert the attention of our management and key personnel from our business operations. Our success will also depend in part on our not infringing patents issued to others, including our competitors and potential competitors. If our products are found to infringe the patents of others, our development, manufacture and sale of such potential products could be severely restricted or prohibited. In addition, our competitors may independently develop similar technologies. We may lose market share to our competitors if we fail to protect our intellectual property rights.
As the number of entrants into our market increases, the possibility of a patent infringement claim against us grows. While we make an effort to ensure that our products do not infringe other parties’ patents and proprietary rights, our products and methods may be covered by U.S. or foreign patents held by our competitors. In addition, our competitors may assert that future products we may manufacture or market infringe their patents.
If we are accused of patent infringement, we may be required to obtain licenses to patents or proprietary rights of others in order to continue to commercialize our products. However, we may not be able to obtain any licenses required under any patents or proprietary rights of third parties on acceptable terms, or at all. Even if we are able to obtain rights to the third party’s intellectual property, these rights may be non-exclusive, thereby giving our competitors access to the same intellectual property. Ultimately, we may be unable to commercialize some of our potential products or may have to cease some of our business operations as a result of patent infringement claims, which could severely harm our business financial condition and results of operations.
Trademarks
As of
March 14, 2016
, we and our affiliates owned 71 registered U.S. trademarks, including “Alphatec Spine,” “Zodiac,” “Illico” and “Trestle Luxe” and 41 registered trademarks outside of the U.S.
Government Regulation
Our products are subject to extensive regulation by the FDA and other U.S. federal and state regulatory bodies and comparable authorities in other countries. To ensure that medical products distributed domestically and internationally are safe and effective for their intended use, FDA and comparable authorities in other countries have imposed regulations that govern, among other things, the following activities that we or our partners perform and will continue to perform:
|
•
|
product design and development;
|
|
•
|
product testing;
|
|
•
|
product manufacturing;
|
8
|
•
|
product labeling;
|
|
•
|
product storage;
|
|
•
|
premarket clearance or approval;
|
|
•
|
advertising and promotion;
|
|
•
|
product marketing, sales and distribution; and
|
|
•
|
post-market surveillance, including reporting deaths or serious injuries related to products and certain product malfunctions.
|
FDA’s Premarket Clearance and Approval Requirements
Unless an exemption applies, each medical device we wish to commercially distribute in the U.S. will require either prior 510(k) clearance or approval of a premarket approval application, or PMA. The information that must be submitted to the FDA in order to obtain clearance or approval to market a new medical device varies depending on how the medical device is classified by the FDA. Medical devices are classified into one of three classes on the basis of the intended use of the device, the risk associated with the use of the device for that indication, as determined by the FDA, and on the controls deemed by the FDA to be necessary to reasonably ensure their safety and effectiveness. Class I devices, which have the lowest level of risk associated with them, are subject to general controls. Class II devices are subject to general controls and special controls, including performance standards. Class III devices, which have the highest level of risk associated with them, are subject to general controls and premarket approval. Most Class I devices and some Class II devices are exempt from the 510(k) requirement, although the manufacturers will still be subject to establishment registration, medical device listing, labeling requirements, QSRs and medical device reporting. Class III devices are subject to those requirements and additional requirements including PMA approval.
A new medical device for which there is no substantially equivalent device is automatically designated a Class III device. Depending on the nature of the new device, the manufacturer may ask the FDA to make a risk-based determination of the new device and reclassify it in Class I or Class II. This process is referred to as the
de novo
process. If the FDA agrees, the new device will be reassigned to the appropriate other class. If the FDA does not agree, the manufacturer will have to submit a PMA. Our current commercial products are Class II devices marketed under FDA 510(k) premarket clearance. Both 510(k)s and PMAs are subject to the payment of user fees at the time of submission for FDA review.
510(k) Clearance Pathway
To obtain 510(k) clearance, we must submit a premarket notification demonstrating that the proposed device is substantially equivalent to a device legally marketed in the U.S. for which a PMA was not required. The FDA’s goal is to review and act on each 510(k) within 90 days of submission, but it may take longer if the FDA requests additional information. Most 510(k)s do not require supporting data from clinical trials, but the FDA may request such data.
After a device receives 510(k) clearance, any modification that could significantly affect its safety or effectiveness, or that would constitute a new or major change in its intended use, will require a new 510(k) clearance or, depending on the modification, require premarket approval. Each manufacturer initially determines whether the proposed change requires submission of a 510(k), or a premarket approval, but the FDA can review any such decision and can disagree with a manufacturer’s determination. If the FDA disagrees with a manufacturer’s determination, the FDA can require the manufacturer to cease marketing and/or recall the modified device until 510(k) clearance or premarket approval is obtained. If the FDA requires us to seek a new 510(k) clearance or premarket approval for any modifications to a previously cleared product, we may be required to cease marketing or recall the modified device until we obtain this clearance or approval. Also, in these circumstances, we may be subject to significant fines or penalties. We have made and plan to continue to make enhancements to our products, and we will consider on a case-by-case basis whether a new 510(k) or PMA is necessary.
Premarket Approval Pathway
A PMA must be submitted if the device cannot be cleared through the 510(k) process. The PMA process is generally more complex, costly and time consuming than the 510(k) process. A PMA must be supported by extensive data including, but not limited to, technical, preclinical, clinical trials, manufacturing and labeling to demonstrate to the FDA’s satisfaction the safety and effectiveness of the device for its intended use. After a PMA is sufficiently complete, the FDA will accept the application for filing and begin an in-depth review of the submitted information. By statute, the FDA has 180 days to review the accepted application, although, review of the application generally can take between one and three years. During this review period, the FDA may request additional information or clarification of information already provided. Also during the review period, an advisory panel of experts from outside the FDA may be convened to review and evaluate the application and
9
provide recommendations to the FDA as to the approvability of the device. In addition, the FDA will conduct a preapproval inspection of the manufacturing facility to ensure compliance with quality system regulations, or QSRs. New premarket approval applications or premarket approval application supplements are also required for product modifications that affect the safety and efficacy of the device. Premarket approval supplements often require submission of the same type of information as a PMA, except that the supplement is limited to information needed to support any changes from the device covered by the original PMA approval, and may not require clinical data or the convening of an advisory panel. We were not required to submit a PMA for any of our currently marketed products, but devices in development may require a PMA.
Clinical Trials
Clinical trials are required to support a PMA and are sometimes required for a 510(k). In the U.S., if the device is determined to present a “significant risk,” the manufacturer may not begin a clinical trial until it submits an investigational device exemption application, or IDE, and obtains approval of the IDE from the FDA. The IDE must be supported by appropriate data, such as animal and laboratory testing results, showing that it is safe to test the device in humans and that the testing protocol is scientifically sound. These clinical trials are also subject to the review, approval and oversight of an institutional review board, or IRB, at each clinical trial site. The clinical trials must be conducted in accordance with the FDA’s IDE regulations and good clinical practices. A clinical trial may be suspended by FDA, the sponsor or an IRB at any time for various reasons, including a belief that the risks to the study participants outweigh the benefits of participation in the trial. Even if a clinical trial is completed, the results may not demonstrate the safety and efficacy of a device to the satisfaction of the FDA, or may be equivocal or otherwise not be sufficient to obtain approval of a device.
Pervasive and Continuing FDA Regulation
After a device is placed on the market, numerous FDA and other regulatory requirements continue to apply. These include:
|
•
|
quality system regulations, which require manufacturers, including third-party contract manufacturers, to follow stringent design, testing, control, documentation, record maintenance and other quality assurance controls, during all aspects of the manufacturing process and to maintain and investigate complaints;
|
|
•
|
labeling regulations, and FDA prohibitions against the promotion of products for uncleared or unapproved “off-label” uses;
|
|
•
|
medical device reporting obligations, which require that manufacturers submit reports to the FDA of adverse events; and
|
|
•
|
other post-market surveillance requirements, which apply when necessary to protect the public health or to provide additional safety and effectiveness data for the device.
|
Failure to comply with applicable regulatory requirements can result in enforcement action by the FDA, which may include any of the following:
|
•
|
warning letters;
|
|
•
|
fines, injunctions, and civil penalties;
|
|
•
|
recall or seizure of products;
|
|
•
|
operating restrictions, partial suspension or total shutdown of production;
|
|
•
|
refusal to grant 510(k) clearance or PMA approvals of new products; and
|
|
•
|
criminal prosecution.
|
To ensure compliance with regulatory requirements, medical device manufacturers are subject to market surveillance and manufacturers and their third-party manufacturers are subject to periodic announced and unannounced inspections by the FDA.
On July 17, 2015, we received a Warning Letter, dated July 16, 2015, from the FDA in connection with the FDA’s inspection of our manufacturing facilities located in Carlsbad, CA that occurred from February 4, 2015 until March 13, 2015, or the Inspection.
In the Warning Letter, the FDA cited eight deficiencies in our response to the FDA Form 483, Inspectional Observation, which was issued to us at the end of the Inspection. The deficiencies relate to our internal procedures for quality planning, design control, document control and corrective and preventive actions.
The Warning Letter does not restrict production or shipment of our products from its facilities, or the sale or marketing of our products. We are currently addressing the deficiencies cited by the FDA in the Warning Letter and intend to work closely with the FDA to resolve any outstanding issues. Until the procedures noted in the Warning Letter are corrected, we may be
10
subject to additional regulatory action by the FDA, and any such actions could significantly disrupt our ongoing business and operations and have a material adverse impact on our financial position and operating results. There can be no assurance that the FDA will be satisfied with our response.
Regulation of Human Cells, Tissues, and Cellular and Tissue-based Products
Human cells, tissues, and cellular and tissue-based products, or HCT/Ps, are defined as articles containing or consisting of human cells or tissue that are intended for implantation, transplantation, infusion, or transfer into a human recipient. They are regulated by the FDA under Section 361 of the Public Health Service Act, or PHS Act, and related regulations promulgated by the FDA in 21 CFR Part 1271. If the HCT/P is minimally manipulated, is intended for homologous use only and meets other requirements, the establishment that manufactures the HCT/P will not be regulated as a drug, device and/or biologic under the Federal Food, Drug and Cosmetic Act, and/or section 351 of the PHS Act and applicable regulations, and premarket review will not be required.
International Device Regulations
International sales of medical devices are subject to foreign government regulations, which vary substantially from country to country. The time required to obtain approval by a foreign country may be longer or shorter than that required for FDA approval, and the requirements may differ.
Japan
In Japan, certain medical devices classified as “highly controlled” must be approved prior to importation and commercial sale by the Ministry of Health, Labour and Welfare, or MHLW, pursuant to the Japanese Pharmaceutical Affairs Law. Manufacturers of medical devices outside of Japan that do not operate through a Japanese entity are required to appoint a contractually bound authorized representative to directly submit an application for device approval to the MHLW. The MHLW evaluates each device for safety and efficacy and may require that the product be tested in Japanese laboratories. After a device is approved for importation and commercial sale in Japan, the MHLW continues to monitor sales of approved products for compliance. Failure to comply with applicable regulatory requirements can result in enforcement action by the MHLW, including administrative inspections and recommendations; recall or seizure of products; operating restrictions, including partial suspension or total shut down of marketing activity in Japan; withdrawal of product approvals; and criminal prosecution by a public prosecutor, including criminal fines and/or imprisonment.
Our devices fall into the “highly controlled” medical device category. Currently, MHLW review times for our device applications range from one year if clinical data is not required, to up to two years if clinical data is required. The review times for our products are expected to be reduced to six months and one year, respectively, and we expect application fees to be reduced as new approval screening standards are established by the MHLW, which has delegated responsibility for these review functions to the Japanese Pharmaceuticals and Medical Devices Agency, for various medical device categories. Currently, the MHLW is working with trade organizations such as AdvaMed, and MHLW may adopt similar standards.
European Union
The European Union, which consists of 28 of the countries in Europe, has adopted numerous directives and standards regulating the design, manufacture, clinical trials, labeling, and adverse event reporting for medical devices. Other countries, such as Switzerland, have voluntarily adopted laws and regulations that mirror those of the European Union with respect to medical devices. Devices that comply with the requirements of a relevant directive will be entitled to bear CE conformity marking and, accordingly, can be commercially distributed throughout the member states of the European Union, as well as other countries that comply with or mirror these directives. The method of assessing conformity varies depending on the type and class of the product, but normally involves a combination of self-assessment by the manufacturer or a third-party assessment by a “Notified Body,” an independent and neutral institution appointed to conduct conformity assessment. This third-party assessment consists of an audit of the manufacturer’s quality system and technical review and testing of the manufacturer’s product. An assessment by a Notified Body in one country within the European Union is required in order for a manufacturer to commercially distribute the product throughout the European Union. In addition, compliance with voluntary harmonized standards including ISO 13845 issued by the International Organization for Standards establishes the presumption of conformity with the essential requirements for a CE mark. In October 2007, we were certified by Intertek Semko, a Notified Body, under the European Union Medical Device Directive allowing the CE conformity marking to be applied. In September 2012, the European Commission adopted a proposed European Medical Device Regulations, or EMDR, which when implemented will change the way that most medical devices are regulated in the European Union. In particular, the EMDR will reclassify CE-marked spine implants from Class IIb to Class III, which will impose additional requirements for technical and
11
clinical information, subject the companies and their suppliers to additional scrutiny and require the use of Special Notified Bodies.
Environmental Matters
Our facilities and operations are subject to extensive federal, state, and local environmental and occupational health and safety laws and regulations. These laws and regulations govern, among other things, air emissions; wastewater discharges; the generation, storage, handling, use and transportation of hazardous materials; the handling and disposal of hazardous wastes; the cleanup of contamination; and the health and safety of our employees. Under such laws and regulations, we are required to obtain permits from governmental authorities for some of our operations. If we violate or fail to comply with these laws, regulations or permits, we could be fined or otherwise sanctioned by regulators. We could also be held responsible for costs and damages arising from any contamination at our past or present facilities or at third-party waste disposal sites. We cannot completely eliminate the risk of contamination or injury resulting from hazardous materials, and we may incur material liability as a result of any contamination or injury.
Compliance with Certain Applicable Statutes
We are subject to various federal and state laws pertaining to healthcare fraud and abuse, including anti-kickback laws, physician self-referral laws, false claims laws, criminal health care fraud laws, and foreign corrupt practice laws. Violations of these laws are punishable by criminal and/or civil sanctions, including, in some instances, fines, imprisonment and, within the United States, exclusion from participation in government healthcare programs, including Medicare, Medicaid and Veterans Administration health programs. These laws are administered by, among others, the U.S. Department of Justice, the Office of Inspector General of the Department of Health and Human Services and state attorneys general. Many of these agencies have increased their enforcement activities with respect to medical device manufacturers in recent years.
The federal Anti-Kickback Statute, prohibits persons from knowingly and willfully soliciting, offering, receiving or providing remuneration, directly or indirectly, in exchange for or to induce either the referral of an individual, or the furnishing, arranging for or recommending a good or service, for which payment may be made in whole or part under federal healthcare programs, such as the Medicare and Medicaid programs. The Anti-Kickback Statute is broad and prohibits many arrangements and practices that are lawful in businesses outside of the healthcare industry. For example, the definition of “remuneration” has been broadly interpreted to include anything of value, including, gifts, discounts, the furnishing of supplies or equipment, credit arrangements, payments of cash, waivers of payments, ownership interests and providing anything at less than its fair market value. In addition, in March 2010, the U.S. Congress adopted and President Obama signed into law the Patient Protection and Affordable Health Care Act, which, as amended by the Health Care and Education Reconciliation Act, is referred to as ACA. ACA, among other things, amends the intent requirement of the federal Anti-Kickback Statute. A person or entity no longer needs to have actual knowledge of this statute or specific intent to violate it. In addition, ACA provides that the government may assert that a claim including items or services resulting from a violation of the Anti-Kickback Statute constitutes a false or fraudulent claim for purposes of the federal False Claims Act.
In implementing the Anti-Kickback Statute, the Department of Health and Human Services Office of Inspector General, or OIG, has issued a series of regulations, known as the safe harbors, which began in July 1991. These safe harbors set forth provisions that, in circumstances where all the applicable requirements are met, will assure healthcare providers and other parties that they will not be prosecuted under the Anti-Kickback Statute. The failure of a transaction or arrangement to fit precisely within one or more safe harbors does not necessarily mean that it is illegal or that prosecution will be pursued. However, conduct and business arrangements that do not fully satisfy all requirements of an applicable safe harbor may result in increased scrutiny by government enforcement authorities such as the OIG. Penalties for violations of the Anti-Kickback Statute include criminal penalties and civil sanctions such as fines, imprisonment and possible exclusion from Medicare, Medicaid and other federal healthcare programs. Many states have anti-kickback laws that are similar to the federal law, including penalties, fines, sanctions for violations, and exclusions from state or commercial programs.
The federal ban on physician self-referrals, commonly known as the Stark Law, subject to certain exceptions, prohibits physician referrals of Medicare and Medicaid patients to an entity providing certain “designated health services” if the physician or an immediate family member of the physician has any financial relationship with the entity. Penalties for violating the Stark Law include fines, civil monetary penalties and possible exclusion from federal healthcare programs. In addition to the Stark Law, many states have their own self-referral laws. Often, these laws closely follow the language of the federal law, although they do not always have the same scope, exceptions or safe harbors.
We have entered into various agreements with certain surgeons that perform services for us, including some who make clinical decisions to use our products. Some of our referring surgeons own our stock, which they either purchased in an arms’ length transaction on terms identical to those offered to non-surgeons or received from us as fair market value consideration for services performed. All such arrangements have been structured with the intention of complying with all applicable fraud and
12
abuse laws, including the Anti-Kickback Statute. Stark Law and similar state self-referral laws. In addition, physician-owned distribution companies, or PODs, have increasingly become involved in the sale and distribution of medical devices, including products for the surgical treatment of spine disorders. In many cases, these distribution companies enter into arrangements with hospitals that bill Medicare or Medicaid for the furnishing of medical services, and the physician-owners are among the physicians who refer patients to the hospitals for surgery. On March 26, 2013 the OIG issued a Special Fraud Alert entitled "Physician-Owned Entities", or the Fraud Alert, in which the OIG concluded, among other things, that PODs are "inherently suspect under the anti-kickback statute" and that PODs present "substantial fraud and abuse risk and pose dangers of patient safety." We believe that all of our arrangements with PODs comply with applicable fraud and abuse laws and do not believe that we are subject to any arrangements that violate any such laws.
The federal False Claims Act prohibits persons from knowingly filing or causing to be filed a false or fraudulent claim to, or the knowing use of false statements to obtain payment from, the federal government. Private suits filed under the False Claims Act, known as qui tam actions, can be brought by individuals on behalf of the government. These individuals, sometimes known as “relators” or, more commonly, as “whistleblowers,” may share in any amounts paid by the entity to the government in fines or settlement. The number of filings of qui tam actions has increased significantly in recent years, causing more healthcare companies to have to defend a False Claim Act action. If an entity is determined to have violated the federal False Claims Act, it may be required to pay up to three times the actual damages sustained by the government, plus civil penalties of between $5,500 to $11,000 for each separate false claim and may be subject to exclusion from Medicare, Medicaid and other federal healthcare programs. Various states have also enacted similar laws modeled after the federal False Claims Act which apply to items and services reimbursed under Medicaid and other state programs, or, in several states, apply regardless of the payor.
The Health Insurance Portability and Accountability Act, or HIPAA, created two new federal crimes: healthcare fraud and false statements relating to healthcare matters. The healthcare fraud statute prohibits knowingly and willfully executing a scheme to defraud any healthcare benefit program, including private payors. Under recent changes in ACA, the intent requirement of the healthcare fraud statute is lowered such that a person or entity no longer needs to have actual knowledge of this statute or specific intent to violate it. A violation of this statute is a felony and may result in fines, imprisonment or possible exclusion from Medicare, Medicaid and other federal healthcare programs. The false statements statute prohibits knowingly and willfully falsifying, concealing or covering up a material fact or making any materially false, fictitious or fraudulent statement in connection with the delivery of or payment for healthcare benefits, items or services. A violation of this statute is a felony and may result in similar sanctions.
ACA also includes various provisions designed to strengthen significantly fraud and abuse enforcement in addition to those changes discussed above. Among these additional provisions include increased funding for enforcement efforts and new “sunshine” provisions to require us to report and disclose to the Centers for Medicare and Medicaid Services, or CMS, any payment or “transfer of value” made or distributed to physicians or teaching hospitals. These sunshine provisions also require certain group purchasing organizations, including physician-owned distributors, to disclose physician ownership information to CMS. On February 8, 2013, CMS published a detailed regulation implementing these sunshine provisions. Under this final rule, starting August 1, 2013, we and other device manufacturers collected specific data on payments and other transfers of value to physicians and teaching hospitals for the remaining calendar year 2013, with such data assembled into a report made to CMS in March 2014. Since the fall of 2014, CMS has been publishing on its website annual data of all manufacturer reports of such payments and transfers of value, including those of us. CMS has delayed putting our 2014 data on its website with expected publication sometime in 2016. Similar disclosures and CMS reports are to be made annually thereafter. There are various state laws and initiatives that require device manufacturers to disclose to the appropriate regulatory agency certain payments or other transfers of value made to physicians, and in certain cases prohibit some forms of these payments, with the risk of fines for any violation of such requirements. Massachusetts has one of the most stringent of these laws, and the District of Columbia and Vermont passed such laws in 2008 and 2009, respectively.
HIPAA also includes privacy and security provisions designed to regulate the use and disclosure of “protected health information”, or PHI, which is health information that identifies a patient and that is held by a health care provider, a health plan or health care clearinghouse. We are not directly regulated by HIPAA, but our ability to access PHI for purposes such as marketing, product development, clinical research or other uses is controlled by HIPAA and restrictions placed on health care providers and other covered entities. HIPAA was amended in 2009 by the Health Information Technology for Economic and Clinical Health Act, or HITECH, which strengthened the rule, increased penalties for violations and added a requirement for the disclosure of breaches to affected individuals, the government and in some cases the media. We must carefully structure any transaction involving PHI to avoid violation of HIPAA and HITECH requirements.
Almost all states have adopted data security laws protecting personal information including social security numbers, state issued identification numbers, credit card or financial account information coupled with individuals’ names or initials. We must comply with all applicable state data security laws, even though they vary extensively, and must ensure that any breaches or accidental disclosures of personal information are promptly reported to affected individuals and responsible government
13
entities. We must also ensure that we maintain compliant, written information security programs or run the risk of civil or even criminal sanctions for non-compliance as well as reputational harm for publicly reported breaches or violations.
We may also be exposed to liabilities under the U.S. Foreign Corrupt Practices Act, or FCPA, which generally prohibits companies and their intermediaries from making corrupt payments to foreign officials for the purpose of obtaining or maintaining business or otherwise obtaining favorable treatment, and requires companies to maintain adequate record-keeping and internal accounting practices to accurately reflect the transactions of the company. We are also subject to a number of other laws and regulations relating to money laundering, international money transfers and electronic fund transfers. These laws apply to companies, individual directors, officers, employees and agents.
If any of our operations are found to have violated or be in violation of any of the laws described above and other applicable state and federal fraud and abuse laws, we may be subject to penalties, among them being civil and criminal penalties, damages, fines, exclusion from government healthcare programs, and the curtailment or restructuring of our operations.
Third-Party Reimbursement
In the U.S., healthcare providers generally rely on third-party payors, principally private insurers and governmental payors such as Medicare and Medicaid, to cover and pay for all or part of the cost of a spine surgery in which our medical devices are used. We expect that sales volumes and prices of our products will depend in large part on the continued availability of reimbursement from such third-party payors. These third-party payors may deny reimbursement if they determine that a device used in a procedure was not medically necessary in accordance with cost-effective treatment methods, as determined by the third-party payor, or was used for an unapproved indication. Particularly in the U.S., third-party payors continue to carefully review, and increasingly challenge, the prices charged for procedures and medical products. Medicare coverage and reimbursement policies are developed by CMS, the federal agency responsible for administering the Medicare program, and its contractors. CMS establishes these Medicare policies for medical products and procedures and such policies are periodically reviewed and updated. While private payors vary in their coverage and payment policies, the Medicare program is viewed as a benchmark. Medicare payment rates for the same or similar procedures vary due to geographic location, nature of the facility in which the procedure is performed (i.e., teaching or community hospital) and other factors. We cannot assure you that government or private third-party payors will cover and provide adequate payment for the procedures in which our products are used. ACA and other reform proposals contain significant changes regarding Medicare, Medicaid and other third party payors.
Among these changes was the imposition of a 2.3% excise tax on domestic sales of medical devices that went into effect on January 1, 2013. This tax has resulted in a significant increase in the tax burden on our industry. In December 2015, the U.S. Congress adopted and President Obama signed into law the Consolidated Appropriations Act of 2016. Among other things, this legislation put in place a two-year moratorium on the device tax through the end of 2017.
Other elements of ACA include numerous provisions to limit Medicare spending through reductions in various fee schedule payments and by instituting more sweeping payment reforms, such as bundled payments for episodes of care, the establishment of “accountable care organizations” under which hospitals and physicians will be able to share savings that result from cost control efforts, comparative effectiveness research, value-based purchasing, and the establishment of an independent payment advisory board. Many of these provisions have been implemented through the regulatory process. In addition, in June 2012 the United States Supreme Court upheld the constitutionality of the minimum essential health insurance coverage rule, or so-called personal mandate, while holding that the federal government must give states the option to accept ACA’s Medical expansion provisions without risk of losing all federal Medicaid funds. Pursuant to that ruling, several states have declined to expand Medicaid coverage. For those states, the failure to expand its Medicaid program as prescribed in ACA will restrict the ability of populations potentially served by such expansion to use our products. Other proposals have been introduced in Congress to repeal the device tax and various healthcare reform proposals have also emerged at the state level. An expansion in government’s role in the U.S. healthcare industry may lower reimbursements for our products, reduce medical procedure volumes, and adversely affect our business and results of operations, possibly materially.
Internationally, healthcare payment systems vary substantially from country to country and include single-payor, government-managed systems as well as systems in which private payors and government-managed systems exist side-by-side. Our ability to achieve market acceptance or significant sales volume in international markets we enter will be dependent in large part on the availability of reimbursement for procedures performed using our products under the healthcare payment systems in such markets. A small number of countries may require us to gather additional clinical data before covering our products. It is our intent to complete the requisite clinical studies and obtain coverage in countries where it makes economic sense to do so.
We believe that the overall escalating cost of medical products and services has led to, and will continue to lead to, increased pressures on the healthcare industry to reduce the costs of products and services. We cannot assure you that government or private third-party payors will cover and provide adequate payment for the procedures using our products. In
14
addition, it is possible that future legislation, regulation, or reimbursement policies of third-party payors will adversely affect the demand for procedures using our products or our ability to sell our products on a profitable basis. The unavailability or inadequacy of third-party payor coverage or reimbursement could have a significant adverse effect on our business, operating results and financial condition.
Employees
As of December 31,
2015
, we had approximately 430 employees worldwide in the following areas: sales, customer service, marketing, clinical education, manufacturing, advanced manufacturing, quality assurance, regulatory affairs, research and development, human resources, finance, legal, information technology and administration. We have never experienced a work stoppage due to labor difficulties and believe that our relations with our employees are good. Certain employees in Europe have labor committees and collective bargaining agreements in place.
Corporate and Available Information
We are a Delaware corporation. We were incorporated in March 2005. Our principal executive office is located at 5818 El Camino Real, Carlsbad, California 92008. Our Internet address is www.alphatecspine.com. By referring to our website, we do not incorporate the website or any portion of the website by reference into this Annual Report on Form 10-K. We are not including the information contained on our website as a part of, or incorporating it by reference into, this Annual Report on Form 10-K. Our annual reports on Form 10-K, quarterly reports on Form 10-Q, current reports on Form 8-K, and all amendments to those reports, are available to you free of charge through the Investor Relations section of our website as soon as reasonably practicable after such materials have been electronically filed with, or furnished to, the Securities and Exchange Commission, or SEC.
Investing in our common stock involves a high degree of risk. You should carefully consider the following risk factors and all other information contained or incorporated by reference in this Annual Report on Form 10-K. The risks and uncertainties described below are not the only ones facing us. Additional risks and uncertainties that we are unaware of, or that we currently deem immaterial, also may become important factors that affect us. If any of such risks or the risks described below, either alone or taken together, occur, our business, financial condition or results of operations could be materially and adversely affected. In that case, the trading price of our common stock could decline, and you may lose some or all of your investment.
Risks Related to Our Business and Industry
Our business plan relies on certain assumptions pertaining to the market for our products that, if incorrect, may adversely affect our growth and profitability.
We allocate our design, development, marketing, management and financial resources based on our business plan, which includes assumptions about various demographic trends and trends in the treatment of spine disorders and the resulting demand for our products. However, these trends are uncertain. There can be no assurance that our assumptions with respect to an aging population with broad medical coverage and longer life expectancy, which we expect to lead to increased spinal injuries and degeneration, are accurate. In addition, an increasing awareness and use of non-invasive means for the prevention and treatment of back pain and rehabilitation purposes may reduce demand for, or slow the growth of sales of, spine fusion products. A significant shift in technologies or methods used in the treatment of back pain or damaged or diseased bone and tissue could adversely affect demand for some or all of our products. For example, pharmaceutical advances could result in non-surgical treatments gaining more widespread acceptance as a viable alternative to spine fusion. The emergence of new biological or synthetic materials to facilitate regeneration of damaged or diseased bone and to repair damaged tissue could increasingly minimize or delay the need for spine fusion surgery and provide other biological alternatives to spine fusion. New surgical procedures could diminish demand for some of our products. The increased acceptance of emerging technologies that do not require spine fusion, such as artificial discs and nucleus replacement, for the surgical treatment of spine disorders would reduce demand for, or slow the growth of sales of, spine fusion products. If our assumptions regarding these factors prove to be incorrect or if alternative treatments to those offered by our products gain further acceptance, then demand for our products could be significantly less than we anticipate and we may not be able to achieve or sustain growth or profitability.
We are in a highly competitive market segment, face competition from large, well-established medical device companies with significant resources, and may not be able to compete effectively.
The market for spine fusion products and procedures is intensely competitive, subject to rapid technological change and significantly affected by new product introductions and other market activities of industry participants. In
2015
, a significant
15
percentage of global spine implant product revenues was generated by Medtronic Sofamor Danek, a subsidiary of Medtronic, Inc.; Depuy Spine, a subsidiary of Johnson & Johnson; and Stryker Spine. Our competitors also include numerous other publicly-traded and privately-held companies.
Several of our competitors enjoy competitive advantages over us, including:
|
•
|
more established relationships with spine surgeons;
|
|
•
|
more established distribution networks;
|
|
•
|
broader spine surgery product offerings;
|
|
•
|
stronger intellectual property portfolios;
|
|
•
|
greater financial and other resources for product research and development, sales and marketing, and patent litigation;
|
|
•
|
greater experience in, and resources for, launching, marketing, distributing and selling products;
|
|
•
|
significantly greater name recognition as well as more recognizable trademarks for products similar to the products that we sell;
|
|
•
|
more established relationships with healthcare providers and payors;
|
|
•
|
products supported by more extensive clinical data; and
|
|
•
|
greater experience in obtaining and maintaining FDA and other regulatory clearances or approvals for products and product enhancements.
|
In addition, at any time our current competitors or other companies may develop alternative treatments, products or procedures for the treatment of spine disorders that compete directly or indirectly with our products, including ones that prove to be superior to our spine surgery products. For these reasons, we may not be able to compete successfully against our existing or potential competitors. Any such failure could lead us to modify our strategy, lower our prices, increase the commissions we pay on sales of our products and have a significant adverse effect on our business, financial condition and results of operations.
A significant percentage of our revenues are derived from the sale of our systems that include polyaxial pedicle screws.
Net sales of our systems that include polyaxial pedicle screws represented approximately 55% and 49% of our net sales for
2015
and
2014
, respectively. A decline in sales of these systems, due to lower market demand, the introduction by a third party of a competitive product, an intellectual property dispute involving these systems, or otherwise, would have a significant adverse impact on our business, financial condition and results of operations. Some of the technology related to our polyaxial pedicle screw systems is licensed to us. Any action that would prevent us from manufacturing, marketing and selling our polyaxial pedicle screw systems would have a significant adverse effect on our business, financial condition and results of operations.
Compliance with changing regulations and standards for accounting, corporate governance and public disclosure may result in additional expenses.
Changing laws, regulations and standards relating to corporate governance and public disclosure, including the Sarbanes-Oxley Act of 2002, new SEC regulations, including accelerated SEC filing timelines and new proxy rules, new NASDAQ Stock Market rules, and new accounting pronouncements create uncertainty and additional complexities for companies such as ours. In particular, the Section 404 internal control evaluation requirements under the Sarbanes-Oxley Act have added and will continue to add complexity and costs to our business and require a significant investment of our time and resources to complete each year. We take these requirements seriously and will make every effort to ensure that we receive clean attestations on our internal controls each year from our outside auditors, but there is no guarantee that our efforts to do so will be successful. As discussed in Item 9A of this report, we determined that we had a material weakness in our internal control over financial reporting for the quarters ended June 30, 2015 and September 30, 2015, which we believe was remediated, and for the quarter ended December 31, 2015, which we are seeking to remediate. To maintain high standards of corporate governance and public disclosure, we intend to invest all reasonably necessary resources to comply with all other evolving standards. These investments may result in increased general and administrative expenses and a diversion of management time and attention from strategic revenue generating and cost management activities.
If we fail to regain and maintain effective internal controls and procedures for financial reporting, we could be unable to provide timely and accurate financial information and therefore be subject to delisting from The NASDAQ Global Select Market, an investigation by the SEC, and civil or criminal sanctions. Additionally, ineffective internal control over financial reporting would place us at increased risk of fraud or misuse of corporate assets and could cause our stockholders, lenders, suppliers and others to lose confidence in the accuracy or completeness of our financial reports.
16
Our sales and marketing efforts in the U.S. are largely dependent upon third parties, some of which are free to market products that compete with our products.
Certain of our independent distributors in the U.S. also market and sell the products of our competitors, and those competitors may have the ability to influence the products that our independent distributors choose to market and sell. Our competitors may be able, by offering higher commission payments or otherwise, to convince our independent distributors to terminate their relationships with us, carry fewer of our products or reduce their sales and marketing efforts for our products.
We may be unable to accurately predict future sales through distributors that purchase products directly from us, which could harm our ability to forecast sales performance.
A portion of our sales are made through domestic and international third-party distributors that purchase our products directly from us and then resell such products to hospitals. As a result, our financial results, quarterly product sales, trends and comparisons are affected by fluctuations in the buying patterns and inventory levels of these distributors. While we attempt to assist such distributors in forecasting their future sales and maintaining adequate inventory levels, we may not be consistently accurate or successful. In addition, our distributors’ decision-making process regarding orders is complex and involves several factors, including surgeon demand levels, which can make it difficult to accurately predict our sales until late in a quarter. Our failure to accurately forecast sales through distributors that purchase products directly from us and the failure of such distributors to maintain adequate inventory levels could lead to a decline in sales and adversely affect our results of operations.
If pricing pressures cause us to decrease prices for our goods and services and we are unable to compensate for such reductions through changes in our product mix or reductions to our expenses, our results of operations will suffer.
We may experience decreasing prices for our goods and services we offer due to pricing pressure exerted by our customers in response to increased cost containment efforts from managed care organizations and other third-party payors and increased market power of our customers as the medical device industry consolidates. If we are unable to offset such price reductions through changes in our product mix or reductions in our expenses, our business, financial condition, results of operations and cash flows will be adversely affected.
We conduct a significant amount of our sales activity outside of the U.S., which subjects us to additional business risks and may adversely affect our results of operations and financial condition.
During the year ended
December 31, 2015
, we derived $
70.7 million
, or
38%
of our net sales from sales of products outside of the U.S. We intend to continue to pursue growth opportunities in sales internationally, which could expose us to additional risks associated with international sales and operations. Our international operations are, and will continue to be, subject to a number of risks and potential costs, including:
|
•
|
changes in foreign medical reimbursement policies and programs;
|
|
•
|
changes in foreign regulatory requirements;
|
|
•
|
differing local product preferences and product requirements;
|
|
•
|
diminished protection of intellectual property in some countries outside of the U.S.;
|
|
•
|
differing payment cycles;
|
|
•
|
trade protection measures and import or export licensing requirements;
|
|
•
|
difficulty in staffing, training and managing foreign operations;
|
|
•
|
differing legal requirements and labor relations;
|
|
•
|
potentially negative consequences from changes in tax laws (including potentially taxes payable on earnings of foreign subsidiaries upon repatriation); and
|
|
•
|
political and economic instability.
|
In addition, we are subject to risks arising from currency exchange rate fluctuations, which could decrease our revenues, increase our costs and may adversely affect our results of operations. Significant increases in the value of the U.S. dollar relative to foreign currencies could have a material adverse effect on our international results of operations.
17
To be commercially successful, we must convince the spine surgeon community that our products are an attractive alternative to our competitors’ products. If the spine surgeon community does not use our products, our sales will decline and we will be unable to increase our sales and profits.
In order for us to sell our products, surgeons must be convinced that our products are superior to competing products. Acceptance of our products depends on educating the spine surgeon community as to the distinctive characteristics, perceived benefits, safety and cost-effectiveness of our products compared to our competitors’ products and on training surgeons in the proper application of our products. If we are not successful in convincing the spine surgeon community of the merit of our products, our sales will decline and we will be unable to increase or achieve and sustain growth or profitability.
There is a learning process involved for spine surgeons to become proficient in the use of our products. Although most spine surgeons may have adequate knowledge on how to use most of our products based on their clinical training and experience, we believe that the most effective way to introduce and build market demand for our products is by directly training spine surgeons in the use of our products. If surgeons are not properly trained, they may misuse or ineffectively use our products. This may also result in unsatisfactory patient outcomes, patient injury, negative publicity or lawsuits against us, any of which could have a significant adverse effect on our business, financial condition and results of operations.
We must retain the current distributors of our products and attract new distributors of our products.
As we launch new products and increase our marketing efforts with respect to existing products, we will need to expand our sales and marketing organization. We plan to accomplish this by increasing our network of independent distributors and hiring additional direct sales representatives. The establishment and development of a broader sales network and dedicated sales force may be expensive and time consuming. Because of the intense competition for their services, we may be unable to recruit or retain additional qualified independent distributors and to hire additional direct sales representatives to work with us. Often, our competitors enter into distribution agreements with independent distributors that require such distributors to exclusively sell the products of our competitors. Further, we may not be able to enter into agreements with independent distributors on commercially reasonable terms, if at all. Even if we do enter into agreements with additional independent distributors, it often takes 90 to 120 days for new distributors to reach full operational effectiveness and such distributors may not generate revenue as quickly as we expect them to, commit the necessary resources to effectively market and sell our products or ultimately be successful in selling our products. Our business, financial condition and results of operations will be materially adversely affected if we do not retain our existing independent distributors and attract new, additional independent distributors or if the marketing and sales efforts of our independent distributors and our own direct sales representatives are unsuccessful.
We rely on a limited number of third parties to manufacture and supply our products. Any problems experienced by any of these manufacturers could result in a delay or interruption in the supply of our products to us until such manufacturer cures the problem or until we locate and qualify an alternative source of supply.
In 2015, we began implementing our implant manufacturing outsourcing initiative and in early 2016 we stopped implant manufacturing on-site in Carlsbad, CA. As a result of this transformation, we rely on third party suppliers for the manufacture of our implants and instruments. We currently rely on a limited number of third party suppliers and any prolonged disruption in the operations of our third party suppliers could have a significant negative impact on our ability to supply our products to customers and would cause us to seek additional third-party manufacturing contracts, which may not be available on acceptable terms, if at all. We may suffer losses as a result of business interruptions that exceed coverage under our manufacturer’s insurance policies. Events beyond our control, such as natural disasters, fire, sabotage or business accidents could have a significant negative impact on our operations by disrupting our product development and commercialization efforts until such third-party supplier can repair its facility or put in place third-party contract manufacturers to assume this manufacturing role, which we may not be able to do on reasonable terms, if at all. In addition, if we are required to change manufacturers for any reason, we will be required to verify that the new manufacturer maintains facilities and procedures that comply with quality standards and with all applicable regulations and guidelines. The delays associated with the verification of a new manufacturer or the re-verification of an existing manufacturer could negatively affect our ability to develop products or supply products to customers in a timely manner. Any disruption in the manufacture of our products by our third party suppliers could have a material adverse impact on our business, financial condition and results of operations.
We depend on various third-party suppliers, and in one case a single third-party supplier, for key raw materials used in the manufacturing processes for our products and the loss of any of these third-party suppliers, or their inability to supply us with adequate raw materials, could harm our business.
We use a number of raw materials, including titanium, titanium alloys, stainless steel, PEEK, and human tissue. We rely from time to time on a number of suppliers and in one case on a single source vendor, Invibio. We have a supply agreement
18
with Invibio, pursuant to which it supplies us with PEEK, a biocompatible plastic that we use in some of our spacers. Invibio is one of a limited number of companies approved to distribute PEEK in the U.S. for use in implantable devices. During
2015
and
2014
, approximately 18% and 16%, respectively, of our revenues were derived from products manufactured using PEEK.
We depend on a limited number of sources of human tissue for use in our biologics products, and any failure to obtain tissue from these sources or to have the tissue processed by these entities for us in a timely manner will interfere with our ability to meet demand for our biologics products effectively. The processing of human tissue into biologics products is labor intensive and it is therefore difficult to maintain a steady supply stream. In addition, due to seasonal changes in mortality rates, some scarce tissues used for our biologics products are at times in particularly short supply. We cannot be certain that our supply of human tissue from our current suppliers and our current inventory of biologics products will be available at current levels or will be sufficient to meet our needs.
Our dependence on a single third-party PEEK supplier and the challenges we may face in obtaining adequate supplies of biologics products involve several risks, including limited control over pricing, availability, quality and delivery schedules. In addition, any supply interruption in a limited or sole sourced component or raw material, such as PEEK or human tissue, could materially harm the ability of our third party manufacturers to manufacture our products until a new source of supply, if any, could be found. We may be unable to find a sufficient alternative supply channel in a reasonable time period or on commercially reasonable terms, if at all, which would have a significant adverse effect on our business, financial condition and results of operations.
Our tissue-based products and related technologies could become subject to significantly greater regulation by the FDA, which could disrupt our business.
The FDA regulates human cells, tissues, and cellular and tissue-based products or HCT/Ps, but the extent to which they are regulated depends on how they are manufactured and used and whether they meet other criteria for minimal regulation. These criteria include but are not limited to the use of the HCT/Ps for homologous use only and minimal manipulation of the HCT/Ps. HCT/Ps that do not meet these criteria are regulated as medical devices, drugs or biologics. If the FDA determines that any of our current or future products contain HCT/Ps that do not meet these criteria, it could subject some of our products to additional review. If this were to happen, further distribution of the affected products could be interrupted for a substantial period of time, which would reduce our revenues and hurt our profitability.
If we or our suppliers fail to comply with the FDA’s quality system and good tissue practice regulations, the manufacture of our products could be delayed.
We and our suppliers are required to comply with the FDA’s QSRs, which cover, among other things, the methods and documentation of the design, testing, production, control, quality assurance, labeling, packaging, sterilization, record keeping, storage and shipping of our products. In addition, suppliers and processors of products derived from HCT must comply with the FDA’s current good tissue practice requirements, or CGTPs, which govern the methods used in and the facilities and controls used for the manufacture of HCT/Ps, record keeping and the establishment of a quality program. The FDA audits compliance with the QSRs and CGTPs through inspections of manufacturing and other facilities. If we or our suppliers have significant non-compliance issues or if any corrective action plan is not sufficient, we or our suppliers could be forced to halt the manufacture of our products until such problems are corrected to the FDA’s satisfaction, which could have a material adverse effect on our business, financial condition and results of operations. Further, our products could be subject to recall if the FDA determines, for any reason, that our products are not safe or effective. Any recall or FDA requirement demanding that we seek additional approvals or clearances could result in delays, costs associated with modification of a product, loss of revenue and potential operating restrictions imposed by the FDA, all of which could have a material adverse effect on our business, financial condition and results of operations.
On July 17, 2015, Alphatec Spine, Inc., our wholly owned subsidiary, received a Warning Letter from the FDA in connection with the FDA’s inspection of our manufacturing facilities located in Carlsbad, California that occurred from February 4, 2015 until March 13, 2015, or the Inspection. In the Warning Letter, the FDA cited eight deficiencies in our responses to investigator's observations on the FDA Form 483, which was issued to us at the end of the Inspection. The deficiencies relate to our internal procedures for quality planning, design control, document control and corrective and preventive actions. The Warning Letter does not restrict production or shipment of our products from our facilities, or the sale or marketing of our products. We are currently addressing the deficiencies cited by the FDA in the Warning Letter and intend to work closely with the FDA to resolve any outstanding issues. Until the procedures noted in the Warning Letter are corrected, we may be subject to additional regulatory action by the FDA, and any such actions could significantly disrupt our ongoing business and operations and have a material adverse impact on our financial position and operating results. There can be no assurance that the FDA will be satisfied with our response.
19
Healthcare policy changes, including recent federal legislation to reform the U.S. healthcare system, may have a material adverse effect on us.
In response to perceived increases in health care costs in recent years, there have been and continue to be proposals by the federal government, state governments, regulators and third-party payors to control these costs and, more generally, to reform the U.S. healthcare system. Certain of these proposals could limit the prices we are able to charge for our products or the amounts of reimbursement available for our products, limit the acceptance and availability of our products, and have a material adverse effect on our financial position and results of operations.
In March 2010, the U.S. Congress adopted and President Obama signed into law the ACA. The legislation imposes a 2.3% excise tax on domestic sales of medical devices which went into effect on January 1, 2013. This tax resulted in a significant increase in the tax burden on our industry. In December 2015, the U.S. Congress adopted and President Obama signed into law the Consolidated Appropriations Act of 2016. Among other things, this legislation put in place a two-year moratorium on the device tax through the end of 2017.
Other elements of ACA include numerous provisions to limit Medicare spending through reductions in various fee schedule payments and by instituting more sweeping payment reforms, such as bundled payments for episodes of care, the establishment of “accountable care organizations” under which hospitals and physicians will be able to share savings that result from cost control efforts, comparative effectiveness research, value-based purchasing, and the establishment of an independent payment advisory board. Many of these provisions have been implemented through the regulatory process with most of the legislation implemented as of January 1, 2014. Other proposals have been introduced in Congress to repeal the device tax, and various healthcare reform proposals have also emerged at the state level. An expansion in government’s role in the U.S. healthcare industry may lower reimbursements for our products, reduce medical procedure volumes and adversely affect our business and results of operations, possibly materially.
The demand for our products and the prices at which customers and patients are willing to pay for our products depend upon the ability of our customers to obtain adequate third-party coverage and reimbursement for their purchases of our products.
Sales of our products depend in part on the availability of adequate coverage and reimbursement from governmental and private payors. In the U.S., healthcare providers that purchase our products generally rely on third-party payors, principally Medicare, Medicaid and private health insurance plans, to pay for all or a portion of the costs and fees associated with the use of our products. In addition, several million individuals were able to purchase health insurance in 2014 for the first time through health insurance "exchanges" established under the ACA. While our currently marketed products are eligible for reimbursement in the U.S., if surgical procedures utilizing our products are performed on an outpatient basis, it is possible that private payors may no longer provide reimbursement for our products without further supporting data on our procedure. Any delays in obtaining, or an inability to obtain, adequate coverage or reimbursement for procedures using our products could significantly affect the acceptance of our products and have a significant adverse effect on our business. Additionally, third-party payors continue to review their coverage policies carefully for existing and new therapies and can, without notice, deny coverage for treatments that include the use of our products. Our business would be negatively impacted if there are any changes that reduce reimbursement for our products.
With respect to coverage and reimbursement outside of the U.S., reimbursement systems in international markets vary significantly by country, and by region within some countries, and reimbursement approvals must be obtained on a country-by-country basis and can take up to 18 months, or longer. Many international markets have government-managed healthcare systems that govern reimbursement for new devices and procedures. In most markets, there are private insurance systems as well as government-managed systems. Additionally, some foreign reimbursement systems provide for limited payments in a given period and therefore result in extended payment periods. Reimbursement in international markets may require us to undertake country-specific reimbursement activities, including additional clinical studies, which could be time consuming, expensive and may not yield acceptable reimbursement rates.
Furthermore, healthcare costs have risen significantly over the past decade. There have been and may continue to be proposals by legislators, regulators and third-party payors to contain these costs. Several such proposals were enacted as part of ACA, and include numerous provisions to limit Medicare spending through reductions in various fee schedule payments and sweeping payment reforms. Other federal and state cost-control measures include prospective payment systems, capitated rates, group purchasing, redesign of benefits, requiring pre-authorizations or second opinions prior to major surgery, encouragement of healthier lifestyles and exploration of more cost-effective methods of delivering healthcare. Some healthcare providers in the U.S. have adopted or are considering a managed care system in which the providers contract to provide comprehensive healthcare for a fixed cost per person. Healthcare providers may also attempt to control costs by authorizing fewer elective surgical procedures or by requiring the use of the least expensive devices possible. These cost-control methods also potentially limit the amount which healthcare providers may be willing to pay for medical devices. In addition, in the U.S., no uniform
20
policy of coverage and reimbursement for medical technology exists among all these payors. Therefore, coverage of and reimbursement for medical technology can differ significantly from payor to payor. The continuing efforts of third-party payors, whether governmental or commercial, whether inside or outside the U.S., to contain or reduce these costs, combined with closer scrutiny of such costs, could restrict our customers’ ability to obtain adequate coverage and reimbursement from these third-party payors. The cost containment measures contained in ACA and other measures being considered at the federal and state level, as well as internationally, could harm our business by adversely affecting the demand for our products or the price at which we can sell our products.
Consolidation in the healthcare industry could lead to demands for price concessions or to the exclusion of some suppliers from certain of our markets, which could have an adverse effect on our business, financial condition or results of operations.
Because healthcare costs have risen significantly over the past decade, numerous initiatives and reforms initiated by legislators, regulators and third-party payors to curb these costs have resulted in a consolidation trend in the healthcare industry to create new companies with greater market power, including hospitals. As the healthcare industry consolidates, competition to provide products and services to industry participants has become and will continue to become more intense. This in turn has resulted and will likely continue to result in greater pricing pressures and the exclusion of certain suppliers from important market segments as group purchasing organizations, independent delivery networks and large single accounts continue to use their market power to consolidate purchasing decisions for some of our customers. We expect that market demand, government regulation, third-party reimbursement policies and societal pressures will continue to change the worldwide healthcare industry, resulting in further business consolidations and alliances among our customers, which may reduce competition, exert further downward pressure on the prices of our products and may adversely impact our business, financial condition or results of operations.
We may be subject to or otherwise affected by federal and state healthcare laws, including fraud and abuse, health information privacy and security, and disclosure laws, and could face substantial penalties if we are unable to fully comply with such laws.
Although we do not provide healthcare services, submit claims for third-party reimbursement, or receive payments directly from Medicare, Medicaid, or other third-party payors for our products or the procedures in which our products are used, healthcare regulation by federal and state governments significantly impacts our business. Healthcare fraud and abuse, health information privacy and security, and disclosure laws potentially applicable to our operations include:
|
•
|
the federal Anti-Kickback Statute, as well as state analogs, which constrains our marketing practices and those of our independent sales agents and distributors, educational programs, pricing policies, and relationships with healthcare providers by prohibiting, among other things, knowingly and willfully soliciting, receiving, offering or providing remuneration, intended to induce the purchase or recommendation of an item or service reimbursable under a federal (or state or commercial) healthcare program (such as the Medicare or Medicaid programs);
|
|
•
|
the federal ban, as well as state analogs, on physician self-referrals, which prohibits, subject to certain exceptions, physician referrals of Medicare and Medicaid patients to an entity providing certain “designated health services” if the physician or an immediate family member of the physician has any financial relationship with the entity;
|
|
•
|
federal false claims laws which prohibit, among other things, knowingly presenting, or causing to be presented, claims for payment from Medicare, Medicaid, or other third-party payors that are false or fraudulent;
|
|
•
|
HIPAA, and its implementing regulations, which created federal criminal laws that prohibit executing a scheme to defraud any healthcare benefit program or making false statements relating to healthcare matters;
|
|
•
|
the state and federal laws “sunshine” provisions that require detailed reporting and disclosures to CMS and made available on CMS's website starting in the fall of 2014, and applicable states of any payments or “transfer of value” made or distributed to prescribers and other health care providers, and for certain states prohibit some forms of these payments, require the adoption of marketing codes of conduct, and constrain their relationships with physicians and other referral sources;
|
|
•
|
state laws analogous to each of the above federal laws, such as anti-kickback and false claims laws that may apply to items or services reimbursed by any third-party payor, including commercial insurers, and state laws governing the privacy of certain health information, many of which differ from each other in significant ways and often are not preempted by HIPAA, thus complicating compliance efforts;
|
21
|
•
|
the Administrative Simplification provisions of HIPAA, specifically, privacy and security provisions including recent amendments under HITECH which impose stringent restrictions on uses and disclosures of protected health information such as for marketing or clinical research purposes and impose significant civil and criminal penalties for non-compliance and require the reporting of breaches to affected individuals, the government and in some cases the media in the event of a violation; and
|
|
•
|
a variety of state-imposed privacy and data security laws which require the protection of information beyond health information, such as employee information or any class of information combining name with state issued identification numbers, social security numbers, credit card, bank or other financial information and which require reporting to state officials in the event of breach or violation and which impose both civil and criminal penalties.
|
ACA includes various provisions designed to strengthen significantly fraud and abuse enforcement, such as increased funding for enforcement efforts and the lowering of the intent requirement of the federal Anti-Kickback Statute and criminal healthcare fraud statute such that a person or entity no longer needs to have actual knowledge of these statutes or specific intent to violate them.
If our past or present operations, or those of our independent sales agents and distributors are found to be in violation of any of such laws or any other governmental regulations that may apply to us, we may be subject to penalties, including civil and criminal penalties, damages, fines, exclusion from federal healthcare programs and/or the curtailment or restructuring of our operations. Similarly, if the healthcare providers, sales agents, distributors or other entities with which we do business are found to be non-compliant with applicable laws, they may be subject to sanctions, which could also have a negative impact on us. Any penalties, damages, fines, curtailment or restructuring of our operations could adversely affect our ability to operate our business and our financial results. The risk of our being found in violation of these laws is increased by the fact that many of them have not been fully interpreted by the regulatory authorities or the Courts, and their provisions are open to a variety of interpretations. Any action against us for violation of these laws, even if we successfully defend against them, could cause us to incur significant legal expenses and divert our management’s attention from the operation of our business.
In January 2004, the Advanced Medical Technology Association, or AdvaMed, the principal U.S. trade association for the medical device industry, put in place a model “code of conduct”, or the AdvaMed Code, since updated in July 2009, that sets forth standards by which its members should abide in the promotion of their products. Although we are not a member of AdvaMed, we have in place policies and procedures for compliance that we believe are at least as stringent as those set forth in the AdvaMed Code, and we provide routine training to our sales and marketing personnel on our policies regarding sales and marketing practices.
The sales and marketing practices of our industry have been the subject of increased scrutiny from federal and state government agencies, and we believe that this trend will continue. For example, on March 26, 2013 the OIG issued a Special Fraud Alert entitled "Physician-Owned Entities" related to physician-owned distributors, or PODS. We believe that all of our arrangements with PODs comply with applicable fraud and abuse laws and do not believe that we are subject to any arrangements that violate any such laws. Prosecutorial scrutiny and governmental oversight over some major device companies regarding the retention of healthcare professionals as consultants has affected and may continue to affect the manner in which medical device companies may retain healthcare professionals as consultants. We have in place policies to govern how we may retain healthcare professionals as consultants that reflect the current climate on this issue and are providing training on these policies. Any action against us for violation of these laws, even if we successfully defend against them, could cause us to incur significant legal expenses and divert our management’s attention from the operation of our business.
Our international operations may expose us to liabilities under the Foreign Corrupt Practices Act and Money Laundering Laws.
We may be exposed to liabilities under the U.S. Foreign Corrupt Practices Act, or FCPA, which generally prohibits companies and their intermediaries from making corrupt payments to foreign officials for the purpose of obtaining or keeping business or otherwise obtaining favorable treatment, and requires companies to maintain adequate record keeping and internal accounting practices to accurately reflect the transactions of the company. We are also subject to a number of other laws and regulations relating to money laundering, international money transfers and electronic fund transfers, which we collectively refer to as Money Laundering Laws. These laws apply to companies, individual directors, officers, employees and agents.
We operate in a number of jurisdictions with developing economies that pose a high risk of potential violations of the FCPA and Money Laundering Laws, and we utilize third-party distributorships that have government customers. If our employees, third-party distributors or other agents are found to have engaged in practices that violate the FCRA or Money Laundering Laws, we could suffer severe penalties, including criminal and civil penalties, disgorgement and other remedial measures, any of which could have a material adverse effect on our business, financial condition and results of operations.
22
If we fail to obtain, or experience significant delays in obtaining, FDA clearances or approvals for our future products or modifications to our products, our ability to commercially distribute and market our products could suffer.
Our medical devices are subject to extensive regulation by the FDA and numerous other federal, state and foreign governmental authorities. The process of obtaining regulatory clearances or approvals to market a medical device, particularly from the FDA, can be costly and time consuming, and there can be no assurance that such clearances or approvals will be granted on a timely basis, if at all. In particular, the FDA permits commercial distribution of most new medical devices only after the devices have received clearance under Section 510(k) of the Federal Food, Drug and Cosmetic Act, or 510(k), or are the subject of an approved premarket approval application, or a PMA. The 510(k) process generally takes three to nine months, but can take significantly longer, especially if the FDA requires a clinical trial to support the 510(k) application. Currently, we do not know whether the FDA will require clinical data in support of any 510(k)s that we intend to submit for other products in our pipeline. In addition, the FDA continues to re-examine its 510(k) clearance process for medical devices and published several draft guidance documents that could change that process. Any changes that make the process more restrictive could increase the time it takes for us to obtain clearances or could make the 510(k) process unavailable for certain of our products. A PMA must be submitted to the FDA if the device cannot be cleared through the 510(k) process or is not exempt from premarket review by the FDA. A PMA must be supported by extensive data, including results of preclinical studies and clinical trials, manufacturing and control data and proposed labeling, to demonstrate to the FDA’s satisfaction the safety and effectiveness of the device for its intended use. The PMA process is more costly and uncertain than the 510(k) clearance process, and generally takes between one and three years, if not longer. In addition, any modification to a 510(k)-cleared device that could significantly affect its safety or effectiveness, or that would constitute a major change in its intended use, design or manufacture, requires a new 510(k) clearance or, possibly, a PMA.
Our commercial distribution and marketing of any products or product modifications that we develop will be delayed until regulatory clearance or approval is obtained. In addition, because we cannot assure you that any new products or any product modifications we develop will be subject to the shorter 510(k) clearance process, the regulatory approval process for our new products or product modifications may take significantly longer than anticipated. There is no assurance that the FDA will not require a new product or product modification to go through the lengthy and expensive PMA approval process. Delays in obtaining regulatory clearances and approvals may:
|
•
|
delay or prevent commercialization of products we develop;
|
|
•
|
require us to perform costly tests or studies;
|
|
•
|
diminish any competitive advantages that we might otherwise have obtained; and
|
|
•
|
reduce our ability to collect revenues.
|
To date, all of our non-biologic medical device products that have required FDA review that are being sold in the U.S. have been cleared through the 510(k) process without any required clinical trials. However, the FDA may require clinical data in support of any future 510(k)s or PMAs that we intend to submit for products in our pipeline. We have limited experience in performing clinical trials that might be required for a 510(k) clearance or PMA approval. If any of our products require clinical trials, the commercialization of such products could be delayed which could have a material adverse effect on our business, financial condition and results of operations.
The safety of our products is not yet supported by long-term clinical data and may therefore prove to be less safe and effective than initially thought.
We obtained clearance to offer all of our current non-biologic medical device products through the 510(k) route. The ability to obtain a 510(k) clearance is generally based on the FDA’s agreement that a new product is substantially equivalent to certain already marketed products. Because most 510(k)-cleared products were not the subject of pre-market clinical trials, surgeons may be slow to adopt our 510(k)-cleared products, we may not have the comparative data that our competitors have or are generating, and we may be subject to greater regulatory and product liability risks. With the passage of the American Recovery and Reinvestment Act of 2009, funds have been appropriated for the U.S. Department of Health and Human Services’ Healthcare Research and Quality to conduct comparative effectiveness research to determine the effectiveness of different drugs, medical devices, and procedures in treating certain conditions and diseases. Some of our products or procedures performed with our products could become the subject of such research. It is unknown what effect, if any, this research may have on our business. Further, future research or experience may indicate that treatment with our products does not improve patient outcomes or improves patient outcomes less than we initially expect. Such results would reduce demand for our products and this could cause us to withdraw our products from the market. Moreover, if future research or experience indicate that our products cause unexpected or serious complications or other unforeseen negative effects, we could be subject to significant legal liability, significant negative publicity, damage to our reputation and a dramatic reduction in sales of our products, all of which would have a material adverse effect on our business, financial condition and results of operations.
23
Due to the anticipated regulatory pathway, we do not anticipate commercializing certain products in the U.S.
Several of our products are not available for sale in the U.S., due to the anticipated regulatory path that is required to sell such product in the U.S. Prior to such products being sold in the U.S., we anticipate that the FDA will require submission of either a 510(k) with clinical trial data or a PMA. As a result, to receive regulatory clearance or approval in the U.S. for OsseoScrew, we must conduct, at our own expense, a clinical trial to demonstrate efficacy and safety in humans. Clinical trials are expensive and have an uncertain outcome. In addition, clinical failure can occur at any stage of the testing. As a result, we do not anticipate ever selling such products in the U.S.
If we choose to acquire new and complementary businesses, products or technologies, we may be unable to complete these acquisitions or successfully integrate them in a cost-effective and non-disruptive manner.
Our success depends in part on our ability to continually enhance and broaden our product offering in response to changing customer demands, competitive pressures and technologies and our ability to increase our market share. Accordingly, we have pursued and intend to pursue the acquisition of complementary businesses, products or technologies instead of developing them ourselves. We do not know if we will be able to successfully complete any acquisitions, or whether we will be able to successfully integrate any acquired business, product or technology into our business or retain any key personnel, suppliers or distributors. Our ability to successfully grow through acquisitions depends upon our ability to identify, negotiate, complete and integrate suitable acquisitions and to obtain any necessary financing. These efforts could be expensive and time consuming, disrupt our ongoing business and distract management. If we are unable to integrate any future or recently acquired businesses, products or technologies effectively, our business, financial condition and results of operations will be materially adversely affected. For example, an acquisition could materially impair our operating results by causing us to incur debt or requiring us to amortize significant amounts of expenses, including non-cash acquisition costs, and acquired assets.
We may not be able to timely develop new products or product enhancements that will be accepted by the market.
We sell our products in a market that is characterized by technological change, product innovation, evolving industry standards, competing patent claims, patent litigation and intense competition. Our success will depend in part on our ability to develop and introduce new products and enhancements or modifications to our existing products, which we will need to do before our competitors do so and in a manner that does not infringe issued patents of third parties from which we do not have a license. We cannot assure you that we will be able to successfully develop or market new, improved or modified products, or that any of our future products will be accepted by even the surgeons who use our current products. Our competitors’ product development capabilities could be more effective than our capabilities, and their new products may get to market before our products. In addition, the products of our competitors may be more effective or less expensive than our products. The introduction of new products by our competitors may lead us to have price reductions, reduced margins or loss of market share and may render our products obsolete or noncompetitive. The success of any of our new product offerings or enhancement or modification to our existing products will depend on several factors, including our ability to:
|
•
|
properly identify and anticipate surgeon and patient needs;
|
|
•
|
develop new products or enhancements in a timely manner;
|
|
•
|
obtain the necessary regulatory approvals for new products or product enhancements;
|
|
•
|
provide adequate training to potential users of new products;
|
|
•
|
receive adequate reimbursement approval of third-party payors such as Medicaid, Medicare and private insurers; and
|
|
•
|
develop an effective marketing and distribution network.
|
Developing products in a timely manner can be difficult, in particular because product designs change rapidly to adjust to third-party patent constraints and to market preferences. As a result, we may experience delays in our product launches which may significantly impede our ability to enter or compete in a given market and may reduce the sales that we are able to generate from these products. We may experience delays in any phase of a product launch, including during research and development, clinical trials, manufacturing, marketing and the surgeon training process. In addition, our suppliers of products or components can suffer similar delays, which could cause delays in our product introductions. If we do not develop new products or product enhancements in time to meet market demand or if there is insufficient demand for these new products or enhancements, it could have a significant adverse effect on our business financial condition and results of operations.
24
We are dependent on our senior management team, sales and marketing team, engineering team and key surgeon advisors, and the loss of any of them could harm our business.
Our continued success depends in part upon the continued availability and contributions of our senior management, sales and marketing team and engineering team and the continued participation of our key surgeon advisors. While we have entered into employment agreements with all members of our senior management team, none of these agreements guarantees the services of the individual for a specified period of time. We would be adversely affected if we fail to adequately prepare for future turnover of our senior management team. Our ability to grow or at least maintain our sales levels depends in large part on our ability to attract and retain sales and marketing personnel and for these sales people to maintain their relationships with surgeons directly and through our distributors. We rely on our engineering team to research, design and develop potential products for our product pipeline. We also rely on our surgeon advisors to advise us on our products, our product pipeline, long-term scientific planning, research and development and industry trends. We compete for personnel and advisors with other companies and other organizations, many of which are larger and have greater name recognition and financial and other resources than we do. The loss of members of our senior management team, sales and marketing team, engineering team and key surgeon advisors, or our inability to attract or retain other qualified personnel or advisors, could have a significant adverse effect on our business, financial conditions and results of operations.
Security breaches, loss of data and other disruptions could compromise sensitive information related to our business, prevent us from accessing critical information or expose us to liability, which could adversely affect our business and our reputation.
In the ordinary course of our business, we collect and store sensitive data, including legally protected patient health information, credit card information, personally identifiable information about our employees, intellectual property, and proprietary business information. We manage and maintain our applications and data utilizing on-site systems. These applications and data encompass a wide variety of business critical information including research and development information, commercial information and business and financial information.
The secure processing, storage, maintenance and transmission of this critical information is vital to our operations and business strategy, and we devote significant resources to protecting such information. Although we take measures to protect sensitive information from unauthorized access or disclosure, our information technology and infrastructure may be vulnerable to attacks by hackers, viruses, breaches or interruptions due to employee error or malfeasance, terrorist attacks, earthquakes, fire, flood, other natural disasters, power loss, computer systems failure, data network failure, Internet failure, or lapses in compliance with privacy and security mandates. Any such attack, virus, breach or interruption could compromise our networks and the information stored there could be accessed by unauthorized parties, publicly disclosed, lost or stolen. We have measures in place that are designed to detect and respond to such security incidents and breaches of privacy and security mandates. Any such access, disclosure or other loss of information could result in legal claims or proceedings, liability under laws that protect the privacy of personal information, such as HIPAA, government enforcement actions and regulatory penalties. Unauthorized access, loss or dissemination could also interrupt our operations, including our ability to bill our customers, provide customer support services, conduct research and development activities, process and prepare company financial information, manage various general and administrative aspects of our business and damage our reputation, any of which could adversely affect our business.
The majority of our operations are currently conducted in locations that may be at risk of damage from fire, earthquakes or other natural disasters.
We currently conduct the majority of our development and management activities in Carlsbad, California near known wildfire areas and earthquake fault zones. We have taken precautions to safeguard our facilities, including obtaining property and casualty insurance, and implementing health and safety protocols. We have developed an information technology disaster recovery plan. However, any future natural disaster, such as a fire or an earthquake, could cause substantial delays in our operations, damage or destroy our equipment or inventory and cause us to incur additional expenses. A disaster could seriously harm our business, financial condition and results of operations. Our facilities would be difficult to replace and would require substantial lead time to repair or replace. The insurance we maintain against earthquakes, fires, and other natural disasters would not be adequate to cover a total loss of our facilities, may not be adequate to cover our losses in any particular case and may not continue to be available to us on acceptable terms, or at all.
25
Alphatec Holdings is a holding company with no operations, and unless it receives dividends or other payments from its subsidiaries, it will be unable to fulfill its cash obligations.
As a holding company with no business operations, Alphatec Holdings’ material assets consist only of the common stock of its subsidiaries, including Alphatec Spine and Scient’x, dividends and other payments received from time to time from its subsidiaries, and the proceeds raised from the sale of debt and equity securities. Alphatec Holdings’ subsidiaries are legally distinct from Alphatec Holdings and have no obligation, contingent or otherwise, to make funds available to Alphatec Holdings. Alphatec Holdings will have to rely upon dividends and other payments from its subsidiaries to generate the funds necessary to fulfill its cash obligations. Alphatec Holdings may not be able to access cash generated by its subsidiaries in order to fulfill cash commitments. The ability of Alphatec Spine to make dividend and other payments to Alphatec Holdings is subject to the availability of funds after taking into account its subsidiaries’ funding requirements, the terms of its subsidiaries’ indebtedness and applicable state laws.
If we fail to properly manage our anticipated growth, our business could suffer.
We will continue to pursue growth in the number of surgeons using our products, the types of products we offer and the geographic regions where our products are sold. Such anticipated growth has placed and will continue to place significant demands on our managerial, operational and financial resources and systems. Future growth would impose significant added responsibilities on members of management, including the need to identify, recruit, maintain, motivate and integrate additional personnel. Also, our management may need to divert a disproportionate amount of its attention away from our day-to-day activities and devote a substantial amount of time to managing these anticipated growth activities. We are currently focused on increasing the size and effectiveness of our sales force and distribution network, marketing activities, research and development efforts, inventory management systems, management team and corporate infrastructure. If we do not manage our anticipated growth effectively, the quality of our products, our relationships with physicians, distributors and hospitals, and our reputation could suffer, which would have a significant adverse effect on our business, financial condition and results of operations. We must attract and retain qualified personnel and third-party distributors and manage and train them effectively. Personnel qualified in the design, development, production and marketing of our products are difficult to find and hire, and enhancements of information technology systems to support our growth are difficult to implement. We will also need to carefully monitor and manage our surgeon services, our third-party manufacturing resources, quality assurance and efficiency, and the quality assurance and efficiency of our suppliers and distributors. This managing, training and monitoring will require allocation of valuable management resources and significant expense. If our management is unable to effectively manage our expected growth, our expenses may increase more than expected, our ability to generate and/or grow revenues could be reduced and we may not be able to implement our business strategy.
Risks Related to Our Financial Results, Credit and Certain Financial Obligations and Need for Financing
We may need to raise additional funds in the future and such funds may not be available on acceptable terms, if at all.
We may seek additional funds from public and private equity or debt financings, borrowings under new debt facilities or other sources to fund our projected operating requirements. Our capital requirements will depend on many factors, including:
|
•
|
the payments due in connection with the settlement of the Orthotec matter;
|
|
•
|
the revenues generated by sales of our products;
|
|
•
|
the costs associated with expanding our sales and marketing efforts;
|
|
•
|
the expenses that we incur from the manufacture of our products by third parties and that we incur from selling our products;
|
|
•
|
the costs of developing new products or technologies;
|
|
•
|
the cost of obtaining and maintaining FDA or other regulatory approval or clearance for our products and products in development;
|
|
•
|
the number and timing of acquisitions and other strategic transactions;
|
|
•
|
the costs and any payments we may make related to our pending litigation matters (in addition to the Orthotec matter);
|
|
•
|
the costs associated with increased capital expenditures; and
|
|
•
|
the costs associated with our employee retention programs and related benefits.
|
As a result of these factors, we may need to raise additional funds and such funds may not be available on favorable terms, if at all. Furthermore, if we issue equity or debt securities to raise additional funds, our existing stockholders
26
may experience dilution and the new equity or debt securities may have rights, preferences and privileges senior to those of our existing stockholders. In addition, if we raise additional funds through collaboration, licensing or other similar arrangements, it may be necessary to relinquish valuable rights to our potential products or proprietary technologies, or to grant licenses on terms that are not favorable to us. If we cannot raise funds on acceptable terms, we may not be able to repay debt or other liabilities, develop or enhance our products, execute our business plan, take advantage of future opportunities, or respond to competitive pressures or unanticipated customer requirements. Any of these events could adversely affect our ability to achieve our development and commercialization goals and have a significant adverse effect on our business, financial condition and results of operations.
For the second, third and fourth quarter of 2015, we determined that we had material weaknesses in our internal control over financial reporting. As a result, current and potential stockholders could lose confidence in our financial reporting which would harm our business and the trading of our stock.
For the quarters ended June 30, 2015, September 30, 2015, and December 31, 2015, we determined that we had material weaknesses in our internal control over financial reporting. Our efforts to comply with Sections 302 and 404 of the Sarbanes-Oxley Act of 2002 and the related regulations regarding our required assessment of our internal control over financial reporting and our independent auditor’s audit of that assessment requires the commitment of significant financial and managerial resources.
The Amended Credit Facility with MidCap includes certain financial debt covenants. Subsequent to filing the Quarterly Reports on Form 10-Q for the interim periods ended June 30, 2015 and September 30, 2015, we discovered that we were not in compliance with the fixed charge coverage ratio covenant under the Amended Credit Facility for June, August, September, November and December of 2015. We obtained a waiver from MidCap to cure the non-compliance for this period. As a result of our failure to comply with the fixed coverage ratio covenant under the Amended Credit Facility, we were also in default under the Facility Agreement with Deerfield for such periods. In 2016, MidCap and Deerfield provided waivers of our failure to comply with the covenant during such periods. As a result of our failure to comply with the fixed charge covenant ratio, we restated the condensed consolidated balance sheet as of June 30, 2015 and September 30, 2015 to classify the amounts due under the Deerfield Facility Agreement as current portion of long-term debt, rather than long-term debt, less current portion. We determined that we failed to design effective controls to assess whether we are in compliance with the debt covenants. As a result, we incorrectly concluded that payments of MidCap term loans were properly excluded from certain covenant calculations. This deficiency resulted in a material weakness, which is defined as a deficiency, or combination of deficiencies, in internal control over financial reporting, such that there is a reasonable possibility that a material misstatement of annual or interim consolidated financial statements will not be prevented or detected on a timely basis. To remediate the material weakness described above, we have designed and implemented new and enhanced controls to ensure that the calculation of the fixed charge coverage ratio reflects an accurate interpretation of the definitions in the underlying debt agreement and that the appropriate level of review is performed. In addition, in our assessment of the effectiveness of internal control over financial reporting at December 31, 2015, we identified a material weakness related to the design of controls over the release of inventory cost through cost of goods sold at a significant wholly owned subsidiary, Alphatec Pacific, Inc. This deficiency resulted in a material weakness in our internal control over financial reporting. To address this material weakness, we are in the process of developing and implementing new processes and procedures to remediate the material weakness and are providing additional training to personnel involved in the costing of inventory at our wholly owned subsidiary.
If we determine in future fiscal periods that we have other material weaknesses in our internal control over financial reporting, the reliability of our financial reports may be impacted or we could be required to restate our financial statements. In addition, our failure to successfully remediate our material weakness described above or any future material weakness could result in adverse consequences to us, including, but not limited to, a loss of investor confidence in the reliability of our financial statements, which could cause the market price of our stock to decline.
If we default on our obligations to make settlement payments to Orthotec LLC, the amounts due under the settlement agreements accelerates and becomes due and payable.
Any default of our payment obligation under the settlement agreements we entered into with Orthotec would give Orthotec the right to declare all of the future payments to be immediately payable. As of
March 14, 2016
, the outstanding amount to be paid to Orthotec through January 2024 is $33.7 million. If either acceleration of payments occurs, our business, financial condition and results of operations could be materially and adversely affected.
There is substantial doubt concerning our ability to continue as a going concern.
Our financial statements have been prepared assuming that we will continue as a going concern, which contemplates the realization of assets and satisfaction of liabilities in the normal course of business. We have incurred significant net losses since
27
inception and have relied on our ability to fund our operations through revenues from the sale of its products, equity financings and debt financings. As we have incurred losses, successful transition to profitability is dependent upon achieving a level of revenues adequate to support our cost structure. This may not occur and, unless and until it does, we will continue to need to raise additional capital. Without modifications to our existing payment obligations or receipt of additional funding, our existing cash and other sources of liquidity may only be sufficient to fund our operations until our Amended Credit Facility with MidCap matures in December 2016, assuming that our creditors continue to waive any breaches under our credit facilities and our debt is not sooner accelerated. These circumstances raise substantial doubt about our ability to continue as a going concern. As a result of this uncertainty and the substantial doubt about our ability to continue as a going concern as of December 31, 2015, the Report of Independent Registered Public Accounting Firm included immediately prior to the consolidated financial statements included elsewhere in this Annual Report on Form 10-K includes a going concern explanatory paragraph. We may seek additional funds from public and private equity or debt financings, borrowings under new debt facilities or other sources to fund our projected operating requirements. However, there is no guarantee that we will be able to obtain further financing, or do so on reasonable terms. If we are unable to raise additional funds on a timely basis, or at all, we would be materially adversely affected. Our financial statements do not include any adjustment relating to the recoverability and classification of recorded asset amounts or the amounts and classification of liabilities that might be necessary should we be unable to continue as a going concern.
We may be unable to comply with the covenants of our credit facilities.
We must comply with certain affirmative and negative covenants, including financial covenants, in our credit facility with MidCap and affirmative and negative covenants in our Facility Agreement with Deerfield. We failed to comply with the fixed coverage ratio covenant under our credit facility with MidCap in June, August, September, October, November and December of 2015 and January 2016, but MidCap and Deerfield have provided waivers of our failure to comply with the covenant during such periods. Even though we obtained waivers from MidCap and Deerfield for the periods above, there can be no assurance that at all times in the future we will satisfy all such financial or other covenants of the MidCap credit facility or the Deerfield Facility Agreement, or obtain any required waiver or amendment, in which event of default the lenders party to the MidCap credit facility could refuse to make further extensions of credit to us and MidCap and/or Deerfield could require all amounts borrowed under the MidCap credit facility and/or the Facility Agreement, respectively, together with accrued interest and other fees, to be immediately due and payable. In addition to allowing the lenders to accelerate the loan, several events of default under the MidCap credit facility, such as our failure to make required payments of principal and interest and the occurrence of certain bankruptcy or insolvency events, could require us to pay interest at a rate which is up to five percentage points higher than the interest rate effective immediately before the event of default.
An event of default under the MidCap credit facility or the Deerfield Facility Agreement could have a material adverse effect on us. Upon an event of default, if the lenders under the MidCap credit facility accelerate the repayment of all amounts borrowed, together with accrued interest and other fees, or if the lenders elect to charge us additional interest, we cannot assure you that we will have sufficient cash available to repay the amounts due, and we may be forced to seek to amend the terms of the MidCap credit facility or the Deerfield Facility Agreement or obtain alternative financing, which may not be available to us on acceptable terms, if at all.
In addition, if we fail to pay amounts when due under the MidCap credit facility or the Deerfield Facility Agreement or upon the occurrence of another event of default, the lenders under the MidCap credit facility or the Deerfield Facility Agreement could proceed against the collateral granted to them pursuant to the MidCap credit facility and the Deerfield Facility Agreement. We have granted to the lenders under the MidCap credit facility a first priority security interest in substantially all of our assets, including all accounts receivable and all securities evidencing our interests in our subsidiaries, as collateral under the MidCap credit facility. If the lenders proceed against the collateral, such assets would no longer be available for use in our business, which would have a significant adverse effect our business, financial condition and results of operations.
Our quarterly financial results could fluctuate significantly.
Our quarterly financial results are difficult to predict and may fluctuate significantly from period to period, particularly because our sales prospects are uncertain. The level of our revenues and results of operations at any given time will be based primarily on the following factors:
|
•
|
acceptance of our products by surgeons, patients, hospitals and third-party payors;
|
|
•
|
demand and pricing of our products;
|
|
•
|
the mix of our products sold, because profit margins differ among our products;
|
|
•
|
timing of new product offerings, acquisitions, licenses or other significant events by us or our competitors;
|
28
|
•
|
our ability to grow and maintain a productive sales and marketing organization;
|
|
•
|
regulatory approvals and legislative changes affecting the products we may offer or those of our competitors;
|
|
•
|
the effect of competing technological and market developments;
|
|
•
|
levels of third-party reimbursement for our products;
|
|
•
|
interruption in the manufacturing or distribution of our products;
|
|
•
|
our ability to produce or obtain products of satisfactory quality or in sufficient quantities to meet demand; and
|
|
•
|
changes in our ability to obtain FDA, state and international approval or clearance for our products.
|
In addition, until we have a larger base of surgeons using our products, occasional fluctuations in the use of our products by individual surgeons or small groups of surgeons will have a proportionately larger impact on our revenues than for companies with a larger customer base.
Many of the products we may seek to develop and introduce in the future will require FDA, state and international approval or clearance. We cannot begin to commercialize any such products in the U.S. without FDA approval or clearance or outside of the U.S. without appropriate regulatory approvals and import licenses. As a result, it will be difficult for us to forecast demand for these products with any degree of certainty. We cannot assure you that our revenue will increase or be sustained in future periods or that we will be profitable in any future period. Any shortfalls in revenue or earnings from levels expected by our stockholders or by securities or industry analysts could have an immediate and significant adverse effect on the trading price of our common stock in any given period.
We have recognized significant goodwill impairment charges.
We account for goodwill in accordance with guidance that requires that goodwill be tested for impairment at least annually. We test goodwill for impairment in December of each year, or more frequently if events and circumstances warrant. These assets are impaired if we determine that their carrying values may not be recoverable based on an assessment of certain events or changes in circumstances. If the assets are considered to be impaired, we recognize the amount by which the carrying value of the assets exceeds the fair value of the assets as an impairment loss. In the third quarter of 2015, the market value of our common stock substantially declined. As a result of this decline, we determined that we had an indicator of impairment of our goodwill, and an interim test of goodwill impairment was required. As a result, we reviewed our goodwill for impairment under a two-step test in accordance with the relevant guidance. Based upon this two-step test, we determined that our goodwill was impaired, which required us to write off the entire balance of our goodwill. In the third quarter of 2015, we recorded a charge of $164.3 million representing the write-off of the balance of our goodwill. For additional information related to this charge, see the "Goodwill and Other Intangible Assets" subsection of Note 2 to the consolidated financial statements included in this report.
Risks Related to Our Intellectual Property Regulatory Penalties and Potential Litigation
If our patents and other intellectual property rights do not adequately protect our products, we may lose market share to our competitors and be unable to operate our business profitably.
Our success depends significantly on our ability to protect our proprietary rights of the technologies used in our products. We rely on patent protection, as well as a combination of copyright, trade secret and trademark laws, and nondisclosure, confidentiality and other contractual restrictions to protect our proprietary technology. However, these legal means afford only limited protection and may not adequately protect our rights or permit us to gain or keep any competitive advantage. For example, we cannot assure you that any of our pending patent applications will result in the issuance of patents to us. The U.S. Patent and Trademark Office, or PTO, may deny or require significant narrowing of claims in our pending patent applications, and patents issued as a result of the pending patent applications, if any, may not provide us with significant commercial protection or be issued in a form that is advantageous to us. We could also incur substantial costs in proceedings before the PTO. These proceedings could result in adverse decisions as to the priority of our inventions and the narrowing or invalidation of claims in issued patents. Our issued patents and those that may be issued in the future could subsequently be successfully challenged by others and invalidated or rendered unenforceable, which could limit our ability to stop competitors from marketing and selling related products. In addition, our pending patent applications include claims to aspects of our products and procedures that are not currently protected by issued patents.
Both the patent application process and the process of managing patent disputes can be time consuming and expensive. Competitors may be able to design around our patents or develop products that provide outcomes that are comparable to our products but fall outside of the scope of our patent protection. Although we have entered into confidentiality agreements and
29
intellectual property assignment agreements with certain of our employees, consultants and advisors as one of the ways we seek to protect our intellectual property and other proprietary technology, such agreements may not be enforceable or may not provide meaningful protection for our trade secrets or other proprietary information in the event of unauthorized use or disclosure or other breaches of the agreements. Furthermore, the laws of some foreign countries may not protect our intellectual property rights to the same extent as the laws of the U.S., if at all. Since most of our issued patents and pending patent applications are for the U.S. only, we lack a corresponding scope of patent protection in other countries, including Japan. Thus, we may not be able to stop a competitor from marketing products in other countries that are similar to some of our products.
In the event a competitor infringes upon one of our patents or other intellectual property rights, enforcing those patents and rights may be difficult and time consuming. Even if successful, litigation to defend our patents against challenges or to enforce our intellectual property rights could be expensive and time consuming and could divert management’s attention from managing our business. Moreover, we may not have sufficient resources to defend our patents against challenges or to enforce our intellectual property rights.
The medical device industry is characterized by patent and other intellectual property litigation and we could become subject to litigation that could be costly, result in the diversion of management’s time and efforts, require us to pay damages, and/or prevent us from marketing our existing or future products.
The medical device industry is characterized by extensive litigation and administrative proceedings over patent and other intellectual property rights. Determining whether a product infringes a patent involves complex legal and factual issues, the determination of which is often uncertain. Our competitors may assert that our products, the components of those products, the methods of using those products, or the methods we employ in manufacturing or processing those products are covered by U.S. or foreign patents held by them. In addition, they may claim that their patents have priority over ours because their patents were filed first. Because patent applications can take many years to issue, there may be applications now pending of which we are unaware, which may later result in issued patents that our products may infringe. There could also be existing patents that one or more components of our products may be inadvertently infringing, of which we are unaware. As the number of participants in the market for spine disorder devices and treatments increases, the possibility of patent infringement claims against us also increases.
Any such claim against us, even those without merit, may cause us to incur substantial costs, and could place a significant strain on our financial resources, divert the attention of management from our core business and harm our reputation. If the relevant patents are upheld as valid and enforceable and we are found to infringe, we could be required to pay substantial damages, including treble, or triple, damages if an infringement is found to be willful, and/or royalties and we could be prevented from selling our products unless we could obtain a license or were able to redesign our products to avoid infringement. Any such license may not be available on reasonable terms, if at all, and there can be no assurance that we would be able to redesign our products in a way that would not infringe those patents, and any such redesign, if possible, may be costly. If we fail to obtain any required licenses or make any necessary changes to our products or technologies, we may have to withdraw existing products from the market or may be unable to commercialize one or more of our products, either of which could have a significant adverse effect on our business, financial condition and results of operations.
In addition, in order to further our product development efforts, from time to time we enter into agreements with surgeons to develop new products. As consideration for product development activities rendered pursuant to these agreements, in certain instances we have agreed to pay such surgeons royalties on products developed by cooperative involvement between us and such surgeons. There can be no assurance that surgeons with whom we have entered into such an arrangement will not claim to be entitled to a royalty even if we do not believe that such products were developed by cooperative involvement between us and such surgeons. Any such claim against us, even those without merit, may cause us to incur substantial costs, and could place a significant strain on our financial resources, divert the attention of management from our core business and harm our reputation.
If we become subject to product liability claims, we may be required to pay damages that exceed our insurance coverage.
Our business exposes us to potential product liability claims that are inherent in the testing, design, manufacture and sale of medical devices for spine surgery procedures. Spine surgery involves significant risk of serious complications, including bleeding, nerve injury, paralysis and even death. To date, our products have not been the subject of any material product liability claims. Currently, we carry product liability insurance in the amount of $20 million per occurrence and $20 million in the aggregate. Our existing product liability insurance coverage may be inadequate to satisfy liabilities we might incur. Any product liability claim brought against us, with or without merit, could result in the increase of our product liability insurance rates or our inability to secure coverage in the future on commercially reasonable terms, if at all. In addition, if our product liability insurance proves to be inadequate to pay a damage award, we may have to pay the excess out of our cash reserves, which could harm our financial condition. If longer-term patient results and experience indicate that our products or any component of our products cause tissue damage, motor impairment or other adverse effects, we could be subject to significant
30
liability. Even a meritless or unsuccessful product liability claim could harm our reputation in the industry, lead to significant legal fees and result in the diversion of management’s attention from managing our business. If a product liability claim or series of claims is brought against us in excess of our insurance coverage limits, our business could suffer and our financial condition, results of operations and cash flow could be materially adversely impacted.
Because biologics products entail a potential risk of communicable disease to human recipients, we may be the subject of product liability claims regarding our biologics products.
Our biologics products may expose us to additional potential product liability claims. The development of biologics products entails a risk of additional product liability claims because of the risk of transmitting disease to human recipients, and substantial product liability claims may be asserted against us. In addition, successful product liability claims made against one of our competitors could cause claims to be made against us or expose us to a perception that we are vulnerable to similar claims. Even a meritless or unsuccessful product liability claim could harm our reputation in the industry, lead to significant legal fees and result in the diversion of management’s attention from managing our business.
Any claims relating to our improper handling, storage or disposal of biological, hazardous and radioactive materials could be time consuming and costly.
The manufacture of certain of our products, including our biologics products, involves the controlled use of biological, hazardous and/or radioactive materials and waste. Our business and facilities and those of our suppliers are subject to foreign, federal, state and local laws and regulations governing the use, manufacture, storage, handling and disposal of these hazardous materials and waste products. Although we believe that our safety procedures for handling and disposing of these materials comply with legally prescribed standards, we cannot completely eliminate the risk of accidental contamination or injury from these materials. In the event of an accident, we could be held liable for damages or penalized with fines. This liability could exceed our resources and any applicable insurance. In addition, under some environmental laws and regulations, we could also be held responsible for all of the costs relating to any contamination at our past or present facilities and at third-party waste disposal sites, even if such contamination was not caused by us. We may incur significant expenses in the future relating to any failure to comply with environmental laws. Any such future expenses or liability could have a significant negative impact on our business, financial condition and results of operations.
We may be subject to damages resulting from claims that we, our employees or our independent distributors have wrongfully used or disclosed alleged trade secrets of our competitors or are in breach of non-competition or non-solicitation agreements with our competitors.
Many of our employees were previously employed at other medical device companies, including our competitors or potential competitors. Many of our independent distributors sell, or in the past have sold, products of our competitors. We may be subject to claims that we, our employees or our independent distributors have inadvertently or otherwise used or disclosed the trade secrets or other proprietary information of our competitors. In addition, we have been and may in the future be subject to claims that we caused an employee or independent distributor to break the terms of his or her non-competition agreement or non-solicitation agreement. Litigation may be necessary to defend against such claims. Even if we are successful in defending against such claims, litigation could result in substantial costs and be a distraction to management. If we fail in defending such claims, in addition to paying monetary damages, we may lose valuable intellectual property rights and/or personnel. A loss of key personnel and/or their work product could hamper or prevent our ability to commercialize products, which could have an adverse effect on our business, financial condition and results of operations.
Risks Related to Our Common Stock
If we fail to continue to meet all applicable NASDAQ Global Select Market requirements and our common stock is delisted, the delisting could adversely affect the market liquidity of our common stock, impair the value of your investment and harm our business.
Our common stock is currently listed on the NASDAQ Global Select Market. In order to maintain that listing, we must satisfy minimum financial and other requirements. On September 17, 2015, we received written notice from the Listing Qualifications Department of the NASDAQ Stock Market LLC, or NASDAQ, notifying us that for the preceding 30 consecutive business days, our common stock did not maintain a minimum closing bid price of $1.00 per share as required for continued inclusion on The NASDAQ Global Select Market under NASDAQ Listing Rule 5450(a)(1). The notification letter states that pursuant to NASDAQ Listing Rule 5810(c)(3)(A), we will be afforded 180 calendar days, or until March 15, 2016, to regain compliance with the minimum bid price requirement. In order to regain compliance, shares of our common stock must maintain a minimum closing bid price of at least $1.00 per share for a minimum of 10 consecutive business days during such
31
180-day period. If we do not regain compliance by March 15, 2016, NASDAQ will provide written notification to us that our common stock will be delisted. At that time, we may appeal NASDAQ’s delisting determination to a NASDAQ Listing Qualifications Panel and, if successful, our common stock would remain listed on the NASDAQ Global Select Market. Alternatively, we may be eligible to transfer to The NASDAQ Capital Market in order to receive an additional 180 day grace period if we satisfy all of the requirements, other than the minimum bid price requirement, for listing on The NASDAQ Capital Market.
While we intend to engage in efforts to regain compliance, and thus maintain our listing, there can be no assurance that we will be able to regain compliance during the applicable time periods set forth above. In particular, we have not been able to maintain a minimum closing bid price of at least $1.00 per share for a minimum of 10 consecutive business days prior to the March 15, 2016 compliance deadline. If we fail to continue to meet all applicable NASDAQ Global Select Market requirements in the future and NASDAQ determines to delist our common stock, the delisting could substantially decrease trading in our common stock and adversely affect the market liquidity of our common stock; adversely affect our ability to obtain financing on acceptable terms, if at all, to continue our operations; and may result in the potential loss of confidence by investors, suppliers, customers and employees and fewer business development opportunities. Additionally, the market price of our common stock may decline further and stockholders may lose some or all of their investment. The closing bid price of our common stock on the NASDAQ Global Select Market was $0.29 per share on
March 14, 2016
.
We expect that the price of our common stock will fluctuate substantially and the market price of our common stock may decline in value in the future.
The market price of our common stock is likely to be highly volatile and may fluctuate substantially due to many factors, including:
|
•
|
volume and timing of orders for our products;
|
|
•
|
quarterly variations in our or our competitors’ results of operations;
|
|
•
|
our announcement or our competitors’ announcements regarding new products, product enhancements, significant contracts, number of distributors, number of hospitals and surgeons using products, acquisitions, and collaborative or strategic investments;
|
|
•
|
announcements of technological or medical innovations for the treatment of spine pathology;
|
|
•
|
changes in earnings estimates or recommendations by securities analysts;
|
|
•
|
our ability to develop, obtain regulatory clearance or approval for, and market new and enhanced products on a timely basis;
|
|
•
|
changes in healthcare policy in the U.S. and internationally;
|
|
•
|
product liability claims or other litigation involving us;
|
|
•
|
sales of large blocks of our common stock, including sales by our executive officers, directors and significant stockholders;
|
|
•
|
changes in governmental regulations or in the status of our regulatory approvals, clearances or applications;
|
|
•
|
disputes or other developments with respect to intellectual property rights;
|
|
•
|
changes in the availability of third-party reimbursement in the U.S. or other countries;
|
|
•
|
changes in accounting principles; and
|
|
•
|
general market conditions and other factors, including factors unrelated to our operating performance or the operating performance of our competitors.
|
We may become involved in securities class action litigation that could divert management’s attention and harm our business.
The stock market in general, The NASDAQ Global Select Market and the market for medical device companies in particular, has experienced extreme price and volume fluctuations that have often been unrelated or disproportionate to the operating performance of those companies. Further, the market prices of securities of medical device companies have been particularly volatile. In the past, following periods of volatility in the market price of a particular company’s securities, securities class action litigation has often been brought against that company. We may become involved in this type of litigation in the future. Litigation is often expensive and diverts management’s attention and resources, which could materially harm our financial condition, results of operations and business.
32
Securities analysts may not continue to provide coverage of our common stock or may issue negative reports, which may have a negative impact on the market price of our common stock.
Securities analysts may not continue to provide research coverage of our common stock. If securities analysts do not cover our common stock, the lack of research coverage may cause the market price of our common stock to decline. The trading market for our common stock may be affected in part by the research and reports that industry or financial analysts publish about our business. If one or more of the analysts who elects to cover us downgrades our stock, our stock price would likely decline rapidly. If one or more of these analysts ceases coverage of us, we could lose visibility in the market, which in turn could cause our stock price to decline. In addition, rules mandated by the Sarbanes-Oxley Act and a global settlement reached in 2003 between the SEC, other regulatory agencies and a number of investment banks have led to a number of fundamental changes in how analysts are reviewed and compensated. In particular, many investment banking firms are required to contract with independent financial analysts for their stock research. It may be difficult for companies such as ours, with smaller market capitalizations, to attract independent financial analysts that will cover our common stock. This could have a negative effect on the market price of our stock.
Because of their significant stock ownership, our executive officers, directors and principal stockholders will be able to exert control over us and our significant corporate decisions.
Based on shares outstanding at
March 14, 2016
, our executive officers, directors and stockholders holding more than 5% of our outstanding common stock and their affiliates, in the aggregate, beneficially own approximately 33% of our outstanding common stock. As a result, these persons will have the ability to impact significantly the outcome of all matters requiring stockholder approval, including the election and removal of directors and any merger, consolidation, or sale of all or substantially all of our assets.
This concentration of ownership may harm the market price of our common stock by, among other things:
|
•
|
delaying, deferring or preventing our change in control;
|
|
•
|
impeding a merger, consolidation, takeover or other business combination involving us;
|
|
•
|
causing us to enter into transactions or agreements that are not in the best interests of all of our stockholders; or
|
|
•
|
reducing our public float held by non-affiliates.
|
Certain members of our Board of Directors also serve as officers and directors of HealthpointCapital, its affiliates and other portfolio companies.
Three members of our Board of Directors also serve as officers and directors of our largest stockholder, HealthpointCapital, or its related entities and of other companies in which HealthpointCapital invests, including companies with which we compete or may in the future compete. As of
March 14, 2016
, HealthpointCapital owned approximately 31% of our outstanding common stock. The Chairman of our Executive Committee of our Board of Directors, Mortimer Berkowitz III, is a managing member of HGP, LLC and HGP II, LLC, the general partners of HealthpointCapital Partners, LP and HealthpointCapital Partners II, LP, respectively. Our directors R. Ian Molson and Stephen E. O’Neil also serve on the board of managers of HealthpointCapital, LLC. In addition, John H. Foster, who is a managing member of HGP, LLC and HGP II, LLC and the Chairman, Co-Chief Executive Officer, a member of the Board of Managers and a Managing Director of HealthpointCapital, LLC, was a member of our Board of Directors until March 2, 2016. Each of Messrs. Berkowitz, O’Neil and Molson, also have financial interests in HealthpointCapital investment funds.
Because of these possible conflicts of interest, such directors may direct potential business and investment opportunities to other entities rather than to us or such directors may undertake or otherwise engage in activities or conduct on behalf of such other entities that is not in, or which may be adverse to, our best interests. Whether a director directs an opportunity to us or to another company, our directors may face claims of breaches of fiduciary duty and other duties relating to such opportunities. Our amended and restated certificate of incorporation requires us to indemnify our directors to the fullest extent permitted by law, which may require us to indemnify them against claims of breaches of such duties arising from their service on our Board of Directors. HealthpointCapital or its affiliates may pursue acquisition opportunities that may be complementary to our business and, as a result, those acquisition opportunities may not be available to us. Furthermore, HealthpointCapital may have an interest in us pursuing acquisitions, divestitures, financings or other transactions that, in its judgment, could enhance its equity investment, even though such transactions might involve risks to us and our stockholders generally. In addition, if we were to seek a business combination with a target business with which one or more of our existing stockholders or directors may be affiliated, conflicts of interest could arise in connection with negotiating the terms of and completing the business combination. Conflicts that may arise may not be resolved in our favor.
33
Anti-takeover provisions in our organizational documents and change of control provisions in some of our employment agreements and agreements with distributors, and in some of our outstanding debt agreements, as well as the terms of our redeemable preferred stock, may discourage or prevent a change of control, even if an acquisition would be beneficial to our stockholders, which could affect our stock price adversely.
Certain provisions of our amended and restated certificate of incorporation and restated by-laws could discourage, delay or prevent a merger, acquisition or other change in control that stockholders may consider favorable, including transactions in which our stockholders might otherwise receive a premium for their shares. These provisions also could limit the price that investors might be willing to pay in the future for shares of our common stock, thereby depressing the market price of our common stock. Stockholders who wish to participate in these transactions may not have the opportunity to do so. Furthermore, these provisions could prevent or frustrate attempts by our stockholders to replace or remove our management. These provisions:
|
•
|
allow the authorized number of directors to be changed only by resolution of our Board of Directors;
|
|
•
|
allow vacancies on our Board of Directors to be filled only by resolution of our Board of Directors;
|
|
•
|
authorize our Board of Directors to issue, without stockholder approval, blank check preferred stock that, if issued, could operate as a “poison pill” to dilute the stock ownership of a potential hostile acquirer to prevent an acquisition that is not approved by our Board of Directors;
|
|
•
|
require that stockholder actions must be effected at a duly called stockholder meeting and prohibit stockholder action by written consent;
|
|
•
|
establish advance notice requirements for stockholder nominations to our Board of Directors and for stockholder proposals that can be acted on at stockholder meetings; and
|
|
•
|
limit who may call stockholder meetings.
|
Some of our employment agreements and all of our restricted stock agreements, incentive stock option agreements, performance-based stock units and restricted common stock provide for accelerated vesting of benefits, including full vesting of restricted stock and options, upon a change of control. A limited number of our agreements with our distributors include a provision that extends the term of the distribution agreement upon a change in control and makes it more difficult for us or our successor to terminate the agreement. These provisions may discourage or prevent a change of control.
In addition, in the event of a change of control, we would be required to redeem all outstanding shares of our redeemable preferred stock for an aggregate of $29.9 million, at the price of $9.00 per share. Further, our amended and restated certificate of incorporation permits us to issue additional shares of preferred stock. The terms of our redeemable preferred stock or any new preferred stock we may issue could have the effect of delaying, deterring or preventing a change in control.
SPECIAL NOTE REGARDING FORWARD-LOOKING STATEMENTS
This Annual Report on Form 10-K and, in particular, the description of our "Business" set forth in Item 1, the "Risk Factors" set forth in this Item 1A and our "Management’s Discussion and Analysis of Financial Condition and Results of Operations" set forth in Item 7 contain or incorporate a number of forward-looking statements within the meaning of Section 27A of the Securities Act of 1933, as amended, or the Securities Act, and Section 21E of the Securities Exchange Act of 1934, as amended, or the exchange Act, including statements regarding:
|
•
|
our estimates regarding anticipated operating losses, future revenue, expenses, capital requirements, uses and sources of cash and liquidity, including our anticipated revenue growth and cost savings;
|
|
•
|
our ability to meet the financial covenants under our credit facilities, to obtain waivers from our lenders with respect to any noncompliance with our financial covenants, and to refinance our existing debt prior to the maturity of our credit facilities with our current or new lenders;
|
|
•
|
our ability to regain and maintain compliance with the continued listing requirements of The NASDAQ Global Select Market
|
|
•
|
our ability to ensure that we have effective disclosure controls and procedures and to remedy our material weakness in our internal control over financial reporting;
|
|
•
|
our ability to meet and potential liability from not meeting the payment obligations under the Orthotec settlement agreement;
|
34
|
•
|
our ability to regain and maintain compliance with the quality requirements of the FDA and similar regulatory authorities outside of the U.S., including our ability to resolve the deficiencies cited in the Warning Letter that we received from the FDA in July 2015 following the FDA's inspection of our manufacturing facilities;
|
|
•
|
our ability to market, improve, grow, commercialize and achieve market acceptance of any of our products or any product candidates that we are developing or may develop in the future;
|
|
•
|
our beliefs about the features, strengths and benefits of our products;
|
|
•
|
our ability to continue to enhance our product offerings, outsource our manufacturing operations and expand the commercialization of our products, and the effect of our strategy;
|
|
•
|
our expectations about the timing, costs and benefits of the restructuring and outsourcing of our manufacturing operations;
|
|
•
|
our beliefs about the ability of our supplier relationships and quality processes to fulfill our production requirements;
|
|
•
|
our ability to successfully integrate, and realize benefits from licenses and acquisitions;
|
|
•
|
our ability to successfully achieve and maintain regulatory clearance or approval for our products in applicable jurisdictions and in a timely manner;
|
|
•
|
the effect of any existing or future federal, state or international regulations on our ability to effectively conduct our business;
|
|
•
|
our estimates of market sizes and anticipated uses of our products;
|
|
•
|
our business strategy and our underlying assumptions about market data, demographic trends, reimbursement trends and pricing trends;
|
|
•
|
our ability to achieve profitability, and the potential need to raise additional funding;
|
|
•
|
our ability to maintain an adequate sales network for our products, including to attract and retain independent distributors;
|
|
•
|
our ability to enhance our U.S. and international sales and distributions networks and product penetration;
|
|
•
|
our ability to increase the use and promotion of our products by training and educating surgeons and our sales network;
|
|
•
|
our ability to attract and retain a qualified management team, as well as other qualified personnel and advisors;
|
|
•
|
our ability to enter into licensing and business combination agreements with third parties and to successfully integrate the acquired technology and/or businesses;
|
|
•
|
our management team’s ability to accommodate growth and manage a larger organization;
|
|
•
|
our ability to protect our intellectual property, and to not infringe upon the intellectual property of third parties;
|
|
•
|
the effects of the escalating cost of medical products and services and the effects of market demand, government regulation, third-party reimbursement policies and societal pressures on the worldwide healthcare industry and our business;
|
|
•
|
our ability to meet or exceed the industry standard in clinical and legal compliance and corporate governance programs;
|
|
•
|
our beliefs about our competitors and the principal competitive factors in our market and the effect of non-operative treatments on demand for our products;
|
|
•
|
potential liability resulting from litigation;
|
|
•
|
our beliefs about our employee relations;
|
|
•
|
potential liability resulting from a governmental review of our business practices;
|
|
•
|
our beliefs about the usefulness of the non-GAAP financial measures included in this Annual Report on Form 10-K;
|
|
•
|
our beliefs with respect to our critical accounting policies and the reasonableness of our estimates and assumptions; and
|
|
•
|
other factors discussed elsewhere in this Annual Report on Form 10-K or any document incorporated by reference herein or therein.
|
Any or all of our forward-looking statements in this Annual Report may turn out to be wrong. They can be affected by inaccurate assumptions by known or unknown risks and uncertainties. Many factors mentioned in our discussion in this Annual Report on Form 10-K will be important in determining future results. Consequently, no forward-looking statement can be guaranteed. Actual future results may vary materially from expected results.
35
We also provide a cautionary discussion of risks and uncertainties under “Risk Factors” in Item 1A of this Annual Report. These are factors that we think could cause our actual results to differ materially from expected results. Other factors besides those listed there could also adversely affect us.
Without limiting the foregoing, the words “believe,” “anticipate,” “plan,” “expect,” “may,” “could,” “would,” “seek,” “intend,” and similar expressions are intended to identify forward-looking statements. There are a number of factors and uncertainties that could cause actual events or results to differ materially from those indicated by such forward-looking statements, many of which are beyond our control, including the factors set forth under “Item 1A Risk Factors.” In addition, the forward-looking statements contained herein represent our estimate only as of the date of this filing and should not be relied upon as representing our estimate as of any subsequent date. While we may elect to update these forward-looking statements at some point in the future, we specifically disclaim any obligation to do so to reflect actual results, changes in assumptions or changes in other factors affecting such forward-looking statements.
|
Item 1B.
|
Unresolved Staff Comments
|
None.
|
Item 2.
|
Properties
|
Our corporate office and former manufacturing facilities are located in Carlsbad, California. The table below provides selected information regarding our current material operating leased locations.
|
Location
|
Use
|
Approximate Square
Footage
|
Lease Expiration
|
||||
|
Carlsbad, California
|
Corporate headquarters and product design
|
76,693
|
|
July 2021
|
|||
|
Carlsbad, California
|
Product design and distribution
|
73,480
|
|
January 2017
|
|||
|
Item 3.
|
Legal Proceedings
|
The Company is and may become involved in various legal proceedings arising from its business activities. While management is not aware of any litigation matter that in and of itself would have a material adverse impact, the Company believes the ultimate disposition of the above matter that have a material adverse impact on the Company’s consolidated results of operations, cash flows or financial position, litigation is inherently unpredictable, and depending on the nature and timing of a proceeding, an unfavorable resolution could materially affect the Company’s future consolidated results of operations, cash flows or financial position in a particular period. The Company assesses contingencies to determine the degree of probability and range of possible loss for potential accrual or disclosure in our consolidated financial statements. An estimated loss contingency is accrued in the Company’s consolidated financial statements if it is probable that a liability has been incurred and the amount of the loss can be reasonably estimated. Because litigation is inherently unpredictable and unfavorable resolutions could occur, assessing contingencies is highly subjective and requires judgments about future events. When evaluating contingencies, the Company may be unable to provide a meaningful estimate due to a number of factors, including the procedural status of the matter in question, the presence of complex or novel legal theories, and/or the ongoing discovery and development of information important to the matters. In addition, damage amounts claimed in litigation against us may be unsupported, exaggerated or unrelated to reasonably possible outcomes, and as such are not meaningful indicators of the Company’s potential liability.
|
Item 4.
|
Mine Safety Disclosures
|
Not applicable.
36
|
Item 5.
|
Market for Registrant’s Common Equity, Related Stockholder Matters and Issuer Purchases of Equity Securities
|
Market Information
Our common stock is traded on The NASDAQ Global Select Market under the symbol “ATEC.” The following table sets forth the high and low sales prices for our common stock as reported on The NASDAQ Global Select Market for the periods indicated.
|
Year Ended December 31, 2015
|
High
|
Low
|
||||||
|
First quarter
|
$
|
1.54
|
|
$
|
1.28
|
|
||
|
Second quarter
|
1.48
|
|
1.28
|
|
||||
|
Third quarter
|
1.43
|
|
0.32
|
|
||||
|
Fourth quarter
|
0.45
|
|
0.18
|
|
||||
|
Year Ended December 31, 2014
|
High
|
Low
|
||||||
|
First quarter
|
$
|
2.53
|
|
$
|
1.16
|
|
||
|
Second quarter
|
1.70
|
|
1.20
|
|
||||
|
Third quarter
|
1.92
|
|
1.32
|
|
||||
|
Fourth quarter
|
1.70
|
|
1.23
|
|
||||
Stockholders
As of
March 14, 2016
, there were approximately 360 holders of record of an aggregate
102,150,232
outstanding shares of our common stock.
Dividend Policy
We have never declared or paid cash dividends on our capital stock. We currently intend to retain all available funds and any future earnings for use in the operation and expansion of our business and do not anticipate paying any cash dividends in the foreseeable future.
Sales of Unregistered Securities
In October 2013, we entered into a three-year collaboration agreement with a third party to provide consultation services to assist us in the development of our products and products in development. Under the terms of the collaboration agreement, we will gain exclusive rights to the use of all intellectual property developed by the collaborators. We will make three annual payments to the collaborator as sole consideration for services provided, totaling an aggregate of up to $8 million, paid in our common stock at a per share price of $1.95, which was equal to the average NASDAQ closing price of the common stock on the five days leading up to and including the date of signing the collaboration agreement. The actual number of shares issued each year will be determined by the fair market value of the services provided over the prior 12 months. On October 30, 2013, November 10, 2014, December 24, 2014, October 9, 2015 and December 31, 2015 we issued 128,571, 1,059,792, 267,672, 883,152 and 441,600, respectively, unregistered shares of our common stock under this agreement.
The shares were issued in reliance upon an exemption from registration under federal securities laws provided by Section 4(2) of the Securities Act, for the issuance and exchange of securities in transactions by an issuer not involving a public offering. We do not have an obligation, nor does it anticipate, registering the issued shares for resale on a registration statement pursuant to the Securities Act.
37
Issuer Purchases of Equity Securities
Under the terms of our Amended and Restated 2005 Employee, Director and Consultant Stock Plan, as amended, or the Stock Plan, and prior to the expiration of the Stock Plan in April 2016, we were permitted to award shares of restricted stock to our employees, directors and consultants. These shares of restricted stock are subject to a lapsing right of repurchase by us. We may exercise this right of repurchase in the event that a restricted stock recipient’s employment, directorship or consulting relationship with us terminates prior to the end of the vesting period. If we exercise this right, we are required to repay the purchase price paid by or on behalf of the recipient for the repurchased restricted shares. Repurchased shares are returned to the Stock Plan and are available for future awards under the terms of the Stock Plan. There were no shares of common stock repurchased during the quarter ended
December 31, 2015
.
38
|
Item 6.
|
Selected Financial Data
|
The following table sets forth consolidated financial data with respect to the Company for each of the five years in the period ended
December 31, 2015
. The selected consolidated financial data set forth below have been derived from our audited consolidated financial statements, and may not be indicative of future operating results. The results of operations for the year ended December 31, 2015 include a goodwill and intangible assets impairment charge of
$165.2 million
. The results of operations for the year ended December 31, 2013 include litigation settlement expenses of $46.0 million and restructuring expenses of $9.7 million. The selected consolidated financial data set forth below should be read in conjunction with our audited consolidated financial statements and related notes thereto found at “Item 8 Financial Statements and Supplementary Data” and “Item 7 Management’s Discussion and Analysis of Financial Condition and Results of Operations” included elsewhere in this Annual Report on Form 10-K.
|
|
Year Ended December 31,
|
|||||||||||||||||||
|
|
2015
|
2014
|
2013
|
2012
|
2011
|
|||||||||||||||
|
|
(in thousands, except per share amounts)
|
|||||||||||||||||||
|
|
||||||||||||||||||||
|
Revenues
|
$
|
185,279
|
|
$
|
206,980
|
|
$
|
204,724
|
|
$
|
196,278
|
|
$
|
197,711
|
|
|||||
|
Operating (loss) income
|
(172,439
|
)
|
1,844
|
|
(73,433
|
)
|
(9,837
|
)
|
(24,516
|
)
|
||||||||||
|
Net loss
|
$
|
(178,676
|
)
|
$
|
(12,882
|
)
|
$
|
(82,227
|
)
|
$
|
(15,459
|
)
|
$
|
(22,181
|
)
|
|||||
|
Net loss per basic share
|
$
|
(1.79
|
)
|
$
|
(0.13
|
)
|
$
|
(0.85
|
)
|
$
|
(0.17
|
)
|
$
|
(0.25
|
)
|
|||||
|
Net loss per diluted share
|
$
|
(1.79
|
)
|
$
|
(0.16
|
)
|
$
|
(0.85
|
)
|
$
|
(0.17
|
)
|
$
|
(0.25
|
)
|
|||||
|
Weighted-average shares used in computing net loss per share:
|
||||||||||||||||||||
|
Shares used in calculating basic net loss per share
|
99,574
|
|
97,347
|
|
96,235
|
|
90,218
|
|
88,798
|
|
||||||||||
|
Shares used in calculating diluted net loss per share
|
99,574
|
|
97,735
|
|
96,235
|
|
90,218
|
|
88,798
|
|
||||||||||
|
|
As of December 31,
|
|||||||||||||||||||
|
|
2015
|
2014
|
2013
|
2012
|
2011
|
|||||||||||||||
|
|
(in thousands)
|
|||||||||||||||||||
|
|
||||||||||||||||||||
|
Cash
|
$
|
11,229
|
|
$
|
19,735
|
|
$
|
21,345
|
|
$
|
22,241
|
|
$
|
20,666
|
|
|||||
|
Working (deficit) capital
|
(23,542
|
)
|
49,511
|
|
34,026
|
|
65,264
|
|
59,292
|
|
||||||||||
|
Total assets
|
146,704
|
|
344,923
|
|
365,630
|
|
382,127
|
|
366,692
|
|
||||||||||
|
Total debt, including current portion
|
80,585
|
|
82,673
|
|
54,902
|
|
41,667
|
|
28,198
|
|
||||||||||
|
Redeemable preferred stock
|
23,603
|
|
23,603
|
|
23,603
|
|
23,603
|
|
23,603
|
|
||||||||||
|
Total stockholders’ (deficit) equity
|
(36,576
|
)
|
148,954
|
|
171,676
|
|
245,816
|
|
245,328
|
|
||||||||||
39
|
Item 7.
|
Management’s Discussion and Analysis of Financial Condition and Results of Operations
|
The following discussion of our financial condition and results of operations should be read in conjunction with the financial statements and the notes to those statements appearing elsewhere in this Annual Report on Form 10-K. Some of the information contained in this discussion and analysis or set forth elsewhere in this report include the identification of certain trends and other statements that may predict or anticipate future business or financial results that are subject to important factors that could cause our actual results to differ materially from those indicated. See “Item 1A Risk Factors” included elsewhere in this Annual Report on Form 10-K.
Overview
We are a medical technology company focused on the design, development and promotion of products for the surgical treatment of spine disorders. We have a comprehensive product portfolio and pipeline that addresses the cervical, thoracolumbar and intervertebral regions of the spine and covers a variety of spinal disorders and surgical procedures. Our principal product offerings are focused on the global market for fusion-based spinal disorder solutions. We believe that our products and systems are attractive to surgeons and patients due to enhanced product features and benefits that are designed to simplify surgical procedures and improve patient outcomes.
Revenue and Expense Components
The following is a description of the primary components of our revenues and expenses:
Revenues.
We derive our revenues primarily from the sale of spinal surgery implants used in the treatment of spine disorders. Spinal implant products include pedicle screws and complementary implants, interbody devices, plates, and tissue-based materials. Our revenues are generated by our direct sales force and independent distributors. Our products are requested directly by surgeons and shipped and billed to hospitals and surgical centers. Today we have existing subsidiaries and/or affiliates in Japan, Germany, Brazil, Italy and the U.K. through which we sell our products and independent distributors in over 50 countries throughout the world. A majority of our business is conducted with customers within markets in which we have experience and with payment terms that are customary to our business. We may defer revenues until the time of collection if circumstances related to payment terms, regional market risk or customer history indicate that collectability is not reasonably assured.
Cost of revenues.
Cost of revenues consists of direct product costs, royalties, milestones, depreciation of our surgical instruments, and the amortization of purchased intangibles. Our product costs consist primarily of direct labor, manufacturing overhead, and raw materials and components. The product costs of certain of our biologics products include the cost of procuring and processing human tissue. We incur royalties related to the technologies that we license from others and the products that are developed in part by surgeons with whom we collaborate in the product development process. Amortization of purchased intangibles consists of amortization of developed product technology.
Research and development.
Research and development expense consists of costs associated with the design, development, testing, and enhancement of our products. Research and development expense also includes salaries and related employee benefits, research-related overhead expenses, fees paid to external service providers in both cash and equity, and costs associated with our Scientific Advisory Board and Executive Surgeon Panels.
In-process research and development, or IPR&D.
In-process research and development expense consists of acquired research and development assets that were not part of an acquisition of a business and were not technically feasible on the date we acquired such technology, provided that such technology also did not have any alternative future use at that date.
Sales and marketing.
Sales and marketing expense consists primarily of salaries and related employee benefits, sales commissions and support costs, professional service fees, travel, medical education, trade show and marketing costs.
General and administrative.
General and administrative expense consists primarily of salaries and related employee benefits, professional service fees, insurance and legal expenses.
Goodwill and intangible assets impairment
. The impairment expense relates to impairment charges related to our goodwill balances and indefinite lived intangible assets.
Restructuring expenses.
Restructuring expenses consist of severance, social plan benefits and related taxes, facility closing costs, manufacturing transfer costs and contract termination incurred in connection with the reorganization of our Scient’x operations in France and the termination of our manufacturing operations in California.
Litigation settlement expenses.
Litigation settlement expenses consist of significant settlements of lawsuits.
40
Total other income (expense).
Total other income (expense) includes interest income, interest expense, changes in the fair value of the warrant liabilities, gains and losses from foreign currency exchanges and other non-operating gains and losses.
Income tax provision.
Income tax provision consists primarily of income tax provision related to state income taxes, foreign operations and uncertain tax positions in foreign jurisdictions, and the tax effect of changes in deferred tax liabilities associated with tax deductible goodwill.
Results of Operations
The first table below sets forth our statements of operations data for the periods presented. Our historical results are not necessarily indicative of the operating results that may be expected in the future.
|
|
Year Ended December 31,
|
|||||||||||
|
|
2015
|
2014
|
2013
|
|||||||||
|
|
(in thousands)
|
|||||||||||
|
Revenues
|
$
|
185,279
|
|
$
|
206,980
|
|
$
|
204,724
|
|
|||
|
Cost of revenues
|
63,742
|
|
61,834
|
|
78,669
|
|
||||||
|
Amortization of acquired intangible assets
|
1,453
|
|
1,736
|
|
1,733
|
|
||||||
|
Gross profit
|
120,084
|
|
143,410
|
|
124,322
|
|
||||||
|
Operating expenses:
|
||||||||||||
|
Research and development
|
17,767
|
|
16,799
|
|
14,190
|
|
||||||
|
In-process research and development
|
274
|
|
527
|
|
—
|
|
||||||
|
Sales and marketing
|
70,856
|
|
77,179
|
|
76,960
|
|
||||||
|
General and administrative
|
34,867
|
|
43,381
|
|
47,949
|
|
||||||
|
Amortization of acquired intangible assets
|
2,400
|
|
2,974
|
|
3,009
|
|
||||||
|
Goodwill and intangible assets impairment
|
165,171
|
|
—
|
|
—
|
|
||||||
|
Restructuring expenses
|
1,188
|
|
706
|
|
9,665
|
|
||||||
|
Litigation settlement expenses
|
—
|
|
—
|
|
45,982
|
|
||||||
|
Total operating expenses
|
292,523
|
|
141,566
|
|
197,755
|
|
||||||
|
Operating (loss) income
|
(172,439
|
)
|
1,844
|
|
(73,433
|
)
|
||||||
|
Other income (expense):
|
||||||||||||
|
Interest income
|
53
|
|
10
|
|
6
|
|
||||||
|
Interest expense
|
(12,589
|
)
|
(13,616
|
)
|
(3,959
|
)
|
||||||
|
Other income (expense), net
|
6,980
|
|
(33
|
)
|
(1,662
|
)
|
||||||
|
Total other income (expense)
|
(5,556
|
)
|
(13,639
|
)
|
(5,615
|
)
|
||||||
|
Pretax net loss
|
(177,995
|
)
|
(11,795
|
)
|
(79,048
|
)
|
||||||
|
Income tax provision
|
681
|
|
1,087
|
|
3,179
|
|
||||||
|
Net loss
|
$
|
(178,676
|
)
|
$
|
(12,882
|
)
|
$
|
(82,227
|
)
|
|||
Year Ended
December 31, 2015
Compared to the Year Ended
December 31, 2014
Revenues.
Revenues were
$185.3 million
for the year ended December 31,
2015
compared to
$207.0 million
for the year ended December 31,
2014
, representing
a decrease
of
$21.7 million
, or
10.5%
. The
decrease
was the result of sales decline in the U.S. region (
$22.5 million
) partially offset by an increase in the International region (
$0.8 million
).
U.S. revenues were
$114.6 million
for the year ended December 31,
2015
compared to
$137.1 million
for the year ended December 31,
2014
, representing
a decrease
of
$22.5 million
, or
16.4%
. The
decrease
was the result of decline in sales directly to hospitals ($18.9 million), combined with a decrease in sales to stocking distributors ($3.6 million).
International revenues were
$70.7 million
for the year ended December 31,
2015
compared to
$69.9 million
for the year ended December 31,
2014
, representing
an increase
of
$0.8 million
, or
1.1%
. The
increase
was due to growth in sales of implants and instruments ($11.8 million), offset by unfavorable exchange rate effect ($11.0 million).
Cost of revenues.
Cost of revenues was
$63.7 million
for the year ended December 31,
2015
compared to
$61.8 million
for the year ended December 31,
2014
, representing
an increase
of
$1.9 million
, or
3.1%
. The
increase
was the result of one-time charges for the impairment of certain product-related intangible assets and the disposal of manufacturing equipment ($1.9
41
million), non-recurring favorable royalties and milestones in 2014 ($1.2 million), an increase in manufacturing depreciation expense due to the reduction of useful lives resulting from the manufacturing outsourcing initiative ($1.5 million), offset by a reduction in reserves and adjustments ($0.9 million), reduced instrument depreciation expense ($0.9 million), a reduction in royalty and milestone expenses due to a reduction sales volume ($0.5 million), and a reduction in amortization expenses ($0.4 million).
Amortization of acquired intangible assets.
Amortization of acquired intangible assets was
$1.5 million
for the year ended December 31,
2015
compared to
$1.7 million
for the year ended December 31,
2014
, representing
a decrease
of
$0.3 million
, or
16.3%
. This expense represents amortization in the period for intangible assets associated with product-related assets obtained in acquisitions.
Gross profit.
Gross profit was
$120.1 million
for the year ended December 31,
2015
compared to
$143.4 million
for the year ended December 31,
2014
, representing
a decrease
of
$23.3 million
, or
16.3%
. The
decrease
was due to the decline in constant currency revenue ($10.7 million), unfavorable exchange rate effect ($11.0 million) and an increase in cost of revenues ($1.9 million), offset by a decrease in the amortization of acquired intangibles ($0.3 million).
Gross margin.
Gross margin was
64.8%
for the year ended December 31,
2015
compared to
69.3%
for the year ended December 31,
2014
. The
decrease
of
4.5
percentage points was due to increased cost of revenues resulting from one-time charges (2.4 percentage points), unfavorable variation in regional mix, currency and product mix (2.4 percentage points), increased royalty costs due to a change in product mix (0.2 percentage points), offset by a decrease in amortization expense (0.3 percentage points) and decrease in inventory reserves and other adjustments (0.2 percentage points).
Gross margin in the U.S. was
67.7%
for the year ended December 31,
2015
compared to
73.4%
for the year ended December 31,
2014
. The
decrease
of
5.7 percentage points
was due to increased cost of revenues resulting from one-time charges (3.9 percentage points), unfavorable variation in pricing and product mix (1.2 percentage points), increased royalty costs due to a change in product mix (0.6 percentage points) and an increase in instrument depreciation expense (0.5 percentage points), offset by a decrease in inventory reserves and adjustments (0.3 percentage points) and a decrease in amortization expense (0.2 percentage points).
Gross margin for the International region was
60.2%
for the year ended December 31,
2015
compared to
61.3%
for the year ended December 31,
2014
. The
decrease
of
1.1 percentage points
was due to favorable variation in regional mix and product mix (3.7 percentage points), reduced instrument depreciation expense (0.4 percentage points), a reduction in amortization of acquired intangibles (0.4 percentage points) and a decrease in inventory reserves and adjustments (0.4 percentage points), offset by unfavorable exchange rate effect (6.0 percentage points).
Research and development.
Research and development expense was
$17.8 million
for the year ended December 31,
2015
compared to
$16.8 million
for the year ended December 31,
2014
representing
an increase
of
$1.0 million
, or
5.8%
. The
increase
was primarily due to an increase in stock-based compensation based on a mark-to-market calculation of stock previously provided to outside consultants ($2.9 million), offset by a reduction in personnel costs ($1.5 million) and a reduction related to the timing of development activities and product launch schedules ($0.4 million).
In-process research and development
. IPR&D expense was
$0.3 million
for the year ended December 31,
2015
compared to
$0.5 million
for the year ended December 31,
2014
. The expense in 2015 and 2014 relates to initial purchase payments in connection with asset purchase agreements for which the underlying product was not technologically feasible at the time the asset was acquired.
Sales and marketing
. Sales and marketing expense was
$70.9 million
for the year ended December 31,
2015
compared to
$77.2 million
for the year ended December 31,
2014
representing
a decrease
of
$6.3 million
, or
8.2%
. The decrease was due to a decrease in selling and marketing activities due to the timing of activity ($2.5 million), and a decrease in commission expense due to the reduction in U.S. revenue ($3.8 million).
General and administrative.
General and administrative expense was
$34.9 million
for the year ended December 31,
2015
compared to
$43.4 million
for the year ended December 31,
2014
, representing
a decrease
of
$8.5 million
, or
19.6%
. The
decrease
was due to a reduction in legal expenses associated with the Orthotec litigation ($4.8 million), a reduction in expenses due to the restructuring of business operations in France ($1.9 million), a reduction in personnel expense in the U.S. region ($0.7 million), a reduction in expenses related to the international regions ($0.7 million), and a sales tax refund ($0.4 million).
Amortization of acquired intangible assets.
Amortization of acquired intangible assets was
$2.4 million
for the year ended December 31,
2015
as compared to
$3.0 million
for the year ended December 31,
2014
. This expense represents amortization in the period for intangible assets associated with general business assets obtained in acquisitions and has declined as those assets have either been impaired or become fully amortized.
Goodwill and intangible assets impairment.
The goodwill and intangible assets impairment of
$165.2 million
is a result of our impairment test performed during the third quarter of 2015 triggered by the decline in our share price. The impairment
42
charge represents a full write off of our existing goodwill balance ($164.3 million) and write offs related to intangible assets (
$0.9 million
).
Restructuring expenses.
Restructuring expenses were
$1.2 million
for the year ended December 31,
2015
compared to
$0.7 million
for the year ended December 31,
2014
. In 2013, we announced that Scient'x had begun a process to significantly restructure its business operations in France in an effort to improve operating efficiencies and rationalize its cost structure and in 2015 we initiated plans to close our French operations completely. In July 2015, we announced a restructuring of our manufacturing operations in California in an effort to improve our cost structure. The restructuring includes a reduction in workforce and closing the California manufacturing facility.
Interest expense.
Interest expense was
$12.6 million
for the year ended December 31,
2015
compared to
$13.6 million
for the year ended December 31,
2014
, representing
a decrease
of
$1.0 million
, or
7.5%
. Interest expense for the years ended December 31, 2015 and 2014 consisted primarily of interest related to loan agreements and lines of credit and the associated amortization expenses related to debt issuance costs. The decrease was primarily due to lower debt offering cost amortization and increased interest expense related to the Deerfield facility.
Other income (expense), net.
Other income (expense), net was income of
$7.0 million
for the year ended December 31,
2015
compared to an expense of less than $0.1 million for the year ended December 31,
2014
, representing
an increase
in income of
$7.0 million
. The increase was due primarily to a decline in the fair value of common stock warrant liability ($5.4 million) and net unfavorable foreign currency exchange results due to having non-functional currency denominated assets and liabilities on our subsidiaries' books ($1.6 million).
Income tax provision.
Income tax provision was
$0.7 million
for the year ended December 31,
2015
compared to
$1.1 million
for the year ended December 31,
2014
, representing
a decrease
of
$0.4 million
, or
37.4%
. The income tax provision in 2015 consists primarily of an increase in valuation allowance on foreign tax assets and state and foreign income taxes, partially offset by the reversal of deferred tax liabilities associated with tax deductible goodwill. The income tax provision in 2014 consists primarily of income tax provisions related to state income taxes, the tax effect of changes in deferred tax liabilities associated with tax deductible goodwill and operations in foreign jurisdictions where we operate.
Year Ended
December 31, 2014
Compared to the Year Ended
December 31, 2013
Revenues.
Revenues were
$207.0 million
for the year ended December 31,
2014
compared to
$204.7 million
for the year ended December 31,
2013
, representing
an increase
of
$2.3 million
, or
1.1%
. The
increase
was the result of growth in both the U.S. region (
$2.1 million
) and the International region (
$0.1 million
).
U.S. revenues were
$137.1 million
for the year ended December 31,
2014
compared to
$135.0 million
for the year ended December 31,
2013
, representing
an increase
of
$2.1 million
, or
1.6%
. The
increase
was the result of increased sales directly to hospitals ($5.2 million), offset by a decrease in sales to stocking distributors ($3.1 million).
International revenues were
$69.9 million
for the year ended December 31,
2014
compared to
$69.8 million
for the year ended December 31,
2013
, representing
an increase
of
$0.1 million
, or
0.2%
. The
increase
was due to growth in sales of implants and instruments ($5.5 million), offset by the elimination of revenue as a result of ceasing commercial operations in France as a result of the restructuring ($5.4 million). The increase in revenue is inclusive of $2.9 million in unfavorable exchange rate effect.
Cost of revenues.
Cost of revenues was
$61.8 million
for the year ended December 31,
2014
compared to
$78.7 million
for the year ended December 31,
2013
, representing
a decrease
of
$16.8 million
, or
21.4%
. The
decrease
was partially due to the one-time charges in 2013 for increased inventory and instrument reserves related to the restructuring of the Scient'x organization ($5.5 million), the obsolescence of the PureGen inventory ($3.5 million) and the obsolescence of certain inventory related to an interbody fusion product ($1.0 million). In addition, there was a reduction in amortization expense related to the Cross Medical settlement, for which expenses concluded in 2013 ($3.8 million), a reduction in depreciation expense related to instruments ($2.2 million), and a decrease in inventory adjustments ($1.7 million), offset by an increase in product costs due to the growth in sales ($0.3 million) and an increase in inventory reserves ($0.6 million).
Amortization of acquired intangible assets.
Amortization of acquired intangible assets was
$1.7 million
for the years ended December 31,
2014
and December 31,
2013
. This expense represents amortization in the period for intangible assets associated with product related assets obtained in acquisitions.
Gross profit.
Gross profit was
$143.4 million
for the year ended December 31,
2014
compared to
$124.3 million
for the year ended December 31,
2013
, representing
an increase
of
$19.1 million
, or
15.4%
. The
increase
was due to a reduction in the cost of revenues ($17.3 million) and an increase in sales volume ($1.8 million).
Gross margin.
Gross margin was
69.3%
for the year ended December 31,
2014
compared to
60.7%
for the year ended December 31,
2013
. The
increase
of
8.6
percentage points was due to a reduction in non-recurring charges and benefits (5.0
43
percentage points), amortization expense related to the Cross Medical settlement, for which expenses concluded in 2013 (2.0 percentage points), a reduction in depreciation expense related to instruments (1.1 percentage points) and a reduction in inventory adjustments (0.8 percentage points), offset by an increase in inventory reserves (0.3 percentage points).
Gross margin in the U.S. was
73.4%
for the year ended December 31,
2014
compared to
65.9%
for the year ended December 31,
2013
. The
increase
of
7.5 percentage points
was due to a reduction in non-recurring charges and benefits (3.4 percentage points), amortization expense related to the Cross Medical settlement, for which expenses concluded in 2013 (3.1 percentage points), a reduction in depreciation expense related to instruments (1.0 percentage points), and a decrease in inventory adjustments (0.7 percentage points), offset by an increase in inventory reserves (0.4 percentage points) and an increase in royalty and milestone expenses due to a change in product mix (0.3 percentage points).
Gross margin for the International region was
61.3%
for the year ended December 31,
2014
compared to
50.8%
for the year ended December 31,
2013
. The
increase
of
10.5 percentage points
was due to 2013 reserves related to the restructuring of the Scient'x organization (7.9 percentage points), a reduction in instrument depreciation (1.3 percentage points) and a reduction in inventory adjustments (1.5 percentage points), offset by an unfavorable variation in pricing and product mix (0.2 percentage points).
Research and development.
Research and development expense was
$16.8 million
for the year ended December 31,
2014
compared to
$14.2 million
for the year ended December 31,
2013
representing
an increase
of
$2.6 million
, or
18.4%
. The
increase
was primarily related to the beta launch of the Arsenal pedicle screw system and increased development activity.
In-process research and development
. IPR&D expense was
$0.5 million
for the year ended December 31,
2014
compared to
$0
for the year ended December 31,
2013
. The $0.5 million expense in 2014 relates to initial purchase payments in connection with asset purchase agreements for which the underlying product was not technologically feasible at the time the asset was acquired.
Sales and marketing
. Sales and marketing expense was
$77.2 million
for the year ended December 31,
2014
compared to
$77.0 million
for the year ended December 31,
2013
representing
an increase
of
$0.2 million
, or
0.3%
. The
increase
was due to an increase in commission expense ($2.1 million), offset by a reduction in the International region resulting from the restructuring of the Scient'x organization ($1.9 million).
General and administrative.
General and administrative expense was
$43.4 million
for the year ended December 31,
2014
compared to
$47.9 million
for the year ended December 31,
2013
, representing
a decrease
of
$4.6 million
, or
9.5%
. The
decrease
was primarily due to a lower amount of legal expenses associated with the Orthotec litigation.
Amortization of acquired intangible assets.
Amortization of acquired intangible assets was
$3.0 million
for the year ended December 31,
2014
and compared to
$3.0 million
for the year ended December 31,
2013
. This expense represents amortization in the period for intangible assets associated with general business assets obtained in acquisitions.
Restructuring expenses.
Restructuring expenses were
$0.7 million
for the year ended December 31,
2014
compared to
$9.7 million
for the year ended December 31,
2013
.
On September 16, 2013, we announced that Scient'x began a process to significantly restructure its business operations in France in an effort to improve operating efficiencies and rationalize its cost structure
. The restructuring included a reduction in Scient'x's workforce and the closing of the manufacturing facilities in France. The Company has recorded total costs of
$10.4 million
through December 31, 2014 associated with this restructuring, which include employee severance, social plan benefits and related taxes, facility closing costs, manufacturing transfer costs, and contract termination costs.
Litigation settlement expenses.
Litigation settlement expenses were
$0
for the year ended December 31,
2014
compared to
$46.0 million
for the year ended December 31,
2013
. The 2013 amount relates to an accrual booked for litigation settlement in connection with the Orthotec litigation matter.
Interest expense.
Interest expense was
$13.6 million
for the year ended December 31,
2014
compared to
$4.0 million
for the year ended December 31,
2013
, representing
an increase
of
$9.7 million
, or
243.9%
. Interest expense for the years ended December 31, 2014 and 2013 consisted primarily of interest related to loan agreements and lines of credit and the associated amortization expenses related to debt issuance costs. The increase in interest expense in 2014 is primarily due to interest expense and amortization of debt discount related to the Deerfield facility ($6.2 million), imputed interest on the Orthotec settlement ($1.7 million) and interest on higher levels of borrowings under the MidCap facility ($1.7 million).
Other income (expense), net.
Other income (expense) was an expense of less than $0.1 million for the year ended December 31,
2014
compared to an expense of
$1.7 million
for the year ended December 31,
2013
, representing
a decrease
in this expense of
$1.6 million
. The
decrease
in expense was primarily due to a gain from the decrease in the fair market value of certain warrants ($2.6 million), partially offset by an increase in unfavorable foreign currency exchange results due to U.S. denominated assets and liabilities on our foreign subsidiaries books and foreign currency losses ($1.0 million).
44
Income tax provision.
Income tax provision (benefit) was a provision of
$1.1 million
for the year ended December 31,
2014
compared to a provision of
$3.2 million
for the year ended December 31,
2013
, representing
a decrease
of
$2.1 million
, or
65.8%
. The income tax provision in 2014 and 2013 consists primarily of income tax provisions related to state income taxes, the tax effect of changes in deferred tax liabilities associated with tax deductible goodwill and operations in foreign jurisdictions where we operate.
Non-GAAP Financial Measures
We utilize certain financial measures that are not calculated based on U.S. Generally Accepted Accounting Principles, or GAAP. Certain of these financial measures are considered “non-GAAP” financial measures within the meaning of Item 10 of Regulation S-K promulgated by the SEC. We believe that non-GAAP financial measures reflect an additional way of viewing aspects of our operations that, when viewed with the GAAP results, provide a more complete understanding of our results of operations and the factors and trends affecting our business. These unaudited non-GAAP financial measures are also used by our management to evaluate financial results and to plan and forecast future periods. However, non-GAAP financial measures should be considered as a supplement to, and not as a substitute for, or superior to, the corresponding measures calculated in accordance with GAAP. Non-GAAP financial measures used by us may differ from the non-GAAP measures used by other companies, including our competitors.
Adjusted EBITDA represents net income (loss) excluding the effects of interest, taxes, depreciation, amortization, stock-based compensation and other non-recurring income or expense items, such as in-process research and development expense and acquisition related transaction expenses, restructuring expenses, litigation exposure expenses, trial related legal costs and litigation settlement expenses. We believe that the most directly comparable GAAP financial measure to adjusted EBITDA is net income (loss). Adjusted EBITDA has limitations, however, and therefore, should not be considered either in isolation or as a substitute for analysis of our results as reported under GAAP. Furthermore, adjusted EBITDA should not be considered as an alternative to operating income (loss) or net income (loss) as a measure of operating performance or to net cash provided by operating, investing or financing activities, or as a measure of our ability to meet cash needs.
The following is a reconciliation of adjusted EBITDA to the most comparable GAAP measure, net loss, for the years ended December 31,
2015
,
2014
and
2013
(in thousands):
|
|
Year Ended December 31,
|
|||||||||||
|
|
2015
|
2014
|
2013
|
|||||||||
|
Net loss
|
$
|
(178,676
|
)
|
$
|
(12,882
|
)
|
$
|
(82,227
|
)
|
|||
|
Stock-based compensation
|
2,643
|
|
4,554
|
|
4,078
|
|
||||||
|
Depreciation
|
12,974
|
|
12,160
|
|
14,638
|
|
||||||
|
Amortization of intangible assets
|
2,204
|
|
1,515
|
|
6,898
|
|
||||||
|
Amortization of acquired intangible assets
|
3,853
|
|
4,710
|
|
4,741
|
|
||||||
|
Goodwill and intangible assets impairment
|
165,171
|
|
—
|
|
—
|
|
||||||
|
In-process research and development
|
274
|
|
527
|
|
—
|
|
||||||
|
Stock price guarantee
|
4,877
|
|
—
|
|
—
|
|
||||||
|
Interest expense, net
|
12,536
|
|
13,606
|
|
3,953
|
|
||||||
|
Income tax provision
|
681
|
|
1,087
|
|
3,179
|
|
||||||
|
Other (income) expense, net
|
(6,980
|
)
|
33
|
|
1,662
|
|
||||||
|
Restructuring and other expenses
|
1,188
|
|
742
|
|
18,603
|
|
||||||
|
Litigation expenses and trial costs
|
—
|
|
4,779
|
|
49,657
|
|
||||||
|
Adjusted EBITDA
|
$
|
20,745
|
|
$
|
30,831
|
|
$
|
25,182
|
|
|||
Liquidity and Capital Resources
We have incurred significant net losses since inception and relied on our ability to fund our operations through revenues from the sale of our products, equity financings and debt financings. As we have incurred losses, successful transition to profitability is dependent upon achieving a level of revenues adequate to support our cost structure. This may not occur and, unless and until it does, we will continue to need to raise additional capital. Additionally, as discussed below, we have a significant amount of debt that is classified as current debt. Operating losses and negative cash flows may continue for at least the next year as we continue to incur costs related to the execution of our operating plan, introduction of new products and expansion into new geographies. Our amended and restated credit facility with MidCap Financial, LLC, or MidCap, as amended, or the Amended Credit Facility, matures in December 2016, which will require us to refinance the Amended Credit
45
Facility with MidCap or seek alternative financing. We were not in compliance with the fixed charge coverage ratio covenant related to the Amended Credit Facility with MidCap for June, August, September, October, November and December of 2015 and January 2016. We obtained waivers from MidCap to cure the non-compliance for these periods. Our default under the Amended Credit Facility with MidCap also constitutes an event of default under our facility agreement, or Facility Agreement, with Deerfield Private Design Fund II, L.P., Deerfield Private Design International II, L.P., Deerfield Special Situations Fund, L.P., and Deerfield Special Situations International Master Fund, L.P., or collectively Deerfield, and such default has been similarly waived for these periods. There is no assurance that we will be in compliance with the financial covenants of the Amended Credit Facility in the future. If we have future defaults and we do not obtain waivers from MidCap or Deerfield they would have the right to call their respective debts due immediately, which would significantly impact our ability to continue as a going concern. We intend to pursue additional opportunities to raise additional capital through public or private equity offerings, debt financings, receivables financings or collaborations or partnerships with other companies to further support our planned operations. However, there is no assurance that we will be able to do so. Accordingly, as of December 31, 2015, there is substantial doubt about our ability to continue as a going concern through December 31, 2016.
Historically, our principal sources of cash have included customer payments from the sale of our products, proceeds from the issuance of common and preferred stock and proceeds from the issuance of debt. Our principal uses of cash have included cash used in operations, acquisitions of businesses and intellectual property rights, payments relating to purchases of surgical instruments, repayments of borrowings under the Amended Credit Facility, and payments due under the Orthotec settlement agreement. We expect that our principal uses of cash in the future will be for operations, working capital, capital expenditures, and potential acquisitions. We expect that, as our revenues grow, our sales and marketing and research and development expenses will continue to grow and, as a result, we will need to generate significant net revenues to achieve profitability. We anticipate that we will raise additional capital through borrowings under our Amended Credit Facility, the incurrence of other indebtedness, additional equity financings or a combination of these potential sources of liquidity.
We will need to invest in working capital and surgical instruments in order to support our revenue projections through the end of 2016. If we are not able to achieve our revenue forecast and cash consumption starts to exceed forecasted consumption, management will need to adjust our investment in surgical instruments and manage our inventory to the decreased sales volumes. If we do not make these adjustments in a timely manner, there could be an adverse impact on our financial resources. Our revenue projections may be negatively impacted as a result of a decline in sales of our products, including declines due to changes in our customers’ ability to obtain third-party coverage and reimbursement for procedures that use our products, increased pricing pressures resulting from intensifying competition, and cost increases and slower product development cycles resulting from a changing regulatory environment.
On July 6, 2015, we announced a restructuring of our manufacturing operations in California in an effort to improve our cost structure. The restructuring includes a reduction in workforce and closing the California manufacturing facility.
A substantial portion of our available cash funds is held in business accounts with reputable financial institutions. At times, however, our deposits, may exceed federally insured limits and thus we may face losses in the event of insolvency of any of the financial institutions where our funds are deposited. We did not hold any marketable securities as of
December 31, 2015
.
Amended Credit Facility, Facility Agreement and Other Debt
On August 30, 2013, we entered into the Amended Credit Facility to, among other things, increase the borrowing limit under the existing credit facility from $50 million to $73 million and extend the maturity to August 2016. The Amended Credit Facility consists of a $33 million term loan, $28 million of which was drawn at closing and a $5 million delayed draw that was drawn in April 2014, and a revolving line of credit with a maximum borrowing base of $40 million. We used the term loan proceeds of $28 million to repay a portion of the outstanding balance on the prior revolving line of credit. In addition to monthly payments of interest, monthly repayments of $0.3 million of the principal for the term loan were made beginning in October 2013, increasing to $0.5 million beginning in October 2014, and are due through maturity, with the remaining principal due upon maturity.
On March 17, 2014, we entered into the First Amendment to the Amended Credit Facility, or the First Amendment. The First Amendment permits, among other things, our execution of, and borrowing of loans, under the Facility Agreement and our granting of liens as security therefore, the payment of amounts due under the Orthotec settlement agreement and the completion of certain conditions. The First Amendment also added a total leverage ratio financial covenant to the Amended Credit Facility.
On July 10, 2015, we entered into a Second Amendment to the Amended Credit Facility, or the Second Amendment, to increase the term loan commitment from $33 million to $38 million. We borrowed the additional $5 million on July 10, 2015, which is the third term loan tranche under the Amended Credit Facility, or the Third Term Loan Tranche. Until January 1, 2016, only interest payments were due for the Third Term Loan Tranche. Thereafter, we will pay an amount equal to $0.5 million on
46
the first day of each calendar month as an amortization payment in respect of all tranches of the term loan. We agreed to pay MidCap, a commitment fee equal to 1.0% of the principal amount of the funds disbursed in the Third Term Loan Tranche.
The Amended Credit Facility includes traditional lending and reporting covenants including a fixed charge coverage ratio, a senior leverage ratio and a total leverage ratio to be maintained by us. The Amended Credit Facility also provides for several event of default provisions, such as payment default and insolvency conditions, which could cause interest to be charged at a rate which is up to
five
percentage points above the rate effective immediately before the event of default or result in MidCap’s right to declare all outstanding obligations immediately due and payable.
We were in compliance with all of the covenants of the Amended Credit Facility as of
December 31, 2015
, except for our non-compliance with the fixed charge coverage ratio covenant discussed above. We have obtained waivers from MidCap to cure the breach of the fixed charge coverage ratio covenant for each of June, August, September, October, November and December of 2015. There is no assurance that we will be in compliance with the financial covenants of the Amended Credit Facility in the future.
On March 11, 2016, we entered into a third amendment and waiver to the Amended Credit Facility with MidCap, or the Third Amendment to the Amended Credit Facility. The Third Amendment to the Amended Credit Facility extends the maturity date of the Amended Credit Facility from August 30, 2016 to December 31, 2016 and contains an amendment fee in the amount of $0.5 million, which is due and payable at the earlier of the termination of the Amended Credit Facility or the maturity date. The Third Amendment also contains a waiver of the December 2015 defaults under the Facility Agreement, provides a waiver for the fixed charge coverage ratio for January 2016 and eliminates the fixed charge coverage ratio covenant for February 2016.
On March 17, 2014, we entered into the Facility Agreement, pursuant to which Deerfield agreed to loan us up to $50 million, subject to the terms and conditions set forth in the Facility Agreement. Under the terms of the Facility Agreement, we had the option, but were not required, upon certain conditions to draw the entire amount available under the Facility Agreement, at any time until January 30, 2015, provided that the initial draw be used for a portion of the payments made in connection with the Orthotec settlement described above, or the Litigation Satisfaction. Following such initial draw down, we had the opportunity to draw down additional amounts under the Facility Agreement up to an aggregate of $15.0 million for working capital or general corporate purposes. We agreed to pay Deerfield, upon each disbursement of funds under the Facility Agreement, a transaction fee equal to 2.5% of the principal amount of the funds disbursed in addition to the issuance of additional warrants to purchase up to 10,000,000 shares of the Company's common stock to Deerfield. On March 20, 2014, we drew $20 million under the Facility Agreement and received net proceeds of $19.5 million to fund the Orthotec settlement payment obligations due in 2014. On November 21, 2014, we drew an additional $6 million under the Facility Agreement and received net proceeds of $5.9 million to fund future Orthotec settlement payment obligations through 2016. The unused proceeds from the Facility Agreement are classified as restricted cash and may not be used for other purposes. As of January 30, 2015, we can no longer draw down additional funds under the Facility Agreement. Amounts borrowed under the Facility Agreement bear interest at a rate of
8.75%
per annum and are payable in March 2017, March 2018 and March 2019, which are the third, fourth and fifth anniversary date of the first amount borrowed under the Facility Agreement, with the final payment due on March 20, 2019.
In connection with the execution of the Facility Agreement, we issued to Deerfield warrants to purchase an aggregate of
6,250,000
shares of our common stock (the “Initial Warrants”). Additionally, we agreed that upon each disbursement under the Facility Agreement we would issue to Deerfield warrants to purchase up to
10,000,000
shares of our common stock, in proportion to the amount of draw compared to the total
$50 million
facility (the "Draw Warrants").
On March 20, 2014, we made an initial draw of
$20 million
under the Facility Agreement and received net proceeds of
$19.5 million
to fund the portion of the Orthotec settlement payment obligations that were due in 2014. The
$0.5 million
transaction fee was recorded as a debt discount and is being amortized over the term of the draw, which ends on March 20, 2019. In connection with this borrowing, we issued Draw Warrants to purchase
4,000,000
shares of common stock, which were valued at
$4.7 million
and recorded as a debt discount and are being amortized over the term of the draw. Additionally,
$2.3 million
of the value of the Initial Warrants was reclassified as a debt discount and is being amortized through interest expense over the term of the debt using the effective interest method.
On November 21, 2014, we made a second draw of
$6 million
under the Facility Agreement and received net proceeds of
$5.9 million
to fund the portion of the Orthotec settlement payments through July 2016. The
$0.2 million
transaction fee was recorded as a debt discount and is being amortized over the remaining term of the draw, which ends on March 20, 2019. In connection with this borrowing, we issued Draw Warrants to purchase
1,200,000
shares of common stock, which were valued at
$0.9 million
and recorded as a debt discount and is being amortized over the term of the debt using the effective interest method.
On July 10, 2015, we entered into a First Amendment to the Facility Agreement, or the Facility Agreement First Amendment, with Deerfield. The Facility Agreement First Amendment permitted us, among other things, to enter into and
47
borrow the additional $5 million under the term loan in July 2015 under the Second Amendment to the Amended Credit Facility.
On February 5, 2016, we entered into a Limited Waiver and Second Amendment to the Facility Agreement, or the Second Amendment. The Second Amendment increases the interest rate under the Facility Agreement from 8.75% per annum to 14.75% per annum. In addition, under the Second Amendment we may elect to have (i) until August 30, 2016, six percent (6%), and (ii) thereafter, three percent (3%), in each case, of the interest on the outstanding principal amount under the Facility Agreement paid in kind, which would be added to the outstanding principal amount under the Facility Agreement and bear interest at the interest rate of 14.75% per annum, hereinafter referred to as the PIK Interest. All accrued and unpaid PIK Interest is due and payable when the outstanding amounts under the Facility Agreement are due and payable thereunder or are fully repaid, whichever occurs first. The Second Amendment also contains an amendment fee in the amount of
$0.6 million
, which is due and payable in installments of
$0.2 million
in March 2017, March 2018 and March 2019 on the third, fourth and fifth anniversaries of the Facility Agreement; provided, that all unpaid amendment fees shall be due and payable when the outstanding amounts under the Facility Agreement are due and payable or are fully repaid, whichever occurs first. The Second Amendment also changes the prior date of March 31, 2017 to March 31, 2018, as the date through which we must pay interest in the event we prepay amounts outstanding under the Facility Agreement prior to such date. The Second Amendment also contains the waivers of the defaults under the Facility Agreement discussed above.
As of
December 31, 2015
, Orthotec settlement payments of
$23.0 million
have been made, leaving remaining proceeds from the funds borrowed under the Facility Agreement of
$2.4 million
, which are classified as short-term restricted cash, as their use is limited under the terms of the Facility Agreement for the payments of amounts due under the Orthotec litigation settlement agreement. Additionally, an Orthotec settlement payment of $1.1 million was made on January 1, 2016. As of
March 14, 2016
, there remains aggregate of
$33.7 million
of Orthotec settlement payments to be paid by us. The amounts borrowed under the Facility Agreement, which total
$26.0 million
in principal and accrued interest as of
December 31, 2015
, are due in
three
equal annual payments beginning March 20, 2017. Additionally,
$0.2 million
of the value of the Initial Warrants was reclassified as a debt discount and is being amortized through interest expense over the term of the debt using the effective interest method.
The Facility Agreement contains various representations and warranties, and affirmative and negative covenants, customary for financings of this type, including restrictions on our ability to incur additional indebtedness or liens on its assets, except as permitted under the Facility Agreement. As security for our repayment of our obligations under the Facility Agreement, we granted to Deerfield a security interest in substantially all of our property and interests in property, which is subordinated to the security interest granted under the Amended Credit Facility. As a result of our non-compliance with the MidCap fixed charge coverage ratio covenant, we were in cross-default of the Facility Agreement as discussed above. There is no assurance that we will be in compliance with the financial covenants of the Amended Credit Facility in the foreseeable future, which would result in cross-default under the Facility Agreement in which case Deerfield would have the right to call the debt outstanding under the Facility Agreement due immediately.
We have various capital lease arrangements. The leases bear interest at rates ranging from
6.6%
to
9.6%
, are generally due in monthly principal and interest installments, are collateralized by the related equipment, and have various maturity dates through
September 2018
. As of December 31,
2015
, the balance of these capital leases, net of interest totaled
$1.3 million
. There was one new lease in
2015
.
NASDAQ Notice for Failure to Satisfy Continued Listing Rules
Our common stock is currently listed on the NASDAQ Global Select Market. In order to maintain that listing, we must satisfy minimum financial and other requirements. On September 17, 2015, we received written notice from the Listing Qualifications Department of the NASDAQ Stock Market LLC, or NASDAQ, notifying us that for the preceding 30 consecutive business days, our common stock did not maintain a minimum closing bid price of $1.00 per share as required for continued inclusion on The NASDAQ Global Select Market under NASDAQ Listing Rule 5450(a)(1). The notification letter states that pursuant to NASDAQ Listing Rule 5810(c)(3)(A), we will be afforded 180 calendar days, or until March 15, 2016, to regain compliance with the minimum bid price requirement. In order to regain compliance, shares of our common stock must maintain a minimum closing bid price of at least $1.00 per share for a minimum of 10 consecutive business days during such 180-day period. However, we will not be able to maintain a minimum closing bid price of at least $1.00 per share for a minimum of 10 consecutive business days prior to the March 15, 2016 compliance deadline. If we do not regain compliance by March 15, 2016, NASDAQ will provide written notification to us that our common stock will be delisted. At that time, we may appeal NASDAQ’s delisting determination to a NASDAQ Listing Qualifications Panel. Alternatively, we may be eligible to transfer to The NASDAQ Capital Market in order to receive an additional 180 day grace period if we satisfy all of the requirements, other than the minimum bid price requirement, for listing on The NASDAQ Capital Market. However, we currently do not satisfy the minimum stockholders’ equity requirements of The NASDAQ Capital Market.
48
A delisting of our common stock from The NASDAQ Global Select Market and our failure to transfer our listing to The NASDAQ Capital Market could substantially further reduce the liquidity of our common stock and result in a corresponding material reduction in the price of our common stock. In addition, delisting could harm our ability to raise capital through alternative financing sources on terms acceptable to us, or at all, and may result in the potential loss of confidence by investors, suppliers, customers and employees and fewer business development opportunities.
Operating Activities
We generated net cash of
$10.1 million
from operating activities for the year ended December 31,
2015
. During this period, net cash provided by operating activities primarily consisted of a net loss of
$178.7 million
and a decrease in working capital and other assets of
$0.9 million
offset by non-cash impairment charge of
$165.2 million
and
$24.5 million
of other non-cash costs, including amortization, depreciation, stock-based compensation, provision for excess and obsolete inventory and interest expense related to amortization of debt discount and issue costs. The decrease in working capital and other assets of
$0.9 million
consisted of decreases in accrued expenses and other liabilities of
$6.4 million
and deferred revenue of
$0.3 million
and a decrease in inventories of
$5.5 million
partially offset by and an increase in accounts payable of
$3.2 million
; and decreases in restricted cash of
$4.4 million
, accounts receivable of
$1.2 million
, and prepaid expenses and other current assets of
$2.5 million
.
Investing Activities
We used net cash of
$12.2 million
in investing activities for the year ended December 31,
2015
primarily related to the purchase of surgical instruments.
Financing Activities
We used net cash of
$6.5 million
in financing activities for the year ended December 31,
2015
. We drew
$141.6 million
under the Amended Credit Facility with MidCap and made principal payments totaling
$144.6 million
. We received proceeds from notes payable of $5.0 million and made principal payments on notes payable totaling
$8.2 million
and capital leases totaling
$0.7 million
for the year ended
December 31, 2015
.
Contractual obligations and commercial commitments
Total contractual obligations and commercial commitments as of December 31,
2015
are summarized in the following table (in thousands):
|
|
Payment Due by Year
|
|||||||||||||||||||||||||||
|
|
Total
|
2016
|
2017
|
2018
|
2019
|
2020
|
Thereafter
|
|||||||||||||||||||||
|
Amended Credit Facility with MidCap
(1)
|
$
|
56,799
|
|
$
|
56,799
|
|
$
|
—
|
|
$
|
—
|
|
$
|
—
|
|
$
|
—
|
|
$
|
—
|
|
|||||||
|
Facility Agreement with Deerfield
(1)
|
26,000
|
|
—
|
|
8,667
|
|
8,667
|
|
8,666
|
|
—
|
|
—
|
|
||||||||||||||
|
Interest expense
(1)
|
8,468
|
|
5,087
|
|
1,706
|
|
948
|
|
727
|
|
—
|
|
—
|
|
||||||||||||||
|
Note payable for software licenses
|
189
|
|
189
|
|
—
|
|
—
|
|
—
|
|
—
|
|
—
|
|
||||||||||||||
|
Note payable for insurance premiums
|
1,599
|
|
1,599
|
|
—
|
|
—
|
|
—
|
|
—
|
|
—
|
|
||||||||||||||
|
Capital lease obligations
|
1,382
|
|
877
|
|
437
|
|
68
|
|
—
|
|
—
|
|
—
|
|
||||||||||||||
|
Operating lease obligations
(2)
|
3,570
|
|
2,268
|
|
823
|
|
304
|
|
170
|
|
5
|
|
—
|
|
||||||||||||||
|
Litigation settlement obligations
|
34,833
|
|
4,400
|
|
4,400
|
|
4,400
|
|
4,400
|
|
4,400
|
|
12,833
|
|
||||||||||||||
|
Guaranteed minimum royalty obligations
|
5,840
|
|
2,036
|
|
1,450
|
|
1,368
|
|
618
|
|
368
|
|
—
|
|
||||||||||||||
|
Stock price guarantee
(3)
|
4,877
|
|
—
|
|
2,185
|
|
2,195
|
|
497
|
|
—
|
|
—
|
|
||||||||||||||
|
New product development milestones
(4)
|
575
|
|
175
|
|
200
|
|
—
|
|
200
|
|
—
|
|
—
|
|
||||||||||||||
|
Total
|
$
|
144,132
|
|
$
|
73,430
|
|
$
|
19,868
|
|
$
|
17,950
|
|
$
|
15,278
|
|
$
|
4,773
|
|
$
|
12,833
|
|
|||||||
|
(1)
|
The amounts above are presented based on the contractual payment schedule in each of the respective agreements. However, the debt balance under the Amended Credit Facility and Facility Agreement was callable as of December 31, 2015 due to the events of default (See Note 1 of the notes to consolidated financial statements) and therefore, is presented as a current liability in the consolidated balance sheet as of December 31, 2015.
|
|
(2)
|
The amounts above do not reflect the commitments under the new Lease agreement that we entered into in January 2016 as disclosed in the "Real Property Leases" section below.
|
49
|
(3)
|
Based on our closing stock price as of December 31, 2015 of $0.30 per share. Actual cash obligation will vary depending on the price of our common stock on the settlement dates.
|
|
(4)
|
This commitment represents payments in cash, and is subject to attaining certain development milestones such as FDA approval, product design and functionality testing requirements, which we believe are reasonably likely to be achieved in
2016
through 2019.
|
Real Property Leases
In February 2008, we entered into a sublease agreement, or the Sublease, for office, engineering, and research and development space in Carlsbad, California, or Building 1. The Sublease term commenced May 2008 and ended on January 31, 2016. In January 2016, we entered into a new lease agreement, or the Building 1 Lease, for the same property with the lease term through July 31, 2021. Under the original Sublease agreement, we were obligated to pay base rent and certain operating costs and taxes for Building 1. Monthly base rent payable by us was approximately $80,500 during the first year of the Sublease, increasing annually at a fixed annual rate of 2.5% to approximately $93,500 per month in the final year of the Sublease. Our rent was abated for months one through seven of the Sublease. Under the Sublease, we were required to provide the sublessor with a security deposit in the amount of approximately $93,500. Under the new Building 1 Lease our monthly rent payable is approximately $105,000 per month during the first year and increases by approximately $3,000 each year thereafter. The Building 1 Lease allowed us to consolidate all corporate, marketing, finance, administrative, and research and development activities into one building.
In March 2008, we entered into a lease agreement, or the Building 2 Lease, for additional office, engineering, research and development and warehouse and distribution space in Carlsbad, California, or Building 2. The Building 2 Lease term commenced on December 1, 2008 and ends on January 31, 2017. We are obligated under the Building 2 Lease to pay base rent and certain operating costs and taxes for Building 2. The monthly base rent payable for Building 2 was approximately $73,500 during the first year of the Building 2 Lease, increasing annually at a fixed annual rate of 3.0% to approximately $93,000 per month in the final year of the Building 2 Lease. Our rent was abated for the months two through eight of the term of the Lease in the amount of $38,480. Under the Building 2 Lease, we were required to provide the lessor with a security deposit in the amount of $293,200, consisting of cash and/or one or more letters of credit. Following our achievement of certain financial milestones, the lessor is obligated to return a portion of the security deposit to us. The lessor provided a tenant improvement allowance of $1.1 million to assist with the configuration of the facility to meet our business needs. As a result of the restructuring of our manufacturing activities we plan to vacate the premises during 2016.
Off-Balance Sheet Arrangements
As of December 31,
2015
, we did not have any off-balance sheet arrangements.
Critical Accounting Policies and Estimates
Our discussion and analysis of our financial condition and results of operations is based upon our consolidated financial statements, which have been prepared in accordance with accounting principles generally accepted in the U.S. The preparation of these financial statements requires us to make estimates and assumptions that affect the reported amounts of assets, liabilities, revenues, expenses and related disclosures. On an on-going basis, we evaluate our estimates and assumptions, including those related to revenue recognition, allowances for accounts receivable, inventories, goodwill and intangible assets, stock-based compensation and income taxes. We base our estimates on historical experience and on various other assumptions that are believed to be reasonable under the circumstances, the results of which form the basis for making judgments about the carrying values of assets and liabilities that are not readily apparent from other sources. Actual results may differ from these estimates under different assumptions conditions.
We believe the following accounting policies to be critical to the judgments and estimates used in the preparation of our consolidated financial statements.
Revenue Recognition
We recognize revenue when all four of the following criteria are met: (i) persuasive evidence that an arrangement exists; (ii) delivery of the products and/or services has occurred; (iii) the selling price is fixed or determinable; and (iv) collectability is reasonably assured. In addition, we account for revenue under provisions which set forth guidelines for the timing of revenue recognition based upon factors such as passage of title, installation, payment and customer acceptance. Determination of criteria (iii) and (iv) are based on management’s judgment regarding the fixed nature of the fee charged for products delivered and the collectability of those fees. Specifically, our revenue from sales of spinal and other surgical implants is recognized upon receipt of written acknowledgment that the product has been used in a surgical procedure or upon shipment to third-party
50
customers who immediately accept title to such implant. Should changes in conditions cause management to determine these criteria are not met for certain future transactions, revenues recognized for any reporting period could be adversely impacted.
Deferred Revenues
Deferred revenues consist of sales transactions where circumstances indicate that collectability is not reasonably assured due to payment terms, regional market risks, or customer history.
Inventories
Inventories are stated at the lower of cost or market, with cost primarily determined under the first-in, first-out method. We review the components of inventory on a periodic basis for excess, obsolete and impaired inventory, and record a reserve for the identified items. We calculate an inventory reserve for estimated excess and obsolete inventory based upon historical turnover and assumptions about future demand for our products and market conditions. Our biologics product inventories are subject to demand fluctuations based on the availability and demand for alternative implant products. Our estimates and assumptions for excess and obsolete inventory are subject to uncertainty as we are continually reviewing our existing products and introducing new products. Increases in the reserve for excess and obsolete inventory result in a corresponding increase to cost of revenues and establish a new cost basis for the inventory component.
Valuation of Goodwill and Intangible Assets
We assess the impairment of our goodwill and intangible assets annually in December or whenever business conditions change and an earlier impairment indicator arises. This assessment requires us to make assumptions and judgments regarding the carrying value of these assets. These assets are considered to be impaired if we determine that their carrying value may not be recoverable based upon our assessment of certain events or changes in circumstances, including the following:
|
•
|
a determination that the carrying value of such assets cannot be recovered through undiscounted cash flows;
|
|
•
|
loss of legal ownership or title to the assets;
|
|
•
|
significant changes in our strategic business objectives and utilization of the assets; or
|
|
•
|
the impact of significant negative industry or economic trends.
|
If the assets are considered to be impaired, the impairment we recognize is the amount by which the carrying value of the assets exceeds the fair value of the assets. In the third quarter of 2015, the market value of our common stock substantially declined. This decline was considered to be a triggering indicator of potential impairment of our goodwill, and a goodwill impairment test was performed. We analyzed the carrying amount of goodwill for impairment under a two-part test in accordance with authoritative guidance.
We estimate the fair value in step one of the goodwill impairment test based on a combination of the income approach which includes discounted cash flows as well as a market approach that utilizes the market information. The fair value measurements utilized to perform the impairment analysis are categorized within Level 3 of the fair value hierarchy. The discounted cash flow projections require management judgment with respect to forecasted sales, launch of new products, gross margins, selling, general and administrative expenses, capital expenditures and the selection and use of an appropriate discount rate and terminal growth rate. For purposes of calculating the discounted cash flows, in the third quarter of 2015 we used estimated revenue growth rates between 3% and 13% for the discrete forecast period. Cash flows beyond the discrete forecast period were estimated using a terminal value calculation, which incorporated historical and forecasted financial trends and considered long-term earnings growth rates for publicly traded peer companies. Future cash flows were then discounted to present value at a discount rate of 13.5%, and terminal value growth rate of 3%. Our market capitalization is also considered in assessing the reasonableness of the Company’s fair value as determined in step one of the goodwill impairment test. Our assessment resulted in a fair value that was lower than the Company’s carrying value of net assets.
Based on the result of step one of the impairment test, we determined that our goodwill was impaired and step two of the test was performed to measure the amount of goodwill impairment. As a result of step two, in the third quarter of 2015 we recorded a goodwill impairment charge of $164.3 million, representing the write-off of the remaining balance of goodwill.
Significant management judgment is required in the forecast of future operating results that are used in our impairment analysis. The estimates we used are consistent with the plans and estimates that we use to manage our business. Significant assumptions utilized in our income approach model included the growth rate of sales for recently introduced products and the introduction of anticipated new products similar to our historical growth rates. Another important assumption involved in forecasted sales is the projected mix of higher margin U.S. based sales and lower margin non-U.S. based sales. Additionally, we have projected an improvement in our gross margin similar to our historical improvements in gross margins, as a result of
51
forecasted mix in U.S. sales versus non-U.S. based sales and lower manufacturing cost per unit based on the increase in forecasted volume to absorb applied overhead over the next 10 years.
Stock-Based Compensation
We account for stock-based compensation under provisions which require that share-based payment transactions with employees be recognized in the financial statements based on their fair value and recognized as compensation expense over the vesting period. The amount of expense recognized during the period is affected by subjective assumptions, including: estimates of our future volatility, the expected term for our stock options, the number of options expected to ultimately vest, and the timing of vesting for our share-based awards.
We use a Black-Scholes option-pricing model to estimate the fair value of our stock option awards. The calculation of the fair value of the awards using the Black-Scholes option-pricing model is affected by our stock price on the date of grant as well as assumptions regarding the following:
|
•
|
Estimated volatility is a measure of the amount by which our stock price is expected to fluctuate each year during the expected life of the award. Our estimated volatility through December 31,
2015
was based on our actual historical volatility. An increase in the estimated volatility would result in an increase to our stock-based compensation expense.
|
|
•
|
The expected term represents the period of time that awards granted are expected to be outstanding. Our estimated expected term through December 31,
2015
was calculated using a weighted-average term based on historical exercise patterns and the term from option grant date to exercise for the options granted within the specified date range. An increase in the expected term would result in an increase to our stock-based compensation expense.
|
|
•
|
The risk-free interest rate is based on the yield curve of a zero-coupon U.S. Treasury bond on the date the stock option award is granted with a maturity equal to the expected term of the stock option award. An increase in the risk-free interest rate would result in an increase to our stock-based compensation expense.
|
|
•
|
The assumed dividend yield is based on our expectation of not paying dividends in the foreseeable future.
|
We use historical data to estimate the number of future stock option forfeitures. Share-based compensation recorded in our consolidated statement of operations is based on awards expected to ultimately vest and has been reduced for estimated forfeitures. Our estimated forfeiture rates may differ from our actual forfeitures which would affect the amount of expense recognized during the period.
We account for stock option grants to non-employees under provisions which require that the fair value of these instruments be recognized as an expense over the period in which the related services are rendered.
Share-based compensation expense of awards with performance conditions is recognized over the period from the date the performance condition is determined to be probable of occurring through the time the applicable condition is met. Determining the likelihood and timing of achieving performance conditions is a subjective judgment made by management which may affect the amount and timing of expense related to these share-based awards. Share-based compensation is adjusted to reflect the value of options which ultimately vest as such amounts become known in future periods. As a result of these subjective and forward-looking estimates, the actual value of our share-based awards could differ significantly from those amounts recorded in our financial statements.
Stock-based compensation has been classified as follows in the accompanying consolidated statements of operations (in thousands, except per share data):
|
|
Year Ended December 31,
|
|||||||||||
|
|
2015
|
2014
|
2013
|
|||||||||
|
Cost of revenues
|
$
|
72
|
|
$
|
274
|
|
$
|
228
|
|
|||
|
Research and development
|
286
|
|
2,080
|
|
719
|
|
||||||
|
Sales and marketing
|
359
|
|
470
|
|
459
|
|
||||||
|
General and administrative
|
1,926
|
|
1,730
|
|
2,672
|
|
||||||
|
Total
|
$
|
2,643
|
|
$
|
4,554
|
|
$
|
4,078
|
|
|||
|
Effect on basic and diluted net loss per share
|
$
|
(0.03
|
)
|
$
|
(0.05
|
)
|
$
|
(0.04
|
)
|
|||
Income Taxes
We account for income taxes in accordance with provisions which set forth an asset and liability approach that requires the recognition of deferred tax assets and deferred tax liabilities for the expected future tax consequences of temporary
52
differences between the carrying amounts and the tax bases of assets and liabilities. Valuation allowances are established when necessary to reduce deferred tax assets to the amount that is more likely than not expected to be realized. In making such a determination, a review of all available positive and negative evidence must be considered, including scheduled reversal of deferred tax liabilities, projected future taxable income, tax planning strategies, and recent financial performance.
We recognize interest and penalties related to uncertain tax positions as a component of the income tax provision.
Recent Accounting Pronouncements
In May 2014, the Financial Accounting Standards Board, or FASB, issued new accounting guidance related to revenue recognition. This new standard replaces all current U.S. GAAP guidance on this topic and eliminates all industry-specific guidance. The new revenue recognition standard provides a unified model to determine when and how revenue is recognized. The core principle is that a company should recognize revenue to depict the transfer of promised goods or services to customers in an amount that reflects the consideration for which the entity expects to be entitled in exchange for those goods or services. This guidance is effective for the Company beginning January 1, 2018 and can be applied either retrospectively to each period presented or as a cumulative-effect adjustment as of the date of adoption. We are currently evaluating the impact of adopting this new accounting standard on our financial statements.
In August 2014, the FASB issued guidance related to disclosures of uncertainties about an entity’s ability to continue as a going concern. The guidance requires management to evaluate whether there are conditions and events that raise substantial doubt about the entity’s ability to continue as a going concern within one year after the financial statements are issued. Management will be required to make this evaluation for both annual and interim reporting periods and will have to make certain disclosures if it concludes that substantial doubt exists or when its plans alleviate substantial doubt about the entity’s ability to continue as a going concern. Substantial doubt exists when relevant conditions and events, considered in the aggregate, indicate that it is probable that the entity will be unable to meet its obligations as they become due within one year after the date that the financial statements are issued. The guidance is effective for annual periods ending after December 15, 2016 and for interim reporting periods thereafter. We are currently evaluating the impact of this guidance and expect to adopt the standard for the annual reporting period ending December 31, 2016.
In January 2015, the FASB issued new accounting guidance, which eliminates the concept of extraordinary items from GAAP, which required certain classification and presentation of extraordinary items in the income statement and disclosures. The guidance is effective for fiscal years, and interim periods within those fiscal years, beginning after December 15, 2015. We are currently evaluating the impact of adopting this new accounting standard on our financial statements.
In July 2015, the FASB issued new accounting guidance, which changes the measurement principle for inventory from the lower of cost or market to lower of cost and net realizable value for entities that do not measure inventory using the last-in, first-out or retail inventory method. The guidance also eliminates the requirement for these entities to consider replacement cost or net realizable value less an approximately normal profit margin when measuring inventory. The guidance is effective for annual periods beginning after December 15, 2016, and interim periods within those annual periods. We are currently evaluating the impact of adopting this new accounting standard on our financial statements.
In November 2015, the FASB issued new accounting guidance, which will require the presentation of deferred tax liabilities and asset be classified as noncurrent in a classified balance sheet. We have elected to early adopt this guidance during the fourth quarter of 2015. The adoption of this new guidance resulted in a reclassification of our deferred income taxes, net, being presented within other long-term liabilities on our consolidated balance sheet as of December 31, 2015. We did not retrospectively adjust the consolidated balance sheet as of December 31, 2014. The adoption did not have a material effect on the consolidated financial statements and had no impact on net loss.
53
|
Item 7A.
|
Quantitative and Qualitative Disclosures About Market Risk
|
Interest Rate Risk
Our borrowings under our line of credit expose us to market risk related to changes in interest rates. As of December 31,
2015
, our outstanding floating rate indebtedness totaled
$56.8 million
. The primary base interest rate is LIBOR. Assuming the outstanding balance on our floating rate indebtedness remains constant over a year, a 100 basis point increase in the interest rate would decrease pre-tax income and cash flow by approximately $0.6 million. Other outstanding debt consists of fixed rate instruments, including notes payable and capital leases.
Foreign Currency Risk
Our foreign currency exposure continues to grow as we expand internationally. Our exposure to foreign currency transaction gains and losses is the result of certain net receivables due from our foreign subsidiaries and customers being denominated in currencies other than the U.S. dollar, primarily the Euro and Japanese Yen, in which our revenues and profits are denominated. We do not currently engage in hedging or similar transactions to reduce these risks. Fluctuations in currency exchange rates could impact our results of operations, financial position, and cash flows.
Commodity Price Risk
We purchase raw materials that are processed from commodities, such as titanium and stainless steel. These purchases expose us to fluctuations in commodity prices. Given the historical volatility of certain commodity prices, this exposure can impact our product costs. However, because our raw material prices comprise a small portion of our cost of revenues, we have not experienced any material impact on our results of operations from changes in commodity prices. A 10 percent change in commodity prices would not have a material impact on our results of operations for the year ended December 31,
2015
.
Equity Price Risk
In connection with the Facility Agreement with Deerfield, we have issued warrants to purchase 11,450,000 shares of our common stock. We recorded the warrant liability at fair value and adjust the carrying value of these common stock warrants to their estimated fair value at each reporting date, with the increases or decreases in the fair value of such warrants at each reporting date recorded as other income (expense) in our consolidated statement of operations. A 10 percent increase in our stock price from its December 31, 2015 closing price of $0.30 per share would
increase
the fair value of the warrant liability by approximately
$0.1 million
with a corresponding charge to the Statements of Operations.
|
Item 8.
|
Financial Statements and Supplementary Data
|
The consolidated financial statements and supplementary data required by this item are set forth at the pages indicated in Item 15.
|
Item 9.
|
Changes in and Disagreements with Accountants on Accounting and Financial Disclosure
|
Not applicable.
54
|
Item 9A.
|
Controls and Procedures
|
Evaluation of Disclosure Controls and Procedures
We maintain disclosure controls and procedures that are designed to ensure that information required to be disclosed by us in the reports we file or submit pursuant to the Exchange Act, is recorded, processed, summarized and reported within the time periods specified in the SEC’s rules and forms and is accumulated and communicated to our management, including our Chief Executive Officer and Chief Financial Officer, or persons performing similar functions, as appropriate, to allow for timely decisions regarding required disclosure. In designing and evaluating the disclosure controls and procedures, management recognizes that any controls and procedures, no matter how well designed and operated, can provide only reasonable assurance of achieving the desired control objectives, and management is required to apply its judgment in evaluating the cost-benefit relationship of possible controls and procedures.
Under the supervision and with the participation of our management, including our Chief Executive Officer and our Chief Financial Officer, we carried out an evaluation of the effectiveness of the design and operation of our disclosure controls and procedures (as such term is defined in Exchange Act Rules 13a-15(e) and 15d-15(e)) as of the end of the period covered by this Annual Report on Form 10-K. Based on such evaluation, our Chief Executive Officer and Chief Financial Officer concluded that our disclosure controls and procedures were not effective to ensure that information required to be disclosed by us in reports that we file or submit under the Exchange Act, is recorded, processed, summarized and reported, within the time periods specified in the SEC’s rules and forms, and is accumulated and communicated to our management, including our Chief Executive Officer and Chief Financial Officer, or persons performing similar functions, as appropriate to allow timely decisions regarding required disclosure. This conclusion was a result of the material weakness in our internal control over financial reporting as of December 31, 2015 (discussed in paragraphs (b) and (c) of this Item 9A).
Management’s Annual Report on Internal Control Over Financial Reporting
Our management, including our Chief Executive Officer and Chief Financial Officer, is responsible for establishing and maintaining adequate internal control over financial reporting (as defined in Rules 13a-15(f)) and 15d-15(f) under the Exchange Act.
Because of its inherent limitations, internal control over financial reporting may not prevent or detect misstatements. Projections of any evaluation of effectiveness to future periods are subject to the risk that controls may become inadequate because of changes in conditions, or that the degree of compliance with the policies or procedures may deteriorate.
Our management, including our Chief Executive Officer and Chief Financial Officer, has performed an assessment of our internal control over financial reporting described in “Internal Control—Integrated Framework” (2013 framework) issued by the Committee of Sponsoring Organizations of the Treadway Commission. The objective of this assessment was to determine whether our internal control over financial reporting was effective as of December 31,
2015
.
A material weakness is a deficiency, or a combination of deficiencies, in internal control over financial reporting, such that there is a reasonable possibility that a material misstatement of our annual or interim financial statements will not be prevented or detected on a timely basis. In our assessment of the effectiveness of internal control over financial reporting at December 31, 2015, we identified a material weakness related to the design of controls over the release of inventory cost through cost of goods sold at a significant wholly owned subsidiary.
This deficiency results in a reasonable possibility that a material misstatement in our annual or interim consolidated financial statements may not be prevented or detected on a timely basis. Based on our assessment, and because of the material weakness described above, we have concluded that our internal control over financial reporting was not effective at December 31, 2015.
Ernst & Young LLP, our independent registered public accounting firm, has audited our consolidated financial statements included in this Annual Report on Form 10-K and has issued an attestation report on our internal control over financial reporting, which report is included herein.
Material Weakness Discussion and Remediation Measures
To address the material weakness in our internal control over financial reporting described above, we performed additional analyses and other post-closing procedures designed to provide reasonable assurance that our consolidated financial statements were prepared in accordance with generally accepted accounting procedures (GAAP). As a result of these procedures, we believe that the consolidated financial statements included in this Annual Report on Form 10-K for the year ended December 31, 2015 fairly present, in all material respects, our financial position, results of operations and cash flow for the periods presented in conformity with GAAP.
55
To address the material weakness in our internal control over financial reporting described above, we are in the process of developing and implementing new processes and controls. We are also in the process of providing additional training to personnel involved in the costing of inventory at our wholly owned subsidiary.
We intend to continue to take appropriate and reasonable steps to make necessary improvements to remediate the deficiency in our internal controls over financial reporting, including:
·
Designing and evaluating a remediation action for each control deficiency at our wholly-owned subsidiary at which the deficiencies exist, including evaluating the skills of the process owners and resources dedicated to the affected area and adjusting our processes as required.
·
Implementing specific remediation actions, including training process owners and allowing time for process adoption and adequate transaction volume for next steps;
·
Testing and measuring the design and effectiveness of the remediation actions and testing and providing feedback on the design and operating effectiveness of the controls; and,
·
Completing management's review and acceptance of the completion of the remediation effort.
We believe that the remediation measures described above will strengthen our internal control over financial reporting and remediate the material weakness we have identified as of December 31, 2015. We are committed to continuing to improve our internal control processes, and under the direction of the Audit Committee of our Board of Directors, we will continue to develop and implement policies and procedures to improve the overall effectiveness of our internal control over financial reporting. As we continue to evaluate and work to improve our internal control over financial reporting, management may determine to take additional measures to address control deficiencies or determine to modify the remediation plan described above. We expect that our remediation efforts including design, implementation and testing will continue through 2016.
Remediation of Previously Reported Material Weakness
In our Quarterly Reports on Form 10-Q/A for the quarters ended June 30, 2015 and September 30, 2015 filed with the SEC on February 10, 2016, we reported a material weakness in our internal control over financial reporting in which we failed to design effective controls to assess whether we were in compliance with the fixed charge coverage ratio covenant in our Amended Credit Facility with MidCap, which resulted in the restatement of our condensed consolidated balance sheets as of June 30, 2015 and September 30, 2015. To address the material weakness described above, during the first quarter of 2016, we designed and implemented new and enhanced controls to ensure that the calculation of the fixed charge coverage ratio reflects an accurate interpretation of the definitions in the underlying debt agreement and that the appropriate level of review is performed.
We believe that these remediation measures have strengthened our internal control over financial reporting and remediated the material weakness we had identified. We will continue to monitor the effectiveness of these controls and will make any further changes management determines appropriate.
Changes in Internal Control over Financial Reporting
Except for the remediation measures disclosed above, there were no changes in our internal control over financial reporting identified in connection with our evaluation of such internal control that occurred during the quarter ended December 31,
2015
that have materially affected, or are reasonably likely to materially affect, our internal control over financial reporting.
56
REPORT OF INDEPENDENT REGISTERED PUBLIC ACCOUNTING FIRM
The Board of Directors and Stockholders of
Alphatec Holdings, Inc.
We have audited Alphatec Holdings, Inc.’s internal control over financial reporting as of December 31, 2015, based on criteria established in Internal Control-Integrated Framework issued by the Committee of Sponsoring Organizations of the Treadway Commission (2013 framework) (the COSO criteria). Alphatec Holdings, Inc.’s management is responsible for maintaining effective internal control over financial reporting, and for its assessment of the effectiveness of internal control over financial reporting included in the accompanying Management's Annual Report on Internal Control over Financial Reporting. Our responsibility is to express an opinion on the company’s internal control over financial reporting based on our audit.
We conducted our audit in accordance with the standards of the Public Company Accounting Oversight Board (United States). Those standards require that we plan and perform the audit to obtain reasonable assurance about whether effective internal control over financial reporting was maintained in all material respects. Our audit included obtaining an understanding of internal control over financial reporting, assessing the risk that a material weakness exists, testing and evaluating the design and operating effectiveness of internal control based on the assessed risk, and performing such other procedures as we considered necessary in the circumstances. We believe that our audit provides a reasonable basis for our opinion.
A company’s internal control over financial reporting is a process designed to provide reasonable assurance regarding the reliability of financial reporting and the preparation of financial statements for external purposes in accordance with generally accepted accounting principles. A company’s internal control over financial reporting includes those policies and procedures that (1) pertain to the maintenance of records that, in reasonable detail, accurately and fairly reflect the transactions and dispositions of the assets of the company; (2) provide reasonable assurance that transactions are recorded as necessary to permit preparation of financial statements in accordance with generally accepted accounting principles, and that receipts and expenditures of the company are being made only in accordance with authorizations of management and directors of the company; and (3) provide reasonable assurance regarding prevention or timely detection of unauthorized acquisition, use, or disposition of the company’s assets that could have a material effect on the financial statements.
Because of its inherent limitations, internal control over financial reporting may not prevent or detect misstatements. Also, projections of any evaluation of effectiveness to future periods are subject to the risk that controls may become inadequate because of changes in conditions, or that the degree of compliance with the policies or procedures may deteriorate.
A material weakness is a deficiency, or combination of deficiencies, in internal control over financial reporting, such that there is a reasonable possibility that a material misstatement of the company’s annual or interim financial statements will not be prevented or detected on a timely basis. The following material weakness has been identified and included in management’s assessment. Management has identified a material weakness related to the design of controls over the release of inventory cost through cost of goods sold at a significant wholly owned subsidiary. We also have audited, in accordance with the standards of the Public Company Accounting Oversight Board (United States), the consolidated balance sheets of Alphatec Holdings, Inc. as of December 31, 2015 and 2014 and the related consolidated statements of operations, comprehensive loss, stockholders' (deficit) equity and cash flows for each of the three years in the period ended December 31, 2015. This material weakness was considered in determining the nature, timing and extent of audit tests applied in our audit of the 2015 financial statements, and this report does not affect our report dated March 15, 2016, which expressed an unqualified opinion on those financial statements.
In our opinion, because of the effect of the material weakness described above on the achievement of the objectives of the control criteria, Alphatec Holdings, Inc. has not maintained effective internal control over financial reporting as of December 31,
2015
, based on the COSO criteria.
57
We also have audited, in accordance with the standards of the Public Company Accounting Oversight Board (United States), the consolidated balance sheets of Alphatec Holdings, Inc. as of December 31,
2015
and
2014
, the related consolidated statements of operations, comprehensive loss, stockholders’ (deficit) equity and cash flows for each of the three years in the period ended December 31,
2015
of Alphatec Holdings, Inc. and our report dated
March 15, 2016
expressed an unqualified opinion thereon that included an explanatory paragraph regarding Alphatec Holdings, Inc.’s ability to continue as a going concern.
|
/s/ Ernst & Young LLP
|
San Diego, California
March 15, 2016
58
|
Item 9B.
|
Other Information
|
Not applicable.
59
|
Item 10.
|
Directors, Executive Officers and Corporate Governance
|
The information required by Item 10 of this Annual Report on Form 10-K is incorporated by reference from the discussion responsive thereto under the captions “Management,” “Corporate Governance Matters,” “Compliance with Section 16(a) of the Securities Exchange Act of 1934,” and “Code of Conduct and Ethics” in our Proxy Statement for the
2016
Annual Meeting of Stockholders.
|
Item 11.
|
Executive Compensation
|
The information required by Item 11 of this Annual Report on Form 10-K is incorporated by reference from the discussion responsive thereto under the captions “Executive Officer and Director Compensation,” “Compensation Discussion and Analysis,” “Compensation Committee Interlocks and Insider Participation,” “Compensation Committee Report,” and “Compensation Practices and Policies Relating to Risk Management” in our Proxy Statement for the
2016
Annual Meeting of Stockholders.
|
Item 12.
|
Security Ownership of Certain Beneficial Owners and Management and Related Stockholder Matters
|
The information required by Item 12 of this Annual Report on Form 10-K is incorporated by reference from the discussion responsive thereto under the captions “Security Ownership of Certain Beneficial Owners and Management” and “Equity Compensation Plan Information” and the planned proposal entitled “Adoption of Equity Incentive Plan” in our Proxy Statement for the
2016
Annual Meeting of Stockholders.
|
Item 13.
|
Certain Relationships and Related Transactions, and Director Independence
|
The information required by Item 13 of this Annual Report on Form 10-K is incorporated by reference from the discussion responsive thereto under the captions “Certain Relationships and Related Transactions,” “Management” and “Corporate Governance Matters” in our Proxy Statement for the
2016
Annual Meeting of Stockholders.
|
Item 14.
|
Principal Accounting Fees and Services
|
The information required by Item 14 of this Annual Report on Form 10-K is incorporated by reference from the discussion responsive thereto under the caption “Independent Public Accountants” in our Proxy Statement for the
2016
Annual Meeting of Stockholders.
60
|
Item 15.
|
Exhibits, Financial Statement Schedules
|
(1) Financial Statements:
|
|
Page
|
(2) Financial Statement Schedules:
All other financial statement schedules have been omitted because they are not applicable, not required or the information required is included in the consolidated financial statements or the notes thereto.
The following is a list of exhibits filed as part of this Annual Report on Form 10-K.
|
Exhibit
Number
|
|
Exhibit Description
|
|
Filed
with this
Report
|
|
Incorporated by
Reference herein
from Form or
Schedule
|
|
Filing
Date
|
|
SEC File/
Reg.
Number
|
|
3.1
|
|
Restated Certificate of Incorporation
|
|
|
Amendment No. 2 to
Form S-1
(Exhibit 3.2)
|
|
04/20/06
|
|
333-131609
|
|
|
3.2
|
|
Restated Bylaws
|
|
|
Amendment No. 5 to
Form S-1
(Exhibit 3.4)
|
|
05/26/06
|
|
333-131609
|
|
|
4.1
|
|
Form of Common Stock Certificate
|
|
|
Form 10-K
(Exhibit 4.1)
|
03/20/14
|
333-131609
|
|||
|
4.2
|
|
Corporate Governance Agreement, dated December 17, 2009, between the Company and certain shareholders of Scient’x Groupe S.A.S. and Scient’x S.A.
|
|
|
Form 8-K
(Exhibit 10.1)
|
|
12/22/09
|
|
000-52024
|
|
|
4.3
|
|
Registration Rights Agreement, dated March 26, 2010, by and among Alphatec Holdings, Inc. and the other signatories thereto
|
|
|
Form 8-K
(Exhibit 4.1)
|
|
03/31/10
|
|
000-52024
|
|
|
4.4
|
|
Warrant with Silicon Valley Bank as the Warrantholder, dated December 16, 2011
|
|
|
Form 10-K
(Exhibit 4.8)
|
|
03/05/12
|
|
000-52024
|
|
61
|
Exhibit
Number
|
|
Exhibit Description
|
|
Filed
with this
Report
|
|
Incorporated by
Reference herein
from Form or
Schedule
|
|
Filing
Date
|
|
SEC File/
Reg.
Number
|
|
4.5
|
Form of Warrant to Purchase Common Stock issued to
each of Deerfield Private Design Fund II, L.P., Deerfield Private Design International II, L.P., Deerfield Special Situations Fund, L.P. and Deerfield Special Situations International Master Fund, L.P. (collectively, “
Deerfield
”) on each of March 17, 2014 and November 21, 2014.
|
Form 8-K
(Exhibit 4.1)
|
03/19/14
|
000-52024
|
||||||
|
4.6
|
Registration Rights Agreement, dated March 17, 2014, by and among Alphatec Holdings, Inc., Deerfield Private Design Fund II, L.P., Deerfield Private Design International II, L.P., Deerfield Special Situations Fund, L.P. and Deerfield Special Situations International Master Fund, L.P.
|
Form 8-K
(Exhibit 4.2)
|
03/19/14
|
000-52024
|
||||||
|
|
Real Property Lease Agreements
|
|||||||||
|
10.1
|
|
Standard Industrial Lease (Net) by and between Alphatec Holdings, Inc. and H.G. Fenton Property Company, dated as of January 30, 2008
|
|
|
Form 10-Q
(Exhibit 10.2)
|
|
05/12/08
|
|
000-52024
|
|
|
10.2
|
|
Lease Agreement by and between Alphatec Holdings, Inc. and Fenton Property Company., dated as of January 21, 2016
|
|
X
|
|
|||||
|
|
Loan Agreements
|
|
|
|
|
|||||
|
10.3†
|
|
Amended and Restated Credit, Security and Guaranty Agreement dated August 30, 2013 by and among Alphatec Holdings, Inc., Alphatec Spine, Inc., Alphatec International LLC, Alphatec Pacific, Inc. and MidCap Funding IV, LLC
|
|
|
Form 10-Q/A (Exhibit 10.1)
|
10/21/15
|
000-52024
|
|||
|
10.4†
|
First Amendment to Amended and Restated Credit, Security and Guaranty Agreement, dated March 17, 2014, with MidCap Funding IV, LLC as Administrative Agent and lender and other lenders from time to time a party thereto
|
Form 8-K/A
(Exhibit 10.3)
|
10/21/15
|
000-52024
|
||||||
|
10.5†
|
Second Amendment to the Amended and Restated Credit, Security and Guaranty Agreement, dated July 10, 2015, with MidCap Funding IV Trust, as a lender and other lenders from time to time a party thereto
|
Form 10-Q (Exhibit 10.1)
|
11/03/15
|
000-52024
|
||||||
|
10.6
|
Amended and Restated Term Loan Note, dated July 10, 2015, with MidCap Funding IV Trust
|
Form 10-Q (Exhibit 10.3)
|
11/03/15
|
000-52024
|
||||||
|
10.7†
|
Facility Agreement, dated March 17, 2014, by and among Alphatec Holdings, Inc., Deerfield Private Design Fund II, L.P., Deerfield Private Design International II, L.P., Deerfield Special Situations Fund, L.P., and Deerfield Special Situations International Master Fund, L.P.
|
Form 8-K/A (Exhibit 10.1)
|
10/21/15
|
000-52024
|
||||||
62
|
Exhibit
Number
|
|
Exhibit Description
|
|
Filed
with this
Report
|
|
Incorporated by
Reference herein
from Form or
Schedule
|
|
Filing
Date
|
|
SEC File/
Reg.
Number
|
|
10.8
|
First Amendment to the Facility Agreement, dated July 10, 2015, by and among Alphatec Holdings, Inc., Deerfield Private Design Fund II, L.P., Deerfield Private Design International II, L.P., and Deerfield Special Situations Fund, L.P.
|
Form 10-Q (Exhibit 10.2)
|
10/03/15
|
000-52024
|
||||||
|
10.9
|
Guaranty and Security Agreement, dated March 17, 2014 by and among Alphatec Holdings, Inc., Alphatec Spine, Inc., Alphatec International LLC, Alphatec Pacific, Inc., Deerfield Private Design Fund II, L.P., Deerfield Private Design International II, L.P., Deerfield Special Situations Fund, L.P., and Deerfield Special Situations International Master Fund, L.P.
|
Form 8-K (Exhibit 10.2)
|
03/19/14
|
000-52024
|
||||||
|
Agreements with Respect to Collaborations, Licenses, Research and Development
|
||||||||||
|
10.10†
|
Supply Agreement by and between Alphatec Spine, Inc. and Invibio, Inc., dated as of October 18, 2004 and amended by Letter of Amendment in respect of the Supply Agreement, dated as of December 13, 2004
|
|
|
Amendment No. 4 to
Form S-1
(Exhibit 10.29)
|
|
05/15/06
|
|
333-131609
|
||
|
10.11†
|
Letter Amendment between Alphatec Spine, Inc. and Invibio, Inc., dated November 24, 2010
|
Form 10-Q
(Exhibit 10.3) |
05/06/11
|
000-52024
|
||||||
|
10.12†
|
Exclusive License Agreement by and between Alphatec Spine, Inc. and Stout Medical Group, LP, dated as of September 11, 2007
|
Form 10-Q
(Exhibit 10.2)
|
11/09/07
|
000-52024
|
||||||
|
10.13†
|
First Amendment to the Exclusive License Agreement, effective March 31, 2009 between Alphatec Spine, Inc. and Stout Medical Group LP
|
Form 10-Q
(Exhibit 10.4)
|
05/05/09
|
000-52024
|
||||||
|
10.14†
|
Amendment to the Exclusive License Agreement dated August 1, 2014 between Alphatec Spine, Inc. and Stout Medical Group, L.P.
|
Form 10-Q
(Exhibit 10.
|
10/30/14
|
000-52024
|
||||||
|
10.15†
|
Collaboration Agreement by and among Alphatec Spine, Inc., Elite Medical Holdings, LLC and Pac 3 Surgical Products, LLC, dated as of October 22, 2013
|
Form 10-K
(Exhibit 10.26)
|
03/20/14
|
333-18790
|
||||||
|
10.16
|
First Amendment to the Collaboration Agreement by and among Alphatec Spine, Inc., Elite Medical Holdings, LLC and Pac 3 Surgical Products, LLC, dated November 2, 2015
|
X
|
||||||||
|
Agreements with Officers and Directors
|
||||||||||
|
10.17*
|
Employment Agreement by and among Alphatec Spine, Inc., Alphatec Holdings, Inc. and Michael O’Neill, dated October 11, 2010
|
Form 10-Q
(Exhibit 10.2) |
11/08/10
|
000-52024
|
||||||
|
10.18*
|
Employment Agreement, dated February 26, 2012, by and among Alphatec Holdings, Inc., Alphatec Spine, Inc, and Leslie Cross
|
Form 10-Q
(Exhibit 10.1) |
05/08/12
|
000-52024
|
||||||
63
|
Exhibit
Number
|
|
Exhibit Description
|
|
Filed
with this
Report
|
|
Incorporated by
Reference herein
from Form or
Schedule
|
|
Filing
Date
|
|
SEC File/
Reg.
Number
|
|
10.19*
|
Amendment to the Employment Agreement by and among Les Cross, Alphatec Holdings, Inc. and Alphatec Spine, Inc., dated May 1, 2014
|
Form 10-K (Exhibit 10.23)
|
02/27/15
|
000-52024
|
||||||
|
10.20*
|
Employment Agreement by and between Alphatec Spine, Inc. and Mitsuo Asai, dated February 17, 2014
|
Form 10-Q
(Exhibit 10.5) |
05/01/14
|
000-52024
|
||||||
|
10.21*
|
Amended and Restated Employment Agreement by and among Alphatec Holdings, Inc., Alphatec Spine, Inc. and Ebun S. Garner, Esq., dated July 17, 2006
|
Form 10-K
(Exhibit 10.20) |
03/07/08
|
000-52024
|
||||||
|
10.22*
|
Employment Agreement by and among James M. Corbett, Alphatec Holdings, Inc. and Alphatec Spine, Inc., dated April 25, 2014
|
Form 10-Q
(Exhibit 10.1)
|
07/31/14
|
000-52024
|
||||||
|
10.23*
|
Employment Agreement by and among Michael Plunkett, Alphatec Spine, Inc., and Alphatec Holdings, Inc., dated February 17, 2014
|
Form 10-Q
(Exhibit 10.4)
|
05/01/14
|
000-52024
|
||||||
|
10.24*
|
Form of Indemnification Agreement entered into with each of the Company’s non-employee directors
|
Form 10-Q
(Exhibit 10.5) |
05/05/09
|
000-52024
|
||||||
|
10.25*
|
Vesting Acceleration Agreement by and between James Glynn and Alphatec Holdings, Inc., dated November 2, 2015
|
X
|
||||||||
|
|
Equity Compensation Plans
|
|||||||||
|
10.26*
|
|
Amended and Restated 2005 Employee, Director and Consultant Stock Plan
|
|
|
Form S-8
(Exhibit 99.1)
|
|
03/23/13
|
|
333-187190
|
|
|
10.27*
|
Amendment to the Amended and Restated 2005 Employee, Director and Consultant Stock Plan
|
Schedule 14A (Appendix B)
|
06/11/13
|
000-52024
|
||||||
|
10.28*
|
Amendment to the Alphatec Holdings, Inc. Amended and Restated 2005 Employee, Director and Consultant Stock Plan
|
Form 10-Q
(Exhibit 10.1)
|
10/30/14
|
000-52024
|
||||||
|
10.29*
|
|
Form of Non-Qualified Stock Option Agreement issued under the Amended and Restated 2005 Stock Plan
|
|
|
Form 10-K
(Exhibit 10.40) |
|
03/05/13
|
|
000-52024
|
|
|
10.30*
|
|
Form of Incentive Stock Option Agreement issued under the Amended and Restated 2005 Stock Plan
|
|
|
Form 10-K
(Exhibit 10.41) |
|
03/05/13
|
|
000-52024
|
|
|
10.31*
|
|
Form of Restricted Stock Agreement issued under the Amended and Restated 2005 Stock Plan
|
|
|
Form 10-K
(Exhibit 10.42) |
|
03/05/14
|
|
000-52024
|
|
|
10.32*
|
Form of Performance-Based Restricted Unit Agreement issued under the Amended and Restated 2005 Employee, Director and Consultant Stock Plan, as amended.
|
Form 10-Q
(Exhibit 10.2)
|
10/30/14
|
000-52024
|
||||||
|
10.33*
|
Amended 2007 Employee Stock Purchase Plan
|
Schedule 14A (Appendix C)
|
06/11/13
|
000-52024
|
||||||
64
|
Exhibit
Number
|
|
Exhibit Description
|
|
Filed
with this
Report
|
|
Incorporated by
Reference herein
from Form or
Schedule
|
|
Filing
Date
|
|
SEC File/
Reg.
Number
|
|
10.34*
|
|
Summary of the Alphatec Holdings, Inc. 2015 Discretionary Bonus Plan
|
|
|
Form 10-Q
(Exhibit 10.1)
|
|
05/01/15
|
|
000-52024
|
|
|
Settlement Agreements
|
||||||||||
|
10.35
|
Settlement and Release Agreement, dated as of August 13, 2014, by and among Alphatec Holdings, Inc. and its direct and indirect subsidiaries and affiliates, Orthotec, LLC, Patrick Bertranou and the other parties named therein
|
Form 10-Q
(Exhibit 10.3)
|
10/30/14
|
000-52024
|
||||||
|
21.1
|
|
Subsidiaries of the Registrant and Wholly Owned Subsidiaries of the Registrant's Subsidiaries
|
|
X
|
|
|
|
|||
|
23.1
|
|
Consent of Independent Registered Public Accounting Firm
|
|
X
|
|
|
|
|||
|
31.1
|
|
Certification of Principal Executive Officer pursuant to Section 302 of the Sarbanes-Oxley Act of 2002
|
|
X
|
|
|
|
|||
|
31.2
|
|
Certification of Principal Financial Officer pursuant to Section 302 of the Sarbanes-Oxley Act of 2002
|
|
X
|
|
|
|
|||
|
32
|
|
Certification pursuant to 18 U.S.C. 1350, as adopted pursuant to Section 906 of the Sarbanes-Oxley Act of 2002
|
|
X
|
|
|
|
|||
|
101.1
|
|
XBRL Instance Document**
|
|
|
|
|
||||
|
101.2
|
|
XBRL Taxonomy Extension Schema Document**
|
|
|
|
|
||||
|
101.3
|
|
XBRL Taxonomy Extension Calculation Linkbase Document**
|
|
|
|
|
||||
|
101.4
|
|
XBRL Taxonomy Extension Definition Linkbase Document**
|
|
|
|
|
||||
|
101.5
|
|
XBRL Taxonomy Extension Label Linkbase Document**
|
|
|
|
|
||||
|
101.6
|
|
XBRL Taxonomy Extension Presentation Linkbase Document**
|
|
|
|
|
||||
|
(*)
|
Management contract or compensatory plan or arrangement.
|
|
(†)
|
Confidential treatment has been granted by the Securities and Exchange Commission as to certain portions.
|
|
(**)
|
Confidential treatment is being requested as to certain portions of this exhibit.
|
65
SIGNATURES
Pursuant to the requirements of Section 13 or 15(d) of the Securities Exchange Act of 1934, the registrant has duly caused this report to be signed on its behalf by the undersigned, thereunto duly authorized.
|
|
|
ALPHATEC HOLDINGS, INC.
|
|||
|
Dated:
|
March 15, 2016
|
|
By:
|
|
/
S
/ JAMES M. CORBETT
|
|
|
Name:
|
|
James M. Corbett
|
||
|
|
Title:
|
|
President and Chief Executive Officer
|
||
|
|
|
(principal executive officer)
|
|||
Pursuant to the requirements of the Securities Exchange Act of 1934, this report has been signed below by the following persons on behalf of the registrant and in the capacities and on the dates indicated:
|
Signature
|
|
Title
|
|
Date
|
|
/S/ JAMES M. CORBETT
|
|
President and Chief Executive Officer and Director (principal executive officer)
|
|
March 15, 2016
|
|
James M. Corbett
|
||||
|
/S/ MICHAEL O’NEILL
|
|
Chief Financial Officer, Vice President and Treasurer (principal financial officer and principal accounting officer)
|
|
March 15, 2016
|
|
Michael O’Neill
|
||||
|
/S/ LESLIE H. CROSS
|
Chairman of the Board of Directors
|
March 15, 2016
|
||
|
Leslie H. Cross
|
||||
|
/S/ MORTIMER BERKOWITZ III
|
|
Chairman of the Executive Committee of the Board of Directors
|
|
March 15, 2016
|
|
Mortimer Berkowitz III
|
||||
|
/S/ TOM C. DAVIS
|
|
Director
|
|
March 15, 2016
|
|
Tom C. Davis
|
||||
|
/S/ SIRI S. MARSHALL
|
|
Director
|
|
March 15, 2016
|
|
Siri S. Marshall
|
||||
|
/S/ R. IAN MOLSON
|
|
Director
|
|
March 15, 2016
|
|
R. Ian Molson
|
||||
|
/S/ STEPHEN E. O’NEIL
|
|
Director
|
|
March 15, 2016
|
|
Stephen E. O’Neil
|
||||
|
/S/ DONALD A. WILLIAMS
|
|
Director
|
|
March 15, 2016
|
|
Donald A. Williams
|
||||
66
ALPHATEC HOLDINGS, INC.
INDEX TO CONSOLIDATED FINANCIAL STATEMENTS
|
|
Page
|
F-1
REPORT OF INDEPENDENT REGISTERED PUBLIC ACCOUNTING FIRM
The Board of Directors and Stockholders of
Alphatec Holdings, Inc.
We have audited the accompanying consolidated balance sheets of Alphatec Holdings, Inc. as of December 31,
2015
and
2014
, and the related consolidated statements of operations, comprehensive loss, stockholders’ equity, and cash flows for each of the three years in the period ended December 31,
2015
. Our audits also included the financial statement schedule listed in the Index at Item 15(a)(2). These financial statements and schedule are the responsibility of the Company's management. Our responsibility is to express an opinion on these financial statements and schedule based on our audits.
We conducted our audits in accordance with the standards of the Public Company Accounting Oversight Board (United States). Those standards require that we plan and perform the audit to obtain reasonable assurance about whether the financial statements are free of material misstatement. An audit includes examining, on a test basis, evidence supporting the amounts and disclosures in the financial statements. An audit also includes assessing the accounting principles used and significant estimates made by management, as well as evaluating the overall financial statement presentation. We believe that our audits provide a reasonable basis for our opinion.
In our opinion, the financial statements referred to above present fairly, in all material respects, the consolidated financial position of Alphatec Holdings, Inc., at December 31,
2015
and
2014
, and the consolidated results of its operations and its cash flows for each of the three years in the period ended December 31,
2015
, in conformity with U.S. generally accepted accounting principles. Also, in our opinion, the related financial statement schedule, when considered in relation to the basic financial statements taken as a whole, presents fairly in all material respects the information set forth therein.
The accompanying consolidated financial statements have been prepared assuming that the Company will continue as a going concern. As discussed in Note 1 to the financial statements, the Company has recurring operating losses and has a working capital deficiency. In addition, the Company has not complied with certain covenants of loan agreements with its lenders and has significant debt obligations due in December 2016. These conditions raise substantial doubt about the Company’s ability to continue as a going concern. Management’s plans in regard to these matters also are described in Note 1. The 2015 consolidated financial statements do not include any adjustments to reflect the possible future effects on the recoverability and classification of assets or the amounts and classification of liabilities that may result from the outcome of this uncertainty.
We also have audited, in accordance with the standards of the Public Company Accounting Oversight Board (United States), Alphatec Holdings, Inc.’s internal control over financial reporting as of December 31,
2015
, based on criteria established in Internal Control-Integrated Framework issued by the Committee of Sponsoring Organizations of the Treadway Commission (2013 framework) and our report dated
March 15, 2016
expressed an adverse opinion thereon.
/s/ Ernst & Young LLP
San Diego, California
March 15, 2016
F-2
ALPHATEC HOLDINGS, INC.
CONSOLIDATED BALANCE SHEETS
(In thousands, except par value data)
|
|
December 31,
|
||||||
|
|
2015
|
2014
|
|||||
|
Assets
|
|||||||
|
Current assets:
|
|||||||
|
Cash
|
$
|
11,229
|
|
$
|
19,735
|
|
|
|
Restricted cash
|
2,350
|
|
4,400
|
|
|||
|
Accounts receivable, net
|
38,319
|
|
40,440
|
|
|||
|
Inventories, net
|
44,908
|
|
41,747
|
|
|||
|
Prepaid expenses and other current assets
|
5,052
|
|
5,466
|
|
|||
|
Deferred income tax assets
|
—
|
|
1,324
|
|
|||
|
Total current assets
|
101,858
|
|
113,112
|
|
|||
|
Property and equipment, net
|
21,945
|
|
26,040
|
|
|||
|
Goodwill
|
—
|
|
171,333
|
|
|||
|
Intangibles, net
|
21,616
|
|
30,259
|
|
|||
|
Other assets
|
1,285
|
|
4,179
|
|
|||
|
Total assets
|
$
|
146,704
|
|
$
|
344,923
|
|
|
|
Liabilities and Stockholders’ (Deficit) Equity
|
|||||||
|
Current liabilities:
|
|||||||
|
Accounts payable
|
$
|
14,169
|
|
$
|
10,130
|
|
|
|
Accrued expenses
|
29,791
|
|
35,393
|
|
|||
|
Deferred revenue
|
648
|
|
1,300
|
|
|||
|
Common stock warrant liabilities
|
687
|
|
8,702
|
|
|||
|
Current portion of long-term debt
|
80,105
|
|
8,076
|
|
|||
|
Total current liabilities
|
125,400
|
|
63,601
|
|
|||
|
Long-term debt, less current portion
|
480
|
|
74,597
|
|
|||
|
Other long-term liabilities
|
33,797
|
|
32,220
|
|
|||
|
Deferred income tax liabilities
|
—
|
|
1,948
|
|
|||
|
Redeemable preferred stock, $0.0001 par value; 20,000 authorized at December 31, 2015 and 2014; 3,319 shares issued and outstanding at both December 31, 2015 and 2014
|
23,603
|
|
23,603
|
|
|||
|
Commitments and contingencies
|
|
|
|||||
|
Stockholders’ (deficit) equity:
|
|||||||
|
Common stock, $0.0001 par value; 200,000 authorized; 102,158 and 99,856 shares issued and outstanding at December 31, 2015 and 2014, respectively
|
10
|
|
10
|
|
|||
|
Treasury stock, 19 shares
|
(97
|
)
|
(97
|
)
|
|||
|
Additional paid-in capital
|
416,939
|
|
413,921
|
|
|||
|
Shareholder note receivable
|
(5,000
|
)
|
(5,000
|
)
|
|||
|
Accumulated other comprehensive loss
|
(21,188
|
)
|
(11,316
|
)
|
|||
|
Accumulated deficit
|
(427,240
|
)
|
(248,564
|
)
|
|||
|
Total stockholders’ (deficit) equity
|
(36,576
|
)
|
148,954
|
|
|||
|
Total liabilities and stockholders’ (deficit) equity
|
$
|
146,704
|
|
$
|
344,923
|
|
|
See accompanying notes to consolidated financial statements.
F-3
ALPHATEC HOLDINGS, INC.
CONSOLIDATED STATEMENTS OF OPERATIONS
(In thousands, except per share amounts)
|
|
Year Ended December 31,
|
||||||||||
|
|
2015
|
2014
|
2013
|
||||||||
|
Revenues
|
$
|
185,279
|
|
$
|
206,980
|
|
$
|
204,724
|
|
||
|
Cost of revenues
|
63,742
|
|
61,834
|
|
78,669
|
|
|||||
|
Amortization of acquired intangible assets
|
1,453
|
|
1,736
|
|
1,733
|
|
|||||
|
Gross profit
|
120,084
|
|
143,410
|
|
124,322
|
|
|||||
|
Operating expenses:
|
|||||||||||
|
Research and development
|
17,767
|
|
16,799
|
|
14,190
|
|
|||||
|
In-process research and development
|
274
|
|
527
|
|
—
|
|
|||||
|
Sales and marketing
|
70,856
|
|
77,179
|
|
76,960
|
|
|||||
|
General and administrative
|
34,867
|
|
43,381
|
|
47,949
|
|
|||||
|
Amortization of acquired intangible assets
|
2,400
|
|
2,974
|
|
3,009
|
|
|||||
|
Goodwill and intangible assets impairment
|
165,171
|
|
—
|
|
—
|
|
|||||
|
Restructuring expenses
|
1,188
|
|
706
|
|
9,665
|
|
|||||
|
Litigation settlement expenses
|
—
|
|
—
|
|
45,982
|
|
|||||
|
Total operating expenses
|
292,523
|
|
141,566
|
|
197,755
|
|
|||||
|
Operating (loss) income
|
(172,439
|
)
|
1,844
|
|
(73,433
|
)
|
|||||
|
Other income (expense):
|
|||||||||||
|
Interest income
|
53
|
|
10
|
|
6
|
|
|||||
|
Interest expense
|
(12,589
|
)
|
(13,616
|
)
|
(3,959
|
)
|
|||||
|
Other income (expense), net
|
6,980
|
|
(33
|
)
|
(1,662
|
)
|
|||||
|
Total other income (expense)
|
(5,556
|
)
|
(13,639
|
)
|
(5,615
|
)
|
|||||
|
Loss before income taxes
|
(177,995
|
)
|
(11,795
|
)
|
(79,048
|
)
|
|||||
|
Income tax provision
|
681
|
|
1,087
|
|
3,179
|
|
|||||
|
Net loss
|
$
|
(178,676
|
)
|
$
|
(12,882
|
)
|
$
|
(82,227
|
)
|
||
|
Net loss per basic share
|
$
|
(1.79
|
)
|
$
|
(0.13
|
)
|
$
|
(0.85
|
)
|
||
|
Net loss per diluted share
|
$
|
(1.79
|
)
|
$
|
(0.16
|
)
|
$
|
(0.85
|
)
|
||
|
Shares used in calculating basic net loss per share
|
99,574
|
|
97,347
|
|
96,235
|
|
|||||
|
Shares used in calculating diluted net loss per share
|
99,574
|
|
97,735
|
|
96,235
|
|
|||||
See accompanying notes to consolidated financial statements.
F-4
ALPHATEC HOLDINGS, INC.
CONSOLIDATED STATEMENTS OF COMPREHENSIVE LOSS
(in thousands)
|
|
Year Ended
December 31,
|
||||||||||
|
|
2015
|
2014
|
2013
|
||||||||
|
Net loss
|
$
|
(178,676
|
)
|
$
|
(12,882
|
)
|
$
|
(82,227
|
)
|
||
|
Foreign currency translation adjustments
|
(9,872
|
)
|
(15,193
|
)
|
3,765
|
|
|||||
|
Comprehensive loss
|
$
|
(188,548
|
)
|
$
|
(28,075
|
)
|
$
|
(78,462
|
)
|
||
See accompanying notes to consolidated financial statements.
F-5
ALPHATEC HOLDINGS, INC.
CONSOLIDATED STATEMENTS OF STOCKHOLDERS’ (DEFICIT) EQUITY
(In thousands)
|
|
Common stock
|
Additional
paid-in
capital
|
Shareholder
note receivable |
Treasury
stock
|
Accumulated
other
comprehensive
income (loss)
|
Accumulated
deficit
|
Total
stockholders’
(deficit) equity
|
|||||||||||||||||||||||
|
|
Shares
|
Amount
|
||||||||||||||||||||||||||||
|
Balance at December 31, 2012
|
96,703
|
|
$
|
10
|
|
$
|
399,246
|
|
$
|
—
|
|
$
|
(97
|
)
|
$
|
112
|
|
$
|
(153,455
|
)
|
$
|
245,816
|
|
|||||||
|
Stock-based compensation
|
—
|
|
—
|
|
2,590
|
|
—
|
|
—
|
|
—
|
|
—
|
|
2,590
|
|
||||||||||||||
|
Exercise of stock options
|
6
|
|
—
|
|
8
|
|
—
|
|
—
|
|
—
|
|
—
|
|
8
|
|
||||||||||||||
|
Repurchase and/or forfeiture of common stock
|
(142
|
)
|
—
|
|
(172
|
)
|
—
|
|
—
|
|
—
|
|
—
|
|
(172
|
)
|
||||||||||||||
|
Shares issued for consulting services
|
354
|
|
—
|
|
1,488
|
|
—
|
|
—
|
|
—
|
|
—
|
|
1,488
|
|
||||||||||||||
|
Issuance of common stock in connection with license agreements
|
130
|
|
—
|
|
250
|
|
—
|
|
—
|
|
—
|
|
—
|
|
250
|
|
||||||||||||||
|
Forfeiture of common stock in connection with business acquisition
|
(328
|
)
|
—
|
|
(561
|
)
|
—
|
|
—
|
|
—
|
|
—
|
|
(561
|
)
|
||||||||||||||
|
Issuance of common stock for employee stock purchase plan
|
500
|
|
—
|
|
719
|
|
—
|
|
—
|
|
—
|
|
—
|
|
719
|
|
||||||||||||||
|
Issuance of common stock for restricted share awards granted to employees
|
376
|
|
—
|
|
—
|
|
—
|
|
—
|
|
—
|
|
—
|
|
—
|
|
||||||||||||||
|
Foreign currency translation adjustments
|
—
|
|
—
|
|
—
|
|
—
|
|
—
|
|
3,765
|
|
—
|
|
3,765
|
|
||||||||||||||
|
Net loss
|
—
|
|
—
|
|
—
|
|
—
|
|
—
|
|
—
|
|
(82,227
|
)
|
(82,227
|
)
|
||||||||||||||
|
Balance at December 31, 2013
|
97,599
|
|
10
|
|
403,568
|
|
—
|
|
(97
|
)
|
3,877
|
|
(235,682
|
)
|
171,676
|
|
||||||||||||||
|
Stock-based compensation
|
—
|
|
—
|
|
2,690
|
|
—
|
|
—
|
|
—
|
|
—
|
|
2,690
|
|
||||||||||||||
|
Exercise of stock options
|
21
|
|
—
|
|
29
|
|
—
|
|
—
|
|
—
|
|
—
|
|
29
|
|
||||||||||||||
|
Repurchase and/or forfeiture of common stock
|
(266
|
)
|
—
|
|
(3
|
)
|
—
|
|
—
|
|
—
|
|
—
|
|
(3
|
)
|
||||||||||||||
|
Shares issued for consulting services
|
1,327
|
|
—
|
|
1,864
|
|
—
|
|
—
|
|
—
|
|
—
|
|
1,864
|
|
||||||||||||||
|
Issuance of common stock for employee stock purchase plan
|
608
|
|
—
|
|
671
|
|
—
|
|
—
|
|
—
|
|
—
|
|
671
|
|
||||||||||||||
|
Issuance of common stock for restricted share awards granted to employees
|
493
|
|
—
|
|
—
|
|
—
|
|
—
|
|
—
|
|
—
|
|
—
|
|
||||||||||||||
|
Shareholder note receivable
|
—
|
|
—
|
|
5,000
|
|
(5,000
|
)
|
—
|
|
—
|
|
—
|
|
—
|
|
||||||||||||||
|
Issuance of common stock for acquired technology
|
74
|
|
—
|
|
102
|
|
—
|
|
—
|
|
—
|
|
—
|
|
102
|
|
||||||||||||||
|
Foreign currency translation adjustments
|
—
|
|
—
|
|
—
|
|
—
|
|
—
|
|
(15,193
|
)
|
—
|
|
(15,193
|
)
|
||||||||||||||
|
Net loss
|
—
|
|
—
|
|
—
|
|
—
|
|
—
|
|
—
|
|
(12,882
|
)
|
(12,882
|
)
|
||||||||||||||
|
Balance at December 31, 2014
|
99,856
|
|
10
|
|
413,921
|
|
(5,000
|
)
|
(97
|
)
|
(11,316
|
)
|
(248,564
|
)
|
148,954
|
|
||||||||||||||
|
Stock-based compensation
|
—
|
|
—
|
|
2,562
|
|
—
|
|
—
|
|
—
|
|
—
|
|
2,562
|
|
||||||||||||||
|
Exercise of stock options
|
5
|
|
—
|
|
—
|
|
—
|
|
—
|
|
—
|
|
—
|
|
—
|
|
||||||||||||||
|
Repurchase and/or forfeiture of common stock
|
(261
|
)
|
—
|
|
—
|
|
—
|
|
—
|
|
—
|
|
—
|
|
—
|
|
||||||||||||||
|
Shares issued for consulting services
|
1,325
|
|
—
|
|
81
|
|
—
|
|
—
|
|
—
|
|
—
|
|
81
|
|
||||||||||||||
|
Issuance of common stock for employee stock purchase plan
|
868
|
|
—
|
|
375
|
|
—
|
|
—
|
|
—
|
|
—
|
|
375
|
|
||||||||||||||
|
Issuance of common stock for restricted share awards granted to employees
|
292
|
|
—
|
|
—
|
|
—
|
|
—
|
|
—
|
|
—
|
|
—
|
|
||||||||||||||
|
Issuance of common stock for acquired technology
|
73
|
|
—
|
|
—
|
|
—
|
|
—
|
|
—
|
|
—
|
|
—
|
|
||||||||||||||
|
Foreign currency translation adjustments
|
—
|
|
—
|
|
—
|
|
—
|
|
—
|
|
(9,872
|
)
|
—
|
|
(9,872
|
)
|
||||||||||||||
|
Net loss
|
—
|
|
—
|
|
—
|
|
—
|
|
—
|
|
—
|
|
(178,676
|
)
|
(178,676
|
)
|
||||||||||||||
|
Balance at December 31, 2015
|
102,158
|
|
$
|
10
|
|
$
|
416,939
|
|
$
|
(5,000
|
)
|
$
|
(97
|
)
|
$
|
(21,188
|
)
|
$
|
(427,240
|
)
|
$
|
(36,576
|
)
|
|||||||
See accompanying notes to consolidated financial statements.
F-6
ALPHATEC HOLDINGS, INC.
(In thousands)
|
|
Year Ended December 31,
|
||||||||||
|
|
2015
|
2014
|
2013
|
||||||||
|
Operating activities:
|
|||||||||||
|
Net loss
|
$
|
(178,676
|
)
|
$
|
(12,882
|
)
|
$
|
(82,227
|
)
|
||
|
Adjustments to reconcile net loss to net cash provided by (used in) operating activities:
|
|||||||||||
|
Depreciation and amortization
|
19,031
|
|
18,385
|
|
26,277
|
|
|||||
|
Goodwill and intangible assets impairment
|
165,171
|
|
—
|
|
—
|
|
|||||
|
Stock-based compensation
|
2,643
|
|
4,554
|
|
4,078
|
|
|||||
|
Interest expense related to amortization of debt discount and debt issuance costs
|
4,695
|
|
6,700
|
|
368
|
|
|||||
|
In-process research and development
|
98
|
|
102
|
|
—
|
|
|||||
|
Provision for doubtful accounts
|
584
|
|
522
|
|
404
|
|
|||||
|
Provision for excess and obsolete inventory
|
2,156
|
|
3,539
|
|
11,652
|
|
|||||
|
Deferred income tax (benefit) provision
|
(333
|
)
|
251
|
|
816
|
|
|||||
|
Other non-cash items
|
(4,363
|
)
|
1,913
|
|
1,464
|
|
|||||
|
Changes in operating assets and liabilities:
|
|||||||||||
|
Restricted cash
|
4,400
|
|
(6,750
|
)
|
—
|
|
|||||
|
Accounts receivable
|
1,197
|
|
(1,028
|
)
|
(1,940
|
)
|
|||||
|
Inventories
|
(5,456
|
)
|
(4,348
|
)
|
(4,407
|
)
|
|||||
|
Prepaid expenses and other current assets
|
2,472
|
|
4,863
|
|
450
|
|
|||||
|
Other assets
|
(6
|
)
|
(276
|
)
|
64
|
|
|||||
|
Accounts payable
|
3,209
|
|
(1,042
|
)
|
(3,853
|
)
|
|||||
|
Accrued expenses and other
|
(6,365
|
)
|
(35,130
|
)
|
55,171
|
|
|||||
|
Deferred revenue
|
(333
|
)
|
356
|
|
(510
|
)
|
|||||
|
Net cash provided by (used in) operating activities
|
10,124
|
|
(20,271
|
)
|
7,807
|
|
|||||
|
Investing activities:
|
|||||||||||
|
Purchases of property and equipment
|
(12,247
|
)
|
(11,300
|
)
|
(14,352
|
)
|
|||||
|
Purchase of intangible assets
|
—
|
|
—
|
|
(750
|
)
|
|||||
|
Cash paid for acquisitions
|
—
|
|
—
|
|
(4,000
|
)
|
|||||
|
Cash received from sale of assets
|
—
|
|
300
|
|
—
|
|
|||||
|
Net cash used in investing activities
|
(12,247
|
)
|
(11,000
|
)
|
(19,102
|
)
|
|||||
|
Financing activities:
|
|||||||||||
|
Exercise of stock options
|
375
|
|
26
|
|
8
|
|
|||||
|
Borrowings under lines of credit
|
141,583
|
|
163,067
|
|
154,622
|
|
|||||
|
Repayments under lines of credit
|
(144,567
|
)
|
(156,106
|
)
|
(168,855
|
)
|
|||||
|
Principal payments on capital lease obligations
|
(747
|
)
|
(766
|
)
|
(434
|
)
|
|||||
|
Proceeds from issuance of notes payable
|
5,000
|
|
30,350
|
|
28,000
|
|
|||||
|
Principal payments on notes payable
|
(8,176
|
)
|
(5,837
|
)
|
(2,654
|
)
|
|||||
|
Net cash (used in) provided by financing activities
|
(6,532
|
)
|
30,734
|
|
10,687
|
|
|||||
|
Effect of exchange rate changes on cash
|
149
|
|
(1,073
|
)
|
(288
|
)
|
|||||
|
Net decrease in cash
|
(8,506
|
)
|
(1,610
|
)
|
(896
|
)
|
|||||
|
Cash at beginning of period
|
19,735
|
|
21,345
|
|
22,241
|
|
|||||
|
Cash at end of period
|
$
|
11,229
|
|
$
|
19,735
|
|
$
|
21,345
|
|
||
See accompanying notes to consolidated financial statements.
F-7
ALPHATEC HOLDINGS, INC.
CONSOLIDATED STATEMENTS OF CASH FLOWS—(Continued)
(in thousands)
|
|
Year Ended December 31,
|
||||||||||
|
|
2015
|
2014
|
2013
|
||||||||
|
Supplemental disclosure of cash flow information:
|
|||||||||||
|
Cash paid for interest
|
$
|
7,627
|
|
$
|
5,885
|
|
$
|
3,973
|
|
||
|
Cash paid for income taxes
|
$
|
621
|
|
$
|
565
|
|
$
|
1,780
|
|
||
|
Purchases of property and equipment in accounts payable
|
$
|
2,323
|
|
$
|
1,638
|
|
$
|
1,513
|
|
||
|
Purchase of property and equipment through capital leases
|
$
|
243
|
|
$
|
1,212
|
|
$
|
—
|
|
||
|
Non-cash purchases of license agreements
|
$
|
—
|
|
$
|
—
|
|
$
|
250
|
|
||
|
Non-cash debt discount
|
$
|
—
|
|
$
|
650
|
|
$
|
—
|
|
||
|
Initial fair value of warrant liability
|
$
|
—
|
|
$
|
11,280
|
|
$
|
—
|
|
||
See accompanying notes to consolidated financial statements.
F-8
ALPHATEC HOLDINGS, INC.
NOTES TO CONSOLIDATED FINANCIAL STATEMENTS
1. The Company and Basis of Presentation
The Company
Alphatec Holdings, Inc. (“Alphatec”, “Alphatec Holdings” or the “Company”), through its wholly owned subsidiary, Alphatec Spine, Inc. and its subsidiaries (“Alphatec Spine”) designs, develops, manufactures and markets products for the surgical treatment of spine disorders. In addition to its U.S. operations, the Company also markets its products in over
50
international markets through its affiliate, Scient’x S.A.S. and its subsidiaries (“Scient’x”), via a direct salesforce in Italy and the United Kingdom and via independent distributors in the rest of Europe, the Middle East and Africa. In South America and Latin America the Company conducts its operations through its Brazilian subsidiary, Cibramed Productos Medicos. In Asia, the Company markets its products through its subsidiary, Alphatec Pacific, Inc. and its subsidiaries (“Alphatec Pacific”) via a direct sales force and independent distributors, and through distributors in other parts of Asia and Australia.
Basis of Presentation
The consolidated financial statements have been prepared in accordance with generally accepted accounting principles in the United States of America ("GAAP") and include the accounts of Alphatec and Alphatec Spine and its wholly owned subsidiaries. All intercompany balances and transactions have been eliminated in consolidation.
The Company has incurred significant net losses since inception and has relied on its ability to fund its operations through revenues from the sale of its products, equity financings and debt financings. As the Company has incurred losses, successful transition to profitability is dependent upon achieving a level of revenues adequate to support the Company’s cost structure. This may not occur and, unless and until it does, the Company will continue to need to raise additional capital. Additionally, as discussed below, the Company has a significant amount of debt that is classified as current debt. These conditions raise substantial doubt about the Company's ability to continue as a going concern. The accompanying consolidated financial statements have been prepared assuming that the Company will continue as a going concern and do not include any adjustments that might result from the outcome of this uncertainty. A going concern basis of accounting contemplates the recovery of the Company’s assets and the satisfaction of its liabilities in the normal course of business. Operating losses and negative cash flows may continue for at least the next year as the Company continues to incur costs related to the execution of its operating plan, introduction of new products and expansion into new geographies.
The Company's amended and restated credit facility (the "Amended Credit Facility") with MidCap Financial, LLC ("MidCap") matures in December 2016, which will require the Company to refinance the Amended Credit Facility with MidCap or to seek alternative financing. In addition, as disclosed in Note 5 as of December 31, 2015 the Company has determined that it failed to comply with the fixed charge coverage ratio covenant under its Amended Credit Facility with MidCap for June, August, September, October and December of 2015 and January 2016. The Company’s default under the MidCap credit facility also constitutes an event of default under the facility agreement (the "Facility Agreement") with Deerfield Private Design Fund II, L.P., Deerfield Private Design International II, L.P., Deerfield Special Situations Fund, L.P., and Deerfield Special Situations International Master Fund, L.P., (collectively "Deerfield"). In 2016, MidCap and Deerfield provided waivers of the Company’s failure to comply with the fixed charge coverage ratio covenant during such periods and MidCap and Deerfield has provided waivers of such defaults. The Company can provide no assurance that it will be in compliance with the financial covenants in the future. If the Company does not obtain waivers from MidCap or Deerfield, they would have the right to call the debts due immediately, which would significantly impact the Company's ability to continue as a going concern. Management intends to pursue additional opportunities to raise additional capital through public or private equity offerings, debt financings, receivables financings or collaborations or partnerships with other companies to further support its planned operations. However, there is no assurance that it will be able to do so.
2. Summary of Significant Accounting Policies
Use of Estimates
The preparation of consolidated financial statements in conformity with accounting principles generally accepted in the United States requires management to make estimates and assumptions that affect the reported amounts of assets and liabilities and disclosure of contingent assets and liabilities at the date of the consolidated financial statements and the reported amounts of revenues and expenses during the reporting period. Actual results could differ from those estimates. Significant items subject to such estimates and assumptions include the useful lives of fixed assets; allowances for doubtful accounts and sales returns,
F-9
ALPHATEC HOLDINGS, INC.
NOTES TO CONSOLIDATED FINANCIAL STATEMENTS—(Continued)
the valuation of share based liabilities, deferred tax assets, fixed assets, inventory, investments, notes receivable and share-based compensation; and reserves for employee benefit obligations, restructuring liabilities, income tax uncertainties and other contingencies.
Concentrations of Credit Risk and Significant Customers
Financial instruments, which potentially subject the Company to concentrations of credit risk, consist primarily of cash and accounts receivable. The Company limits its exposure to credit loss by depositing its cash with established financial institutions. As of December 31,
2015
, a substantial portion of the Company’s available cash funds is held in business accounts. Although the Company deposits its cash with multiple financial institutions, its deposits, at times, may exceed federally insured limits.
The Company’s customers are primarily hospitals, surgical centers and distributors and
no
single customer represented greater than
10 percent
of consolidated revenues or accounts receivable for any of the periods presented. Credit to customers is granted based on an analysis of the customers’ credit worthiness and credit losses have not been significant.
Revenue Recognition
The Company derives its revenues primarily from the sale of spinal surgery implants used in the treatment of spine disorders. The Company sells its products primarily through its direct sales force and independent distributors. Revenue is recognized when all four of the following criteria are met: (i) persuasive evidence of an arrangement exists; (ii) delivery of the products and/or services has occurred; (iii) the selling price is fixed or determinable; and (iv) collectability is reasonably assured. In addition, the Company accounts for revenue under provisions which set forth guidelines for the timing of revenue recognition based upon factors such as passage of title, installation, payment and customer acceptance.
The Company’s revenue from sales of spinal and other surgical implant products is recognized upon receipt of written acknowledgment that the product has been used in a surgical procedure or upon shipment to third-party customers who immediately accept title to such product.
Deferred revenues consist of sales transactions where circumstances indicate that collectibility is not reasonably assured due to payment terms, regional market risks or customer history. The Company defers the recognition of revenue until payments become due and cash is received from these distributors. As of December 31,
2015
and
2014
, the balance in deferred revenue totaled
$0.6 million
and
$1.3 million
, respectively.
Restricted Cash
In March and November 2014, the Company borrowed and set aside cash for the payment of a portion of the Orthotec litigation settlement, which is subject to the terms of the facility agreement that it entered into with Deerfield on March 17, 2014. The Company classified this cash as restricted, because it may not be used for purposes other than payments of amounts due under the Orthotec litigation settlement agreement. As of
December 31, 2015
, the Company had
$2.4 million
classified as short-term restricted cash.
Accounts Receivable
Accounts receivable are presented net of allowance for doubtful accounts. The Company makes judgments as to its ability to collect outstanding receivables and provides allowances for a portion of receivables when collection becomes doubtful. Provisions are made based upon a specific review of all significant outstanding invoices and the overall quality and age of those invoices not specifically reviewed. In determining the provision for invoices not specifically reviewed, the Company analyzes historical collection experience. If the historical data used to calculate the allowance provided for doubtful accounts does not reflect the Company’s future ability to collect outstanding receivables or if the financial condition of customers were to deteriorate, resulting in impairment of their ability to make payments, an increase in the provision for doubtful accounts may be required.
Inventories
Inventories are stated at the lower of cost or market, with cost primarily determined under the first-in, first-out method. The Company reviews the components of inventory on a periodic basis for excess, obsolete and impaired inventory, and records a reserve for the identified items. The Company calculates an inventory reserve for estimated excess and obsolete inventory based upon historical turnover and assumptions about future demand for its products and market conditions. The Company’s biologics inventories have an expiration based on shelf life and are subject to demand fluctuations based on the availability and
F-10
ALPHATEC HOLDINGS, INC.
NOTES TO CONSOLIDATED FINANCIAL STATEMENTS—(Continued)
demand for alternative implant products. The Company’s estimates and assumptions for excess and obsolete inventory are reviewed and updated on a quarterly basis. Increases in the reserve for excess and obsolete inventory result in a corresponding increase to cost of revenues and establish a new cost basis for the part. Approximately
$16.3 million
and
$17.3 million
of inventory was held at consigned locations as of December 31,
2015
and
2014
, respectively.
Property and Equipment
Property and equipment are stated at cost, net of accumulated depreciation and amortization. Depreciation is computed using the straight-line method over the estimated useful lives of the related assets, generally ranging from
three
to
seven
years. Leasehold improvements and assets acquired under capital leases are amortized over the shorter of their useful lives or the terms of the related leases.
Goodwill and Other Intangible Assets
The Company accounts for goodwill and other intangible assets in accordance with provisions which require that goodwill and other identifiable intangible assets with indefinite useful lives be tested for impairment at least annually. The Company tests goodwill and intangible assets for impairment in December of each year, or more frequently if events and circumstances warrant. These assets are considered impaired if the Company determines that their carrying values may not be recoverable based on an assessment of certain events or changes in circumstances. If the assets are considered to be impaired, the Company recognizes the amount by which the carrying value of the assets exceeds the fair value of the assets as an impairment loss. In the third quarter of 2015, the market value of the Company’s common stock substantially declined. As a result of this decline, the Company determined that it had an indicator of impairment of the goodwill, and an interim test of goodwill impairment was performed. The Company analyzed the carrying amount of goodwill for impairment under a two-part test in accordance with authoritative guidance.
The Company estimated the fair value in step one of the goodwill impairment test based on a combination of the income approach which included discounted cash flows as well as a market approach that utilized the Company’s market information. The fair value measurements utilized to perform the impairment analysis are categorized within Level 3 of the fair value hierarchy. Significant management judgment is required in the forecast of future operating results that are used in the Company’s impairment analysis. The estimates the Company used are consistent with the plans and estimates that it uses to manage its business. Significant assumptions utilized in the Company’s income approach model included the growth rate of sales for recently introduced products and the introduction of anticipated new products similar to its historical growth rates. Another important assumption involved in forecasted sales is the projected mix of higher margin U.S. based sales and lower margin non-U.S. based sales. Additionally, the Company has projected an improvement in its gross margin, similar to its historical improvement in gross margins, as a result of its forecasted mix in U.S. sales versus non-U.S. sales and lower manufacturing cost per unit based on the increase in forecasted volume to absorb applied overhead over the next ten years.
The Company’s discounted cash flows required management judgment with respect to forecasted sales, launch of new products, gross margins, selling, general and administrative expenses, capital expenditures and the selection and use of an appropriate discount rate and terminal growth rate. For purposes of calculating the discounted cash flows, the Company used estimated revenue growth rates averaging between
3%
and
13%
for the discrete forecast period. Cash flows beyond the discrete forecast period were estimated using a terminal value calculation, which incorporated historical and forecasted financial trends and considered long-term earnings growth rates for publicly traded peer companies. Future cash flows were then discounted to present value at a discount rate of
13.5%
, and terminal value growth rate of
3%
. The Company's market capitalization was also considered in assessing the reasonableness of the Company’s fair value as determined in step one of the goodwill impairment test. The Company’s assessment resulted in a fair value that was lower than the Company’s carrying value of net assets at September 30, 2015.
Based upon step one of the interim impairment test, the Company determined that its goodwill was impaired and that step two of the test was required to measure the amount of goodwill impairment. As a result of step two, in the third quarter of 2015 the Company recorded a charge of
$164.3 million
, representing the write-off of the entire balance of goodwill. The Company finalized the step two test in the fourth quarter of 2015, which did not change the amount of the impairment charge.
The accounting provisions also require that intangible assets with finite useful lives be amortized over their respective estimated useful lives and reviewed for indicators of impairment. The Company is amortizing its intangible assets, other than goodwill, on a straight-line basis over a
one
to
fifteen
-year period. In connection with the step two goodwill impairment test above the Company determined that certain intangible acquired were impaired. As a result, in the third quarter of 2015, the Company recorded an impairment charge of
$0.9 million
to physician education intangible assets acquired in the Scient’x acquisition, which is included in cost of goods sold. Prior to the impairment, amortization of the physician education intangible assets had been recorded in amortization of acquired intangible assets within operating expenses.
F-11
ALPHATEC HOLDINGS, INC.
NOTES TO CONSOLIDATED FINANCIAL STATEMENTS—(Continued)
During the year ended December 31, 2013, the Company decided that it would not continue to market an adult stem cell product sold under the Company's private label name of PureGen. The Company also decided that it would no longer actively market two additional products. The Company expensed
$1.3 million
as impairment charges in cost of goods sold in the year ended December 31, 2013 for the write-off of intangible assets related to these products.
Impairment of Long-Lived Assets
The Company assesses potential impairment to its long-lived assets when there is evidence that events or changes in circumstances indicate that the carrying amount of an asset may not be recoverable. An impairment loss is recognized when the carrying amount of the long-lived assets is not recoverable if it exceeds the sum of the undiscounted cash flows expected to result from the use and eventual disposition of the asset. Any required impairment loss is measured as the amount by which the carrying amount of a long-lived asset exceeds its fair value and is recorded as a reduction in the carrying value of the related asset and a charge to operating results.
Foreign Currency
The Company’s results of operations and cash flows are subject to fluctuations due to changes in foreign currency exchange rates. The Company’s primary functional currency is the U.S. dollar, while the functional currency of the Company’s foreign subsidiaries include the Japanese Yen, the Euro, the Brazilian Real, the British Pound and the Hong Kong Dollar. Assets and liabilities denominated in foreign currencies are translated at the rate of exchange on the balance sheet date. Revenues and expenses are translated using the average exchange rate for the period. Net gains and losses resulting from the translation of foreign financial statements are recorded as accumulated other comprehensive income (loss) in stockholders’ (deficit) equity. Net foreign currency gains or (losses) resulting from transactions in currencies other than the functional currencies are included in other income (expense), net in the accompanying consolidated statements of operations. For the years ended December 31,
2015
,
2014
and
2013
, the Company recorded net foreign currency losses of approximately
$1.2 million
,
$1.0 million
and
$1.7 million
, respectively.
Warrants to Purchase Common Stock
Common stock warrants that contain compliance covenants and cash payment obligations are classified as common stock warrant liabilities on the consolidated balance sheet. The Company records the warrant liability at fair value and adjusts the carrying value of these common stock warrants to their estimated fair value at each reporting date with the increases or decreases in the fair value of such warrants at each reporting date recorded as other income (expense) in the consolidated statements of operations.
Fair Value Measurements
The carrying amount of financial instruments consisting of cash, restricted cash, trade accounts receivable, prepaid expenses and other current assets, accounts payable, accrued expenses, accrued compensation and current portion of long-term debt included in the Company’s consolidated financial statements are reasonable estimates of fair value due to their short maturities. Based on the borrowing rates currently available to the Company for loans with similar terms, management believes the fair value of long-term debt approximates its carrying value.
Authoritative guidance establishes a three-tier fair value hierarchy, which prioritizes the inputs used in measuring fair value as follows:
|
Level 1:
|
Observable inputs such as quoted prices in active markets;
|
|
Level 2:
|
Inputs, other than the quoted prices in active markets, that are observable either directly or indirectly; and
|
|
Level 3:
|
Unobservable inputs in which there is little or no market data, which require the reporting entity to develop its own assumptions.
|
F-12
ALPHATEC HOLDINGS, INC.
NOTES TO CONSOLIDATED FINANCIAL STATEMENTS—(Continued)
The Company does not maintain any financial instruments that are considered to be Level 1 or Level 2 instruments as of
December 31, 2015
or
December 31, 2014
. The Company classifies its common stock warrant liabilities within Level 3 of the fair value hierarchy because they are valued using valuation models with significant unobservable inputs. The following table provides a reconciliation of liabilities measured at fair value using significant unobservable inputs (Level 3) for the
year ended
December 31, 2015
(in thousands):
|
|
Common Stock Warrant Liabilities
|
||
|
Balance at December 31, 2013
|
$
|
—
|
|
|
Issuance
|
11,280
|
|
|
|
Changes in fair value
|
(2,578
|
)
|
|
|
Balance at December 31, 2014
|
8,702
|
|
|
|
Issuance
|
—
|
|
|
|
Changes in fair value
|
(8,015
|
)
|
|
|
Balance at December 31, 2015
|
$
|
687
|
|
Common stock warrant liabilities are measured at fair value using the Black-Scholes option pricing valuation model. The assumptions used in the Black-Scholes option pricing valuation model for the common stock warrant liabilities were: (a) a risk-free interest rate based on the rates for U.S. Treasury zero-coupon bonds with maturities similar to those of the remaining contractual term of the warrants; (b) an assumed dividend yield of zero percent based on the Company’s expectation that it will pay no dividends in the foreseeable future; (c) an expected term based on the remaining contractual term of the warrants; and (d) an expected volatility based upon the Company's historical volatility over the remaining contractual term of the warrants. The significant unobservable input used in measuring the fair value of the common stock warrant liabilities associated with the Deerfield Facility Agreement (defined below) is the expected volatility. Significant increases in volatility would result in a higher fair value measurement. The decrease in the fair value of the common stock warrant liabilities as of
December 31, 2015
was primarily driven by the decrease in the Company's common stock price at
December 31, 2015
.
Research and Development
Research and development expense consists of costs associated with the design, development, testing, and enhancement of the Company’s products. Research and development costs also include salaries and related employee benefits, research-related overhead expenses, fees paid to external service providers, and costs associated with the Company’s Scientific Advisory Board and Executive Surgeon Panels. Research and development costs are expensed as incurred.
In-Process Research and Development
In-process research and development (“IPR&D”) consists of acquired research and development assets that are not part of an acquisition of a business and were not technologically feasible on the date the Company acquired them and had no alternative future use at that date or assets acquired in a business acquisition that are determined to have no alternative future use. The Company expects all acquired IPR&D will reach technological feasibility, but there can be no assurance that commercial viability of these products will ever be achieved. The nature of the efforts to develop the acquired technologies into commercially viable products consists principally of planning, designing, developing and testing products in order to obtain regulatory approvals. If commercial viability were not achieved, the Company would likely look to other alternatives to provide these products. Until the technological feasibility of the acquired research and development assets are established, the Company expenses these costs.
Leases
The Company leases its facilities and certain equipment and vehicles under operating leases, and certain equipment under capital leases. For facility leases that contain rent escalation or rent concession provisions, the Company records the total rent payable during the lease term on a straight-line basis over the term of the lease. The Company records the difference between the rent paid and the straight-line rent as a deferred rent liability in the accompanying consolidated balance sheets.
F-13
ALPHATEC HOLDINGS, INC.
NOTES TO CONSOLIDATED FINANCIAL STATEMENTS—(Continued)
Product Shipment Cost
Product shipment costs are included in sales and marketing expense in the accompanying consolidated statements of operations. Product shipment costs totaled
$3.8 million
,
$3.7 million
and
$3.1 million
for the years ended December 31,
2015
,
2014
and
2013
, respectively.
Stock-Based Compensation
The Company accounts for stock-based compensation under provisions which require that share-based payment transactions with employees be recognized in the financial statements based on their fair value and recognized as compensation expense over the vesting period. The amount of expense recognized during the period is affected by subjective assumptions, including estimates of the future volatility of the Company’s share price, the expected term for its stock options, the number of options expected to ultimately vest, and the timing of vesting for the Company’s share-based awards.
The Company uses a Black-Scholes option pricing valuation model to estimate the fair value of its stock option awards. The calculation of the fair value of the awards using the Black-Scholes option pricing model is affected by the Company’s common stock price on the date of grant as well as assumptions regarding the following:
|
•
|
Estimated volatility is a measure of the amount by which the Company’s common stock price is expected to fluctuate each year during the expected life of the award. The Company’s estimated volatility through December 31,
2015
was based on a weighted-average volatility of its actual historical volatility over a period equal to the expected remaining life of the awards.
|
|
•
|
The expected term represents the period of time that awards granted are expected to be outstanding. Through December 31,
2015
, the Company calculated the expected term using a weighted-average term based on historical exercise patterns and the term from option date to full exercise for the options granted within the specified date range.
|
|
•
|
The risk-free interest rate is based on the yield curve of a zero-coupon U.S. Treasury bond on the date the stock option award is granted with a maturity equal to the expected term of the stock option award.
|
|
•
|
The assumed dividend yield is based on the Company’s expectation of not paying dividends in the foreseeable future.
|
The Company used historical data to estimate the number of future stock option forfeitures. Share-based compensation recorded in the Company’s consolidated statement of operations is based on awards expected to ultimately vest and has been reduced for estimated forfeitures. The Company’s estimated forfeiture rates may differ from its actual forfeitures which would affect the amount of expense recognized during the period.
The Company accounts for stock option grants to non-employees in accordance with provisions which require that the non-employee awards are remeasured at each reporting period end and fair value of these instruments be recognized as an expense over the period in which the related services are rendered.
Share-based compensation expense of awards with performance conditions is recognized over the period from the date the performance condition is determined to be probable of occurring through the time the applicable condition is met. Determining the likelihood and timing of achieving performance conditions is a subjective judgment made by management which may affect the amount and timing of expense related to these share-based awards. Share-based compensation is adjusted to reflect the value of options which ultimately vest as such amounts become known in future periods.
Valuation of Stock Option Awards
The assumptions used to compute the share-based compensation costs for the stock options granted during the years ended December 31,
2015
,
2014
and
2013
are as follows:
|
|
Year Ended December 31,
|
|||||||
|
|
2015
|
2014
|
2013
|
|||||
|
Risk-free interest rate
|
1.6-1.8%
|
|
1.8-1.9%
|
|
1.1-1.8%
|
|
||
|
Expected dividend yield
|
—
|
|
—
|
|
—
|
|
||
|
Weighted average expected life (years)
|
5.4-5.5
|
|
5.4-5.5
|
|
5.3-5.5
|
|
||
|
Volatility
|
59-68%
|
|
60-71%
|
|
75-76%
|
|
||
F-14
ALPHATEC HOLDINGS, INC.
NOTES TO CONSOLIDATED FINANCIAL STATEMENTS—(Continued)
Stock-Based Compensation Costs
The compensation cost that has been included in the Company’s consolidated statement of operations for all stock-based compensation arrangements is detailed as follows (in thousands):
|
|
Year Ended December 31,
|
||||||||||
|
|
2015
|
2014
|
2013
|
||||||||
|
Cost of revenues
|
$
|
72
|
|
$
|
274
|
|
$
|
228
|
|
||
|
Research and development
|
286
|
|
2,080
|
|
719
|
|
|||||
|
Sales and marketing
|
359
|
|
470
|
|
459
|
|
|||||
|
General and administrative
|
1,926
|
|
1,730
|
|
2,672
|
|
|||||
|
Total
|
$
|
2,643
|
|
$
|
4,554
|
|
$
|
4,078
|
|
||
The amounts provided above include stock-based compensation expense of
$0.1 million
,
$1.9 million
and
$1.5 million
during the years ended December 31,
2015
,
2014
and
2013
, respectively, related to the vesting of stock options and awards granted to non-employees under consulting agreements.
Income Taxes
The Company accounts for income taxes in accordance with provisions which set forth an asset and liability approach that requires the recognition of deferred tax assets and deferred tax liabilities for the expected future tax consequences of temporary differences between the carrying amounts and the tax bases of assets and liabilities. Valuation allowances are established when necessary to reduce deferred tax assets to the amount expected to be realized. In making such determination, a review of all available positive and negative evidence must be considered, including scheduled reversal of deferred tax liabilities, projected future taxable income, tax planning strategies, and recent financial performance.
The Company recognizes interest and penalties related to uncertain tax positions as a component of the income tax provision.
F-15
ALPHATEC HOLDINGS, INC.
NOTES TO CONSOLIDATED FINANCIAL STATEMENTS—(Continued)
Net Loss per Share
Basic earnings per share (“EPS”) is calculated by dividing the net income or loss available to common stockholders by the weighted average number of common shares outstanding for the period, without consideration for common stock equivalents. Diluted EPS is computed by dividing the net income or loss available to common stockholders by the weighted average number of common shares outstanding for the period and the weighted average number of dilutive common stock equivalents outstanding for the period determined using the treasury-stock method. For purposes of this calculation, common stock subject to repurchase by the Company, options and warrants are considered to be common stock equivalents and are only included in the calculation of diluted earnings per share when their effect is dilutive. The following table sets forth the computation of basic and diluted loss per share (in thousands, except per share data):
|
|
Year Ended December 31,
|
||||||||||
|
|
2015
|
2014
|
2013
|
||||||||
|
Numerator:
|
|||||||||||
|
Net loss for basic earnings per share
|
$
|
(178,676
|
)
|
$
|
(12,882
|
)
|
$
|
(82,227
|
)
|
||
|
Decrease in fair value of warrants
|
—
|
|
(2,578
|
)
|
—
|
|
|||||
|
Diluted net loss attributable to common stockholders
|
$
|
(178,676
|
)
|
$
|
(15,460
|
)
|
$
|
(82,227
|
)
|
||
|
Denominator:
|
|||||||||||
|
Weighted average common shares outstanding
|
100,385
|
|
98,138
|
|
97,111
|
|
|||||
|
Weighted average unvested common shares subject to repurchase
|
(811
|
)
|
(791
|
)
|
(876
|
)
|
|||||
|
Weighted average common shares outstanding—basic
|
99,574
|
|
97,347
|
|
96,235
|
|
|||||
|
Effect of dilutive securities:
|
|||||||||||
|
Conversion of preferred stock
|
—
|
|
—
|
|
—
|
|
|||||
|
Options
|
—
|
|
—
|
|
—
|
|
|||||
|
Warrants
|
—
|
|
388
|
|
—
|
|
|||||
|
Weighted average common shares outstanding—diluted
|
99,574
|
|
97,735
|
|
96,235
|
|
|||||
|
Net loss per share:
|
|||||||||||
|
Basic
|
$
|
(1.79
|
)
|
$
|
(0.13
|
)
|
$
|
(0.85
|
)
|
||
|
Diluted
|
$
|
(1.79
|
)
|
$
|
(0.16
|
)
|
$
|
(0.85
|
)
|
||
As of December 31,
2015
,
2014
and
2013
, none of the outstanding shares of redeemable preferred stock were convertible to common stock.
The anti-dilutive securities not included in diluted net loss per share were as follows (in thousands):
|
|
Year Ended December 31,
|
|||||||
|
|
2015
|
2014
|
2013
|
|||||
|
Options to purchase common stock
|
7,941
|
|
7,057
|
|
4,597
|
|
||
|
Warrants to purchase common stock
|
11,544
|
|
725
|
|
594
|
|
||
|
Unvested restricted stock awards
|
811
|
|
791
|
|
876
|
|
||
|
20,296
|
|
8,573
|
|
6,067
|
|
|||
Recent Accounting Pronouncements
In May 2014, the Financial Accounting Standards Board (“FASB”) issued new accounting guidance related to revenue recognition. This new standard replaces all current U.S. GAAP guidance on this topic and eliminates all industry-specific guidance. The new revenue recognition standard provides a unified model to determine when and how revenue is recognized. The core principle is that a company should recognize revenue to depict the transfer of promised goods or services to customers in an amount that reflects the consideration for which the entity expects to be entitled in exchange for those goods or services. This guidance is effective for the Company beginning January 1, 2018 and can be applied either retrospectively to each period presented or as a cumulative-effect adjustment as of the date of adoption. The Company is evaluating the impact of adopting this new accounting standard on its financial statements.
F-16
ALPHATEC HOLDINGS, INC.
NOTES TO CONSOLIDATED FINANCIAL STATEMENTS—(Continued)
In August 2014, the FASB issued guidance related to disclosures of uncertainties about an entity’s ability to continue as a going concern. The guidance requires management to evaluate whether there are conditions and events that raise substantial doubt about the entity’s ability to continue as a going concern within one year after the financial statements are issued. Management will be required to make this evaluation for both annual and interim reporting periods and will have to make certain disclosures if it concludes that substantial doubt exists or when its plans alleviate substantial doubt about the entity’s ability to continue as a going concern. Substantial doubt exists when relevant conditions and events, considered in the aggregate, indicate that it is probable that the entity will be unable to meet its obligations as they become due within one year after the date that the financial statements are issued. The guidance is effective for annual periods ending after December 15, 2016 and for interim reporting periods thereafter. The Company is evaluating the impact of this guidance and expects to adopt the standard for the annual reporting period ending December 31, 2016.
In January 2015, the FASB issued new accounting guidance, which eliminates the concept of extraordinary items from GAAP, which required certain classification and presentation of extraordinary items in the income statement and disclosures. The guidance is effective for fiscal years, and interim periods within those fiscal years, beginning after December 15, 2015. The Company is evaluating the impact of adopting this new accounting standard on its financial statements.
In July 2015, the FASB issued new accounting guidance, which changes the measurement principle for inventory from the lower of cost or market to lower of cost and net realizable value for entities that do not measure inventory using the last-in, first-out or retail inventory method. The guidance also eliminates the requirement for these entities to consider replacement cost or net realizable value less an approximately normal profit margin when measuring inventory. The guidance is effective for annual periods beginning after December 15, 2016, and interim periods within those annual periods. The Company is evaluating the impact of adopting this new accounting standard on its financial statements.
In November 2015, the FASB issued new accounting guidance, which will require the presentation of deferred tax assets and liabilities be classified as noncurrent in a consolidated balance sheet. The Company has elected to early adopt this guidance during the fourth quarter of 2015. The adoption of this new guidance resulted in a reclassification in the Company’s deferred income taxes, net, being presented within other long-term liabilities on the Company’s consolidated balance sheet as of December 31, 2015. The Company did not retrospectively adjust the consolidated balance sheet as of December 31, 2014. The adoption did not have a material effect on the consolidated financial statements and had no impact on net income.
3. Balance Sheet Details
Accounts Receivable
Accounts receivable consist of the following (in thousands):
|
|
December 31,
|
||||||
|
|
2015
|
2014
|
|||||
|
Accounts receivable
|
$
|
39,380
|
|
$
|
41,233
|
|
|
|
Less allowance for doubtful accounts
|
(1,061
|
)
|
(793
|
)
|
|||
|
Accounts receivables, net
|
$
|
38,319
|
|
$
|
40,440
|
|
|
F-17
ALPHATEC HOLDINGS, INC.
NOTES TO CONSOLIDATED FINANCIAL STATEMENTS—(Continued)
Inventories
Inventories consist of the following (in thousands):
|
|
December 31,
|
||||||
|
|
2015
|
2014
|
|||||
|
Raw materials
|
$
|
7,237
|
|
$
|
5,020
|
|
|
|
Work-in-process
|
1,908
|
|
1,032
|
|
|||
|
Finished goods
|
55,393
|
|
57,020
|
|
|||
|
64,538
|
|
63,072
|
|
||||
|
Less reserve for excess and obsolete finished goods
|
(19,630
|
)
|
(21,325
|
)
|
|||
|
Inventories, net
|
$
|
44,908
|
|
$
|
41,747
|
|
|
Property and Equipment
Property and equipment consist of the following (in thousands except for useful lives):
|
|
Useful lives
(in years)
|
December 31,
|
|||||||
|
2015
|
2014
|
||||||||
|
Surgical instruments
|
4
|
$
|
65,723
|
|
$
|
62,872
|
|
||
|
Machinery and equipment
|
7
|
15,520
|
|
15,382
|
|
||||
|
Computer equipment
|
3
|
3,984
|
|
3,180
|
|
||||
|
Office furniture and equipment
|
5
|
3,746
|
|
3,789
|
|
||||
|
Leasehold improvements
|
various
|
3,856
|
|
3,841
|
|
||||
|
Building
|
39
|
65
|
|
65
|
|
||||
|
Land
|
n/a
|
9
|
|
9
|
|
||||
|
Construction in progress
|
n/a
|
354
|
|
1,320
|
|
||||
|
93,257
|
|
90,458
|
|
||||||
|
Less accumulated depreciation and amortization
|
(71,312
|
)
|
(64,418
|
)
|
|||||
|
Property and equipment, net
|
$
|
21,945
|
|
$
|
26,040
|
|
|||
Total depreciation expense was
$13.0 million
,
$12.2 million
and
$14.6 million
for the years ended December 31,
2015
,
2014
and
2013
, respectively. At December 31,
2015
, assets recorded under capital leases of
$2.6 million
were included in the machinery and equipment balance and
$0.1 million
are included in the construction in progress balance. At December 31,
2014
, assets recorded under capital leases of
$3.2 million
were included in the machinery and equipment balance and
$0.6 million
are included in the construction in progress balance. Amortization of assets under capital leases is included in depreciation expense.
F-18
ALPHATEC HOLDINGS, INC.
NOTES TO CONSOLIDATED FINANCIAL STATEMENTS—(Continued)
Intangible Assets
Intangible assets consist of the following (in thousands except for useful lives):
|
|
Remaining Avg. Useful lives (in years)
|
December 31,
|
|||||||
|
2015
|
2014
|
||||||||
|
Developed product technology
|
1
|
$
|
21,633
|
|
$
|
22,526
|
|
||
|
Distribution rights
|
4
|
2,100
|
|
2,095
|
|
||||
|
Intellectual property
|
—
|
1,004
|
|
1,004
|
|
||||
|
License agreements
|
1
|
16,714
|
|
16,716
|
|
||||
|
Core technology
|
4
|
4,086
|
|
4,554
|
|
||||
|
Trademarks and trade names
|
2
|
3,245
|
|
3,559
|
|
||||
|
Customer-related
|
9
|
19,169
|
|
20,493
|
|
||||
|
Distribution network
|
5
|
4,027
|
|
4,027
|
|
||||
|
Physician education programs
|
—
|
2,513
|
|
2,802
|
|
||||
|
Supply agreement
|
—
|
225
|
|
225
|
|
||||
|
74,716
|
|
78,001
|
|
||||||
|
Less accumulated amortization
|
(53,100
|
)
|
(47,742
|
)
|
|||||
|
Intangible assets, net
|
$
|
21,616
|
|
$
|
30,259
|
|
|||
Total expense related to amortization of intangible assets was
$6.1 million
,
$6.2 million
and
$11.6 million
for the years ended December 31,
2015
,
2014
and
2013
, respectively.
In 2015, the Company determined that the physician education intangible asset acquired in the Scient’x acquisition was impaired. As a result, the Company recorded a
$0.9 million
expense, which is included in goodwill and intangible impairment in the year ended December 31, 2015. Prior to the impairment, amortization of the physician eduction intangible asset had been recorded in amortization of acquired intangible assets within operating expenses.
On June 19, 2015, the Company entered into an exclusive distribution agreement with a third party to market a biologic product that would replace its existing NEXoss Synthetic Bone Graft. The Company expensed
$0.3 million
as an impairment charge in cost of goods sold for the write-off of an intangible asset related to this product. Additionally, due to a revised marketing strategy for the Company's Epicage interbody fusion device, the Company evaluated the related intangible asset for impairment in June 2015. As a result of this impairment analysis the Company expensed
$0.9 million
as an impairment charge in cost of goods sold for the write-off of an intangible asset related to this product.
During 2013, the Company decided to discontinue marketing and selling of an adult stem cell product sold under the Company's private label name of PureGen and
two
additional products. The Company expensed
$1.3 million
as impairment charges in cost of goods sold in the year ended December 31, 2013 for the write-off of intangible assets related to these products.
The future expected amortization expense related to intangible assets as of December 31,
2015
is as follows (in thousands):
|
Year Ending December 31,
|
|
||
|
2016
|
$
|
4,001
|
|
|
2017
|
3,995
|
|
|
|
2018
|
2,844
|
|
|
|
2019
|
2,410
|
|
|
|
2020
|
1,811
|
|
|
|
Thereafter
|
6,555
|
|
|
|
|
|||
|
Total
|
$
|
21,616
|
|
|
|
|||
F-19
ALPHATEC HOLDINGS, INC.
NOTES TO CONSOLIDATED FINANCIAL STATEMENTS—(Continued)
Goodwill
The changes in the carrying amount of goodwill from December 31,
2014
through December 31,
2015
were as follows (in thousands):
|
|
|||||||
|
|
2015
|
2014
|
|||||
|
Balance at January 1
|
$
|
171,333
|
|
$
|
183,004
|
|
|
|
Impairment charge
|
(164,266
|
)
|
—
|
|
|||
|
Effect of foreign exchange rate on goodwill
|
(7,067
|
)
|
(11,671
|
)
|
|||
|
Balance at December 31
|
$
|
—
|
|
$
|
171,333
|
|
|
Accrued Expenses
Accrued expenses consist of the following (in thousands):
|
|
December 31,
|
||||||
|
|
2015
|
2014
|
|||||
|
Commissions and sales milestones
|
$
|
5,920
|
|
$
|
6,259
|
|
|
|
Payroll and payroll related
|
5,577
|
|
8,291
|
|
|||
|
Litigation settlements
|
4,400
|
|
7,393
|
|
|||
|
Accrued professional fees
|
2,203
|
|
2,342
|
|
|||
|
Royalties
|
1,578
|
|
2,129
|
|
|||
|
Restructuring and severance accruals
|
1,358
|
|
849
|
|
|||
|
Accrued taxes
|
1,074
|
|
1,344
|
|
|||
|
Accrued interest
|
999
|
|
946
|
|
|||
|
Other
|
6,682
|
|
5,840
|
|
|||
|
Total accrued expenses
|
$
|
29,791
|
|
$
|
35,393
|
|
|
4. License and Consulting Agreements
OsseoFix Spinal Fracture Reduction System License Agreement
On April 16, 2009, the Company and Stout Medical Group LP (“Stout”) amended the license agreement that the parties had entered into in September 2007 (the “License Amendment”) that provides the Company with a worldwide license to develop and commercialize Stout’s proprietary intellectual property related to a treatment for vertebral compression fractures. The effective date of the License Amendment is March 31, 2009. Under the License Amendment, the timing of the minimum royalty payments has been adjusted and Stout’s ability to terminate the License Amendment was revised. Under the original license agreement, the Company’s minimum royalty obligation began in the year ending December 31, 2009 and there are milestones due upon attainment of sales volumes. Pursuant to the License Amendment, the minimum royalty obligation is suspended until a licensed product obtains regulatory approval from the United States Food and Drug Administration (the “FDA”). In addition, under the terms of the License Amendment, Stout has the ability to terminate the License Amendment if the Company is not using commercially reasonable efforts to obtain regulatory approval to market and sell a licensed product; provided that the Company has the right to delay such termination in exchange for making certain payments to Stout. If, during the time period when such payments are made, the Company were to make a regulatory filing for the marketing and sale of a licensed product, such termination will be null and void. Pursuant to the License Amendment, Stout is entitled to retain all up-front payments that had been previously paid to it. The other material terms of the license agreement were not changed in the License Amendment.
In August 2014, the Company entered a third amendment (the “Third Amendment”) to the License Agreement. Pursuant to the Third Amendment: (i) the royalty rate paid by the Company for the net sales of licensed products is a fixed amount per quarter through December 31, 2016; (ii) the royalty rate starting in 2017 will be increased from
7.0%
to
8.5%
; (ii) starting in 2017, the minimum royalty obligation is
$0.2 million
per year, with such minimum royalty obligation being further reduced
F-20
ALPHATEC HOLDINGS, INC.
NOTES TO CONSOLIDATED FINANCIAL STATEMENTS—(Continued)
stating in 2018; (iii) the territory is amended so that the United States is removed from the territory in which the Company can sell and market licensed products; (iv) all obligations of the Company to pursue a clinical trial in the United States are deleted; and (v) all milestone payments based on the achievement of certain sales milestones are deleted. In connection with this amendment the Company reversed the
$1.7 million
accrual it had recorded for the sales milestone payment into cost of goods sold for the
year ended
December 31, 2014
.
OsseoScrew License Agreement
In December 2007, the Company entered into an exclusive license agreement (the “OsseoScrew License Agreement”), with Progressive Spinal Technologies LLC (“PST”), which provides the Company with an exclusive worldwide license to develop and commercialize PST’s proprietary intellectual property related to an expanding pedicle screw with increased pull-out strength. The financial terms of the OsseoScrew License Agreement include: (i) a cash payment payable following the execution of the agreement; (ii) development and sales milestone payments in cash and the Company’s common stock that began to be achieved and paid in 2008; and (iii) a royalty payment based on net sales of licensed products. The agreement included milestone payments of
$3.6 million
consisting of cash and the Company’s common stock upon the completion of the biomechanical testing, which were attained in 2009. Furthermore, the agreement includes milestone payments of
$2.5 million
consisting of cash and the Company’s common stock upon market launch.
In November 2010, the Company and PST entered into a fifth amendment to the OsseoScrew License Agreement. The fifth amendment includes (i) a milestone payment of a
$1.5 million
and the issuance of
$1.0 million
in shares of the Company’s common stock upon market launch in Europe; and (ii) royalty payments based on net sales of licensed products with minimum annual royalties beginning at the end of 2011. During the fourth quarter of 2010, the Company recorded an intangible asset of
$2.5 million
for a milestone payment required upon market launch in Europe which consisted of the cash payment of
$1.5 million
and
$1.0 million
in shares of the Company’s common stock. The Company is amortizing this asset over
seven
years, the estimated life of the product. The total number of shares of common stock that were issued on December 15, 2010 was
452,488
.
On December 12, 2013, the Company and PST entered into a sixth amendment to the OsseoScrew License Agreement
.
The sixth amendment provides (i) the royalty rate paid by the Company for net sales of licensed products is increased; (ii) the territory is amended so that the United States is removed from the territory in which the Company can sell and market licensed products, and such rights are non-exclusive in Russia and the People’s Republic of China; (iii) all milestone payments based on the achievement of certain sales milestones are deleted; and (iv) a
$0.3 million
milestone payment to be paid upon the achievement of regulatory approval of a licensed product in the People’s Republic of China was added. In connection with this amendment, the Company reversed the
$0.6 million
accrual it had recorded for the sales milestone payment into cost of goods sold for the year ended December 31, 2013.
License Agreement with Helix Point, LLC
In February 2009, the Company entered into a license agreement (the “Helifuse/Helifix License Agreement”) with Helix Point, LLC (“Helix Point”) that provides the Company with a worldwide exclusive license (excluding the People’s Republic of China) to develop and commercialize Helix Point’s proprietary intellectual property related to a device for the treatment of spinal stenosis. The financial terms of the Helifuse/Helifix License Agreement include: (i) a cash payment of
$0.2 million
payable following the execution of the Helifuse/Helifix License Agreement; (ii) the issuance of
$0.4 million
of shares of the Company’s common stock following the execution of the Helifuse/Helifix License Agreement; (iii) development and sales milestone payments in cash and the Company’s common stock; and (iv) a royalty payment based on net sales of licensed products, with minimum annual royalties beginning in the year after the first commercial sale of a licensed product. During the third quarter of 2010, the Company recorded an intangible asset of
$0.2 million
for the assets received as this product is cleared for sale in Europe and technological feasibility is considered to have been achieved. Based on the analysis of the estimated remaining useful life of this asset performed in
2015
, the Company has accelerated amortization so that the carrying value of this asset will be fully amortized by December 2016.
F-21
ALPHATEC HOLDINGS, INC.
NOTES TO CONSOLIDATED FINANCIAL STATEMENTS—(Continued)
License Agreement with International Spinal Innovations, LLC
In June 2009, the Company entered into a cross license agreement (the “ISI License Agreement”) with International Spinal Innovations, LLC (“ISI”) that provides the Company with a worldwide license to develop and commercialize ISI’s proprietary intellectual property related to a stand-alone anterior lumbar interbody fusion device. The financial terms of the ISI License Agreement include: (i) the issuance of
260,000
shares of the Company’s common stock following the execution of the ISI License Agreement; (ii) sales milestone payments in cash that could begin to be achieved and paid in 2016; and (iii) a royalty payment based on net sales of licensed products. In 2012, the Company entered into an amended agreement that established a minimum royalty payment amount that began in 2012.
Distribution Agreement with Parcell Spine, LLC
In January 2010, the Company entered into an exclusive distribution agreement (the “Parcell Agreement”) with Parcell Spine, LLC (“Parcell Spine”), which provides the Company with the exclusive right to distribute Parcell Spine’s proprietary adult stem cells for the treatment of spinal disorders under either Parcell’s trademarks or Alphatec Spine’s private label. The financial terms of the Parcell Agreement include: (i) a cash payment of
$0.5 million
payable following the execution of the Parcell Agreement; (ii) a milestone payment consisting of
$1.0 million
in cash and the issuance of
$1.0 million
of shares of the Company’s common stock following the successful completion of a pre-clinical study; and (iii) sales milestone payments in cash and the Company’s common stock. In 2010, the Company recorded an intangible asset of
$1.5 million
for a milestone payment required upon market launch when the product became commercially ready for sale which consisted of a cash payment of
$0.5 million
and
$1.0 million
worth of the Company’s common stock. The Company is amortizing this asset over
seven
years, the estimated life of the product.
During the year ended December 31, 2013, the Company decided that it would not continue to sell its PureGen product, which is currently the only product commercialized by the Company under the Parcell Agreement. During the year ended December 31, 2013, the Company expensed
$0.9 million
as impairment charges in cost of goods for the write-off of intangible assets related to the Parcell Agreement and expensed
$2.6 million
related to the write-off of inventory and certain prepaid assets in cost of goods sold.
License Agreement with R Tree Innovations LLC
In September 2010, the Company entered into a License Agreement (the “R Tree License Agreement”) with R Tree Innovations LLC (“R Tree”) that provides the Company with a worldwide license to develop and commercialize R Tree’s proprietary intellectual property related to its Epicage interbody fusion device and related instrumentation. The financial terms of the R Tree License Agreement include: (i) a cash payment of
$0.8 million
and the issuance of
$0.5 million
of the Company’s common stock following the execution of the R Tree License Agreement; (ii) development and sales milestone payments in cash that could begin to be achieved and paid in 2013; and (iii) a royalty payment based on net sales of licensed products. During the third quarter of 2010, the Company recorded an intangible asset of
$1.3 million
following the execution of the R Tree License Agreement. In November 2012, the Company and R Tree entered into an amendment to the R Tree License Agreement (the “R Tree Amendment”). In connection with the R Tree Amendment, the Company made a cash payment of
$0.3 million
and issued
$0.2 million
of its common stock to R Tree. The total consideration of
$0.5 million
was recorded as an intangible asset. The Company is amortizing the intangible asset over
seven
years, the estimated life of the product. The total number of shares of common stock, which were issued in accordance with the R Tree License Agreement and the R Tree Amendment was
367,044
. In October 2013, another milestone was reached and the Company made a
$0.3 million
cash payment and issued
$0.2 million
worth of its common stock to R Tree. The total consideration of
$0.5 million
was recorded as an intangible asset.
Biologic Supply Agreement
In June 2015, the Company entered into an exclusive distribution agreement with a third party supplier pursuant to which the Company acquired exclusive worldwide distribution rights to market a synthetic biologic product under the Company's own brand name (the "Biologic Supply Agreement"). The Biologic Supply Agreement requires the Company to make minimum payments to the third party supplier for the Company's worldwide distribution rights under the agreement to remain exclusive.
Asset Purchase Agreement
F-22
ALPHATEC HOLDINGS, INC.
NOTES TO CONSOLIDATED FINANCIAL STATEMENTS—(Continued)
In July 2014, the Company entered into an asset purchase and product development services agreement (the "Asset Agreement") whereby the Company purchased rights to the conceptual design for an intervertebral implant device. The financial terms of the Agreement include payments in cash and the Company's common stock upon achievement of various milestones. The Company accounted for this arrangement as an asset acquisition. In the
year ended
December 31, 2014, the Company made cash payments totaling
$0.2 million
and issued
72,992
shares of the Company's common stock valued at
$0.1 million
. The Company recognized the cash and stock payments of
$0.3 million
as in-process research and development expense in the
year ended
December 31, 2014
. Under the terms of the Asset Agreement as amended in 2015 the Company was obligated to pay
$0.2 million
cash compensation and issue
72,992
shares of the Company's common stocks valued at less than
$0.1 million
. The Company expensed
$0.3 million
as in-process research and development in the year ended
December 31, 2015
.
MidCap Loan and Security Agreement
On August 30, 2013, the Company entered into the Amended Credit Facility with MidCap. The Amended Credit Facility amended and restated the prior credit facility that the Company had with MidCap (the "Prior Credit Facility"). Pursuant to the Amended Credit Facility, the Company increased the borrowing limit from
$50 million
to
$73 million
and extended the maturity to
August 2016
. In July 2015, the Company further amended the Amended Credit Facility to provide for an additional term loan of
$5 million
. As of December 31, 2015, the Amended Credit Facility consisted of a
$38 million
term loan,
$28 million
of which was drawn at closing, the remaining
$5 million
of which was drawn in April 2014, a $5 million term loan drawn in July 2015 and a revolving line of credit with a maximum borrowing base of
$40 million
, of which
$28.8 million
was outstanding at
December 31, 2015
. The Company used the term loan proceeds of
$28 million
drawn at closing to repay a portion of the outstanding balance on the prior revolving line of credit.
The term loan interest rate is priced at the London Interbank Offered Rate
("LIBOR") plus 8.0%
, subject to a
9.5%
floor, and the revolving line of credit interest rate bears interest at
LIBOR plus 6.0%
, reset monthly. At
December 31, 2015
, the revolving line of credit carries an interest rate of
6.2%
and the term loan carries an interest rate of
9.5%
. The borrowing base is determined, from time to time, based on the value of domestic eligible accounts receivable and domestic eligible inventory. As collateral for the Amended Credit Facility, the Company granted MidCap a security interest in substantially all of its assets, including all accounts receivable and all securities evidencing its interests in its subsidiaries. In addition to monthly payments of interest, monthly repayments of
$0.3 million
of the principal for the term loan were made beginning in October 2013, increasing to
$0.5 million
beginning in October 2014, and are due through maturity, with the remaining principal due upon maturity.
In connection with the execution of the Amended Credit Facility, the Company incurred approximately
$0.4 million
in costs, which were capitalized as debt issuance costs within the consolidated balance sheet as of
December 31, 2014
. At
December 31, 2015
,
$0.2 million
re
mains as unamortized debt issuance costs related to the prior and Amended Credit Facility within the consolidated balance sheet, which will be amortized over the remaining term of the Amended Credit Facility.
In February 2013, the Company and MidCap entered into a first amendment to the Credit Facility (the "First Amendment to the Credit Facility”). The First Amendment to the Credit Facility allowed the Company to exclude payments related to an acquisition and a settlement agreement from calculation of the fixed charge coverage ratio and the senior leverage ratio. In conjunction with the First Amendment to the Credit Facility, the Company paid MidCap a fee of
$0.1 million
.
On March 17, 2014, the Company entered into a first amendment to the Amended Credit Facility with MidCap (the "First Amendment to the Amended Credit Facility"). Under the First Amendment to the Amended Credit Facility, MidCap gave the Company its consent to enter into the Facility Agreement and make settlement payments in connection with the Orthotec litigation. The First Amendment to the Amended Credit Facility also added a total leverage ratio financial covenant.
The Amended Credit Facility includes traditional lending and reporting covenants including a fixed charge coverage ratio, a senior leverage ratio and a total leverage ratio to be maintained by the Company. The First Amendment to the Amended Credit Facility added a total leverage ratio financial covenant.The Amended Credit Facility also provides for several event of default provisions, such as payment default and insolvency conditions, which could cause interest to be charged at a rate which is up to
five
percentage points above the rate effective immediately before the event of default or result in MidCap’s right to declare all outstanding obligations immediately due and payable.
The Company was in compliance with all of the covenants of the Amended Credit Facility as of
December 31, 2015
, except for the non-compliance disclosed in Note 1. The Company has obtained a waiver from MidCap to cure the breach of the fixed charge coverage ratio covenant for each of June, August, September, October, November and December of 2015 and
F-23
ALPHATEC HOLDINGS, INC.
NOTES TO CONSOLIDATED FINANCIAL STATEMENTS—(Continued)
January 2016. There is no assurance that the Company will be in compliance with the financial covenants of the Amended Credit Facility in the future.
During the year ended December 31,
2015
, the Company repaid
$144.6 million
and drew an additional
$141.6 million
on its working capital line of credit under the Amended Credit Facility. The balance of the line of credit and the term loan as of December 31,
2015
and
2014
was
$28.8 million
and
$28.0 million
, respectively. Amortization of the debt discount and debt issuance costs, accretion of the finance charge and non-cash extinguishment of debt costs, which were recorded as non-cash interest expense, totaled
$0.3 million
,
$0.3 million
and
$0.2 million
for the years ended December 31,
2015
,
2014
and
2013
, respectively. Interest expense for the term loans and the Company’s working capital line of credit, excluding debt discount and debt issuance cost amortization, accretion of the additional finance charge and extinguishment of debt costs, totaled
$5.3 million
,
$5.3 million
and
$3.6 million
for the years ended December 31,
2015
,
2014
and
2013
, respectively.
On March 11, 2016, the Company entered into a third amendment and waiver to the Amended Credit Facility with MidCap (the "Third Amendment to the Amended Credit Facility"). The Third Amendment to the Amended Credit Facility extends the maturity date of the Amended Credit Facility from August 30, 2016 to December 31, 2016 and contains an amendment fee in the amount of
$0.5 million
, which is due and payable at the earlier of the termination of the Amended Credit Facility or the maturity date. The Third Amendment also contains a waiver of the December 2015 defaults under the Facility Agreement, provides a waiver for the fixed charge coverage ratio for January 2016 and eliminates the fixed charge coverage ratio covenant for February 2016.
Deerfield Facility Agreement
On March 17, 2014, the Company entered into the Facility Agreement with Deerfield, pursuant to which Deerfield agreed to loan the Company up to
$50 million
, subject to the terms and conditions set forth in the Facility Agreement. Under the terms of the Facility Agreement, the Company had the option, but was not required, upon certain conditions to draw the entire amount available under the Facility Agreement, at any time until January 30, 2015 (the “Draw Period”), provided that the initial draw be used for a portion of the payments made in connection with the Orthotec settlement described in Note 6 below. Following such initial draw down, the Company was permitted to draw down additional amounts under the Facility Agreement up to an aggregate
$15 million
for working capital or general corporate purposes in
$2.5 million
increments until the end of the Draw Period. The Company agreed to pay Deerfield, upon each disbursement of funds under the Facility Agreement, a transaction fee equal to
2.5%
of the principal amount of the funds disbursed. Amounts borrowed under the Facility Agreement bear interest at a rate of
8.75%
per annum and are payable on the third, fourth and fifth anniversary date of the first amount borrowed under the Facility Agreement, with the final payment due on March 20, 2019.
In connection with the execution of the Facility Agreement on March 17, 2014, the Company issued to Deerfield warrants to purchase an aggregate of
6,250,000
shares of the Company’s common stock (the “Initial Warrants”) (See Note 8). Additionally, the Company agreed that upon each disbursement under the Facility Agreement, the Company would issue to Deerfield warrants to purchase up to
10,000,000
shares of the Company’s common stock, in proportion to the amount of draw compared to the total
$50 million
facility (the "Draw Warrants") (See Note 8).
On March 20, 2014, the Company made an initial draw of
$20.0 million
under the Facility Agreement and received net proceeds of
$19.5 million
to fund the portion of the Orthotec settlement payment obligations that were due in 2014. The
$0.5 million
transaction fee was recorded as a debt discount and is being amortized over the term of the draw, which ends March 20, 2019. In connection with this borrowing, the Company issued Draw Warrants to purchase
4,000,000
shares of common stock, which were valued at
$4.7 million
and recorded as a debt discount and is being amortized over the term of the draw. Additionally,
$2.3 million
of the value of the Initial Warrants was reclassified as a debt discount and is being amortized through interest expense over the term of the debt using the effective interest method.
On November 21, 2014, the Company made a second draw of
$6.0 million
under the Facility Agreement and received net proceeds of
$5.9 million
to fund the portion of the Orthotec settlement payments through 2016. The
$0.2 million
transaction fee was recorded as a debt discount and is being amortized over the remaining term of the draw, which ends March 20, 2019. In connection with this borrowing, the Company issued Draw Warrants to purchase
1,200,000
shares of common stock, which were valued at
$0.9 million
and recorded as a debt discount and is being amortized over the term of the debt using the effective interest method.
On July 10, 2015, the Company entered into a First Amendment to the Facility Agreement (the “Facility Agreement First Amendment”), with Deerfield. The Facility Agreement First Amendment permitted the Company, among other things, to enter into and borrow the additional
$5 million
under the term loan in July 2015 under the Second Amendment to the Amended Credit Facility.
F-24
ALPHATEC HOLDINGS, INC.
NOTES TO CONSOLIDATED FINANCIAL STATEMENTS—(Continued)
As of
December 31, 2015
, Orthotec settlement payments of
$23.0 million
have been made, leaving remaining proceeds from the funds borrowed under the Facility Agreement of
$2.4 million
. These proceeds are classified as short-term restricted cash, as their use is limited by the terms of the Facility Agreement to the payments of amounts due under the Orthotec litigation settlement agreement. Additionally, a payment of
$1.1 million
was made on January 1, 2016. The amounts borrowed under the Facility Agreement, which total
$26.0 million
in principal as of
December 31, 2015
, are due in
three
equal annual payments beginning March 20, 2017. Additionally,
$0.2 million
of the value of the Initial Warrants was reclassified as a debt discount and is being amortized through interest expense over the term of the debt using the effective interest method.
The Facility Agreement contains various representations and warranties, and affirmative and negative covenants, customary for financings of this type, including restrictions on the ability of the Company and its subsidiaries to incur additional indebtedness or liens on its assets, except as permitted under the Facility Agreement. As security for our repayment of our obligations under the Facility Agreement, the Company granted to Deerfield a security interest in substantially all of our property and interests in property, which is subordinated to the security interest granted under the Amended Credit Facility. As a result of the Company's non-compliance with the MidCap fixed charge coverage ratio covenant, the Company was in cross-default of the Facility Agreement, for which the Company received a waiver from Deerfield for the months of June, August, September, October, November and December of 2015. There is no assurance that the Company will be in compliance with the financial covenants of the Amended Credit Facility in the foreseeable future, which would result in a cross-default under the Facility Agreement in which case Deerfield would have the right to call the debt outstanding under the Facility Agreement due immediately. Accordingly, the amounts borrowed under the Facility Agreement are presented on the consolidated balance sheet as of
December 31, 2015
under current liabilities, net of unamortized issuance discount.
On February 5, 2016, the Company entered into a Limited Waiver and Second Amendment to the Facility Agreement (the “Second Amendment”) with Deerfield. The Second Amendment increases the interest rate under the Facility Agreement from
8.75%
per annum to
14.75%
per annum. In addition, the Second Amendment provides that the Company may elect to have (i) until August 30, 2016, six percent (
6%
), and (ii) thereafter, three percent (
3%
), in each case, of the interest on the outstanding principal amount under the Facility Agreement paid in kind, which would be added to the outstanding principal amount under the Facility Agreement and bear interest at the interest rate of
14.75%
per annum (the “PIK Interest”). All accrued and unpaid PIK Interest is due and payable when the outstanding amounts under the Facility Agreement are due and payable thereunder or are fully repaid, whichever occurs first. The Second Amendment also contains an amendment fee in the amount of
$0.6 million
, which is due and payable in installments of
$0.2 million
on each of the third, fourth and fifth anniversaries of the Facility Agreement; provided, that all unpaid amendment fees shall be due and payable when the outstanding amounts under the Facility Agreement are due and payable or are fully repaid, whichever occurs first. The Second Amendment also changes the date March 31, 2017 to March 31, 2018, as the date through which the Company must pay interest in the event the Company prepays amounts outstanding under the Facility Agreement prior to such date. The Second Amendment also contains a waiver of the defaults under the Facility Agreement discussed in Note 1.
F-25
ALPHATEC HOLDINGS, INC.
NOTES TO CONSOLIDATED FINANCIAL STATEMENTS—(Continued)
Other Debt Agreements
The Company has various capital lease arrangements. The leases bear annual interest at rates ranging from
6.6%
to
9.6%
, are generally due in monthly principal and interest installments, are collateralized by the related equipment, and have various maturity dates through
September 2018
.
Long-term debt consists of the following (in thousands):
|
|
December 31,
|
||||||
|
|
2015
|
2014
|
|||||
|
Amended Credit Facility with MidCap
|
$
|
56,799
|
|
$
|
60,390
|
|
|
|
Facility Agreement with Deerfield
|
26,000
|
|
26,000
|
|
|||
|
Note payable related to software license purchases
|
189
|
|
250
|
|
|||
|
Financing agreements for premiums on insurance policies
|
1,599
|
|
1,580
|
|
|||
|
Total
|
84,587
|
|
88,220
|
|
|||
|
Add: capital leases (See Note 6)
|
1,277
|
|
1,784
|
|
|||
|
Less: debt discount
|
(5,279
|
)
|
(7,331
|
)
|
|||
|
Total
|
80,585
|
|
82,673
|
|
|||
|
Less: current portion of long-term debt
|
(80,105
|
)
|
(8,076
|
)
|
|||
|
Total long-term debt, net of current portion
|
$
|
480
|
|
$
|
74,597
|
|
|
Principal payments on debt are as follows as of December 31,
2015
(in thousands):
|
Year Ending December 31,
|
|
||
|
2016
(1)
|
$
|
58,587
|
|
|
2017
(1)
|
8,667
|
|
|
|
2018
(1)
|
8,667
|
|
|
|
2019
(1)
|
8,666
|
|
|
|
|
|||
|
Total
|
84,587
|
|
|
|
Add: capital lease principal payments
|
1,277
|
|
|
|
Less: debt discount
|
(5,279
|
)
|
|
|
|
|||
|
Total
|
80,585
|
|
|
|
Less: current portion of long-term debt
(1)
|
(80,105
|
)
|
|
|
|
|||
|
Long-term debt, net of current portion
|
$
|
480
|
|
|
|
|||
(1)
The amounts above are presented based on the contractual payment schedule in each of the respective agreements.
However, the debt balances under the Amended Credit Facility and Facility Agreement were callable as of December 31, 2015
due to the event of default (See Note 1) and therefore, are presented as a current liability in the consolidated balance sheet as of December 31, 2015.
6. Commitments and Contingencies
Leases
During 2008, the Company entered into a lease agreement and sublease agreement in order to consolidate the use and occupation of its then existing premises into
two
adjacent facilities, as described below. The Company also leases certain equipment and vehicles under operating leases which expire on various dates through 2018, and certain equipment under capital leases which expire on various dates through 2017.
In February 2008, the Company entered into a sublease agreement (the “Sublease”), for office, engineering, and research and development space. The Sublease term commenced May 2008 and ended on January 31, 2016. The Company renewed this Sublease in January 2016 with a commitment through July 2021
.
F-26
ALPHATEC HOLDINGS, INC.
NOTES TO CONSOLIDATED FINANCIAL STATEMENTS—(Continued)
The Company was obligated under the Sublease to pay base rent and certain operating costs and taxes for the building. Monthly base rent payable by the Company was approximately
$80,500
during the first year of the Sublease, increasing annually at a fixed annual rate of
2.5%
to approximately
$93,500
per month in the final year of the Sublease. The Company’s rent was abated for months
one
through
seven
of the Sublease. At the sublease inception, the Company paid a security deposit in the amount of approximately
$93,500
.
In March 2008, the Company entered into a lease agreement (the “Lease”) for additional office, engineering, research and development and warehouse and distribution space. The Lease term commenced on December 1, 2008 and ends on January 31, 2017. The Company is obligated under the Lease to pay base rent and certain operating costs and taxes for the building. The monthly base rent payable by the Company was approximately
$73,500
during the first year of the Lease, increasing annually at a fixed annual rate of
3.0%
to approximately
$93,000
per month in the final year of the Lease. The Company’s rent was abated for the months
two
through
eight
of the term of the Lease in the amount of
$38,480
. At the lease inception, the Company paid a security deposit in the amount of approximately
$293,200
consisting of cash and
two
letters of credit. In the event the Company achieves certain financial milestones, the lessor is obligated to return a portion of the security deposit to the Company. The lessor provided a tenant improvement allowance of
$1.1 million
to assist with the configuration of the facility to meet the Company’s business needs.
Future minimum annual lease payments under the Company’s operating and capital leases are as follows (in thousands):
|
Year ending December 31,
|
Operating
|
Capital
|
|||||
|
2016
|
$
|
2,268
|
|
$
|
877
|
|
|
|
2017
|
823
|
|
437
|
|
|||
|
2018
|
304
|
|
68
|
|
|||
|
2019
|
170
|
|
—
|
|
|||
|
2020
|
5
|
|
—
|
|
|||
|
Thereafter
|
—
|
|
—
|
|
|||
|
$
|
3,570
|
|
1,382
|
|
|||
|
Less: amount representing interest
|
(105
|
)
|
|||||
|
Present value of minimum lease payments
|
1,277
|
|
|||||
|
Current portion of capital leases
|
(797
|
)
|
|||||
|
Capital leases, less current portion
|
$
|
480
|
|
||||
Rent expense under operating leases for the years ended December 31,
2015
,
2014
and
2013
was
$3.1 million
,
$3.4 million
and
$3.8 million
, respectively.
Litigation
The Company is and may become involved in various legal proceedings arising from its business activities. While management is not aware of any litigation matter that in and of itself would have a material adverse impact on the Company’s consolidated results of operations, cash flows or financial position, litigation is inherently unpredictable, and depending on the nature and timing of a proceeding, an unfavorable resolution could materially affect the Company’s future consolidated results of operations, cash flows or financial position in a particular period. The Company assesses contingencies to determine the degree of probability and range of possible loss for potential accrual or disclosure in our consolidated financial statements. An estimated loss contingency is accrued in the Company’s consolidated financial statements if it is probable that a liability has been incurred and the amount of the loss can be reasonably estimated. Because litigation is inherently unpredictable and unfavorable resolutions could occur, assessing contingencies is highly subjective and requires judgments about future events. When evaluating contingencies, the Company may be unable to provide a meaningful estimate due to a number of factors, including the procedural status of the matter in question, the presence of complex or novel legal theories, and/or the ongoing discovery and development of information important to the matters. In addition, damage amounts claimed in litigation against the Company may be unsupported, exaggerated or unrelated to reasonably possible outcomes, and as such are not meaningful indicators of the Company’s potential liability.
F-27
ALPHATEC HOLDINGS, INC.
NOTES TO CONSOLIDATED FINANCIAL STATEMENTS—(Continued)
Royalties
The Company has entered into various intellectual property agreements requiring the payment of royalties based on the sale of products that utilize such intellectual property. These royalties primarily relate to products sold by Alphatec Spine and are calculated either as a percentage of net sales or in one instance on a per-unit sold basis. Royalties are included on the accompanying consolidated statement of operations as a component of cost of revenues.
7. Redeemable Preferred Stock
The Company issued shares of redeemable preferred stock in connection with its initial public offering in June 2006. As of December 31,
2015
, the redeemable preferred stock carrying value was
$23.6 million
and there were
20 million
shares of redeemable preferred stock authorized. The redeemable preferred stock is not convertible into common stock but is redeemable at
$9.00
per share, (i) upon the Company’s liquidation, dissolution or winding up, or the occurrence of certain mergers, consolidations or sales of all or substantially all of the Company’s assets, before any payment to the holders of the Company’s common stock, or (ii) at the Company’s option at any time. Holders of redeemable preferred stock are generally not entitled to vote on matters submitted to the stockholders, except with respect to certain matters that will affect them adversely as a class, and are not entitled to receive dividends. The carrying value of the redeemable preferred stock was
$7.11
per share at December 31,
2015
and
2014
.
The redeemable preferred stock is presented separately from stockholders’ (deficit) equity in the consolidated balance sheets and any adjustments to its carrying value up to its redemption value of
$9.00
per share will be reported as a dividend.
8. Equity Transactions
Deerfield Warrants
In connection with the execution of the Facility Agreement, on March 17, 2014, the Company issued to Deerfield the Initial Warrants to purchase an aggregate of
6,250,000
shares of the Company’s common stock immediately exercisable at an exercise price equal to
$1.39
expiring on March 17, 2020. The number of shares of common stock into which the Initial Warrants are exercisable and the exercise price will be adjusted to reflect any stock splits, payment of stock dividends, recapitalizations, reclassifications or other similar adjustments in the number of outstanding shares of the Company’s common stock. The warrants have the same dividend rights to the same extent as if the warrants had been exercised for shares of common stock.
The Company agreed that upon each disbursement borrowing under the Facility Agreement, the Company would issue to Deerfield Draw Warrants to purchase up to an aggregate of
10,000,000
shares of the Company’s common stock, at an exercise price equal to the lesser of the Initial Warrant exercise price or the average daily volume weighted average price per share of the Company’s common stock for the
15
days following the request for borrowing. The number of Draw Warrants issued for each draw is in proportion to the amount of draw compared to the total
$50 million
facility.
The Initial Warrants were valued on March 17, 2014 using a Black-Scholes option pricing model that resulted in a value of
$5.7 million
, which was recorded as a current liability with an offset to a deferred charge asset and will be amortized on a straight line basis through interest expense over the term of the Facility Agreement commitment period ended January 30, 2015. To the extent the Company draws on the
$50 million
Facility Agreement, a proportionate amount of the unamortized current deferred charge are reclassified as debt discount and are being amortized through interest expense over the term of the debt using the effective interest method.
On March 20, 2014, the Company made an initial draw of
$20 million
under the Facility Agreement and received net proceeds of
$19.5 million
to fund the portion of the Orthotec settlement payment obligations that were due in 2014. In connection with this borrowing, the Company issued Draw Warrants to purchase
4,000,000
shares of common stock at an exercise price of
$1.39
. The Draw Warrants were valued at
$4.7 million
using the Black-Scholes option pricing model, which was recorded as a current liability with an offset to debt discount.
On November 21, 2014, the Company made a second draw of
$6 million
under the Facility Agreement and received net proceeds of
$5.9 million
to fund the portion of the Orthotec settlement payments payable through 2016. The
$0.2 million
transaction fee was recorded as a debt discount and is being amortized over the remaining term of the draw, which ends March 20, 2019. In connection with this borrowing, the Company issued Draw Warrants to purchase
1,200,000
shares of common stock at an exercise price of
$1.39
, which were valued at
$0.9 million
and recorded as a debt discount and is being amortized over the term of the draw.
F-28
ALPHATEC HOLDINGS, INC.
NOTES TO CONSOLIDATED FINANCIAL STATEMENTS—(Continued)
As of
December 31, 2015
, the outstanding Initial Warrants and Draw Warrants to purchase an aggregate of
11,450,000
shares of common stock outstanding were revalued to their fair value with a gain recorded to to other income (expense) of
$8.0 million
for the
year ended
December 31, 2015
. The warrant liability of
$0.7 million
is recorded as common stock warrant liabilities within current liabilities on the consolidated balance sheet as of
December 31, 2015
.
At
December 31, 2015
, the Company's outstanding warrants were valued using the Black-Scholes option pricing model. This is a Level 3 measurement using the following assumptions:
|
December 31, 2015
|
||
|
Risk-free interest rate
|
1.3
|
%
|
|
Dividend yield
|
—
|
%
|
|
Expected volatility
|
70
|
%
|
|
Expected life (years)
|
4.3
|
|
SVB Warrants
In December 2011, in connection with the third amendment to former credit facility with the SiliconValley Bank ("SVB"), finance charges totaling
$0.2 million
were waived in exchange for the issuance to SVB of warrants to purchase
93,750
shares of the Company’s common stock. The warrants are immediately exercisable, can be exercised through a cashless exercise, have an exercise price of
$1.60
per share and have a
10
-year term.
9. Stock Benefit Plans and Stock-Based Compensation
In 2005, the Company adopted its 2005 Employee, Director, and Consultant Stock Plan (the “2005 Plan”). The 2005 Plan allows for the grant of options, restricted stock and restricted stock unit awards to employees, directors, and consultants of the Company. Since its adoption, the 2005 Plan has had
17,400,000
shares of common stock reserved for issuance. The Board of Directors determines the terms of the restricted stock, the terms of the restricted stock units, and the terms of the stock options, including the number of shares for which each option is granted, the exercise price, vesting schedule, expiration date, and whether restrictions will be imposed on the shares subject to options. Options granted under the 2005 Plan expire no later than
10 years
from the date of grant (
5 years
for incentive stock options granted to holders of more than
10%
of the Company’s voting stock). Options generally vest over a
four
year period and may be immediately exercisable upon a change of control of the Company. The exercise price of incentive stock options may not be less than
100%
of the fair value of the Company’s common stock on the date of grant. The exercise price of any option granted to a
10%
stockholder may be no less than
110%
of the fair value of the Company’s common stock on the date of grant. At December 31,
2015
, approximately
3.8
million shares of common stock remained available for issuance under the 2005 Plan. The 2005 Plan will expire in April 2016.
On July 30, 2014, the Company amended the 2005 Plan (the “Plan Amendment”) to authorize the granting of time-based and performance-based restricted stock units, which represent a contingent entitlement to receive shares of the Company’s common stock, to employees, directors and consultants of the Company under the Plan. Prior to the Plan Amendment, the Plan provided solely for the granting of stock options and restricted stock.
Stock Options
F-29
ALPHATEC HOLDINGS, INC.
NOTES TO CONSOLIDATED FINANCIAL STATEMENTS—(Continued)
A summary of the Company’s stock option activity under the 2005 Plan and related information is as follows (in thousands, except as indicated and per share data):
|
Shares
|
Weighted
average
exercise
price
|
Weighted
average
remaining
contractual
term
(in years)
|
Aggregate
intrinsic
value
|
||||||||||
|
Outstanding at December 31, 2014
|
8,267
|
|
$
|
2.08
|
|
7.35
|
|
$
|
71
|
|
|||
|
Granted
|
457
|
|
$
|
1.28
|
|
—
|
|
—
|
|
||||
|
Exercised
|
(5
|
)
|
$
|
—
|
|
—
|
|
—
|
|
||||
|
Forfeited
|
(1,081
|
)
|
$
|
2.10
|
|
—
|
|
—
|
|
||||
|
Outstanding at December 31, 2015
|
7,638
|
|
$
|
2.03
|
|
6.36
|
|
$
|
—
|
|
|||
|
Options vested and exercisable at December 31, 2015
|
5,170
|
|
$
|
2.25
|
|
5.63
|
|
$
|
—
|
|
|||
|
Options vested and expected to vest at December 31, 2015
|
7,304
|
|
$
|
2.05
|
|
6.25
|
|
$
|
—
|
|
|||
The weighted-average grant-date fair value per share of stock options granted during the years ended December 31,
2015
,
2014
and
2013
was
$1.28
,
$0.81
and
$1.09
, respectively. The aggregate intrinsic value of options at December 31,
2015
is based on the Company’s closing stock price on that date of
$0.30
per share.
As of December 31,
2015
, there was
$2.4 million
of unrecognized compensation expense for stock options and awards which is expected to be recognized on a straight-line basis over a weighted average period of approximately
1.8
years. The total intrinsic value of options exercised was immaterial for the years ended December 31,
2015
,
2014
and
2013
.
Restricted Stock Awards
The following table summarizes information about the restricted stock awards activity (in thousands, except as indicated and per share data):
|
Shares
|
Weighted
average
grant
date fair
value
|
Weighted
average
remaining
recognition
period
(in years)
|
||||||
|
Unvested at December 31, 2014
|
690
|
|
$
|
1.60
|
|
1.83
|
||
|
Awarded
|
291
|
|
$
|
1.36
|
|
|||
|
Vested
|
(243
|
)
|
$
|
1.44
|
|
|||
|
Forfeited
|
(5
|
)
|
$
|
1.80
|
|
|||
|
Unvested at December 31, 2015
|
733
|
|
$
|
1.55
|
|
0.88
|
||
The weighted average fair value per share of awards granted during the years ended December 31,
2015
,
2014
and
2013
was
$1.36
,
$1.32
and
$1.97
, respectively.
Performance-Based Restricted Stock Units
In July 2014, the Company granted
932,000
performance-based restricted stock units ("PSUs") to certain employees under its 2005 Plan. The PSUs vest based upon the Company's achievement of certain performance goals over the period from July 1, 2014 through December 31, 2016. The number of PSUs that may vest varies between
0%
-
200%
based on the achievement of such goals. The PSUs were valued at
$1.42
per share based on the closing price of the Company's common stock on the date of grant.
In February 2015, the Company granted
1,854,000
PSUs to certain employees under its 2005 Plan. The PSUs vest based upon the Company's achievement of certain performance goals over the period from January 1, 2015 through December 31, 2017. The number of PSUs that may vest varies between
0%
-
200%
based on the achievement of such goals. The PSUs were valued at
$1.35
per share based on the closing price of the Company's common stock on the date of grant.
F-30
ALPHATEC HOLDINGS, INC.
NOTES TO CONSOLIDATED FINANCIAL STATEMENTS—(Continued)
For purposes of measuring compensation expense, the amount of PSUs ultimately expected to vest is estimated at each reporting date based on management’s expectations regarding the relevant performance criteria. The related compensation expense was $
0.2 million
, $
0.2 million
and
$0.0 million
for the years ended December 31,
2015
,
2014
and
2013
, respectively. The recognition of compensation expense associated with PSUs requires judgment in assessing the probability of meeting the performance goals, as well as defined criteria for assessing achievement of the performance-related goals (in thousands, except as indicated and per share data):
|
Shares
|
Weighted
average
grant
date fair
value
|
Weighted
average
remaining
recognition
period
(in years)
|
||||||
|
Unvested at December 31, 2014
|
854
|
|
$
|
1.42
|
|
2.00
|
||
|
Awarded
|
1,854
|
|
$
|
1.34
|
|
|||
|
Vested
|
—
|
|
$
|
—
|
|
|||
|
Forfeited
|
(338
|
)
|
$
|
1.36
|
|
|||
|
Unvested at December 31, 2015
|
2,370
|
|
$
|
1.37
|
|
1.67
|
||
Elite Medical Holdings and Pac 3 Surgical Collaboration Agreement
In October 2013, the Company entered into a
three
-year collaboration agreement with
Elite Medical Holdings, LLC and Pac 3 Surgical Products, LLC (the "Collaborators") (the "Collaboration Agreement")
to provide consultation services to assist the Company in the development of its products and its products in development. Under the terms of the collaboration agreement, the Company will gain exclusive rights to the use of all intellectual property developed by the collaborators. The Company agreed to make
three
annual payments to the collaborator as sole consideration for services provided, totaling an aggregate of up to
$8 million
, paid in common stock of Alphatec Holdings at a per share price of
$1.95
, which was equal to the average NASDAQ closing price of the common stock on the
five days
leading up to and including the date of signing the Collaboration Agreement. The actual number of shares issued each year will be determined by the fair market value of the services provided over the prior
12
months.
On November 2, 2015, the Company entered into a first amendment (the "First Amendment") to the Collaboration Agreement. Pursuant to the First Amendment, in exchange for a "lock up" restriction on selling or transferring each tranche of shares issued to the Collaborators and a maximum value cap, as discussed below, the Company has agreed to make a cash payment to the Collaborators in the event that the shares in such tranche do not have a minimum amount of value based on the market value of the Company’s common stock at the end of the lock up period applicable to such tranche of shares. In addition, in the event that at the end of a lock up period the value of a tranche of shares issued to the Collaborators exceeds a certain amount, the Collaborators have agreed to forfeit shares back to the Company, so as to limit the maximum amount of value derived from such shares at the end of a lock up period. Pursuant to the First Amendment, the shares issued to the Collaborators in each of 2014, 2015 and 2016 are subject to a lock up that lasts until the first quarter of 2017, 2018 and 2019, respectively. The valuation of each tranche of shares occurs at the end of the applicable lock up period.
Based on the closing price of the Company’s common stock on December 31, 2015, the Company has recorded a guaranteed compensation liability of $
4.9 million
for shares of the Company’s common stock previously issued under the Collaboration Agreement, with
$2.2 million
payable in January of 2017,
$2.2 million
payable in January of 2018 and
$0.5 million
payable in January of 2019. This liability is presented under other long-term liabilities in the consolidated balance sheet. In addition, based on the closing price of the Company’s common stock on December 31, 2015, the Company would have an additional cash liability of
$2.1 million
for shares of the Company’s common stock issuable under the remaining terms of the Collaboration Agreement (assuming that all of the shares issuable under the Collaboration Agreement are issued) payable in 2019 in addition to the amount accrued above. If the Collaborators elect to sell, assign or transfer: (i) more than 20% of the shares issued to the Collaborators prior to the first valuation date; or (ii) any of the Collaborator shares still subject to a lockup after the first valuation date, all of the aforementioned restrictions on transfer and valuation minimums and maximums are null and void.
As of December 31, 2015, the Company has issued
2,780,787
shares of its common stock under this agreement and recorded expense of
$4.9 million
,
$1.9 million
and
$0.5 million
in the years ended December 31, 2015, 2014 and 2013, respectively, which is included in research and development expenses.
F-31
ALPHATEC HOLDINGS, INC.
NOTES TO CONSOLIDATED FINANCIAL STATEMENTS—(Continued)
Common Stock Reserved for Future Issuance
Common stock reserved for future issuance consists of the following (in thousands):
|
|
December 31, 2015
|
|
|
Stock options outstanding
|
7,638
|
|
|
Awards outstanding
|
733
|
|
|
Performance restricted stock units outstanding
|
2,370
|
|
|
Warrants outstanding
|
11,544
|
|
|
Authorized for future grant under 2005 Plan
|
3,840
|
|
|
|
||
|
26,125
|
|
|
|
|
||
10. Income Taxes
The components of the pretax loss from operations for the years ended December 31,
2015
,
2014
and
2013
are as follows (in thousands):
|
|
Year Ended December 31,
|
||||||||||
|
|
2015
|
2014
|
2013
|
||||||||
|
U.S. Domestic
|
$
|
(90,342
|
)
|
$
|
(8,106
|
)
|
$
|
(9,264
|
)
|
||
|
Foreign
|
(87,653
|
)
|
(3,689
|
)
|
(69,784
|
)
|
|||||
|
Pretax loss from operations
|
$
|
(177,995
|
)
|
$
|
(11,795
|
)
|
$
|
(79,048
|
)
|
||
The components of the provision for income taxes are presented in the following table (in thousands):
|
|
Year Ended December 31,
|
||||||||||
|
|
2015
|
2014
|
2013
|
||||||||
|
Current income tax expense (benefit):
|
|||||||||||
|
Federal
|
$
|
221
|
|
$
|
—
|
|
$
|
(21
|
)
|
||
|
State
|
149
|
|
145
|
|
186
|
|
|||||
|
Foreign
|
634
|
|
526
|
|
2,525
|
|
|||||
|
Total current
|
1,004
|
|
671
|
|
2,690
|
|
|||||
|
Deferred income tax (benefit) expense:
|
|||||||||||
|
Federal
|
(1,363
|
)
|
238
|
|
229
|
|
|||||
|
State
|
(154
|
)
|
24
|
|
15
|
|
|||||
|
Foreign
|
1,194
|
|
154
|
|
245
|
|
|||||
|
Total deferred
|
(323
|
)
|
416
|
|
489
|
|
|||||
|
Total income tax expense
|
$
|
681
|
|
$
|
1,087
|
|
$
|
3,179
|
|
||
F-32
ALPHATEC HOLDINGS, INC.
NOTES TO CONSOLIDATED FINANCIAL STATEMENTS—(Continued)
The provision for income taxes differs from the amount of income tax determined by applying the applicable U.S. statutory federal income tax rate to pretax income as a result of the following differences:
|
|
December 31,
|
|||||||
|
|
2015
|
2014
|
2013
|
|||||
|
Federal statutory rate
|
(35.0
|
)%
|
(35.0
|
)%
|
(35.0
|
)%
|
||
|
Adjustments for tax effects of:
|
||||||||
|
State taxes, net
|
(0.3
|
)
|
(1.1
|
)
|
(0.1
|
)
|
||
|
Stock-based compensation
|
0.3
|
|
6.2
|
|
0.5
|
|
||
|
Foreign taxes
|
0.2
|
|
3.4
|
|
1.1
|
|
||
|
Tax credits
|
(0.3
|
)
|
(3.3
|
)
|
(0.4
|
)
|
||
|
Deemed foreign dividend
|
0.1
|
|
—
|
|
—
|
|
||
|
Fair market value adjustments
|
(1.6
|
)
|
(7.6
|
)
|
—
|
|
||
|
Intercompany debt forgiveness and other permanent adjustments
|
0.6
|
|
3.1
|
|
9.5
|
|
||
|
Goodwill impairment
|
29.1
|
|
—
|
|
—
|
|
||
|
Tax rate adjustment
|
0.4
|
|
0.4
|
|
0.2
|
|
||
|
Uncertain tax positions
|
(0.1
|
)
|
5.3
|
|
2.7
|
|
||
|
Other
|
3.1
|
|
0.2
|
|
(0.4
|
)
|
||
|
Valuation allowance
|
3.8
|
|
37.5
|
|
25.9
|
|
||
|
Effective income tax rate
|
0.3
|
%
|
9.1
|
%
|
4.0
|
%
|
||
The 2015 provision for income taxes primarily consists of goodwill impairment, an increase in unrecognized tax benefits associated with the European operations, tax expense related to non-income based state tax in the U.S., an increase in the valuation allowance for Japanese deferred tax assets and current year income in Japan and Brazil.
Significant components of the Company’s deferred tax assets and liabilities as of December 31,
2015
and
2014
are as follows (in thousands):
|
|
December 31,
|
||||||
|
|
2015
|
2014
|
|||||
|
Deferred tax assets:
|
|||||||
|
Allowances and reserves
|
$
|
955
|
|
$
|
818
|
|
|
|
Accrued expenses
|
2,331
|
|
3,674
|
|
|||
|
Inventory reserves
|
9,631
|
|
8,532
|
|
|||
|
Net operating loss carryforwards
|
43,427
|
|
41,965
|
|
|||
|
Property and equipment
|
2,420
|
|
1,976
|
|
|||
|
Stock-based compensation
|
2,377
|
|
2,168
|
|
|||
|
Legal settlement
|
11,806
|
|
1,204
|
|
|||
|
Goodwill
|
3,362
|
|
—
|
|
|||
|
Income tax credit carryforwards
|
3,235
|
|
2,218
|
|
|||
|
Total deferred tax assets
|
79,544
|
|
62,555
|
|
|||
|
Valuation allowance
|
(63,612
|
)
|
(58,781
|
)
|
|||
|
Total deferred tax assets, net of valuation allowance
|
15,932
|
|
3,774
|
|
|||
|
Deferred tax liabilities:
|
|||||||
|
Investment in foreign partnership
|
15,467
|
|
—
|
|
|||
|
Intangible assets
|
465
|
|
2,881
|
|
|||
|
Goodwill
|
—
|
|
1,518
|
|
|||
|
Total deferred tax liabilities
|
15,932
|
|
4,399
|
|
|||
|
Net deferred tax assets (liabilities)
|
$
|
—
|
|
$
|
(625
|
)
|
|
F-33
ALPHATEC HOLDINGS, INC.
NOTES TO CONSOLIDATED FINANCIAL STATEMENTS—(Continued)
The realization of deferred tax assets is dependent on the Company’s ability to generate sufficient taxable income in future years in the associated jurisdiction to which the deferred tax assets relate. As of
December 31, 2015
, a valuation allowance of
$63.6 million
has been established against the net deferred tax assets as realization is uncertain. The deferred tax liabilities consist primarily of the excess of the book value over the tax basis of their investment in the foreign partnership.
In determining the need for a valuation allowance the Company considers all available positive and negative evidence, including scheduled reversals of deferred tax liabilities, projected future taxable income, tax planning strategies, and recent financial performance. Based on the review of all positive and negative evidence, including a
three
year cumulative pre-tax loss, the Company determined that a full valuation allowance should be recorded against all deferred tax assets at
December 31, 2015
.
At December 31,
2015
, the Company has unrecognized tax benefits of
$10.4 million
of which
$8.9 million
will affect the effective tax rate if recognized when the Company no longer has a valuation allowance offsetting its deferred tax assets.
The following table summarizes the changes to unrecognized tax benefits for the years ended December 31,
2015
,
2014
and
2013
(in thousands):
|
|
Year ended December 31,
|
||||||||||
|
|
2015
|
2014
|
2013
|
||||||||
|
Unrecognized tax benefit at the beginning of the year
|
8,861
|
|
7,835
|
|
5,897
|
|
|||||
|
Additions based on tax positions related to the current year
|
859
|
|
1,050
|
|
1,664
|
|
|||||
|
Additions based on tax positions related to the prior year
|
1,144
|
|
391
|
|
221
|
|
|||||
|
Reductions as a result of lapse of applicable statute of limitations
|
(76
|
)
|
(40
|
)
|
(20
|
)
|
|||||
|
Reductions as a result of foreign exchange rates and other
|
(429
|
)
|
(375
|
)
|
73
|
|
|||||
|
Unrecognized tax benefits at the end of the year
|
$
|
10,359
|
|
$
|
8,861
|
|
$
|
7,835
|
|
||
The Company believes it is reasonably possible it will not materially reduce its unrecognized tax benefits within the next
12 months
.
The Company and its subsidiaries are subject to federal income tax as well as income tax of multiple state and foreign jurisdictions. With few exceptions, the Company is no longer subject to income tax examination by tax authorities in major jurisdictions for years prior to 2010. However, to the extent allowed by law, the taxing authorities may have the right to examine prior periods where net operating losses and tax credits were generated and carried forward, and make adjustments up to the amount of the carryforwards. The Company is not currently under examination by the Internal Revenue Service, foreign or state and local tax authorities.
The Company recognizes interest and penalties related to uncertain tax positions as a component of the income tax provision. As of December 31,
2015
, accrued interest and penalties were
$1.2 million
, which primarily relates to the uncertain tax positions of the Scient’x operations. During
2015
, there was an increase of
$0.1 million
in the accrued interest and penalties related to the uncertain tax positions of the Scient’x operations.
At December 31,
2015
, the Company had federal and state net operating loss carryforwards of
$91.1 million
and
$90.4 million
, respectively, expiring at various dates through
2035
. At December 31,
2015
, the Company had federal and state research and development tax credits of
$3.3 million
and
$3.0 million
, respectively. The federal research and development tax credits expire at various dates through
2035
, while the state credits do not expire. The Company had foreign net operating loss carryforwards of
$37.6 million
beginning to expire in
2018
. Utilization of the net operating loss and tax credit carryforwards may become subject to annual limitations due to ownership change limitations that could occur in the future as provided by Section 382 of the Internal Revenue Code of 1986, as amended (the “Internal Revenue Code”), as well as similar state and foreign provisions. These ownership changes may limit the amount of the net operating loss and tax credit carryforwards that can be utilized annually to offset future taxable income.
The Company does not record U.S. income taxes on the undistributed earnings of its foreign subsidiaries based upon the Company’s intention to permanently reinvest undistributed earnings to ensure sufficient working capital and further expansion of existing operations outside the United States. The undistributed earnings of the foreign subsidiaries as of December 31,
2015
are immaterial. In the event the Company is required to repatriate funds from outside of the United States, such repatriation would be subject to local laws, customs, and tax consequences. Determination of the amount of unrecognized deferred tax liability related to these earnings is not practicable.
F-34
ALPHATEC HOLDINGS, INC.
NOTES TO CONSOLIDATED FINANCIAL STATEMENTS—(Continued)
Under current GAAP, in a classified statement of financial position, deferred tax assets and liabilities are separated into a current amount and a non-current amount on the basis of the classification of the related asset or liability for financial reporting. Deferred tax assets and liabilities that are not related to an asset or liability for financial reporting are classified according to the expected reversal date of the temporary difference. On November 20, 2015, the FASB issued Accounting Standards Update 2015-17, Income Taxes (Topic 740): Balance Sheet Classification of Deferred Taxes which requires noncurrent classification of all deferred tax assets and liabilities for all public entities for annual periods beginning after December 15, 2016. Accounting Standards Update 2015-17 also provides for early adoption for all entities as of the beginning of an annual period. For the year ended December 31, 2015, the Company has elected to early adopt Accounting Standards Update 2015-17 and presents all of its deferred tax assets and liabilities as non-current for the period ended December 31, 2015. The Company has applied the Standard on a prospective basis. Therefore, the classification of deferred tax assets and liabilities in periods prior to the period ended December 31, 2015 has not been changed from the original presentation.
11. Segment and Geographical Information
Operating segments are defined as components of an enterprise for which separate financial information is available and evaluated regularly by the chief operating decision maker, or decision-making group, in deciding how to allocate resources and in assessing performance. The Company operates in
one
reportable business segment.
During the years ended December 31,
2015
,
2014
and
2013
, the Company operated in
two
geographic regions, consisting of the U.S. region and the International region. The International region consists of locations outside of the U.S. In the International region, sales in Japan for the years ended December 31,
2015
,
2014
and
2013
totaled
$33.0 million
,
$31.9 million
and
$28.0 million
, respectively, which represented greater than
10 percent
of the Company’s consolidated revenues for such years. For the years ended December 31,
2015
,
2014
and
2013
, sales in other individual countries included in the International region did not exceed
10 percent
of consolidated revenues.
Revenues attributed to the geographic location of the customers were as follows (in thousands):
|
|
Year Ended December 31,
|
||||||||||
|
|
2015
|
2014
|
2013
|
||||||||
|
United States
|
$
|
114,578
|
|
$
|
137,060
|
|
$
|
134,951
|
|
||
|
International
|
70,701
|
|
69,920
|
|
69,773
|
|
|||||
|
Total consolidated revenues
|
$
|
185,279
|
|
$
|
206,980
|
|
$
|
204,724
|
|
||
Total assets by geographic region were as follows (in thousands):
|
|
December 31,
|
||||||
|
|
2015
|
2014
|
|||||
|
United States
|
$
|
97,967
|
|
$
|
200,978
|
|
|
|
International
|
48,737
|
|
143,945
|
|
|||
|
Total consolidated assets
|
$
|
146,704
|
|
$
|
344,923
|
|
|
12. Related Party Transactions
For the years ended December 31,
2015
,
2014
and
2013
, the Company incurred costs of less than
$0.1 million
,
$0.2 million
and
$0.2 million
, respectively, to Foster Management Company and HealthpointCapital, LLC for travel and administrative expenses. John H. Foster, who was one of the Company's directors until March 2, 2016 is a significant equity holder of HealthpointCapital, LLC, an affiliate of HealthpointCapital Partners, L.P. and HealthpointCapital Partners II, L.P., which are the Company’s principal stockholders.
Indemnification Agreements
The Company has entered into indemnification agreements with certain of its directors, which are named defendants in the Orthotec litigation matter in New York (See Note 6). The indemnification agreements require the Company to indemnify these individuals to the fullest extent permitted by applicable law and to advance expenses incurred by them in connection with any proceeding against them with respect to which they may be entitled to indemnification by the Company. For the years ended December 31,
2015
,
2014
and 2013, the Company paid less than
$0.1 million
, less than
$0.1 million
and
$1.7 million
,
F-35
ALPHATEC HOLDINGS, INC.
NOTES TO CONSOLIDATED FINANCIAL STATEMENTS—(Continued)
respectively, in connection with the indemnification obligations of Scient’x and Surgiview, all of which was related to the Orthotec matter. (See Note 6).
13. Retirement Plan
The Company maintains an employee savings plan that qualifies as a deferred salary arrangement under Section 401(k) of the Internal Revenue Code. Under the savings plan, participating employees may contribute a portion of their pre-tax earnings, up to the Internal Revenue Service annual contribution limit. Additionally, the Company may elect to make matching contributions into the savings plan at its sole discretion of up to
4%
of each individual’s compensation. Matching contributions vest after
one
year of service. The Company’s total contributions to the 401(k) plan were
$0.6 million
in each of the years ended December 31,
2015
,
2014
and
2013
.
14. Restructuring Activities
In 2013, the Company announced that Scient'x began a process to significantly restructure its business operations in France in an effort to improve operating efficiencies and rationalize its cost structure and in 2015 the Company iniitated plans to close its French operations. The restructuring included a reduction in Scient'x's workforce and closing of the manufacturing facilities in France. The Company has recorded total costs of
$10.6 million
through December 31, 2015, which includes employee severance, social plan benefits and related taxes, facility closing costs, manufacturing transfer costs, and contract termination costs. The Company has substantially completed the activities associated with the restructuring as of
December 31, 2015
, and majority of the related liabilities have been settled.
In connection with the restructuring plan, the Company modified its estimate of inventory and instrument net book value at its Scient'x entities based on revised global demand. The Company recorded an additional inventory reserve of
$4.9 million
in the year ended December 31, 2013 which is included in cost of goods sold within the consolidated statements of operations.
On July 6, 2015, the Company announced a restructuring of its manufacturing operations in California in an effort to improve its cost structure. The restructuring includes a reduction in workforce and closing the California manufacturing facility. Restructuring liabilities are measured at fair value and recognized as incurred. The restructuring will be completed in 2016 and the Company estimates that it will incur termination benefits, accelerated depreciation, facility closing and other restructuring costs of up to
$4 million
. The Company incurred expenses of
$2.2 million
in the year ended December 31, 2015 related to these restructuring activities.
15. Cross Medical
On February 12, 2010, a complaint was filed in the U.S. District Court for the Central District of California, by Cross Medical Products, LLC, or Cross, (a subsidiary of Biomet),
Cross Medical Products, LLC v. Alphatec Spine, Inc.,
Case No. 8:10-cv-176-MRP -MLG, alleging that we breached a patent license agreement with Cross by failing to make certain royalty payments allegedly due under the agreement. Cross was seeking payment of prior royalties allegedly due from the Company’s sales of polyaxial screws and an order from the court regarding payment of future royalties by us. In its complaint, Cross alleged a material amount of damages were due to it as a result of our alleged breach of the patent license agreement.
In January 2011, we filed a complaint in the U.S. District Court for the Southern District of California against Biomet, Inc., or Biomet, alleging that Biomet’s TPS-TL products infringe one of our patents. On December 30, 2011, we reached a global settlement agreement of the pending lawsuits with Biomet and Cross. Under the terms of the settlement, all parties obtained a release of all claims that were the subject of the disputes. No party has admitted liability in connection with the settlement. The settlement also includes an amendment to the April 23, 2003 License Agreement.
As part of the settlement, we agreed to pay Cross an initial payment of
$5 million
, which was paid in January 2012. In addition to the initial payment, we agreed to make
thirteen
quarterly payments of
$1 million
beginning on August 1, 2012, with each subsequent payment due three months thereafter until the final payment in August 2015. The remaining cash obligations totaling
$3 million
were paid in 2015. In addition, pursuant to the settlement, the parties have exchanged covenants not to sue for patent infringement with respect to products that each respective company had on the market as of December 30, 2011.
F-36
ALPHATEC HOLDINGS, INC.
NOTES TO CONSOLIDATED FINANCIAL STATEMENTS—(Continued)
16. Quarterly Financial Data (Unaudited)
The following financial information reflects all normal recurring adjustments, which are, in the opinion of management, necessary for a fair statement of the results of the interim periods. Summarized quarterly data for fiscal
2015
and
2014
are as follows (in thousands, except per share data):
|
|
Year ended December 31, 2015
|
||||||||||||||
|
|
1st
Quarter
|
2nd
Quarter
|
3rd
Quarter
|
4th
Quarter
|
|||||||||||
|
Selected quarterly financial data:
|
|||||||||||||||
|
Revenue
|
$
|
48,647
|
|
$
|
46,633
|
|
$
|
42,996
|
|
$
|
47,003
|
|
|||
|
Gross profit
|
32,943
|
|
27,527
|
|
28,479
|
|
31,135
|
|
|||||||
|
Total operating expenses
|
31,801
|
|
30,354
|
|
193,427
|
|
36,941
|
|
|||||||
|
Net loss
|
(4,561
|
)
|
(3,947
|
)
|
(160,265
|
)
|
(9,903
|
)
|
|||||||
|
Net loss per basic share (1)
|
(0.05
|
)
|
(0.04
|
)
|
(1.61
|
)
|
(0.10
|
)
|
|||||||
|
Net loss per diluted share (1)
|
(0.05
|
)
|
(0.04
|
)
|
(1.61
|
)
|
(0.10
|
)
|
|||||||
|
|
Year ended December 31, 2014
|
||||||||||||||
|
|
1st
Quarter
|
2nd
Quarter
|
3rd
Quarter
|
4th
Quarter
|
|||||||||||
|
Selected quarterly financial data:
|
|||||||||||||||
|
Revenue
|
$
|
49,173
|
|
$
|
53,167
|
|
$
|
51,013
|
|
$
|
53,627
|
|
|||
|
Gross profit
|
33,294
|
|
36,120
|
|
36,306
|
|
37,690
|
|
|||||||
|
Total operating expenses
|
37,996
|
|
34,279
|
|
34,574
|
|
34,717
|
|
|||||||
|
Net loss
|
(6,673
|
)
|
(2,895
|
)
|
(3,041
|
)
|
(273
|
)
|
|||||||
|
Net loss per basic share (1)
|
(0.07
|
)
|
(0.03
|
)
|
(0.03
|
)
|
0.00
|
|
|||||||
|
Net loss per diluted share (1)
|
(0.07
|
)
|
(0.03
|
)
|
(0.04
|
)
|
(0.03
|
)
|
|||||||
|
(1)
|
Basic and diluted net loss per share is computed independently for each of the quarters presented. Therefore, the sum of the quarterly per share amounts will not necessarily equal the total for the year.
|
F-37
SCHEDULE II—VALUATION AND QUALIFYING ACCOUNTS
|
Allowance
for
Doubtful
Accounts (1)
|
Reserve for
Excess and
Obsolete
Inventories (2)
|
||||||
|
|
(In thousands)
|
||||||
|
Balance at December 31, 2012
|
$
|
1,074
|
|
$
|
17,222
|
|
|
|
Provision
|
404
|
|
11,652
|
|
|||
|
Write-offs and recoveries, net
|
(430
|
)
|
(4,928
|
)
|
|||
|
Balance at December 31, 2013
|
1,048
|
|
23,946
|
|
|||
|
Provision
|
522
|
|
3,539
|
|
|||
|
Write-offs and recoveries, net
|
(777
|
)
|
(6,160
|
)
|
|||
|
Balance at December 31, 2014
|
793
|
|
21,325
|
|
|||
|
Provision
|
584
|
|
2,159
|
|
|||
|
Write-offs and recoveries, net
|
(315
|
)
|
(3,854
|
)
|
|||
|
Balance at December 31, 2015
|
$
|
1,062
|
|
$
|
19,630
|
|
|
|
(1)
|
The provision is included in selling expenses.
|
|
(2)
|
The provision is included in cost of revenues.
|
F-38
TABLE OF CONTENTS
Part IItem 1. BusinessItem 1A. Risk FactorsItem 1B. Unresolved Staff CommentsItem 2. PropertiesItem 3. Legal ProceedingsItem 4. Mine Safety DisclosuresPart IIItem 5. Market For Registrant S Common Equity, Related Stockholder Matters and Issuer Purchases Of Equity SecuritiesItem 6. Selected Financial DataItem 7. Management S Discussion and Analysis Of Financial Condition and Results Of OperationsItem 7A. Quantitative and Qualitative Disclosures About Market RiskItem 8. Financial Statements and Supplementary DataItem 9. Changes in and Disagreements with Accountants on Accounting and Financial DisclosureItem 9A. Controls and ProceduresItem 9B. Other InformationPart IIIItem 10. Directors, Executive Officers and Corporate GovernanceItem 11. Executive CompensationItem 12. Security Ownership Of Certain Beneficial Owners and Management and Related Stockholder MattersItem 13. Certain Relationships and Related Transactions, and Director IndependenceItem 14. Principal Accounting Fees and ServicesPart IVItem 15. Exhibits, Financial Statement SchedulesItem 15 (a) The Following Documents Are Filed As Part Of This Annual Report on Form 10-k:Item 15 (a)Item 15(a)(3) Exhibits ListItem 15(a)(3)