A10 NETWORKS, INC.
10-Ks and 10-Qs
|
|
|
|
|
|
|
|
|
|
|
|
|
|
|
|
|
|
|
|
|
|
|
|
|
|
|
|
|
|
|
|
|
|
|
|
|
|
|
|
|
UNITED STATES
SECURITIES AND EXCHANGE COMMISSION
Washington, D.C. 20549
Form 10-K
(Mark One)
|
x
|
ANNUAL REPORT PURSUANT TO SECTION 13 OR 15(d) OF THE SECURITIES EXCHANGE ACT OF 1934
|
For the fiscal year ended December 31, 2014
OR
|
¨
|
TRANSITION REPORT PURSUANT TO SECTION 13 OR 15(d) OF THE SECURITIES EXCHANGE ACT OF 1934
|
For the transition period from
to
Commission file number: 001-36343
A10 NETWORKS, INC.
(Exact Name of Registrant as Specified in its Charter)
|
Delaware
|
|
20-1446869
|
|
(State or Other Jurisdiction of Incorporation or Organization)
|
|
(I.R.S. Employer Identification No.)
|
|
3 West Plumeria Drive, San Jose, California 95134
|
||
|
(Address of Principal Executive Offices, including zip code)
|
||
(408) 325-8668
(Registrant’s Telephone Number, Including Area Code)
Securities registered pursuant to Section 12(b) of the Act:
|
Title of Each Class
|
|
Name of Each Exchange on Which Registered
|
|
Common Stock, $.00001 Par Value
|
|
New York Stock Exchange
|
Securities registered pursuant to Section 12(g) of the Act:
None.
Indicate by check mark if the registrant is a well-known seasoned issuer, as defined in Rule 405 of the Securities Act.
Yes
¨
No
x
Indicate by check mark if the registrant is not required to file reports pursuant to Section 13 or Section 15(d) of the Act.
Yes
¨
No
x
Indicate by check mark whether the registrant: (1) has filed all reports required to be filed by Section 13 or 15(d) of the Securities Exchange Act of 1934 during the preceding 12 months (or for such shorter period that the registrant was required to file such reports), and (2) has been subject to such filing requirements for the past 90 days. Yes
x
No
¨
Indicate by check mark whether the registrant has submitted electronically and posted on its corporate Web site, if any, every Interactive Data File required to be submitted and posted pursuant to Rule 405 of Regulation S-T during the preceding 12 months (or for such shorter period that the registrant was required to submit and post such files). Yes
x
No
¨
Indicate by check mark if disclosure of delinquent filers pursuant to Item 405 of Regulation S-K is not contained herein, and will not be contained, to the best of registrant’s knowledge, in definitive proxy or information statements incorporated by reference in Part III of this Form 10-K, or any amendment to this Form 10-K.
¨
Indicate by check mark whether the registrant is a large accelerated filer, an accelerated filer, a non-accelerated filer, or a smaller reporting company. See the definitions of “large accelerated filer,” “accelerated filer” and “smaller reporting company” in Rule 12b-2 of the Exchange Act. (Check one):
|
Large accelerated filer
|
|
¨
|
|
|
|
Accelerated filer
|
|
¨
|
|
|
|
|
|
|
||||
|
Non-accelerated filer
|
|
x
|
|
(Do not check if a smaller reporting company)
|
|
Smaller reporting company
|
|
¨
|
Indicate by check mark whether the registrant is a shell company (as defined in Rule 12b-2 of the Exchange Act). Act). Yes
¨
No
x
The aggregate market value of the registrant's common stock held by non-affiliates of the registrant as of June 30, 2014 (the last business day of the registrant's most recently completed second fiscal quarter) was approximately
$465.2 million
, based upon the closing sale price of such stock on the New York Stock Exchange. For purposes of this disclosure, shares of
common stock held or controlled by executive officers and directors of the registrant and by persons who hold more than 5% of the outstanding shares of common stock have been treated as shares held by affiliates. However, such treatment should not be construed as an admission that any such person is an “affiliate” of the registrant. The registrant has no non-voting
common equity.
As of
February 27, 2015
the number of outstanding shares of the registrant’s common stock, par value
$0.00001
per share, was
61,544,312
.
DOCUMENTS INCORPORATED BY REFERENCE
As noted herein, the information called for by Part III is incorporated by reference to specified portions of the Registrant's definitive proxy statement to be filed in conjunction with the Registrant's 2015 Annual Meeting of Stockholders, which is expected to be filed not later than 120 days after the Registrant's fiscal year ended December 31, 2014.
|
A10 NETWORKS, INC.
ANNUAL REPORT ON FORM 10-K
FOR THE YEAR ENDED DECEMBER 31, 2014
TABLE OF CONTENTS
|
||
|
Page
|
||
|
PART I
|
||
|
Item 1.
|
||
|
Item 1A.
|
||
|
Item 1B.
|
||
|
Item 2.
|
||
|
Item 3.
|
||
|
Item 4.
|
||
|
PART II
|
||
|
Item 5.
|
||
|
Item 6.
|
||
|
Item 7.
|
||
|
Item 7A.
|
||
|
Item 8.
|
||
|
Item 9.
|
||
|
Item 9A.
|
||
|
Item 9B.
|
||
|
PART III
|
||
|
Item 10.
|
||
|
Item 11.
|
||
|
Item 12.
|
||
|
Item 13.
|
||
|
Item 14.
|
||
|
PART IV
|
||
1
FORWARD
‑
LOOKING STATEMENTS
This Annual Report on Form 10-K contains forward
‑
looking statements made pursuant to the provisions of Section 21E of the Securities Exchange Act of 1934. These forward
‑
looking statements are based on management's current expectations and beliefs, including estimates and projections about our industry. The following discussion and analysis contains forward-looking statements within the meaning of the Private Securities Litigation Reform Act of 1995. The words “believe,” “may,” “will,” “potentially,” “estimate,” “continue,” “anticipate,” “intend,” “could,” “would,” “project,” “plan” “expect,” and similar expressions that convey uncertainty of future events or outcomes are intended to identify forward-looking statements.
These forward-looking statements include, but are not limited to, statements concerning the following:
|
•
|
our ability to maintain an adequate rate of revenue growth;
|
|
•
|
our business plan and our ability to effectively manage our growth;
|
|
•
|
costs associated with defending intellectual property infringement and other claims;
|
|
•
|
our ability to attract and retain end-customers;
|
|
•
|
our ability to further penetrate our existing customer base;
|
|
•
|
our ability to displace existing products in established markets;
|
|
•
|
our ability to expand our leadership position in next-generation application delivery and server load balancing solutions;
|
|
•
|
our ability to timely and effectively scale and adapt our existing technology;
|
|
•
|
our ability to innovate new products and bring them to market in a timely manner;
|
|
•
|
our ability to expand internationally;
|
|
•
|
the effects of increased competition in our market and our ability to compete effectively;
|
|
•
|
the effects of seasonal trends on our results of operations;
|
|
•
|
our expectations concerning relationships with third parties;
|
|
•
|
the attraction and retention of qualified employees and key personnel;
|
|
•
|
our ability to maintain, protect, and enhance our brand and intellectual property; and
|
|
•
|
future acquisitions of or investments in complementary companies, products, services or technologies.
|
These forward-looking statements are subject to a number of risks, uncertainties, and assumptions, including those described in Item 1A Risk Factors and elsewhere in this Annual Report on Form 10-K. Moreover, we operate in a very competitive and rapidly changing environment, and new risks emerge from time to time. It is not possible for
our management to predict all risks, nor can we assess the impact of all factors on our business or the extent to which any factor, or combination of factors, may cause actual results to differ materially from those contained in any forward-looking statements we may make. In light of these risks, uncertainties, and assumptions, the forward-looking events and circumstances discussed in this Annual Report on Form 10-K may not occur and actual results could differ materially and adversely from those anticipated or implied in the forward-looking statements.
The forward-looking statements in this report speak only as of the time they are made and do not necessarily reflect our outlook at any other point in time. We undertake no obligation to update publicly any forward-looking statements, whether as a result of new information, future event, or for any other reason. However, readers should carefully review the risk factors set forth in other reports or documents we file from time to time with the Securities and Exchange Commission.
As used herein, “A10 Networks,” the “Company,” “we,” “our,” and similar terms include A10 Networks, Inc. and its subsidiaries, unless the context indicates otherwise.
2
BUSINESS
Overview
We are a leading provider of advanced application networking technologies. Our solutions enable enterprises, service providers, Web giants and government organizations to accelerate, secure and optimize the performance of their data center applications and networks. Our products are built on our Advanced Core Operating System, or ACOS which is designed to enable our products to deliver substantially greater performance and security relative to prior generation application networking products. Our software based ACOS architecture also provides the flexibility that enables us to expand our business to offer additional products to solve a growing array of networking and security challenges arising from increased Internet cloud and mobile computing.
We currently offer three software based advanced application networking solutions. These are Application Delivery Controllers, or ADCs, to optimize data center performance; Carrier Grade Networking products, or CGN, to provide address and protocol translation services for service provider networks; and a Distributed Denial of Service Threat Protection System, or TPS, for network-wide security protection. We deliver these solutions both on optimized hardware appliances and as virtual appliances across our Thunder Series and AX Series product families.
Our ACOS platform architecture is optimized for modern 64-bit computer processors, or CPUs, which increasingly have multiple parallel processing cores that operate within a single CPU for higher efficiency and performance scalability. In order to maximize the capabilities of these increasingly dense multi-core CPUs, ACOS implements a proprietary shared memory architecture that provides all cores with simultaneous access to common memory. This shared memory architecture enables our products to utilize these multi-core CPUs efficiently and scale performance with increasing CPU cores. As a result, we believe our ACOS application networking platform enables us to provide our end-customers with products that can deliver superior price performance benefits over products that lack these capabilities. ACOS’ high performance design enables our products to address a wide range of today’s performance-driven networking challenges. For example, we have expanded our products’ capabilities to defend against the rising volume of large scale, sophisticated cyber security threats, such as Distributed Denial of Service, or DDoS, and other increasingly sophisticated high volume network attacks. The flexible software design of ACOS enables our end-customers to deploy our products across a number of new models for Information Technology ("IT") operations, such as managed hosting of their network by a third party provider and Internet cloud-based applications and networks.
We sell our products globally to service providers and enterprises that depend on data center applications and networks to generate revenue and manage operations efficiently. Our high-touch sales force engages directly or through indirect distribution channels with our end-customers. We believe that a high-touch, customer-focused selling process is important before, during and after the sale of our products to maximize our sales success. Product fulfillment is generally done through our original equipment manufacturers or distribution channel partners.
For the years ended December 31, 2012, 2013 and 2014, our total revenue was
$120.1 million
,
$141.7 million
and
$179.5 million
, representing a compound annual growth rate of approximately 22% from 2012 to 2014. Our total revenue grew
18%
from 2012 to 2013 and
27%
from 2013 to 2014. For the years ended December 31, 2012, 2013 and 2014, our gross margin was
80%
,
76%
and
76%
. We generated a net loss of
$90.2 million
,
$27.1 million
and
$34.7 million
for the years ended December 31, 2012, 2013 and 2014. Our net loss in 2012 and 2013 was affected by the settlement of, and legal expenses related to, our litigation with Brocade Communications Systems, Inc.
Trends Driving Continued Evolution of Application Networking
Commercial damage and customer dissatisfaction from poor website, data center application and network performance can have a lasting negative impact well beyond the expenses related directly to the downtime. To optimize data center application and network performance and avoid unforeseen downtime, organizations deploy application networking technology to ensure the performance and security of data center resources. These organizations must simultaneously address significant networking industry trends such as:
•
Increased Adoption of Cloud Computing Applications
. As organizations move their business critical applications to the cloud, they need application networking solutions optimized for cloud computing that can scale with the performance demands and security expectations of this growth.
3
•
Increased Network Complexity Due to Virtualization and Software Defined Networking Adoption.
Application networking technologies need to adapt to software-oriented data center architectures, including virtualization and Software Defined Networking, or SDN.
•
Rapid Growth of Internet-Connected Devices and the Exhaustion of the Existing IP Address Space
.
The rapid growth of mobile and other Internet-connected devices has overwhelmed the current Internet Protocol addressing scheme, IPv4. To support this rapid growth of Internet-connected devices, application networking technology will play an increasingly significant role in managing two Internet connection standards simultaneously, extending the viability of IPv4 and enabling end-customers to move to the IPv6 standard.
•
Increasing Risk from Cyber Security Threats.
Cybercriminals, foreign military intelligence organizations and amateur hackers are targeting the data centers of organizations of every type. Authentication, application security and encryption are necessary but insufficient defenses against increasingly sophisticated attacks. In one particular cyber threat, a DDoS attack, the perpetrator attempts to render the target network unavailable for its intended purpose by orchestrating coordinated attacks from massive worldwide networks of compromised computers, called botnets. DDoS attacks have become more frequent and sophisticated and can easily overwhelm an inadequately protected target network. As these and other types of attacks have become more frequent and sophisticated, organizations increasingly rely on application networking technologies for defense.
•
Exponential Growth in Data Center Speeds
.
Organizations are enhancing the performance of their networks by increasing the data traffic speeds of their data center networks from the 1 and 10 Gigabit Ethernet rates in use over the last ten years to 40 Gigabit Ethernet currently and are now evolving to 100 Gigabit Ethernet. Organizations require high performance application networking technology to ensure data center application and network performance and security are maintained despite rapidly escalating data rates.
Need for Next-Generation High Performance Application Networking
In order to address these increasingly complex network challenges, a new generation of application-aware networking solutions is needed in order to look deeply into application content, modify content for performance optimization or security purposes, and forward the traffic at rapidly escalating network data rates. Next-generation application networking solutions require:
•
Ability to Scale with High Speed Network Traffic.
As the number of Internet-connected devices continues to increase rapidly and the speed of network traffic continues to accelerate, architectural limitations in first-generation application networking approaches prevent them from responding effectively due to their inability to scale performance effectively with newer multi-core processor architectures. Next-generation application networking technologies must be able to analyze application data intelligently as they move through faster networks to take full advantage of the increasing computing power of modern multi-core processors.
•
Platform to Provide Broad Application Extensibility.
First-generation approaches to application networking use rigid system architectures that have been unable to respond effectively to the escalating security threats and the rapidly changing requirements of modern applications and cloud computing. Next-generation application networking technology must be flexible and agile to address the increasing array of networking and application challenges.
•
Sophisticated Security Functionality.
Next-generation application networking technology should be capable of detecting and mitigating the effects of large-scale, sophisticated cyber security threats such as DDoS and other attacks at the application level of the network. In order to defend against the rising volume of these sophisticated cyber-attacks, which circumvent conventional network based security solutions, application networking solutions must have exceptional application content, inspection capabilities and processing speeds.
•
Ability to Accommodate a Variety of IT Delivery Models.
Enterprises are increasingly handling their information technology needs in a variety of ways, including operating their own conventional dedicated data centers, and outsourcing to managed IT hosting providers of cloud-based applications to multiple clients often known as Infrastructure-as-a-Service. Some application networking vendors offer products for only a subset of these IT delivery models, or provide inconsistent features and management across these products, which is unacceptable to customers using multiple IT delivery models. Organizations need consistent application networking features and functionality regardless of which IT model, or combination of models they use, and regardless of whether their networks are in virtual or physical forms.
4
•
Predictable Operational Performance.
As data center traffic grows, first-generation approaches have limitations that can cause unpredictable performance that cannot consistently meet expected service levels. Next-generation application networking needs to deliver appropriate levels of service at ever-increasing data traffic rates.
Technology
Our Advanced Core Operating System Platform
ACOS Scalable Symmetrical Multi Processing Platform.
ACOS is a scalable, flexible and agile software based platform for next-generation application networking. Our proprietary ACOS 64-bit shared memory architecture is critical for current and future performance and scalability requirements. Because ACOS is software based, we can use merchant silicon and industry standard x86 processors to increase our product development velocity, decrease our product development costs, and expand into new product markets. All of our products are built on our ACOS platform and leverage its performance optimization and security services.
ACOS is a symmetric multiprocessing operating system that was built from the ground up to leverage industry trends toward higher density, multi-core processor architectures.

•
High Performance and Intelligent Network I/O Processing.
In order to maximize the efficiency of high density, multi-core processors, we have developed a high performance intelligent network I/O technology that can balance application traffic flows equitably across processor cores. Our Flexible Traffic Accelerator logic can be implemented either as software running within a standard x86 processor or a Field Programmable Gate Array, or FPGA, semiconductor. Our Flexible Traffic Accelerator also performs certain hardware-based security checks for each packet and can discard suspicious traffic before it can impact system performance.
•
Scalable and Efficient Memory Usage.
To improve the performance of our multi-core processor architecture, we have developed a shared memory technology to allow all processors to share common memory and the state of the system simultaneously. As a result, we avoid the overhead associated with Inter-Processor Communication architectures deployed in first-generation approaches. We optimize memory to be visible to all cores simultaneously, while minimizing communication overhead and contention among processors for allocated memory space. Since all processors share a common memory pool, we can dynamically allocate memory space based upon the application processing requirements without constraints. Because configurations, policies and network databases are efficiently stored within a shared memory architecture, we can achieve greater performance and scalability from memory and processor resources.
•
Optimized Application Networking.
Once data has been processed and placed into a shared memory, then a processor can begin to apply ACOS common services and function-specific logic. To ensure that every processor can be utilized to perform every function, and thereby achieve greater system utilization, we have designed ACOS to use all processor cores symmetrically for all functions and services. The ACOS common services perform a set of key
5
operational functions, including configuration management, network I/O, aFleX scripting, Virtual Chassis System, or aVCS, aXAPI for management integration, Application Delivery Partitions, or ADP, virtualization to enable multi-tenancy, and common resource management such as buffer, system memory, timer management and other internal system management tasks. ACOS features a modular software design, which improves reliability by ensuring that modifications made to one module will not have unwanted side-effects on other system functions.
Other ACOS Technologies
. ACOS incorporates a number of other technologies to provide a rich environment for developing Layer 4-7 application networking solutions, including:
•
aFleX Scripting.
aFleX scripting technology is based on industry-standard Tool Command Language and enables end-customers to write custom scripts to augment the application processing.
•
ADP.
ADP enables multi-tenancy in the ACOS common services so that multiple departments of an organization or multiple end-customers can share a physical/virtual appliance.
•
aVCS.
aVCS enables multiple physical/virtual appliances to be managed as a single chassis.
•
aXAPI
.
aXAPI is an industry standard RESTful program interface to enable management integration for achieving automated management.
Our Products
We offer our end-customers a portfolio of software based solutions that are built upon ACOS. Our premium Thunder Series product family, launched in the second quarter of 2013, has three solutions to address end-customer needs, including ADC to optimize data center performance, CGN to provide network address and protocol translation services for service provider networks, and TPS for network-wide security protection. Our AX Series is our original product family that was launched in 2007 and includes ADC and CGN solutions.
Application Networking Solutions
We currently offer three software based solutions that are built on top of our software based ACOS application networking platform and are delivered primarily on our optimized hardware appliances:
Application Delivery Controller
. Our ADC solution provides advanced server load balancing, including global server load balancing, high availability, aFleX scripting, aVCS, ADP virtualization delivery for multi-tenancy, Secure Sockets Layer, or SSL, acceleration, SSL intercept, caching and compression, web application firewall, domain name server application firewall and others. ADC solutions are typically deployed in front of a server farm within a data center, including web, application and database servers.
Carrier Grade Network Address Translation
. Our CGN solution extends the life of increasingly scarce IPv4 address blocks and their associated infrastructure, and provides migration solutions to the IPv6 addressing standard. Our CGN solution is typically deployed in service provider networks to provide standards-compliant address and protocol translation services between varying types of IP addresses.
Threat Protection System
. Our TPS solution provides high volume, large scale detection and mitigation services to ensure that networks and server resources remain available even throughout a massive DDoS attack. TPS solutions are typically deployed at the perimeter of customer networks to protect their internal network resources from large-scale, volumetric cyber attacks, protocol attacks and resource attacks from distributed networks of compromised machines, or botnets.
With the release of our ACOS 4.0 software version we now have the ability to operate ADC and CGN solutions on the same platform, resulting in operational benefits for us and our customers. Our ACOS 4.0 release represents the most significant enhancement to our operating system since the introduction of the 64-bit ACOS release in 2009. The ACOS 4.0 enhanced feature set includes programmability, policy engine and telemetry support for our A10 Harmony architecture, an architecture that lays the foundation of a rapid services integration platform for enterprise, cloud, and service provider networks. An example is our Thunder Series integration and certification with
Cisco Application Centric Architecture (ACI) for agile deployment and management of our advanced L4-7 services.
6
Product Families
We deliver these solutions as both physical and virtual appliances across our Thunder Series and AX Series product families.
Thunder Series
. Our ADC, CGN and TPS solutions are available on our Thunder Series product family, including a range of physical appliances with throughput ranges from 5 gigabits per second, or Gbps, to 155 Gbps and a variety of other security and performance options available, as listed in the table below. Our vThunder virtual appliances operate on all major hypervisor platforms, including VMware, Microsoft, Citrix Xen and Linux KVM. Our vThunder virtual appliance is also available from cloud IaaS providers, including Amazon Web Services (AWS), and service providers offering our Pay-as-you-Go Licensing model.
AX Series
. Our ADC and CGN solutions are available on our AX Series product family, including a range of physical appliances with throughput ranges from 7.5 Gbps to 115 Gbps and a variety of other security and performance options available.
Centralized Management Solution
Our aGalaxy multi-device network management solution enables a network administrator to manage multiple A10 devices. While full control of our appliances can be achieved effectively out-of-the-box, the benefit of central and automated management increases as more appliances are added. The user interface provides a quick, at-a-glance view of status using a standard web browser. aGalaxy is designed to provide lower operational costs, as staff are freed up from repetitive tasks, while also increasing precision and accuracy with centralized and automated tasks, reducing the potential for human error.
Support and Services
One of our founding principles is to provide superior customer and technical support. Our global support team is part of our engineering organization and is trained across all products and solutions. Our support team takes complete ownership of customer issues from the beginning to the end to achieve rapid response and a high quality resolution. We believe that our ability to provide consistent, high-quality customer service and technical support is a key factor in attracting and retaining end-customers of all sizes. Accordingly, we offer a broad range of support services that include installation, phone support, repair and replacement, software updates, online tools, consulting and training services.
All customers receive warranty support for 90 days and greater than 95% of our end-customers purchase one of our maintenance products which entitles them to the support provided by our global support team. We offer a variety of support offerings, primarily two maintenance product options – Basic Support and Gold Support. The average maintenance contract term is 18 months. We invoice our channel partners or end-customers directly for maintenance contracts, in advance, at the time of hardware purchase. We generally provide discounts to our end-customers when they commit to longer term contracts. All our maintenance contracts are non-cancellable and are renewed through the same channel as originally purchased. Updates of our software are provided to all end-customers with a current maintenance contract on a when-and-if-available basis. Additionally, we provide on-site technical support as part of certain maintenance contracts. We maintain technical support centers in the United States, Japan, China and the Netherlands.
We have a professional services team able to provide a full range of fee-based consulting services, including pre-sale network assessment, comprehensive network analysis and capacity planning, post-sale migration and implementation services, on-site installation and on-going support.
Customers
We target organizations globally that depend on data center applications and networks to generate revenue and manage operations efficiently. Our end-customers operate in a variety of industries including telecommunications, technology, industrial, retail, financial and education. Since inception, our customer base has grown rapidly. As of December 31, 2014, we had sold our products to more than 3,900 customers across 71 countries. Our end-customers include three of the top four United States wireless carriers, seven of the top ten United States cable providers, and the top three wireless carriers in Japan, in addition to other global enterprises, Web giants and governmental organizations. Our business is geographically diversified with
48%
of our total revenue from the United States,
26%
from Japan and 26% from other geographic regions for the year ended December 31, 2014. During the years ended December 31, 2012, 2013 and 2014, purchases from our ten largest end-customers accounted for approximately 49%, 43% and 37% of our total revenue.
7
Two end-customers, NTT DoCoMo, Inc., a Japanese wireless provider, and Microsoft Corp., an enterprise customer, both purchasing through resellers, accounted for 13% and 10% of net revenue in the year ended December 31, 2013; no other end-customer accounted for more than 10% of our total revenue during the periods presented.
Backlog
As of December 31, 2014 and 2013, we had product backlog of approximately $4.0 million and $12.0 million. Backlog represents orders confirmed with a purchase order for products to be shipped generally within 90 days to customers with approved credit status. Orders are subject to cancellation, rescheduling by customers and product specification changes by customers. Although we believe that the backlog orders are firm, purchase orders may be canceled by the customer prior to shipment without significant penalty. For this reason, we believe that our product backlog at any given date is not a reliable indicator of future revenues.
Sales and Marketing
Sales
.
We sell our products globally to service providers and enterprises that depend on networks and data centers to generate revenue and manage operations efficiently. Our high-touch sales force engages directly or through indirect distribution channels with service providers and enterprises. Depending on size, geography, and complexity, some end-customer sales are originated and completed by our OEM and distribution channel partners with little or no direct engagement with our sales personnel. We fulfill nearly all orders globally through our distribution channel partners, which include distributors, value added resellers and system integrators.
For the year ended December 31, 2014, 85% of our revenue was generated through our distribution channel partners. In 2014, one distribution channel partner, Itochu Techno Solutions Corporation accounted for 13% of our total revenue. In 2013, two distribution channel partners, NEC Corporation and Adaptive Integration, accounted for 15% and 10% of our total revenue. In 2012, revenues from NEC Corporation accounted for 34% of our total revenue. We also work closely with OEM partners. We believe that our high-touch sales organization is unique given our deep focus on technology competence and partnership with our end-customers’ network engineers and architects. We believe this sales approach allows us to leverage the benefits of the channel, such as expanding our market coverage, as well as maintain face-to-face relationships with our end-customers.
Our sales team is comprised of inside sales and field sales personnel who are organized by geography and maintain sales presence in 30 countries, including in the following countries and regions: United States, Western Europe, the Middle East, Japan, China, Taiwan, South Korea and Latin America. Our sales organization also includes sales engineers with deep technical domain expertise who are responsible for pre-sales technical support, solutions engineering for our end-customers, proof of concept work and technical training for our distribution channel partners. Our sales team is also comprised of a channel sales organization that is expanding our market reach through partners. We expect to continue to grow our sales headcount, including in geographies where we currently do not have a sales presence.
Marketing
.
Our marketing strategy is focused on building our brand and driving end-customer demand for our application networking products and services through channel marketing, direct marketing and corporate communications campaigns. Marketing activities include product and solution launches, demand generation, advertising, Website development, trade shows and conferences. We are also actively engaged in driving global thought leadership through industry analyst engagement, media outreach, blogs and social media, and speaking events.
Manufacturing
We outsource the manufacturing of our hardware products to original design manufacturers. This approach allows us to benefit from the scale and experience of our manufacturing partners to reduce our costs, overhead and inventory while allowing us to adjust more quickly to changing end-customer demand. Our manufacturers are Lanner Electronics Inc., or Lanner, and AEWIN Technologies Co., Ltd., or AEWIN. These companies manufacture and assemble our hardware products using design specifications, quality assurance programs and standards that we establish. Our manufacturers procure components and assemble our products based on our demand forecasts and purchase orders. These forecasts represent our estimates of future demand for our products based upon historical trends and analysis from our sales and product management functions as adjusted for overall market conditions. The component parts incorporated into our products are sourced either by our manufacturing partners or directly by us.
8
We have agreements with both Lanner and AEWIN pursuant to which they manufacture, assemble, and test our products. The Lanner agreement has an initial one year term and the AEWIN agreement has an initial term of six years. Each agreement automatically renews for successive one-year terms unless either party gives notice that they do not want to renew the agreement. We do not have any long-term manufacturing contracts that guarantee us any fixed capacity or pricing. We perform quality assurance and testing at our San Jose, Taiwan and Japan distribution centers, as well as at our manufacturers’ locations. We warehouse and deliver our products out of our San Jose warehouse. We also outsource warehousing and delivery to a third-party logistics provider in some regions.
Research and Development
Our research and development effort is focused on developing new products and on enhancing and improving our existing products, leveraging our ACOS platform. Our engineering team works closely with end-customers and technology partners to identify future needs. A majority of our research and development team is focused on software development, with substantial experience in networking, network management, application delivery, performance optimization, security, software quality engineering and automation.
We believe that innovation and timely development of new features and products is essential to meeting the needs of our end-customer and improving our competitive position. We supplement our own research and development effort with open source technologies and technologies that we license from third parties. We test our products thoroughly to certify and ensure interoperability with third-party hardware and software products.
Our engineering teams are located mainly in our headquarters in San Jose, California, Beijing, China and Taipei, Taiwan. For the years ended December 31, 2012, 2013 and 2014 our research and development expenses were
$25.5 million
,
$33.3 million
and
$49.9 million
, representing
21%
,
24%
and
28%
of our total revenue.
Competition
We operate in the intensely competitive application networking market that is characterized by constant change and innovation. Changes in application delivery needs, cyber security threats, and the technology landscape result in evolving customer requirements to address application performance and security. In addition to server load-balancing and other functions normally associated with application delivery, our solutions have expanded our addressable market into DDoS production and CGN, where we compete with a number of companies not included among traditional ADC vendors. The agility and flexibility of the ACOS platform enables us to rapidly innovate and deploy solutions into adjacent markets to ADC. As a result, we believe the traditional definitions of our market do not encompass all of the features, functions and capabilities of our solutions, or accurately represent the addressable market.
The ADC, CGN and TPS markets are characterized by a set of identifiable participants. We do not consider any of these markets to include a single dominant company, nor do we consider the markets to be fragmented.
We believe that our main competitors fall into three categories:
• Companies that sell products in the traditional ADC market which includes companies that are well established in this market, such as F5 Networks, Inc., Brocade Communications Systems, Inc., Citrix Systems, Inc., and Radware Ltd.
• Companies that sell CGN products, products originally designed for other networking purposes, such as edge routers and security appliances from vendors such as Alcatel-Lucent USA Inc., Cisco Systems, Inc. and Juniper Networks, Inc.
• Companies that sell traditional TPS mitigation products. We are a new entrant into the DDoS market and first publicly launched our DDoS detection and mitigation solution, TPS, in January 2014. We believe our principle competitors in this market are Arbor Networks, Inc., a subsidiary of NetScout Systems, Inc., and Radware, Ltd.
We believe that the principal competitive factors in our markets include:
• Ability to innovate and respond to customer needs rapidly;
• Breadth and depth of product features and functionality;
9
• Level of customer satisfaction;
• Price performance and efficiency;
• Ability for products to scale with high speed network traffic;
• Flexible and agile design of products;
• Ability to detect and mitigate large-scale cyber security threats;
• Ability to accommodate any IT delivery model or combination of models, regardless of form factor;
• Brand awareness and reputation; and
• Strength of sales and marketing effort
s
We compete primarily based on the quality and price of our products, the rich and comprehensive features and functionalities offered by our platform, our differentiated customer support offerings and our close and ongoing relationship with our end-customers. However, many of our competitors have substantially greater financial, technical and other resources, greater name recognition, larger sales and marketing budgets, broader distribution, and larger and more mature intellectual property portfolios.
Intellectual Property
We rely on a combination of patent, copyright, trademark and trade secret laws, and restrictions on disclosure to protect our intellectual property rights. As of December 31, 2014, we had 42 issued United States patents and 58 U.S. patent applications pending, and 85 patents or patent applications pending overseas. Our issued U.S. patents, excluding an older set of 14 patents that we acquired, expire between 2026 and 2032. Our future success depends in part on our ability to protect our proprietary rights to the technologies used in our principal products. Despite our efforts to protect our proprietary rights, unauthorized parties may attempt to copy aspects of our products or to obtain and use trade secrets or other information that we regard as proprietary. In addition, the laws of some foreign countries do not protect our proprietary rights as fully as do the laws of the United States. Any issued patent may not preserve our proprietary position, and competitors or others may develop technologies similar to or superior to our technology. Our failure to enforce and protect our intellectual property rights could harm our business, operating results and financial condition.
We license software from third parties for development of or integration into our products, including proprietary and open source software. We pursue registration of our trademarks and domain names in the United States and other jurisdictions. See Part-I,
Item 1A. Risk Factors
included in this Annual Report on Form 10-K for the year ended December 31, 2014 for additional information regarding the risks associated with protecting our intellectual property.
Employees
As of December 31, 2014, we had 704 full-time employees, including 251 engaged in research and development and customer support, 306 in sales and marketing and 58 in general and administrative and other activities. None of our employees is represented by a labor union or is a party to any collective bargaining arrangement in connection with his or her employment with us. We have never experienced any work stoppages, and we consider our relations with our employees to be good.
Corporate Information
A10 Networks, Inc. was incorporated in the State of California in 2004 and subsequently reincorporated in the State of Delaware in March 2014. Our website is located at www.A10networks.com, and our investor relations website is located at http://investors.A10networks.com. The contents of our website are not intended to be incorporated by reference into this Annual Report on Form 10-K or in any other report or document we file with the Securities and Exchange Commission, or SEC, and any references to our websites are intended to be inactive textual references only. The following filings are available through our investor relations website after we file them with the SEC: Annual Reports on Form 10-K, Quarterly Reports on Form 10-Q, Current Reports on Form 8-K, as well as any amendments to such reports and all other filings pursuant to Section 13(a) or 15(d) of the Securities Act. These filings are also available for download free of charge on our investor relations website. Additionally, copies of materials filed by us with the SEC may be accessed at the SEC's Public Reference Room at
10
100 F Street, N.E., Washington, D.C. 20549 or at www.sec.gov. For information about the SEC's Public Reference Room, contact 1-800-SEC-0330.
Investing in our common stock involves a high degree of risk. You should carefully consider the risks and uncertainties described below, together with all of the other information contained in this report, and in our other public filings. The risks and uncertainties described below are not the only ones we face. Additional risks and uncertainties that we are unaware of, or that we currently believe are not material, may also become important factors that affect us. If any of the following risks occur, our business, financial condition, operating results, and prospects could be materially harmed. In that event, the trading price of our common stock could decline, perhaps significantly.
If we do not successfully anticipate market needs and opportunities or if the market does not continue to adopt our application networking products, our business, financial condition and results of operations could be significantly harmed.
The application networking market is rapidly evolving and difficult to predict. Technologies, customer requirements, security threats and industry standards are constantly changing. As a result, we must anticipate future market needs and opportunities and then develop new products or enhancements to our current products that are designed to address those needs and opportunities, and we may not be successful in doing so.
Even if we are able to anticipate, develop and commercially introduce new products and enhancements that address the market’s needs and opportunities, there can be no assurance that new products or enhancements will achieve widespread market acceptance. For example, organizations that use other conventional or first-generation application networking products for their needs may believe that these products are sufficient. In addition, as we launch new product offerings, organizations may not believe that such new product offerings offer any additional benefits as compared to the existing application networking products that they currently use. Accordingly, organizations may continue allocating their IT budgets for existing
application networking products and may not adopt our products, regardless of whether our products can offer superior performance or security.
If we fail to anticipate market needs and opportunities or if the market does not continue to adopt our application networking products, then market acceptance and sales of our current and future application networking products could be substantially decreased or delayed, we could lose customers, and our revenue may not grow or may decline. Any of such events would significantly harm our business, financial condition and results of operations.
Our success depends on our timely development of new products and features to address rapid technological changes and evolving customer requirements. If we are unable to timely develop new products and features that adequately address these changes and requirements, our business and operating results could be adversely affected.
Changes in application software technologies, data center and communications hardware, networking software and operating systems, and industry standards, as well as our end-customers’ continuing business growth, result in evolving application networking needs and requirements. Our continued success depends on our ability to identify and develop in a timely manner new products and new features for our existing products that meet these needs and requirements.
Our future plans include significant investments in research and development and related product opportunities. Developing our products and related enhancements is time-consuming and expensive. We have made significant investments in our research and development team in order to address these product development needs. Our investments in research and development may not result in significant design and performance improvements or marketable products or features, or may result in products that are more expensive than anticipated. We may take longer to generate revenue, or generate less revenue, than we anticipate from our new products and product enhancements. We believe that we must continue to dedicate a significant amount of resources to our research and development efforts to maintain our competitive position.
If we are unable to develop new products and features to address technological changes and new customer requirements in the application networking market or if our investments in research and development do not yield the expected benefits in a timely manner, our business and operating results could be adversely affected.
We have experienced net losses in recent periods, anticipate increasing our operating expenses in the future and may not achieve or maintain profitability in the future. If we cannot achieve or maintain profitability, our financial performance will be harmed and our business may suffer.
11
We experienced net losses for the years ended December 31, 2012, 2013 and 2014. Although we experienced revenue growth over these same periods and had achieved profitability in prior year periods, we may not be able to sustain or increase our revenue growth or achieve profitability in the future or on a consistent basis. During 2013 and 2014, we have invested in our sales, marketing and research and development teams in order to develop, market and sell our products. We expect to continue to invest significantly in these areas in the future. As a result of these increased expenditures, we will have to generate and sustain increased revenue, manage our cost structure and avoid significant liabilities to achieve future profitability. In particular, in 2012, 2013 and 2014, we incurred substantial expenses associated with defending ourselves in separate litigation matters involving Brocade Communications Systems, Inc. and Radware Ltd. (both settled) and in our settlement of the Brocade litigation. As a public company, we will also incur significant accounting, legal and other expenses that we did not incur as a private company.
Revenue growth may slow or decline, and we may incur significant losses in the future for a number of possible reasons, including our inability to develop products that achieve market acceptance, general economic conditions, increasing competition, decreased growth in the markets in which we operate, or our failure for any reason to capitalize on growth opportunities. Additionally, we may encounter unforeseen operating expenses, difficulties, complications, delays and other unknown factors that may result in losses in future periods. If these losses exceed our expectations or our revenue growth expectations are not met in future periods, our financial performance will be harmed and our stock price could be volatile or decline.
Our operating results are likely to vary significantly from period to period and may be unpredictable, which could cause the trading price of our common stock to decline.
Our operating results – in particular, revenue, margins and operating expenses – have fluctuated in the past, and we expect this will continue, which makes it difficult for us to predict our future operating results. The timing and size of sales of our products are highly variable and difficult to predict and can result in significant fluctuations in our revenue from period to period. This is particularly true of sales to our largest end-customers, such as service providers, Web giants and governmental organizations, who typically make large and concentrated purchases and for whom close or sales cycles can be long, as a result of their complex networks and data centers, as well as requests that may be made for customized features. Our quarterly results may vary significantly based on when these large end-customers place orders with us and the content of their orders. For example, during the three months ended September 30, 2014, we experienced a decline in our revenues primarily due to longer than expected close or sales cycles for certain large deals and lower North America service provider spending as compared to the same period in 2013, which may have contributed to a dramatic decline in our stock price. We anticipate a possible slowdown in spending from North America service providers, which may lead to continued near term fluctuation in our products revenue and total revenue.
Our operating results may also fluctuate due to a number of other factors, many of which are outside of our control and may be difficult to predict. In addition to other risks listed in this “Risk Factors” section, factors that may affect our operating results include:
|
•
|
fluctuations in and timing of purchases from, or loss of, large customers;
|
|
•
|
the budgeting cycles and purchasing practices of end-customers;
|
|
•
|
our ability to attract and retain new end-customers;
|
|
•
|
changes in demand for our products and services, including seasonal variations in customer spending patterns or cyclical fluctuations in our markets;
|
|
•
|
our reliance on shipments at the end of our quarters;
|
|
•
|
variations in product mix or geographic locations of our sales, which can affect the revenue we realize for those sales;
|
|
•
|
the timing and success of new product and service introductions by us or our competitors;
|
|
•
|
our ability to increase the size of our distribution channel and to maintain relationships with important distribution channel partners;
|
12
|
•
|
the effect of currency exchange rates on our revenue and expenses;
|
|
•
|
the cost and potential outcomes of existing and future litigation;
|
|
•
|
the effect of discounts negotiated by our largest end-customers for sales or pricing pressure from our competitors;
|
|
•
|
changes in the growth rate of the application networking market or changes in market needs;
|
|
•
|
inventory write downs, which may be necessary for our older products when our new products are launched and adopted by our end-customers; and
|
|
•
|
our third-party manufacturers’ and component suppliers’ capacity to meet our product demand forecasts on a timely basis, or at all.
|
Any one of the factors above or the cumulative effect of some of these factors may result in significant fluctuations in our financial and other operating results. This variability and unpredictability could result in our failure to meet our or our investors’ or securities analysts’ revenue, margin or other operating results expectations for a particular period, resulting in a decline in the trading price of our common stock.
Reliance on shipments at the end of the quarter could cause our revenue for the applicable period to fall below expected levels.
As a result of end-customer buying patterns and the efforts of our sales force and distribution channel partners to meet or exceed their sales objectives, we have historically received a substantial portion of purchase orders and generated a substantial portion of revenue during the last few weeks of each quarter. We can recognize such revenue in the quarter received, however, only if all of the requirements of revenue recognition, especially shipment, are met by the end of the quarter. In addition, any significant interruption in our information technology systems, which manage critical functions such as order processing, revenue recognition, financial forecasts, inventory and supply chain management, could result in delayed order fulfillment and thus decreased revenue for that quarter. If expected revenue at the end of any quarter is delayed for any reason, including the failure of anticipated purchase orders to materialize, our third-party manufacturers’ inability to manufacture and ship products prior to quarter-end to fulfill purchase orders received near the end of the quarter, our failure to manage inventory to meet demand, our inability to release new products on schedule, any failure of our systems related to order review and processing, or any delays in shipments or achieving specified acceptance criteria, our revenue for that quarter could fall below our, or our investors’ or securities analysts’ expectations, resulting in a decline in the trading price of our common stock.
A limited number of our end-customers, including service providers, make large and concentrated purchases that comprise a significant portion of our revenue. Any loss or delay of expected purchases by our largest end-customers could adversely affect our operating results.
As a result of the nature of our target market and the current stage of our development, a substantial portion of our revenue in any period comes from a limited number of large end-customers, including service providers. For example, NTT DoCoMo, Inc., through a reseller, accounted for approximately 32% of our total revenue during the year ended December 31, 2012, approximately 13% of our total revenue during the year ended December 31, 2013 and 7% of our total revenue during 2014. In addition, during the years ended December 31, 2012, 2013 and 2014, purchases from our ten largest end-customers accounted for approximately 49%, 43% and 37% of our total revenue. The composition of the group of these ten largest end-customers changes from period to period, but often includes service providers, who accounted for approximately 53%, 47% and 46% of our total revenue during the years ended December 31, 2012 and 2013, and 2014.
Sales to these large end-customers have typically been characterized by large but irregular purchases with long initial sales cycles. After initial deployment, subsequent purchases of our products typically have a more compressed sales cycle. The timing of these purchases and of the requested delivery of the purchased product is difficult to predict. As a consequence, any acceleration or delay in anticipated product purchases by or requested deliveries to our largest end-customers could materially affect our revenue and operating results in any quarter and cause our quarterly revenue and operating results to fluctuate from quarter to quarter.
We cannot provide any assurance that we will be able to sustain or increase our revenue from our largest end-customers nor that we will be able to offset any absence of significant purchases by our largest end-customers in any particular
13
period with purchases by new or existing end-customers in that or a subsequent period. We expect that sales of our products to a limited number of end-customers will continue to contribute materially to our revenue for the foreseeable future. The loss of, or a significant delay or reduction in purchases by, a small number of end-customers could have a material adverse effect on our consolidated financial position, results of operations or cash flows.
We have been and are a party to litigation and claims regarding intellectual property rights, resolution of which has been and may in the future be time-consuming, expensive and adverse to us, as well as require a significant amount of resources to prosecute, defend, or make our products non-infringing.
Our industry is characterized by the existence of a large number of patents and by increasingly frequent claims and related litigation based on allegations of infringement or other violations of patent and other intellectual property rights. In the ordinary course of our business, we have been and are involved in disputes and licensing discussions with others regarding their patents and other claimed intellectual property and proprietary rights. Intellectual property infringement and misappropriation lawsuits and other claims are subject to inherent uncertainties due to the complexity of the technical and legal issues involved, and we cannot be certain that we will be successful in defending ourselves against such claims or in concluding licenses on reasonable terms or at all.
We currently have fewer issued patents than some of our major competitors, and therefore may not be able to utilize our patent portfolio effectively to assert defenses or counterclaims in response to patent infringement claims or litigation brought against us by third parties. Further, litigation may involve patent holding companies or other adverse patent owners that have no relevant products revenue and against which our potential patents may provide little or no deterrence. In addition, many potential litigants have the capability to dedicate substantially greater resources than we can to enforce their intellectual property rights and to defend claims that may be brought against them. We expect that infringement claims may increase as the numbers of product types and the number of competitors in our market increases. Also, to the extent we gain greater visibility, market exposure and competitive success, we face a higher risk of being the subject of intellectual property infringement claims.
If we are found in the future to infringe the proprietary rights of others, or if we otherwise settle such claims, we could be compelled to pay damages or royalties and either obtain a license to those intellectual property rights or alter our products such that they no longer infringe. Any license could be very expensive to obtain or may not be available at all. Similarly, changing our products or processes to avoid infringing the rights of others may be costly, time-consuming or impractical. Alternatively, we could also become subject to an injunction or other court order that could prevent us from offering our products. Any of these claims, regardless of their merit, may be time-consuming, result in costly litigation and diversion of technical and management personnel, or require us to cease using infringing technology, develop non-infringing technology or enter into royalty or licensing agreements.
Many of our commercial agreements require us to indemnify our end-customers, distributors and resellers for certain third-party intellectual property infringement actions related to our technology, which may require us to defend or otherwise become involved in such infringement claims, and we could incur liabilities in excess of the amounts we have received for the relevant products and/or services from our end-customers, distributors or resellers. These types of claims could harm our relationships with our end-customers, distributors and resellers, may deter future end-customers from purchasing our products or could expose us to litigation for these claims. Even if we are not a party to any litigation between an end-customer, distributor or reseller, on the one hand, and a third party, on the other hand, an adverse outcome in any such litigation could make it more difficult for us to defend our intellectual property rights in any subsequent litigation in which we are a named party.
We have in the past been involved in two intellectual property litigation matters with F5 Networks, Inc., one with Allegro Software Development, Inc., one with Brocade and one with Radware, all of which have since settled. As part of the settlement with Brocade, we made a significant cash payment to Brocade, granted a license to Brocade to use all of our issued, pending and future patents, and received and granted certain covenants not to sue. We are currently party to one intellectual property litigation matter. In November 2013, Parallel Networks, LLC, which we believe is a patent holding company, filed a lawsuit against us in the United States District Court for the District of Delaware alleging that our AX and Thunder series products infringe two of their patents. Parallel is seeking injunctive relief, damages and costs. While we intend to defend ourselves vigorously against the allegations in this lawsuit, this litigation matter, regardless of the outcome, could result in significant costs and diversion of our management’s efforts.
14
We may face risks related to securities litigation that could result in significant legal expenses and settlement or damage awards.
We are currently and may in the future become subject to claims and litigation alleging violations of securities laws or other related claims, which could harm our business, divert management attention and require us to incur significant costs. For example, in January 2015, a class action lawsuit was filed against us, our Board of Directors, our Chief Financial Officer and the underwriters of our initial public offering alleging violations of the Securities Act of 1933. This lawsuit seeks unspecified compensatory damages and other relief. We are generally obliged, to the extent permitted by law, to indemnify our current and former directors and officers who are named as defendants in these types of lawsuits. We also have certain contractual obligations to the underwriters regarding this lawsuit. While a certain amount
of insurance
coverage is available for expenses or losses associated with this lawsuit, this coverage may not be sufficient. Based on information currently available, we are unable to reasonably estimate a possible loss or range of possible loss, if any, with regards to this lawsuit; therefore, no litigation reserve has been recorded in the accompanying Consolidated Balance Sheets. Although we plan to defend against this lawsuit vigorously, there can be no assurances that a favorable final outcome will be obtained. This lawsuit
or future litigation may require significant attention from management and could result in significant legal expenses, settlement costs or damage awards that could have a material impact on our financial position, results of operations and cash flows.
We may not be able to adequately protect our intellectual property, and if we are unable to do so, our competitive position could be harmed, or we could be required to incur significant expenses to enforce our rights.
We rely on a combination of patent, copyright, trademark and trade secret laws, and contractual restrictions on disclosure of confidential and proprietary information, to protect our intellectual property. Despite the efforts we take to protect our intellectual property and other proprietary rights, these efforts may not be sufficient or effective at preventing their unauthorized use. In addition, effective trademark, patent, copyright and trade secret protection may not be available or cost-effective in every country in which we have rights. There may be instances where we are not able to protect intellectual property or other proprietary rights in a manner that maximizes competitive advantage. If we are unable to protect our intellectual property and other proprietary rights from unauthorized use, the value of those assets may be reduced, which could negatively impact our business.
We also rely in part on confidentiality and/or assignment agreements with our technology partners, employees, consultants, advisors and others. We did not, however, obtain general employee confidentiality and assignment agreements from certain former employees who worked with us prior to July 2010, although we did receive specific assignments from each of these employees who was an inventor of any technologies that we patented. These protections and agreements may not effectively prevent disclosure of our confidential information and may not provide an adequate remedy in the event of unauthorized disclosure. In addition, others may independently discover our trade secrets and intellectual property information we thought to be proprietary, and in these cases we would not be able to assert any trade secret rights against those parties. Despite our efforts to protect our intellectual property, unauthorized parties may attempt to copy or otherwise obtain and use our intellectual property or technology. Monitoring unauthorized use of our intellectual property is difficult and expensive. We have not made such monitoring a priority to date and will not likely make this a priority in the future. We cannot be certain that the steps we have taken or will take will prevent misappropriation of our technology, particularly in foreign countries where the laws may not protect our proprietary rights as fully as in the United States.
If we fail to protect our intellectual property adequately, our competitors might gain access to our technology, and our business might be harmed. In addition, even if we protect our intellectual property, we may need to license it to competitors, which could also be harmful. For example, we have already licensed all of our issued patents, pending applications, and future patents and patent applications that we may acquire, obtain, apply for or have a right to license to Brocade until May 2025, for the life of each such patent. In addition, we might incur significant expenses in defending our intellectual property rights. Any of our patents, copyrights, trademarks or other intellectual property rights could be challenged by others or invalidated through administrative process or litigation.
We may in the future initiate claims or litigation against third parties for infringement of our proprietary rights or to establish the validity of our proprietary rights. Any litigation, whether or not resolved in our favor, could result in significant expense to us and divert the efforts of our management and technical personnel, as well as cause other claims to be made against us, which might adversely affect our business, operating results and financial condition.
In addition, on March 20, 2014, we received a letter from an attorney on behalf of an individual who claims that he is entitled to between 1.6 and 2.6 million shares of our common stock.
15
The individual alleges that prior to the incorporation of our company he had been promised founders’ shares in a different corporation. The individual also alleges that our Chief Executive Officer and founder, Lee Chen, who was involved with this different entity for a short period of time in mid-2004 before our founding, was the CEO and controlling stockholder of such other entity and that Mr. Chen breached his fiduciary duty to such entity and its stockholders. The individual further alleges that Mr. Chen misappropriated intellectual property and diverted employees and investors from that entity to us. On the basis of these allegations, this individual claims he is entitled to shares of our common stock. The individual also alleges that we knowingly aided and abetted Mr. Chen in such alleged actions. To our knowledge, this individual had not raised any of these allegations or made any equity ownership claims to us prior to our receipt of the email on March 20, 2014.
Based on our preliminary review of the allegations in the letter, we and Mr. Chen believe that the claims are without merit and are not likely to have a material adverse effect on us. However, there can be no assurances with respect to the outcome of these allegations. No lawsuit has been filed, and if a lawsuit is filed, we and Mr. Chen intend to defend against these claims vigorously.
We face intense competition in our market, especially from larger, well-established companies, and we may lack sufficient financial or other resources to maintain or improve our competitive position.
The application networking market is intensely competitive, and we expect competition to increase in the future. To the extent that we sell our solutions in adjacent markets, we expect to face intense competition in those markets as well. We believe that our main competitors fall into three categories:
|
•
|
Companies that sell products in the traditional ADC market. In the ADC market, we compete against other companies that are well established in this market, including F5 Networks, Inc., Brocade, Cisco Systems, Inc., Citrix Systems, Inc., and Radware Ltd.;
|
|
•
|
Companies that sell CGN products. Our purpose-built CGN solution competes primarily against products originally designed for other networking purposes, such as edge routers and security appliances from vendors such as Alcatel-Lucent USA Inc., Cisco Systems, Inc. and Juniper Networks, Inc.; and
|
|
•
|
Companies that sell traditional DDoS mitigation products. We are a new entrant into the DDoS market and first publicly launched our DDoS detection and mitigation solution, TPS, in January 2014. We believe our principal competitors in this market are Arbor Networks, Inc., a subsidiary of Danaher Corporation, and Radware.
|
Many of our competitors are substantially larger and have greater financial, technical, research and development, sales and marketing, manufacturing, distribution and other resources and greater name recognition. In addition, some of our larger competitors have broader products offerings and could leverage their customer relationships based on their other products. Potential customers who have purchased products from our competitors in the past may also prefer to continue to purchase from these competitors rather than change to a new supplier regardless of the performance, price or features of the respective products. We could also face competition from new market entrants, which may include our current technology partners. As we continue to expand globally, we may also see new competitors in different geographic regions. Such current and potential competitors may also establish cooperative relationships among themselves or with third parties that may further enhance their resources.
Many of our existing and potential competitors enjoy substantial competitive advantages, such as:
|
•
|
longer operating histories;
|
|
•
|
the capacity to leverage their sales efforts and marketing expenditures across a broader portfolio of products and services at a greater range of prices;
|
|
•
|
the ability to incorporate functionality into existing products to gain business in a manner that discourages users from purchasing our products, including through selling at zero or negative margins, product bundling or closed technology platforms;
|
|
•
|
broader distribution and established relationships with distribution channel partners in a greater number of worldwide locations;
|
|
•
|
access to larger end-customer bases;
|
16
|
•
|
the ability to use their greater financial resources to attract our research and development engineers as well as other employees of ours;
|
|
•
|
larger intellectual property portfolios; and
|
|
•
|
the ability to bundle competitive offerings with other products and services.
|
Our ability to compete will depend upon our ability to provide a better solution than our competitors at a competitive price. We may be required to make substantial additional investments in research and development, marketing and sales in order to respond to competition, and there is no assurance that these investments will achieve any returns for us or that we will be able to compete successfully in the future. We also expect increased competition if our market continues to expand. Moreover, conditions in our market could change rapidly and significantly as a result of technological advancements or other factors.
In addition, current or potential competitors may be acquired by third parties that have greater resources available. As a result of these acquisitions, our current or potential competitors might take advantage of the greater resources of the larger organization to compete more vigorously or broadly with us. In addition, continued industry consolidation might adversely impact end-customers’ perceptions of the viability of smaller and even medium-sized networking companies and, consequently, end-customers’ willingness to purchase from companies like us.
As a result, increased competition could lead to fewer end-customer orders, price reductions, reduced margins and loss of market share.
Some of our large end-customers demand favorable terms and conditions from their vendors and may request price concessions. As we seek to sell more products to these end-customers, we may agree to terms and conditions that may have an adverse effect on our business.
Some of our large end-customers have significant purchasing power and, accordingly, have requested from us and received more favorable terms and conditions, including lower prices than we typically provide. As we seek to sell products to this class of end-customer, we may agree to these terms and conditions, which may include terms that reduce our gross margin and have an adverse effect on our business.
If we are unable to attract new end-customers, sell additional products to our existing end-customers or achieve the anticipated benefits from our investment in additional sales personnel and resources, our revenue may decline, and our gross margin will be adversely affected.
To maintain and increase our revenue, we must continually add new end-customers and sell additional products to existing end-customers. The rate at which new and existing end-customers purchase solutions depends on a number of factors, including some outside of our control, such as general economic conditions. If our efforts to sell our solutions to new end-customers and additional solutions to our existing end-customers are not successful, our business and operating results will suffer.
In recent periods, we have been adding personnel and other resources to our sales and marketing functions, as we focus on growing our business, entering new markets and increasing our market share. We expect to incur significant additional expenses by hiring additional sales personnel and expanding our international operations in order to seek revenue growth. The return on these and future investments may be lower, or may be realized more slowly, than we expect, if realized at all. If we do not achieve the benefits anticipated from these investments, or if the achievement of these benefits is delayed, our growth rates will decline, and our gross margin would likely be adversely affected.
Our gross margin may fluctuate from period to period based on the mix of products sold, the geographic location of our customers, price discounts offered, required inventory write downs and current exchange rate fluctuations.
Our gross margin may fluctuate from period to period in response to a number of factors, such as the mix of our products sold and the geographic locations of our sales. Our products tend to have varying gross margins in different geographic regions. We also may offer pricing discounts from time to time as part of a targeted sales campaign or as a result of pricing pressure from our competitors. In addition, our larger end-customers may negotiate pricing discounts in connection with large orders they place with us. The sale of our products at discounted prices could have a negative impact on our gross margin. We also must manage our inventory of existing products when we introduce new products. For example, in the fourth quarter of
17
2013 and the third quarter of 2014, our gross margin decreased to 74% and 73% due primarily to geographical mix and selling some end-of-life product at low margins.
If we are unable to sell the remaining inventory of our older products prior to or following the launch of such new product offerings, we may be forced to write down inventory for such older products, which could also negatively affect our gross margin. Our gross margin may also vary based on international currency exchange rates. In general, our sales are denominated in U.S. dollars; however, in Japan they are denominated in Japanese yen. Changes in the exchange rate between the U.S. dollar and the Japanese yen may therefore affect our actual revenue and gross margin. For example, in the third and fourth quarters of 2014, our gross margin was adversely impacted by both an increase in our inventory reserve primarily due to obsolete inventory on hand and unfavorable exchange rate fluctuations between the U.S. dollar and the Japanese yen.
We generate a significant amount of revenue from sales to distributors, resellers, and end-customers outside of the United States, and we are therefore subject to a number of risks that could adversely affect these international sources of our revenue.
A significant portion of our revenue is generated in international markets, including Japan, Western Europe, China, Taiwan and South Korea. During the years ended December 31, 2012, 2013 and 2014, approximately 64%, 52% and
52%
of our total revenue was generated from customers located outside of the United States. If we are unable to maintain or continue to grow our revenue in these markets, our financial results may suffer. As a result, we must hire and train experienced personnel to staff and manage our foreign operations. To the extent that we experience difficulties in recruiting, training, managing and retaining an international staff, and specifically sales management and sales personnel, we may experience difficulties in sales productivity in foreign markets. We also seek to enter into distributor and reseller relationships with companies in certain international markets where we do not have a local presence. If we are not able to maintain successful distributor relationships internationally or recruit additional companies to enter into distributor relationships, our future success in these international markets could be limited. Business practices in the international markets that we serve may differ from those in the United States and may require us in the future to include terms in customer contracts other than our standard terms. To the extent that we may enter into customer contracts in the future that include non-standard terms, our operating results may be adversely impacted.
We have a significant presence in international markets and plan to continue to expand our international operations, which exposes us to a number of risks that could affect our future growth.
Our sales team is comprised of field sales and inside sales personnel who are organized by geography and maintain sales presence in 30 countries, including in the following countries and regions: United States, Western Europe, Japan, China, Taiwan and South Korea. We expect to continue to increase our sales headcount in all markets, particularly in markets where we currently do not have a sales presence. As we continue to expand our international sales and operations, we are subject to a number of risks, including the following:
|
•
|
greater difficulty in enforcing contracts and accounts receivable collection and longer collection periods;
|
|
•
|
increased expenses incurred in establishing and maintaining office space and equipment for our international operations;
|
|
•
|
greater difficulty in recruiting local experienced personnel, and the costs and expenses associated with such activities;
|
|
•
|
general economic and political conditions in these foreign markets;
|
|
•
|
economic uncertainty around the world, including continued economic uncertainty as a result of sovereign debt issues in Europe;
|
|
•
|
management communication and integration problems resulting from cultural and geographic dispersion;
|
|
•
|
risks associated with trade restrictions and foreign legal requirements, including the importation, certification, and localization of our products required in foreign countries;
|
|
•
|
greater risk of unexpected changes in regulatory practices, tariffs, and tax laws and treaties;
|
18
|
•
|
the uncertainty of protection for intellectual property rights in some countries;
|
|
•
|
greater risk of a failure of foreign employees to comply with both U.S. and foreign laws, including antitrust regulations, the U.S. Foreign Corrupt Practices Act, and any trade regulations ensuring fair trade practices; and
|
|
•
|
heightened risk of unfair or corrupt business practices in certain geographies and of improper or fraudulent sales arrangements that may impact financial results and result in restatements of, or irregularities in, financial statements.
|
Because of our worldwide operations, we are also subject to risks associated with compliance with applicable anticorruption laws. One such applicable anticorruption law is the U.S. Foreign Corrupt Practices Act, or FCPA, which generally prohibits U.S. companies and their employees and intermediaries from making payments to foreign officials for the purpose of obtaining or keeping business, securing an advantage, or directing business to another, and requires public companies to maintain accurate books and records and a system of internal accounting controls. Under the FCPA, U.S. companies may be held liable for actions taken by directors, officers, employees, agents, or other strategic or local partners or representatives. As such, if we or our intermediaries, such as channel partners and distributors, fail to comply with the requirements of the FCPA or similar legislation, governmental authorities in the United States and elsewhere could seek to impose civil and/or criminal fines and penalties which could have a material adverse effect on our business, operating results and financial condition.
We are exposed to fluctuations in currency exchange rates, which could negatively affect our results of operations.
Our consolidated results of operations, financial position and cash flows are subject to fluctuations due to changes in foreign currency exchange rates. Historically, the majority of our revenue contracts are denominated in U.S. dollars, with the most significant exception being Japan, where we invoice primarily in the Japanese yen. Our expenses are generally denominated in the currencies in which our operations are located, which is primarily in North America and Japan. Revenue resulting from selling in local currencies and costs incurred in local currencies are exposed to foreign currency exchange rate fluctuations that can affect our operating income. For example, a hypothetical 10% adverse movement in the exchange rate between the U.S. dollar and the Japanese yen would have resulted in a $4.6 million decrease in our total revenue and a $3.4 million decrease in our operating income for the year ended December 31, 2014, and a hypothetical 10% favorable movement in the exchange rate between the U.S. dollar and the Japanese yen would have resulted in a $4.6 million increase in our total revenue and a $3.4 million increase in operating income for the year ended December 31, 2014. As exchange rates vary, our operating income may differ from expectations. To date, we have not entered into any hedging arrangements with respect to foreign currency risk or other derivative instruments.
Our success depends on our key personnel and our ability to hire, retain and motivate qualified product development, sales, marketing and finance personnel.
Our success depends to a significant degree upon the continued contributions of our key management, product development, sales, marketing and finance personnel, many of whom may be difficult to replace. The complexity of our products, their integration into existing networks and ongoing support of our products requires us to retain highly trained professional services, customer support and sales personnel with specific expertise related to our business. Competition for qualified professional services, customer support and sales personnel in our industry is intense, because of the limited number of people available with the necessary technical skills and understanding of our products. We may not be successful in attracting, integrating, or retaining qualified personnel to fulfill our current or future needs, nor may we be successful in keeping the qualified personnel we currently have. Our ability to hire and retain these personnel may be adversely affected by volatility or reductions in the price of our common stock, since these employees are generally granted equity-based awards. Also, to the extent we hire personnel from competitors, we may be subject to allegations that they have been improperly solicited, or that they have divulged proprietary or other confidential information, or that their former employers own their inventions or other work product.
Our future performance also depends on the continued services and continuing contributions of our senior management to execute on our business plan and to identify and pursue new opportunities and product innovations. In particular, Lee Chen, our founder and Chief Executive Officer, and Rajkumar Jalan, our Chief Technology Officer, are critical to the development of our technology and the future vision and strategic direction of our company. The loss of services of senior management could significantly delay or prevent the achievement of our development and strategic objectives, which could adversely affect our business, financial condition, and operating results.
19
As a result of becoming a public company, we are obligated to implement and maintain effective internal control over financial reporting. We may not complete our analysis of our internal control over financial reporting in a timely manner, or our internal control over financial reporting may not be determined to be effective, which may adversely affect investor confidence in our company and, as a result, the value of our common stock.
We are required, pursuant to the Exchange Act, to furnish a report by management on, among other things, the effectiveness of our internal control over financial reporting for each fiscal year beginning with fiscal 2015. This assessment will need to include disclosure of any material weaknesses identified by our management in our internal control over financial reporting, as well as, for each fiscal year beginning with fiscal 2016, a statement that our auditors have issued an attestation report on our management’s assessment of our internal controls.
We are currently evaluating our internal controls, identifying and remediating deficiencies in those internal controls and documenting the results of our evaluation, testing and remediation. We may not be able to complete our evaluation, testing and any required remediation in a timely fashion. During the evaluation and testing process, if we identify one or more material weaknesses in our internal control over financial reporting that we are unable to remediate before the end of the same fiscal year in which the material weakness is identified, we will be unable to assert that our internal control over financial reporting is effective. If we are unable to conclude that our internal control over financial reporting is effective, if our auditors are unable to attest to management’s report on the effectiveness of our internal control over financial reporting, or if we are required to restate our financial statements as a result of ineffective internal control over financial reporting, we could lose investor confidence in the accuracy and completeness of our financial reports, which would cause the price of our common stock to decline.
As a public company, we are required to disclose material changes made in our internal control and procedures on a quarterly basis. However, our independent registered public accounting firm will not be required to formally attest to the effectiveness of our internal control over financial reporting pursuant to Section 404 of the Sarbanes-Oxley Act until the later of the year following our first annual report required to be filed with the SEC or the date we are no longer an emerging growth company as defined in the JOBS Act, if we take advantage of the exemptions contained in the JOBS Act. To comply with the requirements of being a public company, we may need to undertake various actions, such as implementing new internal controls and procedures and hiring accounting or internal audit staff.
We have identified a material weakness in our internal control over the computation of share-based compensation expense related to our 2014 Employee Stock Purchase Plan, and our business and stock price may be materially adversely affected if we do not adequately address this material weakness or if we have other material weaknesses in our internal control over financial reporting.
In connection with our review of internal control over financial reporting as of December 31, 2014, we determined that we did not adequately implement certain controls over the computation of share-based compensation related to our 2014 Employee Stock Purchase Plan,
and we have therefore concluded that a material weakness in our internal control over financial reporting existed as of December 31, 2014. A material weakness is a deficiency, or a combination of deficiencies, in internal control over financial reporting, such that there is a reasonable possibility that a material misstatement of a company's annual or interim financial statements will not be prevented or detected on a timely basis. We are working to remediate this material weakness by implementing new review procedures and controls relating to the computation of share-based compensation expense related to our 2014 Employee Stock Purchase Plan. However, changes we make to our controls and processes may not be effective in maintaining the adequacy of our internal controls.
The existence of this material weakness or the discovery of one or more other material weaknesses or significant deficiencies in our internal control over financial reporting could result in errors in our financial statements, and substantial costs and resources may be required to rectify any internal control deficiencies. Although we continually review and evaluate internal control systems, we have in the past discovered significant deficiencies and we cannot assure you that we will not discover additional significant deficiencies or material weaknesses in our internal control over financial reporting. Any such additional significant deficiency or material weakness or failure to remediate the existing material weakness could materially adversely affect our ability to comply with applicable financial reporting requirements. Further, if we cannot produce reliable financial reports, investors could lose confidence in our reported financial information, the market price of our stock could decline significantly, and our business, financial condition and results of operations could be materially harmed.
20
If we are not able to maintain and enhance our brand and reputation, our business and operating results may be harmed in tangible or intangible ways.
We believe that maintaining and enhancing our brand and reputation are critical to our relationships with, and our ability to attract, new end-customers, technology partners and employees. The successful promotion of our brand will depend largely upon our ability to continue to develop, offer and maintain high-quality products and services, our marketing and public relations efforts, and our ability to differentiate our products and services successfully from those of our competitors. Our brand promotion activities may not be successful and may not yield increased revenue. In addition, extension of our brand to products and uses different from our traditional products and services may dilute our brand, particularly if we fail to maintain the quality of products and services in these new areas. We have in the past, and may in the future, become involved in litigation that could negatively affect our brand. If we do not successfully maintain and enhance our brand and reputation, our growth rate may decline, we may have reduced pricing power relative to competitors with stronger brands or reputations, and we could lose end-customers or technology partners, all of which would harm our business, operating results and financial condition.
Adverse general economic conditions or reduced information technology spending may adversely impact our business.
A substantial portion of our business depends on the demand for information technology by large enterprises and service providers, the overall economic health of our current and prospective end-customers and the continued growth and evolution of the Internet. The timing of the purchase of our products is often discretionary and may involve a significant commitment of capital and other resources. While some economic indicators have recently improved, there are still lingering effects of economic weakness from the recent financial recession, including more limited availability of credit, a reduction in business confidence and activity, deficit-driven austerity measures that continue to affect governments and educational institutions, and other difficulties that may affect one or more of the industries to which we sell our products and services. If economic conditions in the United States, Europe and other key markets for our products do not continue to improve or those markets experience another downturn, many end-customers may delay or reduce their IT spending. This could result in reductions in sales of our products and services, longer sales cycles, slower adoption of new technologies and increased price competition. Any of these events would likely harm our business, operating results and financial condition. In addition, there can be no assurance that IT spending levels will increase following any recovery.
We are dependent on third-party manufacturers, and changes to those relationships, expected or unexpected, may result in delays or disruptions that could harm our business.
We outsource the manufacturing of our hardware components to third-party original design manufacturers who assemble these hardware components to our specifications. Our primary manufacturers are Lanner Electronics, Inc. and AEWIN Technologies Co., Ltd., each of which is located in Taiwan. Our reliance on these third-party manufacturers reduces our control over the manufacturing process and exposes us to risks, including reduced control over quality assurance, product costs, and product supply and timing. Any manufacturing disruption at these manufacturers could severely impair our ability to fulfill orders. Our reliance on outsourced manufacturers also may create the potential for infringement or misappropriation of our intellectual property rights or confidential information. If we are unable to manage our relationships with these manufacturers effectively, or if these manufacturers suffer delays or disruptions for any reason, experience increased manufacturing lead-times, experience capacity constraints or quality control problems in their manufacturing operations, or fail to meet our future requirements for timely delivery, our ability to ship products to our end-customers would be severely impaired, and our business and operating results would be seriously harmed.
These manufacturers typically fulfill our supply requirements on the basis of individual orders. We do not have long-term contracts with our manufacturers that guarantee capacity, the continuation of particular pricing terms, or the extension of credit limits. Accordingly, they are not obligated to continue to fulfill our supply requirements, which could result in supply shortages, and the prices we are charged for manufacturing services could be increased on short notice. In addition, our orders may represent a relatively small percentage of the overall orders received by our manufacturers from their customers. As a result, fulfilling our orders may not be considered a priority by one or more of our manufacturers in the event the manufacturer is constrained in its ability to fulfill all of its customer obligations in a timely manner.
Although the services required to manufacture our hardware components may be readily available from a number of established manufacturers, it is time-consuming and costly to qualify and implement such relationships. If we are required to change manufacturers, whether due to an interruption in one of our manufacturers’ businesses, quality control problems or otherwise, or if we are required to engage additional manufacturers, our ability to meet our scheduled product deliveries to our customers could be adversely affected, which could cause the loss of sales to existing or potential customers, delayed revenue or an increase in our costs that could adversely affect our gross margin.
21
Because some of the key components in our products come from limited sources of supply, we are susceptible to supply shortages or supply changes, which could disrupt or delay our scheduled product deliveries to our end-customers and may result in the loss of sales and end-customers.
Our products incorporate key components, including certain integrated circuits, that our third-party manufacturers purchase on our behalf from a limited number of suppliers, including some sole-source providers. In addition, the lead times associated with these and other components of our products can be lengthy and preclude rapid changes in quantities and delivery schedules. Moreover, long-term supply and maintenance obligations to our end-customers increase the duration for which specific components are required, which may further increase the risk we may incur component shortages or the cost of carrying inventory. If we are unable to obtain a sufficient quantity of these components in a timely manner for any reason, sales and/or shipments of our products could be delayed or halted, which would seriously affect present and future sales and cause damage to end-customer relationships, which would, in turn, adversely affect our business, financial condition and results of operations.
In addition, our component suppliers change their selling prices frequently in response to market trends, including industry-wide increases in demand, and because we do not necessarily have contracts with these suppliers, we are susceptible to price fluctuations related to raw materials and components. If we are unable to pass component price increases along to our end-customers or maintain stable pricing, our gross margin and operating results could be negatively impacted. Furthermore, poor quality in sole-sourced components or certain other components in our products could also result in lost sales or lost sales opportunities. If the quality of such components does not meet our standards or our end-customers’ requirements, if we are unable to obtain components from our existing suppliers on commercially reasonable terms, or if any of our sole source providers cease to continue to manufacture such components or to remain in business, we could be forced to redesign our products and qualify new components from alternate suppliers. The development of alternate sources for those components can be time-consuming, difficult and costly, and we may not be able to develop alternate or second sources in a timely manner. Even if we are able to locate alternate sources of supply, we could be forced to pay for expedited shipments of such components or our products at dramatically increased costs.
Real or perceived defects, errors, or vulnerabilities in our products or services or the failure of our products or services to block a threat or prevent a security breach could harm our reputation and adversely impact our results of operations.
Because our products and services are complex, they have contained and may contain design or manufacturing defects or errors that are not detected until after their commercial release and deployment by our end-customers. Even if we discover those weaknesses, we may not be able to correct them promptly, if at all. Defects may cause our products to be vulnerable to security attacks, cause them to fail to help secure networks, or temporarily interrupt end-customers’ networking traffic. Furthermore, our products may fail to detect or prevent malware, viruses, worms or similar threats for any number of reasons, including our failure to enhance and expand our platform to reflect industry trends, new technologies and new operating environments, the complexity of the environment of our end-customers and the sophistication of malware, viruses and other threats. Data thieves and hackers are increasingly sophisticated, often affiliated with organized crime and may operate large-scale and complex automated attacks. The techniques used to obtain unauthorized access or to sabotage networks change frequently and may not be recognized until launched against a target. Additionally, as a well-known provider of enterprise security solutions, our networks, products, and services could be targeted by attacks specifically designed to disrupt our business and harm our reputation. As our products are adopted by an increasing number of enterprises and governments, it is possible that the individuals and organizations behind advanced attacks will focus on finding ways to defeat our products. In addition, defects or errors in our updates to our products could result in a failure of our services to effectively update end-customers’ products and thereby leave our end-customers vulnerable to attacks. Our data centers and networks may experience technical failures and downtime, may fail to distribute appropriate updates, or may fail to meet the increased requirements of a growing installed end-customer base, any of which could temporarily or permanently expose our end-customers’ networks, leaving their networks unprotected against security threats. Our end-customers may also misuse our products, which may result in loss or a breach of business data. For all of these reasons, we may be unable to anticipate all data security threats or provide a solution in time to protect our end-customers’ networks. If we fail to identify and respond to new and increasingly complex methods of attack and to update our products to detect or prevent such threats in time to protect our end-customers’ critical business data, our business, operating results and reputation could suffer.
If any companies or governments that are publicly known to use our platform are the subject of an advanced cyber attack that becomes publicized, our other current or potential channel partners or end-customers may look to our competitors for alternatives to our products. Real or perceived security breaches of our end-customers’ networks could cause disruption or damage to their networks or other negative consequences and could result in negative publicity to us, damage to our reputation, declining sales, increased expenses and end-customer relations issues. To the extent potential end-customers or industry analysts believe that the occurrence of any actual or perceived failure of our products to detect or prevent malware, viruses,
22
worms or similar threats is a flaw or indicates that our products do not provide significant value, our reputation and business could be harmed.
Any real or perceived defects, errors, or vulnerabilities in our products, or any failure of our products to detect a threat, could result in:
•
a loss of existing or potential end-customers or channel partners;
•
delayed or lost revenue;
•
a delay in attaining, or the failure to attain, market acceptance;
|
•
|
the expenditure of significant financial and product development resources in efforts to analyze, correct, eliminate, or work around errors or defects, to address and eliminate vulnerabilities, or to identify and ramp up production with third-party providers;
|
|
•
|
an increase in warranty claims, or an increase in the cost of servicing warranty claims, either of which would adversely affect our gross margins;
|
•
harm to our reputation or brand; and
•
litigation, regulatory inquiries, or investigations that may be costly and further harm our reputation.
Failure to protect and ensure the confidentiality and security of data could lead to legal liability, adversely affect our reputation and have a material adverse effect on our operating results, business and reputation.
We may collect, store and use certain confidential information in the course of providing our services, and we have invested in preserving the security of this data. We may also outsource operations to third-party service providers to whom we transmit certain confidential data. There are no assurances that any security measures we have in place, or any additional security measures that our subcontractors may have in place, will be sufficient to protect this confidential information from unauthorized security breaches.
We cannot assure you that, despite the implementation of these security measures, we will not be subject to a security incident or other data breach or that this data will not be compromised. We may be required to expend significant capital and other resources to protect against security breaches or to alleviate problems caused by security breaches, or to pay penalties as a result of such breaches. Despite our implementation of security measures, techniques used to obtain unauthorized access or to sabotage systems change frequently and may not be recognized until launched against a target. As a result, we may be unable to anticipate these techniques or implement adequate preventative measures to protect this data. In addition, security breaches can also occur as a result of non-technical issues, including intentional or inadvertent breaches by our employees or service providers or by other persons or entities with whom we have commercial relationships. Any compromise or perceived compromise of our security could damage our reputation with our end-customers, and could subject us to significant liability, as well as regulatory action, including financial penalties, which would materially adversely affect our brand, results of operations, financial condition, business and prospects.
We have incurred, and expect to continue to incur, significant costs to protect against security breaches. We may incur significant additional costs in the future to address problems caused by any actual or perceived security breaches.
Breaches of our security measures or those of our third-party service providers, or other security incidents, could result in unauthorized access to our sites, networks and systems; unauthorized access to, misuse or misappropriation of information, including personally identifiable information, or other confidential or proprietary information of ourselves or third parties; viruses, worms, spyware or other malware being served from our sites, networks or systems; deletion or modification of content or the display of unauthorized content on our sites; interruption, disruption or malfunction of operations; costs relating to notification of individuals, or other forms of breach remediation; deployment of additional personnel and protection technologies; response to governmental investigations and media inquiries and coverage; engagement of third party experts and consultants; litigation, regulatory investigations, prosecutions, and other actions, and other potential liabilities. If any of these events occurs, or is believed to occur, our reputation and brand could be damaged, our business may suffer, we could be required to expend significant capital and other resources to alleviate problems caused by such actual or perceived breaches, we could be exposed to a risk of loss, litigation or regulatory action and possible liability, and our ability to operate our business,
23
including our ability to provide maintenance and support services to our channel partners and end-customers, may be impaired. If current or prospective channel partners and end-customers believe that our systems and solutions do not provide adequate security for their businesses’ needs, our business and our financial results could be harmed. Additionally, actual, potential or anticipated attacks may cause us to incur increasing costs, including costs to deploy additional personnel and protection technologies, train employees and engage third-party experts and consultants.
Although we maintain privacy, data breach and network security liability insurance, we cannot be certain that our coverage will be adequate for liabilities actually incurred or that insurance will continue to be available to us on economically reasonable terms, or at all. Any actual or perceived compromise or breach of our security measures, or those of our third-party service providers, or any unauthorized access to, misuse or misappropriation of personally identifiable information, channel partners’ or end-customers information, or other information, could violate applicable laws and regulations, contractual obligations or other legal obligations and cause significant legal and financial exposure, adverse publicity and a loss of confidence in our security measures, any of which could have an material adverse effect on our business, financial condition and operating results.
Our failure to adequately protect personal data could have a material adverse effect on our business.
A wide variety of provincial, state, national, foreign, and international laws and regulations apply to the collection, use, retention, protection, disclosure, transfer, and other processing of personal data. These data protection and privacy-related laws and regulations are evolving and being tested in courts and may result in ever-increasing regulatory and public scrutiny and escalating levels of enforcement and sanctions. Our failure to comply with applicable laws and regulations, or to protect such data, could result in enforcement action against us, including fines, imprisonment of company officials and public censure, claims for damages by end-customers and other affected persons and entities, damage to our reputation and loss of goodwill (both in relation to existing and prospective channel partners and end-customers), and other forms of injunctive or operations-limiting relief, any of which could have a material adverse effect on our operations, financial performance, and business. Evolving and changing definitions of personal data and personal information, within the European Union, the United States, and elsewhere, especially relating to classification of Internet Protocol (IP) addresses, machine identification, location data, and other information, may limit or inhibit our ability to operate or expand our business, including limiting strategic partnerships that may involve the sharing of data. We may be required to expend significant resources to modify our solutions and otherwise adapt to these changes, which we may be unable to do on commercially reasonable terms or at all, and our ability to develop new solutions and features could be limited. These developments could harm our business, financial condition and results of operations. Even if not subject to legal challenge, the perception of privacy concerns, whether or not valid, may harm our reputation and inhibit adoption of our products by current and prospective end-customers.
If the general level of advanced cyber attacks declines, or is perceived by our current or potential customers to have declined, our business could be harmed.
Our security business may be dependent on enterprises and governments recognizing that advanced cyber attacks are pervasive and are not effectively prevented by legacy security solutions. High visibility attacks on prominent companies and governments have increased market awareness of advanced cyber attacks and help to provide an impetus for enterprises and governments to devote resources to protecting against advanced cyber attacks, which may include testing, purchasing, and deploying our products. If advanced cyber attacks were to decline, or enterprises or governments perceived a decline in the general level of advanced cyber attacks, our ability to attract new channel partners and end-customers and expand our offerings within existing channel partners and end-customers could be materially and adversely affected. An actual or perceived reduction in the threat landscape could increase our sales cycles and harm our business, results of operations and financial condition.
Undetected software or hardware errors may harm our business and results of operations.
Our products may contain undetected errors or defects when first introduced or as new versions are released. We have experienced these errors or defects in the past in connection with new products and product upgrades. We expect that these errors or defects will be found from time to time in new or enhanced products after commencement of commercial distribution. These problems may cause us to incur significant warranty and repair costs, divert the attention of our engineering personnel from our product development efforts and cause significant customer relations problems. We may also be subject to liability claims for damages related to product errors or defects. While we carry insurance policies covering this type of liability, these policies may not provide sufficient protection should a claim be asserted. A material product liability claim may harm our business and results of operations.
24
Any errors, defects or vulnerabilities in our products could result in:
|
•
|
expenditures of significant financial and product development resources in efforts to analyze, correct, eliminate or work around errors and defects or to address and eliminate vulnerabilities;
|
|
•
|
loss of existing or potential end-customers or distribution channel partners;
|
|
•
|
delayed or lost revenue;
|
|
•
|
delay or failure to attain market acceptance;
|
|
•
|
indemnification obligations under our agreements with resellers, distributors and/or end-customers;
|
|
•
|
an increase in warranty claims compared with our historical experience or an increased cost of servicing warranty claims, either of which would adversely affect our gross margin; and
|
|
•
|
litigation, regulatory inquiries, or investigations that may be costly and harm our reputation.
|
Our use of open source software in our products could negatively affect our ability to sell our products and subject us to possible litigation.
We incorporate open source software such as the Linux operating system kernel into our products. We recently implemented a formal open source use policy, including written guidelines for use of open source software and business processes for approval of that use. We have developed and implemented our open source policies according to industry practice; however, best practices in this area are subject to change, because there is little reported case law on the interpretation of material terms of many open source licenses. We are in the process of reviewing our open source use and our compliance with open source licenses and implementing remediation and changes necessary to comply with the open source licenses related thereto. We cannot guarantee that our use of open source software has been, and will be, managed effectively for our intended business purposes and/or compliant with applicable open source licenses. We may face legal action by third parties seeking to enforce their intellectual property rights related to our use of such open source software. Failure to adequately manage open source license compliance and our use of open source software may result in unanticipated obligations regarding our products and services, such as a requirement that we license proprietary portions of our products or services on unfavorable terms, that we make available source code for modifications or derivative works we created based upon, incorporating or using open source software, that we license such modifications or derivative works under the terms of the particular open source license and/or that we redesign the affected products or services, which could result, for example, in a loss of intellectual property rights, or delay in providing our products and services. From time to time, there have been claims against companies that distribute or use third-party open source software in their products and services, asserting that the open source software or its combination with the products or services infringes third parties’ patents or copyrights, or that the companies’ distribution or use of the open source software does not comply with the terms of the applicable open source licenses. Use of certain open source software can lead to greater risks than use of warranted third-party commercial software, as open source licensors generally do not provide warranties or controls on the origin of such open source software. From time to time, there have been claims against companies that use open source software in their products, challenging the ownership of rights in such open source software. As a result, we could also be subject to suits by parties claiming ownership of rights in what we believe to be open source software and so challenging our right to use such software in our products. If any such claims were asserted against us, we could be required to incur significant legal expenses defending against such a claim. Further, if our defenses to such a claim were not successful, we could be, for example, subject to significant damages, be required to seek licenses from third parties in order to continue offering our products and services without infringing such third party’s intellectual property rights, be required to re-engineer such products and services, or be required to discontinue making available such products and services if re-engineering cannot be accomplished on a timely or successful basis. The need to engage in these or other remedies could increase our costs or otherwise adversely affect our business, operating results and financial condition.
Our products must interoperate with operating systems, software applications and hardware that are developed by others and if we are unable to devote the necessary resources to ensure that our products interoperate with such software and hardware, we may fail to increase, or we may lose market share and we may experience a weakening demand for our products.
Our products must interoperate with our end-customers’ existing infrastructure, specifically their networks, servers, software and operating systems, which may be manufactured by a wide variety of vendors and original equipment manufacturers. As a result, when problems occur in a network, it may be difficult to identify the source of the problem. The
25
occurrence of software or hardware problems, whether caused by our products or another vendor’s products, may result in the delay or loss of market acceptance of our products. In addition, when new or updated versions of our end-customers’ software operating systems or applications are introduced, we must sometimes develop updated versions of our software so that our products will interoperate properly. We may not accomplish these development efforts quickly, cost-effectively or at all. These development efforts require capital investment and the devotion of engineering resources. If we fail to maintain compatibility with these applications, our end-customers may not be able to adequately utilize our products, and we may, among other consequences, fail to increase, or we may lose market share and experience a weakening in demand for our products, which would adversely affect our business, operating results and financial condition.
We license technology from third parties, and our inability to maintain those licenses could harm our business.
Many of our products include proprietary technologies licensed from third parties. In the future, it may be necessary to renew licenses for third party technology or obtain new licenses for other technology. These third party licenses may not be available to us on acceptable terms, if at all. As a result, we could also face delays or be unable to make changes to our products until equivalent technology can be identified, licensed or developed and integrated with our products. Such delays or an inability to make changes to our products, if it were to occur, could adversely affect our business, operating results and financial condition. The inability to obtain certain licenses to third-party technology, or litigation regarding the interpretation or enforcement of license agreements and related intellectual property issues, could have a material adverse effect on our business, operating results and financial condition.
Failure to prevent excess inventories or inventory shortages could result in decreased revenue and gross margin and harm our business.
We purchase products from our manufacturers outside of, and in advance of, reseller or end-customer orders, which we hold in inventory and resell. We place orders with our manufacturers based on our forecasts of our end-customers’ requirements and forecasts provided by our distribution channel partners. These forecasts are based on multiple assumptions, each of which might cause our estimates to be inaccurate, affecting our ability to provide products to our customers. There is a risk we may be unable to sell excess products ordered from our manufacturers. Inventory levels in excess of customer demand may result in obsolete inventory and inventory write-downs. For example, we incurred inventory write downs of $2.2 million for 2014 as a result of end-customers’ decisions to purchase our new product offering rather than our existing product offerings as originally expected; we also recorded a similar write down during the third quarter 2014. The sale of excess inventory at discounted prices could impair our brand image and have an adverse effect on our financial condition and results of operations. Conversely, if we underestimate demand for our products or if our manufacturers fail to supply products we require at the time we need them, we may experience inventory shortages. Inventory shortages might delay shipments to resellers, distributors and customers and cause us to lose sales. These shortages may diminish the loyalty of our distribution channel partners or customers.
The difficulty in forecasting demand also makes it difficult to estimate our future financial condition and results of operations from period to period. A failure to accurately predict the level of demand for our products could adversely affect our net revenue and net income, and we are unlikely to forecast such effects with any certainty in advance. For example, we failed to predict the slowdown in the United States sales during the three months ended September 30, 2014 which resulted in lower revenues, gross margin and net income than expected.
Our sales cycles can be long and unpredictable, primarily due to the complexity of our end-customers’ networks and data centers and the length of their budget cycles. As a result, our sales and revenue are difficult to predict and may vary substantially from period to period, which may cause our operating results to fluctuate significantly.
The timing of our sales is difficult to predict because of the length and unpredictability of our products’ sales cycles. A sales cycle is the period between initial contact with a prospective end-customer and any sale of our products. Our sales cycle, in particular to our large end-customers, may be lengthy due to the complexity of their networks and data centers. Because of this complexity, prospective end-customers generally consider a number of factors over an extended period of time before committing to purchase our products. End-customers often view the purchase of our products as a significant and strategic decision that can have important implications on their existing networks and data centers and, as a result, require considerable time to evaluate, test and qualify our products prior to making a purchase decision and placing an order to ensure that our products will successfully interoperate with our end-customers’ complex network and data centers. Additionally, the budgetary decisions at these entities can be lengthy and require multiple organization reviews. The length of time that end-customers devote to their evaluation of our products and decision making process varies significantly. The length of our products’ sales cycles typically ranges from three to 12 months but can be longer for our large end-customers. In addition, the length of our close or sales cycle can be affected by the extent to which customized features are requested, in particular in our large deals.
26
For all of these reasons, it is difficult to predict whether a sale will be completed or the particular fiscal period in which a sale will be completed, both of which contribute to the uncertainty of our future operating results. If our close or sales cycles lengthen, our revenue could be lower than expected, which would have an adverse impact on our operating results and could cause our stock price to decline. For example, during the three months ended September 30, 2014, we experienced longer than expected close and sales cycles for certain large deals and a 62% decrease in North America service provider revenue as compared to the same period in 2013 that adversely affected our revenue and may have contributed to a dramatic decline in our stock price.
Our ability to sell our products is highly dependent on the quality of our support and services offerings, and our failure to offer high-quality support could have a material adverse effect on our business, revenue and results of operations.
We believe that our ability to provide consistent, high quality customer service and technical support is a key factor in attracting and retaining end-customers of all sizes and is critical to the deployment of our products. When support is purchased our end-customers depend on our support organization to provide a broad range of support services, including on-site technical support, 24-hour support and shipment of replacement parts on an expedited basis. If our support organization or our distribution channel partners do not assist our end-customers in deploying our products effectively, succeed in helping our end-customers resolve post-deployment issues quickly, or provide ongoing support, it could adversely affect our ability to sell our products to existing end-customers and could harm our reputation with potential end-customers. We currently have technical support centers in the United States, Japan, China and the Netherlands. As we continue to expand our operations internationally, our support organization will face additional challenges, including those associated with delivering support, training and documentation in languages other than English.
We typically sell our products with maintenance and support as part of the initial purchase, and a substantial portion of our support revenue comes from renewals of maintenance and support contracts. Our end-customers have no obligation to renew their maintenance and support contracts after the expiration of the initial period. If we are unable to provide high quality support, our end-customers may elect not to renew their maintenance and support contracts or to reduce the product quantity under their maintenance and support contracts, thereby reducing our future revenue from maintenance and support contracts.
Our failure or the failure of our distribution channel partners to maintain high-quality support and services could have a material and adverse effect on our business, revenue and operating results.
We depend on growth in markets relating to network security, management and analysis, and lack of growth or contraction in one or more of these markets could have a material adverse effect on our results of operations and financial condition.
Demand for our products is linked to, among other things, growth in the size and complexity of network infrastructures and the demand for networking technologies addressing the security, management and analysis of such infrastructures. These markets are dynamic and evolving. Our future financial performance will depend in large part on continued growth in the number of organizations investing in their network infrastructure and the amount they commit to such investments. If this demand declines, our results of operations and financial condition would be materially and adversely affected. Segments of the network infrastructure industry have in the past experienced significant economic downturns. Furthermore, the market for network infrastructure may not continue to grow at historic rates, or at all. The occurrence of any of these factors in the markets relating to network security, management and analysis could materially and adversely affect our results of operations and financial condition. For example, during the three months ended September 30, 2014, we experienced a 62% decrease in North America service provider revenue as compared to the same period in 2013 that adversely affected our revenue and may have contributed to a dramatic decline in our stock price. We anticipate a possible slowdown in North America service providers, which may lead to continued near term fluctuation in our products revenue and total revenue.
27
Our revenue growth rate in recent periods may not be indicative of our future performance.
You should not consider our revenue growth rate in recent periods as indicative of our future performance. We have recently experienced revenue growth rates of 32%, 18% and 27% in 2012, 2013 and 2014 as compared to the same prior periods. We may not achieve similar revenue growth rates in future periods. You should not rely on our revenue for any prior quarterly or annual periods as any indication of our future revenue or revenue growth. If we are unable to maintain consistent revenue or revenue growth, our stock price could be volatile, and it may be difficult to achieve and maintain profitability. For example, our sequential product growth rate between the three months ended June 30, 2014 and September 30, 2014 was a negative 7% and was lower than expected which resulted in our stock price to decline.
Our business and operations have experienced rapid growth in recent periods, and if we do not effectively manage any future growth or are unable to improve our controls, systems and processes, our operating results will be adversely affected.
In recent periods, we have significantly increased the number of our employees and independent contractors. As we hire new employees and independent contractors and expand into new locations outside the United States, we are required to comply with varying local laws for each of these new locations. We anticipate that further expansion of our infrastructure and headcount will be required. Our rapid growth has placed, and will continue to place, a significant strain on our administrative and operational infrastructure and financial resources. Our ability to manage our operations and growth across multiple countries will require us to continue to refine our operational, financial and management controls, human resource policies, and reporting systems and processes.
We need to continue to improve our internal systems, processes, and controls to effectively manage our operations and growth. We may not be able to successfully implement improvements to these systems, processes and controls in an efficient or timely manner. In addition, our systems and processes may not prevent or detect all errors, omissions, or fraud. We may experience difficulties in managing improvements to our systems, processes, and controls or in connection with third-party software, which could impair our ability to provide products or services to our customers in a timely manner, causing us to lose customers, limit us to smaller deployments of our products, increase our technical support costs, or damage our reputation and brand. Our failure to improve our systems and processes, or their failure to operate in the intended manner, may result in our inability to manage the growth of our business and to accurately forecast our revenue, expenses, and earnings, or to prevent certain losses, any of which may harm our business and results of operations.
We may not be able to sustain or develop new distributor and reseller relationships, and a reduction or delay in sales to significant distribution channel partners could hurt our business.
We sell our products and services through multiple distribution channels in the United States and internationally. We may not be able to increase our number of distributor or reseller relationships or maintain our existing relationships. Recruiting and retaining qualified distribution channel partners and training them on our technologies requires significant time and resources. These distribution channel partners may also market, sell and support products and services that are competitive with ours and may devote more resources to the marketing, sales and support of such competitive products. Our sales channel structure could subject us to lawsuits, potential liability and reputational harm if, for example, any of our distribution channel partners misrepresent the functionality of our products or services to end-customers or violate laws or our corporate policies. If we are unable to establish or maintain our sales channels or if our distribution channel partners are unable to adapt to our future sales focus and needs, our business and results of operations will be harmed.
The terms of our credit facility could restrict our operations, particularly our ability to respond to changes in our business or to take specified actions.
Our credit facility contains a number of restrictive covenants that impose operating and financial restrictions on us, including restrictions on our ability to take actions that may be in our best interests. Our credit facility requires us to satisfy specified financial covenants. In the past, we were not in compliance with one of the covenants on one occasion and were able to obtain a waiver from our lenders regarding the non-compliance. Our ability to meet those financial covenants can be affected by events beyond our control, and we may not be able to continue to meet those covenants or obtain waivers if we fail to meet a covenant. Upon the occurrence of an event of default, our lenders could elect to declare all amounts outstanding under the credit facility to be immediately due and payable and terminate all commitments to extend further credit. If our lenders accelerate the repayment, if any, we may not have sufficient funds to repay our existing debt. If we were unable to repay those amounts, our lenders could proceed against the collateral granted to them to secure such indebtedness. We have pledged substantially all of our assets, including our intellectual property, as collateral under the credit facility. As of December 31, 2014, we had no outstanding balance on our credit facility and were in compliance with the facility covenants.
28
Our sales to governmental organizations are subject to a number of challenges and risks.
We sell to governmental organization end-customers. Sales to governmental organizations are subject to a number of challenges and risks. Selling to governmental organizations can be highly competitive, expensive and time consuming, often requiring significant upfront time and expense without any assurance that these efforts will generate a sale. We have not yet received security clearance from the United States government, which prevents us from being able to sell directly for certain governmental uses. There can be no assurance that such clearance will be obtained, and failure to do so may adversely affect our operating results. Governmental organization demand and payment for our products may be impacted by public sector budgetary cycles and funding authorizations, with funding reductions or delays adversely affecting public sector demand for our products. Governmental organizations may have statutory, contractual or other legal rights to terminate contracts with our distributors and resellers for convenience or due to a default, and any such termination may adversely impact our future operating results.
Failure to comply with governmental laws and regulations could harm our business.
Our business is subject to regulation by various federal, state, local and foreign governmental entities, including agencies responsible for monitoring and enforcing employment and labor laws, workplace safety, product safety, environmental laws, consumer protection laws, anti-bribery laws, import/export controls, federal securities laws, and tax laws and regulations. In certain jurisdictions, these regulatory requirements may be more stringent than those in the United States. Noncompliance with applicable regulations or requirements could subject us to investigations, sanctions, mandatory product recalls, enforcement actions, disgorgement of profits, fines, damages, civil and criminal penalties, or injunctions. If any governmental sanctions are imposed, or if we do not prevail in any possible civil or criminal litigation, our business, operating results, and financial condition could be materially adversely affected. In addition, responding to any action will likely result in a significant diversion of management’s attention and resources and an increase in professional fees. Enforcement actions and sanctions could harm our business, operating results and financial condition.
We are subject to governmental export and import controls that could subject us to liability or impair our ability to compete in international markets.
Our products are subject to U.S. export controls and may be exported outside the United States only with the required level of export license or through an export license exception because we incorporate encryption technology into our products. In addition, various countries regulate the import of certain encryption technology and have enacted laws that could limit our ability to distribute our products or our end-customers’ ability to implement our products in those countries. Changes in our products or changes in export and import regulations may create delays in the introduction of our products in international markets, prevent our end-customers with international operations from deploying our products throughout their global systems or, in some cases, prevent the export or import of our products to certain countries altogether. Any change in export or import regulations or related legislation, shift in approach to the enforcement or scope of existing regulations or change in the countries, persons or technologies targeted by such regulations, could result in decreased use of our products by, or in our decreased ability to export or sell our products to, existing or potential end-customers with international operations. Any decreased use of our products or limitation on our ability to export or sell our products would likely adversely affect our business, operating results and financial condition. We discovered that we inadvertently reported incorrect information to the U.S. Census Bureau when reporting certain exports, although the underlying exports were authorized under the Export Administration Regulations. We implemented corrective actions and filed a Voluntary Self Disclosure with the U.S. Census Bureau regarding these technical violations. The Census Bureau closed the voluntary self-disclosure in October, 2014 without imposition of any fines or penalties.
We are subject to various environmental laws and regulations that could impose substantial costs upon us.
Our company must comply with local, state, federal, and international environmental laws and regulations in the countries in which we do business. We are also subject to laws, which restrict certain hazardous substances, including lead, used in the construction of our products, such as the European Union Restriction on the Use of Hazardous Substances in electrical and electronic equipment directive. We are also subject to the European Union Directive, known as the Waste Electrical and Electronic Equipment Directive, or WEEE Directive, which requires producers of certain electrical and electronic equipment to properly label products, register as a WEEE producer, and provide for the collection, disposal, and recycling of waste electronic products. Failure to comply with these environmental directives and other environmental laws could result in the imposition of fines and penalties, inability to sell covered products in certain countries, the loss of revenue, or subject us to third-party property damage or personal injury claims, or require us to incur investigation, remediation or engineering costs. Our operations and products will be affected by future environmental laws and regulations, but we cannot predict the ultimate impact of any such future laws and regulations at this time
.
29
Our products must conform to industry standards in order to be accepted by end-customers in our markets.
Generally, our products comprise only a part of a data center. The servers, network, software and other components and systems of a data center must comply with established industry standards in order to interoperate and function efficiently together. We depend on companies that provide other components of the servers and systems in a data center to support prevailing industry standards. Often, these companies are significantly larger and more influential in driving industry standards than we are. Some industry standards may not be widely adopted or implemented uniformly, and competing standards may emerge that may be preferred by our end-customers. If larger companies do not support the same industry standards that we do, or if competing standards emerge, market acceptance of our products could be adversely affected and we may need to incur substantial costs to conform our products to such standards, which could harm our business, operating results and financial condition.
We are dependent on various information technology systems, and failures of or interruptions to those systems could harm our business.
Many of our business processes depend upon our information technology systems, the systems and processes of third parties, and on interfaces with the systems of third parties. If those systems fail or are interrupted, or if our ability to connect to or interact with one or more networks is interrupted, our processes may function at a diminished level or not at all. This could harm our ability to ship or support our products, and our financial results may be harmed.
In addition, reconfiguring or upgrading our information technology systems or other business processes in response to changing business needs may be time-consuming and costly and is subject to risks of delay or failed deployment. To the extent this impacts our ability to react timely to specific market or business opportunities, our financial results may be harmed.
Future acquisitions we may undertake may not result in the financial and strategic goals that are contemplated at the time of the transaction.
We may make acquisitions of complementary companies, products or technologies. With respect to any other future acquisitions we may undertake, we may find that the acquired businesses, products or technologies do not further our business strategy as expected, that we paid more than what the assets are later worth or that economic conditions change, all of which may generate future impairment charges. Any future acquisitions may be viewed negatively by customers, financial markets or investors. There may be difficulty integrating the operations and personnel of an acquired business, and we may have difficulty retaining the key personnel of an acquired business. We may have difficulty in integrating acquired technologies or products with our existing product lines. Any integration process may require significant time and resources, and we may not be able to manage the process successfully. Our ongoing business and management’s attention may be disrupted or diverted by transition or integration issues and the complexity of managing geographically and culturally diverse locations. We may have difficulty maintaining uniform standards, controls, procedures and policies across locations. We may experience significant problems or liabilities associated with product quality, technology and other matters.
Our inability to successfully operate and integrate future acquisitions appropriately, effectively and in a timely manner, or to retain key personnel of any acquired business, could have a material adverse effect on our revenue, gross margin and expenses.
Our ability to use our net operating loss carryforwards may be subject to limitation and may result in increased future tax liability to us.
Generally, a change of more than 50% in the ownership of a corporation’s stock, by value, over a three-year period constitutes an ownership change for U.S. federal income tax purposes. An ownership change may limit a company’s ability to use its net operating loss carryforwards attributable to the period prior to such change. In the event we have undergone an ownership change under Section 382 of the Internal Revenue Code, if we earn net taxable income, our ability to use our pre-change net operating loss carryforwards to offset U.S. federal taxable income may become subject to limitations, which could potentially result in increased future tax liability to us.
30
Unanticipated changes in effective tax rates or adverse outcomes resulting from examination of our income or other tax returns could adversely affect our operating results and financial condition.
We are subject to income taxes in the United States and various foreign jurisdictions, and our domestic and international tax liabilities will be subject to the allocation of expenses in differing jurisdictions. Our future effective tax rates could be subject to volatility or adversely affected by a number of factors, including:
•
changes in the valuation of our deferred tax assets and liabilities;
•
expected timing and amount of the release of tax valuation allowances;
•
expiration of, or detrimental changes in, research and development tax credit laws;
•
tax effects of stock-based compensation;
•
costs related to intercompany restructurings;
•
changes in tax laws, regulations, accounting principles or interpretations thereof;
|
•
|
future earnings being lower than anticipated in countries where we have lower statutory tax rates and higher than anticipated earnings in countries where we have higher statutory tax rates. or
|
|
•
|
examinations by US federal, state or foreign jurisdictions that disagree with interpretations of tax rules and regulations in regards to positions taken on tax filings
|
Changes in our effective tax rate could adversely affect our results of operations.
As our business grows, we are required to comply with increasingly complex taxation rules and practices. We are subject to tax in multiple U.S. tax jurisdictions and in foreign tax jurisdictions as we expand internationally. The development of our tax strategies requires additional expertise and may impact how we conduct our business. Our future effective tax rates could be unfavorably affected by changes in, or interpretations of, tax rules and regulations in the jurisdictions in which we do business, lapses of the availability of the U.S. research and development tax credit or changes in the valuation of our deferred tax assets and liabilities. Furthermore, we provide for certain tax liabilities that involve significant judgment. We are subject to the examination of our tax returns by federal, state and foreign tax authorities, which could focus on our intercompany transfer pricing methodology as well as other matters. If our tax strategies are ineffective or we are not in compliance with domestic and international tax laws, our financial position, operating results and cash flows could be adversely affected.
Our business is subject to the risks of warranty claims, product returns, product liability, and product defects.
Real or perceived errors, failures or bugs in our products could result in claims by end-customers for losses that they sustain. If end-customers make these types of claims, we may be required, or may choose, for customer relations or other reasons, to expend additional resources in order to help correct the problem. Historically, the amount of warranty claims has not been significant, but there are no assurances that the amount of such claims will not be material in the future. Liability provisions in our standard terms and conditions of sale, and those of our resellers and distributors, may not be enforceable under some circumstances or may not fully or effectively protect us from customer claims and related liabilities and costs, including indemnification obligations under our agreements with resellers, distributors or end-customers. The sale and support of our products also entail the risk of product liability claims. We maintain insurance to protect against certain types of claims associated with the use of our products, but our insurance coverage may not adequately cover any such claims. In addition, even claims that ultimately are unsuccessful could result in expenditures of funds in connection with litigation and divert management’s time and other resources.
We are exposed to the credit risk of our distribution channel partners and end-customers, which could result in material losses and negatively impact our operating results.
Most of our sales are on an open credit basis, with typical payment terms ranging from 30 to 90 days depending on local customs or conditions that exist in the sale location. If any of the distribution channel partners or end-customers responsible for a significant portion of our revenue becomes insolvent or suffers a deterioration in its financial or business condition and is unable to pay for our products, our results of operations could be harmed.
31
Concentration of ownership among our existing executive officers, a small number of stockholders, directors and their affiliates may prevent new investors from influencing significant corporate decisions.
Our executive officers and directors, together with affiliated entities, hold 33.6% of our outstanding common stock as of December31, 2014. Accordingly, these stockholders, acting together, have significant influence over the election of our directors, over whether matters requiring stockholder approval are approved or disapproved and over our affairs in general. The interests of these stockholders could conflict with your interests. These stockholders may also have an interest in pursuing acquisitions, divestitures, financings or other transactions that, in their judgment, could enhance their investments, even though such transactions might involve risks to you. In addition, this concentration of ownership could have the effect of delaying or preventing a liquidity event such as a merger or liquidation of our company.
We may need to raise additional funds in future private or public offerings, and such funds may not be available on acceptable terms, if at all. If we do raise additional funds, existing stockholders will suffer dilution.
We may need to raise additional funds in private or public offerings, and these funds may not be available to us when we need them or on acceptable terms, if at all. If we raise additional funds through further issuances of equity or convertible debt securities, you could suffer significant dilution, and any new equity securities we issue could have rights, preferences and privileges superior to those of our then-existing capital stock. Any debt financing secured by us in the future could involve restrictive covenants relating to our capital raising activities and other financial and operational matters, which may make it more difficult for us to obtain additional capital and to pursue business opportunities. If we cannot raise additional funds when we need them, our business and prospects could fail or be materially and adversely affected.
The price of our common stock may be volatile, and the value of your investment could decline.
Technology stocks have historically experienced high levels of volatility. The trading price of our common stock following the initial public offering has fluctuated substantially. Following the completion of the initial public offering, the market price of our common stock has been higher or lower than the price you paid in the offering, depending on many factors, some of which are beyond our control and may not be related to our operating performance. These fluctuations could cause you to lose all or part of your investment in our common stock. Factors that could cause fluctuations in the trading price of our common stock include the following:
|
•
|
announcements of new products, services or technologies, commercial relationships, acquisitions or other events by us or our competitors;
|
|
•
|
price and volume fluctuations in the overall stock market from time to time;
|
|
•
|
significant volatility in the market price and trading volume of technology companies in general and of companies in our industry;
|
|
•
|
fluctuations in the trading volume of our shares or the size of our public float;
|
|
•
|
actual or anticipated changes or fluctuations in our results of operations;
|
|
•
|
whether our results of operations meet the expectations of securities analysts or investors;
|
|
•
|
actual or anticipated changes in the expectations of investors or securities analysts;
|
|
•
|
litigation or investigations involving us, our industry, or both;
|
|
•
|
regulatory developments in the United States, foreign countries or both;
|
|
•
|
general economic conditions and trends;
|
|
•
|
major catastrophic events;
|
|
•
|
sales of large blocks of our common stock; or
|
|
•
|
departures of key personnel.
|
32
In addition, if the market for technology stocks or the stock market in general experiences a loss of investor confidence, the trading price of our common stock could decline for reasons unrelated to our business, results of operations or financial condition. The trading price of our common stock might also decline in reaction to events that affect other companies in our industry even if these events do not directly affect us. In the past, following periods of volatility in the market price of a company’s securities, securities class action litigation has often been brought against that company. The price of our common stock has been highly volatile since our IPO in March 2014, and in January 2015, a law suit alleging violations of securities laws was filed against us, our directors and certain of our executive officers. This and any future securities litigation could result in substantial costs and divert our management’s attention and resources from our business. This could have a material adverse effect on our business, results of operations and financial condition.
Sales of substantial amounts of our common stock in the public markets, or the perception that such sales might occur, could reduce the price that our common stock might otherwise attain and may dilute your voting power and your ownership interest in us.
Sales of a substantial number of shares of our common stock in the public market, or the perception that such sales could occur, could adversely affect the market price of our common stock and may make it more difficult for you to sell your common stock at a time and price that you deem appropriate. As of December 31, 2014, there were approximately 5.0 million vested and exercisable options to purchase our common stock, in addition to the 61,376,690 common shares outstanding as of such date. All outstanding shares and all shares issuable upon exercise of outstanding and vested options are freely tradable, subject in some cases to volume and other restrictions of Rules 144 and 701 under the Securities Act of 1933, as amended, as well as our insider trading policy. In addition, holders of certain shares of our outstanding common stock, including an aggregate of 9,427,846 shares held by funds affiliated with Summit Partners, L.P. as of December 31, 2014, are entitled to rights with respect to registration of these shares under the Securities Act pursuant to an investors’ rights agreement.
If these holders of our common stock, by exercising their registration rights, sell a large number of shares, they could adversely affect the market price for our common stock. If we file a registration statement for the purposes of selling additional shares to raise capital and are required to include shares held by these holders pursuant to the exercise of their registration rights, our ability to raise capital may be impaired. Sales of substantial amounts of our common stock in the public market, or the perception that these sales could occur, could cause the market price of our common stock to decline.
We are an emerging growth company, and any decision on our part to comply only with certain reduced disclosure requirements applicable to emerging growth companies could make our common stock less attractive to investors.
We are an emerging growth company, and, for as long as we continue to be an emerging growth company, we may choose to take advantage of exemptions from various reporting requirements applicable to other public companies but not to “emerging growth companies,” including, but not limited to, not being required to have our independent registered public accounting firm audit our internal control over financial reporting under Section 404 of the Sarbanes-Oxley Act, reduced disclosure obligations regarding executive compensation in our periodic reports and proxy statements, and exemptions from the requirements of holding a nonbinding advisory vote on executive compensation and stockholder approval of any golden parachute payments not previously approved. We could be an emerging growth company for up to five years following the completion of our initial public offering. We will remain an emerging growth company until the earliest of: (a) the last day of the year (i) following the fifth anniversary of the completion of the initial public offering, (ii) in which we have total annual gross revenue of at least $1.0 billion, or (iii) in which we qualify as a large accelerated filer, which means the market value of our common stock that is held by non-affiliates exceeds $700 million as of the prior June 30, or (b) the date on which we have issued more than $1.0 billion in non-convertible debt securities during the prior three-year period. We cannot predict if investors will find our common stock less attractive if we choose to rely on these exemptions. If some investors find our common stock less attractive as a result of any choices to reduce future disclosure, there may be a less active trading market for our common stock and the price of our common stock may be more volatile.
Under the JOBS Act, emerging growth companies can also delay adopting new or revised accounting standards until such time as those standards apply to private companies. We have irrevocably elected not to avail ourselves of this accommodation allowing for delayed adoption of new or revised accounting standards, and, therefore, we will be subject to the same new or revised accounting standards as other public companies that are not emerging growth companies.
The requirements of being a public company increase costs and may divert management attention.
As a reporting company, we are incurring increased legal, accounting and other expenses, including costs associated with SEC reporting and corporate governance requirements. These requirements include compliance with Section 404 and other provisions of the Sarbanes-Oxley Act, as well as rules implemented by the SEC. In addition, our management team is adapting
33
to the requirements of being a reporting company. The expenses incurred for reporting and corporate governance purposes are significant. We expect these rules and regulations to substantially increase our legal and financial compliance costs and to make some activities more time-consuming and costly.
In addition, changing laws, regulations and standards relating to corporate governance and public disclosure are creating uncertainty for public companies, increasing legal and financial compliance costs, and making some activities more time consuming. Additionally, implementation of the Dodd-Frank Wall Street Reform and Consumer Protection Act of 2010, or the Dodd-Frank Act, may also cause us to incur additional costs and subject us to risks if we are unable to fully comply. For instance, the SEC adopted new disclosure requirements in 2012 as part of implementation of the Dodd-Frank Act regarding the use of conflict minerals mined from the Democratic Republic of Congo and adjoining countries and procedures regarding a manufacturer’s efforts to prevent the sourcing of such conflict minerals. The implementation of these requirements could adversely affect our costs and our relationships with customers and suppliers. These laws, regulations and standards are subject to varying interpretations, in many cases due to their lack of specificity, and, as a result, their application in practice may evolve over time as new guidance is provided by regulatory and governing bodies. This could result in continuing uncertainty regarding compliance matters and higher costs necessitated by ongoing revisions to disclosure and governance practices. We intend to invest resources to comply with evolving laws, regulations, and standards, and this investment may result in increased general and administrative expense and a diversion of management’s time and attention from revenue-generating activities to compliance activities. If our efforts to comply with new laws, regulations, and standards differ from the activities intended by regulatory or governing bodies, regulatory authorities may initiate legal proceedings against us and our business may be harmed.
The increased costs associated with operating as a reporting company may decrease our net income or increase our net loss, and may require us to reduce costs in other areas of our business or increase the prices of our products or services. Additionally, if these requirements divert our management’s attention from other business concerns, they could have a material adverse effect on our business, financial condition and results of operations.
If securities or industry analysts do not publish research or reports about our business, or publish inaccurate or unfavorable research reports about our business, our share price and trading volume could decline
.
The market for our common stock, to some extent, depends on the research and reports that securities or industry analysts publish about us or our business. We do not have any control over these analysts. If one or more of the analysts who cover us should downgrade our shares or change their opinion of our shares, our share price would likely decline. If one or more of these analysts should cease coverage of our company or fail to regularly publish reports on us, we could lose visibility in the financial markets, which would cause our share price or trading volume to decline.
Our charter documents and Delaware law could discourage takeover attempts and lead to management entrenchment.
Our restated certificate of incorporation and bylaws contain provisions that could delay or prevent a change in control of our company. These provisions could also make it difficult for stockholders to elect directors that are not nominated by the current members of our board of directors or take other corporate actions, including effecting changes in our management. These provisions include:
|
•
|
a classified board of directors with three-year staggered terms, which could delay the ability of stockholders to change the membership of a majority of our board of directors;
|
|
•
|
the ability of our board of directors to issue shares of preferred stock and to determine the price and other terms of those shares, including preference and voting rights, without stockholder approval, which could be used to significantly dilute the ownership of a hostile acquirer;
|
|
•
|
the exclusive right of our board of directors to elect a director to fill a vacancy created by the expansion of our board of directors or the resignation, death or removal of a director, which prevents stockholders from being able to fill vacancies on our board of directors;
|
|
•
|
a prohibition on stockholder action by written consent, which forces stockholder action to be taken at an annual or special meeting of our stockholders;
|
|
•
|
the requirement that a special meeting of stockholders may be called only by the chairman of our board of directors, our Chief Executive Officer, our secretary, or a majority vote of our board of directors, which could
|
34
delay the ability of our stockholders to force consideration of a proposal or to take action, including the removal of directors;
|
•
|
the requirement for the affirmative vote of holders of at least 66-2/3% of the voting power of all of the then-outstanding shares of the voting stock, voting together as a single class, to amend the provisions of our restated certificate of incorporation relating to the issuance of preferred stock and management of our business or our bylaws, which may inhibit the ability of an acquirer to effect such amendments to facilitate an unsolicited takeover attempt;
|
|
•
|
the ability of our board of directors, by majority vote, to amend the bylaws, which may allow our board of directors to take additional actions to prevent an unsolicited takeover and inhibit the ability of an acquirer to amend the bylaws to facilitate an unsolicited takeover attempt; and
|
|
•
|
advance notice procedures with which stockholders must comply to nominate candidates to our board of directors or not to propose matters to be acted upon at a stockholders’ meeting, which may discourage or deter a potential acquirer from conducting a solicitation of proxies to elect the acquiror’s own slate of directors or otherwise attempting to obtain control of us.
|
In addition, as a Delaware corporation, we are subject to Section 203 of the Delaware General Corporation Law. These provisions may prohibit large stockholders, in particular those owning 15% or more of our outstanding voting stock, from merging or combining with us for a certain period of time.
Proceeds received from the sale of our capital stock may be used for general corporate purposes, and we may not use such proceeds effectively.
We completed our public offering in March 2014. The principal purposes of the initial public offering were to raise additional capital, to create a public market for our common stock and to facilitate our future access to the public equity markets. We have not yet determined the specific allocation of the net proceeds that we received in the initial public offering. Rather, we intend to use the net proceeds that we received in the initial public offering primarily for general corporate purposes, including working capital, sales and marketing activities, research and development activities, general and administrative matters and capital expenditures, and we may use a portion of the net proceeds for the acquisition of, or investment in, business products, services or technologies that complement our business. Accordingly, our management will have broad discretion over the specific use of the net proceeds that we receive in the initial public offering and might not be able to obtain a significant return, if any, on investment of these net proceeds. We cannot assure you that we will use such proceeds effectively. If we do not use the net proceeds that we received in the initial public offering effectively, our business, results of operations and financial condition could be harmed.
Our business is subject to the risks of earthquakes, fire, power outages, floods, and other catastrophic events, and to interruption by man-made problems such as acts of war and terrorism.
A significant natural disaster, such as an earthquake, fire, a flood, or significant power outage could have a material adverse impact on our business, operating results, and financial condition. Our corporate headquarters are located in the San Francisco Bay Area, a region known for seismic activity. In addition, our two primary manufacturers are located in Taiwan, which is near major earthquake fault lines and subject to typhoons during certain times of the year. In the event of a major earthquake or typhoon, or other natural or man-made disaster, our manufacturers in Taiwan may face business interruptions, which may impact quality assurance, product costs, and product supply and timing. In the event our or our service providers’ information technology systems or manufacturing or logistics abilities are hindered by any of the events discussed above, shipments could be delayed, resulting in missed financial targets, such as revenue and shipment targets, and our operations could be disrupted, for the affected quarter or quarters. In addition, cyber security attacks, acts of war or terrorism, or other geo-political unrest could cause disruptions in our business or the business of our supply chain, manufacturers, logistics providers, partners, or end-customers or the economy as a whole. Any disruption in the business of our supply chain, manufacturers, logistics providers, partners or end-customers that impacts sales at the end of a quarter could have a significant adverse impact on our quarterly results. All of the aforementioned risks may be further increased if the disaster recovery plans for us and our suppliers prove to be inadequate. To the extent that any of the above should result in delays or cancellations of customer orders, or the delay in the manufacture, deployment or shipment of our products, our business, financial condition and operating results would be adversely affected.
35
We do not intend to pay dividends for the foreseeable future.
We intend to retain any earnings to finance the operation and expansion of our business, and we do not anticipate paying any cash dividends in the future. In addition, our revolving credit facility currently restrict our ability to pay dividends while this facility remains outstanding. As a result, you may only receive a return on your investment in our common stock if the value of our common stock increases.
None.
Our corporate headquarters is located in San Jose, California, where we currently lease 79,803 square feet of space under a lease agreement that expires in February 2020. We lease an additional 29,230 square feet of space in San Jose under a lease agreement that expires in January 2016. We also lease space for offices internationally and for sales offices in locations throughout the United States and various international locations, including China, Japan, the United Kingdom, the Netherlands and Taiwan. We believe that our current facilities are adequate to meet our current needs. We intend to expand our facilities or add new facilities as we add employees and enter new geographic markets. We believe that alternative or additional space suitable for our requirements will be available as needed to accommodate ongoing operations and any such growth. We do however expect to incur additional expenses in connection with any such new or expanded facilities.
We lease office space for headquarters, manufacturing, operations, research and engineering, distribution, marketing, sales and customer support at 13 locations in the U.S. and approximately 28 locations throughout the world, including China, Japan, the United Kingdom, the Netherlands, Korea, Taiwan and Singapore.
We consider these current facilities suitable and adequate to meet our requirements.
We have been and may currently be involved in various legal proceedings, the outcomes of which are not within our complete control or may not be known for prolonged periods of time. Management is required to assess the probability of loss and amount of such loss, if any, in preparing our consolidated financial statements. We evaluate the likelihood of a potential loss from legal proceedings to which we are a party. We record a liability for such claims when a loss is deemed probable and the amount can be reasonably estimated. Significant judgment may be required in the determination of both probability and whether an exposure is reasonably estimable. Our judgments are subjective based on the status of the legal proceedings, the merits of our defenses and consultation with in-house and outside legal counsel. As additional information becomes available, we reassess the potential liability related to pending claims and may revise our estimates. Due to the inherent uncertainties of the legal processes in the multiple jurisdictions in which we operate, our judgments may be materially different than the actual outcomes, which could have material adverse effects on our business, financial conditions and results of operations.
Additional information with respect to this Item may be found in Note 5.
Commitments and Contingencies
, in the Notes to Consolidated Financial Statements of this Annual Report on Form 10-K, which is incorporated by reference.
Not applicable.
ITEM 5.
Market for Registrant's Common Equity, Related Stockholder Matters and Issuer Purchases of Equity Securities
Market for Registrant's Common Equity
Our common stock has been quoted on the New York Stock Exchange ("NYSE") under the symbol “ATEN” since March 21, 2014. Prior to that time, there was no public market for our stock. The following table sets forth for the indicated periods, the high and low sale prices of our common stock.
36
|
Fiscal Year 2014 Quarter Ended
|
|||||||||||||||
|
March 31, 2014
|
June 30,
2014
|
September 30,
2014 |
December 31,
2014 |
||||||||||||
|
Low
|
$
|
14.01
|
|
$
|
10.63
|
|
$
|
9.11
|
|
$
|
3.93
|
|
|||
|
High
|
$
|
16.21
|
|
$
|
15.22
|
|
$
|
13.70
|
|
$
|
8.66
|
|
|||
The closing sale price of our common stock on the NYSE was $4.33 and $4.36 on February 27, 2015 and December 31, 2014. As of February 27, 2015, there were approximately 261 stockholders of record. Because many shares of our common stock are held by brokers and other institutions on behalf of stockholders, we are unable to estimate the total number of stockholders represented by these holders of record.
Dividends
We have never declared or paid any cash dividends on our common stock. We currently intend to retain any future earnings and do not expect to pay any cash dividends on our common stock for the foreseeable future. Any determination to pay dividends in the future will be at the discretion of our board of directors and will be dependent on a number of factors, including our earnings, capital requirements and overall financial conditions. Currently, the agreement for our revolving credit facility contains restrictions on our ability to pay dividends.
Equity Compensation Plan Information
See Item 12, “Security Ownership of Certain Beneficial Owners and Management and Related Stockholder Matters” for information regarding securities authorized for issuance.
37
Comparison of Stockholder Return
This graph compares, for the period ended December 31, 2014, the cumulative total return on our common stock, the NASDAQ Composite Index and the Russell 3000 Index. The graph assumes $100 was invested on March 21, 2014 in the common stock of A10 Networks, Inc., the NASDAQ Composite Index and the Russell 3000 Index, and assumes the reinvestment of any dividends. The stock price performance on the following graph is not necessarily indicative of future stock price performance.
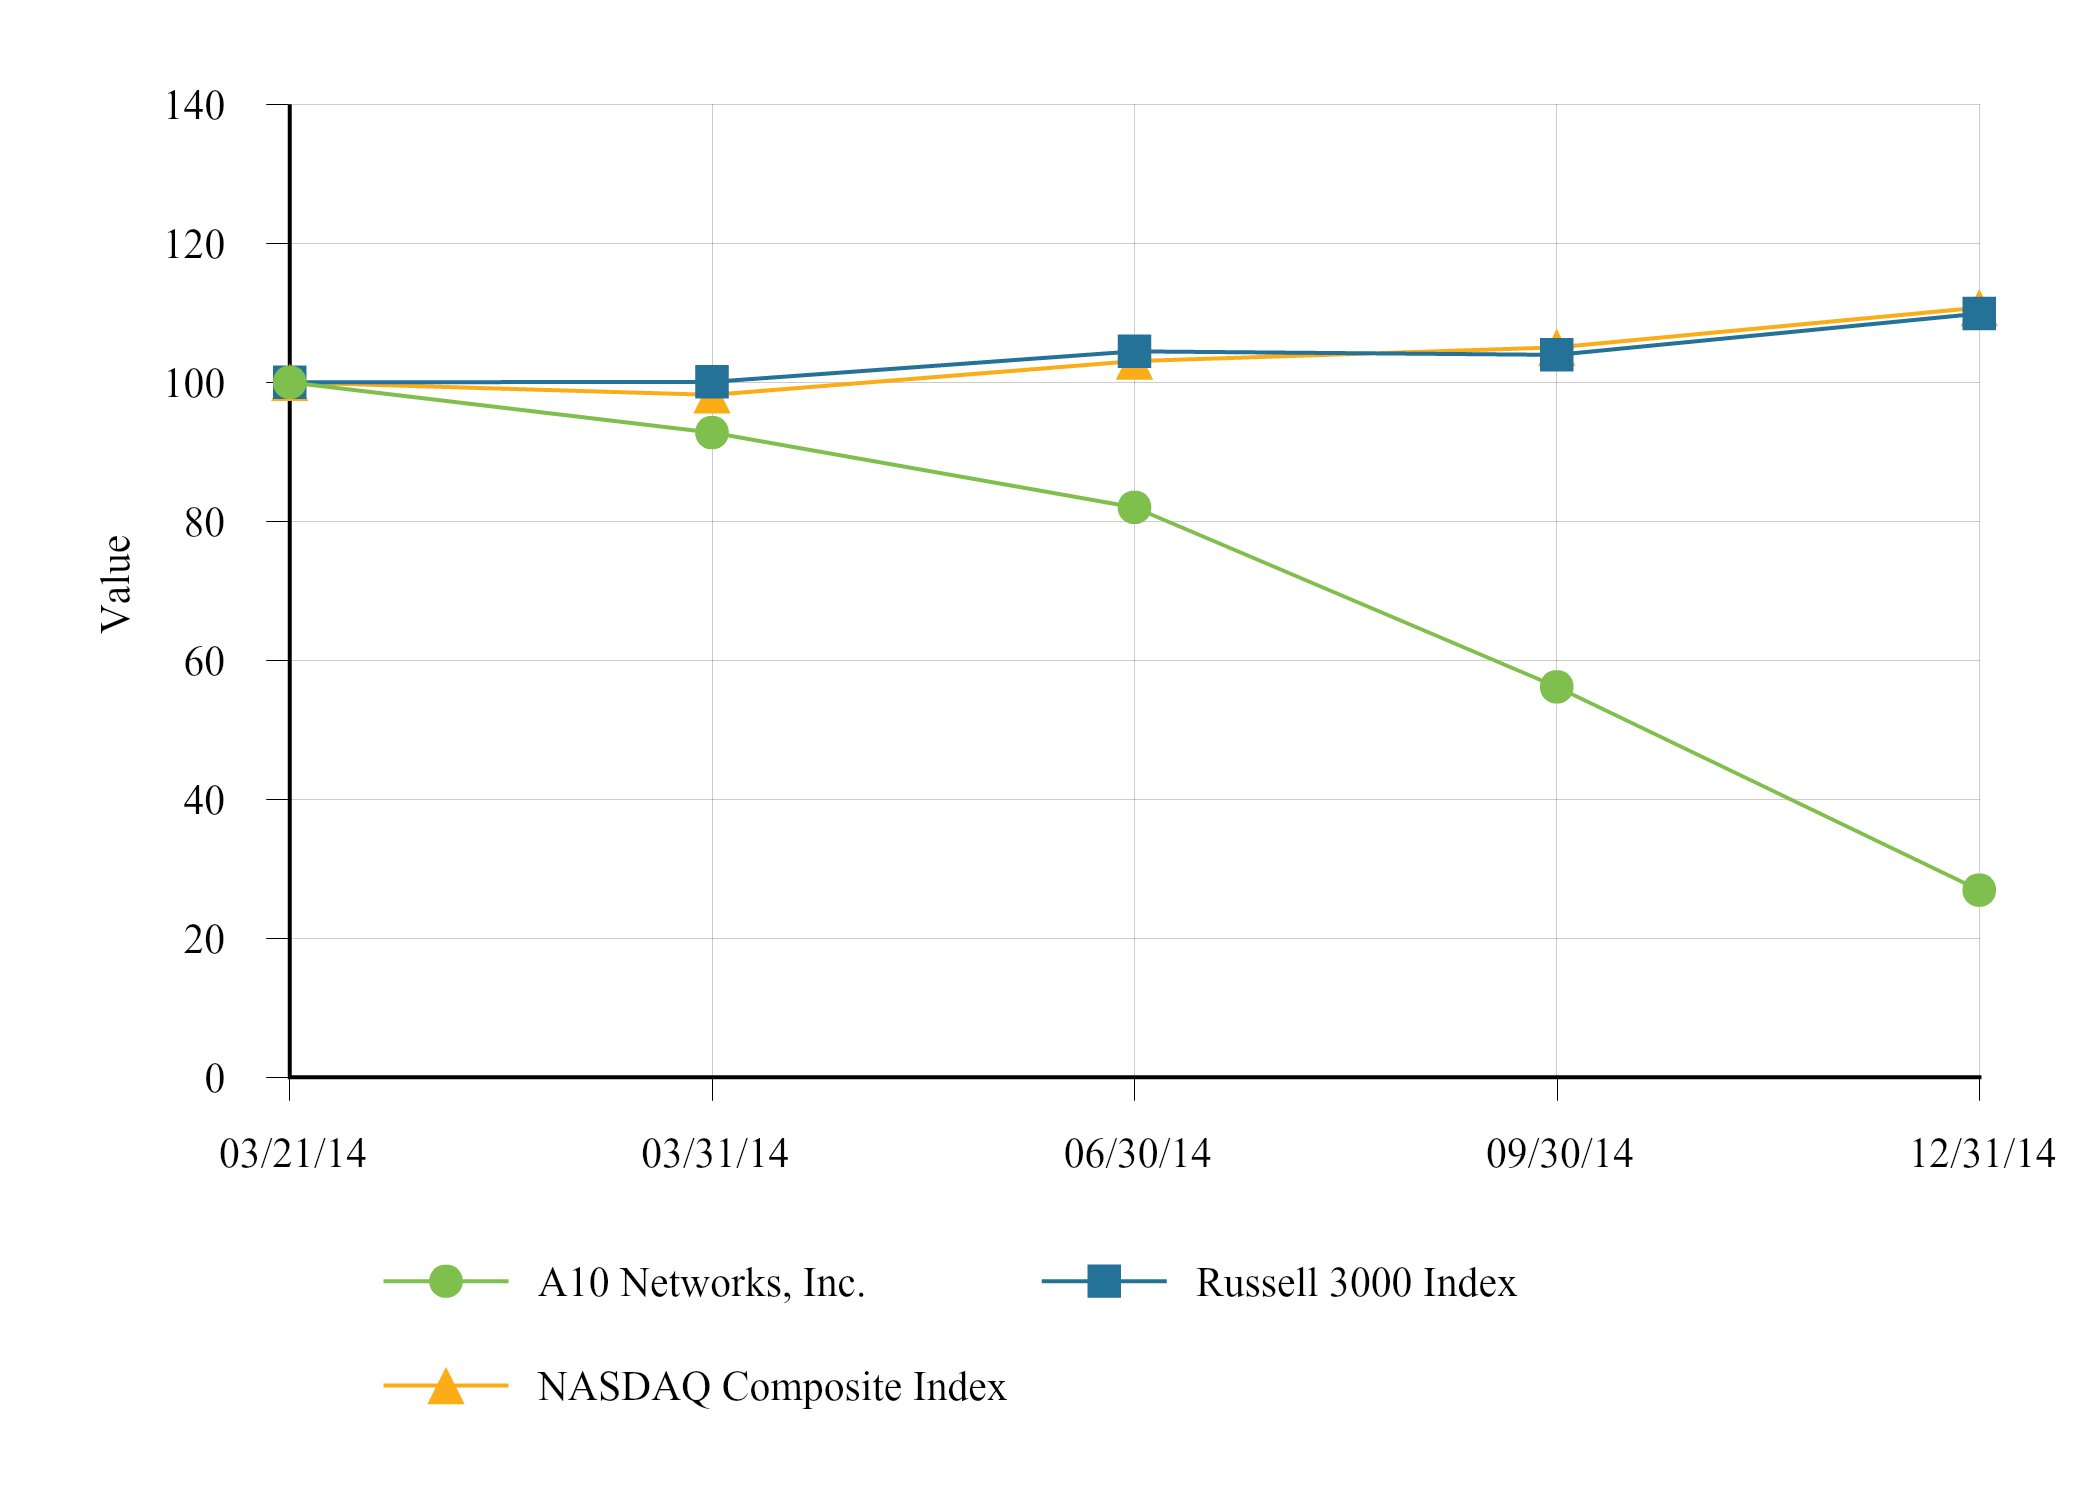
Unregistered Sales of Equity Securities
None.
38
ITEM 6.
Selected Financial Data
The following tables set forth the selected consolidated financial data for each of the years in the five-year period ended December 31, 2014. The selected consolidated financial data is qualified in its entirety and should be read in conjunction with the consolidated financial statements and accompanying notes, Management’s Discussion and Analysis of Financial Condition and Results of Operations and other financial information included elsewhere in this Annual Report on Form 10-K. We have derived the consolidated statement of operations data for the years ended December 31, 2014, 2013 and 2012 and the consolidated balance sheet data as of December 31, 2014 and 2013 from the consolidated audited financial statements included in
Item 8.
Financial Statements and Supplemental Data
in this Annual Report on Form 10-K. The consolidated statement of operations data for the years ended December 31, 2011 and 2010 and the consolidated balance sheet data as of December 31, 2012, 2011 and 2010 were derived from the consolidated audited financial statements that are not included in this Annual Report on Form 10-K.
|
Year Ended December 31,
|
||||||||||||||||||||
|
2014
|
2013
|
2012
|
2011
|
2010
|
||||||||||||||||
|
(in thousands)
|
||||||||||||||||||||
|
|
||||||||||||||||||||
|
Revenue
|
$
|
179,507
|
|
$
|
141,738
|
|
$
|
120,066
|
|
$
|
91,278
|
|
$
|
55,302
|
|
|||||
|
Cost of revenue
|
$
|
42,937
|
|
$
|
33,396
|
|
$
|
24,510
|
|
$
|
18,475
|
|
$
|
12,256
|
|
|||||
|
Gross profit
|
$
|
136,570
|
|
$
|
108,342
|
|
$
|
95,556
|
|
$
|
72,803
|
|
$
|
43,046
|
|
|||||
|
Income (loss) from operations
|
$
|
(30,271
|
)
|
$
|
(22,843
|
)
|
$
|
(87,020
|
)
|
$
|
9,013
|
|
$
|
6,672
|
|
|||||
|
Net income (loss) attributable to common stockholders
|
$
|
(35,870
|
)
|
$
|
(29,078
|
)
|
$
|
(90,150
|
)
|
$
|
7,304
|
|
$
|
5,211
|
|
|||||
|
|
||||||||||||||||||||
|
Cash and cash equivalents
|
$
|
91,905
|
|
$
|
20,793
|
|
$
|
23,867
|
|
$
|
19,048
|
|
$
|
6,877
|
|
|||||
|
Working capital (deficit)
|
$
|
100,656
|
|
$
|
15,122
|
|
$
|
(61,460
|
)
|
$
|
19,064
|
|
$
|
8,437
|
|
|||||
|
Total assets
|
$
|
186,980
|
|
$
|
93,794
|
|
$
|
76,794
|
|
$
|
55,433
|
|
$
|
36,198
|
|
|||||
|
Total debt
|
$
|
—
|
|
$
|
20,000
|
|
$
|
5,631
|
|
$
|
1,654
|
|
$
|
4,159
|
|
|||||
|
Deferred revenue, net-current and long-term
|
$
|
57,220
|
|
$
|
41,232
|
|
$
|
27,707
|
|
$
|
18,050
|
|
$
|
14,463
|
|
|||||
|
Redeemable convertible preferred stock
|
$
|
—
|
|
$
|
81,426
|
|
$
|
—
|
|
$
|
—
|
|
$
|
—
|
|
|||||
|
Convertible preferred stock
|
$
|
—
|
|
$
|
44,749
|
|
$
|
41,737
|
|
$
|
41,665
|
|
$
|
41,648
|
|
|||||
|
Total stockholders' equity (deficit)
|
$
|
96,565
|
|
$
|
(134,880
|
)
|
$
|
(111,892
|
)
|
$
|
(25,590
|
)
|
$
|
(34,829
|
)
|
|||||
39
|
ITEM 7.
|
MANAGEMENT’S DISCUSSION AND ANALYSIS OF FINANCIAL CONDITION AND RESULTS OF OPERATIONS.
|
The following discussion and analysis of our financial condition and results of operations should be read in conjunction with Item 6. “Selected Financial Data,” our consolidated financial statements and related notes included elsewhere in this document. In addition to historical information, the discussion below contains certain forward‑looking statements that involve risks and uncertainties. These forward-looking statements include, but are not limited to, those matters discussed under the heading “Forward-looking Statements.” Our actual results could differ materially from those anticipated by these forward‑looking statements due to various factors, including, but not limited to, those set forth under Item 1A. Risk Factors in this Annual Report on Form 10-K and elsewhere in this document.
Overview
We are a leading provider of application networking technologies. Our solutions enable service providers, enterprises, Web giants and government organizations to accelerate, secure and optimize the performance of their data center applications and networks. Our products are built on our Advanced Core Operating System (" ACOS") platform of advanced network technologies, which is designed to enable our products to deliver substantially greater performance and security relative to prior generation application networking products. Our software based ACOS architecture also provides the flexibility that enables us to expand our business to offer additional products to solve a growing array of networking and security challenges arising from increased Internet cloud and mobile computing.
We currently offer three software based advanced application networking solutions. These are Application Delivery Controllers ("ADCs") to optimize data center performance, Carrier Grade Network Address Translation ("CGN") to provide address and protocol translation services for service provider networks, and a Distributed Denial of Service Threat Protection System ("TPS") for network-wide security protection. We deliver these solutions both on optimized hardware appliances and as virtual appliances across our Thunder Series and AX Series product families.
We derive revenue from sales of products and related support services. Product revenues are generated primarily by sales of hardware appliances with perpetual licenses to our embedded software solutions. We generate services revenue primarily from sales of maintenance and support contracts. Our end-customers predominantly purchase maintenance and support in conjunction with purchases of our products.
We sell our products globally to service providers and enterprises that depend on data center applications and networks to generate revenue and manage operations efficiently. Our end-customers operate in a variety of industries, including telecommunications, technology, industrial, retail, financial and education. Since inception, our customer base has grown rapidly. As of December 31, 2014, we had sold products to approximately 3,900 customers across 71 countries.
We sell substantially all of our solutions through our high-touch sales organization as well as distribution channel partners, including distributors, value added resellers and system integrators, and fulfill nearly all orders globally through such partners. We believe this sales approach allows us to obtain the benefits of channel distribution, such as expanding our market coverage, while still maintaining face-to-face relationships with our end-customers. We outsource the manufacturing of our hardware products to original design manufacturers. We perform quality assurance and testing at our San Jose, California facilities, as well as at our manufacturers’ locations. We warehouse and deliver the majority of our products out of our San Jose warehouse. We also outsource warehousing and delivery to third-party logistics providers in some regions.
During 2014,
48%
of our total revenue was generated from the United States,
26%
from Japan, and
26%
from other geographical regions. During the year ended December 31, 2013, 48% of our total revenue was generated from the United States, 28% from Japan and 24% from other geographical regions. For the years ended December 2014, 2013 and 2012, our enterprise customers accounted for 54%, 53% and 47% of our total revenue. For the years ended December 31, 2014, 2013 and 2012, our service provider customers accounted 53%, 47% and 46% of our total revenue.
As a result of the nature of our target market and the current stage of our development, a substantial portion of our revenue comes from a limited number of large end-customers, including service providers, in any period. During the years ended December 31, 2014, 2013 and 2012, purchases from our ten largest end-customers accounted for approximately 37%, 43% and 49% of our total revenue. Sales to these large end-customers have typically been characterized by large but irregular purchases with long sales cycles. The timing of these purchases and the delivery of the purchased products is difficult to predict. As a consequence, any acceleration or delay in anticipated product purchases by or deliveries to our largest end-customers could materially impact our revenue and operating results in any quarterly period and cause our quarterly revenue and operating results to fluctuate from quarter to quarter and also be difficult to predict.
40
We intend to continue to invest for long-term growth. We have invested and expect to continue to invest in our product development efforts to deliver new products and additional features in our current products to address customer needs. In addition, we expect to continue to expand our global sales and marketing organizations, expand our distribution channel partner programs and increase awareness of our solutions on a global basis. Additionally we will be investing in general and administrative resources to meet the requirements to operate as a public company. Our investments in growth in these areas may affect short-term profitability.
Results of Operations
The following tables provide a summary of our Consolidated Statements of Operations for the years ended December 31, 2014, 2013 and 2012 as derived from our consolidated financial statements included in
Item 8 Financial Statements and Supplemental Data
in this Annual Report on Form 10-K (in thousands, except for percentages).
|
|
Years Ended December 31,
|
|||||||||||||||||||
|
|
2014
|
2013
|
Net Change
|
|||||||||||||||||
|
Amount
|
Percent of Total Revenue
|
Amount
|
Percent of Total Revenue
|
Amount
|
Percent
|
|||||||||||||||
|
Revenue:
|
|
|
|
|
||||||||||||||||
|
Products
|
$
|
134,486
|
|
74.9
|
%
|
$
|
112,045
|
|
79.1
|
%
|
$
|
22,441
|
|
20.0
|
%
|
|||||
|
Services
|
45,021
|
|
25.1
|
%
|
29,693
|
|
20.9
|
%
|
15,328
|
|
51.6
|
%
|
||||||||
|
Total revenue
|
179,507
|
|
100.0
|
%
|
141,738
|
|
100.0
|
%
|
37,769
|
|
26.6
|
%
|
||||||||
|
Cost of revenue:
|
|
|
|
|
||||||||||||||||
|
Products
|
31,084
|
|
17.3
|
%
|
25,284
|
|
17.9
|
%
|
5,800
|
|
22.9
|
%
|
||||||||
|
Services
|
11,853
|
|
6.6
|
%
|
8,112
|
|
5.7
|
%
|
3,741
|
|
46.1
|
%
|
||||||||
|
Total cost of revenue
|
42,937
|
|
23.9
|
%
|
33,396
|
|
23.6
|
%
|
9,541
|
|
28.6
|
%
|
||||||||
|
Gross profit
|
136,570
|
|
76.1
|
%
|
108,342
|
|
76.4
|
%
|
28,228
|
|
26.1
|
%
|
||||||||
|
Operating expenses:
|
|
|
|
|
||||||||||||||||
|
Sales and marketing
|
96,837
|
|
53.9
|
%
|
70,756
|
|
49.9
|
%
|
26,081
|
|
36.9
|
%
|
||||||||
|
Research and development
|
49,903
|
|
27.8
|
%
|
33,348
|
|
23.5
|
%
|
16,555
|
|
49.6
|
%
|
||||||||
|
General and administrative
|
22,938
|
|
12.8
|
%
|
15,556
|
|
11.0
|
%
|
7,382
|
|
47.5
|
%
|
||||||||
|
Litigation expense (benefit)
|
(2,837
|
)
|
(1.6
|
)%
|
11,525
|
|
8.1
|
%
|
(14,362
|
)
|
(124.6
|
)%
|
||||||||
|
Total operating expenses
|
166,841
|
|
92.9
|
%
|
131,185
|
|
92.5
|
%
|
35,656
|
|
27.2
|
%
|
||||||||
|
Loss from operations
|
(30,271
|
)
|
(16.9
|
)%
|
(22,843
|
)
|
(16.1
|
)%
|
(7,428
|
)
|
(32.5
|
)%
|
||||||||
|
Other income (expense), net:
|
|
|
|
|
||||||||||||||||
|
Interest expense
|
(1,028
|
)
|
(0.6
|
)%
|
(1,495
|
)
|
(1.1
|
)%
|
467
|
|
31.2
|
%
|
||||||||
|
Interest income and other income (expense), net
|
(1,914
|
)
|
(1.1
|
)%
|
(2,118
|
)
|
(101.5
|
)%
|
204
|
|
9.6
|
%
|
||||||||
|
Total other income (expense), net
|
(2,942
|
)
|
(1.6
|
)%
|
(3,613
|
)
|
(2.5
|
)%
|
671
|
|
18.6
|
%
|
||||||||
|
Loss before provision for income taxes
|
(33,213
|
)
|
(18.5
|
)%
|
(26,456
|
)
|
(18.6
|
)%
|
(6,757
|
)
|
(25.5
|
)%
|
||||||||
|
Provision for income taxes
|
1,507
|
|
0.8
|
%
|
640
|
|
0.5
|
%
|
867
|
|
135.5
|
%
|
||||||||
|
Net loss
|
$
|
(34,720
|
)
|
(19.3
|
)%
|
$
|
(27,096
|
)
|
(19.1
|
)%
|
$
|
(7,624
|
)
|
(28.1
|
)%
|
|||||
41
|
|
Years Ended December 31,
|
||||||||||||||||
|
|
2013
|
2012
|
Net Change
|
||||||||||||||
|
Amount
|
Percent of Total Revenue
|
Amount
|
Percent of Total Revenue
|
Amount
|
Percent
|
||||||||||||
|
Revenue:
|
|
|
|
|
|||||||||||||
|
Products
|
$
|
112,045
|
|
79.1%
|
$
|
99,891
|
|
83.2%
|
$
|
12,154
|
|
12.2%
|
|||||
|
Services
|
29,693
|
|
20.9%
|
20,175
|
|
16.8%
|
9,518
|
|
47.2%
|
||||||||
|
Total revenue
|
141,738
|
|
100.0%
|
120,066
|
|
100.0%
|
21,672
|
|
18.1%
|
||||||||
|
Cost of revenue:
|
|
|
|
|
|||||||||||||
|
Products
|
25,284
|
|
17.9%
|
18,619
|
|
15.5%
|
6,665
|
|
35.8%
|
||||||||
|
Services
|
8,112
|
|
5.7%
|
5,891
|
|
4.9%
|
2,221
|
|
37.7%
|
||||||||
|
Total cost of revenue
|
33,396
|
|
23.6%
|
24,510
|
|
20.4%
|
8,886
|
|
36.3%
|
||||||||
|
Gross profit
|
108,342
|
|
76.4%
|
95,556
|
|
79.6%
|
12,786
|
|
13.4%
|
||||||||
|
Operating expenses:
|
|
|
|
|
|||||||||||||
|
Sales and marketing
|
70,756
|
|
49.9%
|
51,323
|
|
42.7%
|
19,433
|
|
37.9%
|
||||||||
|
Research and development
|
33,348
|
|
23.5%
|
25,513
|
|
21.3%
|
7,835
|
|
30.7%
|
||||||||
|
General and administrative
|
15,556
|
|
11.0%
|
10,225
|
|
8.5%
|
5,331
|
|
52.1%
|
||||||||
|
Litigation expense (benefit)
|
11,525
|
|
8.1%
|
95,515
|
|
79.6%
|
(83,990
|
)
|
(87.9)%
|
||||||||
|
Total operating expenses
|
131,185
|
|
92.5%
|
182,576
|
|
152.2%
|
(51,391
|
)
|
(28.1)%
|
||||||||
|
Loss from operations
|
(22,843
|
)
|
(16.1)%
|
(87,020
|
)
|
(72.5)%
|
64,177
|
|
73.7%
|
||||||||
|
Other income (expense), net:
|
|
|
|
|
|||||||||||||
|
Interest expense
|
(1,495
|
)
|
(1.1)%
|
(135
|
)
|
(0.1)%
|
(1,360
|
)
|
(1,007.4)%
|
||||||||
|
Interest income and other income (expense), net
|
(2,118
|
)
|
(1.4)%
|
(2,237
|
)
|
(1.9)%
|
119
|
|
5.3%
|
||||||||
|
Total other income (expense), net
|
(3,613
|
)
|
(2.5)%
|
(2,372
|
)
|
(2.0)%
|
(1,241
|
)
|
(52.3)%
|
||||||||
|
Loss before provision for income taxes
|
(26,456
|
)
|
(18.7)%
|
(89,392
|
)
|
(74.5)%
|
62,936
|
|
70.4%
|
||||||||
|
Provision for income taxes
|
640
|
|
0.5%
|
758
|
|
0.6%
|
(118
|
)
|
(15.6)%
|
||||||||
|
Net loss
|
$
|
(27,096
|
)
|
(19.1)%
|
$
|
(90,150
|
)
|
(75.1)
|
$
|
63,054
|
|
69.9%
|
|||||
42
Revenue
Our products revenue primarily consists of revenue from sales of our hardware appliances upon which our software is installed. Such software includes our ACOS software platform plus one of our ADC, CGN or TPS solutions. Purchase of a hardware appliance includes a perpetual license to the included software. We recognize products revenue at the time of shipment, provided that all other revenue recognition criteria have been met. As a percentage of revenue, our products revenue may vary from quarter to quarter based on, among other things, the timing of orders and delivery of products, cyclicality and seasonality, changes in currency exchange rates and the impact of significant transactions with unique terms and conditions.
We generate services revenue from sales of post contract support, or PCS, which is bundled with sales of products and professional services. We offer tiered PCS services under renewable, fee-based PCS contracts, primarily including technical support, hardware repair and replacement parts, and software upgrades on a when-and-if-released basis. We recognize services revenue ratably over the term of the PCS contract, which is typically one year, but can be up to five years. We expect our services revenue to increase in absolute dollars as we expand our installed base.
A summary of our total revenue for the years ended December 31, 2014, 2013 and 2012 is as follows (in thousands, except for percentages):
|
|
Years Ended December 31,
|
Net Change
|
|||||||||||
|
|
2014
|
2013
|
Amount
|
Percent
|
|||||||||
|
Revenue:
|
|
|
|
|
|||||||||
|
Products
|
$
|
134,486
|
|
$
|
112,045
|
|
$
|
22,441
|
|
20.0%
|
|||
|
Services
|
45,021
|
|
29,693
|
|
15,328
|
|
51.6%
|
||||||
|
Total revenue
|
$
|
179,507
|
|
$
|
141,738
|
|
$
|
37,769
|
|
26.6%
|
|||
|
Revenue by geographic location:
|
|
|
|
|
|
||||||||
|
United States
|
$
|
85,325
|
|
$
|
68,127
|
|
$
|
17,198
|
|
25.2%
|
|||
|
Japan
|
45,787
|
|
39,581
|
|
6,206
|
|
15.7%
|
||||||
|
Asia Pacific, excluding Japan
|
20,434
|
|
15,052
|
|
5,382
|
|
35.8%
|
||||||
|
EMEA
|
19,254
|
|
12,087
|
|
7,167
|
|
59.3%
|
||||||
|
Other
|
8,707
|
|
6,891
|
|
1,816
|
|
26.4%
|
||||||
|
Total revenue
|
$
|
179,507
|
|
$
|
141,738
|
|
$
|
37,769
|
|
26.6%
|
|||
|
|
Years Ended December 31,
|
Net Change
|
|||||||||||
|
|
2013
|
2012
|
Amount
|
Percent
|
|||||||||
|
Revenue:
|
|
|
|
|
|||||||||
|
Products
|
$
|
112,045
|
|
$
|
99,891
|
|
$
|
12,154
|
|
12.2%
|
|||
|
Services
|
29,693
|
|
20,175
|
|
9,518
|
|
47.2%
|
||||||
|
Total revenue
|
$
|
141,738
|
|
120,066
|
|
$
|
21,672
|
|
18.1%
|
||||
|
Revenue by geographic location:
|
|
|
|
|
|
|
|
||||||
|
United States
|
$
|
68,127
|
|
$
|
43,389
|
|
$
|
24,738
|
|
57.0%
|
|||
|
Japan
|
39,581
|
|
58,653
|
|
(19,072
|
)
|
(32.5)%
|
||||||
|
Asia Pacific, excluding Japan
|
15,052
|
|
10,315
|
|
4,737
|
|
45.9%
|
||||||
|
EMEA
|
12,087
|
|
6,469
|
|
5,618
|
|
86.8%
|
||||||
|
Other
|
6,891
|
|
1,240
|
|
5,651
|
|
455.7%
|
||||||
|
Total revenue
|
$
|
141,738
|
|
$
|
120,066
|
|
$
|
21,672
|
|
18.1%
|
|||
Total revenue increased by
$37.8 million
in 2014 compared to 2013, which consisted of a
$22.4 million
increase in product revenue and
$15.3 million
increase in services revenue. Revenue from enterprise customers and service providers increased 30% and 23% compared to revenue in 2013.
43
Products revenue increased
$22.4 million
, or
20%
in 2014 compared to 2013 which is primarily attributable to greater adoption of our solutions by new and existing customers. In addition, there has been a rapid adoption of our Thunder Series products introduced in the second quarter of 2013 which accounted for the majority of products revenue in the second half of 2014. Our Thunder Series of products include our ADC, CGN and TPS product lines.
Services revenue increased
$15.3 million
or
52%
in 2014 compared to the same periods in 2013 primarily attributable to the increase in PCS sales in connection with our increasing installed customer base as well as increases in our professional services revenue. Over 95% of our end-customers purchase one of our maintenance service products when purchasing our hardware products. During 2014, services revenue recognized from contracts existing prior to the start of 2014 grew by 50% as compared to 2013 services revenue related to contracts existing prior to 2012.
For the year ended December 31, 2014,
48%
, or
$85.3 million
of total revenue was generated from the United States,
25%
growth compared to 2013. During 2014,
26%
, or
$45.8 million
of total revenue was generated from Japan, a
16%
increase compared to 2013. We continue to see growth in our EMEA and Asia Pacific regions, excluding Japan regions with total revenue increasing by
59%
to
$19.3 million
and
36%
to
$20.4 million
in 2014 compared to 2013 primarily due to our efforts to expand our presence in these regions.
Revenue growth from the year ended December 31, 2012 to 2013 reflects increased demand for our products and related support and services. The increase in products revenue was driven by increased sales of our products primarily to existing customers. We believe the Brocade litigation affected our revenues during both of these periods, but we believe this effect was particularly evident in the year ended December 31, 2013, due to the uncertainty created by injunctions issued in the matter. Although such injunctions did not prevent us from selling our redesigned products, certain customers informed us that they would not purchase any of our products until we settled the dispute. The settlement of the Brocade litigation did not result in any material restrictions to our business.
The increase in services revenue was related to the increase in PCS sales in connection with the increased unit sales of our hardware products, and the resulting increase in our installed base and the renewals of PCS on our installed customer base. During 2013, services revenue recognized from contracts existing prior to the start of 2013 grew by 59% as compared to 2012 services revenue related to contracts existing prior to 2012. Services revenue related to new product orders during 2013 accounted for 22% of total services revenue during the year.
In the year ended December 31, 2013, U.S. revenue was positively affected by a few large orders from existing customers purchasing our products for significant new project deployments within their organizations. These few large orders from existing customers accounted for 10% of revenue for 2013. Similarly, we experienced a decrease in revenue in Japan primarily due to certain end-customers deploying and absorbing products in 2013 that were purchased in 2012 to accommodate anticipated growth in data traffic. Revenue growth in other geographic locations was primarily due to our continued investment in increasing the size of our sales force and the number of distribution channel partners in those regions.
Although we experienced a sequential improvement in spending from North America service providers during the three months ended December 31, 2014, we remain cautious regarding a possible slowdown in this spending, which may lead to continued near term fluctuation in our products revenue and total revenue. We expect services revenue to increase sequentially into the foreseeable future as we increase our installed base.
Cost of Revenue, Gross Profit and Gross Margin
Cost of revenue
Cost of products revenue is primarily comprised of cost of third-party manufacturing services and cost of component inventory for the hardware component of our products. Cost of products revenue also includes warehouse personnel costs, shipping costs, inventory write-downs, certain allocated facilities and information technology infrastructure costs, and expenses associated with logistics and quality control.
Cost of services revenue is primarily comprised of personnel costs for our technical support, training and professional service teams. Cost of services revenue also includes the costs of inventory used to provide hardware replacements to end-customers under PCS contracts and certain allocated facilities and information technology infrastructure costs.
44
A summary of our cost of revenue for the years ended December 31, 2014, 2013 and 2012 is as follows (in thousands, except for percentages):
|
|
Years Ended December 31,
|
Net Change
|
||||||||||||
|
|
2014
|
2013
|
Amount
|
Percent
|
||||||||||
|
Cost of revenue:
|
|
|
|
|
||||||||||
|
Products
|
$
|
31,084
|
|
$
|
25,284
|
|
$
|
5,800
|
|
22.9
|
%
|
|||
|
Services
|
11,853
|
|
8,112
|
|
3,741
|
|
46.1
|
%
|
||||||
|
Total cost of revenue
|
$
|
42,937
|
|
$
|
33,396
|
|
$
|
9,541
|
|
28.6
|
%
|
|||
|
|
Years Ended December 31,
|
Net Change
|
||||||||||||
|
|
2013
|
2012
|
Amount
|
Percent
|
||||||||||
|
Cost of revenue:
|
|
|
|
|
||||||||||
|
Products
|
$
|
25,284
|
|
$
|
18,619
|
|
$
|
6,665
|
|
35.8
|
%
|
|||
|
Services
|
8,112
|
|
5,891
|
|
2,221
|
|
37.7
|
%
|
||||||
|
Total cost of revenue
|
$
|
33,396
|
|
$
|
24,510
|
|
$
|
8,886
|
|
36.3
|
%
|
|||
Gross Margin
Gross margin may vary and be unpredictable from period to period due to a variety of factors. These may include the mix of revenue from each of our regions, the mix of our products sold within a period, discounts provided to customers, discounts on early sales of new products to gain market penetration, inventory write-downs and international currency exchange rates.
Our sales are generally denominated in U.S. dollars, however, in Japan they are denominated in the Japanese yen. Changes in the exchange rates between the U.S. dollar and Japanese yen will therefore affect our revenue and gross margin. For example, in the second half of 2014, gross margin was adversely impacted by an unfavorable exchange rate fluctuation between the U.S. dollar and the Japanese yen. In addition, we had an increase in our inventory reserve primarily due to obsolete inventory on hand. Any of the factors noted above can generate either a positive or negative impact on gross margin as compared to another period. Although our 2014 gross margin decreased compared to the prior years, we expect our gross margin to be consistent with our historical average in the future.
45
A summary of gross profit and gross margin for the years ended December 31, 2014, 2013 and 2012 is as follows (in thousands, except for gross margins):
|
|
Years Ended December 31,
|
|
|||||||||||||||
|
|
2014
|
2013
|
Net Change
|
||||||||||||||
|
|
Amount
|
Gross Margin
|
Amount
|
Gross Margin
|
Amount
|
Gross Margin
|
|||||||||||
|
Gross profit:
|
|
|
|
|
|
|
|
|
|
||||||||
|
Products
|
$
|
103,402
|
|
76.9%
|
$
|
86,761
|
|
77.4%
|
$
|
16,641
|
|
(0.5)%
|
|||||
|
Services
|
33,168
|
|
73.7%
|
21,581
|
|
72.7%
|
11,587
|
|
1.0%
|
||||||||
|
Total gross profit
|
$
|
136,570
|
|
76.1%
|
$
|
108,342
|
|
76.4%
|
$
|
28,228
|
|
(0.3)%
|
|||||
|
|
Years Ended December 31,
|
|
|||||||||||||||
|
|
2013
|
2012
|
Net Change
|
||||||||||||||
|
|
Amount
|
Gross Margin
|
Amount
|
Gross Margin
|
Amount
|
Gross Margin
|
|||||||||||
|
Gross profit:
|
|
|
|
|
|
|
|
|
|
||||||||
|
Products
|
$
|
86,761
|
|
77.4%
|
$
|
81,272
|
|
81.4%
|
$
|
5,489
|
|
(3.9)%
|
|||||
|
Services
|
21,581
|
|
72.7%
|
14,284
|
|
70.8%
|
7,297
|
|
1.9%
|
||||||||
|
Total gross profit
|
$
|
108,342
|
|
76.4%
|
$
|
95,556
|
|
79.6%
|
$
|
12,786
|
|
(3.2)%
|
|||||
Products gross margin decreased
0.5
percentage points in 2014 compared to 2013 primarily due to an unfavorable shift in our geographical sales mix and a devaluation of the Japanese yen against the U.S. dollar. We also experienced higher sales volumes from geographic regions with generally higher gross margins in 2013 compared to 2014, which benefited our gross margin in 2013.
Services gross margin increased
1.0
percentage point in 2014 compared to 2013, as a result of growth in services revenue and partially offset by the impact of increases in cost of services. Our services revenue recognized from our installed base with existing contracts prior to 2014 grew by 50% compared to revenue generated during 2013. The increase in cost of services was primarily a result of our investment to expand our service and support group in anticipation of future growth in our installed base. We increased our average support, training and professional services headcount by 47% during 2014 as compared to 2013.
The decrease of 4.0 percentage points in product gross margin from the year ended December 31, 2012 to the year ended December 31, 2013 was primarily due to a higher than historical gross margin in the year ended December 31, 2012, related to higher than historical volumes coming from geographic regions with generally higher gross margins. In the year ended December 31, 2013, the geographical revenue mix returned to historical levels, as did gross margins. Additionally, in 2013 there was a modest negative impact to gross margin due to changes to the Dollar/Yen exchange rate. The increase of 1.9 percentage points in service gross margin was primarily a result of a 47% growth in services revenue, while cost
of services revenue increased by only 38% due to increased operating efficiencies in our service and support group.
Operating Expenses
Our operating expenses consist of sales and marketing, research and development, general and administrative and litigation. The largest component of our operating expenses is personnel costs which consist of wages, benefits, bonuses, and, with respect to sales and marketing expenses, sales commissions. Personnel costs also include stock-based compensation and travel expenses. We expect personnel costs to continue to increase in absolute dollars as we hire new employees to continue to grow our business.
46
A summary of our operating expenses for the years ended December 31, 2014, 2013 and 2012 is as follows (in thousands, except for percentages):
|
|
Years Ended December 31,
|
Net Change
|
|||||||||||
|
|
2014
|
2013
|
Amount
|
Percent
|
|||||||||
|
Operating expenses:
|
|
|
|
|
|
|
|
||||||
|
Sales and marketing
|
$
|
96,837
|
|
$
|
70,756
|
|
$
|
26,081
|
|
36.9%
|
|||
|
Research and development
|
49,903
|
|
33,348
|
|
16,555
|
|
49.6%
|
||||||
|
General and administrative
|
22,938
|
|
15,556
|
|
7,382
|
|
47.5%
|
||||||
|
Litigation expense (benefit)
|
(2,837
|
)
|
11,525
|
|
(14,362
|
)
|
(124.6)%
|
||||||
|
Total operating expenses
|
$
|
166,841
|
|
$
|
131,185
|
|
$
|
35,656
|
|
27.2%
|
|||
|
|
Years Ended December 31,
|
Net Change
|
|||||||||||
|
|
2013
|
2012
|
Amount
|
Percent
|
|||||||||
|
Operating expenses:
|
|
|
|
|
|
|
|
||||||
|
Sales and marketing
|
$
|
70,756
|
|
$
|
51,323
|
|
$
|
19,433
|
|
37.9%
|
|||
|
Research and development
|
33,348
|
|
25,513
|
|
7,835
|
|
30.7%
|
||||||
|
General and administrative
|
15,556
|
|
10,225
|
|
5,331
|
|
52.1%
|
||||||
|
Litigation expense (benefit)
|
11,525
|
|
95,515
|
|
(83,990
|
)
|
(87.9)%
|
||||||
|
Total operating expenses
|
$
|
131,185
|
|
$
|
182,576
|
|
$
|
(51,391
|
)
|
(28.1)%
|
|||
Sales and Marketing
Sales and marketing expenses are our largest functional category of total operating expense. These expenses primarily consist of personnel costs related to our employees engaged in sales and marketing activities. Sales and marketing expenses also include the cost of marketing programs, trade shows, consulting services, promotional materials, demonstration equipment, depreciation and certain allocated facilities and information technology infrastructure costs.
Sales and marketing expenses increased
$26.1 million
or
37%
in 2014 compared to 2013 primarily attributable to a $17.2 million increase in personnel and related costs, which includes a $3.6 million increase in stock-based compensation. The increase in personnel related costs was a result of higher sales and marketing headcount as we experienced a 26% increase in average headcount during 2014 compared to 2013. The increase was also attributable to a $2.9 million increase in marketing and promotion costs associated with advertising and trade shows, and a $2.1 million increase in professional services fees, as we increased our sales and marketing efforts to grow our revenue and expand our international sales presence. Depreciation expense and allocated facilities and information technology infrastructure costs also increased by $2.2 million as a result of higher headcount and increased depreciation expense on our evaluation equipment.
Sales and marketing expense increased
$19.4 million
in 2013 compared to 2012 primarily attributable to a $15.4 million increase in personnel and related costs, which includes a $7.3 million increase in employee compensation, a $6.1 million increase in commission and bonus expenses, a $0.9 million increase in stock-based compensation and a $1.1 million increase in travel costs, as a result of an increase in sales and marketing headcount. The increase was also attributable to a $1.5 million increase in marketing and promotion costs associated with advertising and trade shows, as we increased our sales and marketing efforts to grow our revenue.
We expect our sales and marketing expenses to continue to increase in absolute dollars as we increase the size of our sales and marketing organization and as we increase our sales presence in existing countries and expand into new countries.
47
Research and Development
Research and development efforts are focused on new product development and on developing additional functionality for our existing products. These expenses consist of personnel costs, and to a lesser extent, prototype materials, depreciation and certain allocated facilities and information technology infrastructure costs. We expense research and development costs as incurred. We expect our research and development expenses to increase in absolute dollars as we continue to develop new products and enhance our existing products.
Research and development expenses increased
$16.6 million
in 2014 compared to 2013 primarily attributed to a $14.0 million increase in personnel and related costs, which includes a $2.6 million increase in stock-based compensation. The increase in personnel related costs was a result of higher research and development headcount as we experienced a 26% increase in average headcount during 2014 compared to 2013. In addition, the increases in research and development expenses also reflected a $1.0 million increase in professional services fees largely attributable to certification fees on our new products and a $1.2 million increase in depreciation and allocated facilities and information technology infrastructure costs in 2014 compared to 2013.
Research and development expenses increased
$7.8 million
in 2013 compared to 2012 primarily attributable to a $7.2 million increase in personnel and related costs, which includes a $5.8 million increase in employee compensation, a $0.5 million increase in bonuses and a $0.6 million increase in stock-based compensation, as a result of an increase in research and development headcount as we continued our efforts to develop new products and additional functionality for our existing products. The increase also reflected a $1.6 million increase in depreciation and allocated facilities and information technology infrastructure costs.
General and Administrative
General and administrative expenses consist primarily of personnel costs, professional fees and facility costs. General and administrative personnel costs include executive, finance, human resources, information technology, facility and legal (excluding litigation) related expenses. Professional fees consist primarily of fees for outside accounting, tax, legal, recruiting and other administrative services. We expect our general and administrative expenses to increase in absolute dollars due to the additional legal, accounting, insurance, investor relations and other costs that we will incur as a public company, as well as other costs associated with growing our business.
General and administrative expenses increased
$7.4 million
from 2013 to 2014 primarily attributed to a $3.3 million increase in personnel related costs which includes a $1.0 million increase in stock-based compensation. The increase in personnel related costs was a result of higher general and administrative headcount as we experienced a 28% increase in average headcount during the year ended December 31, 2014 compared to the same period in 2013. In addition, professional services costs increased by $3.2 million in 2014 compared to 2013 primarily related to increased general legal and consultant fees in connection with scaling our organization to support increased business activity and costs associated with being a public company.
General and administrative expenses increased by
$5.3 million
in 2013 compared to 2012 primarily attributable to higher professional services costs of $2.5 million, which related to increased general legal fees, audit fees, finance and accounting consulting fees, human resources and IT implementation services, in connection with scaling our organization to support increased business activity and preparing for an initial public offering. The increase was also attributable to a $1.8 million increase in personnel and related costs, including bonuses and stock-based compensation, and a $0.4 million increase in bad debt expense.
Litigation Expense (Benefit)
Litigation expense (benefit) is comprised of legal expenses incurred related to litigation and, if applicable, charges for litigation reserves. Litigation expenses consist of professional fees incurred in defending ourselves against litigation matters and are expensed as incurred when professional services are provided. The litigation reserve, if any, consists of accruals we make related to estimated losses in pending legal proceedings. Litigation reserves, if any, are adjusted as we change our estimates or make payments in damages or settlements.
48
Litigation expense decreased
$14.4 million
, from
$11.5 million
litigation expense in 2013 to
$2.8 million
in litigation benefit in 2014. The
$2.8 million
of litigation benefit in the year ended December 31, 2014 is primarily comprised of a benefit of
$7.0 million
from a settlement agreement with one of our legal services providers which resulted in the reduction of a previously accrued contractual liability, partially offset by other litigation expenses of $4.2 million.
The
$11.5 million
litigation expense in 2013 primarily consisted of $7.3 million in costs associated with the Brocade litigation which was settled in May 2013, and $3.4 million of legal expenses incurred in connection with the Radware litigation.
We recognized
$95.5 million
of litigation expense in 2012 which primarily consisted of $94.3 million of Brocade litigation related expenses, including $75.0 million related to the Brocade litigation settlement, and $19.3 million in professional legal service fees related to litigation defense costs primarily for the Brocade litigation.
Interest Expense
Interest expense consists primarily of interest expense and amortization of debt issuance costs on our debt obligations. At December 31, 2014, we have no outstanding balances on our credit facility. We expect to continue to incur commitment fees associated with the undrawn balance of our credit facility. At such time we choose to draw down on the credit facility, we would reduce the commitment fees accrued and increase the interest on outstanding balances.
Interest expense decreased
$0.5 million
in 2014 compared to 2013 due to a $1.1 million interest charge related to an unsecured convertible promissory note we issued to Brocade in 2013, partially offset by a $0.3 million contingent payment in 2014 due upon completion of the initial public offering to a lender and $0.2 million higher amortization of debt issuance costs related to our revolving credit facility recorded in 2014.
Interest expense increased by $1.4 million in 2013 compared to 2012 due primarily to the $1.1 million in interest expense we incurred on an unsecured convertible promissory note we issued to Brocade in July 2013. We repaid the note in full in September 2013. The increase was also attributable to interest expense and amortization of debt issuance costs totaling $0.3 million related to the establishment and subsequent drawdown of $25.0 million of our revolving credit facility in September 2013.
Interest Income and Other Income (Expense), Net
Interest income consists primarily of interest income earned on our cash and cash equivalents balances. Other income (expense) consists primarily of foreign currency exchange gains and losses and, through February 2013, fair value adjustments related to then-outstanding warrants to purchase our convertible preferred stock. Foreign currency exchange gains and losses relate to transactions and asset and liability balances denominated in currencies other than the U.S. dollar. We expect our foreign currency gains and losses to continue to fluctuate in the future due to changes in foreign currency exchange rates.
Interest income and other income (expense), net, decrease by
$0.2 million
in 2014 compared to 2013 primarily attributable to a slight decrease in foreign exchange losses.
Interest income and other income (expense), net changed by $0.1 million in 2013 compared to 2012 due primarily to an increase of $0.7 million in foreign currency exchange losses as a result of the Japanese yen weakening against the U.S. dollar in 2013 offset by a decrease of $0.8 million non-cash expense related to a change in the value of convertible preferred stock warrants outstanding through their exercise or expiration in February 2013.
Provision for Income Taxes
We recorded income tax provision of
$1.5 million
,
$0.6 million
and
$0.8 million
for the years ended December 31, 2014, 2013 and 2012. Our provision for income taxes consists primarily of income and withholding taxes in foreign jurisdictions in which we conduct business, state income taxes in the United States and the effect of unrecognized tax benefits. We estimate income taxes in each of the jurisdictions in which we operate. This process involves determining income tax expense together with calculating the deferred income tax expense related to temporary differences resulting from the differing treatment of items for tax and accounting purposes. We maintain a full valuation allowance against our U.S. deferred tax assets as management does not believe that it is more likely than not that said deferred taxes will be realized. As a result, our provision for income taxes primarily relates only to foreign taxes at this time.
49
Liquidity and Capital Resources
Prior to our initial public offering in March 2014, we had financed our operations primarily through private placements of our convertible preferred stock, redeemable convertible preferred stock, debt financings and cash flows derived from the sale of our products and PCS contracts. In March 2014, we completed our initial public offering, whereby we sold 12,500,000 common shares at $15.00 per share (3,500,000 of which were offered by selling stockholders) and received net cash proceeds of
$120.3 million
after underwriting discounts and commissions and offering expenses. As of December 31, 2014, cash and cash equivalents were
$91.9 million
, including $2.7 million held outside the United States in our foreign subsidiaries. We currently do not have any plans to repatriate our earnings from our foreign operations. As of December 31, 2014, we had working capital of
$100.7 million
, an accumulated deficit of
$181.8 million
and total stockholders' equity of
$96.6 million
.
We plan to continue to invest for long-term growth and anticipate our investment will continue to increase in absolute dollars. We believe that our existing cash and cash equivalents and our cash inflow from operations will be sufficient to meet our anticipated cash needs for at least the next 12 months. Our future capital requirements will depend on many factors, including our growth rate, the expansion of sales and marketing activities, the timing and extent of spending to support development efforts, the introduction of new and enhanced product and service offerings and the continuing market acceptance of our products. In the event that additional financing is required from outside sources, we may not be able to raise such financing on terms acceptable to us or at all. If we are unable to raise additional capital when desired, our business, operating results and financial condition would be adversely affected.
In addition, as described in the section "Legal Proceedings" we are currently involved in ongoing litigation. Any adverse settlements or judgments in any litigation could have a material adverse impact on our results of operations, cash balances and cash flows in the period in which such events occur.
Credit Agreement
In September 2013, we entered into a credit agreement with Royal Bank of Canada, acting as administrative agent and lender, and JPMorgan Chase Bank, N.A. and Bank of America, N.A. as lenders. The credit agreement provides a three-year $35.0 million revolving credit facility, which includes a maximum $10.0 million letter of credit facility. As of December 31, 2013, we had outstanding borrowings under the revolving credit facility of $20.0 million, which was paid in full in March 2014. The revolving credit facility matures on September 30, 2016.
Our obligations under the credit agreement are secured by a security interest on substantially all of our assets, including our intellectual property. The credit agreement contains customary non-financial covenants, and also requires us to comply with financial covenants. One financial covenant requires us to maintain a total leverage ratio, which is defined as total consolidated debt divided by adjusted EBITDA (defined as earnings before interest expense, tax expense, depreciation, amortization and stock-based compensation, adjusted for certain other non-cash or non-recurring income or expenses such as specified litigation settlement payments and litigation expenses) for the trailing four quarters. In addition, we must maintain a minimum amount of liquidity based on our unrestricted cash and availability under the revolving credit facility. The covenant requires us to maintain a minimum liquidity of $25.0 million provided that at least $10.0 million of such liquidity is comprised of unrestricted cash and cash equivalents. The credit agreement includes customary events of default which, if triggered, could result in the acceleration of our obligations under the revolving credit facility, the termination of any obligation by the lenders to extend further credit and the right of the lenders to exercise their remedies as a secured creditor and foreclose upon the collateral securing our obligation under the credit agreement; however, we also have the ability, in certain instances, to cure non-compliance with the financial covenants through qualified equity contributions by certain holders of our equity. Currently, the agreement for our revolving credit facility contains restrictions on our ability to pay dividends. As of December 31, 2014, we had no outstanding balance on our credit facility and were in compliance with our covenants.
50
The following table summarizes our cash flow related activities for the years ended December 31, 2014, 2013 and 2012 (in thousands):
|
|
Years Ended December 31,
|
||||||||||
|
|
2014
|
2013
|
2012
|
||||||||
|
Operating activities
|
$
|
(30,538
|
)
|
$
|
(25,133
|
)
|
$
|
3,213
|
|
||
|
Investing activities
|
(6,100
|
)
|
(2,993
|
)
|
(4,241
|
)
|
|||||
|
Financing activities
|
107,750
|
|
25,052
|
|
5,847
|
|
|||||
|
Net increase (decrease) in cash and cash equivalents
|
$
|
71,112
|
|
$
|
(3,074
|
)
|
$
|
4,819
|
|
||
Cash Flows from Operating Activities
Our cash provided by (used in) operating activities is driven primarily by sales of our products and, to a lesser extent, by up-front payments from end-customers under PCS contracts. Our primary uses of cash from operating activities have been for personnel-related expenditures, manufacturing costs, marketing and promotional expenses, costs related to our facilities and litigation expenses. Our cash flows from operating activities will continue to be affected principally by the extent to which we increase spending on personnel and sales and marketing activities, our working capital requirements, and litigation expenses.
During the year ended December 31, 2014, cash used in operating activities was
$30.5 million
, consisting of a net loss of
$34.7 million
and a
$12.2 million
increase in net operating assets and liabilities offset by non-cash charges of
$16.4 million
. Our non-cash charges consisted primarily of stock-based compensation of
$12.4 million
and depreciation and amortization of
$10.1 million
, partially offset by a
$7.0 million
gain on the settlement of a contractual liability. The change in our net operating assets and liabilities was primarily due to a
$17.3 million
increase in accounts receivable,
$8.9 million
increase in inventory,
$6.1 million
decrease in accrued litigation expenses and a
$3.0 million
increase in prepaid expense and other current assets, partially offset by a
$16.0 million
increase in deferred revenue and an
$7.6 million
increase in accounts payable and accrued liabilities.
The increase in accounts receivable was primarily due to increased billing and the timing of billing and cash collection, as a higher portion of the December 31, 2014 outstanding accounts receivable were billed during the latter part of the year compared to the December 31, 2013 outstanding accounts receivable. The decrease in accrued litigation costs was primarily attributable to a $5.0 million payment we made under the terms of a settlement of a contractual liability we reached with one of our legal services providers in May 2014 as well as lower litigation activities in 2014 compared to 2013. The increase in inventory and prepaid and other current assets was attributable to our year over year business growth. The increase in deferred revenue was due to billings of support contracts with service terms that are typically one year. The increase in accounts payable and accrued liabilities was primarily attributable to increases in accrued compensation costs due to higher headcount and increases as well as a result of increased business activity levels and the timing of vendor invoice payments.
During the year ended December 31, 2013, cash used in operating activities was
$25.1 million
, consisting of a net loss of
$27.1 million
and an $11.1 million decrease in net operating assets and liabilities offset by non-cash charges of $13.1 million. Our non-cash charges consisted of depreciation and amortization of $7.1 million, stock-based compensation of $4.3 million, and provision for doubtful accounts and sales returns of $1.8 million. The change in our net operating assets and liabilities was due primarily to a $15.5 million increase in accounts receivable and a $8.5 million increase in inventory associated with the growth in our business combined with a $6.8 million decrease in accrued litigation expenses due to the payment of the legal fees as a result of settling the Brocade litigation. These changes were offset by a $13.5 million increase in deferred revenue due to increased sales of our PCS contracts, a $2.1 million increase in accrued liabilities attributable to higher accrued personnel costs due to growth in headcount and accrued tax liabilities, a $2.5 million increase in accounts payable due to the growth in our business activities, and a $1.6 million decrease in prepaid expenses and other assets due to a decrease in prepaid state income taxes receivable.
During the year ended December 31, 2012, cash provided by operating activities was $3.2 million, consisting of a net loss of $90.2 million offset by non-cash charges of $10.2 million and an $83.0 million increase in our net operating assets and liabilities. Our non-cash charges consisted of depreciation and amortization of $5.3 million, stock-based compensation of $2.5 million, provision for doubtful accounts and sales returns of $1.3 million and the change in fair value of our convertible preferred stock warrant liability of $0.8 million. The change in our net operating assets and liabilities was due primarily to the
51
$83.6 million increase in accrued litigation expenses attributable to the $75.0 million Brocade settlement, a $9.7 million increase in deferred revenue due to increased sales of our PCS contracts and a $6.5 million increase in accrued liabilities attributable to higher accrued personnel costs due to growth in headcount and accrued tax liabilities. These changes were offset by a $9.1 million increase in inventory and a $7.3 million increase in accounts receivable associated with the growth in our business along with a $2.6 million increase in prepaid expenses and other assets due to an increase in VAT and state income taxes receivable.
Cash Flows from Investing Activities
During the years ended December 31, 2014, 2013 and 2012, cash used in investing activities was
$6.1 million
,
$3.0 million
and
$4.2 million
primarily for purchases of property and equipment.
Cash Flows from Financing Activities
During the year ended December 31, 2014, cash provided by financing activities was
$107.8 million
, primarily consisting of
$121.0 million
in net proceeds from the issuance of our common stock to outside investors in our IPO and
$7.0 million
proceeds from common stock issuance under our equity incentive plans, net of repurchases of common stock, partially offset by a
$20.0 million
repayment of our revolving credit facility.
During the year ended December 31, 2013, cash provided by financing activities was
$25.1 million
, consisting of
$79.4 million
in aggregate net proceeds from the issuance of our Series D redeemable convertible preferred stock to outside investors, a net $14.0 million in net borrowings from our revolving credit facility, $0.8 million in proceeds from the exercise of our Series C convertible preferred stock warrants and
$2.4 million
in proceeds from the exercise of stock options, net of repurchases of common stock, offset by a
$70.0 million
in repayment of a promissory note. In July 2013, in conjunction with our litigation settlement with Brocade, we entered into a convertible promissory note with Brocade for $70.0 million, which we repaid in September 2013.
During the year ended December 31, 2012, cash provided by financing activities was
$5.8 million
, consisting of
$15.0 million
in proceeds from our revolving credit facility offset by
$10.0 million
in repayments on outstanding borrowings on our revolving credit facility and term loan with SVB. We also received
$0.8 million
in proceeds from borrowings under a capital lease for equipment, on which we made $0.2 million in repayments during 2012. We also received
$1.3 million
in proceeds from the exercise of stock options, net of repurchases of common stock
Contractual Obligations
Our contractual commitments will have an impact on our future liquidity. Our contractual obligations represent material expected or contractually committed future obligations with terms in excess of one year. We believe that we will be able to fund these obligations through cash generated from operations and from our existing cash balances.
The following table summarizes our contractual obligations as of December 31, 2014 (in thousands).
|
Payments Due By Period
|
|||||||||||||||||||
|
Total
|
Less Than
1 Year
|
1 to 3 Years
|
3 to 5 Years
|
More Than 5 Years
|
|||||||||||||||
|
Operating lease obligations
|
$
|
10,736
|
|
$
|
2,963
|
|
$
|
4,123
|
|
$
|
3,362
|
|
$
|
288
|
|
||||
|
Technology leasing agreement
|
700
|
|
140
|
|
280
|
|
280
|
|
—
|
|
|||||||||
|
Total
|
$
|
11,436
|
|
$
|
3,103
|
|
$
|
4,403
|
|
$
|
3,642
|
|
$
|
288
|
|
||||
The contractual obligations table above excludes $2.2 million of tax liabilities related to uncertain tax positions because we are unable to make a reasonably reliable estimate of the timing of settlement, if any, of these future payments.
52
In September 2013, we entered into a credit agreement with Royal Bank of Canada, JPMorgan Chase Bank, N.A. and Bank of America, N.A. as lenders. The credit agreement provides a three year $35.0 million revolving credit facility, which includes a maximum $10.0 million letter of credit facility. As of December 31, 2013, we had outstanding borrowings under the revolving credit facility of $20.0 million, which were repaid in March 2014. We have no outstanding borrowings under this credit facility as of December 31, 2014.
Off-Balance Sheet Arrangements
As of December 31, 2014, we did not have any relationships with any unconsolidated entities or financial partnerships, such as entities often referred to as structured finance or special purpose entities that would have been established for the purpose of facilitating off-balance sheet arrangements or other contractually narrow or limited purposes.
Critical Accounting Policies and Estimates
Our consolidated financial statements are prepared in accordance with generally accepted accounting principles in the United States and include our accounts and the accounts of our wholly-owned subsidiaries. The preparation of these consolidated financial statements requires our management to make estimates, assumptions and judgments that affect the reported amounts of assets and liabilities and disclosure of contingent assets and liabilities at the date of the financial statements, and the reported amounts of revenue and expenses during the applicable periods. We base our estimates, assumptions and judgments on historical experience and on various other factors that we believe to be reasonable under the
circumstances. Different assumptions and judgments would change the estimates used in the preparation of our consolidated financial statements, which, in turn, could change the results from those reported. We evaluate our estimates, assumptions and judgments on an ongoing basis.
The critical accounting estimates, assumptions and judgments that we believe have the most significant impact on our consolidated financial statements are described below.
Allowance for Doubtful Accounts
We maintain an allowance for doubtful accounts for estimated losses in the collection of accounts receivable. We make estimates regarding the future ability of our customers to make required payments based on historical credit experience and expected future trends. If actual customer financial conditions are less favorable than projected by management, additional accounts receivable write offs may be necessary, which could unfavorably affect future operating results.
Revenue Recognition
We derive revenue from two sources: (i) products revenue, which includes hardware and perpetual software license revenue; and (ii) services revenue, which include post contract support (“PCS”), professional services, and training. Substantially all of our revenue is from sales of our products and services through distribution channel partners, such as resellers and distributors. Revenue is recognized, net of taxes, when all of the following criteria are met: persuasive evidence of an arrangement exists, delivery or performance has occurred, the sales price is fixed or determinable, and collection is reasonably assured.
We define each of the four criteria above as follows:
|
•
|
Persuasive evidence of an arrangement exists.
Evidence of an arrangement consists of a purchase order issued pursuant to the terms and conditions of a master sales agreement.
|
|
•
|
Delivery or performance has occurred.
We use shipping documents or written evidence of customer acceptance, when applicable, to verify delivery or performance. We recognize product revenue upon transfer of title and risk of loss, which primarily is upon shipment to customers. We do not have significant obligations for future performance, such as customer acceptance provisions, rights of return, or pricing credits, associated with our sales.
|
|
•
|
The sales price is fixed or determinable.
We assess whether the sales price is fixed or determinable based on payment terms and whether the sales price is subject to refund or adjustment. Standard payment terms to customers range from 30 to 90 days.
|
53
|
•
|
Collection is reasonably assured.
We assess probability of collection on a customer-by-customer basis. Our customers are subjected to a credit review process that evaluates their financial condition and ability to pay for products and services.
|
PCS revenue includes arrangements for software support and technical support for our products. PCS is offered under renewable, fee-based contracts, which include technical support, hardware repair and replacement parts, bug fixes, patches, and unspecified upgrades on a when-and-if available basis. Revenue for PCS services is recognized on a straight-line basis over the service contract term, which is typically one to five years. Unearned PCS revenue is included in deferred revenue.
Professional service revenue primarily consists of the fees we earn related to installation and consulting services. We recognize revenue from professional services upon delivery or completion of performance. Professional service arrangements are typically short term in nature and are largely completed within 30 to 90 days from the start of service.
Multiple-Element Arrangements
Our hardware with the embedded software solutions (which is a proprietary operating system that together with the hardware delivers the functionality desired by our customers), is considered a separate unit of accounting from PCS because they have value to the customer on a standalone basis and our sales arrangements do not include a right of return for delivered products. For multiple-element arrangements, we allocate revenue to each unit of accounting based on an estimated selling price at the inception of the arrangement. The total arrangement consideration is allocated to each separate unit of accounting using the relative selling price method. We limit the amount of revenue recognized for delivered elements to an amount that is not contingent upon future delivery of additional products or service.
When applying the relative selling price method, we determine the selling price for each element using (i) vendor-specific objective evidence, or VSOE, of selling price, if available; (ii) third-party evidence, or TPE, of selling price, if VSOE is not available; and (iii) best estimate of selling price, or BESP, if neither VSOE nor TPE is available.
•
VSOE.
We determine VSOE based on our historical pricing and discounting practices for the specific products and services when sold separately. In determining VSOE, we require that a substantial majority of the stand-alone selling prices fall within a reasonably narrow pricing range.
•
TPE.
When VSOE cannot be established for deliverables in multiple-element arrangements, we apply judgment with respect to whether we can establish a selling price based on TPE. TPE is determined based on competitor prices for interchangeable products or services when sold separately to similarly situated customers. However, as our products contain a significant element of proprietary technology and our solutions offer substantially different features and functionality, the comparable pricing of products with similar functionality typically cannot be obtained. Additionally, as we are unable to reliably determine what competitors products’ selling prices are on a stand-alone basis, we are not typically able to determine TPE.
•
BESP.
When we are unable to establish selling price using VSOE or TPE, we use BESP in our allocation of arrangement consideration.
The objective of BESP is to determine the price at which we would transact a sale if the product or service was sold regularly on a standalone basis. As we have not been able to establish VSOE or TPE for our products and some of our services, we determine BESP for the purposes of allocating the arrangement, primarily based on historical transaction pricing. Historical transactions are segregated based on our pricing model and go-to-market strategy, which include factors such as the geographies in which our products and services were sold (domestic or international), offering type (product series, and level of support for PCS) and type of sales channel. The determination of BESP is made through consultation with and approval by management.
We may occasionally accept returns to address customer satisfaction issues or solution-fit issues even though there is no contractual provision for such returns. We estimate returns for sales to customers based on historical returns rates applied against current-period gross revenues. Specific customer returns and allowances are considered within this estimate. Management also analyzes changes in customer demand and acceptance of products when evaluating the adequacy of returns and sales allowances.
54
Inventory Valuation
Inventory consists primarily of finished goods and component parts to be used in the manufacturing process and is stated at lower of average cost or market. A provision is recorded when inventory is determined to be in excess of anticipated demand or obsolete, to adjust inventory to its estimated realizable value. Significant judgment is used in establishing our forecasts of future demand and obsolete material exposures. If the actual component usage and product demand are significantly lower than forecast, which may be caused by factors within and outside of our control, or if there were a higher incidence of inventory obsolescence because of rapidly changing technology and our customer requirements, we may be required to increase our inventory write-downs. We incurred inventory write downs of $2.2 million, $2.6 million and $3.3 million for the years ended December 31, 2014, 2013 and 2012.
Legal Proceedings
We have been and are currently involved in various legal proceedings, the outcomes of which are not within our complete control or may not be known for prolonged periods of time. Management is required to assess the probability of loss and amount of such loss, if any, in preparing our consolidated financial statements. We evaluate the likelihood of a potential loss from legal proceedings to which we are a party. We record a liability for such claims when a loss is deemed probable and the amount can be reasonably estimated. Significant judgment may be required in the determination of both probability and whether an exposure is reasonably estimable. Our judgments are subjective based on the status of the legal proceedings, the merits of our defenses and consultation with in-house and outside legal counsel. As additional information becomes available, we reassess the potential liability related to pending claims and may revise our estimates. Due to the inherent uncertainties of the legal processes in the multiple jurisdictions in which we operate, our judgments may be materially different than the actual outcomes, which could have material adverse effects on our business, financial conditions and results of operations.
Income Taxes
We account for income taxes using the liability method, which requires the recognition of deferred tax assets and liabilities for the expected future tax consequences of events that have been recognized in our financial statements or in our tax returns. Estimates and judgments occur in the calculation of certain tax liabilities and in the determination of the recoverability of certain deferred income tax assets, which arise from temporary differences and carryforwards. Deferred income tax assets and liabilities are measured using the currently enacted tax rates that apply to taxable income in effect for the years in which those tax assets are expected to be realized or settled. We regularly assess the likelihood that our deferred tax assets will be recovered from future taxable income and, to the extent we believe, based upon the weight of available evidence, that it is more likely than not that all or a portion of deferred tax assets will not be realized, a valuation allowance is established through an adjustment to income tax expense
The factors used to assess the likelihood of realization of our deferred tax assets include our forecast of future taxable income and available tax planning strategies that could be implemented to realize the net deferred tax assets. Assumptions represent management’s best estimates and involve inherent uncertainties and the application of management’s judgment.
We account for uncertainty in income taxes recognized in our financial statements by regularly reviewing our tax positions and benefits to be realized. We recognize tax liabilities based upon our estimate of whether, and the extent to which, additional taxes will be due when such estimates are more-likely-than-not to be sustained. An uncertain income tax position will not be recognized if it has less than a 50% likelihood of being sustained upon examination by taxing authorities.
Stock-Based Compensation
We recognize stock-based compensation cost for only those shares ultimately expected to vest on a straight-line basis over the requisite service period of the award. We estimate the fair value of market-performance based restricted stock units using a Monte Carlo simulation model which requires the input of assumptions, including expected term, stock price volatility and the risk-free rate of return. In addition, judgment is required in estimating the number of stock-based awards that are expected to be forfeited. Forfeitures are estimated based on historical experience at the time of grant and revised, if necessary, in subsequent periods if actual forfeitures differ from those estimates. The assumptions used in calculating the fair value of share-based payment awards represent management’s best estimates, but these estimates involve inherent uncertainties and the application of management’s judgment. As a result, if factors change and we use different assumptions, our stock-based compensation expense could be materially different in the future.
Pre-IPO Common Stock Valuations
55
Prior to our IPO in March 2014, the fair value of the common stock underlying our stock options was determined by our board of directors, which intended all options granted to be exercisable at a price per share not less than the per share fair value of our common stock underlying those options on the date of grant. The valuations of our common stock were determined in accordance with the guidelines outlined in the American Institute of Certified Public Accountants Practice Aid, Valuation of Privately-Held-Company Equity Securities Issued as Compensation. The assumptions we used in the valuation model were based on future expectations combined with management judgment. Under the fair value recognition provisions of this guidance, stock-based compensation was measured at the grant date based on the fair value of the award and was recognized as expense, net of estimated forfeitures, over the requisite service period, which was generally the vesting period of the award. Determining the fair value of stock-based awards at the grant date represents management’s best estimate, but the estimates involves inherent uncertainties and the application of management’s judgment. We use the Black-Scholes option pricing model to determine the fair value of stock options. The determination of the grant date fair value of options using an option pricing model was affected by our estimated common stock fair value as well as assumptions regarding a number of other complex and subjective variables.
Recent Accounting Pronouncements
Information with respect to recent accounting pronouncements may be found in Note 1.
Description of Business and Summary of Significant Accounting Policies
in the notes to the consolidated financial statements included in this Annual Report on Form 10-K, which section is incorporated herein by reference.
56
Supplementary Financial Information
Selected Quarterly Consolidated Financial Data (Unaudited, in thousands)
The following tables set forth our unaudited quarterly consolidated statements of operations data for each of the eight quarters ended December 31, 2014. In management's opinion, the data has been prepared on the same basis as the audited Consolidated Financial Statements included in this report, and reflects all necessary adjustments, consisting only of normal recurring adjustments, necessary for a fair statement of this data (in thousands):
|
|
For the Three Months Ended
|
||||||||||||||
|
|
March 31,
2014
|
June 30,
2014
|
September 30, 2014
|
December 31, 2014
|
|||||||||||
|
Revenue:
|
|
|
|
|
|
|
|
|
|||||||
|
Products
|
$
|
36,417
|
|
$
|
34,122
|
|
$
|
31,601
|
|
$
|
32,346
|
|
|||
|
Services
|
9,328
|
|
11,010
|
|
11,827
|
|
12,856
|
|
|||||||
|
Total revenue
|
45,745
|
|
45,132
|
|
43,428
|
|
45,202
|
|
|||||||
|
Cost of revenue:
|
|
|
|
|
|
|
|
|
|||||||
|
Products
|
7,427
|
|
7,410
|
|
8,818
|
|
7,429
|
|
|||||||
|
Services
|
2,626
|
|
2,930
|
|
2,935
|
|
3,362
|
|
|||||||
|
Total cost of revenue
|
10,053
|
|
10,340
|
|
11,753
|
|
10,791
|
|
|||||||
|
Gross profit
|
35,692
|
|
34,792
|
|
31,675
|
|
34,411
|
|
|||||||
|
Operating expenses:
|
|
|
|
|
|
|
|
|
|||||||
|
Sales and marketing
|
21,563
|
|
23,975
|
|
24,651
|
|
26,648
|
|
|||||||
|
Research and development
|
11,205
|
|
11,869
|
|
12,342
|
|
14,487
|
|
|||||||
|
General and administrative
|
5,363
|
|
5,531
|
|
5,141
|
|
6,903
|
|
|||||||
|
Litigation expense (benefit)
|
1,846
|
|
(5,859
|
)
|
910
|
|
266
|
|
|||||||
|
Total operating expenses
|
39,977
|
|
35,516
|
|
43,044
|
|
48,304
|
|
|||||||
|
Loss from operations
|
(4,285
|
)
|
(724
|
)
|
(11,369
|
)
|
(13,893
|
)
|
|||||||
|
Other income (expense), net:
|
|
|
|
|
|
|
|
|
|||||||
|
Interest expense
|
(587
|
)
|
(125
|
)
|
(192
|
)
|
(124
|
)
|
|||||||
|
Interest income and other income (expense), net
|
(25
|
)
|
(138
|
)
|
(510
|
)
|
(1,241
|
)
|
|||||||
|
Total other income (expense), net
|
(612
|
)
|
(263
|
)
|
(702
|
)
|
(1,365
|
)
|
|||||||
|
Loss before provision for income taxes
|
(4,897
|
)
|
(987
|
)
|
(12,071
|
)
|
(15,258
|
)
|
|||||||
|
Provision for income taxes
|
205
|
|
309
|
|
233
|
|
760
|
|
|||||||
|
Net loss
|
(5,102
|
)
|
(1,296
|
)
|
(12,304
|
)
|
(16,018
|
)
|
|||||||
|
Accretion of redeemable convertible preferred stock dividend
|
(1,150
|
)
|
—
|
|
—
|
|
—
|
|
|||||||
|
Net loss attributable to common stockholders
|
$
|
(6,252
|
)
|
$
|
(1,296
|
)
|
$
|
(12,304
|
)
|
$
|
(16,018
|
)
|
|||
57
|
|
For the Three Months Ended
|
||||||||||||||
|
|
March 31,
2013
|
June 30,
2013
|
September 30, 2013
|
December 31, 2013
|
|||||||||||
|
Revenue:
|
|
|
|
|
|
|
|
|
|||||||
|
Products
|
$
|
23,269
|
|
$
|
23,064
|
|
$
|
32,263
|
|
$
|
33,449
|
|
|||
|
Services
|
6,312
|
|
7,067
|
|
7,563
|
|
8,751
|
|
|||||||
|
Total revenue
|
29,581
|
|
30,131
|
|
39,826
|
|
42,200
|
|
|||||||
|
Cost of revenue:
|
|
|
|
|
|
|
|
|
|||||||
|
Products
|
4,906
|
|
4,894
|
|
6,669
|
|
8,815
|
|
|||||||
|
Services
|
1,698
|
|
2,020
|
|
2,065
|
|
2,329
|
|
|||||||
|
Total cost of revenue
|
6,604
|
|
6,914
|
|
8,734
|
|
11,144
|
|
|||||||
|
Gross profit
|
22,977
|
|
23,217
|
|
31,092
|
|
31,056
|
|
|||||||
|
Operating expenses:
|
|
|
|
|
|
|
|
|
|||||||
|
Sales and marketing
|
15,589
|
|
15,723
|
|
18,276
|
|
21,168
|
|
|||||||
|
Research and development
|
7,772
|
|
8,336
|
|
8,517
|
|
8,723
|
|
|||||||
|
General and administrative
|
3,830
|
|
3,697
|
|
3,686
|
|
4,343
|
|
|||||||
|
Litigation expense (benefit)
|
3,404
|
|
4,800
|
|
1,683
|
|
1,638
|
|
|||||||
|
Total operating expenses
|
30,595
|
|
32,556
|
|
32,162
|
|
35,872
|
|
|||||||
|
Loss from operations
|
(7,618
|
)
|
(9,339
|
)
|
(1,070
|
)
|
(4,816
|
)
|
|||||||
|
Other income (expense), net:
|
|
|
|
|
|
|
|
|
|||||||
|
Interest expense
|
(13
|
)
|
(33
|
)
|
(1,399
|
)
|
(50
|
)
|
|||||||
|
Interest income and other income (expense), net
|
(681
|
)
|
(683
|
)
|
(73
|
)
|
(681
|
)
|
|||||||
|
Total other income (expense), net
|
(694
|
)
|
(716
|
)
|
(1,472
|
)
|
(731
|
)
|
|||||||
|
Loss before provision for income taxes
|
(8,312
|
)
|
(10,055
|
)
|
(2,542
|
)
|
(5,547
|
)
|
|||||||
|
Provision for income taxes
|
221
|
|
158
|
|
207
|
|
54
|
|
|||||||
|
Net loss
|
(8,533
|
)
|
$
|
(10,213
|
)
|
(2,749
|
)
|
(5,601
|
)
|
||||||
|
Accretion of redeemable convertible preferred stock dividend
|
—
|
|
$
|
(33
|
)
|
(755
|
)
|
(1,194
|
)
|
||||||
|
Net loss attributable to common stockholders
|
$
|
(8,533
|
)
|
$
|
(10,246
|
)
|
$
|
(3,504
|
)
|
$
|
(6,795
|
)
|
|||
58
Foreign Currency Risk
Our consolidated results of operations, financial position and cash flows are subject to fluctuations due to changes in foreign currency exchange rates. Historically, the majority of our revenue contracts are denominated in U.S. dollars, with the most significant exception being Japan where we invoice primarily in the Japanese yen. Our costs and expenses are generally denominated in the currencies where our operations are located, which is primarily in North America, Japan and to a lesser extent EMEA and the Asia Pacific region. To date, we have not entered into any hedging arrangements with respect to foreign currency risk or other derivative instruments. Revenue resulting from selling in local currencies and costs and expenses incurred in local currencies are exposed to foreign currency exchange rate fluctuations which can affect our revenue and operating income. As exchange rates vary, operating income may differ from expectations.
The functional currency of our foreign subsidiaries is the U.S. dollar. At the end of each reporting period, monetary assets and liabilities are remeasured to the functional currency using exchange rates in effect at the balance sheet date. Non-monetary assets and liabilities are remeasured at historical exchange rates. Gains and losses related to remeasurement are recorded in interest income and other income (expense), net in the Consolidated Statements of Operations. A significant fluctuation in the exchange rates between our subsidiaries' local currencies, especially the Japanese yen and the Euro, and the U.S. dollar could have an adverse impact on our consolidated financial position and results of operations.
We recorded
$2.0 million
,
$2.1 million
and
$1.5 million
foreign exchange loss during the years ended December 31, 2014, 2013 and 2012. The effect of a hypothetical 10% change in our exchange rate would not have a significant impact on our consolidated results of operations.
Interest Rate Sensitivity
Our exposure to market risk for changes in interest rates relates primarily to our cash and cash equivalents and our indebtedness. Our cash and cash equivalents are held in cash deposits and money market funds with maturities of less than 90 days from the date of purchase. Our primary exposure to market risk is interest income sensitivity, which is affected by changes in the general level of the interest rates in the United States. However, because of the short-term nature of the instruments in our portfolio, a sudden change in market interest rates would not be expected to have a material impact on our consolidated financial statements.
Our exposure to interest rates risk relates to our revolving credit facility with variable interest rates, where an increase in interest rates may result in higher borrowing costs. Since we have no outstanding borrowings under our credit facility as of December 31, 2014, the effect of a hypothetical 10% change in interest rates would not have a significant impact on our interest expense.
59
ITEM 8.
FINANCIAL STATEMENTS AND SUPPLEMENTAL DATA
INDEX TO CONSOLIDATED FINANCIAL STATEMENTS
|
Page
|
|
|
Consolidated Financial Statements:
|
|
60
Report of Independent Registered Public Accounting Firm
To the Board of Directors and Stockholders of A10 Networks, Inc.
San Jose, California
We have audited the accompanying consolidated balance sheets of A10 Networks, Inc. and subsidiaries (the "Company") as of December 31, 2014 and 2013, and the related consolidated statements of operations, redeemable convertible preferred stock, convertible preferred stock and stockholders' equity (deficit), and cash flows for each of the three years in the period ended December 31, 2014. These financial statements are the responsibility of the Company's management. Our responsibility is to express an opinion on the financial statements based on our audits.
We conducted our audits in accordance with the standards of the Public Company Accounting Oversight Board (United States). Those standards require that we plan and perform the audit to obtain reasonable assurance about whether the financial statements are free of material misstatement. The Company is not required to have, nor were we engaged to perform, an audit of its internal control over financial reporting. Our audits included consideration of internal control over financial reporting as a basis for designing audit procedures that are appropriate in the circumstances, but not for the purpose of expressing an opinion on the effectiveness of the Company's internal control over financial reporting. Accordingly, we express no such opinion. An audit also includes examining, on a test basis, evidence supporting the amounts and disclosures in the financial statements, assessing the accounting principles used and significant estimates made by management, as well as evaluating the overall financial statement presentation. We believe that our audits provide a reasonable basis for our opinion.
In our opinion, such consolidated financial statements present fairly, in all material respects, the financial position of A10 Networks, Inc. and subsidiaries as of December 31, 2014 and 2013, and the results of their operations and their cash flows for each of the three years in the period ended December 31, 2014, in conformity with accounting principles generally accepted in the United States of America.
/s/ Deloitte & Touche LLP
San Jose, California
March 10, 2015
61
A10 NETWORKS, INC.
CONSOLIDATED BALANCE SHEETS
(in thousands, except par value)
|
|
December 31,
2014 |
December 31,
2013 |
|||||
|
ASSETS
|
|||||||
|
Current Assets:
|
|
|
|||||
|
Cash and cash equivalents
|
$
|
91,905
|
|
$
|
20,793
|
|
|
|
Accounts receivable, net of allowances of $3,246 and $2,738 as of December 31, 2014 and December 31, 2013
|
54,003
|
|
37,704
|
|
|||
|
Inventory
|
20,701
|
|
17,166
|
|
|||
|
Prepaid expenses and other current assets
|
4,732
|
|
3,056
|
|
|||
|
Total current assets
|
171,341
|
|
78,719
|
|
|||
|
Property and equipment, net
|
10,780
|
|
9,801
|
|
|||
|
Other non-current assets
|
4,859
|
|
5,274
|
|
|||
|
Total Assets
|
$
|
186,980
|
|
$
|
93,794
|
|
|
|
LIABILITIES, REDEEMABLE CONVERTIBLE PREFERRED STOCK,
CONVERTIBLE PREFERRED STOCK AND STOCKHOLDERS’ EQUITY (DEFICIT)
|
|||||||
|
Current Liabilities:
|
|
|
|||||
|
Accounts payable
|
$
|
8,994
|
|
$
|
9,228
|
|
|
|
Accrued liabilities
|
22,290
|
|
15,514
|
|
|||
|
Accrued litigation expenses
|
145
|
|
10,407
|
|
|||
|
Deferred revenue, current
|
39,256
|
|
28,448
|
|
|||
|
Total current liabilities
|
70,685
|
|
63,597
|
|
|||
|
Revolving credit facility
|
—
|
|
20,000
|
|
|||
|
Deferred revenue, non-current
|
17,964
|
|
12,784
|
|
|||
|
Other non-current liabilities
|
1,766
|
|
6,118
|
|
|||
|
Total Liabilities
|
90,415
|
|
102,499
|
|
|||
|
Commitments and contingencies (Note 5)
|
|
|
|||||
|
Redeemable convertible preferred stock, no par value—no shares authorized, issued or outstanding as of December 31, 2014; 115 shares authorized, 80 shares issued and outstanding with aggregate liquidation preference of $80,000 as of December 31, 2013
|
—
|
|
81,426
|
|
|||
|
Convertible preferred stock, par value $0.00001 — 100,000 shares authorized and no shares issued and outstanding as of December 31, 2014; no par value —30,569 shares authorized, issued and outstanding with aggregate liquidation preference of $42,884 as of December 31, 2013
|
—
|
|
44,749
|
|
|||
|
STOCKHOLDERS’ EQUITY (DEFICIT)
|
|||||||
|
Common stock, par value $0.00001 — 500,000 and 65,600 shares authorized as of December 31, 2014 and December 31, 2013; 61,377 and 10,032 shares issued and outstanding as of December 31, 2014 and December 31, 2013
|
1
|
|
—
|
|
|||
|
Additional paid-in capital
|
278,349
|
|
12,185
|
|
|||
|
Accumulated deficit
|
(181,785
|
)
|
(147,065
|
)
|
|||
|
Total Stockholders' Equity (Deficit)
|
96,565
|
|
(134,880
|
)
|
|||
|
Total Liabilities, Redeemable Convertible Preferred Stock, Convertible Preferred Stock And Stockholders' Equity (Deficit)
|
$
|
186,980
|
|
$
|
93,794
|
|
|
The accompanying notes are an integral part of these consolidated financial statements.
62
A10 NETWORKS, INC.
CONSOLIDATED STATEMENTS OF OPERATIONS
(in thousands, except per share amounts)
|
|
Years Ended December 31,
|
|||||||||
|
|
2014
|
2013
|
2012
|
|||||||
|
Revenue:
|
|
|
|
|
|
|
||||
|
Products
|
$
|
134,486
|
|
$
|
112,045
|
|
$
|
99,891
|
|
|
|
Services
|
45,021
|
|
29,693
|
|
20,175
|
|
||||
|
Total revenue
|
179,507
|
|
141,738
|
|
120,066
|
|
||||
|
Cost of revenue:
|
|
|
|
|
|
|
||||
|
Products
|
31,084
|
|
25,284
|
|
18,619
|
|
||||
|
Services
|
11,853
|
|
8,112
|
|
5,891
|
|
||||
|
Total cost of revenue
|
42,937
|
|
33,396
|
|
24,510
|
|
||||
|
Gross profit
|
136,570
|
|
108,342
|
|
95,556
|
|
||||
|
Operating expenses:
|
|
|
|
|
|
|
||||
|
Sales and marketing
|
96,837
|
|
70,756
|
|
51,323
|
|
||||
|
Research and development
|
49,903
|
|
33,348
|
|
25,513
|
|
||||
|
General and administrative
|
22,938
|
|
15,556
|
|
10,225
|
|
||||
|
Litigation expense (benefit)
|
(2,837
|
)
|
11,525
|
|
95,515
|
|
||||
|
Total operating expenses
|
166,841
|
|
131,185
|
|
182,576
|
|
||||
|
Loss from operations
|
(30,271
|
)
|
(22,843
|
)
|
(87,020
|
)
|
||||
|
Other income (expense), net:
|
|
|
|
|
|
|
||||
|
Interest expense
|
(1,028
|
)
|
(1,495
|
)
|
(135
|
)
|
||||
|
Interest income and other income (expense), net
|
(1,914
|
)
|
(2,118
|
)
|
(2,237
|
)
|
||||
|
Total other income (expense), net
|
(2,942
|
)
|
(3,613
|
)
|
(2,372
|
)
|
||||
|
Loss before provision for income taxes
|
(33,213
|
)
|
(26,456
|
)
|
(89,392
|
)
|
||||
|
Provision for income taxes
|
1,507
|
|
640
|
|
758
|
|
||||
|
Net loss
|
$
|
(34,720
|
)
|
$
|
(27,096
|
)
|
$
|
(90,150
|
)
|
|
|
Accretion of redeemable convertible preferred stock dividend
|
(1,150
|
)
|
(1,982
|
)
|
—
|
|
||||
|
Net loss attributable to common stockholders
|
$
|
(35,870
|
)
|
$
|
(29,078
|
)
|
$
|
(90,150
|
)
|
|
|
Net loss per share attributable to common stockholders:
|
|
|
|
|
|
|
||||
|
Basic
|
$
|
(0.74
|
)
|
$
|
(3.14
|
)
|
$
|
(10.80
|
)
|
|
|
Diluted
|
$
|
(0.74
|
)
|
$
|
(3.14
|
)
|
$
|
(10.80
|
)
|
|
|
Weighted-average shares used in computing net loss per share attributable to common stockholders
|
|
|
|
|
|
|
||||
|
Basic
|
48,682
|
|
9,262
|
|
8,344
|
|
||||
|
Diluted
|
48,682
|
|
9,262
|
|
8,344
|
|
||||
The accompanying notes are an integral part of these consolidated financial statements.
63
A10 NETWORKS, INC.
CONSOLIDATED STATEMENTS OF REDEEMABLE CONVERTIBLE PREFERRED STOCK, CONVERTIBLE PREFERRED STOCK AND STOCKHOLDERS' EQUITY (DEFICIT)
(in thousands)
|
Redeemable Convertible Preferred Stock
|
Convertible
Preferred Stock
|
Common Stock
|
||||||||||||||||||||||||||||||
|
Shares
|
Amount
|
Shares
|
Amount
|
Shares
|
Amount
|
Additional Paid-in Capital
|
Accumulated Deficit
|
Total Stockholders' Equity (Deficit)
|
||||||||||||||||||||||||
|
Balance at January 1, 2012
|
—
|
|
$
|
—
|
|
30,111
|
|
$
|
41,665
|
|
8,362
|
|
$
|
—
|
|
$
|
4,229
|
|
$
|
(29,819
|
)
|
$
|
(25,590
|
)
|
||||||||
|
Stock based compensation expense
|
—
|
|
—
|
|
—
|
|
—
|
|
6
|
|
—
|
|
2,540
|
|
2,540
|
|
||||||||||||||||
|
Issuance of Series C convertible preferred stock upon exercise of Series C convertible preferred stock warrants for cash
|
—
|
|
—
|
|
11
|
|
72
|
|
—
|
|
—
|
|
—
|
|
—
|
|
—
|
|
||||||||||||||
|
Common stock issued under employee equity incentive plans, net of unvested portion
|
—
|
|
—
|
|
—
|
|
—
|
|
941
|
|
—
|
|
599
|
|
—
|
|
599
|
|
||||||||||||||
|
Vesting of early exercise stock options, net of repurchases
|
—
|
|
—
|
|
—
|
|
—
|
|
(63
|
)
|
—
|
|
709
|
|
—
|
|
709
|
|
||||||||||||||
|
Net loss
|
—
|
|
—
|
|
—
|
|
—
|
|
—
|
|
—
|
|
—
|
|
(90,150
|
)
|
(90,150
|
)
|
||||||||||||||
|
Balance at December 31, 2012
|
—
|
|
—
|
|
30,122
|
|
41,737
|
|
9,246
|
|
—
|
|
8,077
|
|
(119,969
|
)
|
(111,892
|
)
|
||||||||||||||
|
Stock based compensation expense
|
—
|
|
—
|
|
—
|
|
—
|
|
—
|
|
—
|
|
4,282
|
|
—
|
|
4,282
|
|
||||||||||||||
|
Issuance of Series D redeemable convertible preferred stock, net of issuance costs
of $556 |
80
|
|
79,444
|
|
—
|
|
—
|
|
—
|
|
—
|
|
—
|
|
—
|
|
—
|
|
||||||||||||||
|
Accretion of Series D redeemable convertible preferred stock dividend
|
—
|
|
1,982
|
|
—
|
|
—
|
|
—
|
|
—
|
|
(1,982
|
)
|
—
|
|
(1,982
|
)
|
||||||||||||||
|
Issuance of Series C convertible preferred stock upon exercise of Series C convertible preferred stock warrants for cash
|
—
|
|
—
|
|
447
|
|
3,012
|
|
—
|
|
—
|
|
—
|
|
—
|
|
—
|
|
||||||||||||||
|
Common stock issued under employee equity incentive plans, net of unvested portion
|
—
|
|
—
|
|
—
|
|
—
|
|
822
|
|
—
|
|
1,174
|
|
—
|
|
1,174
|
|
||||||||||||||
|
Vesting of early exercise stock options, net of repurchases
|
—
|
|
—
|
|
—
|
|
—
|
|
(36
|
)
|
—
|
|
634
|
|
—
|
|
634
|
|
||||||||||||||
|
Net loss
|
—
|
|
—
|
|
—
|
|
—
|
|
—
|
|
—
|
|
—
|
|
(27,096
|
)
|
(27,096
|
)
|
||||||||||||||
|
Balance at December 31, 2013
|
80
|
|
81,426
|
|
30,569
|
|
44,749
|
|
10,032
|
|
—
|
|
12,185
|
|
(147,065
|
)
|
(134,880
|
)
|
||||||||||||||
|
Stock based compensation expense
|
—
|
|
—
|
|
—
|
|
—
|
|
—
|
|
—
|
|
12,359
|
|
12,359
|
|
||||||||||||||||
|
Accretion of Series D redeemable convertible preferred stock dividend
|
—
|
|
1,150
|
|
—
|
|
—
|
|
—
|
|
—
|
|
(1,150
|
)
|
—
|
|
(1,150
|
)
|
||||||||||||||
|
Issuance of common stock in connection with initial public offering net of offering costs
|
—
|
|
—
|
|
—
|
|
—
|
|
9,000
|
|
—
|
|
120,286
|
|
—
|
|
120,286
|
|
||||||||||||||
|
Conversion of preferred stock to common stock in connection with initial public offering
|
(80
|
)
|
(82,576
|
)
|
(30,569
|
)
|
(44,749
|
)
|
39,997
|
|
1
|
|
127,324
|
|
—
|
|
127,325
|
|
||||||||||||||
|
Common issued under employee equity incentive plans, net of unvested portion
|
—
|
|
—
|
|
—
|
|
—
|
|
2,352
|
|
—
|
|
6,574
|
|
—
|
|
6,574
|
|
||||||||||||||
|
Vesting of early exercise stock options, net of repurchases
|
—
|
|
—
|
|
—
|
|
—
|
|
(4
|
)
|
—
|
|
771
|
|
—
|
|
771
|
|
||||||||||||||
|
Net loss
|
—
|
|
—
|
|
—
|
|
—
|
|
—
|
|
—
|
|
—
|
|
(34,720
|
)
|
(34,720
|
)
|
||||||||||||||
|
Balance at December 31, 2014
|
—
|
|
$
|
—
|
|
—
|
|
$
|
—
|
|
61,377
|
|
$
|
1
|
|
$
|
278,349
|
|
$
|
(181,785
|
)
|
$
|
96,565
|
|
||||||||
The accompanying notes are an integral part of these consolidated financial statements.
64
A10 NETWORKS, INC.
CONSOLIDATED STATEMENTS OF CASH FLOWS
(in thousands)
|
|
Years Ended December 31,
|
||||||||||
|
2014
|
2013
|
2012
|
|||||||||
|
Cash flows from operating activities:
|
|||||||||||
|
Net loss
|
$
|
(34,720
|
)
|
$
|
(27,096
|
)
|
$
|
(90,150
|
)
|
||
|
Adjustments to reconcile net loss to net cash provided by (used in) operating activities:
|
|||||||||||
|
Depreciation and amortization
|
10,121
|
|
7,080
|
|
5,294
|
|
|||||
|
Stock-based compensation
|
12,359
|
|
4,282
|
|
2,540
|
|
|||||
|
Gain on settlement of contractual liability (Note 3)
|
(6,993
|
)
|
—
|
|
—
|
|
|||||
|
Provision for doubtful accounts and sales returns
|
935
|
|
1,788
|
|
1,330
|
|
|||||
|
Changes in fair value of convertible preferred stock warrant liability
|
—
|
|
2
|
|
804
|
|
|||||
|
Changes in operating assets and liabilities:
|
|||||||||||
|
Accounts receivable, net
|
(17,281
|
)
|
(15,549
|
)
|
(7,340
|
)
|
|||||
|
Inventory
|
(8,914
|
)
|
(8,489
|
)
|
(9,147
|
)
|
|||||
|
Prepaid expenses and other assets
|
(3,017
|
)
|
1,588
|
|
(2,571
|
)
|
|||||
|
Accounts payable
|
903
|
|
2,495
|
|
2,382
|
|
|||||
|
Accrued liabilities
|
6,724
|
|
2,133
|
|
6,507
|
|
|||||
|
Accrued litigation expenses
|
(6,066
|
)
|
(6,797
|
)
|
83,644
|
|
|||||
|
Deferred revenue
|
15,989
|
|
13,525
|
|
9,657
|
|
|||||
|
Other
|
(578
|
)
|
(95
|
)
|
263
|
|
|||||
|
Net cash provided by (used in) operating activities
|
(30,538
|
)
|
(25,133
|
)
|
3,213
|
|
|||||
|
Cash flows from investing activities:
|
|||||||||||
|
Purchases of property and equipment
|
(6,100
|
)
|
(2,993
|
)
|
(4,241
|
)
|
|||||
|
Net cash used in investing activities
|
(6,100
|
)
|
(2,993
|
)
|
(4,241
|
)
|
|||||
|
Cash flows from financing activities:
|
|||||||||||
|
Proceeds from initial public offering, net of offering costs
|
121,017
|
|
(656
|
)
|
—
|
|
|||||
|
Proceeds from issuance of Series D redeemable convertible preferred stock, net of issuance costs
|
—
|
|
79,444
|
|
—
|
|
|||||
|
Principal payments on convertible promissory note in relation to settlement of litigation
|
—
|
|
(70,000
|
)
|
—
|
|
|||||
|
Proceeds from revolving credit facility
|
—
|
|
33,988
|
|
15,000
|
|
|||||
|
Principal payments on revolving credit facility
|
(20,000
|
)
|
(20,000
|
)
|
(10,000
|
)
|
|||||
|
Principal payments on term loan
|
—
|
|
(631
|
)
|
(1,023
|
)
|
|||||
|
Proceeds from borrowings under capital lease
|
—
|
|
—
|
|
750
|
|
|||||
|
Proceeds from exercise of convertible preferred stock warrants
|
—
|
|
813
|
|
20
|
|
|||||
|
Proceeds from issuance of common stock under employee equity incentive plans, net of repurchases
|
7,030
|
|
2,392
|
|
1,271
|
|
|||||
|
Other
|
(297
|
)
|
(298
|
)
|
(171
|
)
|
|||||
|
Net cash provided by financing activities
|
107,750
|
|
25,052
|
|
5,847
|
|
|||||
|
Net increase in cash and cash equivalents
|
71,112
|
|
(3,074
|
)
|
4,819
|
|
|||||
|
Cash and cash equivalents—beginning of period
|
20,793
|
|
23,867
|
|
19,048
|
|
|||||
|
Cash and cash equivalents—end of period
|
$
|
91,905
|
|
$
|
20,793
|
|
$
|
23,867
|
|
||
|
Supplemental Disclosures of Cash Flow Information:
|
|
|
|
|
|
|
|||||
|
Cash paid for income taxes, net of refunds
|
$
|
1,108
|
|
$
|
698
|
|
$
|
1,723
|
|
||
|
Cash paid for interest
|
$
|
503
|
|
$
|
1,208
|
|
$
|
93
|
|
||
The accompanying notes are an integral part of these consolidated financial statements.
65
A10 NETWORKS, INC.
CONSOLIDATED STATEMENTS OF CASH FLOWS (Continued)
(in thousands)
|
|
Years Ended December 31,
|
||||||||||
|
2014
|
2013
|
2012
|
|||||||||
|
Supplemental Disclosure of Non-Cash Investing and Financing Activities:
|
|
|
|
|
|
|
|||||
|
Conversion of preferred stock into common stock
|
$
|
127,325
|
|
$
|
—
|
|
$
|
—
|
|
||
|
Inventory transfers to property and equipment
|
$
|
5,379
|
|
$
|
5,638
|
|
$
|
3,400
|
|
||
|
Accretion of Series D redeemable convertible preferred stock
|
$
|
1,150
|
|
$
|
1,982
|
|
$
|
—
|
|
||
|
Vesting of early exercised stock options
|
$
|
771
|
|
$
|
654
|
|
$
|
709
|
|
||
|
Costs related to the initial public offering included in accounts payable and accrued liabilities
|
$
|
75
|
|
$
|
1,776
|
|
$
|
—
|
|
||
|
Issuance of convertible promissory note in relation to settlement of litigation
|
$
|
—
|
|
$
|
70,000
|
|
$
|
—
|
|
||
|
Reclassification of the convertible preferred stock warrant liability to additional paid-in
capital upon the exercise of the convertible preferred stock warrants |
$
|
—
|
|
$
|
2,199
|
|
$
|
52
|
|
||
The accompanying notes are an integral part of these consolidated financial statements.
66
Notes to Consolidated Financial Statements
1. Description of Business and Summary of Significant Accounting Policies
Description of Business and Basis of Presentation
A10 Networks, Inc. (together with our subsidiaries, the “Company”, “we”, “our” or “us”) was incorporated in California in 2004 and reincorporated in Delaware in 2014. We are headquartered in San Jose, California and have wholly-owned subsidiaries throughout the world including Asia and Europe. Our solutions enable enterprises, service providers, Web giants and government organizations to accelerate, secure and optimize the performance of their data center applications and networks. We currently offer three software based advanced application networking solutions. These are Application Delivery Controllers, or ADCs, to optimize data center performance; Carrier Grade Network Address Translation, or CGN, to provide address and protocol translation services for service provider networks; and a Distributed Denial of Service Threat Protection System, or TPS, for network-wide security protection. We deliver these solutions both on optimized hardware appliances and as virtual appliances across our Thunder Series and AX Series product families.
Basis of Presentation
The accompanying consolidated financial statements have been prepared in accordance with generally accepted accounting principles in the United States of America (“GAAP”). The accompanying consolidated financial statements include the accounts of A10 Networks, Inc., and our wholly owned subsidiaries. All inter-company balances and transactions have been eliminated in consolidation.
We had no comprehensive income (loss) other than our net income (loss), hence our comprehensive income (loss) is the same as the net income (loss) for all periods presented. Pursuant to the accounting guidance provided by Accounting Standard Codification ("ASC") 220
Comprehensive Income,
we did not present statements of comprehensive income (loss) for the periods presented
.
Use of Estimates
The preparation of the consolidated financial statements in conformity with GAAP requires us to make estimates and assumptions that affect the amounts reported in the consolidated financial statements and accompanying notes, including revenue recognition and deferred revenue, allowance for doubtful accounts, sales return reserve, valuation of inventory, contingencies and litigation, and determination of fair value of stock-based compensation. These estimates are evaluated on an ongoing basis using historical experience and other factors and that are based on information available as of the date of the consolidated financial statements; therefore, actual results could differ from management’s estimates.
Foreign Currency
The functional currency of our foreign subsidiaries is the U.S. Dollar. Transactions denominated in currencies other than the functional currency are remeasured to the functional currency at the average exchange rate in effect during the period. At the end of each reporting period, monetary assets and liabilities are remeasured to the functional currency using exchange rates in effect at the balance sheet date. Non-monetary assets and liabilities are remeasured at historical exchange rates. Gains and losses related to remeasurement are recorded in interest income and other income (expense), net in the consolidated statements of operations.
Vendor Business Concentration
Our products are concentrated in an industry which is characterized by significant competition, rapid technological advances, changes in customer requirements and evolving regulatory requirements and industry standards. Our success depends on management’s ability to anticipate and respond quickly and adequately to technological developments in the industry, or changes in customer requirements or industry standards. Any significant delays in the development or introduction of products could have a material adverse effect on our business and operating results. We rely on third parties to manufacture our hardware appliances and we purchase raw materials from third-party vendors. We outsourced substantially all of our manufacturing services to two independent manufacturers. In addition, we purchase certain strategic component inventory which is consigned to our third-party manufacturers. Other hardware components included in our products are sourced from various suppliers by our manufacturers and are principally industry standard parts and components that are available from multiple vendors. Quality or performance failures of our products or changes in our manufacturers’ or vendors’ financial or business condition could disrupt our ability to supply quality products to our customers, and thereby may have a material adverse effect on our business and consolidated financial statements.
67
Concentration of Credit Risk and Significant Customers
Financial instruments that potentially subject us to concentrations of credit risk consist of cash, cash equivalents and accounts receivable. Our cash and cash equivalents are invested in high-credit quality financial instruments with banks and financial institutions. Management believes that the financial institutions that hold our cash and cash equivalents are financially sound and, accordingly, are subject to minimal credit risk. Such deposits may be in excess of insured limits provided on such deposits.
Our accounts receivable are unsecured and represent amounts due to us based on contractual obligations of our customers. We mitigate credit risk in respect to accounts receivable by performing periodic credit evaluations of our customers to assess the probability of accounts receivable collection based on a number of factors, including past transaction experience with the customer, evaluation of their credit history, limiting the credit extended and review of the invoicing terms of the contract. We generally do not require our customers to provide collateral to support accounts receivable. We have recorded an allowance for doubtful accounts for those receivables that we have determined not to be collectible.
Significant customers, including distribution channel partners and direct customers, are those which represent more than 10% of our total revenue for each period presented, or our gross accounts receivable balance as of each respective balance sheet date. Revenue from our significant customers as a percentage of our total revenue for the years ended December 31, 2014, 2013 and 2012 are as follows:
|
|
Years Ended December 31,
|
|||||
|
2014
|
2013
|
2012
|
||||
|
Customers
|
||||||
|
Customer A
|
13%
|
*
|
*
|
|||
|
Customer B
|
*
|
15%
|
34%
|
|||
|
Customer C
|
*
|
10%
|
*
|
|||
* represents less than 10% of total revenue
As of December 31, 2014 and 2013, no customer accounted for 10% or more of our total gross accounts receivable.
Cash and Cash Equivalents
We consider all highly liquid investments with maturities of three months or less when purchased to be cash equivalents. Cash and cash equivalents consist of cash on hand and highly liquid investments in money market funds. As of December 31, 2014 and 2013, cash held in bank accounts was
$91.9 million
and
$20.8 million
.
Fair Value Measurement
Our financial instruments consist of cash and cash equivalents, accounts receivable, accounts payable, accrued liabilities, and debt. Cash equivalents are stated at amortized cost, which approximates fair value as of the balance sheet dates, due to the short period of time to maturity. Accounts receivable, accounts payable and accrued expenses are stated at their carrying value, which approximates fair value due to the short time to the expected receipt or payment. The carrying amount of our revolving credit facility approximates its fair value as the stated interest rate approximates market rates currently available to us. As of December 31, 2014 and 2013, we have not elected the fair value option for any financial assets and liabilities for which such an election would have been permitted.
Assets and liabilities recorded at fair value on a recurring basis in the consolidated balance sheets are categorized based upon the level of judgment associated with the inputs used to measure their fair values. Fair value is defined as the exchange price that would be received for an asset or an exit price that would be paid to transfer a liability in the principal or most advantageous market for the asset or liability in an orderly transaction between market participants on the measurement date. Valuation techniques used to measure fair value must maximize the use of observable inputs and minimize the use of unobservable inputs. The authoritative guidance on fair value measurements establishes a three-tier fair
value hierarchy for disclosure of fair value measurements as follows:
Level I
—Inputs are unadjusted, quoted prices in active markets for identical assets or liabilities at the measurement date;
68
Level II
—Inputs are observable, unadjusted quoted prices in active markets for similar assets or liabilities, unadjusted quoted prices for identical or similar assets or liabilities in markets that are not active, or other inputs that are observable or can be corroborated by observable market data for substantially the full term of the related assets or liabilities; and
Level III
—Unobservable inputs that are significant to the measurement of the fair value of the assets or liabilities that are supported by little or no market data.
As of December 31, 2014 and 2013, our financial instruments entirely consist of Level I assets. Level I assets include highly liquid money market funds that are included in cash and cash equivalents.
Accounts Receivable and Allowance for Doubtful Accounts
Accounts receivable are recorded at invoiced amounts, net of allowances for doubtful accounts if applicable, and do not bear interest. We evaluate the collectability of our accounts receivable based on known collection risks and historical experience. In circumstances where we are aware of a specific customer’s inability to meet its financial obligations to us (e.g., bankruptcy filings or substantial downgrading of credit ratings), we record a specific reserve for bad debts against amounts due to reduce the net recognized receivable to the amount we reasonably believe will be collected. For all other customers, we record reserves for bad debts based on the length of time the receivables are past due and our historical experience of collections and write-offs. If circumstances change, such as higher-than-expected defaults or an unexpected material adverse change in a major customer’s ability to meet its financial obligations, our estimate of the recoverability of the amounts due could be reduced by a material amount.
Inventory
Inventory consists primarily of finished goods and related component parts and is stated at the lower of standard cost, (which approximates actual cost on a first-in, first-out basis), or market value (estimated net realizable value). We evaluate inventory for excess and obsolete products, based on management’s assessment of future demand and market conditions. Inventory write-downs, once established, are not reversed as they establish a new cost basis for the inventory. Inventory write downs are included as a component of cost of revenue in the accompanying Consolidated Statements of Operations. We incurred inventory write downs of
$2.2 million
,
$2.6 million
and
$3.3 million
for the years ended December 31, 2014, 2013 and 2012.
Property and Equipment, Net
Property and equipment, including leasehold improvements, are stated at cost, less accumulated depreciation and amortization. Depreciation is computed using the straight-line method over the estimated useful lives of the related assets. Depreciation on property and equipment, excluding leasehold improvements, ranges from one to three years.
Leasehold improvements are amortized on a straight-line basis over the shorter of the estimated useful lives of the assets or the remaining lease term. Amortization on leasehold improvements ranges from two to eight years.
Revenue Recognition
We derive revenue from two sources: (i) products revenue, which includes hardware and perpetual software license revenue; and (ii) services revenue, which include post contract support (“PCS”), professional services, and training. Substantially all of our revenue is from sales of our products and services through distribution channel partners, such as resellers and distributors. Revenue is recognized, net of taxes, when all of the following criteria are met: persuasive evidence of an arrangement exists, delivery or performance has occurred, the sales price is fixed or determinable, and collection is reasonably assured.
We define each of the four criteria above as follows:
|
•
|
Persuasive evidence of an arrangement exists.
Evidence of an arrangement consists of a purchase order issued pursuant to the terms and conditions of a master sales agreement.
|
|
•
|
Delivery or performance has occurred.
We use shipping documents or written evidence of customer acceptance, when applicable, to verify delivery or performance. We recognize product revenue upon transfer
|
69
of title and risk of loss, which primarily is upon shipment to customers. We do not have significant obligations for future performance, such as customer acceptance provisions, rights of return, or pricing credits, associated with our sales.
|
•
|
The sales price is fixed or determinable.
We assess whether the sales price is fixed or determinable based on payment terms and whether the sales price is subject to refund or adjustment. Standard payment terms to customers range from 30 to 90 days.
|
|
•
|
Collection is reasonably assured.
We assess probability of collection on a customer-by-customer basis. Our customers are subjected to a credit review process that evaluates their financial condition and ability to pay for products and services.
|
PCS revenue includes arrangements for software support and technical support for our products. PCS is offered under renewable, fee-based contracts, which include technical support, hardware repair and replacement parts, bug fixes, patches, and unspecified upgrades on a when-and-if available basis. Revenue for PCS services is recognized on a straight-line basis over the service contract term, which is typically one to five years. Unearned PCS revenue is included in deferred revenue.
Professional service revenue primarily consists of the fees we earn related to installation and consulting services. We recognize revenue from professional services upon delivery or completion of performance. Professional service arrangements are typically short term in nature and are largely completed within 30 to 90 days from the start of service.
Multiple-Element Arrangements
Our hardware with the embedded software solutions (which is a proprietary operating system that together with the hardware delivers the functionality desired by our customers), is considered a separate unit of accounting from PCS because they have value to the customer on a standalone basis and our sales arrangements do not include a right of return for delivered products. For multiple-element arrangements, we allocate revenue to each unit of accounting based on an estimated selling price at the inception of the arrangement. The total arrangement consideration is allocated to each separate unit of accounting using the relative selling price method. We limit the amount of revenue recognized for delivered elements to an amount that is not contingent upon future delivery of additional products or service.
When applying the relative selling price method, we determine the selling price for each element using (i) vendor-specific objective evidence, or VSOE, of selling price, if available; (ii) third-party evidence, or TPE, of selling price, if VSOE is not available; and (iii) best estimate of selling price, or BESP, if neither VSOE nor TPE is available.
•
VSOE.
We determine VSOE based on our historical pricing and discounting practices for the specific products and services when sold separately. In determining VSOE, we require that a substantial majority of the stand-alone selling prices fall within a reasonably narrow pricing range.
•
TPE.
When VSOE cannot be established for deliverables in multiple-element arrangements, we apply judgment with respect to whether we can establish a selling price based on TPE. TPE is determined based on competitor prices for interchangeable products or services when sold separately to similarly situated customers. However, as our products contain a significant element of proprietary technology and our solutions offer substantially different features and functionality, the comparable pricing of products with similar functionality typically cannot be obtained. Additionally, as we are unable to reliably determine what competitors products’ selling prices are on a stand-alone basis, we are not typically able to determine TPE.
•
BESP.
When we are unable to establish selling price using VSOE or TPE, we use BESP in our allocation of arrangement consideration.
The objective of BESP is to determine the price at which we would transact a sale if the product or service was sold regularly on a standalone basis. As we have not been able to establish VSOE or TPE for our products and some of our services, we determine BESP for the purposes of allocating the arrangement, primarily based on historical transaction pricing. Historical transactions are segregated based on our pricing model and go-to-market strategy, which include factors such as the geographies in which our products and services were sold (domestic or international), offering type (product series, and level of support for PCS) and type of sales channel. The determination of BESP is made through consultation with and approval by management.
70
We may occasionally accept returns to address customer satisfaction issues or solution-fit issues even though there is no contractual provision for such returns. We estimate returns for sales to customers based on historical returns rates applied against current-period gross revenues. Specific customer returns and allowances are considered within this estimate. Management also analyzes changes in customer demand and acceptance of products when evaluating the adequacy of returns and sales allowances.
Deferred Revenue
Deferred product revenue relates to arrangements where not all revenue recognition criteria have been met. Deferred services revenue primarily represents PCS contracts billed in advance and revenue is recognized ratably over the service contract term, typically one to five years. The current portion of deferred revenue represents the amounts that are expected to be recognized as revenue within one year of the consolidated balance sheet date.
Shipping and Handling
Shipping charges billed to customers are included in revenue and the related shipping costs are included in cost of revenue in the accompanying consolidated statements of operations.
Research and Development Costs
Software and hardware development costs incurred in the research and development of new products and enhancements to existing products are charged to expense as incurred. The period between achievement of technological feasibility, which we define as the establishment of a working model, and the general availability of such software to customers has been short, resulting in software development costs qualifying for capitalization being insignificant. Accordingly, we did not capitalize any development costs for the years ended December 31, 2014, 2013 and 2012.
Deferred Offering Costs
Deferred offering costs, consisting of legal, accounting and filing fees relating to our Initial Public Offering ("IPO"), were capitalized until our IPO in March 2014, at which time the deferred offering costs were offset against our IPO proceeds upon the completion of the offering. As of December 31, 2013, we had capitalized
$2.4 million
of deferred offering costs, which is classified as other current assets on our Consolidated Balance Sheets.
Segment Information
Operating segments are components of an enterprise for which separate financial information is available and is evaluated regularly by our chief operating decision maker in deciding how to allocate resources and assessing performance. Our chief operating decision maker is our Chief Executive Officer.
Our Chief Executive Officer reviews financial information presented on a consolidated basis, for purposes of allocating resources and evaluating financial performance. We have one business activity and there are no segment managers accountable for operations, operating results beyond revenues or gross profit, or plans for levels or components below the consolidated unit level. Accordingly, we have a single reporting segment.
Stock-Based Compensation
We recognize stock-based compensation cost for only those shares ultimately expected to vest on a straight-line basis over the requisite service period of the award.
We recognize compensation expense for all stock-based payment awards granted to employees, including stock options, restricted stock units (“RSUs”) and purchases under our 2014 Employee Stock Purchase Plan (“2014 Purchase Plan”), based on the estimated fair value on the date of the grant. The fair value of each stock option granted is estimated using the Black-Scholes option pricing model. The fair value of each RSU granted represents the closing price of our common stock on the date of grant. The fair value of purchases under our 2014 Purchase Plan is calculated based on the closing price of our common stock on the date of grant and the value of put and call options estimated using the Black-Scholes option pricing model. Stock-based compensation is recognized on a straight-line basis over the requisite service period, net of estimated forfeitures.
71
We estimate the fair value of market-performance based restricted stock units using a Monte Carlo simulation model which requires the input of assumptions, including expected term, stock price volatility and the risk-free rate of return.
We account for stock options issued to nonemployees based on the fair value of the awards determined using the Black-Scholes option pricing model. The fair value of stock options granted to nonemployees is re-measured as the stock options vest, and the resulting change in fair value, if any, is recognized within our Consolidated Statement of Operations during the period the related services are rendered.
In addition, judgment is also required in estimating the number of stock-based awards that are expected to be forfeited. Forfeitures are estimated based on historical experience at the time of grant and revised, if necessary, in subsequent periods if actual forfeitures differ from those estimates. The assumptions used in calculating the fair value of share-based payment awards represent management’s best estimates, but these estimates involve inherent uncertainties and the application of management’s judgment. As a result, if factors change and we use different assumptions, our stock-based compensation expense could be materially different in the future.
Warranty Costs
Our appliance hardware and software generally carry a warranty period of 90 days. Estimates of future warranty costs are based on actual historical returns experience and the application of those historical return rates to our in-warranty installed base. Warranty costs to repair or replace items sold to customers have been insignificant for the years ended December 31, 2014, 2013 and 2012.
Litigation and Contingencies
Litigation is comprised of legal expenses incurred in defending ourselves against litigation matters and our change in litigation reserve. Legal expenses are recorded in our Consolidated Statements of Operations as incurred when the legal services are provided. The current portion of accrued litigation expenses represents the legal expenses that are expected to be paid within one year of Consolidated Balance Sheets date. Accrued litigation expenses represents our estimate of possible losses on pending litigations. Some of these proceedings involve claims that are subject to substantial uncertainties and unascertainable damages. Accordingly, except as disclosed, we have not accrued estimated litigation liabilities or ranges of possible loss related to these proceedings, as at this time in the proceedings, if any, the matters do not relate to a probable loss and/or amounts are not reasonably estimable.
401(k) Profit Sharing Plan
We have a qualified contributory savings plan under Section 401(k) of the Internal Revenue Code that is offered to all of our United States employees. Each participant in the plan may elect to contribute up to $17,500 of his or her annual compensation to the plan for the 2014 calendar year. Individuals who were 50 or older may contribute an additional $5,500 of their annual income. We did not make matching or discretionary contributions to this plan during 2014.
Income Taxes
We account for income taxes using the asset and liability method, which requires the recognition of deferred tax assets and liabilities for the expected future tax consequences of events that have been recognized in our consolidated financial statements or in our tax returns. Estimates and judgments occur in the calculation of certain tax liabilities and in the determination of the recoverability of certain deferred income tax assets, which arise from temporary differences and carryforwards. Deferred income tax assets and liabilities are measured using the currently enacted tax rates that apply to taxable income in effect for the years in which those tax assets are expected to be realized or settled. We regularly assess the likelihood that our deferred tax assets will be recovered from future taxable income and, to the extent we believe, based upon the weight of available evidence, that it is more likely than not that all or a portion of deferred tax assets will not be realized, a valuation allowance is established through an adjustment to income tax expense.
The factors used to assess the likelihood of realization of our deferred tax assets include our forecast of future taxable income and available tax planning strategies that could be implemented to realize the net deferred tax assets. Assumptions represent management’s best estimates and involve inherent uncertainties and the application of management’s judgment.
We account for uncertainty in income taxes recognized in our consolidated financial statements by regularly reviewing our tax positions and benefits to be realized. We recognize tax liabilities based upon our estimate of whether, and the extent to which, additional taxes will be due when such estimates are more-likely-than-not to be sustained. An uncertain income tax
72
position will not be recognized if it has less than a 50% likelihood of being sustained upon examination by taxing authorities. The provision for income taxes includes the effects of any resulting tax reserves, or unrecognized tax benefits, that are considered appropriate as well as the related net interest and penalties.
Recent Accounting Pronouncements
In July 2013, the Financial Accounting Standards Board ("FASB") issued Accounting Standard Update (“ASU”) No. 2013-11,
Income Taxes (Topic 740), Presentation of an Unrecognized Tax Benefit When a Net Operating Loss Carryforward, a Similar Tax Loss, or a Tax Credit Carryforward Exists
. ASU 2013-11 provides guidance on the financial statement presentation of an unrecognized tax benefit when a net operating loss carryforward, similar tax loss, or tax credit carryforward exists. This new standard requires the netting of unrecognized tax benefits (“UTBs”) against a deferred tax asset for a loss or other carryforward that would apply in settlement of the uncertain tax positions. UTBs will be netted against all available same-jurisdiction loss or other tax carryforwards that would be utilized, rather than only against carryforwards that are created by the UTBs. We adopted ASU-2013-11 on January 1, 2014, and the adoption did not have a material impact on our consolidated financial statements.
In May 2014, the FASB issued ASU No. 2014-09,
Revenue from Contracts with Customers
, which provides new guidance on the recognition of revenue and states that an entity should recognize revenue to depict the transfer of promised goods or services to customers in an amount that reflects the consideration to which the entity expects to be entitled in exchange for those goods or services. This standard will be effective for annual reporting periods beginning after December 15, 2016, including interim periods within that reporting period. Early adoption is not permitted. We are currently evaluating the impact of the adoption of this accounting standard update on our consolidated financial position or results of operations.
2. Fair Value Measurements
Our financial instruments consist of cash and cash equivalents, accounts receivable, accounts payable, accrued liabilities and debt. Cash equivalents are stated at amortized cost, which approximates fair value as of the balance sheet dates, due to the short period of time to maturity. Accounts receivable, accounts payable and accrued expenses are stated at their carrying value, which approximates fair value due to the short time to the expected receipt or payment. The carrying amount of our revolving credit facility approximates the fair value as the stated interest rate approximates market rates currently available to us.
Cash and cash equivalents are carried at fair value. Our money market funds and equity instruments are classified within Level 1 of the fair value hierarchy, as these instruments are valued using quoted market prices. Specifically, we value our investments in money market securities, certificates of deposit and plan assets under our deferred compensation plan based on quoted market prices in active markets. As of December 31, 2014 and 2013, we had no assets or liabilities classified within Level II or Level III and there were no transfers of instruments between Level I, Level II and Level III regarding fair value measurement.
The following table sets forth the fair value of our financial assets measured on a recurring basis by level within the fair value hierarchy (in thousands):
|
|
December 31, 2014
|
December 31, 2013
|
|||||||||||||
|
|
Level 1
|
Total
|
Level 1
|
Total
|
|||||||||||
|
Financial Assets
|
|
|
|||||||||||||
|
Money market funds
|
$
|
51,047
|
|
$
|
51,047
|
|
$
|
14,029
|
|
$
|
14,029
|
|
|||
We did not have realized gains or losses for the years ended December 31, 2014 and 2013 related to our financial assets.
73
The following table sets forth a summary of the changes in the fair value of our Level III financial liabilities (in thousands):
|
|
December 31,
2014 |
December 31,
2013 |
December 31,
2012 |
||||||||
|
Fair value, beginning of period
|
$
|
—
|
|
$
|
2,197
|
|
$
|
1,445
|
|
||
|
Fair value of convertible preferred stock warrants exercised
|
—
|
|
(2,199
|
)
|
(52
|
)
|
|||||
|
Changes in fair value of Level III liabilities
|
—
|
|
2
|
|
804
|
|
|||||
|
Fair value, end of period
|
$
|
—
|
|
$
|
—
|
|
$
|
2,197
|
|
||
Level III liabilities that are measured at fair value on a recurring basis consist solely of our convertible
preferred stock warrant liability. The fair values of the outstanding convertible preferred stock warrants are measured using the Black-Scholes option-pricing model. Inputs used to determine estimated fair value include the estimated fair value of the underlying stock at the valuation measurement date, the remaining contractual term of the warrants, risk-free interest rates, expected dividends and the expected volatility of the underlying stock. Generally, increases (decreases) in the fair value of the underlying stock and estimated term would result in a directionally similar impact to the fair value measurement.
3. Balance Sheets and Statement of Operations Components
Allowance for Doubtful Accounts and Sales Return Reserve
For the years ended December 31, 2014, 2013 and 2012, allowance for doubtful accounts and sales return reserve consisted of the following activity (in thousands):
|
|
December 31,
2014 |
December 31,
2013 |
December 31,
2012 |
||||||||
|
Allowance for doubtful accounts, beginning balance
|
$
|
1,836
|
|
$
|
1,494
|
|
$
|
793
|
|
||
|
Charged to expenses
|
76
|
|
1,068
|
|
712
|
|
|||||
|
Write-offs
|
(8
|
)
|
(726
|
)
|
(11
|
)
|
|||||
|
Allowance for doubtful accounts, ending balance
|
$
|
1,904
|
|
$
|
1,836
|
|
$
|
1,494
|
|
||
|
|
December 31,
2014 |
December 31,
2013 |
December 31,
2012 |
||||||||
|
Sales return reserve, beginning balance
|
$
|
902
|
|
$
|
500
|
|
$
|
296
|
|
||
|
Charged to expenses
|
858
|
|
720
|
|
618
|
|
|||||
|
Write-offs
|
(418
|
)
|
(318
|
)
|
(414
|
)
|
|||||
|
Sales return reserve, ending balance
|
$
|
1,342
|
|
$
|
902
|
|
$
|
500
|
|
||
Inventory
Components of inventory as of
December 31, 2014
and 2013 are shown below (in thousands):
|
|
December 31,
2014 |
December 31,
2013 |
|||||
|
Raw materials
|
$
|
9,922
|
|
$
|
10,625
|
|
|
|
Finished goods
|
10,779
|
|
6,541
|
|
|||
|
Total inventory
|
$
|
20,701
|
|
$
|
17,166
|
|
|
74
Property and Equipment, Net
Components of property and equipment, net as of
December 31, 2014
and 2013 are shown below (in thousands):
|
|
Estimated Useful Life
(in Years)
|
December 31,
2014 |
December 31,
2013 |
|||||
|
Equipment
|
1-3
|
$
|
30,486
|
|
$
|
21,188
|
|
|
|
Software
|
1-3
|
3,197
|
|
2,479
|
|
|||
|
Leasehold improvements
|
Lesser of the term of the lease or the estimated useful life
|
1,780
|
|
1,325
|
|
|||
|
Furniture and fixtures
|
3
|
860
|
|
777
|
|
|||
|
Construction in progress
|
—
|
201
|
|
123
|
|
|||
|
Property and equipment, gross
|
36,524
|
|
25,892
|
|
||||
|
Less: accumulated depreciation and amortization
|
(25,744
|
)
|
(16,091
|
)
|
||||
|
Total property and equipment, net
|
$
|
10,780
|
|
$
|
9,801
|
|
||
Depreciation and amortization on our property and equipment for the years ended months ended December 31, 2014, 2013 and 2012 was
$10.0 million
,
$6.9 million
and
$4.7 million
.
Deferred Revenue
Deferred revenue as of
December 31, 2014
and December 31, 2013 consists of the following (in thousands):
|
|
December 31,
2014 |
December 31,
2013 |
|||||
|
Deferred revenue:
|
|
|
|||||
|
Products
|
$
|
2,379
|
|
$
|
3,170
|
|
|
|
Services
|
54,841
|
|
38,062
|
|
|||
|
Total deferred revenue
|
57,220
|
|
41,232
|
|
|||
|
Less: current portion
|
(39,256
|
)
|
(28,448
|
)
|
|||
|
Non-current portion
|
$
|
17,964
|
|
$
|
12,784
|
|
|
Accrued Liabilities
Accrued liabilities as of
December 31, 2014
and December 31, 2013 consists of the following (in thousands):
|
|
December 31,
2014 |
December 31,
2013 |
|||||
|
Accrued compensation and benefits
|
$
|
14,447
|
|
$
|
9,015
|
|
|
|
Accrued tax liabilities
|
2,554
|
|
2,156
|
|
|||
|
Other
|
5,289
|
|
4,343
|
|
|||
|
Total accrued liabilities
|
$
|
22,290
|
|
$
|
15,514
|
|
|
Foreign Currency Exchange Losses
We recorded
$2.0 million
,
$2.1 million
and
$1.5 million
foreign exchange loss as part of interest income and other income (expense), net in our Consolidated Statements of Operations during the years ended December 31, 2014, 2013 and 2012.
75
Settlement of Contractual Liability
In May 2014, we reached a settlement agreement with one of our legal service providers which resulted in the reduction of a previously accrued contractual liability that totaled
$12.0 million
. We made a payment of
$5.0 million
in accordance with the terms of the settlement agreement in June 2014 and recorded a
$7.0 million
benefit to litigation expense (benefit) at that time.
4. Credit Facility
In September 2013, we entered into a credit agreement with Royal Bank of Canada, JPMorgan Chase Bank, N.A. and Bank of America, N.A. as lenders. The credit agreement provides a
three
-year
$35.0 million
revolving credit facility, which includes a maximum
$10.0 million
letter of credit facility. We drew down
$25.0 million
on the revolving credit facility on September 30, 2013, and repaid
$5.0 million
on December 31, 2013. As December 31, 2013, we had
$20.0 million
outstanding borrowing under this credit facility. In 2014, we repaid the
$20.0 million
outstanding borrowing under this credit facility and we have
no
outstanding borrowings under this credit facility as of December 31, 2014.
At our option, the revolving credit facility bears interest at a rate per annum based on either (i) an alternate base rate plus a margin ranging from
1.75%
to
2.50%
depending on our total leverage ratio, or (ii) the London interbank offered rate, or LIBOR, based on one, two, three or six month interest periods plus a margin ranging from
2.75%
to
3.50%
depending on our total leverage ratio. The alternate base rate is equal to the greatest of (i) the Royal Bank of Canada’s prime rate, (ii) the federal funds rate plus a margin equal to
0.50%
and (iii) the Eurodollar rate for a one month interest period plus a margin equal to
1.00%
. We are also required to pay quarterly facility fees of
0.45%
per annum on the average daily unused portion of the revolving credit facility. We may prepay the loans or terminate or reduce the commitments at any time, without premium or penalty. The revolving credit facility matures on September 30, 2016.
In addition, we incurred
$1.0 million
of debt issuance costs that were directly attributable to the issuance of this revolving credit facility which are amortized to interest expense over the three-year term of this credit facility. As of December 31, 2014, the unamortized debt issuance costs of
$0.5 million
were included within other non-current assets in our Consolidated Balance Sheets.
Our obligations under the credit agreement are secured by a security interest on substantially all of our assets, including our intellectual property. The credit agreement contains customary non-financial covenants, and also requires us to comply with financial covenants. One financial covenant requires us to maintain a total leverage ratio, which is defined as total consolidated debt to trailing adjusted EBITDA as defined by the credit agreement. In addition, we must maintain a minimum amount of liquidity based on our unrestricted cash and availability under the revolving credit facility. The covenant requires us to maintain a minimum liquidity of
$25.0 million
provided that at least
$10.0 million
of liquidity comprises of unrestricted cash. The credit agreement includes customary events of default which, if triggered, could result in the acceleration of our obligations under the revolving credit facility, the termination of any obligation by the lenders to extend further credit and a process for the lenders to obtain title to collateral granted to them under the credit agreement; however, we also have the ability, in certain instances, to cure non-compliance with the financial covenants through qualified equity contributions by certain holders of our equity. We were in compliance with all financial and nonfinancial covenants under the revolving credit facility as of
December 31, 2014
.
5. Commitments and Contingencies
Legal Proceedings
From time to time, we may be party or subject to various legal proceedings and claims, either asserted or unasserted, which arise in the ordinary course of business, including proceedings and claims that relate to intellectual property matters. Some of these proceedings involve claims that are subject to substantial uncertainties and unascertainable damages. Accordingly, except as disclosed, we have not established reserves or ranges of possible loss related to these proceedings, as at this time in the proceedings, if any, the matters do not relate to a probable loss and/or amounts cannot be reasonably estimated.
76
In November 2013, Parallel Networks, LLC (“Parallel Networks”), which we believe is a non-practicing patent holding company, filed a lawsuit against us in the United States District Court for the District of Delaware. In the lawsuit, Parallel Networks alleges that our AX and Thunder series products infringe two of their U.S. patents. Parallel Networks is seeking injunctive relief, damages and attorneys’ fees and costs. Parallel Networks has asserted similar claims against a number of our competitors. The separate trials for each defendant in these related actions are set to commence in June 2016 in accordance with an order to be set forth in a trial sequencing conference. This matter is in the early stages, but we intend to vigorously defend the lawsuit. We are unable to reasonably estimate a possible loss or range of possible loss if any, in regards to this matter; therefore,
no
accrued litigation expense has been recorded in the accompanying Consolidated Balance Sheets.
On January 29, 2015, the Company, the members of our Board of Directors, our Chief Financial Officer, and the underwriters of our March 21, 2014, initial public offering were named as defendants in a putative class action lawsuit filed in the Superior Court of the State of California, County of Santa Clara, captioned City of Warren Police and Fire Retirement System v. A10 Networks, Inc., et al., 1-15-CV-276207. The complaint seeks to allege violations of the federal Securities Act of 1933 on behalf of a putative class consisting of purchasers of our common stock pursuant or traceable to the registration statement and prospectus for the initial public offering, and seeks unspecified compensatory damages and other relief. We intend to vigorously defend this lawsuit. Based on information currently available, we are unable to reasonably estimate a possible loss or range of possible loss, if any, in regards to this lawsuit; therefore,
no
accrued litigation expense has been recorded in the accompanying Consolidated Balance Sheets.
In May 2013, we reached an agreement with Brocade Communications Systems, Inc. ("Brocade") to settle the lawsuit that Brocade filed against us, our founder and other individuals in the United States District Court for the Northern District of California in August 2010, and the lawsuit that we filed against Brocade in September 2011, along with all related claims. The total amount of the settlement was
$75.0 million
, which we recognized as litigation expense in our Consolidated Statement of Operations for the year ended December 31, 2012 with the corresponding liability being recored as “accrued litigation expenses, current portion” in our Consolidated Balance Sheet as of December 31, 2012.
In June 2013, we entered into a settlement with Allegro Software Development, Inc. (“Allegro”) whereby we paid
$0.9 million
in cash to resolve all claims relating to the licensing and use of Allegro’s software. As the result of the settlement agreement, we recognized an additional
$0.6 million
as litigation expense in our Consolidated Statement of Operations for the year ended December 31, 2012.
Lease Obligations and Other Commitments
We lease various operating spaces in California, Asia, and Europe under noncancelable operating lease arrangements that expire on various dates through February 2020. These arrangements require us to pay certain operating expenses, such as taxes, repairs, and insurance and contain renewal and escalation clauses. We recognize rent expense under these arrangements on a straight-line basis over the term of the lease.
In 2008, we entered into a technology licensing arrangement that requires us to make payments over the life of the associated patents which are expected to expire in 2020.
As of December 31, 2014, the aggregate future noncancelable minimum lease payments for our operating leases consist of the following (in thousands):
|
Year Ending December 31,
|
Operating Leases
|
Technology Licensing Agreements
|
Minimum Future Lease Payments
|
|||||||||
|
2015
|
$
|
2,963
|
|
$
|
140
|
|
$
|
3,103
|
|
|||
|
2016
|
2,273
|
|
140
|
|
2,413
|
|
||||||
|
2017
|
1,850
|
|
140
|
|
1,990
|
|
||||||
|
2018
|
1,681
|
|
140
|
|
1,821
|
|
||||||
|
2019
|
1,681
|
|
140
|
|
1,821
|
|
||||||
|
Thereafter
|
288
|
|
—
|
|
288
|
|
||||||
|
$
|
10,736
|
|
$
|
700
|
|
$
|
11,436
|
|
||||
Rent expense was
$3.4 million
,
$2.9 million
and
$2.6 million
in 2014, 2013 and 2012, respectively.
77
Guarantees
We have entered into agreements with some of our customers that contain indemnification provisions in the event of claims alleging that our products infringe the intellectual property rights of a third party. Other guarantees or indemnification arrangements include guarantees of product and service performance and standby letters of credit for lease facilities and corporate credit cards. We have not recorded a liability related to these indemnification and guarantee provisions and our guarantees and indemnification arrangements have not had any significant impact on our consolidated financial statements to date.
6.
Redeemable Convertible Preferred Stock, Convertible Preferred Stock and Stockholders' Equity (Deficit)
Initial Public Offering
In March 2014, we completed our IPO, whereby
12,500,000
shares of common stock were sold to the public at a price per share of
$15.00
. We sold
9,000,000
common shares and selling stockholders sold
3,500,000
common shares. In April 2014, our underwriters exercised an overallotment available to them and an additional
345,000
shares were sold by our selling stockholders bringing the total shares sold to
12,845,000
for this offering. The total gross proceeds from the offering were
$192.7 million
. After deducting underwriting discounts and commissions, offering expenses payable by us, and net proceeds received by the selling stockholders, the estimated aggregate net proceeds was
$120.3 million
. Upon the closing of the IPO, all shares of our outstanding redeemable convertible preferred stock and convertible preferred stock converted into
39,997,114
shares of common stock.
Reverse Stock Split
On March 6, 2014, we effected a 1-for-
3.75
reverse stock split of our common stock and convertible preferred stock (collectively referred to as “Capital Stock”). Shares of our Series D redeemable convertible preferred stock were not subject to the split but instead the conversion price of the Series D redeemable convertible preferred stock was adjusted proportionally to reflect the split of the common stock issued upon conversion of the Series D redeemable convertible preferred stock. On March 6, 2014 (i) each 3.75 shares of outstanding Capital Stock was combined into 1 share of Capital Stock; (ii) the number of shares of Capital Stock for which each outstanding option to purchase Capital Stock is exercisable was proportionately reduced on a 1-for-3.75 basis; (iii) the exercise price of each such outstanding option was proportionately increased on a 1-for-3.75 basis; (iv) each 3.75 shares of authorized Capital Stock was reduced to 1 share of Capital Stock; and (v) the conversion price of the Series D redeemable convertible preferred stock was adjusted from
$2.2628
to
$8.4855
. All of the share and per share amounts within these consolidated financial statements have been adjusted, on a retroactive basis, to reflect this 1-for-3.75 reverse stock split.
Common Stock
We had reserved shares of common stock, on an as-converted basis, for future issuance as follows (in thousands):
|
|
December 31,
|
||||
|
|
2014
|
2013
|
|||
|
Conversion of outstanding Series A convertible preferred stock
|
—
|
|
8,913
|
|
|
|
Conversion of outstanding Series B convertible preferred stock
|
—
|
|
7,015
|
|
|
|
Conversion of outstanding Series C convertible preferred stock
|
—
|
|
14,641
|
|
|
|
Conversion of outstanding Series D redeemable convertible preferred stock
|
—
|
|
9,428
|
|
|
|
Outstanding stock options and RSUs
|
14,012
|
|
9,971
|
|
|
|
Shares reserved for future option grants
|
1,344
|
|
1,435
|
|
|
|
15,356
|
|
51,403
|
|
||
78
Preferred Stock
Our preferred stock on March 21, 2014 (immediately before the closing of our IPO) and December 31, 2013 are as follows (in thousands):
|
March 21, 2014
|
|||||||||||||
|
|
Shares Authorized
|
Shares Issued and Outstanding
|
Net Carrying Value
|
Aggregated Liquidation Preference
|
|||||||||
|
Convertible Preferred Stock
|
|||||||||||||
|
Series A
|
8,913
|
|
8,913
|
|
$
|
6,625
|
|
$
|
6,685
|
|
|||
|
Series B
|
7,015
|
|
7,015
|
|
8,922
|
|
8,945
|
|
|||||
|
Series C
|
14,641
|
|
14,641
|
|
29,202
|
|
27,254
|
|
|||||
|
Total convertible preferred stock
|
30,569
|
|
30,569
|
|
$
|
44,749
|
|
$
|
42,884
|
|
|||
|
Redeemable Convertible Preferred Stock
|
|||||||||||||
|
Series D
|
115
|
|
80
|
|
$
|
82,576
|
|
$
|
80,000
|
|
|||
|
December 31, 2013
|
|||||||||||||
|
|
Shares Authorized
|
Shares Issued and Outstanding
|
Net Carrying Value
|
Aggregated Liquidation Preference
|
|||||||||
|
Convertible Preferred Stock
|
|||||||||||||
|
Series A
|
8,913
|
|
8,913
|
|
$
|
6,625
|
|
$
|
6,685
|
|
|||
|
Series B
|
7,015
|
|
7,015
|
|
8,922
|
|
8,945
|
|
|||||
|
Series C
|
14,641
|
|
14,641
|
|
29,202
|
|
27,254
|
|
|||||
|
Total convertible preferred stock
|
30,569
|
|
30,569
|
|
$
|
44,749
|
|
$
|
42,884
|
|
|||
|
Redeemable Convertible Preferred Stock
|
|||||||||||||
|
Series D
|
115
|
|
80
|
|
$
|
81,426
|
|
$
|
80,000
|
|
|||
We recorded the convertible preferred stock at fair value on the dates of issuance, net of issuance costs.
We recorded the Series D redeemable convertible preferred stock at fair value on the dates of issuance, net of issuance costs. We classify the redeemable convertible preferred stock outside of stockholders’ equity (deficit) because the shares contain a date-certain redemption feature. We recorded accretion on the redeemable convertible preferred stock for the difference between the initial net carrying value of
$79.4 million
and the redemption value on June 27, 2019, the earliest redemption date, of
$112.9 million
. The accretion will be recognized from the issuance date through the earliest redemption date of June 27, 2019 or when these preferred stock are converted into common stock using the effective interest rate method. For the years ended December 31, 2014 and 2013, we recognized accretion of
$1.2 million
and
$2.0 million
.
All of our outstanding preferred stock was converted to common stock in connection with our IPO on March 21, 2014.
79
Early Exercise of Stock Options
We have allowed certain of our employees and directors to exercise options granted under the stock option plans prior to vesting. The unvested shares are subject to our repurchase right at the original purchase price. The proceeds from the early exercise of stock options initially are recorded in other non-current liabilities and reclassified to common stock as our repurchase right lapses. We issued
93,987
,
296,218
, and
308,738
shares of common stock for the years ended December 31, 2014, 2013 and 2012 upon early exercise of stock options. For the years ended December 31, 2014, 2013 and 2012, we repurchased
3,834
,
32,743
and
63,448
shares of unvested common stock related to early exercise stock options at the original purchase price due to the termination of employees. As of December 31, 2014 and 2013,
196,217
and
300,746
shares held by employees and directors were subject to repurchase at an aggregate price of
$1.0 million
and
$1.3 million
.
Convertible Preferred Stock Warrants
In conjunction with our Series C convertible preferred stock financing in February 2008, we issued warrants to purchase
752,069
shares of Series C convertible preferred stock. The warrants were immediately exercisable in whole or in part over the term of the warrants.
For the years ended December 31, 2013 and 2012,
450,372
and
10,744
of the warrants were exercised at an exercise price of
$1.8615
per share, resulting in cash proceeds of
$0.8 million
and
$20,000
. We classified our convertible preferred stock warrants as liabilities in our accompanying consolidated balance sheets. The convertible preferred stock warrant liability was
$2.2 million
as of December 31, 2012. Upon exercise of warrants, the fair value of the warrant liability was reclassified to convertible preferred stock. As of December 31, 2014 and 2013, we did not have any outstanding convertible preferred stock warrants.
7. Equity Award Plans
Equity Incentive Plans
2008 Plan
We adopted the 2008 Stock Plan (the "2008 Plan") for the purpose of granting stock-based awards to eligible service providers, which included our employees, directors, and consultants as well as employees and consultants of our subsidiaries. With the establishment of the 2014 Equity Incentive Plan (the "2014 Plan") in March 2014, we terminated the 2008 Plan. Upon such termination, we ceased granting any awards under the 2008 Plan and only options to purchase shares of our Common Stock outstanding as of such date remain under this plan. The remaining options available for future grant under the 2008 Plan were canceled.
2014 Equity Incentive Plan
The 2014 Plan was adopted by our board of directors and approved by our stockholders in March 2014. Our 2014 Plan provides for the granting of stock options, restricted stock awards ("RSAs"), restricted stock units ("RSUs"), stock appreciation rights, performance units and performance shares to our employees, directors and consultants, and our subsidiary corporations’ employees and consultants.
As of December 31, 2014, a total of
7,700,000
shares of our common stock are reserved for issuance pursuant to the 2014 Plan. On the first day of each fiscal year, starting with January 1, 2015, the number of shares in the reserve will increase by the lesser of (i)
8,000,000
shares, (ii)
5%
of the outstanding shares of common stock on the last day of our immediately preceding fiscal year, or (iii) such other amount as determined by our board of directors. As of
December 31, 2014
, we have granted
3,550,889
stock options and
3,080,090
RSUs, including
540,000
shares of market performance-based restrict stock units ("MSUs") under the 2014 Plan to our employees and consultants, and we have
1,343,743
shares available for future grant.
Vesting periods of awards granted under the 2014 Plan are determined by the board of directors or other committees responsible for administering the 2014 Plan (the "Plan Administrators"). The Plan Administrators determine the contractual terms of awards granted under the 2014 Plan, provided that incentive stock options and stock appreciation rights granted expire no more than
ten years
from the grant date. In the case of an incentive stock option granted to an employee, who at the time of grant, owns stock representing more than
10%
of the total combined voting power of all classes of stock, the exercise price shall be no less than
110%
of the fair value per share on the date of grant, and expire
five years
from the date of grant, and for incentive stock options granted to any other employee, and nonstatutory stock options and stock appreciation rights granted to
80
employees, directors or consultants, the per share exercise price shall be no less than
100%
of the fair value per share on the date of grant.
2014 Employee Stock Purchase Plan
The 2014 Employee Stock Purchase Plan (the "2014 Purchase Plan") was adopted by our board of directors and approved by our stockholders in March 2014. A total of
1,600,000
shares of our common stock was authorized for purchase under the 2014 Purchase Plan. On the first day of each fiscal year, starting with January 1, 2015, the number of shares in the reserve will increase by the lesser of (i)
3,500,000
shares, (ii)
1%
of the outstanding shares of our common stock on the last day of the immediately preceding fiscal year, or (iii) such other amount as determined by our board of directors. As of
December 31, 2014
, participants of our 2014 Purchase Plan have purchased
568,684
shares under our 2014 Purchase Plan, and have
1,031,316
shares available for future purchases.
The 2014 Purchase Plan permits eligible employees to acquire shares of our common stock at
85%
of the lower of the fair market value of our common stock on the first trading day of each offering period or on the exercise date that occurs at the end of a purchase period. Each offering period is approximately twenty-four months in duration, starting on the first trading day on or after May 21 and November 21 of each year, except for the first offering period, which commenced on March 21, 2014. Each offering period generally consists of four purchase periods and each purchase period will begin after one exercise date and end with the next exercise date approximately six months later, except that the first purchase period of an offering period will begin on the enrollment date of each offering period and end on the next exercise date. If the fair market value of our common stock on the exercise date is less than the fair market value on the first trading day of the offering period, participants will be withdrawn from the then current offering period following their purchase of shares on the purchase date and automatically will be enrolled in the immediately following offering period. Participants may purchase shares of common stock through payroll deductions of up to
15%
of their eligible compensation, subject to purchase limits of the lesser of
1,500
shares during each six month purchase period or
$25,000
worth of stock for each calendar year in which an option is outstanding.
Stock-based Compensation
Stock-based compensation is based on the estimated fair value of awards, net of estimated forfeitures, and recognized over the requisite service period. Total stock-based compensation recognized for stock-based awards granted under the 2014 Plan, the 2008 Plan, and employee stock purchases under the 2014 Purchase Plan for the years ended December 31, 2014, 2013 and 2012 are as follows (in thousands):
|
|
Years Ended December 31,
|
||||||||||
|
|
2014
|
2013
|
2012
|
||||||||
|
Stock-based compensation by type of award:
|
|||||||||||
|
Stock options
|
$
|
5,852
|
|
$
|
4,282
|
|
$
|
2,540
|
|
||
|
Restricted stock units
|
3,217
|
|
—
|
|
—
|
|
|||||
|
Employee stock purchase plan
|
3,290
|
|
—
|
|
—
|
|
|||||
|
$
|
12,359
|
|
$
|
4,282
|
|
$
|
2,540
|
|
|||
|
Stock-based compensation by category of expense:
|
|||||||||||
|
Cost of revenue
|
$
|
1,063
|
|
$
|
162
|
|
$
|
87
|
|
||
|
Sales and marketing
|
5,829
|
|
2,228
|
|
1,316
|
|
|||||
|
Research and development
|
3,932
|
|
1,356
|
|
776
|
|
|||||
|
General and administrative
|
1,535
|
|
536
|
|
361
|
|
|||||
|
Total stock-based compensation
|
$
|
12,359
|
|
$
|
4,282
|
|
$
|
2,540
|
|
||
As of December 31, 2014, we had
$35.6 million
in unrecognized stock-based compensation expense, net of estimated forfeitures, related to stock options, unvested RSUs and MSUs and 2014 Stock Purchase Plan which will be recognized over a weighted-average period of
2.7 years
.
81
Determination of Fair Value
We use the Black-Scholes option pricing model to determine the grant date fair value of stock options and stock purchases and recognize stock-based compensation expense on a straight-line basis over the requisite service period.
The determination of the fair value on the date of grant is affected by the estimated underlying common stock price, as well as assumptions regarding a number of complex and subjective variables. These variables include expected stock price volatility over the term of the awards, actual and projected employee stock option exercise behaviors, risk-free interest rates, and expected dividends.
The fair value of each grant of stock options was determined using the Black-Scholes option pricing model and assumptions discussed below. Each of these inputs is subjective and generally requires significant judgment to determine.
•
Expected Term
.
We estimate the expected life of options based on an analysis of our historical experience of employee exercise and post-vesting termination behavior considered in relation to the contractual life of the option. The expected term for the Purchase Plan is based on the term of the purchase period.
•
Expected Volatility
.
We determined the share price volatility factor based on historical volatility of our peer group due to the limited trading history of our common stock.
•
Risk-Free Interest Rate
.
The risk-free interest rate is based on the U.S. Treasury yield curve in effect at the time of grant for zero coupon U.S. Treasury notes with maturities approximately equal to the expected terms of stock options and shares to be issued under the 2014 Purchase Plan.
•
Dividend Rate
.
The expected dividend was assumed to be zero as we have never paid dividends and have no current plans to do so.
Stock Options
The following table summarizes our stock option activity and related information as of and for the year ended
December 31, 2014
(in thousands, except for per share amounts):
|
|
Number of Shares Underlying Outstanding Options
|
Weighted-Average Exercise Price
|
Weighted-Average Remaining Contractual Term (Years)
|
Aggregate Intrinsic Value
|
|||||||||
|
Outstanding as of December 31, 2013
|
9,971
|
|
$
|
4.14
|
|
7.9
|
|
|
|||||
|
Granted
|
4,262
|
|
$
|
7.05
|
|
|
|
|
|||||
|
Exercised
|
(1,979
|
)
|
$
|
2.55
|
|
|
|
|
|||||
|
Canceled
|
(1,170
|
)
|
$
|
7.61
|
|
|
|
|
|||||
|
Outstanding as of December 31, 2014
|
11,084
|
|
$
|
5.18
|
|
7.9
|
$
|
8,098
|
|
||||
|
Vested and expected to vest as of December 31, 2014
|
10,413
|
|
$
|
5.11
|
|
7.8
|
$
|
8,093
|
|
||||
|
Vested and exercisable as of December 31, 2014
|
4,654
|
|
$
|
3.41
|
|
6.2
|
$
|
7,824
|
|
||||
The aggregate intrinsic value represents the difference between the closing stock price of our common stock on December 31, 2014 compared to the exercise price of the outstanding in-the-money options.
The following table provides information pertaining to our stock options for the year ended December 31, 2014, 2013 and 2012 (in thousands, except weighted-average fair values):
|
|
Years Ended December 31,
|
||||||||||
|
|
2014
|
2013
|
2012
|
||||||||
|
Total fair value of options granted
|
$
|
11,683
|
|
$
|
13,866
|
|
$
|
4,468
|
|
||
|
Weighted average fair value of options granted
|
$
|
2.79
|
|
$
|
3.28
|
|
$
|
1.96
|
|
||
|
Intrinsic value of options exercised
|
$
|
14,863
|
|
$
|
3,390
|
|
$
|
2,581
|
|
||
82
The estimated grant-date fair value of our equity-based awards issued to employees was calculated using the Black-Scholes option-pricing model, based on the following assumptions:
|
|
Years Ended December 31,
|
||||
|
2014
|
2013
|
2012
|
|||
|
Expected term (in years)
|
4.54-5.50
|
6.02-6.08
|
6.08
|
||
|
Risk-free interest rate
|
1.73%-1.83%
|
1.12%-1.76%
|
0.82 %-1.10%
|
||
|
Expected volatility
|
37.9%-47.0%
|
45.0%-47.0%
|
46%
|
||
|
Dividend rate
|
—%
|
—%
|
—%
|
||
Restricted Stock Units
We granted time-based restricted stock units ("RSUs") to our employees, directors and consultants and market performance-based restricted stock units ("MSUs") to certain executive officers during the year ended December 31, 2014.
Time-based Restricted Stock Units
A summary of RSU activities for the year ended December 31, 2014, is as follows (in thousands, except years and per share amounts):
|
|
Number of Shares
|
Weighted Average Grant Date Fair Value
|
Weighted Average Remaining Contractual Life
|
Aggregated Intrinsic Value
|
||||||||
|
Outstanding as of December 31, 2013
|
—
|
|
$
|
—
|
|
|||||||
|
Granted
|
2,540
|
|
$
|
9.05
|
|
|||||||
|
Released
|
—
|
|
$
|
—
|
|
|||||||
|
Canceled
|
(152
|
)
|
$
|
10.40
|
|
|||||||
|
Outstanding as of December 31, 2014
|
2,388
|
|
$
|
8.97
|
|
2.5
|
$
|
10,411
|
|
|||
The aggregate intrinsic value in the table above represents the total pre-tax intrinsic value (calculated by multiplying our closing stock price on the last trading day of 2014 by the number of nonvested RSUs) that would have been received by the unit holders had all RSUs been vested and released on December 31, 2014. This amount will fluctuate based on the fair market value of our stock.
Market Performance-based Restricted Stock Units
We granted
540,000
shares of MSUs to our executive officers during 2014, all of which were outstanding as of December 31, 2014. These MSUs will vest if the closing price of our common stock remains above certain predetermined target prices for 20 consecutive trading days within a 4-year period.
The following weighted-average assumptions used in the Monte Carlo simulation were as follows:
|
|
Year Ended December 31, 2014
|
|
Expected term (in years)
|
2.82
|
|
Risk-free interest rate
|
1.40%
|
|
Expected volatility
|
36.2%
|
|
Dividend rate
|
—%
|
83
The estimated the fair value of these market-based units was
$0.58
-
$1.41
using a Monte Carlo simulation model with the assumptions discussed above. The total aggregated intrinsic value for the MSUs granted was
$2.4 million
, which represents the total pre-tax intrinsic value (calculated by multiplying our closing stock price on the last trading day of 2014 by the number of non-vested MSUs) that would have been received by the unit holders had all MSUs vested and been released on December 31, 2014. This amount will fluctuate based on the fair market value of our stock. No MSUs were vested or released during 2014.
Employee Stock Purchase Plan
The fair value of the option component of the 2014 Purchase Plan shares was estimated at the grant date using the Black-Scholes option pricing model with the following weighted average assumptions:
|
|
Year Ended December 31, 2014
|
|
Expected term (in years)
|
1.3
|
|
Risk-free interest rate
|
0.26%
|
|
Expected volatility
|
27.4%
|
|
Dividend rate
|
—%
|
8. Net Income Per Share Available (Loss Attributable) To Common Stockholders
Prior to our IPO in March 2014, basic and diluted net loss per common share are computed using the two-class method required for participating securities. Concurrent with the closing of the IPO, all shares of outstanding preferred stock converted into
39,997,114
shares of our common stock. Following the date of the IPO, the two-class method was no longer required. As of December 31, 2014, we have one outstanding class of securities.
Prior to the conversion of the preferred stock, holders of Series A, Series B, Series C and Series D preferred stock were entitled to receive noncumulative dividends at the annual rates of
$0.045
,
$0.0765
,
$0.11169
and
$60
per share per annum payable prior and in preference to any dividends on shares of our common stock. In the event a dividend is paid on our common stock, our preferred stockholders are entitled to a share of that dividend in proportion to the holders of common shares on an as-if converted basis. Series A, Series B, Series C and Series D preferred stock are considered participating securities. In accordance with the two-class method, earnings allocated to participating securities, which include contractual participation rights in undistributed earnings, have been excluded from the computation of basic and diluted net income per share available (loss attributable) to common stockholders. Holders of participating securities do not have a contractual obligation to share in our losses. As such, for the periods we incur net losses, there is no impact on our calculated net loss per share attributable to common stockholders in applying the two-class method. Accretion of our redeemable convertible preferred stock dividend is excluded from income attributable to common stockholders.
Under the two-class method, net income available (loss attributable) to common stockholders is determined by allocating undistributed earnings, calculated as net income per share available (loss attributable) to common stockholders less current period Series A, Series B, Series C and Series D preferred stock non-cumulative dividends, among our common stock and participating securities. In computing diluted net income per share available (loss attributable) to common stockholders, undistributed earnings are re-allocated to reflect the potential impact of dilutive securities. Basic net income per share available (loss attributable) to common stockholders is computed by dividing the net income per share available (loss attributable) to common stockholders by the weighted-average number of common shares outstanding during the period. Diluted net income per share available (loss attributable) to common stockholders is computed by dividing the net income per share available (loss attributable) to common stockholders by the weighted-average number of common shares outstanding, including potential dilutive common shares assuming the dilutive effect of outstanding stock options using the treasury stock method. For purposes of this calculation, participating securities, stock options to purchase common stock and warrants to purchase convertible preferred stock are considered to be common stock equivalents and are excluded from the calculation of diluted net income per share available (loss attributable) to common stockholders if their effect is antidilutive.
Basic net income (loss) per share of common stock is computed by dividing net income (loss) by the weighted average number of shares of common stock outstanding for the period. Diluted net income per share of common stock is computed using the weighted average number of shares of common stock outstanding plus the effect of common stock equivalents, unless the common stock equivalents are anti-dilutive. Potential dilutive common stock includes stock options and restricted stock
84
units. Since we had net losses in the years ended December 31, 2014, 2013 and 2012, none of the stock options and restricted stock units were included in the computation of diluted shares for these periods, as inclusion of such shares would have been anti-dilutive.
The following table summarizes the incremental shares of common stock from potentially dilutive securities, calculated using the treasury stock method (in thousands, except for per share data):
|
Years Ended December 31,
|
|||||||||||
|
2014
|
2013
|
2012
|
|||||||||
|
Basic and diluted net loss per share attributable to common stockholders
|
|||||||||||
|
Numerator:
|
|||||||||||
|
Net loss attributable to common stockholders
|
$
|
(35,870
|
)
|
$
|
(29,078
|
)
|
$
|
(90,150
|
)
|
||
|
Denominator:
|
|||||||||||
|
Weighted-average shares outstanding - basic
|
48,682
|
|
9,262
|
|
8,344
|
|
|||||
|
Effect of dilutive potential common shares
|
—
|
|
—
|
|
—
|
|
|||||
|
Weighted-average shares outstanding - diluted
|
48,682
|
|
9,262
|
|
8,344
|
|
|||||
|
Net loss per share attributable to common stockholders:
|
|||||||||||
|
Basic and diluted
|
$
|
(0.74
|
)
|
$
|
(3.14
|
)
|
$
|
(10.80
|
)
|
||
The following weighted average outstanding shares of common stock equivalents were excluded from the computation of diluted net loss per share for the periods presented because including them would have been antidilutive (in thousands):
|
|
Years Ended December 31,
|
|||||||
|
|
2014
|
2013
|
2012
|
|||||
|
Redeemable convertible preferred stock and convertible preferred stock (on an as if converted basis)
|
—
|
|
34,462
|
|
30,112
|
|
||
|
Stock options, restricted stock units and employee stock purchase plan
|
6,415
|
|
8,498
|
|
6,932
|
|
||
|
Common stock subject to repurchase
|
196
|
|
341
|
|
474
|
|
||
|
Convertible preferred stock warrants
|
—
|
|
44
|
|
461
|
|
||
|
|
6,611
|
|
43,345
|
|
37,979
|
|
||
85
9. Income Taxes
The geographical breakdown of income (loss) before provision for income taxes is as follows (in thousands):
|
Years Ended December 31,
|
|||||||||||
|
2014
|
2013
|
2012
|
|||||||||
|
Domestic loss
|
$
|
(35,593
|
)
|
$
|
(28,313
|
)
|
$
|
(90,694
|
)
|
||
|
Foreign income
|
2,380
|
|
1,857
|
|
1,302
|
|
|||||
|
Loss before provisions for income taxes
|
$
|
(33,213
|
)
|
$
|
(26,456
|
)
|
$
|
(89,392
|
)
|
||
The provision for income taxes for the years ended December 31, 2014, 2013 and 2012 consists of the following (in thousands):
|
Years Ended December 31,
|
|||||||||||
|
2014
|
2013
|
2012
|
|||||||||
|
Current provision for income taxes:
|
|||||||||||
|
State
|
$
|
24
|
|
$
|
33
|
|
$
|
37
|
|
||
|
Foreign
|
1,054
|
|
599
|
|
736
|
|
|||||
|
Total current
|
1,078
|
|
632
|
|
773
|
|
|||||
|
Deferred tax benefits:
|
|||||||||||
|
Foreign
|
429
|
|
8
|
|
(15
|
)
|
|||||
|
Total deferred
|
429
|
|
8
|
|
(15
|
)
|
|||||
|
Provision for income taxes
|
$
|
1,507
|
|
$
|
640
|
|
$
|
758
|
|
||
The reconciliation of the statutory federal income tax and our effective income tax is as follows (in thousands):
|
Years Ended December 31,
|
|||||||||||
|
2014
|
2013
|
2012
|
|||||||||
|
Tax at statutory rate
|
$
|
(11,292
|
)
|
$
|
(8,995
|
)
|
$
|
(30,393
|
)
|
||
|
State tax - Net of federal benefits
|
16
|
|
22
|
|
24
|
|
|||||
|
Foreign rate differential
|
231
|
|
(115
|
)
|
199
|
|
|||||
|
Changes in valuation allowance
|
10,547
|
|
8,051
|
|
29,649
|
|
|||||
|
Stock compensation
|
1,041
|
|
1,230
|
|
751
|
|
|||||
|
Other permanent items
|
513
|
|
346
|
|
448
|
|
|||||
|
Expenses for uncertain tax positions
|
330
|
|
90
|
|
86
|
|
|||||
|
Other
|
121
|
|
11
|
|
(6
|
)
|
|||||
|
Provision for income taxes
|
$
|
1,507
|
|
$
|
640
|
|
$
|
758
|
|
||
86
The tax effects of temporary differences that give rise to significant portions of deferred tax assets (liabilities) are as follows (in thousands):
|
As of December 31,
|
|||||||
|
2014
|
2013
|
||||||
|
Deferred tax assets:
|
|||||||
|
Net operating loss carryforwards
|
$
|
41,941
|
|
$
|
35,898
|
|
|
|
Research and development credits, net of uncertain tax positions
|
7,064
|
|
5,445
|
|
|||
|
Accruals, reserves, and other
|
12,526
|
|
10,047
|
|
|||
|
Stock-based compensation
|
1,585
|
|
222
|
|
|||
|
Depreciation and amortization
|
2,379
|
|
1,099
|
|
|||
|
Gross deferred tax assets
|
65,495
|
|
52,711
|
|
|||
|
Valuation allowance
|
(63,620
|
)
|
(52,413
|
)
|
|||
|
Total deferred tax assets
|
1,875
|
|
298
|
|
|||
|
Deferred tax liabilities:
|
|||||||
|
Others
|
(1,167
|
)
|
(19
|
)
|
|||
|
Total deferred tax liabilities
|
(1,167
|
)
|
(19
|
)
|
|||
|
Net deferred tax assets
|
$
|
708
|
|
$
|
279
|
|
|
Recognition of deferred tax assets is appropriate when realization of these assets is more likely than not. Based upon the weight of available evidence, which includes our historical operating performance and the recorded cumulative net losses in prior fiscal periods, we recorded a full valuation allowance of
$63.6 million
and
$52.4 million
against the net U.S. deferred tax assets as of December 31, 2014 and 2013. The net valuation allowance increased by
$32.9 million
for the year ended December 31, 2012, increased by
$10.4 million
for the year ended December 31, 2013, and increased by
$11.2 million
for the year ended December 31, 2014.
As of December 31, 2014 and 2013, we had U.S. federal net operating loss carryforwards of
$117.1 million
and
$96.3 million
and state net operating loss carryforwards of
$62.6 million
and
$56.8 million
. We track the portion of our net operating loss attributable to stock option benefits in accordance with ASC 718, therefore, these amounts are no longer included in our gross or net deferred tax assets. The gross tax benefit of stock options total
$4.8 million
at December 31, 2014, and will only be recorded to additional paid in capital when they reduce cash taxes payable.
The federal net operating loss carryforwards will expire at various dates beginning in the year ending
December 31, 2026
, if not utilized. The state net operating loss carryforwards will expire at various dates beginning in the year ending
December 31, 2016
, if not utilized.
Additionally, as of December 31, 2014 and 2013, we had U.S. federal research and development credit carryforwards of
$4.9 million
and
$3.9 million
and state research and development credit carryforwards of
$4.6 million
and
$3.4 million
. The federal credit carryforwards will begin to expire at various dates beginning in
2026
while the state credit carryforwards can be carried over indefinitely.
Utilization of the net operating losses and credit carryforwards may be subject to an annual limitation provided for in the Internal Revenue Code and similar state codes. Any annual limitation could result in the expiration of net operating loss and credit carryforwards before utilization.
Our policy with respect to our undistributed foreign subsidiaries' earnings is to consider those earnings to be indefinitely reinvested and, accordingly, no related provision for U.S. federal and state income taxes has been provided. Upon distribution of those earnings' in the form of dividends or otherwise, we may be subject to both U.S. income taxes (subject to an adjustment for foreign tax credits and withholding taxes in the various countries. As of December 31, 2014 and 2013, the undistributed earnings approximated
$1.8 million
and
$1.3 million
. The determination of the future tax consequence of the remittance of these earnings is not practicable.
87
Uncertain Tax Positions
As of December 31, 2014 and 2013, we had gross unrecognized tax benefits of
$2.2 million
and
$1.8 million
, none of which would materially impact the effective tax rate if realized during the year due to our full valuation allowance position. We have accrued interest of
$7,500
related to unrecognized tax benefits reflected in the consolidated financial statements for the year ended December 31, 2014. Our policy for classifying interest and penalties associated with unrecognized income tax benefits is to include such items in income tax expense.
The activity related to the unrecognized tax benefits is as follows (in thousands):
|
Years Ended December 31,
|
|||||||||||
|
2014
|
2013
|
2012
|
|||||||||
|
Gross unrecognized tax benefits—beginning balance
|
$
|
1,846
|
|
$
|
1,463
|
|
$
|
1,348
|
|
||
|
Increases related to tax positions from prior years
|
340
|
|
—
|
|
—
|
|
|||||
|
Increases related to tax positions taken during current year
|
278
|
|
383
|
|
115
|
|
|||||
|
Decreases related to tax positions taken during the current year
|
(269
|
)
|
—
|
|
—
|
|
|||||
|
Gross unrecognized tax benefits—ending balance
|
$
|
2,195
|
|
$
|
1,846
|
|
$
|
1,463
|
|
||
These amounts are related to certain deferred tax assets with a corresponding valuation allowance. If recognized, the impact on our effective tax rate would not be material due to the full valuation allowance.
We believe that there will not be any significant changes in our unrecognized tax benefits in the next 12 months.
We are subject to taxation in the United States, various states, and several foreign jurisdictions. All tax years remain open and are subject to examinations by the appropriate governmental agencies in all of the jurisdictions where we file tax returns. We are not currently under examination in any major jurisdiction.
10. Segment Information
Operating segments are defined as components of an enterprise about which separate financial information is available that is evaluated regularly by the chief operating decision maker, or decision making group, in deciding how to allocate resources and in assessing performance. Our chief operating decision maker is our Chief Executive Officer who reviews financial information presented on a consolidated basis, accompanied by disaggregated information about revenue by geographic region for purposes of allocating resources and evaluating financial performance. Accordingly, we have a single reportable segment and operating segment structure.
The following table represents revenue by geographic areas based on customers' location, as determined by their ship to addresses (in thousands):
|
|
Years Ended December 31,
|
||||||||||
|
|
2014
|
2013
|
2012
|
||||||||
|
United States
|
$
|
85,325
|
|
$
|
68,127
|
|
$
|
43,389
|
|
||
|
Japan
|
45,787
|
|
39,581
|
|
58,653
|
|
|||||
|
Asia Pacific, excluding Japan
|
20,434
|
|
15,052
|
|
10,315
|
|
|||||
|
EMEA
|
19,254
|
|
12,087
|
|
6,469
|
|
|||||
|
Other
|
8,707
|
|
6,891
|
|
1,240
|
|
|||||
|
Total revenue
|
$
|
179,507
|
|
$
|
141,738
|
|
$
|
120,066
|
|
||
No other country outside of the United States and Japan comprised
10%
or greater of our revenue for the years ended
December 31, 2014
,
2013
and 2012.
88
Geographical information relating to our long-lived assets which include property and equipment, net and intangible assets, net as of December 31, 2014 and 2013 was as follows (in thousands):
|
As of December 31,
|
|||||||
|
|
2014
|
2013
|
|||||
|
United States
|
$
|
9,702
|
|
$
|
8,599
|
|
|
|
Japan
|
247
|
|
572
|
|
|||
|
Asia Pacific, excluding Japan
|
1,724
|
|
1,657
|
|
|||
|
EMEA
|
104
|
|
34
|
|
|||
|
Total property and equipment, net and intangible assets, net
|
$
|
11,777
|
|
$
|
10,862
|
|
|
11. Related-Party Transactions
An affiliate of one of our significant stockholders is also acting as a reseller of our products. During the years ended December 31, 2014, 2013 and 2012, we recognized
$2.8 million
,
$4.4 million
and
$5.4 million
total revenue from this reseller.
We had gross accounts receivable of
$0.4 million
and
$0.1 million
from this reseller as of December 31, 2014 and 2013.
89
ITEM
9. CHANGES IN AND DISAGREEMENTS WITH ACCOUNTANTS ON ACCOUNTING AND FINANCIAL DISCLOSURE
Not applicable.
ITEM
9A. CONTROLS AND PROCEDURES
Evaluation of Disclosure Controls and Procedures
Management, with the participation of our Chief Executive Officer and Chief Financial Officer, has evaluated the effectiveness of our disclosure controls and procedures, as required by Rule 13a-15(b) under the Securities Exchange Act of 1934 as of December 31, 2014. Based upon that evaluation, our Chief Executive Officer and Chief Financial Officer concluded that due to the material weakness in our internal control over financial reporting as described below in Management’s Report on Internal Control over Financial Reporting; our disclosure controls and procedures were not effective as of December 31, 2014 solely
as a result of the computation of share based compensation associated with our Employee Stock Purchase Plan as described below.
Material Weakness in Internal Control over Financial Reporting
The material weakness identified in internal control over financial reporting at December 31, 2014 related to the incorrect methodology used to compute share-based compensation associated with our Employee Stock Purchase Plan for the fourth quarter of 2014, which resulted in a material adjustment to decrease share-based compensation in our fourth quarter ended December 31, 2014. The adjustment did not result in a restatement as the error was identified before financial information was published.
Management's Remediation Activities
With the oversight of management and our audit committee, we intend to address the underlying causes of the material weakness in the immediate future, primarily through the implementation of new processes and procedures that will enhance internal controls around computation of shared based compensation related to our Employee Stock Purchase Plan.
We plan to remediate all of the control deficiencies underlying this material weakness during 2015. As we continue to evaluate and work to improve internal control over financial reporting, we may determine to take additional measures to address the material weakness.
Management’s Report on Internal Control over Financial Reporting
This annual report does not include a report of management's assessment regarding internal control over financial reporting or an attestation report of the company's registered public accounting firm due to a transition period established by rules of the Securities and Exchange Commission for newly public companies.
Changes in Internal Control over Financial Reporting
There were no changes in our internal control over financial reporting identified in connection with the evaluation required by Rule 13a-15(d) and 15d-15(d) of the Securities and Exchange Act of 1934, as amended, that occurred during the quarter ended December 31, 2014 that have materially affected, or are reasonably likely to materially affect, our internal control over financial reporting.
90
ITEM
9B. OTHER INFORMATION
None.
The information required by this item will be included under the captions “
“Executive Officers,”
Executive Compensation,” “Election of Directors,” “Report of the Audit Committee” and “Section 16(a) Beneficial Ownership Reporting Compliance” for the 2015 Annual Meeting in our Proxy Statement with the SEC within 120 days of the year-end December 31, 2014 (2015 Proxy Statement) and is incorporated herein by reference.
The information required by this item will be set forth in our 2015 Proxy Statement under the captions “Executive Compensation” and “Report of the Compensation Committee on Executive Compensation” and is incorporated herein by reference.
Information related to the security ownership of certain beneficial owners and management will be set forth in our 2015 Proxy Statement under the caption “Security Ownership of Management and Principal Stockholders,” and is incorporated herein by reference.
The information required by this item will be set forth in our 2015 Proxy Statement under the caption “Certain Relationships and Related Transactions, and Director Independence” and is incorporated herein by reference.
The information required by this item will be set forth in our 2015 Proxy Statement under the captions “Audit and Related Fees” and “Policy on Audit Committee Pre-Approval of Audit and Permissible Non-Audit Services of Independent Auditors” and is incorporated herein by reference.
91
(a) Financial Statements
|
1.
|
Consolidated Financial Statements:
|
|
Our Consolidated Financial Statements are listed in the “Index to Consolidated Financial Statements” in Part II, Item 8 of this Annual Report on Form 10-K.
|
|
|
All other schedules have been omitted as they are not required, not applicable, or the required information is otherwise included.
|
|
|
2.
|
Exhibits:
|
|
The documents listed in the Exhibit Index of this Annual Report on Form 10-K are incorporated by reference or are filed with this report, in each case as indicated therein (numbered in accordance with Item 601 of Regulation S-K).
|
|
92
SIGNATURES
Pursuant to the requirements of Section 13 or 15(d) of the Securities Exchange Act of 1934, the Registrant has duly caused this report to be signed on its behalf by the undersigned, thereunto duly authorized.
|
A10 NETWORKS, INC.
|
|
Date:
March 10, 2015
|
By: /s/ Lee Chen
|
|
|
Lee Chen
|
|
|
Chief Executive Officer and President
(Principal Executive Officer)
|
|
Pursuant to the requirements of the Securities Exchange Act of 1934, this annual report on Form 10-K has been signed below by the following persons on behalf of the Registrant and in the capacities and on the date indicated.
|
Signature
|
Title
|
Date
|
||
|
/s/ Lee Chen
|
Chief Executive Officer, President and Director
|
March 10, 2015
|
||
|
Lee Chen
|
(Principal Executive Officer)
|
|||
|
/s/ Greg Straughn
|
Chief Financial Officer
|
March 10, 2015
|
||
|
Greg Straughn
|
(Principal Accounting and Financial Officer)
|
|||
|
/s/ Robert Cochran
|
Vice President, Legal and Corporate Collaboration
|
March 10, 2015
|
||
|
Robert Cochran
|
and Secretary and Director
|
|||
|
/s/ Peter Y. Chung
|
Director
|
March 10, 2015
|
||
|
Peter Y. Chung
|
||||
|
/s/ Alan S. Henricks
|
Director
|
March 10, 2015
|
||
|
Alan S. Henricks
|
||||
|
/s/ Phillip J. Salsbury
|
Director
|
March 10, 2015
|
||
|
Phillip J. Salsbury
|
||||
93
EXHIBIT INDEX
|
Exhibit
Number |
Incorporated By Reference
|
|||||||||
|
Description
|
Form
|
File No,
|
Exhibit
|
File Date
|
||||||
|
3.1
|
Amended and Restated Certificate of Incorporation of the Registrant
|
S-1/A
|
333-194015
|
3.1
|
March 10, 2014
|
|||||
|
3.2
|
Amended and Restated Bylaws of the Registrant
|
S-1/A
|
333-194015
|
3.2
|
March 10, 2014
|
|||||
|
4.1
|
Form of common stock certificate of the Registrant.
|
S-1/A
|
333-194015
|
4.1
|
March 10, 2014
|
|||||
|
4.2
|
Amended and Restated Investors’ Rights Agreement among the Registrant and certain holders of its capital stock, amended as of October 4, 2013.
|
S-1/A
|
333-194015
|
4.2
|
March 10, 2014
|
|||||
|
10.1*
|
Form of Indemnification Agreement between the Registrant and each of its directors and executive officers
|
S-1/A
|
333-194015
|
10.1
|
March 10, 2014
|
|||||
|
10.2*
|
2004 Stock Plan and forms of agreements thereunder
|
10-Q
|
001-36343
|
10.1
|
May 13, 2014
|
|||||
|
10.3*
|
2008 Stock Plan and forms of agreements thereunder
|
10-Q
|
001-36343
|
10.2
|
May 13, 2014
|
|||||
|
10.4*
|
2014 Equity Incentive Plan and forms of agreements thereunder
|
10-Q
|
001-36343
|
10.3
|
May 13, 2014
|
|||||
|
10.5*
|
2014 Equity Stock Purchase Plan and forms of agreements thereunder
|
S-1/A
|
333-194015
|
10.5
|
March 10, 2014
|
|||||
|
10.6*
|
Form of Stock Option Agreement pursuant to the 2008 Stock Plan
|
10-Q
|
001-36343
|
10.2
|
August 4, 2014
|
|||||
|
10.7*
|
Form of Stock Option Agreement- Early Exercise pursuant to the 2008 Stock Plan
|
10-Q
|
001-36343
|
10.3
|
August 4, 2014
|
|||||
|
10.8*
|
Form of Stock Option Agreement pursuant to the 2014 Equity Incentive Plan
|
10-Q
|
001-36343
|
10.4
|
August 4, 2014
|
|||||
|
10.9*
|
Form of Restricted Stock Unit Agreement pursuant to the 2014 Equity Incentive Plan
|
10-Q
|
001-36343
|
10.5
|
August 4, 2014
|
|||||
|
10.10*
|
Offer Letter, dated July 30, 2004, by and between the Registrant and Lee Chen.
|
S-1/A
|
333-194015
|
10.6
|
March 10, 2014
|
|||||
|
10.11*
|
Offer Letter, dated November 3, 2008, by and between the Registrant and Rajkumar Jalan.
|
S-1/A
|
333-194015
|
10.7
|
March 10, 2014
|
|||||
|
10.12*
|
Offer Letter, dated May 31, 2011, by and between the Registrant and Greg Straughn.
|
S-1/A
|
333-194015
|
10.8
|
March 10, 2014
|
|||||
|
10.13*
|
Offer Letter, dated January 4, 2012, by and between the Registrant and Robert Cochran.
|
S-1/A
|
333-194015
|
10.9
|
March 10, 2014
|
|||||
|
10.14*
|
Offer Letter, dated July 18, 2013, by and between the Registrant and Ray Smets.
|
S-1/A
|
333-194015
|
10.10
|
March 10, 2014
|
|||||
|
10.15*
|
Offer Letter, dated August 28, 2013, by and between the Registrant and Jason Matlof.
|
S-1/A
|
333-194015
|
10.11
|
March 10, 2014
|
|||||
|
10.16
|
Reseller Agreement, dated April 2, 2009, by and between the Registrant and NEC Corporation.
|
S-1/A
|
333-194015
|
10.12
|
February 18, 2014
|
|||||
|
10.17
|
First Amendment to Reseller Agreement, dated May 19, 2011, by and between the Registrant and NEC Corporation.
|
S-1/A
|
333-194015
|
10.13
|
February 18, 2014
|
|||||
|
10.18
|
Second Amendment to Reseller Agreement, dated April 1, 2011, by and between the Registrant and NEC Corporation.
|
S-1/A
|
333-194015
|
10.14
|
February 18, 2014
|
|||||
|
10.19
|
Third Amendment to Reseller Agreement, dated April 1, 2011, by and between the Registrant and NEC Corporation.
|
S-1/A
|
333-194015
|
10.15
|
February 18, 2014
|
|||||
|
10.20
|
Fourth Amendment to Reseller Agreement, dated October 3, 2011, by and between the Registrant and NEC Corporation.
|
S-1/A
|
333-194015
|
10.16
|
February 18, 2014
|
|||||
|
10.21
|
Fifth Amendment to Reseller Agreement, dated April 2, 2012, by and between the Registrant and NEC Corporation.
|
S-1/A
|
333-194015
|
10.17
|
February 18, 2014
|
|||||
94
|
Exhibit
Number |
Incorporated By Reference
|
|||||||||
|
Description
|
Form
|
File No,
|
Exhibit
|
File Date
|
||||||
|
10.22
|
Sixth Amendment to Reseller Agreement, dated November 29, 2012, by and between the Registrant and NEC Corporation.
|
S-1/A
|
333-194015
|
10.18
|
February 18, 2014
|
|||||
|
10.23
|
Seventh Amendment to Reseller Agreement, dated April 9, 2013, by and between the Registrant and NEC Corporation.
|
S-1/A
|
333-194015
|
10.19
|
February 18, 2014
|
|||||
|
10.24
|
Eighth Amendment to Reseller Agreement, dated October 22, 2013, by and between the Registrant and NEC Corporation.
|
S-1/A
|
333-194015
|
10.20
|
February 18, 2014
|
|||||
|
10.25
|
Ninth Amendment to Reseller Agreement, executed on April 22, 2014, by and between the Registrant and NEC Corporation
|
10-Q
|
001-36343
|
10.1
|
August 4, 2014
|
|||||
|
10.26
|
Manufacturing Services Agreement, dated December 8, 2006, by and between the Registrant and Lanner Electronics (USA).
|
S-1/A
|
333-194015
|
10.21
|
February 18, 2014
|
|||||
|
10.27
|
Amendment No. 1 to Manufacturing Services Agreement, dated June 27, 2013, by and between the Registrant and Lanner Electronics (USA).
|
S-1/A
|
333-194015
|
10.22
|
February 18, 2014
|
|||||
|
10.28
|
Contract Manufacturer Agreement, dated July 1, 2008, by and between the Registrant and AEWIN Technologies, Inc.
|
S-1/A
|
333-194015
|
10.23
|
February 18, 2014
|
|||||
|
10.29
|
Credit Agreement, dated as of September 30, 2013, among the Registrant, Royal Bank of Canada, as lender and administrative agent, and JPMorgan Chase Bank, N.A., and Bank of America, N.A., as lenders.
|
S-1/A
|
333-194015
|
10.24
|
March 10, 2014
|
|||||
|
10.30*
|
Form of Change in Control and Severance Agreement.
|
S-1/A
|
333-194015
|
10.25
|
March 10, 2014
|
|||||
|
10.31
|
||||||||||
|
21.1
|
|
|
|
|
||||||
|
23.1
|
||||||||||
|
31.1
|
||||||||||
|
31.2
|
||||||||||
|
32.1 **
|
||||||||||
|
32.2 **
|
||||||||||
|
101.INS
|
XBRL Instance Document.
|
|||||||||
|
101.SCH
|
XBRL Taxonomy Extension Schema Document.
|
|||||||||
|
101.CAL
|
XBRL Taxonomy Extension Calculation Linkbase Document.
|
|||||||||
|
101.DEF
|
XBRL Taxonomy Extension Definition Linkbase Document.
|
|||||||||
|
101.LAB
|
XBRL Taxonomy Extension Label Linkbase Document.
|
|||||||||
|
101.PRE
|
XBRL Taxonomy Extension Presentation Linkbase Document.
|
|||||||||
|
*
|
Indicates a management contract or compensatory plan.
|
|
**
|
The certifications attached as Exhibit 32.1 and 32.2 that accompany this Annual Report on Form 10‑K are not deemed filed with the Securities and Exchange Commission and are not to be incorporated by reference into any filing of A10 Networks, Inc. under the Securities Act of 1933, as amended, or the Securities Exchange Act of 1934, as amended, whether made before or after the date of this Annual Report on Form 10‑K, irrespective of any general incorporation language contained in such filing.
|
95
TABLE OF CONTENTS
Part IItem 1A. Risk FactorsItem 1B. Unresolved Staff CommentsItem 2. PropertiesItem 3. Legal ProceedingsItem 4. Mine Safety DisclosuresPart IIItem 5. Market For Registrant's Common Equity, Related Stockholder Matters and Issuer Purchases Of Equity SecuritiesItem 6. Selected Financial DataItem 7. Management S Discussion and Analysis Of Financial Condition and Results Of OperationsItem 8 Financial Statements and Supplemental DataItem 7A. Quantitative and Qualitative Disclosures About Market RiskItem 8. Financial Statements and Supplemental DataItem 9. Changes in and Disagreements with Accountants on Accounting and Financial DisclosureItem 9A. Controls and ProceduresItem 9B. Other InformationPart IIIItem 10. Directors, Executive Officers and Corporate GovernanceItem 11. Executive CompensationItem 12. Security Ownership Of Certain Beneficial Owners and Management and Related Stockholder MattersItem 13. Certain Relationships and Related Transactions, and Director IndependenceItem 14. Principal Accountant Fees and ServicesPart IVItem 15. Exhibits and Financial Statement Schedules