ALLEGHENY TECHNOLOGIES INC
10-Ks and 10-Qs
|
|
|
|
|
|
|
|
|
|
|
|
|
|
|
|
|
|
|
|
|
|
|
|
|
|
|
|
|
|
|
|
|
|
|
|
|
|
|
|
|
|
|
|
|
|
|
|
|
|
|
|
|
|
|
|
UNITED STATES SECURITIES AND EXCHANGE COMMISSION
Washington, D.C. 20549
FORM 10-K
(Mark One)
|
x
|
Annual report pursuant to Section 13 or 15(d) of the Securities Exchange Act of 1934
|
For the fiscal year ended
December 31, 2014
OR
|
¨
|
Transition report pursuant to Section 13 or 15(d) of the Securities Exchange Act of 1934
|
For the transition period from
to
Commission file number 1-12001
ALLEGHENY TECHNOLOGIES INCORPORATED
(Exact name of registrant as specified in its charter)
|
Delaware
|
|
25-1792394
|
|
(State or other jurisdiction of
incorporation or organization)
|
|
(I.R.S. Employer
Identification Number)
|
|
1000 Six PPG Place, Pittsburgh, Pennsylvania
|
|
15222-5479
|
|
(Address of principal executive offices)
|
|
(Zip Code)
|
Registrant’s telephone number, including area code: (412) 394-2800
Securities registered pursuant to Section 12(b) of the Act:
|
Title of each class
|
|
Name of each exchange on which registered
|
|
Common Stock, $0.10 Par Value
|
|
New York Stock Exchange
|
Securities registered pursuant to Section 12(g) of the Act: None
Indicate by check mark whether the Registrant is well known seasoned issuer, as defined in Rule 405 of the Securities Act. Yes
x
No
¨
Indicate by check mark if the Registrant is not required to file reports pursuant to Section 13 or Section 15(d) of the Act. Yes
¨
No
x
Indicate by check mark whether the Registrant (1) has filed all reports required to be filed by Section 13 or 15(d) of the Securities Exchange Act of 1934 during the preceding 12 months, and (2) has been subject to such filing requirements for the past 90 days. Yes
x
No
¨
Indicate by check mark whether the Registrant has submitted electronically and posted on its corporate Website, if any, every Interactive Data File required to be submitted and posted pursuant to Rule 405 of Regulation S-T (§ 232.405 of this chapter) during the preceding 12 months (or for such shorter period that the registrant was required to submit and post such files). Yes
x
No
¨
Indicate by check mark if disclosure of delinquent filers pursuant to Item 405 of Regulation S-K is not contained herein, and will not be contained, to the best of Registrant’s knowledge, in definitive proxy or information statements incorporated by reference in Part III of this Form 10-K or any amendment to this Form 10-K.
x
Indicate by check mark whether the registrant is a large accelerated filer, an accelerated filer, a non-accelerated filer, or a smaller reporting company. See definitions of “large accelerated filer,” “accelerated filer” and “smaller reporting company” in Rule 12b-2 of the Exchange Act. (Check one):
|
Large accelerated filer
|
|
x
|
|
Accelerated filer
|
|
¨
|
|
Non-accelerated filer
|
|
¨
(Do not check if a smaller reporting company)
|
|
Smaller reporting company
|
|
¨
|
Indicate by check mark whether the Registrant is a shell company (as defined in Rule 12b-2 of the Exchange Act). Yes
¨
No
x
On February 13, 2015, the Registrant had outstanding 108,629,452 shares of its Common Stock.
The aggregate market value of the Registrant’s voting stock held by non-affiliates at June 30, 2014 was approximately $4.9 billion, based on the closing price per share of Common Stock on June 30, 2014 of $45.10 as reported on the New York Stock Exchange. Shares of Common Stock known by the Registrant to be beneficially owned by directors and officers of the Registrant subject to the reporting and other requirements of Section 16 of the Securities Exchange Act of 1934, as amended (the “Exchange Act”), are not included in the computation. The Registrant, however, has made no determination that such persons are “affiliates” within the meaning of Rule 12b-2 under the Exchange Act.
Documents Incorporated By Reference
Selected portions of the Proxy Statement for the Annual Meeting of Stockholders to be held on May 1, 2015 are incorporated by reference into Part III of this Report.
1
INDEX
|
|
Page
Number
|
2
The Company
Allegheny Technologies Incorporated (ATI) is a Delaware corporation with its principal executive offices located at 1000 Six PPG Place, Pittsburgh, Pennsylvania 15222-5479, telephone number (412) 394-2800, Internet website address http://www.atimetals.com. References to “Allegheny Technologies,” “ATI,” the “Company,” the “Registrant,” “we,” “our” and “us” and similar terms mean Allegheny Technologies Incorporated and its subsidiaries, unless the context otherwise requires.
Our Business
We are one of the largest and most diversified specialty materials and components producers in the world. Our high-value products include titanium and titanium alloys, nickel-based alloys and specialty steels, precision forgings, castings and machined components, zirconium and related alloys, precision and engineered stainless steel strip, and grain-oriented electrical steel. Our standard products include specialty stainless sheet, stainless steel sheet, and stainless steel plate. Our specialty materials are produced in a wide range of alloys and product forms and are selected for use in applications that demand materials having exceptional hardness, toughness, strength, resistance to heat, corrosion or abrasion, or a combination of these characteristics. ATI is a fully integrated supplier from raw material (for titanium sponge) and melt (for other specialty alloy systems) through highly engineered finished components.
ATI’s strategic vision is to be an aligned and integrated specialty materials and components company. In connection with this initiative, in the first quarter of 2014, the High Performance Metals segment was renamed the High Performance Materials & Components segment. Individual business unit names within each segment were also changed to reflect their aligned and integrated product focus. There was no change to the business units that comprise each business segment or the manner in which resources are allocated and performance is assessed for the business units by management. Therefore, there was no change to business segment reporting as a result of this initiative.
In 2014, we acquired two businesses in our High Performance Materials & Components segment to expand our value-added capabilities to provide components and near-net shape parts. ATI Flowform Products, acquired in February 2014, uses precision flowforming process technologies to produce thin-walled components in net or near-net shapes across multiple alloy systems, including nickel-based alloys and superalloys, titanium and titanium alloys, zirconium alloys, and specialty and stainless alloys. This acquisition expands ATI’s capabilities to produce specialty materials parts and components, primarily in the aerospace and defense, and oil & gas/chemical process industry markets. ATI Cast Products Salem Operations, acquired in June 2014, performs precision machining on parts and components made from titanium alloys, nickel-based alloys and superalloys, aluminum, specialty steel, and other ferrous and non-ferrous metals. This acquisition expands ATI’s capabilities to produce finished specialty materials parts and components and reinforces the Company’s important aerospace supply chain role. Results for these two businesses are included in the High Performance Materials & Components segment from the acquisition date.
In 2013, we completed the sale of our tungsten materials business. Also, during 2013, we completed a strategic review of our iron castings and fabricated components businesses. These businesses were not projected to meet the Company’s long-term profitable growth and return on capital employed expectations, resulting in the closure of the fabricated components business and planned divestiture of the iron casting business in 2013. In April 2014, the Company announced the closure of the iron castings business, as the divestiture of this business through a sale process on commercially acceptable terms was unlikely to be successful. The orderly wind-down of operations was completed by the end of the third quarter 2014. These businesses, and the divested tungsten materials business, are reported as discontinued operations, and are not reported within our sales, results of continuing operations, or business segment results.
We focus our advanced specialty materials technology, unsurpassed manufacturing capabilities, and innovative products to serve global end use markets with highly diversified and specialized product offerings. Strategic end use markets for our products include:
Aerospace and Defense
.
We are a world leader in the production of premium titanium alloys, nickel-based and cobalt-based alloys and superalloys, and vacuum-melted specialty alloys used in the manufacture of components for both commercial and military jet engines, as well as replacement parts for those engines. We also produce titanium alloys, vacuum-melted specialty alloys, and high-strength stainless alloys for use in commercial and military airframes, airframe components and missiles.
Titanium and titanium alloys are critical metals in aerospace and defense applications. Titanium and titanium alloys possess an extraordinary combination of properties, including superior strength-to-weight ratio, elevated temperature resistance, low coefficient of thermal expansion, and extreme corrosion resistance. These metals are used to produce jet engine components
3
such as blades, vanes, discs, and casings, and airframe components such as structural members, landing gear, hydraulic systems, and fasteners. The latest and next-generation airframes and jet engines use even more titanium and titanium alloys in component parts in order to minimize weight and maximize fuel efficiency.
Our nickel-based alloys and superalloys and specialty alloys are also widely used in aerospace and defense applications. Nickel-based alloys and superalloys remain extremely strong at high temperatures and resist degradation under extreme conditions. Typical aerospace applications for nickel-based alloys and superalloys and advanced powder alloys include jet engine shafts, discs, blades, vanes, rings and casings. The latest, next generation, and future-generation jet engines use new generations of nickel-based superalloys and advanced powder alloys in large part due to increased fuel efficiency requirements that require hotter-burning engines. Our specialty alloys include vacuum-melted maraging steels used in the manufacture of aircraft landing gear and structural components, as well as jet engine components.
Our titanium alloy, nickel-based alloy, and specialty alloy precision forgings are used for hot-section components for jet engines, structural components for aircraft, helicopters, launch vehicles, and other demanding applications. We are a world leader in isothermal and hot-die forging technologies for advanced aerospace components. We produce highly sophisticated components that have differing mechanical properties in different parts of the same piece for greater resistance to fatigue and temperature effects. ATI provides a full range of post-forging inspection, machining and finishing services with the certified quality needed to meet demanding application requirements. ATI has the technology, equipment and know-how to cast titanium parts in some of the largest sizes and most complex shapes currently being manufactured for aerospace applications. ATI’s advanced manufacturing capabilities offer OEMs the freedom to design components with intricate geometries, cored passageways, cast-in features and sculpted surfaces.
ATI’s powder metal technology delivers extreme alloy compositions and a refined microstructure that offer increased performance and longer useful lives in high-temperature aerospace environments. Powder metal technology boosts the efficiency of jet engines. Powder delivers the most uniform grain structure achievable, in near-net shapes, to cut reject rates and costs in highly machined components.
We continuously seek to develop innovative new alloys to better serve the needs of this end use market. For example, ATI’s 718Plus® nickel-based superalloy, Rene 65 near-powder superalloy, and our powder alloys have won significant share in the current and next-generation jet engines.
Oil and Gas and Chemical Process Industry.
The environments in which oil and gas can be found in commercial quantities have become more challenging, involving deep offshore wells, high pressure and high temperature conditions in sour wells and unconventional sources, such as shale oil and gas, and oil sands. Challenging offshore environments are in deepwater remote locations that are further off the continental shelf, including arctic and tropical locations, often one mile or more below the water’s surface, and up to two miles below the ocean floor. The requirements for equipment, which could operate for up to 30 years in these environments, require the specialty materials that we produce.
Both of our business segments produce specialty materials that are critical to the oil and gas industry and the chemical process industry. Our specialty materials, including titanium and titanium alloys, nickel-based alloys, zirconium alloys, stainless and duplex alloys and other specialty alloys have the strength, wear corrosion-resistant properties necessary for difficult environments.
Our Datalloy2® and DatalloyHP™ specialty stainless is used for non-magnetic drill collars that enable the most advanced directional and horizontal drilling techniques to be guided to the exact position desired for the reservoir. We have developed a family of duplex alloys, including ATI 2003® and ATI 2102® lean duplex alloys, for use in subsea and deepwater oil and gas applications. Several of our strip, plate and cast products are NORSOK qualified. The NORSOK standards are developed by the Norwegian petroleum industry and are intended to identify materials used in oil and gas applications that are safe and cost-effective.
Electrical Energy
.
Our specialty materials are widely used in the global electrical power generation and distribution industry. We believe energy needs and environmental policies and the electrification of developing countries will continue to drive demand for our specialty materials and products for use in this industry.
For electrical power generation, our specialty materials, including corrosion-resistant alloys (CRAs), are used in coal, nuclear, and natural gas applications. In coal-fired plants, our CRAs are used for pipe, tube, and heat exchanger applications in water systems in addition to pollution control scrubbers. Our CRAs are also used in water systems, fuel cladding components, and process equipment for nuclear power plants. For nuclear power plants, we are an industry pioneer in producing reactor-grade zirconium and hafnium alloys used in nuclear fuel cladding and structural components. We have developed Nushield
TM
products, a new line of borated stainless alloys that begin with our advanced powder metals and are used for spent nuclear fuel
4
applications. We are a technology leader for large diameter nickel-based superalloys used in natural gas land-based turbines for power generation. For renewable energy generation, our alloys are used for solar, fuel cell and geothermal applications.
For electrical power distribution, our grain-oriented electrical steel (GOES) is used in distribution and power transformers, where low loss magnetic properties are important. In January 2010, the U.S. Department of Energy (DOE) began requiring more efficient transformers, which increases premium grade GOES demand. In February 2011, the U.S. DOE published a revised preliminary rule that would further raise transformer efficiency standards effective January 2016. This new rule will result in the continued use of GOES in transformer manufacturing and will further increase the demand for premium grades.
Medical
.
ATI’s advanced specialty materials are used in medical device products that save and enhance the quality of lives.
Our zirconium-niobium, titanium- and cobalt-based alloys are used for knees, hips and other prosthetic devices. These replacement devices offer the potential of lasting much longer than previous implant options.
Our biocompatible nickel-titanium shape memory alloy is used for stents to support collapsed or clogged blood vessels. Reduced in diameter for insertion, these stents expand to the original tube-like shape due to the metal’s superelasticity. Our ultra fine diameter (0.002 inch/0.051 mm) titanium wire is used for screens to prevent blood clots from entering critical areas of the body. In addition, our titanium bar and wire are used to make surgical screws for bone repairs.
Manufacturers of magnetic resonance imaging (MRI) devices rely on our niobium superconducting wire to help produce electromagnetic fields that allow physicians to safely scan the body’s soft tissue.
Enhancing and Expanding Our Manufacturing Capabilities.
We have undertaken a multi-phase program to enhance and expand our capabilities to produce premium specialty materials aimed at these strategic markets. Since 2004, we have invested approximately $4.6 billion in capital investments and acquisitions which includes construction of what we believe to be the world’s most advanced and powerful Hot-Rolling and Processing Facility (HRPF) in the specialty materials flat rolled products industry. Our HRPF was placed into service at the end of 2013, and product commissioning was completed at the end of 2014. The HRPF, a $1.2 billion capital investment excluding capitalized interest costs, is a critical part of our strategy to transform our flat rolled products business into a more competitive and consistently profitable business and is designed to:
|
•
|
Significantly expand our product offering capabilities, shorten manufacturing cycle times, reduce inventory requirements, and improve the cost structure of our flat rolled products business.
|
|
•
|
Provide unsurpassed manufacturing capability and versatility in the production of a wide range of flat rolled specialty metals, including ATI’s diversified product mix of nickel-based and specialty alloys, titanium and titanium alloys, zirconium alloys, Precision Rolled Strip
®
products, and stainless sheet and coiled plate products.
|
|
•
|
Produce high-strength carbon steel alloys.
|
|
•
|
Roll and process exceptional quality hot bands of up to 78.62 inches, or 2 meters, wide.
|
We expect to realize the sales growth and cost reduction benefits enabled by the HRPF as we increase production volume during 2015. We plan to idle the legacy equipment at the end of the first quarter 2015.
In October 2013, we began the premium-quality (PQ) qualification program at our Rowley, UT titanium sponge production facility and were approved as a PQ aero-engine supplier in December 2014. The PQ qualification process for our products used in jet engine rotating parts made with our sponge is expected to be completed by mid-2015. We continue to achieve improvements in key operational areas and expect to steadily increase production rates, and realize lower titanium production costs per pound, as we progress through 2015.
Additional investments over the past several years include expansions of our: premium titanium alloy melt and remelt capability; nickel-based alloy and superalloy melt and remelt capability; titanium and specialty alloy plate production capability; and premium titanium and nickel-based superalloy forging capability. Also, we purchased assets that added advanced nickel-based alloy and titanium alloy powders to our product portfolio. In February 2014, we acquired flowforming process technologies to expand our capabilities in the aerospace and defense and oil & gas/chemical process industry markets. Also, in June 2014, we acquired capabilities for precision machining parts and components to expand our ability to produce finished specialty materials parts and components and reinforce our important aerospace supply chain role. We believe these investments strengthen and enhance ATI’s leadership position in the production of advanced specialty materials.
5
Business Segments
We operate in the following two business segments, which accounted for the following percentages of total revenues of
$4.22 billion
,
$4.04 billion
, and
$4.67 billion
for the years ended December 31,
2014
,
2013
, and
2012
, respectively. Segment results reflect all changes discussed above for all periods presented.
|
2014
|
2013
|
2012
|
|||||||
|
High Performance Materials & Components
|
48
|
%
|
48
|
%
|
50
|
%
|
|||
|
Flat Rolled Products
|
52
|
%
|
52
|
%
|
50
|
%
|
|||
Information with respect to our business segments is presented below and in Note 15 of the notes to the consolidated financial statements.
High Performance Materials & Components Segment
Our High Performance Materials & Components segment produces, converts and distributes a wide range of high performance materials, including titanium and titanium-based alloys, nickel- and cobalt-based alloys and superalloys, zirconium and related alloys including hafnium and niobium, advanced powder alloys and other specialty materials, in long product forms such as ingot, billet, bar, rod, wire, shapes and rectangles, and seamless tubes, plus precision forgings and castings, components and machined parts. These products are designed for the high performance requirements of such major end markets as aerospace and defense (engines and airframes), oil & gas/chemical process industry, electrical energy, and medical. We are integrated from raw materials (titanium sponge) to melt, remelt, finish processing, forging, investment casting, and machining in our titanium and titanium alloys, and zirconium and hafnium alloy products. Most of the products in this segment are sold directly to end-use customers, and a significant portion of our High Performance Materials & Components segment products are sold under multi-year agreements. The business units in this segment include ATI Specialty Materials, ATI Specialty Alloys and Components, ATI Forged Products, ATI Cast Products and ATI Flowform Products.
Approximately 65% of High Performance Materials & Components segment revenue is derived from the aerospace and defense market. Demand for our products is driven primarily by the commercial aerospace cycle. Large aircraft and aircraft engines are manufactured by a small number of companies, such as The Boeing Company, Airbus S.A.S. (an Airbus Group company), Bombardier Aerospace (a division of Bombardier Inc.), and Embraer (Empresa Brasileira de Aeronáutica S.A.) for airframes, and GE Aviation (a division of General Electric Company), Rolls-Royce plc, Pratt & Whitney (a division of United Technologies Corporation), Snecma (SAFRAN Group), and various joint ventures that manufacture jet engines. These companies and their suppliers form a substantial part of our customer base in this business segment. The loss of one or more of our customers in the aerospace and defense market could have a material adverse effect on ATI’s results of operations and financial condition.
Flat Rolled Products Segment
Our Flat Rolled Products segment produces, converts and distributes stainless steel, nickel-based alloys, specialty alloys, and titanium and titanium-based alloys, in a variety of product forms including plate, sheet, engineered strip, and Precision Rolled Strip
®
products, as well as grain-oriented electrical steel. The major end markets for our flat rolled products are oil & gas/ chemical process industry, electrical energy, automotive, food processing equipment and appliances, construction and mining, electronics, communication equipment and computers, and aerospace and defense. The operations in this segment are ATI Flat Rolled Products and the Chinese joint venture company known as Shanghai STAL Precision Stainless Steel Company Limited (STAL), in which we hold a 60% interest. Segment results also include our 50% interest in the industrial titanium joint venture known as Uniti LLC.
Stainless steel, nickel-based alloys and titanium sheet products are used in a wide variety of industrial and consumer applications. In
2014
, approximately 50% by volume of our stainless sheet products were sold to independent service centers, which have slitting, cutting or other processing facilities, with the remainder sold directly to end-use customers.
Engineered strip and very thin Precision Rolled Strip products are used by customers to fabricate a variety of products primarily in the automotive, construction, and electronics markets. In
2014
, approximately 95% by volume of our engineered strip and Precision Rolled Strip products were sold directly to end-use customers or through our own distribution network, with the remainder sold to independent service centers.
Stainless steel, nickel-based alloy and titanium plate products are primarily used in industrial markets. In
2014
, approximately 60% by volume of our plate products were sold to independent service centers, with the remainder sold directly to end-use customers.
6
Grain-oriented electrical steel is used in power transformers where electrical conductivity and magnetic properties are important. Nearly all of our grain-oriented electrical steel products are sold directly to end-use customers.
Competition
Markets for our products and services in both of our business segments are highly competitive. We compete with many producers and distributors who, depending on the product involved, range from large diversified enterprises to smaller companies specializing in particular products. Factors that affect our competitive position are the quality of our products, service and delivery capabilities, our capabilities to produce a wide range of specialty materials in various alloys and product forms, our technological capabilities including our research and development efforts, our marketing strategies, the prices for our products and services, our manufacturing costs, and industry manufacturing capacity.
We face competition from both domestic and foreign companies. Some of our foreign competitors are either directly or indirectly subsidized by governments. In 1999, the United States imposed anti-dumping and countervailing duties on dumped and subsidized imports of stainless steel sheet and strip in coils and stainless steel plate in coils from companies in ten foreign countries. The anti-dumping and countervailing duty orders were reviewed in 2011 by the U.S. Department of Commerce and the U.S. International Trade Commission to determine whether the orders should remain in place for another five years. The agencies decided that eight such orders against five countries will continue in effect. We continue to monitor unfairly traded imports from foreign producers for appropriate action.
Major Competitors
Nickel-based alloys and superalloys and specialty steel alloys
|
•
|
Carpenter Technology Corporation: A
|
|
•
|
Special Metals Corporation, a Precision Castparts Corp. company: C
|
|
•
|
Haynes International, Inc.: B
|
|
•
|
VDM Metals GmbH (Germany): C
|
Titanium and titanium-based alloys
|
•
|
Titanium Metals Corporation, a Precision Castparts Corp. company: C
|
|
•
|
RMI Titanium, an RTI International Metals company: C
|
|
•
|
VSMPO—AVISMA (Russia): A
|
Precision forgings and titanium investment castings
|
•
|
Precision Castparts Corp.: A
|
|
•
|
Alcoa Inc.: A
|
|
•
|
Aubert & Duval, a group member of Eramet (France): A
|
Zirconium and related alloys
|
•
|
Cezus, a group member of AREVA (France): A
|
|
•
|
H.C. Starck: A
|
|
•
|
Western Zirconium Plant of Westinghouse Electric Company, owned by Toshiba Corporation: A
|
Stainless steel
|
•
|
AK Steel Corporation: B
|
|
•
|
North American Stainless (NAS), owned by Acerinox S.A. (Spain): B
|
|
•
|
Outokumpu Stainless Coil Americas (Finland): B
|
|
•
|
Imports from
|
|
•
|
Aperam (formerly part of Arcelor Mittal) (France, Belgium and Germany): B
|
|
•
|
Outokumpu Oyj (Finland) including Mexinox S.A. de C.V., group member (Mexico): B
|
|
•
|
Ta Chen International Corporation (Taiwan): B
|
|
•
|
Various Chinese producers: B
|
KEY – A = Primarily High Performance Materials & Components segment, B = Primarily Flat Rolled Products segment, C = Both High Performance Materials & Components and Flat Rolled Products segments
7
Raw Materials and Supplies
Substantially all raw materials and supplies required in the manufacture of our products are available from more than one supplier and the sources and availability of raw materials essential to our businesses are currently adequate. The principal raw materials we use in the production of our specialty materials are scrap (including iron-, nickel-, chromium-, titanium-, and molybdenum-bearing scrap), nickel, titanium sponge, zirconium sand and sponge, ferrochromium, ferrosilicon, molybdenum and molybdenum alloys, manganese and manganese alloys, cobalt, niobium, vanadium and other alloying materials.
Purchase prices of certain principal raw materials have been volatile. As a result, our operating results may be subject to significant fluctuation. We use raw materials surcharge and index mechanisms to offset the impact of changes in raw material costs; however, competitive factors in the marketplace may limit our ability to institute such mechanisms, and there can be a delay between the change in the price of raw materials and the impact of such mechanisms. For example, in
2014
we used approximately 120 million pounds of nickel; therefore a hypothetical change of a $1.00 per pound increase in nickel prices would result in increased costs of approximately $120 million. We also used approximately 830 million pounds of ferrous scrap in the production of our flat rolled products; a hypothetical change of a $0.01 per pound increase would result in increased costs of approximately $8 million.
While we have increased our manufacturing capacity to produce titanium sponge, the major raw material for our titanium products, a portion of our needs, together with certain other raw materials, such as nickel, cobalt, and ferrochromium, are available to us and our specialty materials industry competitors primarily from foreign sources. Some of these foreign sources are located in countries that may be subject to unstable political and economic conditions, which could disrupt supplies or affect the price of these materials.
We purchase our nickel requirements principally from producers in Australia, Canada, Norway, Russia, and the Dominican Republic. Zirconium raw materials are primarily purchased from the U.S. and China. Cobalt is purchased primarily from producers in Canada. More than 80% of the world’s reserves of ferrochromium are located in South Africa, Zimbabwe, Albania, and Kazakhstan. Niobium is purchased primarily from producers in Brazil. We also purchase titanium sponge from sources in Russia, Kazakhstan, and Japan.
Export Sales and Foreign Operations
Direct international sales represented approximately 38% of our total annual sales in
2014
, 39% of our total sales in
2013
, and 38% of our total sales in
2012
. These figures include direct export sales by our U.S.-based operations to customers in foreign countries, which accounted for approximately 28% of our total sales in
2014
, 29% of our total sales in
2013
, and 28% of our total sales in
2012
. Our overseas sales, marketing and distribution efforts are aided by our international marketing and distribution offices, ATI Europe, ATI Europe Distribution, and ATI Asia, or by independent representatives at various locations throughout the world. We believe that at least 50% of ATI’s
2014
sales were driven by global markets when we consider exports of our customers. Direct sales by geographic area in
2014
, and as a percentage of total sales, were as follows:
|
(In millions)
|
|
|
|||||
|
United States
|
$
|
2,615.9
|
|
62
|
%
|
||
|
Europe
|
950.5
|
|
22
|
%
|
|||
|
Asia
|
403.8
|
|
10
|
%
|
|||
|
Canada
|
147.0
|
|
3
|
%
|
|||
|
South America, Middle East and other
|
106.2
|
|
3
|
%
|
|||
|
Total sales
|
$
|
4,223.4
|
|
100
|
%
|
||
Our ATI Specialty Materials business has manufacturing capabilities for melting, remelting, forging and finishing nickel-based alloys and specialty alloys in the United Kingdom. Our ATI Forged Products business has manufacturing capabilities for precision forging and machining in Poland, primarily serving the construction, transportation and aerospace markets. Our STAL joint venture in the People’s Republic of China produces Precision Rolled Strip products, which enables us to offer these products more effectively to markets in China and other Asian countries. Our Uniti LLC joint venture allows us to offer titanium products to industrial markets more effectively worldwide.
Backlog, Seasonality and Cyclicality
Our backlog of confirmed orders was approximately $1.7 billion at December 31,
2014
and $1.6 billion at December 31,
2013
. We expect that approximately 90% of confirmed orders on hand at December 31,
2014
will be filled during the year ending December 31,
2015
. Backlog of confirmed orders of our High Performance Materials & Components segment was approximately $1.4 billion at December 31,
2014
and $1.3 billion at December 31,
2013
. We expect that approximately 90% of
8
the confirmed orders on hand at December 31,
2014
for this segment will be filled during the year ending December 31,
2015
. Backlog of confirmed orders of our Flat Rolled Products segment was approximately $0.3 billion at both December 31,
2014
and
2013
. We expect that more than 90% of the confirmed orders on hand at December 31,
2014
for this segment will be filled during the year ending December 31,
2015
.
Generally, our sales and operations are not seasonal. However, demand for our products is cyclical over longer periods because specialty materials customers operate in cyclical industries and are subject to changes in general economic conditions and other factors both external and internal to those industries.
Research, Development and Technical Services
We believe that our research and development capabilities give ATI an advantage in developing new products and manufacturing processes that contribute to the profitable growth potential of our businesses on a long-term basis. We conduct research and development at our various operating locations both for our own account and, on a limited basis, for customers on a contract basis. Research and development expenditures for the years ended December 31,
2014
,
2013
, and
2012
included the following:
|
(In millions)
|
2014
|
2013
|
2012
|
|||||||||
|
Company-Funded:
|
||||||||||||
|
High Performance Materials & Components
|
$
|
12.9
|
|
$
|
11.7
|
|
$
|
16.5
|
|
|||
|
Flat Rolled Products
|
4.3
|
|
4.3
|
|
5.8
|
|
||||||
|
Corporate
|
0.2
|
|
0.1
|
|
—
|
|
||||||
|
$
|
17.4
|
|
$
|
16.1
|
|
$
|
22.3
|
|
||||
|
Customer-Funded:
|
||||||||||||
|
High Performance Materials & Components
|
$
|
2.7
|
|
$
|
2.7
|
|
$
|
1.5
|
|
|||
|
Total Research and Development
|
$
|
20.1
|
|
$
|
18.8
|
|
$
|
23.8
|
|
|||
Our research, development and technical service activities are closely interrelated and are directed toward cost reduction and process improvement, process control, quality assurance and control, system development, the development of new manufacturing methods, the improvement of existing manufacturing methods, the improvement of existing products, and the development of new products.
We own hundreds of United States patents, many of which are also filed under the patent laws of other nations. Although these patents, as well as our numerous trademarks, technical information, license agreements, and other intellectual property, have been and are expected to be of value, we believe that the loss of any single such item or technically related group of such items would not materially affect the conduct of our business.
Environmental, Health and Safety Matters
We are subject to various domestic and international environmental laws and regulations that govern the discharge of pollutants, and disposal of wastes, and which may require that we investigate and remediate the effects of the release or disposal of materials at sites associated with past and present operations. We could incur substantial cleanup costs, fines, civil or criminal sanctions, third party property damage or personal injury claims as a result of violations or liabilities under these laws or non-compliance with environmental permits required at our facilities. We are currently involved in the investigation and remediation of a number of our current and former sites as well as third party sites.
We consider environmental compliance to be an integral part of our operations. We have a comprehensive environmental management and reporting program that focuses on compliance with applicable federal, state, regional and local environmental laws and regulations. Each operating company has an environmental management system that includes mechanisms for regularly evaluating environmental compliance and managing changes in business operations while assessing environmental impact.
Our
Corporate Guidelines for Business Conduct and Ethics
address compliance with environmental laws as well as employment and workplace safety laws, and also describe our commitment to equal opportunity and fair treatment of employees. We continued to focus on safety across ATI’s operations during
2014
. As a result of our continuing focus on and commitment to safety, in
2014
our OSHA Total Recordable Incident Rate was 2.07 and our Lost Time Case Rate was 0.39, which we believe to be competitive with world-class performance for our industry.
9
Employees
We have approximately 9,700 full-time employees, of which approximately 15% are located outside the United States. Approximately 50% of our workforce is covered by various collective bargaining agreements, predominantly with the United Steel, Paper and Forestry, Rubber, Manufacturing, Energy, Allied Industrial and Service Workers International Union (“USW”).
Available Information
Our Internet website address is http://www.atimetals.com. Our annual reports on Form 10-K, quarterly reports on Form 10-Q, current reports on Form 8-K and amendments to those reports filed or furnished pursuant to Section 13(a) or 15(d) of the Securities Exchange Act of 1934, as well as proxy and information statements and other information that we file, are available free of charge through our Internet website as soon as reasonably practicable after we electronically file such material with, or furnish such material to, the United States Securities and Exchange Commission (“SEC”). Our Internet website and the content contained therein or connected thereto are not intended to be incorporated into this Annual Report on Form 10-K. You may read and copy materials we file with the SEC at the SEC’s Public Reference Room at 100 F Street, NE, Washington, DC 20549. You may obtain information on the operation of the Public Reference Room by calling the SEC at 1-800-SEC-0330. The SEC maintains an Internet website at http://www.sec.gov, which contains reports, proxy and information statements and other information that we file electronically with the SEC.
Executive Management, Including Executive Officers under Federal Securities Laws
The following are members of the Company’s executive management, including executive officers under the federal securities laws, as of February 16, 2015:
|
Name
|
Age
|
Title
|
||
|
Richard J. Harshman*
|
58
|
Chairman, President and Chief Executive Officer
|
||
|
Patrick J. DeCourcy*
|
52
|
Senior Vice President, Finance and Chief Financial Officer
|
||
|
Hunter R. Dalton*
|
60
|
Executive Vice President, ATI High Performance Specialty Materials Group
|
||
|
John D. Sims*
|
55
|
Executive Vice President, ATI High Performance Specialty Components Group
|
||
|
Robert S. Wetherbee*
|
55
|
Executive Vice President, ATI Flat Rolled Products Group
|
||
|
Elliot S. Davis*
|
53
|
Senior Vice President, General Counsel, Chief Compliance Officer and Corporate Secretary
|
||
|
Kevin B. Kramer*
|
55
|
Senior Vice President, Chief Commercial and Marketing Officer
|
||
|
Carl R. Moulton
|
67
|
Senior Vice President, International
|
||
|
Elizabeth C. Powers*
|
55
|
Senior Vice President, Chief Human Resources Officer
|
||
|
Karl D. Schwartz*
|
51
|
Controller and Chief Accounting Officer
|
||
|
*
|
Such individuals are subject to the reporting and other requirements of Section 16 of the Securities Exchange Act of 1934, as amended.
|
Set forth below are descriptions of the business backgrounds for the past five years of the Company’s executive officers and management.
Richard J. Harshman
became Chairman, President and Chief Executive Officer in May 2011. Mr. Harshman was President and Chief Operating Officer from August 2010 to May 2011. Prior to that, he served as Executive Vice President, Finance and Chief Financial Officer from 2003 to August 2010.
Patrick J. DeCourcy
, has served as Senior Vice President, Finance and Chief Financial Officer since December 2013. He was Interim Chief Financial Officer from July 2013 to December 2013. From 2011 to July 2013, Mr. DeCourcy provided assistance to ATI executive management with business integration and strategic investments and was Senior Director, Strategic Projects and Business Integration, from March 2012 to July 2013. From 2000 to April 2010, he served as Vice President, Finance and Administration of ATI Specialty Materials.
Hunter R. Dalton
became Executive Vice President, ATI High Performance Specialty Materials Group in May 2011. He has served as President, ATI Specialty Materials since April 2008. Previously, he served as Group President, ATI Long Products from 2008 to May 2011. From 2003 to 2008, Mr. Dalton served as Senior Vice President of Sales and Marketing for ATI Specialty Materials.
John D. Sims
has served as Executive Vice President, ATI High Performance Components Group since September 2013. Mr. Sims was President, ATI Forged Products from September 2013 to April 2014. Previously, he was Executive Vice President, Primary Titanium Operations, and Engineered Alloys and Products beginning in February 2013. Prior to that, Mr. Sims served
10
as Executive Vice President, Primary Metals and Exotic Alloys from May 2011 to February 2013 and President, Specialty Alloys & Components from 2008 to February 2013. Previously, he was Group President, ATI Primary Metals and Exotic Alloys from February 2011 to May 2011.
Robert S. Wetherbee
began serving as Executive Vice President, ATI Flat Rolled Products group on January 1, 2015. He served as President, ATI Flat Rolled Products beginning April 1, 2014. Prior to that, Mr. Wetherbee was President and Chief Executive Officer of Minerals Technologies, Inc. from January 2013 until February 2014. Mr. Wetherbee was President of ATI’s tungsten materials business from 2010 through 2012. Previously, he was Vice President of Market Strategy of Alcoa Inc. from 2006 through 2009.
Elliot S. Davis
became Senior Vice President, General Counsel, Chief Compliance Officer and Corporate Secretary in May 2011. Previously, Mr. Davis was Vice President and General Counsel from August 2010 to May 2011. Mr. Davis served as Assistant General Counsel from 2008, when he joined the Company, to August 2010. Prior to that, Mr. Davis was a partner of the law firm K&L Gates LLP, where he practiced for nearly 20 years in its corporate, mergers and acquisitions and securities group.
Kevin B. Kramer
was named Senior Vice President, Chief Commercial and Marketing Officer when he joined the Company in February 2014. Prior to joining ATI, Mr. Kramer was President - Stoneridge Wiring Division and Vice President of Stoneridge, Inc., from May 2012 through January 2014. Previously, Mr. Kramer worked for Alcoa, Inc. from 2004 until 2012, where he had served as President - Growth Initiatives and President - Wheel and Transportation Products.
Carl R. Moulton
, who has served as Senior Vice President, International since May 2011, will retire from the Company effective February 28, 2015. Previously, Mr. Moulton served as Vice President, International from March 2009 to May 2011. Prior to that, Mr. Moulton was President of Uniti LLC, an ATI joint venture company, since its formation in 2003.
Elizabeth C. Powers
joined ATI in November 2014 as Senior Vice President, Chief Human Resources Officer. Ms. Powers served as Vice President, Human Resources and Chief Administrative Officer for Dresser-Rand Group, Inc. from 2010 until 2012 and from 2005 to 2009. She was named Vice President, Human Resources of Dresser-Rand Group in April 2004. From 2012 until she joined ATI, Ms. Powers worked in academia. In 2009 and 2010, Ms. Powers worked in the public policy and non-profit sectors.
Karl D. Schwartz
is Controller and Chief Accounting Officer and has served in that role since May 2011. Previously, he was Controller and Principal Accounting Officer from August 2010 to May 2011. Prior to that, Mr. Schwartz was Assistant Controller beginning in April 2002, when he joined the Company.
There are inherent risks and uncertainties associated with our business that could adversely affect our operating performance and financial condition. Set forth below are descriptions of those risks and uncertainties that we currently believe to be material, but the risks and uncertainties described are not the only risks and uncertainties that could affect our business. See the discussion under “Forward-Looking Statements” in Item 7. Management’s Discussion and Analysis of Financial Condition and Results of Operations, in this Annual Report on Form 10-K.
Cyclical Demand for Products.
The cyclical nature of the industries in which our customers operate causes demand for our products to be cyclical, creating potential uncertainty regarding future profitability. Various changes in general economic conditions may affect the industries in which our customers operate. These changes could include decreases in the rate of consumption or use of our customers’ products due to economic downturns. Other factors that may cause fluctuation in our customers’ positions are changes in market demand, lower overall pricing due to domestic and international overcapacity, currency fluctuations, lower priced imports and increases in use or decreases in prices of substitute materials. As a result of these factors, our profitability has been and may in the future be subject to significant fluctuation.
Worldwide economic conditions deteriorated significantly in the recent past and could remain weak in the future. These conditions have had, and may continue to have, an adverse effect on demand for our customers’ products and, in turn, on demand for our products. If these conditions persist or worsen, our results of operations and financial condition could be materially adversely affected.
Product Pricing.
From time-to-time, reduced demand, intense competition and excess manufacturing capacity have resulted in reduced prices, excluding raw material surcharges, for many of our products. These factors have had and may have an adverse impact on our revenues, operating results and financial condition.
Although inflationary trends in recent years have been moderate, during most of the same period certain critical raw material costs, such as nickel, titanium sponge, chromium, and molybdenum and scrap containing iron, nickel, titanium, chromium, and
11
molybdenum have been volatile. While we have been able to mitigate some of the adverse impact of volatile raw material costs through raw material surcharges or indices to customers, rapid changes in raw material costs may adversely affect our results of operations.
We change prices on certain of our products from time-to-time. The ability to implement price increases is dependent on market conditions, economic factors, raw material costs and availability, competitive factors, operating costs and other factors, some of which are beyond our control. The benefits of any price increases may be delayed due to long manufacturing lead times and the terms of existing contracts.
Risks Associated with Commercial Aerospace.
A significant portion of the sales of our High Performance Materials & Components segment represents products sold to customers in the commercial aerospace industry. The commercial aerospace industry has historically been cyclical due to factors both external and internal to the airline industry. These factors include general economic conditions, airline profitability, consumer demand for air travel, varying fuel and labor costs, execution of projected build rates, price competition, and international and domestic political conditions such as military conflict and the threat of terrorism. The length and degree of cyclical fluctuation are influenced by these factors and therefore are difficult to predict with certainty. Demand for our products in this segment is subject to these cyclical trends. A downturn in the commercial aerospace industry has had, and may in the future have, an adverse effect on the prices at which we are able to sell these and other products, and our results of operations, business and financial condition could be materially adversely affected.
Risks Associated with Strategic Capital Projects.
From time-to-time, we undertake strategic capital projects in order to enhance, expand and/or upgrade our facilities and operational capabilities. For instance, over the last several years we have undertaken major expansions of our titanium and premium-melt nickel-based alloy, superalloy and specialty alloy production capabilities, and finished product commissioning of a new advanced specialty materials hot-rolling and processing facility. Our ability to achieve the anticipated increased revenues or otherwise realize acceptable returns on these investments or other strategic capital projects that we may undertake is subject to a number of risks, many of which are beyond our control, including a variety of market, operational, permitting, and labor-related factors. In addition, the cost to implement any given strategic capital project ultimately may prove to be greater than originally anticipated. If we are not able to achieve the anticipated results from the implementation of any of our strategic capital projects, or if we incur unanticipated implementation costs or delays, our results of operations and financial position may be materially adversely affected.
Dependence on Critical Raw Materials Subject to Price and Availability Fluctuations.
We rely to a substantial extent on third parties to supply certain raw materials that are critical to the manufacture of our products. Purchase prices and availability of these critical raw materials are subject to volatility. At any given time we may be unable to obtain an adequate supply of these critical raw materials on a timely basis, on price and other terms acceptable, or at all.
If suppliers increase the price of critical raw materials, we may not have alternative sources of supply. In addition, to the extent that we have quoted prices to customers and accepted customer orders for products prior to purchasing necessary raw materials, or have existing contracts, we may be unable to raise the price of products to cover all or part of the increased cost of the raw materials.
The manufacture of some of our products is a complex process and requires long lead times. As a result, we may experience delays or shortages in the supply of raw materials. If unable to obtain adequate and timely deliveries of required raw materials, we may be unable to timely manufacture sufficient quantities of products. This could cause us to lose sales, incur additional costs, delay new product introductions, or suffer harm to our reputation.
We acquire certain important raw materials that we use to produce specialty materials, including nickel, zirconium, niobium, chromium, cobalt, and titanium sponge, from foreign sources. Some of these sources operate in countries that may be subject to unstable political and economic conditions. These conditions may disrupt supplies or affect the prices of these materials.
Volatility of Raw Material Costs.
The prices for many of the raw materials we use have been extremely volatile. Since we value most of our inventory utilizing the last-in, first-out (LIFO) inventory costing methodology, a rapid rise in raw material costs has a negative effect on our operating results. Under the LIFO inventory valuation method, changes in the cost of raw materials and production activities are recognized in cost of sales in the current period even though these material and other costs may have been incurred at significantly different values due to the length of time of our production cycle. For example, in
2014
, the effect of rising raw material costs on our LIFO inventory valuation method resulted in cost of sales which were
$24.6 million
higher than would have been recognized had we utilized the FIFO methodology to value our inventory. In
2013
and
2012
, the effect of falling raw material costs on our LIFO inventory valuation method resulted in cost of sales which were
$80.9 million
and
$75.6 million
, respectively, lower than would have been recognized had we utilized the FIFO methodology to value our inventory. In a period of rising prices, cost of sales expense recognized under LIFO is generally higher than the cash costs incurred to acquire the inventory sold. Conversely, in a period of declining raw material prices, cost of sales recognized under LIFO is generally lower than cash costs incurred to acquire the inventory sold.
12
Availability of Energy Resources.
We rely upon third parties for our supply of energy resources consumed in the manufacture of our products. The prices for and availability of electricity, natural gas, oil and other energy resources are subject to volatile market conditions. These market conditions often are affected by political and economic factors beyond our control. Disruptions in the supply of energy resources could temporarily impair the ability to manufacture products for customers. Further, increases in energy costs, or changes in costs relative to energy costs paid by competitors, has and may continue to adversely affect our profitability. To the extent that these uncertainties cause suppliers and customers to be more cost sensitive, increased energy prices may have an adverse effect on our results of operations and financial condition.
Risks Associated with Environmental Matters.
We are subject to various domestic and international environmental laws and regulations that govern the discharge of pollutants, and disposal of wastes, and which may require that we investigate and remediate the effects of the release or disposal of materials at sites associated with past and present operations. We could incur substantial cleanup costs, fines and civil or criminal sanctions, third party property damage or personal injury claims as a result of violations or liabilities under these laws or non-compliance with environmental permits required at our facilities. We are currently involved in the investigation and remediation of a number of our current and former sites as well as third party sites. We also could be subject to future laws and regulations that govern greenhouse gas emissions and various matters related to climate change, which could increase our operating costs.
With respect to proceedings brought under the federal Superfund laws, or similar state statutes, we have been identified as a potentially responsible party (PRP) at approximately 44 of such sites, excluding those at which we believe we have no future liability. Our involvement is limited or de minimis at approximately 27 of these sites, and the potential loss exposure with respect to 12 individual sites is not considered to be material.
We are a party to various cost-sharing arrangements with other PRPs at most of the sites. The terms of the cost-sharing arrangements are subject to non-disclosure agreements as confidential information. Nevertheless, the cost-sharing arrangements generally require all PRPs to post financial assurance of the performance of the obligations or to pre-pay into an escrow or trust account their share of anticipated site-related costs. In addition, the Federal government, through various agencies, is a party to several such arrangements.
We believe that we operate our businesses in compliance in all material respects with applicable environmental laws and regulations. However, from time-to-time, we are a party to lawsuits and other proceedings involving alleged violations of, or liabilities arising from, environmental laws. When our liability is probable and we can reasonably estimate our costs, we record environmental liabilities in our financial statements. In many cases, we are not able to determine whether we are liable or if liability is probable to reasonably estimate the loss or range of loss. Estimates of our liability remain subject to additional uncertainties, including the nature and extent of site contamination, available remediation alternatives, the extent of corrective actions that may be required, and the participation number and financial condition of other PRPs, as well as the extent of their responsibility for the remediation. We intend to adjust our accruals to reflect new information as appropriate. Future adjustments could have a material adverse effect on our results of operations in a given period, but we cannot reliably predict the amounts of such future adjustments. At December 31,
2014
, our reserves for environmental matters totaled approximately
$17 million
. Based on currently available information, we do not believe that there is a reasonable possibility that a loss exceeding the amount already accrued for any of the sites with which we are currently associated (either individually or in the aggregate) will be an amount that would be material to a decision to buy or sell our securities. Future developments, administrative actions or liabilities relating to environmental matters, however, could have a material adverse effect on our financial condition or results of operations.
Risks Associated with Current or Future Litigation and Claims.
A number of lawsuits, claims and proceedings have been or may be asserted against us relating to the conduct of our currently and formerly owned businesses, including those pertaining to product liability, patent infringement, commercial, government contracting, employment, employee and retiree benefits, taxes, environmental, health and safety and occupational disease, and stockholder and corporate governance matters. Due to the uncertainties of litigation, we can give no assurance that we will prevail on all claims made against us in the lawsuits that we currently face or that additional claims will not be made against us in the future. While the outcome of litigation cannot be predicted with certainty, and some of these lawsuits, claims or proceedings may be determined adversely to us, we do not believe that the disposition of any such pending matters is likely to have a material adverse effect on our financial condition or liquidity, although the resolution in any reporting period of one or more of these matters could have a material adverse effect on our results of operations for that period. Also, we can give no assurance that any other matters brought in the future will not have a material effect on our financial condition, liquidity or results of operations.
Labor Matters.
We have approximately 9,700 full-time employees, of which approximately 15% are located outside the United States. Approximately 50% of our workforce is covered by various collective bargaining agreements, predominantly with the USW. At various times, our collective bargaining agreements expire and are subject to renegotiation. Certain of our collective bargaining agreements expire in 2015, including our collective bargaining agreements with the the United Steel, Paper and
13
Forestry, Rubber, Manufacturing, Energy, Allied Industrial and Service Workers International Union that cover approximately 2,300 Flat Rolled Products segment production, office and maintenance employees and approximately 150 production and maintenance employees in a High Performance Materials & Components segment Albany, Oregon facility, which will expire on June 30, 2015. Generally, collective bargaining agreements that expire may be terminated after notice by the union. After termination, the union may authorize a strike. A labor dispute, which could lead to a strike, lockout, or other work stoppage by the employees covered by one or more of the collective bargaining agreements, could have a material adverse effect on production at one or more of our facilities and, depending upon the length of such dispute or work stoppage, on our operating results. There can be no assurance that we will succeed in concluding collective bargaining agreements to replace those that expire.
Export Sales.
We believe that export sales will continue to account for a significant percentage of our future revenues. Risks associated with export sales include: political and economic instability, including weak conditions in the world’s economies; accounts receivable collection; export controls; changes in legal and regulatory requirements; policy changes affecting the markets for our products; changes in tax laws and tariffs; trade duties; and exchange rate fluctuations (which may affect sales to international customers and the value of profits earned on export sales when converted into dollars). Any of these factors could materially adversely affect our results for the period in which they occur.
Risks Associated with Retirement Benefits.
At December 31,
2014
, our U.S. qualified defined benefit pension plan was approximately 76% funded as calculated in accordance with U.S. generally accepted accounting principles, and we are not required to make any contribution to this plan in
2015
. However, we may be required to fund the U.S. qualified defined benefit pension plan in the years beyond
2015
depending upon the value of plan investments and obligations in the future and changes in laws or regulations that govern pension plan funding. Depending on the timing and amount, a requirement that we fund our U.S. qualified defined benefit pension plan could have a material adverse effect on our results of operations and financial condition.
Risks Associated with Acquisition and Disposition Strategies.
We intend to continue to strategically position our businesses in order to improve our ability to compete. Strategies we employ to accomplish this may include seeking new or expanding existing specialty market niches for our products, expanding our global presence, acquiring businesses complementary to existing strengths, and continually evaluating the performance and strategic fit of our existing business units. From time-to-time, management holds discussions with management of other companies to explore acquisitions, joint ventures, and other business combination opportunities as well as possible business unit dispositions. As a result, the relative makeup of the businesses comprising our Company is subject to change. Acquisitions, joint ventures, and other business combinations involve various inherent risks, such as: assessing accurately the value, strengths, weaknesses, contingent and other liabilities and potential profitability of acquisition or other transaction candidates; the potential loss of key personnel of an acquired business; our ability to achieve identified financial and operating synergies, growth or other benefits anticipated to result from an acquisition or other transaction; and unanticipated changes in business and economic conditions affecting an acquisition or other transaction. International acquisitions and other transactions could be affected by export controls, exchange rate fluctuations, domestic and foreign political conditions, changes in tax laws and a deterioration in domestic and foreign economic conditions.
Risks Associated with Information Technology.
Information technology infrastructure is critical to supporting business objectives; failure of our information technology infrastructure to operate effectively could adversely affect our business. We depend heavily on information technology infrastructure to achieve our business objectives. If a problem occurs that impairs this infrastructure, the resulting disruption could impede our ability to record or process orders, manufacture and ship in a timely manner, or otherwise carry on business in the normal course. Any such events could cause us to lose customers or revenue and could require us to incur significant expense to remediate.
As we integrate, implement and deploy new information technology processes and information infrastructure across our operations, we could experience disruptions in our business that could have an adverse effect on our business, financial condition, results of operations and cash flow.
Cyber Security Threats.
Increased global information technology threats, security requirements, vulnerabilities, and a rise in sophisticated and targeted international computer crime pose a risk to the security of our systems and networks and the confidentiality, availability and integrity of our data. We believe that ATI faces the threat of such cyber attacks due to the markets we serve, the products we manufacture, the locations of our operations, and global interest in our technology. Due to the evolving nature of cyber security threats, the scope and impact of any incident cannot be predicted. We continually work to safeguard our systems and mitigate potential risks. Despite our efforts to protect sensitive information and confidential and personal data, our facilities and systems and those of our third-party service providers may be vulnerable to security breaches. This could lead to disclosure, modification or destruction of proprietary and other key information, defective products,
14
production downtimes, operational disruptions, and remediation costs, which in turn could adversely affect our reputation, competitiveness and results of operations.
Internal Controls Over Financial Reporting.
Because of its inherent limitations, internal control over financial reporting may not prevent or detect misstatements. Also, projections of any evaluation of effectiveness to future periods are subject to the risk that controls may become inadequate because of changes in conditions, or that the degree of compliance with the policies or procedures may deteriorate.
Insurance.
We have maintained various forms of insurance, including insurance covering claims related to our properties and risks associated with our operations. Our existing property and liability insurance coverages contain exclusions and limitations on coverage. From time-to-time, in connection with renewals of insurance, we have experienced additional exclusions and limitations on coverage, larger self-insured retentions and deductibles, and significantly higher premiums. As a result, in the future our insurance coverage may not cover claims to the extent that it has in the past and the costs that we incur to procure insurance may increase significantly, either of which could have an adverse effect on our results of operations.
Political and Social Turmoil.
The war on terrorism as well as political and social turmoil could put pressure on economic conditions in the United States and worldwide. These political, social and economic conditions could make it difficult for us, our suppliers, and our customers to forecast accurately and plan future business activities, and could adversely affect the financial condition of our suppliers and customers and affect customer decisions as to the amount and timing of purchases from us. As a result, our business, financial condition and results of operations could be materially adversely affected.
Risks Associated with Government Contracts
.
Some of our operating units perform contractual work directly or indirectly for the U.S. Government, which requires compliance with laws and regulations relating to the performance of Government contracts. Various claims (whether based on U.S. Government or Company audits and investigations or otherwise) could be asserted against us related to our U.S. Government contract work. Depending on the circumstances and the outcome, such proceedings could result in fines, penalties, compensatory and treble damages or the cancellation or suspension of payments under one or more U.S. Government contracts. Under government regulations, a company, or one or more of its operating divisions or units, can also be suspended or debarred from government contracts based on the results of investigations.
None.
Our principal domestic facilities for our high performance materials include titanium sponge production, melting operations, and production facilities that include processing and finishing operations. Our titanium sponge production facility is located in Rowley, UT. Domestic melting operations are located in Monroe and Bakers, NC, and Lockport, NY (vacuum induction melting, vacuum arc re-melt, electro-slag re-melt, plasma melting), Richland, WA (electron beam melting), and Albany, OR (vacuum arc re-melt). Production of high performance materials, most of which are in long product form, takes place at our domestic facilities in Monroe and Bakers, NC, Lockport, NY, Richburg, SC, Albany, OR, and Oakdale, PA. Our production of zirconium and related specialty alloys takes place at facilities located in Millersburg, OR, Huntsville, AL, and Frackville, PA. Our production of highly engineered forgings, castings, and machined components takes place at facilities in Cudahy and Coon Valley, WI, East Hartford, CT, Albany, OR, Irvine, CA, Portland, IN, Lebanon, KY, Billerica, MA, and Salem, OR.
Our principal domestic locations for melting stainless steel and other flat rolled specialty materials are located in Brackenridge, Midland, and Latrobe, PA. Hot-rolling, including the new HRPF, is performed at our domestic facility in Brackenridge, PA. Hot-rolling is also performed at our domestic facilities in Washington and Houston, PA. Finishing of our flat rolled products takes place at our domestic facilities located in Brackenridge, Bagdad, Vandergrift, Midland, Washington, Rochester, Monaca, and Zelienople, PA, and in Waterbury, CT, New Bedford, MA, Louisville, OH, and Bridgeview, IL.
Substantially all of our properties are owned, and three of our properties are subject to mortgages or similar encumbrances securing borrowings under certain industrial development authority financings.
We also own or lease facilities in a number of foreign countries, including France, Germany, the United Kingdom, Poland, and the People’s Republic of China. We own and/or lease and operate facilities for melting and re-melting, machining and bar mill operations, laboratories and offices located in Sheffield, England. We own highly engineered forging and machining operations in Stalowa Wola, Poland. Through our STAL joint venture, we operate facilities for finishing Precision Rolled Strip products in the Xin-Zhuang Industrial Zone, Shanghai, China.
Our executive offices, located in PPG Place in Pittsburgh, PA, are leased.
15
Although our facilities vary in terms of age and condition, we believe that they have been well maintained and are in sufficient condition for us to carry on our activities.
From time-to-time, we become involved in various lawsuits, claims and proceedings relating to the conduct of our current and formerly owned businesses, including those pertaining to product liability, patent infringement, commercial, government contracting, employment, employee and retiree benefits, taxes, environmental, health and safety and occupational disease, and stockholder and corporate governance matters. While we cannot predict the outcome of any lawsuit, claim or proceeding, our management believes that the disposition of any pending matters is not likely to have a material adverse effect on our financial condition or liquidity. The resolution in any reporting period of one or more of these matters, including those described above, however, could have a material adverse effect on our results of operations for that period.
Information relating to legal proceedings is included in Note 20. Commitments and Contingencies of the Notes to Consolidated Financial Statements and incorporated herein by reference.
Not applicable.
Common Stock Prices
Our common stock is traded on the New York Stock Exchange (symbol ATI). At February 5, 2015, there were 3,899 record holders of Allegheny Technologies Incorporated common stock. We paid a quarterly cash dividend of $0.18 per share of common stock outstanding for each quarter of
2014
and
2013
. The ranges of high and low sales prices for shares of our common stock for the quarterly periods ended on the dates indicated were as follows:
|
2014
|
March 31
|
June 30
|
September 30
|
December 31
|
||||||||||||
|
High
|
$
|
37.71
|
|
$
|
44.58
|
|
$
|
46.23
|
|
$
|
38.22
|
|
||||
|
Low
|
$
|
29.86
|
|
$
|
37.68
|
|
$
|
37.65
|
|
$
|
30.04
|
|
||||
|
2013
|
March 31
|
June 30
|
September 30
|
December 31
|
||||||||||||
|
High
|
$
|
34.18
|
|
$
|
31.92
|
|
$
|
32.74
|
|
$
|
35.89
|
|
||||
|
Low
|
$
|
28.97
|
|
$
|
25.60
|
|
$
|
25.60
|
|
$
|
29.49
|
|
||||
Cumulative Total Stockholder Return
The graph set forth below shows the cumulative total stockholder return (i.e., price change plus reinvestment of dividends) on our common stock from December 31, 2009 through
December 31, 2014
as compared to the S&P 500 Index and a Peer Group of companies. We believe the Peer Group of companies, which is defined below, is representative of companies in our industry that serve similar markets during the applicable periods. The total stockholder return for the Peer Group is weighted according to the respective issuer’s stock market capitalization at the beginning of each period. The graph assumes that $100 was invested on December 31, 2009.
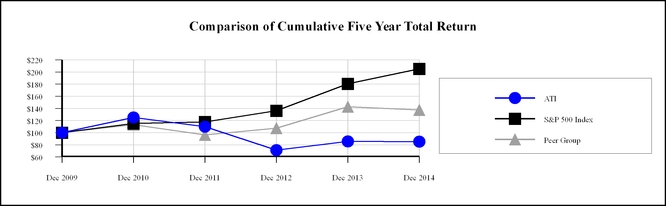
16
|
Company / Index
|
Dec 2009
|
Dec 2010
|
Dec 2011
|
Dec 2012
|
Dec 2013
|
Dec 2014
|
||||||||||||
|
ATI
|
100.00
|
|
124.96
|
|
109.77
|
|
71.23
|
|
85.62
|
|
85.09
|
|
||||||
|
S&P 500 Index
|
100.00
|
|
115.06
|
|
117.49
|
|
136.30
|
|
180.44
|
|
205.14
|
|
||||||
|
Peer Group
|
100.00
|
|
113.24
|
|
96.20
|
|
107.30
|
|
142.84
|
|
137.48
|
|
||||||
|
Source: Standard & Poor’s
|
||||||||||||||||||
Peer Group companies for the cumulative five year total return period ended
December 31, 2014
were as follows:
|
AK Steel Holding Corporation
|
|
Materion Corp
|
|
Steel Dynamics, Inc.
|
|
Alcoa Inc.
|
|
Nucor Corp.
|
|
The Timken Company
|
|
Carpenter Technology Corporation
|
|
Precision Castparts Corp.
|
|
United States Steel Corporation
|
|
Castle (A M) & Co.
|
|
Reliance Steel & Aluminum Co.
|
|
Universal Stainless & Alloy Products, Inc.
|
|
Commercial Metals Company
|
|
RTI International Metals, Inc.
|
|
Worthington Industries, Inc.
|
|
Kennametal Inc.
|
|
Schnitzer Steel Industries, Inc.
|
|
|
Effective July 1, 2014, The Timken Company spun off its steel business into a new public company, TimkenSteel Corporation, which was not part of the total shareholder return Peer Group above.
|
(In millions)
|
||||||||||||||||||||
|
For the Years Ended December 31,
|
2014
|
2013
|
2012
|
2011
|
2010
|
|||||||||||||||
|
Revenue by Market:
|
||||||||||||||||||||
|
Aerospace & Defense
|
$
|
1,446.3
|
|
$
|
1,394.5
|
|
$
|
1,584.5
|
|
$
|
1,441.6
|
|
$
|
998.3
|
|
|||||
|
Oil & Gas/Chemical Process Industry
|
752.3
|
|
706.8
|
|
837.6
|
|
996.0
|
|
705.1
|
|
||||||||||
|
Electrical Energy
|
430.2
|
|
459.4
|
|
571.5
|
|
741.8
|
|
645.7
|
|
||||||||||
|
Medical
|
211.0
|
|
207.7
|
|
211.5
|
|
243.6
|
|
223.7
|
|
||||||||||
|
Subtotal - Key Markets
|
2,839.8
|
|
2,768.4
|
|
3,205.1
|
|
3,423.0
|
|
2,572.8
|
|
||||||||||
|
Automotive
|
414.4
|
|
348.3
|
|
363.7
|
|
356.2
|
|
292.5
|
|
||||||||||
|
Construction/Mining
|
295.6
|
|
287.5
|
|
364.2
|
|
305.3
|
|
267.0
|
|
||||||||||
|
Food Equipment & Appliances
|
248.8
|
|
251.7
|
|
215.4
|
|
236.8
|
|
273.5
|
|
||||||||||
|
Transportation
|
172.1
|
|
136.3
|
|
196.1
|
|
209.0
|
|
153.3
|
|
||||||||||
|
Electronics/Communication/Computers
|
154.6
|
|
153.1
|
|
170.0
|
|
161.1
|
|
127.7
|
|
||||||||||
|
Conversion Services and Other
|
98.1
|
|
98.2
|
|
152.4
|
|
120.9
|
|
79.4
|
|
||||||||||
|
Total
|
$
|
4,223.4
|
|
$
|
4,043.5
|
|
$
|
4,666.9
|
|
$
|
4,812.3
|
|
$
|
3,766.2
|
|
|||||
17
|
(In millions, except per share amounts)
|
||||||||||||||||||||
|
For the Years Ended December 31,
|
2014
|
2013
|
2012
|
2011
|
2010
|
|||||||||||||||
|
Sales:
|
||||||||||||||||||||
|
High Performance Materials & Components
|
$
|
2,006.8
|
|
$
|
1,944.8
|
|
$
|
2,314.0
|
|
$
|
2,081.0
|
|
$
|
1,422.8
|
|
|||||
|
Flat Rolled Products
|
2,216.6
|
|
2,098.7
|
|
2,352.9
|
|
2,731.3
|
|
2,343.4
|
|
||||||||||
|
Total Sales
|
$
|
4,223.4
|
|
$
|
4,043.5
|
|
$
|
4,666.9
|
|
$
|
4,812.3
|
|
$
|
3,766.2
|
|
|||||
|
Operating profit (loss):
|
||||||||||||||||||||
|
High Performance Materials & Components
|
$
|
289.6
|
|
$
|
209.1
|
|
$
|
385.4
|
|
$
|
377.1
|
|
$
|
266.0
|
|
|||||
|
Flat Rolled Products
|
(43.3
|
)
|
(44.7
|
)
|
127.8
|
|
217.6
|
|
89.0
|
|
||||||||||
|
Total operating profit
|
$
|
246.3
|
|
$
|
164.4
|
|
$
|
513.2
|
|
$
|
594.7
|
|
$
|
355.0
|
|
|||||
|
Income (loss) from continuing operations before income taxes
|
$
|
1.5
|
|
$
|
(154.8
|
)
|
$
|
232.3
|
|
$
|
322.1
|
|
$
|
124.2
|
|
|||||
|
Income tax provision (benefit)
|
(8.7
|
)
|
(63.6
|
)
|
72.4
|
|
110.4
|
|
46.5
|
|
||||||||||
|
Income (loss) from continuing operations
|
10.2
|
|
(91.2
|
)
|
159.9
|
|
211.7
|
|
77.7
|
|
||||||||||
|
Income (loss) from discontinued operations, net of tax
|
(0.6
|
)
|
252.8
|
|
7.9
|
|
11.4
|
|
1.0
|
|
||||||||||
|
Net income
|
9.6
|
|
161.6
|
|
167.8
|
|
223.1
|
|
78.7
|
|
||||||||||
|
Less: Net income attributable to noncontrolling interests
|
12.2
|
|
7.6
|
|
9.4
|
|
8.8
|
|
8.0
|
|
||||||||||
|
Net income (loss) attributable to ATI
|
$
|
(2.6
|
)
|
$
|
154.0
|
|
$
|
158.4
|
|
$
|
214.3
|
|
$
|
70.7
|
|
|||||
|
Basic net income (loss) per common share
|
||||||||||||||||||||
|
Continuing operations attributable to ATI per common share
|
$
|
(0.02
|
)
|
$
|
(0.93
|
)
|
$
|
1.42
|
|
$
|
1.98
|
|
$
|
0.72
|
|
|||||
|
Discontinued operations attributable to ATI per common share
|
(0.01
|
)
|
2.37
|
|
0.07
|
|
0.11
|
|
0.01
|
|
||||||||||
|
Basic net income (loss) attributable to ATI per common share
|
$
|
(0.03
|
)
|
$
|
1.44
|
|
$
|
1.49
|
|
$
|
2.09
|
|
$
|
0.73
|
|
|||||
|
Diluted net income (loss) per common share
|
||||||||||||||||||||
|
Continuing operations attributable to ATI per common share
|
$
|
(0.02
|
)
|
$
|
(0.93
|
)
|
$
|
1.36
|
|
$
|
1.87
|
|
$
|
0.71
|
|
|||||
|
Discontinued operations attributable to ATI per common share
|
(0.01
|
)
|
2.37
|
|
0.07
|
|
0.10
|
|
0.01
|
|
||||||||||
|
Diluted net income (loss) attributable to ATI per common share
|
$
|
(0.03
|
)
|
$
|
1.44
|
|
$
|
1.43
|
|
$
|
1.97
|
|
$
|
0.72
|
|
|||||
|
(In millions, except per share amounts and ratios)
|
|
|
|
|
|
|||||||||||||||
|
As of and for the Years Ended December 31,
|
2014
|
2013
|
2012
|
2011
|
2010
|
|||||||||||||||
|
Dividends declared per common share
|
$
|
0.72
|
|
$
|
0.72
|
|
$
|
0.72
|
|
$
|
0.72
|
|
$
|
0.72
|
|
|||||
|
Ratio of earnings to fixed charges
|
—
|
|
—
|
|
2.8x
|
|
3.6x
|
|
2.2x
|
|
||||||||||
|
Working capital
|
$
|
1,522.2
|
|
$
|
1,739.8
|
|
$
|
1,639.1
|
|
$
|
1,707.7
|
|
$
|
1,324.1
|
|
|||||
|
Total assets
|
6,582.6
|
|
6,898.5
|
|
6,247.8
|
|
6,046.9
|
|
4,493.6
|
|
||||||||||
|
Long-term debt
|
1,509.1
|
|
1,527.4
|
|
1,463.0
|
|
1,482.0
|
|
921.9
|
|
||||||||||
|
Total debt
|
1,526.9
|
|
1,947.3
|
|
1,480.1
|
|
1,509.3
|
|
1,063.3
|
|
||||||||||
|
Cash and cash equivalents
|
269.5
|
|
1,026.8
|
|
304.6
|
|
380.6
|
|
432.3
|
|
||||||||||
|
Total ATI Stockholders’ equity
|
2,598.4
|
|
2,894.2
|
|
2,479.6
|
|
2,475.3
|
|
2,040.8
|
|
||||||||||
|
Noncontrolling interests
|
110.9
|
|
100.5
|
|
107.5
|
|
96.3
|
|
88.6
|
|
||||||||||
|
Total Stockholders’ equity
|
2,709.3
|
|
2,994.7
|
|
2,587.1
|
|
2,571.6
|
|
2,129.4
|
|
||||||||||
The information presented in Selected Financial Data should be read in conjunction with the information provided in Item 7. Management’s Discussion and Analysis of Financial Condition and Results of Operations, and in Item 8. Financial Statements and Supplementary Data.
2014 results from continuing operations include postretirement benefit curtailment and settlement gains of
$25.5 million
pre-tax (
$18.4 million
, net of tax). See Note 11 of the notes to the consolidated financial statements for further explanation.
In 2014, we acquired two businesses for
$92.9 million
to expand our value-added capabilities to provide components and near-net shape parts. ATI Flowform Products added precision flowforming process technologies to the Company’s capabilities and ATI Cast Products Salem Operations added precision machining capabilities. Both of these businesses have been integrated into
18
the High Performance Materials & Components business segment. See Note 2 of the notes to the consolidated financial statements for further explanation.
In June 2014, we repaid the remaining
$397.5 million
outstanding of the
4.25%
Convertible Senior Notes. See Note 8 of the notes to the consolidated financial statements for further explanation.
In 2013, we completed the sale of our tungsten materials business and after a strategic review, determined that we would exit our iron castings and fabricated components businesses. These three businesses are classified as discontinued operations for all periods presented above. We received cash proceeds, net of transaction costs, of
$600.9 million
for the sale of the tungsten materials business, and recognized a
$428.3 million
pretax (
$261.4 million
after tax) gain which is reported in discontinued operations. In addition, results of discontinued operations for 2013 include
$19.5 million
pre-tax (
$11.9 million
after-tax) of charges associated with the iron castings and fabricated components operations. See Note 3 of the notes to the consolidated financial statements for further explanation.
For the year ended December 31, 2013, we recorded pre-tax restructuring charges in continuing operations of
$67.5 million
($41.2 million after-tax or $0.39 per share) which are not included in segment results. These pre-tax charges were comprised of $55.1 million in non-cash long-lived asset impairment charges, $4.2 million in facility closure costs and $8.2 million in employee severance and termination benefit charges. See Note 16 of the notes to the consolidated financial statements for further explanation.
In July 2013, we issued $500 million of 5.875% Senior Notes due in 2023, the net proceeds of which were used for general corporate purposes. See Note 8 of the notes to the consolidated financial statements for further explanation.
In May 2011, we acquired Ladish Co., Inc. (Ladish) for $897.6 million, comprised of the issuance of 7.3 million shares of ATI common stock, which increased stockholders’ equity by $513.6 million, and the payment of $384 million in cash. Results are included in the High Performance Materials & Components segment from the date of the acquisition.
In January 2011, we issued $500 million of 5.95% Senior Notes due in 2021. A portion of the proceeds from this transaction was used to fund the cash portion of the Ladish acquisition. Additionally in 2011, we retired the remaining $117 million of our outstanding 8.375% Notes due in December 2011.
Total ATI stockholders’ equity for 2014 included a net decrease of $266.5 million for the year-end remeasurements of pensions and other postretirement benefits, primarily due to the use of a lower discount rate to measure the benefit obligations. Total ATI stockholders’ equity for 2013 included a net increase of $241.0 million due to the use of higher discount rate to measure the benefit obligations, and ATI stockholders’ equity for 2012 and 2011 included net decreases of $164.1 million and $320.0 million, respectively, primarily due to the use of lower discount rates to measure the benefit obligations.
For purposes of determining the ratio of earnings to fixed charges, earnings include pre-tax income (loss) from continuing operations plus fixed charges (excluding capitalized interest). Fixed charges consist of interest on all indebtedness (including capitalized interest) plus that portion of operating lease rentals representative of the interest factor (deemed to be one-third of operating lease rentals). For the years ended December 31, 2014 and 2013, fixed charges exceeded earnings by $7.1 million and $192.8 million, respectively.
Certain statements contained in this Management’s Discussion and Analysis of Financial Condition and Results of Operations are forward-looking statements. Actual results or performance could differ materially from those encompassed within such forward-looking statements as a result of various factors, including those described below. Net income and net income per share amounts referenced below are attributable to Allegheny Technologies Incorporated and Subsidiaries.
Overview of the Company
We are one of the largest and most diversified specialty materials and components producers in the world. We use innovative technologies to offer global markets a wide range of specialty materials solutions. Our high-value products include titanium and titanium alloys, nickel-based alloys and specialty steels, zirconium and related alloys, advanced powder alloys, precision and engineered stainless steel strip, grain-oriented electrical steel, and precision forgings, castings, components and machining capabilities. Our standard products include specialty stainless sheet, stainless steel sheet, and stainless steel plate. Our specialty materials are produced in a wide range of alloys and product forms and are selected for use in applications that demand materials having exceptional hardness, toughness, strength, resistance to heat, corrosion or abrasion, or a combination of these characteristics. We are a fully integrated supplier, from alloy development, to raw materials (for titanium sponge) to melting and hot-working (for other specialty alloy systems), through highly engineered finished components.
19
Our strategic vision is to be an aligned and integrated specialty materials and components company. In connection with this initiative, in the first quarter of 2014, the High Performance Metals segment was renamed the High Performance Materials & Components segment. Individual business unit names within each segment were also changed to reflect their aligned and integrated product focus. There was no change to the business units that comprise each business segment or the manner in which resources are allocated and performance is assessed for the business units by management. Therefore, there was no change to business segment reporting as a result of this initiative. We operate in two business segments: High Performance Materials & Components, and Flat Rolled Products. Our High Performance Materials & Components segment produces, converts and distributes a wide range of high performance materials, including titanium and titanium-based alloys, nickel- and cobalt-based alloys and superalloys, zirconium and related alloys including hafnium and niobium, advanced powder alloys and other specialty materials, in long product forms such as ingot, billet, bar, rod, wire, shapes and rectangles, and seamless tubes, plus precision forgings, castings, components and machined parts. These products are designed for the high performance requirements of major end markets such as aerospace and defense, oil and gas, chemical process industry, electrical energy, and medical. Our Flat Rolled Products segment produces, converts and distributes stainless steel, nickel-based alloys, specialty alloys, and titanium and titanium-based alloys, in a variety of product forms including plate, sheet, engineered strip, and Precision Rolled Strip products, as well as grain-oriented electrical steel. The major end markets for our flat rolled products are oil and gas, chemical process industry, electrical energy, automotive, food processing equipment and appliances, construction and mining, electronics, communication equipment and computers, and aerospace and defense.
Overview of 2014 Financial Performance
Sales in 2014 increased 4% to $4.22 billion. In our key end markets of aerospace and defense, oil and gas, chemical process industry, electrical energy and medical, sales were 3% higher and represented 67% of our total 2014 sales. We continued our strategic focus on key high value specialty products, including titanium and titanium alloys, precision castings and forgings, nickel-based alloys and specialty alloys, zirconium and related alloys, and grain-oriented electrical steel, with 2014 sales of these key high value products representing 77% of our total sales. Direct international sales were $1.6 billion in 2014 and represented 38% of total sales.
We reported a loss from continuing operations attributable to ATI of $2.0 million, or $(0.02) per share, compared to a loss of $98.8 million, or $(0.93) per share for 2013. Higher shipments of most high-value products, improved standard product volumes, and improved base-selling prices for standard products were significant factors affecting 2014 results. Additionally, 2014 results included $63.1 million of commissioning and qualification costs for strategic capital investments, and $25.5 million of curtailment and settlement gains on changes to postretirement benefit obligations. 2013 results from continuing operations included a $67.5 million pre-tax restructuring charge, including $59.3 million of long-lived asset impairment charges and costs associated with facility closures, which were excluded from business segment results. A summary of our results of operations, including continuing and discontinued operations, is as follows:
|
(In millions, except per share amounts)
|
2014
|
2013
|
2012
|
|||||||||
|
Sales
|
$
|
4,223.4
|
|
$
|
4,043.5
|
|
$
|
4,666.9
|
|
|||
|
Segment operating profit
|
$
|
246.3
|
|
$
|
164.4
|
|
$
|
513.2
|
|
|||
|
Income (loss) from continuing operations
|
$
|
10.2
|
|
$
|
(91.2
|
)
|
$
|
159.9
|
|
|||
|
Net income
|
$
|
9.6
|
|
$
|
161.6
|
|
$
|
167.8
|
|
|||
|
Amounts attributable to ATI common stockholders:
|
||||||||||||
|
Income (loss) from continuing operations
|
$
|
(2.0
|
)
|
$
|
(98.8
|
)
|
$
|
150.5
|
|
|||
|
Income (loss) from discontinued operations
|
(0.6
|
)
|
252.8
|
|
7.9
|
|
||||||
|
Net income (loss)
|
$
|
(2.6
|
)
|
$
|
154.0
|
|
$
|
158.4
|
|
|||
|
Per Diluted Share:
|
||||||||||||
|
Continuing operations
|
$
|
(0.02
|
)
|
$
|
(0.93
|
)
|
$
|
1.36
|
|
|||
|
Discontinued operations
|
$
|
(0.01
|
)
|
$
|
2.37
|
|
$
|
0.07
|
|
|||
|
Net income (loss)
|
$
|
(0.03
|
)
|
$
|
1.44
|
|
$
|
1.43
|
|
|||
20
Throughout 2014, we focused on improving our market position and completing our strategic investments to enhance ATI’s position as a leading global specialty materials and components producer. These actions are aimed at improving our future performance and positioning ATI to benefit from long-term growth opportunities. A few of our major strategic accomplishments during 2014 include:
|
•
|
We successfully reached several long-term agreements (LTAs) with strategic aerospace customers during 2014 and early 2015 valued at over $4 billion. These agreements secure significant growth on next-generation and legacy airplanes and are enabled by the capital investments, acquisitions, and technology innovations we have made during the past several years.
|
|
•
|
Product commissioning of our Flat Rolled Products segment Hot-Rolling and Processing Facility (HRPF) was completed at the end of 2014. The HRPF, a $1.2 billion capital investment excluding capitalized interest costs, is a critical part of our strategy to transform our flat rolled products business into a more competitive and consistently profitable business, and is designed to:
|
|
◦
|
Significantly expand our product offering capabilities, shorten manufacturing cycle times, reduce inventory requirements, and improve the cost structure of our flat rolled products business.
|
|
◦
|
Provide unsurpassed manufacturing capability and versatility in the production of a wide range of flat rolled specialty materials, including ATI’s diversified product mix of nickel-based and specialty alloys, titanium and titanium alloys, zirconium alloys, Precision Rolled Strip
®
products, and stainless sheet and coiled plate products.
|
|
◦
|
Produce high-strength carbon steel alloys.
|
|
◦
|
Roll and process exceptional quality hot bands of up to 78.62 inches, or 2 meters, wide.
|
We expect to realize the sales growth and cost reduction benefits enabled by the HRPF as we increase production volume during 2015. We plan to idle the legacy equipment at the end of the first quarter 2015. We expect fourth quarter 2015 operating profit to benefit at an annualized run rate of approximately $150 million, compared to 2014, which includes the elimination of startup costs.
|
•
|
Our Rowley, UT titanium sponge facility was approved as a premium-quality (PQ) aero-engine supplier in December 2014. The PQ qualification process for our products used in jet engine rotating parts made with our sponge is expected to be completed by mid-2015. Completion of the PQ qualification program is an important step in fulfilling the strategic vision and purpose of this approximately $0.5 billion capital investment to provide a secure, domestic supply source for PQ titanium sponge for use in jet engine rotating parts. We continue to achieve improvements in key operational areas and expect to steadily increase production rates, and realize lower titanium production costs per pound, as we progress through 2015.
|
|
•
|
We acquired two businesses for $92.9 million in our High Performance Materials & Components segment to expand our value-added capabilities to provide components and near-net shape parts. ATI Flowform Products, acquired in February 2014, uses precision flowforming process technologies to produce thin-walled components in net or near-net shapes across multiple alloy systems, including nickel-based alloys and superalloys, titanium and titanium alloys, zirconium alloys, and specialty and stainless alloys. This acquisition expands ATI’s capabilities to produce specialty materials parts and components, primarily in the aerospace and defense, and oil & gas/chemical process industry markets. ATI Cast Products Salem Operations, acquired in June 2014, performs precision machining on parts and components made from titanium alloys, nickel-based alloys and superalloys, aluminum, specialty steel, and other ferrous and non-ferrous metals. This acquisition expands ATI’s capabilities to produce finished specialty materials parts and components and reinforces the Company’s important aerospace supply chain role.
|
|
•
|
We made several significant changes to certain pension and other postretirement benefit programs effective in 2015 and future periods, including a defined benefit pension freeze and the elimination of Company-provided postretirement life insurance and medical coverage. These changes are part of ATI’s ongoing initiatives to create an integrated and aligned business with a market competitive, cost competitive, and consistent health, welfare and retirement benefit structure across our operations. The changes to postretirement benefits resulted in $25.5 million of pre-tax curtailment and settlement gains in the fourth quarter 2014. Also, as a result of these pension and other postretirement benefit plan changes, which are expected to gradually improve our ability to control our retirement benefit obligations, we expect to recognize lower retirement benefit expense (defined benefit pension expense and other postretirement benefit expenses; costs associated with defined contribution retirement plans are included in segment operating profit or corporate expenses, as applicable) in 2015 and future periods. Our U.S. qualified defined benefit pension was approximately 76% funded at December 31, 2014, as measured for financial reporting purposes, and there are no required contributions to this plan for 2015.
|
21
|
•
|
We maintained a solid liquidity position, with approximately $270 million in cash on hand and no borrowings outstanding under our $400 million domestic borrowing facility at the end of the year. We paid down $414.9 million of debt, including $397.5 million paid at maturity on our 2014 convertible notes, and payments on debt assumed in the 2011 Ladish acquisition. Total debt to total capital was 37.0% at December 31, 2014, compared to 40.2% at the end of 2013. We have no significant debt maturities for the next four years.
|
|
•
|
Capital expenditures in 2014, the majority of which related to the HRPF, were approximately $226 million. This amount was lower than our 2014 estimate of $250 million because some HRPF payments are now scheduled to be made in 2015. We are near the end of a multi-year cycle of capital expenditures on major strategic investments.
|
|
•
|
Our safety focus continued across all of ATI’s operations. Our 2014 OSHA Total Recordable Incident Rate was 2.07 and our Lost Time Case Rate was 0.39 per 200,000 hours worked, which we believe to be competitive with world class performance for our industry.
|
We continue to believe market conditions remain favorable for strong secular growth over the next several years in many of our key global markets, particularly the aerospace and defense market, which is our largest end market. Commercial aerospace build rates are expected to continue to increase and OEM backlogs remain at record levels. Demand for ATI’s high performance specialty materials and components is expected to increase in support of the higher build rates for both single aisle and larger, twin aisle aircrafts. Also, demand for our innovative new products is expected to begin a multi-year period of significant growth as new technology airframe and jet engine deliveries increase. We have LTAs in place that secure significant growth for ATI on legacy and next-generation airplanes and the jet engines that power them. Volume from these agreements is expected to provide significant profitable growth and improved capacity utilization in our mill product, forging, and titanium investment casting facilities, particularly from 2016 through 2018, and into the next decade. We are currently seeing signs that demand for our products is becoming aligned with the airframe and engine build rates as destocking in the supply chain runs its course. Demand for our products generally leads a change to a production build schedule by approximately 6 to 12 months.
The oil & gas/chemical process industry is our second largest end market. While recent declines in oil prices create market uncertainty, we believe ATI’s strength of diversity in oil and gas products, such as downhole drilling and completions coupled with upstream offshore and downstream petrochemical applications, provides a broad base to mitigate against short-term shifts in exploration and production capital spending. ATI’s sales for drilling applications represented approximately $150 million of total 2014 sales, or about 3.5% of total sales. ATI benefits from the trend toward horizontal and directional drilling, deep water projects, and sour gas projects. In the chemical processing industry, ATI benefits from projects requiring specialty materials that can withstand highly corrosive and high temperature environments. The chemical process industry is often counter-cyclical to the oil & gas market due to the benefit of lower fuel and feedstock costs.
In the electrical energy market, we expect short-term demand to remain flat for both power generation and power distribution because of modest GDP growth in advanced economies, improved energy efficiencies resulting in lower demand growth, and improving, but still weak, new housing construction in the U.S. Our specialty materials are used in nuclear, coal, and natural gas power generation, including pollution control equipment and spent nuclear fuel storage. Our products are also used to manufacture power generation equipment used for renewable energy sources, particularly in solar, fuel cell and geothermal power applications.
We expect moderate growth in demand for our high performance specialty materials from the medical market because of the aging populations in developed countries and the growth of advanced medical procedures in developing countries requiring the products that we produce.
In 2015, we expect to realize the significant commercial benefits of our strategic capital investments, including the completion of the PQ process and product qualification at our Rowley, UT titanium sponge facility, and the full production ramp-up of the HRPF. We will remain focused on actions to enhance ATI’s competitive position and improve the cost structure of our operations, particularly in our Flat Rolled Products business. We believe that this focus, combined with the capabilities of our strategic investments including our recent business acquisitions, and other strategic actions designed to transform ATI into an aligned and integrated global leader in specialty materials products and components, will keep ATI well-positioned for sustainable profitable growth and creating value for our shareholders and customers.
Results of Operations
Sales from continuing operations were $4.22 billion in 2014, $4.04 billion in 2013, and $4.67 billion in 2012. The 4% sales increase in 2014 is primarily the result of higher shipment volumes of most high-value products, and improved base selling prices and shipment volume for standard flat rolled products, reversing recent trends of lower transaction prices and lower shipment volumes for most products over the last few years. Results of discontinued operations, which include the former tungsten materials business which was sold in November 2013, and now-closed iron castings and fabricated components businesses, are excluded from business segment results, and are separately discussed below.
22
Segment operating profit was $246.3 million, or 5.8% of sales, in 2014, compared to $164.4 million, or 4.1% of sales, in 2013, and $513.2 million, or 11.0% of sales, in 2012. Our measure of segment operating profit, which we use to analyze the performance and results of our business segments, excludes income taxes, corporate expenses, net interest expense, retirement benefit expense, closed company expenses and restructuring costs, if any. We believe segment operating profit, as defined, provides an appropriate measure of controllable operating results at the business segment level. Segment operating profit in 2014 included $63.1 million of HRPF commissioning and Rowley titanium sponge facility PQ qualification costs, $24.7 million of LIFO inventory valuation reserve charges, and a $25.0 million benefit from changes in the net realizable value inventory reserves. Segment operating profit in 2013 was adversely impacted by low shipments of many high value and standard products, low base-selling prices for many products, and the impact of higher raw material input costs for products with longer manufacturing cycle times not aligned with falling raw material sales indices and surcharges. Additionally, 2013 segment operating results included $80.9 million of LIFO inventory valuation reserve benefits and $55.5 million of net realizable value and lower of cost or market inventory valuation charges.
Our two business segments represented the following percentages of our total revenues and segment operating profit for the years indicated:
|
|
2014
|
2013
|
2012
|
|||||||||||||||
|
|
Revenue
|
Operating Profit (Loss)
|
Revenue
|
Operating
Profit (Loss) |
Revenue
|
Operating
Profit |
||||||||||||
|
High Performance Materials & Components
|
48
|
%
|
118
|
%
|
48
|
%
|
127
|
%
|
50
|
%
|
75
|
%
|
||||||
|
Flat Rolled Products
|
52
|
%
|
(18
|
)%
|
52
|
%
|
(27
|
)%
|
50
|
%
|
25
|
%
|
||||||
The 2014 loss from continuing operations attributable to ATI was $2.0 million, or $(0.02) per share, compared to a 2013 loss from continuing operations attributable to ATI of $98.8 million, or $(0.93) per share, and income from continuing operations attributable to ATI of $150.5 million, or $1.36 per share in 2012. 2014 results include $25.5 million of pre-tax curtailment and settlement gains relating to postretirement benefit plan changes, in addition to the $63.1 million pre-tax HRPF commissioning and Rowley PQ qualification costs. Results for 2013 include a $67.5 million pre-tax restructuring charge for long-lived asset impairments and other costs associated with facility closures, including termination benefits for pension and other postretirement benefit plans, and other severance charges.
The 2014 loss from discontinued operations attributable to ATI was $0.6 million, or $(0.01) per share. Income from discontinued operations attributable to ATI was $252.8 million in 2013 and $7.9 million in 2012. Discontinued operations results in 2013 include the $261.4 million net of tax, or $2.45 per share, gain on sale of the tungsten materials business, charges of $11.9 million net of tax, or $0.11 per share primarily related to asset impairments in the fabricated components and iron castings business, as well as the results of operations for these three businesses. Income from discontinued operations attributable to ATI in 2012 includes an $8.8 million net of tax charge, or $0.08 per share, for asset impairment charges in the iron castings business.
Net loss attributable to ATI including both continuing and discontinued operations for 2014 was $2.6 million, or $(0.03) share, compared to net income of $154.0 million, or $1.44 per share for 2013, and net income of $158.4 million, or $1.43 per share, for 2012.
Comparative information for our overall revenues (in millions) by end market and their respective percentages of total revenues is as follows:
|
Market
|
2014
|
2013
|
2012
|
||||||||||||||||||
|
Aerospace & Defense
|
$
|
1,446.3
|
|
34
|
%
|
$
|
1,394.5
|
|
35
|
%
|
$
|
1,584.5
|
|
34
|
%
|
||||||
|
Oil & Gas/Chemical Process Industry
|
752.3
|
|
18
|
%
|
706.8
|
|
17
|
%
|
837.6
|
|
18
|
%
|
|||||||||
|
Electrical Energy
|
430.2
|
|
10
|
%
|
459.4
|
|
11
|
%
|
571.5
|
|
12
|
%
|
|||||||||
|
Medical
|
211.0
|
|
5
|
%
|
207.7
|
|
5
|
%
|
211.5
|
|
5
|
%
|
|||||||||
|
Subtotal - Key Markets
|
2,839.8
|
|
67
|
%
|
2,768.4
|
|
68
|
%
|
3,205.1
|
|
69
|
%
|
|||||||||
|
Automotive
|
414.4
|
|
10
|
%
|
348.3
|
|
9
|
%
|
363.7
|
|
8
|
%
|
|||||||||
|
Construction/Mining
|
295.6
|
|
7
|
%
|
287.5
|
|
7
|
%
|
364.2
|
|
8
|
%
|
|||||||||
|
Food Equipment & Appliances
|
248.8
|
|
6
|
%
|
251.7
|
|
6
|
%
|
215.4
|
|
4
|
%
|
|||||||||
|
Transportation
|
172.1
|
|
4
|
%
|
136.3
|
|
3
|
%
|
196.1
|
|
4
|
%
|
|||||||||
|
Electronics/Computers/Communication
|
154.6
|
|
4
|
%
|
153.1
|
|
4
|
%
|
170.0
|
|
4
|
%
|
|||||||||
|
Conversion Services and Other
|
98.1
|
|
2
|
%
|
98.2
|
|
3
|
%
|
152.4
|
|
3
|
%
|
|||||||||
|
Total
|
$
|
4,223.4
|
|
100
|
%
|
$
|
4,043.5
|
|
100
|
%
|
$
|
4,666.9
|
|
100
|
%
|
||||||
23
Comparative information for our major high-value and standard products based on their percentages of our total revenues is as follows:
|
For the Years Ended December 31,
|
2014
|
2013
|
2012
|
||||||
|
High-Value Products
|
|||||||||
|
Nickel-based alloys and specialty alloys
|
26
|
%
|
25
|
%
|
27
|
%
|
|||
|
Titanium and titanium alloys
|
15
|
%
|
16
|
%
|
14
|
%
|
|||
|
Precision forgings, castings and components
|
13
|
%
|
13
|
%
|
14
|
%
|
|||
|
Precision and engineered strip
|
13
|
%
|
13
|
%
|
12
|
%
|
|||
|
Zirconium and related alloys
|
6
|
%
|
6
|
%
|
6
|
%
|
|||
|
Grain-oriented electrical steel
|
4
|
%
|
5
|
%
|
5
|
%
|
|||
|
Total High-Value Products
|
77
|
%
|
78
|
%
|
78
|
%
|
|||
|
Standard Products
|
|||||||||
|
Specialty stainless sheet
|
10
|
%
|
10
|
%
|
10
|
%
|
|||
|
Stainless steel sheet
|
9
|
%
|
9
|
%
|
9
|
%
|
|||
|
Stainless steel plate and other
|
4
|
%
|
3
|
%
|
3
|
%
|
|||
|
Total Standard Products
|
23
|
%
|
22
|
%
|
22
|
%
|
|||
|
Grand Total
|
100
|
%
|
100
|
%
|
100
|
%
|
|||
Information with respect to our business segments is presented below.
High Performance Materials & Components
|
(In millions)
|
2014
|
% Change
|
2013
|
% Change
|
2012
|
|||||||||||||
|
Sales to external customers
|
$
|
2,006.8
|
|
3
|
%
|
$
|
1,944.8
|
|
(16
|
)%
|
$
|
2,314.0
|
|
|||||
|
Operating profit
|
289.6
|
|
38
|
%
|
209.1
|
|
(46
|
)%
|
385.4
|
|
||||||||
|
Operating profit as a percentage of sales
|
14.4
|
%
|
10.8
|
%
|
16.7
|
%
|
||||||||||||
|
Direct international sales as a percentage of sales
|
41.2
|
%
|
43.3
|
%
|
43.5
|
%
|
||||||||||||
Our High Performance Materials & Components segment produces, converts and distributes a wide range of high performance materials, including titanium and titanium-based alloys, nickel- and cobalt-based alloys and superalloys, zirconium and related alloys including hafnium and niobium, advanced powder alloys and other specialty materials, in long product forms such as ingot, billet, bar, rod, wire, shapes and rectangles, and seamless tubes, plus precision forgings, castings, components, and machined parts. These products are designed for the high performance requirements of such major end markets as aerospace and defense, oil and gas, chemical process industry, electrical energy, and medical.
2014 Compared to 2013
Sales for the High Performance Materials & Components segment in 2014 increased 3%, to $2.01 billion, with sales to the aerospace market up 3%, driven by jet engine demand, and sales to the oil & gas/chemical process industry market up 9% on 24% higher oil & gas sales.
24
Comparative information for our High Performance Materials & Components segment revenues (in millions) by market, the respective percentages of overall segment revenues for the years ended 2014 and 2013, and the percentage change in revenues by market for 2014 is as follows:
|
Market
|
2014
|
2013
|
Change
|
||||||||||||||||||
|
Aerospace:
|
|||||||||||||||||||||
|
Jet Engines
|
$
|
632.9
|
|
32
|
%
|
$
|
591.4
|
|
30
|
%
|
$
|
41.5
|
|
7
|
%
|
||||||
|
Airframes
|
376.1
|
|
19
|
%
|
370.5
|
|
19
|
%
|
5.6
|
|
2
|
%
|
|||||||||
|
Government
|
182.4
|
|
9
|
%
|
195.5
|
|
10
|
%
|
(13.1
|
)
|
(7
|
)%
|
|||||||||
|
Total Aerospace
|
1,191.4
|
|
60
|
%
|
1,157.4
|
|
59
|
%
|
34.0
|
|
3
|
%
|
|||||||||
|
Oil & Gas/Chemical Process Industry
|
189.1
|
|
9
|
%
|
172.8
|
|
9
|
%
|
16.3
|
|
9
|
%
|
|||||||||
|
Medical
|
187.6
|
|
9
|
%
|
183.5
|
|
9
|
%
|
4.1
|
|
2
|
%
|
|||||||||
|
Electrical Energy
|
124.0
|
|
6
|
%
|
133.1
|
|
7
|
%
|
(9.1
|
)
|
(7
|
)%
|
|||||||||
|
Defense
|
102.6
|
|
5
|
%
|
95.6
|
|
5
|
%
|
7.0
|
|
7
|
%
|
|||||||||
|
Construction/Mining
|
64.3
|
|
3
|
%
|
61.4
|
|
3
|
%
|
2.9
|
|
5
|
%
|
|||||||||
|
Transportation
|
47.8
|
|
3
|
%
|
49.7
|
|
3
|
%
|
(1.9
|
)
|
(4
|
)%
|
|||||||||
|
Other
|
100.0
|
|
5
|
%
|
91.3
|
|
5
|
%
|
8.7
|
|
10
|
%
|
|||||||||
|
Total
|
$
|
2,006.8
|
|
100
|
%
|
$
|
1,944.8
|
|
100
|
%
|
$
|
62.0
|
|
3
|
%
|
||||||
Sales of nickel-based alloys and specialty alloys mill products increased
11%
compared to 2013, reflecting increased shipment volumes partially offset by slightly lower average selling prices. Sales of titanium mill products were
2%
higher in 2014.
Comparative information for the segment’s major product categories, based on their percentages of 2014 and 2013 segment revenues is as follows:
|
For the Years Ended December 31,
|
2014
|
2013
|
||||
|
High-Value Products
|
||||||
|
Nickel-based alloys and specialty alloys
|
32
|
%
|
30
|
%
|
||
|
Titanium and titanium alloys
|
28
|
%
|
28
|
%
|
||
|
Precision forgings, castings and components
|
27
|
%
|
29
|
%
|
||
|
Zirconium and related alloys
|
13
|
%
|
13
|
%
|
||
|
Total High-Value Products
|
100
|
%
|
100
|
%
|
||
In 2014 and 2013, the aerospace market represented
60%
and
59%
, respectively, of the revenues of the segment with the majority of the sales to the jet engine market. Aerospace has historically represented a significant market for our High Performance Materials & Components segment, especially for premium quality specialty materials used in the manufacture of jet engines for the original equipment and spare parts markets. ATI is a fully integrated supplier, from raw material (for titanium sponge) and melt through highly engineered technically complex parts, creating a more stable and sustainable supply chain for aerospace, defense and industrial markets. In addition, we have become a larger supplier of specialty materials used in airframe construction. In both 2014 and 2013, sales of our material into the airframe market represented approximately
32%
of our aerospace market sales.
Over the past several years, we have entered into long-term agreements (LTAs) with our customers for our specialty materials, in the form of mill products and components, to reduce their supply uncertainty. In 2014 and early 2015, we reached agreement on several LTAs with aerospace market OEMs that total over $4 billion in expected revenue. These LTAs are for ATI’s specialty materials mill products, forgings and investment castings required for both next-generation and legacy aircraft platforms. Our LTAs include a titanium products supply agreement for aircraft airframes and structural components with The Boeing Company, which extends into the next decade. This long-term agreement covers value-added titanium mill products and provides opportunity for greater use of ATI’s next generation and advanced titanium alloys in both long product and flat rolled product forms, including highly engineered titanium cast and forged products. The agreement includes both long-product forms that are manufactured within the High Performance Materials & Components segment, and a significant amount of plate products that are manufactured utilizing assets of both the High Performance Materials & Components and Flat Rolled Products segments. Revenues and profits associated with these titanium products covered by the Boeing long-term agreement are included primarily in the results for the High Performance Materials & Components segment. We also have LTAs with Rolls-Royce plc for the supply of nickel-based superalloy disc-quality products and precision forgings and castings for commercial jet engine applications. In addition, we have LTAs with GE Aviation for the supply of premium titanium alloys,
25
nickel-based alloys, and vacuum-melted specialty alloys products for commercial and military jet engine applications and with Snecma (Safran) for the supply of premium titanium alloys, nickel-based alloys, vacuum melted specialty alloys, and titanium investment castings for commercial and military jet engine applications.
The commercial aerospace market’s use of titanium alloys is expected to increase significantly as new aircraft airframe designs use a larger percentage of titanium alloys. For example, the airframe (excluding engines) of the new Boeing 787 Dreamliner, which entered service in late 2011, uses significantly more titanium and titanium alloys as a percentage of total weight than any previous commercial aircraft airframe. New aircraft designs from Airbus, the A380 and A350-XWB, and from defense contractors also utilize a greater percentage of titanium alloys. Given the significant current backlogs of Boeing and Airbus, as well as the backlogs of the engine manufacturers, this increasing demand for titanium alloys mill products is expected to last for at least the next several years. Both Boeing and Airbus have implemented production increases, and announced production increases over the next several years for legacy and next generation aircraft, which is expected to positively impact the demand for titanium alloys and nickel-based superalloys for both jet engine and airframe applications. Due to manufacturing cycle times, demand for our specialty materials leads the deliveries of new aircraft by between 6 to 12 months. In addition, as our specialty materials are used in rotating components of jet engines, demand for our products for spare parts is impacted by aircraft flight activity and engine refurbishment requirements of U.S. and foreign aviation regulatory authorities. As the number of aircrafts in service increases, the need for our materials associated with engine refurbishment is expected to increase. Industry data regarding these long-term trends are as follows:
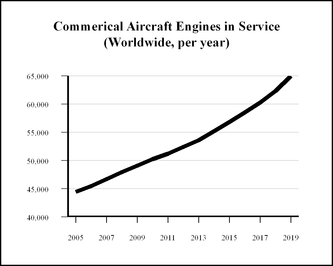
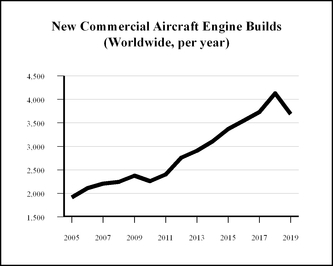
Commercial Aircraft Engines in Service (
Worldwide, per year)
|
2005
|
2006
|
2007
|
2008
|
2009
|
2010
|
2011
|
2012
|
2013
|
2014
|
2015
|
2016
|
2017
|
2018
|
2019
|
|||||||||||||||||||||||||||||
|
44,446
|
|
45,476
|
|
46,705
|
|
47,915
|
|
49,063
|
|
50,216
|
|
51,186
|
|
52,415
|
|
53,593
|
|
55,167
|
|
56,833
|
|
58,515
|
|
60,275
|
|
62,295
|
|
64,934
|
|
||||||||||||||
Source: Airline Monitor; 2014 preliminary, 2015-2019 forecast
New Commercial Aircraft Engine Builds
(Worldwide, per year)
|
2005
|
2006
|
2007
|
2008
|
2009
|
2010
|
2011
|
2012
|
2013
|
2014
|
2015
|
2016
|
2017
|
2018
|
2019
|
|||||||||||||||||||||||||||||
|
1,918
|
|
2,114
|
|
2,208
|
|
2,244
|
|
2,380
|
|
2,258
|
|
2,404
|
|
2,760
|
|
2,906
|
|
3,102
|
|
3,370
|
|
3,550
|
|
3,730
|
|
4,130
|
|
3,690
|
|
||||||||||||||
Source: Airline Monitor; 2014 preliminary, 2015-2019 forecast
26
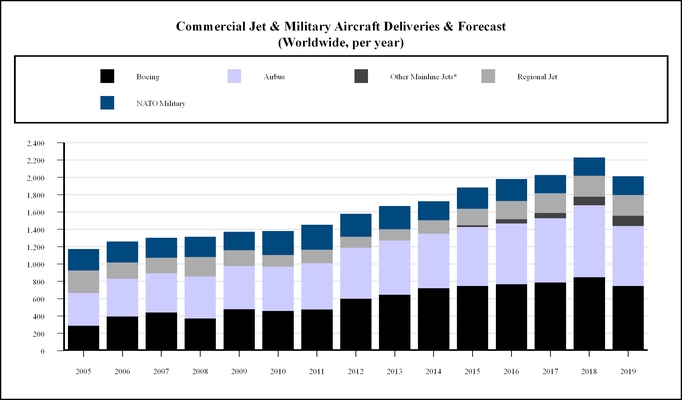
Commercial Jet & Military Aircraft Deliveries and Forecast
|
2005
|
2006
|
2007
|
2008
|
2009
|
2010
|
2011
|
2012
|
2013
|
2014
|
2015
|
2016
|
2017
|
2018
|
2019
|
|||||||||||||||||||||||||||||||
|
Boeing
|
290
|
|
398
|
|
443
|
|
375
|
|
481
|
|
462
|
|
477
|
|
601
|
|
648
|
|
723
|
|
750
|
|
770
|
|
790
|
|
850
|
|
750
|
|
|||||||||||||||
|
Airbus
|
378
|
|
434
|
|
453
|
|
483
|
|
498
|
|
510
|
|
534
|
|
588
|
|
626
|
|
629
|
|
680
|
|
700
|
|
740
|
|
830
|
|
690
|
|
|||||||||||||||
|
Other Mainline Jets*
|
—
|
|
—
|
|
—
|
|
—
|
|
—
|
|
—
|
|
—
|
|
—
|
|
—
|
|
—
|
|
20
|
|
50
|
|
60
|
|
100
|
|
120
|
|
|||||||||||||||
|
Regional Jet
|
261
|
|
187
|
|
180
|
|
225
|
|
183
|
|
135
|
|
156
|
|
128
|
|
130
|
|
157
|
|
190
|
|
210
|
|
230
|
|
240
|
|
240
|
|
|||||||||||||||
|
NATO Military
|
243
|
|
241
|
|
226
|
|
231
|
|
211
|
|
275
|
|
287
|
|
263
|
|
265
|
|
215
|
|
244
|
|
250
|
|
206
|
|
210
|
|
213
|
|
|||||||||||||||
|
Total Deliveries
|
1,172
|
|
1,260
|
|
1,302
|
|
1,314
|
|
1,373
|
|
1,382
|
|
1,454
|
|
1,580
|
|
1,669
|
|
1,724
|
|
1,884
|
|
1,980
|
|
2,026
|
|
2,230
|
|
2,013
|
|
|||||||||||||||
Sources: Airline Monitor, Forecast International (Worldwide, per year); 2014 preliminary, 2015-2019 forecast
*Mainline commercial jets from new producers: Bombardier C Series 1/300, Comac C919 (China), and MC-21 (Russia).
Longer term projections of aircraft deliveries show a decline at the end of the decade due to the phase out of current generation single aisle airframe production, but with overall production still at historically high levels, supported by a large order backlog. New commercial aircraft engine builds are also forecast to follow the same pattern. The Airline Monitor forecast (above) also assumes that single aisle deliveries will hold in the 2016-2018 period as Airbus and Boeing transition to the new models, the A320neo and 737MAX, respectively. Airline Monitor reported in February 2015 that the industry backlog for commercial jets increased to 13,548 airplanes, representing over 50% of the active fleet and almost nine years of deliveries at the 2014 rate, with twin aisle aircraft builds projected to be approximately 25% of total commercial aircraft builds through the 2019 forecast period. The projected growth increase of large twin aisle and next generation single aisle aircraft builds is significant, as the next generation of both types of aircraft utilize significantly more of the high value types of materials we produce in both the airframe and in the jet engines. As of December 31, 2014, our current shipset revenues for certain next-generation airframes and their engines are estimated as follows:
|
•
|
Boeing 737MAX, $1.1 million
|
|
•
|
Boeing 787, $2.8 million
|
|
•
|
Airbus 350, $1.5 million
|
New commercial jet and NATO military aircraft deliveries have averaged 4.4% increases annually since 2005. Independent forecasts from Airline Monitor and Forecast International project 6.7% average annual growth of commercial jet and NATO
27
military aircraft deliveries through 2018. We expect these industry trends, backlog and forecast deliveries to increase demand for the specialty materials and components that we produce.
High Performance Materials & Components segment operating profit for 2014
increased
38%
compared to 2013, to $
289.6 million
, or
14.4%
of sales, due primarily to higher mill product shipment volumes for nickel-based and specialty steel alloys and titanium and titanium alloys mill products, which was partially offset by a slightly weaker product mix for nickel-based alloys and generally lower selling prices.
Segment results in 2014 include a $15.5 million LIFO inventory valuation reserve benefit, and a $25.0 million benefit from changes in the net realizable value inventory reserve. Segment results in 2013 included a $50.4 million LIFO inventory valuation reserve benefit, partially offset by a $35.0 million net realizable value inventory reserve charge. LIFO benefits in both periods reflect deflationary impacts primarily related to zirconium and related alloys in 2014, and titanium in 2013, which lowered cost of goods sold and increased the carrying value of segment inventories accounted for on the LIFO inventory valuation method. These deflationary LIFO benefit impacts have increased the carrying value of inventory above market value, which we define as the current replacement cost, requiring reserves to adjust the market-based valuation of inventory to net realizable value. Results in both periods were also negatively impacted by the strategic decision to use ATI-produced sponge rather than lower cost titanium scrap to manufacture certain standard quality titanium products.
We continued to aggressively reduce costs in 2014. Gross cost reductions, before the effects of inflation, totaled approximately $75 million. Major areas of gross cost reductions included $45 million from operating efficiencies and $19 million from procurement savings.
Competition continues to be very strong across most key end markets, particularly within the aerospace, oil & gas, and medical market supply chains, and we expect that improvements in High Performance Materials & Components segment operating profit in 2015 will be primarily driven by operational improvements, higher shipment volumes as aerospace market destocking ends, and improved product mix. Uncertainties in the oil & gas market may result in 20 - 25% lower 2015 sales for products used in drilling applications, which would primarily impact this business segment.
2013 Compared to 2012
Sales for the High Performance Materials & Components segment in 2013 decreased
16%
, to $1.94 billion, with sales to the aerospace market down $
155.1 million
, or
12%
, due primarily to lower raw material surcharges and indices and continued aggressive supply chain inventory management in the jet engine market. Sales to the oil and gas and chemical process industry markets were
27%
lower, again reflecting lower index-based selling prices and supply chain inventory management actions, as well as lower overall project-based demand. Comparative information for our High Performance Materials & Components segment revenues (in millions) by market, the respective percentages of overall segment revenues for the years ended 2013 and 2012, and the percentage change in revenues by market for 2013 is as follows:
|
Market
|
2013
|
2012
|
Change
|
||||||||||||||||||
|
Aerospace:
|
|||||||||||||||||||||
|
Jet Engines
|
$
|
591.4
|
|
30
|
%
|
$
|
725.3
|
|
31
|
%
|
$
|
(133.9
|
)
|
(18
|
)%
|
||||||
|
Airframes
|
370.5
|
|
19
|
%
|
388.6
|
|
17
|
%
|
(18.1
|
)
|
(5
|
)%
|
|||||||||
|
Government
|
195.5
|
|
10
|
%
|
198.6
|
|
9
|
%
|
(3.1
|
)
|
(2
|
)%
|
|||||||||
|
Total Aerospace
|
1,157.4
|
|
59
|
%
|
1,312.5
|
|
57
|
%
|
(155.1
|
)
|
(12
|
)%
|
|||||||||
|
Medical
|
183.5
|
|
9
|
%
|
188.4
|
|
8
|
%
|
(4.9
|
)
|
(3
|
)%
|
|||||||||
|
Oil & Gas/Chemical Process Industry
|
172.8
|
|
9
|
%
|
235.8
|
|
10
|
%
|
(63.0
|
)
|
(27
|
)%
|
|||||||||
|
Electrical Energy
|
133.1
|
|
7
|
%
|
166.3
|
|
7
|
%
|
(33.2
|
)
|
(20
|
)%
|
|||||||||
|
Defense
|
95.6
|
|
5
|
%
|
111.4
|
|
5
|
%
|
(15.8
|
)
|
(14
|
)%
|
|||||||||
|
Construction/Mining
|
61.4
|
|
3
|
%
|
109.6
|
|
5
|
%
|
(48.2
|
)
|
(44
|
)%
|
|||||||||
|
Transportation
|
49.7
|
|
3
|
%
|
75.8
|
|
3
|
%
|
(26.1
|
)
|
(34
|
)%
|
|||||||||
|
Other
|
91.3
|
|
5
|
%
|
114.2
|
|
5
|
%
|
(22.9
|
)
|
(20
|
)%
|
|||||||||
|
Total
|
$
|
1,944.8
|
|
100
|
%
|
$
|
2,314.0
|
|
100
|
%
|
$
|
(369.2
|
)
|
(16
|
)%
|
||||||
28
Sales of titanium mill products declined 4% in 2013 compared to 2012, and sales of nickel-based alloys and specialty alloys mill products declined 25% compared to 2012, reflecting lower shipment volumes and lower average selling prices. Sales of forged and cast components were 17% lower in 2013. Comparative information for the segment’s major product categories, based on their percentages of 2013 and 2012 segment revenues is as follows:
|
For the Years Ended December 31,
|
|
2013
|
|
2012
|
||
|
High-Value Products
|
|
|
|
|
||
|
Nickel-based alloys and specialty alloys
|
|
30
|
%
|
|
34
|
%
|
|
Precision forgings, castings and components
|
|
29
|
%
|
|
29
|
%
|
|
Titanium and titanium alloys
|
|
28
|
%
|
|
25
|
%
|
|
Zirconium and related alloys
|
|
13
|
%
|
|
12
|
%
|
|
Total High-Value Products
|
|
100
|
%
|
|
100
|
%
|
In 2013 and 2012, the aerospace market represented
59%
and
57%
, respectively, of the revenues of the segment with the majority of the sales to the jet engine market. Aerospace has historically represented a significant market for our High Performance Materials & Components segment, especially for premium quality specialty materials used in the manufacture of jet engines for the original equipment and spare parts markets. ATI is a fully integrated supplier, from raw material (for titanium sponge) and melt through highly engineered technically complex parts, creating a more stable and sustainable supply chain for aerospace, defense and industrial markets. In addition, we have become a larger supplier of specialty materials used in airframe construction. In 2013 and 2012, sales of our material into the airframe market represented approximately
32%
and
30%
, respectively, of our aerospace market sales.
High Performance Materials & Components segment operating profit for 2013
decreased
46%
to $
209.1 million
compared to 2012, due primarily to lower mill product shipment volumes for all specialty materials mill products, as well as lower demand for forged and cast products. Segment operating profit in 2013 was adversely impacted by higher raw material costs for products with longer manufacturing cycle times not aligned with falling raw material indices, and lower base-selling prices for some products.
Segment results in 2013 include a $50.4 million LIFO inventory valuation reserve benefit, compared to a $39.8 million LIFO benefit in 2012, primarily reflecting the deflationary impact of raw material cost inputs, which lowered cost of goods sold and increased the carrying value of segment inventories accounted for on the LIFO inventory valuation method. This deflationary LIFO benefit impact, which accelerated in the fourth quarter of 2013, increased the carrying value of inventory at the end of 2013 above market value, which we define as the current replacement cost. In the fourth quarter 2013, a $35.0 million net realizable value inventory reserve, which reduced segment operating profit, was recorded to reflect this market-based valuation of segment inventory. Results in both periods, with greater effect in 2013, were also impacted by the strategic decision to use ATI-produced sponge rather than lower cost titanium scrap to manufacture certain standard quality titanium products.
We continued to aggressively reduce costs in 2013. Gross cost reductions, before the effects of inflation, totaled approximately $91 million. Major areas of gross cost reductions included $69 million from operating efficiencies and $17 million from procurement savings.
Flat Rolled Products
|
(In millions)
|
2014
|
% Change
|
2013
|
% Change
|
2012
|
|||||||||||||
|
Sales to external customers
|
$
|
2,216.6
|
|
6
|
%
|
$
|
2,098.7
|
|
(11
|
)%
|
$
|
2,352.9
|
|
|||||
|
Operating profit (loss)
|
(43.3
|
)
|
3
|
%
|
(44.7
|
)
|
(135
|
)%
|
127.8
|
|
||||||||
|
Operating profit (loss) as a percentage of sales
|
(2.0
|
)%
|
(2.1
|
)%
|
5.4
|
%
|
||||||||||||
|
Direct international sales as a percentage of sales
|
35.2
|
%
|
35.4
|
%
|
32.0
|
%
|
||||||||||||
Our Flat Rolled Products segment produces, converts and distributes stainless steel, nickel-based alloys, specialty alloys, and titanium and titanium-based alloys, in a variety of product forms including plate, sheet, engineered strip, and Precision Rolled Strip products, as well as grain-oriented electrical steel sheet. The major end markets for our flat rolled products are electrical energy, oil and gas, chemical processing industry, automotive, food processing equipment and appliances, construction and mining, electronics, communication equipment and computers, and aerospace and defense.
2014 Compared to 2013
Sales for the Flat Rolled Products segment for 2014 increased 6%, to $2.22 billion. Sales to the oil & gas/chemical process industry market were up 5% on improved project-based activity, sales to the automotive market increased 18% as vehicle build
29
rates remained strong, and sales to the transportation market increased 44% on higher commercial freight equipment demand. Electrical energy market demand remained at lower levels based on overall weak demand growth related to increased energy efficiencies in developed markets and weak new U.S. housing starts, as well as continued global supply/demand imbalances. Direct international sales were
35%
of segment sales. Comparative information for our Flat Rolled Products segment revenues (in millions) by market, the respective percentages of overall segment revenues for the years ended 2014 and 2013, and the percentage change in revenues by market for 2014 is as follows:
|
Market
|
2014
|
2013
|
Change
|
||||||||||||||||||
|
Oil & Gas/Chemical Process Industry
|
$
|
563.1
|
|
25
|
%
|
$
|
534.0
|
|
25
|
%
|
$
|
29.1
|
|
5
|
%
|
||||||
|
Automotive
|
395.7
|
|
18
|
%
|
335.3
|
|
16
|
%
|
60.4
|
|
18
|
%
|
|||||||||
|
Electrical Energy
|
306.2
|
|
14
|
%
|
326.3
|
|
16
|
%
|
(20.1
|
)
|
(6
|
)%
|
|||||||||
|
Food Equipment & Appliances
|
245.7
|
|
11
|
%
|
249.7
|
|
12
|
%
|
(4.0
|
)
|
(2
|
)%
|
|||||||||
|
Construction/Mining
|
231.3
|
|
10
|
%
|
226.1
|
|
11
|
%
|
5.2
|
|
2
|
%
|
|||||||||
|
Aerospace & Defense
|
152.4
|
|
7
|
%
|
141.4
|
|
7
|
%
|
11.0
|
|
8
|
%
|
|||||||||
|
Electronics/Computers/Communication
|
151.4
|
|
7
|
%
|
149.0
|
|
7
|
%
|
2.4
|
|
2
|
%
|
|||||||||
|
Transportation
|
124.3
|
|
6
|
%
|
86.6
|
|
4
|
%
|
37.7
|
|
44
|
%
|
|||||||||
|
Medical
|
23.4
|
|
1
|
%
|
24.2
|
|
1
|
%
|
(0.8
|
)
|
(3
|
)%
|
|||||||||
|
Other
|
23.1
|
|
1
|
%
|
26.1
|
|
1
|
%
|
(3.0
|
)
|
(11
|
)%
|
|||||||||
|
Total
|
$
|
2,216.6
|
|
100
|
%
|
$
|
2,098.7
|
|
100
|
%
|
$
|
117.9
|
|
6
|
%
|
||||||
Shipment volumes improved for standard products and most high-value products, and base selling prices improved for standard products as two base-price increases were successfully implemented. Comparative information for the Flat Rolled Products segment’s major product categories, based on their percentages of 2014 and 2013 segment revenues is as follows:
|
For the Years Ended December 31,
|
2014
|
2013
|
||||
|
High-Value Products
|
||||||
|
Precision and engineered strip
|
26
|
%
|
26
|
%
|
||
|
Nickel-based alloys and specialty alloys
|
21
|
%
|
20
|
%
|
||
|
Grain-oriented electrical steel
|
8
|
%
|
8
|
%
|
||
|
Titanium and titanium alloys
|
4
|
%
|
5
|
%
|
||
|
Total High-Value Products
|
59
|
%
|
59
|
%
|
||
|
Standard Products
|
||||||
|
Specialty stainless sheet
|
19
|
%
|
19
|
%
|
||
|
Stainless steel sheet
|
17
|
%
|
18
|
%
|
||
|
Stainless steel plate
|
5
|
%
|
4
|
%
|
||
|
Total Standard Products
|
41
|
%
|
41
|
%
|
||
|
Grand Total
|
100
|
%
|
100
|
%
|
||
Sales of our Flat Rolled Products segment high-value products, which include engineered strip, Precision Rolled Strip, nickel-based alloys and specialty steels, titanium and titanium alloys, and grain-oriented electrical steel products, increased 4% in 2014 primarily due to higher shipment volumes for most high-value products. However, demand for our titanium products from the chemical process industry was weaker as project-based activity remained at lower levels, with shipments of titanium and ATI-produced Uniti titanium products decreasing 21% compared to 2013, to 9.7 million pounds.
30
Sales of our standard products, which primarily include stainless steel sheet, strip, and plate, increased 7% compared to 2013. Shipment volumes of standard products increased slightly in 2014, and average transaction selling prices increased 5% as base-selling prices improved off of historically low levels. Comparative shipment volume and average selling price information on the segment’s products for the years ended December 31, 2014 and 2013 is provided in the following table:
|
|
2014
|
2013
|
% change
|
||||||||
|
Volume (000’s pounds):
|
|||||||||||
|
High-value
|
508,753
|
|
468,551
|
|
9
|
%
|
|||||
|
Standard
|
678,022
|
|
665,977
|
|
2
|
%
|
|||||
|
Total
|
1,186,775
|
|
1,134,528
|
|
5
|
%
|
|||||
|
Average prices (per lb.):
|
|||||||||||
|
High-value
|
$
|
2.53
|
|
$
|
2.63
|
|
(4
|
)%
|
|||
|
Standard
|
$
|
1.35
|
|
$
|
1.28
|
|
5
|
%
|
|||
|
Combined Average
|
$
|
1.86
|
|
$
|
1.84
|
|
1
|
%
|
|||
The majority of our flat-rolled products are sold at prices that include surcharges for raw materials, including purchased scrap, that are required to manufacture our products. These raw materials include nickel, iron, chromium, and molybdenum. Nickel, which comprises a significant percen
tage of our materials costs, and where price is influenced by commodity exchange trading, continued to be volatile during 2014. The cost of nickel increased 39% during the first five months of 2014 to an LME average monthly cost of $8.64 per pound in May 2014, only to decline by 27%, or $1.68 per pound over the next six months, and ended the year at $7.37 per pound for an overall 19% increase in 2014.
Our other major raw materials were also volatile, with molybdenum costs increasing over 50% in the first half of 2014, only to finish the year with a 7% decline, and iron scrap costs declining 13% in the fourth quarter. Volatility in raw material surcharges affects customer purchasing trends.
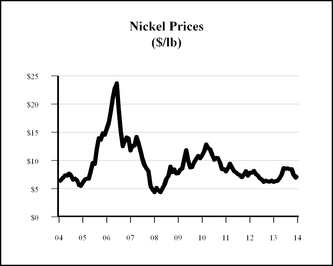
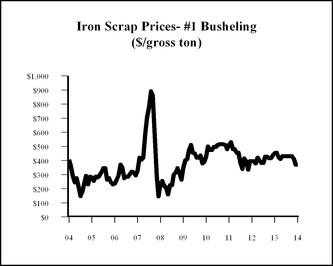
|
04
|
05
|
06
|
07
|
08
|
09
|
10
|
11
|
12
|
13
|
14
|
04
|
05
|
06
|
07
|
08
|
09
|
10
|
11
|
12
|
13
|
14
|
|||||||||||||||||||||||
|
6.25
|
|
6.09
|
|
15.68
|
|
11.79
|
|
4.39
|
|
7.74
|
|
10.94
|
|
8.05
|
|
7.82
|
|
6.22
|
|
7.37
|
|
405
|
|
280
|
|
235
|
|
325
|
|
235
|
|
345
|
|
430
|
|
510
|
|
395
|
|
452
|
|
371
|
|
|
|
Source: London Metals Exchange
|
Source: American Metals Market
|
|||||||||||||||||||||||||||||||||||||||||||
31
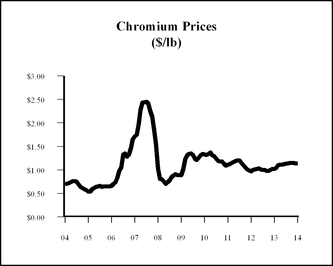
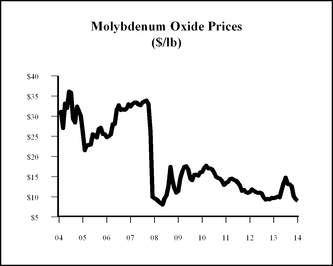
|
04
|
05
|
06
|
07
|
08
|
09
|
10
|
11
|
12
|
13
|
14
|
04
|
05
|
06
|
07
|
08
|
09
|
10
|
11
|
12
|
13
|
14
|
|||||||||||||||||||||||
|
0.69
|
|
0.54
|
|
0.66
|
|
1.71
|
|
1.03
|
|
0.89
|
|
1.33
|
|
1.11
|
|
0.97
|
|
1.02
|
|
1.14
|
|
30.30
|
|
25.95
|
|
24.78
|
|
32.38
|
|
9.60
|
|
11.38
|
|
16.19
|
|
13.45
|
|
11.20
|
|
9.67
|
|
9.01
|
|
|
|
Source: Platts Metals Week
|
Source: Platts Metals Week
|
|||||||||||||||||||||||||||||||||||||||||||
Segment operating results in 2014 were a loss of $
43.3 million
, or
(2.0)%
of sales, compared to segment operating loss of $
44.7 million
, or
(2.1)%
of sales in 2013. Segment operating results in 2014 included $22.6 million of HRPF commissioning costs, and a $40.2 million LIFO inventory valuation reserve charge. Results in 2013 included a LIFO inventory valuation reserve benefit of $30.5 million. Based on continued weak demand for industrial titanium products from global markets, we recorded lower of cost or market inventory charges of $23.2 million in 2014 and $20.5 million in 2013 in the segment to reduce the carrying value of these product inventories to current market levels. Segment operating results also include ATI’s share of Uniti’s results, which were losses of $8.9 million in 2014 and $7.1 million in 2013. Results in both periods were also negatively impacted by the strategic decision to use ATI-produced sponge rather than lower cost titanium scrap to manufacture certain standard quality titanium products.
We continued to aggressively reduce costs and streamline our flat rolled products operations. In 2014, we achieved gross cost reductions, before the effects of inflation, of approximately $65 million in our Flat Rolled Products segment. Major areas of gross cost reductions included $30 million from procurement savings and $24 million from operating efficiencies.
We expect to see gradual improvement in Flat Rolled Products segment operating profit beginning in the second quarter 2015 as volumes increase and HRPF startup costs abate. We are forecasting approximately $5 million in startup costs relating to the HRPF during the first quarter 2015, and the legacy hot mills are scheduled to be shut down by the end of the first quarter of 2015. This is expected to result in a significant cost reduction and also improve production efficiencies. We expect to realize the sales growth and cost reduction benefits enabled by the HRPF as we increase production volume during 2015. We expect fourth quarter 2015 operating profit to benefit at an annualized run rate of approximately $150 million compared to 2014, which includes the elimination of startup costs.
While the near term outlook for the oil & gas/chemical process industry market remains uncertain, we believe that the Flat Rolled Products segment’s strength of diversity in oil & gas products give us some insulation against short-term shifts in exploration and production capital spending. Additionally, we have a large nickel-based alloy plate order in our backlog for a large oil & gas pipeline for a sour gas field in Asia, which is expected to ship over the first half of 2015. For ATI, oil & gas is a global market, which includes very large offshore and onshore projects that require our corrosion resistant alloys that can safely operate at high temperatures and high pressures. These multi-billion dollar projects take years to complete. Further helping to diversify this market segment is our participation in the chemical process industry. The oil & gas and chemical process industry (or CPI) markets are often counter cyclical to each other as lower oil and gas prices can be a positive development for the CPI market. Additionally, the HRPF gives us the capability to offer these markets larger and flatter coils of nickel-based alloys, duplex alloys, and other specialty alloys, and stainless alloys.
2013 Compared to 2012
Sales for the Flat Rolled Products segment for 2013 were $2.10 billion, or 11% lower than 2012, primarily due to lower raw material surcharges and reduced base selling prices for most products. Demand improved from the food equipment and appliances, automotive and medical markets. Demand remained weak from the oil & gas/chemical process industry market
32
based on lower project activity for new oil and gas exploration and inventory management actions in global oil and gas supply chain, and lower levels of desalination and large other chemical process industry projects. Electrical energy market demand remained at lower levels based on overall weak demand growth related to increased energy efficiencies in developed markets and weak new U.S. housing starts. Direct international sales were
35%
of segment sales. Comparative information for our Flat Rolled Products segment revenues (in millions) by market, the respective percentages of overall segment revenues for the years ended 2013 and 2012, and the percentage change in revenues by market for 2013 is as follows:
|
Market
|
2013
|
2012
|
Change
|
||||||||||||||||||
|
Oil & Gas/Chemical Process Industry
|
$
|
534.0
|
|
25
|
%
|
$
|
601.9
|
|
25
|
%
|
$
|
(67.9
|
)
|
(11
|
)%
|
||||||
|
Automotive
|
335.3
|
|
16
|
%
|
352.4
|
|
15
|
%
|
(17.1
|
)
|
(5
|
)%
|
|||||||||
|
Electrical Energy
|
326.3
|
|
16
|
%
|
405.2
|
|
17
|
%
|
(78.9
|
)
|
(19
|
)%
|
|||||||||
|
Food Equipment & Appliances
|
249.7
|
|
12
|
%
|
212.6
|
|
9
|
%
|
37.1
|
|
17
|
%
|
|||||||||
|
Construction/Mining
|
226.1
|
|
11
|
%
|
254.6
|
|
11
|
%
|
(28.5
|
)
|
(11
|
)%
|
|||||||||
|
Electronics/Computers/Communication
|
149.0
|
|
7
|
%
|
161.0
|
|
7
|
%
|
(12.0
|
)
|
(7
|
)%
|
|||||||||
|
Aerospace & Defense
|
141.4
|
|
7
|
%
|
160.7
|
|
7
|
%
|
(19.3
|
)
|
(12
|
)%
|
|||||||||
|
Transportation
|
86.6
|
|
4
|
%
|
120.3
|
|
5
|
%
|
(33.7
|
)
|
(28
|
)%
|
|||||||||
|
Medical
|
24.2
|
|
1
|
%
|
23.1
|
|
1
|
%
|
1.1
|
|
5
|
%
|
|||||||||
|
Other
|
26.1
|
|
1
|
%
|
61.1
|
|
3
|
%
|
(35.0
|
)
|
(57
|
)%
|
|||||||||
|
Total
|
$
|
2,098.7
|
|
100
|
%
|
$
|
2,352.9
|
|
100
|
%
|
$
|
(254.2
|
)
|
(11
|
)%
|
||||||
Total product shipments in 2013 were flat compared to 2012. Average transaction prices in 2013 were 11% lower than 2012, and declined sequentially, quarter over quarter, in 2013 for both high value and standard stainless products due to falling raw material price surcharges. Base selling prices for standard stainless products remained at historically low levels.
Comparative information for the Flat Rolled Products segment’s major product categories, based on their percentages of 2013 and 2012 segment revenues is as follows:
|
For the Years Ended December 31,
|
2013
|
2012
|
||||
|
High-Value Products
|
||||||
|
Precision and engineered strip
|
26
|
%
|
24
|
%
|
||
|
Nickel-based alloys and specialty alloys
|
20
|
%
|
21
|
%
|
||
|
Grain-oriented electrical steel
|
8
|
%
|
10
|
%
|
||
|
Titanium and titanium alloys
|
5
|
%
|
4
|
%
|
||
|
Total High-Value Products
|
59
|
%
|
59
|
%
|
||
|
Standard Products
|
||||||
|
Specialty stainless sheet
|
19
|
%
|
19
|
%
|
||
|
Stainless steel sheet
|
18
|
%
|
17
|
%
|
||
|
Stainless steel plate
|
4
|
%
|
5
|
%
|
||
|
Total Standard Products
|
41
|
%
|
41
|
%
|
||
|
Grand Total
|
100
|
%
|
100
|
%
|
||
Sales of our Flat Rolled Products segment high-value products, which include engineered strip, Precision Rolled Strip, nickel-based alloys and specialty steels, titanium and titanium alloys, and grain-oriented electrical steel products, decreased 11% in 2013 primarily due to lower average transaction prices, and lower shipment volumes for nickel-based alloys and specialty steels, and grain-oriented electrical steel. Demand for our titanium products from the chemical process industry and oil and gas markets increased due to project deliveries from backlog in the first half of 2013, with shipments of titanium and ATI-produced Uniti titanium products increasing 5% compared to 2012, to 12.3 million pounds. Shipments of our grain-oriented electrical steel products, which are primarily sold under long-term supply agreements with key customers, continued to be affected by the downturn in residential and commercial construction.
33
Sales of our standard products, which primarily include stainless steel sheet, strip, and plate, also decreased 11% compared to 2012. Although our shipment volumes of standard products increased slightly in 2013, average transaction selling prices decreased by 12% due to declining raw materials surcharges and historically low base selling prices. Comparative shipment volume and average selling price information on the segment’s products for the years ended December 31, 2013 and 2012 is provided in the following table:
|
|
2013
|
2012
|
% change
|
||||||
|
Volume (000’s pounds):
|
|||||||||
|
High-value
|
468,551
|
|
475,808
|
|
(2
|
)%
|
|||
|
Standard
|
665,977
|
|
656,285
|
|
1
|
%
|
|||
|
Total
|
1,134,528
|
|
1,132,093
|
|
—
|
%
|
|||
|
Average prices (per lb.):
|
|||||||||
|
High-value
|
$2.63
|
$2.89
|
(9
|
)%
|
|||||
|
Standard
|
$1.28
|
$1.46
|
(12
|
)%
|
|||||
|
Combined Average
|
$1.84
|
$2.06
|
(11
|
)%
|
|||||
Segment operating results in 2013 were a loss of $44.7 million, or (2.1%) of sales, compared to segment operating profit of $127.8 million, or 5.4% of sales in 2012. Although overall shipment volumes of high-value and standard products were comparable to the prior year, results reflected a weaker product mix. Segment operating results in 2013 included a LIFO inventory valuation reserve benefit of $30.5 million, compared to $35.8 million in 2012, as continued deflation in raw materials reduced cost of sales of inventory valued on the LIFO method. These LIFO inventory valuation reserve charges were partially offset by higher raw material costs, which did not align with declining raw material surcharges. Results in both periods, with greater affect to 2013, were also impacted by the strategic decision to use ATI-produced sponge rather than lower cost titanium scrap to manufacture certain standard quality titanium products. In the fourth quarter 2013, based on continued weak demand for industrial titanium products from global markets, we recorded a $20.5 million lower of cost or market inventory charge in the segment to reduce the carrying value of these product inventories to current market levels. Segment operating results include ATI’s share of Uniti’s results, which were a loss of $7.1 million in 2013 and income of $4.9 million in 2012.
We continued to aggressively reduce costs and streamline our flat rolled products operations. In 2013, we achieved gross cost reductions, before the effects of inflation, of approximately $50 million in our Flat Rolled Products segment. Major areas of gross cost reductions included $19 million from procurement savings and $16 million from operating efficiencies.
Corporate Expenses
Corporate expenses, which are included in selling and administrative expenses in the statement of operations, were
$44.2 million
in
2014
compared to
$43.0 million
in
2013
, and
$68.4 million
in
2012
. The decrease in corporate expenses in 2014 and
2013
compared to
2012
was due primarily from reduced annual and long-term performance-based compensation expenses. Corporate expenses in 2013 also included the favorable effects of a litigation settlement.
Interest Expense, Net
Interest expense, net of interest income and interest capitalization, was
$108.7 million
in
2014
,
$65.2 million
in
2013
, and
$71.6 million
in
2012
. The increase in interest expense in
2014
compared to
2013
was primarily due to
$40 million
of lower interest capitalization on capital projects. For
2013
, interest expense decreased compared to
2012
primarily due to
$21 million
of higher interest capitalization on capital projects, which more than offset higher interest costs incurred from the July 2013 issuance of $500 million of 5.875% Notes due 2023. Interest expense is presented net of interest income of
$1.1 million
in
2014
,
$0.8 million
in
2013
, and
$0.8 million
in
2012
.
Interest expense in
2014
,
2013
, and
2012
was reduced by
$5.3 million
,
$45.7 million
, and
$24.5 million
, respectively, related to interest capitalization on major strategic capital projects.
Restructuring Charges
In 2013, we recorded $67.5 million in pre-tax restructuring charges in continuing operations, including $59.3 million of long-lived asset impairment charges and costs associated with facility closures, and $8.2 million in termination benefits for pension and other postretirement benefit plans, and other severance charges. The strategic investments in manufacturing capabilities
34
and process technologies we have made in the last several years enabled the closure in 2013 of older, higher-cost operations, and the streamlining of our manufacturing processes by reducing our manufacturing footprint.
We permanently closed the Albany, OR titanium sponge production facility, which resulted in a $38.1 million long-lived asset impairment charge and $3.5 million of asset retirement obligations in 2013. Additionally, less efficient flat rolled finishing facilities in New Castle, IN and Wallingford, CT were permanently closed. The New Castle facility, which was idled in 2011, was permanently closed in 2013, resulting in a $6.3 million long-lived asset impairment charge. In December 2013, we announced the closure of the Wallingford facility, which was completed in the third quarter 2014. Restructuring charges of $9.1 million were recorded in 2013 for this action, including $2.7 million of long-lived asset impairment charges, $5.0 million of termination benefits for pension and other postretirement benefit plans, and $1.4 million of severance and other closure costs.
Restructuring charges in 2013 also included $8.0 million in other long-lived asset impairments in the High Performance Materials & Components segment, and $2.2 million of severance charges for workforce reductions across ATI’s operations.
Closed Company and Other Expenses
Closed company and other expenses, which were
$21.2 million
in
2014
,
$14.2 million
in
2013
, and
$18.5 million
in
2012
, include charges incurred in connection with closed operations, pre-tax gains and losses on the sale of surplus real estate, non-strategic investments and other assets, and other non-operating income or expense. Higher costs in 2014 primarily related to environmental and insurance obligations of closed operations. Closed company and other expenses are presented primarily in selling and administrative expenses in the consolidated statements of operations, and mostly related to legal, environmental and insurance costs associated with closed operations.
Retirement Benefit Expense
Retirement benefit expense, which includes pension and other postretirement benefit expense, decreased to
$70.7 million
in
2014
, compared to
$129.3 million
in
2013
and
$122.4 million
in
2012
. The decrease in expense in 2014 was primarily due to $25.5 million of pre-tax curtailment and settlement gains relating to postretirement benefit plan changes and the utilization of a higher discount rate to value retirement benefit obligations. Retirement benefit expense as presented, which excludes $6.1 million in termination benefits in 2013 that is reported within restructuring charges, is reported in both cost of sales and selling and administrative expenses. Excluding the curtailment and settlement gains, approximately 85% of 2014 retirement benefit expense is included in costs of sales, with the remainder included in selling and administrative expenses.
Total retirement benefit expense for
2015
is estimated to be approximately
$77 million
, a decrease of approximately $19 million compared to 2014, excluding the 2014 impact of the postretirement benefit curtailment and settlement gains. Pension expense is expected to be approximately
$37 million
in
2015
compared to pension expense of $55.9 million in 2014. A longer amortization period for net actuarial losses and lower service cost as a result of the pension freeze will more than offset the higher expense impacts of a lower discount rate used to value pension obligations, increased life expectancy estimates and lower returns on plan assets. We expect most of the
2015
pension expense to be non-cash. Other postretirement benefit expense is expected to be
$40 million
in
2015
, which is unchanged from 2014, as the reduction in expense from benefit plan changes will be offset by the use of a lower discount rate to value postretirement benefit obligations.
Income Taxes
The
2014
income tax benefit from continuing operations was
$8.7 million
, for U.S. Federal, foreign and state income taxes, which included $11.6 million of discrete tax benefits primarily associated with prior years’ and foreign taxes. 2013 results from continuing operations included a benefit from income taxes of
$63.6 million
, or 41.1% of the pre-tax loss from continuing operations. Results for 2013 included an income tax provision of $161.4 million in discontinued operations, or 39.0% of pre-tax income from discontinued operations, which includes the effects of the gain on sale of the tungsten materials business, for total 2013 income tax expense of $97.8 million. Income taxes in 2014 and 2013 include the effects of adjustments related to prior years’ and foreign taxes, and the absence of the benefits of the U.S. Federal manufacturing deduction due to operating losses in both years. The
2012
provision for income taxes from continuing operations was
$72.4 million
, or 31.2% of income before tax. The income tax rate in 2012 includes the effects of a greater portion of pre-tax income from foreign earnings that are generally taxed at lower rates than the U.S. Federal rate, and the benefits of the U.S. Federal manufacturing deduction.
Deferred taxes result from temporary differences in the recognition of income and expense for financial and income tax reporting purposes, and differences between the fair value of assets acquired in business combinations accounted for as a purchase for financial reporting purposes and their corresponding tax bases. Deferred income taxes represent future tax benefits
35
or costs to be recognized when those temporary differences reverse. At
December 31, 2014
, we had a net deferred tax liability of
$143.1 million
.
Financial Condition and Liquidity
At
December 31, 2014
, we had
$270 million
of cash and cash equivalents, and our available liquidity includes our $400 million senior unsecured domestic revolving credit facility (“credit facility”). We believe that internally generated funds, current cash on hand, and available borrowings under the credit facility will be adequate to meet foreseeable liquidity needs. If we needed to obtain additional financing using the credit markets, the cost and the terms and conditions of such borrowings may be influenced by our credit rating. We have no significant debt maturities for the next four years.
As of
December 31, 2014
, there were
no
outstanding borrowings under the credit facility, which expires
May 31, 2018
, although a portion of the credit facility was used to support approximately
$4.7 million
in letters of credit.
In October 2014, the Company amended the credit facility to modify the maximum leverage ratio and minimum interest coverage ratio permitted under the credit facility and to revise the calculation definitions for these two ratios. In addition, the amended credit facility provides for a springing lien on certain of the Company’s accounts receivable and inventory. This springing lien would become effective in the future if the Company’s credit ratings from both Standard & Poor’s and Moody’s are below investment grade, and would be subsequently released if the Company’s credit rating returns to investment grade from either rating agency, assuming no event of default condition existed. Third-party costs associated with this amendment were
$1.2 million
in 2014, and are being amortized to interest expense over the remaining term of the credit facility.
As amended, the credit facility requires the Company to maintain a leverage ratio (measured as consolidated total indebtedness net of cash on hand in excess of
$50 million
, divided by consolidated EBITDA, defined as earnings before interest, taxes, depreciation and amortization, and non-cash pension expense, with the definition of consolidated EBIT excluding any gain or loss attributable to sale or other dispositions of assets outside the ordinary course of business, for the four prior fiscal quarters) of not greater than
5.75
for the quarter ended December 31, 2014,
5.00
for the quarter ended March 31, 2015,
4.50
for the quarter ended June 30, 2015,
3.75
for the quarter ended September 30, 2015, and
3.50
for the quarter ended December 31, 2015 and for each fiscal quarter thereafter. The credit facility, as amended, also requires the Company to maintain an interest coverage ratio (consolidated EBITDA as calculated for the leverage ratio, divided by interest expense) of not less than
2.0
for the quarter ended December 31, 2014,
2.50
for the quarter ended March 31, 2015,
3.00
for the quarter ended June 30, 2015,
3.25
for the quarter ended September 30, 2015, and
3.50
for the quarter ended December 31, 2015 and for each fiscal quarter thereafter. At
December 31, 2014
, the leverage ratio was
4.20
and the interest coverage ratio was
2.79
. The Company was in compliance with these required ratios during all applicable periods.
We have no off-balance sheet arrangements as defined in Item 303(a)(4) of SEC Regulation S-K.
Cash Flow and Working Capital
Cash flow from operations for
2014
was
$55.9 million
, which included a
$148.0 million
investment in managed working capital associated with increased business activity. Investing activities were a net cash outflow of
$316.2 million
, and included
$72.9 million
for the acquisition of Dynamic Flowform Corp.,
$20.0 million
for the acquisition of Hanard Machine, Inc., and
$225.7 million
of capital expenditures, which primarily related to the HRPF. Cash used by financing activities in
2014
was
$497.0 million
and consisted primarily of debt repayments of
$414.9 million
, including the June 2014 maturity of our convertible notes, and dividend payments of
$77.1 million
to ATI stockholders. At
December 31, 2014
, cash and cash equivalents on hand totaled
$269.5 million
, a decrease of
$757.3 million
from year end
2013
. Cash and cash equivalents held by our foreign subsidiaries was $139.6 million at
December 31, 2014
.
Cash flow from operations for 2013 was $368.4 million, which included a reduction of $242.0 million of managed working capital, excluding the effects of the sale of the tungsten materials business. Investing activities were a net cash outflow of $11.0 million, as $612.7 million of capital expenditures, which primarily related to the HRPF, were offset by the net proceeds from the sale of the tungsten materials business. 2013 represented the peak year of capital spending on the HRPF. Cash provided by financing activities in 2013 was $364.8 million and included net proceeds of $494.8 million from the 2023 Notes, partially offset by dividend payments of $76.9 million to ATI stockholders and $18.0 million to noncontrolling interests, and repayments of other indebtedness of $31.5 million. At December 31, 2013, cash and cash equivalents on hand totaled $1,026.8 million, an increase of $722.2 million from year end 2012.
36
Managed Working Capital
As part of managing the liquidity of the business, we focus on controlling inventory, accounts receivable and accounts payable. In measuring performance in controlling this managed working capital, we exclude the effects of LIFO and other inventory valuation reserves, and reserves for uncollectible accounts receivable which, due to their nature, are managed separately. We also measure managed working capital as a percentage of the prior two months annualized sales to evaluate our performance based on recent levels of business volume. We define managed working capital as gross inventory plus accounts receivable less accounts payable.
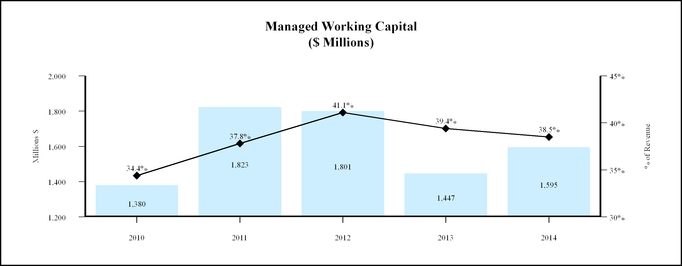
|
2010
|
2011
|
2012
|
2013
|
2014
|
|||||||
|
Millions/$
|
1,380
|
|
1,823
|
|
1,801
|
|
1,447
|
|
1,595
|
|
|
|
% of Annualized Sales
|
34.4
|
%
|
37.8
|
%
|
41.1
|
%
|
39.4
|
%
|
38.5
|
%
|
|
In
2014
, managed working capital increased
$148.0 million
, due to increased business activity. The
$148.0 million
increase resulted from a $156.4 million increase in inventory and a $73.4 million increase in accounts receivable, partially offset by an $81.8 million increase in accounts payable.
In 2013, managed working capital decreased $354.3 million, including $112.3 million divested in the tungsten materials sale, and $242.0 million from ATI’s operations in response to business conditions. The $242.0 million reduction resulted from a $206.5 million decrease in inventory and a $40.9 million decrease in accounts receivable, partially offset by a $5.4 million decrease in accounts payable.
Managed working capital as a percentage of annualized sales has decreased, primarily due to higher sales. Days sales outstanding, which measures actual collection timing for accounts receivable, decreased by approximately 4% in
2014
compared to
2013
, while gross inventory turns, which excludes the effect of inventory valuation reserves, decreased by approximately 11% in
2014
reflecting a greater investment in inventory to support improving business volumes.
37
The components of managed working capital were as follows:
|
(In millions)
|
December 31,
2014 |
December 31,
2013 |
December 31,
2012 |
|||||||||
|
Accounts receivable
|
$
|
603.6
|
|
$
|
528.2
|
|
$
|
613.3
|
|
|||
|
Inventory
|
1,472.8
|
|
1,322.1
|
|
1,536.6
|
|
||||||
|
Accounts payable
|
(556.7
|
)
|
(471.8
|
)
|
(499.9
|
)
|
||||||
|
Subtotal
|
1,519.7
|
|
1,378.5
|
|
1,650.0
|
|
||||||
|
Allowance for doubtful accounts
|
4.8
|
|
5.3
|
|
5.5
|
|
||||||
|
LIFO reserve
|
(4.8
|
)
|
(29.4
|
)
|
76.9
|
|
||||||
|
Inventory reserves
|
68.8
|
|
84.3
|
|
63.1
|
|
||||||
|
Corporate and other
|
6.0
|
|
2.7
|
|
5.3
|
|
||||||
|
Managed working capital of discontinued operations
|
—
|
|
5.1
|
|
—
|
|
||||||
|
Managed working capital
|
$
|
1,594.5
|
|
$
|
1,446.5
|
|
$
|
1,800.8
|
|
|||
|
Annualized prior 2 months sales
|
$
|
4,144.5
|
|
$
|
3,675.0
|
|
$
|
4,380.8
|
|
|||
|
Managed working capital as a % of annualized sales
|
38.5
|
%
|
39.4
|
%
|
41.1
|
%
|
||||||
|
December 31, 2014 change in managed working capital
|
$
|
148.0
|
|
|||||||||
Capital Expenditures and Acquisitions
Capital expenditures for
2014
were
$225.7 million
, compared to
$612.7 million
in
2013
and
$382.0 million
in
2012
. In all three of these years, our capital expenditures primarily related to the HRPF. Capital expenditures in 2014 were lower than our original estimate of $250 million because some HRPF payments are now scheduled to be made in 2015. We are near the end of a multi-year cycle of capital expenditures on major strategic investments. Since 2004, we have transformed ATI by investing $4.6 billion in capital expenditures and acquisitions. Nearly all of these investments have been in the United States, and approximately 75% have been self-funded.
We have significantly expanded and continue to expand our manufacturing capabilities to meet current and expected demand growth from the aerospace (engine and airframe) and defense, oil and gas, chemical process industry, electrical energy, and medical markets, especially for titanium and titanium-based alloys, nickel-based alloys and superalloys, specialty alloys, and zirconium and related alloys. Significant capital expenditures and acquisitions recently completed or in progress include:
|
•
|
Product commissioning of our Flat Rolled Products segment HRPF was completed at the end of 2014. The HRPF, a $1.2 billion capital investment excluding capitalized interest costs, is a critical part of our strategy to transform our flat rolled products business into a more competitive and consistently profitable business and is designed to:
|
|
◦
|
Significantly expand our product offering capabilities, shorten manufacturing cycle times, reduce inventory requirements, and improve the cost structure of our flat rolled products business.
|
|
◦
|
Provide unsurpassed manufacturing capability and versatility in the production of a wide range of flat rolled specialty materials, including ATI’s diversified product mix of nickel-based and specialty alloys, titanium and titanium alloys, zirconium alloys, Precision Rolled Strip
®
products, and stainless sheet and coiled plate products.
|
|
◦
|
Produce high-strength carbon steel alloys.
|
|
◦
|
Roll and process exceptional quality hot bands of up to 78.62 inches, or 2 meters, wide.
|
We expect to realize the sales growth and cost reduction benefits enabled by the HRPF as we increase production volume during 2015. We plan to idle the legacy equipment at the end of the first quarter 2015. Start-up costs of approximately $5 million pre-tax are expected to be incurred through the first quarter 2015 as we transition to full production and idle the existing legacy hot-rolling assets. We expect fourth quarter 2015 operating profit to benefit at an annualized run rate of approximately $150 million, compared to 2014, which includes the elimination of startup costs.
|
•
|
The expansion of ATI’s aerospace quality titanium sponge production capabilities in the High Performance Materials & Components segment. Titanium sponge is an important raw material used to produce our titanium mill products. Our greenfield premium-grade titanium sponge (jet engine rotating parts) facility in Rowley, UT, which started operations in 2009 with a total cost of approximately $0.5 billion, began the PQ qualification program in the 2013 fourth quarter and was approved as a premium-quality (PQ) aero-engine supplier in December 2014. The PQ qualification process for our products used in jet engine rotating parts made with our sponge is expected to be completed by mid-2015. We continue
|
38
to achieve improvements in key operational areas and expect to steadily increase production rates, and realize lower titanium production costs per pound, as we progress through 2015.
|
•
|
The acquisition in 2014 of two businesses for $92.9 million to expand our value-added capabilities to provide components and near-net shape parts. ATI Flowform Products adds precision flowforming process technologies to ATI’s capabilities. ATI Cast Products Salem Operations adds precision machining capability.
|
We currently expect our
2015
capital expenditures to be approximately $290 million, approximately 50% of which is primarily related to the completion of payments associated with the HRPF project. Our objective is to fund these capital expenditures in
2015
with cash on hand and cash flow generated from our operations, and if needed, by using a portion of our $400 million credit facility.
Total debt outstanding decreased $420.4 million in
2014
to
$1,526.9 million
at
December 31, 2014
. We made debt repayments of
$414.9 million
, including $397.5 million paid at maturity on our 2014 convertible notes and payments on debt assumed in the 2011 Ladish acquisition. In managing our overall capital structure, some of the measures on which we focus are net debt to total capitalization, which is the percentage of our debt, net of cash that may be available to reduce borrowings, to our total invested and borrowed capital, and total debt to total capitalization, which excludes cash balances. At year-end
2014
, our net debt to total capitalization was
32.6%
, compared to
24.1%
at
December 31, 2013
.
|
(In millions)
|
December 31,
2014 |
December 31,
2013 |
||||||
|
Total debt
|
$
|
1,526.9
|
|
$
|
1,947.3
|
|
||
|
Less: Cash
|
(269.5
|
)
|
(1,026.8
|
)
|
||||
|
Net debt
|
$
|
1,257.4
|
|
$
|
920.5
|
|
||
|
Total ATI stockholders’ equity
|
2,598.4
|
|
2,894.2
|
|
||||
|
Net ATI capital
|
$
|
3,855.8
|
|
$
|
3,814.7
|
|
||
|
Net debt to ATI capital
|
32.6
|
%
|
24.1
|
%
|
||||
Total debt to total capitalization was
37.0%
at
December 31, 2014
compared to
40.2%
at
December 31, 2013
.
|
(In millions)
|
December 31,
2014 |
December 31,
2013 |
||||||
|
Total debt
|
$
|
1,526.9
|
|
$
|
1,947.3
|
|
||
|
Total ATI stockholders’ equity
|
2,598.4
|
|
2,894.2
|
|
||||
|
Total ATI capital
|
$
|
4,125.3
|
|
$
|
4,841.5
|
|
||
|
Total debt to ATI capital
|
37.0
|
%
|
40.2
|
%
|
||||
We have a $400 million credit facility that includes a $200 million sublimit for the issuance of letters of credit. Under the terms of the facility, we may increase the size of the credit facility by up to $100 million without seeking the further approval of the lending group.
In October 2014, the Company amended the credit facility to modify the maximum leverage ratio and minimum interest coverage ratio permitted under the credit facility and to revise the calculation definitions for these two ratios. In addition, the amended credit facility provides for a springing lien on certain of the Company’s accounts receivable and inventory. This springing lien would become effective in the future if the Company’s credit ratings from both Standard & Poor’s and Moody’s are below investment grade, and would be subsequently released if the Company’s credit rating returns to investment grade from either rating agency, assuming no event of default condition existed.
During the fourth quarter of 2014, Moody’s downgraded the Company’s credit rating one notch to Ba1 from Baa3, resulting in an increase of the interest rate on the 2023 Notes from
5.875%
to
6.125%
effective with the interest period beginning August 15, 2014. Future downgrades of the Company’s credit ratings could result in additional increases to the interest cost with respect to the 2023 Notes.
We have an additional, separate credit facility for the issuance of letters of credit. As of
December 31, 2014
,
$32 million
in letters of credit were outstanding under this facility.
STAL, the Company’s Chinese joint venture company in which ATI has a
60%
interest, had a
205 million
renminbi revolving credit facility with a group of banks that expired in August 2014. Replacement of the credit facility is expected to be finalized in the first quarter of 2015.
39
A summary of required payments under financial instruments (excluding accrued interest) and other commitments are presented below.
|
(In millions)
|
Total
|
Less than 1
year
|
1-3
years
|
4-5
years
|
After 5
years
|
|||||||||||||||
|
Contractual Cash Obligations
|
||||||||||||||||||||
|
Total Debt including Capital Leases (A)
|
$
|
1,526.2
|
|
$
|
17.8
|
|
$
|
8.2
|
|
$
|
350.3
|
|
$
|
1,149.9
|
|
|||||
|
Operating Lease Obligations
|
98.0
|
|
19.2
|
|
33.0
|
|
21.5
|
|
24.3
|
|
||||||||||
|
Other Long-term Liabilities (B)
|
156.2
|
|
—
|
|
98.1
|
|
12.1
|
|
46.0
|
|
||||||||||
|
Unconditional Purchase Obligations
|
|
|
||||||||||||||||||
|
Raw Materials (C)
|
358.6
|
|
138.1
|
|
67.8
|
|
38.2
|
|
114.5
|
|
||||||||||
|
Capital expenditures
|
118.0
|
|
109.8
|
|
8.2
|
|
—
|
|
—
|
|
||||||||||
|
Other (D)
|
200.9
|
|
95.3
|
|
72.9
|
|
17.4
|
|
15.3
|
|
||||||||||
|
Total
|
$
|
2,457.9
|
|
$
|
380.2
|
|
$
|
288.2
|
|
$
|
439.5
|
|
$
|
1,350.0
|
|
|||||
|
Other Financial Commitments
|
||||||||||||||||||||
|
Lines of Credit (E)
|
$
|
508.7
|
|
$
|
108.7
|
|
$
|
—
|
|
$
|
400.0
|
|
$
|
—
|
|
|||||
|
Guarantees
|
$
|
20.4
|
|
|||||||||||||||||
|
(A)
|
Debt and capital leases exclude acquisition fair value adjustments.
|
|
(B)
|
Other long-term liabilities exclude pension liabilities and accrued postretirement benefits. See Note 11. Pension Plans and Other Postretirement Benefits of the notes to the 2014 consolidated financial statements for further information on these obligations.
|
|
(C)
|
We have contracted for physical delivery for certain of our raw materials to meet a portion of our needs. These contracts are based upon fixed or variable price provisions. We used current market prices as of December 31, 2014, for raw material obligations with variable pricing.
|
|
(D)
|
We have various contractual obligations that extend through 2026 for services involving production facilities and administrative operations. Our purchase obligation as disclosed represents the estimated termination fees payable if we were to exit these contracts.
|
|
(E)
|
There were no amounts drawn under foreign credit agreements at December 31, 2014. Drawn amounts include $4.7 million utilized under the $400 million credit facility for standby letters of credit, which renew annually, and $31.8 million under a separate letter of credit facility. These letters of credit are used to support: $30.7 million in workers’ compensation and general insurance arrangements, and $5.8 million related to environmental matters.
|
Commitments and Contingencies
At
December 31, 2014
, the Company had reserves for environmental remediation obligations totaling approximately
$17 million
, of which
$9 million
was included in other current liabilities. These reserves included estimated probable future costs of
$5 million
for federal Superfund and comparable state-managed sites;
$10 million
for formerly owned or operated sites for which the Company has remediation or indemnification obligations;
$1 million
for owned or controlled sites at which Company operations have been discontinued; and
$1 million
for sites utilized by the Company in its ongoing operations. The Company continues to evaluate whether it may be able to recover a portion of future costs for environmental liabilities from third parties and to pursue such recoveries where appropriate. The timing of expenditures depends on a number of factors that vary by site. The Company expects that it will expend present accruals over many years and that remediation of all sites with which it has been identified will be completed within thirty years.
At
December 31, 2014
, the Company had recognized asset retirement obligations (AROs) of
$25.4 million
related to landfill closures, decommissioning costs, facility leases and conditional AROs associated with manufacturing activities using what may be characterized as potentially hazardous materials. The sale of the tungsten materials business in 2013 included an indemnification to the buyer for conditional ARO costs of up to
$13 million
for a five year period. The Company recorded a
$9.4 million
charge in 2013 to increase recorded reserves to
$13 million
for these retained liabilities, which was reported as part of the gain on sale of the tungsten materials business.
Based on currently available information, it is reasonably possible that the costs for active matters may exceed the Company’s recorded reserves by as much as
$11 million
. However, future investigation or remediation activities may result in the discovery of additional hazardous materials, potentially higher levels of contamination than discovered during prior investigation, and may impact costs of the success or lack thereof in remedial solutions. Therefore, future developments, administrative actions or liabilities relating to environmental matters could have a material adverse effect on the Company’s consolidated financial condition or results of operations.
40
Retirement Benefits
At
December 31, 2014
, our U.S. qualified defined benefit pension plan (U.S. Plan) was approximately 76% funded in accordance with generally accepted accounting principles. The funded position of the U.S. Plan decreased in 2014 primarily due to the use of a lower discount rate to value pension obligations. In 2014, we made several significant changes to our retirement benefit programs, including a freeze of all future benefit accruals to the U.S. Plan, and to our nonqualified U.S. defined benefit pension plans, effective December 31, 2014, and also the elimination of company-provided salaried retiree life insurance benefits and all remaining company provided salaried retiree medical benefits. These changes to retirement benefits affected all participants in these various retirement benefit plans other than those employees or retirees covered by collective bargaining contracts or other contractual employment arrangements. Based upon current regulations and actuarial studies, we are not required to make a cash contribution to the U.S. Plan for
2015
. However, we may elect, depending upon investment performance of the pension plan assets and other factors, to make additional voluntary cash contributions to this plan in the future.
Dividends
We paid a quarterly cash dividend of $0.18 per share of common stock outstanding for each quarter of
2014
and
2013
. The payment of dividends and the amount of such dividends depends upon matters deemed relevant by our Board of Directors, such as our results of operations, financial condition, cash requirements, future prospects, any limitations imposed by law, credit agreements or senior securities, and other factors deemed relevant and appropriate.
Critical Accounting Policies
The accompanying consolidated financial statements have been prepared in conformity with United States generally accepted accounting principles. When more than one accounting principle, or the method of its application, is generally accepted, management selects the principle or method that is appropriate in our specific circumstances. Application of these accounting principles requires our management to make estimates about the future resolution of existing uncertainties; as a result, actual results could differ from these estimates. In preparing these consolidated financial statements, management has made its best estimates and judgments of the amounts and disclosures included in the financial statements giving due regard to materiality.
Inventories
At
December 31, 2014
, we had net inventory of
$1,472.8 million
. Inventories are stated at the lower of cost (last-in, first-out (LIFO), first-in, first-out (FIFO) and average cost methods) or market, less progress payments. Costs include direct material, direct labor and applicable manufacturing and engineering overhead, and other direct costs. Most of our inventory is valued utilizing the LIFO costing methodology. Inventory of our non-U.S. operations is valued using average cost or FIFO methods. Under the LIFO inventory valuation method, changes in the cost of raw materials and production activities are recognized in cost of sales in the current period even though these material and other costs may have been incurred at significantly different values due to the length of time of our production cycle. In a period of rising prices, cost of sales expense recognized under LIFO is generally higher than the cash costs incurred to acquire the inventory sold. Conversely, in a period of declining raw material prices, cost of sales recognized under LIFO is generally lower than cash costs incurred to acquire the inventory sold. Generally, over time based on overall inflationary trends in raw materials, labor and overhead costs, the use of the LIFO inventory valuation method will result in a LIFO inventory valuation reserve, as the higher current period costs are included in cost of sales and the balance sheet carrying value of inventory is reduced.
The prices for many of the raw materials we use have been extremely volatile during the past several years. Since we value most of our inventory utilizing the LIFO inventory costing methodology, a rise in raw material costs has a negative effect on our operating results by increasing cost of sales while lowering the carrying value of inventory, while, conversely, a fall in material costs results in a benefit to operating results by reducing cost of sales and increasing inventory carrying value. For example, in
2014
, the effect of rising raw material costs on our LIFO inventory valuation method resulted in cost of sales from continuing operations which were
$24.6 million
higher than would have been recognized had we utilized the FIFO methodology to value our inventory. Conversely, in
2013
and
2012
, the effect of falling raw material costs on our LIFO inventory valuation method resulted in cost of sales from continuing operations which were
$80.9 million
and
$75.6 million
, respectively, lower than would have been recognized had we utilized the FIFO methodology to value our inventory. However, in cases where inventory at FIFO cost is lower than the LIFO carrying value, a write-down of the inventory to market may be required, subject to a lower of cost or market evaluation.
In applying the lower of cost or market principle, market means current replacement cost, subject to a ceiling (market value shall not exceed net realizable value) and a floor (market shall not be less than net realizable value reduced by an allowance for a normal profit margin). We evaluate product lines on a quarterly basis to identify inventory values that exceed estimated net realizable value. The calculation of a resulting reserve, if any, is recognized as an expense in the period that the need for the reserve is identified. At December 31, 2013, the carrying value of our LIFO inventory exceeded FIFO, and a
$35.0 million
net
41
realizable value reserve was recorded in the High Performance Materials & Components segment. This net realizable value reserve was reduced to
$10.0 million
at
December 31, 2014
. In
2014
and
2013
, based on continued weak demand for industrial titanium products from global markets, we recorded a
$23.2 million
and
$20.5 million
, respectively, lower of cost or market inventory charge in the Flat Rolled Products segment, to reduce the carrying value of these product inventories to current market levels.
It is our general policy to write-down to scrap value any inventory that is identified as obsolete and any inventory that has aged or has not moved in more than twelve months. In some instances this criterion is up to twenty-four months due to the longer manufacturing and distribution process for such products.
The LIFO inventory valuation methodology is not utilized by many of the companies with which we compete, including foreign competitors. As such, our results of operations may not be comparable to those of our competitors during periods of volatile material costs due, in part, to the differences between the LIFO inventory valuation method and other acceptable inventory valuation methods.
Asset Impairment
We monitor the recoverability of the carrying value of our long-lived assets. An impairment charge is recognized when the expected net undiscounted future cash flows from an asset’s use (including any proceeds from disposition) are less than the asset’s carrying value, and the asset’s carrying value exceeds its fair value. Changes in the expected use of a long-lived asset group, and the financial performance of the long-lived asset group and its operating segment, are evaluated as indicators of possible impairment. Future cash flow value may include appraisals for property, plant and equipment, land and improvements, future cash flow estimates from operating the long-lived assets, and other operating considerations. We perform the required annual goodwill impairment and indefinite lived intangible asset evaluations in the fourth quarter of each year. Additionally, in the fourth quarter of each year in conjunction with the annual business planning cycle, or more frequently if new material information is available, we evaluate the recoverability of temporarily idled facilities.
For example, as part of our 2014-2018 strategic planning process, which was completed in the fourth quarter of 2013, we updated our strategic assessment of the likely future use of several manufacturing facilities. The strategic investments in manufacturing capabilities and process technologies we have made in the last several years enabled the closure in 2013 of older, higher-cost operations, and the streamlining of our manufacturing processes by reducing our manufacturing footprint. In 2013, we recorded a $67.5 million restructuring charge, which included $55.1 million of impairment charges relating to the previously idled Albany, OR standard grade titanium sponge production facility, the previously idled New Castle, IN flat rolled stainless finishing facility, and the Wallingford, CT flat rolled stainless finishing facility, which was closed in 2014.
Also, during 2013, we completed a strategic review of our iron castings and fabricated components businesses. These businesses were not projected to meet the Company’s long-term profitable growth and return on capital employed expectations, resulting in the closure of the fabricated components business and planned divestiture of the iron casting business in 2013. In April 2014, the Company announced the closure of the iron castings business, as the divestiture of this business through a sale process on commercially acceptable terms was unlikely to be successful. The orderly wind-down of operations was completed by the end of the third quarter 2014. The closure of the iron castings business resulted in
$1.8 million
of cash exit costs in 2014, primarily related to severance benefits, of which
$1.0 million
was paid in 2014. Payment of the remaining cash exit costs for the iron casting business is expected to be completed within the next twelve months. In addition, we recorded $18.6 million of asset impairment of long-lived assets associated with these operations in 2013. These businesses are reported as discontinued operations for all periods presented, and are not reported within our sales, results of continuing operations, or business segment results.
We perform our annual goodwill impairment evaluations in the fourth quarter of each year. No impairments were determined to exist for the years ended
December 31, 2014
,
2013
or
2012
. The fair values of all reporting units significantly exceeded the carrying values for the 2014 evaluation.
Retirement Benefits
We have defined benefit pension plans or defined contribution retirement plans covering substantially all of our employees. We also sponsor several postretirement plans covering certain hourly and salaried employees and retirees. These plans provide health care and life insurance benefits for eligible employees. In December 2014, the Company announced several significant changes to its retirement benefit programs. These changes are part of our ongoing initiatives to create an integrated and aligned business with a market competitive, cost competitive, and consistent health, welfare and retirement benefit structure across our operations. These changes included:
42
|
•
|
Freezing all future benefit accruals to our U.S. qualified defined benefit pension plan (U.S. Plan), and to our non-qualified defined benefit pension plans, including the executive Supplemental Pension Plan, effective December 31, 2014.
|
|
•
|
Implementing a consistent defined contribution retirement plan with a base
6.5%
company contribution and up to
3%
in Company matching contributions across all U.S. operations effective January 1, 2015.
|
|
•
|
Ending Company-provided salaried retiree life insurance benefits effective January 1, 2015.
|
|
•
|
Ending all remaining Company-provided salaried retiree medical benefits on January 1, 2016. The salaried retiree medical benefit plan being ended was assumed as part of the 2011 Ladish acquisition. Certain participants in the retiree medical plan will have transition provisions through the end of 2016.
|
|
•
|
These changes to pension, retiree life insurance and medical benefits do not affect benefits for those employees or retirees covered by collective bargaining contracts or other contractual employment agreements.
|
Under U.S. generally accepted accounting principles, benefit expenses recognized in financial statements for defined benefit pension plans are determined on an actuarial basis, rather than as contributions are made to the plan. A significant element in determining our pension expense in accordance with the accounting standards is the expected investment return on plan assets. In establishing the expected return on plan investments, which is reviewed annually in the fourth quarter, we take into consideration input from our third party pension plan asset managers and actuaries regarding the types of securities the plan assets are invested in, how those investments have performed historically, and expectations for how those investments will perform in the future. Our expected long-term return on pension plan investments was
8.25%
in
2014
, and the expected long-term rate of return for
2015
will be
8.0%
. We apply this assumed rate to the market value of plan assets at the end of the previous year. This produces the expected return on plan assets that is included in annual pension expense for the current year. The actual returns on pension plan assets for the last five years have been
6.5%
for
2014
,
14.3%
for
2013
,
8.0%
for
2012
,
0.3%
for
2011
, and
12.2%
for
2010
. The effect of increasing, or lowering, the expected return on pension plan investments by 0.25% results in additional pre-tax annual income, or expense, of approximately $5.2 million. The cumulative difference between this expected return and the actual return on plan assets is deferred and amortized into pension income or expense over future periods. The amount of expected return on plan assets can vary significantly from year-to-year since the calculation is dependent on the market value of plan assets as of the end of the preceding year. U.S. generally accepted accounting principles allow companies to calculate the expected return on pension assets using either an average of fair market values of pension assets over a period not to exceed five years, which reduces the volatility in reported pension income or expense, or their fair market value at the end of the previous year. However, the U.S. Securities and Exchange Commission currently does not permit companies to change from the fair market value at the end of the previous year methodology, which is the methodology that we use, to an averaging of fair market values of plan assets methodology. As a result, our results of operations and those of other companies, including companies with which we compete, may not be comparable due to these different methodologies in calculating the expected return on pension investments.
In accordance with accounting standards, we determine the discount rate used to value pension plan liabilities as of the last day of our fiscal year. The discount rate reflects the current rate at which the pension liabilities could be effectively settled. In estimating this rate, we receive input from our actuaries regarding the rates of return on high quality, fixed-income investments with maturities matched to the expected future retirement benefit payments. Based on this assessment, we established a discount rate of
4.25%
for valuing the pension liabilities as of
December 31, 2014
, and for determining the pension expense for
2015
. We had previously assumed a discount rate of
5.15%
at the end of
2013
and
4.25%
at the end of
2012
. The estimated effect of changing the discount rate by 0.50% would decrease pension liabilities in the case of an increase in the discount rate, or increase pension liabilities in the case of a decrease in the discount rate, by approximately $175 million. Such a change in the discount rate would decrease pension expense in the case of an increase in the discount rate, or increase pension expense in the case of a decrease in the discount rate, by approximately $4 million. The effect on pension liabilities for changes to the discount rate, as well as the net effect of other changes in actuarial assumptions and experience, are deferred and amortized over future periods in accordance with the accounting standards.
Changes in the benefit obligation for 2014 include the effects of updated estimates of participant life expectancy, including consideration of the impacts of the updated 2014 U.S. Society of Actuaries projections and Company-specific experience. These mortality assumption changes increased the projected benefit obligation at December 31, 2014 by approximately
$90 million
.
As discussed above, gains and losses due to differences between actual and expected results for investment returns on plan assets, changes in the discount rate used to value benefit obligations, and other changes in estimates such as participant life expectancy are deferred and recognized in the income statement over future periods. However for balance sheet presentation, these gains and losses are included in the determination of benefit obligations, net of plan assets, included on the year-end consolidated statement of financial position. At
December 31, 2014
, the Company had
$1.4 billion
of pre-tax net actuarial losses on its pension obligations, primarily related to an extended decline over the last several years in the discount rate used to value the pension obligations. These actuarial losses have been recognized on the consolidated balance sheet through a
43
reduction in stockholders’ equity, and are being recognized in the consolidated statement of operations through expense amortizations over future years. As a result of the pension freeze effective December 31, 2014 and the resultant determination of inactive status, beginning in 2015, the U.S. Plan and the non-qualified U.S. pension plans will change the amortization period for accumulated other comprehensive loss recognition to average remaining life expectancy, which is approximately
18
years on a weighted average basis, rather than the average remaining service period of
10
years, which was used in 2014 and prior periods.
With respect to our postretirement plans, under most of the plans, our contributions towards retiree medical premiums are capped based upon the cost as of certain dates, thereby creating a defined contribution. For the non-collectively bargained plans, we maintain the right to amend or terminate the plans in the future. In accordance with U.S. generally accepted accounting standards, postretirement expenses recognized in financial statements associated with defined benefit plans are determined on an actuarial basis, rather than as benefits are paid. We use actuarial assumptions, including the discount rate and the expected trend in health care costs, to estimate the costs and benefit obligations for these plans. The discount rate, which is determined annually at the end of each fiscal year, is developed based upon rates of return on high quality, fixed-income investments. At the end of
2014
, we determined the rate to be
4.10%
, compared to a
5.15%
discount rate in
2013
, and a
4.25%
discount rate in
2012
. The estimated effect of changing the discount rate by 0.50%, would decrease postretirement obligations in the case of an increase in the discount rate, or increase postretirement obligations in the case of a decrease in the discount rate, by approximately $20 million. Such a change in the discount rate would decrease postretirement benefit expense in the case of an increase in the discount rate, or increase postretirement benefit expense in the case of a decrease in the discount rate, by approximately $1.2 million. Based upon predictions of continued significant medical cost inflation in future years, the annual assumed rate of increase in the per capita cost of covered benefits of health care plans is
8.0%
in
2015
and is assumed to gradually decrease to
5.0%
in the year
2028
and remain level thereafter.
New Accounting Pronouncements Adopted
In January 2014, the Company adopted changes issued by the Financial Accounting Standards Board (FASB) that require an entity to net its liability for unrecognized tax positions against a net operating loss carryforward, a similar tax loss or a tax credit carryforward when settlement in this manner is available under the tax law. The adoption of these changes had no impact on the consolidated financial statements.
In January 2014, the Company adopted changes issued by the FASB to the accounting for obligations resulting from joint and several liability arrangements. This guidance requires an entity that is joint and severally liable to measure the obligation as the sum of the amount the entity has agreed with co-obligors to pay and any additional amount it expects to pay on behalf of one or more co-obligors. Required disclosures include a description of the nature of the arrangement, how the liability arose, the relationship with co-obligors and the terms and conditions of the arrangement. The adoption of these changes had no impact on the consolidated financial statements.
In January 2014, the Company adopted changes issued by the FASB to a parent entity’s accounting for the cumulative translation adjustment (CTA) upon derecognition of certain subsidiaries or groups of assets within a foreign entity or of an investment in a foreign entity. The amendments specify that CTA should be released into earnings when an entity ceases to have a controlling financial interest in a subsidiary or group of assets within a consolidated foreign entity and the sale or transfer results in the complete or substantially complete liquidation of the foreign entity. For sales of an equity method investment that is a foreign entity, a pro rata portion of CTA attributable to the investment would be recognized in earnings when the investment is sold. When an entity sells either a part or all of its investment in a consolidated foreign entity, CTA would be recognized in earnings only if the sale results in the parent no longer having a controlling financial interest in the foreign entity. In addition, CTA should be recognized in earnings in a business combination achieved in stages (i.e., a step acquisition). The adoption of these changes had no impact on the consolidated financial statements.
Pending Accounting Pronouncements
In May 2014, the FASB issued changes to revenue recognition with customers. This update provides a five-step analysis of transactions to determine when and how revenue is recognized. An entity should recognize revenue to depict the transfer of promised goods or services to customers in an amount that reflects the consideration to which the entity expects to be entitled in exchange for those goods or services. This update will be effective for the Company beginning in fiscal year 2017. This update may be applied retrospectively to each prior reporting period presented or retrospectively with the cumulative effect of initially applying this update recognized at the date of initial application. The Company is currently evaluating the impact of the new guidance on its consolidated financial statements.
In April 2014, the FASB issued changes to the criteria for reporting discontinued operations. Under the new criteria, a disposal of a component of an entity is required to be reported as discontinued operations only if the disposal represents a strategic shift
44
that has, or will have, a major effect on an entity’s operations and financial results. The current criteria that there be no significant continuing involvement in the operations of the component after the disposal transaction has been removed under the new guidance. The new guidance also requires the presentation of the assets and liabilities of a disposal group that includes a discontinued operation for each comparative period and requires additional disclosures about discontinued operations, including the major line items constituting the pretax profit or loss of the discontinued operation, certain cash flow information for the discontinued operation, expanded disclosures about an entity’s significant continuing involvement in a discontinued operation, and disclosures about a disposal of an individually significant component of an entity that does not qualify for discontinued operations presentation. The provisions of the new guidance become effective for all disposals that occur for the Company beginning in fiscal year 2015. The Company does not anticipate a material impact to the consolidated financial statements upon adoption.
Forward-Looking Statements
From time-to-time, the Company has made and may continue to make “forward-looking statements” within the meaning of the Private Securities Litigation Reform Act of 1995. Certain statements in this report relate to future events and expectations and, as such, constitute forward-looking statements. Forward-looking statements include those containing such words as “anticipates,” “believes,” “estimates,” “expects,” “would,” “should,” “will,” “will likely result,” “forecast,” “outlook,” “projects,” and similar expressions. Such forward-looking statements are based on management’s current expectations and include known and unknown risks, uncertainties and other factors, many of which the Company is unable to predict or control, that may cause our actual results or performance to materially differ from any future results or performance expressed or implied by such statements. Various of these factors are described in Item 1A, Risk Factors, of this Annual Report on Form 10-K and will be described from time-to-time in the Company filings with the SEC, including the Company’s Annual Reports on Form 10-K and the Company’s subsequent reports filed with the SEC on Form 10-Q and Form 8-K, which are available on the SEC’s website at http://www.sec.gov and on the Company’s website at http://www.atimetals.com. We assume no duty to update our forward-looking statements.
As part of our risk management strategy, we utilize derivative financial instruments, from time to time, to hedge our exposure to changes in energy and raw material prices, foreign currencies, and interest rates. We monitor the third-party financial institutions which are our counterparty to these financial instruments on a daily basis and diversify our transactions among counterparties to minimize exposure to any one of these entities. Fair values for derivatives were measured using exchange-traded prices for the hedged items including consideration of counterparty risk and the Company’s credit risk. Our exposure to volatility in interest rates is presently not material, as nearly all of our debt is at fixed interest rates.
Volatility of Energy Prices.
Energy resources markets are subject to conditions that create uncertainty in the prices and availability of energy resources. The prices for and availability of electricity, natural gas, oil and other energy resources are subject to volatile market conditions. These market conditions often are affected by political and economic factors beyond our control. Increases in energy costs, or changes in costs relative to energy costs paid by competitors, have and may continue to adversely affect our profitability. To the extent that these uncertainties cause suppliers and customers to be more cost sensitive, increased energy prices may have an adverse effect on our results of operations and financial condition. We use approximately 12 to 14 million MMBtu’s of natural gas annually, depending upon business conditions, in the manufacture of our products. These purchases of natural gas expose us to risk of higher gas prices. For example, a hypothetical $1.00 per MMBtu increase in the price of natural gas would result in increased annual energy costs of approximately $12 to $14 million. We use several approaches to minimize any material adverse effect on our financial condition or results of operations from volatile energy prices. These approaches include incorporating an energy surcharge on many of our products and using financial derivatives to reduce exposure to energy price volatility.
At
December 31, 2014
, the outstanding financial derivatives used to hedge our exposure to energy cost volatility included natural gas hedges. For natural gas, approximately
80%
of our forecasted requirements for 2015,
70%
for 2016 and
40%
for 2017 are hedged. The net mark-to-market valuation of these outstanding natural gas hedges at
December 31, 2014
was an unrealized pre-tax loss of $18.1 million, comprised of
$10.2 million
in accrued liabilities and
$7.9 million
in other long-term liabilities. For the year ended
December 31, 2014
, the effects of natural gas hedging activity decreased cost of sales by
$3.4 million
. There were no material electricity hedge contracts outstanding as of December 31, 2014. The net mark-to-market valuation of the electricity hedges at
December 31, 2014
was an unrealized pre-tax loss of
$0.1 million
in accrued liabilities on the consolidated balance sheet. For the year ended
December 31, 2014
, the effects of electricity hedging activity decreased cost of sales by
$0.7 million
.
Volatility of Raw Material Prices.
We use raw materials surcharge and index mechanisms to offset the impact of increased raw material costs; however, competitive factors in the marketplace can limit our ability to institute such mechanisms, and there can
45
be a delay between the increase in the price of raw materials and the realization of the benefit of such mechanisms. For example, in 2014 we used approximately 120 million pounds of nickel; therefore a hypothetical change of $1.00 per pound in nickel prices would result in increased costs of approximately $120 million. In addition, in 2014 we also used approximately 830 million pounds of ferrous scrap in the production of our flat rolled products and a hypothetical change of $0.01 per pound would result in increased costs of approximately $8 million. While we enter into raw materials futures contracts from time-to-time to hedge exposure to price fluctuations, such as for nickel, we cannot be certain that our hedge position adequately reduces exposure. We believe that we have adequate controls to monitor these contracts, but we may not be able to accurately assess exposure to price volatility in the markets for critical raw materials.
The majority of our products are sold utilizing raw material surcharges and index mechanisms. However as of
December 31, 2014
, we had entered into financial hedging arrangements, primarily at the request of our customers, related to firm orders, for an aggregate amount of approximately
15%
of our estimated annual nickel requirements. These nickel hedges extend to
2020
. Any gain or loss associated with these hedging arrangements is included in cost of sales. At
December 31, 2014
, the net mark-to-market valuation of our outstanding raw material hedges was an unrealized pre-tax loss of $7.2 million, comprised of
$1.1 million
in prepaid expenses and other current assets,
$0.5 million
in other assets,
$5.8 million
in accrued liabilities and
$3.0 million
in other long-term liabilities.
Foreign Currency Risk.
Foreign currency exchange contracts are used, from time-to-time, to limit transactional exposure to changes in currency exchange rates. We sometimes purchase foreign currency forward contracts that permit us to sell specified amounts of foreign currencies expected to be received from our export sales for pre-established U.S. dollar amounts at specified dates. The forward contracts are denominated in the same foreign currencies in which export sales are denominated. These contracts are designated as hedges of the variability in cash flows of a portion of the forecasted future export sales transactions which otherwise would expose the Company to foreign currency risk, primarily euros. At
December 31, 2014
, the Company held euro forward sales contracts designated as hedges with a notional value of approximately
388 million
euros with maturity dates through June 2018, including approximately
175 million
euros with maturities in 2015. We may also enter into foreign currency forward contracts that are not designated as hedges, which are denominated in the same foreign currency in which export sales are denominated. In addition, we may also designate cash balances held in foreign currencies as hedges of forecasted foreign currency transactions. At
December 31, 2014
, the net mark-to-market valuation of the outstanding foreign currency forward contracts was an unrealized pre-tax gain of $58.3 million, comprised of $30.0 million in prepaid expenses and other current assets and
$28.3 million
in other assets.
46
Report of Independent Registered Public Accounting Firm
The Board of Directors and Stockholders of Allegheny Technologies Incorporated and Subsidiaries
We have audited the accompanying consolidated balance sheets of Allegheny Technologies Incorporated and Subsidiaries as of
December 31, 2014
and
2013
, and the related consolidated statements of operations, comprehensive income, cash flows, and changes in equity for each of the three years in the period ended
December 31, 2014
. These financial statements are the responsibility of the Company’s management. Our responsibility is to express an opinion on these financial statements based on our audits.
We conducted our audits in accordance with the standards of the Public Company Accounting Oversight Board (United States). Those standards require that we plan and perform the audit to obtain reasonable assurance about whether the financial statements are free of material misstatement. An audit includes examining, on a test basis, evidence supporting the amounts and disclosures in the financial statements. An audit also includes assessing the accounting principles used and significant estimates made by management, as well as evaluating the overall financial statement presentation. We believe that our audits provide a reasonable basis for our opinion.
In our opinion, the financial statements referred to above present fairly, in all material respects, the consolidated financial position of Allegheny Technologies Incorporated and Subsidiaries at
December 31, 2014
and
2013
, and the consolidated results of their operations and their cash flows for each of the three years in the period ended
December 31, 2014
, in conformity with U.S. generally accepted accounting principles.
We also have audited, in accordance with the standards of the Public Company Accounting Oversight Board (United States), Allegheny Technologies Incorporated and Subsidiaries’ internal control over financial reporting as of
December 31, 2014
, based on criteria established in Internal Control-Integrated Framework issued by the Committee of Sponsoring Organizations of the Treadway Commission (2013 framework) and our report dated
February 26, 2015
expressed an unqualified opinion thereon.
/s/ Ernst & Young LLP
Pittsburgh, Pennsylvania
February 26, 2015
47
Allegheny Technologies Incorporated and Subsidiaries
(In millions, except per share amounts)
|
For the Years Ended December 31,
|
2014
|
2013
|
2012
|
|||||||||
|
Sales
|
$
|
4,223.4
|
|
$
|
4,043.5
|
|
$
|
4,666.9
|
|
|||
|
Costs and expenses:
|
||||||||||||
|
Cost of sales
|
3,844.8
|
|
3,790.9
|
|
4,041.4
|
|
||||||
|
Selling and administrative expenses
|
272.5
|
|
276.4
|
|
321.6
|
|
||||||
|
Restructuring costs
|
—
|
|
67.5
|
|
—
|
|
||||||
|
Income (loss) before interest, other income and income taxes
|
106.1
|
|
(91.3
|
)
|
303.9
|
|
||||||
|
Interest expense, net
|
(108.7
|
)
|
(65.2
|
)
|
(71.6
|
)
|
||||||
|
Other income, net
|
4.1
|
|
1.7
|
|
—
|
|
||||||
|
Income (loss) from continuing operations before income taxes
|
1.5
|
|
(154.8
|
)
|
232.3
|
|
||||||
|
Income tax provision (benefit)
|
(8.7
|
)
|
(63.6
|
)
|
72.4
|
|
||||||
|
Income (loss) from continuing operations
|
10.2
|
|
(91.2
|
)
|
159.9
|
|
||||||
|
Income (loss) from discontinued operations, net of tax
|
(0.6
|
)
|
252.8
|
|
7.9
|
|
||||||
|
Net income
|
9.6
|
|
161.6
|
|
167.8
|
|
||||||
|
Less: Net income attributable to noncontrolling interests
|
12.2
|
|
7.6
|
|
9.4
|
|
||||||
|
Net income (loss) attributable to ATI
|
$
|
(2.6
|
)
|
$
|
154.0
|
|
$
|
158.4
|
|
|||
|
Basic net income (loss) per common share
|
||||||||||||
|
Continuing operations attributable to ATI per common share
|
$
|
(0.02
|
)
|
$
|
(0.93
|
)
|
$
|
1.42
|
|
|||
|
Discontinued operations attributable to ATI per common share
|
(0.01
|
)
|
2.37
|
|
0.07
|
|
||||||
|
Basic net income (loss) attributable to ATI per common share
|
$
|
(0.03
|
)
|
$
|
1.44
|
|
$
|
1.49
|
|
|||
|
Diluted net income (loss) per common share
|
||||||||||||
|
Continuing operations attributable to ATI per common share
|
$
|
(0.02
|
)
|
$
|
(0.93
|
)
|
$
|
1.36
|
|
|||
|
Discontinued operations attributable to ATI per common share
|
(0.01
|
)
|
2.37
|
|
0.07
|
|
||||||
|
Diluted net income (loss) attributable to ATI per common share
|
$
|
(0.03
|
)
|
$
|
1.44
|
|
$
|
1.43
|
|
|||
|
Amounts attributable to ATI common stockholders
|
||||||||||||
|
Income (loss) from continuing operations, net of tax
|
$
|
(2.0
|
)
|
$
|
(98.8
|
)
|
$
|
150.5
|
|
|||
|
Income (loss) from discontinued operations, net of tax
|
(0.6
|
)
|
252.8
|
|
7.9
|
|
||||||
|
Net income (loss)
|
$
|
(2.6
|
)
|
$
|
154.0
|
|
$
|
158.4
|
|
|||
The accompanying notes are an integral part of these statements.
48
Allegheny Technologies Incorporated and Subsidiaries
Consolidated Statements of Comprehensive Income
(In millions)
|
For the Years Ended December 31,
|
2014
|
2013
|
2012
|
|||||||||
|
Net income
|
$
|
9.6
|
|
$
|
161.6
|
|
$
|
167.8
|
|
|||
|
Currency translation adjustment
|
||||||||||||
|
Unrealized net change arising during the period
|
(34.1
|
)
|
13.8
|
|
14.3
|
|
||||||
|
Reclassification adjustment included in net income
|
0.5
|
|
1.5
|
|
—
|
|
||||||
|
Total
|
(33.6
|
)
|
15.3
|
|
14.3
|
|
||||||
|
Unrealized holding gain (loss) on securities
|
||||||||||||
|
Net gain arising during the period
|
—
|
|
0.1
|
|
—
|
|
||||||
|
Derivatives
|
||||||||||||
|
Net derivatives gain (loss) on hedge transactions
|
45.7
|
|
(25.2
|
)
|
(9.8
|
)
|
||||||
|
Reclassification to net income of net realized loss (gain)
|
(3.6
|
)
|
14.0
|
|
5.2
|
|
||||||
|
Income taxes on derivative transactions
|
16.2
|
|
(4.3
|
)
|
(1.8
|
)
|
||||||
|
Total
|
25.9
|
|
(6.9
|
)
|
(2.8
|
)
|
||||||
|
Postretirement benefit plans
|
||||||||||||
|
Actuarial loss
|
||||||||||||
|
Amortization of net actuarial loss
|
88.1
|
|
129.0
|
|
119.8
|
|
||||||
|
Net gain (loss) arising during the period
|
(424.5
|
)
|
384.9
|
|
(272.7
|
)
|
||||||
|
Prior service cost
|
||||||||||||
|
Amortization to net income of net prior service credits
|
(0.7
|
)
|
(15.2
|
)
|
(11.8
|
)
|
||||||
|
Income taxes on postretirement benefit plans
|
(124.5
|
)
|
187.6
|
|
(67.3
|
)
|
||||||
|
Total
|
(212.6
|
)
|
311.1
|
|
(97.4
|
)
|
||||||
|
Other comprehensive income (loss), net of tax
|
(220.3
|
)
|
319.6
|
|
(85.9
|
)
|
||||||
|
Comprehensive income (loss)
|
(210.7
|
)
|
481.2
|
|
81.9
|
|
||||||
|
Less: Comprehensive income attributable to noncontrolling interests
|
10.1
|
|
11.0
|
|
11.3
|
|
||||||
|
Comprehensive income (loss) attributable to ATI
|
$
|
(220.8
|
)
|
$
|
470.2
|
|
$
|
70.6
|
|
|||
The accompanying notes are an integral part of these statements.
49
Allegheny Technologies Incorporated and Subsidiaries
|
(In millions, except share and per share amounts)
|
December 31,
2014 |
December 31,
2013 |
||||||
|
Assets
|
||||||||
|
Cash and cash equivalents
|
$
|
269.5
|
|
$
|
1,026.8
|
|
||
|
Accounts receivable, net
|
603.6
|
|
528.2
|
|
||||
|
Inventories, net
|
1,472.8
|
|
1,322.1
|
|
||||
|
Prepaid expenses and other current assets
|
136.2
|
|
73.7
|
|
||||
|
Total Current Assets
|
2,482.1
|
|
2,950.8
|
|
||||
|
Property, plant and equipment, net
|
2,961.8
|
|
2,874.1
|
|
||||
|
Cost in excess of net assets acquired
|
780.4
|
|
727.9
|
|
||||
|
Other assets
|
358.3
|
|
345.7
|
|
||||
|
Total Assets
|
$
|
6,582.6
|
|
$
|
6,898.5
|
|
||
|
Liabilities and Stockholders’ Equity
|
||||||||
|
Accounts payable
|
$
|
556.7
|
|
$
|
471.8
|
|
||
|
Accrued liabilities
|
323.2
|
|
315.8
|
|
||||
|
Deferred income taxes
|
62.2
|
|
3.5
|
|
||||
|
Short-term debt and current portion of long-term debt
|
17.8
|
|
419.9
|
|
||||
|
Total Current Liabilities
|
959.9
|
|
1,211.0
|
|
||||
|
Long-term debt
|
1,509.1
|
|
1,527.4
|
|
||||
|
Accrued postretirement benefits
|
415.8
|
|
442.4
|
|
||||
|
Pension liabilities
|
739.3
|
|
368.2
|
|
||||
|
Deferred income taxes
|
80.9
|
|
206.6
|
|
||||
|
Other long-term liabilities
|
156.2
|
|
148.2
|
|
||||
|
Total Liabilities
|
3,861.2
|
|
3,903.8
|
|
||||
|
Redeemable noncontrolling interest
|
12.1
|
|
—
|
|
||||
|
Equity:
|
||||||||
|
ATI Stockholders’ Equity:
|
||||||||
|
Preferred stock, par value $0.10: authorized-50,000,000 shares; issued-none
|
—
|
|
—
|
|
||||
|
Common stock, par value $0.10: authorized-500,000,000 shares; issued-109,695,171 shares at December 31, 2014 and 2013; outstanding-108,710,914 shares at December 31, 2014 and 107,983,360 shares at December 31, 2013
|
11.0
|
|
11.0
|
|
||||
|
Additional paid-in capital
|
1,164.2
|
|
1,185.9
|
|
||||
|
Retained earnings
|
2,398.9
|
|
2,490.1
|
|
||||
|
Treasury stock: 984,257 shares at December 31, 2014 and 1,711,811 shares at December 31, 2013
|
(44.3
|
)
|
(79.6
|
)
|
||||
|
Accumulated other comprehensive loss, net of tax
|
(931.4
|
)
|
(713.2
|
)
|
||||
|
Total ATI Stockholders’ Equity
|
2,598.4
|
|
2,894.2
|
|
||||
|
Noncontrolling Interests
|
110.9
|
|
100.5
|
|
||||
|
Total Stockholders’ Equity
|
2,709.3
|
|
2,994.7
|
|
||||
|
Total Liabilities and Stockholders’ Equity
|
$
|
6,582.6
|
|
$
|
6,898.5
|
|
||
The accompanying notes are an integral part of these statements.
50
Allegheny Technologies Incorporated and Subsidiaries
(In millions)
|
For the Years Ended December 31,
|
2014
|
2013
|
2012
|
|||||||||
|
Operating Activities:
|
||||||||||||
|
Net income
|
$
|
9.6
|
|
$
|
161.6
|
|
$
|
167.8
|
|
|||
|
Adjustments to reconcile net income to net cash provided by operating activities:
|
||||||||||||
|
Depreciation and amortization
|
176.8
|
|
189.9
|
|
194.0
|
|
||||||
|
Deferred taxes
|
31.7
|
|
70.1
|
|
(19.4
|
)
|
||||||
|
Non-cash restructuring costs
|
—
|
|
72.7
|
|
13.0
|
|
||||||
|
Gain on sale of business
|
—
|
|
(428.3
|
)
|
—
|
|
||||||
|
Change in operating assets and liabilities:
|
||||||||||||
|
Retirement benefits
|
3.1
|
|
70.6
|
|
58.9
|
|
||||||
|
Accounts receivable
|
(70.3
|
)
|
41.1
|
|
95.8
|
|
||||||
|
Inventories
|
(143.7
|
)
|
146.6
|
|
(152.3
|
)
|
||||||
|
Accounts payable
|
82.1
|
|
(7.8
|
)
|
9.2
|
|
||||||
|
Accrued income taxes
|
(37.5
|
)
|
(25.5
|
)
|
9.4
|
|
||||||
|
Accrued liabilities and other
|
4.1
|
|
77.4
|
|
51.1
|
|
||||||
|
Cash provided by operating activities
|
55.9
|
|
368.4
|
|
427.5
|
|
||||||
|
Investing Activities:
|
||||||||||||
|
Purchases of property, plant and equipment
|
(225.7
|
)
|
(612.7
|
)
|
(382.0
|
)
|
||||||
|
Proceeds from sale of business, net of transaction costs
|
—
|
|
600.9
|
|
—
|
|
||||||
|
Purchases of businesses, net of cash acquired
|
(92.9
|
)
|
—
|
|
—
|
|
||||||
|
Asset disposals and other
|
2.4
|
|
0.8
|
|
3.3
|
|
||||||
|
Cash used in investing activities
|
(316.2
|
)
|
(11.0
|
)
|
(378.7
|
)
|
||||||
|
Financing Activities:
|
||||||||||||
|
Issuances of long-term debt
|
—
|
|
500.0
|
|
—
|
|
||||||
|
Payments on long-term debt and capital leases
|
(414.9
|
)
|
(17.1
|
)
|
(16.7
|
)
|
||||||
|
Net repayments under credit facilities
|
—
|
|
(14.4
|
)
|
(10.4
|
)
|
||||||
|
Debt issuance costs
|
(1.2
|
)
|
(5.2
|
)
|
—
|
|
||||||
|
Dividends paid to shareholders
|
(77.1
|
)
|
(76.9
|
)
|
(76.5
|
)
|
||||||
|
Dividends paid to noncontrolling interests
|
—
|
|
(18.0
|
)
|
—
|
|
||||||
|
Shares repurchased for income tax withholding on share-based compensation
|
(3.9
|
)
|
(6.6
|
)
|
(23.4
|
)
|
||||||
|
Taxes on share-based compensation
|
—
|
|
2.6
|
|
—
|
|
||||||
|
Exercises of stock options and other
|
0.1
|
|
0.4
|
|
2.2
|
|
||||||
|
Cash provided by (used in) financing activities
|
(497.0
|
)
|
364.8
|
|
(124.8
|
)
|
||||||
|
Increase (decrease) in cash and cash equivalents
|
(757.3
|
)
|
722.2
|
|
(76.0
|
)
|
||||||
|
Cash and cash equivalents at beginning of year
|
1,026.8
|
|
304.6
|
|
380.6
|
|
||||||
|
Cash and cash equivalents at end of year
|
$
|
269.5
|
|
$
|
1,026.8
|
|
$
|
304.6
|
|
|||
Amounts presented on the Consolidated Statements of Cash Flows may not agree to the corresponding changes in consolidated balance sheet items due to the accounting for purchases and sales of businesses and the effects of foreign currency translation.
The accompanying notes are an integral part of these statements.
51
Allegheny Technologies Incorporated and Subsidiaries
Statements of Changes in Consolidated Equity
|
|
ATI Stockholders
|
|
|
|||||||||||||||||||||||||
|
(In millions, except per share amounts)
|
Common
Stock
|
Additional
Paid-In
Capital
|
Retained
Earnings
|
Treasury
Stock
|
Accumulated
Other
Comprehensive
Income (Loss)
|
Non-
controlling
Interests
|
Total
Equity
|
|||||||||||||||||||||
|
Balance, December 31, 2011
|
$
|
11.0
|
|
$
|
1,207.1
|
|
$
|
2,361.5
|
|
$
|
(162.7
|
)
|
$
|
(941.6
|
)
|
$
|
96.3
|
|
$
|
2,571.6
|
|
|||||||
|
Net income
|
—
|
|
—
|
|
158.4
|
|
—
|
|
—
|
|
9.4
|
|
$
|
167.8
|
|
|||||||||||||
|
Other comprehensive income (loss)
|
—
|
|
—
|
|
—
|
|
—
|
|
(87.8
|
)
|
1.9
|
|
$
|
(85.9
|
)
|
|||||||||||||
|
Cash dividends on common stock ($0.72 per share)
|
—
|
|
—
|
|
(76.5
|
)
|
—
|
|
—
|
|
—
|
|
$
|
(76.5
|
)
|
|||||||||||||
|
Purchase of subsidiary shares from noncontrolling interest
|
—
|
|
—
|
|
—
|
|
—
|
|
—
|
|
(0.1
|
)
|
$
|
(0.1
|
)
|
|||||||||||||
|
Employee stock plans
|
—
|
|
(25.4
|
)
|
(15.8
|
)
|
51.4
|
|
—
|
|
—
|
|
$
|
10.2
|
|
|||||||||||||
|
Balance, December 31, 2012
|
$
|
11.0
|
|
$
|
1,181.7
|
|
$
|
2,427.6
|
|
$
|
(111.3
|
)
|
$
|
(1,029.4
|
)
|
$
|
107.5
|
|
$
|
2,587.1
|
|
|||||||
|
Net income
|
—
|
|
—
|
|
154.0
|
|
—
|
|
—
|
|
7.6
|
|
161.6
|
|
||||||||||||||
|
Other comprehensive income
|
—
|
|
—
|
|
—
|
|
—
|
|
316.2
|
|
3.4
|
|
319.6
|
|
||||||||||||||
|
Cash dividends on common stock ($0.72 per share)
|
—
|
|
—
|
|
(76.9
|
)
|
—
|
|
—
|
|
—
|
|
(76.9
|
)
|
||||||||||||||
|
Dividends paid to noncontrolling interest
|
—
|
|
—
|
|
—
|
|
—
|
|
—
|
|
(18.0
|
)
|
(18.0
|
)
|
||||||||||||||
|
Employee stock plans
|
—
|
|
4.2
|
|
(14.6
|
)
|
31.7
|
|
—
|
|
—
|
|
21.3
|
|
||||||||||||||
|
Balance, December 31, 2013
|
$
|
11.0
|
|
$
|
1,185.9
|
|
$
|
2,490.1
|
|
$
|
(79.6
|
)
|
$
|
(713.2
|
)
|
$
|
100.5
|
|
$
|
2,994.7
|
|
|||||||
|
Net income (loss)
|
—
|
|
—
|
|
(2.6
|
)
|
—
|
|
—
|
|
12.2
|
|
9.6
|
|
||||||||||||||
|
Other comprehensive loss
|
—
|
|
—
|
|
—
|
|
—
|
|
(218.2
|
)
|
(2.1
|
)
|
(220.3
|
)
|
||||||||||||||
|
Cash dividends on common stock ($0.72 per share)
|
—
|
|
—
|
|
(77.1
|
)
|
—
|
|
—
|
|
—
|
|
(77.1
|
)
|
||||||||||||||
|
Conversion of convertible notes
|
—
|
|
—
|
|
(0.5
|
)
|
5.5
|
|
—
|
|
—
|
|
5.0
|
|
||||||||||||||
|
Redeemable noncontrolling interest
|
—
|
|
—
|
|
(0.3
|
)
|
—
|
|
—
|
|
0.3
|
|
—
|
|
||||||||||||||
|
Employee stock plans
|
—
|
|
(21.7
|
)
|
(10.7
|
)
|
29.8
|
|
—
|
|
—
|
|
(2.6
|
)
|
||||||||||||||
|
Balance, December 31, 2014
|
$
|
11.0
|
|
$
|
1,164.2
|
|
$
|
2,398.9
|
|
$
|
(44.3
|
)
|
$
|
(931.4
|
)
|
$
|
110.9
|
|
$
|
2,709.3
|
|
|||||||
The accompanying notes are an integral part of these statements.
52
Notes to Consolidated Financial Statements
Principles of Consolidation
The consolidated financial statements include the accounts of Allegheny Technologies Incorporated and its subsidiaries, including the Chinese joint venture known as Shanghai STAL Precision Stainless Steel Company Limited (“STAL”), in which the Company has a
60%
interest. The remaining
40%
interest in STAL is owned by Baosteel Group, a state authorized investment company whose equity securities are publicly traded in the People’s Republic of China. The financial results of STAL are consolidated into the Company’s operating results and financial position, with the
40%
interest of our minority partner recognized in the consolidated statement of income as net income attributable to noncontrolling interests and as equity attributable to the noncontrolling interest within total stockholders’ equity. Investments in which the Company exercises significant influence, but which it does not control (generally a 20% to 50% ownership interest), including ATI’s
50%
interest in the industrial titanium joint venture known as Uniti LLC (“Uniti”), are accounted for under the equity method of accounting. Accounts receivable from Uniti were
$4.3 million
and
$3.1 million
at
December 31, 2014
and
2013
, respectively. Significant intercompany accounts and transactions have been eliminated. Unless the context requires otherwise, “Allegheny Technologies,” “ATI” and the “Company” refer to Allegheny Technologies Incorporated and its subsidiaries.
Basis of Presentation
ATI’s strategic vision is to be an aligned and integrated specialty materials and components company. In connection with this initiative, in the first quarter of 2014, the High Performance Metals segment was renamed the High Performance Materials & Components segment. Individual business unit names within each segment were also changed to reflect their aligned and integrated product focus. There was no change to the business units that comprise each business segment or the manner in which resources are allocated and performance is assessed for the business units by management. Therefore, there was no change to business segment reporting as a result of this initiative. Certain prior year amounts have been reclassified in order to conform with
2014
presentation.
Risks and Uncertainties and Use of Estimates
The preparation of consolidated financial statements in conformity with United States generally accepted accounting principles requires management to make estimates and assumptions that affect reported amounts of assets and liabilities at the date of the financial statements, as well as the reported amounts of income and expenses during the reporting period. Actual results could differ from those estimates. Management believes that the estimates are reasonable.
The Company markets its products to a diverse customer base, principally throughout the United States. No single customer accounted for more than 10% of sales for any year presented. The principal end markets for the ATI’s products are customers in the aerospace and defense, oil & gas/chemical process industry, electrical energy, automotive, construction and mining, food equipment and appliances, and medical markets.
ATI has approximately
9,700
full-time employees, of which approximately
15%
are located outside the United States. Approximately
50%
of ATI’s workforce is covered by various collective bargaining agreements (“CBAs”), predominantly with the United Steel, Paper and Forestry, Rubber, Manufacturing, Energy, Allied Industrial and Service Workers International Union (“USW”). Certain of these CBAs expire in 2015, including CBAs with the USW for approximately
2,300
Flat Rolled Products segment production, office and maintenance employees and approximately
150
production and maintenance employees in a High Performance Materials & Components segment Albany, Oregon facility, which will expire on June 30, 2015.
Cash Equivalents and Investments
Cash equivalents are highly liquid investments valued at cost, which approximates fair value, acquired with an original maturity of three months or less.
Accounts Receivable
Accounts receivable are presented net of a reserve for doubtful accounts of
$4.8 million
at
December 31, 2014
and
$5.3 million
at
December 31, 2013
. Trade credit is extended based upon evaluations of each customer’s ability to perform its obligations, which are updated periodically. Accounts receivable reserves are determined based upon an aging of accounts and a review for collectability of specific accounts.
53
Inventories
Inventories are stated at the lower of cost (last-in, first-out (LIFO), first-in, first-out (FIFO), and average cost methods) or market, less progress payments. Costs include direct material, direct labor and applicable manufacturing and engineering overhead, and other direct costs. Most of the Company’s inventory is valued utilizing the LIFO costing methodology. Inventory of the Company’s non-U.S. operations is valued using average cost or FIFO methods.
The Company evaluates product lines on a quarterly basis to identify inventory carrying values that exceed estimated net realizable value. In applying the lower of cost or market principle, market means current replacement cost, subject to a ceiling (market value shall not exceed net realizable value) and a floor (market shall not be less than net realizable value reduced by an allowance for a normal profit margin). The calculation of a resulting reserve, if any, is recognized as an expense in the period that the need for the reserve is identified. However, in cases where inventory at FIFO cost is lower than the LIFO carrying value, a write-down of the inventory to market may be required, subject to the ceiling and floor. It is the Company’s general policy to write-down to scrap value any inventory that is identified as obsolete and any inventory that has aged or has not moved in more than twelve months. In some instances this criterion is up to twenty-four months.
Long-Lived Assets
Property, plant and equipment are recorded at cost, including capitalized interest, and includes long-lived assets acquired under capital leases. The principal method of depreciation adopted for all property placed into service after July 1, 1996 is the straight-line method. For buildings and equipment acquired prior to July 1, 1996, depreciation is computed using a combination of accelerated and straight-line methods. Property, plant and equipment associated with the Company’s Rowley titanium sponge facility in the High Performance Materials & Components segment, and the Hot-Rolling and Processing Facility (HRPF) in the Flat Rolled Products segment, are being depreciated utilizing the units of production method of depreciation, which the Company believes provides a better matching of costs and revenues. The Company periodically reviews estimates of useful life and production capacity assigned to new and in service assets. Significant enhancements, including major maintenance activities that extend the lives of property and equipment, are capitalized. Costs related to repairs and maintenance are charged to expense in the period incurred. The cost and related accumulated depreciation of property and equipment retired or disposed of are removed from the accounts and any related gains or losses are included in income.
The Company monitors the recoverability of the carrying value of its long-lived assets. An impairment charge is recognized when an indicator of impairment occurs and the expected net undiscounted future cash flows from an asset’s use (including any proceeds from disposition) are less than the asset’s carrying value and the asset’s carrying value exceeds its fair value. Assets to be disposed of by sale are stated at the lower of their fair values or carrying amounts and depreciation is no longer recognized.
Cost in Excess of Net Assets Acquired
At
December 31, 2014
, the Company had
$780.4 million
of goodwill on its consolidated balance sheet. Of the total,
$653.8 million
related to the High Performance Materials & Components segment and
$126.6 million
related to the Flat Rolled Products segment. Goodwill increased
$55.0 million
in
2014
from the acquisitions of Dynamic Flowform Corp. and Hanard Machine, Inc. (see Note 2) which was partially offset by a decrease of
$2.5 million
as a result of the impact of foreign currency translation on goodwill denominated in functional currencies other than the U.S. dollar. Goodwill is reviewed annually for impairment or more frequently if impairment indicators arise. The review for goodwill impairment requires a comparison of the fair value of each reporting unit that has goodwill associated with its operations with its carrying amount, including goodwill. If this comparison reflects impairment, then the loss would be measured as the excess of recorded goodwill over its implied fair value. Implied fair value is the excess of the fair value of the reporting unit over the fair value of all recognized and unrecognized assets and liabilities.
Generally accepted accounting standards provide the option to qualitatively assess goodwill for impairment before completing a quantitative assessment. Under the qualitative approach, if, after assessing the totality of events or circumstances, including both macroeconomic, industry and market factors, and entity-specific factors, the Company determines it is likely (more likely than not) that the fair value of a reporting unit is greater than its carrying amount, then the quantitative impairment analysis is not required. The quantitative assessment may be performed each year for a reporting unit at the Company’s option without first performing a qualitative assessment. The Company’s quantitative assessment of goodwill for possible impairment includes estimating the fair market value of a reporting unit which has goodwill associated with its operations using discounted cash flow and multiples of cash earnings valuation techniques, plus valuation comparisons to recent public sale transactions of similar businesses, if any. These impairment assessments and valuation methods require the Company to make estimates and assumptions regarding future operating results, cash flows, changes in working capital and capital expenditures, selling prices, profitability, and the cost of capital. Many of these assumptions are determined by reference to market participants identified by the Company. Although management believes that the estimates and assumptions used were reasonable, actual results could differ from those estimates and assumptions.
54
The Company performs the required annual goodwill impairment evaluations in the fourth quarter of each year. No impairments were determined to exist for the years ended
December 31, 2014
,
2013
or
2012
. The fair values of all reporting units significantly exceeded the carrying values for the 2014 evaluation.
Environmental
Costs that mitigate or prevent future environmental contamination or extend the life, increase the capacity or improve the safety or efficiency of property utilized in current operations are capitalized. Other costs that relate to current operations or an existing condition caused by past operations are expensed. Environmental liabilities are recorded when the Company’s liability is probable and the costs are reasonably estimable, but generally not later than the completion of the feasibility study or the Company’s recommendation of a remedy or commitment to an appropriate plan of action. The accruals are reviewed periodically and, as investigations and remediations proceed, adjustments of the accruals are made to reflect new information as appropriate. Accruals for losses from environmental remediation obligations do not take into account the effects of inflation, and anticipated expenditures are not discounted to their present value. The accruals are not reduced by possible recoveries from insurance carriers or other third parties, but do reflect allocations among potentially responsible parties (“PRPs”) at Federal Superfund sites or similar state-managed sites after an assessment is made of the likelihood that such parties will fulfill their obligations at such sites and after appropriate cost-sharing or other agreements are entered. The measurement of environmental liabilities by the Company is based on currently available facts, present laws and regulations, and current technology. Such estimates take into consideration the Company’s prior experience in site investigation and remediation, the data concerning cleanup costs available from other companies and regulatory authorities, and the professional judgment of the Company’s environmental experts in consultation with outside environmental specialists, when necessary.
Foreign Currency Translation
Assets and liabilities of international operations are translated into U.S. dollars using year-end exchange rates, while revenues and expenses are translated at average exchange rates during the period. The resulting net translation adjustments are recorded as a component of accumulated other comprehensive income (loss) in stockholders’ equity.
Sales Recognition
Sales are recognized when title passes or as services are rendered.
Research and Development
Company funded research and development costs from continuing operations were
$17.4 million
in
2014
,
$16.1 million
in
2013
, and
$22.3 million
in
2012
and were expensed as incurred. Customer funded research and development costs were
$2.7 million
in
2014
,
$2.7 million
in
2013
, and
$1.5 million
in
2012
.
Stock-based Compensation
The Company accounts for stock-based compensation transactions, such as nonvested stock and performance equity awards, using fair value. Compensation expense for an award is estimated at the date of grant and is recognized over the requisite service period. Compensation expense is adjusted for equity awards that do not vest because service or performance conditions are not satisfied. However, compensation expense already recognized is not adjusted if market conditions are not met, such as the Company’s total shareholder return performance relative to a peer group under the Company’s performance equity awards.
Income Taxes
The provision for, or benefit from, income taxes includes deferred taxes resulting from temporary differences in income for financial and tax purposes using the liability method. Such temporary differences result primarily from differences in the carrying value of assets and liabilities. Future realization of deferred income tax assets requires sufficient taxable income within the carryback, carryforward period available under tax law.
The Company evaluates, on a quarterly basis whether, based on all available evidence, it is probable that the deferred income tax assets are realizable. Valuation allowances are established when it is estimated that it is more likely than not that the tax benefit of the deferred tax asset will not be realized. The evaluation includes the consideration of all available evidence, both positive and negative, regarding historical operating results including recent years with reported losses, the estimated timing of future reversals of existing taxable temporary differences, estimated future taxable income exclusive of reversing temporary differences and carryforwards, and potential tax planning strategies which may be employed to prevent an operating loss or tax credit carryforward from expiring unused.
55
It is the Company’s policy to classify interest and penalties recognized on underpayment of income taxes as income tax expense.
Net Income Per Common Share
Basic and diluted net income per share are calculated by dividing the net income available to common stockholders by the weighted average number of common shares outstanding during the year. Diluted amounts assume the issuance of common stock for all potentially dilutive share equivalents outstanding. The calculations of all diluted income/loss per share figures for a period exclude the potentially dilutive effect of dilutive share equivalents if there is a net loss from continuing operations since the inclusion in the calculation of additional shares in the net loss from continuing operations per share would result in a lower per share loss and therefore be anti-dilutive.
New Accounting Pronouncements Adopted
In January 2014, the Company adopted changes issued by the Financial Accounting Standards Board (FASB) that require an entity to net its liability for unrecognized tax positions against a net operating loss carryforward, a similar tax loss or a tax credit carryforward when settlement in this manner is available under the tax law. The adoption of these changes had no impact on the consolidated financial statements.
In January 2014, the Company adopted changes issued by the FASB to the accounting for obligations resulting from joint and several liability arrangements. This guidance requires an entity that is joint and severally liable to measure the obligation as the sum of the amount the entity has agreed with co-obligors to pay and any additional amount it expects to pay on behalf of one or more co-obligors. Required disclosures include a description of the nature of the arrangement, how the liability arose, the relationship with co-obligors and the terms and conditions of the arrangement. The adoption of these changes had no impact on the consolidated financial statements.
In January 2014, the Company adopted changes issued by the FASB to a parent entity’s accounting for the cumulative translation adjustment (CTA) upon derecognition of certain subsidiaries or groups of assets within a foreign entity or of an investment in a foreign entity. The amendments specify that CTA should be released into earnings when an entity ceases to have a controlling financial interest in a subsidiary or group of assets within a consolidated foreign entity and the sale or transfer results in the complete or substantially complete liquidation of the foreign entity. For sales of an equity method investment that is a foreign entity, a pro rata portion of CTA attributable to the investment would be recognized in earnings when the investment is sold. When an entity sells either a part or all of its investment in a consolidated foreign entity, CTA would be recognized in earnings only if the sale results in the parent no longer having a controlling financial interest in the foreign entity. In addition, CTA should be recognized in earnings in a business combination achieved in stages (i.e., a step acquisition). The adoption of these changes had no impact on the consolidated financial statements.
Pending Accounting Pronouncements
In May 2014, the FASB issued changes to revenue recognition with customers. This update provides a five-step analysis of transactions to determine when and how revenue is recognized. An entity should recognize revenue to depict the transfer of promised goods or services to customers in an amount that reflects the consideration to which the entity expects to be entitled in exchange for those goods or services. This update will be effective for the Company beginning in fiscal year 2017. This update may be applied retrospectively to each prior reporting period presented or retrospectively with the cumulative effect of initially applying this update recognized at the date of initial application. The Company is currently evaluating the impact of the new guidance on its consolidated financial statements.
In April 2014, the FASB issued changes to the criteria for reporting discontinued operations. Under the new criteria, a disposal of a component of an entity is required to be reported as discontinued operations only if the disposal represents a strategic shift that has, or will have, a major effect on an entity’s operations and financial results. The current criteria that there be no significant continuing involvement in the operations of the component after the disposal transaction has been removed under the new guidance. The new guidance also requires the presentation of the assets and liabilities of a disposal group that includes a discontinued operation for each comparative period and requires additional disclosures about discontinued operations, including the major line items constituting the pretax profit or loss of the discontinued operation, certain cash flow information for the discontinued operation, expanded disclosures about an entity’s significant continuing involvement in a discontinued operation, and disclosures about a disposal of an individually significant component of an entity that does not qualify for discontinued operations presentation. The provisions of the new guidance become effective for all disposals that occur for the Company beginning in fiscal year 2015. The Company does not anticipate a material impact to the consolidated financial statements upon adoption.
56
On February 7, 2014, the Company acquired
85%
of Dynamic Flowform Corp. (“Dynamic Flowform”) for
$72.9 million
of cash consideration, net of cash acquired. The Dynamic Flowform acquisition is treated as an asset purchase for tax purposes. The holders of the
15%
noncontrolling interest have a put option requiring the Company to purchase their equity interest (see Note 17 for additional explanation). The Company also incurred
$0.7 million
of pre-tax costs related to the acquisition, consisting primarily of professional fees, which were recorded in selling and administrative expenses in the
2014
consolidated statement of operations.
Based in Billerica, MA, Dynamic Flowform, which has been renamed ATI Flowform Products, uses precision flowforming process technologies to produce thin-walled components in net or near-net shapes across multiple alloy systems, including nickel-based alloys and superalloys, titanium and titanium alloys, zirconium alloys, and specialty and stainless alloys. Management expects this acquisition to expand the Company’s capabilities to produce specialty materials parts and components, primarily in the aerospace and defense, and oil & gas/chemical process industry markets. ATI Flowform Products results are included in the High Performance Materials & Components segment from the date of the acquisition.
The purchase price allocation includes technology, trademarks and customer intangible assets of
$21.4 million
, which will be amortized over a
23
year weighted average life, and goodwill of
$46.8 million
, which is deductible for tax purposes. The final allocation of the purchase price was completed in the second quarter of 2014.
In addition, on June 12, 2014, the Company acquired Hanard Machine, Inc. (“Hanard”) for
$20.5 million
of cash consideration, net of cash acquired, including
$20.0 million
paid in
2014
and
$0.5 million
that is expected to be paid in 2015. Located in Salem, OR, Hanard performs precision machining on parts and components made from titanium alloys, nickel-based alloys and superalloys, aluminum, specialty steel, and other ferrous and non-ferrous metals. The business operates as ATI Cast Products Salem Operations, and is reported as a part of the High Performance Materials & Components segment from the date of the acquisition. Management expects this acquisition to expand the Company’s capabilities to produce finished specialty materials parts and components and reinforces the Company’s important aerospace supply chain role. The purchase price allocation includes technology and customer intangible assets of
$4.3 million
, which will be amortized over a
20
year life, and goodwill of
$8.3 million
, which is deductible for tax purposes. The final allocation of the purchase price is expected to be completed by the end of the first quarter of 2015.
Pro forma financial information has not been included because these acquisitions did not meet certain significance thresholds individually or in the aggregate.
On November 4, 2013, the Company completed the sale of its tungsten materials business, which produces tungsten powder, tungsten heavy alloys, tungsten carbide materials, and carbide cutting tools. In 2013, the Company received cash proceeds, net of transaction costs, of
$600.9 million
on the sale of this business and recognized a
$428.3 million
pre-tax (
$261.4 million
after tax) gain which has been recorded in discontinued operations.
Also, during 2013, the Company completed a strategic review of its iron castings and fabricated components businesses. These businesses were not projected to meet the Company’s long-term profitable growth and return on capital employed expectations, resulting in the closure of the fabricated components business and planned divestiture of the iron casting business in 2013. In April 2014, the Company announced the closure of the iron castings business, as the divestiture of this business through a sale process on commercially acceptable terms was unlikely to be successful. The orderly wind-down of operations was completed by the end of the third quarter 2014. The closure of the iron castings business resulted in
$1.8 million
of cash exit costs in 2014, primarily related to severance benefits, of which
$1.0 million
was paid in 2014. Payment of the remaining cash exit costs for the iron casting business is expected to be completed within the next twelve months.
The operating results of the tungsten materials, iron castings and fabricated components businesses have been included in discontinued operations in the Company’s consolidated statements of income for all periods presented. Results of discontinued operations for 2014 include
$1.8 million
pre-tax of charges associated with the iron castings closure. Results of discontinued operations for 2013 include
$19.5 million
pre-tax (
$11.9 million
after-tax) of charges associated with the iron castings and fabricated components divestitures, including
$18.6 million
of pre-tax asset impairment charges. Results of discontinued operations for 2012 include a
$13.0 million
pre-tax (
$8.8 million
after-tax) charge to write down the value of the long-lived assets with the closing of the Alpena, MI iron casting facility.
57
The following table presents summarized results for these discontinued operations (in millions):
|
2014
|
2013
|
2012
|
|||||||||
|
Sales
|
$
|
14.9
|
|
$
|
268.2
|
|
$
|
364.6
|
|
||
|
Income (loss) before income taxes
|
$
|
(0.9
|
)
|
$
|
414.2
|
|
$
|
11.7
|
|
||
Net liabilities of discontinued operations were
$1.3 million
at
December 31, 2014
and were net assets of
$4.2 million
at
December 31, 2013
and were reported as follows on the consolidated balance sheet (in millions):
|
2014
|
2013
|
|||||
|
Prepaid expenses and other current assets
|
$
|
0.4
|
|
$
|
6.1
|
|
|
Other assets
|
1.4
|
|
3.7
|
|
||
|
Total Assets
|
1.8
|
|
9.8
|
|
||
|
Accrued liabilities
|
2.5
|
|
4.9
|
|
||
|
Other long-term liabilities
|
0.6
|
|
0.7
|
|
||
|
Total Liabilities
|
3.1
|
|
5.6
|
|
||
|
Net Assets (Liabilities)
|
$
|
(1.3
|
)
|
$
|
4.2
|
|
Inventories at
December 31, 2014
and
2013
were as follows (in millions):
|
2014
|
2013
|
|||||||
|
Raw materials and supplies
|
$
|
249.3
|
|
$
|
277.6
|
|
||
|
Work-in-process
|
1,184.1
|
|
984.9
|
|
||||
|
Finished goods
|
172.2
|
|
162.1
|
|
||||
|
Total inventories at current cost
|
1,605.6
|
|
1,424.6
|
|
||||
|
Adjustment from current cost to LIFO cost basis
|
4.8
|
|
29.4
|
|
||||
|
Inventory valuation reserves
|
(68.8
|
)
|
(84.3
|
)
|
||||
|
Progress payments
|
(68.8
|
)
|
(47.6
|
)
|
||||
|
Total inventories, net
|
$
|
1,472.8
|
|
$
|
1,322.1
|
|
||
Inventories, before progress payments, determined on the LIFO method were
$1,102.4 million
at
December 31, 2014
, and
$976.1 million
at
December 31, 2013
. The remainder of the inventory was determined using the FIFO and average cost methods, and these inventory values do not differ materially from current cost. The effect of using the LIFO costing methodology to value inventory, rather than FIFO, increased cost of sales by
$24.6 million
in
2014
. Fiscal years
2013
and
2012
included a decrease in cost of sales of
$80.9 million
and
$75.6 million
, respectively, from using the LIFO costing methodology. Due to deflationary impacts primarily related to raw materials, the carrying value of the Company’s inventory as valued on the LIFO inventory accounting method exceeded current replacement cost at December 31, 2013, and based on a lower of cost or market value analysis, a
$35.0 million
net realizable value reserve was recorded in the High Performance Materials & Components segment in
2013
. This net realizable value reserve was reduced to
$10.0 million
at
December 31, 2014
. In addition, continued sluggish demand for industrial titanium products from global markets has resulted in much lower selling prices for these products. As a result, the Company recorded a lower of cost or market charge for industrial titanium products in the Flat Rolled Products segment of
$23.2 million
in
2014
and
$20.5 million
in
2013
.
During
2013
, and
2012
, inventory usage resulted in liquidations of LIFO inventory quantities, increasing cost of sales by
$3.8 million
and
$1.5 million
in
2013
and
2012
, respectively. These inventories were carried at differing costs prevailing in prior years as compared with the cost of current manufacturing cost and purchases. There were
no
LIFO liquidations in
2014
.
58
Property, plant and equipment at
December 31, 2014
and
2013
was as follows:
|
(In millions)
|
2014
|
2013
|
||||||
|
Land
|
$
|
30.2
|
|
$
|
30.2
|
|
||
|
Buildings
|
1,048.9
|
|
1,019.1
|
|
||||
|
Equipment and leasehold improvements
|
3,702.5
|
|
3,526.0
|
|
||||
|
4,781.6
|
|
4,575.3
|
|
|||||
|
Accumulated depreciation and amortization
|
(1,819.8
|
)
|
(1,701.2
|
)
|
||||
|
Total property, plant and equipment, net
|
$
|
2,961.8
|
|
$
|
2,874.1
|
|
||
Construction in progress at
December 31, 2014
and
2013
was
$71.1 million
and
$186.2 million
, respectively. Depreciation and amortization from continuing operations for the years ended
December 31, 2014
,
2013
and
2012
was as follows:
|
(In millions)
|
2014
|
2013
|
2012
|
|||||||||
|
Depreciation of property, plant and equipment
|
$
|
146.7
|
|
$
|
156.8
|
|
$
|
157.0
|
|
|||
|
Software and other amortization
|
29.9
|
|
23.8
|
|
24.4
|
|
||||||
|
Total depreciation and amortization
|
$
|
176.6
|
|
$
|
180.6
|
|
$
|
181.4
|
|
|||
The Company maintains reserves where a legal obligation exists to perform an asset retirement activity and the fair value of the liability can be reasonably estimated. These asset retirement obligations (“AROs”) include liabilities where the timing and (or) method of settlement may be conditional on a future event, that may or may not be within the control of the entity. At
December 31, 2014
, the Company had recognized AROs of
$25.4 million
related to landfill closures, decommissioning costs, facility leases and conditional AROs associated with manufacturing activities using what may be characterized as potentially hazardous materials. The 2013 sale of the tungsten materials business included an indemnification to the buyer for conditional ARO costs of up to
$13 million
for a
five
year period. The Company recorded a
$9.4 million
charge in 2013 to increase recorded reserves to
$13 million
for these retained liabilities, which was reported as part of the gain on sale of the tungsten materials business. In addition, as part of facility closures in 2013,
$4.2 million
in decommissioning AROs were reported in continuing operations (see Note 16) on the 2013 consolidated statement of operations.
Estimates of AROs are evaluated annually in the fourth quarter, or more frequently if material new information becomes known. Accounting for asset retirement obligations requires significant estimation and in certain cases, the Company has determined that an ARO exists, but the amount of the obligation is not reasonably estimable. The Company may determine that additional AROs are required to be recognized as new information becomes available.
Changes in asset retirement obligations for the years ended
December 31, 2014
and
2013
were as follows:
|
(In millions)
|
2014
|
2013
|
||||||
|
Balance at beginning of year
|
$
|
27.7
|
|
$
|
13.0
|
|
||
|
Accretion expense
|
0.9
|
|
1.1
|
|
||||
|
Payments
|
(2.2
|
)
|
(0.8
|
)
|
||||
|
Revision of estimates
|
(1.0
|
)
|
13.8
|
|
||||
|
Liabilities incurred
|
—
|
|
0.6
|
|
||||
|
Balance at end of year
|
$
|
25.4
|
|
$
|
27.7
|
|
||
Cash and cash equivalents at
December 31, 2014
and
2013
were as follows:
|
(In millions)
|
2014
|
2013
|
||||||
|
Cash
|
$
|
267.7
|
|
$
|
1,025.2
|
|
||
|
Other short-term investments
|
1.8
|
|
1.6
|
|
||||
|
Total cash and cash equivalents
|
$
|
269.5
|
|
$
|
1,026.8
|
|
||
Accounts receivable are presented net of a reserve for doubtful accounts of
$4.8 million
at
December 31, 2014
, and
$5.3 million
at
December 31, 2013
. During
2014
, the Company recognized expense of
$0.5 million
to increase the reserve for
59
doubtful accounts and wrote off
$1.0 million
of uncollectible accounts, which decreased the reserve. During
2013
, the Company recognized expense of
$1.1 million
to increase the reserve for doubtful accounts and wrote off
$0.8 million
of uncollectible accounts, which decreased the reserve. Additionally, the reserve for doubtful accounts in 2013 decreased
$0.5 million
as a result of the sale of the tungsten materials business. During
2012
, the Company recognized expense of
$1.0 million
to increase the reserve for doubtful accounts and wrote off
$1.4 million
of uncollectible accounts, which decreased the reserve.
Other intangible assets, which are included in Other assets on the accompanying consolidated balance sheets as of
December 31, 2014
and
2013
were as follows:
|
|
|
December 31, 2014
|
December 31, 2013
|
|||||||||||||||
|
(in millions)
|
Weighted Average Useful life
(years)
|
Gross
carrying
amount
|
Accumulated
amortization
|
Gross
carrying
amount
|
Accumulated
amortization
|
|||||||||||||
|
Technology
|
21
|
$
|
91.4
|
|
$
|
(14.2
|
)
|
$
|
74.0
|
|
$
|
(9.9
|
)
|
|||||
|
Customer relationships
|
24
|
35.7
|
|
(4.7
|
)
|
31.0
|
|
(3.3
|
)
|
|||||||||
|
Trademarks
|
15
|
64.6
|
|
(4.3
|
)
|
—
|
|
—
|
|
|||||||||
|
Total amortizable intangible assets
|
191.7
|
|
(23.2
|
)
|
105.0
|
|
(13.2
|
)
|
||||||||||
|
Indefinite-lived trademarks
|
—
|
|
—
|
|
61.0
|
|
—
|
|
||||||||||
|
Total intangible assets
|
$
|
191.7
|
|
$
|
(23.2
|
)
|
$
|
166.0
|
|
$
|
(13.2
|
)
|
||||||
Amortizable intangible assets increased in 2014 by
$21.4 million
and
$4.3 million
from the acquisitions of ATI Flowform Products and ATI Cast Products Salem Operations, respectively. For a
$61.0 million
trademark intangible asset, the Company changed the estimate of the period of future benefit from indefinite life to a
15
year useful life beginning in 2014 based on a de-emphasis of legacy business unit tradenames. Amortization expense from continuing operations related to intangible assets was approximately
$10 million
for the year ended
December 31, 2014
and
$5 million
for the year ended
December 31, 2013
. For each of the years ending December 31, 2015 through 2019, annual amortization expense is expected to be approximately $
10 million
. No impairment of indefinite-lived intangible assets was determined to exist for the year ended
December 31, 2013
.
Accrued liabilities included salaries, wages and other payroll-related liabilities of
$77.3 million
and
$52.7 million
at
December 31, 2014
and
2013
, respectively.
Other income (expense) from continuing operations for the years ended
December 31, 2014
,
2013
, and
2012
was as follows:
|
(In millions)
|
2014
|
2013
|
2012
|
|||||||||
|
Rent and royalty income
|
$
|
4.0
|
|
$
|
0.9
|
|
$
|
0.7
|
|
|||
|
Net gains (losses) on property and investments
|
0.1
|
|
0.7
|
|
(0.7
|
)
|
||||||
|
Other
|
—
|
|
0.1
|
|
—
|
|
||||||
|
Total other income, net
|
$
|
4.1
|
|
$
|
1.7
|
|
$
|
—
|
|
|||
60
Debt at
December 31, 2014
and
2013
was as follows:
|
(In millions)
|
2014
|
2013
|
||||||
|
Allegheny Technologies $500 million 5.875% Senior Notes due 2023 (a)
|
$
|
500.0
|
|
$
|
500.0
|
|
||
|
Allegheny Technologies $500 million 5.95% Senior Notes due 2021
|
500.0
|
|
500.0
|
|
||||
|
Allegheny Technologies $402.5 million 4.25% Convertible Senior Notes due 2014
|
—
|
|
402.5
|
|
||||
|
Allegheny Technologies $350 million 9.375% Senior Notes due 2019
|
350.0
|
|
350.0
|
|
||||
|
Allegheny Ludlum 6.95% Debentures due 2025
|
150.0
|
|
150.0
|
|
||||
|
Ladish Series B 6.14% Notes due 2016 (b)
|
11.9
|
|
18.2
|
|
||||
|
Ladish Series C 6.41% Notes due 2015 (c)
|
10.3
|
|
21.1
|
|
||||
|
Domestic Bank Group $400 million unsecured credit agreement
|
—
|
|
—
|
|
||||
|
Foreign credit agreements
|
—
|
|
—
|
|
||||
|
Industrial revenue bonds, due through 2020, and other
|
4.7
|
|
5.5
|
|
||||
|
Total short-term and long-term debt
|
1,526.9
|
|
1,947.3
|
|
||||
|
Short-term debt and current portion of long-term debt
|
17.8
|
|
419.9
|
|
||||
|
Total long-term debt
|
$
|
1,509.1
|
|
$
|
1,527.4
|
|
||
|
(a)
|
Bearing interest at
6.125%
effective August 15, 2014.
|
|
(b)
|
Includes fair value adjustments of
$0.4 million
and
$1.0 million
at
December 31, 2014
and
December 31, 2013
, respectively.
|
|
(c)
|
Includes fair value adjustments of
$0.3 million
and
$1.1 million
at
December 31, 2014
and
December 31, 2013
, respectively.
|
Interest expense was
$109.8 million
in
2014
,
$66.0 million
in
2013
, and
$72.4 million
in
2012
. Interest expense was reduced by
$5.3 million
,
$45.7 million
, and
$24.5 million
, in
2014
,
2013
, and
2012
, respectively, from interest capitalization on capital projects. Interest and commitment fees paid were
$113.2 million
in
2014
,
$110.6 million
in
2013
, and
$96.5 million
in
2012
. Net interest expense includes interest income of
$1.1 million
in
2014
,
$0.8 million
in
2013
, and
$0.8 million
in
2012
.
Scheduled principal payments during the next five years are
$17.8 million
in 2015,
$7.7 million
in 2016,
$0.5 million
in 2017,
$0.2 million
in 2018, and
$350.1 million
in 2019.
2023 Notes
On July 12, 2013, ATI issued
$500 million
aggregate principal amount of
5.875%
Senior Notes due 2023 (the “2023 Notes”). Interest on the 2023 Notes is payable semi-annually in arrears, and the 2023 Notes will mature on
August 15, 2023
, unless redeemed or repurchased earlier. Underwriting fees, discount, and other third-party expenses for the issuance of the 2023 Notes were
$5.2 million
in 2013, and are being amortized to interest expense over the
10
-year term of the 2023 Notes. The 2023 Notes are unsecured and unsubordinated obligations of the Company and equally ranked with all of its existing and future senior unsecured debt. The interest rate payable on the 2023 Notes is subject to adjustment in the event of a change in the credit ratings on the 2023 Notes. During the fourth quarter of 2014, Moody’s downgraded the Company’s credit rating one notch to Ba1 from Baa3, resulting in an increase of the interest rate on the 2023 Notes from
5.875%
to
6.125%
effective with the interest period beginning August 15, 2014. Future downgrades of the Company’s credit ratings could result in additional increases to the interest cost with respect to the 2023 Notes.
Unsecured Credit Agreement
The Company has a
$400 million
senior unsecured domestic revolving credit facility (“credit facility”) which expires
May 31, 2018
. Under the terms of the facility, the Company may increase the size of the credit facility by up to
$100 million
without seeking the further approval of the lending group.
In October 2014, the Company amended the credit facility to modify the maximum leverage ratio and minimum interest coverage ratio permitted under the credit facility and to revise the calculation definitions for these two ratios. In addition, the amended credit facility provides for a springing lien on certain of the Company’s accounts receivable and inventory. This springing lien would become effective in the future if the Company’s credit ratings from both Standard & Poor’s and Moody’s are below investment grade, and would be subsequently released if the Company’s credit rating returns to investment grade
61
from either rating agency, assuming no event of default condition existed. Third-party costs associated with this amendment were
$1.2 million
in 2014, and are being amortized to interest expense over the remaining term of the credit facility.
As amended, the credit facility requires the Company to maintain a leverage ratio (measured as consolidated total indebtedness net of cash on hand in excess of
$50 million
, divided by consolidated EBITDA, defined as earnings before interest, taxes, depreciation and amortization, and non-cash pension expense, with the definition of consolidated EBIT excluding any gain or loss attributable to sale or other dispositions of assets outside the ordinary course of business, for the four prior fiscal quarters) of not greater than
5.75
for the quarter ended December 31, 2014,
5.00
for the quarter ended March 31, 2015,
4.50
for the quarter ended June 30, 2015,
3.75
for the quarter ended September 30, 2015, and
3.50
for the quarter ended December 31, 2015 and for each fiscal quarter thereafter. The credit facility, as amended, also requires the Company to maintain an interest coverage ratio (consolidated EBITDA as calculated for the leverage ratio, divided by interest expense) of not less than
2.0
for the quarter ended December 31, 2014,
2.50
for the quarter ended March 31, 2015,
3.00
for the quarter ended June 30, 2015,
3.25
for the quarter ended September 30, 2015, and
3.50
for the quarter ended December 31, 2015 and for each fiscal quarter thereafter. At
December 31, 2014
, the leverage ratio was
4.20
and the interest coverage ratio was
2.79
. The Company was in compliance with these required ratios during all applicable periods. As of
December 31, 2014
, there were
no
outstanding borrowings made against the facility, although a portion of the facility was used to support approximately
$4.7 million
in letters of credit. The credit facility includes a
$200 million
sublimit for the issuance of letters of credit.
Borrowings under the credit facility bear interest at the Company’s option at either: (1) the one-, two-, three- or six-month LIBOR rate plus a margin ranging from
1.25%
to
2.50%
depending upon the value of the leverage ratio as defined by the credit facility agreement; or (2) a base rate announced from time-to-time by the lending group (i.e., the Prime lending rate plus a margin ranging from
0.25%
to
1.50%
depending on the value of the leverage ratio). In addition, the credit facility contains a letter of credit fee of
1.25%
to
2.50%
and a facility fee of
0.18%
to
0.35%
, both depending upon the value of the leverage ratio. The Company’s overall borrowing costs under the credit facility are not affected by changes in the Company’s credit ratings.
Convertible Notes
In June 2009, ATI issued
$402.5 million
in aggregate principal amount of
4.25%
Convertible Senior Notes due 2014 (the “Convertible Notes”). Interest was payable semi-annually on June 1 and December 1 of each year. The Convertible Notes were unsecured and unsubordinated obligations of the Company and ranked equally with all of its existing and future senior unsecured debt.
On June 2, 2014, the Company repaid the remaining
$397.5 million
outstanding of the Convertible Notes. Holders of the Convertible Notes had the option to convert their notes into shares of ATI common stock at any time prior to the close of business on the second scheduled trading day immediately preceding the June 1, 2014 maturity date. Prior to the maturity date,
$5.0 million
of the Convertible Notes were converted into
120,476
shares of ATI common stock. The conversion rate for the Convertible Notes was
23.9263
shares of ATI common stock per
$1,000
principal amount of Convertible Notes, equivalent to a conversion price of approximately
$41.795
per share. Other than receiving cash in lieu of fractional shares, holders did not have the option to receive cash instead of shares of common stock upon conversion.
Ladish Notes
In conjunction with the acquisition of Ladish Co., Inc. (“Ladish”, now ATI Ladish LLC) in May 2011, the Company assumed the Series B and Series C Notes previously issued by Ladish. The Series B
6.14%
Notes are unsecured and have a principal balance of
$11.5 million
at
December 31, 2014
, excluding fair value adjustments. The Series B Notes pay interest semi-annually and mature on May 16, 2016, with the principal amortizing equally in annual payments over the remaining term. The Series C
6.41%
Notes are unsecured and have a principal balance of
$10.0 million
at
December 31, 2014
, excluding fair value adjustments. The Series C Notes pay interest semi-annually and mature on September 2, 2015, with the principal amortizing equally in annual payments over the remaining term. The Series B and Series C Notes contain financial covenants specific to Ladish which (1) limit the incurrence of certain additional debt; (2) require a certain level of consolidated adjusted net worth; (3) require minimum fixed charges coverage ratio; and (4) require a limited amount of funded debt to consolidated cash flow. The covenant on incurrence of additional debt limits funded debt to
60%
of total capitalization. Ladish was in compliance with all Series B and Series C covenants at
December 31, 2014
. In March 2012, the Ladish Series B and Series C Notes were amended to replace certain reporting requirements specific to these Notes with a Parent Guaranty Agreement by ATI, by which ATI unconditionally guarantees all amounts payable by ATI Ladish LLC for the Series B and Series C Notes. As a result of the March 2012 amendment, the Series B and Series C Notes are equally ranked with all of ATI’s existing and future senior unsecured debt.
62
Foreign and Other Credit Facilities
The Company has an additional separate credit facility for the issuance of letters of credit. As of
December 31, 2014
,
$32 million
in letters of credit were outstanding under this facility.
STAL, the Company’s Chinese joint venture company in which ATI has a
60%
interest, had a
205 million
renminbi revolving credit facility with a group of banks that expired in August 2014. Replacement of the credit facility is expected to be finalized in the first quarter of 2015.
The Company has no off-balance sheet financing relationships as defined in Item 303(a)(4) of SEC Regulation S-K, with variable interest entities, structured finance entities, or any other unconsolidated entities. At
December 31, 2014
, the Company had not guaranteed any third-party indebtedness.
As part of its risk management strategy, the Company, from time-to-time, utilizes derivative financial instruments to manage its exposure to changes in raw material prices, energy costs, foreign currencies, and interest rates. In accordance with applicable accounting standards, the Company accounts for most of these contracts as hedges. In general, hedge effectiveness is determined by examining the relationship between offsetting changes in fair value or cash flows attributable to the item being hedged, and the financial instrument being used for the hedge. Effectiveness is measured utilizing regression analysis and other techniques to determine whether the change in the fair market value or cash flows of the derivative exceeds the change in fair value or cash flow of the hedged item. Calculated ineffectiveness, if any, is immediately recognized on the statement of operations.
The Company sometimes uses futures and swap contracts to manage exposure to changes in prices for forecasted purchases of raw materials, such as nickel, and energy costs, such as electricity and natural gas. Generally under these contracts, which are accounted for as cash flow hedges, the price of the item being hedged is fixed at the time that the contract is entered into and the Company is obligated to make or receive a payment equal to the net change between this fixed price and the market price at the date the contract matures.
The majority of ATI’s products are sold utilizing raw material surcharges and index mechanisms. However, as of
December 31, 2014
, the Company had entered into financial hedging arrangements primarily at the request of its customers, related to firm orders, for an aggregate notional amount of approximately
15%
of the Company’s estimated annual nickel requirements. These nickel hedges extend to
2020
.
At
December 31, 2014
, the outstanding financial derivatives used to hedge the Company’s exposure to energy cost volatility included natural gas cost hedges for approximately
80%
of its annual forecasted domestic requirements for 2015,
70%
for 2016, and approximately
40%
for 2017. There were no material electricity hedge contracts outstanding as of December 31, 2014.
While the majority of the Company’s direct export sales are transacted in U.S. dollars, foreign currency exchange contracts are used, from time-to-time, to limit transactional exposure to changes in currency exchange rates for those transactions denominated in a non-U.S. currency. The Company sometimes purchases foreign currency forward contracts that permit it to sell specified amounts of foreign currencies expected to be received from its export sales for pre-established U.S. dollar amounts at specified dates. The forward contracts are denominated in the same foreign currencies in which export sales are denominated. These contracts are designated as hedges of the variability in cash flows of a portion of the forecasted future export sales transactions which otherwise would expose the Company to foreign currency risk, primarily euros. At
December 31, 2014
, the Company held euro forward sales contracts designated as hedges with a notional value of approximately
388 million
euros with maturity dates through June 2018, including approximately
175 million
euros with maturities in 2015. In addition, the Company may also designate cash balances held in foreign currencies as hedges of forecasted foreign currency transactions.
The Company may enter into derivative interest rate contracts to maintain a reasonable balance between fixed- and floating-rate debt. There were no unsettled derivative financial instruments related to debt balances for the periods presented.
There are no credit risk-related contingent features in the Company’s derivative contracts, and the contracts contained no provisions under which the Company has posted, or would be required to post, collateral. The counterparties to the Company’s derivative contracts were substantial and creditworthy commercial banks that are recognized market makers. The Company controls its credit exposure by diversifying across multiple counterparties and by monitoring credit ratings and credit default swap spreads of its counterparties. The Company also enters into master netting agreements with counterparties when possible.
63
The fair values of the Company’s derivative financial instruments are presented below, representing the gross amounts recognized which are not offset by counterpart or by type of item hedged. All fair values for these derivatives were measured using Level 2 information as defined by the accounting standard hierarchy, which includes quoted prices for similar assets or liabilities in active markets, quoted prices for identical or similar assets or liabilities in markets that are not active, and inputs derived principally from or corroborated by observable market data.
|
(In millions)
|
|
December 31,
2014 |
December 31,
2013 |
|||||||
|
Asset derivatives
|
Balance sheet location
|
|||||||||
|
Derivatives designated as hedging instruments:
|
||||||||||
|
Foreign exchange contracts
|
Prepaid expenses and other current assets
|
$
|
23.6
|
|
$
|
0.3
|
|
|||
|
Nickel and other raw material contracts
|
Prepaid expenses and other current assets
|
1.1
|
|
0.1
|
|
|||||
|
Natural gas contracts
|
Prepaid expenses and other current assets
|
—
|
|
2.5
|
|
|||||
|
Foreign exchange contracts
|
Other assets
|
28.3
|
|
—
|
|
|||||
|
Natural gas contracts
|
Other assets
|
—
|
|
1.0
|
|
|||||
|
Nickel and other raw material contracts
|
Other assets
|
0.5
|
|
0.4
|
|
|||||
|
Total derivatives designated as hedging instruments:
|
53.5
|
|
4.3
|
|
||||||
|
Derivatives not designated as hedging instruments:
|
||||||||||
|
Foreign exchange contracts
|
Prepaid expenses and other current assets
|
6.4
|
|
—
|
|
|||||
|
Total derivatives not designated as hedging instruments:
|
6.4
|
|
—
|
|
||||||
|
Total asset derivatives
|
$
|
59.9
|
|
$
|
4.3
|
|
||||
|
Liability derivatives
|
Balance sheet location
|
|
|
|||||||
|
Derivatives designated as hedging instruments:
|
||||||||||
|
Natural gas contracts
|
Accrued liabilities
|
$
|
10.2
|
|
$
|
0.4
|
|
|||
|
Foreign exchange contracts
|
Accrued liabilities
|
—
|
|
7.8
|
|
|||||
|
Nickel and other raw material contracts
|
Accrued liabilities
|
5.8
|
|
4.5
|
|
|||||
|
Electricity contracts
|
Accrued liabilities
|
0.1
|
|
0.5
|
|
|||||
|
Foreign exchange contracts
|
Other long-term liabilities
|
—
|
|
5.4
|
|
|||||
|
Natural gas contracts
|
Other long-term liabilities
|
7.9
|
|
—
|
|
|||||
|
Nickel and other raw material contracts
|
Other long-term liabilities
|
3.0
|
|
1.3
|
|
|||||
|
Total liability derivatives
|
$
|
27.0
|
|
$
|
19.9
|
|
||||
|
Derivatives not designated as hedging instruments:
|
||||||||||
|
Foreign exchange contracts
|
Accrued liabilities
|
—
|
|
1.7
|
|
|||||
|
Total derivatives not designated as hedging instruments:
|
—
|
|
1.7
|
|
||||||
|
Total liability derivatives
|
$
|
27.0
|
|
$
|
21.6
|
|
||||
For derivative financial instruments that are designated as cash flow hedges, the effective portion of the gain or loss on the derivative is reported as a component of other comprehensive income (OCI) and reclassified into earnings in the same period or periods during which the hedged item affects earnings. Gains and losses on the derivative representing either hedge ineffectiveness or hedge components excluded from the assessment of effectiveness are recognized in current period results. The Company did not use fair value or net investment hedges for the periods presented. The effects of derivative instruments in the tables below are presented net of related income taxes.
64
Activity with regard to derivatives designated as cash flow hedges for the year ended
December 31, 2014
were as follows (in millions):
|
Derivatives in Cash Flow
Hedging Relationships
|
Amount of Gain (Loss)
Recognized in OCI on
Derivatives
(Effective Portion)
|
Amount of Gain (Loss)
Reclassified from
Accumulated OCI
into Income
(Effective Portion) (a)
|
Amount of Gain (Loss)
Recognized in Income
on Derivatives (Ineffective
Portion and Amount
Excluded from
Effectiveness Testing) (b)
|
|||||||||||||||||||||
|
2014
|
2013
|
2014
|
2013
|
2014
|
2013
|
|||||||||||||||||||
|
Nickel and other raw material contracts
|
$
|
(1.6
|
)
|
$
|
(8.4
|
)
|
$
|
(0.6
|
)
|
$
|
(5.4
|
)
|
$
|
—
|
|
$
|
—
|
|
||||||
|
Natural gas contracts
|
(10.9
|
)
|
2.1
|
|
2.1
|
|
(2.3
|
)
|
—
|
|
—
|
|
||||||||||||
|
Electricity contracts
|
0.5
|
|
(0.1
|
)
|
0.4
|
|
(0.2
|
)
|
—
|
|
—
|
|
||||||||||||
|
Foreign exchange contracts
|
40.1
|
|
(9.1
|
)
|
0.3
|
|
(0.7
|
)
|
—
|
|
—
|
|
||||||||||||
|
Total
|
$
|
28.1
|
|
$
|
(15.5
|
)
|
$
|
2.2
|
|
$
|
(8.6
|
)
|
$
|
—
|
|
$
|
—
|
|
||||||
|
(a)
|
The gains (losses) reclassified from accumulated OCI into income related to the effective portion of the derivatives are presented in cost of sales.
|
|
(b)
|
The gains (losses) recognized in income on derivatives related to the ineffective portion and the amount excluded from effectiveness testing are presented in selling and administrative expenses.
|
Assuming market prices remain constant with those at
December 31, 2014
, a gain of
$5.3 million
, net of tax, is expected to be recognized over the next 12 months.
The disclosures of gains or losses presented above for nickel and other raw material contracts and foreign exchange contracts do not take into account the anticipated underlying transactions. Since these derivative contracts represent hedges, the net effect of any gain or loss on results of operations may be fully or partially offset.
Derivatives that are not designated as hedging instruments were as follows:
|
(In millions)
|
Amount of Gain (Loss) Recognized
in Income on Derivatives
|
|||||||
|
Derivatives Not Designated as Hedging Instruments
|
2014
|
2013
|
||||||
|
Foreign exchange contracts
|
$
|
5.2
|
|
$
|
(0.3
|
)
|
||
Changes in the fair value of foreign exchange contract derivatives not designated as hedging instruments are recorded in cost of sales.
The estimated fair value of financial instruments at
December 31, 2014
was as follows:
|
|
|
Fair Value Measurements at Reporting Date Using
|
||||||||||||||
|
(In millions)
|
Total
Carrying
Amount
|
Total
Estimated
Fair Value
|
Quoted Prices in
Active Markets for
Identical Assets
(Level 1)
|
Significant
Observable
Inputs
(Level 2)
|
||||||||||||
|
Cash and cash equivalents
|
$
|
269.5
|
|
$
|
269.5
|
|
$
|
269.5
|
|
$
|
—
|
|
||||
|
Derivative financial instruments:
|
||||||||||||||||
|
Assets
|
59.9
|
|
59.9
|
|
—
|
|
59.9
|
|
||||||||
|
Liabilities
|
27.0
|
|
27.0
|
|
—
|
|
27.0
|
|
||||||||
|
Debt
|
1,526.9
|
|
1,616.0
|
|
1,589.1
|
|
26.9
|
|
||||||||
65
The estimated fair value of financial instruments at
December 31, 2013
was as follows:
|
|
|
Fair Value Measurements at Reporting Date Using
|
||||||||||||||
|
(In millions)
|
Total
Carrying
Amount
|
Total
Estimated
Fair Value
|
Quoted Prices in
Active Markets for
Identical Assets
(Level 1)
|
Significant
Observable
Inputs
(Level 2)
|
||||||||||||
|
Cash and cash equivalents
|
$
|
1,026.8
|
|
$
|
1,026.8
|
|
$
|
1,026.8
|
|
$
|
—
|
|
||||
|
Derivative financial instruments:
|
||||||||||||||||
|
Assets
|
4.3
|
|
4.3
|
|
—
|
|
4.3
|
|
||||||||
|
Liabilities
|
21.6
|
|
21.6
|
|
—
|
|
21.6
|
|
||||||||
|
Debt
|
1,947.3
|
|
2,072.6
|
|
2,027.8
|
|
44.8
|
|
||||||||
In accordance with accounting standards, fair value is defined as the exchange price that would be received for an asset or paid to transfer a liability (an exit price) in the principal or most advantageous market for the asset or liability in an orderly transaction between market participants at the measurement date. Accounting standards established three levels of a fair value hierarchy that prioritizes the inputs used to measure fair value. This hierarchy requires entities to maximize the use of observable inputs and minimize the use of unobservable inputs. The three levels of inputs used to measure fair value are as follows:
Level 1 – Quoted prices in active markets for identical assets or liabilities.
Level 2 – Observable inputs other than quoted prices included in Level 1, such as quoted prices for similar assets and liabilities in active markets; quoted prices for identical or similar assets and liabilities in markets that are not active; or other inputs that are observable or can be corroborated by observable market data.
Level 3 – Unobservable inputs that are supported by little or no market activity and that are significant to the fair value of the assets and liabilities. This includes certain pricing models, discounted cash flow methodologies and similar techniques that use significant unobservable inputs.
The availability of observable market data is monitored to assess the appropriate classification of financial instruments within the fair value hierarchy. Changes in economic conditions or model-based valuation techniques may require the transfer of financial instruments from one fair value level to another. In such instances, the transfer is reported at the beginning of the reporting period. No transfers between levels were reported in
2014
or
2013
.
The following methods and assumptions were used by the Company in estimating the fair value of its financial instruments:
Cash and cash equivalents: Fair values were determined using Level 1 information.
Derivative financial instruments: Fair values for derivatives were measured using exchange-traded prices for the hedged items. The fair value was determined using Level 2 information, including consideration of counterparty risk and the Company’s credit risk.
Short-term and long-term debt: The fair values of the Allegheny Technologies
4.25%
Convertible Senior Notes due 2014 (for 2013 fair value), the Allegheny Technologies
9.375%
Senior Notes due 2019, the Allegheny Technologies
5.95%
Senior Notes due 2021, the Allegheny Technologies
5.875%
Senior Notes due 2023 and the Allegheny Ludlum
6.95%
Debentures due 2025 were determined using Level 1 information. The fair values of the other short-term and long-term debt were determined using Level 2 information.
The Company has defined benefit pension plans or defined contribution retirement plans covering substantially all employees. Benefits under the defined benefit pension plans are generally based on years of service and/or final average pay. The Company funds the U.S. pension plans in accordance with the Employee Retirement Income Security Act of 1974, as amended, and the Internal Revenue Code (“Code”).
The Company also sponsors several postretirement plans covering certain salaried and hourly employees. The plans provide health care and life insurance benefits for eligible retirees. In most retiree health care plans, Company contributions towards premiums are capped based on the cost as of a certain date, thereby creating a defined contribution. For the non-collectively bargained plans, the Company maintains the right to amend or terminate the plans at its discretion.
66
In December 2014, the Company announced several significant changes to its retirement benefit programs. These changes are part of the Company’s ongoing initiatives to create an integrated and aligned business with a market competitive, cost competitive, and consistent health, welfare and retirement benefit structure across its operations. These changes included:
|
•
|
Freezing all future benefit accruals to its U.S. qualified defined benefit pension plan (U.S. Plan), and to the Company’s non-qualified defined benefit pension plans, including the executive Supplemental Pension Plan, effective December 31, 2014.
|
|
•
|
Implementing a consistent defined contribution retirement plan with a base
6.5%
company contribution and up to
3%
in Company matching contributions across all U.S. operations effective January 1, 2015.
|
|
•
|
Ending Company-provided salaried retiree life insurance benefits effective January 1, 2015.
|
|
•
|
Ending all remaining Company-provided salaried retiree medical benefits on January 1, 2016. The salaried retiree medical benefit plan being ended was assumed as part of the 2011 Ladish acquisition. Certain participants in the retiree medical plan will have transition provisions through the end of 2016.
|
|
•
|
These changes to pension, retiree life insurance and medical benefits do not affect benefits for those employees or retirees covered by collective bargaining contracts or other contractual employment agreements.
|
The components of pension and other postretirement benefit expense for the Company’s defined benefit plans included the following:
|
|
Pension Benefits
|
Other Postretirement Benefits
|
||||||||||||||||||||||
|
(In millions)
|
2014
|
2013
|
2012
|
2014
|
2013
|
2012
|
||||||||||||||||||
|
Service cost—benefits earned during the year
|
$
|
29.4
|
|
$
|
39.0
|
|
$
|
35.0
|
|
$
|
2.9
|
|
$
|
3.2
|
|
$
|
3.1
|
|
||||||
|
Interest cost on benefits earned in prior years
|
133.6
|
|
122.8
|
|
132.4
|
|
24.0
|
|
22.4
|
|
26.1
|
|
||||||||||||
|
Expected return on plan assets
|
(184.2
|
)
|
(176.0
|
)
|
(181.4
|
)
|
(0.3
|
)
|
(0.5
|
)
|
(0.8
|
)
|
||||||||||||
|
Amortization of prior service cost (credit)
|
2.3
|
|
3.0
|
|
6.4
|
|
(3.0
|
)
|
(18.2
|
)
|
(18.2
|
)
|
||||||||||||
|
Amortization of net actuarial loss
|
74.0
|
|
111.8
|
|
105.2
|
|
14.1
|
|
17.2
|
|
14.6
|
|
||||||||||||
|
Curtailment (gain) loss
|
0.5
|
|
—
|
|
—
|
|
(25.5
|
)
|
—
|
|
—
|
|
||||||||||||
|
Termination benefits
|
0.3
|
|
4.8
|
|
—
|
|
—
|
|
1.3
|
|
—
|
|
||||||||||||
|
Total retirement benefit expense
|
$
|
55.9
|
|
$
|
105.4
|
|
$
|
97.6
|
|
$
|
12.2
|
|
$
|
25.4
|
|
$
|
24.8
|
|
||||||
Other postretirement benefit costs for a defined contribution plan were
$2.6 million
and
$4.6 million
for the fiscal years ended
December 31, 2014
and
2013
, respectively. The curtailment loss for pension benefits recorded in 2014 relates to unamortized prior service cost recognized as a result of the freezing of pension benefit accruals in the fourth quarter of 2014, as discussed above. The curtailment gain for other postretirement benefits recorded in 2014 relates to the changes to salaried retiree life insurance and medical benefits in the fourth quarter of 2014 as discussed above. Special termination benefits recorded in 2014 relate to the acceptance of an early retirement benefit in the Forged Products business. Special termination benefits recorded in 2013 relate largely to the closure of the Flat Rolled Product segment’s Wallingford, CT finishing facility, and these costs were reported in restructuring costs for segment reporting (see Notes 15 and 16).
Actuarial assumptions used to develop the components of defined benefit pension expense and other postretirement benefit expense were as follows:
|
|
Pension Benefits
|
Other Postretirement Benefits
|
||||||||||||||||
|
|
2014
|
2013
|
2012
|
2014
|
2013
|
2012
|
||||||||||||
|
Discount rate (a)
|
5.15
|
%
|
4.25 - 4.95%
|
|
5.00
|
%
|
5.15
|
%
|
4.25
|
%
|
5.00
|
%
|
||||||
|
Rate of increase in future compensation levels
|
3.0 - 3.50%
|
|
3.0 - 3.50%
|
|
3.0 - 4.50%
|
|
—
|
|
—
|
|
—
|
|
||||||
|
Expected long-term rate of return on assets
|
8.25
|
%
|
8.25
|
%
|
8.50
|
%
|
8.3
|
%
|
8.3
|
%
|
8.3
|
%
|
||||||
|
(a)
|
Pension expense for 2013 was initially measured at a
4.25%
discount rate. The U.S. Plan was remeasured using a
4.95%
discount rate as of October 31, 2013, following the sale of the tungsten materials business.
|
67
Actuarial assumptions used for the valuation of defined benefit pension and other postretirement benefit obligations at the end of the respective periods were as follows:
|
|
Pension Benefits
|
Other Postretirement Benefits
|
||||||||||
|
|
2014
|
2013
|
2014
|
2013
|
||||||||
|
Discount rate
|
4.25
|
%
|
5.15
|
%
|
4.10
|
%
|
5.15
|
%
|
||||
|
Rate of increase in future compensation levels
|
3.0 - 3.5%
|
|
3.0 - 3.5%
|
|
—
|
|
—
|
|
||||
A reconciliation of the funded status for the Company’s defined benefit pension and other postretirement benefit plans at
December 31, 2014
and
2013
was as follows:
|
|
Pension Benefits
|
Other Postretirement Benefits
|
||||||||||||||
|
(In millions)
|
2014
|
2013
|
2014
|
2013
|
||||||||||||
|
Change in benefit obligations:
|
||||||||||||||||
|
Benefit obligation at beginning of year
|
$
|
2,698.2
|
|
$
|
2,952.0
|
|
$
|
506.7
|
|
$
|
574.3
|
|
||||
|
Service cost
|
29.4
|
|
39.0
|
|
2.9
|
|
3.2
|
|
||||||||
|
Interest cost
|
133.6
|
|
122.8
|
|
24.0
|
|
22.4
|
|
||||||||
|
Benefits paid
|
(269.9
|
)
|
(195.6
|
)
|
(54.3
|
)
|
(52.9
|
)
|
||||||||
|
Subsidy paid
|
—
|
|
—
|
|
1.0
|
|
1.2
|
|
||||||||
|
Participant contributions
|
0.3
|
|
0.1
|
|
—
|
|
—
|
|
||||||||
|
Effect of currency rates
|
(4.9
|
)
|
0.8
|
|
—
|
|
—
|
|
||||||||
|
Net actuarial (gains) losses – discount rate change
|
288.5
|
|
(280.4
|
)
|
39.5
|
|
(36.9
|
)
|
||||||||
|
– other
|
78.4
|
|
54.7
|
|
(19.5
|
)
|
(5.9
|
)
|
||||||||
|
Plan curtailments
|
—
|
|
—
|
|
(7.2
|
)
|
—
|
|
||||||||
|
Plan settlements
|
—
|
|
—
|
|
(27.0
|
)
|
—
|
|
||||||||
|
Special termination benefits
|
0.3
|
|
4.8
|
|
—
|
|
1.3
|
|
||||||||
|
Benefit obligation at end of year
|
$
|
2,953.9
|
|
$
|
2,698.2
|
|
$
|
466.1
|
|
$
|
506.7
|
|
||||
Pension benefit payments in 2014 include approximately
$52 million
associated with a one-time, voluntary lump sum cash out offer to terminated vested participants in the U.S. Plan. Changes in the pension benefit obligation for 2014 include the effects of updated estimates of participant life expectancy, including consideration of the impacts of the updated 2014 U.S. Society of Actuaries projections and Company-specific experience. These mortality assumption changes increased the pension benefit obligation at December 31, 2014 by approximately
$90 million
.
|
Change in plan assets:
|
||||||||||||||||
|
Fair value of plan assets at beginning of year
|
$
|
2,329.8
|
|
$
|
2,220.0
|
|
$
|
4.0
|
|
$
|
6.3
|
|
||||
|
Actual returns on plan assets and plan expenses
|
136.8
|
|
293.8
|
|
(0.9
|
)
|
(0.9
|
)
|
||||||||
|
Employer contributions
|
11.5
|
|
10.7
|
|
—
|
|
—
|
|
||||||||
|
Participant contributions
|
0.3
|
|
0.1
|
|
—
|
|
—
|
|
||||||||
|
Effect of currency rates
|
(4.1
|
)
|
0.8
|
|
—
|
|
—
|
|
||||||||
|
Benefits paid
|
(269.9
|
)
|
(195.6
|
)
|
(0.2
|
)
|
(1.4
|
)
|
||||||||
|
Fair value of plan assets at end of year
|
$
|
2,204.4
|
|
$
|
2,329.8
|
|
$
|
2.9
|
|
$
|
4.0
|
|
||||
|
Amounts recognized in the consolidated balance sheet:
|
||||||||||||||||
|
Noncurrent assets
|
$
|
—
|
|
$
|
5.1
|
|
$
|
—
|
|
$
|
—
|
|
||||
|
Current liabilities
|
(10.2
|
)
|
(5.3
|
)
|
(47.3
|
)
|
(60.3
|
)
|
||||||||
|
Noncurrent liabilities
|
(739.3
|
)
|
(368.2
|
)
|
(415.8
|
)
|
(442.4
|
)
|
||||||||
|
Total amount recognized
|
$
|
(749.5
|
)
|
$
|
(368.4
|
)
|
$
|
(463.1
|
)
|
$
|
(502.7
|
)
|
||||
68
Changes to accumulated other comprehensive loss related to pension and other postretirement benefit plans in
2014
and
2013
were as follows:
|
|
Pension Benefits
|
Other Postretirement Benefits
|
||||||||||||||
|
(In millions)
|
2014
|
2013
|
2014
|
2013
|
||||||||||||
|
Beginning of year accumulated other comprehensive loss
|
$
|
(1,016.4
|
)
|
$
|
(1,474.7
|
)
|
$
|
(151.5
|
)
|
$
|
(191.9
|
)
|
||||
|
Amortization of net actuarial loss
|
74.0
|
|
111.8
|
|
14.1
|
|
17.2
|
|
||||||||
|
Amortization of prior service cost (credit)
|
2.3
|
|
3.0
|
|
(3.0
|
)
|
(18.2
|
)
|
||||||||
|
Remeasurements
|
(412.0
|
)
|
343.5
|
|
(12.5
|
)
|
41.4
|
|
||||||||
|
End of year accumulated other comprehensive loss
|
$
|
(1,352.1
|
)
|
$
|
(1,016.4
|
)
|
$
|
(152.9
|
)
|
$
|
(151.5
|
)
|
||||
|
Net change in accumulated other comprehensive loss
|
$
|
(335.7
|
)
|
$
|
458.3
|
|
$
|
(1.4
|
)
|
$
|
40.4
|
|
||||
Amounts included in accumulated other comprehensive loss at
December 31, 2014
and
2013
were as follows:
|
|
Pension Benefits
|
Other Postretirement Benefits
|
||||||||||||||
|
(In millions)
|
2014
|
2013
|
2014
|
2013
|
||||||||||||
|
Prior service (cost) credit
|
$
|
(4.9
|
)
|
$
|
(7.7
|
)
|
$
|
(11.8
|
)
|
$
|
(8.7
|
)
|
||||
|
Net actuarial loss
|
(1,347.2
|
)
|
(1,008.7
|
)
|
(141.1
|
)
|
(142.8
|
)
|
||||||||
|
Accumulated other comprehensive loss
|
(1,352.1
|
)
|
(1,016.4
|
)
|
(152.9
|
)
|
(151.5
|
)
|
||||||||
|
Deferred tax effect
|
514.7
|
|
390.7
|
|
58.8
|
|
58.3
|
|
||||||||
|
Accumulated other comprehensive loss, net of tax
|
$
|
(837.4
|
)
|
$
|
(625.7
|
)
|
$
|
(94.1
|
)
|
$
|
(93.2
|
)
|
||||
Retirement benefit expense for
2015
for defined benefit plans is estimated to be approximately
$77 million
, comprised of
$37 million
for pension expense and
$40 million
of expense for other postretirement benefits. As a result of the pension freeze effective December 31, 2014 and the resultant determination of inactive status, beginning in 2015, the U.S. Plan and the non-qualified U.S. pension plans will change the amortization period for accumulated other comprehensive loss recognition to the average remaining life expectancy, which is approximately
18
years on a weighted average basis, rather than the average remaining service period of
10
years, which was used in 2014 and prior periods.
Amounts in accumulated other comprehensive loss that are expected to be recognized as components of net periodic benefit cost in
2015
are:
|
(In millions)
|
Pension
Benefits
|
Other
Postretirement
Benefits
|
Total
|
|||||||||
|
Amortization of prior service cost
|
$
|
1.3
|
|
$
|
4.9
|
|
$
|
6.2
|
|
|||
|
Amortization of net actuarial loss
|
60.5
|
|
14.7
|
|
75.2
|
|
||||||
|
Amortization of accumulated other comprehensive loss
|
$
|
61.8
|
|
$
|
19.6
|
|
$
|
81.4
|
|
|||
The accumulated benefit obligation for all defined benefit pension plans was
$2,917.3 million
and
$2,621.8 million
at
December 31, 2014
and
2013
, respectively. Additional information for pension plans with accumulated benefit obligations in excess of plan assets:
|
|
Pension Benefits
|
|||||||
|
(In millions)
|
2014
|
2013
|
||||||
|
Projected benefit obligation
|
$
|
2,953.9
|
|
$
|
2,619.6
|
|
||
|
Accumulated benefit obligation
|
$
|
2,917.3
|
|
$
|
2,545.4
|
|
||
|
Fair value of plan assets
|
$
|
2,204.4
|
|
$
|
2,246.1
|
|
||
Based upon current regulations and actuarial studies, the Company does not expect to be required to make cash contributions to its U.S. Plan for
2015
. However, the Company may elect, depending upon the investment performance of the pension plan assets and other factors, to make voluntary cash contributions to this pension plan in the future. For
2015
, the Company expects to fund benefits of approximately
$10 million
for its U.S. nonqualified benefit pension plans and its U.K. defined benefit plan.
69
The following table summarizes expected benefit payments from the Company’s various pension and other postretirement benefit defined benefit plans through 2024, and also includes estimated Medicare Part D subsidies projected to be received during this period based on currently available information.
|
(In millions)
|
Pension
Benefits
|
Other
Postretirement
Benefits
|
Medicare Part
D Subsidy
|
|||||||||
|
2015
|
$
|
195.4
|
|
$
|
51.3
|
|
$
|
1.1
|
|
|||
|
2016
|
195.4
|
|
44.7
|
|
1.1
|
|
||||||
|
2017
|
195.1
|
|
42.6
|
|
1.1
|
|
||||||
|
2018
|
195.4
|
|
40.4
|
|
1.1
|
|
||||||
|
2019
|
195.1
|
|
38.3
|
|
1.1
|
|
||||||
|
2020 - 2024
|
967.7
|
|
154.7
|
|
4.7
|
|
||||||
The annual assumed rate of increase in the per capita cost of covered benefits (the health care cost trend rate) for health care plans was
8.0%
in
2015
and is assumed to gradually decrease to
5.0%
in the year
2028
and remain at that level thereafter. Assumed health care cost trend rates have a significant effect on the amounts reported for the health care plans. A one percentage point change in assumed health care cost trend rates would have the following effects:
|
(In millions)
|
One
Percentage
Point
Increase
|
One
Percentage
Point
Decrease
|
||||||
|
Effect on total of service and interest cost components for the year ended December 31, 2014
|
$
|
0.5
|
|
$
|
(0.5
|
)
|
||
|
Effect on other postretirement benefit obligation at December 31, 2014
|
$
|
11.1
|
|
$
|
(9.7
|
)
|
||
The plan assets for the U.S. Plan represent approximately
96%
of total pension plan assets at
December 31, 2014
. The U.S. Plan invests in a diversified portfolio consisting of an array of asset classes that attempts to maximize returns while minimizing volatility. These asset classes include U.S. domestic equities, developed market equities, emerging market equities, private equity, global high quality and high yield fixed income, floating rate debt and real estate. The Company continually monitors the investment results of these asset classes and its fund managers, and explores other potential asset classes for possible future investment.
U.S. Plan assets at
December 31, 2014
and
2013
included
3.0 million
shares of ATI common stock with a fair value of
$102.7 million
and
$105.3 million
, respectively. Dividends of
$2.1 million
were received by the U.S. Plan in both
2014
and
2013
on the ATI common stock held by this plan.
The fair values of the Company’s pension plan assets at
December 31, 2014
by asset category and by the level of inputs used to determine fair value, were as follows:
|
(In millions)
|
|
Quoted Prices in
Active Markets for
Identical Assets
|
Significant
Observable Inputs
|
Significant
Unobservable Inputs
|
||||||||||||
|
Asset category
|
Total
|
(Level 1)
|
(Level 2)
|
(Level 3)
|
||||||||||||
|
Equity securities:
|
||||||||||||||||
|
ATI common stock
|
$
|
102.7
|
|
$
|
102.7
|
|
$
|
—
|
|
$
|
—
|
|
||||
|
Other U.S. equities (a)
|
673.8
|
|
306.1
|
|
367.7
|
|
—
|
|
||||||||
|
International equities (b)
|
238.2
|
|
—
|
|
238.2
|
|
—
|
|
||||||||
|
Global debt securities and cash: (c)
|
||||||||||||||||
|
Fixed income and cash equivalents
|
383.5
|
|
0.7
|
|
373.9
|
|
8.9
|
|
||||||||
|
Floating rate
|
392.3
|
|
—
|
|
—
|
|
392.3
|
|
||||||||
|
Private equity
|
134.7
|
|
—
|
|
—
|
|
134.7
|
|
||||||||
|
Hedge funds
|
122.6
|
|
—
|
|
—
|
|
122.6
|
|
||||||||
|
Real estate and other
|
156.6
|
|
—
|
|
5.4
|
|
151.2
|
|
||||||||
|
Total assets
|
$
|
2,204.4
|
|
$
|
409.5
|
|
$
|
985.2
|
|
$
|
809.7
|
|
||||
|
(a)
|
Includes investments in commingled funds that invest in U.S. equity securities, comprised of approximately
90%
large-cap U.S. companies and
10%
small-cap U.S. companies.
|
70
|
(b)
|
Includes investments in commingled funds that invest in non-U.S. equity securities, comprised of approximately
90%
developed countries and
10%
emerging market economies.
|
|
(c)
|
Global debt securities include both fixed interest rate and floating interest rate instruments. These are comprised of actively managed investments which include U.S. government and U.S. government agency securities, foreign government securities, corporate bonds, mortgage-backed securities and other debt securities, and include both investment grade and non-investment grade debt, public and private debt, and secured and unsecured debt investments. To mitigate risk, investment managers have limitations regarding the amount of investment in particular securities and the credit quality of such investments.
|
The fair values of the Company’s pension plan assets at
December 31, 2013
by asset category and by the level of inputs used to determine fair value, were as follows:
|
(In millions)
|
|
Quoted Prices in
Active Markets for
Identical Assets
|
Significant
Observable Inputs
|
Significant
Unobservable Inputs
|
||||||||||||
|
Asset category
|
Total
|
(Level 1)
|
(Level 2)
|
(Level 3)
|
||||||||||||
|
Equity securities:
|
||||||||||||||||
|
ATI common stock
|
$
|
105.3
|
|
$
|
105.3
|
|
$
|
—
|
|
$
|
—
|
|
||||
|
Other U.S. equities (a)
|
746.0
|
|
257.2
|
|
488.8
|
|
—
|
|
||||||||
|
International equities (b)
|
311.0
|
|
—
|
|
311.0
|
|
—
|
|
||||||||
|
Global securities and cash: (c)
|
||||||||||||||||
|
Fixed income and cash equivalents
|
508.0
|
|
—
|
|
507.2
|
|
0.8
|
|
||||||||
|
Floating rate
|
294.5
|
|
—
|
|
—
|
|
294.5
|
|
||||||||
|
Private equity
|
94.5
|
|
—
|
|
—
|
|
94.5
|
|
||||||||
|
Hedge funds
|
139.7
|
|
—
|
|
—
|
|
139.7
|
|
||||||||
|
Real estate and other
|
130.8
|
|
—
|
|
5.0
|
|
125.8
|
|
||||||||
|
Total assets
|
$
|
2,329.8
|
|
$
|
362.5
|
|
$
|
1,312.0
|
|
$
|
655.3
|
|
||||
|
(a)
|
Includes investments in commingled funds that invest in U.S. equity securities, comprised of approximately
90%
large-cap U.S. companies and
10%
small-cap U.S. companies.
|
|
(b)
|
Includes investments in commingled funds that invest in non-U.S. equity securities, comprised of approximately
80%
developed countries and
20%
emerging market economies.
|
|
(c)
|
Global debt securities include both fixed interest rate and floating interest rate instruments. These are comprised of actively managed investments which include U.S. government and U.S. government agency securities, foreign government securities, corporate bonds, mortgage-backed securities and other debt securities, and include both investment grade and non-investment grade debt, public and private debt, and secured and unsecured debt investments. To mitigate risk, investment managers have limitations regarding the amount of investment in particular securities and the credit quality of such investments.
|
Transfers from Level 1 to Level 2 of the fair value hierarchy were approximately
$203 million
in 2013 based on the Company’s reassessment of fair value input measures and observable market data used to value certain investments, due to a changing mix of securities and the increased use of derivative financial instruments.
Changes in the fair value of Level 3 pension plan assets for the year ended
December 31, 2014
were as follows:
|
(In millions)
|
January 1,
2014 Balance
|
Net Realized
and Unrealized
Gains (Losses)
|
Net Purchases,
Issuances and
Settlements
|
Net Transfers
Into (Out Of)
Level 3
|
December 31,
2014 Balance
|
|||||||||||||||
|
Global debt securities and cash:
|
||||||||||||||||||||
|
Fixed income and cash equivalents
|
$
|
0.8
|
|
$
|
0.1
|
|
$
|
8.0
|
|
$
|
—
|
|
$
|
8.9
|
|
|||||
|
Floating rate debt
|
294.5
|
|
4.6
|
|
93.2
|
|
—
|
|
392.3
|
|
||||||||||
|
Private equity
|
94.5
|
|
19.1
|
|
21.1
|
|
—
|
|
134.7
|
|
||||||||||
|
Hedge funds
|
139.7
|
|
5.9
|
|
(23.0
|
)
|
—
|
|
122.6
|
|
||||||||||
|
Real estate and other
|
125.8
|
|
13.7
|
|
11.7
|
|
—
|
|
151.2
|
|
||||||||||
|
Total
|
$
|
655.3
|
|
$
|
43.4
|
|
$
|
111.0
|
|
$
|
—
|
|
$
|
809.7
|
|
|||||
71
Changes in the fair value of Level 3 pension plan assets for the year ended
December 31, 2013
were as follows:
|
(In millions)
|
January 1,
2013 Balance
|
Net Realized
and Unrealized
Gains (Losses)
|
Net Purchases,
Issuances and
Settlements
|
Net Transfers
Into (Out Of)
Level 3
|
December 31,
2013 Balance
|
|||||||||||||||
|
Global debt securities and cash:
|
||||||||||||||||||||
|
Fixed income and cash equivalents
|
$
|
1.4
|
|
$
|
0.1
|
|
$
|
(0.7
|
)
|
$
|
—
|
|
$
|
0.8
|
|
|||||
|
Floating rate debt
|
—
|
|
5.4
|
|
289.1
|
|
—
|
|
294.5
|
|
||||||||||
|
Private equity
|
85.5
|
|
3.9
|
|
5.1
|
|
—
|
|
94.5
|
|
||||||||||
|
Hedge funds
|
148.9
|
|
13.8
|
|
(23.0
|
)
|
—
|
|
139.7
|
|
||||||||||
|
Real estate and other
|
104.4
|
|
16.4
|
|
5.0
|
|
—
|
|
125.8
|
|
||||||||||
|
Total
|
$
|
340.2
|
|
$
|
39.6
|
|
$
|
275.5
|
|
$
|
—
|
|
$
|
655.3
|
|
|||||
A financial instrument’s categorization within the valuation hierarchy is based upon the lowest level of input that is significant to the fair value measurement. Investments in U.S. and International equities, and Fixed Income are predominantly held in common/collective trust funds and registered investment companies. These investments are public investment vehicles valued using the net asset value (NAV) provided by the administrator of the fund. The NAV is based on the value of the underlying assets owned by the fund, minus its liabilities, and then divided by the number of shares outstanding. In certain cases NAV is a quoted price in a market that is not active, and valuation is based on quoted prices for similar assets and liabilities in active markets, and these investments are classified within Level 2 of the valuation hierarchy. Investments that are not actively traded, such as non-publicly traded real estate funds, are classified within Level 3 of the valuation hierarchy, as the NAV is based on significant unobservable information.
Hedge fund investments are made either (1) as a limited partner in a portfolio of underlying hedge funds managed by a general partner or (2) through commingled institutional funds (CIFs) that in-turn invest in various portfolios of hedge funds whereby the allocation of the Plan’s investments to each CIF is managed by a third party Investment Manager. All hedge fund investments are classified within Level 3 of the valuation hierarchy, as the valuations are substantially based on unobservable information.
Private equity investments include both Direct Funds and Fund-of-Funds. All private equity investments are classified as Level 3 in the valuation hierarchy, as the valuations are substantially based upon unobservable information. Direct Funds are investments in Limited Partnership (LP) interests. Fund-of-Funds are investments in private equity funds that invest in other private equity funds or LPs.
Real estate investments are made in either (1) as a limited partner in a portfolio of properties managed by a general partner or (2) through a CIF that invests in a portfolio of real estate funds.
For certain investments classified as Level 3 which have formal financial valuations reported on a one-quarter lag, fair value is determined utilizing net asset values adjusted for subsequent cash flows, estimated financial performance and other significant events.
For
2015
, the expected long-term rate of returns on defined benefit pension assets will be
8.0%
. In developing the expected long-term rate of return assumptions, the Company evaluated input from its third party pension plan asset managers and actuaries, including reviews of their asset class return expectations and long-term inflation assumptions. The expected long-term rate of return is based on expected asset allocations within ranges for each investment category, and includes consideration of both historical and projected annual compound returns, weighted on a 65%/35% basis, respectively. The Company’s actual returns on pension assets for the last five years have been
6.5%
for
2014
,
14.3%
for
2013
,
8.0%
for
2012
,
0.3%
for
2011
, and
12.2%
for
2010
.
72
The target asset allocations for pension plans for
2015
, by major investment category, are:
* Have a combined target allocation of
18%
and a
20%
limit.
|
Asset category
|
Target asset allocation range
|
|
|
Equity securities:
|
||
|
U. S. equities
|
18% - 40%
|
|
|
International equities
|
7% - 17%
|
|
|
Global debt securities and cash
|
35% - 48%
|
|
|
Private equity*
|
0% - 10%
|
|
|
Hedge funds*
|
0% - 10%
|
|
|
Real estate and other*
|
0% - 10%
|
|
At
December 31, 2014
, other postretirement benefit plan assets of
$2.9 million
are primarily invested in private equity investments, which are classified as Level 3 in the valuation hierarchy, as the valuations are substantially based upon unobservable information. For 2015, the expected long-term rate of returns on these other postretirement benefit assets will be
4.0%
.
Costs for defined contribution plans were
$21.9 million
in
2014
,
$24.3 million
in
2013
, and
$23.8 million
in
2012
. Company contributions to these defined contribution plans are funded with cash.
Labor agreements with USW-represented employees require the Company to make contributions to VEBA trusts based upon the attainment of a certain level of profitability. The Company expects to make approximately
$16 million
of contributions, tied to profitability levels, to these VEBA trusts in
2015
.
The Company contributes to several multiemployer defined benefit pension plans under collective bargaining agreements that cover certain of its union-represented employees. The risks of participating in such plans are different from the risks of single-employer plans, in the following respects:
|
a.
|
Assets contributed to a multiemployer plan by one employer may be used to provide benefits to employees of other participating employers.
|
|
b.
|
If a participating employer ceases to contribute to the plan, the unfunded obligations of the plan may be borne by the remaining participating employers.
|
|
c.
|
If the Company ceases to have an obligation to contribute to the multiemployer plan in which it had been a contributing employer, it may be required to pay to the plan an amount based on the underfunded status of the plan and on the history of the Company’s participation in the plan prior to the cessation of its obligation to contribute. The amount that an employer that has ceased to have an obligation to contribute to a multiemployer plan is required to pay to the plan is referred to as a withdrawal liability.
|
The Company’s participation in multiemployer plans for the years ended
December 31, 2014
,
2013
and
2012
is reported in the following table. The Company’s contributions to the Steelworkers Western Independent Shops Pension Plan exceed
5%
of this plan’s total contributions for the plan year ended September 30, 2013, which is the most recent information available from the Plan Administrator.
|
|
|
Pension
Protection Act
Zone Status (1)
|
FIP / RP Status
Pending /
Implemented (2)
|
in millions
|
|
Expiration Dates
of Collective
Bargaining
Agreements
|
||||||||||||||||||
|
|
EIN / Pension
Plan Number
|
Company Contributions
|
Surcharge
Imposed (3)
|
|||||||||||||||||||||
|
Pension Fund
|
2014
|
2013
|
2014
|
2013
|
2012
|
|||||||||||||||||||
|
Steelworkers Western Independent Shops Pension Plan
|
90-0169564
/ 001
|
Green
|
Red
|
N/A
|
$
|
1.1
|
|
$
|
1.0
|
|
$
|
1.3
|
|
No
|
6/30/2015
|
|||||||||
|
Boilermakers-Blacksmiths National Pension Trust
|
48-6168020
/ 001
|
Yellow
|
Yellow
|
Yes
|
2.0
|
|
2.2
|
|
2.4
|
|
No
|
9/30/2018
|
||||||||||||
|
IAM National Pension Fund
|
51-6031295
/ 002
|
Green
|
Green
|
N/A
|
1.6
|
|
1.8
|
|
1.9
|
|
No
|
Various between 2018-2019 (4)
|
||||||||||||
|
Total contributions
|
$
|
4.7
|
|
$
|
5.0
|
|
$
|
5.6
|
|
|||||||||||||||
|
(1)
|
The most recent Pension Protection Act Zone Status available for ATI’s fiscal years
2014
and
2013
is for plan years ending in calendar years
2013
and
2012
, respectively. The zone status is based on information provided to ATI and other
|
73
participating employers by each plan and is certified by the plan’s actuary. A plan in the “red” zone had been determined to be in “critical status”, based on criteria established by the Code, and is generally less than
65%
funded. A plan in the “yellow” zone has been determined to be in “endangered status”, based on criteria established under the Code, and is generally less than
80%
funded. A plan in the “green” zone has been determined to be neither in “critical status” nor in “endangered status”, and is generally at least
80%
funded.
|
(2)
|
The “FIP / RP status Pending / Implemented” column indicates whether a Funding Improvement Plan, as required under the Code by plans in the “yellow” zone, or a Rehabilitation Plan, as required under the Code to be adopted by plans in the “red” zone, is pending or has been implemented as of the end of the plan year that ended in
2014
.
|
|
(3)
|
The “Surcharge Imposed” column indicates whether ATI’s contribution rate for
2014
included an amount in addition to the contribution rate specified in the applicable collective bargaining agreement, as imposed by a plan in “critical status”, in accordance with the requirements of the Code.
|
|
(4)
|
The Company is party to five separate bargaining agreements that require contributions to this plan. Expiration dates of these collective bargaining agreements range between February 25, 2018 and July 14, 2019.
|
The changes in accumulated other comprehensive income (loss) (AOCI) by component, net of tax, for the fiscal years ended
December 31, 2014
and
2013
were as follows (in millions):
|
Post-
retirement
benefit plans
|
Currency
translation
adjustment
|
Unrealized
holding gains
on securities
|
Derivatives
|
Total
|
|||||||||||||||
|
Attributable to ATI:
|
|||||||||||||||||||
|
Balance, December 31, 2012
|
$
|
(1,030.0
|
)
|
$
|
3.4
|
|
$
|
(0.1
|
)
|
$
|
(2.7
|
)
|
$
|
(1,029.4
|
)
|
||||
|
OCI before reclassifications
|
|
241.1
|
|
|
10.4
|
|
|
0.1
|
|
|
(15.5
|
)
|
236.1
|
|
|||||
|
Amounts reclassified from AOCI
|
(a)
|
70.0
|
|
(b)
|
1.5
|
|
(c)
|
—
|
|
(d)
|
8.6
|
|
80.1
|
|
|||||
|
Net current-period OCI
|
|
311.1
|
|
|
11.9
|
|
|
0.1
|
|
|
(6.9
|
)
|
316.2
|
|
|||||
|
Balance, December 31, 2013
|
(718.9
|
)
|
15.3
|
|
—
|
|
(9.6
|
)
|
(713.2
|
)
|
|||||||||
|
OCI before reclassifications
|
(266.4
|
)
|
(32.0
|
)
|
—
|
|
28.1
|
|
$
|
(270.3
|
)
|
||||||||
|
Amounts reclassified from AOCI
|
(a)
|
53.8
|
|
0.5
|
|
(c)
|
—
|
|
(d)
|
(2.2
|
)
|
52.1
|
|
||||||
|
Net current-period OCI
|
(212.6
|
)
|
(31.5
|
)
|
—
|
|
25.9
|
|
(218.2
|
)
|
|||||||||
|
Balance, December 31, 2014
|
$
|
(931.5
|
)
|
$
|
(16.2
|
)
|
$
|
—
|
|
$
|
16.3
|
|
$
|
(931.4
|
)
|
||||
|
Attributable to noncontrolling interests:
|
|||||||||||||||||||
|
Balance, December 31, 2012
|
$
|
—
|
|
$
|
23.7
|
|
$
|
—
|
|
$
|
—
|
|
$
|
23.7
|
|
||||
|
OCI before reclassifications
|
|
—
|
|
|
3.4
|
|
|
—
|
|
|
—
|
|
3.4
|
|
|||||
|
Amounts reclassified from AOCI
|
|
—
|
|
(c)
|
—
|
|
|
—
|
|
|
—
|
|
—
|
|
|||||
|
Net current-period OCI
|
|
—
|
|
|
3.4
|
|
|
—
|
|
|
—
|
|
3.4
|
|
|||||
|
Balance, December 31, 2013
|
—
|
|
27.1
|
|
—
|
|
—
|
|
27.1
|
|
|||||||||
|
OCI before reclassifications
|
|
—
|
|
(2.1
|
)
|
—
|
|
—
|
|
(2.1
|
)
|
||||||||
|
Amounts reclassified from AOCI
|
|
—
|
|
(c)
|
—
|
|
—
|
|
—
|
|
—
|
|
|||||||
|
Net current-period OCI
|
|
—
|
|
(2.1
|
)
|
—
|
|
—
|
|
(2.1
|
)
|
||||||||
|
Balance, December 31, 2014
|
$
|
—
|
|
$
|
25.0
|
|
$
|
—
|
|
$
|
—
|
|
$
|
25.0
|
|
||||
|
(a)
|
Amounts were included in net periodic benefit cost for pension and other postretirement benefit plans (see Note 11).
|
|
(b)
|
Amount was included in discontinued operations as part of the gain on sale of the tungsten materials business (see Note 3).
|
|
(c)
|
No amounts were reclassified to earnings.
|
|
(d)
|
Amounts were included in cost of goods sold in the period or periods the hedged item affects earnings (see Note 9).
|
Other comprehensive income (loss) amounts are net of applicable income tax expense (benefit) for each year presented. Foreign currency translation adjustments, including those pertaining to noncontrolling interests, are generally not adjusted for income taxes as they relate to indefinite investments in non-U.S. subsidiaries.
74
Reclassifications out of AOCI for the fiscal years ended
December 31, 2014
and
2013
were as follows:
|
|
Amount reclassified from AOCI (d)
|
|
|||||||||||
|
Fiscal year ended
|
|||||||||||||
|
Details about AOCI Components
(In millions)
|
December 31, 2014
|
|
December 31, 2013
|
Affected line item in the
consolidated statement of operations
|
|||||||||
|
Postretirement benefit plans
|
|
|
|
||||||||||
|
Prior service credit
|
$
|
0.7
|
|
(a)
|
$
|
15.2
|
|
(a)
|
|||||
|
Actuarial losses
|
(88.1
|
)
|
(a)
|
(129.0
|
)
|
(a)
|
|||||||
|
(87.4
|
)
|
(d)
|
(113.8
|
)
|
(d)
|
Total before tax
|
|||||||
|
(33.6
|
)
|
(43.8
|
)
|
Tax provision (benefit)
|
|||||||||
|
$
|
(53.8
|
)
|
$
|
(70.0
|
)
|
Net of tax
|
|||||||
|
Currency translation adjustment
|
$
|
(0.5
|
)
|
(b) , (d)
|
$
|
(1.5
|
)
|
(b) , (d)
|
|||||
|
Derivatives
|
|||||||||||||
|
Nickel and other raw material contracts
|
$
|
(1.0
|
)
|
(c)
|
$
|
(8.8
|
)
|
(c)
|
|||||
|
Natural gas contracts
|
3.4
|
|
(c)
|
(3.8
|
)
|
(c)
|
|||||||
|
Electricity contracts
|
0.7
|
|
(c)
|
(0.3
|
)
|
(c)
|
|||||||
|
Foreign exchange contracts
|
0.5
|
|
(c)
|
(1.1
|
)
|
(c)
|
|||||||
|
3.6
|
|
(d)
|
(14.0
|
)
|
(d)
|
Total before tax
|
|||||||
|
1.4
|
|
(5.4
|
)
|
Tax provision (benefit)
|
|||||||||
|
$
|
2.2
|
|
$
|
(8.6
|
)
|
Net of tax
|
|||||||
|
(a)
|
Amounts are included in the computation of pension and other postretirement benefit expense, which is reported in both cost of goods sold and selling and administrative expenses. For additional information, see Note 11.
|
|
(b)
|
Amount in 2014 is included in other income, net, and amount in 2013 is included in discontinued operations as part of the gain on sale of the tungsten materials business (see Note 3).
|
|
(c)
|
Amounts are included in cost of goods sold in the period or periods the hedged item affects earnings. For additional information, see Note 9.
|
|
(d)
|
For pretax items, positive amounts are income and negative amounts are expense in terms of the impact to net income. Tax effects are presented in conformity with ATI’s presentation in the consolidated statements of operations.
|
Preferred Stock
Authorized preferred stock may be issued in one or more series, with designations, powers and preferences as shall be designated by the Board of Directors. At
December 31, 2014
, there were
no
shares of preferred stock issued.
Share-based Compensation
During 2007, the Company adopted the Allegheny Technologies Incorporated 2007 Incentive Plan (the “Incentive Plan”), which was amended and restated in 2010 and further amended in 2012. Awards earned under share-based incentive compensation programs are generally paid with shares held in treasury, if sufficient treasury shares are held, and any additional required share payments are made with newly issued shares. At
December 31, 2014
, approximately
1.6 million
shares of common stock were available for future awards under the Incentive Plan. The general terms of each arrangement granted under the Incentive Plan, and predecessor plans, the method of estimating fair value for each arrangement, and award activity is reported below.
The Company sponsors
two
principal share-based incentive compensation programs, the Performance/Restricted Stock Program (PRSP) of nonvested stock awards, and the Long-Term Performance Plan (LTPP), which was adopted in 2014 and may include performance shares under the Total Shareholder Return (TSR) portion and nonvested stock awards under the
75
Long-Term Shareholder Value (LTSV) portion. Prior periods include performance equity awards issued under the former Total Shareholder Return Program (TRSP), which has the same performance measurement criteria as the TSR.
Nonvested stock awards:
Awards of nonvested stock are granted to employees, with either performance and/or service conditions. Awards of nonvested stock are also granted to non-employee directors, with service conditions. For nonvested stock awarded in
2014
,
2013
and
2012
, dividend equivalents, whether in stock or cash form, accumulate but are not paid until the underlying award vests. In 2014,
492,773
shares of nonvested stock were granted to employees under the PRSP.
In 2014,
113,827
shares of nonvested stock were also granted under the LTSV portion of the newly-adopted LTPP plan. The LTSV award vests at the end of a
three
-year measurement period subject to the achievement, in whole or in part, of specified Operational Goals. As of December 31, 2014, these Operational Goals were expected to be attained.
The fair value of nonvested stock awards is measured based on the stock price at the grant date, adjusted for non-participating dividends, as applicable, based on the current dividend rate. For nonvested stock awards to employees in
2014
,
2013
, and
2012
, under the Company’s PRSP, one-half of the nonvested stock (“performance shares”) vests only on the attainment of an income target, measured over a cumulative
three
-year period. The remaining nonvested stock awarded to employees vests over a service period of
five
years, with accelerated vesting to
three
years if the performance shares’ vesting criterion is attained. Expense for each of these awards is recognized based on estimates of attaining the performance criterion, including estimated forfeitures. As of
December 31, 2014
, the income target for the 2012 PRSP award was not met, and
171,083
shares were forfeited. Vesting of the remaining half of the 2012 PRSP award continues over the
five
-year service period through February 2017. The income target for the 2013 PRSP awards is not expected to be attained for the performance shares, therefore, no expense was recognized on the performance shares and expense for the remaining nonvested stock was recognized on a straight line basis over the
five
-year service period. As of
December 31, 2014
, the income target for the 2014 PRSP nonvested stock award is expected to be attained for the performance shares, and expense for both portions of the award was recognized on a straight line basis based on a
three
-year vesting assumption.
Compensation expense in continuing operations related to all nonvested stock awards was
$2.4 million
in
2014
,
$11.3 million
in
2013
, and
$14.0 million
in
2012
. Reduced compensation expense in 2014 is primarily the result of the forfeiture of the 2012 PRSP award performance shares. Approximately
$18.9 million
of unrecognized fair value compensation expense relating to nonvested stock awards is expected to be recognized through 2018 based on estimates of attaining performance vesting criteria, including estimated forfeitures. Activity under the Company’s nonvested stock awards for the years ended
December 31, 2014
,
2013
, and
2012
was as follows:
|
(Shares in thousands, $ in millions)
|
2014
|
2013
|
2012
|
||||||||||||||||||
|
|
Number of
shares
|
Weighted
Average
Grant Date
Fair Value
|
Number of
shares
|
Weighted
Average Grant
Date Fair
Value
|
Number of
shares
|
Weighted
Average Grant
Date Fair
Value
|
|||||||||||||||
|
Nonvested, beginning of year
|
927
|
|
$
|
36.9
|
|
727
|
|
$
|
38.6
|
|
677
|
|
$
|
36.4
|
|
||||||
|
Granted
|
675
|
|
20.3
|
|
576
|
|
16.4
|
|
394
|
|
16.4
|
|
|||||||||
|
Vested
|
(18
|
)
|
(1.0
|
)
|
(333
|
)
|
(16.4
|
)
|
(343
|
)
|
(14.1
|
)
|
|||||||||
|
Forfeited
|
(208
|
)
|
(8.4
|
)
|
(43
|
)
|
(1.7
|
)
|
(1
|
)
|
(0.1
|
)
|
|||||||||
|
Nonvested, end of year
|
1,376
|
|
$
|
47.8
|
|
927
|
|
$
|
36.9
|
|
727
|
|
$
|
38.6
|
|
||||||
Performance equity awards:
Award opportunities under the TSR, and previously the TSRP, are determined at a target number of shares, and performance equity awards pay out based on the measured return of the Company’s stock price and dividend performance at the end of
three
-year periods as compared to the stock price and dividend performance of a group of industry peers. In 2014, the Company established a 2014-2016 TSR award, with
319,955
shares as the target award level. A maximum of
1.85 million
shares have been reserved for issuance for award periods under the TSR and the TSRP. The actual number of shares awarded at the end of the performance measurement period may range from a minimum of
zero
to a maximum of
two
times target. Fair values for these performance awards were estimated using Monte Carlo simulations of stock price correlation, projected dividend yields and other variables over
three
-year time horizons matching the total shareholder return performance measurement periods. Compensation expense from continuing operations was
$9.8 million
in
2014
,
$12.3 million
in
2013
, and
$19.2 million
in
2012
for the fair value of TSR and TSRP awards.
76
The estimated fair value of each performance equity award, the projected shares to be awarded and future compensation expense to be recognized for these awards, including actual and estimated forfeitures, was as follows:
(Shares in thousands, $ in millions)
|
TSR / TSRP Award Performance Period
|
Award
Fair Value
|
December 31, 2014
Unrecognized
Compensation
Expense
|
Minimum
Shares
|
Target
Shares
|
Maximum
Shares
|
||||||||||||
|
2012 - 2014
|
$
|
8.8
|
|
$
|
—
|
|
—
|
|
186
|
|
373
|
|
|||||
|
2013 - 2015
|
$
|
11.0
|
|
3.7
|
|
—
|
|
309
|
|
618
|
|
||||||
|
2014 - 2016
|
$
|
9.9
|
|
6.6
|
|
—
|
|
294
|
|
589
|
|
||||||
|
Total
|
$
|
10.3
|
|
—
|
|
789
|
|
1,580
|
|
||||||||
An award was earned for the 2012-2014 TSRP performance period based on the Company’s stock price and dividend performance for the three-year period ended
December 31, 2014
relative to the peer group, which resulted in the issuance of
137,843
shares of stock to participants in the 2015 first quarter.
Undistributed Earnings of Investees
Stockholders’ equity includes undistributed earnings of investees accounted for under the equity method of accounting of approximately
$12 million
at
December 31, 2014
.
The income tax provision (benefit) was as follows:
|
(In millions)
|
2014
|
2013
|
2012
|
|||||||||
|
Continuing operations:
|
||||||||||||
|
Current:
|
||||||||||||
|
Federal
|
$
|
(47.9
|
)
|
$
|
(127.5
|
)
|
$
|
82.3
|
|
|||
|
State
|
(4.0
|
)
|
(10.2
|
)
|
8.7
|
|
||||||
|
Foreign
|
9.8
|
|
7.9
|
|
9.0
|
|
||||||
|
Total
|
(42.1
|
)
|
(129.8
|
)
|
100.0
|
|
||||||
|
Deferred:
|
||||||||||||
|
Federal
|
34.1
|
|
62.7
|
|
(27.6
|
)
|
||||||
|
State
|
(0.2
|
)
|
4.6
|
|
0.1
|
|
||||||
|
Foreign
|
(0.5
|
)
|
(1.1
|
)
|
(0.1
|
)
|
||||||
|
Total
|
33.4
|
|
66.2
|
|
(27.6
|
)
|
||||||
|
Income tax provision (benefit) from continuing operations
|
$
|
(8.7
|
)
|
$
|
(63.6
|
)
|
$
|
72.4
|
|
|||
|
Income tax provision (benefit) from discontinued operations
|
$
|
(0.3
|
)
|
$
|
161.4
|
|
$
|
3.8
|
|
|||
|
Total company income tax provision (benefit)
|
$
|
(9.0
|
)
|
$
|
97.8
|
|
$
|
76.2
|
|
|||
77
The following is a reconciliation of income taxes computed at the statutory U.S. Federal income tax rate to the actual effective income tax provision (benefit) from continuing operations:
|
|
Income Tax Provision (Benefit)
|
|||||||||||
|
(In millions)
|
2014
|
2013
|
2012
|
|||||||||
|
Taxes computed at the federal rate
|
$
|
0.5
|
|
$
|
(54.2
|
)
|
$
|
81.3
|
|
|||
|
State and local income taxes, net of federal tax benefit
|
(2.0
|
)
|
(11.8
|
)
|
0.6
|
|
||||||
|
Tax reserve adjustments
|
(0.5
|
)
|
(10.2
|
)
|
(0.4
|
)
|
||||||
|
Repatriation of foreign earnings
|
0.3
|
|
9.4
|
|
1.3
|
|
||||||
|
Valuation allowance
|
0.5
|
|
9.1
|
|
2.2
|
|
||||||
|
Adjustment to prior years’ taxes
|
0.1
|
|
(5.3
|
)
|
1.4
|
|
||||||
|
Foreign earnings taxed at different rate
|
(6.6
|
)
|
(2.5
|
)
|
(10.2
|
)
|
||||||
|
Manufacturing deduction
|
—
|
|
—
|
|
(7.1
|
)
|
||||||
|
Other
|
(1.0
|
)
|
1.9
|
|
3.3
|
|
||||||
|
Income tax provision (benefit)
|
$
|
(8.7
|
)
|
$
|
(63.6
|
)
|
$
|
72.4
|
|
|||
In general, the Company is responsible for filing consolidated U.S. Federal, foreign and combined, unitary or separate state income tax returns. The Company is responsible for paying the taxes relating to such returns, including any subsequent adjustments resulting from the redetermination of such tax liability by the applicable taxing authorities. No provision has been made for U.S. Federal, state or additional foreign taxes related to approximately
$181 million
of undistributed earnings of foreign subsidiaries which have been permanently re-invested. It is not practical to determine the deferred tax liability on these earnings.
Income (loss) from continuing operations before income taxes for the Company’s U.S. and non-U.S. operations was as follows:
|
(In millions)
|
2014
|
2013
|
2012
|
|||||||||
|
U.S.
|
$
|
(46.1
|
)
|
$
|
(180.0
|
)
|
$
|
178.4
|
|
|||
|
Non-U.S.
|
47.6
|
|
25.2
|
|
53.9
|
|
||||||
|
Income (loss) from continuing operations before income taxes
|
$
|
1.5
|
|
$
|
(154.8
|
)
|
$
|
232.3
|
|
|||
Income taxes paid and amounts received as refunds were as follows:
|
(In millions)
|
2014
|
2013
|
2012
|
|||||||||
|
Income taxes paid
|
$
|
15.1
|
|
$
|
21.4
|
|
$
|
101.7
|
|
|||
|
Income tax refunds received
|
(20.2
|
)
|
(18.3
|
)
|
(15.8
|
)
|
||||||
|
Income taxes paid (received), net
|
$
|
(5.1
|
)
|
$
|
3.1
|
|
$
|
85.9
|
|
|||
The Company’s income tax payments have benefited over the last several years from provisions under the U.S. tax code allowing companies to immediately deduct a significant portion of the cost of new capital investments placed into service. In the first-half of 2015, the Company expects to receive an approximately
$60 million
federal tax refund which relates to a refund of prior years’ taxes. After this refund, the Company expects to have approximately
$76 million
of tax-effected federal net operating loss carryforwards and
$33.5 million
of other federal tax credits to offset future federal tax liabilities.
78
Deferred income taxes result from temporary differences in the recognition of income and expense for financial and income tax reporting purposes, and differences between the fair value of assets acquired in business combinations accounted for as purchases for financial reporting purposes and their corresponding tax bases. Deferred income taxes represent future tax benefits or costs to be recognized when those temporary differences reverse. The categories of assets and liabilities that have resulted in differences in the timing of the recognition of income and expense at
December 31, 2014
and
2013
were as follows:
|
(In millions)
|
2014
|
2013
|
||||||
|
Deferred income tax assets
|
||||||||
|
Pensions
|
$
|
251.8
|
|
$
|
115.7
|
|
||
|
Postretirement benefits other than pensions
|
169.0
|
|
182.9
|
|
||||
|
Federal and state net operating loss tax carryovers
|
122.7
|
|
32.2
|
|
||||
|
Federal and state tax credits
|
53.6
|
|
42.0
|
|
||||
|
Deferred compensation and other benefit plans
|
25.6
|
|
29.4
|
|
||||
|
Self insurance reserves
|
10.1
|
|
10.1
|
|
||||
|
Other items
|
79.1
|
|
79.5
|
|
||||
|
Gross deferred income tax assets
|
711.9
|
|
491.8
|
|
||||
|
Valuation allowance for deferred tax assets
|
(34.4
|
)
|
(33.9
|
)
|
||||
|
Total deferred income tax assets
|
677.5
|
|
457.9
|
|
||||
|
Deferred income tax liabilities
|
||||||||
|
Bases of property, plant and equipment
|
579.5
|
|
488.1
|
|
||||
|
Inventory valuation
|
111.7
|
|
66.5
|
|
||||
|
Bases of amortizable intangible assets
|
75.5
|
|
67.1
|
|
||||
|
Other items
|
53.9
|
|
46.3
|
|
||||
|
Total deferred tax liabilities
|
820.6
|
|
668.0
|
|
||||
|
Net deferred tax liability
|
$
|
(143.1
|
)
|
$
|
(210.1
|
)
|
||
The Company had
$34.4 million
and
$33.9 million
in deferred tax asset valuation allowances at
December 31, 2014
and
2013
, respectively, related to federal foreign tax credits and state deferred tax assets. The valuation allowance at
December 31, 2014
includes
$2.3 million
for federal foreign tax credits,
$20.9 million
for state net operating loss tax carryforwards,
$10.0 million
for state tax credits and
$1.2 million
for state temporary differences, since the Company has concluded, based on current state tax laws, that it is more likely than not that these tax benefits would not be realized. For these state net operating loss tax carryforwards, expiration will generally occur within
20 years
of the year generated and utilization of the tax benefit is limited to
$5 million
per year or
30%
of apportioned income, whichever is greater.
The changes in the liability for unrecognized income tax benefits for the years ended
December 31, 2014
,
2013
and
2012
were as follows:
|
(In millions)
|
2014
|
2013
|
2012
|
|||||||||
|
Balance at beginning of year
|
$
|
72.8
|
|
$
|
29.2
|
|
$
|
29.7
|
|
|||
|
Increases in prior period tax positions
|
2.0
|
|
0.1
|
|
0.2
|
|
||||||
|
Decreases in prior period tax positions
|
(0.6
|
)
|
(5.8
|
)
|
(0.3
|
)
|
||||||
|
Increases in current period tax positions
|
0.7
|
|
60.4
|
|
1.2
|
|
||||||
|
Expiration of the statute of limitations
|
(0.5
|
)
|
(0.7
|
)
|
(2.0
|
)
|
||||||
|
Settlements
|
(0.7
|
)
|
(8.6
|
)
|
(0.4
|
)
|
||||||
|
Interest and penalties, net
|
(0.3
|
)
|
(1.8
|
)
|
0.8
|
|
||||||
|
Balance at end of year
|
$
|
73.4
|
|
$
|
72.8
|
|
$
|
29.2
|
|
|||
At
December 31, 2014
, interest and penalties included in the liability for unrecognized tax benefits were
$4.4 million
.
For the years ended
December 31, 2014
and
2013
,
$60.9 million
and
$59.4 million
, respectively, of the liability for unrecognized income tax benefits relates to temporary differences, which would not impact the effective tax rate upon resolution of the uncertainty. Including tax positions for which the Company determined that the tax position would not meet the more-likely-than-not recognition threshold upon examination by the tax authorities based upon the technical merits of the position, the total estimated unrecognized tax benefit that, if recognized, would affect ATI’s effective tax rate was approximately
$9 million
. At this time, the Company believes that it is reasonably possible that approximately
$62 million
of
79
the estimated unrecognized tax benefits as of
December 31, 2014
will be recognized within the next twelve months based on the expiration of statutory review periods.
The Company, and/or one of its subsidiaries, files income tax returns in the U.S. Federal jurisdiction and in various state and foreign jurisdictions. A summary of tax years that remain subject to examination, by major tax jurisdiction, is as follows:
|
Jurisdiction
|
Earliest Year Open to
Examination
|
|
|
U.S. Federal
|
2013
|
|
|
States:
|
||
|
Alabama
|
2011
|
|
|
Illinois
|
2011
|
|
|
North Carolina
|
2010
|
|
|
Oregon
|
2011
|
|
|
Pennsylvania
|
2011
|
|
|
Foreign:
|
||
|
China
|
2010
|
|
|
Germany
|
2012
|
|
|
Poland
|
2010
|
|
|
United Kingdom
|
2011
|
|
The Company operates in two business segments: High Performance Materials & Components and Flat Rolled Products. The High Performance Materials & Components business segment produces, converts and distributes a wide range of high performance materials, including titanium and titanium-based alloys, nickel- and cobalt-based alloys and superalloys, zirconium and related alloys including hafnium and niobium, advanced powder alloys and other specialty materials, in long product forms such as ingot, billet, bar, rod, wire, shapes and rectangles, and seamless tubes, plus precision forgings and castings, components and machined parts. These products are designed for the high performance requirements of such major end markets as aerospace and defense, oil and gas, chemical process industry, electrical energy, and medical. The business units in this segment include ATI Specialty Materials, ATI Specialty Alloys and Components, ATI Forged Products, ATI Cast Products and ATI Flowform Products.
The Flat Rolled Products business segment produces, converts and distributes stainless steel, nickel-based alloys, specialty alloys, and titanium and titanium-based alloys, in a variety of product forms including plate, sheet, engineered strip, and Precision Rolled Strip
®
products, as well as grain-oriented electrical steel. The major end markets for our flat rolled products are oil and gas, chemical process industry, electrical energy, automotive, food processing equipment and appliances, construction and mining, electronics, communication equipment and computers, and aerospace and defense. The business units in this segment include ATI Flat Rolled Products and STAL, in which the Company has a
60%
ownership interest. Segment results also include ATI’s
50%
interest in Uniti, which is accounted for under the equity method. Sales to Uniti, which are included in ATI’s consolidated statements of operations, were
$75.3 million
in
2014
,
$95.9 million
in
2013
, and
$77.1 million
in
2012
. ATI’s share of Uniti’s (loss)/income was
$(8.9) million
in
2014
,
$(7.1) million
in
2013
, and
$4.9 million
in
2012
, which is included in the Flat Rolled Products segment’s operating profit, and within cost of sales in the consolidated statements of operations. The remaining
50%
interest in Uniti is held by VSMPO, a Russian producer of titanium, aluminum, and specialty steel products.
Intersegment sales are generally recorded at full cost or market. Common services are allocated on the basis of estimated utilization. Business segment results exclude amounts reported in discontinued operations.
80
|
(In millions)
|
2014
|
2013
|
2012
|
|||||||||
|
Total sales:
|
||||||||||||
|
High Performance Materials & Components
|
$
|
2,084.6
|
|
$
|
2,016.7
|
|
$
|
2,398.1
|
|
|||
|
Flat Rolled Products
|
2,320.2
|
|
2,146.6
|
|
2,398.9
|
|
||||||
|
Total sales
|
4,404.8
|
|
4,163.3
|
|
4,797.0
|
|
||||||
|
Intersegment sales:
|
||||||||||||
|
High Performance Materials & Components
|
77.8
|
|
71.9
|
|
84.1
|
|
||||||
|
Flat Rolled Products
|
103.6
|
|
47.9
|
|
46.0
|
|
||||||
|
Total intersegment sales
|
181.4
|
|
119.8
|
|
130.1
|
|
||||||
|
Sales to external customers:
|
||||||||||||
|
High Performance Materials & Components
|
2,006.8
|
|
1,944.8
|
|
2,314.0
|
|
||||||
|
Flat Rolled Products
|
2,216.6
|
|
2,098.7
|
|
2,352.9
|
|
||||||
|
Total sales to external customers
|
$
|
4,223.4
|
|
$
|
4,043.5
|
|
$
|
4,666.9
|
|
|||
Total direct international sales were
$1,607.5 million
in
2014
,
$1,585.1 million
in
2013
, and
$1,705.7 million
in
2012
. Of these amounts, sales by operations in the United States to customers in other countries were
$1,201.8 million
in
2014
,
$1,175.1 million
in
2013
, and
$1,262.9 million
in
2012
.
|
(In millions)
|
2014
|
2013
|
2012
|
|||||||||
|
Operating profit (loss):
|
||||||||||||
|
High Performance Materials & Components
|
$
|
289.6
|
|
$
|
209.1
|
|
$
|
385.4
|
|
|||
|
Flat Rolled Products
|
(43.3
|
)
|
(44.7
|
)
|
127.8
|
|
||||||
|
Total operating profit
|
246.3
|
|
164.4
|
|
513.2
|
|
||||||
|
Corporate expenses
|
(44.2
|
)
|
(43.0
|
)
|
(68.4
|
)
|
||||||
|
Interest expense, net
|
(108.7
|
)
|
(65.2
|
)
|
(71.6
|
)
|
||||||
|
Restructuring costs
|
—
|
|
(67.5
|
)
|
—
|
|
||||||
|
Closed company and other expenses
|
(21.2
|
)
|
(14.2
|
)
|
(18.5
|
)
|
||||||
|
Retirement benefit expense
|
(70.7
|
)
|
(129.3
|
)
|
(122.4
|
)
|
||||||
|
Income (loss) before income taxes
|
$
|
1.5
|
|
$
|
(154.8
|
)
|
$
|
232.3
|
|
|||
Business segment operating profit excludes costs for restructuring charges (see Note 16), retirement benefit income or expense, corporate expenses, interest expenses, debt extinguishment costs, and costs associated with closed operations. These costs are excluded for segment reporting to provide a profit measure based on what management considers to be controllable costs at the segment level. Retirement benefit expense includes both defined benefit pension expense and other postretirement benefit expenses. Costs associated with multiemployer pension plans are included in segment operating profit, and costs associated with defined contribution retirement plans are included in segment operating profit or corporate expenses, as applicable.
Business segment operating profit for 2013 includes a
$55.5 million
charge for inventory valuation adjustments, including a
$35.0 million
LIFO-related net realizable value charge in the High Performance Materials & Components segment and a
$20.5 million
charge related to the market-based valuation of industrial titanium products in the Flat Rolled Products segment. The
$35.0 million
net realizable value reserve in the High Performance Materials & Components segment was reduced to
$10.0 million
at
December 31, 2014
. A charge of
$23.2 million
related to the market-based valuation of industrial titanium products was recorded in 2014 in the Flat Rolled Products segment.
Closed company and other expenses, which were
$21.2 million
in
2014
,
$14.2 million
in
2013
and
$18.5 million
in
2012
, includes charges incurred in connection with closed operations, pre-tax gains and losses on the sale of surplus real estate, non-strategic investments, and other assets, and other non-operating income or expense. Other items are primarily presented in selling and administrative expenses in the consolidated statements of operations. In
2014
, these other items included
$8.0 million
for closed company environmental costs,
$3.8 million
for closed company insurance obligations, and
$9.4 million
for other expenses including legal matters and real estate costs at closed companies. In
2013
, the Company recorded
$14.2 million
in other charges primarily related to closed companies, including
$3.9 million
for environmental costs and
$10.3 million
for other expenses including real estate costs at closed companies. In
2012
, the Company recorded
$18.5 million
in other charges primarily related to closed companies, including
$4.3 million
for environmental costs,
$4.0 million
for real estate costs at closed companies, and
$10.2 million
for other expenses including legal matters and foreign exchange losses.
81
Certain additional information regarding the Company’s business segments is presented below:
|
(In millions)
|
2014
|
2013
|
2012
|
|||||||||
|
Depreciation and amortization:
|
||||||||||||
|
High Performance Materials & Components
|
$
|
124.4
|
|
$
|
127.4
|
|
$
|
130.0
|
|
|||
|
Flat Rolled Products
|
49.3
|
|
49.5
|
|
49.7
|
|
||||||
|
Corporate
|
2.9
|
|
3.7
|
|
1.7
|
|
||||||
|
Total depreciation and amortization
|
176.6
|
|
180.6
|
|
181.4
|
|
||||||
|
Capital expenditures:
|
||||||||||||
|
High Performance Materials & Components
|
51.9
|
|
39.5
|
|
59.9
|
|
||||||
|
Flat Rolled Products
|
172.1
|
|
568.1
|
|
311.3
|
|
||||||
|
Corporate
|
1.7
|
|
0.2
|
|
1.3
|
|
||||||
|
Total capital expenditures
|
225.7
|
|
607.8
|
|
372.5
|
|
||||||
|
Identifiable assets:
|
2014
|
2013
|
2012
|
|||||||||
|
High Performance Materials & Components
|
3,555.8
|
|
3,452.2
|
|
3,720.7
|
|
||||||
|
Flat Rolled Products
|
2,601.6
|
|
2,320.9
|
|
1,857.0
|
|
||||||
|
Discontinued Operations
|
1.8
|
|
9.8
|
|
214.0
|
|
||||||
|
Corporate:
|
||||||||||||
|
Prepaid pension cost
|
—
|
|
5.1
|
|
—
|
|
||||||
|
Deferred taxes
|
—
|
|
—
|
|
71.5
|
|
||||||
|
Cash and cash equivalents and other
|
423.4
|
|
1,110.5
|
|
384.6
|
|
||||||
|
Total assets
|
$
|
6,582.6
|
|
$
|
6,898.5
|
|
$
|
6,247.8
|
|
|||
Geographic information for external sales based on country of destination, and assets, are as follows:
|
($ in millions)
|
2014
|
Percent
of total
|
2013
|
Percent
of total
|
2012
|
Percent
of total
|
|||||||||||||||
|
External sales:
|
|||||||||||||||||||||
|
United States
|
$
|
2,615.9
|
|
62
|
%
|
$
|
2,458.4
|
|
61
|
%
|
$
|
2,961.1
|
|
63
|
%
|
||||||
|
China
|
249.6
|
|
6
|
%
|
237.7
|
|
6
|
%
|
255.4
|
|
5
|
%
|
|||||||||
|
United Kingdom
|
228.4
|
|
5
|
%
|
251.5
|
|
6
|
%
|
303.9
|
|
7
|
%
|
|||||||||
|
Germany
|
207.7
|
|
5
|
%
|
215.4
|
|
5
|
%
|
256.0
|
|
6
|
%
|
|||||||||
|
France
|
168.1
|
|
4
|
%
|
152.8
|
|
4
|
%
|
157.0
|
|
3
|
%
|
|||||||||
|
Italy
|
160.7
|
|
4
|
%
|
132.3
|
|
3
|
%
|
136.1
|
|
3
|
%
|
|||||||||
|
Canada
|
147.0
|
|
3
|
%
|
141.0
|
|
4
|
%
|
134.9
|
|
3
|
%
|
|||||||||
|
Japan
|
89.3
|
|
2
|
%
|
124.7
|
|
3
|
%
|
93.7
|
|
2
|
%
|
|||||||||
|
Mexico
|
76.5
|
|
2
|
%
|
54.9
|
|
1
|
%
|
49.3
|
|
1
|
%
|
|||||||||
|
Other
|
280.2
|
|
7
|
%
|
274.8
|
|
7
|
%
|
319.5
|
|
7
|
%
|
|||||||||
|
Total External Sales
|
$
|
4,223.4
|
|
100
|
%
|
$
|
4,043.5
|
|
100
|
%
|
$
|
4,666.9
|
|
100
|
%
|
||||||
|
($ in millions)
|
2014
|
Percent
of total
|
2013
|
Percent
of total
|
2012
|
Percent
of total
|
|||||||||||||||
|
Total assets:
|
|||||||||||||||||||||
|
United States
|
$
|
5,879.6
|
|
90
|
%
|
$
|
6,145.4
|
|
89
|
%
|
$
|
5,505.0
|
|
88
|
%
|
||||||
|
China
|
280.5
|
|
4
|
%
|
258.1
|
|
4
|
%
|
276.2
|
|
4
|
%
|
|||||||||
|
United Kingdom
|
196.3
|
|
3
|
%
|
208.0
|
|
3
|
%
|
239.2
|
|
4
|
%
|
|||||||||
|
Luxembourg (a)
|
81.8
|
|
1
|
%
|
145.9
|
|
2
|
%
|
48.3
|
|
1
|
%
|
|||||||||
|
Other
|
144.4
|
|
2
|
%
|
141.1
|
|
2
|
%
|
179.1
|
|
3
|
%
|
|||||||||
|
Total Assets
|
$
|
6,582.6
|
|
100
|
%
|
$
|
6,898.5
|
|
100
|
%
|
$
|
6,247.8
|
|
100
|
%
|
||||||
|
(a)
|
Comprises assets held by the Company’s European Treasury Center operation.
|
82
For the year ended December 31, 2013, the Company recorded pre-tax restructuring charges in continuing operations of
$67.5 million
(
$41.2 million
after-tax or
$0.39
per share) which are presented as restructuring costs in the consolidated statement of operations. These pre-tax charges were comprised of
$55.1 million
in non-cash long-lived asset impairment charges,
$4.2 million
in facility closure costs and
$8.2 million
in employee severance and termination benefit charges. The non-cash long-lived asset impairment charges were based on analysis of the estimated fair values, which represents Level 3 unobservable information in the fair value hierarchy.
|
•
|
In the High Performance Materials & Components segment, the Company permanently closed the previously idled Albany, Oregon standard-grade titanium sponge facility, resulting in a
$38.1 million
non-cash asset impairment charge in 2013. In addition, a charge was recorded for
$3.5 million
of asset retirement obligations, which were substantially completed in 2014.
|
|
•
|
In the Flat Rolled Products segment, the Company permanently closed the previously idled New Castle, Indiana stainless finishing facility in 2013, and the Wallingford, Connecticut stainless finishing facility in 2014. The closure of New Castle and Wallingford resulted in
$6.3 million
and
$2.7 million
, respectively, of non-cash asset impairment charges in 2013. Facility closure costs in 2013 included
$0.3 million
and
$0.4 million
in asset retirement obligations for New Castle and Wallingford, respectively. Additionally, pension and other postretirement benefit termination charges of
$5.0 million
, and
$1.0 million
of employee termination costs were recognized in 2013 for approximately
65
employees affected by the Wallingford facility closure.
|
In addition to the above facility closures, restructuring costs in 2013 included
$8.0 million
of other non-cash long-lived asset impairment charges in the High Performance Materials & Components segment. Other severance charges in 2013 included
$1.1 million
in pension benefit termination charges in the High Performance Materials & Components segment, and
$1.1 million
in severance costs, collectively affecting approximately
75
employees.
Reserves for restructuring charges at December 31, 2013 were approximately
$2 million
for severance costs, which were paid in 2014.
The holders of the
15%
noncontrolling interest in ATI Flowform Products have a put option to require the Company to purchase their equity interest at a redemption value determinable from a specified formula based on a multiple of EBITDA (subject to a fixed minimum linked to the original acquisition date value). The put option is fully exercisable beginning in the second quarter of 2017, and is also exercisable under certain other circumstances. The put option cannot be separated from the noncontrolling interest, and the combination of a noncontrolling interest and the redemption feature requires classification as redeemable noncontrolling interest in the consolidated balance sheet, separate from Stockholders’ Equity.
The carrying amount of the redeemable noncontrolling interest approximates its maximum redemption value. Any subsequent change in maximum redemption value is adjusted through retained earnings. The adjustment to the carrying amount for the year ended
December 31, 2014
reduced retained earnings by
$0.3 million
. The Company applied the two-class method of calculating earnings per share, and as such this adjustment to the carrying amount was reflected in earnings per share. The redeemable noncontrolling interest was
$12.1 million
as of
December 31, 2014
, which was unchanged from the acquisition date value.
83
The following table sets forth the computation of basic and diluted income (loss) from continuing operations per common share:
(In millions, except per share amounts)
|
For the Years Ended December 31,
|
2014
|
2013
|
2012
|
|||||||||
|
Numerator:
|
||||||||||||
|
Numerator for basic income (loss) from continuing operations per common share -
|
||||||||||||
|
Income (loss) from continuing operations attributable to ATI
|
$
|
(2.0
|
)
|
$
|
(98.8
|
)
|
$
|
150.5
|
|
|||
|
Redeemable noncontrolling interest (Note 17)
|
(0.3
|
)
|
—
|
|
—
|
|
||||||
|
Effect of dilutive securities:
|
||||||||||||
|
4.25% Convertible Senior Notes due 2014
|
—
|
|
—
|
|
8.5
|
|
||||||
|
Numerator for diluted net income (loss) per common share -
|
||||||||||||
|
Income (loss) from continuing operations attributable to ATI after assumed conversions
|
$
|
(2.3
|
)
|
$
|
(98.8
|
)
|
$
|
159.0
|
|
|||
|
Denominator:
|
||||||||||||
|
Denominator for basic net income per common share—weighted average shares
|
107.1
|
|
106.8
|
|
106.1
|
|
||||||
|
Effect of dilutive securities:
|
||||||||||||
|
Share-based compensation
|
—
|
|
—
|
|
0.9
|
|
||||||
|
4.25% Convertible Senior Notes due 2014
|
—
|
|
—
|
|
9.6
|
|
||||||
|
Denominator for diluted net income per common share—adjusted weighted average shares and assumed conversions
|
107.1
|
|
106.8
|
|
116.6
|
|
||||||
|
Basic income (loss) from continuing operations attributable to ATI per common share
|
$
|
(0.02
|
)
|
$
|
(0.93
|
)
|
$
|
1.42
|
|
|||
|
Diluted income (loss) from continuing operations attributable to ATI per common share
|
$
|
(0.02
|
)
|
$
|
(0.93
|
)
|
$
|
1.36
|
|
|||
Common stock that would be issuable upon the assumed conversion of the 2014 Convertible Notes (prior to maturity on June 2, 2014) and other option equivalents and contingently issuable shares are excluded from the computation of contingently issuable shares, and therefore, from the denominator for diluted earnings per share, if the effect of inclusion would have been anti-dilutive. Excluded shares were
4.7 million
for 2014, and
10.0 million
for 2013. There were no anti-dilutive shares for 2012.
The payment obligations under the
$150.0 million
6.95%
Debentures due 2025 issued by Allegheny Ludlum, LLC (formerly known as Allegheny Ludlum Corporation) (the “Subsidiary”) are fully and unconditionally guaranteed by Allegheny Technologies Incorporated (the “Guarantor Parent”). In accordance with positions established by the U.S. Securities and Exchange Commission, the following financial information sets forth separately financial information with respect to the Subsidiary, the Non-guarantor Subsidiaries and the Guarantor Parent. The principal elimination entries eliminate investments in subsidiaries and certain intercompany balances and transactions.
Allegheny Technologies is the plan sponsor for the U.S. qualified defined benefit pension plan (the “Plan”) which covers certain current and former employees of the Subsidiary and the Non-guarantor Subsidiaries. As a result, the balance sheets presented for the Subsidiary and the Non-guarantor Subsidiaries do not include any Plan assets or liabilities, or the related deferred taxes. The Plan assets, liabilities and related deferred taxes and pension income or expense are recognized by the Guarantor Parent. Management and royalty fees charged to the Subsidiary and to the Non-guarantor Subsidiaries by the Guarantor Parent have been excluded solely for purposes of this presentation.
84
Allegheny Technologies Incorporated
Financial Information for Subsidiary and Guarantor Parent
Balance Sheets
December 31, 2014
|
(In millions)
|
Guarantor
Parent
|
Subsidiary
|
Non-guarantor
Subsidiaries
|
Eliminations
|
Consolidated
|
|||||||||||||||
|
Assets:
|
||||||||||||||||||||
|
Cash and cash equivalents
|
$
|
2.2
|
|
$
|
13.8
|
|
$
|
253.5
|
|
$
|
—
|
|
$
|
269.5
|
|
|||||
|
Accounts receivable, net
|
0.1
|
|
209.1
|
|
394.4
|
|
—
|
|
603.6
|
|
||||||||||
|
Intercompany notes receivable
|
—
|
|
—
|
|
2,390.8
|
|
(2,390.8
|
)
|
—
|
|
||||||||||
|
Inventories, net
|
—
|
|
387.7
|
|
1,085.1
|
|
—
|
|
1,472.8
|
|
||||||||||
|
Prepaid expenses and other current assets
|
63.7
|
|
13.2
|
|
59.3
|
|
—
|
|
136.2
|
|
||||||||||
|
Total current assets
|
66.0
|
|
623.8
|
|
4,183.1
|
|
(2,390.8
|
)
|
2,482.1
|
|
||||||||||
|
Property, plant and equipment, net
|
2.2
|
|
1,545.1
|
|
1,414.5
|
|
—
|
|
2,961.8
|
|
||||||||||
|
Cost in excess of net assets acquired
|
—
|
|
126.6
|
|
653.8
|
|
—
|
|
780.4
|
|
||||||||||
|
Intercompany notes receivable
|
—
|
|
—
|
|
200.0
|
|
(200.0
|
)
|
—
|
|
||||||||||
|
Investments in subsidiaries
|
6,149.4
|
|
37.7
|
|
—
|
|
(6,187.1
|
)
|
—
|
|
||||||||||
|
Other assets
|
23.7
|
|
28.0
|
|
306.6
|
|
—
|
|
358.3
|
|
||||||||||
|
Total assets
|
$
|
6,241.3
|
|
$
|
2,361.2
|
|
$
|
6,758.0
|
|
$
|
(8,777.9
|
)
|
$
|
6,582.6
|
|
|||||
|
Liabilities and stockholders’ equity:
|
||||||||||||||||||||
|
Accounts payable
|
$
|
4.5
|
|
$
|
302.0
|
|
$
|
250.2
|
|
$
|
—
|
|
$
|
556.7
|
|
|||||
|
Accrued liabilities
|
47.5
|
|
72.0
|
|
203.7
|
|
—
|
|
323.2
|
|
||||||||||
|
Intercompany notes payable
|
1,232.6
|
|
1,158.2
|
|
—
|
|
(2,390.8
|
)
|
—
|
|
||||||||||
|
Deferred income taxes
|
62.2
|
|
—
|
|
—
|
|
—
|
|
62.2
|
|
||||||||||
|
Short-term debt and current portion of long-term debt
|
0.5
|
|
0.1
|
|
17.2
|
|
—
|
|
17.8
|
|
||||||||||
|
Total current liabilities
|
1,347.3
|
|
1,532.3
|
|
471.1
|
|
(2,390.8
|
)
|
959.9
|
|
||||||||||
|
Long-term debt
|
1,350.6
|
|
150.3
|
|
8.2
|
|
—
|
|
1,509.1
|
|
||||||||||
|
Intercompany notes payable
|
—
|
|
200.0
|
|
—
|
|
(200.0
|
)
|
—
|
|
||||||||||
|
Accrued postretirement benefits
|
—
|
|
153.0
|
|
262.8
|
|
—
|
|
415.8
|
|
||||||||||
|
Pension liabilities
|
675.5
|
|
6.0
|
|
57.8
|
|
—
|
|
739.3
|
|
||||||||||
|
Deferred income taxes
|
80.9
|
|
—
|
|
—
|
|
—
|
|
80.9
|
|
||||||||||
|
Other long-term liabilities
|
77.7
|
|
22.5
|
|
56.0
|
|
—
|
|
156.2
|
|
||||||||||
|
Total liabilities
|
3,532.0
|
|
2,064.1
|
|
855.9
|
|
(2,590.8
|
)
|
3,861.2
|
|
||||||||||
|
Redeemable noncontrolling interest
|
—
|
|
—
|
|
12.1
|
|
—
|
|
12.1
|
|
||||||||||
|
Total stockholders’ equity
|
2,709.3
|
|
297.1
|
|
5,890.0
|
|
(6,187.1
|
)
|
2,709.3
|
|
||||||||||
|
Total liabilities and stockholders’ equity
|
$
|
6,241.3
|
|
$
|
2,361.2
|
|
$
|
6,758.0
|
|
$
|
(8,777.9
|
)
|
$
|
6,582.6
|
|
|||||
85
Allegheny Technologies Incorporated
Financial Information for Subsidiary and Guarantor Parent
Statements of Operations
For the year ended
December 31, 2014
|
(In millions)
|
Guarantor
Parent
|
Subsidiary
|
Non-guarantor
Subsidiaries
|
Eliminations
|
Consolidated
|
|||||||||||||||
|
Sales
|
$
|
—
|
|
$
|
1,878.0
|
|
$
|
2,345.4
|
|
$
|
—
|
|
$
|
4,223.4
|
|
|||||
|
Cost of sales
|
45.3
|
|
1,874.8
|
|
1,924.7
|
|
—
|
|
3,844.8
|
|
||||||||||
|
Selling and administrative expenses
|
103.9
|
|
44.0
|
|
124.6
|
|
—
|
|
272.5
|
|
||||||||||
|
Income (loss) before interest, other income and income taxes
|
(149.2
|
)
|
(40.8
|
)
|
296.1
|
|
—
|
|
106.1
|
|
||||||||||
|
Interest income (expense), net
|
(111.0
|
)
|
(44.9
|
)
|
47.2
|
|
—
|
|
(108.7
|
)
|
||||||||||
|
Other income (expense) including equity in income of unconsolidated subsidiaries
|
261.7
|
|
1.1
|
|
2.9
|
|
(261.6
|
)
|
4.1
|
|
||||||||||
|
Income (loss) from continuing operations before income taxes
|
1.5
|
|
(84.6
|
)
|
346.2
|
|
(261.6
|
)
|
1.5
|
|
||||||||||
|
Income tax provision (benefit)
|
(8.7
|
)
|
(29.3
|
)
|
116.7
|
|
(87.4
|
)
|
(8.7
|
)
|
||||||||||
|
Income (loss) from continuing operations
|
10.2
|
|
(55.3
|
)
|
229.5
|
|
(174.2
|
)
|
10.2
|
|
||||||||||
|
Income (loss) from discontinued operations, net of tax
|
(0.6
|
)
|
—
|
|
(0.6
|
)
|
0.6
|
|
(0.6
|
)
|
||||||||||
|
Net income (loss)
|
9.6
|
|
(55.3
|
)
|
228.9
|
|
(173.6
|
)
|
9.6
|
|
||||||||||
|
Less: Net income attributable to noncontrolling interest
|
—
|
|
—
|
|
12.2
|
|
—
|
|
12.2
|
|
||||||||||
|
Net income (loss) attributable to ATI
|
$
|
9.6
|
|
$
|
(55.3
|
)
|
$
|
216.7
|
|
$
|
(173.6
|
)
|
$
|
(2.6
|
)
|
|||||
Allegheny Technologies Incorporated
Financial Information for Subsidiary and Guarantor Parent
Statements of Comprehensive Income
For the year ended
December 31, 2014
|
(In millions)
|
Guarantor
Parent
|
Subsidiary
|
Non-guarantor
Subsidiaries
|
Eliminations
|
Consolidated
|
|||||||||||||||
|
Net income (loss)
|
$
|
9.6
|
|
$
|
(55.3
|
)
|
$
|
228.9
|
|
$
|
(173.6
|
)
|
$
|
9.6
|
|
|||||
|
Other comprehensive income (loss)
|
||||||||||||||||||||
|
Currency translation adjustment arising during the period
|
(33.6
|
)
|
—
|
|
(33.6
|
)
|
33.6
|
|
(33.6
|
)
|
||||||||||
|
Net derivative gain on hedge transactions
|
25.9
|
|
—
|
|
—
|
|
—
|
|
25.9
|
|
||||||||||
|
Pension and postretirement benefits
|
(212.6
|
)
|
1.8
|
|
(28.4
|
)
|
26.6
|
|
(212.6
|
)
|
||||||||||
|
Other comprehensive income (loss), net of tax
|
(220.3
|
)
|
1.8
|
|
(62.0
|
)
|
60.2
|
|
(220.3
|
)
|
||||||||||
|
Comprehensive income (loss)
|
(210.7
|
)
|
(53.5
|
)
|
166.9
|
|
(113.4
|
)
|
(210.7
|
)
|
||||||||||
|
Less: Comprehensive income attributable to noncontrolling interest
|
—
|
|
—
|
|
10.1
|
|
—
|
|
10.1
|
|
||||||||||
|
Comprehensive income (loss) attributable to ATI
|
$
|
(210.7
|
)
|
$
|
(53.5
|
)
|
$
|
156.8
|
|
$
|
(113.4
|
)
|
$
|
(220.8
|
)
|
|||||
86
Condensed Statements of Cash Flows
For the year ended
December 31, 2014
|
(In millions)
|
Guarantor
Parent
|
Subsidiary
|
Non-guarantor
Subsidiaries
|
Eliminations
|
Consolidated
|
|||||||||||||||
|
Cash flows provided by (used in) operating activities
|
$
|
(66.9
|
)
|
$
|
(313.8
|
)
|
$
|
436.6
|
|
$
|
—
|
|
$
|
55.9
|
|
|||||
|
Investing Activities:
|
||||||||||||||||||||
|
Purchases of property, plant and equipment
|
(0.1
|
)
|
(170.8
|
)
|
(54.8
|
)
|
—
|
|
(225.7
|
)
|
||||||||||
|
Net receipts (payments) on intercompany activity
|
—
|
|
—
|
|
(1,027.7
|
)
|
1,027.7
|
|
—
|
|
||||||||||
|
Purchases of businesses, net of cash acquired
|
—
|
|
—
|
|
(92.9
|
)
|
—
|
|
(92.9
|
)
|
||||||||||
|
Asset disposals and other
|
—
|
|
1.7
|
|
0.7
|
|
—
|
|
2.4
|
|
||||||||||
|
Cash flows provided by (used in) investing activities
|
(0.1
|
)
|
(169.1
|
)
|
(1,174.7
|
)
|
1,027.7
|
|
(316.2
|
)
|
||||||||||
|
Financing Activities:
|
||||||||||||||||||||
|
Payments on long-term debt and capital leases
|
(397.9
|
)
|
(0.1
|
)
|
(16.9
|
)
|
—
|
|
(414.9
|
)
|
||||||||||
|
Net receipts (payments) on intercompany activity
|
544.4
|
|
483.3
|
|
—
|
|
(1,027.7
|
)
|
—
|
|
||||||||||
|
Dividends paid to stockholders
|
(77.1
|
)
|
—
|
|
—
|
|
—
|
|
(77.1
|
)
|
||||||||||
|
Other
|
(3.8
|
)
|
—
|
|
(1.2
|
)
|
—
|
|
(5.0
|
)
|
||||||||||
|
Cash flows provided by (used in) financing activities
|
65.6
|
|
483.2
|
|
(18.1
|
)
|
(1,027.7
|
)
|
(497.0
|
)
|
||||||||||
|
Increase (decrease) in cash and cash equivalents
|
$
|
(1.4
|
)
|
$
|
0.3
|
|
$
|
(756.2
|
)
|
$
|
—
|
|
$
|
(757.3
|
)
|
|||||
87
Allegheny Technologies Incorporated
Financial Information for Subsidiary and Guarantor Parent
Balance Sheets
December 31, 2013
|
(In millions)
|
Guarantor
Parent
|
Subsidiary
|
Non-guarantor
Subsidiaries
|
Eliminations
|
Consolidated
|
|||||||||||||||
|
Assets:
|
||||||||||||||||||||
|
Cash and cash equivalents
|
$
|
3.6
|
|
$
|
13.5
|
|
$
|
1,009.7
|
|
$
|
—
|
|
$
|
1,026.8
|
|
|||||
|
Accounts receivable, net
|
0.3
|
|
179.4
|
|
348.5
|
|
—
|
|
528.2
|
|
||||||||||
|
Intercompany notes receivable
|
—
|
|
—
|
|
1,589.4
|
|
(1,589.4
|
)
|
—
|
|
||||||||||
|
Inventories, net
|
—
|
|
295.5
|
|
1,026.6
|
|
—
|
|
1,322.1
|
|
||||||||||
|
Prepaid expenses and other current assets
|
26.2
|
|
6.5
|
|
41.0
|
|
—
|
|
73.7
|
|
||||||||||
|
Total current assets
|
30.1
|
|
494.9
|
|
4,015.2
|
|
(1,589.4
|
)
|
2,950.8
|
|
||||||||||
|
Property, plant and equipment, net
|
2.9
|
|
1,397.5
|
|
1,473.7
|
|
—
|
|
2,874.1
|
|
||||||||||
|
Cost in excess of net assets acquired
|
—
|
|
112.1
|
|
615.8
|
|
—
|
|
727.9
|
|
||||||||||
|
Intercompany notes receivable
|
—
|
|
—
|
|
200.0
|
|
(200.0
|
)
|
—
|
|
||||||||||
|
Investments in subsidiaries
|
6,170.8
|
|
37.7
|
|
—
|
|
(6,208.5
|
)
|
—
|
|
||||||||||
|
Other assets
|
35.7
|
|
32.0
|
|
278.0
|
|
—
|
|
345.7
|
|
||||||||||
|
Total assets
|
$
|
6,239.5
|
|
$
|
2,074.2
|
|
$
|
6,582.7
|
|
$
|
(7,997.9
|
)
|
$
|
6,898.5
|
|
|||||
|
Liabilities and stockholders’ equity:
|
||||||||||||||||||||
|
Accounts payable
|
$
|
3.1
|
|
$
|
310.5
|
|
$
|
158.2
|
|
$
|
—
|
|
$
|
471.8
|
|
|||||
|
Accrued liabilities
|
51.6
|
|
56.6
|
|
207.6
|
|
—
|
|
315.8
|
|
||||||||||
|
Intercompany notes payable
|
825.6
|
|
763.8
|
|
—
|
|
(1,589.4
|
)
|
—
|
|
||||||||||
|
Deferred income taxes
|
3.5
|
|
—
|
|
—
|
|
—
|
|
3.5
|
|
||||||||||
|
Short-term debt and current portion of long-term debt
|
402.9
|
|
0.1
|
|
16.9
|
|
—
|
|
419.9
|
|
||||||||||
|
Total current liabilities
|
1,286.7
|
|
1,131.0
|
|
382.7
|
|
(1,589.4
|
)
|
1,211.0
|
|
||||||||||
|
Long-term debt
|
1,350.8
|
|
150.4
|
|
26.2
|
|
—
|
|
1,527.4
|
|
||||||||||
|
Intercompany notes payable
|
—
|
|
200.0
|
|
—
|
|
(200.0
|
)
|
—
|
|
||||||||||
|
Accrued postretirement benefits
|
—
|
|
179.7
|
|
262.7
|
|
—
|
|
442.4
|
|
||||||||||
|
Pension liabilities
|
323.0
|
|
5.6
|
|
39.6
|
|
—
|
|
368.2
|
|
||||||||||
|
Deferred income taxes
|
206.6
|
|
—
|
|
—
|
|
—
|
|
206.6
|
|
||||||||||
|
Other long-term liabilities
|
77.7
|
|
20.2
|
|
50.3
|
|
—
|
|
148.2
|
|
||||||||||
|
Total liabilities
|
3,244.8
|
|
1,686.9
|
|
761.5
|
|
(1,789.4
|
)
|
3,903.8
|
|
||||||||||
|
Total stockholders’ equity
|
2,994.7
|
|
387.3
|
|
5,821.2
|
|
(6,208.5
|
)
|
2,994.7
|
|
||||||||||
|
Total liabilities and stockholders’ equity
|
$
|
6,239.5
|
|
$
|
2,074.2
|
|
$
|
6,582.7
|
|
$
|
(7,997.9
|
)
|
$
|
6,898.5
|
|
|||||
88
Allegheny Technologies Incorporated
Financial Information for Subsidiary and Guarantor Parent
Statements of Operations
For the year ended
December 31, 2013
|
(In millions)
|
Guarantor
Parent
|
Subsidiary
|
Non-guarantor
Subsidiaries
|
Eliminations
|
Consolidated
|
|||||||||||||||
|
Sales
|
$
|
—
|
|
$
|
1,769.4
|
|
$
|
2,274.1
|
|
$
|
—
|
|
$
|
4,043.5
|
|
|||||
|
Cost of sales
|
75.2
|
|
1,748.8
|
|
1,966.9
|
|
—
|
|
3,790.9
|
|
||||||||||
|
Selling and administrative expenses
|
124.3
|
|
34.9
|
|
117.2
|
|
—
|
|
276.4
|
|
||||||||||
|
Restructuring costs
|
1.1
|
|
15.7
|
|
50.7
|
|
—
|
|
67.5
|
|
||||||||||
|
Income (loss) before interest, other income and income taxes
|
(200.6
|
)
|
(30.0
|
)
|
139.3
|
|
—
|
|
(91.3
|
)
|
||||||||||
|
Interest income (expense), net
|
(63.4
|
)
|
(37.2
|
)
|
35.4
|
|
—
|
|
(65.2
|
)
|
||||||||||
|
Other income (expense) including equity in income of unconsolidated subsidiaries
|
109.2
|
|
0.9
|
|
0.8
|
|
(109.2
|
)
|
1.7
|
|
||||||||||
|
Income (loss) from continuing operations before income taxes
|
(154.8
|
)
|
(66.3
|
)
|
175.5
|
|
(109.2
|
)
|
(154.8
|
)
|
||||||||||
|
Income tax provision (benefit)
|
(63.6
|
)
|
(20.0
|
)
|
40.4
|
|
(20.4
|
)
|
(63.6
|
)
|
||||||||||
|
Income (loss) from continuing operations
|
(91.2
|
)
|
(46.3
|
)
|
135.1
|
|
(88.8
|
)
|
(91.2
|
)
|
||||||||||
|
Income (loss) from discontinued operations, net of tax
|
252.8
|
|
—
|
|
252.8
|
|
(252.8
|
)
|
252.8
|
|
||||||||||
|
Net income (loss)
|
161.6
|
|
(46.3
|
)
|
387.9
|
|
(341.6
|
)
|
161.6
|
|
||||||||||
|
Less: Net income attributable to noncontrolling interest
|
—
|
|
—
|
|
7.6
|
|
—
|
|
7.6
|
|
||||||||||
|
Net income (loss) attributable to ATI
|
$
|
161.6
|
|
$
|
(46.3
|
)
|
$
|
380.3
|
|
$
|
(341.6
|
)
|
$
|
154.0
|
|
|||||
Allegheny Technologies Incorporated
Financial Information for Subsidiary and Guarantor Parent
Statements of Comprehensive Income
For the year ended
December 31, 2013
|
(In millions)
|
Guarantor
Parent
|
Subsidiary
|
Non-guarantor
Subsidiaries
|
Eliminations
|
Consolidated
|
|||||||||||||||
|
Net income (loss)
|
$
|
161.6
|
|
$
|
(46.3
|
)
|
$
|
387.9
|
|
$
|
(341.6
|
)
|
$
|
161.6
|
|
|||||
|
Other comprehensive income (loss)
|
||||||||||||||||||||
|
Currency translation adjustment arising during the period
|
15.3
|
|
—
|
|
15.3
|
|
(15.3
|
)
|
15.3
|
|
||||||||||
|
Unrealized holding gain (loss) on securities
|
0.1
|
|
—
|
|
0.1
|
|
(0.1
|
)
|
0.1
|
|
||||||||||
|
Net derivative loss on hedge transactions
|
(6.9
|
)
|
—
|
|
—
|
|
—
|
|
(6.9
|
)
|
||||||||||
|
Pension and postretirement benefits
|
311.1
|
|
22.0
|
|
27.6
|
|
(49.6
|
)
|
311.1
|
|
||||||||||
|
Other comprehensive income (loss), net of tax
|
319.6
|
|
22.0
|
|
43.0
|
|
(65.0
|
)
|
319.6
|
|
||||||||||
|
Comprehensive income (loss)
|
481.2
|
|
(24.3
|
)
|
430.9
|
|
(406.6
|
)
|
481.2
|
|
||||||||||
|
Less: Comprehensive income attributable to noncontrolling interest
|
—
|
|
—
|
|
11.0
|
|
—
|
|
11.0
|
|
||||||||||
|
Comprehensive income (loss) attributable to ATI
|
$
|
481.2
|
|
$
|
(24.3
|
)
|
$
|
419.9
|
|
$
|
(406.6
|
)
|
$
|
470.2
|
|
|||||
89
Condensed Statements of Cash Flows
For the year ended
December 31, 2013
|
(In millions)
|
Guarantor
Parent
|
Subsidiary
|
Non-guarantor
Subsidiaries
|
Eliminations
|
Consolidated
|
|||||||||||||||
|
Cash flows provided by (used in) operating activities
|
$
|
(41.1
|
)
|
$
|
(50.4
|
)
|
$
|
484.2
|
|
$
|
(24.3
|
)
|
$
|
368.4
|
|
|||||
|
Investing Activities:
|
||||||||||||||||||||
|
Purchases of property, plant and equipment
|
(0.2
|
)
|
(564.8
|
)
|
(47.7
|
)
|
—
|
|
(612.7
|
)
|
||||||||||
|
Net receipts (payments) on intercompany activity
|
—
|
|
—
|
|
(248.8
|
)
|
248.8
|
|
—
|
|
||||||||||
|
Proceeds from sale of business, net of transaction costs
|
(7.9
|
)
|
—
|
|
608.8
|
|
—
|
|
600.9
|
|
||||||||||
|
Asset disposals and other
|
—
|
|
0.2
|
|
0.6
|
|
—
|
|
0.8
|
|
||||||||||
|
Cash flows provided by (used in) investing activities
|
(8.1
|
)
|
(564.6
|
)
|
312.9
|
|
248.8
|
|
(11.0
|
)
|
||||||||||
|
Financing Activities:
|
||||||||||||||||||||
|
Borrowings on long-term debt
|
500.0
|
|
—
|
|
—
|
|
—
|
|
500.0
|
|
||||||||||
|
Net receipts (payments) on intercompany acivity
|
(366.7
|
)
|
615.5
|
|
—
|
|
(248.8
|
)
|
—
|
|
||||||||||
|
Dividends paid to stockholders
|
(76.9
|
)
|
—
|
|
(24.3
|
)
|
24.3
|
|
(76.9
|
)
|
||||||||||
|
Other
|
(9.1
|
)
|
(0.1
|
)
|
(49.1
|
)
|
—
|
|
(58.3
|
)
|
||||||||||
|
Cash flows provided by (used in) financing activities
|
47.3
|
|
615.4
|
|
(73.4
|
)
|
(224.5
|
)
|
364.8
|
|
||||||||||
|
Increase (decrease) in cash and cash equivalents
|
$
|
(1.9
|
)
|
$
|
0.4
|
|
$
|
723.7
|
|
$
|
—
|
|
$
|
722.2
|
|
|||||
Allegheny Technologies Incorporated
Financial Information for Subsidiary and Guarantor Parent
Statements of Operations
For the year ended
December 31, 2012
|
(In millions)
|
Guarantor
Parent
|
Subsidiary
|
Non-guarantor
Subsidiaries
|
Eliminations
|
Consolidated
|
|||||||||||||||
|
Sales
|
$
|
—
|
|
$
|
2,031.8
|
|
$
|
2,635.1
|
|
$
|
—
|
|
$
|
4,666.9
|
|
|||||
|
Cost of sales
|
57.0
|
|
1,888.2
|
|
2,096.2
|
|
—
|
|
4,041.4
|
|
||||||||||
|
Selling and administrative expenses
|
144.2
|
|
42.6
|
|
134.8
|
|
—
|
|
321.6
|
|
||||||||||
|
Income (loss) before interest, other income and income taxes
|
(201.2
|
)
|
101.0
|
|
404.1
|
|
—
|
|
303.9
|
|
||||||||||
|
Interest expense, net
|
(60.7
|
)
|
(10.5
|
)
|
(0.4
|
)
|
—
|
|
(71.6
|
)
|
||||||||||
|
Other income (expense) including equity in income of unconsolidated subsidiaries
|
494.2
|
|
(21.5
|
)
|
31.8
|
|
(504.5
|
)
|
—
|
|
||||||||||
|
Income (loss) from continuing operations, before income taxes
|
232.3
|
|
69.0
|
|
435.5
|
|
(504.5
|
)
|
232.3
|
|
||||||||||
|
Income tax provision (benefit)
|
72.4
|
|
27.5
|
|
168.7
|
|
(196.2
|
)
|
72.4
|
|
||||||||||
|
Income (loss) from continuing operations
|
159.9
|
|
41.5
|
|
266.8
|
|
(308.3
|
)
|
159.9
|
|
||||||||||
|
Income (loss) from discontinued operations, net of tax
|
7.9
|
|
—
|
|
7.9
|
|
(7.9
|
)
|
7.9
|
|
||||||||||
|
Net income (loss)
|
167.8
|
|
41.5
|
|
274.7
|
|
(316.2
|
)
|
167.8
|
|
||||||||||
|
Less: Net income (loss) attributable to noncontrolling interest
|
—
|
|
—
|
|
9.4
|
|
—
|
|
9.4
|
|
||||||||||
|
Net income (loss) attributable to ATI
|
$
|
167.8
|
|
$
|
41.5
|
|
$
|
265.3
|
|
$
|
(316.2
|
)
|
$
|
158.4
|
|
|||||
90
Allegheny Technologies Incorporated
Financial Information for Subsidiary and Guarantor Parent
Statements of Comprehensive Income
For the year ended
December 31, 2012
|
(In millions)
|
Guarantor
Parent
|
Subsidiary
|
Non-guarantor
Subsidiaries
|
Eliminations
|
Consolidated
|
|||||||||||||||
|
Net income (loss)
|
$
|
167.8
|
|
$
|
41.5
|
|
$
|
274.7
|
|
$
|
(316.2
|
)
|
$
|
167.8
|
|
|||||
|
Other comprehensive income (loss)
|
||||||||||||||||||||
|
Currency translation adjustment arising during the period
|
14.3
|
|
—
|
|
14.3
|
|
(14.3
|
)
|
14.3
|
|
||||||||||
|
Net derivative loss on hedge transactions
|
(2.8
|
)
|
—
|
|
—
|
|
—
|
|
(2.8
|
)
|
||||||||||
|
Pension and postretirement benefits
|
(97.4
|
)
|
(18.1
|
)
|
(5.1
|
)
|
23.2
|
|
(97.4
|
)
|
||||||||||
|
Other comprehensive income (loss), net of tax
|
(85.9
|
)
|
(18.1
|
)
|
9.2
|
|
8.9
|
|
(85.9
|
)
|
||||||||||
|
Comprehensive income (loss)
|
81.9
|
|
23.4
|
|
283.9
|
|
(307.3
|
)
|
81.9
|
|
||||||||||
|
Less: Comprehensive income attributable to noncontrolling interest
|
—
|
|
—
|
|
11.3
|
|
—
|
|
11.3
|
|
||||||||||
|
Comprehensive income (loss) attributable to ATI
|
$
|
81.9
|
|
$
|
23.4
|
|
$
|
272.6
|
|
$
|
(307.3
|
)
|
$
|
70.6
|
|
|||||
Condensed Statements of Cash Flows
For the year ended
December 31, 2012
|
(In millions)
|
Guarantor
Parent
|
Subsidiary
|
Non-guarantor
Subsidiaries
|
Eliminations
|
Consolidated
|
|||||||||||||||
|
Cash flows provided by (used in) operating activities
|
$
|
(52.3
|
)
|
$
|
43.9
|
|
$
|
435.9
|
|
$
|
—
|
|
$
|
427.5
|
|
|||||
|
Investing Activities:
|
||||||||||||||||||||
|
Purchases of property, plant and equipment
|
(1.7
|
)
|
(308.6
|
)
|
(71.7
|
)
|
—
|
|
(382.0
|
)
|
||||||||||
|
Net receipts (payments) on intercompany activity
|
—
|
|
—
|
|
(304.4
|
)
|
304.4
|
|
—
|
|
||||||||||
|
Asset disposals and other
|
—
|
|
0.3
|
|
3.0
|
|
—
|
|
3.3
|
|
||||||||||
|
Cash flows provided by (used in) investing activities
|
(1.7
|
)
|
(308.3
|
)
|
(373.1
|
)
|
304.4
|
|
(378.7
|
)
|
||||||||||
|
Financing Activities:
|
||||||||||||||||||||
|
Net receipts (payments) on intercompany activity
|
156.5
|
|
147.9
|
|
—
|
|
(304.4
|
)
|
—
|
|
||||||||||
|
Dividends paid to stockholders
|
(76.5
|
)
|
—
|
|
—
|
|
—
|
|
(76.5
|
)
|
||||||||||
|
Other
|
(21.2
|
)
|
(0.1
|
)
|
(27.0
|
)
|
—
|
|
(48.3
|
)
|
||||||||||
|
Cash flows provided by (used in) financing activities
|
58.8
|
|
147.8
|
|
(27.0
|
)
|
(304.4
|
)
|
(124.8
|
)
|
||||||||||
|
Increase (decrease) in cash and cash equivalents
|
$
|
4.8
|
|
$
|
(116.6
|
)
|
$
|
35.8
|
|
$
|
—
|
|
$
|
(76.0
|
)
|
|||||
Rental expense from continuing operations under operating leases was
$22.4 million
in
2014
,
$20.5 million
in
2013
, and
$22.5 million
in
2012
. Future minimum rental commitments under operating leases with non-cancelable terms of more than one year at
December 31, 2014
, were as follows:
$19.2 million
in
2015
,
$17.7 million
in
2016
,
$15.3 million
in
2017
,
$13.5 million
in
2018
,
$8.0 million
in
2019
and
$24.3 million
thereafter. Commitments for expenditures on property, plant and equipment at
December 31, 2014
were approximately
$118.0 million
.
The Company is subject to various domestic and international environmental laws and regulations that govern the discharge of pollutants and disposal of wastes, and which may require that it investigate and remediate the effects of the release or disposal of materials at sites associated with past and present operations. The Company could incur substantial cleanup costs, fines, and civil or criminal sanctions, third party property damage or personal injury claims as a result of violations or liabilities under these laws or noncompliance with environmental permits required at its facilities. The Company is currently involved in the investigation and remediation of a number of its current and former sites, as well as third party sites.
91
Environmental liabilities are recorded when the Company’s liability is probable and the costs are reasonably estimable. In many cases, however, the Company is not able to determine whether it is liable or, if liability is probable, to reasonably estimate the loss or range of loss. Estimates of the Company’s liability remain subject to additional uncertainties, including the nature and extent of site contamination, available remediation alternatives, the extent of corrective actions that may be required, and the number, participation, and financial condition of other PRPs. The Company adjusts its accruals to reflect new information as appropriate. Future adjustments could have a material adverse effect on the Company’s consolidated results of operations in a given period, but the Company cannot reliably predict the amounts of such future adjustments.
At
December 31, 2014
, the Company’s reserves for environmental remediation obligations totaled approximately
$17 million
, of which
$9 million
was included in other current liabilities. The reserve includes estimated probable future costs of
$5 million
for federal Superfund and comparable state-managed sites;
$10 million
for formerly owned or operated sites for which the Company has remediation or indemnification obligations;
$1 million
for owned or controlled sites at which Company operations have been discontinued; and
$1 million
for sites utilized by the Company in its ongoing operations. The Company continues to evaluate whether it may be able to recover a portion of future costs for environmental liabilities from third parties and to pursue such recoveries where appropriate.
Based on currently available information, it is reasonably possible that the costs for active matters may exceed the Company’s recorded reserves by as much as
$11 million
. However, future investigation or remediation activities may result in the discovery of additional hazardous materials, potentially higher levels of contamination than discovered during prior investigation, and may impact costs of the success or lack thereof in remedial solutions. Therefore, future developments, administrative actions or liabilities relating to environmental matters could have a material adverse effect on the Company’s consolidated financial condition or results of operations.
The timing of expenditures depends on a number of factors that vary by site. The Company expects that it will expend present accruals over many years and that remediation of all sites with which it has been identified will be completed within thirty years.
A number of other lawsuits, claims and proceedings have been or may be asserted against the Company relating to the conduct of its currently and formerly owned businesses, including those pertaining to product liability, patent infringement, commercial, government contracting, employment, employee and retiree benefits, taxes, environmental, health and safety, occupational disease, and stockholder and corporate governance matters. While the outcome of litigation cannot be predicted with certainty, and some of these lawsuits, claims or proceedings may be determined adversely to the Company, management does not believe that the disposition of any such pending matters is likely to have a material adverse effect on the Company’s consolidated financial condition or liquidity, although the resolution in any reporting period of one or more of these matters could have a material adverse effect on the Company’s consolidated results of operations for that period.
92
(Unaudited)
|
|
Quarter Ended
|
|||||||||||||||
|
(In millions, except share and per share amounts)
|
March 31
|
June 30
|
September 30
|
December 31
|
||||||||||||
|
2014 -
|
||||||||||||||||
|
Sales
|
$
|
987.3
|
|
$
|
1,119.0
|
|
$
|
1,069.6
|
|
$
|
1,047.5
|
|
||||
|
Gross Profit
|
70.2
|
|
89.5
|
|
97.0
|
|
121.9
|
|
||||||||
|
Income (loss) from continuing operations attributable to ATI
|
(18.1
|
)
|
(3.8
|
)
|
—
|
|
19.9
|
|
||||||||
|
Net income (loss)
|
(17.9
|
)
|
(0.7
|
)
|
2.9
|
|
25.3
|
|
||||||||
|
Net income (loss) attributable to ATI
|
(20.0
|
)
|
(4.0
|
)
|
(0.7
|
)
|
22.1
|
|
||||||||
|
Basic income (loss) from continuing operations attributable to ATI per common share
|
$
|
(0.17
|
)
|
$
|
(0.03
|
)
|
$
|
—
|
|
$
|
0.18
|
|
||||
|
Basic income (loss) attributable to ATI per common share
|
$
|
(0.19
|
)
|
$
|
(0.03
|
)
|
$
|
(0.01
|
)
|
$
|
0.20
|
|
||||
|
Diluted income (loss) from continuing operations attributable to ATI per common share
|
$
|
(0.17
|
)
|
$
|
(0.03
|
)
|
$
|
—
|
|
$
|
0.18
|
|
||||
|
Diluted income (loss) attributable to ATI per common share
|
$
|
(0.19
|
)
|
$
|
(0.03
|
)
|
$
|
(0.01
|
)
|
$
|
0.20
|
|
||||
|
Average shares outstanding
|
108,173,581
|
|
108,628,024
|
|
108,712,682
|
|
108,704,983
|
|
||||||||
|
2013 -
|
||||||||||||||||
|
Sales
|
$
|
1,099.0
|
|
$
|
1,056.8
|
|
$
|
972.4
|
|
$
|
915.3
|
|
||||
|
Gross Profit
|
100.5
|
|
87.7
|
|
53.1
|
|
11.3
|
|
||||||||
|
Income (loss) from continuing operations attributable to ATI
|
9.7
|
|
3.7
|
|
(28.4
|
)
|
(83.8
|
)
|
||||||||
|
Net income (loss)
|
11.6
|
|
6.6
|
|
(32.2
|
)
|
175.6
|
|
||||||||
|
Net income (loss) attributable to ATI
|
10.0
|
|
4.4
|
|
(33.8
|
)
|
173.4
|
|
||||||||
|
Basic income (loss) from continuing operations attributable to ATI per common share
|
$
|
0.09
|
|
$
|
0.04
|
|
$
|
(0.27
|
)
|
$
|
(0.79
|
)
|
||||
|
Basic income (loss) attributable to ATI per common share
|
$
|
0.09
|
|
$
|
0.04
|
|
$
|
(0.32
|
)
|
$
|
1.62
|
|
||||
|
Diluted income (loss) from continuing operations attributable to ATI per common share
|
$
|
0.09
|
|
$
|
0.04
|
|
$
|
(0.27
|
)
|
$
|
(0.79
|
)
|
||||
|
Diluted income (loss) attributable to ATI per common share
|
$
|
0.09
|
|
$
|
0.04
|
|
$
|
(0.32
|
)
|
$
|
1.62
|
|
||||
|
Average shares outstanding
|
107,614,468
|
|
107,980,753
|
|
108,001,306
|
|
107,984,535
|
|
||||||||
Fourth quarter 2014 results from continuing operations include postretirement benefit curtailment and settlement gains of
$25.5 million
pre-tax (
$18.4 million
, net of tax).
Fourth quarter 2013 results from continuing operations included restructuring costs of
$41.2 million
, net of tax, for non-cash long-lived asset impairment charges, facility closure costs and employee severance and termination benefits (see Note 16). Net income (loss) and net income (loss) attributable to ATI includes discontinued operations, which includes a
$261.4 million
after-tax gain in 2013 from the sale of the Company’s tungsten materials business. In addition, results from discontinued operations for the third and fourth quarters of 2013 also include
$5.8 million
and
$6.1 million
after-tax charges, respectively, for non-cash asset impairment charges and facility closure costs associated with the iron castings and fabricated components divestitures.
93
Not applicable.
Disclosure Controls and Procedures
Our Chief Executive Officer and Chief Financial Officer have evaluated the Company’s disclosure controls and procedures (as defined in Rule 13a-15(e) or Rule 15d-15(e) under the Securities Exchange Act of 1934, as amended) as of
December 31, 2014
, and they concluded that these controls and procedures are effective.
Changes in Internal Controls
There was no change in our internal controls over financial reporting identified in connection with the evaluation of the Company’s disclosure controls and procedures (as defined in Rule 13a-15(e) or Rule 15d-15(e) under the Securities Exchange Act of 1934, as amended) as of
December 31, 2014
conducted by our Chief Executive Officer and Chief Financial Officer, that occurred during the quarter ended
December 31, 2014
that has materially affected, or is reasonably likely to materially affect, our internal control over financial reporting.
Management’s Report on Internal Control Over Financial Reporting
Management is responsible for establishing and maintaining adequate internal control over financial reporting for the Company. Internal control over financial reporting is defined in Rules 13a-15(f) and 15d-15(f) promulgated under the Securities Exchange Act of 1934, as amended, as a process designed by, or under the supervision of, the company’s principal executive and principal financial officers and effected by the company’s board of directors, management and other personnel, to provide reasonable assurance regarding the reliability of financial reporting and the preparation of financial statements for external purposes in accordance with generally accepted accounting principles and includes those policies and procedures that:
Pertain to the maintenance of records that in reasonable detail accurately and fairly reflect the transactions and dispositions of the assets of the company;
Provide reasonable assurance that transactions are recorded as necessary to permit preparation of financial statements in accordance with generally accepted accounting principles, and that receipts and expenditures of the company are being made only in accordance with authorizations of management and directors of the company; and
Provide reasonable assurance regarding prevention or timely detection of unauthorized acquisition, use or disposition of the company’s assets that could have a material effect on the financial statements.
Because of its inherent limitations, internal control over financial reporting may not prevent or detect misstatements. Projections of any evaluation of effectiveness to future periods are subject to the risk that controls may become inadequate because of changes in conditions, or that the degree of compliance with the policies or procedures may deteriorate.
Internal control over financial reporting cannot provide absolute assurance of achieving financial reporting objectives because of its inherent limitations. Internal control over financial reporting is a process that involves human diligence and compliance and is subject to lapses in judgment and breakdowns resulting from human failures. Internal control over financial reporting can also be circumvented by collusion or improper management override. Because of such limitations, there is a risk that material misstatements may not be prevented or detected on a timely basis by internal control over financial reporting. However, these inherent limitations are known features of the financial reporting process. Therefore, it is possible to design into the process safeguards to reduce, though not eliminate, this risk.
The Company’s management assessed the effectiveness of the Company’s internal control over financial reporting as of
December 31, 2014
. In making this assessment, the Company’s management used the criteria set forth by the Committee of Sponsoring Organizations of the Treadway Commission (2013 framework) (COSO) in Internal Control-Integrated Framework.
Based on our assessment, management has concluded that, as of
December 31, 2014
, the Company’s internal control over financial reporting is effective based on those criteria.
The Company’s independent registered public accounting firm that audited the consolidated financial statements included in this Annual Report issued an attestation report on the Company’s internal control over financial reporting.
94
Management’s Certifications
The certifications of the Company’s Chief Executive Officer and Chief Financial Officer required by the Sarbanes-Oxley Act are included as Exhibits 31 and 32 to this Annual Report on Form 10-K. In addition, in
2014
the Company’s Chief Executive Officer provided to the New York Stock Exchange the annual CEO certification pursuant to Section 303A regarding the Company’s compliance with the New York Stock Exchange’s corporate governance listing standards.
Report of Independent Registered Public Accounting Firm
The Board of Directors and Stockholders of Allegheny Technologies Incorporated and Subsidiaries
We have audited Allegheny Technologies Incorporated and Subsidiaries’ internal control over financial reporting as of
December 31, 2014
, based on criteria established in Internal Control-Integrated Framework issued by the Committee of Sponsoring Organizations of the Treadway Commission (2013 framework) (the COSO criteria). Allegheny Technologies Incorporated and Subsidiaries’ management is responsible for maintaining effective internal control over financial reporting, and for its assessment of the effectiveness of internal control over financial reporting included in the accompanying Management’s Report on Internal Control Over Financial Reporting. Our responsibility is to express an opinion on the company’s internal control over financial reporting based on our audit.
We conducted our audit in accordance with the standards of the Public Company Accounting Oversight Board (United States). Those standards require that we plan and perform the audit to obtain reasonable assurance about whether effective internal control over financial reporting was maintained in all material respects. Our audit included obtaining an understanding of internal control over financial reporting, assessing the risk that a material weakness exists, testing and evaluating the design and operating effectiveness of internal control based on the assessed risk, and performing such other procedures as we considered necessary in the circumstances. We believe that our audit provides a reasonable basis for our opinion.
A company’s internal control over financial reporting is a process designed to provide reasonable assurance regarding the reliability of financial reporting and the preparation of financial statements for external purposes in accordance with generally accepted accounting principles. A company’s internal control over financial reporting includes those policies and procedures that (1) pertain to the maintenance of records that, in reasonable detail, accurately and fairly reflect the transactions and dispositions of the assets of the company; (2) provide reasonable assurance that transactions are recorded as necessary to permit preparation of financial statements in accordance with generally accepted accounting principles, and that receipts and expenditures of the company are being made only in accordance with authorizations of management and directors of the company; and (3) provide reasonable assurance regarding prevention or timely detection of unauthorized acquisition, use, or disposition of the company’s assets that could have a material effect on the financial statements.
Because of its inherent limitations, internal control over financial reporting may not prevent or detect misstatements. Also, projections of any evaluation of effectiveness to future periods are subject to the risk that controls may become inadequate because of changes in conditions, or that the degree of compliance with the policies or procedures may deteriorate.
In our opinion, Allegheny Technologies Incorporated and Subsidiaries maintained, in all material respects, effective internal control over financial reporting as of
December 31, 2014
, based on the COSO criteria.
We also have audited, in accordance with the standards of the Public Company Accounting Oversight Board (United States), the consolidated balance sheets of Allegheny Technologies Incorporated and Subsidiaries as of
December 31, 2014
and
2013
, and the related consolidated statements of operations, comprehensive income, cash flows, and changes in equity for each of the three years in the period ended
December 31, 2014
of Allegheny Technologies Incorporated and Subsidiaries and our report dated
February 26, 2015
expressed an unqualified opinion thereon.
/s/ Ernst & Young LLP
Pittsburgh, Pennsylvania
February 26, 2015
Not applicable.
95
In addition to the information set forth under the caption “Executive Management, including Executive Officers under the Federal Securities Laws” in Part I of this report, the information concerning our directors required by this item is incorporated and made part hereof by reference to the material appearing under the heading “Our Corporate Governance” and “Election of Directors” in the Allegheny Technologies Proxy Statement for the
2015
Annual Meeting of Stockholders (the “
2015
Proxy Statement”), which will be filed with the Securities and Exchange Commission, pursuant to Regulation 14A, not later than 120 days after the end of the fiscal year. Information concerning the Audit Committee and its financial expert required by this item is incorporated and made part hereof by reference to the material appearing under the heading “Committees of the Board of Directors – Audit Committee” in the
2015
Proxy Statement. Information required by this item regarding compliance with Section 16(a) of the Exchange Act is incorporated and made a part hereof by reference to the material appearing under the heading “Section 16(a) Beneficial Ownership Reporting Compliance” in the
2015
Proxy Statement. Information concerning the executive officers of Allegheny Technologies is contained in Part I of this Form 10-K under the caption “Executive Management, including Executive Officers under the Federal Securities Laws.”
Allegheny Technologies has adopted
Corporate Guidelines for Business Conduct and Ethics
that apply to all employees including its principal executive officer, principal financial officer, principal accounting officer or controller, or persons performing similar functions. The
Corporate Guidelines for Business Conduct and Ethics
as well as the charters for the Company’s Audit, Finance, Nominating and Governance, Personnel and Compensation, and Technology Committees, as well as periodic and current reports filed with the SEC, are available through the Company’s website at http://www.atimetals.com and are available in print free of charge to any shareholder upon request. To obtain a copy, contact the Corporate Secretary, Allegheny Technologies Incorporated, 1000 Six PPG Place, Pittsburgh, Pennsylvania 15222-5479 (telephone: 412-394-2800). The Company intends to post on its website any waiver from or amendment to the guidelines that apply to the Company’s Principal Executive Officer, Principal Financial Officer or Principal Accounting Officer or Controller (or persons performing similar functions) that relate to elements of the code of ethics identified by the Securities and Exchange Commission in Item 406(b) of Regulation S-K.
Information required by this item is incorporated by reference to “Director Compensation,” “Executive Compensation” and “Compensation Committee Interlocks and Insider Participation” as set forth in the
2015
Proxy Statement.
Information relating to the ownership of equity securities by certain beneficial owners and management is incorporated by reference to “Stock Ownership Information” as set forth in the
2015
Proxy Statement.
Equity Compensation Plan Information
Information about our equity compensation plans at
December 31, 2014
was as follows:
|
(a)
|
||||||||||
|
(In thousands, except per share amounts)
|
Number of
Shares to be
Issued Upon
Exercise of
Outstanding
Options
|
Weighted
Average
Exercise Price of
Outstanding
Options
|
Number of Shares
Remaining Available
for Future Issuance
Under Equity
Compensation Plans (1)
(excluding securities
reflected in column (a))
|
|||||||
|
Equity Compensation Plans Approved by Shareholders
|
9
|
|
$
|
61.78
|
|
1,620
|
|
|||
|
Equity Compensation Plans Not Approved by Shareholders
|
—
|
|
—
|
|
—
|
|
||||
|
Total
|
9
|
|
$
|
61.78
|
|
1,620
|
|
|||
|
(1)
|
Represents shares available for issuance under the 2007 Incentive Plan, which was amended and restated in 2010 and further amended in 2012 (which provides for the issuance of stock options and stock appreciation rights, restricted shares, performance and other stock-based awards). See Note 13. Stockholders’ Equity for a discussion of the Company’s stock-based compensation plans.
|
96
Information required by this item is incorporated by reference to “Certain Transactions” and “Number and Independence of Directors” as set forth in the
2015
Proxy Statement.
Information required by this item is incorporated by reference to “Ratification of Selection of Independent Auditors” including “Audit Committee Pre-Approval Policy” and “Independent Auditor: Services and Fees,” as set forth in the
2015
Proxy Statement.
(a) Financial Statements, Financial Statement Schedules and Exhibits:
(1) Financial Statements
The following consolidated financial statements and report are filed as part of this report under Item 8 – “Financial Statements and Supplementary Data”:
Report of Ernst & Young LLP, Independent Registered Public Accounting Firm
Consolidated Statements of Operations — Years Ended
December 31, 2014
,
2013
, and
2012
Consolidated Statements of Comprehensive Income — Years Ended
December 31, 2014
,
2013
, and
2012
Consolidated Balance Sheets at
December 31, 2014
and
2013
Consolidated Statements of Cash Flows — Years Ended
December 31, 2014
,
2013
, and
2012
Statements of Changes in Consolidated Equity — Years Ended
December 31, 2014
,
2013
, and
2012
Notes to Consolidated Financial Statements
(2) Financial Statement Schedules
All schedules set forth in the applicable accounting regulations of the Securities and Exchange Commission either are not required under the related instructions or are not applicable and, therefore, have been omitted.
(3) Exhibits
Exhibits required to be filed by Item 601 of Regulation S-K are listed below. Documents not designated as being incorporated herein by reference are filed herewith. The paragraph numbers correspond to the exhibit numbers designated in Item 601 of Regulation S-K.
EXHIBIT INDEX
|
Exhibit
No.
|
Description
|
|
|
2.1
|
Purchase Agreement, dated as of September 13, 2013, by and among TDY Industries, LLC, Kennametal Inc., Cuttech Limited and ATI Holdings SAS (incorporated by reference to Exhibit 2.1 to the Registrant’s Current Report on Form 8-K dated September 18, 2013 (File No. 1-12001)).
|
|
|
3.1
|
Certificate of Incorporation of Allegheny Technologies Incorporated, as amended (incorporated by reference to Exhibit 3.1 to the Registrant’s Annual Report on Form 10-K for the year ended December 31, 1999 (File No. 1-12001)).
|
|
|
3.2
|
Second Amended and Restated Bylaws of Allegheny Technologies Incorporated (incorporated by reference to Exhibit 3.1 to the Registrant’s Current Report on Form 8-K dated September 7, 2012 (File No. 1-12001)).
|
|
|
4.1
|
Indenture dated as of December 15, 1995 between Allegheny Ludlum Corporation and The Chase Manhattan Bank (National Association), as trustee, relating to Allegheny Ludlum Corporation’s 6.95% Debentures due 2025 (incorporated by reference to Exhibit 4(a) to Allegheny Ludlum Corporation’s Report on Form 10-K for the year ended December 31, 1995 (File No. 1-9498)), and First Supplemental Indenture by and among Allegheny Technologies Incorporated, Allegheny Ludlum Corporation and The Chase Manhattan Bank (National Association), as Trustee, dated as of August 15, 1996 (incorporated by reference to Exhibit 4.1 to Registrant’s Current Report on Form 8-K dated August 15, 1996 (File No. 1-12001)).
|
|
97
|
Exhibit
No.
|
Description
|
|
|
4.2
|
Supplemental Indenture, dated as of December 22, 2011, among Allegheny Ludlum Corporation, ALC Merger, LLC, and The Bank of New York Mellon (as successor to The Chase Manhattan Bank (National Association)), as Trustee (incorporated by reference to Exhibit 4.4 to the Registrant’s Annual Report on Form 10-K for the year ended December 31, 2011 (File No. 1-12001)).
|
|
|
4.3
|
Indenture, dated June 1, 2009, between Allegheny Technologies Incorporated and The Bank of New York Mellon, as Trustee (incorporated by reference to Exhibit 4.1 to the Registrant’s Current Report on Form 8-K dated June 3, 2009 (File No. 1-12001)).
|
|
|
4.4
|
First Supplemental Indenture, dated June 1, 2009, between Allegheny Technologies Incorporated and The Bank of New York Mellon, as Trustee, relating to Allegheny Technologies Incorporated’s 9.375% Senior Notes due 2019 (incorporated by reference to Exhibit 4.2 to the Registrant’s Current Report on Form 8-K dated June 3, 2009 (File No. 1-12001)).
|
|
|
4.5
|
Second Supplemental Indenture, dated June 2, 2009, between Allegheny Technologies Incorporated and The Bank of New York Mellon, as Trustee, relating to Allegheny Technologies Incorporated’s 4.25% Convertible Senior Notes due 2014 (incorporated by reference to Exhibit 4.3 to the Registrant’s Current Report on Form 8-K dated June 3, 2009 (File No. 1-12001)).
|
|
|
4.6
|
Form of 9.375% Senior Note due 2019 (incorporated by reference to Exhibit 4.4 to the Registrant’s Current Report on Form 8-K dated June 3, 2009 (File No. 1-12001)).
|
|
|
4.7
|
Third Supplemental Indenture, dated January 7, 2011, between Allegheny Technologies Incorporated and The Bank of New York Mellon, as Trustee, relating to Allegheny Technologies Incorporated’s 5.950% Senior Notes due 2021 (incorporated by reference to Exhibit 4.1 to the Registrant’s Current Report on Form 8-K dated January 7, 2011 (File No. 1-12001)).
|
|
|
4.8
|
Form of 5.950% Senior Note due 2021 (incorporated by reference to Exhibit 4.2 to the Registrant’s Current Report on Form 8-K dated January 7, 2011 (File No. 1-12001)).
|
|
|
4.9
|
Note Purchase Agreement, dated as of July 20, 2001, by and between Ladish Co., Inc. and the purchasers listed therein (incorporated by reference to Exhibit 10.(E) to the Annual Report on Form 10-K of Ladish Co., Inc. for the year ended December 31, 2001 (File No. 0-23539)).
|
|
|
4.10
|
First Amendment to Note Purchase Agreement, dated as of May 16, 2006, by and between Ladish Co., Inc. and the purchasers listed therein (incorporated by reference to Exhibit 10(b) to the Current Report on Form 8-K filed by Ladish Co., Inc. on May 18, 2006 (File No. 0-23539)).
|
|
|
4.11
|
Series B Terms Agreement to Note Purchase Agreement, dated as of May 16, 2006, by and between Ladish Co., Inc. and the purchasers listed therein (incorporated by reference to Exhibit 10(a) to the Current Report on Form 8-K filed by Ladish Co., Inc. on May 18, 2006 (File No. 0-23539)).
|
|
|
4.12
|
Second Amendment to Note Purchase Agreement, dated as of September 2, 2008, by and between Ladish Co., Inc. and the purchasers listed therein (incorporated by reference to Exhibit 99.C to the Current Report on Form 8-K filed by Ladish Co., Inc. on September 2, 2008 (File No. 0-23539)).
|
|
|
4.13
|
Series C Terms Agreement to Note Purchase Agreement, dated as of September 2, 2008, by and between Ladish Co., Inc. and the purchasers listed therein (incorporated by reference to Exhibit 99.B to the Current Report on Form 8-K filed by Ladish Co., Inc. on September 2, 2008 (File No. 0-23539)).
|
|
|
4.14
|
Third Amendment to Note Purchase Agreement, dated as of December 21, 2009, by and between Ladish Co., Inc. and the purchasers listed therein (incorporated by reference to Exhibit 10(Q) to the Annual Report on Form 10-K of Ladish Co., Inc. for the year ended December 31, 2009 (File No. 0-23539)).
|
|
|
4.15
|
Fourth Amendment to Note Purchase Agreement, dated as of March 16, 2012, by and between ATI Ladish LLC (as successor by merger to Ladish Co., Inc.) and the purchasers listed therein (incorporated by reference to Exhibit 4.1 to the Registrant’s Quarterly Report on Form 10-Q for the quarter ended March 31, 2012 (File No. 1-12001)).
|
|
|
4.16
|
Fourth Supplemental Indenture, dated July 12, 2013, between Allegheny Technologies Incorporated and The Bank of New York Mellon, as Trustee (incorporated by reference to Exhibit 4.1 to the Registrant’s Current Report on Form 8-K dated July 12, 2013 (File No. 1-12001)).
|
|
|
4.17
|
Form of 5.875% Senior Note due 2023 (incorporated by reference to Exhibit 4.2 to the Registrant’s Current Report on Form 8-K dated July 12, 2013 (File No. 1-12001)).
|
|
|
10.1
|
Allegheny Technologies Incorporated 1996 Incentive Plan (incorporated by reference to Exhibit 10.1 to the Registrant’s Annual Report on Form 10-K for the year ended December 31, 1997 (File No. 1-12001)).*
|
|
|
10.2
|
Allegheny Technologies Incorporated 1996 Non-Employee Director Stock Compensation Plan, as amended December 17, 1998 (incorporated by reference to Exhibit 10.4 to the Registrant’s Annual Report on Form 10-K for the year ended December 31, 1998 (File No. 1-12001)).*
|
|
|
10.3
|
Allegheny Technologies Incorporated Fee Continuation Plan for Non-Employee Directors, as amended (incorporated by reference to Exhibit 10.3 to the Registrant’s Annual Report on Form 10-K for the year ended December 31, 2004 (File No. 1-12001)).*
|
|
98
|
Exhibit
No.
|
Description
|
|
|
10.4
|
Supplemental Pension Plan for Certain Key Employees of Allegheny Technologies Incorporated and its subsidiaries (formerly known as the Allegheny Ludlum Corporation Key Man Salary Continuation Plan) (incorporated by reference to Exhibit 10.7 to the Company’s Annual Report on Form 10-K for the year ended December 31, 1997 (File No. 1-12001)).*
|
|
|
10.5
|
Allegheny Technologies Incorporated Benefit Restoration Plan, as amended (incorporated by reference to Exhibit 10.8 to the Registrant’s Annual Report on Form 10-K for the year ended December 31, 1999 (File No. 1-12001)).*
|
|
|
10.6
|
Allegheny Technologies Incorporated 2000 Incentive Plan, as amended (incorporated by reference to Exhibit 10.9 to the Registrant’s Annual Report on Form 10-K for the year ended December 31, 2005 (File No. 1-12001)).*
|
|
|
10.7
|
Amendment to the Allegheny Technologies Incorporated Pension Plan effective January 1, 2003 (incorporated by reference to Exhibit 10.20 to the Registrant’s Annual Report on Form 10-K for the year ended December 31, 2003 (File No. 1-12001)).*
|
|
|
10.8
|
Credit Agreement, dated July 31, 2007, by and among the Company, the guarantors party thereto, the lenders party thereto, PNC Bank, National Association, as Administrative Agent, and PNC Capital Markets LLC, as Lead Arranger (incorporated by reference to Exhibit 10.6 to the Registrant’s Quarterly Report on Form 10-Q for the quarter ended March 31, 2010 (File No. 1-12001)).
|
|
|
10.9
|
Form of Amended and Restated Change in Control Severance Agreement, dated as of December 31, 2008 (incorporated by reference to Exhibit 10.10 to the Registrant’s Annual Report on Form 10-K for the year ended December 31, 2008 (File No. 12001)).*
|
|
|
10.10
|
Administrative Rules for the Non-Employee Director Restricted Stock Program, effective as of May 2, 2007, as amended through May 7, 2010 (incorporated by reference to Exhibit 10.5 to the Registrant’s Quarterly Report on Form 10-Q for the quarter ended March 31, 2010 (File No. 1-12001)).*
|
|
|
10.11
|
First Amendment to Credit Agreement, dated May 29, 2009, by and among ATI Funding Corporation, TDY Holdings, LLC, the guarantors party thereto, the lenders party thereto and PNC Bank, National Association, as administrative agent for the lenders (incorporated by reference to Exhibit 10.7 to the Registrant’s Quarterly Report on Form 10-Q dated March 31, 2010 (File No. 1-12001)).
|
|
|
10.12
|
Allegheny Technologies Incorporated 2007 Incentive Plan As Amended and Restated, effective May 7, 2010 (incorporated by reference to Exhibit 99.1 to the Registrant’s Registration Statement on Form S-8 dated May 7, 2010 (File No 333-166628)).*
|
|
|
10.13
|
Second Amendment to Credit Agreement, dated December 22, 2010, by and among ATI Funding Corporation, TDY Holdings, LLC, the guarantors party thereto, the lenders party thereto and PNC Bank, National Association, as Administrative Agent for the lenders (incorporated by reference to Exhibit 10.1 to the Registrant’s Current Report on Form 8-K dated December 29, 2010 (File No. 1-12001)).
|
|
|
10.14
|
Third Amendment to Credit Agreement, dated March 11, 2011, by and among ATI Funding Corporation, TDY Holdings, LLC, the guarantors party thereto, the lenders party thereto and PNC Bank, National Association, as Administrative Agent for the lenders (incorporated by reference to Exhibit 10.5 to the Registrant’s Quarterly Report on Form 10-Q for the quarter ended March 31, 2011 (file No. 1-12001)).
|
|
|
10.15
|
Fourth Amendment to Credit Agreement, dated November 9, 2011, by and among ATI Funding Corporation, TDY Holdings, LLC, the guarantors party thereto, the lenders party thereto and PNC Bank, National Association, as Administrative Agent for the lenders (incorporated by reference to Exhibit 10.33 to the Registrant’s Annual Report on Form 10-K for the year ended December 31, 2011 (File No. 1-12001)).
|
|
|
10.16
|
Aircraft Time Sharing Agreement, effective as of January 1, 2012, by and between Allegheny Technologies Incorporated and Richard J. Harshman (incorporated by reference to Exhibit 10.34 to the Registrant’s Annual Report on Form 10-K for the year ended December 31, 2011 (File No. 1-12001)).
|
|
|
10.17
|
Fifth Amendment to Credit Agreement, dated April 4, 2012, by and among ATI Funding Corporation, TDY Holdings, LLC, the guarantors party thereto, the lenders party thereto and PNC Bank, National Association, as Administrative Agent for the lenders (incorporated by reference to Exhibit 10.1 to the Registrant’s Quarterly Report on Form 10-Q for the quarter ended March 31, 2012 (File No. 1-12001)).
|
|
|
10.18
|
Form of Performance/Restricted Stock Agreement dated February 22, 2012 (incorporated by reference to Exhibit 10.3 to the Registrant’s Quarterly Report on Form 10-Q for the quarter ended March 31, 2012 (File No. 1-12001)).*
|
|
|
10.19
|
Form of Total Shareholder Return Incentive Compensation Program Award Agreement effective as of January 1, 2012 (incorporated by reference to Exhibit 10.4 to the Registrant’s Quarterly Report on Form 10-Q for the quarter ended March 31, 2012 (File No. 1-12001)).*
|
|
|
10.20
|
Form of Key Executive Performance Plan Agreement dated February 22, 2012, including Key Executive Performance Plan as amended February 22, 2012 (incorporated by reference to Exhibit 10.5 to the Registrant’s Quarterly Report on Form 10-Q for the quarter ended March 31, 2012 (File No. 1-12001)). *
|
|
|
10.21
|
Form of Clawback Agreement regarding incentive payments under the Annual Incentive Plan dated March 15, 2012 (incorporated by reference to Exhibit 10.6 to the Registrant’s Quarterly Report on Form 10-Q for the quarter ended March 31, 2012 (File No. 1-12001)).*
|
|
99
|
Exhibit
No.
|
Description
|
|
|
10.22
|
Form of Clawback Agreement regarding incentive payments under the long-term incentive plans dated March 15, 2012 (incorporated by reference to Exhibit 10.7 to the Registrant’s Quarterly Report on Form 10-Q for the quarter ended March 31, 2012 (File No. 1-12001)).*
|
|
|
10.23
|
Amendment No. 1 to the Allegheny Technologies Incorporated 2007 Incentive Plan, as Amended and Restated, effective May 11, 2012 (incorporated by reference to Exhibit 99.2 to the Registrant’s Registration Statement on Form S-8 dated May 17, 2012 (File No. 333-181491)).*
|
|
|
10.24
|
Form of Performance/Restricted Stock Agreement dated February 28, 2013 (incorporated by reference to Exhibit 10.2 to the Registrant’s Quarterly Report on Form 10-Q for the quarter ended March 31, 2013 (File No. 1-12001)).*
|
|
|
10.25
|
Form of Total Shareholder Return Incentive Compensation Program Award Agreement effective as of January 1, 2013 (incorporated by reference to Exhibit 10.3 to the Registrant’s Quarterly Report on Form 10-Q for the quarter ended March 31, 2013 (File No. 1-12001)).*
|
|
|
10.26
|
Form of Key Executive Performance Plan Agreement dated February 28, 2013, including Key Executive Performance Plan as amended February 28, 2013 (incorporated by reference to Exhibit 10.4 to the Registrant’s Quarterly Report on Form 10-Q for the quarter ended March 31, 2013 (File No. 1-12001)).*
|
|
|
10.27
|
Sixth Amendment to Credit Agreement, dated May 31, 2013, by and among ATI Funding Corporation, TDY Holdings, LLC, the guarantors party thereto, the lenders party thereto and PNC Bank, National Association, as Administrative Agent for the lenders (incorporated by reference to Exhibit 10.1 to the Registrant’s Current Report on Form 8-K dated June 7, 2013 (File No. 1-12001)).
|
|
|
10.28
|
Amended and Restated Change in Control Severance Agreement between the Company and Richard J. Harshman, dated August 2, 2013 (incorporated by reference to Exhibit 10.2 to the Registrant’s Quarterly Report on Form 10-Q for the quarter ended June 30, 2013 (File No. 1-12001)).*
|
|
|
10.29
|
Seventh Amendment to Credit Agreement, dated September 26, 2013, by and among ATI Funding Corporation, TDY Holdings, LLC, the guarantors party thereto, the lenders party thereto and PNC Bank, National Association, as Administrative Agent for the lenders (incorporated by reference to Exhibit 10.1 to the Registrant’s Current Report on Form 8-K dated October 1, 2013 (File No. 1-12001)).
|
|
|
10.30
|
Retirement Agreement, dated as of September 18, 2013, by and between Allegheny Technologies Incorporated and Gary J. Vroman (incorporated by reference to Exhibit 10.2 to the Registrant’s Quarterly Report on Form 10-Q for the quarter ended September 30, 2013 (File No. 1-12001)).*
|
|
|
10.31
|
Form of Amended and Restated Change in Control Severance Agreement (incorporated by reference to Exhibit 10.3 to the Registrant’s Quarterly Report on Form 10-Q for the quarter ended September 30, 2013 (File No. 1-12001)).*
|
|
|
10.32
|
Form of 2014 Annual Incentive Plan (incorporated by reference to Exhibit 10.1 to the Registrant’s Quarterly Report on Form 10-Q for the quarter ended March 31, 2014 (File No. 1-12001)).*
|
|
|
10.33
|
Form of 2014 Performance/Restricted Stock Award Agreement (incorporated by reference to Exhibit 10.2 to the Registrant’s Quarterly Report on Form 10-Q for the quarter ended March 31, 2014 (File No. 1-12001)).*
|
|
|
10.34
|
Form of 2014 Total Shareholder Return Award Agreement (incorporated by reference to Exhibit 10.3 to the Registrant’s Quarterly Report on Form 10-Q for the quarter ended March 31, 2014 (File No. 1-12001)).*
|
|
|
10.35
|
Form of 2014 Long Term Shareholder Value Award Agreement (incorporated by reference to Exhibit 10.4 to the Registrant’s Quarterly Report on Form 10-Q for the quarter ended March 31, 2014 (File No. 1-12001)).*
|
|
|
10.36
|
Form of Amended and Restated Change in Control Severance Agreement (incorporated by reference to Exhibit 10.5 to the Registrant’s Quarterly Report on Form 10-Q for the quarter ended March 31, 2014 (File No. 1-12001)).*
|
|
|
10.37
|
Eighth Amendment to Credit Agreement, dated October 15, 2014, by and among ATI Funding Corporation, TDY Holdings, LLC, the guarantors party thereto, the lenders party thereto and PNC Bank, National Association, as Administrative Agent for the lenders (incorporated by reference to Exhibit 10.1 to the Registrant’s Current Report on Form 8-K dated October 17, 2014 (File No. 1-12001)).
|
|
|
10.38
|
Consulting Agreement between Allegheny Technologies Incorporated and Terry L. Dunlap, effective January 1, 2015 (incorporated by reference to Exhibit 10.2 to the Registrant’s Quarterly Report on Form 10-Q for the quarter ended September 30, 2014 (File No. 1-12001)).*
|
|
|
12.1
|
Computation of Ratio of Earnings to Fixed Charges (filed herewith).
|
|
|
21.1
|
Subsidiaries of the Registrant (filed herewith).
|
|
|
23.1
|
Consent of Ernst & Young LLP (filed herewith).
|
|
|
31.1
|
Certification of Chief Executive Officer required by Securities and Exchange Commission Rule 13a-14(a) or 15d-14(a) (filed herewith).
|
|
|
31.2
|
Certification of Principal Financial Officer required by Securities and Exchange Commission Rule 13a-14(a) or 15d-14(a) (filed herewith).
|
|
|
32.1
|
Certification pursuant to 18 U.S.C. Section 1350 (filed herewith).
|
|
100
|
Exhibit
No.
|
Description
|
|
|
101.INS
|
XBRL Instance Document
|
|
|
101.SCH
|
XBRL Taxonomy Extension Schema Document
|
|
|
101.CAL
|
XBRL Taxonomy Extension Calculation Linkbase Document
|
|
|
101.DEF
|
XBRL Taxonomy Extension Definition Linkbase Document
|
|
|
101.LAB
|
XBRL Taxonomy Extension Label Linkbase Document
|
|
|
101.PRE
|
XBRL Taxonomy Extension Presentation Linkbase Document
|
|
|
*
|
Management contract or compensatory plan or arrangement required to be filed as an Exhibit to this Report.
|
Certain instruments defining the rights of holders of long-term debt of the Company and its subsidiaries have been omitted from the Exhibits in accordance with Item 601(b)(4)(iii) of Regulation S-K. A copy of any omitted document will be furnished to the Commission upon request.
101
SIGNATURES
Pursuant to the requirements of Section 13 or 15(d) of the Securities Exchange Act of 1934, the Registrant has duly caused this Report to be signed on its behalf by the undersigned, thereunto duly authorized.
|
ALLEGHENY TECHNOLOGIES INCORPORATED
|
||||
|
Date:
|
February 26, 2015
|
By
|
|
/s/ Richard J. Harshman
|
|
|
Richard J. Harshman
|
|||
|
|
Chairman, President and Chief Executive Officer
|
|||
Pursuant to the requirements of the Securities Exchange Act of 1934, this report has been signed below by the following persons on behalf of the Registrant and in the capacities and as of the 26th day of February,
2015
.
|
/s/ Richard J. Harshman
|
|
/s/ Patrick J. DeCourcy
|
|
Richard J. Harshman
Chairman, President and Chief
Executive Officer and Director |
|
Patrick J. DeCourcy
Senior Vice President, Finance and Chief Financial Officer
(Principal Financial Officer)
|
|
|
||
|
|
/s/ Karl D. Schwartz
|
|
|
|
Karl D. Schwartz
Controller and
Chief Accounting Officer
(Principal Accounting Officer)
|
|
|
|
||
|
/s/ Carolyn Corvi
|
|
/s/ David J. Morehouse
|
|
Carolyn Corvi
Director
|
|
David J. Morehouse
Director
|
|
/s/ Diane C. Creel
|
|
/s/ John R. Pipski
|
|
Diane C. Creel
Director
|
|
John R. Pipski
Director
|
|
/s/ James C. Diggs
|
|
/s/ James E. Rohr
|
|
James C. Diggs
Director
|
|
James E. Rohr
Director
|
|
/s/ J. Brett Harvey
|
|
/s/ Louis J. Thomas
|
|
J. Brett Harvey
Director
|
|
Louis J. Thomas
Director
|
|
/s/ Barbara S. Jeremiah
|
|
/s/ John D. Turner
|
|
Barbara S. Jeremiah
Director
|
|
John D. Turner
Director
|
102
EXHIBIT INDEX
|
Exhibit
No.
|
|
Description
|
|
2.1
|
Purchase Agreement, dated as of September 13, 2013, by and among TDY Industries, LLC, Kennametal Inc., Cuttech Limited and ATI Holdings SAS (incorporated by reference to Exhibit 2.1 to the Registrant’s Current Report on Form 8-K dated September 18, 2013 (File No. 1-12001)).
|
|
|
3.1
|
Certificate of Incorporation of Allegheny Technologies Incorporated, as amended (incorporated by reference to Exhibit 3.1 to the Registrant’s Annual Report on Form 10-K for the year ended December 31, 1999 (File No. 1-12001)).
|
|
|
3.2
|
Second Amended and Restated Bylaws of Allegheny Technologies Incorporated (incorporated by reference to Exhibit 3.1 to the Registrant’s Current Report on Form 8-K dated September 7, 2012 (File No. 1-12001)).
|
|
|
4.1
|
Indenture dated as of December 15, 1995 between Allegheny Ludlum Corporation and The Chase Manhattan Bank (National Association), as trustee, relating to Allegheny Ludlum Corporation’s 6.95% Debentures due 2025 (incorporated by reference to Exhibit 4(a) to Allegheny Ludlum Corporation’s Report on Form 10-K for the year ended December 31, 1995 (File No. 1-9498)), and First Supplemental Indenture by and among Allegheny Technologies Incorporated, Allegheny Ludlum Corporation and The Chase Manhattan Bank (National Association), as Trustee, dated as of August 15, 1996 (incorporated by reference to Exhibit 4.1 to Registrant’s Current Report on Form 8-K dated August 15, 1996 (File No. 1-12001)).
|
|
|
4.2
|
Supplemental Indenture, dated as of December 22, 2011, among Allegheny Ludlum Corporation, ALC Merger, LLC, and The Bank of New York Mellon (as successor to The Chase Manhattan Bank (National Association)), as Trustee (incorporated by reference to Exhibit 4.4 to the Registrant’s Annual Report on Form 10-K for the year ended December 31, 2011 (File No. 1-12001)).
|
|
|
4.3
|
Indenture, dated June 1, 2009, between Allegheny Technologies Incorporated and The Bank of New York Mellon, as Trustee (incorporated by reference to Exhibit 4.1 to the Registrant’s Current Report on Form 8-K dated June 3, 2009 (File No. 1-12001)).
|
|
|
4.4
|
First Supplemental Indenture, dated June 1, 2009, between Allegheny Technologies Incorporated and The Bank of New York Mellon, as Trustee, relating to Allegheny Technologies Incorporated’s 9.375% Senior Notes due 2019 (incorporated by reference to Exhibit 4.2 to the Registrant’s Current Report on Form 8-K dated June 3, 2009 (File No. 1-12001)).
|
|
|
4.5
|
Second Supplemental Indenture, dated June 2, 2009, between Allegheny Technologies Incorporated and The Bank of New York Mellon, as Trustee, relating to Allegheny Technologies Incorporated’s 4.25% Convertible Senior Notes due 2014 (incorporated by reference to Exhibit 4.3 to the Registrant’s Current Report on Form 8-K dated June 3, 2009 (File No. 1-12001)).
|
|
|
4.6
|
Form of 9.375% Senior Note due 2019 (incorporated by reference to Exhibit 4.4 to the Registrant’s Current Report on Form 8-K dated June 3, 2009 (File No. 1-12001)).
|
|
|
4.7
|
Third Supplemental Indenture, dated January 7, 2011, between Allegheny Technologies Incorporated and The Bank of New York Mellon, as Trustee, relating to Allegheny Technologies Incorporated’s 5.950% Senior Notes due 2021 (incorporated by reference to Exhibit 4.1 to the Registrant’s Current Report on Form 8-K dated January 7, 2011 (File No. 1-12001)).
|
|
|
4.8
|
Form of 5.950% Senior Note due 2021 (incorporated by reference to Exhibit 4.2 to the Registrant’s Current Report on Form 8-K dated January 7, 2011 (File No. 1-12001)).
|
|
|
4.9
|
Note Purchase Agreement, dated as of July 20, 2001, by and between Ladish Co., Inc. and the purchasers listed therein (incorporated by reference to Exhibit 10.(E) to the Annual Report on Form 10-K of Ladish Co., Inc. for the year ended December 31, 2001 (File No. 0-23539)).
|
|
|
4.10
|
First Amendment to Note Purchase Agreement, dated as of May 16, 2006, by and between Ladish Co., Inc. and the purchasers listed therein (incorporated by reference to Exhibit 10(b) to the Current Report on Form 8-K filed by Ladish Co., Inc. on May 18, 2006 (File No. 0-23539)).
|
|
|
4.11
|
Series B Terms Agreement to Note Purchase Agreement, dated as of May 16, 2006, by and between Ladish Co., Inc. and the purchasers listed therein (incorporated by reference to Exhibit 10(a) to the Current Report on Form 8-K filed by Ladish Co., Inc. on May 18, 2006 (File No. 0-23539)).
|
|
|
4.12
|
Second Amendment to Note Purchase Agreement, dated as of September 2, 2008, by and between Ladish Co., Inc. and the purchasers listed therein (incorporated by reference to Exhibit 99.C to the Current Report on Form 8-K filed by Ladish Co., Inc. on September 2, 2008 (File No. 0-23539)).
|
|
|
4.13
|
Series C Terms Agreement to Note Purchase Agreement, dated as of September 2, 2008, by and between Ladish Co., Inc. and the purchasers listed therein (incorporated by reference to Exhibit 99.B to the Current Report on Form 8-K filed by Ladish Co., Inc. on September 2, 2008 (File No. 0-23539)).
|
|
|
4.14
|
Third Amendment to Note Purchase Agreement, dated as of December 21, 2009, by and between Ladish Co., Inc. and the purchasers listed therein (incorporated by reference to Exhibit 10(Q) to the Annual Report on Form 10-K of Ladish Co., Inc. for the year ended December 31, 2009 (File No. 0-23539)).
|
|
|
Exhibit
No.
|
|
Description
|
|
4.15
|
Fourth Amendment to Note Purchase Agreement, dated as of March 16, 2012, by and between ATI Ladish LLC (as successor by merger to Ladish Co., Inc.) and the purchasers listed therein (incorporated by reference to Exhibit 4.1 to the Registrant’s Quarterly Report on Form 10-Q for the quarter ended March 31, 2012 (File No. 1-12001)).
|
|
|
4.16
|
Fourth Supplemental Indenture, dated July 12, 2013, between Allegheny Technologies Incorporated and The Bank of New York Mellon, as Trustee (incorporated by reference to Exhibit 4.1 to the Registrant’s Current Report on Form 8-K dated July 12, 2013 (File No. 1-12001)).
|
|
|
4.17
|
Form of 5.875% Senior Note due 2023 (incorporated by reference to Exhibit 4.2 to the Registrant’s Current Report on Form 8-K dated July 12, 2013 (File No. 1-12001)).
|
|
|
10.1
|
Allegheny Technologies Incorporated 1996 Incentive Plan (incorporated by reference to Exhibit 10.1 to the Registrant’s Annual Report on Form 10-K for the year ended December 31, 1997 (File No. 1-12001)).*
|
|
|
10.2
|
Allegheny Technologies Incorporated 1996 Non-Employee Director Stock Compensation Plan, as amended December 17, 1998 (incorporated by reference to Exhibit 10.4 to the Registrant’s Annual Report on Form 10-K for the year ended December 31, 1998 (File No. 1-12001)).*
|
|
|
10.3
|
Allegheny Technologies Incorporated Fee Continuation Plan for Non-Employee Directors, as amended (incorporated by reference to Exhibit 10.3 to the Registrant’s Annual Report on Form 10-K for the year ended December 31, 2004 (File No. 1-12001)).*
|
|
|
10.4
|
Supplemental Pension Plan for Certain Key Employees of Allegheny Technologies Incorporated and its subsidiaries (formerly known as the Allegheny Ludlum Corporation Key Man Salary Continuation Plan) (incorporated by reference to Exhibit 10.7 to the Company’s Annual Report on Form 10-K for the year ended December 31, 1997 (File No. 1-12001)).*
|
|
|
10.5
|
Allegheny Technologies Incorporated Benefit Restoration Plan, as amended (incorporated by reference to Exhibit 10.8 to the Registrant’s Annual Report on Form 10-K for the year ended December 31, 1999 (File No. 1-12001)).*
|
|
|
10.6
|
Allegheny Technologies Incorporated 2000 Incentive Plan, as amended (incorporated by reference to Exhibit 10.9 to the Registrant’s Annual Report on Form 10-K for the year ended December 31, 2005 (File No. 1-12001)).*
|
|
|
10.7
|
Amendment to the Allegheny Technologies Incorporated Pension Plan effective January 1, 2003 (incorporated by reference to Exhibit 10.20 to the Registrant’s Annual Report on Form 10-K for the year ended December 31, 2003 (File No. 1-12001)).*
|
|
|
10.8
|
Credit Agreement, dated July 31, 2007, by and among the Company, the guarantors party thereto, the lenders party thereto, PNC Bank, National Association, as Administrative Agent, and PNC Capital Markets LLC, as Lead Arranger (incorporated by reference to Exhibit 10.6 to the Registrant’s Quarterly Report on Form 10-Q for the quarter ended March 31, 2010 (File No. 1-12001)).
|
|
|
10.9
|
Form of Amended and Restated Change in Control Severance Agreement, dated as of December 31, 2008 (incorporated by reference to Exhibit 10.10 to the Registrant’s Annual Report on Form 10-K for the year ended December 31, 2008 (File No. 12001)).*
|
|
|
10.10
|
Administrative Rules for the Non-Employee Director Restricted Stock Program, effective as of May 2, 2007, as amended through May 7, 2010 (incorporated by reference to Exhibit 10.5 to the Registrant’s Quarterly Report on Form 10-Q for the quarter ended March 31, 2010 (File No. 1-12001)).*
|
|
|
10.11
|
First Amendment to Credit Agreement, dated May 29, 2009, by and among ATI Funding Corporation, TDY Holdings, LLC, the guarantors party thereto, the lenders party thereto and PNC Bank, National Association, as administrative agent for the lenders (incorporated by reference to Exhibit 10.7 to the Registrant’s Quarterly Report on Form 10-Q dated March 31, 2010 (File No. 1-12001)).
|
|
|
10.12
|
Allegheny Technologies Incorporated 2007 Incentive Plan As Amended and Restated, effective May 7, 2010 (incorporated by reference to Exhibit 99.1 to the Registrant’s Registration Statement on Form S-8 dated May 7, 2010 (File No 333-166628)).*
|
|
|
10.13
|
Second Amendment to Credit Agreement, dated December 22, 2010, by and among ATI Funding Corporation, TDY Holdings, LLC, the guarantors party thereto, the lenders party thereto and PNC Bank, National Association, as Administrative Agent for the lenders (incorporated by reference to Exhibit 10.1 to the Registrant’s Current Report on Form 8-K dated December 29, 2010 (File No. 1-12001)).
|
|
|
10.14
|
Third Amendment to Credit Agreement, dated March 11, 2011, by and among ATI Funding Corporation, TDY Holdings, LLC, the guarantors party thereto, the lenders party thereto and PNC Bank, National Association, as Administrative Agent for the lenders (incorporated by reference to Exhibit 10.5 to the Registrant’s Quarterly Report on Form 10-Q for the quarter ended March 31, 2011 (file No. 1-12001)).
|
|
|
10.15
|
Fourth Amendment to Credit Agreement, dated November 9, 2011, by and among ATI Funding Corporation, TDY Holdings, LLC, the guarantors party thereto, the lenders party thereto and PNC Bank, National Association, as Administrative Agent for the lenders (incorporated by reference to Exhibit 10.33 to the Registrant’s Annual Report on Form 10-K for the year ended December 31, 2011 (File No. 1-12001)).
|
|
|
Exhibit
No.
|
|
Description
|
|
10.16
|
Aircraft Time Sharing Agreement, effective as of January 1, 2012, by and between Allegheny Technologies Incorporated and Richard J. Harshman (incorporated by reference to Exhibit 10.34 to the Registrant’s Annual Report on Form 10-K for the year ended December 31, 2011 (File No. 1-12001)).
|
|
|
10.17
|
Fifth Amendment to Credit Agreement, dated April 4, 2012, by and among ATI Funding Corporation, TDY Holdings, LLC, the guarantors party thereto, the lenders party thereto and PNC Bank, National Association, as Administrative Agent for the lenders (incorporated by reference to Exhibit 10.1 to the Registrant’s Quarterly Report on Form 10-Q for the quarter ended March 31, 2012 (File No. 1-12001)).
|
|
|
10.18
|
Form of Performance/Restricted Stock Agreement dated February 22, 2012 (incorporated by reference to Exhibit 10.3 to the Registrant’s Quarterly Report on Form 10-Q for the quarter ended March 31, 2012 (File No. 1-12001)).*
|
|
|
10.19
|
Form of Total Shareholder Return Incentive Compensation Program Award Agreement effective as of January 1, 2012 (incorporated by reference to Exhibit 10.4 to the Registrant’s Quarterly Report on Form 10-Q for the quarter ended March 31, 2012 (File No. 1-12001)).*
|
|
|
10.20
|
Form of Key Executive Performance Plan Agreement dated February 22, 2012, including Key Executive Performance Plan as amended February 22, 2012 (incorporated by reference to Exhibit 10.5 to the Registrant’s Quarterly Report on Form 10-Q for the quarter ended March 31, 2012 (File No. 1-12001)). *
|
|
|
10.21
|
Form of Clawback Agreement regarding incentive payments under the Annual Incentive Plan dated March 15, 2012 (incorporated by reference to Exhibit 10.6 to the Registrant’s Quarterly Report on Form 10-Q for the quarter ended March 31, 2012 (File No. 1-12001)).*
|
|
|
10.22
|
Form of Clawback Agreement regarding incentive payments under the long-term incentive plans dated March 15, 2012 (incorporated by reference to Exhibit 10.7 to the Registrant’s Quarterly Report on Form 10-Q for the quarter ended March 31, 2012 (File No. 1-12001)).*
|
|
|
10.23
|
Amendment No. 1 to the Allegheny Technologies Incorporated 2007 Incentive Plan, as Amended and Restated, effective May 11, 2012 (incorporated by reference to Exhibit 99.2 to the Registrant’s Registration Statement on Form S-8 dated May 17, 2012 (File No. 333-181491)).*
|
|
|
10.24
|
Form of Performance/Restricted Stock Agreement dated February 28, 2013 (incorporated by reference to Exhibit 10.2 to the Registrant’s Quarterly Report on Form 10-Q for the quarter ended March 31, 2013 (File No. 1-12001)).*
|
|
|
10.25
|
Form of Total Shareholder Return Incentive Compensation Program Award Agreement effective as of January 1, 2013 (incorporated by reference to Exhibit 10.3 to the Registrant’s Quarterly Report on Form 10-Q for the quarter ended March 31, 2013 (File No. 1-12001)).*
|
|
|
10.26
|
Form of Key Executive Performance Plan Agreement dated February 28, 2013, including Key Executive Performance Plan as amended February 28, 2013 (incorporated by reference to Exhibit 10.4 to the Registrant’s Quarterly Report on Form 10-Q for the quarter ended March 31, 2013 (File No. 1-12001)).*
|
|
|
10.27
|
Sixth Amendment to Credit Agreement, dated May 31, 2013, by and among ATI Funding Corporation, TDY Holdings, LLC, the guarantors party thereto, the lenders party thereto and PNC Bank, National Association, as Administrative Agent for the lenders (incorporated by reference to Exhibit 10.1 to the Registrant’s Current Report on Form 8-K dated June 7, 2013 (File No. 1-12001)).
|
|
|
10.28
|
Amended and Restated Change in Control Severance Agreement between the Company and Richard J. Harshman, dated August 2, 2013 (incorporated by reference to Exhibit 10.2 to the Registrant’s Quarterly Report on Form 10-Q for the quarter ended June 30, 2013 (File No. 1-12001)).*
|
|
|
10.29
|
Seventh Amendment to Credit Agreement, dated September 26, 2013, by and among ATI Funding Corporation, TDY Holdings, LLC, the guarantors party thereto, the lenders party thereto and PNC Bank, National Association, as Administrative Agent for the lenders (incorporated by reference to Exhibit 10.1 to the Registrant’s Current Report on Form 8-K dated October 1, 2013 (File No. 1-12001)).
|
|
|
10.30
|
Retirement Agreement, dated as of September 18, 2013, by and between Allegheny Technologies Incorporated and Gary J. Vroman (incorporated by reference to Exhibit 10.2 to the Registrant’s Quarterly Report on Form 10-Q for the quarter ended September 30, 2013 (File No. 1-12001)).*
|
|
|
10.31
|
Form of Amended and Restated Change in Control Severance Agreement (incorporated by reference to Exhibit 10.3 to the Registrant’s Quarterly Report on Form 10-Q for the quarter ended September 30, 2013 (File No. 1-12001)).*
|
|
|
10.32
|
Form of 2014 Annual Incentive Plan (incorporated by reference to Exhibit 10.1 to the Registrant’s Quarterly Report on Form 10-Q for the quarter ended March 31, 2014 (File No. 1-12001)).*
|
|
|
10.33
|
Form of 2014 Performance/Restricted Stock Award Agreement (incorporated by reference to Exhibit 10.2 to the Registrant’s Quarterly Report on Form 10-Q for the quarter ended March 31, 2014 (File No. 1-12001)).*
|
|
|
10.34
|
Form of 2014 Total Shareholder Return Award Agreement (incorporated by reference to Exhibit 10.3 to the Registrant’s Quarterly Report on Form 10-Q for the quarter ended March 31, 2014 (File No. 1-12001)).*
|
|
|
10.35
|
Form of 2014 Long Term Shareholder Value Award Agreement (incorporated by reference to Exhibit 10.4 to the Registrant’s Quarterly Report on Form 10-Q for the quarter ended March 31, 2014 (File No. 1-12001)).*
|
|
|
Exhibit
No.
|
|
Description
|
|
10.36
|
Form of Amended and Restated Change in Control Severance Agreement (incorporated by reference to Exhibit 10.5 to the Registrant’s Quarterly Report on Form 10-Q for the quarter ended March 31, 2014 (File No. 1-12001)).*
|
|
|
10.37
|
Eighth Amendment to Credit Agreement, dated October 15, 2014, by and among ATI Funding Corporation, TDY Holdings, LLC, the guarantors party thereto, the lenders party thereto and PNC Bank, National Association, as Administrative Agent for the lenders (incorporated by reference to Exhibit 10.1 to the Registrant’s Current Report on Form 8-K dated October 17, 2014 (File No. 1-12001)).
|
|
|
10.38
|
Consulting Agreement between Allegheny Technologies Incorporated and Terry L. Dunlap, effective January 1, 2015 (incorporated by reference to Exhibit 10.2 to the Registrant’s Quarterly Report on Form 10-Q for the quarter ended September 30, 2014 (File No. 1-12001)).*
|
|
|
12.1
|
Computation of Ratio of Earnings to Fixed Charges (filed herewith).
|
|
|
21.1
|
Subsidiaries of the Registrant (filed herewith).
|
|
|
23.1
|
Consent of Ernst & Young LLP (filed herewith).
|
|
|
31.1
|
Certification of Chief Executive Officer required by Securities and Exchange Commission Rule 13a-14(a) or 15d-14(a) (filed herewith).
|
|
|
31.2
|
Certification of Principal Financial Officer required by Securities and Exchange Commission Rule 13a-14(a) or 15d-14(a) (filed herewith).
|
|
|
32.1
|
Certification pursuant to 18 U.S.C. Section 1350 (filed herewith).
|
|
|
101.INS
|
XBRL Instance Document
|
|
|
101.SCH
|
XBRL Taxonomy Extension Schema Document
|
|
|
101.CAL
|
XBRL Taxonomy Extension Calculation Linkbase Document
|
|
|
101.DEF
|
XBRL Taxonomy Extension Definition Linkbase Document
|
|
|
101.LAB
|
XBRL Taxonomy Extension Label Linkbase Document
|
|
|
101.PRE
|
XBRL Taxonomy Extension Presentation Linkbase Document
|
|
|
*
|
Management contract or compensatory plan or arrangement required to be filed as an Exhibit to this Report.
|
Certain instruments defining the rights of holders of long-term debt of the Company and its subsidiaries have been omitted from the Exhibits in accordance with Item 601(b)(4)(iii) of Regulation S-K. A copy of any omitted document will be furnished to the Commission upon request.
TABLE OF CONTENTS
Part IItem 1. BusinessItem 1A. Risk FactorsItem 1B. Unresolved Staff CommentsItem 2. PropertiesItem 3. Legal ProceedingsItem 4. Mine Safety DisclosuresPart IIItem 5. Market For The Registrant S Common Equity, Related Stockholder Matters and Issuer Purchases Of Equity SecuritiesItem 6. Selected Financial DataItem 7. Management S Discussion and Analysis Of Financial Condition and Results Of OperationsItem 7A. Quantitative and Qualitative Disclosures About Market RiskItem 8. Financial Statements and Supplementary DataNote 1. Summary Of Significant Accounting PoliciesNote 2. AcquisitionsNote 3. Discontinued OperationsNote 4. InventoriesNote 5. Property, Plant and EquipmentNote 6. Asset Retirement ObligationsNote 7. Supplemental Financial Statement InformationNote 8. DebtNote 9. Derivative Financial Instruments and HedgingNote 10. Fair Value Of Financial InstrumentsNote 11. Pension Plans and Other Postretirement BenefitsNote 12. Accumulated Other Comprehensive Income (loss)Note 13. Stockholders EquityNote 14. Income TaxesNote 15. Business SegmentsNote 16. Restructuring CostsNote 17. Redeemable Noncontrolling InterestNote 18. Per Share InformationNote 19. Financial Information For Subsidiary and Guarantor ParentNote 20. Commitments and ContingenciesNote 21. Selected Quarterly Financial DataItem 9. Changes in and Disagreements with Accountants on Accounting and Financial DisclosureItem 9A. Controls and ProceduresItem 9B. Other InformationPart IIIItem 10. Directors and Executive Officers Of The RegistrantItem 11. Executive CompensationItem 12. Security Ownership Of Certain Beneficial Owners and Management and Related Stockholder MattersItem 13. Certain Relationships and Related Transactions, and Director IndependenceItem 14. Principal Accountant Fees and ServicesPart IVItem 15. Exhibits, Financial Statements and Financial Statement Schedules