ATLAS LITHIUM CORP
10-Ks and 10-Qs
|
|
|
|
|
|
|
|
|
|
|
U.S. SECURITIES AND EXCHANGE COMMISSION
Washington, D.C. 20549
FORM 10-K
(Mark One)
|
☑
|
ANNUAL REPORT PURSUANT TO SECTION 13 OR 15(d) OF THE SECURITIES EXCHANGE ACT OF 1934
|
For the Fiscal Year Ended December 31, 2017
|
☐
|
TRANSITION REPORT PURSUANT TO SECTION 13 OR 15(d) OF THE SECURITIES EXCHANGE ACT OF 1934
|
Commission File Number 000-55191
Brazil Minerals, Inc.
(Exact name of registrant as specified in its charter)
|
Nevada
|
|
39-2078861
|
|
(State or other jurisdiction of
|
|
(IRS Employer
|
|
incorporation or organization)
|
|
Identification No.)
|
Rua Vereador João Alves Praes, nº 95-A
Olhos D'Água, MG 39398-000, Brazil
(Address of principal executive offices)
Issuer's telephone number, including area code:
(213) 590-2500
Securities registered pursuant to Section 12(b) of the Act: None.
Securities registered pursuant to Section 12(g) of the Act: Common Stock, par value $0.001 per share
Indicate by check mark if the registrant is a well-known seasoned issuer, as defined in Rule 405 of the Securities Act. Yes
☐
No
☑
Indicate by check mark if the registrant is not required to file reports pursuant to Section 13 or Section 15(d) of the Act. Yes
☐
No
☑
Indicate by check mark whether the registrant (1) has filed all reports required to be filed by Section 13 or 15(d) of the Securities Exchange Act of 1934 during the preceding 12 months (or for such shorter period that the registrant was required to file such reports), and (2) has been subject to such filing requirements for the past 90 days. Yes
☑
No
¨
Indicate by check mark whether the registrant has submitted electronically and posted on its corporate Web site, if any, every Interactive Data File required to be submitted and posted pursuant to Rule 405 of Regulation S-T (§232.405 of this chapter) during the preceding 12 months (or for such shorter period that the registrant was required to submit and post such files).
Yes
☑
No
☐
Indicate by check mark if disclosure of delinquent filers pursuant to Item 405 of Regulation S-K is not contained herein, and will not be contained, to the best of registrant's knowledge, in definitive proxy or information statements incorporated by reference in Part III of this Form 10-K or any amendment to this Form 10-K
☑
Indicate by check mark whether the registrant is a large accelerated filer, an accelerated filer, a non-accelerated filer, a smaller reporting company or, an emerging growth company. See the definitions of "large accelerated filer," "accelerated filer", "smaller reporting company", and "emerging growth company", in Rule 12b-2 of the Exchange Act.
|
Large accelerated filer
☐
|
|
Accelerated filer
☐
|
|
Non-accelerated filer
☐
|
|
Smaller reporting company ☑
|
|
(Do not check if smaller reporting company)
|
Emerging growth company ☐
|
If an emerging growth company, indicate by check mark if the registrant has elected not to use the extended transition period for complying with any new or revised financial accounting standards provided pursuant to Section 13(a) of the Exchange Act.
☐
Indicate by check mark whether the registrant is a shell company (as defined in Rule 12b-2 of the Act)
.
Yes
☐
No
☑
As of June 30, 2017, the last business day of the Registrant's most recently completed second fiscal quarter, the aggregate market value of the Registrant's common stock held by non-affiliates (based on the closing sales price of such shares on such date as reported by Nasdaq.com) was approximately $857,603. For the purpose of this report it has been assumed that all officers and directors of the Registrant, as well as all stockholders holding 10% or more of the Registrant's stock, are affiliates of the Registrant.
As of April 8, 2018, there were outstanding 170,228,912 shares of the registrant's common stock.
Documents incorporated by reference: None.
TABLE OF CONTENTS
|
PART I
|
||||
|
Item 1.
|
Description of Business
|
2
|
||
|
Item 1A.
|
Risk Factors
|
5
|
||
|
Item 1B.
|
Unresolved Staff Comments
|
7
|
||
|
Item 2.
|
Properties
|
7
|
||
|
Item 3.
|
Legal Proceedings
|
13
|
||
|
Item 4.
|
Mine Safety Disclosures
|
13
|
||
|
PART II
|
||||
|
Item 5.
|
Market for Registrant's Common Equity, Related Stockholder Matters and Issuer Purchases of Equity Securities
|
14
|
||
|
Item 6.
|
Selected Financial Data
|
15
|
||
|
Item 7.
|
Management's Discussion and Analysis of Financial Condition and Results of Operations
|
15
|
||
|
Item 7A.
|
Quantitative and Qualitative Disclosures About Market Risk
|
23
|
||
|
Item 8.
|
Financial Statements and Supplementary Data
|
23
|
||
|
Item 9.
|
Changes in and Disagreements With Accountants on Accounting and Financial Disclosure
|
23
|
||
|
Item 9A.
|
Controls and Procedures
|
23
|
||
|
Item 9B.
|
Other Information
|
24
|
||
|
PART III
|
||||
|
Item 10.
|
Directors, Executive Officers and Corporate Governance
|
24
|
||
|
Item 11.
|
Executive Compensation
|
25
|
||
|
Item 12.
|
Security Ownership of Certain Beneficial Owners and Management and Related Stockholder Matters
|
26
|
||
|
Item 13.
|
Certain Relationships and Related Transactions, and Director Independence
|
28
|
||
|
Item 14.
|
Principal Accounting Fees and Services
|
28
|
||
|
PART IV
|
||||
|
Item 15.
|
Exhibits, Financial Statement Schedules
|
29
|
||
|
Item 16
|
Form 10-K Summary
|
|||
|
SIGNATURES
|
30
|
|||
|
FINANCIAL STATEMENTS
|
F-1
|
|||
FORWARD LOOKING STATEMENTS
This Annual Report contains forward-looking statements. Forward-looking statements for Brazil Minerals, Inc. reflect current expectations, as of the date of this Annual Report, and involve certain risks and uncertainties. Actual results could differ materially from those anticipated in these forward- looking statements as a result of various factors. Factors that could cause future results to materially differ from the recent results or those projected in forward-looking statements include, among others
: unprofitable efforts resulting not only from the failure to discover mineral deposits, but also from finding mineral deposits that, though present, are insufficient in quantity and quality to return a profit from production; market fluctuations; government regulations, including regulations relating to royalties, allowable production, importing and exporting of minerals, and environmental protection; competition; the loss of services of key personnel; unusual or infrequent weather phenomena, sabotage, government or other interference in the maintenance or provision of infrastructure
as well as general economic conditions.
PART I
Item 1. Description of Business.
Brazil Minerals, Inc. with its subsidiaries ("Brazil Minerals", the "Company", "we", "us", or "our") has two components to its business model: 1) Growing a portfolio of mineral rights in a wide spectrum of strategic and sought-after minerals, from which equity holdings and/or royalty interests will develop, and 2) Mining certain specific areas for gold, diamonds, and sand.. We consolidate our results in this Annual Report.
Our progress as an exploration project generator has been steady. In early 2013 we owned mineral rights for gold and diamonds. Since then we have grown several-fold our bank of high quality mineral properties (the "BMIX Mineral Bank") to currently include mineral rights for gold, diamonds, cobalt, copper, lithium, manganese, nickel, precious gems (aquamarine, beryl, tourmaline) and sand.
Our first equity holdings from our exploration project generation strategy is Jupiter Gold Corporation ("Jupiter Gold"). Jupiter Gold has been a public company since December 16, 2016, and we own approximately 55.4% of Jupiter Gold's equity.
Emerging Growth Company Status
Until December 31, 2017, we were deemed to be an "emerging growth company" as defined in the Jumpstart Our Business Startups Act of 2012, or JOBS Act. Since our predecessor was incorporated in December 2011 and completed an initial public offering in June 2012, our status as an emerging growth company expired on December 31, 2017.
Markets
Rough Diamonds
The market for our rough diamonds is local and with demand from various buyers. Prices for rough diamond are set globally in U.S. dollars.
- 2 -
Polished Diamonds
The market for our polished diamonds is global and with prices normally quoted in U.S dollars. Their price is determined by the so-called four C's – color, carat weight, clarity, and cut. All of our exported diamonds to date have been certified and graded at the Gemological Institute of America ("GIA"), considered the premier analytical laboratory. The highest color grade our polished diamonds have obtained from GIA has been "E", the 2
nd
highest possible grade (the color scale starts at "D"). The best clarity that our polished diamonds have obtained from GIA has been "VVS1", the 2
nd
best clarity possible. The majority of our polished diamonds have been graded F-G for color and VVS2-VS2 for clarity. Their cut has been round brilliant, and their weight has been between 0.4 and 2.0 carats. The Rapaport valuation of our polished diamonds graded at GIA has been approximately $3,250 per carat. Rapaport is a diamond service provider that publishes well-known, periodic pricing valuations for diamonds based on the four C's, as described above.
Gold
The market for our gold is local with demand from various buyers. The price of our 96%-purity gold bars is determined by the global price for gold and quoted in U.S. dollars.
Sand
The market for our sand is local and priced in Brazilian reais. There are various local buyers for our sand, mostly owners of supply stores that cater to the construction industry. Our sand has been analyzed at a well-regarded analytical laboratory in Brazil and found to have high silica levels and low organic matter, both characteristics of high quality sand.
Demand
When we have diamond and gold for sale, demand for our products has been robust. We have been constrained on supply primarily by equipment malfunction and additionally by need for more working capital to expand operations. Demand for our sand is highly dependent on the health of the Brazilian economy since it is used in construction projects.
Distribution
We have not had material issues or bottlenecks with distribution of our products.
Competition
Diamonds, gold and sand production are difficult fields to penetrate due to regulatory requirements, long wait times for permitting and limited availability of new resource areas. We have had competition from illegal exploration of sand areas along the Jequitinhonha River, and we have notified the local authorities concerning such activities.
Seasonality
Our ability to mine for diamonds and gold is highly seasonal. The local rainy season lasts from December through April during which time open sky mining is reduced or stopped depending on the severity of the rains and storms. We expect that during this period our revenues will be substantially lower than during other periods.
Raw Materials
We do not have any material dependence on any raw material or raw material supplier. All of the raw materials that we need are available from numerous suppliers and at market-driven prices.
Intellectual Property
None which is material.
- 3 -
Government Regulation
Mining Regulation and Compliance
Mining regulation in Brazil is carried out by the mining department, a federal entity, and each state in Brazil has an office of this federal entity. For each mineral right that we own, we file any paperwork related to it in the office of the mining department in the state in which such mineral right is located. We believe that we maintain a good relationship with the mining department and that our methods of monitoring are adequate for our current needs.
The mining department normally inspects our operations once a year via an unannounced visit which is their standard practice. We estimate that it costs $10,000 annually to maintain compliance with various mining regulations.
Environmental Regulation and Compliance
Environmental regulation in Brazil is carried out by a state-level agency, which may have multiple offices, one for each region of the state. For each mineral right that we own, we file any paperwork related to it in the local office of the environmental agency that has the applicable geographical jurisdiction. We maintain a good relationship with the offices of the environmental agency and believe that our methods of monitoring are adequate for our current needs.
The environmental agency normally inspects our operations once every one or two years which is standard practice for companies in good standing. We estimate that it costs $10,000 annually to maintain compliance with various environmental regulations.
Surface disturbance from any open pit mining performed by us is in full compliance with its mining plan as approved the local regulatory agencies. We regularly recuperate areas that have been exploited. The current environmental regulations state that after all mining has ceased (however long that may take), there would still be five years of available time for any necessary recuperation to be performed. Our mining and recovery processing for diamonds and gold does not use any chemical products. Tests are conducted regularly and there are no records of groundwater contamination.
Export Regulation
The export of rough diamonds from Brazil complies with the United Nations Kimberley Process certification system of which Brazil is a signatory country. This system was implemented to prevent entrance to the diamond marketplace of those gems produced in areas where human exploitation and other specific illicit activities exist. To our knowledge, Brazil was never a jurisdiction that had such issues.
Employees and Independent Contractors
As of April 10, 2018, we had 6 full-time employees. We also periodically retain consultants to provide specific services deemed necessary.
We consider our employee relations to be very good.
Form and Year of Organization & History to Date
We were incorporated in the State of Nevada on December 15, 2011. From inception until December 2012, we were focused in the software business, which was discontinued when the current management team and business focus began. The Company changed name to Brazil Minerals, Inc. in December 2012.
Available Information
We maintain a website at www.brazil-minerals.com. We make available free of charge, through the Public Filings section of the Investors tab on our website, our Annual Reports on Form 10-K, Quarterly Reports on Form 10-Q, Current Reports on Form 8-K, and all amendments to those reports filed or furnished pursuant to Section 13(a) or 15(d) of the Exchange Act, as soon as reasonably practicable after such material is electronically filed with, or furnished to, the SEC. The information on our website is not, and shall not be deemed to be, a part hereof or incorporated into this or any of our other filings with the SEC.
Our SEC filings are available from the SEC's internet website at www.sec.gov which contains reports, proxy and information statements and other information regarding issuers that file electronically. These reports, proxy statements and other information may also be inspected and copied at the SEC's Public Reference Room at 100 F Street, NE, Washington, D.C. 20549.
- 4 -
Item 1A. Risk Factors.
Some, but not all, of our operating risk factors and the risks of any investment in our stock are listed below.
Risks Related to Our Operations
We have a limited operating history.
Investors should evaluate an investment in us in light of the uncertainties encountered by developing companies in a competitive environment. Our business is dependent upon the implementation of our business plan. There can be no assurance that our efforts will be successful or that we will ultimately be able to attain profitability.
Our ability to execute our business plan depends primarily on the continuation of a favorable mining environment in Brazil.
Mining operations in Brazil are heavily regulated. Any significant change in mining legislation or other changes in Brazil's current mining environment may slow down or alter our business prospects.
We do not have any reserves compliant with SEC Industry Guide 7.
Vaaldiam, the previous owner of this mining concession, and at that time a publicly-traded Canadian company, performed detailed geological studies leading to the publication of an NI 43-101 technical report in 2007, with an update in 2008, as required by the rules of the Canadian securities administrator and filed in SEDAR. The NI 43-101 report describes the existence of mineralized materials amounting to 1,639,200 cubic meters with the following concentrations: 0.16 carats of diamonds per cubic meter and 182 milligrams of gold per cubic meter. Vaaldiam also submitted a bankable feasibility study to the Brazilian mining department in accordance with local regulations. The NI 43-101 technical report and the bankable feasibility study were not prepared in accordance with the SEC-sanctioned Industry Guide 7 for mining companies. Under such regulation, no assertion can be made about reserves and the term "resources" is not recognized.
We may be unable to find sources of funding if and when needed, resulting in the failure of our business.
As of today, we need additional equity or debt financing beyond our existing cash to operate. This additional financing may not become available and, if available, may not be available on terms that are acceptable to us. If we do obtain acceptable funding, the terms and conditions of receiving such capital would likely result in further dilution. If we are not successful in raising capital or sufficient capital, we will have to modify our business plans and substantially reduce or eliminate operations, or as an extreme measure seek reorganization. In these events, you could lose a substantial part or all of your investment.
Our quarterly and annual operating and financial results and our revenue are likely to fluctuate significantly in future periods.
Our quarterly and annual operating and financial results are difficult to predict and may fluctuate significantly from period to period. Our revenues, net income, and results of operations may fluctuate as a result of a variety of factors that are outside our control including, but not limited to, lack of sufficient working capital, equipment malfunction and breakdowns, inability to timely find spare machines or parts to fix the broken equipment, regulatory or licensing delays, and severe weather phenomena.
We do not intend to pay regular future dividends on our common stock and thus stockholders must look to appreciation of our common stock to realize a gain on their investments.
We have never paid a dividend and we do not have any plans to pay dividends in the foreseeable future. Our future dividend policy is within the discretion of our Board of Directors and will depend upon various factors, including future earnings, if any, our capital requirements and general financial condition, and other factors. Accordingly, stockholders must look solely to appreciation of our common stock to realize a gain on their investment. This appreciation may not occur, or may occur over a longer timeframe that is less interesting to short-term oriented investors.
- 5 -
We depend upon Marc Fogassa, our Chief Executive Officer and Chairman.
Our success is largely dependent upon the personal efforts of Marc Fogassa. Currently he is our only management team member that is fluent and fully conversant in both Portuguese, the language of Brazil, and English. The loss of the services of Mr. Fogassa would have a material adverse effect on our business and prospects. We maintain key-man life insurance on the life of Mr. Fogassa.
Risks Related to Our Capital Stock
Our Series A Preferred Stock has the effect of concentrating voting control over us in Marc Fogassa, our Chairman and Chief Executive Officer.
One share of our Series A Preferred Stock is issued, outstanding and held since 2012 by Marc Fogassa, our Chairman and Chief Executive Officer. The Certificate of Designations, Preferences and Rights of our Series A Convertible Preferred provides that for so long as Series A Preferred Stock is issued and outstanding, the holders of Series A Preferred Stock shall vote together as a single class with the holders of our Common Stock, with the holders of Series A Preferred Stock being entitled to 51% of the total votes on all matters regardless of the actual number of shares of Series A Preferred Stock then outstanding, and the holders of Common Stock and any other class or series of capital stock entitled to vote with the Common Stock being entitled to their proportional share of the remaining 49% of the total votes based on their respective voting power.
Our stock price may be volatile.
The market price of our Common Stock has been and is likely to continue to be volatile and could fluctuate in price in response to various factors, many of which are beyond our control, including the following:
|
(1)
|
our ability to grow and/or maintain revenue;
|
|
(2)
|
our ability to achieve profitability;
|
|
(3)
|
our ability to raise capital when needed;
|
|
(4)
|
our sales of our common stock;
|
|
(5)
|
our ability to execute our business plan;
|
|
(6)
|
our ability to acquire additional mineral properties;
|
|
(7)
|
legislative, regulatory, and competitive developments; and
|
|
(8)
|
economic and other external factors.
|
In addition, the securities markets have from time to time experienced significant price and volume fluctuations that are unrelated to the operating performance of particular companies. These market fluctuations may also materially and adversely affect the market price of our common stock.
Because our common stock trades on the over-the-counter (OTC) market, you may not be able to buy and sell our common stock at optimum prices and you may face liquidity issues.
The trading of our stock on the OTC imposes, among others, the following risks:
|
·
|
Availability of quotes and order information
|
|
·
|
Liquidity risks
|
|
·
|
Dealer's spreads
|
- 6 -
Our convertible debt securities outstanding may adversely affect the market price for our common stock.
To the extent that any remaining convertible debt securities are converted into our common stock, the existing stockholder percentage ownership will be diluted and any sales in the public market of the common stock underlying such options may adversely affect prevailing market prices for our common stock. A similar situation occurs if our outstanding options and warrants are exercised.
We may seek to raise additional funds, finance acquisitions or develop strategic relationships by issuing capital stock that would dilute your ownership.
We may largely finance our operations by issuing equity securities, which would materially reduce the percentage ownership of our existing stockholders. Furthermore, any newly issued securities could have rights, preferences, and privileges senior to those of our existing common stock. Moreover, any issuances by us of equity securities may be at or below the prevailing market price of our stock and in any event may have a dilutive impact on ownership interest of existing common stockholders, which could cause the market price of stock to decline. We may also raise additional funds through the incurrence of debt or the issuance or sale of other securities or instruments senior to our common shares. The holders of any debt securities or instruments we may issue could have rights superior to the rights of our common stockholders.
Our common stock is currently defined as "penny stock" and the rules imposed on the sale of the shares may affect your ability to resell any shares you may purchase, if at all.
Our common stock has traded below $5 and is therefore defined as a "penny stock" under the Securities Exchange Act of 1934, as amended (the "Exchange Act") and rules of the SEC. The Exchange Act and such penny stock rules generally impose additional sales practice and disclosure requirements on broker-dealers who sell our securities to persons other than certain accredited investors who are, generally, institutions with assets in excess of $5,000,000 or individuals with a net worth in excess of $1,000,000 or annual income exceeding $200,000, or $300,000 jointly with spouse, or in transactions not recommended by the broker-dealer. For transactions covered by the penny stock rules, a broker-dealer must make a suitability determination for each purchaser and receive the purchaser's written agreement prior to the sale. In addition, the broker-dealer must make certain mandated disclosures in penny stock transactions, including the actual sale or purchase price and actual bid and offer quotations, the compensation to be received by the broker-dealer and certain associated persons, and deliver certain disclosures required by the SEC. Consequently, the penny stock rules may affect the ability of broker-dealers to make a market in or trade our common stock and may also affect a stockholder's ability to resell any of our shares in the public markets.
Item 1B. Unresolved Staff Comments.
None.
Item 2. Properties.
Mineral Properties
Our mineral properties are listed in the following table and summarized below.
- 7 -
|
Project Name
|
Minerals
|
Location (state, country)
|
Area (acres)
|
Status
|
|
Jequitinhonha Valley
|
Diamonds, Gold, Sand
|
Minas Gerais, Brazil
|
27,955
|
active mining
|
|
Goiás
|
Cobalt, Copper, Nickel
|
Goiás,
Brazil
|
5,011
|
pre-research planning
|
|
Salinas
|
Lithium, Aquamarine, Beryl,
Tourmaline, Granite, Feldspar
|
Minas Gerais, Brazil
|
288
|
pre-research planning
|
|
Paracatu*
|
Gold
|
Minas Gerais, Brazil
|
795
|
research phase
|
|
Crixás*
|
Gold
|
Goiás,
Brazil
|
4,925
|
research phase
|
|
Itabira*
|
Gold
|
Minas Gerais, Brazil
|
4,069
|
research phase
|
|
Diamantina*
|
Manganese
|
Minas Gerais, Brazil
|
4,970
|
research phase
|
|
Serrita*
|
Gold
|
Pernambuco, Brazil
|
14,169
|
pre-research planning
|
|
Amazonas*
|
Gold
|
Amazonas, Brazil
|
69,030
|
pre-research planning
|
* Projects owned by our subsidiary, Jupiter Gold.
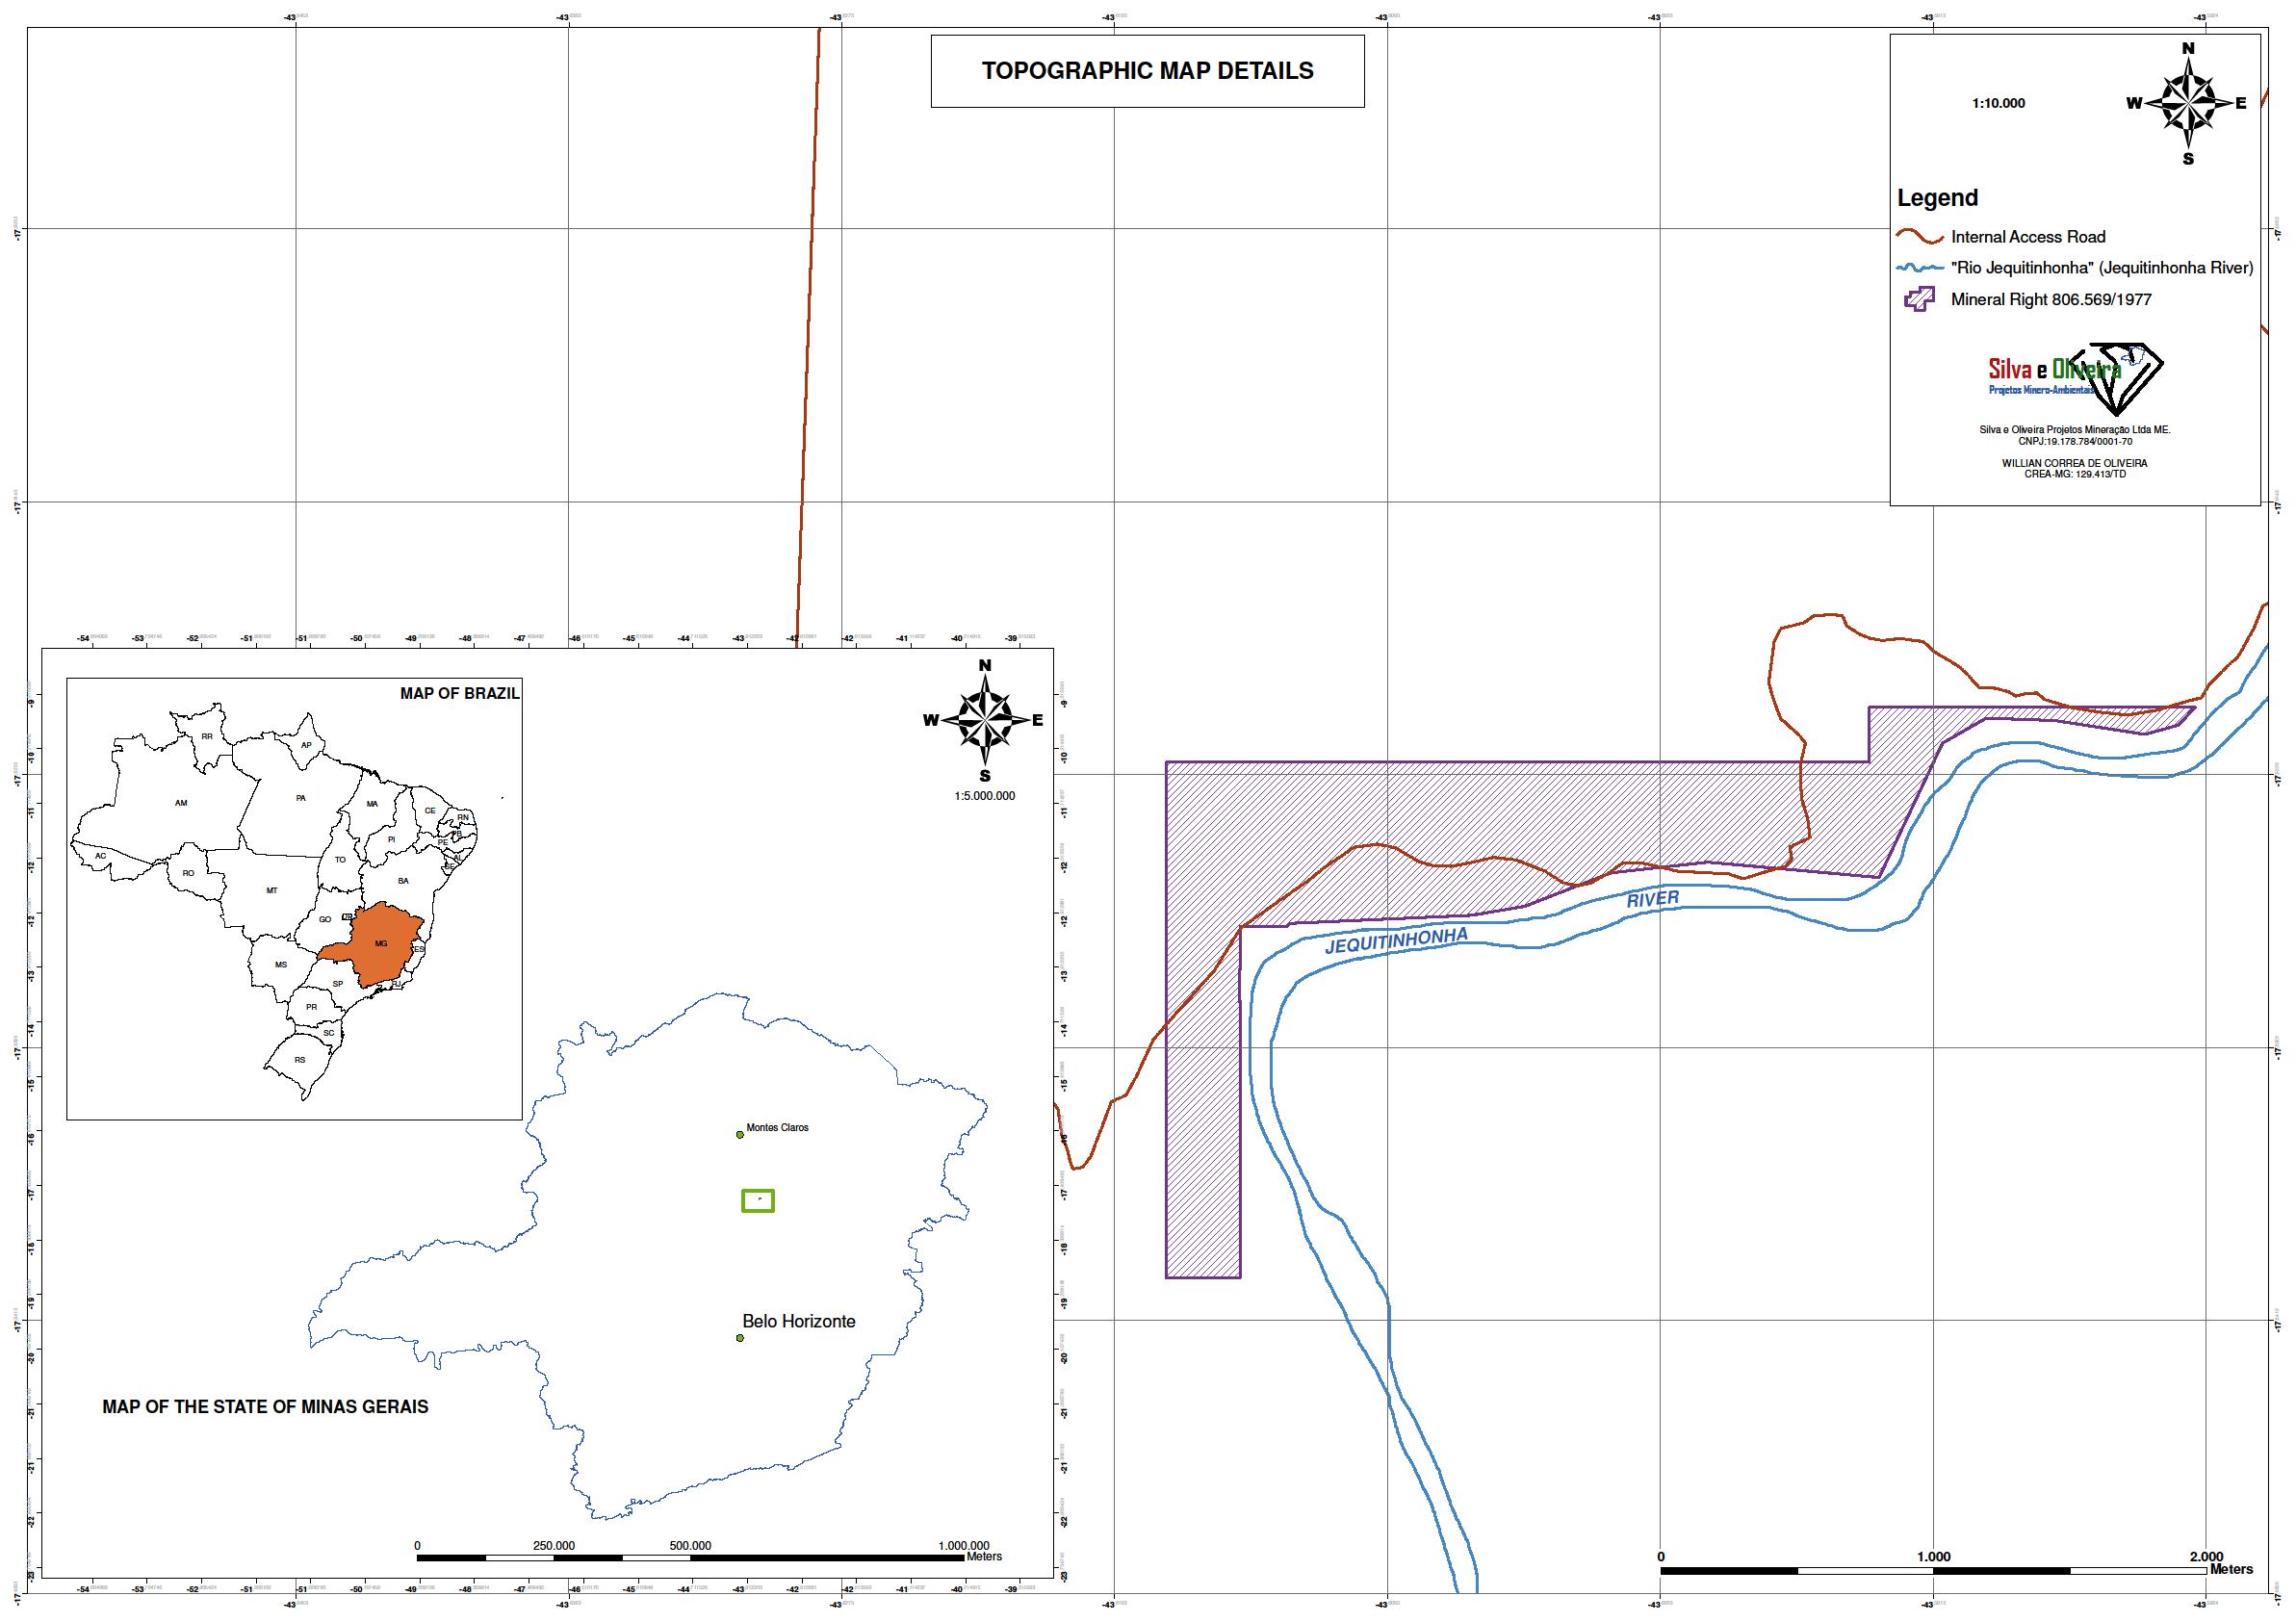
Diamond, Gold, Sand – Jequitinhonha Valley
Brazil Minerals, through subsidiaries, has 31 mineral rights for diamond, gold, and sand, on and near the margins of the Jequitinhonha River in the state of Minas Gerais in Brazil. The Jequitinhonha River valley is a well-known area for diamond and gold production; it has hosted alluvial production since the 18th century.
- 8 -
One of our mineral rights, covering 422 acres, is a mining concession for diamond, gold and sand. Our concession, awarded by the Brazilian federal government through the Brazilian mining department, is the highest level of mineral right in Brazil. It permits us to mine in perpetuity provided that environmental licenses are kept current and that mining guidelines are followed.
Mineralization
Vaaldiam, the previous owner of this mining concession, and at that time a publicly-traded Canadian company, performed detailed geological studies leading to the publication of an NI 43-101 technical report in 2007, with an update in 2008, as required by the rules of the Canadian securities administrator and filed in SEDAR. The NI 43-101 report describes the existence of mineralized materials amounting to 1,639,200 cubic meters with the following concentrations: 0.16 carats of diamonds per cubic meter and 182 milligrams of gold per cubic meter. Vaaldiam also submitted a bankable feasibility study to the Brazilian mining department in accordance with local regulations. The NI 43-101 technical report and the bankable feasibility study were not prepared in accordance with the SEC-sanctioned Industry Guide 7 for mining companies. Under such regulation, no assertion can be made about reserves and the term "resources" is not recognized.
Equipment & Processing
Gold and diamonds are present within gravel found in alluvial material in our concession area. Following drilling for identification of mineralized areas, we excavate the chosen perimeters, and gravel is removed and accumulated by excavator and bulldozer working together and later transported by truck to our recovery unit described below.
Recovery Plants
We have two working recovery plants for diamonds and gold. Our subsidiary, Jupiter Gold owns a modular recovery plant which utilizes a large centrifuge for recovery, currently deployed in this concession area. During 2017, this plant was completed, tested and made operational. The plant uses centrifugation as the primary method of gold separation. Material identified as potentially containing diamonds is retrieved and further processed in specific high-precision equipment for detection of diamonds, located in our large plant, as described below.
- 9 -
The modular plant is highly cost-effective and has become our preferred method of gold and diamond recovery. Under an agreement between Brazil Minerals and Jupiter Gold, this modular plant is solely operated by Brazil Minerals which retains 100% of the diamonds and 50% of the gold recovered from it, while the other 50% of gold is for the account of Jupiter Gold. Under U.S. GAAP consolidation of financial results for subsidiaries, any gold revenues obtained by Jupiter Gold are added to the revenues of Brazil Minerals.
Our other plant at this concession is regarded as the largest such type in Latin America and capable of processing upwards of 45 tons of gravel per hour of operation. It was acquired when we took over the concession. From the best information we have, this plant cost $2.5 million and was built by South African mining engineers. We utilize the state-of-the-art diamond recovery facilities from this large plant, following separation of concentrated diamondiferous-yielding material obtained after initial processing in our modular plant. We also utilize the gold laboratory unit of the large plant for final processing of gold obtained from our modular plant.
Fuel & Water
All of our equipment at the concession runs on diesel, purchased from multiple local vendors. Our water comes from lagoons that receive water from the Jequitinhonha River. We do not utilize any chemicals in any processes.
No Chemicals
All of our processing is based on washing auriferous and diamondiferous gravel with water, then applying physical processes such as sieving, shaking, followed by centrifugation. Gold and diamonds are heavy substances, allowing separation by such methods. The final step in diamond recovery uses diffraction differential in light emitted by diamonds versus non-diamonds.
Sand
The mining concession contains a sand bay from which
in natura
sand is extracted via excavator and sold to truckers. Our sand is of high-quality and sought after locally for civil construction projects.
Logistics
Our mining concession is an approximately one and half hour drive from Montes Claros with a population close to 700,000 people, with all needed services and the regional airport.
- 10 -
Map
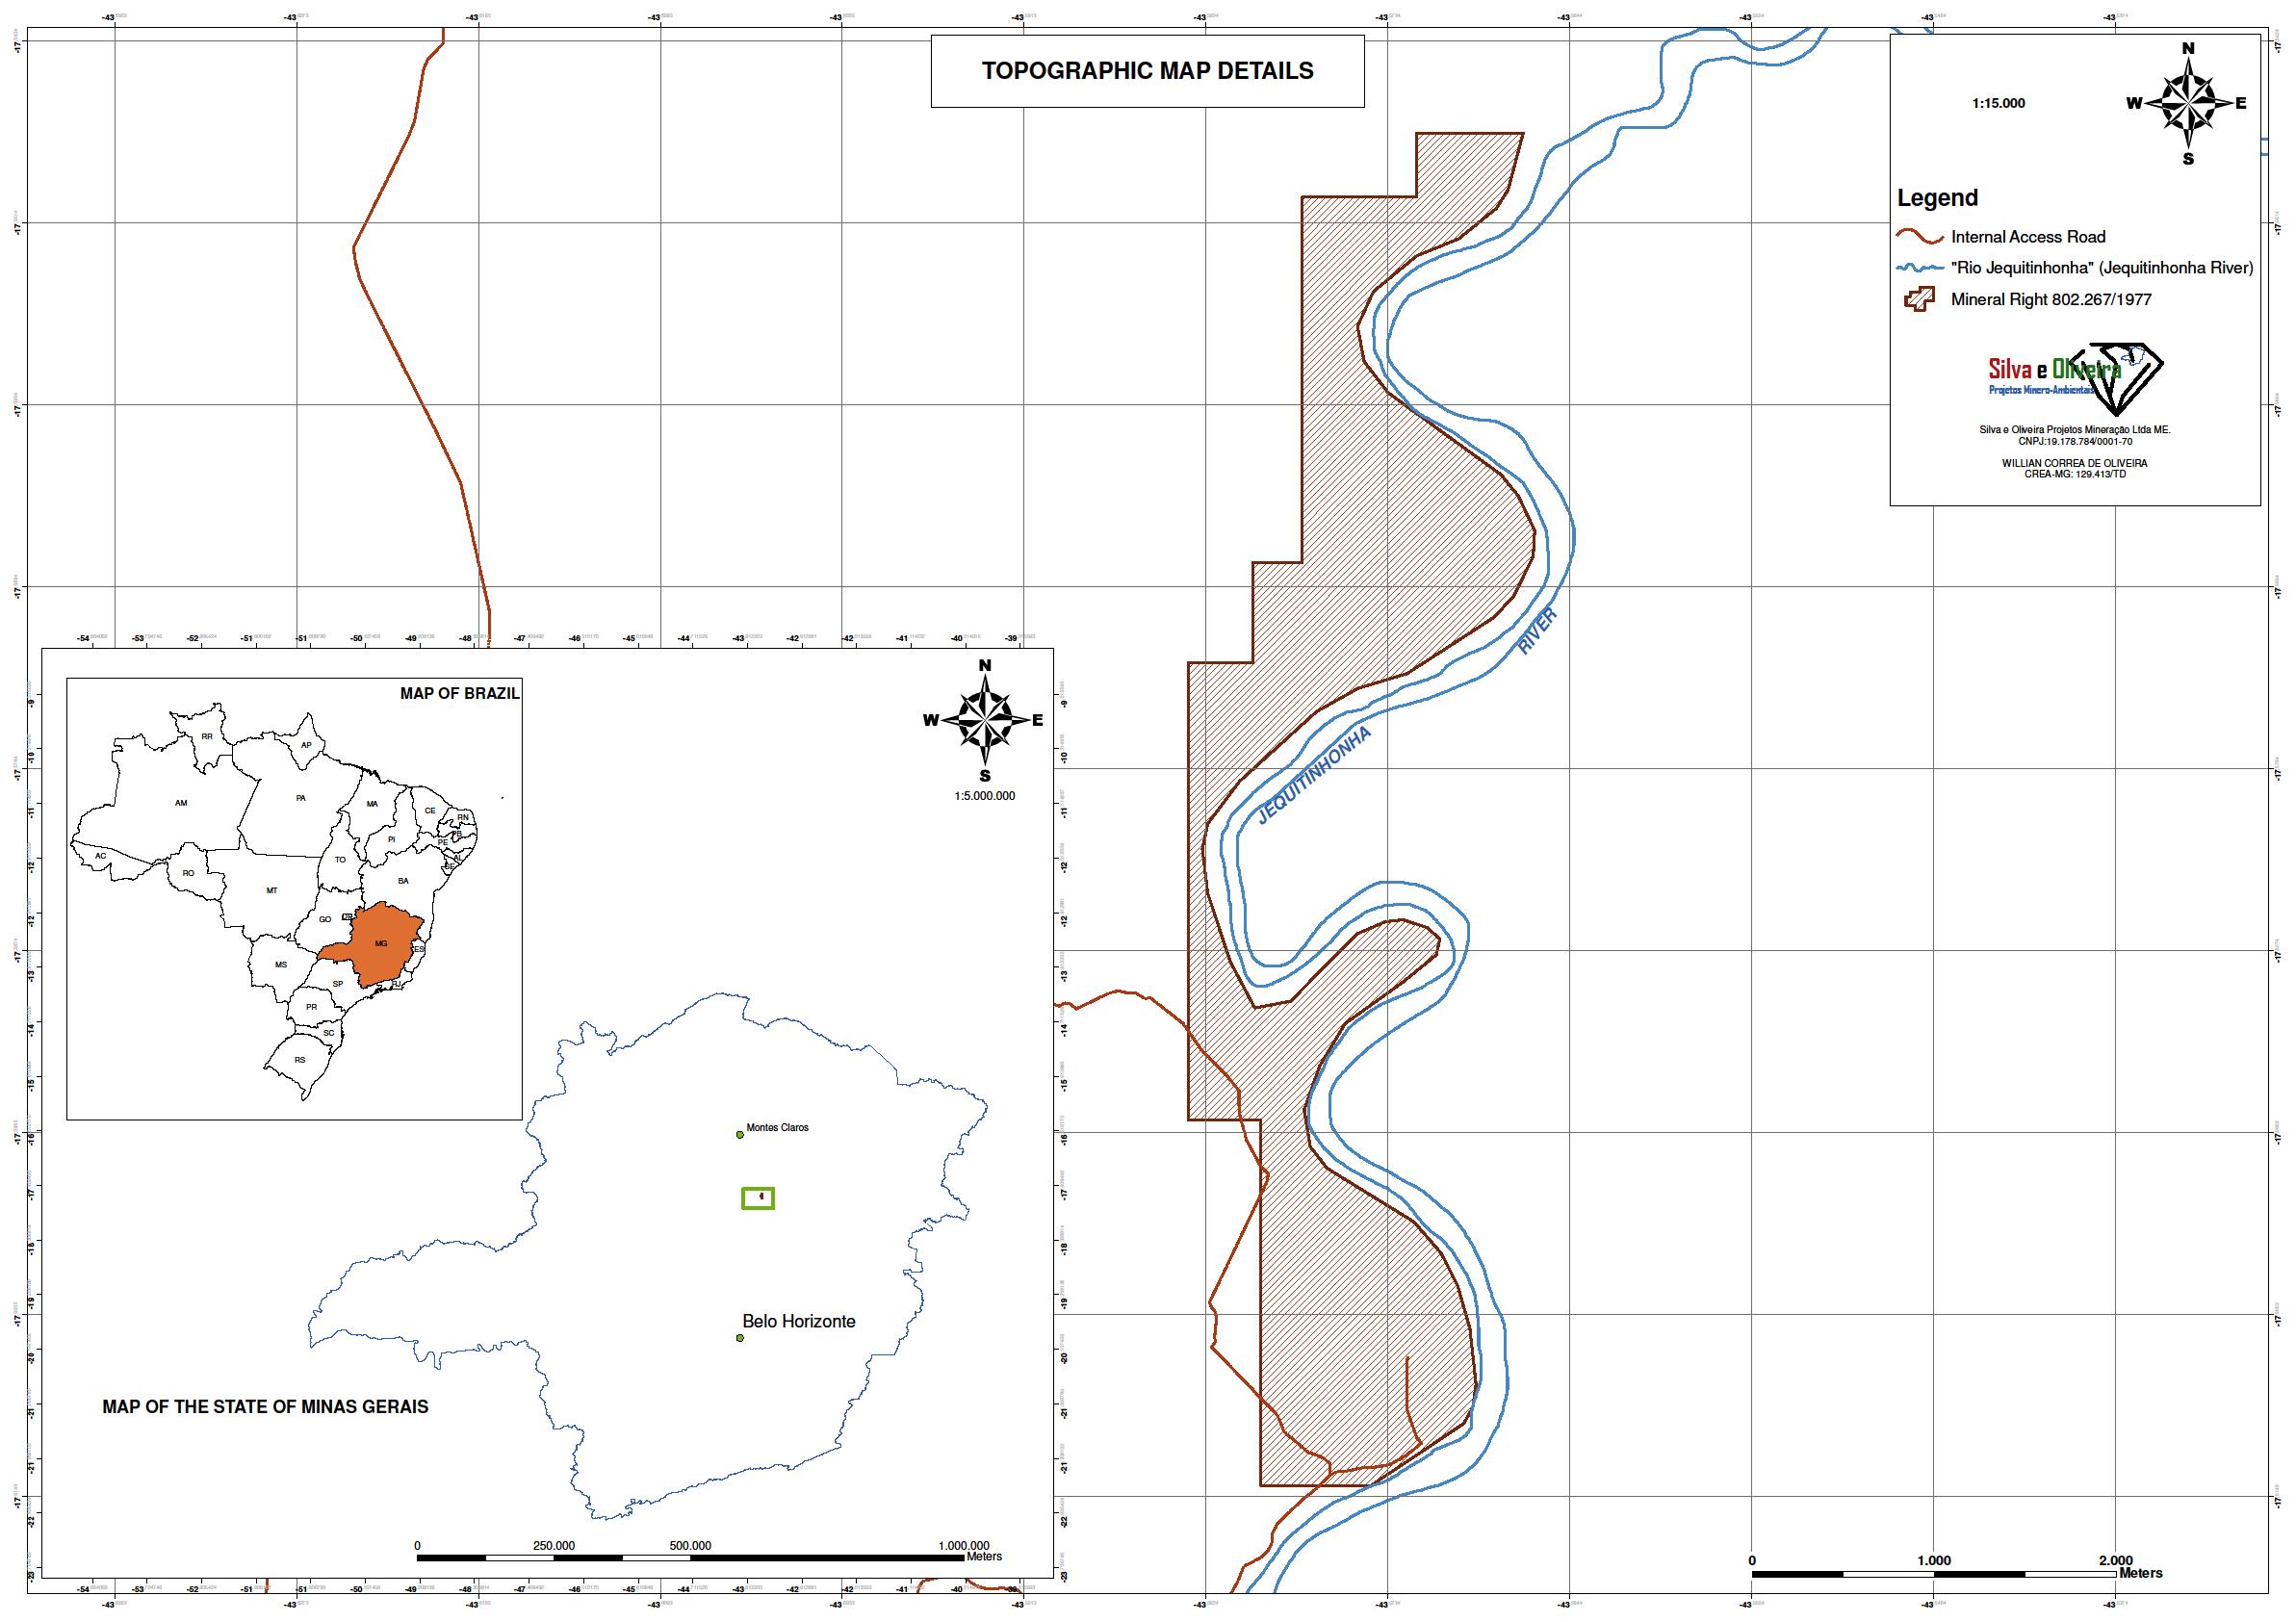
Additional Area
We have obtained an initial permit for mining another mineral right that is located approximately two miles downstream from the mining concession described above. This mineral right has 1,310 acres, and our current authorization covers only a small part of this available surface area. We have drilled this area and identified presence of both gold and diamonds. We intend to move to this area for recovery after further exploitation of the mining concession described above. A map of this area is found below.
Map
- 11 -
Gold – Paracatu
The Paracatu project, held by our subsidiary, Jupiter Gold, consists of a mineral right for gold in this well-known gold district. This area of Brazil was settled in the early 17
th
century by pioneers searching for gold. Today Paracatu is home to the largest gold mine in Brazil, "Morro do Ouro" (Gold Hill), owned and operated by Kinross Gold, a large global producer. Morro do Ouro is an open-sky mine, with an ore body of 16 million ounces of gold, and annual production of 480,000 ounces, according to publicly-available information. The Paracatu project area is located only a few miles downstream from Morro do Ouro.
The Paracatu project is exploratory and Jupiter Gold intends to begin a drilling study during the second quarter of 2018.
Gold – Crixás
The
Crixás project
, held by our subsidiary Jupiter Gold, consists of a mineral right for gold in this well-known gold district. This area of Brazil was settled in the 18
th
century by pioneers searching for gold. Today Crixás is home to the some of the largest gold operations in Brazil, with large gold mines and projects from AngloGold Ashanti and Cleveland Mining. AngloGold Ashanti's operations in Crixás encompass three underground and two open sky mines, with an ore body of greater than 7 million ounces of gold and annual production of 132,000 ounces, according to publicly-available information.
The
Crixás
project is exploratory, and Jupiter Gold intends to begin a field study in late 2018.
Gold – Itabira
The
Itabira project
, held by our subsidiary Jupiter Gold, consists of a mineral right for gold in a region of Brazil near Itabira called the "
Quadrilátero Ferrífero" (Iron Quandrangle) known for large iron mines as well as gold mines.
Manganese – Diamantina
The
Diamantina project
, held by our subsidiary, Jupiter Gold, consists of two mineral rights for manganese in the region in and surrounding Diamantina where other companies have explored for manganese.
The
Diamantina
project is exploratory, and Jupiter Gold intends to begin a field study in late 2018.
- 12 -
Cobalt, Copper, Nickel –
Goiás
The
Goiás project
,
held by our subsidiary Jupiter Gold, consists of two mineral rights for cobalt, copper, and nickel in the region in and surrounding Montes Claros de
Goiás
, where other companies have explored for these minerals, and some of the largest Brazilian reserves of nickel are located, according to publicly-available information.
The
Goiás
project is exploratory, and Jupiter Gold intends to study the area or enter into a partnership for its study.
Lithium –
Salinas
The
Salinas project
consists of a mineral right for lithium, aquamarine, beryl, tourmaline, granite, and feldspar
in the Salinas district, where other companies have explored for these minerals.
The
Salinas
project is exploratory, and we intend to study the area or enter into a partnership for its study.
Gold – Serrita
The
Serrita project,
held by our subsidiary, Jupiter Gold, consists of three mineral rights for gold
in the Serrita district, a known gold district.
The
Serrita
project is exploratory, and Jupiter Gold intends to study the area or enter into a partnership for its study.
Gold – Amazonas
The
Amazonas project, held by our
subsidiary, Jupiter Gold, consists of three mineral rights for gold
in the Apui area, a known gold district.
The
Amazonas
project is exploratory, and Jupiter Gold intends to study the area or enter into a partnership for its study.
Offices
The Company's principal place of operations and office is in the municipality of Olhos D'Agua in the state of Minas Gerais in Brazil. We also utilize an office in Pasadena, California.
Item 3. Legal Proceedings.
None which are material.
Item 4. Mine Safety Disclosures.
Not applicable.
- 13 -
PART II
Item 5. Market for Registrant's Common Equity, Related Stockholder Matters and Issuer Purchases of Equity Securities.
Market Information and Current Stockholders
Our common stock is traded under the symbol "BMIX". The following table sets forth, for each of the quarterly periods indicated, the range of high and low sales prices, in U.S. dollars, for our common stock for each quarter in 2016 and 2017. Prices have been proportionally adjusted to reflect a 1 for 500 reverse stock split effective January 27, 2017.
|
|
Year Ended
|
|||||||
|
Quarters
|
December 31, 2016
|
|||||||
|
High
|
Low
|
|||||||
|
2016
|
||||||||
|
First (1/1-3/31)
|
$
|
0.1000
|
$
|
0.0500
|
||||
|
Second (4/1-6/30)
|
$
|
0.1000
|
$
|
0.0500
|
||||
|
Third (7/1-9/30)
|
$
|
0.1000
|
$
|
0.0500
|
||||
|
Fourth (10/1-12/31)
|
$
|
0.1000
|
$
|
0.0500
|
||||
|
|
Year Ended
|
|||||||
|
Quarters
|
December 31, 2017
|
|||||||
|
High
|
Low
|
|||||||
|
2017
|
||||||||
|
First (1/1-3/31)
|
$
|
0.0500
|
$
|
0.0100
|
||||
|
Second (4/1-6/30)
|
$
|
0.0319
|
$
|
0.0100
|
||||
|
Third (7/1-9/30)
|
$
|
0.0360
|
$
|
0.0040
|
||||
|
Fourth (10/1-12/31)
|
$
|
0.0089
|
$
|
0.0035
|
||||
As of April 10, 2018 we had 184 holders of record of our common stock as such term is defined in SEC rules, according to records maintained by our transfer agent.
Dividends
We have not paid any cash dividends since inception and do not expect to declare any cash dividends in the foreseeable future.
Equity Compensation Plan
In 2017, our Board of Directors approved our 2017 Stock Incentive Plan under which we can offer eligible employees, consultants, and non-employee directors cash and stock-based compensation and/or incentives to compensate, attract, retain, or reward such individuals. We have no other equity compensation plan. The table below sets forth certain information as of December 31, 2017 with respect to the 2017 Stock Incentive Plan.
- 14 -
|
Plan Category
|
Number of securities to
be issued upon exercise
of outstanding options,
warrants, and rights
(a)
|
Weighted-average
exercise price of
outstanding options,
warrants and rights
(b)
|
Number of securities
remaining available for
future issuance under equity
compensation plans
(excluding securities
reflected in column "(a)")
(c)
|
|||||||||
|
|
||||||||||||
|
Equity compensation plans approved by security holders
|
0
|
0
|
0
|
|||||||||
|
|
||||||||||||
|
Equity compensation plans not approved by security holders (2017 Stock Incentive Plan)
|
25,000,000
|
$
|
n/a
|
25,000,000
|
||||||||
|
|
||||||||||||
|
Total
|
25,000,000
|
$
|
n/a
|
25,000,000
|
||||||||
Sales of Unregistered Securities
None during the 4
th
quarter of 2017.
Item 6. Selected Financial Data.
The information to be reported under this Item is not required of smaller reporting companies.
Item 7. Management's Discussion and Analysis of Financial Condition and Results of Operation.
The following discussion of our financial condition and results of operations should be read in conjunction with our audited consolidated financial statements and the notes to those financial statements appearing elsewhere in this Report.
This Annual Report contains forward-looking statements. Forward-looking statements for Brazil Minerals, Inc. reflect current expectations, as of the date of this Annual Report, and involve certain risks and uncertainties. Actual results could differ materially from those anticipated in these forward- looking statements as a result of various factors. Factors that could cause future results to materially differ from the recent results or those projected in forward-looking statements include, among others
: unprofitable efforts resulting not only from the failure to discover mineral deposits, but also from finding mineral deposits that, though present, are insufficient in quantity and quality to return a profit from production; market fluctuations; government regulations, including regulations relating to royalties, allowable production, importing and exporting of minerals, and environmental protection; competition; the loss of services of key personnel; unusual or infrequent weather phenomena, sabotage, government or other interference in the maintenance or provision of infrastructure
as well as general economic conditions.
Overview
Brazil Minerals, Inc. with its subsidiaries ("Brazil Minerals", the "Company", "we", "us", or "our") has two components to its business model: 1) Growing a portfolio of mineral rights in a wide spectrum of strategic and sought-after minerals, from which equity holdings and/or royalty interests will develop, and 2) Mining certain specific areas for gold, diamonds, and sand.. We consolidate our results in this Annual Report.
Our progress as an exploration project generator has been steady. In early 2013 we owned mineral rights for gold and diamonds. Since then we have grown several-fold our bank of high quality mineral properties (the "BMIX Mineral Bank") to currently include mineral rights for gold, diamonds, cobalt, copper, lithium, manganese, nickel, precious gems (aquamarine, beryl, tourmaline) and sand.
Our first equity holdings from our exploration project generation strategy is Jupiter Gold Corporation ("Jupiter Gold"). Jupiter Gold has been a public company since December 16, 2016, and we own approximately 55.4% of Jupiter Gold's equity.
Our mineral properties are listed in the following table and summarized below.
- 15 -
|
Project Name
|
Minerals
|
Location (state, country)
|
Area (acres)
|
Status
|
|
Jequitinhonha Valley
|
Diamonds, Gold, Sand
|
Minas Gerais, Brazil
|
27,955
|
active mining
|
|
Goiás
|
Cobalt, Copper, Nickel
|
Goiás,
Brazil
|
5,011
|
pre-research planning
|
|
Salinas
|
Lithium, Aquamarine, Beryl,
Tourmaline, Granite, Feldspar
|
Minas Gerais, Brazil
|
288
|
pre-research planning
|
|
Paracatu*
|
Gold
|
Minas Gerais, Brazil
|
795
|
research phase
|
|
Crixás*
|
Gold
|
Goiás,
Brazil
|
4,925
|
research phase
|
|
Itabira*
|
Gold
|
Minas Gerais, Brazil
|
4,069
|
research phase
|
|
Diamantina*
|
Manganese
|
Minas Gerais, Brazil
|
4,970
|
research phase
|
|
Serrita*
|
Gold
|
Pernambuco, Brazil
|
14,169
|
pre-research planning
|
|
Amazonas*
|
Gold
|
Amazonas, Brazil
|
69,030
|
pre-research planning
|
* Projects owned by our subsidiary, Jupiter Gold.
Diamond, Gold, Sand – Jequitinhonha Valley
Brazil Minerals, through subsidiaries, has 31 mineral rights for diamond, gold, and sand, on and near the margins of the Jequitinhonha River in the state of Minas Gerais in Brazil. The Jequitinhonha River valley is a well-known area for diamond and gold production; it has hosted alluvial production since the 18th century.
- 16 -
One of our mineral rights, covering 422 acres, is a mining concession for diamond, gold and sand. Our concession, awarded by the Brazilian federal government through the Brazilian mining department, is the highest level of mineral right in Brazil. It permits us to mine in perpetuity provided that environmental licenses are kept current and that mining guidelines are followed.
Mineralization
Vaaldiam, the previous owner of this mining concession, and at that time a publicly-traded Canadian company, performed detailed geological studies leading to the publication of an NI 43-101 technical report in 2007, with an update in 2008, as required by the rules of the Canadian securities administrator and filed in SEDAR. The NI 43-101 report describes the existence of mineralized materials amounting to 1,639,200 cubic meters with the following concentrations: 0.16 carats of diamonds per cubic meter and 182 milligrams of gold per cubic meter. Vaaldiam also submitted a bankable feasibility study to the Brazilian mining department in accordance with local regulations. The NI 43-101 technical report and the bankable feasibility study were not prepared in accordance with the SEC-sanctioned Industry Guide 7 for mining companies. Under such regulation, no assertion can be made about reserves and the term "resources" is not recognized.
Equipment & Processing
Gold and diamonds are present within gravel found in alluvial material in our concession area. Following drilling for identification of mineralized areas, we excavate the chosen perimeters, and gravel is removed and accumulated by excavator and bulldozer working together and later transported by truck to our recovery unit described below.
Recovery Plants
We have two working recovery plants for diamonds and gold. Our subsidiary, Jupiter Gold owns a modular recovery plant which utilizes a large centrifuge for recovery, currently deployed in this concession area. During 2017, this plant was completed, tested and made operational. The plant uses centrifugation as the primary method of gold separation. Material identified as potentially containing diamonds is retrieved and further processed in specific high-precision equipment for detection of diamonds, located in our large plant, as described below.
- 17 -
The modular plant is highly cost-effective and has become our preferred method of gold and diamond recovery. Under an agreement between Brazil Minerals and Jupiter Gold, this modular plant is solely operated by Brazil Minerals which retains 100% of the diamonds and 50% of the gold recovered from it, while the other 50% of gold is for the account of Jupiter Gold. Under U.S. GAAP consolidation of financial results for subsidiaries, any gold revenues obtained by Jupiter Gold are added to the revenues of Brazil Minerals.
Our other plant at this concession is regarded as the largest such type in Latin America and capable of processing upwards of 45 tons of gravel per hour of operation. It was acquired when we took over the concession. From the best information we have, this plant cost $2.5 million and was built by South African mining engineers. We utilize the state-of-the-art diamond recovery facilities from this large plant, following separation of concentrated diamondiferous-yielding material obtained after initial processing in our modular plant. We also utilize the gold laboratory unit of the large plant for final processing of gold obtained from our modular plant.
Fuel & Water
All of our equipment at the concession runs on diesel, purchased from multiple local vendors. Our water comes from lagoons that receive water from the Jequitinhonha River. We do not utilize any chemicals in any processes.
No Chemicals
All of our processing is based on washing auriferous and diamondiferous gravel with water, then applying physical processes such as sieving, shaking, followed by centrifugation. Gold and diamonds are heavy substances, allowing separation by such methods. The final step in diamond recovery uses diffraction differential in light emitted by diamonds versus non-diamonds.
Sand
The mining concession contains a sand bay from which
in natura
sand is extracted via excavator and sold to truckers. Our sand is of high-quality and sought after locally for civil construction projects.
Logistics
Our mining concession is an approximately one and half hour drive from Montes Claros with a population close to 700,000 people, with all needed services and the regional airport.
- 18 -
Map
Additional Area
We have obtained an initial permit for mining another mineral right that is located approximately two miles downstream from the mining concession described above. This mineral right has 1,310 acres, and our current authorization covers only a small part of this available surface area. We have drilled this area and identified presence of both gold and diamonds. We intend to move to this area for recovery after further exploitation of the mining concession described above. A map of this area is found below.
Map
- 19 -
Gold – Paracatu
The Paracatu project, held by our subsidiary, Jupiter Gold, consists of a mineral right for gold in this well-known gold district. This area of Brazil was settled in the early 17
th
century by pioneers searching for gold. Today Paracatu is home to the largest gold mine in Brazil, "Morro do Ouro" (Gold Hill), owned and operated by Kinross Gold, a large global producer. Morro do Ouro is an open-sky mine, with an ore body of 16 million ounces of gold, and annual production of 480,000 ounces, according to publicly-available information. The Paracatu project area is located only a few miles downstream from Morro do Ouro.
The Paracatu project is exploratory and Jupiter Gold intends to begin a drilling study during the second quarter of 2018.
Gold – Crixás
The
Crixás project
, held by our subsidiary Jupiter Gold, consists of a mineral right for gold in this well-known gold district. This area of Brazil was settled in the 18
th
century by pioneers searching for gold. Today Crixás is home to the some of the largest gold operations in Brazil, with large gold mines and projects from AngloGold Ashanti and Cleveland Mining. AngloGold Ashanti's operations in Crixás encompass three underground and two open sky mines, with an ore body of greater than 7 million ounces of gold and annual production of 132,000 ounces, according to publicly-available information.
The
Crixás
project is exploratory, and Jupiter Gold intends to begin a field study in late 2018.
Gold – Itabira
The
Itabira project
, held by our subsidiary Jupiter Gold, consists of a mineral right for gold in a region of Brazil near Itabira called the "
Quadrilátero Ferrífero" (Iron Quandrangle) known for large iron mines as well as gold mines.
Manganese – Diamantina
The
Diamantina project
, held by our subsidiary, Jupiter Gold, consists of two mineral rights for manganese in the region in and surrounding Diamantina where other companies have explored for manganese.
The
Diamantina
project is exploratory, and Jupiter Gold intends to begin a field study in late 2018.
- 20 -
Cobalt, Copper, Nickel –
Goiás
The
Goiás project
,
held by our subsidiary Jupiter Gold, consists of two mineral rights for cobalt, copper, and nickel in the region in and surrounding Montes Claros de
Goiás
, where other companies have explored for these minerals, and some of the largest Brazilian reserves of nickel are located, according to publicly-available information.
The
Goiás
project is exploratory, and Jupiter Gold intends to study the area or enter into a partnership for its study.
Lithium –
Salinas
The
Salinas project
consists of a mineral right for lithium, aquamarine, beryl, tourmaline, granite, and feldspar
in the Salinas district, where other companies have explored for these minerals.
The
Salinas
project is exploratory, and we intend to study the area or enter into a partnership for its study.
Gold – Serrita
The
Serrita project,
held by our subsidiary, Jupiter Gold, consists of three mineral rights for gold
in the Serrita district, a known gold district.
The
Serrita
project is exploratory, and Jupiter Gold intends to study the area or enter into a partnership for its study.
Gold – Amazonas
The
Amazonas project, held by our
subsidiary, Jupiter Gold, consists of three mineral rights for gold
in the Apui area, a known gold district.
The
Amazonas
project is exploratory, and Jupiter Gold intends to study the area or enter into a partnership for its study.
- 21 -
Results of Operations
Fiscal Year Ended December 31, 2017 Compared to Fiscal Year Ended December 31, 2016
In 2017, we had revenues of $43,253, as compared to revenues of $13,323 in 2016, an increase of 224.6%. The increase was primarily due to higher processing volumes, albeit mining was very limited because of capital equipment being serviced, which has since been resolved.
Our consolidated cost of goods sold in 2017 was $208,840, comprised primarily of labor and fuel expenses, as well as machine maintenance. Our consolidated cost of goods sold in 2016 was $218,245. The decrease of 4.3% between 2017 and 2016 for the consolidated cost of goods sold is explained by lower labor and fuel expenses despite higher machine maintenance expenses.
Our gross margin in 2017 was ($165,587). By comparison, our gross margin in 2016 was ($204,922). The decrease of 19.2% between 2017 and 2016 for the gross margin is explained by both higher revenues and lower cost of goods sold in 2017.
We had an aggregate of $1,129,717 in operating expense in 2017, as compared to an aggregate of $1,117,699 in operating expenses in 2016, an increase of $12,018 or 1.1%. This increase was mostly due to higher professional fees which more than offset declines in general and administrative expenses and compensation expenses.
In 2017, we had total other expenses of $508,103, as compared to $417,008 in total other expenses in 2016, an increase of $91,095 or 21.8%. This increase was mostly due to higher amortization of debt discounts and other fees, which more than offset lower interest on promissory notes and other expense.
In 2017, we experienced a net loss attributable to Brazil Minerals, Inc. of $1,691,433, as compared to a net loss attributable to Brazil Minerals, Inc. of $1,588,418 in 2016, an increase of $103,015 or 6.5%. On a per share basis (both basic and diluted), the 2017 net loss attributable to Brazil Minerals, Inc. was $0.02 versus $0.08 in 2016.
Net cash used in operating activities was $734,294 in 2017, as compared to $647,406 in 2016, an increase of $86,888 or 13.4%. Net cash used in investing activities was $37,985 in 2017, as compared to $45,883 in 2016, a decline of $7,898 or 17.2%. Net cash provided by financing activities was $852,655 in 2017, as compared to $581,277 in 2016, an increase of $271,378 or 46.7%.
Liquidity and Capital Resources
As of December 31, 2017, we had total current assets of $155,118 compared to total current liabilities of $1,610,227 for a current ratio of 0.10 to 1 and working capital of ($1,455,109). By comparison, on December 31, 2016, we had total current assets of $121,572 compared to current liabilities of $992,704 for a current ratio of 0.12 to 1 and working capital of ($871,132). In both 2017 and 2016, our principal sources of liquidity were issuances of equity and convertible debt.
We believe that financial resources and funds generated from revenues and securities sales will provide cash flow for operations. The Company has no plans for any significant cash acquisitions in 2018 or in the foreseeable future.
Off-Balance Sheet Arrangements
The Company currently has no off-balance sheet arrangements.
Critical Accounting Policies and Estimates
Our financial instruments consist of cash and cash equivalents, loans to a related party, accrued expenses, and an amount due to a director. The carrying amount of these financial instruments approximates fair value due either to length of maturity or interest rates that approximate prevailing market rates unless otherwise disclosed in our financial statements. If our estimate of the fair value is incorrect at December 31, 2017, it could negatively affect our financial position and liquidity and could result in our having understated our net loss.
Recent Accounting Pronouncements
Our consolidated financial statements are prepared in accordance with U.S. generally accepted accounting principles. Our significant accounting policies are described in Note 1 of the financial statements. We have reviewed all recent accounting pronouncements issued to the date of the issuance of these financial statements, and we do not believe any of these pronouncements will have a material impact on us.
- 22 -
Item 7A. Quantitative and Qualitative Disclosures About Market Risk.
The information to be reported under this Item is not required of smaller reporting companies.
Item 8. Financial Statements and Supplementary Data.
Our financial statements, including the notes thereto, together with the report from our independent registered public accounting firm are presented beginning at page F-1.
Item 9. Changes in and Disagreements with Accountants on Accounting and Financial Disclosure.
None
.
Item 9A. Controls and Procedures.
(a) Evaluation of Disclosure Controls and Procedures
The Company's management, with the participation of the Company's Principal Executive Officer and Principal Financial Officer, has evaluated the design, operation, and effectiveness of the Company's disclosure controls and procedures, as defined in Rules 13a-15(e) and 15d-15(e) of the Exchange Act as of December 31, 2017. On the basis of that evaluation, management concluded that the Company's disclosure controls and procedures are designed, and are effective, to provide reasonable assurance that the information required to be disclosed in reports filed or submitted pursuant to the Exchange Act is recorded, processed, summarized, and reported within the time periods specified in the rules and forms of the Commission, and that such information is accumulated and communicated to management, including its Principal Executive Officer and Principal Financial Officer as appropriate, to allow timely decisions regarding required disclosure.
(b) Management's Report on Internal Control Over Financial Reporting
Management is responsible for establishing and maintaining adequate internal control over financial reporting, as such term is defined in Exchange Act Rule 13a-15(f). The Company's internal control system is designed to provide reasonable assurance to management and to the Company's Board of Directors regarding the preparation and fair presentation of published financial statements. Under the supervision and with the participation of management, including the Company's Principal Executive Officer and Principal Financial Officer, management conducted an evaluation of the effectiveness of the Company's internal control over financial reporting based on the framework in
Internal Control—Integrated Framework
issued by the Committee of Sponsoring Organizations of the Treadway Commission. Based on management's evaluation under the framework in
Internal Control—Integrated Framework,
management concluded that the Company's internal control over financial reporting was effective as of December 31, 2017.
This Annual Report does not include an attestation report of the Company's registered public accounting firm regarding internal control over financial reporting. Since the Company is a non-accelerated filer, management's report is not subject to attestation by the Company's registered public accounting firm pursuant to Section 404(b) of the Sarbanes-Oxley Act of 2002. As a result, this Annual Report contains only management's report on internal controls.
(c)
Changes in Internal Control over Financial Reporting
There were no changes in the Company's internal control over financial reporting that occurred in the fourth quarter of 2017 that materially affected, or would be reasonably likely to materially affect, the Company's internal control over financial reporting.
- 23 -
(d)
Limitations of the Effectiveness of Internal Controls
The effectiveness of the Company's system of disclosure controls and procedures and internal control over financial reporting is subject to certain limitations, including the exercise of judgment in designing, implementing and evaluating the control system, the assumptions used in identifying the likelihood of future events, and the inability to eliminate fraud and misconduct completely. As a result, there can be no assurance that the Company's disclosure controls and procedures and internal control over financial reporting will detect all errors or fraud. However, the Company's control systems have been designed to provide reasonable assurance of achieving their objectives, and the Company's Principal Executive Officer and Principal Financial Officer have concluded that the Company's disclosure controls and procedures and internal control over financial reporting are effective at the reasonable
assurance level.
The Company has utilized the 1992
Committee of Sponsoring Organizations of the Treadway Commission's
internal control framework.
Item 9B. Other Information.
None.
PART III
Item 10. Directors, Executive Officers and Corporate Governance.
The following table sets forth certain information as of April 10, 2018 concerning our directors and executive officers:
|
Name
|
|
Age
|
|
Position
|
|
|
|
|
|
|
|
Marc Fogassa
|
|
51
|
|
Director, Chairman, Chief Executive Officer,
President, Chief Financial Officer, Treasurer and Secretary
|
|
|
|
|
|
|
|
Ambassador Robert F. Noriega
|
|
58
|
|
Director
|
|
|
|
|
|
|
Marc Fogassa, age 51, has been a director and our Chairman and Chief Executive Officer since 2012. He is also the Chairman and CEO of Jupiter Gold Corporation, one of our subsidiaries. He has over 16 years of investment experience in venture capital, and private and public equity investing, and has served on boards of directors of multiple private companies. Mr. Fogassa has been invited numerous times to speak about investment issues, particularly as related to Brazil. Mr. Fogassa double majored at the Massachusetts Institute of Technology (M.I.T.), graduating with two Bachelor of Science degrees in 1990. He later graduated from the Harvard Medical School with a Doctor of Medicine degree in 1995, and also from the Harvard Business School with a Master in Business Administration degree in 1999. Mr. Fogassa was born in Brazil and is fluent in Portuguese and English. We appointed Mr. Fogassa as a director and our Chairman of the Board and President because of his substantial management and fundraising skills, prior experience as a director of several private companies, venture capital and private equity experience, judgment and his knowledge of, and contacts in, Brazil.
Ambassador Roger Noriega, age 58, has been a director since 2012. He has extensive experience in Latin America. Ambassador Noriega was appointed by President George W. Bush and confirmed by the U.S. Congress as U.S. Assistant Secretary of State, and served from July 2003 to October 2005. In that capacity, Ambassador Noriega managed a 3,000-person team of professionals in Washington and in 50 diplomatic posts to design and implement political and economic strategies in Canada, Latin America, and the Caribbean. Prior to this assignment, Ambassador Noriega served as U.S. Ambassador to the Organization of American States ("OAS") from August 2001 to July 2003. Since February 2009 Ambassador Noriega has been the Managing Director of Vision Americas, a Latin America-focused consulting group that he founded. Ambassador Noriega has a Bachelor of Arts degree from Washburn University of Topeka, Kansas. We appointed Ambassador Noriega as a director because of his extensive experience in Latin America, business and government contacts, management skills and judgment.
Ambassador Paul Durand was our director from 2012 to November 24, 2017 when he resigned due to illness. Ambassador Durand unfortunately died a few weeks later.
- 24 -
Board Composition
Our Board of Directors is currently composed of two members, Marc Fogassa and Ambassador Roger Noriega.
There are no family relationships among our directors and executive officers. There is no arrangement or understanding between or among our executive officers and directors pursuant to which any director or officer was or is to be selected as a director or officer, and there is no arrangement, plan, or understanding as to whether non-management shareholders will exercise their voting rights to continue to elect the current board of directors.
Our directors and executive officers have not, during the past ten years:
| · |
had any bankruptcy petition filed by or against any business of which such person was a general partner or executive officer, either at the time of the bankruptcy or within two years prior to that time,
|
| · |
been convicted in a criminal proceeding and is not subject to a pending criminal proceeding,
|
| · |
been subject to any order, judgment, or decree, not subsequently reversed, suspended, or vacated, of any court of competent jurisdiction, permanently, or temporarily enjoining, barring, suspending, or otherwise limiting his involvement in any type of business, securities, futures, commodities, or banking activities; or
|
| · |
been found by a court of competent jurisdiction (in a civil action), the Securities Exchange Commission, or the Commodity Futures Trading Commission to have violated a federal or state securities or commodities law, and the judgment has not been reversed, suspended, or vacated
|
We do not have standing audit, nominating, or compensation committees. Currently, our entire Board of Directors is responsible for the functions that would otherwise be handled by these committees.
Code of Ethics
Our Board of Directors will adopt a new code of ethics that applies to all of our directors, officers, and employees, including our principal executive officer, principal financial officer, and principal accounting officer. The new code will address, among other things, honesty and ethical conduct, conflicts of interest, compliance with laws, regulations and policies, including disclosure requirements under the federal securities laws, confidentiality, trading on inside information, and reporting of violations of the code.
Audit Committee Financial Expert
Our Board of Directors currently acts as our audit committee. We do not currently have an independent member of our Board of Directors who qualifies as an "audit committee financial expert" as defined in Item 407(e)(5) of Regulation S-K.
Item 11. Executive Compensation.
The following table sets forth information concerning cash and non-cash compensation paid by us to our Chief Executive Officer for each of the two years ended December 31, 2016 and December 31, 2017. No other employee or independent contractor received compensation in excess of $100,000 for either of those two years.
- 25 -
Summary Compensation Table
|
Name and
Principal
Position
|
Year
Ended
|
|
Salary
($)
|
|
|
|
Bonus
($)
|
|
|
Stock
Awards
($)
|
|
|
|
Option
Awards
|
|
|
|
|
Non-Equity
Incentive
Plan
Compensation
($)
|
|
|
Non-Qualified
Deferred
Compensation
Earnings
($)
|
|
|
All
Other
Compensation
($)
|
|
|
Total
($)
|
|
|||||||||||||
|
Marc Fogassa,
as CEO of
|
12/31/2016
|
|
25,000
|
|
|
|
-
|
|
|
-
|
|
|
-
|
|
|
|
|
-
|
|
|
|
-
|
|
|
|
-
|
|
|
|
25,000
|
|
|||||||||||
| Brazil Minerals |
12/31/2017
|
|
14,000
|
|
|
|
-
|
|
|
-
|
|
|
-
|
|
|
|
|
-
|
|
|
|
-
|
|
|
|
-
|
|
|
|
14,000
|
||||||||||||
Employment Agreement with Marc Fogassa
Marc Fogassa was hired by the Company as the Company's Chief Executive Officer, Chairman, Chief Financial Officer, Treasurer and Secretary under an Employment Agreement dated December 31, 2012 (the "Agreement"). Under the Agreement, Mr. Fogassa is entitled to receive a salary of $175,000 per annum; however, he has been paid less due to capital availability constraints. Mr. Fogassa is entitled to reimbursement of expenses incurred by him in the performance of his duties, a maximum allowable SEP IRA contribution, four weeks of paid vacation time, and the payment by the Company of certain insurance-related expenses. The agreement further provides that the Company shall pay to Mr. Fogassa severance in case of termination or change in control with demotion.
Director Compensation
The following table sets forth a summary of compensation for the fiscal year ended December 31, 2017 that we paid to each director other than its Chief Executive Officer, whose compensation is fully reflected in the Summary Compensation Table. We do not sponsor a pension benefits plan, a non-qualified deferred compensation plan, or a non-equity incentive plan for directors; therefore, these columns have been omitted from the following table. No other or additional compensation for services were paid to any of the directors.
Director Compensation Table
|
Name
|
Fees
Earned
or Paid
in Cash
($)
|
Option
Awards
($) (1)
|
Stock
Awards
($)
|
Total
($)
|
|||||||||
|
Roger Noriega
|
-
|
$
|
50,000
|
$
|
50,000
|
||||||||
| (1) |
The amounts in this column reflect the aggregate grant date fair value of stock options granted in 2017 to each director calculated in accordance with FASB ASC Topic 718. See the notes to our consolidated financial statements included in this Annual Report on Form 10-K for the year ended December 31, 2017 for a discussion of all assumptions made in the calculation of this amount.
|
Item 12. Security Ownership of Certain Beneficial Owners and Management and Related Stockholder Matters.
The following table sets forth information regarding beneficial ownership of our Common Stock and Series A Preferred Stock as of April 9, 2018 by (i) any person or group with more than 5% of any class of voting securities, (ii) each director, (iii) our chief executive officer and each other executive officer whose cash compensation for the most recent fiscal year exceeded $100,000 and (iv) all executive officers and directors as a group. Except as indicated in the footnotes to this table and subject to applicable community property laws, the persons named in the table to our knowledge have sole voting and investment power with respect to all shares of securities shown as beneficially owned by them. The Certificate of Designations, Preferences and Rights of our Series A Convertible Preferred provides that for so long as Series A Preferred Stock is issued and outstanding, the holders of Series A Preferred Stock shall vote together as a single class with the holders of our Common Stock, with the holders of Series A Preferred Stock being entitled to 51% of the total votes on all matters regardless of the actual number of shares of Series A Preferred Stock then outstanding, and the holders of Common Stock being entitled to their proportional share of the remaining 49% of the total votes based on their respective voting power.
- 26 -
|
|
|
|
|
|
|
Percentage of Voting Power
|
|
|||||||
|
|
|
|
|
Shares Beneficially
|
|
|
|
|
|
of all Outstanding Classes
|
|
|||
|
Name and Address (1)
|
|
Office
|
|
Owned (2)
|
|
|
Percent of Class (3)
|
|
|
of Company Stock (4)
|
|
|||
|
|
|
|
|
|
|
|
|
|
|
|
||||
|
Common Stock
|
|
|
|
|
|
|
|
|
|
|
|
|
|
|
|
|
|
|
|
|
|
|
|
|
|
|
|
|
|
|
|
Marc Fogassa
|
|
Director, Chairman, Chief Executive Officer, Chief Financial Officer, Secretary and Treasurer
|
|
|
114,063,961
|
(5)
|
|
|
44.5%
|
|
|
|
21.8%
|
|
|
|
|
|
|
|
|
|
|
|
|
|
|
|
|
|
|
Ambassador Roger Noriega
|
|
Director
|
|
|
13,369,897
|
(7)
|
|
|
7.3%
|
|
|
3.6% |
|
|
|
|
|
|
|
|
|
|
|
|
|
|
|
|
|
|
|
All executive officers and directors as a group (2 people)
|
|
|
|
|
127,433,858
|
(5)(6)(7)
|
|
|
47.2%
|
|
|
|
23.1%
|
|
|
Lancaster Brazil Fund L.P.
|
|
|
|
|
25,000,000
|
(8) |
|
|
14.7%
|
|
|
|
7.2%
|
|
|
Benjamin Khowong
|
|
|
|
|
9,636,364
|
|
|
5.7%
|
|
|
|
2.8%
|
||
|
Series A Stock
|
|
|
|
|
|
|
|
|
|
|
|
|
|
|
|
Marc Fogassa
|
|
Director
|
|
|
1
|
|
|
|
100%
|
|
|
|
51.0%
|
|
|
|
|
|
|
|
|
|
|
|
|
|
|
|
|
|
|
All executive officers and directors as a group (2 people)
|
|
|
|
|
1
|
|
|
|
100%
|
|
|
|
51.0%
|
|
———————
(1) The mailing address of each of the officers and directors set forth below is in care of Brazil Minerals, Inc., Rua Vereador João Alves Praes nº 95-A, Olhos D'Agua, MG 39.398-000, Brazil.
(2) Beneficial ownership is determined in accordance with rules promulgated by the SEC.
(3) Based on
170,228,912
shares of common stock outstanding and computations in accordance with rules promulgated by the Commission.
(4) The holders of our Series A Stock vote together as a single class with the holders of our Common Stock, with the holders of Series A Stock being entitled to 51% of the total votes on all matters regardless of the actual number of shares of Series A Stock then outstanding, and the holders of Common Stock being entitled to their proportional share of the remaining 49% of the total votes based on their respective voting power. Based on their beneficial ownership of shares of Series A Stock and Common Stock as of February 7, 2018, each person set forth in the table had the approximate percentage of the voting power of the common and preferred stock voting together as a single class as of such date set forth opposite their name.
(5) Includes 86,185,680 shares of our common stock which are obtainable through conversion of notes for unpaid wages and other contractual obligations, 195,336 shares of common stock owned by a company controlled by Marc Fogassa, and 25,000,000 shares of common stock owned by Lancaster Brazil Fund L.P.
(7) Includes 13,367,539 options to purchase shares of our common stock at prices ranging from $0.0037 to $290 per share, with expiration dates ranging from April 23, 2018 to March 31, 2023.
(8) Entity managed by a company which is an affiliate of Marc Fogassa.
- 27 -
Director Independence
We believe that Ambassador Roger Noriega is "independent" as such term is defined with respect to directors by the NASDAQ Stock Market Rules.
Item 14. Principal Accounting Fees and Services.
Audit Fees
On December 31, 2016, the Company engaged BF Borgers CPA PC ("Borgers") as the Company's independent registered public accounting firm for the audit of the Company's financial statements as of December 31, 2016. Borgers was also retained as the Company's independent registered public accounting firm for the audit of the Company's financial statements as of December 31, 2017. The fee that was billed by Borgers for the audit of our financial statements as of December 31, 2016 and for quarterly reviews during such year was $46,170. The Company expects that the total fees payable to Borgers for the audit of the Company's financial statements as of December 31, 2017 will be $31,860.
Audit-Related Fees
During 2016 or 2017 there were no fees paid to Borgers in connection with our compliance with Section 404 of the Sarbanes-Oxley Act of 2002.
No other fees were billed by Borgers for the last two years that were reasonably related to the performance of the audit or review of our financial statements and not reported under "Audit Fees" above.
Tax Fees
There were no fees billed by Borgers during the last two fiscal years for professional services rendered for tax compliance, tax advice, or tax planning. Accordingly, none of such services were approved pursuant to pre-approval procedures or permitted waivers thereof.
All Other Fees
There were no other non-audit-related fees billed to us by Borgers in 2016 or 2017.
Pre-Approval Policies and Procedures
Engagement of accounting services by us is not made pursuant to any pre-approval policies and procedures. Rather, we believe that our accounting firm is independent because all of its engagements by us are approved by our Board of Directors prior to any such engagement.
Our Board of Directors will meet periodically to review and approve the scope of the services to be provided to us by its independent registered public accounting firm, as well as to review and discuss any issues that may arise during an engagement. The Board is responsible for the prior approval of every engagement of our independent registered public accounting firm to perform audit and permissible non-audit services for us, such as quarterly financial reviews, tax matters, and consultation on new accounting and disclosure standards.
Before the auditors are engaged to provide those services, our Chief Financial Officer and Controller will make a recommendation to the Board of Directors regarding each of the services to be performed, including the fees to be charged for such services. At the request of the Board of Directors, the independent registered public accounting firm and/or management shall periodically report to the Board of Directors regarding the extent of services being provided by the independent registered public accounting firm, and the fees for the services performed to date.
- 28 -
PART IV
Item 15. Exhibits, Financial Statement Schedules
|
(a)
|
Documents filed as part of this report.
|
|
|
|
|
|
|
|
(i)
|
Financial Statements - see Item 8. Financial Statements and Supplementary Data
|
|
|
|
|
|
|
(ii)
|
Financial Statement Schedules – None
|
|
|
|
|
|
|
|
(Financial statement schedules have been omitted either because they are not applicable, not required, or the information required to be set forth therein is included in the financial statements or notes thereto.)
|
|
|
|
|
|
|
(iii)
|
Report of Independent Registered Public Accounting Firm.
|
|
|
|
|
|
|
(iv)
|
Notes to Financial Statements.
|
|
|
|
|
|
(b)
|
Exhibits
|
|
|
|
|
|
|
|
The exhibits listed on the accompanying Exhibit Index are filed as part of this Annual Report.
|
|
Item 16. Form 10-K Summary
None
- 29 -
BRAZIL MINERALS, INC.
TABLE OF CONTENTS
DECEMBER 31, 2017
|
Report of Independent Registered Public Accounting Firm
|
F-1
|
|
|
|
|
Consolidated Balance Sheets as of December 31, 2017 and 2016
|
F-2
|
|
|
|
|
Consolidated Statements of Operations for the Year Ended December 31, 2017
|
|
|
and December 31, 2016
|
F-3
|
|
|
|
|
Consolidated Statement of Stockholders' Equity
|
F-4
|
|
|
|
|
Consolidated Statements of Cash Flows for the Year
|
|
|
Ended December 31, 2017 and December 31, 2016
|
F-5
|
|
|
|
|
Notes to the Consolidated Financial Statements
|
F-6 - F-17
|
- 30 -
Report of Independent Registered Public Accounting Firm
To the shareholders and the board of directors of Brazil Minerals, Inc.
Opinion on the Financial Statements
We have audited the accompanying balance sheets of
Brazil Minerals, Inc.
(the "Company") as of December 31, 2017 and 2016, the related statements of operations, stockholders' equity (deficit), and cash flows for the years then ended, and the related notes (collectively referred to as the "financial statements"). In our opinion, the financial statements present fairly, in all material respects, the financial position of the Company as of December 31, 2017 and 2016, and the results of its operations and its cash flows for the years then ended, in conformity with accounting principles generally accepted
in the United States.
Basis for Opinion
These financial statements are the responsibility of the Company's management. Our responsibility is to express an opinion on the Company's financial statements based on our audit. We are a public accounting firm registered with the Public Company Accounting Oversight Board (United States) ("PCAOB") and are required to be independent with respect to the Company in accordance with the U.S. federal securities laws and the applicable rules and regulations of the Securities and Exchange Commission and the PCAOB.
We conducted our audit in accordance with the standards of the PCAOB. Those standards require that we plan and perform the audit to obtain reasonable assurance about whether the financial statements are free of material misstatement, whether due to error or fraud.
Our audit included performing procedures to assess the risks of material misstatement of the financial statements, whether due to error or fraud, and performing procedures that respond to those risks. Such procedures included examining, on a test basis, evidence regarding the amounts and disclosures in the financial statements. Our audit also included evaluating the accounting principles used and significant estimates made by management, as well as evaluating the overall presentation of the financial statements. We believe that our audit provides a reasonable basis for our opinion.
Substantial Doubt about the Company's Ability to Continue as a Going Concern
The accompanying financial statements have been prepared assuming that the Company will continue as a going concern. As discussed in Note 1 to the financial statements, the Company's significant operating losses raise substantial doubt about its ability to continue as a going concern. The financial statements do not include any adjustments that might result from the outcome of this uncertainty.
/s/ BF Borgers CPA PC
BF Borgers CPA PC
We have served as the Company's auditor since 2015.
Lakewood, CO
April 17, 2018
F-1
BRAZIL MINERALS, INC.
CONSOLIDATED BALANCE SHEETS
AS OF DECEMBER 31, 2017 AND 2016
|
December 31,
|
December 31,
|
|||||||
|
2017
|
2016
|
|||||||
|
ASSETS
|
||||||||
|
Current assets:
|
||||||||
|
Cash and cash equivalents
|
$
|
84,107
|
$
|
7,139
|
||||
|
Taxes recoverable
|
27,846
|
28,264
|
||||||
|
Prepaid expenses
|
-
|
7,258
|
||||||
|
Inventory
|
38,875
|
78,911
|
||||||
|
Deposits and advances
|
4,290
|
-
|
||||||
|
Total current assets
|
155,118
|
121,572
|
||||||
|
Capital assets:
|
||||||||
|
Property and equipment, net
|
365,472
|
421,927
|
||||||
|
Other assets:
|
||||||||
|
Intangible assets, net
|
620,805
|
630,089
|
||||||
|
Investments held available for sale
|
150,000
|
-
|
||||||
|
Total assets
|
$
|
1,291,395
|
$
|
1,173,588
|
||||
|
LIABILITIES AND STOCKHOLDERS' DEFICIT
|
||||||||
|
Current liabilities:
|
||||||||
|
Accounts payable and accrued expenses
|
$
|
407,650
|
$
|
333,415
|
||||
|
Convertible notes payable, net of debt discounts totaling $219,608 and $137,113, respectively
|
665,394
|
349,030
|
||||||
|
Related party payable
|
537,183
|
310,259
|
||||||
|
Total current liabilities
|
1,610,227
|
992,704
|
||||||
|
Long term liabilities:
|
||||||||
|
Convertible notes payable -- noncurrent, net of debt discounts
|
-
|
-
|
||||||
|
Other noncurrent liabilities
|
200,815
|
191,391
|
||||||
|
Total liabilities
|
1,811,042
|
1,184,095
|
||||||
|
Stockholders' deficit:
|
||||||||
|
Series A preferred stock, $0.001 par value. 10,000,000 shares authorized; 1 share issued and outstanding
|
1
|
1
|
||||||
|
Common stock, $0.001 par value. 250,000,000 shares authorized; 121,274,424 and 64,752,286 shares
|
||||||||
|
issued and outstanding as of December 31, 2017 and 2016, respectively
|
121,274
|
64,752
|
||||||
|
Additional paid-in capital
|
45,788,819
|
44,690,704
|
||||||
|
Accumulated other comprehensive loss
|
(524,819
|
)
|
(489,516
|
)
|
||||
|
Stock purchase warrants
|
218,656
|
218,656
|
||||||
|
Accumulated deficit
|
(47,515,131
|
)
|
(45,823,698
|
)
|
||||
|
Total Brazil Minerals, Inc. stockholders' deficit
|
(1,911,200
|
)
|
(1,339,101
|
)
|
||||
|
Non-controlling interest
|
1,391,553
|
1,328,594
|
||||||
|
Total stockholders' deficit
|
(519,647
|
)
|
(10,507
|
)
|
||||
|
Total liabilities and stockholders' deficit
|
$
|
1,291,395
|
$
|
1,173,588
|
||||
The accompanying notes are an integral part of these consolidated financial statements.
F-2
BRAZIL MINERALS, INC.
CONSOLIDATED STATEMENTS OF OPERATIONS AND COMPREHENSIVE LOSS
FOR THE YEARS ENDED DECEMBER 31, 2017 AND 2016
|
Year Ended December 31,
|
Year Ended December 31,
|
|||||||
|
2017
|
2016
|
|||||||
|
Revenue
|
$
|
43,253
|
$
|
13,323
|
||||
|
Cost of revenue
|
208,840
|
218,245
|
||||||
|
Gross margin
|
(165,587
|
)
|
(204,922
|
)
|
||||
|
Operating expenses:
|
||||||||
|
Professional fees
|
155,150
|
106,517
|
||||||
|
General and administrative
|
345,371
|
371,787
|
||||||
|
Compensation and related costs
|
265,753
|
279,825
|
||||||
|
Stock based compensation
|
450,943
|
359,570
|
||||||
|
Total operating expenses
|
1,217,217
|
1,117,699
|
||||||
|
Loss from operations
|
(1,382,804
|
)
|
(1,322,621
|
)
|
||||
|
Other expense (income):
|
||||||||
|
(Gain) loss on derivative liabilities
|
-
|
(281,345
|
)
|
|||||
|
Interest on promissory notes
|
111,504
|
234,288
|
||||||
|
Amortization of debt discounts and other fees
|
395,060
|
237,773
|
||||||
|
Other expense (income)
|
1,539
|
226,292
|
||||||
|
Total other expense (income)
|
508,103
|
417,008
|
||||||
|
Loss before provision for income taxes
|
(1,890,907
|
)
|
(1,739,629
|
)
|
||||
|
Provision for income taxes
|
-
|
-
|
||||||
|
Net loss
|
(1,890,907
|
)
|
(1,739,629
|
)
|
||||
|
Loss attributable to non-controlling interest
|
(199,474
|
)
|
(151,211
|
)
|
||||
|
Net loss attributable to Brazil Minerals, Inc. stockholders
|
$
|
(1,691,433
|
)
|
$
|
(1,588,418
|
)
|
||
|
Basic and diluted loss per share
|
||||||||
|
Net loss per share attributable to Brazil Minerals, Inc. common stockholders
|
$
|
(0.02
|
)
|
$
|
(0.08
|
)
|
||
|
Weighted-average number of common shares outstanding:
|
||||||||
|
Basic and diluted
|
76,700,560
|
19,351,894
|
||||||
|
Comprehensive loss:
|
||||||||
|
Net loss
|
$
|
(1,890,907
|
)
|
$
|
(1,739,629
|
)
|
||
|
Foreign curreny translation adjustment
|
(35,303
|
)
|
-
|
|||||
|
Comprehensive loss
|
(1,926,210
|
)
|
(1,739,629
|
)
|
||||
|
Comprehensive loss attributable to noncontrolling interests
|
(199,474
|
)
|
(151,211
|
)
|
||||
|
Comprehensive loss attributable to Brazil Minerals, Inc. stockholders
|
$
|
(1,726,736
|
)
|
$
|
(1,588,418
|
)
|
||
The accompanying notes are an integral part of these consolidated financial statements.
F-3
BRAZIL MINERALS, INC.
CONSOLIDATED STATEMENTS OF STOCKHOLDERS' EQUITY (DEFICIT)
FOR THE YEARS ENDED DECEMBER 31, 2017 AND 2016
|
|
|
|
|
|||||||||||||||||||||||||||||||||||||||||||||||||||||
|
Series A
Preferred
Stock
|
Series B
Preferred
Stock
|
Series C
Preferred
Stock
|
Common
Stock
|
Additional
Paid-in
|
Accumulated
Other
Comprehensive
|
Common
Stock Purchase
|
Accumulated
|
Noncontrolling
|
Total
Stockholders'
Equity
|
|||||||||||||||||||||||||||||||||||||||||||||||
|
Shares
|
Value
|
Shares
|
Value
|
Shares
|
Value
|
Shares
|
Value
|
Capital
|
Loss
|
Warrants
|
Deficit
|
Interests
|
(Deficit)
|
|||||||||||||||||||||||||||||||||||||||||||
|
Balance, December 31, 2015
|
1
|
$
|
1
|
1,047
|
$
|
1,560,433
|
200,000
|
$
|
250,000
|
12,438,783
|
12,439
|
$
|
42,353,642
|
$
|
(678,830
|
)
|
$
|
218,656
|
$
|
(44,235,280
|
)
|
$
|
131,054
|
$
|
(387,885
|
)
|
||||||||||||||||||||||||||||||
|
Issuance of Series B preferred stock in connection with sales made
|
||||||||||||||||||||||||||||||||||||||||||||||||||||||||
|
under private offerings
|
-
|
-
|
35
|
55,500
|
-
|
-
|
-
|
-
|
-
|
-
|
-
|
-
|
-
|
55,500
|
||||||||||||||||||||||||||||||||||||||||||
|
Conversion of Series B preferred stock into shares of
|
||||||||||||||||||||||||||||||||||||||||||||||||||||||||
|
common stock and Jupiter Gold common stock
|
-
|
-
|
(1,082
|
)
|
(1,698,283
|
)
|
-
|
-
|
20,610,000
|
20,610
|
888,363
|
-
|
-
|
-
|
890,346
|
101,036
|
||||||||||||||||||||||||||||||||||||||||
|
Accrual of Series B preferred stock dividend(s)
|
-
|
-
|
-
|
82,350
|
-
|
-
|
-
|
-
|
(82,350
|
)
|
-
|
-
|
-
|
-
|
-
|
|||||||||||||||||||||||||||||||||||||||||
|
Conversion of Series C preferred stock into shares of
|
||||||||||||||||||||||||||||||||||||||||||||||||||||||||
|
Jupiter Gold common stock
|
-
|
-
|
-
|
-
|
(200,000
|
)
|
(250,000
|
)
|
-
|
-
|
-
|
-
|
-
|
-
|
125,000
|
(125,000
|
)
|
|||||||||||||||||||||||||||||||||||||||
|
Issuance of common stock in connection with sales made
|
||||||||||||||||||||||||||||||||||||||||||||||||||||||||
|
under private offerings
|
-
|
-
|
-
|
-
|
-
|
-
|
17,687,503
|
17,687
|
241,013
|
-
|
-
|
-
|
-
|
258,700
|
||||||||||||||||||||||||||||||||||||||||||
|
Conversion of convertible debenture(s) and other indebtedness
|
||||||||||||||||||||||||||||||||||||||||||||||||||||||||
|
into common stock and Jupiter Gold common stock
|
-
|
-
|
-
|
-
|
-
|
-
|
11,912,849
|
11,913
|
575,116
|
-
|
-
|
-
|
229,425
|
816,454
|
||||||||||||||||||||||||||||||||||||||||||
|
Issuance of common stock in exchange for consulting, professional
|
||||||||||||||||||||||||||||||||||||||||||||||||||||||||
|
and other services
|
-
|
-
|
-
|
-
|
-
|
-
|
160,000
|
160
|
7,840
|
-
|
-
|
-
|
-
|
8,000
|
||||||||||||||||||||||||||||||||||||||||||
|
Issuance of common stock to related parties in lieu of cash for
|
||||||||||||||||||||||||||||||||||||||||||||||||||||||||
|
loans payable and other accrued obligations
|
-
|
-
|
-
|
-
|
-
|
-
|
1,842,467
|
1,842
|
90,281
|
-
|
-
|
-
|
45,980
|
138,103
|
||||||||||||||||||||||||||||||||||||||||||
|
Recognition of beneficial conversion features related to
|
||||||||||||||||||||||||||||||||||||||||||||||||||||||||
|
convertible debentures
|
-
|
-
|
-
|
-
|
-
|
-
|
-
|
-
|
240,352
|
-
|
-
|
-
|
-
|
240,352
|
||||||||||||||||||||||||||||||||||||||||||
|
Stock based compensation
|
-
|
-
|
-
|
-
|
-
|
-
|
100,684
|
101
|
359,469
|
-
|
-
|
-
|
-
|
359,570
|
||||||||||||||||||||||||||||||||||||||||||
|
Contribution of capital assets from related party
|
-
|
-
|
-
|
-
|
-
|
-
|
-
|
-
|
16,978
|
-
|
-
|
-
|
-
|
16,978
|
||||||||||||||||||||||||||||||||||||||||||
|
Change in foreign currency translation
|
-
|
-
|
-
|
-
|
-
|
-
|
-
|
-
|
-
|
189,314
|
-
|
-
|
-
|
189,314
|
||||||||||||||||||||||||||||||||||||||||||
|
Issuance of Jupiter Gold common stock in connection with sales
|
||||||||||||||||||||||||||||||||||||||||||||||||||||||||
|
made under private offerings
|
-
|
-
|
-
|
-
|
-
|
-
|
-
|
-
|
-
|
-
|
-
|
-
|
58,000
|
58,000
|
||||||||||||||||||||||||||||||||||||||||||
|
Change in noncontrolling interest(s)
|
-
|
-
|
-
|
-
|
-
|
-
|
-
|
-
|
-
|
-
|
-
|
-
|
-
|
-
|
||||||||||||||||||||||||||||||||||||||||||
|
Net income (loss)
|
-
|
-
|
-
|
-
|
-
|
-
|
-
|
-
|
-
|
-
|
-
|
(1,588,418
|
)
|
(151,211
|
)
|
(1,739,629
|
)
|
|||||||||||||||||||||||||||||||||||||||
|
Balance, December 31, 2016
|
1
|
$
|
1
|
-
|
$
|
-
|
-
|
$
|
-
|
64,752,286
|
$
|
64,752
|
$
|
44,690,704
|
$
|
(489,516
|
)
|
$
|
218,656
|
$
|
(45,823,698
|
)
|
$
|
1,328,594
|
$
|
(10,507
|
)
|
|||||||||||||||||||||||||||||
|
Issuance of common stock in connection with sales made
|
||||||||||||||||||||||||||||||||||||||||||||||||||||||||
|
under private offerings
|
-
|
-
|
-
|
-
|
-
|
-
|
1,800,000
|
1,800
|
20,034
|
-
|
-
|
-
|
-
|
21,834
|
||||||||||||||||||||||||||||||||||||||||||
|
Conversion of convertible debenture(s) and other indebtedness
|
||||||||||||||||||||||||||||||||||||||||||||||||||||||||
|
into common stock
|
-
|
-
|
-
|
-
|
-
|
-
|
29,722,138
|
29,722
|
54,866
|
-
|
-
|
-
|
-
|
84,588
|
||||||||||||||||||||||||||||||||||||||||||
|
Issuance of common stock in exchange for consulting, professional
|
||||||||||||||||||||||||||||||||||||||||||||||||||||||||
|
and other services
|
-
|
-
|
-
|
-
|
-
|
-
|
-
|
-
|
-
|
-
|
-
|
-
|
3,167
|
3,167
|
||||||||||||||||||||||||||||||||||||||||||
|
Issuance of common stock in connection with share exchange
|
||||||||||||||||||||||||||||||||||||||||||||||||||||||||
|
agreement with related party
|
-
|
-
|
-
|
-
|
-
|
-
|
25,000,000
|
25,000
|
125,000
|
-
|
-
|
-
|
-
|
150,000
|
||||||||||||||||||||||||||||||||||||||||||
|
Issuance of common stock to related parties in lieu of cash for
|
||||||||||||||||||||||||||||||||||||||||||||||||||||||||
|
loans payable and other accrued obligations
|
-
|
-
|
-
|
-
|
-
|
-
|
-
|
-
|
-
|
-
|
-
|
-
|
-
|
-
|
||||||||||||||||||||||||||||||||||||||||||
|
Recognition of beneficial conversion features related to
|
||||||||||||||||||||||||||||||||||||||||||||||||||||||||
|
convertible debentures
|
-
|
-
|
-
|
-
|
-
|
-
|
-
|
-
|
447,272
|
-
|
-
|
-
|
-
|
447,272
|
||||||||||||||||||||||||||||||||||||||||||
|
Stock based compensation
|
-
|
-
|
-
|
-
|
-
|
-
|
-
|
-
|
450,943
|
-
|
-
|
-
|
-
|
450,943
|
||||||||||||||||||||||||||||||||||||||||||
|
Change in foreign currency translation
|
-
|
-
|
-
|
-
|
-
|
-
|
-
|
-
|
-
|
(35,303
|
)
|
-
|
-
|
-
|
(35,303
|
)
|
||||||||||||||||||||||||||||||||||||||||
|
Issuance of Jupiter Gold common stock in connection with sales
|
||||||||||||||||||||||||||||||||||||||||||||||||||||||||
|
made under private offerings
|
-
|
-
|
-
|
-
|
-
|
-
|
-
|
-
|
-
|
-
|
-
|
-
|
259,266
|
259,266
|
||||||||||||||||||||||||||||||||||||||||||
|
Change in noncontrolling interest(s)
|
-
|
-
|
-
|
-
|
-
|
-
|
-
|
-
|
-
|
-
|
-
|
-
|
-
|
-
|
||||||||||||||||||||||||||||||||||||||||||
|
Net income (loss)
|
-
|
-
|
-
|
-
|
-
|
-
|
-
|
-
|
-
|
-
|
-
|
(1,691,433
|
)
|
(199,474
|
)
|
(1,890,907
|
)
|
|||||||||||||||||||||||||||||||||||||||
|
Balance, December 31, 2017
|
1
|
$
|
1
|
-
|
$
|
-
|
-
|
$
|
-
|
121,274,424
|
$
|
121,274
|
$
|
45,788,819
|
$
|
(524,819
|
)
|
$
|
218,656
|
$
|
(47,515,131
|
)
|
$
|
1,391,553
|
(519,647
|
)
|
||||||||||||||||||||||||||||||
The accompanying notes are an integral part of these consolidated financial statements.
F-4
BRAZIL MINERALS, INC.
CONSOLIDATED STATEMENTS OF CASH FLOWS
FOR THE YEARS ENDED DECEMBER 31, 2017 AND 2016
|
Year Ended December 31,
|
Year Ended December 31,
|
|||||||
|
2017
|
2016
|
|||||||
|
Cash flows from operating activities of continuing operations:
|
||||||||
|
Net loss
|
$
|
(1,890,907
|
)
|
$
|
(1,739,629
|
)
|
||
|
Adjustments to reconcile net loss to cash used in operating activities:
|
||||||||
|
Stock based compensation and services
|
454,110
|
367,570
|
||||||
|
Unrealized (gain) loss from change in derivative liabilities
|
-
|
(281,345
|
)
|
|||||
|
Amortization of debt discounts
|
395,060
|
237,773
|
||||||
|
Amortization of deferred financing costs
|
-
|
2,542
|
||||||
|
Excess fair market value of common stock issued in satisfaction of related party liabilities
|
-
|
37,584
|
||||||
|
Gain on exchange of preferred shares for common stock to noncontrolling interests of subsidiary company
|
-
|
(2,964
|
)
|
|||||
|
Loss on extinguishment of debt
|
-
|
229,426
|
||||||
|
Depreciation and amortization
|
90,040
|
87,005
|
||||||
|
Provision for doubtful accounts
|
-
|
1,339
|
||||||
|
Provision for excess or obsolete inventory
|
-
|
73,837
|
||||||
|
Changes in operating assets and liabilities:
|
||||||||
|
Accounts receivable
|
-
|
1,896
|
||||||
|
Taxes recoverable
|
-
|
(20,781
|
)
|
|||||
|
Inventory
|
40,281
|
14,958
|
||||||
|
Deposits and advances
|
(4,445
|
)
|
-
|
|||||
|
Accounts payable and accrued expenses
|
81,371
|
140,300
|
||||||
|
Accrued salary due to officer
|
87,500
|
230,143
|
||||||
|
Other noncurrent liabilities
|
12,696
|
(27,060
|
)
|
|||||
|
Net cash provided by (used in) operating activities
|
(734,294
|
)
|
(647,406
|
)
|
||||
|
Cash flows from investing activities:
|
||||||||
|
Acquisition of capital assets
|
(37,985
|
)
|
(17,467
|
)
|
||||
|
Increase in intangible assets
|
-
|
(28,416
|
)
|
|||||
|
Net cash provided by (used in) investing activities
|
(37,985
|
)
|
(45,883
|
)
|
||||
|
Cash flows from financing activities:
|
||||||||
|
Loan from officer
|
116,971
|
(33,067
|
)
|
|||||
|
Net proceeds from sale of common stock
|
21,834
|
258,700
|
||||||
|
Proceeds from sale of preferred stock
|
-
|
55,500
|
||||||
|
Proceeds from sale of subsidiary common stock to noncontrolling interests
|
259,266
|
58,000
|
||||||
|
Proceeds from convertible notes payable
|
454,584
|
242,144
|
||||||
|
Proceeds from loans payable
|
79,000
|
-
|
||||||
|
Repayment of loans payable
|
(79,000
|
)
|
-
|
|||||
|
Net cash provided by (used in) financing activities
|
852,655
|
581,277
|
||||||
|
Effect of exchange rates on cash and cash equivalents
|
(2,537
|
)
|
54,794
|
|||||
|
Net increase (decrease) in cash and cash equivalents
|
77,839
|
(57,218
|
)
|
|||||
|
Cash and cash equivalents at beginning of period
|
6,268
|
64,357
|
||||||
|
Cash and cash equivalents at end of period
|
$
|
84,107
|
$
|
7,139
|
||||
|
Supplemental disclosure of cash flow information:
|
||||||||
|
Cash paid for interest
|
$
|
-
|
$
|
-
|
||||
|
Cash paid for income taxes
|
$
|
-
|
$
|
-
|
||||
|
Supplemental disclosure of non-cash investing and financing activities:
|
||||||||
|
Acquisition of capital assets with taxes receivable
|
$
|
-
|
$
|
50,496
|
||||
|
Shares issued in connection with share exchange agreement with related party
|
$
|
150,000
|
$
|
-
|
||||
|
Shares issued in connection with conversion of debt and accrued interest
|
$
|
84,588
|
$
|
350,779
|
||||
|
Conversion of notes payable and accrued interest into subsidiary common stock
|
$
|
-
|
$
|
236,250
|
||||
|
Conversion of Series B preferred stock into common stock
|
$
|
-
|
$
|
908,972
|
||||
|
Conversion of Series B preferred stock into common stock of subsidiary company
|
$
|
-
|
$
|
789,311
|
||||
|
Deferred financing costs accrued in relation to the issuance of debt
|
$
|
-
|
$
|
9,800
|
||||
|
Discount for beneficial conversion features on convertible notes
|
$
|
447,273
|
$
|
241,852
|
||||
|
Dividends payable to Series B preferred shareholders
|
$
|
-
|
$
|
82,350
|
||||
The accompanying notes are an integral part of these consolidated financial statements.
F-5
BRAZIL MINERALS, INC.
NOTES TO THE CONSOLIDATED FINANCIAL STATEMENTS
NOTE 1 – ORGANIZATION, BUSINESS AND SUMMARY OF SIGNIFICANT ACCOUNTING POLICIES
Organization and Description of Business
Brazil Minerals, Inc. ("Brazil Minerals" or the "Company") was incorporated as Flux Technologies, Corp. under the laws of the State of Nevada, U.S. on December 15, 2011. The Company changed its management and business on December 18, 2012, to focus on mineral exploration. Brazil Minerals, through subsidiaries, owns mineral rights in Brazil for gold, diamonds, cobalt, copper, lithium, manganese, nickel, precious gems (aquamarine, beryl, tourmaline) and sand, among others. In one of these rights, a mining concession, the Company currently mines diamonds, gold, and sand.
On July 27, 2016,
upon approval by its Board of Directors, the Company sold a 99.99% equity interest in
Mineração Jupiter Ltda
to Jupiter Gold Corporation ("Jupiter Gold"), a newly created company, in exchange for 4,000,000 shares of the common stock of Jupiter Gold.
On December 16, 2016, the Securities and Exchange Commission ("SEC") declared effective a Registration Statement filed by Jupiter Gold for the sale of shares in a public offering in the U.S. As of December 31, 2017, the Company has ownership of approximately 55.4% of the equity of Jupiter Gold. As such, the accounts and results of Jupiter Gold, and its subsidiary MJL, have been included in the Company's consolidated financial statements. See Note 2 for more information.
Basis of Presentation
The consolidated financial statements of the Company have been prepared in accordance with generally accepted accounting principles ("GAAP") of the United States of America and are expressed in United States dollars. For the years ended December 31, 2017 and 2016, the consolidated financial statements include the accounts of the Company and its subsidiaries. All material intercompany accounts and transactions have been eliminated in consolidation.
Use of Estimates
The preparation of financial statements in conformity with generally accepted accounting principles requires management to make estimates and assumptions that affect the reported amounts of assets and liabilities and disclosure of contingencies at the date of the financial statements and the reported amount of revenues and expenses during the reporting period. Actual results may differ from those estimates.
Going Concern
The consolidated financial statements have been prepared on a going concern basis which contemplates the realization of assets and the settlement of liabilities in the normal course of business. The Company has limited working capital, has incurred losses in each of the past two years, and has not yet received material revenues from sales of products or services. These factors create substantial doubt about the Company's ability to continue as a going concern. The consolidated financial statements do not include any adjustment that might be necessary if the Company is unable to continue as a going concern.
The ability of the Company to continue as a going concern is dependent on the Company generating cash from its operations, the sale of its stock and/or obtaining debt financing. During the year ended December 31, 2017, the Company funded operations primarily through the sale of debt and equity securities and through the receipt of proceeds from revenues. Management's plan to fund its capital requirements and ongoing operations include an increase in cash received from sales of gold and rough diamonds recovered from a new modular processing and recovery plant. Management's secondary plan to cover any shortfall is selling its equity securities, including common stock in the Company or common stock in Jupiter Gold that it owns, and obtaining debt financing. There can be no assurance the Company will be successful in these efforts.
F-6
BRAZIL MINERALS, INC.
NOTES TO THE CONSOLIDATED FINANCIAL STATEMENTS
NOTE 1 – ORGANIZATION, BUSINESS AND SUMMARY OF SIGNIFICANT ACCOUNTING POLICIES (Continued)
Share Count
All share and per share amounts have been restated to give effect to a 1-for-500 reverse split of the Company's common stock which became effective on January 27, 2017.
Fair Value of Financial Instruments
The Company follows the guidance of Accounting Standards Codification ("ASC") Topic 820 – Fair Value Measurement and Disclosure. Fair value is defined as the exit price, or the amount that would be received to sell an asset or paid to transfer a liability in an orderly transaction between market participants as of the measurement date. The guidance also establishes a hierarchy for inputs used in measuring fair value that maximizes the use of observable inputs and minimizes the use of unobservable inputs by requiring that the most observable inputs be used when available. Observable inputs are inputs market participants would use in valuing the asset or liability and are developed based on market data obtained from sources independent of our Company. Unobservable inputs are inputs that reflect our Company's assumptions about the factors market participants would use in valuing the asset or liability. The guidance establishes three levels of inputs that may be used to measure fair value:
Level 1. Observable inputs such as quoted prices in active markets;
Level 2. Inputs, other than the quoted prices in active markets, that are observable either directly or indirectly; and
Level 3. Unobservable inputs in which there is little or no market data, which require the reporting entity to develop its own assumptions.
As of December 31, 2017 and 2016, the Company's derivative liabilities were considered a level 2 liability. See Note 4 for a discussion regarding the determination of the fair market value. The Company does not have any level 3 assets or liabilities.
The Company's financial instruments consist of cash and cash equivalents, accounts receivable, taxes recoverable, prepaid expenses, inventory, deposits and other assets, accounts payable, accrued expenses, deferred revenue and convertible notes payable. The carrying amount of these financial instruments approximates fair value due to either length of maturity or interest rates that approximate prevailing market rates unless otherwise disclosed in these consolidated financial statements.
Cash and Cash Equivalents
The Company considers all highly liquid instruments purchased with a maturity of three months or less to be cash equivalents to the extent that the funds are not being held for investment purposes. The Company's bank accounts are deposited in FDIC insured institutions. Funds held in U.S. banks are insured up to $250,000 and funds held in Brazilian banks are insured up to $250,000 Brazilian Reais (translating into approximately $75,575 as of December 31, 2017).
Inventory
Inventory for the Company consists of ore stockpile, containing auriferous and diamondiferous gravel, which after processing in a recovery plant yields diamonds and gold, and is stated at lower of cost or market. No value was placed on sand. The amount of any write-down of inventories to net realizable value and all losses, are recognized in the period the write-down of loss occurs. At December 31, 2017 and 2016, inventory consisted primarily of rough ore stockpiled for further gold and diamonds recovery. During the years ended December 31, 2017 and 2016, the Company recorded reserves of $38,875 and $78,916, respectively, against the value of its inventory.
F-7
BRAZIL MINERALS, INC.
NOTES TO THE CONSOLIDATED FINANCIAL STATEMENTS
NOTE 1 – ORGANIZATION, BUSINESS AND SUMMARY OF SIGNIFICANT ACCOUNTING POLICIES (Continued)
Value-Added Taxes Receivable
The Company records a receivable for value added taxes recoverable from Brazilian authorities on goods and services purchased by its Brazilian subsidiaries. The Company intends to recover the taxes through the acquisition of capital equipment from sellers who accept tax credits as payments. On April 20, 2016, the Company's taxes receivable decreased by $50,496 with the recovery of such amount being used in the acquisition of a Mercedes Benz truck, through a state-government program.
Property and Equipment
Property and equipment are stated at cost. Major improvements and betterments are capitalized. Maintenance and repairs are expensed as incurred. Depreciation is computed using the straight-line method over the estimated useful life. At the time of retirement or other disposition of property and equipment, the cost and accumulated depreciation are removed from the accounts and any resulting gain or loss is reflected in the statements of operations as other gain or loss, net.
The diamond and gold processing plant and other machinery are depreciated over an estimated useful life of ten years; vehicles are depreciated over an estimated life of four years; and computer and other office equipment over an estimated useful life of three years.
Mineral Properties
Costs of exploration, carrying and retaining unproven mineral lease properties are expensed as incurred. Mineral property acquisition costs, including licenses and lease payments, are capitalized. Although the Company has taken steps to verify title to mineral properties in which it has an interest, these procedures do not guarantee the Company's rights. Such properties may be subject to prior agreements or transfers and title may be affected by undetected defects.
Impairment losses are recorded on mineral properties used in operations when indicators of impairment are present and the undiscounted cash flows estimated to be generated by those assets are less than the assets' carrying amount. As of December 31, 2017 and 2016, the Company did not recognize any impairment losses related to mineral properties held.
Intangible Assets
For intangible assets purchased in a business combination, the estimated fair values of the assets received are used to establish their recorded values. For intangible assets acquired in a non-monetary exchange, the estimated fair values of the assets transferred (or the estimated fair values of the assets received, if more clearly evident) are used to establish their recorded values, unless the values of neither the assets received nor the assets transferred are determinable within reasonable limits, in which case the assets received are measured based on the carrying values of the assets transferred. Valuation techniques consistent with the market approach, income approach and/or cost approach are used to measure fair value. Intangible assets consist of mineral rights awarded by the Brazilian national mining department and held by the Company's subsidiaries.
F-8
BRAZIL MINERALS, INC.
NOTES TO THE CONSOLIDATED FINANCIAL STATEMENTS
NOTE 1 – ORGANIZATION, BUSINESS AND SUMMARY OF SIGNIFICANT ACCOUNTING POLICIES (Continued)
Impairment of Long-Lived Assets
For long-lived assets, such as property and equipment and intangible assets subject to amortization, the Company continually monitors events and changes in circumstances that could indicate carrying amounts of long-lived assets may not be recoverable. When such events or changes in circumstances are present, the Company assesses the recoverability of long-lived assets by determining whether the carrying value of such assets will be recovered through undiscounted expected future cash flows. If the total of the future cash flows is less than the carrying amount of those assets, the Company recognizes an impairment loss based on the excess of the carrying amount over the fair value of the assets. Assets to be disposed of are reported at the lower of the carrying amount or the fair value less costs to sell.
Revenue Recognition
The Company recognizes revenue when products are fully delivered, or services have been provided and collection is reasonably assured. Typically, the Company records revenues upon delivery of the products sold to the customer.
Costs of Goods Sold
Included within costs of goods sold are the costs of cutting and polishing rough diamonds and costs of production such as diesel fuel, labor, and transportation.
Stock-Based Compensation
The Company records stock-based compensation in accordance with ASC Topic 718, Compensation - Stock Compensation. ASC 718 requires companies to measure compensation cost for stock-based employee compensation at fair value at the grant date and recognize the expense over the employee's requisite service period. Under ASC 718, volatility is based on the historical volatility of our stock or the expected volatility of the stock of similar companies. The expected life assumption is primarily based on historical exercise patterns and employee post-vesting termination behavior. The risk-free interest rate for the expected term of the option is based on the U.S. Treasury yield curve in effect at the time of grant.
The Company utilizes the Black-Scholes option-pricing model, which was developed for use in estimating the fair value of options. Option-pricing models require the input of highly complex and subjective variables including the expected life of options granted and the expected volatility of our stock price over a period equal to or greater than the expected life of the options. Because changes in the subjective assumptions can materially affect the estimated value of our employee stock options, it is management's opinion that the Black-Scholes option-pricing model may not provide an accurate measure of the fair value of our employee stock options. Although the fair value of employee stock options is determined in accordance with ASC Topic 718 using an option-pricing model, that value may not be indicative of the fair value observed in a willing buyer/willing seller market transaction.
The Company has adopted a stock plan to attract, retain and motivate its directors, officers, employees, consultants and advisors. The Company's 2017 stock incentive plan provides for the issuance of up to 25,000,000 common shares for employees, consultants, directors, and advisors.
Foreign Currency
The Company's foreign subsidiaries use a local currency as the functional currency. Resulting translation gains or losses are recognized as a component of accumulated other comprehensive income. Transaction gains or losses related to balances denominated in a currency other than the functional currency are recognized in the consolidated statements of operations. Net foreign currency transaction losses included in the Company's consolidated statements of operations were negligible for all periods presented.
F-9
BRAZIL MINERALS, INC.
NOTES TO THE CONSOLIDATED FINANCIAL STATEMENTS
NOTE 1 – ORGANIZATION, BUSINESS AND SUMMARY OF SIGNIFICANT ACCOUNTING POLICIES (Continued)
Income Taxes
The Company accounts for income taxes in accordance with ASC Topic 740, Income Taxes. ASC 740 requires a company to use the asset and liability method of accounting for income taxes, whereby deferred tax assets are recognized for deductible temporary differences, and deferred tax liabilities are recognized for taxable temporary differences. Temporary differences are the differences between the reported amounts of assets and liabilities and their tax bases. Deferred tax assets are reduced by a valuation allowance when, in the opinion of management, it is more likely than not that some portion, or all of, the deferred tax assets will not be realized. Deferred tax assets and liabilities are adjusted for the effects of changes in tax laws and rates on the date of enactment. As of December 31, 2017 and 2016, the Company's deferred tax assets had a full valuation allowance.
Under ASC 740, a tax position is recognized as a benefit only if it is "more likely than not" that the tax position would be sustained in a tax examination being presumed to occur. The amount recognized is the largest amount of tax benefit that is greater than 50% likely of being realized on examination. For tax positions not meeting the "more likely than not" test, no tax benefit is recorded.
The Company has identified the United States Federal tax returns as its "major" tax jurisdiction.
Basic Income (Loss) Per Share
The Company computes loss per share in accordance with ASC Topic 260, Earnings per Share, which requires presentation of both basic and diluted earnings per share on the face of the statement of operations. Basic loss per share is computed by dividing net loss available to common shareholders by the weighted average number of outstanding common shares during the period. Diluted loss per share gives effect to all dilutive potential common shares outstanding during the period. As of December 31, 2017, the Company's potentially dilutive securities relate to common stock issuable in connection with convertible notes payable, options and warrants. As of December 31, 2017, if all holders of preferred stock, convertible notes payable, options and warrants exercised their right to convert their securities to common stock, the common stock issuable would be in excess of the Company's authorized, but unissued shares of common stock. The Company increased its authorized share count on March 15, 2018 to rectify such situation.
Other Comprehensive Income
Other comprehensive income is defined as the change in equity of a business enterprise during a period from transactions and other events and circumstances from non-owner sources, other than net income and including foreign currency translation adjustments.
Recent Accounting Pronouncements
In February 2016, the FASB issued ASU 2016-02, Leases (Topic 840), to increase transparency and comparability among organizations by recognizing lease assets and lease liabilities on the balance sheet and disclosing key information about leasing arrangements. The amendments in this standard are effective for fiscal years beginning after December 15, 2018, including interim periods within those fiscal years, for a public entity. Early adoption of the amendments in this standard is permitted for all entities and the Company must recognize and measure leases at the beginning of the earliest period presented using a modified retrospective approach. The Company is currently in the process of evaluating the effect this guidance will have on its financial statements and related disclosures.
We have reviewed other recent accounting pronouncements issued to the date of the issuance of these consolidated financial statements, and we do not believe any of these pronouncements will have a material impact on the Company.
F-10
BRAZIL MINERALS, INC.
NOTES TO THE CONSOLIDATED FINANCIAL STATEMENTS
NOTE 2 –ACQUISITIONS
Jupiter Gold Corporation and
Mineração
Jupiter Ltda
On July 27, 2016,
upon approval by its Board of Directors, the Company sold a 99.99% equity interest in
Mineração Jupiter Ltda
to Jupiter Gold Corporation ("Jupiter Gold"), a newly created company, in exchange for 4,000,000 shares of the common stock of Jupiter Gold which, at par value, were valued at $4,000.
Subsequent to the agreement, the Company transferred approximately 41% of its ownership in Jupiter Gold to noncontrolling interests through both sales of Jupiter Gold common stock at $1.00 per share to outside investors and conversions of certain of the Company's notes payable and preferred stock into Jupiter Gold common stock. As a result of these transactions, a noncontrolling interest of $1,348,751 was recognized in the consolidated financial statements.
NOTE 3 – COMPOSITION OF CERTAIN FINANCIAL STATEMENT ITEMS
Property and Equipment
The following table sets forth the components of the Company's property and equipment at December 31, 2017 and December 31, 2016:
|
|
December 31, 2017
|
December 31, 2016
|
||||||||||||||||||||||
|
|
Cost
|
Accumulated Depreciation
|
Net Book
Value
|
Cost
|
Accumulated Depreciation
|
Net Book
Value
|
||||||||||||||||||
|
Capital assets subject to depreciation:
|
||||||||||||||||||||||||
|
Computers and office equipment
|
$
|
901
|
$
|
(863
|
)
|
$
|
38
|
$
|
915
|
$
|
(292
|
)
|
$
|
623
|
||||||||||
|
Machinery and equipment
|
520,645
|
(250,067
|
)
|
270,578
|
490,664
|
(195,185
|
)
|
295,479
|
||||||||||||||||
|
Vehicles
|
200,164
|
(105,308
|
)
|
94,856
|
203,167
|
(77,432
|
)
|
125,825
|
||||||||||||||||
|
Total fixed assets
|
$
|
721,710
|
$
|
(356,238
|
)
|
$
|
365,472
|
$
|
694,746
|
$
|
(272,909
|
)
|
$
|
421,927
|
||||||||||
For the years ended December 31, 2017 and 2016, the Company recorded depreciation expense of $90,040 and $87,005, respectively.
Intangible Assets
Intangible assets consist of mining rights are not amortized as the mining rights are perpetual. The carrying value was $620,805 and $630,089 at December 31, 2017 and 2016, respectively.
Investments Held Available for Sale
On October 2, 2017, the Company entered into an exchange agreement whereby it issued 25,000,000 shares of its common stock in exchange for 500,000 shares of Ares Resources Corporation, a related party. The shares were recorded at $150,000, or $0.006 per share. The shares were valued based upon the lowest market price of the Company's common stock on the date the agreement. As of December 31, 2017, no change in the value of the Ares common stock was recorded as the recorded value still approximated fair value.
F-11
BRAZIL MINERALS, INC.
NOTES TO THE CONSOLIDATED FINANCIAL STATEMENTS
NOTE 3 – COMPOSITION OF CERTAIN FINANCIAL STATEMENT ITEMS (Continued)
Accounts Payable and Accrued Liabilities
|
As of
|
As of
|
|||||||
|
December 31, 2017
|
December 31, 2016
|
|||||||
|
Accounts payable and other accruals
|
$
|
132,172
|
$
|
162,976
|
||||
|
Accrued interest
|
275,478
|
170,439
|
||||||
|
Total
|
$
|
407,650
|
$
|
333,415
|
||||
NOTE 4 – CONVERTIBLE PROMISSORY NOTES PAYABLE
Convertible Notes Payable - Fixed Conversion Price
On January 7, 2014, the Company issued to a family trust a senior secured convertible promissory note in the principal amount, and received gross proceeds, of $244,000 (the "Note") and warrants to purchase an aggregate of 488,000 shares of the Company's common stock at an exercise price of $62.50 per share through December 26, 2018 (the "Warrants"). The Company received gross proceeds of $244,000 for the sale of such securities. The outstanding principal of the Note bears interest at the rate of 12% per annum. All principal on the Note was payable on March 31, 2015 (the "Maturity Date"), which as of the date of this filing is past due and in technical default. The Company is in negotiations with the note holder to satisfy, amend the terms or otherwise resolve the obligation in default. No demand for payment has been made. As a result of the default, the interest rate on the Note increased to 30% per annum. Interest was payable on September 30, 2014 and on the Maturity Date. As of December 31, 2017, the Company has accrued interest payable totaling $237,609. The Note is convertible at the option of the holder into common stock of the Company at a conversion rate of one share for each $50.00 of principal and interest converted.
In January 2015, the Company issued four convertible promissory notes totaling $200,000 in proceeds and options to purchase an aggregate of 80,000 shares of the Company's common stock at an exercise price of $2.50 per share for a period of three years. The convertible promissory notes incurred interest at 10.0% and are were due January 30, 2018. The convertible promissory notes were convertible at the option of the holder at a rate of $1.25 per share. A debt discount of $44,846 was recorded, of which $27,406 was amortized to interest expense during the year ended December 31, 2016. The notes were converted into 160,000 shares of the Company's common stock, 192,000 shares of Jupiter Gold common stock, and 384,000 stock purchase warrants for JCG common stock. The 192,000 shares of Jupiter Gold common stock were valued at $192,000, or $1.00 per share, which represents fair market value as of such date. The 384,000 warrants are exercisable at $1.50 for a two-year period from issuance. The Jupiter Gold warrants were valued at $37,426 using the Black-Scholes option pricing model and the following assumptions:
an exercise price of $1.50, a stock price of $1.00 on the date of grant, an expected dividend yield of 0%, an expected volatility of 40.0%, a risk-free interest rate of 0.71% and an expected term of 2.0 years.
As a result, a noncontrolling interest of $229,425 was recorded in the consolidated financial statements.
Convertible Notes Payable - Variable Conversion Price
At various times to fund operations, the Company issues convertible notes payable in which the conversion features are variable. In addition, some of these convertible notes payable have on issuance discounts and other fees withheld.
F-12
BRAZIL MINERALS, INC.
NOTES TO THE CONSOLIDATED FINANCIAL STATEMENTS
NOTE 3 – COMPOSITION OF CERTAIN FINANCIAL STATEMENT ITEMS (Continued)
During the year ended December 31, 2016, the Company issued to one noteholder in various transactions $242,144 in convertible promissory notes with fixed floors and received an aggregate of $232,344 in proceeds. The convertible promissory notes each bear interest at 8.0% per annum and mature one year from issuance. After six months from issuance, each convertible promissory note is convertible at the option of the holder at a 50% discount to the lowest traded price of the Company's common stock over the previous 20 days. In addition, each note's conversion rate has a floor of $0.0001. Total debt discounts related to the beneficial conversion features of $241,852 were recorded and are being amortized over the life of the notes.
During the year ended December 31, 2017, the Company issued to one noteholder in various transactions $477,609 in convertible promissory notes with fixed floors and received an aggregate of $454,584 in proceeds. The convertible promissory notes each bear interest at 8.0% per annum and mature one year from issuance. After six months from issuance, each convertible promissory note is convertible at the option of the holder at a 50% discount to the lowest traded price of the Company's common stock over the previous 20 days. In addition, each note's conversion rate has a floor of $0.0001. Total debt discounts related to the beneficial conversion features of $447,272 were recorded and are being amortized over the life of the notes.
As of December 31, 2017, the Company has $885,003 in principal of notes payable with remaining discounts of $219,608. The convertible notes payable incur interest at rates ranging from 8.0% to 30.0% per annum with due dates ranging from currently due to September 2018.
During the years ended December 31, 2017 and 2016, $375,757 and $237,773 of the discounts were amortized to interest expense, respectively.
During the years ended December 31, 2017 and 2016, the Company issued 29,772,138 and 11,912,849 shares of common stock upon conversion of $84,588 and
$
358,781, respectively, in notes payable and accrued interest.
Derivative Liabilities
In connection with certain convertible notes payable the Company records derivative liabilities for the conversion feature. The derivative liabilities are valued on the date of issuance of the convertible note payable and revalued at each reporting period.
During the year ended December 31, 2017 the Company recorded derivative liabilities of $281,345 based upon the following Black-Scholes option pricing model average assumptions: an exercise price of $0.75 to $0.025, our stock price on the date of grant ($1.65 to $0.05), expected dividend yield of 0%, expected volatility of 218% to 313%, risk free interest rate of 0.12% and an expected term of 0.50 years. Upon initial valuation, the derivative liability exceeded the face value of the convertible note payable of $302,111, a day one loss on derivative liability of $372,878 was recorded.
During the year ended December 31, 2016, the Company recorded a loss on derivative liabilities of $281,345. As of December 31, 2016, no derivative liabilities were recorded
Future Potential Dilution
Most of the Company's convertible notes payable contain adjustable conversion terms with significant discounts to market. As of December 31, 2017, the Company's convertible notes are convertible into an aggregate of approximately 337,370,000 shares of common stock. Due to the variable conversion prices on some of the Company's convertible notes, the number of common shares issuable is dependent upon the traded price of the Company's common stock.
F-13
BRAZIL MINERALS, INC.
NOTES TO THE CONSOLIDATED FINANCIAL STATEMENTS
NOTE 5 – STOCKHOLDERS' DEFICIT
Authorized and Amendments
As of December 31, 2016, the Company had 30,000,000 common shares authorized with a par value of $0.001 per share.
The Company filed a 1-for-500 reverse split with the state of Nevada on December 15, 2016, which became effective on January 27, 2017. On February 15, 2017, the Company amended its Articles of Incorporation to increase the authorized number of shares of its common stock to 100 million shares. On October 23, 2017, an amendment of the charter of the Company filed with the Secretary of State of Nevada increased the number of authorized common shares to 250,000,000.
As of December 31, 2017, the Company had 250,000,000 common shares authorized with a par value of $0.001 per share.
On March 15, 2018, an amendment of the charter of the Company filed with the Secretary of State of Nevada increased the number of authorized common shares to 950,000,000.
Series A Preferred Stock
On December 18, 2012, the Company filed with the Nevada Secretary of State a Certificate of Designations, Preferences and Rights of Series A Convertible Preferred Stock ("Series A Stock") to designate one share of a new series of preferred stock. The Certificate of Designations, Preferences and Rights of Series A Convertible Preferred Stock provides that for so long as Series A Stock is issued and outstanding, the holders of Series A Stock shall vote together as a single class with the holders of the Company's Common Stock, with the holders of Series A Stock being entitled to 51% of the total votes on all such matters regardless of the actual number of shares of Series A Stock then outstanding, and the holders of Common Stock are entitled to their proportional share of the remaining 49% of the total votes based on their respective voting power.
Series B Preferred Stock
On August 26, 2015, the Company filed with the Nevada Secretary of State a Certificate of Designations, Preferences and Rights (the "Certificate of Designations") of par value $0.001 Series B Convertible Preferred Stock ("Series B Stock") to designate 1,000,000 shares of a new series of preferred stock. The Series B Stock has an original issue price of $1,000 per share. Cumulative dividends on such shares are payable annually (or upon conversion of such stock into Common Stock) in Common Stock at the rate of 10% per stated share value per annum. The holders of Series B Stock shall be entitled to vote on all matters as one class with the holders of Common Stock, with the holders of Series B Stock being entitled to such number of votes as shall equal the number of whole and fractional shares of Common Stock into which such share is then convertible. At any time until December 31, 2016 each holder of Series B Stock could have elected to convert all or a portion of the preference amount into shares of Common Stock at a conversion price which is a 40% discount to the average of the lowest 5 closing prices of the Common Stock in the 20-day period before a notice of conversion is given, but the conversion price would not have been higher than $15.00 nor lower than $0.0165.
During the year ended December 31, 2016, the Company issued 34.5 shares of Series B Stock for $55,500 in cash proceeds.
F-14
BRAZIL MINERALS, INC.
NOTES TO THE CONSOLIDATED FINANCIAL STATEMENTS
NOTE 5 – STOCKHOLDERS' DEFICIT (Continued)
During the year ended December 31, 2016, the Company entered into an agreement with the holders of its Series B Preferred Stock whereby the holders exchanged 471.3 shares preferred stock for 785,248 shares of Jupiter Gold common stock and options to purchase common stock of Jupiter Gold. The options were issued in two tranches. The first tranche of 581,548 options are exercisable at $1.50 for a one-year period from issuance. The second tranche of 785,248 options are exercisable at $1.50 for a two-year period from issuance. The options were valued at $97,349 using the Black-Scholes option pricing model and the following assumptions: an exercise price of $1.50, a stock price of $1.00 on the date of grant, an expected dividend yield of 0%, an expected volatility of 40.0%, a risk-free interest rate of 0.56%-0.72% and an expected term of 1.0-2.0 years. As a result, a noncontrolling interest of $890,346 was recorded in the consolidated financial statements.
During the year ended December 31, 2016, the Company accrued dividends of $82,350, recorded as interest expense which increased the dividends payable balance to $92,783 at December 31, 2016.
On December 31, 2016, all outstanding shares of Series B Stock and their related dividends payable automatically converted into Common Stock at the applicable conversion price.
Series C Preferred Stock
On December 29, 2015, the Company filed with the Nevada Secretary of State a Certificate of Designations, Preferences and Rights of Series C Convertible Preferred Stock ("Series C Stock") to designate 1,000,000 shares of a new series of preferred stock. The Series C Stock has an original issue price of $1,000 per share. Cumulative dividends on such shares are payable annually (or upon conversion of such stock into Common Stock) in Common Stock at the rate of $0.04 per share per annum. The holders of Series C Stock shall be entitled to vote on all matters as one class with the holders of Common Stock, with the holders of Series C Stock being entitled to such number of votes as shall equal the number of whole and fractional shares of Common Stock into which such share is then convertible. At any time until December 31, 2016 each holder of Series C Stock could have elected to convert all or a portion of the preference amount into shares of Common Stock at a conversion price which is the lower of $0.04 or the volume weighted average price of the Company's Common Stock for the 90 trading days before a notice of conversion with a floor of $0.02.
On July 30, 2016, the Company entered into an agreement with the holders of its Series C Preferred Stock whereby the holders exchanged all of the Preferred C Stock outstanding, namely 200,000 such shares, for 125,000 shares of Jupiter Gold common stock. As a result, a noncontrolling interest of $125,000 was recorded in the consolidated financial statements.
On December 31, 2016, all outstanding shares of Series C Stock automatically converted into Common Stock at the applicable conversion price.
Year Ended December 31, 2017 Transactions
During the year ended December 31, 2017, the Company issued 1,800,000 shares of common stock for cash proceeds of $21,834.
Year Ended December 31, 2016 Transactions
During the year ended December 31, 2016, the Company issued 260,684
shares of common stock with a fair market value of $18,068 to consultants in lieu of cash payments. The shares were valued based upon the closing market price of the Company's common stock on the date the service was complete.
F-15
BRAZIL MINERALS, INC.
NOTES TO THE CONSOLIDATED FINANCIAL STATEMENTS
NOTE 5 – STOCKHOLDERS' DEFICIT (Continued)
During the year ended December 31, 2016, the Company issued 836,486 shares of its common stock to its CEO in satisfaction of amounts payable. The shares were valued based upon the closing market price of the Company's common stock on the date the service was complete. In addition, the Company has agreed to issue additional shares of common stock if the effective price of a future common stock transaction decreases.
During the year ended December 31, 2016, the Company issued 17,687,503 shares of common stock for cash proceeds of $258,700.
See Notes 3 and 4 for additional discussions of common stock issuances.
Common Stock Options
During the year ended December 31, 2016, the Company granted options to purchase an aggregate of 626,680 shares of common stock to non-management directors. The options were valued at $25,000 in total. The options were valued using the Black-Scholes option pricing model with the following average assumptions: our stock price on date of grant ($0.05), expected dividend yield of 0%, historical volatility of 113%, risk-free interest rate of 1.13%, and an expected term of 5.00 years.
During the year ended December 31, 2017, the Company granted options to purchase an aggregate of 10,226,100 shares of common stock to non-management directors. The options were valued at $87,500 in total. The options were valued using the Black-Scholes option pricing model with the following average assumptions: our stock price on date of grant (range of $0.03 to $0.07), expected dividend yield of 0%, historical volatility ranging from 221% to 234%, risk-free interest rate of 1.80%, and an expected term of 5.00 years.
NOTE 6 – COMMITMENTS AND CONTINGENCIES
Operating Leases
The Company leases offices in Pasadena, California, U.S., and in the municipality of Olhos D'Agua, Brazil. Such costs are immaterial to the consolidated financial statements.
NOTE 7 - RELATED PARTY TRANSACTIONS
Chief Executive Officer
As of December 31, 2017 and 2016, amounts payable to the Chief Executive Officer for accrued salaries, retirement contributions, and advances made net of any repayments included within related party payable were $502,397 and $310,259, respectively. These amounts bear no interest and are payable on demand. During the years ended December 31, 2017 and 2016, the Chief Executive Officer made advances of $2,540 and $21,220, respectively, to the Company.
Investment in Ares Resources Corporation's Common Stock
On October 2, 2017, the Company entered into an exchange agreement whereby it issued 25,000,000 shares of its common stock in exchange for 500,000 shares of Ares Resources Corporation, a related party. The shares were recorded at $150,000, or $0.006 per share. The shares were valued based upon the lowest market price of the Company's common stock on the date the agreement. As of December 31, 2017, no change in the value of the Ares common stock was recorded as the recorded value still approximated fair value.
F-16
BRAZIL MINERALS, INC.
NOTES TO THE CONSOLIDATED FINANCIAL STATEMENTS
OTE 8 - SUBSEQUENT EVENTS
In accordance with FASB ASC 855-10 Subsequent Events, the Company has analyzed its operations subsequent to December 31, 2017 to the date these consolidated financial statements were issued, and has determined that it does not have any material subsequent events to disclose in these consolidated financial statements, except as follows:
On March 15, 2018, an amendment of the charter of the Company filed with the Secretary of State of Nevada increased the number of authorized common shares to 950,000,000.
F-17
SIGNATURES
Pursuant to the requirements of Section 13 or 15(d) of the Securities Exchange Act of 1934, the Registrant has duly caused this report to be signed on its behalf by the undersigned, thereunto duly authorized.
|
|
BRAZIL MINERALS, INC.
|
|
|
|
|
|
|
|
By:
|
/s/ Marc Fogassa
|
|
|
|
Marc Fogassa
|
|
Date: April 17, 2018
|
|
Chief Executive Officer
|
Pursuant to the requirements of the Securities Exchange Act of 1934, this report has been signed below by the following persons on behalf of the Registrant and in the capacities and on the dates indicated.
|
Signature
|
Title
|
Date
|
||
|
|
|
|
||
|
/s/ Marc Fogassa
|
Chief Executive Officer
|
April 17, 2018
|
||
|
Marc Fogassa
|
and Director; Chief Financial
|
|
||
|
|
Officer and Chief Accounting Officer
|
|
||
|
|
|
|
||
|
|
|
|
||
|
/s/ Roger Noriega
|
Director
|
April 17, 2018
|
||
|
Roger Noriega
|
|
|
||
|
|
|
|
- 30 -
EXHIBIT INDEX
- 33 -
TABLE OF CONTENTS
Part IItem 1. Description Of BusinessItem 1A. Risk FactorsItem 1B. Unresolved Staff CommentsItem 2. PropertiesItem 3. Legal ProceedingsItem 4. Mine Safety DisclosuresPart IIItem 5. Market For Registrant's Common Equity, Related Stockholder Matters and Issuer Purchases Of Equity SecuritiesItem 6. Selected Financial DataItem 7. Management's Discussion and Analysis Of Financial Condition and Results Of OperationItem 7A. Quantitative and Qualitative Disclosures About Market RiskItem 8. Financial Statements and Supplementary DataItem 9. Changes in and Disagreements with Accountants on Accounting and Financial DisclosureItem 9A. Controls and ProceduresItem 9B. Other InformationPart IIIItem 10. Directors, Executive Officers and Corporate GovernanceItem 11. Executive CompensationItem 12. Security Ownership Of Certain Beneficial Owners and Management and Related Stockholder MattersItem 13. Certain Relationships and Related Transactions, and Director IndependenceItem 14. Principal Accounting Fees and ServicesPart IVItem 15. Exhibits, Financial Statement SchedulesItem 16. Form 10-k SummaryNote 1 Organization, Business and Summary Of Significant Accounting PoliciesNote 1 Organization, Business and Summary Of Significant Accounting Policies (continued)Note 2 AcquisitionsNote 3 Composition Of Certain Financial Statement ItemsNote 3 Composition Of Certain Financial Statement Items (continued)Note 4 Convertible Promissory Notes PayableNote 5 Stockholders' DeficitNote 5 Stockholders' Deficit (continued)Note 6 Commitments and ContingenciesNote 7 - Related Party Transactions