UNITED
STATES
SECURITIES
AND
EXCHANGE
COMMISSION
WASHINGTON,
DC
20549
FORM
20
-F
(Mark
One)
☐
OR
☑
For
the
fiscal
year
ended
December
31,
2019
OR
☐
For
the
transition
period
from
to
OR
☐
Date
of
event
requiring
this
shell
company
report
Commission
file
number
Barclays
Bank
PLC
1
-
10257
BARCLAYS
BANK
PLC
ENGLAND
(Jurisdiction
of
Incorporation
or
Organization)
1
CHURCHILL
PLACE,
LONDON
E14
5HP,
ENGLAND
(Address
of
Principal
Executive
Offices)
GARTH
WRIGHT,
+44
(0)20
7116
3170,
GARTH.WRIGHT@BARCLAYS.COM
1
CHURCHILL
PLACE,
LONDON
E14
5HP,
ENGLAND
(Name,
Telephone,
E-mail
and/or
Facsimile
number
and
Address
of
Company
Contact
Person)
As
a
wholly
-
owned
subsidiary
of
Barclays
PLC,
which
is
a
reporting
company
under
the
Securities
Exchange
Act
of
1934,
Barclays
Bank
PLC
meets
the
conditions
set
forth
in
General
Instruction
I(1)(a)
and
(b)
of
Form
10
-
K,
as
applied
to
annual
reports
on
Form
20
-
F,
and
is
therefore
filing
this
Form
20
-
F
with
a
reduced
disclosure
format.
Securities
registered
or
to
be
registered
pursuant
to
Section
12(b)
of
the
Act:
Title
of
Each
Class
Trading
Symbol(s)
Name
of
Each
Exchange
On
Which
Registered
2.650%
Fixed
Rate
Senior
Notes
due
2021
BCS21E
New
York
Stock
Exchange
Floating
Rate
Notes
due
2021
BCS21D
New
York
Stock
Exchange
5.140%
Lower
Tier
2
Notes
due
October
2020
BCS/20
New
York
Stock
Exchange
iPath
®
SM
DJP
NYSE
Arca
iPath
®
SM
JJA
NYSE
Arca
iPath
®
SM
JJU
NYSE
Arca
iPath
®
SM
NIB
NYSE
Arca
iPath
®
SM
JO
NYSE
Arca
iPath
®
SM
JJC
NYSE
Arca
iPath
®
SM
BAL
NYSE
Arca
iPath
®
SM
JJE
NYSE
Arca
iPath
®
SM
JJG
NYSE
Arca
iPath
®
SM
JJM
NYSE
Arca
iPath
®
SM
LD
NYSE
Arca
iPath
®
SM
COW
NYSE
Arca
iPath
®
SM
JJN
NYSE
Arca
iPath
®
SM
PGM
NYSE
Arca
iPath
®
SM
JJP
NYSE
Arca
iPath
®
SM
JJS
NYSE
Arca
iPath
®
SM
SGG
NYSE
Arca
iPath
®
SM
JJT
NYSE
Arca
iPath
®
SM
GAZ
NYSE
Arca
iPath
®
®
GSP
NYSE
Arca
iPath
®
Series
B
S&P
GSCI
Crude
Oil
Return
Index
ETN
OIL
NYSE
Arca
iPath
®
BCM
NYSE
Arca
iPath
®
OLEM
NYSE
Arca
iPath
®
GRN
NYSE
Arca
iPath
®
GBUG
NYSE
Arca
iPath
®
SBUG
NYSE
Arca
Barclays
ETN+
Shiller
CAPE
TM
CAPE
NYSE
Arca
Barclays
ETN+
FI
Enhanced
Europe
50
ETN
Series
C
FFEU
NYSE
Arca
Barclays
ETN+
FI
Enhanced
Global
High
Yield
ETN
Series
B
FIYY
NYSE
Arca
Barclays
ETN+
FI
Enhanced
Europe
50
ETN
Series
B
FLEU
NYSE
Arca
iPath
®
TM
VXX
CBOE
BZX
Exchange
iPath
®
TM
VXZ
CBOE
BZX
Exchange
iPath
®
IMLP
CBOE
BZX
Exchange
iPath
®
XVZ
CBOE
BZX
Exchange
Barclays
ETN+
Select
MLP
ETN
ATMP
CBOE
BZX
Exchange
Barclays
ETN+
S&P
VEQTOR™
ETN
VQT
CBOE
BZX
Exchange
Barclays
Women
in
Leadership
ETN
WIL
CBOE
BZX
Exchange
Barclays
Return
on
Disability
ETN
RODI
CBOE
BZX
Exchange
iPath
®
STPP
CBOE
BZX
Exchange
iPath
®
FLAT
CBOE
BZX
Exchange
iPath
®
DTUL
CBOE
BZX
Exchange
iPath
®
DTUS
CBOE
BZX
Exchange
iPath
®
DFVL
CBOE
BZX
Exchange
iPath
®
DFVS
CBOE
BZX
Exchange
iPath
®
DTYL
CBOE
BZX
Exchange
iPath
®
DTYS
CBOE
BZX
Exchange
iPath
®
DLBS
CBOE
BZX
Exchange
Barclays
Inverse
US
Treasury
Composite
ETN
TAPR
CBOE
BZX
Exchange
Securities
registered
or
to
be
registered
pursuant
to
Section
12(g)
of
the
Act:
None
Securities
for
which
there
is
a
reporting
obligation
pursuant
to
Section
15(d)
of
the
Act:
None
Indicate
the
number
of
outstanding
shares
of
each
of
the
issuer’s
classes
of
capital
or
common
stock
as
of
the
close
of
the
period
covered
by
the
annual
report.
£1
ordinary
shares
2,342,558,515
£1
preference
shares
1,000
€100
preference
shares
31,856
$100
preference
shares
58,133
Indicate
by
check
mark
if
the
registrant
is
a
well-known
seasoned
issuer,
as
defined
in
Rule
405
of
the
Securities
Act.
Yes
☐
☑
If
this
report
is
an
annual
or
transition
rep
ort,
indicate
by
check
mark
if
the
registrant
is
not
required
to
file
reports
pursuant
to
Section
13
or
15(d)
of
the
Securities
Exchange
Act
1934.
Yes
☐
☑
Note
–
Checking
the
box
above
will
not
relieve
any
registrant
required
to
file
reports
pursua
nt
to
Section
13
or
15(d)
of
the
Securities
Exchange
Act
of
1934
from
their
obligations
under
those
Sections.
Indicate
by
check
mark
whether
the
registrant
(1)
has
filed
all
reports
required
to
be
filed
by
Section
13
or
15(d)
of
the
Securities
Exchange
Ac
t
of
1934
during
the
preceding
12
months
(or
for
such
shorter
period
that
the
registrant
was
required
to
file
such
reports),
and
(2)
has
been
subject
to
such
filing
requirements
for
the
past
90
days.
Yes
☑
☐
Indicate
by
check
mark
whether
the
registrant
has
submitted
electronically
every
Interactive
Data
File
required
to
be
submitted
pursuant
to
Rule
405
of
Regulation
S-T
(§
232.405
of
this
chapter)
during
the
preceding
12
months
(or
for
such
shorter
period
that
the
registrant
was
required
to
submit
such
files).
Yes
☑
☐
Indicate
by
check
mark
whether
the
registrant
is
a
large
accelerated
filer,
an
accelerated
filer,
a
non
-
accelerated
filer,
or
an
emerging
growth
company.
See
definition
of
“large
accelerated
filer”,
“accelerated
filer”
and
“emerging
growth
company”
in
Rule
12b
-
2
of
the
Exchange
Act:
Large
Accelerated
Filer
☐
Accelerated
Filer
☐
Non
-
Accelerated
Filer
☑
Emerging
growth
company
☐
If
an
emerging
growth
company
that
prepares
its
financial
statements
in
accordance
with
U.S.
GAAP,
indicate
by
check
mark
if
the
registrant
has
elected
not
to
use
the
extended
transition
period
for
complying
with
any
new
or
revised
financial
accounting
standards†
provided
pursuant
to
Section
13(a)
of
the
Exchange
Act.
☐
†
The
term
“new
or
revised
financial
accounting
standard”
refers
to
any
update
issued
by
the
Financial
Accounting
Standards
Board
to
its
Accounting
Standards
Codification
after
April
5,
2012.
*Indicate
by
check
mark
which
basis
of
accounting
the
registrant
has
used
to
prepare
the
financial
statements
included
in
this
filing:
U.S.
GAAP
☐
International
Financial
Reporting
Standards
as
issued
by
the
International
Accounting
Standards
Board
☑
Other
☐
*If
“Other”
has
been
checked
in
response
to
the
previous
question,
indicate
by
chec
k
mark
which
financial
statement
item
the
registrant
has
elected
to
follow:
Item
17
☐
Item
18
☐
If
this
is
an
annual
report,
indicate
by
check
mark
whether
the
registrant
is
a
shell
company
(as
defined
in
Rule
12b
-
2
of
the
Exchange
Act).
Yes
☐
☑
(APPLICABLE
ONLY
TO
ISSUERS
INVOLVED
IN
BANKRUPTCY
PROCEEDINGS
DURING
THE
PAST
FIVE
YEARS)
Indicate
by
check
mark
whether
the
registrant
has
filed
all
documents
and
reports
required
to
be
filed
by
Section
12,
13
or
15(d)
of
the
Securities
Exchange
Act
of
1934
subsequent
to
the
distribution
of
securities
under
a
plan
confirmed
by
a
court.
Yes
☐
☐
SEC
Form
20
-F
Cross
reference
information
Form
20
-F
item
number
Page
and
caption
references
in
this
document*
1
Identity
of
Directors,
Senior
Management
and
Advisers
Not
applicable
2
Offer
Statistics
and
Expected
Timetable
Not
applicable
3
Key
Information
A.
Selected
financial
data
Omitted
B.
Capitalization
and
indebtedness
Not
applicable
C.
Reason
for
the
offer
and
use
of
proceeds
Not
applicable
D.
Risk
factors
25
-
36
4
Information
on
the
Company
A.
History
and
development
of
the
company
Omitted
B.
Business
overview
i
(Market
and
other
data),
88
-
94,
110
-
111
(Note
2),
211
C.
Organizational
structure
182
-
187
(Notes
33
and
34),
208
-
210
D.
Property,
plants
and
equipment
154
-
156
(Note
20)
4A
Unresolved
staff
comments
Not
applicable
5
Operating
and
Financial
Review
and
Prospects
A.
Operating
results
28
-
36,
39
-
43,
78,
84
-
94,
127
-
136
(Note
13),
211
B.
Liquidity
and
capital
resources
Omitted
C.
Research
and
development,
patents
and
licenses,
etc.
Omitted
D.
Trend
information
28
-
36,
211
E.
Off-balance
sheet
arrangements
Omitted
F.
Tabular
disclosure
of
contractual
obligations
Omitted
G.
Safe
harbor
i
(Forward
-
looking
statements)
6
Directors,
Senior
Management
and
Employees
A.
Directors
and
senior
management
Omitted
B.
Compensation
Omitted
C.
Board
practices
8
-
9,
13
-
14,
17
D.
Employees
Omitted
E.
Share
ownership
Omitted
7
Major
Shareholders
and
Related
Party
Transactions
A.
Major
shareholders
Omitted
B.
Related
party
transactions
C.
Interests
of
experts
and
counsel
Omitted
Not
applicable
8
Financial
Information
A.
Consolidated
statements
and
other
financial
information
96
-
196,
B.
Significant
changes
Not
applicable
9
The
Offer
and
Listing
A.
Offer
and
listing
details
Not
applicable
B.
Plan
of
distribution
Not
applicable
C.
Markets
Not
applicable
D.
Selling
shareholders
Not
applicable
E.
Dilution
Not
applicable
F.
Expenses
of
the
issue
Not
applicable
10
Additional
Information
A.
Share
capital
Not
applicable
B.
Memorandum
and
Articles
of
Association
197
-
200
C.
Material
contracts
Not
applicable
D.
Exchange
controls
204
E.
Taxation
201
-
204
F.
Dividends
and
paying
assets
Not
applicable
G.
Statement
by
experts
Not
applicable
H.
Documents
on
display
204
I.
Subsidiary
information
182
-
183
(Note
33),
208
-
210
11
Quantitative
and
Qualitative
Disclosure
about
Market
Risk
22
-
94,
129
-
150
(Notes
13
-
16)
12
Description
of
Securities
Other
than
Equity
Securities
A.
Debt
Securities
Not
applicable
B.
Warrants
and
Rights
Not
applicable
C.
Other
Securities
Not
applicable
D.
American
Depositary
Shares
Not
applicable
13
Defaults,
Dividends
Arrearages
and
Delinquencies
Not
applicable
14
Material
Modifications
to
the
Rights
of
Security
Holders
and
Use
of
Proceeds
Not
applicable
15
Controls
and
Procedures
A.
Disclosure
controls
and
procedures
205
B.
Management’s
annual
report
on
internal
control
over
financial
reporting
14
C.
Attestation
report
of
the
registered
public
accounting
firm
Not
applicable
D.
Changes
in
internal
control
over
financial
reporting
14
16A
Audit
Committee
Financial
Expert
Omitted
16B
Code
of
Ethics
Omitted
16C
Principal
Accountant
Fees
and
Services
18
-
19,
196
(Note
40),
205
16D
Exemptions
from
the
Listing
Standards
for
Audit
Committees
Not
applicable
16E
Purchases
of
Equity
Securities
by
the
Issuer
and
Affiliated
Purchasers
16
16F
Change
in
Registrant’s
Certifying
Accountant
Not
applicable
16G
Corporate
Governance
3
-
15
17
Financial
Statements
Not
applicable
(See
Item
8)
18
Financial
Statements
Not
applicable
(See
Item
8)
19
Exhibits
Exhibit
Index
*
Certain
items
are
indicated
as
omitted
as
Barclays
Bank
PLC
is
a
wholly
owned
subsidiary
of
Barclays
PLC,
which
is
a
reporting
company
under
the
Securities
Exchange
Act
of
1934,
and
meets
the
conditions
set
forth
in
General
Instruction
I(1)(a)
and
(b)
of
Form
10
-
K,
as
applied
to
annual
reports
on
Form
20
-
F,
and
is
therefore
filing
this
Form
20
-
F
with
a
reduced
disclosure
format.
Notes
The
term
Barclays
Bank
Group
refers
to
Barclays
Bank
PLC
together
with
its
subsidiaries.
Unless
otherwise
stated,
the
income
statement
analysis
compares
the
year
ended
31
December
2019
to
the
corresponding
twelve
months
of
2018
and
balance
sheet
analysis
as
at
31
December
2019
with
comparatives
relating
to
31
December
2018.
The
abbreviations
‘£m’
and
‘£bn’
represent
millions
and
thousands
of
millions
of
Pounds
Sterling
respectively;
the
abbreviations
‘$m’
and
‘$bn’
represent
millions
and
thousands
of
millions
of
US
Dollars
respectively;
and
the
abbreviations
‘€m’
and
‘€bn’
represent
millions
and
thousands
of
millions
of
Euros
res
pectively.
Forward
-looking
statements
This
document
contains
certain
forward
-
looking
statements
within
the
meaning
of
Section
21E
of
the
US
Securities
Exchange
Act
of
1934,
as
amended,
and
Section
27A
of
the
US
Securities
Act
of
1933,
as
amended,
with
respect
to
the
Barclays
Bank
Group.
Barclays
cautions
readers
that
no
forward
-
looking
statement
is
a
guarantee
of
future
performance
and
that
actual
results
or
other
financial
condition
or
performance
measures
could
differ
materially
from
those
contained
in
the
forward
-
looking
statements.
These
forward
-
looking
statements
can
be
identified
by
the
fact
that
they
do
not
relate
only
to
historical
or
current
facts.
Forward
-
looking
statements
sometimes
use
words
such
as
‘may’,
‘will’,
‘seek’,
‘continue’,
‘aim’,
‘anticipate’,
‘target’,
‘projected’,
‘expect’,
‘estimate’,
‘intend’,
‘plan’,
‘goal’,
‘believe’,
‘achieve’
or
other
words
of
similar
meaning.
Forward
-
looking
statements
can
be
made
in
writing
but
also
may
be
made
verbally
by
members
of
the
management
of
the
Barclays
Bank
Group
(including,
without
limitation,
during
management
presentations
to
financial
analysts)
in
connection
with
this
document.
Examples
of
forward
-
looking
statements
include,
among
others,
statements
or
guidance
regarding
or
relating
to
the
B
arclays
Bank
Group’s
future
financial
position,
income
growth,
assets,
impairment
charges,
provisions,
business
strategy,
capital,
leverage
and
other
regulatory
ratios,
payment
of
dividends
(including
dividend
payout
ratios
and
expected
payment
strategies),
projected
levels
of
growth
in
the
banking
and
financial
markets,
projected
costs
or
savings,
any
commitments
and
targets,
estimates
of
capital
expenditures,
plans
and
objectives
for
future
operations,
projected
employee
numbers,
IFRS
impacts
and
other
statements
that
are
not
historical
fact.
By
their
nature,
forward
-
looking
statements
involve
risk
and
uncertainty
because
they
relate
to
future
events
and
circumstances.
The
forward
-
looking
statements
speak
only
as
at
the
date
on
which
they
are
made
and
such
statements
may
be
affected
by
changes
in
legislation,
the
development
of
standards
and
interpretations
under
IFRS,
including
evolving
practices
with
regard
to
the
interpretation
and
application
of
accounting
and
regulatory
standards,
the
outcome
of
curren
t
and
future
legal
proceedings
and
regulatory
investigations,
future
levels
of
conduct
provisions,
the
policies
and
actions
of
governmental
and
regulatory
authorities,
geopolitical
risks
and
the
impact
of
competition.
In
addition,
factors
including
(but
no
t
limited
to)
the
following
may
have
an
effect:
capital,
leverage
and
other
regulatory
rules
applicable
to
past,
current
and
future
periods;
UK,
US,
Eurozone
and
global
macroeconomic
and
business
conditions;
the
effects
of
any
volatility
in
credit
markets;
market
related
risks
such
as
changes
in
interest
rates
and
foreign
exchange
rates;
effects
of
changes
in
valuation
of
credit
market
exposures;
changes
in
valuation
of
issued
securities;
volatility
in
capital
markets;
changes
in
credit
ratings
of
any
entity
within
the
Barclays
Bank
Group
or
any
securities
issued
by
such
entities;
instability
as
a
result
of
the
exit
by
the
UK
from
the
European
Union
and
the
disruption
that
may
subsequently
result
in
the
UK
and
globally;
and
the
success
of
future
acquisitions,
disposals
and
other
strategic
transactions.
A
number
of
these
influences
and
factors
are
beyond
the
Barclays
Bank
Group’s
control.
As
a
result,
the
Barclays
Bank
Group’s
actual
financial
position,
future
results,
dividend
payments,
capital,
leverage
or
o
ther
regulatory
ratios
or
other
financial
and
non
-
financial
metrics
or
performance
measures
may
differ
materially
from
the
statements
or
guidance
set
forth
in
the
Barclays
Bank
Grou
p’s
forward
-
looking
statements.
Subject
to
our
obligations
under
the
applicable
laws
and
regulations
of
any
relevant
jurisdiction,
(including,
without
limitation,
the
UK
and
the
US),
in
relation
to
disclosure
and
ongoing
information,
we
undertake
no
obligation
to
update
publicly
or
revise
any
forward
-
looking
statements,
whether
as
a
result
of
new
information,
future
events
or
otherwise.
Market
and
other
data
This
document
contains
information,
including
statistical
data,
about
certain
Barclays
markets
and
its
competitive
position.
Except
as
otherwise
indicated,
this
information
is
taken
or
derived
from
Datastream
and
other
external
sources.
Barclays
cannot
guarantee
the
accuracy
of
information
taken
from
external
sources,
or
that,
in
respect
of
internal
estimates,
a
third
party
using
different
methods
would
obtain
the
same
estimates
as
Barclays.
Uses
of
Internet
addresses
This
document
contains
inactive
textual
addresses
to
internet
websites
operated
by
us
and
third
parties.
Reference
to
such
websites
is
made
for
information
purposes
only,
and
information
found
at
such
websites
is
not
incorporated
by
reference
into
this
document.
Governance
C
ontents
Barclays
Bank
PLC
2019
Annual
Report
on
Form
20-F
1
Our
corporate
governance
processes
and
the
role
they
play
in
supporting
the
delivery
of
our
strategy.
Governance
Page
◾
Chairman’s
introduction
2
◾
Corporate
Governance
Statement
3
◾
Directors’
report
16
◾
Our
people
our
culture
21
Governance
Chairman’s
introduction
Barclays
Bank
PLC
2019
Annual
Report
on
Form
20-F
2
The
2019
corporate
governance
report
("Governance
Report")
for
Barclays
Bank
PLC
("BBPLC"
or
the
"Company”)
provides
an
overview
of
how
the
BBPLC
governance
framework
operates
and
of
the
Board’s
key
areas
of
focus
during
the
year.
Following
the
structural
reform
to
realign
the
Barclays
Group
and
ring
-
fence
the
Group's
UK
consumer
banking
business,
BBPLC
became
the
non-
ring
-
fenced
bank
in
April
2018.
Initially,
BBPLC
and
its
parent
company,
BPLC,
had
different
(and
non
-
overlapping)
board
and
board
committee
members.
However,
as
we
moved
into
2019,
following
a
further
review
of
the
corporate
governance
structure
of
BBPLC
and
BPLC
and
reflecting
the
outcomes
of
discussions
with
the
Group's
regulators,
a
decision
was
taken
to
consolidate
and
streamline
the
memb
ership
of
the
BBPLC
and
BPLC
boards,
such
that
membership
of
our
Board
now
comprises
a
subset
of
that
of
the
BPLC
Board,
with
all
members
of
the
BPLC
board,
except
the
Senior
Independent
Director,
the
Chairman
of
BBUKPLC
and
one
Non
-
Executive
Director,
now
also
serving
on
the
board
of
BBPLC.
This
has
significantly
increased
coordination
and
efficiency,
and
reduced
complexity
and
duplication.
This
revised
structure
vests
oversight
over
the
activities
of
BBPLC
in
a
board
the
members
of
which
also
have
direct
accountability
to
BPLC’s
shareholders
through
their
separate
responsibilities
as
members
of
the
BPLC
board.
As
a
result
of
this
consolidation,
during
2019
the
former
Board
members
of
BBPLC
all
stepped
down
and
a
new
Board,
including
myself,
took
office.
We
thank
those
Board
members
who
left
us
this
year
for
their
valued
contribution.
Strategy
During
2019,
the
Board
spent
considerable
time
overseeing
the
development
of
the
Company's
strategy
that
is
being
shaped
by
the
increasingly
sophisticated
needs
of
our
clients
and
technological
evolution
across
our
industry,
in
order
to
fulfil
Barclays'
common
purpose
of
"Creating
Opportunities
to
Rise".
Governance
This
year,
as
required
under
the
Companies
(Miscellaneous
Reporting)
Regulations
2018
(the
"2018
Regulations"),
we
have
included
on
page
7,
a
statement
of
the
Company's
corporate
governance
arrangements.
In
addition,
the
Governance
Report
reflects
the
enhanced
requirements
to
report
on
the
Company’s
engagement
with
employees,
suppliers,
customer
s
and
others
in
a
business
relationship
with
the
Company,
which
are
now
in
force
pursuant
to
the
2018
Regulations.
These
new
requirements
have
prompted
us
to
look
afresh
at
the
governance
principles
that
underpin
our
corporate
governance
arrangements.
You
can
read
more
about
these
principles
and
how
we
apply
them
in
our
Corporate
Governance
Statement,
where
you
can
also
find
out
more
about
the
work
of
the
Board
and
our
Board
Committees
during
2019.
I
would
like
to
thank
fellow
Board
members
and
our
colleag
ues
for
their
support
and
hard
work
throughout
2019.
Nigel
Higgins
Chairman
–
Barclays
Bank
Group
12
February
2020
Governance
Corporate
Governance
Statement
Barclays
Bank
PLC
2019
Annual
Report
on
Form
20-F
3
The
Board
aspires
to
have
high
standards
of
corporate
governance
and,
in
accordance
with
the
2018
Regulations,
has
during
the
year
considered
which
corporate
governance
arrangements
would
be
most
appropriate
to
apply.
The
Board
has
chosen
not
to
adopt
an
d
report
against
the
2018
UK
Corporate
Governance
Code,
which
is
designed
for
premium
listed
companies
and,
whilst
we
fully
support
the
introduction
of
the
Wates
Corporate
Governance
Principles
for
Large
Private
Companies
(in
particular
the
focus
on
purpos
e,
culture
and
employee
and
stakeholder
engagement),
the
Board
considers
they
are
less
appropriate
for
a
wholly
-
owned
subsidiary
of
a
premium
listed
company
which
is
also
a
complex
financial
institution
subject
to
a
comprehensive
regulatory
regime.
We
have
therefore
adopted
our
own
corporate
governance
arrangements
which
we
believe
are
most
appropriate
for
the
Company
and
are
designed
to
ensure
effective
decision
-
making
to
promote
the
Company’s
success
for
the
long
term.
Our
primary
aim
is
that
our
governa
nce
is:
●
effective
in
providing
challenge,
advice
and
support
to
management;
●
providing
checks
and
balances,
and
encourage
constructive
challenge;
●
driving
informed,
collaborative
and
accountable
decision
-
making;
and
●
creating
long
-
term
sustainable
value
for
our
shareholder,
the
ultimate
shareholders
of
Barclays
PLC
(‘Barclays’),
and
our
wider
stakeholders.
Set
out
below
are
the
principles
which
underpin
our
corporate
governance
arrangements
and
how
these
principles
have
been
applied
during
2019.
Certain
addi
tional
information,
signposted
throughout
this
section,
will
be
available
in
the
‘Board
and
Committee
Governance’
section
on
pages
6
–
12.
Our
group
-
wide
governance
framework
is
set
by
Barclays
and
has
been
designed
to
facilitate
the
effective
management
of
the
Barclays
Group.
This
includes
the
setting
of
Group
policies
in
relation
to
matters
such
as
Barclays
values,
Barclays’
Remuneration
Policy
and
the
Barclays’
Charter
of
Expectations.
Where
appropriate,
this
corporate
governance
statement
makes
referen
ce
to
those
Group
policies
which
are
relevant
to
the
way
in
which
the
Company
is
governed.
Our
corporate
governance
principles
and
how
the
Company
has
applied
them
during
2019
and
to
the
date
of
this
report
Principle
One:
Board
leadership
and
company
purpose
A
successful
company
is
led
by
an
effective
and
entrepreneurial
board
whose
role
is
to
establish
the
company’s
purpose,
values
and
strategy,
aligned
to
its
culture,
and
make
decisions
to
promote
its
success
for
the
long
term
benefit
of
its
shareholder
,
having
regard
to
the
interests
of
other
relevant
stakeholders
and
factors.
◾
Through
the
leadership
of
the
Board,
a
clear
vision
for
the
Company’s
purpose
and
overall
values
is
articulated,
underpinning
and
defining
the
strategy
and
culture
of
the
organisation.
This
is
embedded
at
every
level
of
management.
◾
Time
was
spent
in
2019
overseeing
the
development
of
the
Company's
strategy
that
is
shaped
by
the
increasingly
sophisticated
needs
of
our
clients,
and
technological
evolution
across
our
indu
stry,
to
fulfil
the
Barclays
common
purpose
of
'Creating
Opportunities
to
Rise'.
◾
Culture
remains
a
core
area
of
focus
with
the
Board
actively
promoting
ethical
leadership
and
accountability
and
supporting
and
reinforcing
the
Barclays
’
Code
of
Conduct,
the
Barclays
Way,
and
the
Barclays
Values,
to
achieve
a
dynamic
and
positive
culture.
Principle
Two:
Division
of
responsibilities
An
effective
board
requires
a
clear
division
of
responsibilities
with
the
Chair
leading
the
board
and
being
responsible
for
its
overall
effectiveness,
and
the
executive
leadership
of
the
company’s
business
being
delegated
to
the
Chief
Executive.
The
board
should
consist
of
an
appropriate
combination
of
executive
and
independent
non
-
executive
directors
each
with
a
clear
understanding
of
their
accountability
and
responsibilities.
The
board’s
policies
and
procedures
should
support
effective
decision
-
making
and
independent
challenge.
◾
Clear
division
of
responsibilities
between
the
Chairman
and
Chief
Executive
Officer.
Detail
on
the
role
of
each
can
be
found
on
page
6.
Page
7
lists
‘who
is
on
the
Board’
with
a
majority
of
the
Board
comprised
of
independent
Non
-Executive
Directors.
◾
Polic
ies
and
protocols
are
in
place
to
support
effective
decision
-
making
and
independent
challenge,
including
the
Company’s
Charter
of
Expectations,
setting
out
clearly
the
role
and
responsibilities
of
each
Director.
The
Chairman
meets
privately
with
the
Non
-
Executive
Directors
when
appropriate
,
to
promote
required
independence.
◾
Board
duties
are
executed
in
part
through
Board
Committees,
which
provide
oversight
and
make
recommendations
on
the
matters
delegated
to
them
by
the
Board.
Detail
on
the
principal
Commi
ttees,
their
core
responsibilities
and
activities
in
2019
is
set
out
on
pages
6
to
12.
◾
Appropriate
information
and
support
is
provided
to
the
Board,
to
enable
them
to
undertake
their
work
with
due
care
and
discharge
their
responsibilities.
See
page
7
for
further
detail.
◾
The
Barclays
Group’s
Corporate
Governance
Manual
clearly
sets
out
guidelines
of
how
the
Barclays
Group
entities
and
their
respective
Boards
and
Board
committees
should
interact,
while
also
providing
guidance
and
clarity
for
management
and
directors
as
to
how
these
relationships
and
processes
should
work
in
practice.
It
is
a
dynamic
document
that
continues
to
evolve
with
the
changing
nature
of
the
Barclays
Group.
Governance
Corporate
Governance
Statement
Barclays
Bank
PLC
2019
Annual
Report
on
Form
20-F
4
Principle
Three:
Composition,
succession
and
evaluation
A
board
with
the
right
balance
of
skills,
experience
and
diversity
is
critical
to
the
sustainable
delivery
of
value
to
the
company’s
shareholder
and
broader
stakeholders.
The
size
of
the
board
should
be
guided
by
the
scale
and
complexity
of
the
company
and
appointments
should
b
e
based
on
merit
and
objective
criteria
and
with
a
view
to
promoting
diversity
and
subject
to
a
formal,
rigorous
and
transparent
procedure
which
is
underpinned
by
an
effective
succession
plan
for
board
and
senior
management.
A
successful
board
is
a
cohesiv
e
board
that
provides
informed
and
constructive
challenge
to
the
management
team
and
measures
its
effectiveness.
◾
The
size
and
composition
of
the
Board
is
appropriate
for
the
business
of
the
Barclays
Bank
Group.
There
is
a
good
balance
between
Executive
and
independent
N
on
-
Executive
directors
with
the
N
on
-
Executive
Directors
providing
independent
challenge.
The
Board
members
have
a
strong
combination
of
technical,
finance
(including
significant
financial
services
experience)
and
commercial
skills,
with
broader
experience
in
culture
and
colleague
engagement.
◾
Diversity
across
the
Barclays
Group
remains
a
key
area
of
focus
and
the
Board
diversity
target
of
33%
female
directors
was
reached
n
2019
.
◾
All
appointments
to
the
Board
and
senior
management
are
based
on
merit
and
objective
criteria.
With
a
continued
strong
belief
in
the
benefits
of
diversity
(gender,
ethnicity
and
thought)
for
an
effective
Board
and
organisation.
This
will
remain
a
key
area
of
focus
as
we
continue
to
strive
to
build
a
workfor
ce
that
reflects
the
diversity
of
our
customers
and
the
communities
we
serve.
The
approach
is
set
out
in
the
Barclays
Group
Diversity
Policy
and
further
detail
can
be
found
on
page
15.
◾
There
is
regular
review
of
the
leadership
and
succession
needs
of
the
business
to
ensure
the
depth
and
diversity
of
the
talent
and
succession
pipeline
at
the
Board,
Executive
and
one
level
down.
This
remains
a
key
focus
for
2020
to
ensure
the
quality
of
leadership
is
in
place
to
lead
the
business
in
the
delivery
of
the
strategy,
against
a
challenging
economic
and
operating
environment.
◾
As
part
of
the
simpler
and
more
effective
governance
structure,
the
membership
of
the
Board
was
largely
consolidated
with
the
BPLC
b
oard
with
effect
from
25
September
2019.
Further
detail
can
be
found
on
page
7.
◾
Effectiveness
is
driven
through
routine
evaluations
of
the
Board
and
Board
Committees.
Key
findings
are
included
for
each
committee
on
pages
6
to
13.
◾
Ongoing
focus
on
training
and
professional
development
to
provide
Board
members
with
a
deeper
and
more
granular
understanding
of
the
business
contributing
to
informed
and
sound
decision
-
making.
Further
detail
on
'training
and
induction'
can
be
found
on
page
14.
Principle
Four:
Audit,
Risk
and
Internal
Control
The
board
should
establish
formal
and
transparent
policies
and
procedures
to
(i)
identify
the
nature
and
extent
of
principal
risks
the
company
is
willing
to
take
in
order
to
achieve
its
long
-
term
strategic
o
bjectives;
(ii)
manage
such
risks
effectively;
(iii)
oversee
the
internal
control
framework;
(iv)
promote
the
independence
and
effectiveness
of
internal
and
external
audit
functions;
and
(v)
satisfy
itself
on
the
integrity
of
financial
reporting.
◾
Principal
risks
have
been
identified,
as
articulated
on
pages
25
to
43
in
line
with
the
ERMF,
with
robust
processes
in
place
to
evaluate
and
manage
such
risks;
including
regular
reporting
to,
and
oversight
by
the
Risk
Committee
and
the
Board.
◾
The
Board
ap
proves
the
Company's
risk
appetite;
the
level
of
risk
the
Company
is
prepared
to
accept
across
different
risk
types.
Significant
steps
have
been
taken
in
recent
years
to
de
-
risk
the
business,
setting
us
up
for
sustainable
growth
and
value
creation
in
the
future.
◾
Effectiveness
of
risk
management
and
internal
controls
is
reviewed
regularly
by
the
Risk
Committee
(responsible
for
providing
oversight
on
current
and
potential
future
risk
exposures)
and
the
Audit
Committee
(responsible
for
controls,
including
revi
ewing
audit
reports,
internal
controls
and
risk
management
systems).
Please
see
pages
8
–
13
for
further
detail
on
the
role
of
these
Committees.
◾
The
Audit
Committee
continues
to
provide
its
oversight
of
the
financial
reporting
processes
and
the
work
of
the
external
and
internal
auditors
(including
independence
and
effectiveness).
Further
detail
can
be
found
on
page
8.
Governance
Corporate
Governance
Statement
Barclays
Bank
PLC
2019
Annual
Report
on
Form
20-F
5
Principle
Five:
Remuneration
The
remuneration
policies
and
practices
should
support
strategy
and
promote
long
-
term
sustainable
success,
and
be
developed
in
accordance
with
formal
and
transparent
procedures,
ensuring
no
director
is
involved
in
deciding
their
own
remuneration
outcome.
Executive
remuneration
should
be
aligned
to
the
company’s
purpose
and
values
and
the
successful
delivery
of
the
strategy;
with
outcomes
taking
account
of
company
and
individual
performance,
and
wider
circumstances
such
as
pay
across
the
Company’s
workforce
and
Barclays’
Fair
Pay
agenda.
◾
Barclays’
Remuneration
Policy
is
set
by
the
BPLC
r
emuneration
c
ommittee,
but
adopted
by
the
Company’s
independent
Remuneration
Committee.
Remuneration
is
aligned
to
the
Company’s
strategy
and
risk
management
approach
and
designed
to
promote
the
long
-
term
success
of
the
Company.
◾
Executive
and
senior
management
remuneration
appr
oaches
are
developed
in
accordance
with
the
Group’s
formal
procedures
(ensuring
no
Director
is
involved
in
deciding
their
own
remuneration
outcome)
and
having
regard
to
workforce
remuneration
policies
and
alignment
of
incentives
and
rewards
with
culture
an
d
performance
as
reviewed
annually
by
the
B
PLC
r
emuneration
committee
and
shared
with
the
Company
’s
Remuneration
Committee.
◾
The
Remuneration
Committee
has
clearly
defined
terms
of
reference,
with
responsibility
for
the
development
of
a
remuneration
approv
al
framework
to
ensure
an
appropriate
level
of
oversight
of
senior
remuneration
decisions,
as
well
as
annual
consideration
of
the
Company
incentive
pool
to
ensure
alignment
with
delivery
of
the
Company’s
strategic
ambitions.
◾
Barclays
remains
focussed
on
improving
its
gender
pay
gap
position,
with
the
2019
gender
pay
gap
statistics
due
to
be
published
on
the
Government’s
Gender
Pay
Gap
reporting
portal
on
13
February
2020,
along
with
a
Pay
Gaps
report
in
which
B
arclays
makes
both
statutory
g
ender
p
ay
gap
disclosures
and
voluntary
ethnicity
p
ay
g
ap
disclosures.
Principle
Six:
Stakeholder
r
elationships
and
engagement
Directors
should
foster
effective
stakeholder
relationships
aligned
to
the
company’s
purpose.
The
board
should
recognise
the
importance
of
listening
to,
and
understanding
the
views
of
its
stakeholders,
including
the
workforce,
and
specifically
the
impact
of
the
company’s
behaviour
and
business
on
customers
and
clients,
colleagues,
suppliers,
communities
and
society
more
broadly;
having
regard
to
these
views
and
impact
when
taking
decisions.
◾
Through
the
Company’s
defined
purpose
and
strategy,
key
stakeholders
on
whom
the
success
of
the
Company
depends
are
identified.
◾
The
Board
seeks
to
understand
key
stakeholders’
views,
and
the
impact
of
our
behaviour
and
business
on
customers
and
clients,
colleagues,
suppliers,
communities
and
society
more
broadly.
There
is
more
to
be
done
in
this
regard
in
2020.
◾
The
Board
monitors
key
indicators
across
areas
such
as
culture,
citizenship,
conduct
and
customer
satisfaction
on
a
continuing
and
ongoing
basis.
◾
Engagement
by
Board
and
management
throughout
the
year
with
broader
stakeholders
through
participation
in
forums
and
roundtables
and
joining
industry,
sector
and
topic
debates.
◾
Our
long
-
standing
commitment
to
the
importance
and
value
of
colleague
engagement
continues;
our
people
are
our
most
valuable
asset.
Governance
Corporate
Governance
Statement
Barclays
Bank
PLC
2019
Annual
Report
on
Form
20-F
6
Current
Directors
Nigel
Higgins
–
Chairman
Mike
Ashley
–
Non
-
Executive
Director
and
Board
Audit
Committee
Chairman
Tim
Breedon
–
Non
-
Executive
Director,
Board
Risk
Committee
and
Remuneration
Committee
Chairman
Mary
Anne
Citrino
–
Non
-
Executive
Director
Mohamed
A.
El-Erian
(Appointed
1
January
2020)
-
Non
-
Executive
Director
Dawn
Fitzpatrick
-
Non
-
Executive
Director
Mary
Francis
-
Non
-
Executive
Director
Diane
Schueneman
-
Non
-
Executive
Director
Jes
Staley
–
Chief
Executive
Officer
Tushar
Morzaria
–
Executive
Director
The
Board
Executive
and
Non
-
Executive
Directors
share
the
same
duties
and
are
subject
to
the
same
constraints.
However,
a
clear
division
of
responsibilities
has
been
established.
The
Chairman
is
responsible
for
leading
the
Board
and
its
overall
effectiveness,
demons
trating
objective
judgement
and
promoting
a
culture
of
openness
and
constructive
debate
between
all
Directors.
The
Chairman
facilitates
constructive
board
relations,
the
effective
contribution
of
all
Non
-
Executive
Directors
and
ensures
Directors
receive
accurate,
clear
and
timely
information.
It
is
our
responsibility
as
the
Board
to
ensure
that
management
deliver
on
short
-
term
objectives,
whilst
promoting
the
long
-
term
success
of
the
Company
and
the
Barclays
Group.
We
are
also
responsible
for
ensuring
that
management
maintains
an
effective
system
of
internal
control.
An
effective
system
of
internal
control
should
provide
assurance
of
effective
and
efficient
operations,
internal
financial
controls
and
compliance
with
law
and
regulation.
In
meeting
this
respon
sibility,
we
consider
what
is
appropriate
for
the
Company’s
business
and
reputation,
the
materiality
of
financial
and
other
risks
and
the
relevant
costs
and
benefits
of
implementing
controls.
Since
BBPLC
became
a
non
-
ring
fenced
bank
in
April
2018,
the
Board
has
been
responsible
for
the
Barclays
Bank
Group,
Barclays
International
division,
some
of
its
head
office
and
legacy
matters.
The
previous
Chairman,
Sir
Gerry
Grimstone,
resigned
from
the
BBPLC
Board
in
February
2019
and
Nigel
Higgins
was
appointe
d
in
his
stead
on
1
March
2019.
Since
his
appointment,
Nigel
has,
with
BPLC
b
oard
and
regulators,
been
reviewing
the
operation
of
the
Board
particularly
with
a
view
to
optimising
the
effectiveness
of
the
Barclays
Groups’
governance
through
consolidation
an
d
simplification
wherever
possible,
reducing
duplication
and
complexity,
ensuring
that
the
most
critical
issues
are
handled
directly
by
the
BPLC
b
oard.
This
has
ultimately
resulted
in
a
decision
to
largely
consolidate
membership
of
the
Board
with
that
of
the
BPLC
b
oard
to
create
a
simpler,
more
efficient
governance
structure.
This
resulted
in
the
reconstitution
of
the
Board
with
its
membership
drawn
exclusively
from
the
BPLC
b
oard.
The
BBPLC
Schedule
of
Matters
Reserved
to
the
Board
has
been
reviewed
an
d
revised
to
ensure
that
appropriate
coordination
with
the
governance
of
the
consolidated
boards
is
in
place.
Similarly,
a
review
has
been
undertaken
to
ensure
the
B
oard
Committees
are
appropriately
constituted
and
coordinated
with
the
Board
c
ommittees
of
BPLC.
The
Matters
Reserved
specifies
those
decisions
to
be
taken
by
the
Board,
including
but
not
limited
to
material
decisions
relating
to
strategy,
risk
appetite,
medium
term
plans,
capital
and
liquidity
plans,
risk
management
and
controls
frameworks,
app
roval
of
financial
statements,
approval
of
share
allotments
and
dividends.
The
Board
has
delegated
the
responsibility
for
making
and
implementing
operational
decisions
and
running
the
Company’s
business
on
a
day
-
to-
day
basis
to
the
Chief
Executive
Officer
and
his
senior
management
team.
As
listed
in
‘Current
Directors’
above,
the
Board
comprises
a
Chairman,
who
was
independent
on
appointment,
two
Executive
Directors
and
seven
independent
Non
-
Executive
Directors.
The
majority
of
the
Board
are
independent
Non
-Executive
Directors
bringing
significant
expertise
(including
external
perspectives)
and
independent
challenge.
The
independence
of
our
Non-
Executive
Directors
is
considered
annually.
Governance
Corporate
Governance
Statement
Barclays
Bank
PLC
2019
Annual
Report
on
Form
20-F
7
Attendance
Directors
are
expected
to
attend
every
Board
meeting.
I
n
2019,
attendance
was
very
strong
at
scheduled
meetings,
as
reflected
in
the
table
below:
Director
Eligible
Meeting
Attendance
(excluding
ad
hoc
meetings)
Appointment
Dates
Nigel
Higgins
7/7
Appointed
1
March
2019
Mike
Ashley
3/3
Appointed
25
September
2019
Tim
Breedon
3/3
Appointed
25
September
2019
Mary
Anne
Citrino
3/3
Appointed
25
September
2019
Mary
Francis
3/3
Appointed
25
September
2019
Dawn
Fitzpatrick
3/3
Appointed
25
September
2019
Matthew
Lester
3/3
Appointed
25
September
2019;
retired
1
January
2020
Tushar
Morzaria*
3/3
Appointed
25
September
2019
Diane
Schueneman
3/3
Appointed
25
September
2019
Jes
Staley**
6/6
Appointed
26
March
2019
Sir
Gerry
Grimstone
2/2
Resigned
28
February
2019
Peter
Bernard
6/7
Resigned
25
September
2019
Steven
Ewart*
7/7
Resigned
25
September
2019
Helen
Keelan
6/7
Resigned
25
September
2019
Maria
Richter
6/7
Resigned
25
September
2019
Jeremy
Scott
7/7
Resigned
25
September
2019
Tim
Throsby**
3/3
Resigned
26
March
2019
Alex
Thursby
6/7
Resigned
25
September
2019
Hélène
Vletter
-
van
Dort
7/7
Resigned
25
September
2019
*
Following
Steven
Ewart’s
resignation
as
a
Director
on
25
September
2019,
Tushar
Morzaria
was
appointed
as
an
Executive
Director.
Steven
Ewart
remains
as
the
Chief
Financial
Officer.
**
Following
Tim
Throsby’s
resignation
as
Chief
Executive
Officer
and
Director,
Jes
Staley
was
appointed
as
Chief
Executive
Officer
and
Executive
Director
of
Barclays
Bank
PLC.
What
we
did
in
2019
During
2019,
the
Board
focused
on
the
following
specific
areas:
Strategy
and
operational
matters
◾
Received
deep
dive
business
presentations
from
Banking,
Merchant
Acquiring,
Barclays
Partner
Finance
and
Private
Banking
and
Overseas
Services.
◾
Provided
with
an
overview
of
BX,
its
structure
and
costs.
◾
Discussed
and
considered
the
impact
of
the
UK’s
decision
to
leave
the
EU
and
the
transfer
of
the
Company’s
European
business
to
Barclays
Bank
Ireland
PLC
under
the
European
Referendum
Response
Programme.
◾
Discussed
regular
updates
from
the
Chief
Executive
Officer
and
BBPLC
President
on
the
progress
being
made
against
the
BBPLC
strategy,
key
strategic
p
rojects
and
recruitment.
Finance
and
liquidity
◾
Regularly
assessed
financial
performance
of
the
various
businesses
and
the
Barclays
Bank
Group
results
through
reports
from
the
BBPLC
Chief
Financial
Officer
and
through
business
specific
updates
to
the
Board.
◾
Reviewed
and
approved
BBPLC’s
financial
results
prior
to
publication.
◾
Considered
and
approved
the
BBPLC
elements
of
the
Group
Recovery
Plan.
◾
Consider
ed
and
approved
the
BBPLC
Medium
Term
Plan
(‘MTP’)
in
which
strategy
is
embedded,
together
with
related
funding
and
capital
plans
for
BBPLC.
Governance
and
risk
(including
regulatory
issues)
◾
Delegated
authority
to
the
Risk
Committee
to
consider
and
recommend,
on
behalf
of
the
Board,
the
adoption
by
the
Company
of
the
Internal
Capital
Adequacy
Assessment
Process
and
Internal
Liquidity
Adequacy
Assessment
Process.
◾
Received
regular
updates
on
key
risk
themes
and
approved
the
Company’s
r
isk
appetite.
◾
Re
ceived
reports
on
Barclays’
operational
and
technology
capability,
including
specific
updates
on
cyber
risk
capability
and
resilience,
and
a
service
management
update
in
respect
of
services
provided
by
BX
Limited,
the
Barclays
Group
service
company.
◾
Considered
and
approved
appointments
to
the
BBPLC
Board
and
appointment
of
senior
executives
following
recommendation
from
the
Nominations
Committee.
◾
Received
regular
reports
from
the
Chairmen
of
each
Board
Committee.
See
the
reports
from
the
Committee
Chairmen
below
and
on
the
following
page.
◾
Received
and
considered
the
feedback
from
the
Barclays
Group’s
principal
regulators
including
the
PRA
PSM
Letter,
FCA
Firm
Evaluation
Letter,
FED
Letter
in
respect
of
the
IHC
Governance
review
and
the
FDIC
Exam
on
the
governance
of
Barclays
Bank
Delaware.
◾
Provided
an
attestation
to
the
PRA
in
respect
of
the
ring
-
fenced
bank
and
operational
resilience.
◾
Considered
the
results
of
the
external
Board
Evaluation
conducted
by
Independent
Board
Evaluation.
Governance
Corporate
Governance
Statement
Barclays
Bank
PLC
2019
Annual
Report
on
Form
20-F
8
Board
Committees
The
main
Board
Committees
are
the
Audit
Committee,
the
Nominations
Committee,
the
Remuneration
Committee
and
the
Risk
Committee.
Pursuant
to
authority
granted
under
our
Articles
of
Association,
each
Board
Committee
has
had
specific
responsibilities
delegated
to
it
by
the
Board.
You
can
read
about
what
each
of
the
Committees
did
during
2019
on
the
following
pages.
The
Chairmen
of
each
Board
Committee
provide
a
report
on
Committee
business
at
each
Board
meeting,
including
the
matters
being
recomme
nded
by
a
Committee
for
Board
approval.
Board
Audit
Committee
The
Audit
Committee
is
comprised
solely
of
independent
Non
-
Executive
Directors,
with
membership
designed
to
provide
the
breadth
of
financial
expertise
and
commercial
acumen
it
needs
to
fulfil
its
responsibilities.
Its
members
as
a
whole
have
recent
and
relevant
experience
of
the
banking
and
financial
services
sector,
in
addition
to
general
management
and
commercial
experience,
and
are
financially
literate.
The
Audit
Committee
is
chaired
by
Mike
Ashley
who
has
over
20
years
accounting
and
audit
experience.
Diane
Schueneman
and
Tim
Breedon
are
members
of
the
Committee.
Matthew
Lester
was
a
member
of
the
Committee
until
he
stepped
down
from
the
Board
on
1
January
2020.
The
Audit
Committee
met
nine
times
during
2019.
Audit
Committee
meetings
were
attended
by
representatives
from
management
in
respect
of
matters
relevant
to
their
function
or
business
area,
including
the
BBPLC
Chief
Financial
Officer
and,
Barclays
Group
and/or
BBPLC
Chief
Compliance
Officer,
Chief
Controls
Officer,
Chief
Operating
Officer,
Chief
Internal
Auditor,
General
Counsel
,
as
appropriate
and
the
Company’s
External
Auditors,
KPMG.
The
Audit
Committee
held
a
number
of
separate
private
sessions
with
each
of
the
Chief
Internal
Auditor
and
the
lead
external
audit
partner,
which
were
not
attended
by
management.
As
part
of
the
Company’s
commitment
to
effective
oversight
and
allocation
of
responsibilities
between
the
BPLC
audit
committee,
the
Barclays
Bank
UK
PLC
audit
committee
and
the
Committee,
the
Audit
Chairs
of
these
committees
met
regularly
during
2019
to
share
relevant
information
and
to
ensure
embedment
of
information
flows
and
governance
practice.
In
addition,
regular
dialogue
has
been
held
with
the
Audit
Committees
of
the
Company’s
major
subsidiaries,
Barclays
Bank
Ireland
PLC
and
the
Barclays
US
LLC.
An
externally
facilitated
review
of
the
effectiveness
of
the
Board
and
Board
members
was
undertaken
in
the
first
quarter
of
2019.
Following
the
consolidation
and
streamlining
of
the
membership
of
the
BPLC
and
BBPLC
b
oards
and
the
change
in
membership
of
the
Audit
Committee
,
it
was
agreed
that
the
recommendations
from
the
re
view
of
the
performance
of
the
BPLC
Audit
Committee
would
be
adopted
as
the
review
of
Audit
Committee
performance
in
2019.
The
results
confirm
that
the
Audit
Committee
is
operating
effectively
and
provide
s
an
effective
level
of
challenge
and
oversight
of
the
areas
within
its
remit.
It
was
noted
that
coverage
of
BBPLC
matters
within
concurrent
meetings
was
considered
appropriate
and
would
benefit
from
further
embedment.
Attendance
at
the
Audit
Committee
du
ring
2019
was
as
follows:
Member
Eligible
Meeting
Attendance
Appointment
Dates
Mike
Ashley
(Chairman)
2/2
Appointed
25
September
2019
Tim
Breedon
2/2
Appointed
25
September
2019
Matthew
Lester
2/2
Appointed
25
September
2019;
retired
1
January
2020
Diane
Schueneman
2/2
Appointed
25
September
2019
Jeremy
Scott
(Former
Chairman)
7/7
Retired
25
September
2019
Peter
Bernard
7/7
Retired
25
September
2019
Helen
Keelan
7/7
Retired
25
September
2019
Alex
Thursby
7/7
Retired
25
September
2019
The
principal
role
and
responsibilities
of
the
Audit
Committee,
pursuant
to
its
Terms
of
Reference,
are:
◾
Assessing
the
integrity
of
the
Barclays
Bank
Group’s
financial
reporting
and
satisfying
itself
that
any
significant
financial
judgements
made
by
management
are
sound;
◾
Evaluating
the
effectiveness
of
the
Barclays
Bank
Group’s
internal
controls,
including
internal
financial
controls;
◾
Scrutinising
the
activities
and
performance
of
the
internal
and
external
auditors,
including
monitoring
their
independ
ence
and
objectivity;
◾
Overseeing
the
relationship
with
the
Barclays
Bank
Group’s
external
auditor;
◾
Reviewing
and
monitoring
the
effectiveness
of
the
Barclays
Bank
Group’s
whistleblowing
procedures;
◾
Overseeing
significant
legal
and
regulatory
investigations,
including
the
proposed
litigation
statement
for
inclusion
in
the
Company’s
statutory
accounts.
During
2019,
the
principal
activities
of
the
Audit
Committee
included:
◾
Financial
reporting:
assessing
the
appropriateness
of
key
accounting
themes,
disclosures,
issues
and
judgements,
including
in
respect
of
IFRS9.
◾
Impairment:
assessing
the
appropriateness
of
impairment
experience
against
forecast
and
considering
whether
impairment
provisions
were
appropriate.
◾
Conduct
provisions:
analysing
the
judgeme
nts
and
estimates
made
with
regard
to
the
Barclays
Bank
Group’s
material
conduct
provisions.
Governance
Corporate
Governance
Statement
Barclays
Bank
PLC
2019
Annual
Report
on
Form
20-F
9
◾
Legal,
competition
and
regulatory
provisions:
evaluating
advice
on
the
status
of
current
legal,
competition
and
regulatory
matters
and
considering
the
adequacy
of
disclosures;
assessing
management’s
judgements
and
estimates
regarding
provisions.
◾
Valuations:
monitoring
the
valuation
methods
applied
by
management
to
significant
valuation
items
and
areas
of
judgement.
◾
Tax:
overseeing
tax
matters
relating
to
the
Barcla
ys
Bank
Group,
including
tax
risk
provisions
and
regulatory
matters.
◾
Internal
controls
and
business
control
environment:
evaluating
the
status
of
the
most
material
control
issues
identified
by
management,
including
the
Barclays
Group
Internal
Control
Enhan
cement
Programme;
receiving
deep
dives
on
the
status
of
specific
control
issues
across
the
business
of
the
Barclays
Bank
Group
and
functions,
and
on
progress
of
the
related
remediation
programmes
and
lessons
learned
from
critical
risk
events.
Utilising
the
output
from
the
Risk
and
Control
Self
Assessments
(RCSA)
to
review
and
monitor
the
control
environment
and
related
risks.
◾
Raising
concerns:
reviewing
the
annual
report
on
whistleblowing
matters,
including
reporting
and
training
and
key
areas
of
the
Barcl
ays
Bank
Group’s
whistleblowing
procedures
and
controls.
Monitoring
whistleblowing
metrics
and
instances
of
retaliation
reports,
including
whether
any
instances
had
been
substantiated.
◾
Internal
audit:
receiving
thematic
control
and
operational
reporting
from
Barclays
Internal
Audit;
overseeing
issues
arising
from
unsatisfactory
audit
reports;
evaluating
reports
regarding
Barclays
Internal
Audit’s
assessment
of
the
management
control
approach
and
control
environment
in
the
Barclays
Bank
Group.
◾
External
audit:
reviewing
and
approving
the
annual
audit
plan
for
the
Barclays
Bank
Group,
including
the
main
areas
of
focus,
and
assessing
the
progress
of
the
2019
audit.
The
Audit
Committee
also
reviewed
audit
quality
and
discussed
KPMG’s
feedback
on
the
Company’
s
critical
accounting
estimates
and
judgements.
In
2020
the
Committee
will
still
continue
to
monitor
the
embedment
of
IFRS
9
processes
and
further
enhancements
to
our
disclosure,
particular
as
regards
sensitivities.
We
will
also
be
looking
to
assess
the
reporting
of
control
issues
after
the
conclusion
of
Barclays
Internal
Controls
Enhancement
Programme
(‘BICEP’)
as
well
as
monitor
the
satisfactory
completion
of
remediation
programmes
which
are
due
to
extend
beyond
31
March
2020
,
in
particular
the
Designated
Market
Activities
(‘DMA’)
remediation
plan.
Board
Nominations
Committee
The
Nominations
Committee
is
comp
rised
solely
of
independent
Non
-
Executive
Directors.
Nigel
Higgins,
as
Chairman
of
the
BBPLC
Board,
Mike
Ashley,
Tim
Breedon
and
Diane
Schueneman,
are
also
members.
The
Nominations
Committee
met
three
times
during
2019.
Attendance
by
the
Nominations
Committee
members
is
shown
in
the
table
below,
and
Nominations
Committee
meetings
were
attended
during
the
ye
ar
by
the
Chief
Executive
Officer,
President
of
BBPLC,
the
BPLC
HR
Director
and
the
BBPLC
Head
of
Talent
as
appropriate.
An
externally
facilitated
review
of
the
effectiveness
of
the
Board
and
Board
members
was
undertaken
in
the
first
quarter
of
2019.
Fol
lowing
the
consolidation
and
streamlining
of
the
membership
of
the
BPLC
and
BBPLC
Boards
and
the
change
in
membership
of
the
n
ominations
c
ommittee,
it
was
agreed
that
the
recommendations
from
the
review
of
the
performance
of
the
BPLC
Nominations
Committee
would
be
adopted
as
the
review
of
Nominations
Committee
performance
in
2019.
The
results
confirm
that
the
Nominations
Committee
is
operating
effectively
and
provides
an
effective
level
of
challenge
and
oversight
of
the
areas
within
its
remit.
It
was
noted
that
coverage
of
BBPLC
matters
within
concurrent
meetings
was
considered
appropriate
and
would
benefit
from
further
embedment.
Attendance
at
the
Nominations
Committee
during
2019
was
as
follows:
Member
Eligible
Meeting
Attendance
(excluding
ad
hoc
meetings)
Appointment
Dates
Nigel
Higgins
(Chairman)
2/2
Appointed
1
March
2019
Mike
Ashley
2/2
Appointed
25
September
2019
Tim
Breedon
2/2
Appointed
25
September
2019
Diane
Schueneman
2/2
Appointed
25
September
2019
Sir
Gerry
Grimstone
(Former
Chairman)
1/1
Resigned
28
February
2019
Jeremy
Scott
1/1
Resigned
25
September
2019
Peter
Bernard
1/1
Resigned
25
September
2019
Hélène
Vletter
-
van
Dort
1/1
Resigned
25
September
2019
The
principal
role
and
responsibilities
of
the
Nominations
Committee,
pursuant
to
its
Terms
of
Reference,
are:
◾
Considering
b
oard
appointments
to
the
Board,
its
Committees
and
its
significant
subsidiaries;
◾
Considering
composition
of
the
Board
and
its
Committees;
◾
Considering
succession
planning
and
talent
management
;
◾
Evaluating
Board
effectiveness;
◾
Assessing
serving
Directors
tenure;
◾
Considering
b
oard
induction
and
training;
◾
Evaluating
conflicts
of
interest;
and
◾
Evaluating
g
overnance
m
atters.
Governance
Corporate
Governance
Statement
Barclays
Bank
PLC
2019
Annual
Report
on
Form
20-F
10
During
2019,
the
principal
activities
of
the
Committee
included:
◾
Reviewing
the
Board
and
Board
Committee
composition,
taking
into
account
time
commitment,
skills,
knowledge,
experience
and
diversity
of
the
Directors,
and
identifying
any
desirable
skills
to
aid
the
Company
in
operating
and
competing
effectively;
◾
Review
and
approv
al
of
proposed
changes
to
the
Board
of
a
number
of
the
Company’s
significant
subsidiaries,
including
but
not
limited
to
reviewing
the
composition
of
the
b
oards
of
Barclays
US
LLC,
Barclays
Bank
Delaware
and
Barclays
Capital
Securities
Limited;
and
◾
Receiving
updates
on
the
Company
’s
executive
governance
framework,
talent
and
succession
management
and
key
appointments
to
the
Executive
Committee,
the
succession
planning
review
process
for
the
Executive
Committee
and
the
global
Barclays
Group
campaigns
to
promote
a
diverse
and
inclusive
workforce.
Board
Remuneration
Committee
The
Remuneration
Committee
is
comprised
solely
of
independent
Non
-
Executive
Directors.
The
Remuneration
Committee
is
chaired
by
Tim
Breedon
with
Mary
Francis
as
a
member.
The
principal
role
and
responsibilities
of
the
Remuneration
Committee,
pursuant
to
its
Terms
of
Reference,
is
to:
◾
Adopt
the
over
-
arching
principles
of
remuneration
policy
for
the
Barclays
Bank
Group
within
the
parameters
set
by
the
BPLC
r
emuneration
commit
tee;
◾
Consider
and
endorse
the
incentive
pool
for
the
Company
and
its
subsidiaries
and
the
remuneration
of
key
BBPLC
executives
and
other
specified
individuals
as
determined
by
the
Remuneration
Committee
from
time
to
time;
◾
Exercise
oversight
of
remuneration
issues
within
the
Barclays
Bank
Group
and
of
matters
that
more
generally
concern
people
and
culture
within
the
Barclays
Bank
Group;
and
◾
Approve
the
remuneration
and
compensation
arrangement
of
employees
that
fall
within
the
remit
of
the
Remuneration
Commi
ttee.
The
Remuneration
Committee
met
five
times
during
2019
.
Attendance
by
the
Remuneration
Committee
members
is
shown
in
the
table
below.
Remuneration
Committee
meetings
are
attended
by
management,
including
the
Chief
Executive
Officer
and
the
BPLC
HR
Director.
An
externally
facilitated
review
of
the
effectiveness
of
the
Board
and
Board
members
was
undertaken
in
the
first
quarter
of
2019.
Following
the
streamlining
of
the
membership
of
the
BPLC
and
BBPLC
b
oards
and
the
change
in
membership
of
the
Remune
ration
Committee,
it
was
agreed
that
the
recommendations
from
the
review
of
the
performance
of
the
BPLC
Remuneration
Committee
would
be
adopted
as
the
review
of
Remuneration
Committee
performance
in
2019.
The
results
confirm
that
the
Remuneration
Committee
is
operating
effectively
and
provides
an
effective
level
of
challenge
and
oversight
of
the
areas
within
its
remit.
It
was
noted
that
coverage
of
BBPLC
matters
within
concurrent
meetings
was
considered
appropriate
and
would
benefit
from
further
embedment.
Attendance
at
the
Remuneration
Committee
during
2019
was
as
follows:
Member
Eligible
Meeting
Attendance
(excluding
ad
hoc
meetings)
Appointment
Dates
Tim
Breedon
(Chairman)
2/2
Appointed
25
September
2019
Mary
Francis
2/2
Appointed
25
September
2019
Hélène
Vletter
-
van
Dort
(Former
Chair)
3/3
Resigned
25
September
2019
Helen
Keelan
3/3
Resigned
25
September
2019
Maria
Richter
3/3
Resigned
25
September
2019
Alex
Thursby
3/3
Resigned
25
September
2019
During
the
period,
the
Remuneration
Committee’s
activities
have
included:
◾
Approving
the
Group
People
Risk
Reward
Policy,
Material
Risk
Taker
Identification
Methodology,
and
2019
Incentive
Funding
Frameworks;
◾
Endorsing
the
funding
ratio;
◾
Approving
the
201
9
Ex
Ante
Risk
adjustments;
◾
Approving
the
ex
-
post
risk
and
conduct
adjustments
approach
for
individual
remuneration;
◾
Receiving
regular
stakeholder,
regulatory
and
legal
updates,
financial
and
risk
performance
updates,
pay
round
timings
and
approach,
and
co
nsolidation
of
the
Fair
Pay
Agenda;
and
◾
Reviewing
specific
remuneration
arrangements
for
individuals
within
the
Remuneration
Committee’s
remit.
Board
Risk
Committee
The
Risk
Committee
is
comprised
solely
of
independent
Non
-
Executive
Directors
.
Following
the
consolidation
and
streamlining
of
the
BPLC
and
BBPLC
boards
in
September
2019,
membership
of
the
Risk
Committee
was
aligned
with
the
BPLC
risk
committee.
The
Risk
Committee
is
chaired
by
Tim
Breedon.
Mike
Ashley,
Mary
Anne
Citrino,
Dawn
Fitzpatrick
and
Diane
Schueneman
are
members
of
the
Committee.
Matthew
Lester
was
a
member
of
the
Committee
until
he
stepped
down
from
the
Board
on
1
January
2020.
During
2019,
the
Risk
Committee
met
eight
times,
and
also
held
a
number
of
ad
hoc
meetings
duri
ng
the
year.
One
of
the
key
roles
of
the
Risk
Committee
is
to
review
and
challenge
the
risk
profile
and
risk
appetite
of
the
Barclays
Bank
Group,
and
to
consider
key
risk
issues
and
internal
control
and
risk
policies
concerning
the
Barclays
Bank
Group.
Risk
Committee
meetings
are
attended
by
management,
including
the
BBPLC
Chief
Financial
Officer
and,
Barclays
Group
and/or
BBPLC
Chief
Risk
Officer,
Chief
Compliance
Officer,
Chief
Internal
Auditor,
General
Counsel,
as
appropriate
and
the
Company’s
External
A
uditors,
KPMG.
Following
the
BPLC
and
BBPLC
consolidation,
the
Committee
continued
to
invite
the
relevant
BBPLC
Senior
Manager
to
attend
meetings
for
the
appropriate
agenda
items.
Governance
Corporate
Governance
Statement
Barclays
Bank
PLC
2019
Annual
Report
on
Form
20-F
11
An
externally
facilitated
review
of
the
effectiveness
of
the
Board
and
Boar
d
members
was
undertaken
in
the
first
quarter
of
2019.
Following
the
streamlining
of
the
membership
of
the
BPLC
and
BBPLC
b
oards
and
the
change
in
membership
of
the
Risk
Committee,
it
was
agreed
that
the
recommendations
from
the
review
of
the
performance
o
f
the
BPLC
r
isk
committee
would
be
adopted
as
the
review
of
Risk
Committee
performance
in
2019.
The
results
confirm
that
the
Risk
Committee
is
operating
effectively
and
provides
an
effective
level
of
challenge
and
oversight
of
the
areas
within
its
remit.
I
t
was
noted
that
coverage
of
BBPLC
matters
within
concurrent
meetings
was
considered
appropriate
and
would
benefit
from
further
embedment.
Attendance
at
the
Risk
Committee
during
2019
was
as
follows:
Member
Eligible
Meeting
Attendance
in
2019
(excluding
ad
hoc
meetings)
Appointment
Dates
Tim
Breedon
(Chairman)
3/3
Appointed
25
September
2019
Mike
Ashley
3/3
Appointed
25
September
2019
Mary
Anne
Citrino
3/3
Appointed
25
September
2019
Dawn
Fitzpatrick
Nil
Appointed
1
January
2020
Matthew
Lester
3/3
Appointed
25
September
2019;
retired
1
January
2020
Diane
Schueneman
3/3
From
25
September
2019
Peter
Bernard
(Former
Chairman)
5/5
Retired
25
September
2019
Jeremy
Scott
5/5
Retired
25
September
2019
Maria
Richter
5/5
Retired
25
September
2019
Hélène
Vletter
-
van
Dort
5/5
Retired
25
September
2019
The
principal
role
and
responsibilities
of
the
Risk
Committee,
pursuant
to
its
Terms
of
Reference,
is
to
review,
on
behalf
of
the
Board,
management’s
recommendations
on
the
principal
risks
as
set
out
in
the
ERMF
with
the
exception
of
Reputation
r
isk
which
is
a
matter
reserved
to
the
Board,
and
in
particular:
◾
Review,
on
behalf
of
the
Board,
the
management
of
the
principal
risks
in
the
ERMF;
◾
Consider
and
recommend
to
the
Board,
within
the
risk
p
arameters
set
by
the
BPLC
r
isk
committee,
the
Company’s
risk
appetite
and
tolerance
for
those
principal
risks;
◾
Review,
on
behalf
of
the
Board,
the
Barclays
Bank
Group’s
risk
profile
for
those
principal
risks;
and
◾
Commission,
receive
and
consider
reports
on
key
risk
issues.
During
2019,
the
principal
activities
of
the
Risk
Committee
included:
◾
Advising
the
Board
on
the
appropriate
risk
appetite
and
risk
tolerance
for
the
principal
risks
in
the
ERMF
when
determining
strategy,
including
recommending
to
the
Bo
ard
for
approval
the
proposed
overall
r
isk
appetite
and
risk
limits
for
the
Company.
◾
Considering
and
approving
the
Company’s
capital
and
liquidity
stress
test
scenarios,
and
the
results
of
different
stress
and
reverse
stress
assumptions,
including
both
internal
stress
tests
and
those
proposed
by
external
regulatory
bodies.
◾
Ensuring
that
the
Company
has
enough
capital,
liquidity
and
financial
resources
to
meet
its
regulatory
requirements
and
obligations.
◾
Reviewing
and
considering
the
operational
risks
arising
from
the
Company’s
procedures,
processes,
systems
and
policies,
and
annual
approval
of
the
operational
risk
tolerance
statement.
◾
Evaluating
the
appropriateness
of
Barclays’
Model
r
isk
management
framework
and
receiving
and
considering
reports
from
management
on
specific
modelling
processes.
◾
Overseeing
the
management
of
Conduct
r
isk
within
BBPLC,
and
the
performance
of
the
Compliance
function.
◾
Overseeing
the
Company’s
regulatory
requirements,
as
they
relate
to
risk
management,
including
regulatory
and
internal
capital
and
funding
requirements,
approving
the
Company’s
Internal
Capital
Adequacy
Assessment
Process
and
Individual
Liquidity
Adequacy
Assessment
Process
and
considering
and
recommending
the
Company’s
Resolution
and
Recovery
Plan
to
the
Board
for
approval.
◾
Reviewing
the
frameworks,
policies
and
resources
in
place
to
support
effective
risk
management
and
oversight
of
the
Barclays
Bank
Grou
p.
◾
Reviewing
performance
against
risk
metrics
and
advising
the
Remuneration
Committee
when
making
remuneration
decisions
for
2019.
◾
Reviewing
and
approving
strategic
transactions
above
standard
thresholds,
taking
account
of
the
impact
on
the
Company’s
risk
profile
and
overall
r
isk
appetite.
◾
Reviewing
and
endorsing
statements
in
relation
to
the
Company’s
principal
risks
and
the
effectiveness
of
the
Company’s
risk
management
systems
made
in
the
Company’s
Strategic
Report,
A
nnual
Report,
and
Pillar
3
report
ing.
Governance
Corporate
Governance
Statement
Barclays
Bank
PLC
2019
Annual
Report
on
Form
20-F
12
The
Risk
Committee
continually
considers
the
impact
of
issues
on
the
Barclays
Bank
Group
and
the
risk
environment
in
which
it
operates.
It
reviews
steps
taken
by
the
business
to
manage
exposures
in
this
context.
The
Risk
Committee
also
received
focused
presentations
on
a
number
of
areas
specific
to
the
business
and
activities
of
Barclays
Bank
Group
(including
through
joint
presentations
with
the
BPLC
r
isk
committee),
including:
◾
Risk
appetite
and
risk
profile:
to
review
the
key
themes
arising
from
the
current
and
prospective
macroeconomic,
geopolitical,
macro
-
prudential
and
financial
environment
and
their
impact
on
the
Company’s
risk
appetite
and
risk
profi
le.
◾
Conduct
r
isk:
to
receive
an
overview
of
the
oversight
and
management
of
Conduct
r
isk
across
the
Barclays
Bank
Group
and
the
role
of
the
Compliance
function
in
the
management
of
Conduct
r
isk.
◾
Stress
testing:
the
Risk
Committee
considered
the
2019
Group
Recovery
Plan
for
BBPLC
ahead
of
approval
by
the
Board
and
the
initial
submission
of
the
Biennial
Exploratory
Scenario
submission
to
the
Bank
of
England.
◾
Deep
dive
on
the
Structured
Products
business:
to
provide
the
Risk
Committee
with
an
update
on
the
governance
processes
embedded
by
the
Risk
Function
to
ensure
the
structured
products
business
is
grown
in
a
controlled
manner.
◾
Certain
important
sovereign
exposures
of
the
bank.
◾
US
credit
c
ard
r
isk:
to
inform
the
Risk
Comm
ittee
on
the
risk
profile
and
risk
performance
of
the
business
within
both
current
and
stressed
macro-
economic
conditions;
and
continued
progress
in
embedding
the
control
environment.
◾
Strategic
transactions:
to
review
and
approve
strategic
transactions
abo
ve
standard
thresholds,
taking
account
of
the
impact
on
the
Company’s
risk
profile
and
overall
risk
appetite.
In
2020,
the
Risk
Committee
will
continue
to
focus
on
the
impact
of
the
external
environment
on
the
risk
profile
of
the
Barclays
Bank
Group,
particularly
as
the
negotiations
on
the
future
trade
relationship
with
the
EU
progress
and
the
broader
geopolitical
context
evolves
in
the
run
up
to
the
US
presidential
election.
The
Risk
Committee
will
continue
to
evaluate
progress
made
by
the
Risk
function
in
further
developing
its
capabilities
and
impact.
Leadership
Individual
roles
on
the
Board
and
their
responsibilities
are
set
out
in
the
Company’s
Charter
of
Expectations.
This
includes
role
profiles
and
the
behaviours
and
competencies
required
for
each
role
on
the
Board,
namely
the
Chair
man
,
Non
-
Executive
Directors,
Executive
Directors
and
Committee
Chairs.
Pursuant
to
the
Charter
of
Expectations,
Non
-
Executive
Directors
provide
effective
oversight
and
scrutiny,
strategic
guidance
and
constructive
challenge
whilst
holding
the
Executive
Directors
to
account
against
their
agreed
performance
objectives.
A
copy
of
the
Chart
er
of
Expectations
can
be
found
at
home.barclays/corporate
governance.
Appointment
and
r
etirement
of
Directors
The
appointment
and
retirement
of
Directors
is
governed
by
the
Company’s
Articles
of
Association
(the
A
rticles),
the
Act
and
related
legislation.
The
Articles
may
only
be
amended
by
a
special
resolution
of
the
shareholders.
The
Board
has
the
power
to
appoint
additional
Directors
or
to
fill
a
casual
vacancy
amongst
the
Directors.
Any
such
Director
holds
office
only
until
the
next
Annual
General
Me
eting
(‘AGM’)
and
may
offer
himself/herself
for
re
-
election.
All
Directors
will
stand
for
election
or
re
-
election
at
the
2020
AGM.
All
appointments
to
the
Board
and
senior
management
are
viewed
through
a
diversity
lens
and
are
based
on
merit
and
objective
criteria,
which
focus
on
the
skills
and
experience
required
for
the
Board’s
effectiveness
and
the
delivery
of
the
Company’s
strategy.
Board
appointments
are
made
following
a
rigorous
and
transparent
proces
s
facilitated
by
the
Nomination
s
Committee,
with
the
aid
of
an
external
search
consultancy
firm.
You
can
read
more
about
the
work
of
the
Nomination
s
Committee
on
pages
9
to
10.
Diversity
across
the
Barclays
Group
remains
a
key
area
of
focus.
For
more
detail
on
the
Barclays
Bank
Group
actions
to
increase
diversity
please
see
page
15.
The
Nominations
Committee
regularly
reviews
the
composition
of
the
Board,
Board
Committees
and
Executive
Committee
and
the
core
competencies,
diversity
and
experience
required.
For
the
Board,
it
is
standard
practice
to
appoint
any
new
non
-
executive
director
or
chairman
for
an
initial
three
-
year
term
subject
to
annual
re
-
election
at
the
AGM,
which
may
be
extended
for
up
to
a
further
three
-
year
term.
As
such,
non-
executive
directors
typ
ically
serve
up
to
a
total
of
six
years.
Effectiveness
Appointments
to
the
Board
were
made
via
a
formal,
rigorous
and
transparent
process,
based
on
merit,
taking
into
account
the
skills,
experience
and
diversity
needed
on
the
Board
in
the
context
of
the
B
arclays’
Group’s
strategic
direction.
As
at
the
date
of
this
report,
we
have
met
the
Board
gender
diversity
target
of
33%
with
four
female
directors.
The
Board
is
committed
to
regularly
reviewing
its
broad
diversity
profile.
The
Company
considers
the
composition
of
principal
Board
Committees
to
meet
the
independence
criteria
of
the
2018
UK
Corporate
Governance
Code
as
it
applied
to
BBPLC
and
there
is
appropriate
cross
-
membership
on
the
Board
Committees
to
further
promote
effec
tiveness.
All
Directors
are
expected
to
commit
sufficient
time
to
fulfil
their
duties
to
the
Company
.
This
includes
attending,
and
being
well-prepared
for,
all
Board
and
Board
Committee
meetings,
as
well
as
making
time
to
understand
the
business
and
meet
with
executives.
The
Company’s
Charter
of
Expectations
Governance
Corporate
Governance
Statement
Barclays
Bank
PLC
2019
Annual
Report
on
Form
20-F
13
Director
effectiveness
assessment:
disclosure
of
regulatory
investigation
Barclays
PLC
has
disclosed
the
following
in
relation
to
its
annual
director
effectiveness
assessment:
In
accordance
with
the
UK
Corporate
Governance
Code,
all
of
the
current
Directors
of
Barclays
PLC
will
be
submitting
themselves
for
election
or
re-
election
at
the
Annual
General
Meeting
to
be
held
on
7
May
2020,
and
will
be
unanimously
recommended
by
the
Barclays
PLC
Board
for
election
or
re
-
election
as
appropriate.
Further
information
in
this
regard
will
be
set
out
in
the
Notice
of
Meeting
which
will
be
published
in
due
course.
In
deciding
whether
to
recommend
Jes
Staley
for
re
-
election,
the
Board
has
carried
out
its
usual
formal
and
rigorous
performance
assessment,
which
it
does
in
respect
of
the
effectiveness
of
each
of
the
Directors.
As
part
of
its
determination
in
respect
of
Mr.
Staley,
the
Board
has
had
regard
to
media
reports
in
the
past
6
months
that
have
highlighte
d
historical
links
between
Mr.
Staley
and
Jeffrey
Epstein.
As
has
been
widely
reported,
earlier
in
his
career
Mr.
Staley
developed
a
professional
relationship
with
Mr.
Epstein.
In
the
summer
of
2019,
in
light
of
the
renewed
media
interest
in
the
relationship,
Mr.
Staley
volunteered
and
gave
to
certain
executives,
and
the
Chairman,
an
explanation
of
his
relationship
with
Mr.
Epstein.
Mr.
Staley
also
confirmed
to
the
Board
that
he
has
had
no
contact
whatsoever
with
Mr.
Epstein
at
any
time
since
taking
up
his
role
as
Barclays
Group
CEO
in
December
2015.
The
relationship
between
Mr.
Staley
and
Mr.
Epstein
was
the
subject
of
an
enquiry
from
the
Financial
Conduct
Authority
(FCA),
to
which
the
Company
responded.
The
FCA
and
the
Prudential
Regulation
Authority
subsequently
commenced
an
investigation,
which
is
ongoing,
into
Mr.
Staley's
characterisation
to
the
Company
of
his
relationship
with
Mr.
Epstein
and
the
subsequent
description
of
that
relationship
in
the
Company’s
response
to
the
FCA.
Based
on
a
review
,
conducted
with
the
support
of
external
counsel,
of
the
information
available
to
us
and
representations
made
by
Mr.
Staley,
the
Board
(the
Executive
Directors
having
been
recused)
believes
that
Mr.
Staley
has
been
sufficiently
transparent
with
the
Company
as
regards
the
nature
and
extent
of
his
relationship
with
Mr.
Epstein.
Accordingly,
Mr.
Staley
retains
the
full
confidence
of
the
Board,
and
is
being
unanimously
recommended
for
re
-
election
at
the
Annual
General
Meeting.
The
Board
will
continue
to
coope
rate
fully
with
the
regulatory
investigation,
and
will
provide
a
further
update
as
and
when
it
is
appropriate
to
do
so.
Accountability
The
Board
is
responsible
for
setting
Barclays
Bank
Group
risk
appetite
within
the
overall
parameters
set
by
the
Barclays
Group,
that
is,
the
level
of
risk
it
is
prepared
to
take
in
the
context
of
achieving
the
Barclays’
Group
strategic
objectives.
The
ERMF
is
designed
to
identify
and
set
minimum
requirements
in
respect
of
the
main
risks
to
achieving
Barclays’
strategic
obje
ctives
and
to
provide
reasonable
assurance
that
internal
controls
are
effective.
The
Board,
assisted
by
the
Risk
Committee,
conducts
robust
assessments
of
the
principal
risks
facing
the
Company
,
including
those
that
would
threaten
its
business
model,
future
performance,
solvency
or
liquidity.
The
Audit
Committee
oversees
the
effectiveness
of
BB
PLC
internal
and
external
auditors.
The
Directors
also
review
the
effectiveness
of
the
Barclays
Bank
Group’s
systems
of
internal
control
and
risk
management.
The
Board
has
put
in
place
processes
to
support
the
presentation
to
stakeholders
of
fair,
balanced
and
understandable
information.
Remuneration
The
Remuneration
Committee
reviews
and
adopts
the
Barclays
Group
’s
Remuneration
Policy
for
use
in
the
Barclays
Ban
k
Group.
The
purpose
and
activities
of
which
are
contained
in
the
Remuneration
Committee
report
on
page
10.
The
Board
has
delegated
responsibility
for
the
consideration
and
approval
of
the
remuneration
arrangements
of
the
Chairman,
Executive
Directors,
other
senior
executives
and
certain
Barclays
Bank
Group
employees
to
the
Remuneration
Committee.
The
Remuneration
Committee
when
considering
the
remuneration
policies
and
practices
will
seek
to
ensure
that
they
support
the
Company’s
strategy
and
promote
the
long
-
term
success
of
the
business
and
that
they
are
aligned
to
successful
delivery
of
the
Barclays
Group’s
strategy.
All
executive
and
senior
management
remuneration
policies
will
only
be
developed
in
accordance
with
the
Barclays
Group’s
formal
and
tran
sparent
procedures
(ensuring
that
no
Director
is
involved
in
deciding
his/her
own
remuneration
outcome)
and
having
regard
to
workforce
remuneration
and
related
policies
and
the
alignment
of
incentives
and
rewards
with
culture.
All
Remuneration
Committee
m
embers
will
demonstrate
independent
judgement
and
discretion
when
determining
and
approving
remuneration
outcomes.
The
Board
as
a
whole,
with
the
Non
-
Executive
Directors
abstaining,
considers
annually
the
fees
p
aid
to
Non
-
Executive
Directors.
Governance
Corporate
Governance
Statement
Barclays
Bank
PLC
2019
Annual
Report
on
Form
20-F
14
Controls
over
financial
reporting
A
framework
of
disclosure
controls
and
procedures
is
in
place
to
support
the
approval
of
the
financial
statements
of
the
Barclays
Bank
Group.
Specific
governance
committees
are
responsible
for
examining
the
financial
reports
and
disclosures
to
ensure
that
they
have
been
subject
to
adequate
verification
and
comply
with
applicable
standards
and
legislation.
These
committ
ees
report
their
conclusions
to
the
Audit
Committee,
which
debates
its
conclusions
and
provides
further
challenge.
Finally,
the
Board
scrutinises
and
approves
results
announcements
and
the
BBPLC
PLC
Annual
Report,
and
ensures
that
appropriate
disclosures
h
ave
been
made.
This
governance
process
ensures
that
both
management
and
the
Board
are
given
sufficient
opportunity
to
debate
and
challenge
the
financial
statements
of
the
Barclays
Bank
Group
and
other
significant
disclosures
before
they
are
made
public.
A
udit,
Risk
and
Internal
Control
The
Company
is
committed
to
operating
within
a
strong
system
of
internal
control
that
enables
business
to
be
transacted
and
risk
taken
without
exposure
to
unacceptable
potential
losses
or
reputational
damage.
As
referenced
above,
the
Board
is
responsible
for
ensuring
that
management
maintains
an
effective
system
of
risk
management
and
internal
control
and
for
assessing
its
effectiveness.
Such
a
system
is
designed
to
identify,
evaluate
and
manage,
rather
than
eliminate,
the
risk
of
failure
to
achieve
business
objectives
and
can
only
provide
reasonable
and
not
absolute
assurance
against
material
misstatement
or
loss.
Processes
are
in
place
for
identifying,
evaluating
and
managing
the
Principal
Risks
facing
the
Company.
A
key
component
of
the
framework
is
the
ERMF
which
supports
the
business
in
its
aim
to
embed
effective
risk
management
and
a
strong
risk
management
culture.
The
ERMF
is
designed
to
identify
and
set
minimum
requirements,
in
respect
of
the
main
risks,
to
achieving
the
Company’s
strategic
objectives
and
to
provide
reasonable
assurance
that
internal
controls
are
effective.
The
effectiveness
of
the
risk
management
and
internal
control
systems
is
reviewed
regularly
by
the
Risk
Committee
and
the
Audit
Committee
(as
detailed
above).
The
Risk
Committee
is
responsible
for
providing
oversight
and
advice
to
the
Board
in
relation
to
current
and
potential
future
risk
exposures
examining
reports
covering
the
principal
risks
including
those
that
would
threaten
its
business
mode
l,
future
performance,
solvency
or
liquidity,
as
well
as
reports
on
risk
measurement
methodologies
and
risk
appetite.
Further
detail
of
the
work
of
the
Risk
Com
mittee
can
be
found
on
pages
10
to
12.
As
referenced
above,
the
Audit
Committee
carries
out
several
duties,
delegated
to
it
by
the
Board,
including
oversight
of
financial
reporting
processes,
reviewing
the
effectiveness
of
internal
controls,
considering
whistle-blowing
arrangements
and
oversight
of
the
work
of
the
external
and
internal
auditors.
Throughout
the
year
ended
31
December
2019
and
to
date,
the
Company
has
operated
a
system
of
internal
control
that
provides
reasonable
assurance
of
effective
operations
covering
all
controls,
including
financial
and
operational
controls
and
compliance
with
laws
and
regulations.
The
Board
together
with
the
Audit
Committee
is
responsible
for
ensuring
the
independent
and
effectiveness
of
the
internal
and
external
audit
functions.
For
this
reason
the
Audit
Committee
members
met
regularly
with
the
Head
of
Barcl
ays
Internal
Audit
and
the
External
Audit
Partner
without
management
present.
Further
detail
of
the
work
of
the
Audit
Com
mittee
can
be
found
on
pages
8
to
9.
Management
is
responsible
for
establishing
and
maintaining
adequate
internal
controls
over
financ
ial
reporting
under
the
supervision
of
the
principal
executive
and
financial
officers,
to
provide
reasonable
assurance
regarding
the
reliability
of
financial
reporting
and
the
preparation
of
financial
statements,
in
accordance
with
International
Financial
Reporting
Standards
(IFRS).
Internal
control
over
financial
reporting
includes
policies
and
procedures
that
pertain
to
the
maintenance
of
records
that,
in
reasonable
detail:
◾
Accurately
and
fairly
reflect
transactions
and
dispositions
of
assets;
◾
Provide
reasonable
assurances
that
transactions
are
recorded
as
necessary
to
permit
preparation
of
financial
statements
in
accordance
with
IFRS
and
that
receipts
and
expenditures
are
being
made
only
in
accordance
with
authorisations
of
manageme
nt
and
the
respectiv
e
Directors;
and
◾
Provide
reasonable
assurance
regarding
prevention
or
timely
detection
of
unauthorised
acquisition,
use
or
disposition
of
assets
that
could
have
a
material
effect
on
the
financial
statements.
Internal
control
systems,
no
matter
how
well
de
signed,
have
inherent
limitations
and
may
not
prevent
or
detect
misstatements.
Also,
projections
of
any
evaluation
of
effectiveness
to
future
periods
are
subject
to
the
risk
that
internal
controls
may
become
inadequate
because
of
changes
in
conditions,
or
that
the
degree
of
compliance
with
the
policies
or
procedures
may
deteriorate.
Management
has
assessed
the
internal
control
over
financial
reporting
as
of
31
December
2019.
In
making
its
assessment,
management
utilised
the
criteria
set
out
in
the
2013
COSO
framework
and
concluded
that,
based
on
its
assessment,
the
internal
control
over
financial
reporting
was
effective
as
of
31
December
2019.
Governance
Corporate
Governance
Statement
Barclays
Bank
PLC
2019
Annual
Report
on
Form
20-F
15
The
system
of
internal
financial
and
operational
controls
is
also
subject
to
regulatory
oversight
in
the
UK
and
ov
erseas.
Further
information
on
supervision
by
the
financial
services
regulators
is
provided
under
Supervision
and
Regulation
in
the
Risk
review
section
on
pages
88
to
94.
Changes
in
internal
control
over
financial
reporting
There
have
been
no
changes
in
the
Barclays
Group’s
internal
control
over
financial
reporting
that
occurred
during
the
period
covered
by
this
report,
which
have
materially
affected
or
are
reasonably
likely
to
materially
affect
the
Barclays
Group’s
internal
control
over
financial
reporting.
Executive
Committee
During
2019,
the
Executive
Committee
membership
included
the
BBPLC
President,
Chief
Financial
Officer,
Chief
Risk
Officer,
and
leaders
of
each
business
unit,
Human
Resources,
Legal
and
Compliance.
The
Executive
Committee
meets
weekly
and
is
chaired
by
the
Chief
Executive
Officer.
In
addition
to
the
day
-
to-
day
management
of
the
Company
,
the
Executive
Committee
supports
the
Chief
Executive
Officer
in
ensuring
that
the
values,
strategy
and
culture
align,
are
implemented
and
are
com
municated
consistently
to
colleagues
–
for
example
through
regular
leadership
team
conferences,
roadshows
and
communications
that
are
available
to
all
colleagues
.
Non
-Executive
Directors
time
commitment
and
conflict
Non
-
Executive
Directors,
including
the
Chairman,
are
informed
of
the
minimum
time
commitment
prior
to
their
appointment
and
they
are
required
to
devote
sufficient
time
to
the
Company
to
discharge
their
responsibilities
effectively.
The
time
commitments
of
Directors
are
considered
by
the
Boar
d
on
appointment
and
are
reviewed
when
appropriate.
External
appointments
must
be
agreed
with
the
Chairman
and
disclosed
to
the
Board,
before
appointment,
with
an
indication
of
the
time
involved
The
Board
is
satisfied
that
there
are
no
Directors
whose
time
commitment
is
considered
to
be
a
matter
for
concern
In
accordance
with
the
Act
and
the
Articles
of
Association,
the
Board
has
authority
to
authorise
conflicts
of
interest,
and
this
ensures
that
the
influence
of
third
parties
does
not
compromise
or
overri
de
independent
judgement
of
the
Board.
The
Company
Secretary
maintains
a
conflicts
register,
which
is
a
record
of
actual
and
potential
conflicts,
together
with
any
Board
authorisation
of
the
conflict.
Training
and
induction
During
2019
,
Directors
met
regularly
with
senior
management,
as
well
as
attending
town
halls
and
senior
leadership
gatherings.
In
addition,
Directors
are
regularly
provided
with
the
opportunity
to
take
part
in
ongoing
training
and
development
and
can
also
request
specific
training
they
may
consider
necessary
or
useful.
During
2019
,
the
Directors
received
training
on
legal
and
regulatory
developments,
including
w
histleblowing
and
the
Senior
Manager’s
Regime.
There
is
an
induction
programme
for
all
new
Directors
which
is
tailored
to
their
specific
experience
and
knowledge,
providing
access
to
all
parts
of
the
business,
to
support
Directors
in
understanding
the
nature
of
the
business
and
the
key
issues
the
Company
faces.
When
a
Director
joins
a
Board
Committee,
the
schedule
includes
an
induction
to
the
operation
of
that
Board
Committee.
Diversity
and
i
nclusion
The
Board
recognises
the
importance
of
ensuring
that
there
is
broad
diversity
among
the
Directors
inclusive
of,
but
not
limited
to,
gender,
ethnicity,
geography
and
business
experience.
In
addition,
the
Company
aims
to
ensure
that
employees
of
all
backgrounds
are
treated
equally
and
have
the
opportunity
to
be
successful.
The
Barclays
Group’s
G
lobal
Diversity
and
Inclusion
(D&I)
strategy
sets
objectives,
initiatives
and
plans
across
five
core
pillars:
Gender,
LGBT+,
Disability,
Multicultural
and
Multigenerational,
in
support
of
that
ambition.
Further
information
on
the
Barclays
Group’s
Board
Diversity
Policy
and
D&I
strategy
can
be
found
on
page
62
of
the
Barclays
PLC
Annual
Report
2019.
Governance
Directors’
report
Barclays
Bank
PLC
2019
Annual
Report
on
Form
20-F
16
The
Directors
present
their
report
together
with
the
audited
accounts
for
the
Company
for
the
year
ended
31
December
2019.
BBPLC
has
addressed
the
Non
-
Financial
Reporting
requirements
contained
in
sections
414CA
and
414CB
of
the
Act
through
the
disclosure
contained
in
the
Barclays
PLC
Annual
Report
on
pages
39
to
40
.
Act,
and
as
noted
in
this
Directors’
Report,
to
include
certain
matters
in
its
Strategic
Report
that
would
otherwise
be
disclosed
in
this
Directors’
Report.
The
particulars
of
important
events
affecting
the
Company
since
the
financial
year
end
can
be
found
in
the
notes
to
the
financial
statements.
Other
information
that
is
relevant
to
the
Directors’
Report,
and
which
is
incorporated
by
reference
into
this
re
port,
can
be
located
at:
Pages
Corporate
Governance
Report
3
Risk
Management
25
Principal
Risks
38
Disclosures
required
pursuant
to
Large
and
Medium
-sized
Companies
and
Groups
(Accounts
and
Reports)
Regulations
2008
as
updated
by
Companies
(Miscellaneous
Reporting)
2018
Regulations
can
be
found
on
the
following
pages:
Engagement
with
employees
(Sch.7
Para
11
and
11A
2008/2018
Regs
and
S172
(1)
Statement)
21
Policy
concerning
the
employment
of
disabled
persons
(Sch.7
Para
10
2008
Regs)
21
Financial
Instruments
(Sch.7
Para
6
2008
Regs)
38
Hedge
accounting
policy
(Sch.7
Para
6
2008
Regs)
127
Profits
and
dividends
The
results
of
the
Barclays
Bank
Group
show
statutory
profit
after
tax
of
£2,780m
(2018:
£1,010m
1
).
The
Barclays
Bank
Group
had
net
assets
of
£50,615m
at
31
December
2019
(2018:
£
47,711m
).
Barclays
PLC
will
pay
a
full
year
dividend
in
respect
of
2019
of
6p
per
ordinary
share
on
3
April
2020
to
shareholders
on
the
share
register
on
28
February
2020.
The
Company
will
pay
a
dividend
to
Barclays
PLC
in
order
to
fund
its
external
dividend
payment.
The
Directors
of
BBPLC
recommend
a
dividend
of
no
more
than
£263m
to
satisfy
this
requirement.
Further
details
on
total
dividends
on
ordinary
shares
paid
in
2019
are
set
out
in
Note
9
to
the
financial
statements.
Dividends
paid
on
preference
shares
for
the
year
ended
31
December
2019
amounted
to
£41m
(2018:
£
204
m).
Share
Capital
There
was
no
increase
in
ordinary
share
capital
during
the
year.
Barclays
PLC
owns
100%
of
the
issued
ordinary
shares.
There
are
no
restrictions
on
the
transfer
of
ordinary
shares
or
agreements
between
holders
of
ordinary
shares
known
to
the
Company
which
may
result
in
restrictions
on
the
transfer
of
securities
or
voting
rights.
Further
information
on
the
Company’s
share
capital
can
be
found
in
Note
27
of
the
financial
statements.
Powers
of
Directors
to
issue
or
buy
back
the
Company’s
shares
The
powers
of
the
Directors
are
determined
by
the
Act
and
the
Company’s
Articles
of
Association.
No
shares
were
issued
or
bought
back
in
2019.
The
Directors
are
authorised
to
issue
and
allot
shares
and
to
buy
back
shares
subject
to
annual
shareholder
approval
at
the
AGM.
Such
authorities
were
granted
by
shareholders
at
the
2019
AGM.
It
will
be
proposed
at
the
2020
AGM
that
the
Directors
be
granted
new
authorities
to
allot
and
buy-
back
shares.
Repurchase
of
preference
shares
No
p
reference
shares
were
redeem
ed
by
the
Company
during
2019.
1
previously
recorded
within
retained
earnings.
Comparatives
have
been
restated,
reducing
the
tax
charge
for
FY18
by
£175m.
Further
detail
can
be
found
in
Note
1.
Governance
Directors’
report
Barclays
Bank
PLC
2019
Annual
Report
on
Form
20-F
17
Directors
The
list
of
current
Directors
of
the
Company
can
be
found
in
the
Corporate
Governance
Statement.
Changes
to
Directors
during
the
year
and
up
to
the
date
of
signing
this
report
are
set
out
below.
Name
Role
Effective
date
of
appointment/resignation
Mike
Ashley
Non
-
Executive
Director
Appointed
25
September
2019
Peter
Bernard
Non
-
Executive
Director
Resigned
25
September
2019
Tim
Breedon
Non
-
Executive
Director
Appointed
25
September
2019
Mary
Anne
Citrino
Non
-
Executive
Director
Appointed
25
September
2019
Steven
Ewart
Executive
Director
Resigned
25
September
2019
Mohamed
A.
El-Erian
Non
-
Executive
Director
Appointed
1
January
2020
Mary
Francis
Non
-
Executive
Director
Appointed
25
September
2019
Dawn
Fitzpatrick
Non
-
Executive
Director
Appointed
25
September
2019
Sir
Gerry
Grimstone
Non
-
Executive
Director
Resigned
28
February
2019
Nigel
Higgins
Non
-
Executive
Director
Appointed
1
March
2019
Helen
Keelan
Non
-
Executive
Director
Resigned
25
September
2019
Matthew
Lester
Non
-
Executive
Director
Appointed
25
September
2019
and
Resigned
1
January
2020
Tushar
Morzaria
Executive
Director
Appointed
25
September
2019
Maria
Richter
Non
-
Executive
Director
Resigned
25
September
2019
Diane
Schueneman
Non
-
Executive
Director
Appointed
25
September
2019
Jeremy
Scott
Non
-
Executive
Director
Resigned
25
September
2019
Jes
Staley
Executive
Director
Appointed
26
March
2019
Tim
Throsby
Executive
Director
Resigned
26
March
2019
Alexander
Thursby
Non
-
Executive
Director
Resigned
25
September
2019
Helene
Vletter
Van
Dort
Non
-
Executive
Director
Resigned
25
September
2019
Directors’
i
ndemnities
Qualifying
third
party
indemnity
provisions
(as
defined
by
section
234
of
the
Act)
were
in
force
during
the
course
of
the
financial
year
ended
31
December
2019
for
the
benefit
of
the
then
Directors
and,
at
the
date
of
this
report,
are
in
force
for
the
benefit
of
the
Directors
in
relation
to
certain
losses
and
liabilities
which
they
may
incur
(or
have
incurred)
in
connection
with
their
duties,
powers
or
office.
In
addition,
the
Company
maintains
Directors’
&
Officers’
Liability
Insurance
which
gives
appropriate
cover
for
legal
action
brought
against
its
Directors.
Qualifying
pension
scheme
indemnity
provisions
(as
defined
by
section
235
of
the
Act)
were
in
force
during
the
course
of
the
financial
year
ended
31
December
2019
for
the
benefit
of
the
then
Directors,
and
at
the
date
of
this
report
are
in
force
for
the
benefit
of
Directors
of
Barc
lays
Pension
Funds
Trustees
Limited
as
Trustee
of
the
Barclays
Bank
UK
Retirement
Fund.
The
Directors
of
the
Trustee
are
indemnified
against
liability
incurred
in
connection
with
the
company’s
activities
as
Trustee
of
the
Barclays
Bank
UK
Retirement
Fund.
Similarly,
qualifying
pension
scheme
indemnities
were
in
force
during
2019
for
the
benefit
of
Directors
of
Barclays
Executive
Schemes
Trustees
Limited
as
Trustee
of
Barclays
Bank
International
Limited
Zambia
Staff
Pension
Fund
(1965),
Barclays
Capital
Int
ernational
Pension
Scheme
(No.1),
and
Barclays
PLC
Funded
Unapproved
Retirement
Benefits
Scheme.
The
Directors
of
the
Trustee
are
indemnified
against
liability
incurred
in
connection
with
the
Company’s
activities
as
Trustee
of
the
schemes
above.
Politica
l
donations
The
Barclays
Bank
Group
did
not
give
any
money
for
political
purposes
in
the
UK,
the
rest
of
the
EU
or
outside
the
EU,
nor
did
it
make
any
political
donations
to
political
parties
or
other
political
organisations,
or
to
any
independent
election
candidates,
or
incur
any
political
expenditure
during
the
year.
Details
of
any
political
contributions
made
by
the
wider
Barclays
Group
can
be
found
in
the
2019
Barclays
PLC
Annual
Report.
Environment
Barclays
focuses
on
addressing
environmental
issues
where
we
believe
we
have
the
greatest
potential
to
make
a
difference.
We
focus
on
managing
our
own
carbon
footprint
and
reducing
our
absolute
carbon
emissions,
developing
products
and
services
to
help
enable
the
transition
to
a
low-
carbon
economy,
and
man
aging
the
risks
of
climate
change
to
our
operations,
clients,
customers
and
society
at
large.
We
invest
in
improving
the
energy
efficiency
of
our
operations
and
offset
the
emissions
remaining
through
the
purchase
of
carbon
credits.
We
also
have
a
long
-
standing
commitment
to
managing
the
environmental
and
social
risks
associated
with
our
lending
practices,
which
is
embedded
into
our
risk
processes.
A
governance
structure
is
in
place
to
facilitate
clear
dialogue
across
the
business
and
with
suppliers
around
issues
of
potential
environmental
and
social
risk.
Disclosure
of
global
greenhouse
gas
emissions
is
done
at
a
Barclays
Group
level
with
information
available
in
the
Barclays
PLC
2019
Annual
Report
with
fuller
disclosure
available
on
our
website
at
home.barclays.com/citizenship.
Governance
Directors’
report
Barclays
Bank
PLC
2019
Annual
Report
on
Form
20-F
18
Engagement
with
customers,
suppliers
and
others
in
a
business
relationship
with
the
Company
Customers
and
clients
are
the
heart
of
the
Barclays
business
–
without
them,
Barclays
would
not
exist.
Barclays
works
hard
to
understand
the
needs
of
its
customers
and
clients
to
inform
and
improve
its
products
and
services.
Barclays
engages
with
them
in
a
variety
of
ways,
including
conducting
a
wide
-
range
of
customer
and
client
research;
using
the
invaluable
insight
to
inform
bu
siness
decisions
on
the
development
of
services
and
initiatives.
As
an
illustration,
during
2019,
the
Company
continued
the
roll
out
of
the
Corporate
Bank’s
European
platform,
providing
clients
with
a
consistent
digital
cash
management
offering
and
servicing
model
across
the
continent
and
launched
BARX
as
a
newly
integrated,
cross
-
asset
electronic
trading
platform
to
create
a
better
experience
for
Investment
Bank
clients.
Barclays
supply
chain
helps
it
deliver
for
all
of
its
customers,
clients
and
stakeholders.
Barclays
engages
with
its
suppliers
through
its
contractual
arrangements
and
requirements
to
ensure
suppliers
adhere
to
the
Barclays’
Supplier
Control
Obligations
and
the
Supplier
Code
of
Conduct.
From
such
engagement
suppliers
have
identified
prom
pt
payment
as
critical.
Barclays
is
a
signatory
to
the
Prompt
Payment
Code
in
the
UK
and
is
committed
to
paying
its
suppliers
within
clearly
defined
terms,
and
to
ensuring
there
is
a
proper
process
for
dealing
with
any
issues
that
may
arise.
Please
see
pag
e
33
of
the
Barclays
PLC
2019
Annual
Report
for
detail
on
Barclays’
supplier
payment
on
-
time
performance
in
2019.
For
further
detail
on
customer,
client
and
supplier
engagement
is
set
out
on
page
33
of
the
Barclays
PLC
2019
Annual
Report.
Branches
and
Country-by-Country
r
eporting
The
Barclays
Bank
Group
operates
through
branches,
offices
and
subsidiaries
in
the
UK
and
overseas.
Those
branches
are
in
a
number
of
different
jurisdictions
including
in
Hong
Kong,
Singapore
and
New
York.
The
Company
is
exemp
t
from
publishing
information
required
by
The
Capital
Requirements
(Country
-
by
-
Country
Reporting)
Regulations
2013
as
this
information
is
published
by
its
parent
Barclays
PLC.
This
information
is
due
to
be
published
on
or
around
13
February
2020
and
will
b
e
available
at
home.barclays.com/citizenship.
Research
and
d
evelopment
In
the
ordinary
course
of
business,
the
Barclays
Bank
Group
develops
new
products
and
services
in
each
of
its
business
divisions.
Change
of
control
There
are
no
significant
agreements
to
which
the
Company
is
a
party
that
are
affected
by
a
change
of
control
of
the
Company
following
a
takeover
bid.
There
are
no
agreements
between
the
Company
and
its
Directors
or
employees
providing
for
compensation
for
loss
of
office
or
employment
that
occurs
because
of
a
takeover
bid.
The
Auditors
The
BPLC
audit
committee
reviews
the
appointment
of
the
external
auditors,
as
well
as
their
relationship
with
the
Barclays
Group,
including
monitoring
the
Barclays
Group’s
use
of
the
external
auditors
for
non
-
audit
services
and
the
balance
of
audit
and
non
-
audit
fees
paid
to
them.
The
BBPLC
Audit
Committee
also
monitors
the
use
of
the
external
auditors
for
non
-
audit
services
within
BBPLC.
More
details
on
this
can
be
found
in
Note
40
to
the
financial
statements.
An
external
audit
tender
was
conducted
in
2015
and
the
decision
was
made
to
appoint
KPMG
as
Barclays
Group’s
external
auditor
with
effect
from
the
2017
financial
year,
with
PwC
resigning
as
Barclays
Group’s
statutory
auditor
at
the
conclusion
of
the
2016
audit.
The
Company
is
in
compliance
with
the
requirements
of
The
Statutory
Audit
Services
for
Large
Companies
Market
Investigation
(Mandatory
Use
of
Competitive
Tender
Processes
and
Audit
Committee
Responsibilities)
Order
2014,
which
relates
to
the
frequency
and
governance
of
tenders
for
the
appointment
of
the
external
auditor
and
the
setting
of
a
policy
on
the
provision
of
non
-
audit
services.
Provided
that
KPMG
continue
to
maintain
their
independence
and
objectivity,
and
the
BPLC
audit
committee
remains
satisfied
with
their
performance,
the
Barclays
Group
has
no
intention
of
appointing
an
alternative
external
auditor
before
the
end
of
the
current
required
period
of
10
years.
Non
-audit
s
ervices
In
order
to
safeguard
the
auditor’s
independence
and
objectivity,
the
Barclays
Group
has
in
place
a
policy
setting
out
the
circumstances
in
which
the
Auditor
may
be
engaged
to
provide
services
other
than
those
covered
by
the
Barclays
Group
audit.
The
Barcl
ays
Group
Policy
on
the
Provision
of
Services
by
the
Group
Statutory
Auditor
(the
Policy)
applies
to
all
Barclays’
subsidiaries
and
other
material
entities
over
which
Barclays
has
significant
influence.
The
core
principle
of
the
Policy
is
that
non
-
audit
services
(other
than
those
legally
required
to
be
carried
out
by
the
Barclays
Group’s
Auditor)
should
only
be
performed
by
the
Auditor
in
certain,
controlled
circumstances.
The
P
olicy
sets
out
those
types
of
services
that
are
strictly
prohibited
and
those
that
are
allowable
in
principle.
Any
service
types
that
do
not
fall
within
either
list
are
considered
by
the
chairman
of
the
BPLC
audit
c
ommittee
a
case-by
-
case
basis,
supported
by
a
risk
assessment
provided
by
management.
Under
the
policy
the
BPLC
audit
c
o
mmittee
has
pre
-
approved
all
allowable
services
for
which
fees
are
less
than
£100,000.
All
requests
to
engage
the
Auditor
are
assessed
by
independent
management
before
work
can
commence.
Requests
for
allowable
service
types
in
respect
of
which
the
fees
are
expected
to
meet
or
exceed
the
above
threshold
must
be
approved
by
the
chairman
of
the
BPLC
audit
committee
before
work
is
permitted
to
begin.
Services
where
the
fees
are
expected
to
be
£250,000
or
higher
must
be
approved
by
the
BPLC
audit
committee
as
a
whole.
All
expenses
and
disbursements
must
be
included
in
the
fees
calculation.
More
information
on
this
can
be
found
in
the
Barclays
PLC
2019
Annual
Report.
Governance
Directors’
report
Barclays
Bank
PLC
2019
Annual
Report
on
Form
20-F
19
The
fees
payable
to
KPMG
for
the
year
ended
31
December
2019
amounted
to
£35m,
of
which
£4m
(2018:
£4m)
was
payable
in
respect
of
non-
audit
services.
A
breakdown
of
the
fees
payable
to
the
auditor
for
statutory
audit
and
non
-
audit
work
can
be
found
in
Note
40.
Disclosure
of
i
nformation
to
the
Auditor
Each
Director
confirms
that,
so
far
as
he/she
is
aware,
there
is
no
relevant
audit
information
of
which
the
Company’s
auditors
are
unaware
and
that
each
of
the
Directors
has
taken
all
the
steps
that
he/she
ought
to
have
taken
as
a
Director
to
make
himself/herself
aware
of
any
relevant
audit
information
and
to
establish
that
the
Company's
auditors
are
aware
of
that
information.
This
confirmation
is
given
pursuant
to
section
418
of
the
Act
and
should
be
interpreted
in
accordance
with
and
subject
to
those
provisions.
Directors’
responsibilities
Th
e
following
statement,
which
should
be
read
in
conjunction
with
the
auditors’
report
set
out
on
page
96,
is
made
with
a
view
to
distinguishing
for
shareholders
the
respective
responsibilities
of
the
directors
and
of
the
auditors
in
relation
to
the
accounts
.
Going
concern
BBPLC’s
business
activities,
financial
position,
capital,
factors
likely
to
affect
its
future
development
and
performance
and
its
objectives
and
policies
in
managing
the
financial
risks
to
which
it
is
exposed
are
discussed
in
the
Strategic
Report
section
of
the
Barclays
Bank
Annual
Report
and
the
Risk
Review
section.
The
Directors
considered
it
appropriate
to
prepare
the
financial
statements
on
a
going
concern
basis.
In
preparing
each
of
the
Barclays
Bank
Group
and
Company
financial
statements,
the
Directors
are
required
to:
●
assess
the
Barclays
Bank
Group
and
Company’s
ability
to
continue
as
a
going
concern,
disclosing,
as
applicable,
matters
related
to
going
concern;
and
●
use
the
going
concern
basis
of
accounting
unless
they
either
intend
to
liquidate
the
Barclays
Bank
Group
or
to
cease
operations,
or
have
no
realistic
alternative
but
to
do
so.
The
Barclays
Bank
Group’s
business
activities,
financial
position
(including
the
implications
of
the
UK’s
decision
to
leave
the
European
Union
),
capital,
factors
likely
to
affect
its
future
development
and
performance
and
its
objectives
and
policies
in
managing
the
financial
risks
to
which
it
is
exposed
are
discussed
in
the
risk
management
sections.
The
Directors
have
evaluated
these
risks
in
the
preparation
of
the
financial
statements
and
consider
it
appropriate
to
prepare
the
financial
statements
on
a
going
concern
basis.
Preparation
of
accounts
The
Directors
are
required
by
the
Act
to
prepare
the
Company
and
the
Barclays
Bank
Group
accounts
for
each
financial
year
and,
with
regards
to
Barclays
Bank
Group
accounts,
in
accordance
with
article
4
of
the
IAS
regulation.
The
Directors
have
prepared
these
accounts
in
accordance
with
IFRS
as
adopted
by
the
EU.
Under
the
Act,
the
Directors
must
not
approve
the
accounts
unless
they
are
satisfied
that
they
give
a
true
and
fair
view
of
the
state
of
affairs
of
the
Barclays
Bank
Group
and
the
Company
and
of
their
profit
or
loss
for
that
period.
The
Directors
consider
that,
in
preparing
the
financial
statements
the
Barclays
Bank
Group
and
the
Company
has
used
appropriate
accounting
policies,
supported
by
reasonable
judgements
and
estimates,
and
that
all
accounting
standards
which
they
consider
to
be
applicable
have
been
followed.
The
Directors
are
satisfied
that
the
Annual
Report
and
Financial
Statements,
taken
as
a
whole,
are
fair,
balanced
and
understandable,
and
provide
the
information
necessary
for
shareholders
to
assess
the
Company’s
position
and
performance,
business
model
and
strategy.
Directors
are
responsible
for
such
internal
control
as
they
determine
is
necessary
to
enable
the
preparation
of
financial
statements
that
are
free
from
material
misstatement,
whether
due
to
fraud
or
error.
Directors’
r
esponsibility
s
tatement
The
Directors
have
respon
sibility
for
ensuring
that
the
Company
and
the
Barclays
Bank
Group
keeps
accounting
records
which
disclose
with
reasonable
accuracy
the
financial
position
of
the
Company
and
the
Barclays
Bank
Group
and
which
enable
them
to
ensure
that
the
accounts
comply
w
ith
the
Act.
The
Directors
are
also
responsible
for
preparing
a
Strategic
Report,
Directors’
Report
and
Corporate
Governance
Statement
in
accordance
with
applicable
law
and
regulations.
The
Directors
are
responsible
for
the
maintenance
and
integrity
of
the
Annual
Report
and
Financial
Statements
as
they
appear
on
the
Company’s
website.
Legislation
in
the
UK
governing
the
preparation
and
dissemination
of
financial
statements
may
differ
from
legislation
in
other
jurisdictions.
The
Directors
have
a
general
responsibility
for
taking
such
steps
as
are
reasonably
open
to
them
to
safeguard
the
assets
of
the
Company
and
to
prevent
and
detect
fraud
and
other
irregularities.
The
Directors,
whose
names
are
set
out
on
page
7,
confirm
to
the
best
of
their
knowledge
that:
(a)
the
financial
statements,
prepared
in
accordance
with
the
applicable
set
of
accounting
standards,
give
a
true
and
fair
view
of
the
assets,
liabilities,
financial
position
and
profit
or
loss
of
the
Company
and
the
undertakings
included
in
the
consolida
tion
taken
as
a
whole;
and
Governance
Directors’
report
Barclays
Bank
PLC
2019
Annual
Report
on
Form
20-F
20
(b)
the
management
report,
in
Strategic
Report
within
Barclays
Bank
PLC
Annual
Report
on
pages
1
to
9,
which
is
incorporated
in
the
Directors’
Report,
includes
a
fair
review
of
the
development
and
performance
of
the
business
and
the
position
of
the
Company
and
the
undertakings
included
in
the
consolidation
taken
as
a
whole,
together
with
a
description
of
the
principal
risks
and
uncertainties
that
they
face.
By
order
of
the
Board
Stephen
Shapiro
Company
Secretary
12
February
2020
Barclays
Bank
PLC
Registered
in
England.
Company
No.
1026167
Governance
Our
people
and
culture
Barclays
Bank
PLC
2019
Annual
Report
on
Form
20-F
21
Our
people
and
culture
We
believe
that
the
culture
of
Barclays
is
built
and
shaped
by
the
thousands
of
professionals
around
the
world
who
serve
our
customers
and
clients
with
a
shared
purpose
and
values.
Our
people
make
a
critical
difference
to
our
success,
and
our
investment
in
them
protects
and
strengthens
our
culture.
The
following
sub
-
sections
are
therefore
consistent
with
those
detailed
in
the
People
Section
of
the
Barclays
PLC
Annual
Report
and
figures
mentioned
are
for
Barclays
PLC
Group
other
than
specifically
mentioned.
Colleague
engagement
We
have
an
established
approach
to
engaging
colleagues,
based
on
best
practice
set
out
by
the
UK’s
Financial
Reporting
Council
and
in
line
with
new
governance
requirements
in
2019.
This
ensures
that
we
understand
their
perspective,
take
it
into
account
in
our
decision
making
at
the
most
senior
level,
and
share
with
them
our
strategy
and
progress.
That
extends
to
those
who
work
for
us
indirectly
as
well,
such
as
contractors,
although
in
a
more
limited
way.
In
2020,
our
supplier
code
of
conduct
will
require
these
organisations
to
demonstrate
that
they
have
an
effective
workforce
engagement
approach
of
their
own.
It’s
important
to
us
that
our
Board
members
are
engaged
with
our
people
–
directly,
and
indirectly
through
our
management
team.
We
regularly
report
on
our
colleague
engagement
activity
to
our
Boards.
Together
with
direct
engagement,
this
comprehensive
reporting
approach
and
dedicated
time
at
board
meetings
helps
our
Board
take
the
issues
of
interest
to
our
colleagues
into
account
in
their
decision
making.
This
has
enabled
them
to
confirm
that
our
workforce
engagement
approach
is
effective.
Listening
to
our
people
Our
regular
colleague
survey
formally
captures
the
views
of
all
our
people
and
is
a
key
part
of
how
we
track
colleague
engagement,
alongside
more
granular
colleague
sentiment
tracking
across
our
businesses.
Barclay
Bank
Group’s
overall
engagement
score
reduced
slightly
to
73%
in
2019,
but
77%
of
our
colleagues
would
still
recommend
Barclays
as
a
good
place
to
work.
The
results
from
the
survey
are
an
important
part
of
the
conversati
ons
our
leaders
have
about
how
we
run
the
business,
and
it’s
a
specific
focus
for
our
Executive
Committee
and
our
Board.
We
monitor
our
culture
across
the
organisation,
and
in
individual
business
areas,
through
Culture
Dashboards.
These
combine
colleague
survey
data
with
other
metrics
about
our
business,
so
that
we
can
see
the
effect
our
people’s
engagement
has
on
our
perfor
mance,
and
on
the
continued
strength
of
our
culture.
82%
of
our
people
have
heard
or
read
senior
leaders
across
the
Group
talking
about
the
character
and
culture
of
Barclays.
Keeping
our
people
informed
In
addition
to
these
data
sources,
our
leaders,
inc
luding
our
Board,
engage
face
to
face
with
colleagues
to
hear
what
they
think.
That
might
be
through
site
visits,
large
-
scale
town
halls,
training
and
development
activity,
mentoring,
informal
breakfast
sessions,
committee
membership,
diversity
and
wellbeing
programmes,
or
focus
and
consultative
groups.
We
make
sure
we’re
regularly
keeping
everyone
up
to
date
on
the
strategy,
performance
and
progress
of
the
organisation
through
a
strategically-
coordinated,
multichannel
approach
across
a
combination
of
leader
-
led
engagement,
and
digital
and
print
communication,
including
blogs,
vlogs
and
podcasts.
We
also
engage
with
our
people
collectively
through
a
strong
and
effective
partnership
with
Unite,
as
well
as
the
Barclays
Group
European
Forum,
which
represent
s
all
Barclays
Group
colleagues
within
the
European
Union.
These
conversations
help
us
to
deliver
things
like
a
collective
pay
deal
for
our
Unite
covered
colleagues,
who
represent
84%
of
our
UK
-
based
colleagues,
as
well
as
more
complex
business
change
an
d
our
long
-
term
focus
on
colleague
wellbeing.
We
regularly
brief
our
union
partners
on
the
strategy
and
progress
of
the
business
and
seek
their
input
on
ways
in
which
we
can
improve
the
colleague
experience
of
working
in
Barclays.
The
collective
bargaining
coverage
of
Unite
in
the
UK
represents
c.52%
of
our
global
workforce.
Building
a
supportive
culture
Diversity
of
thought
and
experience
works
best
when
everyone
feels
included.
People
who
feel
they
can
be
themselves
at
work
are
happier
and
more
producti
ve,
so
we
believe
that
creating
an
inclusive
and
diverse
culture
isn’t
just
the
right
thing
to
do,
but
is
also
best
for
our
business.
Our
policies
require
managers
to
give
full
and
fair
consideration
to
those
with
a
disability
on
the
basis
of
their
aptitudes
and
abilities;
both
when
hiring
and
through
ongoing
people
management,
as
well
as
ensuring
opportunities
for
training,
career
development
and
promotion
are
available
to
all.
As
part
of
our
Disability
Confident
scheme,
we
actively
encourage
application
s
from
people
with
a
disability,
or
a
physical
or
mental
health
condition.
We
encourage
our
people
to
benefit
from
Barclays’
performance
by
enrolling
in
our
share
plans,
further
strengthening
their
commitment
to
the
organisation.
Risk
review
Contents
Barclays
Bank
PLC
2019
Annual
Report
on
Form
20-F
22
The
management
of
risk
is
a
critical
underpinning
to
the
execution
of
the
Barclays
Bank
Group’s
strategy.
The
material
risks
and
uncertainties
the
Barclays
Bank
Group
faces
across
its
business
and
portfolios
are
key
areas
of
management
focus.
Risk
management
strategy
Page
Overview
of
the
Barclays
Bank
Group’s
approach
to
risk
management.
◾
Enterprise
Risk
Management
Framework
(ERMF)
◾
Segregation
of
duties
–
the
“Three
Lines
of
Defence”
model
◾
Principal
risks
◾
Risk
appetite
for
the
principal
risks
◾
Risk
committees
◾
Barclays’
risk
culture
25
25
25
25
26
27
Material
existing
and
emerging
risks
Insight
into
the
level
of
risk
across
our
business
and
portfolios,
the
material
existing
and
emerging
risks
and
uncertainties
we
face
and
the
key
areas
of
management
focus.
◾
Material
existing
and
emerging
risks
potentially
impacting
more
than
one
principal
risk
28
◾
Credit
risk
31
◾
Market
risk
32
◾
Treasury
and
capital
risk
32
◾
Operational
risk
33
◾
Model
risk
34
◾
Conduct
risk
34
◾
Reputation
risk
35
◾
Legal
risk
and
legal,
competition
and
regulatory
matters
36
Climate
change
risk
management
Overview
of
the
Barclays
Bank
Group’s
approach
to
managing
climate
change
risk.
◾
Overview,
organisation
and
structure
◾
Risk
management
policy
37
37
Principal
risk
management
The
Barclays
Bank
Group’s
approach
to
risk
management
for
each
principal
risk
with
focus
on
organisation
and
structure
and
roles
and
responsibilities.
◾
Credit
risk
management
38
◾
Market
risk
management
39
◾
Treasury
and
capital
risk
management
39
◾
Operational
risk
management
41
◾
Model
risk
management
42
◾
Conduct
risk
management
42
◾
Reputation
risk
management
43
◾
Legal
risk
management
43
Risk
performance
Credit
risk:
Group
from
the
failure
of
clients,
customers
or
counterparties,
including
sovereigns,
to
fully
honour
their
obligations
to
the
Barclays
Bank
Group,
including
the
whole
and
timely
payment
of
principal,
interest,
collateral
and
other
receivables.
◾
Credit
risk
overview
and
summary
of
performance
45
◾
Maximum
exposure
and
effects
of
netting,
collateral
and
risk
transfer
46
◾
Expected
credit
losses
49
◾
Movement
in
gross
exposure
and
impairment
allowance
including
provisions
for
loan
commitments
and
financial
guarantees
50
◾
Measurement
uncertainty
and
sensitivity
analysis
55
◾
Analysis
of
the
concentration
of
credit
risk
61
◾
Approach
to
the
management
and
representation
of
credit
quality
63
◾
Analysis
of
specific
portfolios
and
asset
types
67
Risk
review
Contents
Barclays
Bank
PLC
2019
Annual
Report
on
Form
20-F
23
Risk
performance
continued
Page
Market
risk:
adverse
changes
in
the
value
of
the
Barclays
Bank
Group’s
assets
and
liabilities
from
fluctuation
in
market
variables
including,
but
not
limited
to,
interest
rates,
foreign
exchange,
equity
prices,
commodity
prices,
credit
spreads,
implied
volatilities
and
asset
correlations.
◾
Market
risk
overview
and
summary
of
performance
◾
Review
of
management
measures
69
69
Treasury
and
capital
risk
–
Liquidity:
The
risk
that
the
Barclays
Bank
Group
is
unable
to
meet
its
contractual
or
contingent
obligations
or
that
it
does
not
have
the
appropriate
amount,
tenor
and
composition
of
funding
and
liquidity
to
support
its
assets.
◾
Liquidity
risk
overview
◾
Liquidity
risk
stress
testing
◾
Contractual
maturity
of
financial
assets
and
liabilities
72
72
72
Treasury
and
capital
risk
–
Capital:
The
risk
that
the
Barclays
Bank
Group
has
an
insufficient
level
or
composition
of
capital
to
support
its
normal
business
activities
and
to
meet
its
regulatory
capital
requirements
under
normal
operating
environments
or
stressed
conditions
(both
actual
and
as
defined
for
internal
planning
or
regulatory
testing
purposes).
This
also
includes
the
risk
from
the
Barclays
Bank
Group’s
pension
plans.
◾
Capital
risk
overview
77
Treasury
and
capital
risk
–
Interest
rate
risk
in
the
banking
book
:
The
risk
that
the
Barclays
Bank
Group
is
exposed
to
capital
or
income
volatility
because
of
a
mismatch
between
the
interest
rate
exposures
of
its
(non
-
traded)
assets
and
liabilities.
◾
Interest
rate
risk
in
the
banking
book
overview
and
summary
of
performance
◾
Net
interest
income
sensitivity
◾
Analysis
of
equity
sensitivity
◾
Volatility
of
the
fair
value
through
other
comprehensive
income
(
FVOCI
)
portfolio
in
the
liquidity
pool
81
81
82
83
Operational
risk:
The
risk
of
loss
to
the
Barclays
Bank
Group
from
inadequate
or
failed
processes
or
systems,
human
factors
or
due
to
external
events
(for
example
fraud)
where
the
root
cause
is
not
due
to
credit
or
market
risks.
◾
Operational
risk
overview
and
summary
of
performance
◾
Operational
risk
profile
87
87
Model
risk:
The
risk
of
the
potential
adverse
consequences
from
financial
assessments
or
decisions
based
on
incorrect
or
misused
model
outputs
and
reports.
◾
Model
risk
overview
and
summary
of
performance
87
Conduct
risk:
The
risk
of
detriment
to
customers,
clients,
market
integrity,
effective
competition
or
Barclays
from
the
inappropriate
supply
of
financial
services,
including
instances
of
wilful
or
negligent
misconduct.
◾
Conduct
risk
overview
and
summary
of
performance
87
Reputation
risk:
The
risk
that
an
action,
transaction,
investment,
event,
decision,
or
business
relationship
will
reduce
trust
in
the
Barclays
Bank
Group’s
integrity
and/or
competence.
◾
Reputation
risk
overview
and
summary
of
performance
87
Risk
review
Contents
Barclays
Bank
PLC
2019
Annual
Report
on
Form
20-F
24
Page
Legal
risk:
The
risk
of
loss
or
imposition
of
penalties,
damages
or
fines
from
the
failure
of
the
Barclays
Bank
Group
to
meet
its
legal
obligations
including
regulatory
or
contractual
requirements.
◾
Legal
risk
overview
and
summary
of
performance
87
Su
pervision
and
regulation
The
Barclays
Bank
Group’s
operations,
including
its
overseas
offices,
subsidiaries
and
associates,
are
subject
to
a
significant
body
of
rules
and
regulations.
◾
Supervision
of
the
Barclays
Bank
Group
◾
Global
regulatory
developments
◾
Financial
regulatory
framework
88
88
89
Risk
review
Risk
management
Barclays’
risk
management
strategy
Barclays
Bank
PLC
2019
Annual
Report
on
Form
20-F
25
The
Barclays
Bank
Group’s
risk
management
strategy
This
section
introduces
the
Barclays
Bank
Group’s
approach
to
managing
and
identifying
risks,
and
for
fostering
a
strong
risk
culture.
Enterprise
Risk
Management
Framework
(ERMF)
The
ERMF
sets
the
strategic
approach
for
risk
management
by
defining
standards,
objectives
and
responsibilities
for
all
areas
of
the
Barclays
Group.
It
is
approved
by
the
Barclays
PLC
Board
on
recommendation
of
the
Barclays
Group
Chief
Risk
Officer
(CRO)
;
it
is
then
adopted
by
the
Barclays
Bank
Group
with
modifications
where
needed.
It
supports
senior
management
in
effective
risk
management
and
developing
a
strong
risk
culture.
The
ERMF
sets
out:
◾
Segregation
of
duties:
The
ERMF
defines
a
Three
Lines
of
Defence
model
.
◾
Principal
risks
faced
by
the
Barclays
Bank
Group
:
This
list
guides
the
organisation
of
the
risk
management
function,
and
the
identification,
management
and
reporting
of
risks.
◾
Risk
appetite
requirements
:
This
helps
define
the
level
of
risk
we
are
willing
to
undertake
in
our
business.
◾
Roles
and
responsibilities
for
risk
management:
The
ERMF
sets
out
the
accountabilities
of
the
Barclays
Bank
Group
CEO
and
other
senior
managers,
as
well
as
the
Barclays
Bank
Group
committees.
The
ERMF
is
complemented
by
frameworks,
policies
and
standards
which
are
mainly
aligned
to
individual
Principal
Risks:
◾
Frameworks
cover
the
management
approach
for
a
collection
of
related
activities
and
define
the
associated
policies
used
to
govern
them.
◾
Policies
set
out
principles
and
other
core
requirements
for
the
activities
of
the
Barclays
Bank
Group
.
Policies
describe
“what”
must
be
done.
◾
Standards
set
out
the
key
control
objectives
that
describe
how
the
requirem
ents
set
out
in
the
p
olicy
are
met,
and
who
needs
to
carry
them
out.
Standards
describe
“how”
controls
should
be
undertaken.
Segregation
of
duties
-
the
"Three
Lines
of
Defence"
model
The
ERMF
sets
out
a
clear
lines
of
defence
model.
All
colleagues
are
responsible
for
understanding
and
managing
risks
within
the
context
of
their
individual
roles
and
responsibilities,
as
set
out
below:
◾
First
line
comprises
all
employees
engaged
in
the
revenue
generating
and
client
facing
areas
of
the
Barclays
Bank
Group
an
d
all
associated
support
functions,
including
Finance,
Treasury,
and
Human
Resources.
The
first
line
is
responsible
for
identifying
and
managing
the
risks
they
generate,
establishing
a
control
framework,
and
escalating
risk
events
to
Risk
and
Compliance.
◾
Second
line
is
comprised
of
the
Risk
and
Compliance
functions.
The
role
of
the
second
line
is
to
establish
the
limits,
rules
and
constraints
under
which
first
line
activities
shall
be
performed,
consistent
with
the
r
isk
appetite
of
the
Barclays
Bank
Group
,
and
to
monitor
the
performance
of
the
first
line
against
these
limits
and
constraints.
Note
that
limits
for
a
number
of
first
line
activities,
related
to
o
perational
r
isk,
will
be
set
by
the
first
line
and
overseen
by
the
Chief
Con
trols
Office.
These
will
remain
subject
to
supervision
by
the
second
line.
◾
Third
line
of
defence
is
Internal
Audit,
who
are
responsible
for
providing
independent
assurance
over
the
effectiveness
of
governance,
risk
management
and
control
over
current,
systemic
and
evolving
risks.
◾
The
Legal
function
provides
support
to
all
areas
of
the
bank
and
is
not
formally
part
of
any
of
the
three
lines.
However
,
it
is
subject
to
second
line
oversight.
Principal
risks
The
ERMF
identifies
eight
principal
risks
(see
pages
31
to
36)
and
sets
out
associated
responsibilities
and
expectations
around
risk
management.
Each
of
the
principal
r
isks
is
overseen
by
an
accountable
executive
within
the
Barclays
Group
who
is
responsible
for
the
framework,
p
olicies
and
standards
that
detail
the
related
requirem
ents.
Risk
reports
to
executive
and
Board
committees
are
clearly
organised
by
p
rincipal
r
isk.
In
addition,
certain
risks
span
more
than
one
principal
risk;
these
are
also
subject
to
the
ERMF
and
are
reported
to
executive
and
Board
committees.
Risk
appetite
for
the
principal
risks
Risk
appetite
is
defined
as
the
level
of
risk
which
the
Barclays
Bank
Group’s
businesses
are
prepared
to
accept
in
the
conduct
of
their
activities.
It
sets
the
‘tone
from
the
top’
and
provides
a
basis
for
ongoing
dialogue
between
management
and
Board
with
respect
to
the
Barclays
Bank
Group’s
current
and
evolving
risk
profile,
allowing
strategic
and
financial
decisions
to
be
made
on
an
informed
basis.
The
Barclays
Group
’s
total
risk
appetite
and
its
allocation
to
the
Barclays
Bank
G
roup
are
supported
by
limits
to
control
exposures
and
activities
that
have
material
concentration
risk
implications.

Risk
review
Risk
management
Barclays’
risk
management
strategy
Barclays
Bank
PLC
2019
Annual
Report
on
Form
20-F
26
Risk
Committees
Barclays
Bank
Group
Product/Risk
Type
Committees
consider
risk
matters
relevant
to
their
business,
and
escalate
as
required
to
the
Barclays
Group
Risk
Committee,
whose
Chairman,
in
turn,
escalates
to
the
Barclays
Bank
PLC
Board
Committees
and
the
Barclays
Bank
PLC
Board.
There
are
two
Board
-
level
forums
which
oversee
the
application
of
the
ERMF
and
review
and
monitor
r
isk
across
Barclays
Bank
PLC.
These
are:
the
Barclays
Bank
PLC
Board
Risk
Committee
and
the
Barclays
Bank
PLC
Board
Audit
Committee.
Additionally,
the
Barclays
Bank
PLC
Board
Remuneration
Committee
oversees
pay
practices
focusing
on
aligning
pay
to
sustainable
performance
in
line
with
p
olicies.
Finally,
the
Barclays
Bank
PLC
Board
receives
regular
information
on
the
risk
profile
of
Barclays
Bank
Group,
and
has
ultimate
responsibility
for
risk
appetite
and
capital
plans,
within
the
parameters
set
by
the
Barc
lays
PLC
Board.
◾
The
Barclays
Bank
PLC
Board:
approved
by
the
B
arclays
PLC
Board
and
disseminated
across
legal
entities,
including
the
Barclays
Bank
Group
.
The
Barclays
Bank
Group
may
choose
to
adopt
a
lower
risk
appetite
than
allocated
to
it
by
the
Barclays
Group.
The
Barclays
Bank
PLC
Board
is
also
responsible
for
the
adoption
of
the
ERMF.
◾
The
Barclays
Bank
PLC
Board
Risk
Committee
(BRC
):
The
BRC
monitors
Barclays
Bank
Group’s
risk
profile
against
the
agreed
appetite.
Where
actual
performance
differs
from
expectations,
the
actions
taken
by
management
are
reviewed
to
ascertain
that
the
BRC
is
comfortable
with
them.
The
Barclays
Bank
Group
CRO
regularly
presents
a
report
to
the
BRC
summarising
developments
in
the
risk
environment
and
performance
trends
in
the
key
portfolios.
The
BRC
also
reviews
certain
key
risk
methodol
ogies,
the
effectiveness
of
risk
management,
and
the
Barclays
Bank
Grou
p
risk
profile,
including
the
material
issues
affecting
each
business
portfolio
and
forward
risk
trends.
The
committee
also
commissions
in-
depth
analyses
of
significant
risk
topics,
which
are
presented
by
the
Barclays
Bank
Group
CRO
or
senior
r
isk
managers
in
the
businesses.
All
members
are
independent
non
-
executive
Directors
.
The
Chairman
of
the
BRC
also
sits
on
the
BAC.
◾
The
Barclays
Bank
PLC
Board
Audit
Committee
(BAC):
material
control
issues
of
significance,
and
on
accounting
judgements
(including
impairment).
It
also
receives
a
half-yearly
review
of
the
adequacy
of
impairment
allowan
ces,
which
it
reviews
relative
to
the
risk
inherent
in
the
portfolios,
the
business
environment
and
Barclays
Bank
Group
policies
and
methodologies.
The
Chairman
of
the
BAC
also
sits
on
the
BRC.
◾
The
Barclays
Bank
PLC
Board
Remuneration
Committee
(RemCo):
risk
profile,
and
proposals
on
ex
-
ante
and
ex
-
post
risk
adjustments
to
variable
remuneration.
These
inputs
are
considered
in
the
setting
of
performance
incentives.
A
small
number
of
risk
management
forums,
supported
by
reporting
processes,
include
representation
from
the
Barclays
Group
risk
management
executives,
as
well
as
from
the
operating
entities
(including
the
Barclays
Bank
Group
)
as
appropriate.
This
is
typically
to
consider
matters
that
are
relevant
to
the
risk
profile
of
the
Barclays
Group,
and/or
where
it
is
appropriate
to
make
decisions
that
apply
uniformly
across
the
Barclays
Group
(for
instance,
the
Barclays
Group
Impairment
Committee
approves
impairment
results).
Role
o
f
the
Barclays
Group
Risk
Management
Processes
and
Forums
in
the
Barclays
Bank
Group
The
Barclays
Group
Risk
teams
and
Board
Committees
conduct
risk
management
activity,
and
oversight,
in
respect
of
the
Barclays
Bank
Group:
◾
The
Barclays
Group
Board
allocates
a
portion
of
the
overall
risk
appetite
to
the
Barclays
Bank
Group;
◾
Certain
Barclays
Group
Committees
and
executives
review,
and
take
decisions
on,
matters,
events
or
transactions
originating
in
the
Barclays
Bank
Group
that
are
relevant
to
the
risk
profile
of
the
Barclays
Group
;
Risk
review
Risk
management
Barclays’
risk
management
strategy
Barclays
Bank
PLC
2019
Annual
Report
on
Form
20-F
27
◾
Barclays
Group
-
wide
risk
policies
are
owned
by
the
Barclays
Group
Risk
Function
teams,
and
adopted
by
the
Barclays
Bank
Group.
Entity-specific
addenda
are
agreed
with
the
Barclays
Group
where
local
regulations
would
otherwi
se
preclude
adoption,
or
to
clarify
or
emphasise
particular
aspects.
Barclays’
risk
culture
Risk
culture
can
be
defined
as
the
norms,
attitudes
and
behaviours
related
to
risk
awareness,
risk
taking
and
risk
management
.
This
is
reflected
in
how
the
Barclays
Bank
Group
identifies,
escalates
and
manages
risk
matters.
The
Barclays
Bank
Group
is
committed
to
maintaining
a
robust
risk
culture
in
which:
◾
management
expect,
model
and
reward
the
right
behaviours
from
a
risk
and
control
perspective;
◾
colleagues
identify,
manage
and
escalate
risk
and
control
matters,
and
meet
their
responsibilities
around
risk
management.
Specifically,
all
employees
regardless
of
their
positions,
functions
or
locations
must
play
their
part
in
the
Barclays
Bank
Group’s
risk
managem
ent.
Employees
are
required
to
be
familiar
with
risk
management
policies
which
are
relevant
to
their
responsibilities,
know
how
to
escalate
actual
or
potential
risk
issues,
and
have
a
role
-
appropriate
level
of
awareness
of
the
risk
management
process
as
de
fined
by
the
ERMF.
Our
Code
of
Conduct
–
the
Barclays
Way
Globally,
all
colleagues
must
attest
to
the
“Barclays
Way”,
our
Code
of
Conduct,
and
comply
with
all
frameworks,
policies
and
standards
applicable
to
their
roles.
The
Code
of
Conduct
outlines
the
purpose
and
values
which
govern
our
“Barclays
Way”
of
working
across
our
business
globally.
It
constitutes
a
reference
point
covering
the
aspects
of
colleagues’
working
relationships,
with
other
Barclays
employees,
customers
and
clients,
governments
and
regulators,
business
partners,
suppliers,
competitors
and
the
broader
community.
Risk
review
Material
existing
and
emerging
risks
Barclays
Bank
PLC
2019
Annual
Report
on
Form
20-F
28
Material
existing
and
emerging
risks
to
the
Barclays
Bank
Group’s
future
performance
The
Barclays
Bank
Group
has
identified
a
broad
range
of
risks
to
which
its
businesses
are
exposed
.
Material
risks
are
those
to
which
senior
management
pay
particular
attention
and
which
could
cause
the
delivery
of
the
Barclays
Bank
Group’s
strategy,
results
of
operations,
financial
condition
and/or
prospects
to
differ
materially
from
expectations.
Emerging
risks
are
those
which
have
unknown
components,
the
impact
of
which
could
crystallise
over
a
longer
time
peri
od.
In
addition,
certain
other
factors
beyond
the
Barclays
Bank
Group’s
control,
including
escalation
of
terrorism
or
global
conflicts,
natural
disasters,
epidemic
outbreaks
and
similar
events,
although
not
detailed
below,
could
have
a
similar
impact
on
the
Barclays
Bank
Group.
Material
existing
and
emerging
risks
potentially
impacting
more
than
one
principal
risk
i)
Business
conditions,
general
economy
and
geopolitical
issues
The
Barclays
Bank
Group’s
operations
are
subject
to
potentially
unfavourable
global
and
local
economic
and
market
conditions,
as
well
as
geopolitical
developments,
which
may
have
a
material
effect
on
the
Barclays
Bank
Group’s
business,
results
of
operations,
financial
condition
and
prospects.
A
deterioration
in
global
or
local
economic
and
market
conditions
may
lead
to
(among
other
things)
:
(i)
deteriorating
business,
consumer
or
investor
confidence
and
lower
levels
of
fixed
asset
investment
and
productivity
growth,
which
in
turn
may
lead
to
lower
client
activity,
including
lower
demand
for
borrowing
from
creditworthy
customers;
(ii)
higher
default
rates,
delinquencies,
write-
offs
and
impairment
charges
as
borrowers
struggle
with
the
burden
of
additional
debt;
(iii)
subdued
asset
prices
and
payment
patterns,
including
the
value
of
any
collateral
held
by
the
Barclays
Bank
Group;
(iv)
mark
-
to-
market
losses
in
trading
portfolios
resulting
from
changes
in
factors
such
as
credit
ratings,
share
prices
and
solvency
of
counterparties;
and
(v)
revisions
to
calculated
expected
credit
losses
(ECLs)
leading
to
increases
in
impairment
allowances.
In
addition,
the
Barclays
Bank
Group’s
ability
to
borrow
from
other
financial
institutions
or
raise
funding
from
external
investors
may
be
affected
by
deteriorating
economic
co
nditions
and
market
disruption.
Geo
political
events
may
lead
to
further
financial
instability
and
affect
economic
growth.
In
particular:
◾
In
the
UK
,
the
decision
to
leave
the
European
Union
(EU)
may
give
rise
to
further
economic
and
political
consequences
including
for
investment
and
market
confidence
in
the
UK
and
the
remainder
of
EU
.
See
“(ii)
Process
of
UK
withdrawal
from
the
EU
”
below
for
further
details.
◾
A
significant
proportion
of
the
Barclays
Bank
Group’s
portfolio
is
located
in
the
US,
including
a
major
credit
card
portfolio
and
a
range
of
corporate
and
investment
banking
exposures.
The
possibility
of
significant
continued
changes
in
US
policy
in
certain
sectors
(including
trade,
healthcare
and
commodities),
may
have
an
impact
on
the
Barclays
Bank
Group’s
associated
portfolios.
Stress
in
the
US
economy,
weakening
GDP
and
the
associated
exchange
rate
fluctuations,
heightened
trade
tensions
(
such
as
the
current
dispute
between
the
US
and
China)
,
an
unexpected
rise
in
unemployment
and/or
an
increase
in
interest
rates
could
lead
to
incre
ased
levels
of
impairment,
resulting
in
a
negative
impact
on
the
Barclays
Bank
Group’s
profitability.
◾
Global
GDP
growth
weakened
in
2019,
as
elevated
policy
uncertainty
weighed
on
manufacturing
activity
and
investment.
As
a
result,
a
number
of
central
bank
s,
most
notably
the
Federal
Reserve
and
European
Central
Bank
(
ECB)
,
pursued
monetary
easing.
Growth
is
expected
to
stabilise
in
2020,
but
macroeconomic
risks
remain
skewed
to
the
downside,
while
concerns
around
the
efficacy
of
existing
policy
tools
to
cou
nter
these
risks
persist.
An
escalation
in
geopolitical
tensions,
increased
use
of
protectionist
measures
or
a
disorderly
withdrawal
from
the
EU
may
negatively
impact
the
Barclays
Bank
Group’s
business
in
the
affected
regions.
◾
In
China
the
pace
of
credit
growth
remains
a
concern,
given
the
high
level
of
leverage
and
despite
government
and
regulatory
action.
A
stronger
than
expected
slowdown
could
result
if
authorities
fail
to
appropriately
manage
growth
during
the
transition
from
manufacturing
towards
serv
ices
and
the
end
of
the
investment
and
credit
-
led
boom.
Deterioration
in
emerging
markets
could
affect
the
Barclays
Bank
Group
if
it
results
in
higher
impairment
charges
via
sovereign
or
counterparty
defaults.
ii)
Process
of
UK
withdrawal
from
the
EU
The
manner
in
which
the
UK
withdraws
from
the
EU
will
likely
have
a
marked
impact
on
general
economic
conditions
in
the
UK
and
the
EU.
The
UK’s
future
relationship
with
the
EU
and
its
trading
relationships
with
the
rest
of
the
world
could
take
a
number
of
years
to
resolve.
This
may
lead
to
a
prolonged
period
of
uncertainty,
unstable
economic
conditions
and
market
volatility,
including
fluctuations
in
interest
rates
and
foreign
exchange
rates.
Whilst
the
exact
impact
of
the
UK’s
withdrawal
from
the
EU
is
unk
nown,
the
Barclays
Bank
Group
continues
to
monitor
the
risks
that
may
have
a
more
immediate
impact
for
its
business,
including,
but
not
limited
to:
◾
Market
volatility,
including
in
currencies
and
interest
rates,
might
increase
which
could
have
an
impact
on
the
value
of
the
Barclays
Bank
Group’s
trading
book
positions.
◾
Credit
spreads
could
widen
leading
to
reduced
investor
appetite
for
the
Barclays
Bank
Group’s
debt
securities.
This
could
negatively
impact
the
Barclays
Bank
Group’s
cost
of
and/or
access
to
fu
nding.
In
addition,
market
and
interest
rate
volatility
could
affect
the
underlying
value
of
assets
in
the
banking
book
and
securities
held
by
the
Barclays
Bank
Group
for
liquidity
purposes.
◾
A
credit
rating
agency
downgrade
applied
directly
to
the
Barclays
Bank
Group,
or
indirectly
as
a
result
of
a
credit
rating
agency
downgrade
to
the
UK
Government,
could
significantly
increase
the
Barclays
Bank
Group’s
cost
of
and/or
reduce
its
access
to
funding,
widen
credit
spreads
and
materially
adversely
affect
the
Ba
rclays
Bank
Group’s
interest
margins
and
liquidity
position.
◾
A
UK
recession
with
lower
growth,
higher
unemployment
and
falling
UK
property
prices
could
lead
to
increased
impairments
in
relation
to
a
number
of
the
Barclays
Bank
Group’s
portfolios,
including
,
but
not
limited
to,
its
corporate
portfolios
and
commercial
real
estate
exposures.
◾
The
ability
to
attract,
or
prevent
the
departure
of,
qualified
and
skilled
employees
may
be
impacted
by
the
UK’s
and
the
EU’s
future
approach
to
the
EU
freedom
of
movement
and
immigration
from
the
EU
countries
and
this
may
impact
the
Barclays
Bank
Group’
s
access
to
the
EU
talent
pool.
Risk
review
Material
existing
and
emerging
risks
Barclays
Bank
PLC
2019
Annual
Report
on
Form
20-F
29
◾
A
disorderly
exit
from
the
EU
may
put
a
strain
on
the
capabilities
of
the
Barclays
Bank
Group’s
systems,
increasing
the
risk
of
failure
of
those
systems
and
potentially
resulting
in
losses
and
reputational
damage
for
the
Barclays
Bank
Group.
◾
Changes
to
current
EU
‘Passporting’
rights
may
require
further
adjustment
to
the
current
model
for
the
Barclays
Bank
Group’s
cross
-
border
banking
operation
which
could
increase
operational
complexity
and/or
costs
for
the
Barclays
Bank
Group.
◾
The
legal
framework
within
which
the
Barclays
Bank
Group
operates
could
change
and
become
more
uncertain
if
the
UK
takes
steps
to
replace
or
repeal
certain
laws
currently
in
force,
which
are
based
on
EU
legislation
and
regulation
(including
EU
regulation
of
the
banking
sector)
following
its
withdrawal
from
the
EU.
Certainty
around
the
ability
to
maintain
existing
contracts,
enforceability
of
certain
legal
obligations
and
uncertainty
around
the
jurisdiction
of
the
UK
courts
may
be
affected
until
the
impacts
of
the
loss
of
the
current
legal
and
regulatory
arrangements
between
the
UK
and
EU
and
the
enforceabil
ity
of
UK
judgements
across
the
EU
are
fully
known.
◾
Should
the
UK
see
reduced
access
to
financial
markets
infrastructures
(including
exchanges,
central
counterparties
and
payments
services,
or
other
support
services
provided
by
third
party
suppliers)
service
provision
for
clients
could
be
impacted
,
likely
resulting
in
reduced
market
share
and
revenue
and
increased
operating
costs
for
the
Barclays
Bank
Group.
iii)
The
impact
of
interest
rate
changes
on
the
Barclays
Bank
Group’s
profitability
Any
changes
to
interest
rates
are
significant
for
the
Barclays
Bank
Group,
especially
given
the
uncertainty
as
to
the
direction
of
interest
rates
and
the
pace
at
which
interest
rates
may
change
particularly
in
the
Barclays
Bank
Group’s
main
markets
of
the
UK
and
the
US.
A
continued
period
of
low
interest
rates
and
flat
yield
curves,
including
any
further
cuts,
may
affect
and
continue
to
put
pressure
on
the
Barclays
Bank
Group’s
net
interest
margins
(the
difference
between
its
lending
income
and
borrowing
costs)
and
could
adversely
affect
the
profitability
and
prospects
of
the
Barclays
Bank
Group.
However,
whilst
interest
rate
rises
could
positively
impact
the
Barclays
Bank
Group’s
profitability
as
retail
and
corporate
business
income
increases
due
to
margin
de
-
compression
,
further
increases
in
interest
rates,
if
larger
or
more
frequent
than
expected,
could
lead
to
general
ly
weaker
than
expected
growth,
reduced
business
confidence
and
higher
unemployment,
which
in
turn
could
cause
stress
in
the
lending
portfolio
and
underwr
iting
activity
of
the
Barclays
Bank
Group.
Resultant
higher
credit
losses
driving
an
increased
impairment
charge
would
most
notably
impact
retail
unsecured
portfolios
and
wholesale
non
-
investment
grade
lending
and
could
have
a
material
effect
on
the
Barcla
ys
Bank
Group’s
business,
results
of
operations,
financial
condition
and
prospects.
In
addition,
changes
in
interest
rates
could
have
an
adverse
impact
on
the
value
of
the
securities
held
in
the
Barclays
Bank
Group’s
liquid
asset
portfolio.
Consequently,
this
could
create
more
volatility
than
expected
through
the
Barclays
Bank
Group’s
FVOCI
reserves.
iv)
The
competitive
environments
of
the
banking
and
financial
services
industry
The
Barclays
Bank
Group’s
businesses
are
conducted
in
competitive
environments
(in
particular,
in
the
UK
and
US),
with
increased
competition
scrutiny,
and
the
Barclays
Bank
Group’s
financial
performance
depends
upon
the
Barclays
Bank
Group’s
ability
to
respond
effectively
to
competitive
pressures
whether
due
to
competitor
behaviour,
new
entrants
to
the
market,
consumer
demand,
technological
changes
or
otherwise.
This
competitive
environment,
and
the
Barclays
Bank
Group’s
response
to
it,
may
have
a
material
adverse
effect
on
the
Barclays
Bank
Group’s
ability
to
maintain
existing
or
capture
additional
market
share,
business,
results
of
operations,
financial
condition
and
prospects.
v)
Regulatory
change
agenda
and
impact
on
bus
iness
model
The
Barclays
Bank
Group
remains
subject
to
ongoing
significant
levels
of
regulatory
change
and
scrutiny
in
many
of
the
countries
in
which
it
operates
(including,
in
particular,
the
UK
and
the
US).
As
a
result,
regulatory
risk
will
remain
a
focus
for
senior
management
.
Furthermore,
a
more
intensive
regulatory
approach
and
enhanced
requirements
together
with
the
potential
lack
of
international
regulatory
co
-
ordination
as
enhanced
supervisory
standards
are
developed
and
implemented
may
adverse
ly
affect
the
Barclays
Bank
Group’s
business,
capital
and
risk
management
strategies
and/or
may
result
in
the
Barclays
Bank
Group
deciding
to
modify
its
legal
entity,
capital
and
funding
structures
and
business
mix,
or
to
exit
certain
business
activities
altogether
or
not
to
expand
in
areas
despite
otherwise
attractive
potential.
There
are
several
significant
pieces
of
legislation
and
areas
of
focus
which
will
require
significant
management
attention,
cost
and
resource,
including:
◾
Chan
ges
in
prudential
requ
irements
may
impact
minimum
requirements
for
own
funds
and
eligible
liabilities
(MREL)
(including
requirements
for
internal
MREL),
leverage,
liquidity
or
funding
requirements,
applicable
buffers
and/or
add
-
ons
to
such
minimum
requirements
and
risk
weighted
assets
calculation
methodologies
all
as
may
be
set
by
international,
EU
or
national
authorities.
Such
or
similar
changes
to
prudential
requirements
or
additional
supervisory
and
prudential
expectations,
either
individually
or
in
aggregate,
may
result
in,
among
other
things,
a
need
for
further
management
actions
to
meet
the
changed
requirements,
such
as:
-
increasing
capital,
MREL
or
liquidity
resources,
reducing
leverage
and
risk
weighted
assets;
-
restricting
distributions
on
capital
instruments;
-
modifying
the
terms
of
outstanding
capital
instruments;
-
modifying
legal
entity
structure
(including
with
regard
to
issuance
and
deployment
of
capital,
MREL
and
funding);
-
changing
the
Barclays
Bank
Group’s
business
mix
or
exiting
other
businesses;
-
and/or
undertaking
other
actions
to
strengthen
the
Barclays
Bank
Group’s
position.
◾
The
derivatives
market
has
been
the
subject
of
particular
focus
for
regulators
in
recent
years
across
the
G20
countries
and
beyond,
with
regulations
introduced
which
require
the
reporting
and
clearing
of
standardised
over
the
counter
(OTC)
derivatives
and
the
mandatory
margining
of
non
-
cleared
OTC
derivatives.
The
se
regulation
s
may
increase
costs
for
market
participants,
as
well
as
reduce
liquidity
in
the
derivatives
markets.
More
broadly
,
changes
to
the
regulatory
framework
(in
particular,
the
review
of
the
second
Markets
in
Financial
Instruments
Directive
and
the
implementation
of
the
Benchmarks
Regulation)
could
entail
significant
costs
for
market
participants
and
may
hav
e
a
significant
impact
on
certain
markets
in
which
the
Barclays
Bank
Group
operates.
Risk
review
Material
existing
and
emerging
risks
Barclays
Bank
PLC
2019
Annual
Report
on
Form
20-F
30
◾
The
Barclays
Group
and
certain
of
its
members
including
Barclays
Bank
PLC
are
subject
to
supervisory
stress
testing
exercises
in
a
number
of
jurisdictions.
These
exercises
currently
include
the
programmes
of
the
Bank
of
England
(BoE)
,
the
European
Banking
Authority
(EBA)
,
the
Federal
Deposit
Insurance
Corporation
(
FDIC)
and
the
Federal
Reserve
Board
(
FRB
).
Failure
to
meet
the
requirements
of
regulatory
stress
tests,
or
the
failure
by
regulators
to
approve
the
stress
test
results
and
capital
plans
of
the
Barclays
Group,
could
result
in
the
Barclays
Group
or
certain
of
its
members
including
Barclays
Bank
PLC
being
required
to
enhance
their
capital
position,
limit
capital
distributions
or
position
additional
capital
in
specific
subsidiaries.
For
further
details
on
the
regulatory
supervision
of,
and
regulations
applicable
to,
the
Barclays
Bank
Group,
see
Supervision
and
regulation
on
pages
88
to
94.
vi)
The
impact
of
climate
change
on
the
Barclays
Bank
Group’s
business
The
risks
associated
with
climate
change
are
subject
to
rapidly
increasing
societal,
regulatory
and
political
focus,
both
in
the
UK
and
internationally.
Embedding
climate
risk
into
the
Barclays
Bank
Group’s
risk
framework
in
line
with
regulatory
expectations,
and
adapting
the
Barcl
ays
Bank
Group’s
operations
and
business
strategy
to
address
both
the
financial
risks
resulting
from:
(i)
the
physical
risk
of
climate
change;
and
(ii)
the
risk
from
the
transition
to
a
low
carbon
economy
,
could
have
a
significant
impact
on
the
Barclays
Ba
nk
Group’s
business.
Physical
risks
from
climate
change
arise
from
a
number
of
factors
and
relate
to
specific
weather
events
and
longer
-
term
shifts
in
the
climate.
The
nature
and
timing
of
extreme
weather
events
are
uncertain
but
they
are
increasing
in
frequency
and
their
impact
on
the
economy
is
predicted
to
be
more
acute
in
the
future.
The
potential
impact
on
the
economy
includes,
but
is
not
limited
to,
lower
GDP
growth,
higher
unemployment
and
significant
changes
in
asset
prices
and
profitability
of
industries.
Damage
to
the
properties
and
operations
of
borrowers
could
impair
asset
values
and
the
creditworthiness
of
customers
leading
to
increased
default
rates,
delinquencies,
write-
offs
and
impairment
charges
in
the
Barclays
Bank
Group’s
portfolios
.
In
addition,
the
Barclays
Bank
Group’s
premises
and
resilience
may
also
suffer
physical
damage
due
to
weather
events
leading
to
increased
costs
for
the
Barclays
Bank
Group.
As
the
economy
transitions
to
a
low
-
carbon
economy,
financial
institutions
such
as
the
Barclays
Bank
Group
may
face
significant
and
rapid
developments
in
stakeholder
expectations,
policy,
law
and
regulation
which
could
impact
the
lending
activities
the
Barclays
Bank
Group
undertakes,
as
well
as
the
risks
associated
with
its
lending
portfol
ios,
and
the
value
of
the
Barclays
Bank
Group’s
financial
assets.
As
sentiment
towards
climate
change
shifts
and
societal
preferences
change,
the
Barclays
Bank
Group
may
face
greater
scrutiny
of
the
type
of
business
it
conducts,
adverse
media
coverage
and
reputational
damage,
which
may
in
turn
impact
customer
demand
for
the
Barclays
Bank
Group's
products,
returns
on
certain
business
activities
and
the
value
of
certain
assets
and
trading
positions
resulting
in
impairment
charges.
In
addition,
the
impacts
of
physical
and
transition
climate
risks
can
lead
to
second
order
connected
risks,
which
have
the
potential
to
affect
the
Barclays
Bank
Group’s
retail
and
wholesale
portfolios.
The
impacts
of
climate
change
may
increase
losses
for
those
sectors
sensitive
to
the
effects
of
physical
and
transition
risks.
Any
subsequent
increase
in
defaults
and
rising
unemployment
could
create
recessionary
pressures,
which
may
lead
to
wider
deterioration
in
the
creditworthiness
of
the
Barclays
Bank
Group’s
clients,
higher
ECLs,
and
increased
charge
-
offs
and
defaults
among
retail
customers.
If
the
Barclays
Bank
Group
does
not
adequately
embed
risks
associated
with
climate
change
into
its
risk
framework
to
appropriately
measure,
manage
and
disclose
the
various
financial
and
operational
risks
it
faces
as
a
result
of
climate
change,
or
fails
to
adapt
its
strategy
and
business
model
to
the
changing
regulatory
requirements
and
market
expectations
on
a
timely
basis,
it
may
have
a
material
and
adverse
impact
on
the
Barclays
Bank
Gr
oup’s
level
of
business
growth,
competitiveness,
profitability,
capital
requirements,
cost
of
funding,
and
financial
condition.
For
further
details
on
the
Barclays
Bank
Group’s
approach
to
climate
change,
see
page
37
of
climate
change
risk
management.
vii)
Impact
of
benchmark
interest
rate
reforms
on
the
Barclays
Bank
Group
For
several
years,
global
regulators
and
central
banks
have
been
driving
international
efforts
to
reform
key
benchmark
interest
rates
and
indices,
such
as
the
London
Interbank
Offered
Rate
(“LIBOR”),
which
are
used
to
determine
the
amounts
payable
under
a
wide
range
of
transactions
and
make
them
more
reliable
and
robust.
This
has
resulted
in
significant
changes
to
the
methodology
and
operation
of
certain
benchmarks
and
indices,
the
adoptio
n
of
alternative
“risk-free”
reference
rates
and
the
proposed
discontinuation
of
certain
reference
rates
(including
LIBOR),
with
further
changes
anticipated.
Uncertainty
as
to
the
nature
of
such
potential
changes,
the
availability
and/or
suitability
of
alternative
“risk-free”
reference
rates
and
other
reforms
may
adversely
affect
a
broad
range
of
transactions
(including
any
securities,
loans
and
derivatives
which
use
LIBOR
to
determine
the
amount
of
interest
payable
that
are
included
in
the
Barclays
Bank
Gr
oup’s
financial
assets
and
liabilities)
that
use
these
reference
rates
and
indices
and
introduce
a
number
of
risks
for
the
Barclays
Bank
Group,
including,
but
not
limited
to:
◾
Conduct
risk:
conduct
risks,
which
may
lead
to
customer
complaints,
regulatory
sanctions
or
reputational
impact
if
the
Barclays
Bank
Group
is
(
i)
considered
to
be
undertaking
market
activities
that
are
manipulative
or
create
a
false
or
misleading
impression,
(ii)
misusing
sensitive
information
or
not
identifying
or
appropriately
managing
or
mitigating
conflicts
of
interest,
(iii)
providing
custom
ers
with
inadequate
advice,
misleading
information,
unsuitable
products
or
unacceptable
service,
(iv)
not
taking
an
appropriate
or
consistent
response
to
remediation
activity
or
customer
complaints,
(v)
providing
regulators
with
inaccurate
regulatory
repor
ting
or
(vi)
colluding
or
inappropriately
sharing
information
with
competitors;
◾
Financial
risks:
“risk-free”
reference
rates
may
impact
the
ability
of
members
of
the
Barclays
Bank
Group
to
calculate
and
model
amounts
rece
ivable
by
them
on
certain
financial
assets
and
determine
the
amounts
payable
on
certain
financial
liabilities
(such
as
debt
securities
issued
by
them)
because
currently
alternative
“risk-free”
reference
rates
(such
as
the
Sterling
Overnight
Index
Average
(
SONIA)
and
the
Secured
Overnight
Financing
Rate
(SOFR))
are
look
-
back
rates
whereas
term
rates
(such
as
LIBOR)
allow
borrowers
to
calculate
at
the
start
of
any
interest
period
exactly
how
much
is
payable
at
the
end
of
such
interest
period.
This
may
have
a
material
adverse
effect
on
the
Barclays
Bank
Group’s
cashflows;
Risk
review
Material
existing
and
emerging
risks
Barclays
Bank
PLC
2019
Annual
Report
on
Form
20-F
31
◾
Pricing
risk:
free”
reference
rates
may
impact
the
pricing
mechanisms
used
by
the
Barclays
Bank
Group
on
certain
transactions;
◾
Operational
risk:
“risk-free”
reference
rates
may
require
cha
nges
to
the
Barclays
Bank
Group’s
IT
systems,
trade
reporting
infrastructure,
operational
processes,
and
controls.
In
addition,
if
any
reference
rate
or
index
(such
as
LIBOR)
is
no
longer
available
to
calculate
amounts
payable,
the
Barclays
Bank
Group
may
incur
additional
expenses
in
amending
documentation
for
new
and
existing
transactions
and/or
effecting
the
transition
from
the
original
reference
rate
or
index
to
a
new
reference
rate
or
index;
and
◾
Accounting
risk:
financial
results
and
performance.
Any
of
these
factors
may
have
a
material
adverse
effect
on
the
Barclays
Bank
Group’s
business,
results
of
operations,
financial
conditi
on
and
prospects.
For
further
details
on
the
impacts
of
benchmark
interest
rate
reforms
on
the
Barclays
Bank
Group,
see
Note
13
.
Material
existing
and
emerging
risks
impacting
individual
principal
risks
i)
Credit
risk
Credit
risk
is
the
risk
of
loss
to
the
Barclays
Bank
Group
from
the
failure
of
clients,
customers
or
counterparties,
including
sovereigns,
to
fully
honour
their
obligations
to
members
of
the
Barclays
Bank
Group,
including
the
whole
and
timely
payment
of
pr
incipal,
interest,
collateral
and
other
receivables.
a)
Impairment
The
introduction
of
the
impairment
requirements
of
IFRS
9
Financial
Instruments
,
resulted
in
impairment
loss
allowances
that
are
recognised
earlier,
on
a
more
forward
-
looking
basis
and
on
a
broader
scope
of
financial
instruments,
and
may
continue
to
have,
a
material
impact
on
the
Barclays
Bank
Group’s
business,
results
of
operations,
financial
condition
and
prospects.
Measurement
involves
complex
judgement
and
impairment
charges
could
b
e
volatile,
particularly
under
stressed
conditions.
Unsecured
products
with
longer
expected
lives,
such
as
credit
cards,
are
the
most
impacted.
Taking
into
account
the
transitional
regime,
the
capital
treatment
on
the
increased
reserves
has
the
potential
to
adversely
impact
the
Barclays
Bank
Group’s
regulatory
capital
ratios.
In
addition,
the
move
from
incurred
losses
to
ECLs
has
the
potential
to
impact
the
Barclays
Bank
Group’s
performance
under
stressed
economic
conditions
or
regulatory
stress
tests.
For
more
information,
refer
to
Note
1.
b)
Specific
sectors
and
concentrations
The
Barclays
Bank
Group
is
subject
to
risks
arising
from
changes
in
credit
quality
and
recovery
rate
s
of
loans
and
advances
due
from
borrowers
and
counterparties
in
any
specific
portfol
io.
Any
deterioration
in
credit
quality
could
lead
to
lower
recoverability
and
higher
impairment
in
a
specific
sector.
The
following
are
areas
of
uncertainties
to
the
Barclays
Bank
Group’s
portfolio
which
could
have
a
material
impact
on
performance:
◾
UK
retail,
hospitality
&
leisure.
Softening
demand,
rising
costs
and
a
structural
shift
to
online
shopping
is
fuelling
pressure
on
the
UK
High
Street
and
other
sectors
heavily
reliant
on
consumer
discretionary
spending.
As
these
sectors
continue
to
reposit
ion
themselves,
the
trend
represents
a
potential
risk
in
the
Barclays
Bank
Group’s
UK
corporate
portfolio
from
the
perspective
of
the
its
interactions
with
both
retailers
and
their
landlords.
◾
Consumer
affordability
unemployment,
that
impact
a
customer’s
ability
to
service
unsecured
debt
payments
could
lead
to
increased
arrears
in
unsecured
products.
Barclays
Ba
nk
Group
is
exposed
to
the
adverse
credit
performance
of
unsecured
products,
particularly
in
the
US
through
its
US
Cards
business.
◾
UK
real
estate
market.
UK
property
represents
a
significant
portion
of
the
Barclays
Bank
Group’s
overall
corporate
credit
exp
osure.
In
2019,
property
price
growth
across
the
UK
has
slowed,
particularly
in
London
and
the
South
East
where
the
Barclays
Bank
Group’s
exposure
has
high
concentration.
The
Barclays
Bank
Group
is
at
risk
of
increased
impairment
from
a
material
fall
in
pr
operty
prices.
◾
Leverage
finance
underwriting.
The
Barclays
Bank
Group
takes
on
sub
-
investment
grade
underwriting
exposure,
including
single
name
risk,
particularly
in
the
US
and
Europe.
The
Barclays
Bank
Group
is
exposed
to
credit
events
and
market
volatility
during
the
underwriting
period.
Any
adverse
events
during
this
period
may
potentially
result
in
loss
for
the
Barclays
Bank
Group,
or
an
increased
capital
requirement
should
there
be
a
need
to
hold
the
exposure
for
an
extended
period.
◾
Italian
mortgage
portfolio.
in
run
-
off
and
positions
to
wholesale
customers.
Growth
in
the
Italian
economy
remained
weak
in
2019
and
should
the
economy
deteriora
te
further,
there
could
be
a
material
adverse
effect
on
the
Barclays
Bank
Group’s
results
including,
but
not
limited
to,
increased
credit
losses
and
higher
impairment
charges.
The
Barclays
Bank
Group
also
has
large
individual
exposures
to
single
name
count
erparties,
both
in
its
lending
activities
and
in
its
financial
services
and
trading
activities,
including
transactions
in
derivatives
and
transactions
with
brokers,
central
clearing
houses,
dealers,
other
banks,
mutual
and
hedge
funds
and
other
institutional
clients.
The
default
of
such
counterparties
could
have
a
significant
impact
on
the
carrying
value
of
these
assets.
In
addition,
where
such
counterparty
risk
has
been
mitigated
by
taking
collateral,
credit
risk
may
remain
high
if
the
collateral
held
cann
ot
be
realised,
or
has
to
be
liquidated
at
prices
which
are
insufficient
to
recover
the
full
amount
of
the
loan
or
derivative
exposure.
Any
such
defaults
could
have
a
material
adverse
effect
on
the
Barclays
Bank
Group’s
results
due
to,
for
example,
increas
ed
credit
losses
and
higher
impairment
charges.
For
further
details
on
the
Barclays
Bank
Group’s
approach
to
credit
risk,
see
credit
risk
management
on
pages
38
to
39
and
credit
risk
performance
on
pages
45
to
67.
Risk
review
Material
existing
and
emerging
risks
Barclays
Bank
PLC
2019
Annual
Report
on
Form
20-F
32
ii)
Market
risk
Market
risk
is
the
risk
of
loss
arising
from
potential
adverse
change
in
the
value
of
the
Barclays
Bank
Group’s
assets
and
liabilities
from
fluctuation
in
market
variables
including,
but
not
limited
to,
interest
rates,
foreign
exchange,
equity
prices,
commodity
prices,
credit
spread
s,
implied
volatilities
and
asset
correlations.
A
broadening
in
trade
tensions
between
the
US
and
its
major
trading
partners,
slowing
global
growth
and
political
concerns
in
the
US
and
Europe
(including
Brexit)
are
some
of
the
factors
that
could
heighten
market
risks
for
the
Barclays
Bank
Group’s
portfolios.
In
addition,
the
Barclays
Bank
Group’s
trading
business
is
generally
exposed
to
a
prolonged
period
of
elevated
asset
price
volatility,
particularly
if
it
negatively
affects
the
depth
of
marketplace
liquidity.
Such
a
scenario
could
impact
the
Barclays
Bank
Group’s
ability
to
execute
client
trades
and
may
also
result
in
lower
client
flow
-
driven
income
and/or
market
-
based
losses
on
its
existing
portfolio
of
market
risks.
These
can
include
having
to
absorb
higher
hedging
costs
from
rebalancing
risks
that
need
to
be
managed
dynamically
as
market
levels
and
their
associated
volatilities
change.
It
is
difficult
to
predict
changes
in
market
conditions,
and
such
changes
could
have
a
material
adverse
effect
on
the
Barclays
Bank
Group’s
business,
results
of
operations,
financial
condition
and
prospects.
For
further
details
on
the
Barclays
Bank
Group’s
approach
to
market
risk,
see
market
risk
management
on
page
39
and
market
risk
performance
on
pages
68
to
70.
iii)
Treasury
and
capital
risk
There
are
three
primary
types
of
treasury
and
capital
risk
faced
by
the
Barclays
Bank
Group:
a)
Liquidity
risk
Liquidity
risk
is
the
risk
that
the
Barclays
Bank
Group
is
unable
to
meet
its
contractual
or
contingent
obligations
or
that
it
does
not
have
the
appropriate
amount,
tenor
and
composition
of
funding
and
liquidity
to
support
its
assets.
This
could
cause
the
Barclays
Bank
Group
to
fail
to
meet
regulatory
liquidity
standards
or
be
unable
to
support
day
-
to-
day
banking
activities.
Key
liquidity
risks
that
the
Barclays
Bank
Group
faces
include:
◾
The
stability
of
the
Barclays
Bank
Group’s
current
funding
profile:
demand
or
at
short
notice,
could
be
affected
by
the
Barclays
Bank
Group
failing
to
preserve
the
current
level
of
customer
and
investor
confidence.
The
Barclays
Bank
Group
also
regularly
accesses
the
money
and
capital
markets
to
provide
short
-
term
and
long
-
term
funding
to
support
its
operations.
Several
factors,
including
adverse
macroeconomic
conditions,
adverse
outcomes
in
conduct
and
legal,
competition
and
regulatory
matters
and
loss
of
confidence
by
investors,
counterparties
and/or
customers
in
the
Barclays
Bank
Group,
can
affect
the
ability
of
the
Barclays
Bank
Group
to
access
the
capital
markets
and/or
the
cost
and
other
terms
upon
which
the
Barclays
Bank
Group
is
able
to
obtain
market
funding
.
◾
Credit
rating
changes
and
the
impact
on
funding
costs
:
Rating
agencies
regularly
review
credit
ratings
given
to
Barclays
Bank
PLC
and
certain
members
of
the
Barclays
Bank
Group.
Credit
ratings
are
based
on
a
number
of
factors,
including
some
which
are
not
within
the
Barclays
Bank
Group’s
control
(such
as
political
and
regulatory
developments,
changes
in
rating
methodologies,
macro
-
economic
conditions
and
the
sovereign
credi
t
rating
s
of
the
countries
in
which
the
Barclays
Bank
Group
operates
).
Whilst
the
impact
of
a
credit
rating
change
will
depend
on
a
number
of
factors
(including
the
type
of
issuance
and
prevailing
market
conditions),
any
reductions
in
a
credit
rating
(in
p
articular,
any
downgrade
below
investment
grade)
may
affect
the
Barclays
Bank
Group’s
access
to
the
money
or
capital
markets
and/or
terms
on
which
the
Barclays
Bank
Group
is
able
to
obtain
market
funding,
increase
costs
of
funding
and
credit
spreads,
reduc
e
the
size
of
the
Barclays
Bank
Group’s
deposit
base,
trigger
additional
collateral
or
other
requirements
in
derivative
contracts
and
other
secured
funding
arrangements
or
limit
the
range
of
counterparties
who
are
willing
to
enter
into
transactions
with
the
Barclays
Bank
Group.
Any
of
these
factors
could
have
a
material
adverse
effect
on
the
Barclays
Bank
Group’s
business,
results
of
operations,
financial
condition
and
prospects.
b)
Capital
risk
Capital
risk
is
the
risk
that
the
Barclays
Bank
Group
has
an
insufficient
level
or
composition
of
capital
to
support
its
normal
business
activities
and
to
meet
its
regulatory
capital
requirements
under
normal
operating
environments
or
stressed
conditions
(both
actual
and
as
defined
for
internal
planning
or
regulator
y
stress
testing
purposes).
This
includes
the
risk
from
the
Barclays
Bank
Group’s
pension
plans.
Key
capital
risks
that
the
Barclays
Bank
Group
faces
include:
◾
Failure
to
meet
prudential
capital
requirements
:
This
could
lead
to
the
Barclays
Bank
Group
being
unable
to
support
some
or
all
of
its
business
activities,
a
failure
to
pass
regulatory
stress
tests,
increased
cost
of
funding
due
to
deterioration
in
investor
appetite
or
credit
ratings,
restrictions
on
distributions
including
the
ability
to
meet
dividend
targets,
and/or
the
need
to
take
additional
measures
to
strengthen
the
Barclays
Bank
Group's
capital
or
leverage
position.
◾
Adverse
changes
in
FX
rates
impacting
capital
ratios
:
The
Barclays
Bank
Group
has
capital
resources,
risk
weighted
assets
and
leverage
exposures
denominated
in
foreign
currencies.
Changes
in
foreign
currency
exchange
rates
may
adversely
impact
the
Sterling
equivalent
value
of
these
items.
As
a
result,
the
Barclays
Bank
Group’s
regulatory
capital
ratios
are
sensitive
to
foreign
currency
movements.
Failure
to
appropriately
manage
the
Barclays
Bank
Group’s
balance
sheet
to
take
account
of
foreign
currency
movements
could
result
in
an
adverse
impact
on
the
Barclays
Bank
Group’s
regulatory
capital
and
leverage
ratios.
◾
Adverse
movements
in
the
pension
fund
:
Adverse
movements
in
pension
assets
and
liabilities
for
defined
benefit
pension
schemes
could
result
in
deficits
on
a
funding
and/or
accounting
basis.
This
could
lead
to
the
Barclays
Bank
Group
making
substantial
additional
contributions
to
its
pension
plans
and/or
a
deterioration
in
its
capital
position.
Under
IAS
19,
the
liabilities
discount
rate
is
derived
from
the
yields
of
high
quality
corporate
bonds.
Therefore,
the
valuation
of
the
Barclays
Bank
Group’s
defined
benefits
schemes
would
be
adversely
affected
by
a
prolonged
fall
in
the
discount
rate
due
to
a
persistent
low
interest
rate
and/or
credit
spread
environment.
Inflation
is
another
significant
risk
driver
to
the
pension
fund
as
the
liabilities
are
ad
versely
impacted
by
an
increase
in
long
-
term
inflation
expectations.
Risk
review
Material
existing
and
emerging
risks
Barclays
Bank
PLC
2019
Annual
Report
on
Form
20-F
33
c)
Interest
rate
risk
in
the
banking
book
is
the
risk
that
the
Barclays
Bank
Group
is
exposed
to
capital
or
income
volatility
because
of
a
mismatch
between
the
interest
rate
exposures
of
its
(non
-
traded)
assets
and
liabilities.
The
Barclays
Bank
Group’s
hedge
programmes
for
interest
rate
risk
in
the
banking
book
rely
on
behavioural
assumptions
and,
as
a
result,
the
success
of
the
hedging
strategy
can
not
be
guaranteed.
A
potential
mismatch
in
the
balance
or
duration
of
the
hedge
assumptions
could
lead
to
earnings
deterioration.
A
decline
in
interest
rates
in
G3
currencies
may
also
compress
net
interest
margin
on
retail
portfolios.
In
addition,
the
Barc
lays
Bank
Group’s
liquidity
pool
is
exposed
to
potential
capital
and/or
income
volatility
due
to
movements
in
market
rates
and
prices.
For
further
details
on
the
Barclays
Bank
Group’s
approach
to
treasury
and
capital
risk,
see
treasury
and
capital
risk
management
on
pages
39
to
41
and
treasury
and
capital
risk
performance
on
pages
71
to
83.
iv)
Operational
risk
Operational
risk
is
the
risk
of
loss
to
the
Barclays
Bank
Group
from
inadequate
or
failed
processes
or
systems,
human
factors
or
due
to
external
events
where
the
root
cause
is
not
due
to
credit
or
market
risks.
Examples
include:
a)
Operational
resilience
The
loss
of
or
disruption
to
business
processing
is
a
material
inherent
risk
within
the
Barclays
Bank
Group
and
across
the
financial
services
industry,
whether
arising
through
impacts
on
the
Barclays
Bank
Group’s
technology
systems
or
availability
of
perso
nnel
or
services
supplied
by
third
parties.
Failure
to
build
resilience
and
recovery
capabilities
into
business
processes
or
into
the
services
of
technology,
real
estate
or
suppliers
on
which
the
Barclays
Bank
Group’s
business
processes
depend,
may
result
in
significant
customer
detriment,
costs
to
reimburse
losses
incurred
by
the
Barclays
Bank
Group’s
customers,
and
reputational
damage.
b)
Cyber
threats
The
frequency
of
cyber
-
attacks
continues
to
grow
and
is
a
global
threat
that
is
inheren
t
across
all
industries.
The
financial
sector
remains
a
primary
target
for
cyber
criminals,
hostile
nation
states,
opportunists
and
hacktivists
and
there
is
an
increasing
level
of
sophistication
in
criminal
hacking
for
the
purpose
of
stealing
money,
stealing,
destroying
or
manipulating
data
(including
customer
data)
and/or
disrupting
operations,
where
multiple
threats
exist
including
threats
arising
from
malicious
emails,
distributed
denial
of
service
(DDoS)
attacks,
payment
system
compromises,
insider
attackers,
supply
chain
and
vulnerability
exploitation.
Cyber
events
have
a
compounding
impact
on
services
and
customers,
e.g.
data
breaches
in
social
networking
sites,
retail
companies
and
payments
networks.
Any
failure
in
the
Barclays
Bank
Group’s
cyber
-
security
policies,
procedures
or
controls
and/or
its
IT
systems,
may
result
in
significant
financial
losses,
major
business
disruption,
inability
to
deliver
customer
services,
or
loss
of
data
or
other
sensitive
information
(including
as
a
result
of
an
outage)
and
may
cause
associated
reputational
damage.
Any
of
these
factors
could
increase
costs
(including,
but
not
limited
to,
costs
relating
to
notification
of,
or
compensation
for
customers)
or
may
affect
the
Barclays
Bank
Group’s
ability
to
retain
an
d
attract
customers.
Regulators
in
the
UK,
US
and
Europe
continue
to
recognise
cyber
-
security
as
an
increasing
systemic
risk
to
the
financial
sector
and
have
highlighted
the
need
for
financial
institutions
to
improve
their
monitoring
and
control
of,
and
re
silience
(particularly
of
critical
services)
to
cyber
-
attacks,
and
to
provide
timely
notification
of
them,
as
appropriate.
Given
the
Barclays
Bank
Group’s
reliance
on
technology,
a
cyber
-
attack
could
have
a
material
adverse
effect
on
its
business,
results
of
operations,
financial
condition
and
prospects.
For
further
details
on
the
Barclays
Bank
Group’s
approach
to
cyber
threats,
see
operational
risk
performance
on
pages
84
to
86.
c)
New
and
emergent
technology
Technological
advancements
present
opportunities
to
develop
new
and
innovative
ways
of
doing
business
across
the
Barclays
Bank
Group,
with
new
solutions
being
developed
both
in-
house
and
in
association
with
third
-
party
companies.
Introducing
new
forms
of
technology,
however,
also
has
the
potential
to
increase
inherent
risk.
Failure
to
evaluate,
actively
manage
and
closely
monitor
risk
exposure
during
all
phases
of
business
development
could
introduce
new
vulnerabilities
and
security
flaws
and
have
a
material
adverse
effect
on
the
Barclays
Bank
Group’s
business,
results
of
operations,
financial
condition
and
prospects
.
d)
External
fraud
T
he
level
and
nature
of
fraud
threats
continues
to
evolve,
particularly
with
the
increasing
use
of
digital
products
and
the
greater
functionality
available
online.
Criminals
continue
to
adapt
their
techniques
and
are
increasingly
focused
on
targeting
customers
and
clients
through
ever
more
sophisticated
methods
of
social
engineering.
External
data
breaches
also
provide
criminal
s
with
the
opportunity
to
exploit
the
growing
levels
of
compromised
data.
These
fraud
threats
could
lead
to
customer
detriment,
loss
of
business,
missed
business
opportunity
and
reputational
damage,
all
of
which
could
have
a
material
adverse
effect
on
the
Barclays
Bank
Group’s
business,
results
of
operations,
financial
condition
and
prospects.
e)
Data
management
and
information
protection
The
Barclays
Bank
Group
holds
and
processes
large
volumes
of
data,
including
personally
identifiable
information,
intellectual
property,
and
financial
data.
The
General
Data
Protection
Regulation
(GDPR)
has
strengthened
the
data
protection
rights
of
customers
and
increased
the
accountability
of
the
Barclays
Bank
Group
in
its
management
of
such
data.
Failure
to
accurat
ely
collect
and
maintain
this
data,
protect
it
from
breaches
of
confidentiality
and
interference
with
its
availability
exposes
the
Barclays
Bank
Group
to
the
risk
of
loss
or
unavailability
of
data
(including
customer
data
discussed
under
“vi)
Conduct
risk,
c)
Data
protection
and
privacy”
below)
or
data
integrity
issues.
Any
of
these
failures
could
have
a
material
adverse
effect
on
the
Barclays
Bank
Group’s
business,
results
of
operations,
financial
condition
and
prospects.
f)
Algorithmic
trading
In
some
areas
of
the
investment
banking
business,
trading
algorithms
are
used
to
price
and
risk
manage
client
and
principal
transactions.
An
algorithmic
error
could
result
in
erroneous
or
duplicated
transactions,
a
system
outage,
or
impact
the
Barclays
Bank
Group’s
pric
ing
abilities,
which
could
have
a
material
adverse
effect
on
the
Barclays
Bank
Group’s
business,
results
of
operations,
financial
condition
and
prospects
and
reputation.
g)
Processing
error
As
a
large,
complex
financial
institution,
the
Barclays
Bank
Group
faces
the
risk
of
material
errors
in
existing
operational
processes,
or
from
new
processes
as
a
result
of
on
-
going
change
activity,
including
payments
and
client
transactions.
Material
operational
or
payment
errors
could
disadvantage
the
Barclays
Bank
Grou
p’s
customers,
clients
or
counterparties
and
could
have
a
material
adverse
effect
on
the
Barclays
Bank
Risk
review
Material
existing
and
emerging
risks
Barclays
Bank
PLC
2019
Annual
Report
on
Form
20-F
34
Group’s
business,
results
of
operations,
financial
condition
and
prospects
.
h)
Supplier
exposure
The
Barclays
Bank
Group
depends
on
suppliers,
including
Barclays
Execution
Services
Limited,
for
the
provision
of
many
of
its
services
and
the
development
of
technology.
Whilst
the
Barclays
Bank
Group
depends
on
suppliers,
it
remains
fully
accountable
for
any
risk
arising
from
the
actions
of
suppliers.
The
dependency
on
suppliers
and
sub
-
contracting
of
outsourced
services
introduces
concentration
risk
where
the
failure
of
specific
suppliers
could
have
an
impact
on
the
Barclays
Bank
Group’s
ability
to
contin
ue
to
provide
material
services
to
its
customers.
Failure
to
adequately
manage
supplier
risk
could
have
a
material
adverse
effect
on
the
Barclays
Bank
Group’s
business,
results
of
operations,
financial
condition
and
prospects.
i)
Critical
accounting
estimates
and
judgements
The
preparation
of
financial
statements
in
accordance
with
IFRS
requires
the
use
of
estimates.
It
also
requires
management
to
exercise
judgement
in
applying
relevant
accounting
policies.
The
key
areas
involving
a
higher
degree
of
judgement
or
complexity,
or
areas
where
assumptions
are
significant
to
the
consolidated
and
individual
financial
statements,
include
credit
impairment
charges
for
amortised
cost
assets,
taxes,
fair
value
of
financial
instruments,
pensions
and
post-
retirement
benefits,
and
provisions
including
conduct
and
legal,
competition
and
regulatory
matters.
There
is
a
risk
that
if
the
judgement
exercised,
or
the
estimates
or
assumptions
used,
subsequently
turn
out
to
be
incorrect,
this
could
result
in
material
losses
to
the
Bar
clays
Bank
Group,
beyond
what
was
anticipated
or
provided
for.
Further
development
of
standards
and
interpretations
under
IFRS
could
also
materially
impact
the
financial
results,
condition
and
prospects
of
the
Barclays
Bank
Group.
For
further
details
on
the
accounting
estimates
and
policies,
see
the
Notes
to
the
audited
financial
statements
on
pages
105
to
196.
j)
Tax
risk
The
Barclays
Bank
Group
is
required
to
comply
with
the
domestic
and
international
tax
laws
and
practice
of
all
countries
in
which
it
has
business
operations.
There
is
a
risk
that
the
Barclays
Bank
Group
could
suffer
losses
due
to
additional
tax
charges,
other
financial
costs
or
reputational
damage
as
a
result
of
failing
to
comply
with
such
laws
and
practice,
or
by
failing
to
manage
its
tax
affairs
in
an
appropriate
manner,
with
much
of
this
risk
attributable
to
the
international
structure
of
the
Barclays
Bank
Group.
In
addition,
increasing
reporting
and
disclosure
requirements
around
the
world
and
the
digitisation
of
the
administration
of
tax
has
potential
to
increase
the
Barclays
Bank
Group’s
tax
compliance
obligations
further.
k)
Ability
to
hire
and
retain
appropriately
qualified
employees
As
a
regulated
financial
institution,
the
Barclays
Bank
Group
requires
diversified
and
specialist
skilled
colleagues.
The
Barclays
Bank
Group’s
ability
to
attract,
develop
and
retain
a
diverse
mix
of
talent
is
key
to
the
delivery
of
its
core
business
activity
and
strategy.
This
is
impacted
by
a
range
of
external
and
internal
factors,
such
as
the
UK’s
decision
to
leave
the
EU
and
the
enhanced
individual
accountability
applicable
to
the
banking
industry.
Failure
to
attract
or
prevent
the
departure
of
appropriately
qualified
and
skilled
employees
could
have
a
material
adverse
effect
on
the
Barclays
Bank
Group’s
business,
results
of
operations,
financial
condition
and
prospects
.
Additionally,
this
may
result
in
disruption
to
service
which
could
in
turn
lead
to
disenfranchising
certain
customer
groups,
customer
detriment
and
reputational
damage.
For
further
details
on
the
Barclays
Bank
Group’s
approach
to
operational
risk,
see
operational
risk
management
on
pages
41
to
42
and
operational
risk
performance
on
pages
84
to
86
.
v)
Model
risk
Model
risk
is
the
risk
of
potential
adverse
consequences
from
financial
assessments
or
decisions
based
on
incorrect
or
misused
model
outputs
and
reports.
The
Barclays
Bank
Group
relies
on
models
to
support
a
broad
range
of
business
and
risk
management
activities,
including
informing
business
decisions
and
strategies,
measuring
and
limiting
risk,
valuing
exposures
(including
the
calculation
of
impairment),
conducting
stress
testing,
assessing
capital
adequacy,
supporting
new
business
acceptance
and
risk
and
reward
evaluation,
managing
client
assets,
and
meeting
reporting
requirements.
Models
are,
by
their
nature,
imperfect
and
incomplete
representations
of
reality
because
they
rely
on
assumptions
and
inputs,
and
so
they
may
be
subject
to
errors
affecting
the
accuracy
of
their
outputs.
For
instance,
the
quality
of
the
data
used
in
models
across
the
Barclays
Bank
Group
has
a
material
impact
on
the
accuracy
and
completeness
of
its
risk
and
financial
metrics.
Models
may
also
be
misused.
Mod
el
errors
or
misuse
may
result
in
(among
other
things)
the
Barclays
Bank
Group
making
inappropriate
business
decisions
and/or
inaccuracies
or
errors
being
identified
in
the
Barclays
Bank
Group’s
risk
management
and
regulatory
reporting
processes.
This
coul
d
result
in
significant
financial
loss,
imposition
of
additional
capital
requirements,
enhanced
regulatory
supervision
and
reputational
damage,
all
of
which
could
have
a
material
adverse
effect
on
the
Barclays
Bank
Group’s
business,
results
of
operations,
financial
condition
and
prospects.
For
further
details
on
the
Barclays
B
ank
Group’s
approach
to
model
risk,
see
model
risk
management
on
page
42
and
model
risk
performance
on
pages
87.
vi)
Conduct
risk
Conduct
risk
is
the
risk
of
detriment
to
customers,
clients,
market
integrity,
effective
competition
or
the
Barclays
Bank
Group
from
the
inappropriate
supply
of
financial
services,
including
instances
of
wilful
or
negligent
misconduct.
This
risk
could
manifest
itself
in
a
variety
of
ways:
a)
Employee
misconduct
The
Barclays
Bank
Group’s
businesses
are
exposed
to
risk
from
potential
non
-
compliance
with
its
policies
and
instances
of
wilful
and
negligent
misconduct
by
employees,
all
of
which
could
result
in
enforcement
action
or
r
eputational
harm.
It
is
n
ot
always
possible
to
deter
employee
misconduct,
and
the
precautions
we
take
to
prevent
and
detect
this
activity
may
not
always
be
effective.
Employee
misconduct
could
have
a
material
adverse
effect
on
the
Barclays
Bank
Group’s
customers,
clients,
market
integrity
as
well
as
reputation,
financial
condition
and
prospects.
b)
Product
governance
and
life
cycle
The
ongoing
review,
management
and
governance
of
new
and
amended
products
has
come
under
increasing
regulatory
focus
(for
example,
the
recast
of
the
Markets
in
Financial
Instruments
Directive
and
guidance
in
relation
to
the
adoption
o
f
the
EU
Benchmarks
Regulation)
and
the
Barclays
Bank
Group
expects
this
to
continue.
The
following
could
lead
to
poor
customer
outcomes:
(i)
ineffective
product
governance,
including
design,
approval
and
review
of
products,
and
(ii)
inappropriate
controls
over
internal
and
third
party
sales
channels
and
post
sales
services,
such
as
complaints
handling,
collections
and
recoveri
es.
The
Barclays
Bank
Group
is
at
risk
of
financial
loss
and
reputational
damage
as
a
result.
Risk
review
Material
existing
and
emerging
risks
Barclays
Bank
PLC
2019
Annual
Report
on
Form
20-F
35
c)
Financial
crime
The
Barclays
Bank
Group
may
be
adversely
affected
if
it
fails
to
effectively
mitigate
the
risk
that
third
parties
or
its
employees
facilitate,
or
that
its
products
and
services
are
used
to
facilitate,
financial
crime
(money
laundering,
terrorist
financing
and
proliferation
financing,
breaches
of
economic
and
financial
sanctions,
bribery
and
corruption,
and
the
facilitation
of
tax
evasion).
UK
and
US
regulations
cov
ering
financial
institutions
continue
to
focus
on
combating
financial
crime.
Failure
to
comply
may
lead
to
enforcement
action
by
the
B
arclays
Bank
Group’s
regulators,
including
severe
penalties,
which
may
have
a
material
adverse
effect
on
the
Barclays
Bank
Group’s
business,
financial
condition
and
prospects.
d)
Data
protection
and
privacy
Proper
handling
of
personal
data
is
critical
to
sustaining
long
-
term
relationships
with
our
customers
and
clients
and
complying
with
privacy
laws
and
regulations.
Failure
to
protect
personal
data
can
lead
to
potential
detriment
to
our
customers
and
clients,
reputational
damage,
enforcement
action
and
financial
loss,
which
may
be
substantial
(see
“iv)
Operational
risk,
(e)
Data
management
and
information
protection”
above).
e)
Regulatory
focus
on
culture
and
accountability
Regulators
around
the
world
continue
to
emphasise
the
importance
of
culture
and
personal
accountability
and
enforce
the
adoption
of
adequate
internal
reporting
and
whistleblowing
procedures
to
help
to
promote
appropriate
conduct
and
driv
e
positive
outcomes
for
customers,
colleagues,
clients
and
markets.
The
requirements
and
expectations
of
the
UK
Senior
Managers
Regime,
Certification
Regime
and
Conduct
Rules
have
driven
additional
accountabilities
for
individuals
across
the
Barclays
Bank
Group
with
an
increased
focus
on
governance
and
rigour.
Failure
to
meet
these
requirements
and
expectations
may
lead
to
regulatory
sanctions,
both
for
the
individuals
and
the
Barclays
Bank
Group.
For
further
details
on
the
Barclays
Bank
Group’s
approach
to
conduct
risk,
see
conduct
risk
management
on
page
42
and
conduct
risk
performance
on
page
87
.
vii)
Reputation
risk
Reputation
risk
is
the
risk
that
an
action,
transaction,
investment,
event,
decision
or
business
relationship
will
reduce
trust
in
the
Barclays
Bank
Group’s
integrity
and
competence.
Any
material
lapse
in
standards
of
integrity,
compliance,
customer
service
or
operating
efficiency
may
represent
a
potential
reputation
risk.
Stakeholder
expe
ctations
constantly
evolve,
and
so
reputation
risk
is
dynamic
and
varies
between
geographical
regions,
groups
and
individuals.
A
risk
arising
in
one
business
area
can
have
an
adverse
effect
upon
the
Barclays
Bank
Group’s
overall
reputation
and
any
one
tran
saction,
investment
or
event
(in
the
perception
of
key
stakeholders)
can
reduce
trust
in
the
Barclays
Bank
Group’s
integrity
and
competence.
The
Barclays
Bank
Group’s
association
with
sensitive
topics
and
sectors
has
been,
and
in
some
instances
continues
to
be,
an
area
of
concern
for
stakeholders,
including
(i)
the
financing
of,
and
investments
in,
businesses
which
operate
in
sectors
that
are
sensitive
because
of
their
relative
carbon
intensity
or
local
environmental
impact;
(ii)
potential
association
with
human
rights
violations
(including
combating
modern
slavery)
in
the
Barclays
Bank
Group’s
operations
or
supply
chain
and
by
clients
and
customers;
and
(iii)
the
financing
of
businesses
which
manufacture
and
export
military
and
riot
control
goods
and
services.
Reputation
risk
could
also
arise
from
negative
public
opinion
about
the
actual,
or
perceived,
manner
in
which
the
Barclays
Bank
Group
conducts
its
business
activities,
or
the
Barclays
Bank
Group’s
financial
performance,
as
well
as
actual
or
perceived
practices
in
banking
and
the
financial
services
industry
generally.
Modern
technologies,
in
particular
online
social
media
channels
and
other
broadcast
tools
that
facilitate
communication
with
large
au
diences
in
short
time
frames
and
with
minimal
costs,
may
significantly
enhance
and
accelerate
the
distribution
and
effect
of
damaging
information
and
allegations.
Negative
public
opinion
may
adversely
affect
the
Barclays
Bank
Group’s
ability
to
retain
and
attract
customers,
in
particular,
corporate
and
retail
depositors,
and
to
retain
and
motivate
staff,
and
could
have
a
material
adverse
effect
on
the
Barclays
Bank
Group’s
business,
results
of
operations,
financial
condition
and
prospects.
In
addition
to
the
above,
reputation
risk
has
the
potential
to
arise
from
operational
issues
or
conduct
matters
which
cause
detriment
to
customers,
clients,
market
integrity,
effective
competition
or
the
Barclays
Bank
Group
(see
“iv)
Operational
risk”
above).
For
furthe
r
details
on
the
Barclays
Bank
Group’s
approach
to
reputation
risk,
see
reputation
risk
management
on
page
43
and
reputation
risk
performance
on
page
87
.
Risk
review
Material
existing
and
emerging
risks
Barclays
Bank
PLC
2019
Annual
Report
on
Form
20-F
36
viii)
Legal
risk
and
legal,
competition
and
regulatory
matters
The
Barclays
Bank
Group
conducts
activities
in
a
highly
regulated
market
which
exposes
it
to
legal
risk
arising
from
(i)
the
multitude
of
laws
and
regulations
that
apply
to
the
businesses
it
operates,
which
are
highly
dynamic,
may
vary
between
jurisdictions,
and
are
often
unclear
in
their
application
to
particular
circumstances
especially
in
new
and
emerging
areas;
and
(ii)
the
diversified
and
evolving
nature
of
the
Barclays
Bank
Group’s
businesses
and
business
practices.
In
each
case,
this
exposes
the
Barclays
Bank
Group
to
the
risk
of
loss
or
the
imposition
of
penalties,
damages
or
fines
from
the
failure
of
members
of
the
Barclays
Bank
Group
to
meet
their
respective
legal
obligations,
including
legal
or
contractual
requirements.
Legal
risk
may
arise
in
relation
to
a
number
of
the
risk
factors
identified
above,
including
(without
limitation)
as
a
result
of
(i)
the
UK’s
withdrawal
from
the
EU,
(ii)
benchmark
reform,
(iii)
the
regulatory
change
agenda,
and
(iv)
rapidly
evolving
rules
and
regulations
in
relation
to
data
protection,
privacy
and
cyber
-
security.
A
breach
of
applicable
legislation
and/or
regulations
by
the
Barclays
Bank
Group
or
its
employees
could
result
in
criminal
prosecution,
regulatory
censure,
potentially
significant
fines
and
other
sanctions
in
the
jurisdictions
in
which
the
Barclays
Bank
Group
operates.
Where
clients,
customers
or
other
third
parties
are
harmed
by
the
Barclays
Bank
Group’s
conduct,
this
may
also
give
rise
to
civil
legal
proceedings,
including
class
actions.
Other
legal
disputes
may
also
arise
between
the
Barclays
Bank
Group
and
third
parties
relating
to
matters
such
as
breaches
or
enforcement
of
legal
rights
or
obligations
arising
under
contracts,
statutes
or
common
law.
Adverse
findings
in
any
such
matters
may
result
in
the
Barclays
Bank
Group
being
liable
to
third
pa
rties
or
may
result
in
the
Barclays
Bank
Group’s
rights
not
being
enforced
as
intended.
Details
of
legal,
competition
and
regulatory
matters
to
which
the
Barclays
Bank
Group
is
currently
exposed
are
set
out
in
Note
25.
In
addition
to
matters
specifically
d
escribed
in
Note
25,
the
Barclays
Bank
Group
is
engaged
in
various
other
legal
proceedings
which
arise
in
the
ordinary
course
of
business.
The
Barclays
Bank
Group
is
also
subject
to
requests
for
information,
investigations
and
other
reviews
by
regulators,
governmental
and
other
public
bodies
in
connection
with
business
activities
in
which
the
Barclays
Bank
Group
is,
or
has
been,
engaged.
The
outcome
of
legal,
competition
and
regulatory
matters,
both
those
to
which
the
Barclays
Bank
Group
is
currently
exposed
and
any
others
which
may
arise
in
the
future,
is
difficult
to
predict.
In
connection
with
such
matters,
the
Barclays
Bank
Group
may
incur
significant
expense,
regardless
of
the
ultimate
outcome,
and
any
such
matters
could
expose
the
Barclays
Bank
Group
to
any
of
the
following
outcomes:
substantial
monetary
damages,
settlements
and/or
fines;
remediation
of
affected
customers
and
clients;
other
penal
ties
and
injunctive
relief;
additional
litigation;
criminal
prosecution;
the
loss
of
any
existing
agreed
protection
from
prosecution;
regulatory
restrictions
on
the
Barclays
Bank
Group’s
business
operations
including
the
withdrawal
of
authorisations;
incre
ased
regulatory
compliance
requirements
or
changes
to
laws
or
regulations;
suspension
of
operations;
public
reprimands;
loss
of
significant
assets
or
business;
a
negative
effect
on
the
Barclays
Bank
Group’s
reputation;
loss
of
confidence
by
investors,
coun
terparties,
clients
and/or
customers;
risk
of
credit
rating
agency
downgrades;
potential
negative
impact
on
the
availability
and/or
cost
of
funding
and
liquidity;
and/or
dismissal
or
resignation
of
key
individuals.
In
light
of
the
uncertainties
involved
in
legal,
competition
and
regulatory
matters,
there
can
be
no
assurance
that
the
outcome
of
a
particular
matter
or
matters
will
not
have
a
material
adverse
effect
on
the
Barclays
Bank
Group’s
business,
results
of
operations,
financial
condition
and
prospects.
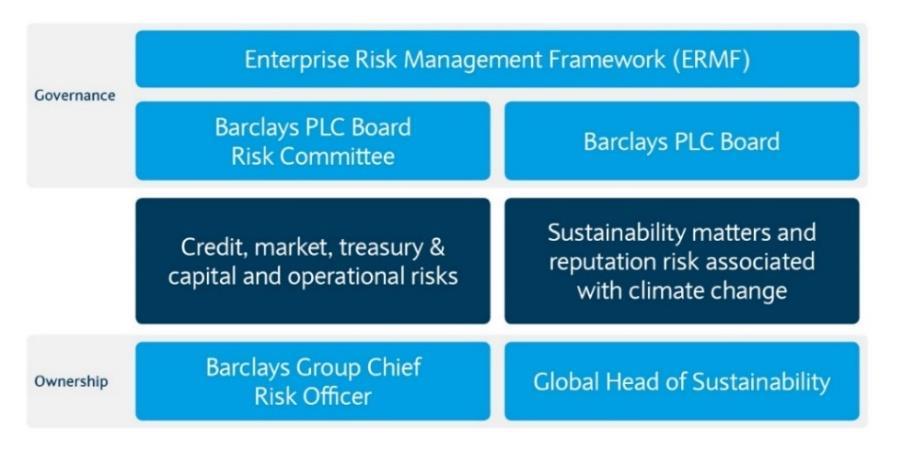
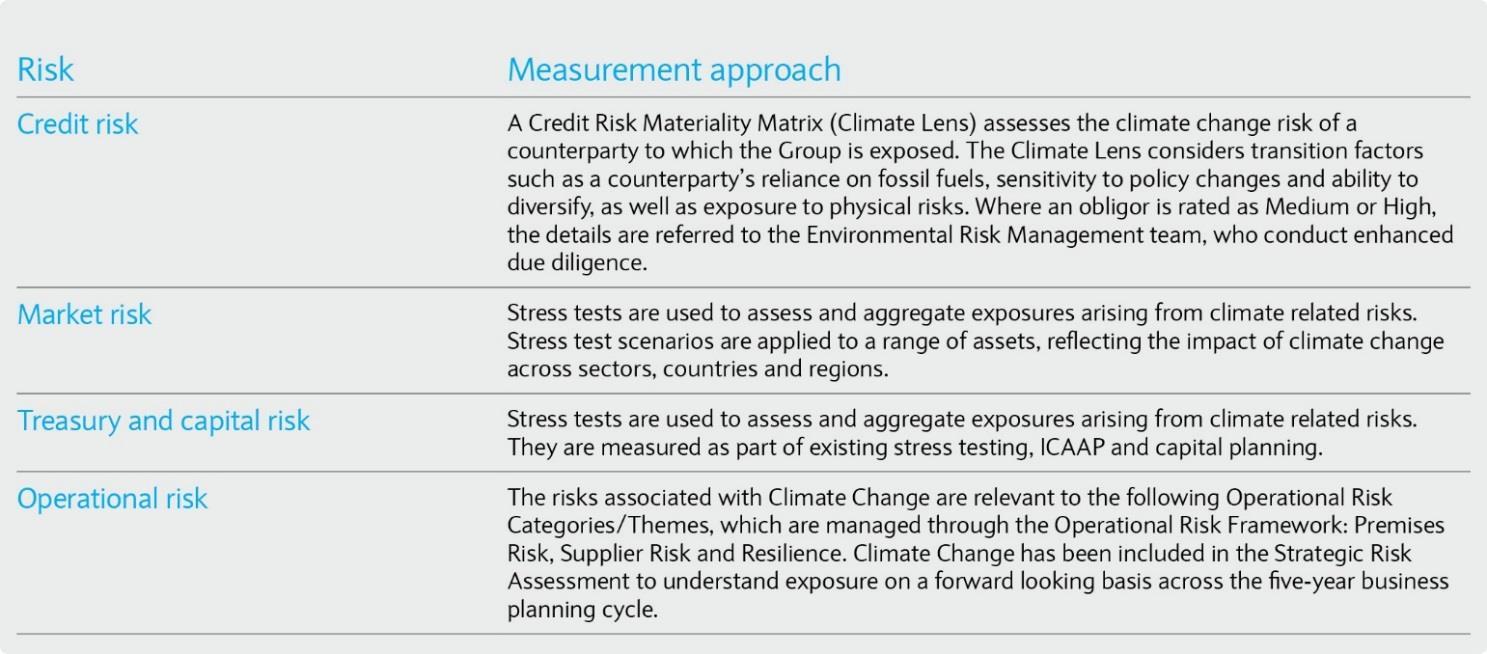
Risk
review
Climate
change
risk
management
Barclays
Bank
PLC
2019
Annual
Report
on
Form
20-F
37
Climate
Change
Risk
Management
Overview
The
Barclays
Group
has
a
longstanding
commitment
to
Environmental
Risk
Management
(ERM)
and
its
approach,
aided
by
regulatory
initiatives,
has
continued
to
evolve,
incorporating
climate
change
in
recent
years
as
the
understanding
of
associated
risks
has
grown.
In
2018,
a
dedicated
Sustainability
team
was
created
to
consider
how
the
Barclays
Group
approaches
wider
sustainability
and
ESG
matters,
working
closely
with
the
ERM
function.
In
2019,
the
Barclays
Group
pub
lished
an
Energy
&
Climate
Change
Statement
(
https://home.barclays/statements/barclays
-energy
-and-climate-
change-statement
)
which
articulates
our
focus
on
three
areas:
financing
growth
of
renewables
and
businesses
addressing
environmental
challenges;
taking
a
responsible
approach
to
financing
energy
sources
with
a
greater
carbon
intensity;
and
reducing
our
own
carbon
footprint.
It
is
supported
by
an
internal
standard
containing
guidelines
for
restricting
or
supporting
financing
activities
in
carbon
-
intensive
energy
sectors,
as
well
as
enhanced
due
diligence
requirements
for
environmentally
or
socially
sensitive
sectors.
For
more
detail
on
how
climate
change
risks
arise
and
their
impact
on
the
Barclays
Bank
Group,
refer
to
material
existing
and
emerging
risks
on
page
28.
Organisation
and
Structure
The
matters
and
risks
associated
with
climate
change
are
managed
at
a
Barclays
Group
level,
with
additional
input
and
oversight
provided
by
the
Barclays
Bank
Group
CRO
for
matters
pertaining
to
the
Barclays
Bank
Grou
p
.
On
behalf
of
the
Barclays
PLC
Board,
the
Barclays
PLC
BRC
reviews
and
approves
the
Barclays
Group’s
approach
to
managing
the
financial
and
operational
risks
associated
with
climate
change.
Broadly,
climate
change
matters
are
co
-
ordinated
by
the
Sustainability
team,
including
reputation
risks
linked
to
the
Barclays
Group’s
financial
and
societal
impact.
In
2019,
reputation
risk
became
the
responsibility
of
the
Barclays
PLC
Board,
where
the
most
material
issues
facing
the
Barclays
Group
are
escalated
to
and
directly
handled
by
the
Barclays
PLC
Board.
Risk
management
–
Policy
In
2019,
the
Barclays
Group
published
a
‘Climate
Change
Financial
Risk
and
Operational
Risk
Policy’.
This
introduced
climate
change
as
an
overarching
risk
impacting
certain
principal
risks:
credit
risk,
market
risk,
treasury
&
capital
risk
and
operational
risk.
The
policy
is
jointly
owned
by
the
relevant
Principal
Risk
Leads
with
oversight
by
the
Barclays
PLC
BRC,
and
applies
across
the
Barclays
Group
including
within
the
Bar
clays
Bank
Group
.
Each
relevant
Principal
Risk
Lead
has
developed
a
methodology
and
implementation
plan
for
quantifying
climate
change
risk.
Risk
review
Principal
r
isk
management
Barclays
Bank
PLC
2019
Annual
Report
on
Form
20-F
38
Credit
risk
management
(audited)
The
risk
of
loss
to
the
Barclays
Bank
Group
from
the
failure
of
clients,
customers
or
counterparties,
including
sovereigns,
to
fully
hono
ur
their
obligations
to
the
Barclays
Bank
Group
,
including
the
whole
and
timely
payment
of
principal,
intere
st,
collateral
and
other
receivables.
Overview
The
credit
risk
that
the
Barclays
Bank
Gro
up
faces
arises
from
wholesale
and
retail
loans
and
advances
together
with
the
counterparty
credit
risk
arising
from
derivative
contracts
with
clients;
trading
activities,
including:
debt
securities,
settlement
balances
with
market
counterparties,
FVOCI
assets
and
reverse
repurchase
loans.
Credit
risk
management
objectives
are
to:
◾
maintain
a
framework
of
controls
to
oversee
credit
risk;
◾
identify,
assess
and
measure
credit
risk
clearly
and
accurately
across
the
Barclays
Bank
Group
and
within
each
separate
business,
from
the
level
of
individual
facilities
up
to
the
total
portfolio;
◾
control
and
plan
credit
risk
taking
in
line
with
external
stakeholder
expectations
and
avoiding
undesirable
concentrations;
and
◾
monitor
credit
risk
and
adherence
to
agreed
control
s.
Organisation,
roles
and
responsibilities
The
first
line
of
defence
has
primary
responsibility
for
managing
credit
risk
within
the
risk
appetite
and
limits
set
by
the
Risk
function,
supported
by
a
defined
set
of
policies,
standards
and
controls.
In
the
Barclays
Bank
Group
,
business
risk
committees
(attended
by
the
first
line)
monitor
and
review
the
credit
risk
profile
of
each
business
unit
where
the
most
material
issues
are
escalated
to
the
Retail
Credit
Risk
Management
Committee,
Wholesale
Credit
Risk
M
anagement
Committee
and
the
Barclays
Group
Risk
Committee.
Wholesale
and
retail
portfolios
are
managed
separately
to
reflect
the
differing
nature
of
the
assets;
wholesale
balances
tend
to
be
larger
and
are
managed
on
an
individual
basis,
while
retail
balan
ces
are
greater
in
number
but
lesser
in
value
and
are,
therefore,
managed
in
aggregated
segments.
The
responsibilities
of
the
credit
risk
management
teams
in
the
businesses,
the
sanctioning
team
and
other
shared
services
include:
sanctioning
new
credit
agr
eements
(principally
wholesale);
setting
strategies
for
approval
of
transactions
(principally
retail);
setting
risk
appetite;
monitoring
risk
against
limits
and
other
parameters;
maintaining
robust
processes,
data
gathering,
quality,
storage
and
reporting
methods
for
effective
credit
risk
management;
performing
effective
turnaround
and
workout
scenarios
for
wholesale
portfolios
via
dedicated
restructuring
and
recoveries
teams;
maintaining
robust
collections
and
recovery
processes/units
for
retail
portfolios
;
and
review
and
validation
of
credit
risk
measurement
models.
The
credit
risk
management
teams
in
the
Barclays
Bank
Group
are
accountable
to
the
Barclays
Bank
PLC
CRO,
who
reports
to
the
Barclays
Group
CRO.
For
wholesale
portfolios
,
credit
risk
managers
are
organised
in
sanctioning
teams
by
geography,
industry
and/or
product.
In
wholesale
portfolios,
credit
risk
approval
is
undertaken
by
experienced
credit
risk
professionals
operating
within
a
clearly
defined
delegated
authority
framework,
with
only
the
most
senior
credit
officers
assigned
the
higher
levels
of
delegated
authority.
The
largest
credit
exposures,
which
are
outside
the
Risk
Sanctioning
Unit
or
Risk
Distribution
Committee
authority,
require
the
support
of
the
Barclays
Bank
PLC
Senior
Credit
Officer.
For
exposures
in
excess
of
the
Barclays
Bank
PLC
Senior
Credit
Officer’s
authority,
approval
by
the
Barclays
Group
Senior
Credit
Officer/Barclays
PLC
Board
Risk
Committee
is
also
required.
The
Barclays
Group
Credit
Risk
Committee,
attended
by
the
Ba
rclays
Bank
PLC
Senior
Credit
Officer,
provides
a
formal
mechanism
for
the
Barclays
Group
Senior
Credit
Officer
to
exercise
the
highest
level
of
credit
authority
over
the
most
material
Barclays
Group
single
name
exposures.
Credit
risk
mitigation
The
Barc
lays
Bank
Group
employs
a
range
of
techniques
and
strategies
to
actively
mitigate
credit
risks.
These
can
broadly
be
divided
into
three
types:
◾
netting
and
set-off
◾
collateral
◾
risk
transfer.
Netting
and
set-off
Cre
dit
risk
exposures
can
be
reduced
by
applying
netting
and
set-off.
For
derivative
transactions,
the
Barclays
Bank
Group’s
normal
practice
is
to
enter
into
standard
master
agreements
with
counterparties
(e.g.
ISDAs).
These
master
agreements
typically
allow
for
netting
of
credit
risk
exposure
to
a
counterparty
resulting
from
derivative
transactions
against
the
obligations
to
the
counterparty
in
the
event
of
default,
and
so
produce
a
lower
net
credit
exposure.
These
agreements
may
also
reduce
settlement
exposu
re
(e.g.
for
foreign
exchange
transactions)
by
allowing
payments
on
the
same
day
in
the
same
currency
to
be
set-off
against
one
another.
Collateral
The
Barclays
Bank
Group
has
the
ability
to
call
on
collateral
in
the
event
of
default
of
the
counterparty,
comprising:
◾
home
loans:
◾
wholesale
lending:
◾
other
retail
lending:
lease
receivables
.
◾
derivatives:
which
the
Barclays
Bank
Group
has
master
netting
agreements
in
place.
These
annexes
to
master
agreements
provide
a
mechanism
for
further
reducing
credit
risk,
whereby
collateral
(margin)
is
posted
on
a
regular
basis
(typically
daily)
to
collateralise
the
mark
to
market
exposure
of
a
derivative
por
tfolio
measured
on
a
net
basis.
Risk
review
Principal
r
isk
management
Barclays
Bank
PLC
2019
Annual
Report
on
Form
20-F
39
◾
reverse
repurchase
agreements:
Group
subjec
t
to
an
agreement
to
return
them
for
a
fixed
price.
◾
financial
guarantees
and
similar
off-balance
sheet
commitments:
Risk
transfer
A
range
of
instruments
including
guarantees,
credit
insurance,
credit
derivatives
and
securitisation
can
be
used
to
transfer
credit
risk
from
one
counterparty
to
another.
These
mitigate
credit
risk
in
two
main
ways
:
◾
if
the
risk
is
transferred
to
a
counterparty
which
is
more
creditworthy
than
the
original
counterparty,
then
o
verall
credit
risk
is
reduced
◾
where
recourse
to
the
first
counterparty
remains,
both
counterparties
must
default
before
a
loss
materialises.
This
is
less
likely
than
the
default
of
either
counterparty
individually
so
credit
risk
is
reduced.
Market
risk
management
(audited)
The
risk
of
loss
arising
from
potential
adverse
changes
in
the
value
of
the
Barclays
Bank
Group’s
assets
and
liabilities
from
fluctuation
in
market
variables
including,
but
not
limited
to,
interest
rates,
foreign
exchange,
equity
prices,
commodity
prices,
credit
spreads,
implied
volatilities
and
asset
correlations.
Overview
Market
risk
arises
primarily
as
a
result
of
client
facilitation
in
wholesale
markets,
involving
market
making
activities,
risk
management
solutions
and
execution
of
syndications.
Upon
execution
of
a
trade
with
a
client,
the
Barclays
Bank
Group
will
look
to
hedge
against
the
risk
of
the
trade
moving
in
an
adverse
direction.
Mismatches
between
client
transactions
and
hedges
result
in
market
risk
due
to
changes
in
asset
prices
,
volatility
or
correlations.
Organisation,
roles
and
responsibilities
Market
risk
in
the
businesses
resides
primarily
in
CIB
and
Treasury.
These
businesses
have
the
mandate
to
assume
market
risk.
The
front
office
and
Treasury
trading
desks
are
responsible
for
managing
market
risk
on
a
day
-
to-
day
basis,
where
they
are
required
to
understand
and
adhere
to
all
limits
applicable
to
their
businesses.
The
Market
Risk
team
support
the
trading
desks
with
the
day
-
to-
day
limit
management
of
market
risk
exposures
through
governance
processes
which
are
outlined
in
supporting
market
risk
polic
ies
and
standards.
Market
risk
oversight
and
cha
llenge
is
provided
by
business
committees
and
Barclays
Group
c
ommittees,
including
the
Market
Risk
Committee.
The
objectives
of
market
risk
management
are
to:
◾
Identify,
understand
and
control
market
risk
by
robust
measurement,
limit
setting,
reporting
and
oversight
◾
facilitate
business
growth
within
a
controlled
and
transparent
risk
management
framework
◾
control
market
risk
in
the
businesses
according
to
the
allocated
appetite.
To
meet
the
above
objectives,
a
governance
structure
is
in
place
to
manage
these
risks
consistent
with
the
ERMF.
The
Barclays
Bank
PLC
Board
Risk
Committee
recommends
market
risk
appetite
to
the
Barclays
Bank
PLC
Board
for
their
approval,
within
the
parameters
set
by
the
Barclays
PLC
Boa
rd.
The
Market
Risk
Committee
approves
and
makes
recommendations
concerning
the
Barclays
Group
-
wide
market
risk
profile
to
the
Barclays
Group
Risk
Committee.
This
includes
overseeing
the
operation
of
the
Market
Risk
Framework
and
associated
standards
and
p
olicies;
reviewing
market
or
regulatory
issues
and
limits
and
utilisation.
The
committee
is
chaired
by
the
Market
Risk
Principal
Risk
Lead
and
attendees
include
the
business
heads
of
market
risk
and
business
aligned
market
risk
managers.
Management
value
at
r
isk
(VaR)
VaR
is
an
estimate
of
the
potential
loss
arising
from
unfavourable
market
movements
if
the
current
positions
were
to
be
held
unchanged
for
one
business
day.
For
internal
market
risk
management
purposes,
a
historical
simulation
methodology
with
a
two
-
year
equally
weighted
historical
period,
at
the
95%
confidence
level
is
used
for
all
trading
books
and
some
banking
books.
In
some
instances,
historical
data
is
not
available
for
particular
market
risk
factors
for
the
entire
look
-
back
period,
for
example,
complete
historical
data
would
not
be
available
for
an
equity
security
following
an
initial
public
offering.
In
these
cases,
market
risk
managers
will
proxy
the
unavailable
market
risk
factor
data
with
available
data
for
a
related
market
risk
factor.
Limits
are
applied
at
the
total
level
as
well
as
by
risk
factor
type,
which
are
then
cascaded
down
to
particular
trading
desks
and
businesses
by
the
market
risk
management
function.
See
page
39
for
a
review
of
management
VaR
in
2019.
Treasury
and
capital
risk
management
This
comprises
:
Liquidity
risk:
The
risk
that
Barclays
Bank
Group
is
unable
to
meet
its
contractual
or
contingent
obligations
or
that
it
does
not
have
the
appropriate
amount,
tenor
and
composition
of
funding
and
liquidity
to
support
its
assets.
Risk
review
Principal
r
isk
management
Barclays
Bank
PLC
2019
Annual
Report
on
Form
20-F
40
Capital
risk:
The
risk
that
Barclays
Bank
Group
has
an
insufficient
level
or
composition
of
capital
to
support
its
normal
business
activities
and
to
meet
its
regulatory
capital
requirements
under
normal
operating
environments
or
stressed
conditions
(both
actual
and
as
defined
for
internal
planning
or
r
egulatory
testing
purposes).
This
also
includes
the
risk
from
Barclays
Bank
Group’s
pension
plans.
Interest
rate
risk
in
the
banking
book:
The
risk
that
Barclays
Bank
Group
is
exposed
to
capital
or
income
volatility
because
of
a
mismatch
between
the
intere
st
rate
exposures
of
its
(non
traded)
assets
and
liabilities.
The
Barclays
Bank
Group
Treasury
manages
treasury
and
capital
risk
exposure
on
a
day
-
to-
day
basis
with
the
Barclays
Group
Treasury
Committee
acting
as
the
principal
management
body.
The
Barclays
Group
Treasury
and
Capital
Risk
function
is
responsible
for
over
sight
and
provide
insight
into
key
capital,
liquidity,
interest
rate
risk
in
the
banking
book
(IRRBB)
and
pension
risk
management
activities.
Liquidity
risk
management
(audited)
Overview
The
efficient
management
of
liquidity
is
essential
to
the
Barclays
Bank
Group
in
order
to
retain
the
confidence
of
the
financial
markets
and
maintain
the
sustainability
of
the
business.
The
liquidity
risk
control
framework
is
used
to
manage
all
liquidity
risk
exposures
under
both
BAU
and
stressed
conditions.
The
framework
is
designed
to
maintain
liquidity
resources
that
are
sufficient
in
amount,
quality
and
funding
tenor
profile
to
support
the
liquidity
risk
appetite
as
expressed
by
the
Barclays
Bank
PLC
Board.
The
liquidity
risk
appetite
is
monitored
against
bot
h
internal
and
regulatory
liquidity
metrics.
Organisation,
roles
and
responsibilities
Treasury
has
the
primary
responsibility
for
managing
liquidity
risk
within
the
set
risk
appetite.
Both
Risk
and
Treasury
contribute
to
the
production
of
the
I
nternal
Liqu
idity
A
dequacy
A
ssessment
P
rocess
(ILAAP).
The
Treasury
and
Capital
Risk
function
is
responsible
for
the
management
and
governance
of
the
liquidity
risk
mandate,
as
defined
by
the
Barclays
Bank
PLC
Board
.
The
liquidity
risk
control
framework
is
designed
to
deliver
the
appropriate
term
and
structure
of
funding,
consistent
with
the
liquidity
risk
appetite
set
by
the
Barclays
Bank
PLC
Board.
The
control
framework
incorporates
a
range
of
ongoing
business
management
tools
to
monitor,
limit
and
stress
test
the
Barclays
Bank
Group
balance
sheet
and
contingent
liabilities.
Limit
setting
and
transfer
pricing
are
tools
that
are
designed
to
control
the
level
of
liquidity
risk
taken
and
drive
the
appropriate
mix
of
funds.
In
addition,
Barclays
maintains
a
Group
reco
very
plan
which
includes
application
to
the
Barclays
Bank
Group.
Together,
these
tools
reduce
the
likelihood
that
a
liquidity
stress
event
could
lead
to
an
inability
to
meet
the
Barclays
Bank
Group’
s
obligations
as
they
fall
due.
The
Barclays
Bank
PLC
Boar
d
approves
the
Barclays
Bank
Group
funding
plan,
internal
stress
tests
and
results
of
regulatory
stress
tests.
The
Barclays
Bank
PLC
Treasury
Committee
is
responsible
for
monitoring
and
managing
liquidity
risk
in
line
with
the
Barclays
Bank
Group’s
funding
management
objectives,
funding
plan
and
risk
frameworks.
The
Barclays
Group
Treasury
and
Capital
Risk
Committee
monitors
and
reviews
the
liquidity
risk
profile
and
control
environment,
providing
second
line
oversight
of
the
management
of
liquidity
risk.
The
Barclays
Bank
PLC
Board
Risk
Committee
reviews
the
risk
profile,
and
annually
reviews
risk
appetite
and
the
impact
of
stress
scenarios
on
the
Barclays
Bank
Group
funding
plan/forecast
in
order
to
agree
the
Barclays
Bank
Group’s
projected
funding
abilities.
Capital
risk
management
(audited)
Overview
Capital
risk
is
managed
through
ongoing
monitoring
and
management
of
the
capital
position,
regular
stress
testing
and
a
robust
capital
governance
framework.
The
objectives
of
the
framework
are
to
maintain
adequate
capital
for
the
Barclays
Bank
Group
and
its
legal
entities
to
withstand
the
impact
of
the
risks
that
may
arise
under
normal
and
stressed
conditions,
and
maintain
adequate
capital
to
cover
current
and
forecast
business
needs
and
associated
risks
to
provide
a
viable
and
sustainable
business
offering.
Organisation,
r
oles
and
responsibilities
Treasury
has
the
primary
responsibility
for
managing
and
monitoring
capital.
The
Barclays
Bank
Group
Treasury
and
Capital
Risk
function
provides
oversight
of
capital
risk
and
is
an
independent
risk
function
that
reports
to
the
Barclays
Bank
Group
CRO.
Production
of
the
Barclays
Bank
PLC
I
nternal
Capital
A
dequacy
A
ssessment
P
rocess
(ICAAP)
is
the
responsibility
of
Treasury.
Capital
risk
management
is
underpinned
by
a
control
framework
and
policy.
The
capital
management
strategy,
outlined
in
the
relevant
legal
entity
capital
plans,
is
developed
in
alignment
with
the
control
framework
and
pol
icy
for
capital
risk,
and
is
implemented
consistently
in
order
to
deliver
on
the
Barclays
Bank
Group’s
objectives,
which
are
aligned
to
those
of
the
Barclays
Group.
The
Barclays
Bank
PLC
Board
approves
the
Barclays
Bank
PLC
capital
plan,
internal
stress
tests
and
results
of
regulatory
stress
tests
and
those
of
the
relevant
Barclays
Bank
Group
entities.
The
Barclays
PLC
Board
also
approves
the
Barclays
Group
recovery
plan
which
takes
into
account
management
actions
identified
at
the
Barclays
Bank
Group
level.
The
Barclays
Bank
PLC
Treasury
Committee
together
with
the
Barclays
Group
Treasury
Committee
are
responsible
for
monitoring
and
managing
capital
risk
in
line
with
Barclays
Bank
Group’s
capital
management
objectives,
capital
plan
and
risk
frameworks.
The
BRC
monitors
and
reviews
the
capital
risk
profile
and
control
environment,
providing
second
line
oversight
of
the
management
of
capital
risk.
For
the
relevant
Barclays
Bank
Group
subsidiaries,
local
management
assures
compliance
with
an
entity’s
minimum
re
gulatory
capital
requirements
by
reporting
to
local
Asset
and
Liability
Committees
(or
equivalents)
with
oversight
by
the
Barclays
Bank
PLC
Treasury
Committee
and
the
Barclays
Group
Treasury
Committee,
as
required.
In
2019,
Barclays
complied
with
all
regul
atory
minimum
capital
requirements.
Pension
risk
The
Barclays
Bank
Group
maintains
a
number
of
defined
benefit
pension
schemes
for
past
and
current
employees.
The
ability
of
schemes
to
meet
pension
payments
is
achieved
with
investments
and
contributions.
Risk
review
Principal
r
isk
management
Barclays
Bank
PLC
2019
Annual
Report
on
Form
20-F
41
Pension
risk
arises
because
the
market
value
of
pension
fund
assets
might
decline;
investment
returns
might
reduce;
or
the
estimated
value
of
pension
liabilities
might
increase.
The
Barclays
Bank
Group
monitors
the
pension
risks
arising
from
its
defined
b
enefit
pension
schemes
and
works
with
Trustees
to
address
shortfalls.
In
these
circumstances
the
Barclays
Bank
Group
could
be
required
or
might
choose
to
make
extra
contributions
to
the
pension
fund.
The
Barclays
Bank
Group
’s
main
defined
benefit
scheme
wa
s
closed
to
new
entrants
in
2012.
Interest
rate
risk
in
the
banking
book
management
(IRRBB)
Overview
Interest
rate
risk
in
the
banking
book
is
driven
by
customer
deposit
taking
and
lending
activities,
investments
in
the
liquid
asset
portfolio
and
funding
activities.
As
per
the
Barclays
Bank
Group’s
policy
to
remain
within
the
defined
risk
appetite,
businesses
and
Treasury
execute
hedging
strategies
to
mitigate
the
risks.
However,
the
Barclays
Bank
Group
remains
susceptible
to
interest
rate
risk
and
other
non
-
traded
market
risks
from
key
sources:
◾
Interest
rate
and
repricing
risk:
timing
of
interest
rate
changes
between
assets
and
liabilities,
and
other
constraints
on
interest
rate
changes
as
per
product
terms
and
conditions.
◾
Customer
behavioural
risk:
the
risk
that
net
interest
income
could
be
adversely
impacted
by
the
discretion
that
custom
ers
and
counterparties
may
have
in
respect
of
being
able
to
vary
their
contractual
obligations
with
the
Barclays
Bank
Group.
This
risk
is
often
referred
to
by
industry
regulators
as
‘embedded
option
risk’.
◾
Investment
risks
in
the
liquid
asset
portfolio:
the
risk
that
the
fair
value
of
assets
held
in
the
liquid
asset
portfolio
and
associated
risk
management
portfolios
could
be
adversely
impacted
by
market
volatility,
creating
volatility
in
capital
directly.
Organisation,
roles
and
responsibilities
The
Barclays
Bank
PLC
Treasury
Committee,
together
with
the
Barclays
Group
Treasury
Committee,
are
responsible
for
monitoring
and
managing
IRRBB
risk
in
line
with
Barclays
Bank’s
management
objectives
and
risk
frameworks.
The
BRC
and
Treasury
and
Capital
Risk
Committee
monitors
and
reviews
the
IRRBB
risk
profile
and
control
environment,
providing
second
line
oversight
of
the
management
of
IRRBB.
The
BRC
reviews
the
interest
rate
risk
profile,
including
annual
review
of
the
risk
appetite
and
the
impact
of
stress
scenarios
on
the
interest
rate
risk
of
the
Barclays
Bank
Group’s
banking
books.
In
addition,
the
Barclays
Bank
Group’s
IRRBB
policy
sets
out
the
processes
and
key
controls
required
to
identify
all
IRRBB
risks
arising
from
banking
book
operations,
to
monitor
the
risk
exposures
via
a
set
of
metrics
with
a
frequency
in
line
with
the
risk
management
horizon,
and
to
manage
these
risks
within
agreed
risk
appetite
and
limits.
Operational
risk
management
The
risk
of
loss
to
Barclays
Bank
Group
from
inadequate
or
failed
processes
or
systems,
human
factors
or
due
to
external
events
(for
example
fraud)
where
the
root
cause
is
not
due
to
credit
or
market
risks.
Overview
The
management
of
operational
risk
has
three
key
objectives:
◾
d
eliver
an
operational
risk
capability
owned
and
used
by
business
leaders
to
enable
sound
ri
sk
decisions
over
the
long
term;
◾
p
rovide
the
frameworks,
policies
and
standards
to
enable
management
to
meet
their
risk
management
responsibilities
while
the
second
line
of
defence
provides
robust,
independent,
and
effective
oversight
and
challenge;
and
◾
d
eliver
a
consistent
and
aggregated
measurement
of
operational
risk
that
will
provide
clear
and
relevant
insights,
so
that
the
right
management
actions
can
be
taken
to
keep
the
operational
risk
profile
consistent
with
the
Barclays
Bank
Group’s
strategy,
the
stated
risk
appetite
and
stakeholder
needs.
The
Barclays
Bank
Group
operates
within
a
system
of
internal
controls
that
enables
business
to
be
transacted
and
risk
taken
without
exposing
it
to
unacceptable
potential
losses
or
reputational
damages
.
Organisation,
roles
and
responsibilities
The
prime
responsibility
for
the
management
of
operational
risk
and
the
compliance
with
control
requirements
rests
within
the
business
and
functional
units
where
the
risk
arises.
The
operational
risk
profile
and
control
environment
is
reviewed
by
management
through
business
risk
committees
and
control
committees.
Businesses
and
functions
are
required
to
report
their
operational
r
isks
on
both
a
regular
and
an
event
-
driven
basis.
The
reports
include
a
profile
of
the
material
risks
that
may
threaten
the
achievement
of
their
objectives
and
the
effectiveness
of
key
controls,
operational
risk
events
and
a
review
of
scenarios.
The
Barclays
Group
Head
of
Operational
Risk
is
responsible
for
establishing,
owning
and
maintaining
an
appropriate
Barclays
Group
-wide
Operational
Risk
Management
Framework,
meanwhile
the
Barclays
Bank
PLC
Head
of
Operational
Risk
is
responsible
for
overse
eing
the
portfolio
of
operational
risk
across
all
businesses.
Operational
Risk
Management
(ORM)
acts
in
a
second
line
of
defence
capacity,
and
is
responsible
for
defining
and
overseeing
the
implementation
of
the
framework
and
monitoring
Barclays
Bank
Group
’s
operational
risk
profile.
ORM
alerts
management
when
risk
levels
exceed
acceptable
tolerance
in
order
to
drive
timely
decision
making
and
actions
by
the
first
line
of
defence.
Operational
risk
issues
escalated
from
these
meetings
are
considered
through
the
second
line
of
defence
review
meetings.
Depending
on
their
nature,
the
outputs
of
these
meetings
are
presented
to
the
Barclays
Bank
Risk
Forum,
BRC
or
the
BAC.
In
addition,
specific
reports
are
prepared
by
the
business
and
Barclays
Bank
PLC
Head
of
Operational
Risk
on
a
regular
basis
for
the
Barclays
Bank
Risk
Forum
and
the
BRC.
Operational
risk
categories
Operational
risks
are
grouped
into
risk
categories
to
support
effective
risk
management,
measurement
and
reporting.
These
comprise:
Data
Management
&
Information
Risk;
Financial
Reporting
Risk;
Fraud
Risk;
Payments
Process
Risk;
People
Risk;
Premises
Risk;
Physical
Security
Risk;
Supplier
Risk;
Tax
Risk;
Technology
Risk;
Transaction
Operations
Risk
and
Execution
Risk.
Risk
review
Principal
r
isk
management
Barclays
Bank
PLC
2019
Annual
Report
on
Form
20-F
42
In
addition
to
the
above,
operational
risk
encompasses
risks
associated
with
prudential
regulation.
This
includes
the
risk
of
failing
to:
adhere
to
prudential
regulatory
requirements,
provide
regulatory
submissions;
or
monitor
and
manage
adherence
to
new
prudential
regulatory
requirements.
Enterprise
risk
themes
The
Barclays
Bank
Group
also
recognises
that
there
are
certain
threats/risk
drivers
that
are
more
thematic
and
have
the
potential
to
impact
the
Barclays
Bank
Group’s
strategic
objectives.
These
are
enterprise
risk
themes
which
require
an
overarching
and
integrated
risk
management
approach.
The
Barclays
Bank
Group’s
enterprise
risk
themes
include
Cyber,
Data
and
Resilience.
For
definitions
of
the
Barclays
Bank
Group’s
operational
risk
categories
and
enterpris
e
risk
themes,
refer
to
pages
199
to
200
of
the
Barclays
PLC
Pillar
3
Report
2019.
Model
risk
management
The
risk
of
the
potential
adverse
consequences
from
financial
assessments
or
decisions
based
on
incorrect
or
misused
model
outputs
and
reports.
Overview
The
Barclays
Bank
Group
uses
models
to
support
a
broad
range
of
activities,
including
informing
business
decisions
and
strategies,
measuring
and
limiting
risk,
valuing
exposures,
conducting
stress
testing,
assessing
capital
adequacy,
managing
client
assets,
and
meeting
reporting
requirements.
Since
models
are
imperfect
and
incomplete
representations
of
reality,
they
may
be
subject
to
errors
affecting
the
accuracy
of
their
output.
Model
errors
and
misuse
are
the
primary
sources
of
model
risk.
Organisation,
roles
and
responsibilities
The
Barclays
Group
has
a
dedicated
Model
Risk
Management
(MRM)
function
that
consists
of
two
main
units:
the
Independent
Validation
Unit
(IVU),
responsible
for
model
validation
and
approval,
and
Model
Governance
and
Controls
(MGC),
covering
model
risk
governance,
controls
and
reporting,
including
ownership
of
model
risk
policy
and
the
model
inventory.
The
model
risk
management
framework
consists
of
the
model
risk
policy
and
standards.
The
policy
prescribes
the
Barclays
G
roup
-
wide,
en
d
-
to-
end
requirements
for
the
identification,
measurement
and
management
of
model
risk,
covering
model
documentation,
development,
implementation,
monitoring,
annual
review,
independent
validation
and
approval,
change
and
reporting
processes.
The
policy
is
supported
by
global
standards
covering
model
inventory,
documentation,
validation,
complexity
and
materiality,
testing
and
monitoring,
overlays,
risk
appetite,
as
well
as
vendor
models
and
stress
testing
challenger
models.
The
function
reports
to
the
Barclays
Group
CRO
and
operates
a
global
framework.
Implementation
of
best
practice
standards
is
a
centr
al
objective
of
the
Barclays
Group.
The
key
model
risk
management
activities
include:
◾
Correctly
identifying
models
across
all
relevant
areas
of
the
Bar
clays
Bank
Group,
and
recording
models
in
the
Barclays
Group
Models
Database
(GMD),
the
Barclays
Group
-
wide
model
inventory.
◾
Enforcing
that
every
model
has
a
model
owner
who
is
accountable
for
the
model.
The
model
owner
must
sign
off
models
prior
to
submission
to
IVU
for
validation
and
maintain
that
the
model
presented
to
IVU
is
and
remains
fit
for
purpose.
◾
Overseeing
that
every
model
is
subject
to
validation
and
approval
by
IVU,
prior
to
being
implemented
and
on
a
continual
basis.
◾
Defining
model
risk
appetite
in
terms
of
risk
tolerance,
and
qualitative
metrics
which
are
used
to
track
and
report
model
risk.
Conduct
risk
management
The
risk
of
detriment
to
customers,
clients,
market
integrity,
effective
competition
or
Barclays
from
the
inappropriate
supply
of
financial
services,
including
instances
of
wilful
or
negligent
misconduct.
Overview
The
Barclays
Bank
Group
defines,
manages
and
mitigates
conduct
risk
with
the
objective
of
providing
good
customer
and
client
outcomes,
prote
cting
market
integrity
and
promoting
effective
competition.
Product
Lifecycle,
Culture
and
Strategy
and
Financial
Crime
are
the
risk
categories
under
the
Barclays
Group
definition
of
conduct
risk.
Organisation,
roles
and
responsibilities
The
governance
of
conduct
risk
within
the
Barclays
Bank
Group
is
fulfilled
through
management
committees
and
forums
operated
by
the
first
and
second
lines
of
d
efence
with
clear
escalation
and
reporting
lines
to
the
Barclays
Bank
PLC
Board
committees.
The
Barclays
Group
Risk
Committee
is
the
most
senior
executive
body
responsible
for
reviewing
and
m
onitoring
the
effectiveness
of
both
the
Barclays
Bank
Group
and
the
Barclays
Group’s
management
of
conduct
risk.
The
Conduct
Risk
Management
Framework
(CRMF)
comprises
a
number
of
elements
that
allow
the
Barclays
Bank
Group
to
manage
and
measure
its
conduct
risk
profile.
Senio
r
m
anagers
have
accountability
for
managing
conduct
risk
in
their
areas
of
responsibility.
This
is
expressed
in
their
Statement
of
Responsibilities
which
identifies
the
activities
and
areas
for
which
they
are
accountable.
The
primary
responsibility
for
managing
conduct
risk
and
compliance
with
control
requirements
sits
with
the
business
where
the
risk
arises.
The
Barclays
Bank
Group
Controls
Committee
provi
des
oversight
of
controls
relating
to
conduct
risk.
The
Barclays
Bank
Group
Chief
Compliance
Officer
is
responsible
for
providing
effective
oversight,
management
and
escalation
of
conduct
r
isk
in
line
with
the
CRMF.
This
includes
overseeing
the
development
and
maintenance
of
the
relevant
conduct
risk
p
olicies
and
standards
and
monitoring
and
reporting
on
the
consistent
application
and
effectiveness
of
the
implem
entation
of
controls
to
manage
conduct
r
isk.
Risk
review
Principal
r
isk
management
Barclays
Bank
PLC
2019
Annual
Report
on
Form
20-F
43
The
Barclays
Group
Risk
Committee
is
the
primary
second
line
governance
committee
for
the
oversight
of
conduct
risk
profile
and
implementation
of
the
CRMF
for
the
Barclays
Bank
Group.
The
responsibilities
of
the
Barclays
Group
Risk
Committee
in
relation
to
the
Barclays
Bank
Group
include
adoption
of
the
co
nduct
risk
tolerance
and
the
business
defined
key
indicators.
Additional
responsibilities
include
the
identification
and
discussion
of
any
emerging
conduct
risks
exposures
that
have
been
identified.
Reputation
risk
management
The
risk
that
an
action,
transaction,
investment,
event,
decision,
or
business
relationsh
ip
will
reduce
trust
in
Barclays
Bank
Group
’s
integrity
and/or
competence
.
Overview
A
reduction
of
trust
in
the
Barclays
Bank
Group’s
integrity
and
competence
may
reduce
the
attractiveness
of
Barclays
Bank
Group
to
customers
and
clients
and
other
stakeholders
and
could
lead
to
negative
publicity,
loss
of
revenue,
regulatory
or
legislative
action,
loss
of
existing
and
potential
client
business,
reduce
workforce
morale
and
difficulties
in
recruiting
talent.
Ultimately
it
may
destroy
shareholder
value.
Organisation,
roles
and
responsibilities
The
governance
of
reputation
risk
within
the
Barclays
Bank
Group
is
fulfilled
through
managem
ent
committees
and
forums
operated
by
the
First
and
Second
Lines
of
Defence,
with
clear
escalation
and
reporting
lines
to
the
relevant
Barclays
Bank
Group
Board
committees.
The
Barclays
Group
Risk
Committee
is
the
most
senior
executive
body
responsible
fo
r
reviewing
and
monitoring
the
effectiveness
of
the
Barclays
Bank
Group
management
of
reputation
risk.
The
Reputation
Risk
Management
Framework
(RRMF)
comprises
a
number
of
elements
that
allow
the
Barclays
Bank
Group
to
manage
and
measure
its
reputation
ri
sk
profile.
The
RRMF
sets
out
what
is
required
to
manage
reputation
risk
across
the
Barclays
Bank
Group.
The
Barclays
Bank
PLC
Chief
Compliance
Officer
is
responsible
for
assessing
the
appropriateness
of
the
relevant
reputation
risk
policy
and
standards
an
d
oversight
of
the
implementation
of
controls
to
manage
the
risk.
The
Barclays
Bank
Group
is
required
to
prepare
reports
for
the
Barclays
Group
Risk
Committee
highlighting
the
most
significant
current
and
potential
reputation
risks
and
issues
and
how
they
are
being
managed.
Legal
risk
management
The
risk
of
loss
or
imposition
of
penalties,
damages
or
fines
from
the
failure
of
Barclays
Bank
Group
to
meet
its
legal
obligations
including
regulatory
or
contractual
requirements.
Overview
The
Barclays
Bank
Group
has
no
tolerance
for
wilful
breaches
of
laws,
regulations
or
other
legal
obligations.
However,
the
multitude
of
laws
and
regulations
across
the
globe
are
highly
dynamic
and
their
application
to
particular
circumstances
is
often
unclear;
this
results
in
a
level
of
inherent
legal
risk,
for
which
the
Barclays
Bank
Group
has
limited
tolerance.
Organisation,
roles
and
responsibilities
The
Barclays
Bank
Group’s
businesses
and
functions
have
primary
responsibility
for
identifying,
managing
and
escalating
legal
risk
in
their
area
as
well
as
responsibility
for
adherence
to
minimum
control
requirements.
The
Legal
Function
organisation
and
coverage
model
aligns
expertise
to
businesses,
functions,
products,
activities
and
geographic
locations
so
that
the
Barclays
Bank
Group
receives
legal
support
from
appropriate
legal
professionals.
The
senior
management
o
f
the
Legal
Function
oversees,
monitors
and
challenges
legal
risk
across
the
Barclays
Group.
The
Legal
Funct
ion
does
not
sit
in
any
of
the
three
lines
of
d
efence
but
supports
them
all.
The
Barclays
Group
General
Counsel
is
responsible
for
maintaining
an
ap
propriate
Barclays
Group
-
wide
legal
risk
management
framework.
This
includes
defining
the
relevant
legal
risk
policies
and
oversight
of
the
implementation
of
controls
to
manage
and
escalate
legal
risk.
The
legal
risk
profile
and
control
environment
is
reviewed
by
management
through
business
risk
committe
es
and
control
committees.
The
BRC
is
the
most
senior
body
responsible
for
reviewing
and
monitoring
the
effectiveness
of
risk
management
across
the
Barclays
Bank
Group.
Escalation
paths
from
this
committee
exist
to
the
Barclays
Group
Risk
Committee.
Risk
review
Risk
performance
Credit
risk
Barclays
Bank
PLC
2019
Annual
Report
on
Form
20-F
44
Summary
of
Contents
Credit
risk
represents
a
significant
risk
to
the
Barclays
Bank
Group
and
mainly
arises
from
exposure
to
wholesale
and
retail
loans
and
advances
together
with
the
counterparty
credit
risk
arising
from
derivative
contracts
entered
into
with
clients.
◾
Credit
risk
overview
and
summary
of
performance
◾
M
aximum
exposure
and
effects
of
netting,
collateral
and
risk
transfer
45
46
This
section
outlines
the
expected
credit
loss
allowances,
the
movements
in
allowances
during
the
period,
material
management
adjustments
to
model
output
and
measurement
uncertainty
and
sensitivity
analysis.
◾
Expected
credit
losses
-
Loans
and
advances
at
amortised
cost
by
product
-
Movement
in
gross
exposure
and
impairment
allowance
for
loans
and
advances
at
amortised
cost
including
provisions
for
loan
commitments
and
financial
guarantees
-
Stage
2
decomposition
-
Stage
3
decomposition
◾
Management
adjustments
to
models
for
impairment
◾
Measurement
uncertainty
and
sensitivity
analysis
49
49
50
54
54
55
55
The
Barclays
Bank
Group
reviews
and
monitors
risk
concentrations
in
a
variety
of
ways.
This
section
outlines
performance
against
key
concentration
risks.
◾
Analysis
of
the
concentration
of
credit
risk
-
Geographic
concentrations
-
Industry
concentrations
◾
A
pp
roach
to
management
and
representation
of
credit
quality
-
Asset
credit
quality
-
Debt
securities
-
Balance
sheet
credit
quality
-
Credit
exposures
by
internal
PD
grade
61
61
62
63
63
63
63
65
Credit
Risk
monitors
exposure
performance
across
a
range
of
significant
portfolios.
◾
Analysis
of
specific
portfolios
and
asset
types
-
Credit
cards,
unsecured
loans
and
other
retail
lending
67
67
Risk
review
Risk
performance
Credit
risk
Barclays
Bank
PLC
2019
Annual
Report
on
Form
20-F
45
A
ll
disclosures
in
this
section
pages
45
to
67
are
unaudited
unless
otherwise
stated.
Overview
Credit
risk
represents
a
significant
risk
to
the
Barclays
Bank
Group
and
mainly
arises
from
exposure
to
wholesale
and
retail
loans
and
advances
together
with
the
counterparty
credit
risk
arising
from
derivative
contracts
entered
into
with
clients.
Further
detail
can
be
found
in
the
Financial
statements
section
in
Note
7
Credit
impairment
charges.
Descriptions
of
terminology
can
be
found
in
the
glossary,
available
at
home.barclays/annualreport.
Summary
of
performance
in
the
period
Credit
impairment
charges
increased
87%
to
£1,202m.
CIB
credit
impairment
charges
increased
to
£157m
(2018:
release
of
£152m)
due
to
the
non
-
recurrence
of
favourable
macroeconomic
scenario
updates
and
single
name
recove
ries
in
2018.
CC&P
credit
impairment
charges
increased
to
£1,016m
(2018:
£808m)
due
to
growth
in
cards
balance
and
the
non
-
recurrence
of
favourable
US
macroeconomic
scenario
updates
in
2018.
Credit
metrics
remained
stable,
with
US
cards
30
and
90
day
arrears
of
2.7%
(Q418:
2.7%)
and
1.4%
(Q41
8:
1.4%)
respectively.
Key
metrics
Decrease
of
£112m
impairment
allowance
Impairment
allowances
on
loans
and
advances
at
amortised
cost,
including
off
-
balance
sheet
elements
of
the
allowance
in
Barcl
ays
Bank
Group
decreased
by
£112
m
to
£3,948m
(2018:
£4,060m)
during
the
year.
This
is
driven
by
a
decrease
in
Home
Loans
£32m,
Credit
cards,
unsecured
loans
and
other
retail
lending
of
£144m
offset
by
an
increase
in
Wholesale
Loans
of
£29m
and
an
increase
in
off
-
balance
sheet
provisions
of
£35m.
Please
refer
to
Pg
00
Expected
Credit
loss
section
for
further
details.
Please
see
risk
management
section
on
pages
25
to
27
for
details
of
governance,
policies
and
procedures.
Risk
review
Risk
performance
Credit
risk
Barclays
Bank
PLC
2019
Annual
Report
on
Form
20-F
46
Analysis
of
the
Balance
Sheet
Barclays
Bank
Group’s
maximum
exposure
and
effects
of
netting,
collateral
and
risk
transfer
The
following
tables
present
a
reconciliation
between
the
Barclays
Bank
Group’s
maximum
exposure
and
its
net
exposure
to
credit
risk,
reflecting
the
financial
effects
of
risk
mitigation
reducing
the
Barclays
Bank
Group’s
exposure.
For
financial
assets
recognised
on
the
balance
sheet,
maximum
exposure
to
credit
risk
represents
the
balance
sheet
carrying
value
after
allowance
for
impairment.
For
off
-
balance
sheet
guarantees,
the
maximum
exposure
is
the
maximum
amount
that
the
Barclays
Bank
Group
would
have
to
pay
if
the
guarantees
w
ere
to
be
called
upon.
For
loan
and
other
credit
related
commitments
,
the
maximum
exposure
is
the
full
amount
of
the
committed
facilities.
This
and
subsequent
analyses
of
credit
risk
exclude
other
financial
assets
not
subject
to
credit
risk,
mainly
equity
securities.
The
Barclays
Bank
Group
mitigates
the
credit
risk
to
which
it
is
exposed
through
netting
and
set-off,
collateral
and
risk
transfer.
Furt
her
detail
on
these
forms
of
credit
enhan
cement
is
presented
on
page
31
of
the
credit
risk
management
section.
Overview
As
at
31
December
2019,
the
Barclays
Bank
Group’s
net
exposure
to
credit
risk,
after
taking
into
account
credit
risk
mitigation,
increase
d
0
.4%
to
£657.7
bn
.
Overall,
the
extent
to
which
the
Barclays
Bank
Group
holds
mitigation
against
its
total
exposure
remained
unchanged
at
4
0%
(2018:
40%).
Of
the
unmitigated
on
balance
sheet
exposure,
a
significant
portion
relates
to
cash
held
at
central
banks,
cash
collateral
and
settlement
balances,
and
debt
securities
issued
by
governments,
all
of
which
are
considered
to
be
lower
risk.
The
increase
in
the
Barclays
Bank
Group’s
net
exposure
to
credit
risk
has
been
driven
by
increases
in
cash
col
lateral
and
settlement
balances,
wholesale
corporate
loans
and
off
-
balance
sheet
loan
commitments,
offset
by
decreases
in
cash
and
balances
at
central
banks
and
trading
portfolio
assets.
Trading
portfolio
liability
positions,
which
to
a
significant
extent
economically
hedge
trading
portfolio
assets
but
which
are
not
held
specifically
for
risk
management
purposes,
are
excluded
from
the
analysis.
The
credit
quality
of
counterparties
to
derivatives,
financial
investments
and
wholesale
loan
assets
are
predomina
ntly
investment
grade
and
there
are
no
significant
changes
from
prior
year.
Further
analysis
on
the
credit
quality
o
f
assets
is
presented
on
pages
63
to
64
.
Collateral
obtained
Where
collateral
has
been
obtained
in
the
event
of
default,
the
Barclays
Bank
Group
does
not,
ordinarily,
use
such
assets
for
its
own
operations
and
they
are
usually
sold
on
a
timely
basis.
The
carrying
value
of
assets
held
by
the
Barclays
Bank
Group
as
at
31
December
2019,
as
a
result
of
the
en
forcement
of
collateral,
was
£6
m
(2018
:
£6m).
Risk
review
Risk
performance
Credit
risk
Barclays
Bank
PLC
2019
Annual
Report
on
Form
20-F
47
Maximum
exposure
and
effect
of
netting,
collateral
and
risk
transfer
(audited)
Maximum
exposure
Netting
and
set
-off
Cash
collateral
Non
-cash
collateral
Risk
transfer
Net
exposure
Barclays
Bank
Group
As
at
31
December
2019
£m
£m
£m
£m
£m
£m
On-balance
sheet:
Cash
and
balances
at
central
banks
125,940
-
-
-
-
125,940
Cash
collateral
and
settlement
balances
79,486
-
-
-
-
79,486
Loans
and
advances
at
amortised
cost:
Home
loans
10,986
-
(293)
(10,582)
(69)
42
Credit
cards,
unsecured
loans
and
other
retail
lending
33,503
-
(695)
(4,753)
(256)
27,799
Wholesale
loans
97,147
(7,636)
(146)
(25,915)
(4,550)
58,900
Total
loans
and
advances
at
amortised
cost
141,636
(7,636)
(1,134)
(41,250)
(4,875)
86,741
764
-
(2)
(749)
(13)
-
658
-
(7)
(271)
(3)
377
780
-
(9)
(209)
(19)
543
2,202
-
(18)
(1,229)
(35)
920
Reverse
repurchase
agreements
and
other
similar
secured
lending
1,731
-
-
(1,731)
-
-
Trading
portfolio
assets:
Debt
securities
51,880
-
-
(423)
-
51,457
Traded
loans
5,378
-
-
(134)
-
5,244
Total
trading
portfolio
assets
57,258
-
-
(557)
-
56,701
Financial
assets
at
fair
value
through
the
income
statement:
Loans
and
advances
19,137
-
(14)
(14,791)
(57)
4,275
Debt
securities
5,220
-
-
-
-
5,220
Reverse
repurchase
agreements
97,823
-
(1,132)
(96,672)
-
19
Other
financial
assets
742
-
-
-
-
742
Total
financial
assets
at
fair
value
through
the
income
statement
122,922
-
(1,146)
(111,463)
(57)
10,256
Derivative
financial
instruments
229,641
(176,022)
(33,469)
(5,403)
(5,564)
9,183
Financial
assets
at
fair
value
through
other
comprehensive
income
45,405
-
-
(305)
(727)
44,373
Other
assets
614
-
-
-
-
614
Total
on
-balance
sheet
804,633
(183,658)
(35,749)
(160,709)
(11,223)
413,294
Off-balance
sheet:
Contingent
liabilities
23,777
-
(400)
(4,412)
(159)
18,806
Loan
commitments
270,027
-
(48)
(42,420)
(1,913)
225,646
Total
off-balance
sheet
293,804
-
(448)
(46,832)
(2,072)
244,452
Total
1,098,437
(183,658)
(36,197)
(207,541)
(13,295)
657,746
Off-balance
sheet
exposures
are
shown
gross
of
provisions
of
£252m
(2018:
£217m).
See
Note
24
for
further
details.
In
addition
to
the
above,
Barclays
Bank
Group
holds
forward
starting
reverse
repos
amounting
to
£31.1
bn
(2018:
£35.5bn).
The
balances
are
fully
collateralised.
For
further
information
on
credit
risk
mitigation
techniques,
refer
to
page
31
within
the
credit
risk
management
section.
Risk
review
Risk
performance
Credit
risk
Barclays
Bank
PLC
2019
Annual
Report
on
Form
20-F
48
Maximum
exposure
and
effects
of
netting,
collateral
and
risk
transfer
(audited)
Maximum
exposure
Netting
and
set
-off
Cash
collateral
Non-cash
collateral
Risk
transfer
Net
exposure
Barclays
Bank
Group
As
at
31
December
2018
£m
£m
£m
£m
£m
£m
On-balance
sheet:
Cash
and
balances
at
central
banks
136,359
-
-
-
-
136,359
Cash
collateral
and
settlement
balances
74,352
-
-
-
-
74,352
Loans
and
advances
at
amortised
cost:
Home
loans
13,160
-
(294)
(12,675)
(129)
62
Credit
cards,
unsecured
loans
and
other
retail
lending
33,791
-
(607)
(5,063)
(427)
27,694
Corporate
loans
90,008
(7,546)
(63)
(27,853)
(3,971)
50,575
Total
loans
and
advances
at
amortised
cost
136,959
(7,546)
(964)
(45,591)
(4,527)
78,331
887
-
(3)
(854)
(30)
-
645
-
(6)
(231)
(38)
370
558
-
-
(150)
(17)
391
2,090
-
(9)
(1,235)
(85)
761
Reverse
repurchase
agreements
and
other
similar
secured
lending
1,613
-
(17)
(1,565)
-
31
Trading
portfolio
assets:
Debt
securities
57,134
-
-
(451)
-
56,683
Traded
loans
7,234
-
-
(154)
-
7,080
Total
trading
portfolio
assets
64,368
-
-
(605)
-
63,763
Financial
assets
at
fair
value
through
the
income
statement:
Loans
and
advances
15,644
-
(11)
(9,690)
-
5,943
Debt
securities
4,515
-
-
(445)
-
4,070
Reverse
repurchase
agreements
119,391
-
(2,996)
(115,951)
-
444
Other
financial
assets
528
-
-
-
-
528
Total
financial
assets
at
fair
value
through
the
income
statement
140,078
-
(3,007)
(126,086)
-
10,985
Derivative
financial
instruments
222,683
(172,014)
(31,475)
(5,502)
(4,712)
8,980
Financial
assets
at
fair
value
through
other
comprehensive
income
44,983
-
-
-
(399)
44,584
Other
assets
699
-
-
-
-
699
Total
on
-balance
sheet
822,094
(179,560)
(35,463)
(179,349)
(9,638)
418,084
Off-balance
sheet:
Contingent
liabilities
19,394
-
(399)
(1,418)
(190)
17,387
Loan
commitments
257,768
-
(89)
(36,852)
(1,288)
219,539
Total
off-balance
sheet
277,162
-
(488)
(38,270)
(1,478)
236,926
Total
1,099,256
(179,560)
(35,951)
(217,619)
(11,116)
655,010
Risk
review
Risk
performance
Credit
risk
Barclays
Bank
PLC
2019
Annual
Report
on
Form
20-F
49
Expected
Credit
Losses
Loans
and
advances
at
amortised
cost
by
product
The
table
below
presents
a
breakdown
of
loans
and
advances
at
amortised
cost
and
the
impairment
allowance
with
stage
allocation
by
asset
classification.
Impairment
allowance
under
IFRS
9
considers
both
the
drawn
and
the
undrawn
counterparty
exposure.
For
r
etail
portfolios,
the
total
impairment
allowance
is
allocated
to
the
drawn
exposure
to
the
extent
that
the
allowance
does
not
exceed
the
exposure
as
ECL
is
not
reported
separately.
Any
excess
is
reported
on
the
liability
side
of
the
balance
sheet
as
a
prov
ision.
For
wholesale
portfolios
the
impairment
allowance
on
the
undrawn
exposure
is
reported
on
the
liability
side
of
the
balance
sheet
as
a
provision
.
Barclays
Bank
Group
(audited)
Stage
2
As
at
31
December
2019
Stage
1
Not
past
due
<=30
days
past
due
past
due
Total
Stage
3
Total
a
Gross
exposure
£m
£m
£m
£m
£m
£m
£m
Home
loans
9,604
544
48
82
674
1,056
11,334
Credit
cards,
unsecured
loans
and
other
retail
lending
29,541
3,806
304
340
4,450
2,129
36,120
Wholesale
loans
89,200
6,489
354
672
7,515
1,163
97,878
Total
128,345
10,839
706
1,094
12,639
4,348
145,332
Impairment
allowance
Home
loans
16
24
9
7
40
292
348
Credit
cards,
unsecured
loans
and
other
retail
lending
362
523
99
162
784
1,471
2,617
Wholesale
loans
114
219
8
7
234
383
731
Total
492
766
116
176
1,058
2,146
3,696
Net
exposure
Home
loans
9,588
520
39
75
634
764
10,986
Credit
cards,
unsecured
loans
and
other
retail
lending
29,179
3,283
205
178
3,666
658
33,503
Wholesale
loans
89,086
6,270
346
665
7,281
780
97,147
Total
127,853
10,073
590
918
11,581
2,202
141,636
Coverage
ratio
%
%
%
%
%
%
%
Home
loans
0.2
4.4
18.8
8.5
5.9
27.7
3.1
Credit
cards,
unsecured
loans
and
other
retail
lending
1.2
13.7
32.6
47.6
17.6
69.1
7.2
Wholesale
loans
0.1
3.4
2.3
1.0
3.1
32.9
0.7
Total
0.4
7.1
16.4
16.1
8.4
49.4
2.5
As
at
31
December
2018
Gross
exposure
£m
£m
£m
£m
£m
£m
£m
Home
loans
11,486
663
50
147
860
1,194
13,540
Credit
cards,
unsecured
loans
and
other
retail
lending
29,548
4,381
305
240
4,926
2,078
36,552
Wholesale
loans
81,555
7,480
315
443
8,238
917
90,710
Total
122,589
12,524
670
830
14,024
4,189
140,802
Impairment
allowance
Home
loans
26
29
9
9
47
307
380
Credit
cards,
unsecured
loans
and
other
retail
lending
356
694
118
160
972
1,433
2,761
Wholesale
loans
107
214
11
11
236
359
702
Total
489
937
138
180
1,255
2,099
3,843
Net
exposure
Home
loans
11,460
634
41
138
813
887
13,160
Credit
cards,
unsecured
loans
and
other
retail
lending
29,192
3,687
187
80
3,954
645
33,791
Wholesale
loans
81,448
7,266
304
432
8,002
558
90,008
Total
122,100
11,587
532
650
12,769
2,090
136,959
Coverage
ratio
%
%
%
%
%
%
%
Home
loans
0.2
4.4
18.0
6.1
5.5
25.7
2.8
Credit
cards,
unsecured
loans
and
other
retail
lending
1.2
15.8
38.7
66.7
19.7
69.0
7.6
Wholesale
loans
0.1
2.9
3.5
2.5
2.9
39.1
0.8
Total
0.4
7.5
20.6
21.7
8.9
50.1
2.7
Note
a
Other
financial
assets
subject
to
impairment
not
included
in
the
table
above
include
cash
collateral
and
settlement
balances,
financial
assets
at
fair
value
through
other
comprehensive
income,
accrued
income
and
sundry
debtors.
These
have
a
total
gross
exposure
of
£125.5bn
(December
2018:
£120.1bn)
and
impairment
allowance
of
£22m
(December
2018:
£11m).
This
comprises
£10m
(December
2018:
£9m)
ECL
on
£124.7bn
(December
2018:
£119.6bn)
Stage
1
assets
and
£2m
(December
2018:£2m)
on
£0.8bn
(December
2018:
£
0.5bn)
Stage
2
fair
value
through
other
comprehensive
income
assets,
cash
collateral
and
settlement
assets
and
£10m
(December
2018:
£n
il)
on
£10m
Stage
3
(December
2018:
£nil)
other
assets.
Loan
commitments
and
financial
guarantee
contracts
have
total
ECL
of
£252m
(December
2018:
£217m).
Risk
review
Risk
performance
Credit
risk
Barclays
Bank
PLC
2019
Annual
Report
on
Form
20-F
50
Movement
in
gross
exposures
and
impairment
allowance
including
provisions
for
loan
commitments
and
financial
guarantees
The
following
tables
present
a
reconciliation
of
the
opening
to
the
closing
balance
of
the
exposure
and
impairment
allowance.
Explanation
of
the
terms:
12
-
month
ECL,
lifetime
ECL
and
credit
-
impaired
are
included
in
page
115
The
disclosure
has
been
enhanced
in
2019
to
provide
further
granularity
by
product.
Transfers
between
stages
in
the
tables
have
been
reflected
as
if
they
had
taken
place
at
the
beginning
of
the
year.
The
movements
are
measured
over
a
12
-
month
period.
Loans
and
advances
at
amortised
cost
(audited)
Stage
1
Stage
2
Stage
3
Total
Barclays
Bank
Group
Gross
ECL
Gross
ECL
Gross
ECL
Gross
ECL
£m
£m
£m
£m
£m
£m
£m
£m
Home
loans
As
at
1
January
2019
11,486
26
860
47
1,194
307
13,540
380
Transfers
from
Stage
1
to
Stage
2
(320)
(1)
320
1
-
-
-
-
Transfers
from
Stage
2
to
Stage
1
301
11
(301)
(11)
-
-
-
-
Transfers
to
Stage
3
(103)
-
(94)
(12)
197
12
-
-
Transfers
from
Stage
3
13
-
70
2
(83)
(2)
-
-
Business
activity
in
the
year
785
1
-
-
-
-
785
1
Changes
to
models
used
for
calculation
a
-
-
-
-
-
-
-
-
Net
drawdowns,
repayments,
net
re-
measurement
and
movements
due
to
exposure
and
risk
parameter
changes
(793)
(19)
(58)
19
(70)
1
(921)
1
Final
repayments
(1,042)
(1)
(61)
(2)
(159)
(5)
(1,262)
(8)
Disposals
b
(723)
(1)
(62)
(4)
(2)
-
(787)
(5)
Write-offs
c
-
-
-
-
(21)
(21)
(21)
(21)
As
at
31
December
2019
d
9,604
16
674
40
1,056
292
11,334
348
Credit
cards,
unsecured
loans
and
other
retail
lending
As
at
1
January
2019
29,548
356
4,926
972
2,078
1,433
36,552
2,761
Transfers
from
Stage
1
to
Stage
2
(1,611)
(41)
1,611
41
-
-
-
-
Transfers
from
Stage
2
to
Stage
1
2,134
312
(2,134)
(312)
-
-
-
-
Transfers
to
Stage
3
(585)
(15)
(524)
(244)
1,109
259
-
-
Transfers
from
Stage
3
4
3
16
8
(20)
(11)
-
-
Business
activity
in
the
year
6,007
75
311
56
45
10
6,363
141
Changes
to
models
used
for
calculation
a
-
16
-
(57)
-
(7)
-
(48)
Net
drawdowns,
repayments,
net
re-
measurement
and
movements
due
to
exposure
and
risk
parameter
changes
(3,690)
(318)
410
346
341
1,018
(2,939)
1,046
Final
repayments
(2,266)
(26)
(166)
(26)
(202)
(31)
(2,634)
(83)
Disposals
b
-
-
-
-
(54)
(32)
(54)
(32)
Write-offs
c
-
-
-
-
(1,168)
(1,168)
(1,168)
(1,168)
As
at
31
December
2019
d
29,541
362
4,450
784
2,129
1,471
36,120
2,617
Wholesale
loans
As
at
1
January
2019
81,555
107
8,238
236
917
359
90,710
702
Transfers
from
Stage
1
to
Stage
2
(2,465)
(6)
2,465
6
-
-
-
-
Transfers
from
Stage
2
to
Stage
1
2,905
42
(2,905)
(42)
-
-
-
-
Transfers
to
Stage
3
(305)
(1)
(381)
(13)
686
14
-
-
Transfers
from
Stage
3
52
-
92
15
(144)
(15)
-
-
Business
activity
in
the
year
31,714
44
1,496
22
31
-
33,241
66
Changes
to
models
used
for
calculation
a
-
(9)
-
(19)
-
-
-
(28)
Net
drawdowns,
repayments,
net
re-
measurement
and
movements
due
to
exposure
and
risk
parameter
changes
7,366
(33)
615
70
139
220
8,120
257
Final
repayments
(31,622)
(30)
(2,105)
(41)
(362)
(91)
(34,089)
(162)
Disposals
b
-
-
-
-
-
-
-
-
Write-offs
c
-
-
-
-
(104)
(104)
(104)
(104)
As
at
31
December
2019
d
89,200
114
7,515
234
1,163
383
97,878
731
Notes
a
Changes
to
models
used
for
calculation
include
a
£48m
movement
in
Credit
cards,
unsecured
loans
and
other
retail
lending
and
a
£28m
movement
in
Wholesale
loans
.
These
reflect
methodology
changes
made
during
the
year.
Barclays
continually
review
the
output
of
models
to
determine
accuracy
of
the
ECL
calculation
including
review
of
model
monitoring,
external
benchmarking
and
experience
of
model
operation
over
an
extended
period
of
time.
This
ensures
that
the
models
used
continue
to
reflect
the
risks
inherent
across
the
businesses.
b
The
£787m
movement
of
gross
loans
and
advances
disposed
of
across
Home
Loans
relates
to
the
sale
of
a
portfolio
of
mortgages
from
the
Italian
loan
book.
The
£54m
disposal
reported
within
Credit
cards,
unsecured
loans
and
other
retai
l
lending
portfolio
relates
to
debt
sa
les
undertaken
during
the
year.
c
In
2019,
gross
write
-offs
amounted
to
£1,
293m
(2018:
£1,456m)
and
post
write
-off
recoveries
amounted
to
£73m
(2018:
£86m).
Net
write
-offs
represent
gross
write
-offs
less
post
write
-off
recoverie
s
and
amounted
to
£1,220m
(2018:
£1,370m).
d
Other
financial
assets
subject
to
impairment
not
included
in
the
table
above
include
cash
collateral
and
settlement
balances,
financial
assets
at
fair
value
through
other
comprehensive
income,
accrued
income
and
sundry
debtors.
These
have
a
total
gross
exposure
of
£125.5bn
(December
2018:
£120.1bn)
and
impairment
allowance
of
£22m
(December
2018:
£11m).
This
comprises
£10m
ECL
(December
2018
£9m)
on
£124.7bn
stage
1
assets
(December
2018:
£119.6bn)
and
£2m
(December
2018:
£2m)
on
£0.8bn
stage
2
fair
value
through
other
comprehensive
income
assets,
cash
collateral
and
settlement
assets
(December
2018:
£0.5bn)
and
£10m
(December
2018:
£
nil
)
on
£10m
Stage
3
other
assets
(December
2018:
£nil
).
Risk
review
Risk
performance
Credit
risk
Barclays
Bank
PLC
2019
Annual
Report
on
Form
20-F
51
Reconciliation
of
ECL
movement
to
impairment
charge/(release)
for
the
period
£m
Home
loans
(6)
Credit
cards,
unsecured
loans
and
other
retail
lending
1,056
Wholesale
loans
133
ECL
movement
excluding
assets
derecognised
due
to
disposals
and
write
-offs
1,183
Post
write
-
off
recoveries
(73)
Exchange
and
other
adjustments
a
31
Impairment
charge
on
loan
commitments
and
financial
guarantees
55
Impairment
charge
on
other
financial
assets
b
6
Income
statement
charge
for
the
period
1,202
Notes
a
Includes
foreign
exchange
and
interest
and
fees
in
suspense.
b
Other
financial
assets
subject
to
impairment
not
included
in
the
table
above
include
cash
collateral
and
settlement
balances,
financial
assets
at
fair
value
through
other
comprehensive
income,
accrued
income
and
sundry
debtors.
These
have
a
total
gross
exposure
of
£125.5bn
(December
2018:
£120.1bn)
and
impairment
allowance
of
£22m
(December
2018:
£11m).
This
comprises
£10m
ECL
(December
2018
£9m)
on
£124.7bn
stage
1
assets
(December
2018:
£119.6bn)
and
£2m
(December
2018:
£2m)
on
£0.8bn
stage
2
fair
value
through
other
comprehensive
income
assets,
cash
collateral
and
settlement
assets
(December
2018:
£0.5bn)
and
£10m
(December
2018:
£nil
)
on
£10m
Stage
3
other
assets
(December
2018:
£nil).
Loan
commitments
and
financial
guarantees
(audited)
Stage
1
Stage
2
Stage
3
Total
Barclays
Bank
Group
Gross
ECL
Gross
ECL
Gross
ECL
Gross
ECL
£m
£m
£m
£m
£m
£m
£m
£m
Home
loans
As
at
1
January
2019
15
-
1
-
-
-
16
-
Net
transfers
between
stages
-
-
-
-
-
-
-
-
Business
activity
in
the
year
18
-
-
-
-
-
18
-
Net
drawdowns,
repayments,
net
re-
measurement
and
movement
due
to
exposure
and
risk
parameter
changes
1
-
(1)
-
-
-
-
-
Final
repayments
-
-
-
-
-
-
-
-
As
at
31
December
2019
34
-
-
-
-
-
34
-
Credit
cards,
unsecured
loans
and
other
retail
lending
As
at
1
January
2019
74,624
32
4,304
21
69
20
78,997
73
Net
transfers
between
stages
251
4
(981)
(3)
730
(1)
-
-
Business
activity
in
the
year
13,322
2
173
-
6
6
13,501
8
Net
drawdowns,
repayments,
net
re-
measurement
and
movement
due
to
exposure
and
risk
parameter
changes
1,169
(15)
(810)
(2)
(725)
(10)
(366)
(27)
Final
repayments
(11,109)
(1)
(633)
(1)
(13)
(1)
(11,755)
(3)
As
at
31
December
2019
78,257
22
2,053
15
67
14
80,377
51
Wholesale
loans
As
at
1
January
2019
173,951
59
12,139
83
352
2
186,442
144
Net
transfers
between
stages
(881)
7
585
(8)
296
1
-
-
Business
activity
in
the
year
53,666
22
2,777
22
16
-
56,459
44
Net
drawdowns,
repayments,
net
re-
measurement
and
movement
due
to
exposure
and
risk
parameter
changes
686
(1)
1,211
36
238
41
2,135
76
Final
repayments
(44,421)
(24)
(4,659)
(36)
(266)
(3)
(49,346)
(63)
As
at
31
December
2019
183,001
63
12,053
97
636
41
195,690
201
Risk
review
Risk
performance
Credit
risk
Barclays
Bank
PLC
2019
Annual
Report
on
Form
20-F
52
Gross
exposure
for
loans
and
advances
at
amortised
cost
(audited)
Barclays
Bank
Group
Stage
1
Stage
2
Stage
3
Total
£m
£m
£m
£m
As
at
1
January
2018
266,173
49,592
9,081
324,846
Disposal
of
business
to
Barclays
Bank
UK
PLC
(155,390)
(27,978)
(4,202)
(187,570)
Net
transfers
between
stages
4,999
(6,196)
1,197
-
Business
activity
in
the
year
51,044
1,650
122
52,816
Net
drawdowns
and
repayments
(5,635)
767
155
(4,713)
Final
repayments
(33,493)
(3,811)
(654)
(37,958)
Disposals
(5,109)
-
(54)
(5,163)
Write-
offs
-
-
(1,456)
(1,456)
As
at
31
December
2018
122,589
14,024
4,189
140,802
Impairment
allowance
on
loans
and
advances
at
amortised
cost
(audited)
Barclays
Bank
Group
Stage
1
Stage
2
Stage
3
Total
£m
£m
£m
£m
As
at
1
January
2018
608
3,112
3,382
7,102
Disposal
of
business
to
Barclays
Bank
UK
PLC
(168)
(1,490)
(1,278)
(2,936)
Net
transfers
between
stages
664
(995)
331
-
Business
activity
in
the
year
191
114
57
362
Net
re
-measurement
and
movement
due
to
exposure
and
risk
parameter
changes
(740)
597
1,189
1,046
UK
economic
uncertainty
adjustment
-
50
-
50
Final
repayments
(66)
(133)
(72)
(271)
Disposals
-
-
(54)
(54)
Write-
offs
-
-
(1,456)
(1,456)
As
at
31
December
2018
a
489
1,255
2,099
3,843
Reconciliation
of
ECL
movement
to
impairment
charge/(release)
for
the
period
ECL
movement
excluding
assets
derecognised
due
to
disposals
and
write-
offs
1,187
Post
write-
off
recoveries
(86)
Exchange
and
other
adjustments
(212)
Impairment
release
on
loan
commitments
and
financial
guarantees
b
(48)
Impairment
charge
on
other
financial
assets
3
Income
statement
charge/(release)
for
the
period
c
844
Notes
a
Other
financial
assets
subject
to
impairment
not
included
in
the
table
above
include
cash
collateral
and
settlement
balances,
financial
assets
at
fair
value
through
other
comprehensive
income,
accrued
income
and
sundry
debtors.
These
have
a
total
gross
exposure
of
£120.1bn
(1
January
2018:
£128.1bn)
and
impairment
allowance
of
£11m
(1
January
2018:
£9m).
This
comprises
£9m
ECL
on
£119.6bn
stage
1
as
sets
and
£2m
on
£0.5bn
stage
2
fair
value
through
other
comprehensive
income
assets.
b
Impairment
release
of
£48m
on
loan
commitments
and
financial
guarantees
represents
reduction
in
impairment
allowance
excluding
disposal
of
business
to
Barclays
Bank
UK
PLC
of
£116m
and
exchange
and
other
adjustments
of
£68m.
c
Barclays
Bank
PLC
transferred
its
UK
banking
business
on
1
April
2018
to
Barclays
Bank
UK
PLC.
Net
impairment
charge
of
£201m
(Impairment
charges:
£217m
and
recoveries:
£16m)
relating
to
the
UK
banking
business
for
the
three
months
ended
31
March
2018
is
included
in
the
reconciliation
in
“Income
statement
charge/(release)
for
the
period”.
Risk
review
Risk
performance
Credit
risk
Barclays
Bank
PLC
2019
Annual
Report
on
Form
20-F
53
Gross
exposure
for
loans
and
advances
at
amortised
cost
Continuing
operations
Barclays
Bank
Group
Stage
1
Stage2
Stage3
Total
£m
£m
£m
£m
As
at
1
January
2018
113,375
19,913
4,831
138,119
Net
transfers
between
stages
3,795
(4,588)
793
-
Business
activity
in
the
year
43,520
1,188
48
44,756
Net
drawdowns
and
repayments
(2,773)
1,117
486
(1,170)
Final
repayments
(30,219)
(3,606)
(590)
(34,415)
Disposals
(5,109)
-
(54)
(5,163)
Write-offs
-
-
(1,325)
(1,325)
As
at
31
December
2018
122,589
14,024
4,189
140,802
Impairment
allowance
on
loans
and
advances
at
amortised
cost
Continuing
operations
Barclays
Bank
Group
Stage
1
Stage2
Stage3
Total
£m
£m
£m
£m
As
at
1
January
2018
437
1,713
2,108
4,258
Net
transfers
between
stages
446
(697)
251
-
Business
activity
in
the
year
167
86
30
283
Net
re-measurement
and
movement
due
to
exposure
and
risk
parameter
changes
(506)
220
1,151
865
UK
economic
uncertainty
adjustment
-
50
-
50
Final
repayments
(55)
(117)
(62)
(234)
Disposals
-
-
(54)
(54)
Write-offs
-
-
(1,325)
(1,325)
As
at
31
December
2018
489
1,255
2,099
3,843
Gross
exposure
for
loans
and
advances
at
amortised
cost
Discontinued
operations
Barclays
Bank
Group
Stage
1
Stage2
Stage3
Total
£m
£m
£m
£m
As
at
1
January
2018
152,798
29,679
4,250
186,727
Net
transfers
between
stages
1,204
(1,608)
404
-
Business
activity
in
the
year
7,524
462
74
8,060
Net
drawdowns
and
repayments
(2,862)
(350)
(331)
(3,543)
Final
repayments
(3,274)
(205)
(64)
(3,543)
Write-offs
-
-
(131)
(131)
Transferred
to
Barclays
Bank
UK
PLC
on
1
April
2018
155,390
27,978
4,202
187,570
Impairment
allowance
on
loans
and
advances
at
amortised
cost
Discontinued
operations
Barclays
Bank
Group
Stage
1
Stage2
Stage3
Total
£m
£m
£m
£m
As
at
1
January
2018
171
1,399
1,274
2,844
Net
transfers
between
stages
218
(298)
80
-
Business
activity
in
the
year
24
28
27
79
Net
re-measurement
and
movement
due
to
exposure
and
risk
parameter
changes
(234)
377
38
181
Final
repayments
(11)
(16)
(10)
(37)
Write-offs
-
-
(131)
(131)
Transferred
to
Barclays
Bank
UK
PLC
on
1
April
2018
168
1,490
1,278
2,936
Risk
review
Risk
performance
Credit
risk
Barclays
Bank
PLC
2019
Annual
Report
on
Form
20-F
54
Stage
2
decomposition
Loans
and
advances
at
amortised
cost
a
2019
2018
Gross
Exposure
Impairment
allowance
Gross
Exposure
Impairment
allowance
As
at
31
December
£m
£m
Quantitative
test
8,415
848
10,357
1,116
Qualitative
test
3,365
181
3,324
118
30
days
past
due
backstop
859
29
343
21
Total
Stage
2
12,639
1,058
14,024
1,255
Note
a
Where
balances
satisfy
more
than
one
of
the
above
three
criteria
for
determining
a
significant
increase
in
credit
risk,
the
corresponding
gross
exposure
and
ECL
has
been
assigned
in
order
of
categories
presented.
Stage
2
exposures
are
predominantly
identified
using
quantitative
tests
where
the
lifetime
PD
has
deteriorated
more
than
a
pre
-
determined
amount
since
origination.
This
is
augmented
by
inclusion
of
accounts
meeting
the
designated
high
risk
criteria
(including
watchlist)
for
the
portfolio
under
the
qualitative
test.
Qualitative
tests
include
£1.7bn
relating
to
Corporate
and
Investment
Bank,
£0.9bn
relating
to
Barclaycard
International
and
£0.7bn
relating
to
Private
Bank.
A
small
number
of
other
accounts
(3%
of
impairment
allowances
and
7%
of
gross
exposure)
are
included
in
Stage
2.
These
accounts
are
not
otherwise
identified
by
the
quantitative
or
qualitative
tests
but
are
more
than
30
day
s
past
due.
The
percentage
triggered
by
these
backstop
criteria
is
a
measure
of
the
effectiveness
of
the
Stage
2
criteria
in
identifying
deterioration
prior
to
delinquency.
These
balances
include
items
in
Corporate
and
Investment
Bank
for
reasons
such
as
outstanding
interest
and
fees
rather
than
principal
balances
.
For
further
detail
on
the
three
criteria
for
determining
a
significant
increase
in
credit
risk
required
for
Stage
2
classification,
refer
to
Note
7.
Stage
3
decomposition
Loans
and
advances
at
amortised
cost
2019
2018
Gross
Exposure
Impairment
allowance
Gross
Exposure
Impairment
allowance
As
at
31
December
£m
£m
Exposures
not
charged
-off
including
within
cure
period
a
1,429
490
1,410
509
Exposures
individually
assessed
or
in
recovery
book
b
2,919
1,656
2,779
1,590
Total
Stage
3
4,348
2,146
4,189
2,099
Notes
a
Includes
£0.6bn
of
gross
exposure
in
a
cure
period
that
must
remain
in
Stage
3
for
a
minimum
of
12
months
before
moving
to
Stage
2.
b
Exposures
individually
assessed
or
in
recovery
book
cannot
cure
out
of
Stage
3.
Management
adjustments
to
models
for
impairment
(audited)
Management
adjustments
to
impairment
models
are
applied
in
order
to
factor
in
certain
conditions
or
changes
in
policy
that
are
not
fully
incorporated
into
the
impairment
models,
or
to
reflect
additional
facts
and
circumstances
at
the
period
end.
Management
adjustments
are
reviewed
and
incorporated
into
future
model
development
where
applicable.
Total
management
adjustments
to
impairment
allowance
are
presented
by
product
below.
Management
adjustments
to
models
for
impairment
(audited)
a
2019
2018
Management
adjustments
to
impairment
allowances
Proportion
of
total
impairment
allowances
Management
adjustments
to
impairment
allowances
Proportion
of
total
impairment
allowances
As
at
31
December
£m
%
£m
%
Home
loans
-
-
4
1.1
Credit
cards,
unsecured
loans
and
other
retail
lending
3
0.1
(18)
(0.7)
Wholesale
loans
(40)
(5.5)
(12)
(1.7)
Total
(37)
(1.0)
(26)
(0.7)
Note
a
Positive
values
relate
to
an
in
crease
in
impairment
allowance.
Risk
review
Risk
performance
Credit
risk
Barclays
Bank
PLC
2019
Annual
Report
on
Form
20-F
55
Credit
cards,
unsecured
loans
and
other
retail
lending:
the
US
Cards
portfolio
to
account
for
changes
in
the
modelled
lifetime
of
credit
cards
in
Stage
2.
This
adjustment
will
be
removed
once
updates
to
the
model
have
been
incorporated.
Wholesale
loans:
adjustments
in
CIB
related
to
Probability
of
Default
at
origination
and
Loss
Given
Default
floors.
A
£50m
ECL
adjustment
is
held
in
CIB
for
the
anticipated
impact
of
economic
uncertainty
in
the
UK,
first
taken
in
December
2018
and
retained
as
at
2019
year
-
end.
Measurement
uncertainty
and
sensitivity
analysis
The
measurement
of
ECL
involves
complexity
and
judgement,
including
estimation
of
probabilities
of
default
(PD),
loss
given
default
(LGD),
a
range
of
unbiased
future
economic
scenarios,
estimation
of
expected
lives,
estimation
of
exposures
at
default
(EAD)
and
assessing
significant
increases
in
credit
risk.
The
Barclays
Bank
Group
uses
a
five-
scenario
model
to
calculate
ECL.
An
external
consensus
foreca
st
is
assembled
from
key
sources,
including
HM
Treasury
(short
and
medium
term
forecasts)
,
Bloomberg
(based
on
median
of
economic
forecasters)
and
the
Urban
Land
Institute
(for
US
House
Prices)
,
which
forms
the
B
aseline
scenario.
In
addition,
two
adverse
scenarios
(Downside
1
and
Downside
2)
and
two
favourable
scenarios
(Upside
1
and
Upside
2)
are
derived,
with
associated
probability
weightings.
The
adverse
scenarios
are
calibrated
to
a
similar
severity
to
internal
stress
tests,
whilst
also
considering
IFR
S
9
specific
sensitivities
and
non
-
linearity.
Downside
2
is
benchmarked
to
the
Bank
of
England’s
annual
cyclical
scenarios
and
to
the
most
severe
scenario
from
Moody’s
inventory,
but
is
not
designed
to
be
the
same.
The
favourable
scenarios
are
calibrated
to
be
symmetric
to
the
adverse
scenarios,
subject
to
a
ceiling
calibrated
to
relevant
recent
favourable
benchmark
scenarios.
All
scenarios
are
regenerated
at
a
minimum
annually.
The
scenarios
include
eight
economic
variables,
(GDP,
unemployment,
House
Price
Index
(HPI)
and
base
rates
in
both
the
UK
and
US
markets),
and
expanded
variables
using
statistical
models
ba
sed
on
historical
correlations.
The
upside
and
downside
shocks
are
designed
to
evolve
over
a
five-
year
stress
horizon,
with
all
five
scenarios
con
verging
to
a
steady
state
after
approximately
eight
years.
Scenario
weights
(audited)
The
methodology
for
estimating
probability
weights
for
each
of
the
scenarios
involves
a
comparison
of
the
distribution
of
key
historical
UK
and
US
macroeconomic
variables
against
the
forecast
paths
of
the
five
scenarios.
The
m
ethodology
works
such
that
the
B
aseline
(reflecting
current
consensus
outlook)
has
the
highest
weight
and
the
weights
of
adverse
and
favourable
scenarios
de
pend
on
the
deviation
from
the
Baseline;
the
further
from
the
B
aseline,
the
smaller
the
weight.
This
is
reflected
in
the
table
below
where
the
probability
weights
of
the
scenarios
as
of
31
December
2019
are
shown.
A
single
set
of
five
scenarios
is
used
across
all
po
rtfolios
and
all
five
weights
are
normalised
to
equate
to
100%.
The
same
scenarios
and
weights
that
are
used
in
the
estimation
of
expected
credit
losses
are
also
used
for
the
Barclays
Bank
Group
internal
planning
purposes.
The
impacts
across
the
portfolios
are
different
because
of
the
sensitivities
of
each
of
the
portfolios
to
specific
macroeconomic
variables,
for
example,
mortgages
are
highly
sensitive
to
house
prices
and
base
rates,
credit
cards
and
unsecured
consumer
loans
are
highly
sensitive
to
unemployment.
The
tables
below
show
the
macroeconomic
variables
for
each
scenario
and
their
respective
scenario
weights.
Macroeconomic
variables
are
presented
using
the
most
relevant
basis
for
each
variable.
5
-
year
average
tables
and
movement
over
time
graphs
provide
additional
transparency.
Scenario
probability
weighting
(audited)
Upside
2
Upside
1
Baseline
Downside
1
Downside
2
As
at
31
December
2019
Scenario
probability
weighting
10.1
23.1
40.8
22.7
3.3
As
at
31
December
2018
Scenario
probability
weighting
9.0
24.0
41.0
23.0
3.0
The
weights
of
Upside
2
and
Downside
2
have
increased
slightly
reflecting
the
small
decrease
in
dispersion
in
the
scenarios.
The
impact
on
ECL
is
immaterial.
Risk
review
Risk
performance
Credit
risk
Barclays
Bank
PLC
2019
Annual
Report
on
Form
20-F
56
Macroeconomic
variables
used
in
the
calculation
of
ECL
(specific
bases)
(audited)
a
Upside
2
Upside
1
Baseline
Downside
1
Downside
2
As
at
31
December
2019
UK
GDP
b
4.2
2.9
1.6
0.2
(4.7)
UK
unemployment
c
3.4
3.8
4.2
5.7
8.7
UK
HPI
d
46.0
32.0
3.1
(8.2)
(32.4)
UK
bank
rate
c
0.5
0.5
0.7
2.8
4.0
US
GDP
b
4.2
3.3
1.9
0.4
(3.4)
US
unemployment
c
3.0
3.5
3.9
5.3
8.5
US
HPI
d
37.1
23.3
3.0
0.5
(19.8)
US
federal
funds
rate
c
1.5
1.5
1.7
3.0
3.5
As
at
31
December
2018
UK
GDP
b
4.5
3.1
1.7
0.3
(4.1)
UK
unemployment
c
3.4
3.9
4.3
5.7
8.8
UK
HPI
d
46.4
32.6
3.2
(0.5)
(32.1)
UK
bank
rate
c
0.8
0.8
1.0
2.5
4.0
US
GDP
b
4.8
3.7
2.1
0.4
(3.3)
US
unemployment
c
3.0
3.4
3.7
5.2
8.4
US
HPI
d
36.9
30.2
4.1
-
(17.4)
US
federal
funds
rate
c
2.3
2.3
2.7
3.0
3.5
Macroeconomic
variables
used
in
the
calculation
of
ECL
(5
-year
averages)
(audited)
a
Upside
2
Upside
1
Baseline
Downside
1
Downside
2
As
at
31
December
2019
UK
GDP
3.2
2.4
1.6
0.8
(0.7)
UK
unemployment
3.5
3.9
4.2
5.4
7.7
UK
HPI
7.9
5.7
3.1
(1.1)
(6.5)
UK
bank
rate
0.5
0.5
0.7
2.5
3.7
US
GDP
3.5
2.8
1.9
1.0
(0.5)
US
unemployment
3.1
3.6
3.9
5.0
7.5
US
HPI
6.5
4.3
3.0
1.3
(3.7)
US
federal
funds
rate
1.6
1.7
1.7
2.9
3.4
As
at
31
December
2018
UK
GDP
3.4
2.6
1.7
0.9
(0.6)
UK
unemployment
3.7
4.0
4.3
5.1
7.9
UK
HPI
7.9
5.8
3.2
0.9
(6.4)
UK
bank
rate
0.8
0.8
1.0
2.3
3.7
US
GDP
3.7
3.0
2.1
1.1
(0.5)
US
unemployment
3.1
3.5
3.7
4.7
7.4
US
HPI
6.5
5.4
4.1
2.4
(2.6)
US
federal
funds
rate
2.3
2.3
2.7
3.0
3.4
Notes
a
UK
GDP
=
Real
GDP
growth
seasonally
adjusted;
UK
unemployment
=
UK
unemployment
rate
16-year+;
UK
HPI
=
Halifax
All
Houses,
All
Buyers
Index;
US
GDP
=
Real
GDP
growth
seasonally
adjusted;
US
unemployment
=
US
civilian
unemployment
rate
16-year+;
US
HPI
=
FHFA
house
price
index.
b
Highest
annual
growth
in
Upside
scenarios;
5-year
average
in
Baseline;
lowest
annual
growth
in
Downside
scenarios.
c
Lowest
yearly
average
in
Upside
scenarios;
5-year
average
in
Baseline;
highest
yearly
average
in
Downside
scenarios.
d
Cumulative
growth
(trough
to
peak)
in
Upside
scenarios;
5-year
average
in
Baseline;
cumulative
fall
(peak-to-trough)
in
Downside
scenarios.
Over
the
year,
the
macroeconomic
baseline
variables
have
worsened
in
the
US,
in
part
due
to
the
trade
dispute
with
Ch
ina.
Baseline
expectations
for
the
US
federal
funds
rate
have
also
moved
lower
from
2.7%
to
1.7%
averaged
over
the
first
five
years.
Macroeconomic
baseline
variables
in
the
UK
have
remained
fairly
flat
with
a
small
decrease
in
bank
rates
driven
by
market
expectations
of
lower
interest
rates
in
the
next
few
years.
The
other
scenarios
are
generally
unchanged
from
2018,
with
the
exception
of
UK
HPI
in
the
Downside
1
scenario
where
the
cumulative
fall
in
house
prices
now
represents
a
mo
re
severe
fall
of
8.2%
versus
0.5%
in
2018.
The
graphs
below
plot
the
historical
data
for
GDP
growth
rate
and
unemployment
rate
in
the
UK
and
US
as
well
as
the
forecasted
data
under
each
of
the
five
scenarios.


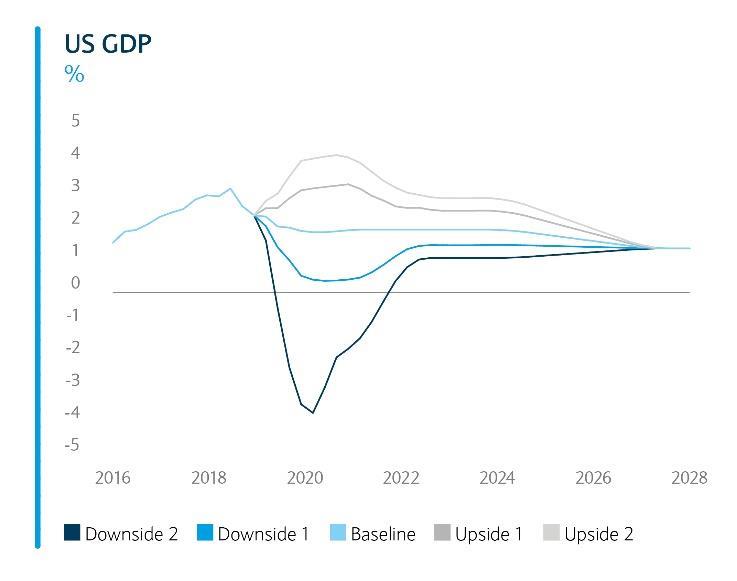
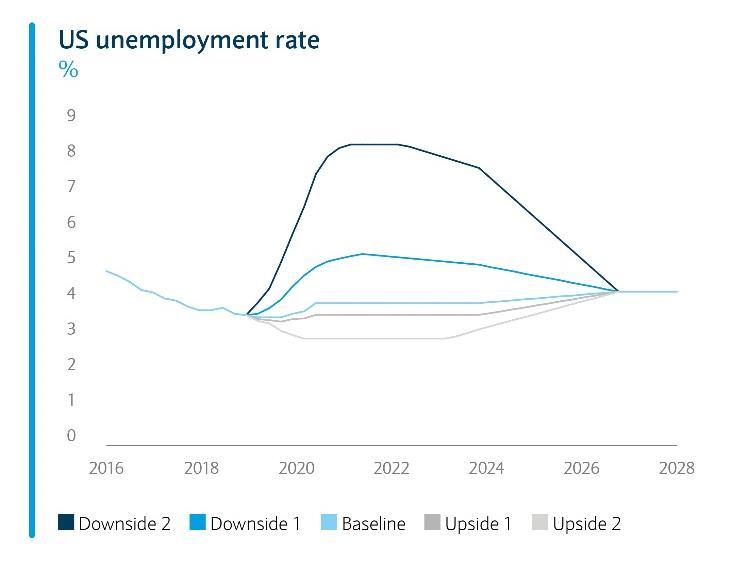
Risk
review
Risk
performance
Credit
risk
Barclays
Bank
PLC
2019
Annual
Report
on
Form
20-F
57
ECL
under
100%
weighted
scenarios
for
modelled
portfolios
(audited)
The
table
below
shows
the
Expected
Credit
Risk
(ECL)
assuming
scenarios
have
been
100
%
weighted.
Model
exposures
are
allocated
to
a
stage
based
on
the
individual
scenario
rather
than
through
a
probability
-
weighted
approach
as
required
for
Barclays
reported
impairment
allowances.
As
a
result,
it
is
not
possible
to
back
solve
to
the
final
re
ported
weighted
ECL
from
the
individual
scenarios
as
a
balance
may
be
assigned
to
a
different
stage
dependent
on
the
scenario.
Model
exposure
uses
Exposure
at
default
(EAD)
values
and
is
not
directly
comparable
to
gross
exposure
used
in
prior
disclosures.
For
Credit
cards,
unsecured
loans
and
other
retail
lending,
an
average
EAD
measure
is
used
(12
month
or
lifetime
depending
on
stage
allocation
in
each
scenario).
Therefore,
the
model
exposure
movement
into
Stage
2
is
higher
than
the
corresponding
Stage
1
r
eduction.
All
ECL
using
a
model
is
included,
with
the
ex
ception
of
Treasury
assets
(£7.7
m
of
ECL),
providing
additional
coverage
as
compared
to
the
2018
year
-
end
disclosure.
Non
-
modelled
exposures
and
management
adjustments
are
excluded.
Management
adjustments
can
be
found
on
page
54
.
The
prior
year
comparative
includes
key
principal
portfolios
amounting
to
circa
80%
of
total
impairment
allowance.
Model
Exposures
allocated
to
Stage
3
do
not
change
in
any
of
the
scenarios
as
the
transition
criteria
relies
only
on
observable
evidence
of
default
as
at
31
December
2019
and
not
on
macroeconomic
scenarios.
The
Downside
2
scenario
represents
a
severe
globa
l
recession
with
substantial
falls
in
UK
GDP.
Unemployment
rises
towards
9%
and
there
are
substantial
falls
in
asset
prices
including
housing.
Under
the
Downside
2
scenario,
model
exposure
moves
between
stages
as
the
economic
environment
weakens.
This
can
be
seen
in
the
movement
of
£17bn
of
model
exposure
into
Stage
2
between
the
Weighted
and
Downside
2
scenario.
ECL
increases
in
Stage
2
predominantly
due
to
unsecured
portfolios
as
economic
conditions
deteriorate.
Risk
review
Risk
performance
Credit
risk
Barclays
Bank
PLC
2019
Annual
Report
on
Form
20-F
58
Scenarios
As
at
31
December
2019
Weighted
Upside
2
Upside
1
Baseline
Downside
1
Downside
2
Stage
1
Model
Exposure
(£m)
Home
loans
4,887
4,902
4,894
4,887
4,876
4,863
Credit
cards,
unsecured
loans
and
other
retail
lending
37,599
37,361
37,534
37,269
37,921
38,414
Wholesale
loans
141,272
142,393
142,125
141,806
139,227
126,882
Stage
1
Model
ECL
(£m)
Home
loans
5
4
4
5
5
5
Credit
cards,
unsecured
loans
and
other
retail
lending
350
344
347
342
349
356
Wholesale
loans
184
141
152
164
244
268
Stage
1
Coverage
(%)
Home
loans
0.1
0.1
0.1
0.1
0.1
0.1
Credit
cards,
unsecured
loans
and
other
retail
lending
0.9
0.9
0.9
0.9
0.9
0.9
Wholesale
loans
0.1
0.1
0.1
0.1
0.2
0.2
Stage
2
Model
Exposure
(£m)
Home
loans
511
496
505
512
522
535
Credit
cards,
unsecured
loans
and
other
retail
lending
4,228
3,350
3,540
4,025
5,615
7,204
Wholesale
loans
13,099
11,979
12,246
12,566
15,145
27,489
Stage
2
Model
ECL
(£m)
Home
loans
36
32
34
35
41
47
Credit
cards,
unsecured
loans
and
other
retail
lending
784
584
638
739
1,115
2,450
Wholesale
loans
352
253
280
314
493
1,240
Stage
2
Coverage
(%)
Home
loans
7.1
6.6
6.7
6.8
7.8
8.8
Credit
cards,
unsecured
loans
and
other
retail
lending
18.5
17.4
18.0
18.4
19.8
34.0
Wholesale
loans
2.7
2.1
2.3
2.5
3.3
4.5
Stage
3
Model
Exposure
(£m)
Home
loans
711
711
711
711
711
711
Credit
cards,
unsecured
loans
and
other
retail
lending
1,697
1,697
1,697
1,697
1,697
1,697
Wholesale
loans
a
279
279
279
279
279
279
Stage
3
Model
ECL
(£m)
Home
loans
260
258
259
260
261
264
Credit
cards,
unsecured
loans
and
other
retail
lending
1,382
1,367
1,374
1,380
1,395
1,418
Wholesale
loans
a
3
2
2
3
4
5
Stage
3
Coverage
(%)
Home
loans
36.5
36.3
36.4
36.5
36.7
37.2
Credit
cards,
unsecured
loans
and
other
retail
lending
81.5
80.5
81.0
81.3
82.2
83.6
Wholesale
loans
a
1.0
0.8
0.9
0.9
1.3
1.9
Total
Model
ECL
(£m)
Home
loans
301
294
297
300
307
316
Credit
cards,
unsecured
loans
and
other
retail
lending
2,516
2,295
2,359
2,461
2,859
4,224
Wholesale
loans
a
539
396
434
481
741
1,513
Note
a
Material
wholesale
loan
defaults
are
individually
assessed
across
different
recovery
strategies.
As
a
result,
ECL
of
£398m
is
reported
as
non-
model
led
in
the
table
below.
Risk
review
Risk
performance
Credit
risk
Barclays
Bank
PLC
2019
Annual
Report
on
Form
20-F
59
Reconciliation
to
total
ECL
£m
Total
model
ECL
3,355
ECL
from
non
-modelled,
individually
assessed,
and
other
adjustments
630
ECL
from
management
adjustments
(37)
Total
ECL
3,948
The
total
weighted
ECL
represents
a
4%
uplift
from
the
Baseline
ECL,
largely
driven
by
wholesale
loans.
Home
loans:
Credit
cards,
unsecured
loans
and
other
retail
lending:
reflecting
the
range
of
economic
scenarios
used,
mainly
impacted
by
Unemployment.
Total
ECL
increases
to
£4,22
4
m
under
Downside
2
scenario,
mainly
driven
by
Stage
2,
wh
ere
coverage
rates
increase
to
3
4.0
%
from
a
weighted
scenario
approach
of
18
.5%
and
a
£
3bn
increase
in
model
exposure
that
meets
the
Significant
Increase
in
Credit
Risk
criteria
and
tran
sitions
from
Stage
1
to
Stage
2.
Wholesale
loans:
scenarios
used,
with
exposures
in
the
Investment
Bank
particularly
sensitive
to
Downside
2
scenario.
Risk
review
Risk
performance
Credit
risk
Barclays
Bank
PLC
2019
Annual
Report
on
Form
20-F
60
Scenarios
As
at
31
December
2018
Weighted
Upside
2
Upside
1
Baseline
Downside
1
Downside
2
Stage
1
Gross
Exposure
(£m)
Credit
cards,
unsecured
loans
and
other
retail
lending
15,399
16,345
15,629
15,437
15,063
12,125
Wholesale
loans
80,835
81,346
81,180
80,941
80,517
73,715
Stage
1
ECL
(£m)
Credit
cards,
unsecured
loans
and
other
retail
lending
208
168
202
205
212
231
Wholesale
loans
175
161
163
162
203
242
Stage
1
Coverage
(%)
Credit
cards,
unsecured
loans
and
other
retail
lending
1.4
1.0
1.3
1.3
1.4
1.9
Wholesale
loans
0.2
0.2
0.2
0.2
0.3
0.3
Stage
2
Gross
Exposure
(£m)
Credit
cards,
unsecured
loans
and
other
retail
lending
4,084
3,138
3,853
4,046
4,420
7,358
Wholesale
loans
11,377
10,866
11,031
11,271
11,694
18,496
Stage
2
ECL
(£m)
Credit
cards,
unsecured
loans
and
other
retail
lending
937
719
830
901
1,111
2,414
Wholesale
loans
323
277
290
302
397
813
Stage
2
Coverage
(%)
Credit
cards,
unsecured
loans
and
other
retail
lending
22.9
22.9
21.5
22.3
25.1
32.8
Wholesale
loans
2.8
2.5
2.6
2.7
3.4
4.4
Stage
3
Gross
Exposure
(£m)
Credit
cards,
unsecured
loans
and
other
retail
lending
1,396
1,396
1,396
1,396
1,396
1,396
Wholesale
loans
a
1,165
n/a
n/a
1,165
n/a
n/a
Stage
3
ECL
(£m)
Credit
cards,
unsecured
loans
and
other
retail
lending
1,181
1,168
1,174
1,181
1,189
1,207
Wholesale
loans
a
333
n/a
n/a
323
n/a
n/a
Stage
3
Coverage
(%)
Credit
cards,
unsecured
loans
and
other
retail
lending
84.6
83.7
84.1
84.6
85.2
86.5
Wholesale
loans
a
28.6
n/a
n/a
27.7
n/a
n/a
Total
ECL
(£m)
Credit
cards,
unsecured
loans
and
other
retail
lending
2,326
2,055
2,206
2,287
2,512
3,852
Wholesale
loans
a
831
n/a
n/a
787
n/a
n/a
Note
a
Material
corporate
loan
defaults
are
individually
assessed
across
different
recovery
strategies
which
are
impacted
by
the
macroeconomic
variables.
As
a
result,
only
the
Baseline
scenario
is
shown
together
with
the
weighted
estimate
which
reflects
alternative
recovery
paths.
Staging
sensitivity
(audited)
An
increase
of
1%
(£1,4
53
m)
of
total
gross
exposure
into
Stage
2
(from
Stage
1),
would
result
in
an
increase
in
ECL
impairment
allowance
of
£1
16
m
based
on
applying
the
difference
in
Stage
2
and
Stage
1
average
impairment
coverage
ratios
to
the
movement
in
gross
exposure
(refer
to
Loans
and
advances
at
amo
rtised
cost
by
product
on
page
49
).
Risk
review
Risk
performance
Credit
risk
Barclays
Bank
PLC
2019
Annual
Report
on
Form
20-F
61
Analysis
of
the
concentration
of
credit
risk
A
concentration
of
credit
risk
exists
when
a
number
of
counterparties
are
located
in
a
common
geographical
region
or
are
engaged
in
similar
activities
and
have
similar
economic
characteristics
that
would
cause
their
ability
to
meet
contractual
obligations
to
be
similarly
affected
by
changes
in
economic
or
other
conditions.
Barclays
Bank
Group
implements
limits
on
concentrations
in
order
to
mitigate
the
risk.
The
analyses
of
credit
risk
concentrations
prese
nted
below
are
based
on
the
location
of
the
counterparty
or
customer
or
the
ind
ustry
in
which
they
are
engaged
.
Geographic
concentrations
Exposure
is
concentrated
in
the
Americas
43%
(2018:
43%),
in
the
UK
26%
(2018:
26%)
and
Europe
24%
(2018:
25
%).
Credit
risk
concentrations
by
geography
(audited)
Barclays
Bank
Group
United
Kingdom
Americas
Europe
Asia
Africa
and
Middle
East
Total
As
at
31
December
2019
£m
£m
£m
£m
£m
£m
On-balance
sheet:
Cash
and
balances
at
central
banks
29,791
28,273
52,003
15,128
745
125,940
Cash
collateral
and
settlement
balances
23,775
23,593
25,955
5,326
837
79,486
Loans
and
advances
at
amortised
cost
62,568
45,863
24,450
5,881
2,874
141,636
Reverse
repurchase
agreements
and
other
similar
secured
lending
12
15
401
470
833
1,731
Trading
portfolio
assets
11,538
27,249
12,922
4,786
763
57,258
Financial
assets
at
fair
value
through
the
income
statement
26,363
70,832
11,272
12,534
1,921
122,922
Derivative
financial
instruments
70,256
63,337
83,165
11,189
1,694
229,641
Financial
assets
at
fair
value
through
other
comprehensive
income
8,383
16,092
17,884
2,945
101
45,405
Other
assets
407
124
81
2
-
614
Total
on
-balance
sheet
233,093
275,378
228,133
58,261
9,768
804,633
Off-balance
sheet:
Contingent
liabilities
6,789
10,838
3,862
1,562
726
23,777
Loan
commitments
39,247
192,857
33,182
3,130
1,611
270,027
Total
off-balance
sheet
46,036
203,695
37,044
4,692
2,337
293,804
Total
279,129
479,073
265,177
62,953
12,105
1,098,437
As
at
31
December
2018
On-balance
sheet:
Cash
and
balances
at
central
banks
39,143
36,045
51,395
9,064
712
136,359
Cash
collateral
and
settlement
balances
24,611
22,184
22,309
4,872
376
74,352
Loans
and
advances
at
amortised
cost
54,700
46,799
27,470
4,952
3,038
136,959
Reverse
repurchase
agreements
and
other
similar
secured
lending
45
68
97
83
1,320
1,613
Trading
portfolio
assets
12,296
34,369
13,374
3,616
713
64,368
Financial
assets
at
fair
value
through
the
income
statement
30,305
73,475
20,984
13,556
1,758
140,078
Derivative
financial
instruments
69,943
58,699
80,003
12,172
1,866
222,683
Financial
investments
-
debt
securities
9,529
10,959
21,546
2,786
163
44,983
Other
assets
448
110
137
3
1
699
Total
on
-balance
sheet
241,020
282,708
237,315
51,104
9,947
822,094
Off-balance
sheet:
Contingent
liabilities
5,001
8,996
3,572
1,289
536
19,394
Loan
commitments
42,224
175,951
34,447
3,310
1,836
257,768
Total
off-balance
sheet
47,225
184,947
38,019
4,599
2,372
277,162
Total
288,245
467,655
275,334
55,703
12,319
1,099,256
Risk
review
Risk
performance
Credit
risk
Barclays
Bank
PLC
2019
Annual
Report
on
Form
20-F
62
Industry
concentrations
Total
assets
concentrated
in
banks
and
other
financial
institutions
is
46%
(2018:
4
6%),
predominantly
within
derivative
financial
instruments
and
financial
assets.
The
proportion
of
the
overall
balance
concentrated
in
gov
ernments
and
central
banks
is
20%
(2018:
21
%).
Credit
risk
concentrations
by
industry
(audited)
Barclays
Bank
Group
Banks
Other
financial
insti-
tutions
Manu
-
facturing
Const
-
ruction
and
property
Govern-
ment
and
central
bank
Energy
and
water
Wholesale
and
retail
distribution
Business
and
other
services
Home
loans
Cards,
unsecured
loans
and
other
personal
lending
Other
Total
As
at
31
December
2019
£m
£m
£m
£m
£m
£m
£m
£m
£m
£m
£m
£m
On
-balance
sheet:
Cash
and
balances
at
central
banks
4
-
-
-
125,936
-
-
-
-
-
-
125,940
Cash
collateral
and
settlement
balances
16,638
54,582
516
64
6,122
536
51
642
-
-
335
79,486
Loans
and
advances
at
amortised
cost
9,185
20,230
7,940
13,610
11,402
5,278
8,226
14,588
10,986
33,560
6,631
141,636
Reverse
repurchase
agreements
and
other
similar
secured
lending
1,172
486
-
-
73
-
-
-
-
-
-
1,731
Trading
portfolio
assets
2,806
9,050
2,787
1,053
32,298
2,996
842
3,158
-
-
2,268
57,258
Financial
assets
at
fair
value
through
the
income
statement
11,694
97,824
620
3,609
5,340
37
-
3,318
358
-
122
122,922
Derivative
financial
instruments
125,612
83,286
2,049
2,273
7,811
3,077
562
1,635
-
2
3,334
229,641
Financial
assets
at
fair
value
through
other
comprehensive
income
13,158
2,938
-
208
28,489
-
-
415
-
-
197
45,405
Other
assets
180
312
1
-
2
7
-
104
-
2
6
614
Total
on
-balance
sheet
180,449
268,708
13,913
20,817
217,473
11,931
9,681
23,860
11,344
33,564
12,893
804,633
Off
-balance
sheet:
Contingent
liabilities
1,250
8,043
3,549
703
1,231
3,318
1,072
2,831
-
109
1,671
23,777
Loan
commitments
1,861
47,619
42,001
13,358
1,703
29,865
14,320
22,491
49
73,573
23,187
270,027
Total
off
-balance
sheet
3,111
55,662
45,550
14,061
2,934
33,183
15,392
25,322
49
73,682
24,858
293,804
Total
183,560
324,370
59,463
34,878
220,407
45,114
25,073
49,182
11,393
107,246
37,751
1,098,437
As
at
31
December
2018
On
-balance
sheet:
Cash
and
balances
at
central
banks
-
-
-
-
136,359
-
-
-
-
-
-
136,359
Cash
collateral
and
settlement
balances
17,294
48,340
498
75
6,470
386
223
717
-
-
349
74,352
Loans
and
advances
at
amortised
cost
9,692
17,734
8,379
13,143
3,474
5,442
9,678
17,222
13,160
32,818
6,217
136,959
Reverse
repurchase
agreements
and
other
similar
secured
lending
1,369
169
-
37
38
-
-
-
-
-
-
1,613
Trading
portfolio
assets
3,502
9,550
3,825
897
34,817
4,202
1,202
3,481
-
-
2,892
64,368
Financial
assets
at
fair
value
through
the
income
statement
30,374
96,708
-
5,371
5,295
31
13
1,881
405
-
-
140,078
Derivative
financial
instruments
123,999
80,302
2,390
1,974
5,987
2,791
486
2,012
-
-
2,742
222,683
Financial
assets
at
fair
value
through
other
comprehensive
income
11,066
1,880
-
200
31,701
-
-
136
-
-
-
44,983
Other
assets
288
411
-
-
-
-
-
-
-
-
-
699
Total
on
-balance
sheet
197,584
255,094
15,092
21,697
224,141
12,852
11,602
25,449
13,565
32,818
12,200
822,094
Off
-balance
sheet:
Contingent
liabilities
939
3,841
3,470
626
980
3,491
952
3,445
-
116
1,524
19,384
Loan
commitments
1,265
42,844
39,827
12,280
1,629
26,520
14,127
21,702
1,409
71,781
24,384
257,768
Total
off
-balance
sheet
2,204
46,685
43,297
12,906
2,609
30,011
15,079
25,147
1,409
71,897
25,908
277,162
Total
199,788
301,779
58,389
34,603
226,750
42,863
26,681
50,606
14,974
104,715
38,108
1,099,256
Risk
review
Risk
performance
Credit
risk
Barclays
Bank
PLC
2019
Annual
Report
on
Form
20-F
63
Approach
to
management
and
representation
of
credit
quality
Asset
credit
quality
The
credit
quality
distribution
is
based
on
the
IFRS
9
12
month
probability
of
default
(PD)
at
the
reporting
date
to
ensure
comparability
with
other
ECL
disclosures
on
pages
49
to
54.
The
Barclays
Bank
Group
uses
the
following
internal
measures
to
determine
credit
quality
for
loans:
Retail
and
Wholesale
lending
Default
Grade
Probability
of
default
Credit
Quality
Description
1
-
3
0.0
to
<
0.05%
Strong
4
-
5
0.05
to
<
0.15%
6
-
8
0.15
to
<
0.30%
9
-
11
0.30
to
<
0.60%
12
-
14
0.60
to
<
2.15%
Satisfactory
15
-
19
19
20
-
21
Higher
Risk
22
100%
Credit
Impaired
For
retail
clients,
a
range
of
analytical
tools
is
used
to
derive
the
probability
of
default
of
clients
at
inception
and
on
an
ongoing
basis.
T
hese
credit
quality
descriptions
can
be
summarised
as
follows:
Strong:
Satisfactory:
asset
may
not
be
collateralised,
o
r
may
relate
to
unsecured
retail
facilities.
At
the
lower
end
of
this
grade
there
are
customers
that
are
being
more
carefully
monitored,
for
example,
corporate
customers
which
are
indicating
some
evidence
of
deterioration,
mortgages
with
a
high
loan
to
value,
and
unsecured
retail
loans
operating
outside
normal
product
guidelines.
Higher
risk:
There
may
also
be
doubts
over
the
value
of
collateral
or
security
provided.
However,
the
borrower
or
counterparty
is
continuing
to
make
payments
when
due
and
is
expected
to
settle
all
outstanding
amounts
of
principal
and
interest.
Debt
securities
For
assets
held
at
fair
value,
the
carryin
g
value
on
the
balance
sheet
will
include,
among
other
things,
the
credit
risk
of
the
issuer.
Most
listed
and
some
unlisted
securities
are
rated
by
external
rating
agencies.
The
Barclays
Bank
Group
mainly
uses
external
credit
ratings
provided
by
Standard
&
Poor’s,
Fitch
or
Moody’s
.
Where
such
ratings
are
not
available
or
are
not
current,
the
Barclays
Bank
Group
will
use
its
own
internal
ratings
for
the
securities.
Balance
sheet
credit
quality
The
following
tables
present
the
credit
quality
of
Barclays
Bank
Group
assets
exposed
to
credit
risk.
Overview
As
at
31
December
2019
,
the
ratio
of
the
Barclays
Bank
Group’s
on
-
balance
sheet
assets
classified
as
strong
(0.0
<
0.60%)
remained
stable
at
85
%
(2018:
86
%)
of
total
assets
exposed
to
credit
risk.
Risk
review
Risk
performance
Credit
risk
Barclays
Bank
PLC
2019
Annual
Report
on
Form
20-F
64
Balance
sh
eet
credit
quality
(audited)
Barclays
Bank
Group
PD
Range
0.0
to
<0.60%
0.60
to
<11.35%
11.35%
to
100%
Total
0.0
to
<0.60%
0.60
to
<11.35%
11.35%
to
100%
Total
As
at
31
December
2019
£m
£m
£m
£m
%
%
%
%
Cash
and
balances
at
central
banks
125,940
-
-
125,940
100
-
-
100
Cash
collateral
and
settlement
balances
69,351
10,135
-
79,486
87
13
-
100
Loans
and
advances
at
amortised
cost
Home
loans
7,536
2,626
824
10,986
68
24
8
100
Credit
cards,
unsecured
loans
and
other
retail
lending
13,631
18,019
1,853
33,503
40
54
6
100
Wholesale
loans
75,638
19,716
1,793
97,147
78
20
2
100
Total
loans
and
advances
at
amortised
cost
96,805
40,361
4,470
141,636
69
28
3
100
Reverse
repurchase
agreements
and
other
similar
secured
lending
1,642
89
-
1,731
95
5
-
100
Trading
portfolio
assets:
Debt
securities
48,258
3,479
143
51,880
93
7
-
100
Traded
loans
864
3,219
1,295
5,378
16
60
24
100
Total
trading
portfolio
assets
49,122
6,698
1,438
57,258
85
12
3
100
Financial
assets
at
fair
value
through
the
income
statement:
Loans
and
advances
11,030
7,880
227
19,137
58
41
1
100
Debt
securities
4,786
404
30
5,220
91
8
1
100
Reverse
repurchase
agreements
63,411
34,232
180
97,823
65
35
-
100
Other
financial
assets
736
6
-
742
99
1
-
100
Total
financial
assets
at
fair
value
through
the
income
statement
79,963
42,522
437
122,922
65
35
-
100
Derivative
financial
instruments
216,508
13,012
121
229,641
94
6
-
100
Financial
assets
at
fair
value
through
other
comprehensive
income
45,405
-
-
45,405
100
-
-
100
Other
assets
501
113
-
614
82
18
-
100
Total
on
-balance
sheet
685,237
112,930
6,466
804,633
85
14
1
100
As
at
31
December
2018
Cash
and
balances
at
central
banks
136,359
-
-
136,359
100
-
-
100
Cash
collateral
and
settlement
balances
67,585
6,763
4
74,352
91
9
-
100
Loans
and
advances
at
amortised
cost
Home
loans
8,993
3,220
947
13,160
69
24
7
100
Credit
cards,
unsecured
loans
and
other
retail
lending
14,893
17,489
1,409
33,791
44
52
4
100
Wholesale
loans
65,080
23,562
1,366
90,008
72
26
2
100
Total
loans
and
advances
at
amortised
cost
88,966
44,271
3,722
136,959
65
32
3
100
Reverse
repurchase
agreements
and
other
similar
secured
lending
1,125
444
44
1,613
69
28
3
100
Trading
portfolio
assets:
Debt
securities
51,747
4,998
389
57,134
90
9
1
100
Traded
loans
1,903
4,368
963
7,234
27
60
13
100
Total
trading
portfolio
assets
53,650
9,366
1,352
64,368
83
15
2
100
Financial
assets
at
fair
value
through
the
income
statement:
Loans
and
advances
9,487
6,109
48
15,644
61
39
-
100
Debt
securities
4,378
76
61
4,515
97
2
1
100
Reverse
repurchase
agreements
86,237
31,813
1,341
119,391
72
27
1
100
Other
financial
assets
524
4
-
528
99
1
-
100
Total
financial
assets
at
fair
value
through
the
income
statement
100,626
38,002
1,450
140,078
72
27
1
100
Derivative
financial
instruments
211,841
10,790
52
222,683
95
5
-
100
Financial
assets
at
fair
value
through
other
comprehensive
income
44,835
148
-
44,983
100
-
-
100
Other
assets
426
273
-
699
61
39
-
100
Total
on
-balance
sheet
705,413
110,057
6,624
822,094
86
13
1
100
Risk
review
Risk
performance
Credit
risk
Barclays
Bank
PLC
2019
Annual
Report
on
Form
20-F
65
Credit
exposures
by
internal
PD
grade
The
below
tables
represents
credit
risk
profile
by
PD
grade
for
loans
and
advances
at
amortised
cost,
contingent
liabilities
and
loan
commitments.
Stage
1
higher
risk
assets,
presented
gross
of
associated
collateral
held,
are
of
weaker
credit
quality
but
have
not
significantly
deteriorated
since
origination.
Examples
would
include
leveraged
corporate
loans
or
non
-
prime
credit
cards.
IFRS
9
Stage
1
and
Stage
2
classification
is
not
dependent
solely
on
the
absolute
probability
of
default
but
on
elements
that
determine
a
Significant
Increase
in
Credit
Risk
(see
Note
7
on
pg
115
),
including
relative
movement
in
probability
of
default
since
initial
recognition.
There
is
therefore
no
direct
relationship
between
credit
quality
and
IFRS
9
stage
classification.
Barclays
Bank
Group
As
at
31
December
2019
Credit
risk
profile
by
internal
PD
grade
for
loans
and
advances
at
amortised
cost
(audited)
Gross
carrying
amount
Allowance
for
ECL
Net
exposure
Coverage
ratio
PD
range
Credit
quality
description
Stage
1
Stage
2
Stage
3
Total
Stage
1
Stage
2
Stage
3
Total
Grading
%
£m
£m
£m
£m
£m
£m
£m
£m
£m
%
1
-
3
0.0
to
<
0.05%
Strong
37,430
564
-
37,994
9
15
-
24
37,970
0.1
4
-
5
0.05
to
<
0.15%
Strong
17,117
783
-
17,900
6
-
-
6
17,894
-
6
-
8
0.15
to
<
0.30%
Strong
15,020
581
-
15,601
16
1
-
17
15,584
0.1
9
-
11
0.30
to
<
0.60%
Strong
24,490
944
-
25,434
71
6
-
77
25,357
0.3
12
-
14
0.60
to
<
2.15%
Satisfactory
24,211
1,740
-
25,951
134
102
-
236
25,715
0.9
15
-
19
2.15
to
<
10%
Satisfactory
7,491
5,450
-
12,941
185
339
-
524
12,417
4.0
19
10
to
<
11.35%
Satisfactory
1,945
339
-
2,284
21
34
-
55
2,229
2.4
20
-
21
11.35
to
<
100%
Higher
Risk
641
2,238
-
2,879
50
561
-
611
2,268
21.2
22
100%
Credit
Impaired
-
-
4,348
4,348
-
-
2,146
2,146
2,202
49.4
Total
128,345
12,639
4,348
145,332
492
1,058
2,146
3,696
141,636
2.5
As
at
31
December
2018
Credit
risk
profile
by
internal
PD
grade
for
loans
and
advances
at
amortised
cost
(audited)
Gross
carrying
amount
Allowance
for
ECL
Net
exposure
Coverage
ratio
PD
range
Credit
quality
description
Stage
1
Stage
2
Stage
3
Total
Stage
1
Stage
2
Stage
3
Total
Grading
%
£m
£m
£m
£m
£m
£m
£m
£m
£m
%
1
-
3
0.0
to
<
0.05%
Strong
27,116
434
-
27,550
21
7
-
28
27,522
0.1
4
-
5
0.05
to
<
0.15%
Strong
17,651
556
-
18,207
2
1
-
3
18,204
-
6
-
8
0.15
to
<
0.30%
Strong
12,531
353
-
12,884
19
7
-
26
12,858
0.2
9
-
11
0.30
to
<
0.60%
Strong
29,577
880
-
30,457
64
11
-
75
30,382
0.2
12
-
14
0.60
to
<
2.15%
Satisfactory
28,638
3,344
-
31,982
178
139
-
317
31,665
1.0
15
-
19
2.15
to
<
10%
Satisfactory
5,696
5,101
-
10,797
163
404
-
567
10,230
5.3
19
10
to
<
11.35%
Satisfactory
1,141
1,307
-
2,448
15
57
-
72
2,376
2.9
20
-
21
11.35
to
<
100%
Higher
Risk
239
2,049
-
2,288
27
629
-
656
1,632
28.7
22
100%
Credit
Impaired
-
-
4,189
4,189
-
-
2,099
2,099
2,090
50.1
Total
122,589
14,024
4,189
140,802
489
1,255
2,099
3,843
136,959
2.7
As
at
31
December
2019
Credit
risk
profile
by
internal
PD
grade
for
contingent
liabilities
a
Gross
carrying
amount
Allowance
for
ECL
Net
exposure
Coverage
ratio
PD
range
Credit
quality
description
Stage
1
Stage
2
Stage
3
Total
Stage
1
Stage
2
Stage
3
Total
Grading
%
£m
£m
£m
£m
£m
£m
£m
£m
£m
%
1
-
3
0.0
to
<
0.05%
Strong
6,198
118
-
6,316
1
-
-
1
6,315
-
4
-
5
0.05
to
<
0.15%
Strong
4,199
40
-
4,239
1
-
-
1
4,238
-
6
-
8
0.15
to
<
0.30%
Strong
2,953
103
-
3,056
1
-
-
1
3,055
-
9
-
11
0.30
to
<
0.60%
Strong
4,551
136
-
4,687
2
2
-
4
4,683
0.1
12
-
14
0.60
to
<
2.15%
Satisfactory
2,529
654
-
3,183
7
8
-
15
3,168
0.5
15
-
19
2.15
to
<
10%
Satisfactory
663
244
-
907
4
8
-
12
895
1.3
19
10
to
<
11.35%
Satisfactory
421
172
-
593
9
9
-
18
575
3.0
20
-
21
11.35
to
<
100%
Higher
Risk
117
282
-
399
-
30
-
30
369
7.5
22
100%
Credit
Impaired
-
-
354
354
-
-
5
5
349
1.4
Total
21,631
1,749
354
23,734
25
57
5
87
23,647
0.4
Risk
review
Risk
performance
Credit
risk
Barclays
Bank
PLC
2019
Annual
Report
on
Form
20-F
66
As
at
31
December
2018
Credit
risk
profile
by
internal
PD
grade
for
contingent
liabilities
a
Gross
carrying
amount
Allowance
for
ECL
Net
exposure
Coverage
ratio
PD
range
Credit
quality
description
Stage
1
Stage
2
Stage
3
Total
Stage
1
Stage
2
Stage
3
Total
Grading
%
£m
£m
£m
£m
£m
£m
£m
£m
£m
%
1
-
3
0.0
to
<
0.05%
Strong
5,763
38
-
5,801
2
-
-
2
5,799
-
4
-
5
0.05
to
<
0.15%
Strong
3,687
129
-
3,816
1
-
-
1
3,815
-
6
-
8
0.15
to
<
0.30%
Strong
1,433
55
-
1,488
1
-
-
1
1,487
0.1
9
-
11
0.30
to
<
0.60%
Strong
3,206
222
-
3,428
1
3
-
4
3,424
0.1
12
-
14
0.60
to
<
2.15%
Satisfactory
2,544
509
-
3,053
4
5
-
9
3,044
0.3
15
-
19
2.15
to
<
10%
Satisfactory
464
252
-
716
1
3
-
4
712
0.6
19
10
to
<
11.35%
Satisfactory
534
203
-
737
6
5
-
11
726
1.5
20
-
21
11.35
to
<
100%
Higher
Risk
48
229
-
277
-
11
-
11
266
4.0
22
100%
Credit
Impaired
-
-
74
74
-
-
2
2
72
2.7
Total
17,679
1,637
74
19,390
16
27
2
45
19,345
0.2
As
at
31
December
2019
Credit
risk
profile
by
internal
PD
grade
for
loan
commitments
a
Gross
carrying
amount
Allowance
for
ECL
Net
exposure
Coverage
ratio
PD
range
Credit
quality
description
Stage
1
Stage
2
Stage
3
Total
Stage
1
Stage
2
Stage
3
Total
Grading
%
£m
£m
£m
£m
£m
£m
£m
£m
£m
%
1
-
3
0.0
to
<
0.05%
Strong
77,725
990
-
78,715
4
-
-
4
78,711
-
4
-
5
0.05
to
<
0.15%
Strong
53,910
1,480
-
55,390
3
-
-
3
55,387
-
6
-
8
0.15
to
<
0.30%
Strong
43,728
811
-
44,539
6
1
-
7
44,532
-
9
-
11
0.30
to
<
0.60%
Strong
28,813
1,294
-
30,107
10
2
-
12
30,095
-
12
-
14
0.60
to
<
2.15%
Satisfactory
27,115
2,066
-
29,181
26
9
-
35
29,146
0.1
15
-
19
2.15
to
<
10%
Satisfactory
4,322
2,050
-
6,372
7
21
-
28
6,344
0.4
19
10
to
<
11.35%
Satisfactory
3,454
1,814
-
5,268
4
7
-
11
5,257
0.2
20
-
21
11.35
to
<
100%
Higher
Risk
594
1,852
-
2,446
-
15
-
15
2,431
0.6
22
100%
Credit
Impaired
-
-
349
349
-
-
50
50
299
14.3
Total
239,661
12,357
349
252,367
60
55
50
165
252,202
0.1
As
at
31
December
2018
Credit
risk
profile
by
internal
PD
grade
for
loan
commitments
a
Gross
carrying
amount
Allowance
for
ECL
Net
exposure
Coverage
ratio
PD
range
Credit
quality
description
Stage
1
Stage
2
Stage
3
Total
Stage
1
Stage
2
Stage
3
Total
Grading
%
£m
£m
£m
£m
£m
£m
£m
£m
£m
%
1
-
3
0.0
to
<
0.05%
Strong
71,089
1,590
-
72,679
4
1
-
5
72,674
-
4
-
5
0.05
to
<
0.15%
Strong
50,221
1,368
-
51,589
3
1
-
4
51,585
-
6
-
8
0.15
to
<
0.30%
Strong
24,109
581
-
24,690
3
1
-
4
24,686
-
9
-
11
0.30
to
<
0.60%
Strong
26,740
1,045
-
27,785
7
1
-
8
27,777
-
12
-
14
0.60
to
<
2.15%
Satisfactory
41,076
2,766
-
43,842
31
10
-
41
43,801
0.1
15
-
19
2.15
to
<
10%
Satisfactory
16,089
4,388
-
20,477
23
23
-
46
20,431
0.2
19
10
to
<
11.35%
Satisfactory
919
596
-
1,515
1
7
-
8
1,507
0.5
20
-
21
11.35
to
<
100%
Higher
Risk
668
2,473
-
3,141
3
33
-
36
3,105
1.1
22
100%
Credit
Impaired
-
-
347
347
-
-
20
20
327
5.8
Total
230,911
14,807
347
246,065
75
77
20
172
245,893
0.1
Note
a
Excludes
loan
commitments
and
financial
guarantees
carried
at
fair
value
of
£17.7bn
(2018:
£11.7
bn)
for
Barclays
Bank
Group
.
Risk
review
Risk
performance
Credit
risk
Barclays
Bank
PLC
2019
Annual
Report
on
Form
20-F
67
Analysis
of
specific
portfolios
and
asset
types
Credit
cards,
unsecured
loans
and
other
retail
lending
The
principal
portfolios
listed
below
accounted
for
83%
(2018:
82%
)
of
Barclays
Bank
Group’s
total
credit
cards,
unsecured
loans
and
other
retail
lending.
Credit
cards
and
unsecured
loans
principal
portfolios
Gross
exposure
30
day
arrears
rate,
excluding
recovery
book
90
day
arrears
rate,
excluding
recovery
book
Annualised
gross
write-off
rate
Annualised
net
write-off
rate
£m
%
%
%
%
As
at
31
December
2019
US
cards
22,041
2.7
1.4
4.5
4.4
Barclays
Partner
Finance
4,134
0.9
0.3
1.7
1.7
Germany
consumer
lending
3,683
1.7
0.7
1.1
1.0
As
at
31
December
2018
US
cards
22,178
2.7
1.4
3.6
3.4
Barclays
Partner
Finance
4,216
1.1
0.4
1.7
1.7
Germany
consumer
lending
3,545
1.9
0.8
1.2
1.1
US
cards:
30
and
90
-
day
arrears
rates
remained
stable.
The
annualised
gross
and
net
write-
off
rates
increased
to
4.5%
(2018:
3.6%)
and
4.4%
(2018:
3.4%)
respectively
primarily
driven
by
an
increase
in
charge
-
offs
in
2018.
The
percentage
of
write-
offs
to
charge
-
offs
was
stable
year
on
year.
Barclays
Partner
Finance:
Improvement
in
30
and
90
days
arrears
was
driven
by
better
arrears
management
and
improved
customer
selection.
Annualised
write-
off
rates
remained
flat.
Germany
consumer
lending:
Improvement
in
30
and
90
days
arrears
was
driven
by
better
collections
performance
across
all
products.
Risk
review
Risk
performance
Market
risk
Barclays
Bank
PLC
2019
Annual
Report
on
Form
20-F
68
Summary
of
Contents
Page
◾
Market
risk
overview
and
summary
of
performance
69
Outlines
key
measures
used
to
summarise
the
market
risk
profile
of
the
bank
such
as
value
at
risk
(VaR).
◾
Traded
market
risk
◾
Review
of
management
measures
-
The
daily
average,
maximum
and
minimum
values
of
management
VaR
-
Business
scenario
stresses
69
69
69
70
The
Barclays
Bank
Group
discloses
details
on
management
measures
of
market
risk.
Total
management
VaR
includes
all
trading
positions
and
is
presented
on
a
diversified
basis
by
risk
factor.
This
section
also
outlines
the
macroeconomic
conditions
modelled
as
part
of
the
Barclays
Bank
Group’s
risk
management
framework.
Risk
review
Risk
performance
Market
risk
Barclays
Bank
PLC
2019
Annual
Report
on
Form
20-F
69
All
disclosures
in
this
section
(pages
69
to
70
)
are
unaudited
unless
otherwise
stated.
Overview
This
section
contains
key
statistics
describing
the
market
risk
profile
of
Barclays
Bank
Group
:
●
page
39
covers
the
management
of
market
risk.
Management
measures
are
shown
on
page
69.
Measures
of
market
risk
in
the
Barclays
Bank
Group
and
accounting
measures
Traded
market
risk
measures
such
as
VaR
and
balance
sheet
exposure
measures
have
fundamental
differences:
●
balance
sheet
measures
show
accruals
-
based
balances
or
marked
to
market
values
as
at
the
reporting
date
●
VaR
measures
also
take
account
of
current
marked
to
market
values,
but
in
addition
hedging
effects
between
positions
are
considered
●
market
risk
measures
are
expressed
in
terms
of
changes
in
value
or
volatilities
as
opposed
to
static
values.
For
these
reasons,
it
is
not
possible
to
present
direct
reconciliations
of
traded
market
risk
and
accounting
measures.
Summary
of
performance
in
the
period
Overall,
the
Barclays
Bank
Group
has
maintained
a
steady
market
risk
profile.
Average
management
VaR
increased
by
15%
to
£23m
in
2019
(2018:
£20m)
and
remained
relatively
stable
during
the
period.
The
increase
in
average
management
VaR
in
2019
was
driven
by
a
small
increase
in
equity
risk
and
credit
risk,
partially
offset
by
a
slight
decrease
in
interest
rate
risk
compared
to
2018.
Traded
market
risk
review
Review
of
management
measures
The
following
disclosures
provide
details
on
management
measures
of
market
risk.
The
table
below
shows
the
total
management
VaR
on
a
diversified
basis
by
risk
factor.
Total
management
VaR
includes
all
trading
positions
in
CIB
and
the
supporting
Barclays
Bank
Group
Treasury
desks.
Limits
are
applied
against
each
risk
factor
VaR
as
well
as
total
Management
VaR,
which
are
then
cascaded
further
by
risk
managers
to
each
business.
The
daily
average,
maximum
and
minimum
values
of
management
VaR
Management
VaR
(95%,
one
day)
(audited)
2019
2018
Average
High
b
Low
b
Average
High
b
Low
b
For
the
year
ended
31
December
a
£m
£m
£m
£m
£m
£m
Credit
risk
12
17
8
11
16
8
Interest
rate
risk
6
11
3
8
18
3
Equity
risk
10
22
5
7
14
4
Basis
risk
8
11
6
6
8
4
Spread
risk
4
5
3
6
9
3
Foreign
exchange
risk
3
5
2
3
7
1
Commodity
risk
1
2
-
1
2
-
Inflation
risk
2
3
1
3
4
2
Diversification
effect
b
(23)
n/a
n/a
(25)
n/a
n/a
Total
management
VaR
23
29
16
20
27
15
Notes
a
Excludes
BAGL
from
23
July
2018.
b
Diversification
effects
recognise
that
forecast
losses
from
different
assets
or
businesses
are
unlikely
to
occur
concurrently,
hence
the
expected
aggregate
loss
is
lower
than
the
sum
of
the
expected
losses
from
each
area.
Historical
correlations
between
losses
are
taken
into
account
in
making
these
assessments.
The
high
and
low
VaR
figures
reported
for
each
category
did
not
necessarily
occur
on
the
same
day
as
the
high
and
low
VaR
reported
as
a
whole.
Consequently,
a
diversification
effect
balance
fo
r
the
high
and
low
VaR
figures
would
not
be
meaningful
and
is
therefore
omitted
from
the
above
table.


Risk
review
Risk
performance
Market
risk
0
20
40
60
Jan
2018
Jan
2019
Dec
2019
Barclays
Bank
PLC
2019
Annual
Report
on
Form
20-F
70
Barclays
Bank
Group
Management
VaR
a
a
Excludes
BAGL
from
23
July
2018.
Business
scenario
stresses
As
part
of
the
Barclays
Bank
Group’s
ri
sk
management
framework,
on
a
regular
basis
the
performance
of
the
trading
business
in
hypothetical
scenarios
characterised
by
severe
macroeconomic
conditions
is
modelled.
Up
to
seven
global
scenarios
are
modelled
on
a
regular
basis,
for
example,
a
sharp
deterioration
in
liquidity,
a
slowdown
in
the
global
economy,
global
recession,
and
a
sharp
increase
in
economic
growth.
In
2019,
the
scenario
analyses
showed
that
the
largest
market
risk
related
impacts
would
be
due
to
a
severe
deterioration
in
financial
liquidity
and
a
global
recession.
Risk
review
Risk
performance
Treasury
and
Capital
risk
Barclays
Bank
PLC
2019
Annual
Report
on
Form
20-F
71
Summary
of
Contents
Page
Liquidity
risk
performance
◾
Liquidity
risk
overview
◾
Liquidity
risk
stress
testing
72
72
The
risk
that
the
firm
is
unable
to
meet
its
contractual
or
contingent
obligations
or
that
it
does
not
have
the
appropriate
amount,
tenor
and
composition
of
funding
and
liquidity
to
support
its
assets
.
This
section
provides
an
overview
of
the
Barclays
Bank
Group’s
liquidity
risk.
◾
Contractual
maturity
of
financial
assets
and
liabilities
72
Provides
details
on
the
contractual
maturity
of
all
financial
instruments
and
other
assets
and
liabilities.
Capital
risk
performance
◾
Capital
risk
overview
-
Capital
ratios
-
Capital
resources
-
Capital
Requirements
Regulation
leverage
ratio
77
77
77
77
Capital
risk
is
the
risk
that
the
firm
has
an
insufficient
level
or
composition
of
capital
to
support
its
normal
business
activities
and
to
meet
its
regulatory
capital
requirements
under
normal
operating
environments
or
stressed
conditions
(both
actual
and
as
defined
for
internal
planning
or
regulatory
testing
purposes).
This
also
includes
the
risk
from
the
firm’s
pe
nsion
plans.
This
section
details
Barclays
Bank
Group
’s
capital
and
leverage
position.
◾
Foreign
exchange
risk
-
Transactional
foreign
currency
exposure
-
Translational
foreign
exchange
exposure
-
Functional
currency
of
operations
78
78
78
78
Barclays
Bank
Group
discloses
the
two
sources
of
foreign
exchange
risk
that
it
is
exposed
to.
◾
Pension
risk
review
-
Assets
and
liabilities
-
IAS
19
position
-
Risk
measurement
79
79
80
80
A
review
focusing
on
the
UK
retirement
fund,
which
represents
the
majority
of
Barclays
Bank
Group’s
total
retirement
benefit
obligation.
Interest
rate
risk
in
the
banking
book
performance
◾
Interest
rate
risk
in
the
banking
book
overview
and
summary
of
performance
◾
Net
interest
income
sensitivity
◾
Analysis
of
equity
sensitivity
◾
Volatility
of
the
FVOCI
portfolio
in
the
liquidity
pool
81
81
82
83
A
description
of
the
non
-
traded
market
risk
framework
is
provided.
Barclays
Bank
Group
discloses
a
sensitivity
analysis
on
pre
-
tax
net
interest
income
for
non
-
trading
financial
assets
and
liabilities.
The
analysis
is
carried
out
by
currency.
Barclays
Bank
Group
discloses
the
overall
impact
of
a
parallel
shift
in
interest
rates
on
other
comprehensive
income
and
cash
flow
hedges.
Barclays
Bank
Group
measures
the
volatility
of
the
value
of
the
FVOCI
instruments
in
the
liquidity
pool
through
non
-
traded
market
risk
VaR.
Risk
review
Risk
performance
Treasury
and
Capital
risk
Barclays
Bank
PLC
2019
Annual
Report
on
Form
20-F
72
Liquidity
risk
All
disclosures
in
this
section
(pages
72
to
76
)
are
unaudited
unless
otherwise
stated.
Overview
The
liquidity
pool
decreased
to
£
169
bn
(December
201
8
:
£1
82bn).
The
liquidity
pool,
LCR
and
surplus
have
been
managed
down
through
the
course
of
the
year,
supporting
increased
business
funding
requirements
while
maintaining
a
prudent
liquidity
position.
For
the
purpose
of
liquidity
management,
Barclays
Bank
PLC
and
its
subsidiary
Barclays
Capital
Securities
Limited,
a
UK
broker
dealer
entity,
are
monitored
on
a
combined
basis
by
the
PRA
under
a
Domestic
Liquidity
Sub
-
Group
(Barclays
Bank
PLC
DoLSub)
arrangement.
Liquidity
risk
stress
testing
The
liquidity
risk
assessment
measures
the
potential
contractual
and
contingent
stress
outflows
under
a
range
of
stress
scenarios,
which
are
then
used
to
determine
the
size
of
the
liquidity
pool
that
is
immediately
available
to
meet
anticipated
outflows
if
a
stress
occurs.
The
scenarios
include
a
30
day
Barclays
-
specific
stress
event,
a
90
day
market
-
wide
stress
event
and
a
30
day
combined
scenario
consisting
of
both
a
Barclays
specific
and
market
-
wide
stress
event.
The
CRR
(amended
by
CRRII)
Liquidity
Co
verage
Ratio
(
LCR)
requirement
takes
into
account
the
relative
stability
of
different
sources
of
funding
and
potential
incremental
funding
requirements
in
a
stress.
The
LCR
is
designed
to
promote
short
-
term
resilience
of
a
bank’s
liquidity
risk
profile
by
holding
sufficient
high
quality
liquid
assets
to
survive
an
acute
stress
scenario
lasting
for
30
days.
As
at
As
at
31.12.19
31.12.18
£bn
£bn
Barclays
Bank
Group
liquidity
pool
169
182
Contractual
maturity
of
financial
assets
and
liabilities
The
table
on
the
next
page
provides
detail
on
the
contractual
maturity
of
all
financial
instruments
and
other
assets
and
liabilities.
Derivatives
(other
than
those
designated
in
a
hedging
relationsh
ip)
and
trading
portfolio
assets
and
liabilities
are
included
in
the
‘on
demand’
column
at
their
fair
value.
Liquidity
risk
on
these
items
is
not
managed
on
the
basis
of
contractual
maturity
since
they
are
not
held
for
settlement
according
to
such
maturity
and
will
frequently
be
settled
before
contractual
maturity
at
fair
value.
Derivatives
designated
in
a
hedging
relationship
are
included
according
to
their
contractual
maturity.
Risk
review
Risk
performance
Treasury
and
Capital
risk
Barclays
Bank
PLC
2019
Annual
Report
on
Form
20-F
73
Contractual
maturity
of
financial
assets
and
liabilities
(audited)
Barclays
Bank
Group
On
demand
Not
more
than
three
months
Over
three
months
but
not
more
than
six
months
Over
six
months
but
not
more
than
nine
months
Over
nine
months
but
not
more
than
one
year
Over
one
year
but
not
more
than
two
years
Over
two
years
but
not
more
than
three
years
Over
three
years
but
not
more
than
five
years
Over
five
years
but
not
more
than
ten
years
Over
ten
years
Total
As
at
31
December
2019
£m
£m
£m
£m
£m
£m
£m
£m
£m
£m
£m
Assets
Cash
and
balances
at
central
banks
125,065
766
109
–
–
–
–
–
–
–
125,940
Cash
collateral
and
settlement
balances
2,122
77,361
3
–
–
–
–
–
–
–
79,486
Loans
and
advances
at
amortised
cost
11,396
10,376
9,764
4,513
6,227
17,780
18,460
26,294
14,565
22,261
141,636
Reverse
repurchase
agreements
and
other
similar
secured
lending
13
1,449
–
–
–
77
190
–
–
2
1,731
Trading
portfolio
assets
113,337
–
–
–
–
–
–
–
–
–
113,337
Financial
assets
at
fair
value
through
the
income
statement
14,257
90,292
13,969
3,431
1,150
1,082
313
888
1,803
2,285
129,470
Derivative
financial
instruments
229,460
49
–
–
–
7
21
1
78
25
229,641
Financial
assets
at
fair
value
through
other
comprehensive
income
–
3,176
1,672
817
455
3,510
4,305
9,737
17,544
4,190
45,406
Other
financial
assets
307
168
126
–
13
–
–
–
–
–
614
Total
financial
assets
495,957
183,637
25,643
8,761
7,845
22,456
23,289
36,920
33,990
28,763
867,261
Other
assets
9,411
Total
assets
876,672
Liabilities
Deposits
at
amortised
cost
158,218
39,831
7,127
2,291
3,147
1,102
536
530
545
554
213,881
Cash
collateral
and
settlement
balances
3,077
64,592
13
–
–
–
–
–
–
–
67,682
Repurchase
agreements
and
other
similar
secured
borrowing
7
1,489
–
–
–
–
–
470
–
66
2,032
Debt
securities
in
issue
–
12,418
4,601
3,262
3,036
2,989
131
3,444
3,366
289
33,536
Subordinated
liabilities
–
207
834
397
832
7,999
6,836
7,627
4,784
3,909
33,425
Trading
portfolio
liabilities
35,212
–
–
–
–
–
–
–
–
–
35,212
Financial
liabilities
designated
at
fair
value
13,952
128,078
10,890
6,519
3,797
6,968
6,235
7,702
7,127
13,178
204,446
Derivative
financial
instruments
228,338
–
–
8
–
36
41
42
88
387
228,940
Other
financial
liabilities
217
1,388
19
18
16
777
29
86
183
70
2,803
Total
financial
liabilities
439,021
248,003
23,484
12,495
10,828
19,871
13,808
19,901
16,093
18,453
821,957
Other
liabilities
4,100
Total
liabilities
826,057
Cumulative
liquidity
gap
56,936
(7,430)
(5,271)
(9,005)
(11,988)
(9,403)
78
17,097
34,994
45,304
50,615
Risk
review
Risk
performance
Treasury
and
Capital
risk
Barclays
Bank
PLC
2019
Annual
Report
on
Form
20-F
74
Contractual
maturity
of
financial
assets
and
liabilities
(audited)
Barclays
Bank
Group
On
demand
Not
more
than
three
months
Over
three
months
but
not
more
than
six
months
Over
six
months
but
not
more
than
nine
months
Over
nine
months
but
not
more
than
one
year
Over
one
year
but
not
more
than
two
years
Over
two
years
but
not
more
than
three
years
Over
three
years
but
not
more
than
five
years
Over
five
years
but
not
more
than
ten
years
Over
ten
years
Total
As
at
31
December
2018
£m
£m
£m
£m
£m
£m
£m
£m
£m
£m
£m
Assets
Cash
and
balances
at
central
banks
134,824
1,353
118
64
136,359
Cash
collateral
and
settlement
balances
2,388
71,909
27
22
2
4
74,352
Loans
and
advances
at
amortised
cost
8,902
9,674
6,047
3,882
5,497
19,601
18,900
25,858
15,019
23,579
136,959
Reverse
repurchase
agreements
and
other
similar
secured
lending
31
550
586
446
1,613
Trading
portfolio
assets
104,038
104,038
Financial
assets
at
fair
value
through
the
income
statement
13,590
112,648
7,108
3,124
2,279
3,921
154
286
535
1,605
145,250
Derivative
financial
instruments
222,522
6
1
4
14
11
11
93
21
222,683
Financial
investments
–
Financial
assets
at
fair
value
through
other
comprehensive
income
11
2,474
1,361
1,119
2,041
5,535
2,402
7,290
17,387
5,374
44,994
Other
financial
assets
333
303
56
7
699
Total
financial
assets
486,639
198,911
14,723
8,126
9,914
29,659
21,913
33,449
33,034
30,579
866,947
Other
assets
10,753
Total
assets
877,700
Liabilities
Deposits
at
amortised
cost
155,788
29,273
6,062
2,410
2,314
1,160
694
541
349
746
199,337
Cash
collateral
and
settlement
balances
3,446
64,283
5
2
67,736
Repurchase
agreements
and
other
similar
secured
borrowing
1,331
5,560
3
484
7,378
Debt
securities
in
issue
26
13,718
5,740
4,361
4,235
4,373
982
1,152
4,278
198
39,063
Subordinated
liabilities
306
78
45
1,951
8,269
11,850
5,940
6,888
35,327
Trading
portfolio
liabilities
36,614
36,614
Financial
liabilities
designated
at
fair
value
14,280
144,561
6,809
9,050
3,577
10,365
5,689
7,116
4,415
11,879
217,741
Derivative
financial
instruments
219,527
10
3
3
3
3
43
219,592
Other
financial
liabilities
141
1,982
343
2,466
Total
financial
liabilities
431,153
259,693
18,616
15,901
10,171
18,198
15,637
20,662
15,469
19,754
825,254
Other
liabilities
4,735
Total
liabilities
829,989
Cumulative
liquidity
gap
55,486
(5,296)
(9,189)
(16,964)
(17,221)
(5,760)
516
13,303
30,868
41,693
47,711
Risk
review
Risk
performance
Treasury
and
Capital
risk
Barclays
Bank
PLC
2019
Annual
Report
on
Form
20-F
75
Expected
maturity
date
may
differ
from
the
contractual
dates,
to
account
for:
◾
Tr
ading
portfolio
assets
and
liabilities
and
derivative
financial
instruments,
which
may
not
be
held
to
maturity
as
part
of
Barclays
Bank
Group’s
trading
strategies
◾
Corporate
and
retail
deposits,
reported
under
deposits
at
amortised
cost,
are
repayable
on
demand
or
at
short
notice
on
a
contractual
basis.
In
practice,
their
behavioural
maturity
is
typically
longer
than
their
contractual
maturity,
and
therefore
provide
stable
funding
for
Barclays
Bank
Group’s
operations
and
liquidity
needs
.
◾
Loans
to
corporate
and
retail
customers,
which
are
included
within
loans
and
advances
at
amortised
cost
and
financial
assets
at
fair
value,
may
be
repaid
earlier
in
line
with
terms
an
d
conditions
of
the
contract
◾
Debt
securities
in
issue,
subordinated
liabilities,
and
financial
liabilities
designated
at
fair
value,
may
include
early
redemption
features.
Contractual
maturity
of
financial
liabilities
on
an
undiscounted
basis
The
table
below
presents
the
cash
flows
payable
by
the
Barclays
Bank
Group
under
financial
liabilities
by
remaining
contractual
maturities
at
the
balance
sheet
date.
The
amounts
disclosed
in
the
table
are
the
contractual
undiscounted
cash
flows
of
all
financial
liabilities
(i.e.
nominal
values).
The
balances
in
the
below
table
do
not
agree
directly
to
the
balances
in
the
consolidated
balance
sheet
as
the
table
incorporates
all
cash
flows,
on
an
undiscounted
basis,
related
to
both
principal
as
well
as
those
associated
with
all
future
coupon
payments.
Derivative
financial
instruments
held
for
trading
and
trading
portfolio
liabilities
are
included
in
the
on
demand
column
at
their
fair
value.
Contractual
maturity
of
financial
liabilities
-
undiscounted
(audited)
Barclays
Bank
Group
On
demand
Not
more
than
three
months
Over
three
months
but
not
more
than
six
months
Over
six
months
but
not
more
than
one
year
Over
one
year
but
not
more
than
three
years
Over
three
years
but
not
more
than
five
years
Over
five
years
but
not
more
than
ten
years
Over
ten
years
Total
£m
£m
£m
£m
£m
£m
£m
£m
£m
As
at
31
December
2019
Deposits
at
amortised
cost
158,218
39,844
7,138
5,457
1,648
532
554
595
213,986
Cash
collateral
and
settlement
balances
3,077
64,614
13
–
–
–
–
–
67,704
Repurchase
agreements
and
other
similar
secured
borrowing
7
1,491
–
–
–
485
–
149
2,132
Debt
securities
in
issue
–
12,473
4,627
6,332
3,229
3,582
3,508
290
34,041
Subordinated
liabilities
–
207
845
1,302
18,750
9,875
6,364
8,617
45,960
Trading
portfolio
liabilities
35,212
–
–
–
–
–
–
–
35,212
Financial
liabilities
designated
at
fair
value
13,952
128,203
11,020
10,597
13,500
8,054
7,519
19,392
212,237
Derivative
financial
instruments
228,338
–
–
8
79
45
99
396
228,965
Other
financial
liabilities
217
1,388
19
34
819
99
197
98
2,871
Total
financial
liabilities
439,021
248,220
23,662
23,730
38,025
22,672
18,241
29,537
843,108
As
at
31
December
2018
Deposits
at
amortised
cost
155,788
29,301
6,066
4,739
1,887
568
412
816
199,577
Cash
collateral
and
settlement
balances
3,446
64,295
5
2
–
–
–
–
67,748
Repurchase
agreements
and
other
similar
secured
borrowing
1,331
5,561
–
–
3
–
486
–
7,381
Debt
securities
in
issue
26
13,749
5,779
8,637
5,454
1,195
4,519
229
39,588
Subordinated
liabilities
–
306
–
123
10,477
12,420
6,867
10,393
40,586
Trading
portfolio
liabilities
36,614
–
–
–
–
–
–
–
36,614
Financial
liabilities
designated
at
fair
value
14,280
144,693
6,948
12,731
16,528
7,679
5,008
17,621
225,488
Derivative
financial
instruments
219,527
13
–
–
6
3
4
59
219,612
Other
financial
liabilities
141
1,982
–
–
343
–
–
–
2,466
Total
financial
liabilities
431,153
259,900
18,798
26,232
34,698
21,865
17,296
29,118
839,060
Risk
review
Risk
performance
Treasury
and
Capital
risk
Barclays
Bank
PLC
2019
Annual
Report
on
Form
20-F
76
Maturity
of
off-balance
sheet
commitments
received
and
given
The
table
below
presents
the
maturity
split
of
the
Barclays
Bank
Group’s
off
-
balance
sheet
commitments
received
and
given
at
the
balance
sheet
date.
The
amounts
disclosed
in
the
table
are
the
undiscounted
cash
flows
(i.e.
nominal
values)
on
the
basis
of
earliest
opportunity
at
which
they
are
available.
Maturity
analysis
of
off-balance
sheet
commitments
received
(audited)
On
demand
Not
more
than
three
months
Over
three
months
but
not
more
than
six
months
Over
six
months
but
not
more
than
nine
months
Over
nine
months
but
not
more
than
one
year
Over
one
year
but
not
more
than
two
years
Over
two
years
but
not
more
than
three
years
Over
three
years
but
not
more
than
five
years
Over
five
years
but
not
more
than
ten
years
Over
ten
years
Total
Barclays
Bank
Group
£m
£m
£m
£m
£m
£m
£m
£m
£m
£m
£m
As
at
31
December
2019
Guarantees,
letters
of
credit
and
credit
insurance
5,205
106
22
81
–
11
12
21
12
34
5,504
Other
commitments
received
91
–
–
2,373
–
–
–
–
–
–
2,464
Total
off-balance
sheet
commitments
received
5,296
106
22
2,454
–
11
12
21
12
34
7,968
As
at
31
December
2018
Guarantees,
letters
of
credit
and
credit
insurance
5,581
110
20
13
16
65
10
33
10
5
5,863
Other
commitments
received
93
42
–
–
–
–
–
–
–
–
135
Total
off
-balance
sheet
commitments
received
5,674
152
20
13
16
65
10
33
10
5
5,998
Maturity
analysis
of
off-balance
sheet
commitments
given
(audited)
On
demand
Not
more
than
three
months
Over
three
months
but
not
more
than
six
months
Over
six
months
but
not
more
than
nine
months
Over
nine
months
but
not
more
than
one
year
Over
one
year
but
not
more
than
two
years
Over
two
years
but
not
more
than
three
years
Over
three
years
but
not
more
than
five
years
Over
five
years
but
not
more
than
ten
years
Over
ten
years
Total
Barclays
Bank
Group
£m
£m
£m
£m
£m
£m
£m
£m
£m
£m
£m
As
at
31
December
2019
Contingent
liabilities
22,836
366
86
125
140
143
42
28
3
8
23,777
Documentary
credits
and
other
short
-term
trade
related
transactions
1,287
3
1
–
–
–
–
–
–
–
1,291
Standby
facilities,
credit
lines
and
other
commitments
264,346
1,134
792
973
638
118
98
273
139
225
268,736
Total
off-balance
sheet
commitments
given
288,469
1,503
879
1,098
778
261
140
301
142
233
293,804
As
at
31
December
2018
Contingent
liabilities
15,435
1,102
553
145
170
415
435
641
319
179
19,394
Documentary
credits
and
other
short
-term
trade
related
transactions
70
1,263
325
55
14
11
3
–
–
–
1,741
Standby
facilities,
credit
lines
and
other
commitments
250,802
1,734
1,311
397
667
311
257
424
19
105
256,027
Total
off-balance
sheet
commitments
given
266,307
4,099
2,189
597
851
737
695
1,065
338
284
277,162
Risk
review
Risk
performance
Treasury
and
Capital
risk
Barclays
Bank
PLC
2019
Annual
Report
on
Form
20-F
77
Capital
risk
All
disclosures
in
this
section
(pages
77
to
80)
are
unaudited
unless
otherwise
stated.
Overview
Barclays
Bank
PLC
is
currently
regulated
by
the
PRA
on
a
solo-
consolidated
basis.
Barclays
Bank
PLC
solo-
consolidated
comprises
Barclays
Bank
PLC
plus
certain
additional
subsidiaries,
subject
to
PRA
approval.
The
disclosures
below
provide
key
capital
metrics
for
Barclays
Bank
PLC
solo-
consolidated
with
further
information
on
its
risk
profile
to
be
included
in
the
Barclays
PLC
Pillar
3
Report
FY
2019
,
available
at
home.barclays/investor
-
r
elations/repor
ts-and
-
events/annual-reports.
On
27
June
2019,
CRR
II
came
into
force
amending
CRR.
As
an
amending
regulation,
the
existing
provisions
of
CRR
apply
unless
they
are
amended
by
CRR
II.
Certain
provisions
took
immediate
effect.
Amendments
within
this
section
include
changes
to
qualifying
criteria
for
CET1,
Additional
Tier
1
(
AT1
)
and
Tier
2
instruments,
and
an
amendment
to
the
treatment
of
deferred
tax
assets.
Other
CRR
II
amendments
are
expected
to
take
effect
from
28
June
2021
.
Certain
aspects
of
CRR
II
ar
e
dependent
on
final
technical
standards
to
be
issued
by
the
European
Banking
Authority
(EBA)
and
adopted
by
the
European
Commission
as
well
as
UK
implementation
of
the
rules.
The
disclosures
in
the
following
section
reflect
Barclays’
interpretation
of
the
current
rules
and
guidance.
As
at
31
December
201
9
,
Barclays
Bank
PLC
Solo’s
transitional
CET1
ratio
was
13.9%
which
exceeded
the
2019
minimum
requirement.
Capital
ratios
a,b,c
As
at
31
December
2019
2018
CET1
13.9%
13.5%
Tier
1
(T1)
18.1%
18.4%
Total
regulatory
capital
22.1%
22.2%
Capital
resources
(audited)
2019
2018
As
at
31
December
£bn
£bn
CET1
capital
22.1
23.4
T1
capital
28.6
31.9
Total
regulatory
capital
35.0
38.4
Total
risk
weighted
assets
(RWAs)
(unaudited)
158.4
173.2
Capital
Requirements
Regulation
(CRR)
leverage
ratio
a
2019
2018
As
at
31
December
£bn
£bn
CRR
leverage
ratio
3.9%
4.0%
T1
capital
28.6
31.9
CRR
leverage
exposure
732
791
Notes
a
Capital,
RWAs
and
leverage
are
calculated
applying
the
transitional
arrangements
of
the
CRR
as
amended
by
CRR
II
applicable
as
at
the
reporting
date.
This
includes
IFRS
9
t
ransitional
arrangements
and
the
grandfathering
of
CRR
and
CRR
II
non
-compliant
capital
instruments
.
b
The
fully
loaded
CET1
ratio
was
13.6%,
with
£21.4bn
of
CET1
capital
and
£157.8bn
of
RWAs,
calculated
without
applying
the
transitional
arrangements
of
the
CRR
as
amended
by
CRR
II
applicable
as
at
the
reporting
date.
c
The
Barclays
PLC
CET1
ratio,
as
is
relevant
for
assessing
against
the
convers
ion
trigger
in
Barclays
Bank
PLC
Tier
2
Contingent
Capital
Notes,
was
13.8%.
For
this
calculation
CET1
capital
and
RWAs
are
calculated
applying
the
transitional
arrangements
under
the
CRR,
including
the
IFRS
9
transitional
arrangements.
The
benefit
of
the
Financial
Services
Authority
(FSA)
October
2012
interpretation
of
the
transitional
provisions,
relating
to
the
implementation
of
CRD
IV,
expired
in
December
2017.
Risk
review
Risk
performance
Treasury
and
Capital
risk
Barclays
Bank
PLC
2019
Annual
Report
on
Form
20-F
78
Foreign
exchange
risk
(audited)
Barclays
Bank
Group
is
exposed
to
two
sources
of
foreign
exchange
risk.
a)
Transactional
foreign
currency
exposure
Transactional
foreign
currency
exposures
represent
exposure
on
banking
assets
and
liabilities,
denominated
in
currencies
other
than
the
functional
currency
of
the
transacting
entity.
Barclays
Bank
Group
risk
management
policies
are
designed
to
prevent
the
holding
of
significant
open
positions
in
foreign
currencies
outside
the
trading
portfolio
managed
by
Barclays
International
which
is
monitored
through
VaR.
Banking
book
transactional
foreign
exchange
risk
outside
of
Barclays
International
is
monitored
on
a
daily
basis
by
the
market
risk
function
and
minimised
by
the
businesses.
b)
Translational
foreign
exchange
exposure
Barclays
Bank
Group
investments
in
overseas
subsidiaries
and
branches
create
capital
resources
denominated
in
foreign
currencies,
principally
USD
and
EUR
.
Changes
in
the
GBP
value
of
the
net
investments
due
to
foreign
currency
movements
are
captured
in
the
currency
translation
reserve,
resulting
in
a
movement
in
CET1
capital.
Barclays
Bank
Group
strategy
is
to
minimise
the
volatility
of
the
capital
ratios
caused
by
foreign
exchange
movements,
by
matching
the
CET1
capital
movements
to
the
revaluation
of
Barclays
Bank
Group
foreign
currency
RWA
exposures.
Functional
currency
of
operations
(audited)
Foreign
currency
net
investments
Borrowings
which
hedge
the
net
investments
Derivatives
which
hedge
the
net
investments
Structural
currency
exposures
pre
-
economic
hedges
Economic
hedges
Remaining
structural
currency
exposures
£m
£m
£m
£m
£m
£m
As
at
31
December
2019
USD
25,628
(8,073)
(1,111)
16,443
(5,339)
11,104
EUR
2,987
(3)
-
2,984
(1,122)
1,862
JPY
533
-
-
533
-
533
Other
1,741
-
(34)
1,707
-
1,707
Total
30,889
(8,076)
(1,145)
21,667
(6,461)
15,206
As
at
31
December
2018
USD
28,857
(12,322)
(2,931)
13,604
(4,827)
8,777
EUR
2,672
(3)
-
2,669
(2,146)
523
JPY
489
-
-
489
-
489
Other
2,026
-
(37)
1,989
-
1,989
Total
34,044
(12,325)
(2,968)
18,751
(6,973)
11,778
Economic
hedges
relate
to
exposures
arising
on
foreign
currency
denominated
preference
share
and
AT1
instruments.
These
are
accounted
for
at
historical
cost
under
IFRS
and
do
not
qualify
as
hedges
for
accounting
purposes.
The
gain
or
loss
arising
from
changes
in
the
GBP
value
of
these
instruments
is
recognised
on
redemption
in
retained
earnings.
During
2019,
total
structural
currency
exposure
net
of
hedging
instruments
increased
by
£3.4bn
to
£15.2bn
(2018:
£11.8bn).
For
eign
currenc
y
net
investments
de
creased
by
£
3.1
bn
to
£
30.9
bn
(2018:
£34
.0bn)
driven
predominantly
by
a
£3.
3bn
de
crease
in
US
Dollars
and
a
£
0.2
bn
decrease
in
other
currencies
offset
by
a
£0.3bn
increase
in
Euro
.
The
hedges
associated
with
these
investments
decreased
by
£6
.1
bn
to
£9
.2bn
(2018:
£15.3bn).
Risk
review
Risk
performance
Treasury
and
Capital
risk
1.1%
5.8%
13.6%
24.7%
29.9%
24.9%
0-10
Years
11-20
Years
21-30
Years
31-40
Years
41-50
Years
51
Years
+
Barclays
Bank
PLC
2019
Annual
Report
on
Form
20-F
79
Pension
risk
review
The
UKRF
represents
approximately
97
%
(2018:
9
7
%)
of
the
Barclays
Bank
Group’s
total
retirement
benefit
obligations
globally.
As
such
this
risk
review
section
focuses
exclusively
on
the
UKRF.
The
UKRF
is
closed
to
new
entrants
and
there
is
no
new
final
salary
benefit
being
accrued.
Existing
active
members
accrue
a
combination
of
a
cash
balance
benefit
and
a
defined
contribution
element.
Pension
risk
arises
as
the
market
value
of
the
pension
fund
assets
may
decline,
investment
returns
may
reduce
or
the
estimated
value
of
the
pension
liabilities
may
increase.
Assets
The
Trustee
Board
of
the
UKRF
defines
its
overall
long
-
term
investment
strategy
with
investments
across
a
broad
range
of
asset
classes.
T
his
results
in
an
appropriate
mix
of
return
seeking
assets
as
well
as
liability
matching
assets
to
better
match
future
pension
obligations.
The
two
largest
market
risks
within
the
asset
portfolio
are
interest
rates
and
equities.
The
split
of
scheme
assets
is
shown
within
Note
32.
The
fair
value
of
the
UKRF
assets
was
£31.4bn
as
at
31
December
2019
(2018:
£29.0bn).
Liabilities
The
UKRF
retirement
benefit
obligations
are
a
series
of
future
cash
flows
with
relatively
long
duration.
On
an
IAS
19
basis
these
cash
flows
are
sensitive
to
changes
in
the
expected
long
-
term
price
inflation
rate
(RPI)
and
the
discount
rate
(GBP
AA
corporate
bond
yield):
◾
An
increase
in
long
-
term
expected
inflation
corresponds
to
an
increase
in
liabilities
◾
A
decrease
in
the
discount
rate
corresponds
to
an
increase
in
liabilities.
Pension
risk
is
generated
through
the
Barclays
Bank
Group’s
defined
benefit
schemes
and
this
risk
is
set
to
reduce
over
time
as
the
main
defined
benefit
scheme
is
closed
to
new
entrants.
The
chart
below
outlines
the
shape
of
the
UKRF’s
liability
cash
flow
profile
as
at
31
December
2019
that
takes
account
of
the
future
inflation
indexing
of
payments
to
beneficiaries.
The
majority
of
the
cash
flows
(approximately
93%)
fall
between
0
and
40
years,
peaking
between
11
and
20
years
and
reducing
thereafter.
The
shape
may
vary
depending
on
changes
to
inflation
and
longevity
expectations
and
any
members
who
elect
to
transfer
out.
Transfers
out
will
bring
forward
the
liability
cash
flows.
For
more
detail
on
the
UKRF’s
financial
and
demographic
assumptions
see
Note
32
to
the
financial
statements.
Proportion
of
liability
cash
flows
Risk
review
Risk
performance
Treasury
and
Capital
risk
Barclays
Bank
PLC
2019
Annual
Report
on
Form
20-F
80
IAS
19
pension
position
in
2019
The
graph
above
shows
the
evolution
of
the
UKRF’s
net
IAS
19
position
over
the
last
two
years.
During
2019
the
net
improvement
in
the
IAS
19
position
was
largely
driven
by
bank
contributions.
Credit
spreads
tightening
during
the
year
had
a
negative
impact
which
was
broadly
offset
by
changes
in
other
market
levels,
in
particular
equity
prices
and
interest
rates,
and
updates
to
demographic
assumptions.
Refer
to
Note
32
for
the
sensitivity
of
the
UKRF
to
changes
in
key
assumptions.
Risk
measurement
In
line
with
the
Barclays
Bank
Group’s
risk
management
framework
the
assets
and
liabilities
of
the
UKRF
are
modelled
within
a
VaR
framework
to
show
the
volatility
of
the
pension
position
at
a
total
portfolio
level.
This
enables
the
risks,
diversification
and
liability
matching
characteristics
of
the
UKRF
obligations
and
inv
estments
to
be
adequately
captured.
VaR
is
measured
and
monitored
on
a
monthly
basis.
Risks
are
reviewed
and
reported
regularly
at
forums
including
the
Barclays
PLC
BRC,
the
Barclays
Group
Risk
Committee,
the
Pensions
Management
Group
and
the
Pension
Execu
tive
Board.
The
VaR
model
takes
into
account
the
valuation
of
the
liabilities
on
an
IAS
19
basis
(see
Note
32).
The
Trustee
receives
quarterly
VaR
measures
on
a
funding
basis.
The
pension
liability
is
also
sensitive
to
post-
retirement
mortality
assumptions
which
are
reviewed
regularly.
See
Note
32
for
more
details.
In
addition,
the
impact
of
pension
risk
to
the
Barclays
Bank
Group
is
taken
into
account
as
part
of
the
stress
testing
process.
Stress
testing
is
performed
internally
on
at
least
an
annual
basis.
The
UKRF
exposure
is
also
included
as
part
of
regulatory
stress
tests.
The
Barclays
Bank
Group’s
defined
benefit
pension
schemes
affects
capital
in
two
ways:
◾
An
IAS
19
deficit
is
treated
as
a
liability
on
the
Barclays
Bank
Group’s
balance
sheet.
Movement
in
a
deficit
due
to
remeasurements,
including
actuarial
losses,
are
recognised
immediately
through
Other
Comprehensive
Income
and
as
such
reduces
shareholders’
equity
and
CET1
capital.
An
IAS
19
surplus
is
treated
as
an
asset
on
the
balance
sheet
and
increases
shareholders’
equity;
however,
it
is
deducted
for
the
purposes
of
determining
CET1
capital.
◾
In
the
Barclays
Bank
Group’s
statutory
balance
sheet
an
IAS
19
surplus
or
deficit
is
partially
offset
by
a
deferred
tax
liability
or
asset
respectively.
These
may
or
may
not
be
recognised
for
calculating
CET1
capital
depending
on
the
overall
deferred
tax
position
of
the
Barclays
Bank
Group
at
the
particular
time.
Pen
sion
risk
is
taken
into
account
in
the
Pillar
2A
capital
assessment
undertaken
by
the
PRA
at
least
annually.
The
Pillar
2A
requirement
forms
part
of
the
Barclays
Bank
Group’s
overall
regulatory
minimum
requirement
for
CET1
capital,
Tier
1
capital
and
total
capital.
Risk
review
Risk
performance
Treasury
and
Capital
risk
Barclays
Bank
PLC
2019
Annual
Report
on
Form
20-F
81
Interest
rate
risk
in
the
banking
book
All
disclosure
s
in
this
section
(pages
81
to
83
)
are
unaudited
unless
otherwise
stated.
Overview
The
treasury
and
capital
risk
framework
covers
interest
rate
sensitive
exposures
held
in
the
banking
book,
mostly
relating
to
accrual
accounted
and
FVOCI
instruments.
The
potential
volatility
of
net
interest
income
is
measured
by
an
Annual
Earnings
at
Risk
(AEaR)
metric
which
is
monitored
regularly
and
reported
to
senior
management
and
the
Barclays
Bank
PLC
Boa
rd
Risk
Committee
as
part
of
the
limit
monitoring
framework.
Summary
of
performance
in
the
period
◾
Annual
Earnings
at
Risk
(AEaR),
is
a
key
measure
of
interest
rate
risk
in
the
banking
book
(IRRBB).
Key
metrics
+£25m
AEaR
across
the
Barclays
Bank
Group
from
a
positive
25bps
shock
to
forward
interest
rate
curves.
Net
interest
income
sensitivity
The
table
below
shows
a
sensitivity
analysis
on
pre
-
tax
net
interest
income
for
non
-
traded
financial
assets
and
liabilities,
including
the
effect
of
any
hedging.
NII
sensitivity
uses
the
Annual
Earnings
at
Risk
(AEaR)
metric.
Note
that
this
metric
assumes
an
instantaneous
parallel
change
to
forward
interest
rate
curves.
The
model
does
not
apply
floors
to
shocked
market
rates,
but
does
recogni
se
contractual
product
specific
interest
rate
floors
where
relevant.
The
main
model
assumptions
are:
(i)
one
-
year
ahead
time
horizon;
(ii)
balance
sheet
is
held
constant;
(iii)
balances
are
adjusted
for
assumed
behavioural
profiles
(i.e.
considers
that
customers
may
prepay
the
mortgages
before
the
contractual
maturity);
and
(iv)
behavioural
assumptions
are
kept
unchanged
in
all
rate
scenarios.
Net
Interest
Income
Sensitivity
(AEaR)
by
currency
a,
b
(audited)
2019
2018
+25
basis
points
-25
basis
points
+25
basis
points
-25
basis
points
Barclays
Bank
Group
£m
£m
£m
£m
GBP
19
(34)
23
(36)
USD
29
(32)
39
(40)
EUR
(14)
(16)
(8)
6
Other
currencies
(9)
8
1
(3)
Total
25
(74)
55
(73)
Notes
a
Excludes
minor
investment
banking
business.
b
NII
sensitivity
for
December
2018
restated
due
to
increased
portfolio
coverage,
primarily
the
inclusion
of
the
Treasury
portfolio.
NII
asymmetry
arises
due
to
the
current
low
interest
rate
levels
as
some
customer
products
have
embedded
floors
.
NII
sensiti
vity
to
a
+25bp
shock
to
rates
has
decreased
year
on
year
as
a
result
of
increased
bond
holding
s
outright
in
the
liquidity
pool.
Risk
review
Risk
performance
Treasury
and
Capital
risk
Barclays
Bank
PLC
2019
Annual
Report
on
Form
20-F
82
Analysis
of
equity
sensitivity
Equity
sensitivity
table
measures
the
overall
impact
of
a
+/
-
25bps
movement
in
interest
rates
on
retained
earnings,
fair
value
through
other
comprehensive
income
(FVOCI),
cash
flow
hedge
reserves
and
pensions.
For
non
-
NII
items
a
DV01
metric
is
used,
which
is
an
indicator
of
the
shift
in
value
for
a
1
basis
point
movement
in
the
yield
curve.
Analysis
of
equity
sensitivity
a
31
December
2019
31
December
2018
+25
basis
points
-25
basis
points
+25
basis
points
-25
basis
points
Barclays
Bank
Group
£m
£m
£m
£m
Net
interest
income
25
(74)
55
(73)
Taxation
effects
on
the
above
(6)
18
(14)
19
Effect
on
profit
for
the
year
19
(56)
41
(54)
As
percentage
of
net
profit
after
tax
0.7%
(2.0%)
4.1%
(5.3%)
Effect
on
profit
for
the
year
(per
above)
19
(56)
41
(54)
Fair
value
through
other
comprehensive
income
reserve
(295)
303
(238)
245
Cash
flow
hedge
reserve
(497)
497
(446)
446
Taxation
effects
on
the
above
198
(200)
171
(173)
Effect
on
equity
(575)
544
(472)
464
As
percentage
of
equity
(1.1%)
1.1%
(1.0%)
1.0%
Note
a
December
2018
sensitivities
restated
due
to
increased
portfolio
coverage,
primarily
the
inclusion
of
the
Treasury
portfolio.
Movements
in
the
FVOCI
reserve
impact
CET1
capital.
However,
movements
in
the
cash
flow
hedge
reserve
and
pensions
remeasurement
reserve
recognised
in
FVOCI
do
not
affect
CET1
capital.
Risk
review
Risk
performance
Treasury
and
Capital
risk
Barclays
Bank
PLC
2019
Annual
Report
on
Form
20-F
83
Volatility
of
the
FVOCI
portfolio
in
the
liquidity
pool
Changes
in
value
of
FVOCI
exposures
flow
directly
through
capital
via
the
FVOCI
reserve.
The
volatility
of
the
value
of
the
FVOCI
investments
in
the
liquidity
pool
is
captured
and
managed
through
a
va
lue
measure
rather
than
an
earning
measure,
i.e.
non
-
traded
market
risk
VaR.
Although
the
underlying
methodology
to
calculate
the
non
-traded
VaR
is
identical
to
the
one
used
in
traded
management
VaR,
the
two
measures
are
not
directly
comparable.
The
non-
traded
VaR
represents
the
volatility
to
capital
driven
by
the
FVOCI
exposures.
These
exposures
are
in
the
banking
book
and
do
not
meet
the
criteria
for
trading
book
treatment.
Analysis
of
volatility
of
the
FVOCI
portfolio
in
the
liquidity
pool
2019
2018
Average
High
Low
Average
High
Low
For
the
year
ended
31
December
£m
£m
£m
£m
£m
£m
Non
-
traded
market
value
at
risk
(daily,
95%)
42
49
34
42
56
27
DVaR
trended
upwards
for
the
first
3
quarters
of
2019
as
outright
duration
and
asset
swap
spread
risk
increased.
The
liquidity
pool
de
-
risked
substantially
in
early
Q4,
causing
an
associated
reduction
in
DVaR.
Risk
review
Risk
performance
Operational
risk
Barclays
Bank
PLC
2019
Annual
Report
on
Form
20-F
84
All
disclosures
in
this
section
are
unaudited
unless
otherwise
stated.
Overview
Operational
risks
are
inherent
in
the
Barclays
Bank
Group’s
business
activities
and
it
is
not
cost
effective
or
possible
to
attempt
to
eliminate
all
operational
risks.
The
Operational
Risk
Framework
is
therefore
focused
on
identifying
operational
risks,
assessing
them
and
managing
them
within
the
Barclays
Bank
Group’s
approved
risk
appetite.
The
Operational
Risk
principal
risk
comprises
the
followi
ng
risks:
Data
Management
&
Information
Risk;
Financial
Reporting
Risk;
Fraud
Risk;
Payments
Process
Risk;
People
Risk;
Premises
Risk;
Physical
Security
Risk;
Supplier
Risk;
Tax
Risk;
Technology
Risk;
Transaction
Operations
Risk
and
Execution
Risk.
The
ope
rational
risk
profile
is
also
informed
by
a
number
of
risk
themes:
Cyber,
Data
and
Resilience.
These
represent
threats
to
the
Barclays
Bank
Group
that
extend
across
multiple
risk
types,
and
therefore
require
an
integrated
risk
management
approach.
For
definitions
of
these
risks
refe
r
to
pages
199
to
200
of
the
Barclays
PLC
Pillar
3
Report
2019.
In
order
to
provide
complete
coverage
of
the
potential
adverse
impacts
on
the
Barclays
Bank
Group
arising
from
operational
risk,
the
operational
risk
taxonomy
extend
s
beyond
the
risks
listed
above
to
cover
operational
risks
associated
with
other
principal
risks
too.
This
section
provides
an
analysis
of
the
Barclays
Bank
Group’s
operational
risk
profile,
including
events
above
the
Barclays
Bank
Group’s
reportable
thres
hold,
which
have
had
a
financial
impact
in
2019.
The
Barclays
Bank
Group’s
operational
risk
profile
is
informed
by
bottom
-
up
risk
assessments
undertaken
by
each
business
unit
and
top
-
down
qualitative
review
by
the
Operational
Risk
specialists
for
each
risk
type.
Fraud,
Transaction
Operations
and
Technology
continue
to
be
highlighted
as
key
operational
risk
exposures.
For
information
on
conduct
risk
please
see
page
42
.
Summary
of
performance
in
the
period
During
2019
,
total
operational
risk
losses
a
b
:
£127m)
and
the
number
of
recorded
events
for
2019
decreased
to
1,057
from
1,363
events
recorded
during
the
prior
year.
The
total
operational
risk
losses
for
the
year
were
mainly
driven
by
events
falling
within
the
Execution,
Delivery
and
Process
Management
and
External
Fraud
categories,
which
tend
to
be
high
volume
but
low
impact
events.
Key
metrics
79%
of
the
Barclays
Bank
Group’s
net
reportable
operational
risk
events
had
a
loss
value
of
£50,000
or
less
51%
of
events
by
number
are
due
to
external
fraud
66%
of
losses
are
from
events
aligned
to
Execution,
Delivery
and
Process
Management
Operational
risk
profile
Within
operational
risk,
there
are
a
large
number
of
small
risk
events.
In
2019,
79%
(2018:
81%)
of
the
Barclays
Bank
Group’s
reportable
operational
risk
events
by
volume
had
a
value
of
less
than
£50,000
each.
Cumulatively,
events
under
this
£50,000
threshold
accounted
for
only
13%
(2018:
17%)
of
the
Barclays
Bank
Group’s
total
net
operational
risk
losses.
A
small
proport
ion
of
operational
risk
events
have
a
material
impact
on
the
financial
results
of
the
Barclays
Bank
Group.
The
analysis
below
presents
the
Barclays
Bank
Group’s
operational
risk
events
by
Basel
event
category:
Notes
a
The
data
disclosed
includes
operational
risk
losses
for
reportable
events
impacting
the
Barclays
Bank
Group
business
areas,
having
impact
of
>
£10,000
and
excludes
Gain
or
Insurance
Recovery
impacts,
events
that
are
Conduct
or
Legal
risk,
aggregate
and
boundary
events.
A
boundary
event
is
an
operational
risk
event
that
results
in
a
credit
risk
impact.
Due
to
the
nature
of
risk
events
that
keep
evolving,
prior
year
losses
are
updated.
b
Amendment
s
were
made
to
the
combination
of
organisational
units
that
make
up
this
entity
at
the
end
of
Q1
2018,
which
will
impact
comparison
against
prior
year
values.

Risk
review
Risk
performance
Operational
risk
Barclays
Bank
PLC
2019
Annual
Report
on
Form
20-F
85
◾
Execution,
Delivery
and
Process
Management
impacts
decreased
to
£78m
(2018:
£91m)
and
accounted
for
a
reduced
level
of
66%
(2018:
72%)
of
total
operational
risk
losses.
The
events
in
this
category
are
typical
of
the
banking
industry
as
a
whole
where
high
volumes
of
transactions
are
processed
on
a
daily
basis,
mapping
mainly
to
Barclays
Transaction
Operations
risk
type.
The
overall
frequency
of
events
in
this
category
increased
slightly
in
2019
to
41%
of
total
events
by
volume
(2018:
36%),
the
decrease
in
total
impacts
was
due
to
a
lower
number
of
events
with
high
loss
values
compared
to
the
prior
yea
r.
◾
External
Fraud
remains
the
category
with
the
highest
frequency
of
events
at
51%
of
total
events
in
2019,
although
down
from
56%
in
prior
year.
In
this
category,
high
volume,
low
value
events
are
driven
by
transactional
fraud
often
related
to
debit
and
credit
card
usage.
Ratio
of
losses
in
this
category
increased
to
22%
of
total
2019
losses
(2018:
17%),
driven
mainly
by
increased
fraud
attacks
on
the
Barclays
Bank
Group’s
systems
following
implementation
of
Cheque
Imaging
as
part
of
the
clearing
process.
◾
Business
Disruption
and
System
Failures
impacts
remained
broadly
stable
at
£14m
(2018:
£12m)
and,
while
the
count
of
events
decreased
slightly
year
-
on
-
year
to
71
(2018:
81),
losses
in
this
category
accounted
for
12%
of
total
losses,
slightly
increased
fro
m
the
previous
year
(2018:
10%).
Investment
continues
to
be
made
in
improving
the
control
environment
across
the
Barclays
Bank
Group.
Particular
areas
of
focus
include
new
and
enhanced
fraud
prevention
systems
and
tools
to
combat
the
increasing
level
of
fr
aud
attempts
being
made
and
to
minimise
any
disruption
to
genuine
transactions.
Fraud
remains
an
industry
wide
threat
and
the
Barclays
Bank
Group
continues
to
work
closely
with
external
partners
on
various
prevention
initiatives.
Operational
Resilience
is
a
key
area
of
focus
for
the
Barclays
Bank
Group.
Disruption
to
our
business
activities
is
a
material
inherent
risk
within
the
Group
and
across
the
financial
services
industry,
whether
arising
through
impacts
on
our
technology
systems,
our
real
estate
serv
ices,
availability
of
personnel
or
services
supplied
by
third
parties.
Failure
to
build
resilience
and
recovery
capabilities
into
our
business
activities
may
result
in
significant
customer
detriment,
costs
to
reimburse
losses
incurred
by
the
Barclays
Bank
Group’s
customers,
market
impact
and
reputational
damage.
In
common
with
the
rest
of
the
Financial
Services
industry,
the
Barclays
Bank
Group
expects
continued
regulatory
scrutiny
in
relation
to
resilience.
Technology,
resilience
and
cyber
security
risks
evolve
rapidly
so
the
Barclays
Bank
Group
maintains
continued
focus
and
investment
in
our
control
environment
to
manage
these
risks,
and
actively
partners
with
peers
and
relevant
organisations
to
understand
and
disrupt
threats
originating
outside
the
Barcl
ays
Bank
Group.
Cyber
-
attacks
are
a
global
threat
that
are
inherent
across
all
industries.
The
financial
sector
remains
a
primary
target
for
cyber
criminals,
hostile
nation
states,
opportunists
and
hacktivists.
There
are
high
levels
of
sophistication
in
criminal
hacking
for
the
purpose
of
stealing
money,
stealing,
destroying
or
manipulating
data
(including
customer
data)
and/or
disrupting
operations,
where
multiple
threats
exist
including
threats
arising
from
malicious
emails,
distributed
denial
of
service
(DDoS)
attacks,
payment
system
compromises,
insider
attackers,
supply
chain
and
vulnerability
Risk
review
Risk
performance
Operational
risk
Barclays
Bank
PLC
2019
Annual
Report
on
Form
20-F
86
exploitation.
Cyber
events
can
have
a
compounding
impact
on
services
and
customers,
e.g.
data
breaches
in
social
networking
sites,
retail
co
mpanies
and
payments
networks.
The
threat
of
cyber
-
attack
is
recognised
by
the
Barclays
Bank
Group
along
with
the
significant
potential
impact
on
all
areas
of
its
business
ranging
from
operational
matters
to
its
scrutiny
of
its
relationships
with
its
suppliers,
customers
and
other
external
stakeholders.
Regulators
in
the
UK,
US
and
Europe
continue
to
focus
on
cyber
-
security
risk
management
in
the
financial
sector
and
have
highlighted
the
need
for
financial
institutions
to
improve
their
monitoring
and
control
of,
and
resilience
(particularly
of
critical
services)
to
cyber
-
attacks,
and
to
provide
timely
notification
of
them,
as
appropriate.
This
has
resulted
in
a
number
of
proposed
laws,
regulations
and
other
requirements
that
necessitate
implementation
of
a
variety
of
increased
controls
and
enhancement
activities
for
regulated
Barclays
Bank
Group
entities.
These
include,
among
others,
the
adoption
of
cyber
security
policies
and
procedures
meeting
specified
criteria,
minimum
required
security
measures,
controls
and
procedures
for
enhanced
reporting
and
public
disclosures,
compliance
certification
requirements,
and
other
cyber
and
information
risk
governance
measures.
The
Barclays
Bank
Group
continues
to
use
an
intelligence-driven
defence
approach,
analysing
external
events
for
curr
ent
and
emerging
cyber
threats
which
allows
the
delivery
of
proactive
counter
measures;
the
Barclays
Bank
Group
also
completes
cyber
threat
scenarios
and
incident
playbooks
to
assess
our
security
posture
and
business
impacts
and
runs
an
internal
adversaria
l
capability
which
simulates
hackers
to
proactively
test
controls
and
responses.
The
increased
control
environment
will
continue
to
enhance
our
security
posture
and
our
ability
to
better
protect
the
organisation
and
our
customers.
Cyber
-
attacks
however
are
increasingly
sophisticated
and
there
can
be
no
assurance
that
the
measures
implemented
will
be
fully
effective
to
prevent
or
mitigate
future
attacks,
the
consequences
of
which
could
be
significant
to
the
Barclays
Bank
Group.
Furthermore,
such
measures
hav
e
resulted
and
will
result
in
increased
technology
and
other
costs
in
connection
with
cyber
security
mitigation
and
compliance
for
the
Barclays
Bank
Group.
For
further
information,
see
operational
risk
management
section
(pages
41
to
42).
Risk
review
Risk
performance
Model
risk,
Conduct
risk,
Reputation
risk,
Legal
risk
Barclays
Bank
PLC
2019
Annual
Report
on
Form
20-F
87
All
disclosures
in
this
section
are
unaudited
unless
otherwise
stated.
Model
risk
Since
the
inception
of
model
risk
as
a
principal
risk,
key
achievements
to
date
include
creating
a
complete
model
inventory
across
the
firm,
roll
out
of
a
robust
Model
Risk
Management
(MRM)
framework
and
the
validation
of
all
high
material
models.
In
2019
the
framework
and
governance
of
model
risk
was
further
improved
by:
◾
enhancing
the
Barclays
Bank
PLC
Board
oversight
of
model
risk,
through
the
reporting
of
the
model
risk
tolerance
framework
and
periodic
updates
to
the
Barclays
Bank
PLC
Board
on
the
progress
of
the
MRM
implementation
;
◾
v
alidating
a
third
of
the
po
pulation
of
low
material
models;
◾
strengthening
the
model
inventory
identification
process,
including
enhancing
the
model
lifecycle
technology
platform
;
and
◾
b
etter
alignment
of
documentation
re
quirements
to
model
materiality.
Conduct
risk
The
Barclays
Bank
Group
is
committed
to
continuing
to
drive
the
right
culture
throughout
all
levels
of
the
organisation.
The
Barclays
Bank
Group
will
continue
to
enhance
effective
management
of
conduct
risk
and
appropriately
consider
the
relevant
tools,
go
vernance
and
management
information
in
decision
-
making
processes.
Focus
on
management
of
conduct
risk
is
ongoing
and
the
Barclays
Bank
Group
Conduct
Dashboards
are
a
key
component
of
this.
The
Barclays
Bank
Group
continues
to
review
the
role
and
impact
of
conduct
issues
in
the
remuneration
process
at
both
the
individual
and
business
level.
Businesses
have
continued
to
assess
the
potential
customer,
client
and
market
impacts
of
strategic
change.
As
part
of
the
2019
Medium-Term
Planning
Process,
material
con
duct
risks
associated
with
strategic
and
financial
plans
were
assessed.
Throughout
2019,
conduct
risks
were
raised
by
each
business
area
for
consideration
by
the
Barclays
Bank
PLC
Board
Risk
Committee.
The
Committee
reviewed
the
risks
raised
and
whether
m
anagement’s
proposed
actions
were
appropriate
to
mitigate
the
risks
effectively.
The
Barclays
Bank
PLC
Board
Risk
Committee
received
regular
updates
with
regards
to
key
risks
and
issues
including
those
relating
to
structural
reform
and
regulatory
change.
Although
certain
legacy
litigation
and
conduct
issues
have
been
resolved,
the
Barclays
Bank
Group
continued
to
incur
costs
in
relation
to
litigation
and
conduct
matters,
please
refer
to
Note
25
Legal,
competition
and
regulatory
matters
and
Note
23
Provisions,
for
further
details.
Costs
include
customer
redress
and
remediation,
as
well
as
fines
and
settlements.
Resolution
of
these
matters
remains
a
necessary
and
important
part
of
delivering
the
Barclays
Bank
Group
strategy
and
an
ongoing
commitment
to
improve
oversight
of
culture
and
conduct.
The
Barclays
Bank
Group
has
operated
at
the
overall
set
tolerance
for
conduct
risk
throughout
2019.
The
tolerance
is
assessed
by
the
business
through
Key
Indicators
which
are
aggregated
and
provide
an
overall
rating
which
is
reported
to
the
Barclays
Bank
PLC
Board
Risk
Comm
ittee
as
part
of
the
Conduct
Dashboard.
Reputation
risk
The
Barclays
Bank
Group
is
committed
to
continuing
to
drive
the
right
culture
throughout
all
levels
of
the
organisation.
The
Barclays
Bank
Group
will
continue
to
enhance
effective
m
anagement
of
reputation
risk
and
appropriately
consider
the
relevant
tools,
governance
and
management
information
in
decision
-
making
processes.
The
Barclays
Bank
PLC
Board
considers
reputation
risks
raised
by
businesses.
The
Board
has
also
considered
whether
management’s
proposed
actions
have
been
appropriate
to
mitigate
the
risks
effectively.
Barclays
Bank
Group
continued
to
incur
costs
in
relation
to
litigation
and
conduct
matters,
please
refer
to
Note
25
Legal,
competition
and
regulatory
matters
and
N
ote
23
Provisions,
for
further
details.
Costs
include
customer
redress
and
remediation,
as
well
as
fines
and
settlements.
Resolution
of
these
matters
is
an
ongoing
commitment
to
improve
oversight
of
culture
and
conduct
and
management
of
reputation
risks
ar
ising.
The
Barclays
Bank
Group
remains
focused
on
the
continuous
improvements
being
made
to
manage
risk
effectively,
with
an
emphasis
on
enhancing
governance
and
management
information
to
help
identify
risks
at
earlier
stages.
Legal
risk
The
Barclays
Bank
Group
remains
committed
to
continuous
improvements
to
manage
legal
risk
effectively.
A
number
of
enhancements
have
been
implemented
during
2019,
including
updating
the
Barclays
Group
framework
for
managing
legal
risk
and
associated
policies
as
well
as
reviewing
legal
risk
tolerances
and
risk
appetite.
Updated
legal
risk
m
andatory
training
was
also
implemented
across
the
Barclays
Group,
reinforced
by
ongoing
engagement
and
education
of
the
Barclays
Group’s
businesses
and
functions.
Throughout
2019,
the
Barclays
Bank
Group
operated
within
set
tolerances
for
legal
risk.
Tolerance
adherence
is
assessed
through
key
indicators,
which
are
reviewed
through
the
relevant
risk
and
control
committees.
In
addition
to
ongoing
monitoring,
legal
risk
controls
are
reviewed
and
assessed
annually
as
part
of
the
Risk
and
Control
Self-Assessment
process.
Risk
review
Supervision
and
regulation
Barclays
Bank
PLC
2019
Annual
Report
on
Form
20-F
88
Supervision
of
the
Barclays
Bank
Group
The
Barclays
Bank
Group’s
operations,
including
its
overseas
branches,
subsidiaries
and
associates,
are
subject
to
a
large
number
of
rules
and
regulations
that
are
a
condition
for
authorisation
to
conduct
banking
and
financial
services
business
in
each
of
the
jurisdictions
in
which
the
Barclays
Bank
Group
operates.
These
apply
to
business
operations,
impact
financial
returns
and
include
capital,
leverage
and
liquidity
requirements,
authorisation,
registration
and
reporting
requirements,
restrictions
on
cert
ain
activities,
conduct
of
business
regulations
and
many
others.
Regulatory
developments
impact
the
Barclays
Bank
Group
globally.
We
focus
particularly
on
EU,
UK
and
US
regulation
due
to
the
location
of
the
Barclays
Bank
Group’s
principal
areas
of
business.
Regulations
elsewhere
may
also
have
a
significant
impact
on
the
Barclays
Bank
Group
due
to
the
location
of
its
branches,
subsidiaries
and,
in
some
cases,
clients.
For
more
information
on
the
risks
related
to
the
supervision
and
regulation
of
the
Barclay
s
Bank
Group,
including
regulatory
change,
see
the
Risk
Factor
entitled
‘Regulatory
Change
agenda
and
impa
ct
on
Business
Model’
on
page
29
.
Supervision
in
the
UK
and
EU
The
Barclays
Bank
Group’s
operations
in
Europe
are
authorised
and
regulated
by
a
com
bination
of
its
UK
home
regulators
and
host
regulators
in
the
European
countries
where
the
Barclays
Group
operates.
The
impact
of
the
UK’s
departure
from
the
EU
in
this
respect
and,
more
broadly,
its
impact
on
the
UK
domestic
regulatory
framework,
is
yet
to
be
finally
determined.
In
the
UK,
day
-
to-
day
regulation
and
supervision
of
the
Barclays
Bank
Group
is
divided
between
the
Prudential
Regulation
Authority
(PRA)
(a
division
of
the
Bank
of
England
(BoE))
and
the
Financial
Conduct
Authority
(FCA).
In
addition,
the
Financial
Policy
Committee
(FPC)
of
the
BoE
has
influence
on
the
prudential
requirements
that
may
be
imposed
on
the
banking
system
through
its
powers
of
direction
and
recommendation.
Barclays
Bank
PLC
is
an
authorised
credit
institution
and
subject
to
solo-
consolidated
prudential
supervision
by
the
PRA,
which
comprises
Barclays
Bank
PLC
plus
certain
additional
subsidiaries,
and
subject
to
conduct
regulation
and
supervision
by
the
FCA.
The
Barclays
Group
is
also
subject
to
prudential
supervision
by
the
PRA
on
a
group
consolidated
basis.
Barclays
Capital
Securities
Limited
is
authorised
and
supervised
by
the
PRA
as
a
PRA
-
designated
investment
firm
and
subject
to
conduct
regulation
and
supervision
by
the
FCA.
Barclays
Services
Limited
is
an
appointed
representative
of
Barclays
Bank
PLC
and
Clydesdale
Financial
Services
Limited.
Barclays
Bank
Ireland
PLC
is
licensed
as
a
credit
institution
by
the
Central
Bank
of
Ireland
(CBI)
and
is
designated
as
a
significant
institution
falling
under
direct
supervision
on
a
solo
basis
by
the
European
Central
Bank
(ECB).
Barclays
Bank
Ireland
PLC’s
EU
branches
are
supervised
by
the
ECB
and
are
also
subject
to
direct
supervision
for
local
conduct
purposes
by
national
supervisory
authorities
in
the
jurisdictions
where
they
are
established.
The
Barclays
Bank
Group
is
also
subject
to
regulatory
initiatives
undertaken
by
the
UK
Payment
Systems
Regulator
(PSR),
as
a
participant
in
payment
systems
regulated
by
the
PSR.
The
PRA’s
continuing
supervision
of
the
Barclays
Group
is
conducted
through
a
variety
of
regulatory
tools,
including
the
collection
of
information
by
way
of
prudential
returns
or
cross
-
firm
reviews,
reports
obtained
from
skilled
persons,
regular
supervisory
visits
to
firms
and
regular
meetings
with
management
an
d
directors
to
discuss
issues
such
as
strategy,
governance,
financial
resilience,
operational
resilience,
risk
management,
and
recovery
and
resolution.
Parliament
gave
the
FCA
a
single
strategic
objective
–
to
ensure
that
relevant
markets
function
well
–
and
three
operational
objectives:
to
protect
consumers,
enhance
market
integrity
and
promote
competition.
The
FCA’s
supervision
of
the
UK
firms
in
the
Barclays
Bank
Group
is
carried
out
through
a
combination
of
proactive
engagement,
regular
thematic
work
and
project
work
based
on
the
FCA’s
sector
assessments,
which
analyse
the
different
areas
of
the
market
and
the
risks
that
may
lie
ahead.
Both
the
PRA
and
the
FCA
apply
standards
that
either
anticipate
or
go
beyond
requirements
established
by
global
or
EU
standards,
whether
in
relation
to
capital,
leverage
and
liquidity,
resolvability
and
resolution
or
matters
of
conduct.
The
FCA
has
focused
on
conduct
risk
and
on
customer
outcomes
and
will
continue
to
do
so.
This
has
included
a
focus
on
the
design
and
op
eration
of
products,
the
behaviour
of
customers
and
the
operation
of
markets.
The
FCA
is
conducting
on
-
going
work
on
fair
pricing
in
financial
services,
affordability
and
fair
treatment
of
vulnerable
customers.
These
initiatives
may
impact
future
revenues
and
increase
conduct
costs
and
costs
of
remediation.
The
FCA
and
the
PRA
also
apply
the
Senior
Managers
and
Certification
Regime
(the
SMCR)
which
imposes
a
regulatory
approval,
individual
accountability
and
fitness
and
propriety
framework
in
respect
of
senior
or
key
individuals
within
relevant
firms.
Supervision
in
the
US
The
Barclays
Bank
Group’s
US
activities
and
operations
are
subject
to
umbrella
supervision
by
the
Board
of
Governors
of
the
Federal
Reserve
System
(FRB),
as
well
as
additional
supervision,
requirements
and
restrictions
imposed
by
other
federal
and
state
regulators
and
self-regulatory
organisations
(SROs).
Barclays
PLC,
Barclays
Bank
PLC
and
its
US
branches
and
subsidiaries
are
subject
to
a
comprehensive
regulatory
framework
invo
lving
numerous
statutes,
rules
and
regulations.
In
some
cases,
US
requirements
may
impose
restrictions
on
the
Barclays
Bank
Group’s
global
activities,
in
addition
to
its
activities
in
the
US.
Barclays
PLC,
Barclays
Bank
PLC
and
Barclays
US
LLC
(BUSL)
are
regulated
as
bank
holding
companies
(BHCs)
by
the
FRB.
BUSL
is
the
Barclays
Bank
Group’s
top
-
tier
US
holding
company
that
holds
substantially
all
of
the
Barclays
Bank
Group’s
US
subsidiaries
(including
Barclays
Capital
Inc.
and
Barclays
Bank
Delaware).
BUS
L
is
subject
to
requirements
in
respect
of
capital
adequacy,
capital
planning
and
stress
testing,
risk
management
and
governance,
liquidity,
leverage
limits,
large
exposure
limits,
activities
restrictions
and
financial
regulatory
reporting.
Barclays
Bank
P
LC’s
US
branches
are
also
subject
to
enhanced
prudential
supervision
requirements
relating
to,
among
other
things,
liquidity
and
risk
management.
Barclays
PLC,
Barclays
Bank
PLC
and
BUSL
have
elected
to
be
treated
as
financial
holding
companies
(FHCs)
und
er
the
Bank
Holding
Company
Act
of
1956.
FHC
status
allows
these
entities
to
engage
in
a
variety
of
financial
and
related
activities,
directly
or
through
subsidiaries,
including
underwriting,
dealing
and
market
making
in
securities.
Failure
to
maintain
FHC
status
could
result
in
increasingly
stringent
penalties
and
ultimately,
in
the
closure
or
cessation
of
certain
operations
in
the
US.
In
addition
to
umbrella
oversight
by
the
FRB,
many
of
the
Barclays
Bank
Group’s
branches
and
subsidiaries
are
regulated
b
y
additional
authorities
based
on
the
location
or
activities
of
those
entities.
The
New
York
and
Florida
branches
of
Barclays
Bank
PLC
are
subject
to
supervision
and
regulation
by,
respectively,
the
New
York
State
Department
of
Financial
Services
(NYSDFS)
and
the
Florida
Office
of
Financial
Regulation,
as
well
as
the
applicable
Federal
Reserve
Banks.
Barclays
Bank
Delaware,
a
Delaware
chartered
commercial
bank,
is
subject
to
supervision
and
regulation
by
the
Delaware
Office
of
the
State
Bank
Commissioner,
the
Federal
Deposit
Insurance
Corporation
(FDIC),
and
the
Consumer
Financial
Protection
Risk
review
Supervision
and
regulation
Barclays
Bank
PLC
2019
Annual
Report
on
Form
20-F
89
Bureau
(CFPB).
The
deposits
of
Barclays
Bank
Delaware
are
insured
by
the
FDIC
and
Barclays
PLC,
Barclays
Bank
PLC
and
BUSL
are
required
to
act
as
a
source
of
strength
fo
r
Barclays
Bank
Delaware.
This
could,
among
other
things,
require
these
entities
to
inject
capital
into
Barclays
Bank
Delaware
if
it
fails
to
meet
applicable
regulatory
capital
requirements.
Barclays
Bank
Delaware
is
subject
to
direct
supervision
and
regul
ation
by
the
CFPB,
which
has
the
authority
to
examine
and
take
enforcement
action
related
to
compliance
with
US
federal
consumer
financial
laws
and
regulations.
The
Barclays
Bank
Group’s
US
securities
broker/dealer
and
investment
banking
operations,
primarily
conducted
through
Barclays
Capital
Inc.,
are
also
subject
to
ongoing
supervision
and
regulation
by
the
Securities
and
Exchange
Commission
(SEC),
the
Financial
Industry
Regulatory
Authority
(FINRA)
and
other
government
agencies
and
SROs
under
US
federal
and
state
securities
laws.
The
Barclays
Bank
Group’s
US
commodity
futures,
commodity
options
and
swaps-
related
and
client
clearing
operations
are
subject
to
ongoing
supervision
and
regulation
by
the
Commodity
Futures
Trading
Commission
(CFTC),
the
National
Futures
Association
and
other
SROs.
Barclays
Bank
PLC
is
also
a
US
registered
swap
dealer
and
is
subject
to
the
FRB
swaps
rules
with
respect
to
margin
and
capital
requirements.
Supervision
in
Asia
Pacific
The
Barclays
Bank
Group’s
operations
in
Asia
Pacific
are
supervised
and
regulated
by
a
broad
range
of
national
banking
and
financial
services
regulators.
Brexit
There
remains
much
uncertainty
regarding
the
state
of
the
future
relationship
between
the
UK
and
the
EU
and
therefore
the
potential
impact
of
the
UK's
withdrawal
from
the
EU
on
the
financial
re
gulatory
framework
in
the
UK.
Following
the
UK’s
withdrawal
from
the
EU
on
31
January
2020
pursuant
to
the
withdrawal
agreement
negotiated
between
the
UK
and
the
EU
in
October
2019,
firms
incorpo
rated
and
authorised
in
the
UK
are
able
to
continue
to
provide
services
into
the
EU27,
and
firms
incorporated
and
authorised
in
the
EU27
are
able
to
continue
to
provide
services
into
the
UK
in
accordance
with
the
terms
of
the
withdrawal
agreement
for
the
d
uration
of
the
transition
period
set
out
in
the
agreement.
Following
the
expiry
of
that
transitional
period
in
December
2020,
the
ability
of
UK
firms
to
access
the
EU
market
and
vice
versa
would
depend
upon
the
terms
of
any
future
trade
deal
between
the
UK
and
the
EU,
including
whether
such
deal
provides
for
any
access
rights
in
respect
of
financial
services.
It
would
also
depend
upon
whether
the
EU
grants
equivalence
to
the
UK
as
a
third
country
pursuant
to
equivalence
regimes
in
existing
EU
financial
serv
ices
legislation.
If,
after
the
expiry
of
the
transitional
period
in
December
2020,
there
is
no
deal
or
arrangement
covering
financial
services
in
place,
with
no
ability
to
passport,
and
assuming
no
third
country
"equivalence"
-
based
recognition
in
place,
the
Barclays
Bank
Group
entities
in
the
UK
would
no
longer
be
able
to
provide
certain
of
their
services
from
the
UK
into
the
EU27
in
the
way
in
which
these
services
are
currently
provided.
As
a
result
of
the
onshoring
of
EU
legislation
in
the
UK,
UK
firms
w
ould
(at
least
initially)
be
subject
to
substantially
the
same
rules
and
regulations
as
before
Brexit.
The
UK
may
seek
to
make
changes
to
these
rules
going
forward,
particularly
in
the
event
of
no
deal
or
arrangement
covering
financial
services,
where
they
are
not
subject
to
any
requirements
to
maintain
particular
rules
or
standards
for
equivalence
purposes.
Financial
regulatory
framework
(a)
Prudential
regulation
Certain
Basel
III
standards
were
implemented
in
EU
law
through
the
Capital
Requirements
Regulation
(CRR)
and
the
Capital
Requirements
Directive
IV
(CRD
IV).
Beyond
the
minimum
standards
required
by
CRD
IV,
the
PRA
has
expected
the
Barclays
Group,
in
common
with
other
major
UK
banks
and
building
societies,
to
meet
a
7%
Common
Equity
Tier
1
(CET1)
ratio
at
the
level
of
the
consolidated
group
since
1
January
2016.
Global
systemically
important
banks
(G
-
SIBs),
such
as
the
Barclays
Group,
are
subject
to
a
number
of
additional
prudential
requirements,
including
the
requirement
to
hold
additional
loss-absorbing
capacity
and
additional
capital
buffers
above
the
level
required
by
Basel
III
standards.
The
level
of
the
G
-
SIB
buffer
is
set
by
the
Financial
Stability
Board
(FSB)
according
to
a
bank’s
systemic
importance
and
can
range
from
1%
to
3.5%
of
risk-
weighted
assets
(RWAs).
The
G
-
SIB
buffer
must
be
met
with
CET1.
In
November
2019,
the
FSB
published
an
update
to
its
list
of
G
-
SIBs,
maintaining
the
1.5%
G
-
SIB
buffer
that
applies
to
the
Barclays
Group.
The
Barclays
Group
is
also
subject
to
a
‘combined
buffer
requirement’
consisting
of
(i)
a
capital
conservation
buffer,
and
(ii)
a
countercyclical
capital
buffer
(CCyB).
The
CCyB
is
based
on
rates
determined
by
the
regulatory
authorities
in
each
jurisdiction
in
which
the
Barclays
Group
maintains
exposures
.
These
rates
may
vary
in
either
direction.
In
December
2019,
the
FPC
raised
the
UK
CCyB
rate
from
1%
to
2%
with
binding
effect
from
December
2020.
The
PRA
requires
UK
firms
to
hold
additional
capital
to
cover
risks
which
the
PRA
assesses
are
not
fully
captured
by
the
Pillar
1
capital
requirement.
The
PRA
sets
this
additional
capital
requirement
(Pillar
2A)
at
least
annually,
derived
from
each
firm's
individual
capital
guidance.
Under
current
PRA
rules,
the
Pillar
2A
must
be
met
with
at
least
56%
CET1
capital
and
no
more
than
25%
tier
2
capital.
In
addition,
the
capital
that
firms
use
to
meet
their
minimum
requirements
(Pillar
1
and
Pillar
2A)
cannot
be
counted
towards
meeting
the
combined
buffer
requirement.
The
PRA
may
also
impose
a
'PRA
buffer'
to
cove
r
risks
over
a
forward
looking
planning
horizon,
including
with
regard
to
firm
-
specific
stresses
or
management
and
governance
weaknesses.
If
the
PRA
buffer
is
imposed
on
a
specific
firm,
it
must
be
met
separately
to
the
combined
buffer
requirement,
and
mus
t
be
met
fully
with
CET1
capital.
Final
BCBS
standards
on
counterparty
credit
risk,
leverage,
large
exposures
and
a
Net
Stable
Funding
Ratio
(NSFR)
are
being
implemented
under
EU
law
via
the
Risk
Reduction
Measures
package,
which
was
published
in
the
Official
Journal
in
June
2019
and
includes
the
CRR
II
regulation,
the
CRD
V
directive
and
the
BRRD
II
directive.
The
BCBS’s
finalisation
of
‘Basel
III
–
post-
crisis
regulatory
reforms’
in
December
2017,
among
other
things,
eliminated
model
-
based
approaches
for
certain
categories
of
RWAs,
revised
the
standardised
approach’s
risk
weights
for
a
variety
of
exposure
categories,
replaced
the
four
current
approaches
for
operational
risk
(including
the
advanced
measurement
approach)
with
a
single
standardised
measureme
nt
approach,
established
72.5%
of
standardised
approach
RWAs
for
exposure
categories
as
a
floor
for
RWAs
calculated
under
advanced
approaches
(referred
to
as
the
‘output
floor’),
and
for
G
-
SIBs
introduced
a
leverage
ratio
buffer
in
an
amount
equal
to
50%
o
f
the
applicable
G
-
SIB
buffer
used
for
RWA
purposes
(meaning,
for
the
Barclays
Group,
a
leverage
ratio
buffer
of
0.75%).
The
majority
of
the
final
Basel
III
changes
are
due
to
be
implemented
commencing
1
January
2022,
with
a
five-
year
phase
-
in
period
for
the
output
floor,
although
the
precise
timing
as
it
applies
to
the
Barclays
Group
depends
on
national
and
EU
legislative
processes.
The
new
market
risk
framework,
including
rules
made
as
a
result
of
the
‘fundamental
review
of
Risk
review
Supervision
and
regulation
Barclays
Bank
PLC
2019
Annual
Report
on
Form
20-F
90
the
trading
book’,
is
expected
to
be
implemented
in
the
UK
first
as
a
reporting
requirement,
with
further
legislation
needed
to
replace
the
existing,
binding
market
risk
requirements.
In
the
US,
in
October
2019,
the
FRB
and
other
US
regulatory
agencies
released
final
rules
to
tailor
the
applicability
of
prudential
requirements
for
large
domestic
US
banking
organisations,
foreign
banking
organisations
and
their
intermediate
holding
companies
(IHCs),
including
BUSL.
In
the
final
rule,
BUSL
is
a
“Category
III”
IHC.
BUSL
is
therefore
subjec
t
to
full
standardised
liquidity
requirements,
including
the
liquidity
coverage
ratio,
which
has
been
implemented
by
the
US
regulatory
agencies,
and
the
NSFR,
which
has
been
proposed
by
the
US
regulatory
agencies
but
does
not
have
a
clear
timeframe
for
finalisation.
In
June
2018
and
October
2019,
the
FRB
finalised
rules
regarding
single
counterparty
credit
limits
(SCCL).
The
SCCL
apply
to
the
largest
US
BHCs
and
foreign
banks’
(including
the
Barclays
Bank
Group’s)
US
operations.
The
SCCL
creates
two
separat
e
limits
for
foreign
banks,
the
first
on
combined
US
operations
(CUSO)
and
the
second
on
the
US
IHC
(BUSL).
The
SCCL
for
US
BHCs,
including
BUSL,
will
go
into
effect
in
2020
and
requires
that
exposure
to
an
unaffiliated
counterparty
of
BUSL
not
exceed
25%
of
BUSL’s
tier
1
capital.
With
respect
to
the
CUSO,
the
SCCL
rule
allows
certification
to
the
FRB
that
a
foreign
bank
complies
with
comparable
h
ome
country
regulation.
In
November
2019,
the
FRB
issued
a
proposal
to
extend
by
18
months
the
initial
compliance
date
for
foreign
banks'
CUSO
to
allow
the
home
countries
of
foreign
banks
time
to
finalize
comparable
home
country
regulation.
Under
the
propo
sal,
Barclays
Bank
PLC
would
not
need
to
comply
with
the
CUSO
requirement
until
July
1,
2021.
In
order
to
give
the
FRB
time
to
finalize
the
November
proposal,
in
December
2019
the
FRB
separately
granted
Barclays
Bank
PLC
relief
from
the
SCCL
CUSO
requirem
ent
through
a
letter
indicating
that
Barclays
Bank
PLC
is
not
required
to
provide
the
CUSO
certification
until
1
July
2020.
Stress
testing
The
Barclays
Group
and
certain
of
its
members,
including
Barclays
Bank
PLC,
are
subject
to
supervisory
stress
testing
exercises
in
a
number
of
jurisdictions,
designed
to
assess
the
resilience
of
banks
to
adverse
economic
or
financial
developments
and
ensure
that
they
have
robust,
forward-
looking
capital
planning
processes
that
account
for
the
risks
associated
with
their
business
profile.
Assessment
by
regulators
is
on
both
a
quantitative
and
qualitative
basis,
the
latter
focusing
on
such
elements
as
data
provision,
stress
testing
capability
including
model
risk
management
and
internal
management
processes
and
controls.
(b)
Recovery
and
Resolution
Stabilisation
and
resolution
framework
The
2014
Bank
Recovery
and
Resolution
Directive
(BRRD)
established
a
framework
for
the
recovery
and
resolution
of
EU
credit
institutions
and
investment
firms.
Amendments
to
BRRD
(referred
to
as
BRRD
II)
were
made
via
the
finalisation
of
the
EU
Risk
Reduction
Measures.
Member
states
are
required
to
transpose
BRRD
II
into
national
law
by
28
December
2020
(subject
to
certain
exceptions).
On
28
December
2017,
a
related
EU
directive
c
ame
into
force
harmonising
the
priority
ranking
of
unsecured
debt
instruments
under
national
insolvency
laws.
The
directive
has
been
transposed
into
national
law
in
the
UK,
dividing
a
financial
institution’s
non
-
preferred
debts
into
three
classes
in
a
descending
ranking
order
(ordinary,
secondary
and
tertiary
non
-
preferential
debts).
UK
resolution
authorities
are
empowered
by
law
to
intervene
in
and
resolve
a
UK
financial
institution
that
is
failing
or
likely
to
fail.
The
BoE
(in
consultation
with
the
PRA
and
HM
Treasury
as
appropriate)
has
several
stabilisation
options
where
a
banking
institution
is
failing
or
likely
to
fail,
including,
for
example,
to
transfer
some
or
all
of
the
securities
or
business
of
the
bank
to
a
commercial
purchaser
or
a
‘bridge
ban
k’
owned
by
the
BoE
or
to
transfer
the
banking
institution
into
temporary
public
ownership.
When
exercising
any
of
its
stabilisation
powers,
the
BoE
must
generally
provide
that
shareholders
bear
first
losses,
followed
by
creditors
in
accordance
with
the
pr
iority
of
their
claims
in
insolvency.
In
order
to
enable
the
exercise
of
its
stabilisation
powers,
the
BoE
may
impose
a
temporary
stay
on
the
rights
of
creditors
to
terminate,
accelerate
or
close
out
contracts,
or
override
events
of
default
or
termination
rights
that
might
otherwise
be
invoked
as
a
result
of
a
resolution
action
and
modify
contractual
arrangements
in
certain
circumstances
(including
a
variation
of
the
terms
of
any
securities).
In
addition,
the
BoE
has
the
power
to
override,
vary,
or
impose
conditions
or
contractual
obligations
between
a
UK
bank,
its
holding
company
and
its
group
undertakings,
in
order
to
enable
any
transferee
or
successor
bank
to
operate
effectively
after
any
of
the
resolution
tools
have
been
applied.
HM
Treasury
may
also
am
end
the
law
for
the
purpose
of
enabling
it
to
use
its
powers
under
this
regime
effectively,
potentially
with
retrospective
effect.
These
powers
apply
regardless
of
any
contractual
restrictions
and
compensation
that
may
be
payable.
In
addition,
the
BoE
is
required
by
law
to
permanently
write-
down,
or
convert
into
equity,
tier
1
capital
instruments
and
tier
2
capital
instruments
at
the
point
of
non
-
viability
of
the
bank.
This
power
will
be
extended
to
include
eligible
liabilities
(such
as
liabilities
under
M
REL
instruments
(see
TLAC
and
MREL
below))
once
BRRD
II
is
implemented.
The
BoE’s
preferred
approach
for
the
resolution
of
the
Barclays
Group
is
a
bail-
in
strategy
with
a
single
point
of
entry
at
Barclays
PLC.
Under
such
a
strategy,
Barclays
PLC’s
subsidiaries
would
remain
operational
while
Barclays
PLC’s
eligible
liabilities
would
be
written
down
or
converted
to
equity
in
order
to
recapitalise
the
Barclays
Group
and
allow
for
the
continued
provision
of
services
and
operations
throughout
the
resolution.
The
order
in
which
the
bail-
in
tool
is
applied
reflects
the
hierarchy
of
capital
instruments.
Accordingly,
the
more
subordinated
the
claim,
the
more
likely
losses
will
be
suffered.
The
PRA
has
made
rules
that
require
authorised
firms
to
draw
up
recovery
plans
and
resolution
packs,
as
required
by
the
BRRD.
Recovery
plans
are
designed
to
outline
credible
actions
that
authorised
firms
could
implement
in
the
event
of
severe
stress
in
order
to
restore
their
business
to
a
stable
and
sustainable
condition.
Removal
of
potential
impediments
to
an
orderly
resolution
of
a
banking
group
or
one
or
more
of
its
subsidiaries
is
considered
as
part
of
the
BoE’s
and
PRA’s
supervisory
strategy
for
each
firm,
and
the
PRA
can
require
firms
to
make
significant
changes
in
order
to
enh
ance
resolvability.
The
Barclays
Group
currently
provides
the
PRA
with
a
recovery
plan
annually
and
with
a
resolution
pack
as
requested.
In
July
2019,
the
BoE
and
PRA
published
final
policies
on
the
Resolvability
Assessment
Framework
(RAF),
designed
to
increase
transparency
and
accountability
and
clarify
the
responsibilities
on
firms
with
respect
to
resolution.
The
RAF
consists
of
three
components:
(i)
how
the
BoE
will
assess
resolvability;
(ii)
the
requirement
for
certain
firms
to
perform
an
assessment
of
their
preparations
for
resolution,
submit
a
report
to
the
PRA
and
publish
a
summary
of
their
most
recent
report;
and
(iii)
the
BoE’s
publication
of
a
statement
concerning
the
resolvability
of
each
in-
scope
firm.
The
BoE
will
assess
firms
against
three
res
olvability
outcomes
they
must
meet
by
2022:
(i)
adequate
financial
resources;
(ii)
being
able
to
continue
to
do
business
through
resolution
and
restructuring;
and
(iii)
being
able
to
communicate
and
coordinate
within
the
firm
and
with
authorities.
While
regulators
in
many
jurisdictions
have
indicated
a
preference
for
single
point
of
entry
resolution
for
the
Barclays
Group,
additional
resolution
or
bankruptcy
provisions
may
apply
to
certain
Barclays
Bank
Group
entities
or
branches.
Risk
review
Supervision
and
regulation
Barclays
Bank
PLC
2019
Annual
Report
on
Form
20-F
91
In
the
US,
BUSL
is
subject
to
the
Orderly
Liquidation
Authority
established
by
Title
II
of
the
Dodd
-
Frank
Act,
a
regime
for
the
orderly
liquidation
of
systemically
important
financial
institutions
by
the
FDIC,
as
an
alternative
to
proceedings
under
the
US
Bankruptcy
Code.
In
add
ition,
the
licensing
authorities
of
each
US
branch
of
Barclays
Bank
PLC
and
of
Barclays
Bank
Delaware
have
the
authority
to
take
possession
of
the
business
and
property
of
the
applicable
branch
or
entity
they
license
and/or
to
revoke
or
suspend
such
licence.
In
the
US,
Title
I
of
the
DFA,
as
amended,
and
the
implementing
regulations
issued
by
the
FRB
and
the
FDIC
require
each
bank
holding
company
with
assets
of
$250bn
or
more,
including
those
within
the
Barclays
Group,
to
prepare
and
submit
a
plan
for
the
orderly
resolution
of
subsidiaries
and
operations
in
the
event
of
future
material
financial
distress
or
failure.
The
Barclays
Group’s
next
submission
of
the
US
Resolution
Plan
in
respect
of
its
US
operations
will
be
due
on
1
July
2020.
Barclays
Bank
Ireland
PLC,
as
a
significant
institution
under
the
Single
Resolution
Mechanism
Regulation
(SRMR),
is
subject
to
the
powers
of
the
Single
Resolution
Board
(SRB)
as
the
Eurozone
resolution
authority.
The
CBI
and
the
ECB
require
Barclays
Bank
I
reland
PLC
to
submit
a
standalone
BRRD
-
compliant
recovery
plan
on
an
annual
basis.
The
SRB
has
the
power
to
require
data
submissions
specific
to
Barclays
Bank
Ireland
PLC
under
powers
conferred
upon
it
by
the
BRRD
and
the
SRMR.
The
SRB
will
exercise
these
powers
to
determine
the
optimal
resolution
strategy
for
Barclays
Bank
Ireland
PLC
in
the
context
of
the
BoE’s
preferred
resolution
strategy
of
single
point
of
entry
with
bail-
in
at
Barclays
PLC.
The
SRB
also
has
the
power
under
the
BRRD
and
the
SRMR
to
dev
elop
a
resolution
plan
for
Barclays
Bank
Ireland
PLC.
TLAC
and
MREL
The
BRRD
requires
competent
authorities
to
impose
a
Minimum
Requirement
for
own
funds
and
Eligible
Liabilities
(MREL)
on
financial
institutions
to
facilitate
their
orderly
resolution
without
broader
financial
disruption
or
recourse
to
public
funds.
In
November
2015,
the
FSB
finalised
its
proposals
to
enhance
the
loss-absorbing
capacity
of
G
-
SIBs
and
set
a
new
minimum
requirement
for
‘total
loss-absorbing
capacity’
(TLAC).
The
FSB
also
pub
lished
guiding
principles
on
internal
TLAC
in
July
2017.
The
EU
is
implementing
the
TLAC
standard
(including
internal
TLAC)
via
the
MREL
requirement
for
G
-
SIBs
and
the
relevant
amendments
are
contained
in
the
Risk
Reduction
Measures
package.
Under
the
BoE’s
2018
statement
of
policy
on
MREL,
the
BoE
will
set
MREL
for
UK
G
-
SIBs
as
necessary
to
implement
the
TLAC
standard
and
institution
or
group
-
specific
MREL
requirements
will
depend
on
the
preferred
resolution
strategy
for
that
institution
or
group.
Int
ernal
MREL
for
operating
subsidiaries
will
be
scaled
within
a
75
-
90%
range
of
the
external
requirement
that
would
apply
to
the
subsidiary
if
it
were
a
resolution
entity.
The
starting
point
for
the
scalar
will
be
90%
for
ring
-
fenced
bank
sub
-
groups.
The
MREL
requirements
are
being
phased
in
as
from
1
January
2019.
From
1
January
2020,
G
-
SIBs
with
resolution
entities
incorporated
in
the
UK,
including
the
Barclays
Group,
will
be
subject
to
an
MREL
requirement
equivalent
to
the
higher
of:
(i)
the
sum
of
two
times
the
Pillar
1
requirement
and
one
times
the
Pillar
2A
requirement;
or
(ii)
the
higher
of
two
times
the
leverage
ratio
or
6%
of
leverage
exposures.
The
MREL
requirements
will
be
fully
implemented
by
1
January
2022,
at
which
time
such
G
-
SIBs
will
be
requi
red
to
meet
an
MREL
equivalent
to
the
higher
of:
(i)
two
times
the
sum
of
their
Pillar
1
and
Pillar
2A
requirements;
or
(ii)
the
higher
of
two
times
their
leverage
ratio
or
6.75%
of
leverage
exposures.
Barclays
Bank
Ireland
PLC
is
subject
to
the
SRB’s
MREL
policy,
as
issued
in
January
2019,
in
respect
of
the
internal
MREL
that
it
will
be
required
to
issue
to
Barclays
Bank
Group.
The
SRB’s
MREL
policy
will
be
revised
in
the
near
future
to
reflect
the
implementation
of
the
Risk
Reduction
Measures
package
in
the
EU.
The
SRB’s
current
calibration
of
MREL
is
two
times
the
sum
of:
(i)
the
firm’s
Pillar
1
requirement;
(ii)
its
Pillar
2
requirement;
and
(iii)
its
combined
buffer
requirement,
minus
125
basis
points.
The
SRB’s
policy
does
not
envisage
the
application
of
any
scalar
in
respect
of
the
internal
MREL
requirement.
In
the
US,
the
FRB’s
TLAC
rule
includes
provisions
that
require
BUSL
to
have:
(i)
a
specified
outstanding
amount
of
eligible
long
-
term
debt;
(ii)
a
specified
outstanding
amount
of
TLAC
(consisting
of
common
and
preferred
equity
regulatory
capital
plus
eligible
long
-
term
debt);
and
(iii)
a
specified
common
equity
buffer.
In
addition,
the
FRB’s
TLAC
rule
prohibits
BUSL,
for
so
long
as
the
Barclays
Group’s
overall
resolution
plan
treats
BUSL
as
a
no
n
-
resolution
entity,
from
issuing
TLAC
to
entities
other
than
those
within
the
Barclays
Group.
Bank
Levy
and
FSCS
The
BRRD
requires
EU
member
states
to
establish
a
pre
-
funded
resolution
financing
arrangement
with
funding
equal
to
1%
of
covered
deposits
by
31
December
2024
to
cover
the
costs
of
bank
resolutions.
The
UK
has
implemented
this
requirement
by
way
of
a
tax
o
n
the
balance
sheets
of
banks
known
as
the
‘Bank
Levy’.
In
addition,
the
UK
has
a
statutory
compensation
fund
called
the
Financial
Services
Compensation
Scheme
(FSCS),
which
is
funded
by
way
of
annual
levies
on
most
financial
services
firms
authorised
und
er
FSMA.
(c)
Structural
reform
In
the
UK,
the
Financial
Services
(Banking
Reform)
Act
2013
put
in
place
a
framework
for
ring
-
fencing
certain
operations
of
large
banks
and
secondary
legislation
passed
in
2014
elaborated
on
the
operation
and
application
of
the
ring
-
fence.
Ring
-
fencing
requires,
among
other
things,
the
separation
of
the
retail
and
smaller
deposit
-
taking
business
activities
of
UK
banks
into
a
legally
distinct,
operationally
separate
and
economically
independent
entity,
which
is
not
permitte
d
to
undertake
a
range
of
activities.
US
regulation
places
further
substantive
limits
on
the
activities
that
may
be
conducted
by
banks
and
holding
companies,
including
foreign
banking
organisations
such
as
the
Barclays
Group.
The
‘Volcker
Rule’,
which
was
part
of
the
DFA
and
which
came
into
effect
in
the
US
in
2015,
prohibits
banking
entities
from
undertaking
certain
proprietary
trading
activities
and
limits
such
entities’
ability
to
sponsor
or
invest
in
certain
private
equity
funds
and
hedge
funds
(in
each
case
broadly
defined).
As
required
by
the
rule,
the
Barclays
Group
has
developed
and
implemented
an
extensive
compliance
and
monitoring
programme
addressing
proprietary
trading
and
covered
fund
activities
(both
inside
and
outside
of
the
US).
In
August
20
19
the
Volcker
regulatory
agencies
finalised
amendments
to
the
Volcker
Rule’s
proprietary
trading
provisions,
which
became
effective
on
1
January
2020
(with
a
mandatory
compliance
date
of
1
January
2021).
The
amendments
generally
provide
greater
flexibility
for
banking
entities,
and
in
particular
for
business
units
that
operate
solely
outside
the
US.
The
Volcker
Rule
agencies
have
indicated
that
further
changes
are
likely
to
be
proposed
in
2020
with
regard
to
the
Volcker
covered
funds
provisions.
Risk
review
Supervision
and
regulation
Barclays
Bank
PLC
2019
Annual
Report
on
Form
20-F
92
(d)
Market
infrastructure
regulation
In
recent
years,
regulators
as
well
as
global
-
standard
setting
bodies
such
as
the
International
Organisation
of
Securities
Commissions
(IOSCO)
have
focused
on
improving
transparency
and
reducing
risk
in
markets,
particularly
ri
sks
related
to
over
-
the-
counter
(OTC)
transactions.
This
focus
has
resulted
in
a
variety
of
new
regulations
across
the
G20
countries
and
beyond
that
require
or
encourage
on
-
venue
trading,
clearing,
posting
of
margin
and
disclosure
of
pre
-
trade
and
post-
tra
de
information.
Some
of
the
most
significant
developments
are
described
below.
The
European
Market
Infrastructure
Regulation,
as
amended,
(EMIR)
has
introduced
requirements
designed
to
improve
transparency
and
reduce
the
risks
associated
with
the
derivati
ves
market,
some
of
which
are
still
to
be
fully
implemented.
EMIR
has
potential
operational
and
financial
impacts
on
the
Barclays
Group,
including
by
imposing
new
collateral
require
ments.
Over
the
coming
months,
European
regulators
will
undergo
a
review
of
the
exchange
of
collateral
rules,
raising
the
possibility
of
some
alterations
to
the
existing
rules.
European
regulators
are
also
currently
consulting
on
details
of
the
recent
amendments
to
EMIR,
which
could
potentially
have
a
significant
impact
on
our
clearing
business.
CRD
IV
complements
EMIR
by
applying
higher
capital
requirements
for
bilateral,
uncleared
OTC
derivative
trades.
Lower
capital
requirements
for
cleared
derivative
trades
are
only
available
if
the
central
counterparty
(CCP)
through
which
the
trade
is
cleared
is
recognised
as
a
‘qualifying
central
counterparty’
(QCCP)
which
has
been
authorised
or
recognised
under
EMIR.
The
Markets
in
Financial
Instruments
Directive
and
Markets
in
Financial
Instruments
Regulation
(collectively
referred
to
as
M
iFID
II)
have
largely
been
applicable
since
3
January
2018.
MiFID
II
affects
many
of
the
investment
markets
in
which
the
Barclays
Group
operates,
the
instruments
in
which
it
trades
and
the
way
it
transacts
with
market
counterparties
and
other
customers.
MiFID
II
is
currently
undergoing
a
review
process
in
order
to
determine
those
areas
of
the
regulation
that
require
further
amendment.
These
amendments
are
being
considered
particularly
in
light
of
the
EU’s
ongoing
focus
on
the
development
of
a
stronger
Capital
Markets
Union.
As
part
of
the
EU’s
sustainable
finance
action
plan,
new
regulatory
requirements
are
being
introduced
to
provide
greater
transparency
on
the
environmental
and
social
impact
of
financial
investments.
These
include
(i)
the
Regulation
on
Sustainability-Related
Disclosures,
which
introduces
disclosure
obligations
regarding
the
way
in
which
financial
institutions
integrate
environmental,
social
and
governance
factors
in
their
investment
decisions,
and
(ii)
the
Taxonomy
Regulation,
which
provid
es
for
a
general
framework
for
the
development
of
an
EU
-
wide
classification
system
for
environmentally
sustainable
economic
activities.
These
new
requirements
will
have
an
impact
on
the
Barclays
Bank
Group
as
an
intermediary
performing
investment
services
for
customers
and
investors.
The
EU
Benchmarks
Regulation
applies
to
the
administration,
contribution
of
data
to
and
use
of
benchmarks
within
the
EU.
Financial
institutions
within
the
EU
are
prohibited
from
using
benchmarks
unless
their
administrators
are
authorised,
registered
or
otherwise
recognised
in
the
EU,
subject
to
transitional
provisions
expiring
on
1
January
2022.
For
example,
EURIBOR
is
no
longer
compliant
with
the
Benchmarks
Regulation,
and
the
FCA
has
stated
that
it
does
not
intend
to
support
LIBOR
after
the
end
of
2021.
International
initiatives
are
therefore
underway
to
develop
alternative
benchmarks
and
backstop
arrangements.
US
regulators
have
imposed
similar
rules
as
the
EU
with
respect
to
the
mandatory
on
-
venue
trading
and
clearing
of
certain
derivatives,
and
post-
trade
transparency,
as
well
as
in
relation
to
the
margining
of
OTC
derivatives.
US
regulators
are
continuing
to
review
and
consider
their
rules
with
respect
to
their
application
on
a
cross
-
border
basis,
including
with
respect
to
their
registration
requirements
in
relation
to
non
-
US
swap
dealers
and
security-
based
swap
dealers.
The
regulators
may
adopt
further
rules,
or
provide
further
guidance,
regarding
cross-border
applicability.
In
December
2017,
the
CFTC
and
the
European
Commission
recognised
the
trading
venues
of
each
other’s
jurisdiction
to
allow
market
participants
to
comply
with
mandatory
on
-
venue
trading
requirements
while
trading
on
certain
venues
recognised
by
the
other
jurisdiction.
In
April
2019,
the
CFTC
issued
temporary
relief
that
would
permit
trading
venues
and
market
participants
located
in
the
UK
to
continue
to
rely
on
this
mutual
recognition
framework
following
a
withdrawal
of
the
UK
from
the
EU.
Certain
participants
in
US
swap
markets
are
required
to
register
with
the
CFTC
as
‘swap
dealers’
or
‘major
swap
participants’
and/or,
following
the
compliance
date
for
relevant
SEC
rules,
with
the
SEC
as
‘security-based
swap
dealers’
or
‘major
security-
based
swap
participants’.
Such
registrants
are
subject
to
CFTC,
an
d
will
be
subject
to
SEC,
regulation
and
oversight.
Entities
required
to
register
as
swap
dealers
are
subject
to
business
conduct,
recordkeeping
and
reporting
requirements
under
CFTC
rules.
Barclays
Bank
PLC
is
subject
to
regulation
by
the
FRB,
and
has
pro
visionally
registered
with
the
CFTC
as
a
swap
dealer.
Accordingly,
Barclays
Bank
PLC
is
subject
to
CFTC
rules
on
business
conduct,
record
-
keeping
and
reporting
and
to
FRB
rules
on
capital
and
margin.
The
CFTC
has
approved
certain
comparability
determinati
ons
that
permit
substituted
compliance
with
non
-
US
regulatory
regimes
for
certain
swap
regulations.
Substituted
compliance
is
permitted
for
certain
transaction
-
level
requirements,
where
applicable,
only
with
respect
to
transactions
between
a
non
-
US
swap
de
aler
and
a
non
-
US
counterparty,
whereas
entity-level
determinations
generally
apply
on
an
entity-wide
basis
regardless
of
counterparty
status.
In
April
2019,
the
CFTC
issued
temporary
relief
that
would
permit
swap
dealers
located
in
the
UK
to
continue
to
r
ely
on
existing
CFTC
substituted
compliance
determinations
with
respect
to
EU
requirements
in
the
event
of
a
withdrawal
of
the
UK
from
the
EU.
In
addition,
the
CFTC
has
issued
guidance
that
would
require
a
non
-
US
swap
dealer
to
comply
with
certain
CFTC
rul
es
in
connection
with
transactions
that
are
“arranged,
negotiated
or
executed”
from
the
US.
The
CFTC
has
provided
temporary
no
-
action
relief
from
application
of
the
guidance.
In
December
2019
the
CFTC
proposed
rules
that
would,
for
certain
CFTC
requirement
s,
codify
on
a
permanent
basis,
the
temporary
no
-
action
relief
for
transactions
that
are
arranged,
negotiated
or
executed
in
the
US.
The
proposed
rules
would
also
codify
certain
aspects
of
the
CFTC's
current
cross
-
border
framework
with
respect
to
internal
and
external
business
conduct
requirements,
and
it
is
expected
that
the
CFTC
will
introduce
additional
proposed
rules
addressing
mandatory
clearing,
trading
and
reporting
requirements
.
In
October
2017,
the
CFTC
issued
an
order
permitting
substituted
compliance
with
EU
margin
rules
for
certain
uncleared
derivatives.
However,
as
the
Barclays
Bank
Group
is
subject
to
the
margin
rules
of
the
FRB,
it
will
not
benefit
from
the
CFTC’s
action
unless
the
FRB
takes
a
similar
approach.
The
SEC
finalised
the
rul
es
governing
security
based
swap
dealer
registration
in
2015
but
clarified
that
registration
timing
is
contingent
upon
the
finalisation
of
certain
additional
rules
under
Title
VII
of
DFA
.
In
December
of
2019
the
SEC
adopted
a
final
cross
-
border
rule
that,
upon
publication
in
the
federal
register,
will
trigger
the
timeline
for
security-
based
swap
dealer
registration,
which
will
be
required
18
months
following
the
effective
date
of
those
rules,
currently
expected
in
September
2021.
When
security-
based
swap
d
ealer
registration
is
required,
it
is
anticipated
that
Barclays
Bank
PLC
and/or
one
or
more
of
its
affiliates
will
be
required
to
register
in
that
capacity
and
thus
will
be
required
to
comply
with
the
SEC’s
rules
for
security-
based
swap
dealers.
These
rule
s
may
impose
costs
and
other
requirements
or
restrictions
that
could
impact
our
business.
As
with
similar
CFTC
rules,
substituted
compliance
will
be
available
for
certain
security-
based
swap
dealer
requirements;
however,
the
SEC
has
not
yet
issued
any
comp
arability
determinations,
and
the
ultimate
scope
and
applicability
of
such
determinations
remains
unclear.
Risk
review
Supervision
and
regulation
Barclays
Bank
PLC
2019
Annual
Report
on
Form
20-F
93
(e)
Conduct,
culture
and
other
regulation
Conduct
and
culture
The
PRA
and
FCA
measures
to
increase
the
individual
accountability
of
senior
managers
and
other
covered
individuals
in
the
banking
sector
include:
the
‘Senior
Managers
Regime’,
which
applies
to
a
limited
number
of
individuals
with
senior
management
responsibilities
within
a
firm;
the
‘Certification
Regime’,
which
is
intended
to
assess
and
monitor
the
fitness
and
propriety
of
a
wider
range
of
employees
who
could
pose
a
risk
of
significant
harm
to
the
firm
or
its
customers;
and
conduct
rules
that
individuals
subject
to
either
regime
must
comply
with.
From
March
2017,
the
conduct
rules
have
applied
more
widely
to
other
staff
of
firms
within
the
scope
of
the
regime,
including
the
Barclays
Group.
Our
regulators
have
also
enhanced
their
focus
on
the
promotion
of
cultural
values
as
a
key
area
for
banks,
although
they
generally
view
the
resp
onsibility
for
reforming
culture
as
primarily
sitting
with
the
industry.
Data
protection
and
PSD2
Most
countries
in
which
the
Barclays
Bank
Group
operates
have
comprehensive
laws
governing
the
collection
and
use
of
personal
information.
Prominent
media
reporting
of
recent
cyber
-
security
breaches
or
data
losses
and
the
significant
penalties
being
handed
down
by
European
privacy
regulators
have
heightened
interest
in
data
privacy
worldwide.
The
introduction
of
the
EU’s
General
Data
Protection
Regulation
(G
DPR)
does
not
significantly
alter
the
core
principles
established
under
the
earlier
Data
Protection
Directive,
but
it
creates
a
harmonised
privacy
regime
across
European
member
states
with
penalties
up
to
the
higher
of
4%
of
global
turnover
or
€20
million.
The
GDPR
also
institutes
new
mandatory
breach
notification
requirements,
enhances
the
rights
of
individual
data
subjects
and
introduces
an
accountability
principle
concerned
with
openly
demonstrating
compliance.
The
international
nature
of
our
business
and
IT
infrastructure
means
personal
information
may
be
available
in
countries
other
than
from
where
it
originated.
The
GDPR
has
extra
-
territorial
effect
where
a
business
established
outside
the
EU
is
processing
personal
data
of
persons
located
in
the
EU
(
e.g.
European
based
customers
or
clients)
and
such
processing
relates
to
the
offering
of
goods
or
services
to
such
persons,
or
the
monitoring
of
their
behaviour
in
the
EU.
In
the
United
States,
the
California
Consumer
Privacy
Protection
Act
(CCPA),
effec
tive
1
January
2020
requires
companies
that
process
information
regarding
California
residents
to
make
new
disclosures
to
consumers
about
their
data
collection,
use
and
sharing
practices,
allows
consumers
to
opt
out
of
certain
data
sharing
with
third
parti
es
and
provides
a
new
cause
of
action
for
data
breaches.
It
remains
unclear
what
modifications
will
be
made,
if
any,
to
the
CCPA
and
its
regulations
and
how
these
will
be
interpreted.
The
introduction
of
the
CCPA
has
prompted
several
other
US
states
to
con
sider
similar
legislation.
Elsewhere
non
-
EU
countries
such
as
Bermuda,
Brazil,
India,
Cayman
Islands,
China,
Guernsey,
Jersey,
Isle
of
Man,
and
Switzerland
have
introduced
or
updated
existing
legislation,
or
are
considering
new
laws,
with
provisions
that
are
either
inspired
by
the
GDPR
or
that
otherwise
provide
enhanced
rights
to
data
subjects.
The
revised
Payment
Services
Directive
(PSD2)
introduces
additional
security
requirements
when
customers
and
clients
are
accessing
accounts
or
making
payments
onlin
e.
In
August
2019,
the
FCA
agreed
an
18
-
month
plan
for
firms
to
implement
these
requirements,
referred
to
as
Strong
Customer
Authentication
(SCA).
Cyber
security
and
operational
resilience
Regulators
in
Europe
and
the
US
continue
to
focus
on
cyber
security
risk
management
and
organisational
operational
resilience
and
overall
soundness
across
all
financial
services
firms,
with
customer
and
market
expectations
of
continuous
access
to
financial
services
at
an
all-time
high.
This
has
a
led
to
a
number
of
proposed
laws
and
changes
to
regulatory
frameworks
being
published,
such
as
the
UK
regulators’
proposals
for
a
new
operational
resilience
regime,
that
necessitate
the
implementation
of
a
variety
of
increased
controls
and
enhancement
activities
for
regulate
d
Barclays
Bank
Group
entities.
To
comply
with
these
new
requirements,
firms
such
as
the
Barclays
Bank
Group
have
adopted
or
will
adopt
a
variety
of
increased
controls
and
processes,
including,
among
others,
the
amendment
of
cyber
security
policies
and
pro
cedures
to
include
specified
criteria,
additional
security
measures
for
enhanced
reporting
and
public
disclosures,
compliance
certification
requirements,
operational
resilience
and
more
advanced
recovery
solutions,
as
well
as
other
cyber
and
information
ri
sk
governance
measures.
These
increased
controls
will
enhance
industry
standardisation,
expand
and
enhance
our
resilience
capabilities
as
well
as
increase
our
ability
to
protect
and
maintain
customer
service
during
potential
disruptions.
Such
measures
are
likely
to
result
in
increased
technology
and
compliance
costs
for
the
Barclays
Bank
Group.
Sanctions
and
financial
crime
The
UK
Bribery
Act
2010
introduced
a
new
form
of
corporate
criminal
liability
focused
broadly
on
a
company’s
failure
to
prevent
bri
bery
on
its
behalf.
The
Criminal
Finances
Act
2017
introduced
new
corporate
criminal
offences
of
failing
to
prevent
the
facilitation
of
UK
and
overseas
tax
evasion.
Both
pieces
of
legislation
have
broad
application
and
in
certain
circumstances
may
have
extra
-
territorial
impact
on
entities,
persons
or
activities
located
outside
the
UK,
including
Barclays
PLC
and
its
subsidiaries.
The
UK
Bribery
Act
requires
the
Barclays
Bank
Group
to
have
adequate
procedures
to
prevent
bribery
which,
due
to
the
extra
-
territo
rial
nature
of
the
Act,
makes
this
both
complex
and
costly.
Additionally,
the
Criminal
Finances
Act
requires
the
Barclays
Group
to
have
reasonable
prevention
procedures
in
place
to
prevent
the
criminal
facilitation
of
tax
evasion
by
persons
acting
for,
or
on
behalf
of,
the
Barclays
Group.
In
May
2018,
the
Sanctions
and
Anti-
Money
Laundering
Act
became
law
in
the
UK.
The
Act
allows
for
the
adoption
of
an
autonomous
UK
Sanctions
regime,
as
well
as
a
more
flexible
licensing
regime
post-
Brexit.
In
July
2018,
the
5th
EU
Anti-
Money
Laundering
Directive
entered
into
force.
Amongst
other
things,
the
Directive
introduces
changes
to
the
Enhanced
Due
Diligence
measures
that
are
required
in
respect
of
customer
relationships
or
transactions
involving
high
risk
non
-
EU
countries.
EU
Member
States
are
required
to
implement
the
requirements
of
the
Directive
by
January
2020.
The
UK
Government
has
confirmed
that
it
will
implement
the
requirements
of
the
Directive,
regardless
of
the
outcome
of
Brexit.
In
the
US,
the
Ban
k
Secrecy
Act,
the
USA
PATRIOT
Act
2001
and
regulations
thereunder
contain
numerous
anti-money
laundering
and
anti-
terrorist
financing
requirements
for
financial
institutions.
In
addition,
the
Barclays
Bank
Group
is
subject
to
the
US
Foreign
Corrupt
Practi
ces
Act,
which
prohibits
certain
payments
to
foreign
officials,
as
well
as
rules
and
regulations
relating
to
economic
sanctions
and
embargo
programs
administered
by
the
US
government,
including
the
US
Office
of
Foreign
Assets
Control
and
the
US
Department
of
State,
which
restrict
certain
business
activities
with
certain
individuals,
entities,
groups,
countries
and
territories.
In
some
cases,
US
state
and
federal
regulations
addressing
sanctions,
money
laundering
and
other
financial
crimes
may
impact
entities,
persons
or
activities
located
outside
the
US,
including
Barclays
PLC
and
its
subsidiaries.
The
enforcement
of
these
regulations
has
been
a
major
focus
of
US
Risk
review
Supervision
and
regulation
Barclays
Bank
PLC
2019
Annual
Report
on
Form
20-F
94
state
and
federal
government
policy
relating
to
financial
institutions
in
recent
years,
and
failure
of
a
financial
institution
to
ensure
compliance
could
have
serious
legal,
financial
and
reputational
consequences
for
the
institution.
Financial
statements
Contents
Credit
risk
management
Barclays
Bank
PLC
2019
Annual
Report
on
Form
20-F
95
Detailed
analysis
of
our
consolidated
financial
statements
,
independently
audited
and
providing
in-
depth
disclosure
on
the
financial
performance
of
Barclays
Bank
Group.
Consolidated
financial
statements
Page
Note
◾
Report
of
independent
registered
public
accounting
firm
96
n/a
◾
Consolidated
income
statement
97
n/a
◾
Consolidated
statement
of
comprehensive
income
98
n/a
◾
Consolidated
balance
sheet
99
n/a
◾
Consolidated
statement
of
changes
in
equity
100
n/a
◾
Consolidated
cash
flow
statement
103
n/a
Notes
to
the
financial
statements
◾
Significant
accounting
policies
105
1
Performance/return
◾
Segmental
reporting
110
2
◾
Net
interest
income
111
3
◾
Net
fee
and
commission
income
112
4
◾
Net
trading
income
114
5
◾
Net
investment
income
115
6
◾
Credit
impairment
charges
115
7
◾
Operating
expenses
120
8
◾
Tax
120
9
◾
Dividends
on
ordinary
shares
125
10
Assets
and
liabilities
held
at
fair
value
◾
Trading
portfolio
126
11
◾
Financial
assets
at
fair
value
through
the
income
statement
126
12
◾
Derivative
financial
instruments
127
13
◾
Financial
assets
at
fair
value
through
other
comprehensive
income
136
14
◾
Financial
liabilities
designated
at
fair
value
137
15
◾
Fair
value
of
financial
instruments
138
16
◾
Offsetting
financial
assets
and
financial
liabilities
150
17
Assets
at
amortised
cost
and
other
◾
Loans
and
advances
and
deposits
at
amortised
cost
152
18
i
nvestments
◾
Property,
plant
and
equipment
152
19
◾
Leases
154
20
◾
Goodwill
and
intangible
assets
156
21
Accruals,
provisions,
contingent
◾
Other
liabilities
159
22
liabilities
and
legal
proceedings
◾
Provisions
159
23
◾
Contingent
liabilities
and
commitments
161
24
◾
Legal,
competition
and
regulatory
matters
161
25
Capital
instruments,
equity
and
◾
Subordinated
liabilities
166
26
reserves
◾
Ordinary
shares,
share
premium
and
other
equity
169
27
◾
R
eserves
171
28
◾
Non
-
controlling
interests
172
29
Employee
benefits
◾
Staff
costs
173
30
◾
Share
-
based
payments
173
31
◾
Pensions
and
post-
retirement
benefits
176
32
Scope
of
consolidation
◾
Principal
subsidiaries
182
33
◾
Structured
entities
183
34
◾
Investments
in
associates
and
joint
ventures
187
35
◾
S
ecuritisations
188
36
◾
Assets
pledged
,
collateral
received
and
assets
transferred
189
37
Other
disclosure
matters
◾
Related
party
transactions
and
Directors’
remuneration
191
38
◾
Disposal
of
businesses
and
d
iscontinued
operations
194
39
◾
Auditor
’s
remuneration
196
40
Report
of
Independent
Registered
Public
Accounting
Firm
Barclays
Bank
PLC
2019
Annual
Report
on
Form
20-F
96
Report
of
Independent
Registered
Public
Accounting
Firm
To
the
Shareholders
and
Board
of
Directors
Barclays
Bank
PLC:
Opinion
on
the
Consolidated
Financial
Statements
We
have
audited
the
accompanying
consolidated
balance
sheets
of
Barclays
Bank
PLC
and
subsidiaries
(the
Group)
as
of
December
31,
2019
and
2018,
the
related
consolidated
income
statements,
statements
of
comprehensive
income,
statements
of
changes
in
equity,
and
cash
flow
statements
for
each
of
the
years
in
the
three
-
year
period
ended
December
31,
2019,
and
the
related
notes
and
specific
disclosures
described
in
Note
1
of
the
consolidated
financial
statements
as
being
part
of
the
consolidated
financial
statements
(collectively,
the
consolidated
financial
statements).
In
our
opinion,
the
consolidated
financial
statements
present
fairly,
in
all
material
respects,
the
financial
position
of
the
Group
as
of
December
31,
2019
and
2018,
and
the
results
of
its
operations
and
its
cash
flows
for
each
of
the
years
in
the
three
-
year
period
ended
December
31,
2019,
in
conformity
with
International
Financial
Reporting
Standards,
as
issued
by
the
International
Accounting
Standards
Board.
Change
in
Accounting
Principle
The
Group
changed
its
meth
od
of
accounting
for
financial
instruments
in
2018
due
to
the
adoption
of
International
Financial
Reporting
Standard
9
Financial
Instruments.
Basis
for
Opinion
These
consolidated
financial
statements
are
the
responsibility
of
the
Group’s
management.
Our
re
sponsibility
is
to
express
an
opinion
on
these
consolidated
financial
statements
based
on
our
audits.
We
are
a
public
accounting
firm
registered
with
the
Public
Company
Accounting
Oversight
Board
(United
States)
(PCAOB)
and
are
required
to
be
independent
w
ith
respect
to
the
Group
in
accordance
with
the
U.S.
federal
securities
laws
and
the
applicable
rules
and
regulations
of
the
Securities
and
Exchange
Commission
and
the
PCAOB.
We
conducted
our
audits
in
accordance
with
the
standards
of
the
PCAOB.
Those
standards
require
that
we
plan
and
perform
the
audit
to
obtain
reasonable
assurance
about
whether
the
consolidated
financial
statements
are
free
of
material
misstatement,
whether
due
to
error
or
fraud.
The
Group
is
not
required
to
have,
nor
were
we
engaged
to
perform,
an
audit
of
its
internal
control
over
financial
reporting.
As
part
of
our
audits,
we
are
required
to
obtain
an
understanding
of
internal
control
over
financial
reporting
but
not
for
the
purpose
of
expressing
an
opinion
on
the
effectiveness
of
the
Group’s
internal
control
over
financial
reporting.
Accordingly,
we
express
no
such
opinion.
Our
audits
included
performing
procedures
to
assess
the
risks
of
material
misstatement
of
the
consolidated
financial
statements,
whether
due
to
error
or
fraud,
and
performing
procedures
that
respond
to
those
risks.
Such
procedures
included
examining,
on
a
test
basis,
evidence
regarding
the
amounts
and
disclosures
in
the
consolidated
financial
statements.
Our
audits
also
included
evaluating
the
accounting
principles
u
sed
and
significant
estimates
made
by
management,
as
well
as
evaluating
the
overall
presentation
of
the
consolidated
financial
statements.
We
believe
that
our
audits
provide
a
reasonable
basis
for
our
opinion.
We
have
served
as
the
Group’s
auditor
since
2017.
/s/
KPMG
LLP
London,
United
Kingdom
February
12,
2020
Consolidated
financial
statements
Consolidated
income
statement
Barclays
Bank
PLC
2019
Annual
Report
on
Form
20-F
97
2019
2018
a
2017
a,b
For
the
year
ended
31
December
Notes
£m
£m
£m
Continuing
operations
Interest
income
3
8,085
7,459
6,917
Interest
expense
3
(4,178)
(4,329)
(3,041)
Net
interest
income
3,907
3,130
3,876
Fee
and
commission
income
4
7,664
7,392
7,424
Fee
and
commission
expense
4
(1,992)
(1,785)
(1,726)
Net
fee
and
commission
income
5,672
5,607
5,698
Net
trading
income
5
4,073
4,364
3,396
Net
investment
income
6
420
394
699
Other
income
79
105
61
Total
income
14,151
13,600
13,730
Credit
impairment
charges
7
(1,202)
(643)
(1,553)
Net
operating
income
12,949
12,957
12,177
Staff
costs
30
(4,565)
(4,874)
(4,393)
Infrastructure
costs
8
(835)
(935)
(1,696)
Administration
and
general
expenses
8
(4,318)
(4,224)
(4,141)
Provision
for
litigation
and
conduct
8
(264)
(1,706)
(448)
Operating
expenses
8
(9,982)
(11,739)
(10,678)
Share
of
post-
tax
results
of
associates
and
joint
ventures
57
68
75
Profit
on
disposal
of
subsidiaries,
associates
and
joint
ventures
88
-
184
Profit
before
tax
3,112
1,286
1,758
Taxation
9
(332)
(229)
(1,352)
Profit
after
tax
in
respect
of
continuing
operations
2,780
1,057
406
(Loss)/profit
after
tax
in
respect
of
discontinued
operations
39
-
(47)
(1,386)
Profit/(loss)
after
tax
2,780
1,010
(980)
Attributable
to:
Equity
holders
of
the
parent
2,120
363
(1,763)
Other
equity
instrument
holders
660
647
639
Total
equity
holders
of
the
parent
2,780
1,010
(1,124)
Non
-
controlling
interests
in
respect
of
continuing
operations
29
-
-
4
Non
-
controlling
interests
in
respect
of
discontinued
operations
29
-
-
140
Profit/(loss)
after
tax
2,780
1,010
(980)
Note
a
From
2019,
due
to
an
IAS
12
update,
the
tax
relief
on
payments
in
relation
to
equity
instruments
has
been
recognised
in
the
tax
charge
of
the
income
statement,
whereas
it
was
previously
recorded
in
retained
earnings.
Comparatives
have
been
restated,
reducing
the
tax
charge
for
2018
by
£
175m
and
2017
by
£174m.
This
change
does
not
impact
earnings
per
share
or
return
on
average
tangible
shareholders’
equity.
Further
detail
can
be
found
in
Note
1.
b
Following
the
sale
of
the
UK
banking
business
on
1
April
2018
by
the
Group,
the
continuing
operations
for
2017
have
been
restated
to
disclose
the
UK
banking
business
as
a
discontinued
operation.
Further
detail
on
the
discontinued
operations
can
be
found
in
Note
39.
Consolidated
financial
statements
Consolidated
statement
of
comprehensive
income
Barclays
Bank
PLC
2019
Annual
Report
on
Form
20-F
98
2019
2018
2017
a
For
the
year
ended
31
December
£m
£m
£m
Profit/(loss)
after
tax
2,780
1,010
(980)
Profit
after
tax
in
respect
of
continuing
operations
2,780
1,057
406
Loss
after
tax
in
respect
of
discontinuing
operations
-
(47)
(1,386)
Other
comprehensive
income/(loss)
that
may
be
recycled
to
profit
or
loss
from
continuing
operations:
Currency
translation
reserve
Currency
translation
differences
b
(544)
844
(1,310)
Fair
value
through
other
comprehensive
income
reserve
movement
relating
to
debt
securities
c
Net
gains/(losses)
from
changes
in
fair
value
2,465
(475)
-
Net
(gains)/losses
transferred
to
net
profit
on
disposal
(454)
74
-
Net
losses
transferred
to
net
profit
due
to
impairment
1
4
-
Net
(losses)/gains
due
to
fair
value
hedging
(1,782)
165
-
Other
movements
(8)
(25)
-
Tax
(63)
53
-
Cash
flow
hedging
reserve
Net
gains/(losses)
from
changes
in
fair
value
823
(197)
(428)
Net
gains
transferred
to
net
profit
(141)
(213)
(602)
Tax
(171)
103
256
Available
for
sale
reserve
c
-
-
429
Other
16
27
(7)
Other
comprehensive
income/(loss)
that
may
be
recycled
to
profit
or
loss
from
continuing
operations
142
360
(1,662)
Other
comprehensive
(loss)/income
not
recycled
to
profit
or
loss
from
continuing
operations:
Retirement
benefit
remeasurements
(280)
412
115
Fair
value
through
other
comprehensive
income
reserve
movements
relating
to
equity
instruments
c
-
(141)
-
Own
credit
(316)
77
(7)
Tax
150
(118)
(66)
Other
comprehensive
(loss)/income
not
recycled
to
profit
or
loss
from
continuing
operations
(446)
230
42
Other
comprehensive
(loss)/income
for
the
year
from
continuing
operations
(304)
590
(1,620)
Other
comprehensive
(loss)/gains
for
the
year
from
discontinued
operation
-
(3)
1,301
Total
comprehensive
income/(loss)
for
the
year
Total
comprehensive
income/(loss)
for
the
year,
net
of
tax
from
continuing
operations
2,476
1,647
(1,214)
Total
comprehensive
loss
for
the
year,
net
of
tax
from
discontinued
operation
-
(50)
(85)
Total
comprehensive
income/(loss)
for
the
year
2,476
1,597
(1,299)
Attributable
to:
Equity
holders
of
the
parent
2,476
1,597
(1,411)
Non-controlling
interests
-
-
112
Total
comprehensive
income/(loss)
for
the
year
2,476
1,597
(1,299)
Note
a
Following
the
sale
of
the
UK
banking
business
on
1
April
2018
by
the
Group,
the
continuing
operations
for
2017
have
been
restated
to
disclose
the
UK
banking
business
as
a
discontinued
operation.
Further
detail
on
the
discontinued
operations
can
be
found
i
n
Note
39.
b
Includes
£15
m
profit
(2018:
£41m
loss;
2017:£189m
loss)
on
recycling
of
currency
translation
differences.
c
Following
the
adoption
of
IFRS
9,
Financial
Instruments
on
1
January
2018,
the
fair
value
through
other
comprehensive
income
reserve
was
introduced
replacing
the
available
for
sale
reserve.
Consolidated
financial
statements
Consolidated
balance
sheet
Barclays
Bank
PLC
2019
Annual
Report
on
Form
20-F
99
2019
2018
As
at
31
December
Notes
£m
£m
Assets
Cash
and
balances
at
central
banks
125,940
136,359
Cash
collateral
and
settlement
balances
79,486
74,352
Loans
and
advances
at
amortised
cost
18
141,636
136,959
Reverse
repurchase
agreements
and
other
similar
secured
lending
1,731
1,613
Trading
portfolio
assets
11
113,337
104,038
Financial
assets
at
fair
value
through
the
income
statement
12
129,470
145,250
Derivative
financial
instruments
13
229,641
222,683
Financial
assets
at
fair
value
through
other
comprehensive
income
14
45,406
44,994
Investments
in
associates
and
joint
ventures
35
295
762
Goodwill
and
intangible
assets
21
1,212
1,327
Property,
plant
and
equipment
19
1,631
947
Current
tax
assets
9
898
1,713
Deferred
tax
assets
9
2,460
2,970
Retirement
benefit
assets
32
2,108
1,768
Other
assets
1,421
1,965
Total
assets
876,672
877,700
Liabilities
Deposits
at
amortised
cost
18
213,881
199,337
Cash
collateral
and
settlement
balances
67,682
67,736
Repurchase
agreements
and
other
similar
secured
borrowing
2,032
7,378
Debt
securities
in
issue
33,536
39,063
Subordinated
liabilities
26
33,425
35,327
Trading
portfolio
liabilities
11
35,212
36,614
Financial
liabilities
designated
at
fair
value
15
204,446
217,741
Derivative
financial
instruments
13
228,940
219,592
Current
tax
liabilities
9
320
621
Deferred
tax
liabilities
9
80
-
Retirement
benefit
liabilities
32
313
283
Other
liabilities
22
5,239
5,170
Provisions
23
951
1,127
Total
liabilities
826,057
829,989
Equity
Called
up
share
capital
and
share
premium
27
2,348
2,348
Other
equity
instruments
27
8,323
7,595
Other
reserves
28
3,235
3,361
Retained
earnings
36,709
34,405
Total
equity
excluding
non
-
controlling
interests
50,615
47,709
Non
-
controlling
interests
29
-
2
Total
equity
50,615
47,711
Total
liabilities
and
equity
876,672
877,700
The
Board
of
Directors
approved
the
financial
statements
on
pages
97
to
196
on
12
February
2020.
James
E
Staley
Barclays
Bank
Group
–
Chief
Executive
Officer
Steven
Ewart
Barclays
Bank
Group
–
Chief
Financial
Officer
Consolidated
financial
statements
Consolidated
statement
of
changes
in
equity
Barclays
Bank
PLC
2019
Annual
Report
on
Form
20-F
100
Called
up
share
capital
and
share
premium
a
Other
equity
instruments
a
Other
reserves
b
Retained
earnings
Total
equity
excluding
non-
controlling
interests
Non
-
controlling
interests
Total
equity
£m
£m
£m
£m
£m
£m
£m
Balance
as
at
1
January
2019
2,348
7,595
3,361
34,405
47,709
2
47,711
Profit
after
tax
-
660
-
2,120
2,780
-
2,780
Currency
translation
movements
-
-
(544)
-
(544)
-
(544)
Fair
value
through
other
comprehensive
income
reserve
-
-
159
-
159
-
159
Cash
flow
hedges
-
-
511
-
511
-
511
Retirement
benefit
remeasurement
-
-
-
(194)
(194)
-
(194)
Own
credit
reserve
-
-
(252)
-
(252)
-
(252)
Other
-
-
-
16
16
-
16
Total
comprehensive
income
for
the
year
-
660
(126)
1,942
2,476
-
2,476
Issue
and
exchange
of
other
equity
instruments
-
728
-
(406)
322
-
322
Other
equity
instruments
coupons
paid
-
(660)
-
-
(660)
-
(660)
Equity
settled
share
schemes
-
-
-
392
392
-
392
Vesting
of
Barclays
PLC
shares
under
share
-
based
payment
schemes
-
-
-
(349)
(349)
-
(349)
Dividends
on
ordinary
shares
-
-
-
(233)
(233)
-
(233)
Dividends
on
preference
shares
and
other
shareholders
equity
-
-
-
(41)
(41)
-
(41)
Capital
contribution
from
Barclays
Plc
-
-
-
995
995
-
995
Other
reserve
movements
-
-
-
4
4
(2)
2
Balance
as
at
31
December
2019
2,348
8,323
3,235
36,709
50,615
-
50,615
Notes
a
For
further
details
refer
to
Note
27.
b
For
further
details
refer
to
Note
28.
Consolidated
financial
statements
Consolidated
statement
of
changes
in
equity
Barclays
Bank
PLC
2019
Annual
Report
on
Form
20-F
101
Called
up
share
capital
and
share
premium
a
Other
equity
instruments
a
Other
reserves
b
Retained
earnings
c
Total
equity
excluding
non-
controlling
interests
Non
-
controlling
interests
Total
equity
£m
£m
£m
£m
£m
£m
£m
Balance
as
at
31
December
2017
14,453
8,982
3,808
38,490
65,733
1
65,734
Effects
of
changes
in
accounting
policies
d
-
-
(136)
(2,014)
(2,150)
-
(2,150)
Balance
as
at
1
January
2018
14,453
8,982
3,672
36,476
63,583
1
63,584
Profit
after
tax
-
647
-
410
1,057
-
1,057
Currency
translation
movements
-
-
844
-
844
-
844
Fair
value
through
other
comprehensive
income
reserve
-
-
(345)
-
(345)
-
(345)
Cash
flow
hedges
-
-
(307)
-
(307)
-
(307)
Retirement
benefit
remeasurement
-
-
-
313
313
-
313
Own
credit
reserve
-
-
58
-
58
-
58
Other
-
-
-
27
27
-
27
Total
comprehensive
income
net
of
tax
from
continuing
operations
-
647
250
750
1,647
-
1,647
Total
comprehensive
income
net
of
tax
from
discontinued
operations
-
-
(3)
(47)
(50)
-
(50)
Total
comprehensive
income
for
the
year
-
647
247
703
1,597
-
1,597
Issue
and
exchange
of
other
equity
instruments
-
683
-
(312)
371
-
371
Capital
reorganisation
(12,092)
-
-
12,092
-
-
-
Other
equity
instruments
coupons
paid
-
(647)
-
-
(647)
-
(647)
Redemption
of
preference
shares
(13)
-
21
(2,048)
(2,040)
-
(2,040)
Equity
to
debt
reclassification
e
-
-
(272)
-
(272)
-
(272)
Equity
settled
share
schemes
-
-
-
373
373
-
373
Vesting
of
Barclays
PLC
shares
under
share
-
based
payment
schemes
-
-
-
(418)
(418)
-
(418)
Dividends
on
ordinary
shares
-
-
-
(14,585)
(14,585)
-
(14,585)
Dividends
on
preference
shares
and
other
shareholders
equity
-
-
-
(204)
(204)
-
(204)
Capital
contribution
from
Barclays
Plc
-
-
-
3,000
3,000
-
3,000
Net
equity
impact
of
intra
-
group
transfers
-
(2,070)
(307)
(638)
(3,015)
-
(3,015)
Other
reserve
movements
-
-
-
(34)
(34)
1
(33)
Balance
as
at
31
December
2018
2,348
7,595
3,361
34,405
47,709
2
47,711
Notes
a
For
further
details
refer
to
Note
27.
b
For
further
details
refer
to
Note
28.
c
From
2019,
due
to
an
IAS
12
update,
the
tax
relief
on
payments
in
relation
to
AT1
instruments
has
been
recognised
in
the
tax
charge
of
the
income
statement,
whereas
it
was
previously
recorded
in
retained
earnings.
This
change
does
not
impact
earnings
per
share
or
return
on
average
tangible
shareholders’
equity.
Comparatives
have
been
restated,
reducin
g
the
tax
charge
for
2018
by
£175
m.
Further
detai
l
can
be
found
in
Note
1.
d
Effects
of
changes
in
accounting
policies
relate
to
the
adoption
of
IFRS
9
Financial
Instruments
and
IFRS
15
Revenue
from
Contracts
with
Customers
on
1
January
2018.
The
impact
of
IFRS
15
Revenue
from
Contracts
with
Customers
was
an
increase
to
retained
earnings
of
£67m
with
the
remainder
due
to
the
impact
of
IFRS
9
Financial
Instruments
.
e
Following
a
review
of
certain
equity
instruments,
certain
instruments
have
been
deemed
to
have
characteristics
that
would
qualify
them
as
debt
and
have
subsequently
been
reclassified.
Consolidated
financial
statements
Consolidated
statement
of
changes
in
equity
Barclays
Bank
PLC
2019
Annual
Report
on
Form
20-F
102
Called
up
share
capital
and
share
premium
a
Other
equity
instruments
a
Other
reserves
b
Retained
earnings
Total
equity
excluding
non-
controlling
interests
Non
-
controlling
interests
Total
equity
£m
£m
£m
£m
£m
£m
£m
Balance
as
at
31
December
2016
14,462
6,486
4,295
42,190
67,433
3,522
70,955
Effects
of
changes
in
accounting
policies
c
-
-
(175)
175
-
-
-
Balance
as
at
1
January
2017
14,462
6,486
4,120
42,365
67,433
3,522
70,955
Profit
after
tax
-
639
(411)
228
4
232
Currency
translation
movements
-
-
(1,309)
-
(1,309)
(1)
(1,310)
Fair
value
through
other
comprehensive
income
reserve
-
-
429
-
429
-
429
Cash
flow
hedges
-
-
(774)
-
(774)
-
(774)
Retirement
benefit
remeasurement
-
-
53
53
-
53
Own
credit
reserve
-
-
(11)
-
(11)
-
(11)
Other
-
-
-
(7)
(7)
-
(7)
Total
comprehensive
income
net
of
tax
from
continuing
operation
-
639
(1,665)
(365)
(1,391)
3
(1,388)
Total
comprehensive
income
net
of
tax
from
discontinued
operation
-
-
1,332
(1,526)
(194)
109
(85)
Total
comprehensive
income
for
the
year
-
639
(333)
(1,891)
(1,585)
112
(1,473)
Issue
and
exchange
of
other
equity
instruments
-
2,496
-
-
2,496
-
2,496
Other
equity
instruments
coupons
paid
-
(639)
-
174
(465)
-
(465)
Redemption
of
preference
shares
(9)
-
14
(1,343)
(1,338)
-
(1,338)
Equity
settled
share
schemes
-
-
-
550
550
-
550
Vesting
of
Barclays
PLC
shares
under
share
-
based
payment
schemes
-
-
-
(78)
(78)
-
(78)
Dividends
on
ordinary
shares
-
-
-
(674)
(674)
(173)
(847)
Dividends
on
preference
shares
and
other
shareholders
equity
-
-
-
(242)
(242)
-
(242)
Capital
contribution
from
Barclays
Plc
-
-
-
-
-
-
-
Net
equity
impact
of
intra
-group
transfers
-
-
-
(359)
(359)
(3,462)
(3,821)
Other
reserve
movements
-
-
7
(12)
(5)
2
(3)
Balance
as
at
31
December
2017
14,453
8,982
3,808
38,490
65,733
1
65,734
Note
a
For
further
details
refer
to
Note
27.
b
For
further
details
refer
to
Note
28.
c
As
a
result
of
the
early
adoption
of
the
own
credit
provisions
of
IFRS
9
on
1
January
2017,
own
credit
which
was
previously
recorded
in
the
income
statement
is
now
recognised
within
other
comprehensive
income.
The
cumulative
unrealised
own
credit
net
loss
of
£175m
was
therefore
reclassified
from
retained
earnings
to
a
separate
own
credit
reserve,
within
other
reserves.
During
2017,
a
£
3m
loss
(net
of
tax)
on
own
credit
was
booked
in
the
reserve.
Consolidated
financial
statements
Consolidated
cash
flow
statement
Barclays
Bank
PLC
2019
Annual
Report
on
Form
20-F
103
2019
2018
2017
a
For
the
year
ended
31
December
Notes
£m
£m
£m
Continuing
operations
Reconciliation
of
profit
before
tax
to
net
cash
flows
from
operating
activities:
Profit
before
tax
3,112
1,286
1,758
Adjustment
for
non-cash
items:
Credit
impairment
charges
1,202
643
1,553
Depreciation,
amortisation
and
impairment
of
property,
plant,
equipment
and
intangibles
459
397
663
Other
provisions,
including
pensions
417
2,274
770
Net
profit
on
disposal
of
investments
and
property,
plant
and
equipment
(84)
-
(314)
Other
non-cash
movements
including
exchange
rate
movements
1,060
(3,877)
1,565
Changes
in
operating
assets
and
liabilities
Net
increase
in
cash
collateral
and
settlement
balances
(6,427)
(5,606)
(3,912)
Net
(increase)/decrease
in
loans
and
advances
at
amortised
cost
(5,125)
(3,890)
26,062
Net
increase
in
reverse
repurchase
agreements
and
other
similar
secured
lending
(118)
(434)
(1,827)
Net
increase
in
deposits
and
debt
securities
in
issue
8,782
16,330
938
Net
(decrease)/increase
in
repurchase
agreements
and
other
similar
secured
borrowing
(5,346)
2
16,978
Net
decrease/(increase)
in
derivative
financial
instruments
2,390
(6,419)
6,770
Net
(increase)/decrease
in
trading
assets
(9,299)
10,102
(33,179)
Net
(decrease)/increase
in
trading
liabilities
(1,402)
1,688
2,665
Net
decrease/(increase)
in
financial
assets
and
liabilities
designated
at
fair
value
2,485
(6,284)
39,507
Net
(increase)/decrease
in
other
assets
(44)
949
(721)
Net
decrease
in
other
liabilities
(991)
(6,099)
(2,014)
Corporate
income
tax
received/(paid)
9
894
(409)
59
Net
cash
from
operating
activities
(8,035)
653
57,321
Purchase
of
financial
assets
at
fair
value
through
other
comprehensive
income
(67,056)
(106,330)
-
Purchase
of
available
for
sale
investments
-
-
(83,233)
Proceeds
from
sale
or
redemption
of
financial
assets
at
fair
value
through
other
comprehensive
income
67,743
108,038
-
Proceeds
from
sale
or
redemption
of
available
for
sale
investments
-
-
88,298
Purchase
of
property,
plant
and
equipment
and
intangibles
(610)
(422)
(714)
Proceeds
from
sale
of
property,
plant
and
equipment
and
intangibles
-
35
2,150
Disposal
of
discontinued
operation,
net
of
cash
disposed
-
(39,703)
(1,060)
Disposal
of
subsidiaries
and
associates,
net
of
cash
disposed
617
-
358
Other
cash
flows
associated
with
investing
activities
95
1,191
693
Net
cash
from
investing
activities
789
(37,191)
6,492
Dividends
paid
and
coupon
payments
on
other
equity
instruments
(934)
(1,142)
(1,427)
Issuance
of
subordinated
debt
26
6,785
221
3,041
Redemption
of
subordinated
debt
26
(6,574)
(3,246)
(1,378)
Issue
of
shares
and
other
equity
instruments
2,292
1,925
2,495
Redemption
of
shares
and
other
equity
instruments
(1,970)
(3,588)
(1,339)
Capital
contribution
from
Barclays
PLC
-
2,000
-
Vesting
of
shares
under
employee
share
schemes
(349)
(418)
-
Net
cash
from
financing
activities
(750)
(4,248)
1,392
Effect
of
exchange
rates
on
cash
and
cash
equivalents
(3,345)
4,159
(4,773)
Net
(decrease)/increase
in
cash
and
cash
equivalents
from
continuing
operations
(11,341)
(36,627)
60,432
Net
cash
from
discontinued
operation
40
-
(468)
88
Net
(decrease)/increase
in
cash
and
cash
equivalents
(11,341)
(37,095)
60,520
Cash
and
cash
equivalents
at
beginning
of
year
167,357
204,452
143,932
Cash
and
cash
equivalents
at
end
of
year
156,016
167,357
204,452
Cash
and
cash
equivalents
comprise:
Cash
and
balances
at
central
banks
125,940
136,359
171,036
Loans
and
advances
to
banks
with
original
maturity
less
than
three
months
8,158
7,404
8,050
Cash
collateral
and
settlement
balances
with
banks
with
original
maturity
less
than
three
months
21,438
22,677
24,656
Treasury
and
other
eligible
bills
with
original
maturity
less
than
three
months
480
917
682
Trading
portfolio
assets
with
original
maturity
less
than
three
months
-
-
28
156,016
167,357
204,452
Consolidated
financial
statements
Consolidated
cash
flow
statement
Barclays
Bank
PLC
2019
Annual
Report
on
Form
20-F
104
Note
a
Following
the
sale
of
the
UK
banking
business
on
1
April
2018
by
the
Group,
the
continuing
operations
for
2017
have
been
restated
to
disclose
the
UK
banking
business
as
a
discontinued
operation.
Further
detail
on
the
discontinued
operations
can
be
found
in
Note
39.
Interest
received
by
Barclays
Bank
Group
was
£
26,
637m
(2018:
£
1
8,990m)
and
interest
paid
by
Barclays
Bank
Group
was
£
21,314
m
(2018:
£1
4,800
m).
Barclays
Bank
Group
is
required
to
maintain
balances
with
central
banks
and
other
regulatory
authorit
ies
and
these
amounted
to
£4,505
m
(
2018
:
£4
,716
m).
For
the
purposes
of
the
cash
flow
statement,
cash
comprises
cash
on
hand
and
demand
deposits
and
cash
equivalents
comprise
highly
liquid
investments
that
are
convertible
into
cash
with
an
insignificant
risk
of
changes
in
value
with
original
maturities
of
three
months
or
less.
Repurchase
and
reverse
repurchase
agreements
are
not
considered
to
be
part
of
cash
equivalents.
Notes
to
the
financial
statements
For
the
year
ended
31
December
2019
Barclays
Bank
PLC
2019
Annual
Report
on
Form
20-F
105
This
section
describes
Barclays
Bank
Group’s
significant
policies
and
critical
accounting
estimates
that
relate
to
the
financial
statements
and
notes
as
a
whole.
If
an
accounting
policy
or
a
critical
accounting
estimate
relates
to
a
particular
note,
the
account
ing
policy
and/or
critical
accounting
estimate
is
contained
with
the
relevant
note.
1
Significant
accounting
policies
1.
Reporting
entity
Barclays
Bank
PLC
is
a
public
limited
company,
registered
in
England
under
company
number
1026167.
These
financial
statements
are
prepared
for
Barclays
Bank
PLC
and
its
subsidiaries
(the
Barclays
Bank
Group)
under
Section
399
of
the
Companies
Act
2006.
The
Barclays
Bank
Group
is
a
major
global
financial
services
provider
engaged
in
credit
cards,
wholesale
banking,
inve
stment
banking,
wealth
management
and
investment
management
services.
In
addition,
separate
financial
statements
have
been
presented
for
the
holding
company.
2.
Compliance
with
International
Financial
Reporting
Standards
The
consolidated
financial
statements
of
the
Barclays
Bank
Group
have
been
prepared
in
accordance
with
International
Financial
Reporting
Standards
(IFRS)
and
interpretations
(IFRICs)
issued
by
the
Interpretations
Committee,
as
published
by
the
International
Accounting
Standards
Boar
d
(IASB).
They
are
also
in
accordance
with
IFRS
and
IFRIC
interpretations
endorsed
by
the
European
Union.
The
principal
accounting
policies
applied
in
the
preparation
o
f
the
consolidated
and
separate
financial
statements
are
set
out
below,
and
in
the
relev
ant
notes
to
the
financial
statements.
These
policies
have
been
consistently
applied
with
the
exception
of
the
adoption
of
IFRS
16
Leases,
Uncertainty
over
Income
Tax
Treatments,
Income
Taxes,
Employee
Benefits,
IFRS
9,
IAS
39
and
IFRS
7
which
were
applied
from
1
January
2019.
3.
Basis
of
preparation
The
consolidated
financial
statements
have
been
prepared
under
the
historical
cost
convention
modified
to
include
the
fair
valuation
of
investment
property,
and
particular
financial
instruments,
to
the
extent
required
or
permitted
under
IFRS
as
set
out
in
the
relevant
acc
ounting
policies.
They
are
stated
in
millions
of
pounds
Sterling
(£m),
the
functional
currency
of
Barclays
Bank
PLC.
The
financial
statements
have
been
prepared
on
a
going
concern
basis,
in
accordance
with
the
Companies
Act
2006
as
applicable
to
companies
using
IFRS.
4.
Accounting
policies
The
Barclays
Bank
Group
prepares
financial
statements
in
accordance
with
IFRS.
The
Barclays
Bank
Group
’s
significant
accounting
policies
relating
to
specific
financial
statement
items,
together
with
a
description
of
the
accounting
estimates
and
judgements
that
were
critical
to
preparing
them,
are
set
out
under
the
relevant
notes.
Accounting
policies
that
affect
the
financial
statements
as
a
whole
are
set
out
below.
(i)
Consolidation
Barclays
Bank
Group
applies
IFRS
10
Consolidated
financial
statements
.
The
consolidated
financial
statements
combine
the
financial
statements
of
Barclays
Bank
PLC
and
all
its
subsidiaries.
Subsidiaries
are
entities
over
which
Barclays
Bank
PLC
has
control.
The
Barclays
Bank
Group
has
contro
l
over
another
entity
when
the
Barclays
Bank
Group
has
all
of
the
following:
1)
power
over
the
relevant
activities
of
the
investee,
for
example
through
voting
or
other
rights
2)
exposure
to,
or
rights
to,
variable
returns
from
its
involvement
with
the
investee
and
3)
the
ability
to
affect
those
returns
through
its
power
over
the
investee.
The
assessment
of
control
is
based
on
the
consideration
of
all
facts
and
circumstances.
The
Barclays
Bank
Group
reassesses
whether
it
controls
an
investee
if
facts
and
circumstances
indicate
that
there
are
changes
to
one
or
more
of
the
three
elements
of
control.
Intra
-
group
transactions
and
balances
are
eliminated
on
consolidation.
Consistent
accounting
policies
are
used
throughout
the
Barclays
Bank
Group
for
the
purpos
es
of
the
consolidation.
Changes
in
ownership
interests
in
subsidiaries
are
accounted
for
as
equity
transactions
if
they
occur
after
control
has
already
been
obtained
and
they
do
not
result
in
loss
of
control.
As
the
consolidated
financial
statements
inc
lude
partnerships
where
the
Barclays
Bank
Group
member
is
a
partner,
advantage
has
been
taken
of
the
exemption
under
Regulation
7
of
the
Partnership
(Accounts)
Regulations
2008
with
regard
to
preparing
and
filing
of
individual
partnership
financial
statements.
Details
of
the
principal
subsidiaries
are
given
in
Note
33
,.
(ii)
Foreign
currency
translation
The
Barclays
Bank
Group
applies
IAS
21
The
Effects
of
Changes
in
Foreign
Exchange
Rates
.
Transactions
in
foreign
currencies
are
translated
into
Sterling
at
the
rate
ruling
on
the
date
of
the
transaction.
Foreign
currency
monetary
balances
are
translated
into
Sterling
at
the
period
end
exchange
rates.
Exchange
gains
and
losses
on
such
balances
are
taken
to
the
income
statement.
Non
-
monetary
foreign
currenc
y
balances
are
carried
at
historical
transaction
date
exchange
rates.
The
Barclays
Bank
Group
’s
foreign
operations
(including
subsidiaries,
joint
ventures,
associates
and
branches)
based
mainly
outside
the
UK
may
have
different
functional
currencies.
The
functional
currency
of
an
operation
is
the
currency
of
the
main
economy
to
which
it
is
exposed.
Notes
to
the
financial
statements
For
the
year
ended
31
December
2019
Barclays
Bank
PLC
2019
Annual
Report
on
Form
20-F
106
1
Significant
accounting
policies
Prior
to
consolidation
(or
equity
accounting)
the
assets
and
liabilities
of
non
-
Sterling
operations
are
translated
at
the
period
end
exchange
rate
and
items
of
income,
expense
and
other
comprehensive
income
are
translated
into
Sterling
at
the
rate
on
the
date
of
the
transactions.
Exchange
differences
arising
on
the
translation
of
foreign
operations
are
inclu
ded
in
currency
translation
reserves
within
equity.
These
are
transferred
to
the
income
statement
when
the
Barclays
Bank
Group
disposes
of
the
entire
interest
in
a
foreign
operation,
when
partial
disposal
results
in
the
loss
of
control
of
an
interest
in
a
subsidiary,
when
an
investment
previously
accounted
for
using
the
equity
method
is
accounted
for
as
a
financial
asset,
or
on
the
disposal
of
an
autonomous
foreign
operation
within
a
branch.
The
Barclays
Bank
Group
applies
IFRS
9
Financial
Instruments
assets
and
financial
liabilities
and
the
impairment
of
financial
assets.
The
Barclays
Bank
Group
applies
the
req
uirements
of
IAS
39
Financial
Instruments:
Recognition
and
Measurement
Recognition
The
Barclays
Bank
Group
recognises
financial
assets
and
liabilities
when
it
becomes
a
party
to
the
terms
of
the
contract.
Trade
date
or
settlement
date
accounting
is
applied
depending
on
the
classification
of
the
financial
asset.
Classification
and
measurement
Financial
assets
are
classified
on
the
basis
of
two
criteria:
i)
the
business
model
within
which
financial
assets
are
managed;
and
ii)
their
contractual
cash
flow
characteristics
(whether
the
cash
flows
represent
‘solely
payments
of
principal
and
interest’
(SPPI)).
The
Barclays
Bank
Group
assesses
the
business
model
criteria
at
a
portfolio
level.
In
formation
that
is
considered
in
determining
the
applicable
business
model
includes
(i)
policies
and
objectives
for
the
relevant
portfolio,
(ii)
how
the
performance
and
risks
of
the
portfolio
are
managed,
evaluated
and
reported
to
management,
and
(iii)
the
frequency,
volume
and
timing
of
sales
in
prior
periods,
sales
expectation
for
future
periods,
and
the
reasons
for
such
sales.
The
contractual
cash
flow
characteristics
of
financial
assets
are
assessed
with
reference
to
whether
the
cash
flows
represent
SPP
I.
In
assessing
whether
contractual
cash
flows
are
SPPI
compliant,
interest
is
defined
as
consideration
primarily
for
the
time
value
of
money
and
the
credit
risk
of
the
principal
outstanding.
The
time
value
of
money
is
defined
as
the
element
of
interest
that
provides
consideration
only
for
the
passage
of
time
and
not
consideration
for
other
risks
or
costs
associated
with
holding
the
financial
asset.
Terms
that
could
change
the
contractual
cash
flows
so
that
it
would
not
meet
the
condition
for
SPPI
are
consi
dered,
including:
(i)
contingent
and
leverage
features,
(ii)
non
-
recourse
arrangements
and
(iii)
features
that
could
modify
the
time
value
of
money.
Financial
assets
ar
e
measured
at
amortised
cost
if
they
are
held
within
a
business
model
whose
objective
is
to
hold
financial
assets
in
order
to
collect
contractual
cash
flows,
and
their
contractual
cash
flows
represent
SPPI
.
Financial
assets
ar
e
measured
at
fair
value
through
other
comprehensive
income
if
they
are
held
within
a
business
model
whose
objective
is
achieved
by
both
collecting
contractual
cash
flows
and
selling
financial
assets,
and
their
contractual
cash
flows
represent
SPPI
.
Other
financial
assets
are
measured
at
fair
value
through
profit
and
loss.
There
is
an
option
to
make
an
irrevocable
election
on
initial
recognition
for
non
traded
equity
investments
to
be
measured
at
fair
value
through
other
comprehensive
income,
in
which
case
dividends
are
recognised
in
profit
or
loss,
but
gains
or
losses
are
not
reclassified
to
profit
or
loss
upon
derecognition,
and
the
impairment
requirements
of
IFRS
9
do
not
apply
.
The
accounting
policy
for
each
type
of
financial
asset
or
liability
is
included
within
the
relevant
note
for
the
item.
The
Barclays
Bank
Group’s
policies
for
determining
the
fair
values
of
the
assets
and
liabilities
are
set
out
in
Note
16.
Derecognition
The
Barclays
Bank
Group
derecognises
a
financial
asset,
or
a
portion
of
a
financial
asset,
from
its
balance
sheet
where
the
contractual
rights
to
cash
flows
from
the
asset
have
expired,
or
have
been
transferred,
usually
by
sale,
and
with
them
either
substantially
all
the
risks
and
rewards
of
the
asset
or
significant
risks
and
rewa
rds,
along
with
the
unconditional
ability
to
sell
or
pledge
the
asset.
Financial
liabilities
are
de
-
recognised
when
the
liability
has
been
settled,
has
expired
or
has
been
extinguished.
An
exchange
of
an
existing
financial
liability
for
a
new
liability
with
the
same
lender
on
substantially
different
terms
–
generally
a
difference
of
10%
or
more
in
the
present
value
of
the
cash
flows
or
a
substantive
qualitative
amendment
–
is
accounted
for
as
an
extinguishment
of
the
original
financial
liability
and
the
re
cognition
of
a
new
financial
liability.
Transactions
in
which
the
Barclays
Bank
Group
transfers
assets
and
liabilities,
portions
of
them,
or
financial
risks
associated
with
them
can
be
complex
and
it
may
not
be
obvious
whether
substantially
all
of
the
risks
and
rewards
have
been
transferred.
It
is
often
necessary
to
perform
a
quantitative
analysis.
Such
an
analysis
compares
the
Barclays
Bank
Group’s
exposure
to
variability
in
asset
cash
flows
before
the
transfer
with
its
retained
exposure
after
the
transfe
r.
A
cash
flow
analysis
of
this
nature
may
require
judgement.
In
particular,
it
is
necessary
to
estimate
the
asset’s
expected
future
cash
flows
as
well
as
potential
variability
around
this
expectation.
The
method
of
estimating
expected
future
cash
flows
depends
on
the
nature
of
the
asset,
with
market
and
market
-
implied
data
used
to
the
greatest
extent
possible.
The
potential
variability
around
this
expectation
is
typically
determined
by
stressing
underlying
parameters
to
create
reasonable
alternative
upside
and
downside
scenarios.
Probabilities
are
then
assigned
to
each
scenario.
Stressed
parameters
may
include
default
rates,
loss
severity,
or
prepayment
rates.
Notes
to
the
financial
statements
For
the
year
ended
31
December
2019
Barclays
Bank
PLC
2019
Annual
Report
on
Form
20-F
107
1
Significant
accounting
policies
Accounting
for
reverse
repurchase
and
repurchase
agreements
including
other
similar
lending
and
borrowing
Reverse
repurchase
agreements
(and
stock
borrowing
or
similar
transaction)
are
a
form
of
secured
lending
whereby
the
Barclays
Bank
Group
provides
a
lo
an
or
cash
collateral
in
exchange
for
the
transfer
of
collateral,
generally
in
the
form
of
marketable
securities
subject
to
an
agreement
to
transfer
the
securities
back
at
a
fixed
price
in
the
future.
Repurchase
agreements
are
where
the
Barclays
Bank
Group
obtains
such
loans
or
cash
collateral,
in
exchange
for
the
transfer
of
collateral.
The
Barclays
Bank
Group
purchases
(a
reverse
repurchase
agreement)
or
borrows
securities
subject
to
a
commitment
to
resell
or
return
them.
The
securities
are
not
included
in
the
balance
sheet
as
the
Barclays
Bank
Group
does
not
acquire
the
risks
and
rewards
of
ownership.
Consideration
paid
(or
cash
collateral
provided)
is
accounted
for
as
a
loan
asset
at
amortised
cost,
unless
it
is
designated
or
mandatorily
at
fair
value
through
profit
and
loss.
The
Barclays
Bank
Group
may
also
sell
(a
repurchase
agreement)
or
lend
securities
subject
to
a
commitment
to
repurchase
or
redeem
them.
The
securities
are
retained
on
the
balance
sheet
as
the
Barclays
Bank
Group
retains
substantially
all
the
risks
and
rewards
of
ownership.
Consideration
received
(or
cash
collateral
provided)
is
accounted
for
as
a
financial
liability
at
amortised
cost,
unless
it
is
designated
at
fair
value
through
profit
and
loss.
The
Barclays
Bank
Group
applies
IAS
32,
Financial
Instruments:
Presentation
,
to
determine
whether
funding
is
either
a
financial
liability
(debt)
or
equity.
Issued
financial
instruments
or
their
components
are
classified
as
liabilities
if
the
contractual
arrangement
results
in
the
Barclays
Bank
Group
having
an
obligation
to
either
deliver
cash
or
another
financial
asset,
or
a
variable
number
of
equity
shares,
to
the
holder
of
the
instrument.
If
this
is
not
the
case,
the
instrument
is
generally
an
equity
instrument
and
the
proceeds
included
in
equity,
net
of
transaction
costs.
Dividends
and
other
returns
to
equity
holders
are
recognised
when
paid
or
declared
by
the
members
at
the
AGM
and
treated
as
a
deduction
fro
m
equity.
Where
issued
financial
instruments
contain
both
liability
and
equity
components,
these
are
accounted
for
separately.
The
fair
value
of
the
debt
is
estimated
first
and
the
balance
of
the
proceeds
is
included
within
equity.
5.
New
and
amended
standards
and
interpretations
The
accounting
policies
adopted
are
consistent
with
those
of
the
previous
financial
year,
with
the
exception
of
the
adoption
of
IFRS
16
Leases
,
IFRIC
Interpretation
23
Uncertainty
over
Income
Tax
Treatment
,
the
amendments
to
IAS
12
Income
Taxes
,
the
amendments
to
IAS
19
Employee
Benefits
,
and
the
amendments
to
IFRS
9,
IAS
39
and
IFRS
7
which
were
applied
from
1
January
2019.
IFRS
16
–
Leases
IFRS
16
Leases
,
which
replaced
IAS
17
Leases
,
was
applied
effective
from
1
January
2019.
IFRS
16
does
not
result
in
a
significant
change
to
lessor
accounting;
however,
for
lessee
accounting
there
is
no
longer
a
distinction
between
operating
and
finance
leases.
Instead,
the
lessee
is
required
to
recognis
e
both
a
r
ight
of
use
(ROU)
Asset
and
lease
liability
on
-
balance
sheet.
There
is
a
recognition
exemption
permitted
for
leases
with
a
term
of
12
months
or
less.
The
Barclays
Bank
Group
applied
IFRS
16
on
a
modified
retrospective
basis
and
took
advantage
of
the
optio
n
not
to
restate
comparative
periods.
The
Barclays
Bank
Group
applied
the
following
transition
options
available
under
the
modified
retrospective
approach:
●
To
calculate
the
right
of
use
asset
equal
to
the
lease
liability,
adjusted
for
prepaid
or
accrued
payments.
●
To
rely
on
the
previous
assessment
of
whether
leases
are
onerous
in
accordance
with
IAS
37
immediately
before
the
date
of
initial
application
as
an
alternative
to
performing
an
impairment
review.
The
Barclays
Bank
Group
adjusted
the
carrying
amou
nt
of
the
ROU
asset
at
the
date
of
initial
application
by
the
previous
carrying
amount
of
its
onerous
lease
provision.
●
To
apply
the
recognition
exception
for
leases
with
a
term
not
exceeding
12
months.
●
To
use
hindsight
in
determining
the
lease
term
if
the
contract
contains
options
to
extend
or
terminate
the
lease.
Upon
adoption
of
IFRS
16,
the
Barclays
Bank
Group
applied
the
transition
option
which
permitted
the
ROU
asset
to
equal
the
lease
liability,
adjusted
for
prepaid
or
accrued
prepayments.
This
approach
resulted
in
a
lease
liability
of
£569m
and
an
ROU
asset
o
f
£509m
being
recognised
as
at
1
January
2019.
Th
e
difference
in
the
lease
liability
and
the
ROU
asset
was
a
result
of
the
following
adjustments:
●
An
increase
in
the
ROU
asset
as
a
result
of
rental
prepayments
o
f
£
1
4m
and,
●
A
decrease
in
the
ROU
asset
as
a
result
of
onerous
lease
provisions
previously
reco
gnised
of
£46m,
£
25
m
of
rent
free
adjustments
and
£3m
of
finance
sublease
arrangements
.
The
ROU
asset
was
recorded
in
property,
plant
and
equipment
and
the
lease
liability
within
other
liabilitites.
When
measuring
lease
liabilities,
the
Barclays
Bank
Group
discounted
lease
payments
using
the
incremental
borrowing
rate
at
1
January
2019.
The
weighted
average
applied
was
4.59%.
Notes
to
the
financial
statements
For
the
year
ended
31
December
2019
Barclays
Bank
PLC
2019
Annual
Report
on
Form
20-F
108
The
following
shows
a
reconciliation
between
the
operating
lease
commitments
as
at
31
December
2018
and
the
lease
liability
recorded
as
at
1
January
2019.
£m
Operating
lease
commitment
as
at
31
December
2018
as
disclosed
in
the
Barclays
Bank
Group
consolidated
financial
statements
1,071
Impact
of
discounting
using
the
Barclays
Bank
Group's
incremental
borrowing
rate
(488)
Recognition
exemption
for
short
term
leases
(3)
Extension
and
termination
options
reasonably
certain
to
be
exercised
(11)
Lease
liability
recognised
as
at
1
January
2019
569
IFRIC
Interpretation
23
–
Uncertainty
over
Income
Tax
Treatment
IFRIC
23
clarifies
the
application
of
IAS
12
to
accounting
for
income
tax
treatments
that
have
yet
to
be
accepted
by
tax
authorities,
in
scenarios
where
it
may
be
unclear
how
tax
law
applies
to
a
particular
transaction
or
circumstance,
or
whether
a
taxation
authority
will
accept
an
entity’s
tax
treatment.
There
was
no
significant
effect
from
the
adoption
of
IFRIC
23
in
relation
to
accounti
ng
for
uncertain
tax
positions.
IAS
12
–
Income
Taxes
–
Amendments
to
IAS
12
The
IASB
amended
IAS
12
in
order
to
clarify
the
accounting
treatment
of
the
income
tax
consequences
of
dividends.
As
a
result
of
the
amendment,
the
tax
consequences
of
all
paymen
ts
on
financial
instruments
that
are
classified
as
equity
for
accounting
purposes,
where
those
payments
are
considered
to
be
a
distribution
of
profit,
will
be
included
in,
and
will
reduce,
the
income
statement
tax
charge.
The
amendments
of
IAS
12
were
appl
ied
to
the
income
tax
consequences
of
dividends
recognised
on
or
after
the
beginning
of
the
earliest
comparative
period.
This
resulted
in
reducing
the
tax
charge
and
increasing
profit
after
tax
for
2019
by
£171m,
2018
by
£175
m
and
2017
by
£174m.
This
chang
e
does
not
impact
retained
earnings.
IAS
19
–
Employee
Benefits
–
Amendments
to
IAS
19
The
IASB
issued
amendments
to
the
guidance
in
IAS
19,
Employee
Benefits,
in
connection
with
accounting
for
plan
amendments,
curtailments
and
settlements.
There
was
no
significant
effect
from
the
adoption
of
the
amendments
of
IAS
19.
IFRS
9,
IAS
39
and
IFRS
7
Amendments
relating
to
Interest
Rate
Benchmark
Reform
IFRS
9,
IAS
39
and
IFRS
7
were
amended
in
September
2019.
The
amendments
are
effective
for
periods
beginning
on
or
after
1
January
2020
with
earlier
application
permitted.
The
Barclays
Bank
Group
elected
to
early
adopt
the
amendments
with
effect
from
1
January
2019.
The
amendments
have
been
endorsed
by
the
EU.
IFRS
9
allows
companies
when
they
first
apply
IFRS
9
,
to
choose
as
an
accounting
policy
to
continue
to
apply
the
hedge
accounting
requirements
of
IAS
39.
The
Barclays
Bank
Group
made
the
election
to
continue
to
apply
the
IAS
39
hedge
accounting
requirements
,
and
consequently,
the
amendments
to
IAS
39
have
b
een
adopted
by
the
Barclays
Bank
Group.
The
objective
of
the
amendments
are
to
provide
temporary
exceptions
from
applying
specific
hedge
accounting
requirements
during
the
period
of
uncertainty
resulting
from
interest
rate
benchmark
reform.
Each
of
the
ex
ceptions
adopted
by
the
Barclays
Bank
Group
are
described
below.
◾
Highly
probable
requirement
When
determining
whether
a
forecast
transaction
or
cash
flow
is
highly
probable,
the
Barclays
Bank
Group
assumes
that
the
interest
rate
benchmark
on
which
the
hed
ged
cash
flows
are
based
is
not
altered
as
a
result
of
the
reform.
This
amendment
has
also
been
applied
when
cash
flows
are
still
expected
to
occur
in
respect
of
amounts
remaining
in
the
cash
flow
hedge
reserve.
◾
Prospective
assessments
When
performing
pro
spective
assessments,
the
Barclays
Bank
Group
assumes
that
the
interest
rate
benchmark
on
which
the
hedged
risk
and/or
hedging
instrument
are
based
is
not
altered
as
a
result
of
the
interest
rate
benchmark
reform.
◾
Retrospective
assessments
The
Barclays
Bank
Group
will
not
discontinue
hedge
accounting
during
the
period
of
IBOR
-
related
uncertainty
solely
because
the
retrospective
effectiveness
falls
outside
the
required
80
-
125%
range.
◾
Hedge
of
a
non
-
contractually
specified
benchmark
portion
of
an
interest
rate
The
Barclays
Bank
Group
only
considers
at
inception
of
such
a
hedging
relationship
whether
the
separately
identifiable
requirement
is
met.
The
amendments
to
IFRS
7
require
certain
disclosures
to
be
made
in
the
first
period
that
the
amendments
to
IFRS
9
or
IAS
39
are
adopted.
Refer
to
Note
13
where
these
disclosures
have
been
included.
Future
accounting
developments
The
following
accounting
standards
have
been
issued
by
the
IASB
but
are
not
yet
effective:
IFRS
17
–
Insurance
contracts
In
May
2017,
the
IASB
issued
IFRS
17
Insurance
Contracts
,
a
comprehensive
new
accounting
standard
for
insurance
contracts
covering
recognition
and
measurement,
presentation
and
disclosure.
Once
effective,
IFRS
17
will
replace
IFRS
4
Insurance
Contracts
Notes
to
the
financial
statements
For
the
year
ended
31
December
2019
Barclays
Bank
PLC
2019
Annual
Report
on
Form
20-F
109
IFRS
17
applies
to
all
types
of
insurance
contracts
(i.e.
life,
non
-
life,
direct
insurance
and
re
-
insurance),
regardless
of
the
type
of
entities
that
issue
them,
as
well
as
to
certain
guarantees
and
financial
instruments
with
discretionary
participation
features.
A
few
scope
exceptions
will
apply.
In
June
2019,
the
IASB
published
an
exposure
draft
with
proposed
amendments
to
IFRS
17.
The
proposed
amendments
that
are
expected
to
be
relevant
to
the
Barclays
Bank
Group
are
changes
to
the
scoping
of
IFRS
17,
changes
in
the
effective
date
of
IFRS
17
and
changes
to
IFRS
9
which
were
consequential
amendments
as
a
result
of
IFRS
17.
The
standard
is
currently
effective
from
1
January
2021,
although
the
amendments
would
change
the
effective
date
to
1
January
2022,
and
the
standard
has
not
yet
been
endorsed
by
the
EU.
The
Barclays
Bank
Group
is
currently
assessing
the
expected
impact
of
adopting
this
standard.
6.
Critical
accounting
estimates
and
judgements
The
preparation
of
financial
statements
in
accordance
with
IFRS
requires
the
use
of
estimates.
It
also
requires
management
to
exercise
judgement
in
applying
the
accounting
policies.
The
key
areas
involving
a
higher
degree
of
judgement
or
complexity,
or
areas
where
assumptions
are
significant
to
the
consolidated
and
individual
financial
statements
are
highlighted
under
the
relevant
note.
Critical
accounting
estimates
and
judgements
are
disclosed
in:
◾
Cre
dit
impairment
charges
on
page
115
to
119
◾
Tax
on
page
120
to
124
◾
Fair
value
of
financial
instruments
on
page
138
to
149
◾
Pensions
and
post-
retirement
benefits
–
obligations
on
page
176
to
181
◾
Provisions
including
conduct
and
legal,
competition
and
regulatory
matters
on
page
159
to
160
.
7.
Other
disclosures
To
improve
transparency
and
ease
of
reference,
by
concentrating
rela
ted
information
in
one
place,
certain
disclosures
required
under
IFRS
have
been
included
within
the
Risk
review
section
as
follows:
◾
Credit
risk
on
page
38
to
39
and
on
pages
45
to
67
◾
Market
risk
on
page
39
and
on
pages
68
to
70
◾
Treasury
and
capital
risk
–
capital
on
page
40
to
41
and
on
page
77
◾
Treasury
and
c
apital
risk
–
liquidity
on
page
40
and
on
pages
72
to
76
.
These
disclosures
are
covered
by
the
A
udit
opinion
(included
on
page
96)
where
referenced
as
audited.
Notes
to
the
financial
statements
Performance/return
Barclays
Bank
PLC
2019
Annual
Report
on
Form
20-F
110
The
notes
included
in
this
section
focus
on
the
results
and
performance
of
the
Barclays
Bank
Group
.
Information
on
the
segmental
performance,
income
generated,
expenditure
incurred,
tax,
and
dividends
are
included
here.
2
Segment
al
reporting
Presentation
of
segmental
reporting
The
Barclays
Bank
Group’s
segmental
reporting
is
in
accordance
with
IFRS
8
Operating
Segments
.
Operating
segments
are
reported
in
a
manner
consistent
with
the
internal
reporting
provided
to
the
Executive
Committee,
which
is
responsible
for
allocating
resou
rces
and
assessing
performance
of
the
operating
segments,
and
has
been
identified
as
the
chief
operating
decision
maker.
All
transactions
between
business
segments
are
conducted
on
an
arm’s-
length
basis,
with
intra
-
segment
revenue
and
costs
being
eliminated
in
Head
Office.
Income
and
expenses
directly
associated
with
each
segment
are
included
in
determining
business
segment
performance.
T
he
Barclays
Bank
Group
divisions
have
been
for
segmental
reporting
purposes
defined
as
Corporate
and
Investment
Bank
and
Consumer,
Cards
and
Payments.
◾
Corporate
and
Investment
Bank
◾
Consumer,
Cards
and
Payments
Commercial
Payments,
Barclaycard
Payment
Solutions
and
the
international
Wealth
business.
The
below
table
also
includes
Head
Office
which
comprises
head
office
and
central
support
functions.
Analysis
of
results
by
business
Corporate
and
Consumer,
Cards
and
Payments
Head
Barclays
Bank
Group
£m
£m
£m
£m
For
the
year
ended
31
December
2019
Total
income
10,009
4,462
(320)
14,151
Credit
impairment
charges
(157)
(1,016)
(29)
(1,202)
Net
operating
income/(expenses)
9,852
3,446
(349)
12,949
Operating
expenses
(7,267)
(2,359)
(92)
(9,718)
Litigation
and
conduct
(108)
(7)
(149)
(264)
Total
operating
expenses
(7,375)
(2,366)
(241)
(9,982)
Other
net
income/(expenses)
a
113
40
(8)
145
Profit/(loss)
before
tax
2,590
1,120
(598)
3,112
Total
assets
799.6
65.7
11.4
876.7
Number
of
employees
(full
time
equivalent)
8,100
3,100
9,300
20,500
Average
number
of
employees
(full
time
equivalent)
21,700
Corporate
and
Investment
Bank
Consumer,
Cards
Head
Barclays
Bank
Group
£m
£m
£m
£m
For
the
year
ended
31
December
2018
Total
income
b
9,741
4,267
(408)
13,600
Credit
impairment
releases/(charges)
152
(808)
13
(643)
Net
operating
income/(expenses)
9,893
3,459
(395)
12,957
Operating
expenses
(7,459)
(2,304)
(130)
(9,893)
GMP
charge
-
-
(140)
(140)
Litigation
and
conduct
(68)
(59)
(1,579)
(1,706)
Total
operating
expenses
(7,527)
(2,363)
(1,849)
(11,739)
Other
net
income/(expenses)
a
28
41
(1)
68
Profit/(loss)
before
tax
2,394
1,137
(2,245)
1,286
Total
assets
792.5
71.6
13.6
877.7
Number
of
employees
(full
time
equivalent)
9,100
3,300
10,000
22,400
Notes
a
Other
net
income/(expenses)
represents
the
share
of
post
-tax
results
of
associates
and
joint
ventures,
profit
(or
loss)
on
disposal
of
subsidiaries,
associates
and
joint
ventures,
and
gains
on
acquisitions.
b
£
351m
of
certain
capital
instrument
funding
costs
are
now
charged
to
Head
Office,
the
impact
of
which
would
have
been
materially
the
same
if
the
charges
had
been
included
in
full
year
2017.
Notes
to
the
financial
statements
Performance/return
Barclays
Bank
PLC
2019
Annual
Report
on
Form
20-F
111
Corporate
and
Investment
Bank
Consumer,
Cards
and
Payments
Head
Barclays
Non
-Core
a
Barclays
Bank
Group
£m
£m
£m
£m
£m
For
the
year
ended
31
December
2017
Total
income
9,901
4,504
(148)
(527)
13,730
Credit
impairment
charges
(213)
(1,293)
(17)
(30)
(1,553)
Net
operating
income/(expenses)
9,688
3,211
(165)
(557)
12,177
Operating
expenses
(7,610)
(2,167)
(202)
(251)
(10,230)
Litigation
and
conduct
(267)
(2)
(151)
(28)
(448)
Total
operating
expenses
(7,877)
(2,169)
(353)
(279)
(10,678)
Other
net
income
b
133
121
(192)
197
259
Profit
before
tax
from
continuing
operations
1,944
1,163
(710)
(639)
1,758
Total
assets
c
788.7
67.4
35.8
-
1,129.3
Number
of
employees
(full
time
equivalent)
8,800
2,700
10,300
-
21,800
Notes
a
Barclays
Non-Core
segment
was
closed
on
1
July
2017,
with
financial
performance
subsequently
reported
in
Corporate
and
Investment
Bank,
Head
Office
and
UK
banking
business.
b
Other
net
income/(expenses)
represents
the
share
of
post
-tax
results
of
associates
and
joint
ventures,
profit
(or
loss)
on
disposal
of
subsidiaries,
associates
and
joint
ventures,
and
gains
on
acqui
sitio
ns.
c
Total
assets
for
UK
banking
business
are
included
within
Barclays
Bank
Group
for
2017.
Income
by
geographic
region
a
2019
2018
2017
For
the
year
ended
31
December
£m
£m
£m
Continuing
operations
United
Kingdom
4,084
4,007
3,582
Europe
1,752
1,615
1,985
Americas
7,251
7,048
7,194
Africa
and
Middle
East
62
44
137
Asia
1,002
886
832
Total
14,151
13,600
13,730
Income
from
individual
countries
which
represent
more
than
5%
of
total
income
a
2019
2018
2017
For
the
year
ended
31
December
£m
£m
£m
Continuing
operations
United
Kingdom
4,084
4,007
3,582
United
States
7,121
6,916
7,049
Note
a
The
geographical
analysis
is
now
based
on
the
location
of
office
where
the
transactions
are
recorded,
whereas
it
was
previously
based
on
counterparty
location.
The
new
approach
is
better
aligned
to
the
geographical
view
of
the
business
following
the
implementation
of
structural
reform.
Prior
year
comparatives
have
been
restated.
3
Net
interest
income
Accounting
for
interest
income
and
expenses
Interest
income
on
loans
and
advances
at
amortised
cost,
and
interest
expense
on
financial
liabilities
held
at
amortised
cost,
are
calculated
using
the
effective
interest
method
which
allocates
interest,
and
direct
and
increme
ntal
fees
and
costs,
over
the
expected
lives
of
the
assets
and
liabilities.
The
effective
interest
method
requires
the
Barclays
Bank
Group
to
estimate
future
cash
flows,
in
some
cases
based
on
its
experience
of
customers’
behaviour,
considering
all
contra
ctual
terms
of
the
financial
instrument,
as
well
as
the
expected
lives
of
the
assets
and
liabilities.
Barclays
Bank
Group
incurs
certain
costs
to
originate
credit
card
balances
with
the
most
significant
being
co
-
brand
partner
fees.
To
the
extent
these
costs
are
attributed
to
customers
that
continuously
carry
an
outstanding
balance
(revolvers),
they
are
cap
italised
and
subsequently
included
within
the
calculation
of
the
effective
interest
rate.
They
are
amortised
to
interest
income
over
the
period
of
expected
repayment
of
the
originated
balance.
Costs
attributed
to
customers
that
settle
their
outstanding
bal
ances
each
period
(transactors)
are
deferred
on
the
balance
sheet
as
a
cost
of
obtaining
a
contract
and
amortised
to
fee
and
commission
expense
over
the
life
of
the
customer
relationship
(refer
to
Note
4
)
.
There
are
no
other
individual
estimates
involved
in
the
calculation
of
effective
interest
rates
that
are
material
to
the
results
or
financial
position.
Notes
to
the
financial
statements
Performance/return
Barclays
Bank
PLC
2019
Annual
Report
on
Form
20-F
112
2019
2018
2017
£m
£m
£m
Cash
and
balances
at
central
banks
919
919
214
Loans
and
advances
at
amortised
cost
5,514
5,554
5,951
Financial
investments
-
-
385
Fair
value
through
other
comprehensive
income
831
662
-
Other
821
324
367
Interest
income
8,085
7,459
6,917
Deposits
at
amortised
cost
(1,778)
(1,591)
(936)
Debt
securities
in
issue
(873)
(493)
(461)
Subordinated
liabilities
(1,096)
(1,397)
(1,225)
Other
(431)
(848)
(419)
Interest
expense
(4,178)
(4,329)
(3,041)
Net
interest
income
3,907
3,130
3,876
Interest
income
presented
above
represents
interest
revenue
calculated
using
the
effective
interest
method.
Costs
to
originate
credit
card
balances
o
f
£
684m
(2018:
£585m;
2017:
£486
m)
have
been
amortised
to
interest
income
during
the
period.
Intere
st
income
includes
£9
m
(2018:
£
9
m;
201
7
:
£16m)
accrued
on
impaired
loans
.
Other
interest
expense
includes
£25m
relating
to
IFRS
16
lease
interest
expenses.
4
Net
fee
and
commission
income
Accounting
for
net
fee
and
commission
income
under
IFRS
15
effective
from
1
January
2018
The
Barclays
Bank
Group
applies
IFRS
15
Revenue
from
Contracts
with
Customers.
The
standard
establishes
a
five-
step
model
governing
revenue
recognition.
The
five-
step
model
requires
the
Barclays
Bank
Group
to
(i)
identify
the
contract
with
the
customer,
(ii)
identify
each
of
the
performance
obligations
included
in
the
contract,
(iii)
determine
the
amount
of
consideration
in
the
contract,
(iv)
allocate
the
consideration
to
each
of
the
identified
performance
obligations
and
(v)
recognise
revenue
as
each
performance
obligation
is
satisfied.
The
Barclays
Bank
Group
recognises
fee
and
com
mission
income
charged
for
services
provided
by
the
Barclays
Bank
Group
as
the
services
are
provided,
for
example
on
completion
of
the
underlying
transaction.
Accounting
for
net
fee
and
commission
incom
e
under
IAS
18
for
2017
The
Barclays
Bank
Group
appl
ies
IAS
18
Revenue.
Fees
and
commissions
charged
for
services
provided
or
received
by
the
Barclays
Bank
Group
are
recognised
as
the
services
are
provided,
for
example
on
completion
of
the
underlying
transaction.
Fee
and
commission
income
is
disaggregated
below
by
fee
types
that
reflect
the
nature
of
the
services
offered
across
the
Barclays
Bank
Group
and
operating
segments,
in
accordance
with
IFRS
15.
It
includes
a
total
for
fees
in
scope
of
IFRS
15.
Refer
to
Note
2
for
more
detailed
information
about
ope
rating
segments.
2019
Corporate
and
Investment
Bank
Consumer,
Cards
and
Payments
Head
Office
Total
£m
£m
£m
£m
Fee
type
Transactional
391
2,418
-
2,809
Advisory
821
83
-
904
Brokerage
and
execution
1,082
49
-
1,131
Underwriting
and
syndication
2,358
-
-
2,358
Other
90
227
30
347
Total
revenue
from
contracts
with
customers
4,742
2,777
30
7,549
Other
non
-
contract
fee
income
110
5
-
115
Fee
and
commission
income
4,852
2,782
30
7,664
Fee
and
commission
expense
(743)
(1,249)
-
(1,992)
Net
fee
and
commission
income
4,109
1,533
30
5,672
Notes
to
the
financial
statements
Performance/return
Barclays
Bank
PLC
2019
Annual
Report
on
Form
20-F
113
2018
Corporate
and
Investment
Bank
Consumer,
Cards
and
Payments
Head
Office
Total
£m
£m
£m
£m
Fee
type
Transactional
366
2,248
-
2,614
Advisory
772
78
-
850
Brokerage
and
execution
1,002
71
-
1,073
Underwriting
and
syndication
2,462
-
-
2,462
Other
24
222
29
275
Total
revenue
from
contracts
with
customers
4,626
2,619
29
7,274
Other
non
-
contract
fee
income
114
4
-
118
Fee
and
commission
income
4,740
2,623
29
7,392
Fee
and
commission
expense
(657)
(1,128)
-
(1,785)
Net
fee
and
commission
income
4,083
1,495
29
5,607
2017
£m
Fee
and
commission
income
Banking,
investment
management
and
credit
related
fees
and
commissions
7,352
Foreign
exchange
commission
72
Fee
and
commission
income
7,424
Fee
and
commission
expense
(1,726)
Net
fee
and
commission
income
5,698
Note
a
The
Barclays
Group
elected
the
cumulative
effect
transition
method
on
adoption
of
IFRS
15
for
1
January
2018,
and
recognised
in
retained
earnings
without
restating
comparative
periods.
The
comparative
figures
are
reported
under
IAS
18.
Fee
types
Transactional
Transactional
fees
are
service
charges
on
deposit
accounts,
cash
management
services
and
transactional
processing
fees
including
interchange
and
merchant
fee
income
generated
from
credit
and
bank
card
usage.
Transaction
and
processing
fees
are
recognised
at
the
point
in
time
the
transaction
occurs
or
service
is
performed.
They
include
banking
services
such
as
Automated
Teller
Machine
(ATM)
fees,
wire
transfer
fees,
balance
transfer
fees,
overdraft
or
late
fees
and
foreign
exchange
fees,
among
others.
Interchange
and
merchant
fees
are
recognised
upon
settlement
of
the
card
transaction
payment.
Barclays
incurs
certain
card
related
costs
including
those
related
to
cardholder
reward
programmes
and
various
payments
made
to
co
-
brand
partners.
To
the
extent
cardholder
reward
programmes
costs
are
attributed
to
customers
that
settle
their
outstanding
balance
each
period
(transactors)
they
are
expensed
wh
en
incurred
and
presented
in
fee
and
commission
expense
while
costs
related
to
customers
who
continuously
carry
an
outstanding
balance
(revolvers)
are
included
in
the
effective
interest
rate
of
the
receivable
(refer
to
Note
3).
Payments
to
partners
for
new
cardholder
account
originations
for
transactor
accounts
are
deferred
as
costs
to
obtain
a
contract
under
IFRS
15
while
those
costs
related
to
revolver
accounts
are
included
in
the
effective
interest
rate
of
the
receivable
(refer
to
Note
3).
Those
costs
de
ferred
under
IFRS
15
are
capitalised
and
amortised
over
the
estimated
cardholder
relationship.
Payments
to
co
-
brand
partners
based
on
revenue
sharing
are
presented
as
a
reduction
of
fee
and
commission
income
while
payments
based
on
profitability
are
presen
ted
in
fee
and
commission
expense.
Advisory
Advisory
fees
are
generated
from
wealth
management
services
and
investment
banking
advisory
services
related
to
mergers,
acquisitions
and
financial
restructurings.
Wealth
management
advisory
fees
primarily
consi
sts
of
asset-based
fees
for
advisory
accounts
of
wealth
management
clients
and
are
based
on
the
market
value
of
client
assets.
They
are
earned
over
the
period
the
services
are
provided
and
are
generally
recognised
quarterly
when
the
market
value
of
client
assets
is
determined.
Investment
banking
advisory
fees
are
recognised
at
the
point
in
time
when
the
services
related
to
the
transaction
have
been
completed
under
the
terms
of
the
engagement.
Investment
banking
advisory
costs
are
recognised
as
incurred
in
fee
and
commission
expense
if
direct
and
incremental
to
the
advisory
services
or
otherwise
recognised
in
operating
expenses.
Brokerage
and
execution
Brokerage
and
execution
fees
are
earned
for
executing
client
transactions
with
various
exchanges
and
over
-
the
-
counter
markets
and
assisting
clients
in
clearing
transactions.
Brokerage
and
execution
fees
are
recognised
at
the
point
in
time
the
associated
service
has
been
completed
which
is
generally
the
trade
date
of
the
transaction.
Notes
to
the
financial
statements
Performance/return
Barclays
Bank
PLC
2019
Annual
Report
on
Form
20-F
114
Underwriting
and
syndication
Underwriting
and
syndication
fees
are
earned
for
the
distribution
of
client
equity
or
debt
securities
and
the
arrangement
and
administration
of
a
loan
syndication.
This
includes
commitment
fees
to
provide
loan
financing.
Underwriting
fees
are
generally
r
ecognised
on
trade
date
if
there
is
no
remaining
contingency,
such
as
the
transaction
being
conditional
on
the
closing
of
an
acquisition
or
another
transaction.
Underwriting
costs
are
deferred
and
recognised
in
fee
and
commission
expense
when
the
associated
underwriting
fees
are
recorded.
Syndication
fees
are
earned
for
arranging
and
administering
a
loan
syndication;
however,
the
associated
fee
may
be
subject
to
variability
until
the
loan
has
been
syndicated
to
other
syndicate
members
or
until
other
conting
encies
(such
as
a
successful
M&A
closing)
have
been
resolved
and
therefore
the
fee
revenue
is
deferred
until
the
uncertainty
is
resolved.
Included
in
underwriting
and
syndication,
are
commitment
fees
to
provide
loan
financing
which
are
not
presented
as
pa
rt
of
the
carrying
value
of
the
loan
in
accordance
with
IFRS
9,
for
example
as
part
of
the
effective
interest
rate.
Loan
commitment
fees
included
as
IFRS
15
revenues
are
fees
for
loan
commitments
that
are
not
expected
to
fund,
fees
received
as
compensation
for
unfunded
commitments
and
the
applicable
portion
of
fees
received
for
a
revolving
loan
facility,
which
for
that
period,
are
undrawn.
Such
commitment
fees
are
recognised
over
time
through
to
the
contractual
maturity
of
the
commitment.
Contract
assets
and
contract
liabilities
The
Barclays
Bank
Group
had
no
material
contract
assets
or
contract
liabilities
as
at
31
December
2019
(2018:
nil).
Impairment
on
fee
receivables
and
contract
assets
During
201
9
,
there
have
been
no
material
impairments
recognised
in
relation
to
fees
receivable
and
contract
assets
(2018:
nil).
Fees
in
relation
to
transactional
business
can
be
added
to
outstanding
customer
balances.
These
amounts
may
be
subsequently
impaired
as
par
t
of
the
overall
loans
and
advances
balance.
Remaining
performance
obligations
The
Barclays
Bank
Group
applies
the
practical
expedient
of
IFRS
15
and
does
not
disclose
information
about
remaining
performance
obligations
that
have
original
expected
durations
of
one
year
or
less
or
because
the
Barclays
Bank
Group
has
a
right
to
consideration
that
corresponds
directly
with
the
value
of
the
service
provided
to
the
client
or
customer.
Costs
incurred
in
obtaining
or
fulfilling
a
contract
The
Barclays
Bank
Group
expects
that
incremental
costs
of
obtaining
a
contract
such
as
success
fee
and
commission
fees
paid
are
recoverable
and
therefore
capitalised
such
con
tract
costs
in
the
amount
of
£153
m
at
31
December
2019
(2018:
£125m).
Capitalised
contract
costs
are
amortised
based
on
the
transfer
of
services
to
which
the
asset
relates
which
typically
ranges
over
the
expected
life
of
the
relationship.
In
2019,
the
amount
of
amortisation
was
£
29
m
(2018:
£30m)
and
there
was
no
impairment
loss
recognised
in
connection
with
the
capitalised
contract
costs
(2018:
nil).
5
Net
trading
income
Accounting
for
net
trading
income
In
accordance
with
IFRS
9,
trading
positions
are
held
at
fair
value,
and
the
resulting
gains
and
losses
are
included
in
the
income
statement,
together
with
interest
and
dividends
arising
from
long
and
short
positions
and
funding
costs
relating
to
trading
activities.
Income
arises
from
both
the
sale
and
purchase
of
trading
positions,
margins
which
are
achieved
through
market
making
and
customer
business
and
from
changes
in
fair
value
caused
by
movements
in
interest
and
exchange
rates,
equity
prices
and
othe
r
market
variables.
Gains
or
losses
on
non
-
trading
financial
instruments
designated
or
mandatorily
at
fair
value
with
changes
in
fair
value
recognised
in
the
income
statement
are
included
in
net
trading
income
where
the
business
model
is
to
manage
assets
and
liabilities
on
a
fair
value
basis
which
includes
use
of
derivatives
or
where
an
instrument
is
designated
at
fair
value
to
eliminate
an
accounting
mismatch
and
the
related
instrument's
gain
and
losses
are
reported
in
trading
income.
2019
2018
2017
£m
£m
£m
Net
gains
from
financial
instruments
held
for
trading
2,795
3,101
2,280
Net
gains
from
financial
instruments
designated
at
fair
value
240
259
1,116
Net
gains
from
financial
instruments
mandatorily
at
fair
value
1,038
1,004
-
Net
trading
income
4,073
4,364
3,396
Notes
to
the
financial
statements
Performance/return
Barclays
Bank
PLC
2019
Annual
Report
on
Form
20-F
115
6
Net
investment
income
Accounting
for
net
investment
income
Dividends
are
recognised
when
the
right
to
receive
the
dividend
has
been
established.
Other
accounting
policies
relating
to
net
investment
income
are
set
out
in
Note
12
and
Note
14.
2019
2018
2017
£m
£m
£m
Net
gains
from
financial
assets
mandatorily
at
fair
value
218
172
-
Net
gains
from
disposal
of
debt
instruments
at
fair
value
through
other
comprehensive
income
454
131
-
Net
gains/(losses)
from
disposal
of
financial
assets
and
liabilities
measured
at
amortised
cost
(38)
(20)
86
Dividend
income
-
55
48
Net
(losses)/gains
on
other
investments
(214)
56
(14)
Net
gains
from
financial
instruments
designated
at
fair
value
a
-
-
281
Net
gains
from
disposal
of
available
for
sale
investments
b
-
-
298
Net
investment
income
420
394
699
Notes
a
Following
the
adoption
of
IFRS
9
in
2018,
gains
or
losses
on
financial
assets
designated
at
fair
value
to
eliminate
or
reduce
an
accounting
mismatch
are
recognised
in
net
trading
income
lines.
b
Following
the
adoption
of
IFRS
9
in
2018,
available
for
sale
classification
is
no
longer
applicable.
7
Credit
impairment
charges
Accounting
for
the
impairment
of
financial
assets
under
IFRS
9
effective
from
1
January
2018
Impairment
The
Barclays
Bank
Group
is
required
to
recognise
expected
credit
losses
(ECLs)
based
on
unbiased
forward
-
looking
information
for
all
financial
assets
at
amortised
cost,
lease
receivables,
debt
financial
assets
at
fair
value
through
other
comprehensive
income,
loan
commitments
and
financial
guarantee
con
tracts.
Intercompany
exposures
in
the
individual
financial
statements,
including
loan
commitments
and
financial
guarantee
contracts,
are
also
in
scope
of
IFRS
9
for
ECL
purposes.
At
the
reporting
date,
an
allowance
(or
provision
for
loan
commitments
and
financial
guarantees)
is
required
for
the
12
month
(Stage
1)
ECLs.
If
the
credit
risk
has
significantly
increased
since
initial
recognition
(Stage
2),
or
if
the
financial
instrument
is
credit
impaired
(Stage
3),
an
allowance
(or
provision)
should
be
recogni
sed
for
the
lifetime
ECLs.
The
measurement
of
ECL
is
calculated
using
three
main
components:
(i)
probability
of
default
(PD)
(ii)
loss
given
default
(LGD)
and
(iii)
the
exposure
at
default
(EAD).
The
12
month
and
lifetime
ECLs
are
calculated
by
multiplying
the
respective
PD,
LGD
and
the
EAD.
The
12
month
and
lifetime
PDs
represent
the
PD
occurring
over
the
next
12
months
and
the
remaining
maturity
of
the
instrument
respectively.
The
EAD
represents
the
expected
balance
at
default,
taking
into
account
the
repayment
of
principal
and
interest
from
the
balance
sheet
date
to
the
default
event
together
with
any
expected
drawdowns
of
committed
facilities.
The
LGD
represents
expected
losses
on
the
EAD
given
the
event
of
default,
taking
into
account,
among
other
attributes,
the
mitigating
effect
of
collateral
value
at
the
time
it
is
expected
to
be
realised
and
the
time
value
of
money.
Determining
a
significant
increase
in
credit
risk
since
initial
recognition:
The
Barclays
Bank
Group
assesses
when
a
significant
increase
in
credit
risk
has
occurred
based
on
quantitative
and
qualitative
assessments.
The
credit
risk
of
an
exposure
is
considered
to
have
significantly
increased
when
:
i)
Quantitative
test
The
annualised
lifetime
PD
has
increased
by
more
than
an
agreed
threshold
relative
to
the
equivalent
at
origination.
PD
deterioration
thresholds
are
defined
as
percentage
increases,
and
are
set
at
an
origination
score
band
and
segment
level
to
ensure
the
test
appropriately
captures
significant
increases
in
credit
risk
at
all
risk
levels.
Generally,
thresholds
are
inversely
correlated
to
the
origination
PD,
i.e.
as
the
origination
PD
increases,
the
threshold
value
reduces.
The
assessment
of
the
point
at
which
a
PD
increase
is
deemed
‘significant’,
is
based
upon
analysis
of
the
portfolios’
risk
profile
against
a
common
set
of
principles
and
performance
metrics
(consistent
across
both
retail
and
wholesale
businesses),
incorporating
expert
credit
judgement
where
appropriate.
Application
of
quantitative
PD
floors
does
not
r
epresent
the
use
of
the
low
credit
risk
exemption
as
exposures
can
separately
move
into
stage
2
via
the
qualitative
route
described
below.
Notes
to
the
financial
statements
Performance/return
Barclays
Bank
PLC
2019
Annual
Report
on
Form
20-F
116
Wholesale
assets
apply
a
100%
increase
in
PD
an
d
0.2%
PD
floor
to
determine
a
significant
increase
in
credit
risk.
Retail
assets
apply
bespoke
relative
increase
and
absolute
PD
thresholds
based
on
product
type
and
origination
PD.
Thresholds
are
subject
to
maximums
defined
by
Barclays
Bank
Group
policy
and
typically
apply
minimum
relative
thresholds
of
50
-
100%
and
a
max
imum
relative
threshold
of
400%.
For
existing/historical
exposures
where
origination
point
scores
or
data
are
no
longer
available
or
do
not
represent
a
comparable
estimate
of
lifetime
PD,
a
proxy
origination
score
is
defined,
based
upon:
◾
Back
-
population
of
the
approved
lifetime
PD
score
either
to
origination
date
or,
where
this
is
not
feasible,
as
far
back
as
possible,
(subject
to
a
data
start
point
no
later
than
1
January
2015);
or
◾
Use
of
available
historical
account
performance
data
and
other
customer
information,
to
derive
a
comparable
‘proxy’
estimation
of
origination
PD.
ii)
Qualitative
test
This
is
relevant
for
accounts
that
meet
the
portfolio’s
‘high
risk’
criteria
and
are
subject
to
closer
credit
monitoring.
High
risk
customers
may
not
be
in
arrears
but
either
through
an
event
or
an
observed
behaviour
exhibit
credit
distress.
The
definition
and
assessment
of
high
risk
includes
as
wide
a
range
of
information
as
reasonably
available,
such
as
industry
and
Group
-
wide
customer
level
data,
including
but
not
limited
to
bureau
scores
and
high
consumer
indebtedness
index,
wherever
possible
or
relevant.
Whilst
the
high
risk
populations
applied
for
IFRS
9
impairment
purposes
are
aligned
with
risk
management
processes,
they
are
also
regularly
reviewed
and
validated
to
ensure
that
they
capture
any
incremental
segments
where
there
is
evidence
of
credit
deterioration.
iii)
Backstop
criteria
This
is
relevant
for
accounts
that
are
more
than
30
calendar
days
past
due.
The
30
days
past
due
cr
iteria
is
a
backstop
rather
than
a
primary
driver
of
moving
exposures
into
Stage
2.
The
criteria
for
determining
a
significant
increase
in
credit
risk
for
assets
with
bullet
repayments
follows
the
same
principle
as
all
other
assets,
i.e.
quantitative,
qualitative
and
backstop
tests
are
all
applied.
Exposures
will
move
back
to
Stage
1
once
they
no
longer
meet
the
criteria
for
a
significant
increase
in
credit
risk.
This
means
that,
at
a
minimum
all
payments
must
be
up
-
to-
date,
the
PD
deterioration
test
is
no
longer
met,
the
account
is
no
longer
classified
as
high
risk,
and
the
customer
has
evidenced
an
ability
to
maintain
future
payments.
Exposures
are
only
removed
from
Stage
3
and
re
-
assigned
to
Stage
2
once
the
original
default
trigger
event
no
longer
applies.
Exposures
b
eing
removed
from
Stage
3
must
no
longer
qualify
as
credit
impaired,
and:
a)
the
obligor
will
also
have
demonstrated
consistently
good
payment
behaviour
over
a
12
-
month
period,
by
making
all
consecutive
contractual
payments
due
and,
fo
r
forborne
exposures,
the
relevant
EBA
defined
probationary
period
has
also
been
successfully
completed
or;
b)
(for
non
-
forborne
exposures)
the
performance
conditions
are
defined
and
approved
within
an
appropriately
sanctioned
restructure
plan,
including
12
months’
payment
history
have
been
met.
Management
overlays
and
other
exceptions
to
model
outputs
are
applied
only
if
consistent
with
the
objective
of
identifying
significant
increases
in
credit
risk.
Forward
-
looking
information
The
measurement
of
ECL
involves
complexity
and
judgement,
including
estimation
of
PD,
LGD,
a
range
of
unbiased
future
economic
scenarios,
estimation
of
expected
lives
(where
contractual
life
is
not
appropriate),
and
estimation
of
EAD
and
assessing
significant
increases
in
credit
risk.
Credit
losses
are
the
expected
cash
shortfalls
from
what
is
contractually
due
over
the
expected
life
of
the
financial
instrument,
discounted
at
the
original
effective
interest
rate
(EIR).
ECLs
are
the
unbiased
probability
-
wei
ghted
credit
losses
determined
by
evaluating
a
range
of
possible
outcomes
and
considering
future
economic
conditions.
The
Barclays
Bank
Group
uses
a
five-
scenario
model
to
calculate
ECL.
An
external
consensus
forecast
is
assembled
from
key
sources,
including
HM
Treasury
(short
and
medium
term
forecasts),
Bloomberg
(based
on
median
of
economic
forecasters)
and
the
Urban
Land
Institute
(for
US
House
Prices),
which
forms
the
b
aseline
scenario.
In
addition,
two
adverse
scenarios
(Downside
1
and
Downside
2)
and
two
favourable
scenarios
(Upside
1
and
Upside
2)
are
derived,
with
associated
probability
weightings.
The
adverse
scenarios
are
calibrated
to
a
similar
severity
to
internal
stress
tests,
whilst
also
considering
IFRS
9
specific
sensitivities
and
non
-
linearity.
Downside
2
is
benchmarked
to
the
Bank
of
England’s
annual
cyclical
scenarios
and
to
the
most
severe
scenario
from
Moody’s
inventory,
but
is
not
designed
to
be
the
same.
The
favourable
scenarios
are
calibrated
to
be
symmetric
to
the
adverse
scenarios,
subject
to
a
ceiling
calibrated
to
relevant
recent
favourable
benchmark
scenarios.
The
scenarios
include
eight
economic
variables,
(GDP,
unemployment,
House
Price
Index
(HPI)
and
base
rates
in
both
the
UK
and
US
markets),
and
expanded
variables
using
statistical
models
based
on
historical
correlations.
The
upside
and
downside
shocks
are
designed
to
evolve
over
a
five-
year
stress
horizon,
with
all
five
scenarios
converging
to
a
steady
state
after
approximately
eight
years.
The
methodology
for
estimating
probability
weights
for
each
of
the
scenarios
involves
a
comparison
of
the
distribution
of
key
historical
UK
and
US
macroeconomic
variables
against
the
forecast
paths
of
the
five
scenarios.
The
m
ethodology
works
such
that
the
b
aseline
(reflecting
curren
t
Notes
to
the
financial
statements
Performance/return
Barclays
Bank
PLC
2019
Annual
Report
on
Form
20-F
117
consensus
outlook)
has
the
highest
weight
and
the
weights
of
adverse
and
favourable
scenarios
depend
o
n
the
deviation
from
the
b
aseline;
the
further
from
the
b
aseline,
the
smaller
the
weight.
A
single
set
of
five
scenarios
is
used
across
all
portfolios
and
all
five
weights
are
normalised
to
equate
to
100%.
The
same
scenarios
and
weights
that
are
used
in
the
estimation
of
expected
credit
losses
are
also
used
for
the
Barclays
Group
internal
planning
purposes.
The
impacts
across
the
portfolios
are
different
because
of
the
sensitivities
of
each
of
the
portfolios
to
specific
macroeconomic
variables,
for
example,
mortgages
are
highly
sensitive
to
house
prices
and
base
rates,
credit
cards
and
unsecured
consumer
loans
are
highly
sensitive
to
unemployment.
Definition
of
default,
credit
impaired
assets,
write
-
offs,
and
interest
income
recognition
The
definition
of
default
for
the
purpose
of
determining
ECLs,
and
for
internal
credit
risk
management
purposes,
has
been
aligned
to
the
Regulatory
Capital
CRR
Article
178
definition
of
default,
to
maintain
a
consistent
approach
with
IFRS
9
and
associated
regulatory
guidance.
The
Regulatory
Capital
CRR
Article
178
definition
of
default
considers
indicators
that
the
debtor
is
unlikely
to
pay,
includes
exposures
in
forbearance
and
is
no
later
than
when
the
exposure
is
more
than
90
days
past
due
or
180
days
past
due
in
the
case
of
UK
mortgages.
When
exposures
are
identified
as
cr
edit
impaired
or
purchased
or
originated
as
such
interest
income
is
calculated
on
the
carrying
value
net
of
the
impairment
allowance.
An
asset
is
considered
credit
impaired
when
one
or
more
events
occur
that
have
a
detrimental
impact
on
the
estimated
futu
re
cash
flows
of
the
financial
asset.
This
comprises
assets
defined
as
defaulted
and
other
individually
assessed
exposures
where
imminent
default
or
actual
loss
is
identified.
Uncollectible
loans
are
written
off
against
the
related
allowance
for
loan
impa
irment
on
completion
of
the
Barclays
Bank
Group’s
internal
processes
and
when
all
reasonably
expected
recoverable
amounts
have
been
collected.
Subsequent
recoveries
of
amounts
previously
written
off
are
credited
to
the
income
statement.
The
timing
and
extent
of
write-
offs
may
involve
some
element
of
subjective
judgement.
Nevertheless,
a
write-
off
will
often
be
prompted
by
a
specific
event,
such
as
the
inception
of
insolvency
proceedings
or
other
formal
recovery
action,
which
makes
it
possible
to
establish
that
some
or
the
entire
advance
is
beyond
realistic
prospect
of
recovery
.
Loan
modifications
and
renegotiations
that
are
not
credit
-
impaired
When
modification
of
a
loan
agreement
occurs
as
a
result
of
commercial
restructuring
activity
rather
than
due
to
the
credit
risk
of
the
borrower,
an
assessment
must
be
performed
to
determine
whether
the
terms
of
the
new
agreement
are
substantially
different
from
the
terms
of
the
existing
agreement.
This
assessment
considers
both
the
change
in
cash
flows
arising
from
the
modified
terms
as
well
as
the
change
in
overall
instrument
risk
profile.
Where
terms
are
substantially
different,
the
existing
loan
will
be
derecognised
and
a
new
loan
will
be
recognised
at
fair
value,
with
any
difference
in
valuation
recognised
immediately
within
the
income
statement,
subject
to
observability
criteria.
Where
terms
are
not
substantially
different,
the
loan
carrying
value
will
be
adjusted
to
reflect
the
present
value
of
modified
cash
flows
discounted
at
the
original
EIR,
with
any
resulting
gain
or
loss
recognised
immediately
within
the
income
statement
as
a
modification
gain
or
loss.
Expected
life
Lifetime
ECLs
must
be
measure
d
over
the
expected
life.
This
is
restricted
to
the
maximum
contractual
life
and
takes
into
account
expected
prepayment,
extension,
call
and
similar
options.
The
exceptions
are
certain
revolver
financial
instruments,
such
as
credit
cards
and
bank
overdraft
s,
that
include
both
a
drawn
and
an
undrawn
component
where
the
entity’s
contractual
ability
to
demand
repayment
and
cancel
the
undrawn
commitment
does
not
limit
the
entity’s
exposure
to
credit
losses
to
the
contractual
notice
period.
For
revolvi
ng
facilities,
expected
life
is
analytically
derived
to
reflect
behavioural
life
of
the
asset,
i.e.
the
full
period
over
which
the
business
expects
to
be
exposed
to
credit
risk.
Behavioural
life
is
typically
based
upon
historical
analysis
of
the
average
time
to
defa
ult,
closure
or
withdrawal
of
facility.
Where
data
is
insufficient
or
analysis
inconclusive,
an
additional
‘maturity
factor’
may
be
incorporated
to
reflect
the
full
estimated
life
of
the
exposures,
based
upon
experienced
judgement
and/or
peer
analysis.
Pot
ential
future
modifications
of
contracts
are
not
taken
into
account
when
determining
the
expected
life
or
EAD
until
they
occur.
Discounting
ECLs
are
discounted
at
the
EIR
at
initial
recognition
or
an
approximation
thereof
and
consistent
with
income
recogn
ition.
For
loan
commitments
the
EIR
is
the
rate
that
is
expected
to
apply
when
the
loan
is
drawn
down
and
a
financial
asset
is
recognised.
Issued
financial
guarantee
contracts
are
discounted
at
the
risk
free
rate.
Lease
receivables
are
discounted
at
the
ra
te
implicit
in
the
lease.
For
variable/floating
rate
financial
assets,
the
spot
rate
at
the
reporting
date
is
used
and
projections
of
changes
in
the
variable
rate
over
the
expected
life
are
not
made
to
estimate
future
interest
cash
flows
or
for
discounting
.
Modelling
techniques
ECLs
are
calculated
by
multiplying
three
main
components,
being
the
PD,
LGD
and
the
EAD,
discounted
at
the
original
EIR.
The
regulatory
Basel
Committee
of
Banking
Supervisors
(BCBS)
ECL
calculations
are
leveraged
for
IFRS
9
modellin
g
but
adjusted
for
key
differences
which
include:
◾
BCBS
requires
12
month
through
the
economic
cycle
losses
whereas
IFRS
9
requires
12
months
or
lifetime
point
in
time
losses
based
on
conditions
at
the
reporting
date
and
multiple
forecasts
of
the
future
economic
conditions
over
the
expected
lives;
◾
IFRS
9
models
do
not
include
certain
conservative
BCBS
model
floors
and
downturn
assessments
and
require
discounting
to
the
reporting
date
at
the
original
EIR
rather
than
using
the
cost
of
capital
to
the
date
of
default;
◾
Management
adjustments
are
made
to
modelled
output
to
account
for
situations
where
known
or
expected
risk
factors
and
information
have
not
been
considered
in
the
modelling
process,
for
example
forecast
economic
scenarios
for
uncertain
political
events;
and
◾
ECL
is
measured
at
the
individual
financial
instrument
level,
however
a
collective
approach
where
financial
instruments
with
similar
risk
characteristics
are
grouped
together,
with
apportionment
to
individual
financial
instruments,
is
used
where
effects
can
only
be
seen
at
a
collective
Notes
to
the
financial
statements
Performance/return
Barclays
Bank
PLC
2019
Annual
Report
on
Form
20-F
118
level,
for
example
for
forward
-
looking
information.
For
the
IFRS
9
impairment
assessment,
the
Barclays
Bank
Group’
risk
models
are
used
to
determine
the
PD,
LGD
and
EAD.
For
Stage
2
and
3,
the
Barclays
Bank
Group
applies
lifetime
PDs
but
uses
12
month
PDs
for
Stage
1.
The
ECL
drivers
of
PD,
EAD
and
LGD
are
modelled
at
an
account
level
which
considers
vintage,
among
other
credit
factors.
Also,
the
assessment
of
significant
increase
in
credit
risk
is
based
on
the
initial
lifetime
PD
curve,
which
accounts
for
the
different
credit
risk
underwritten
over
time.
Forbearance
A
financial
asset
is
subject
to
forbearance
when
it
is
modified
due
to
the
credit
distress
of
the
borrower.
A
modification
made
to
the
terms
of
an
asset
due
to
forbearance
will
typically
be
assessed
as
a
non
-
substantial
modification
that
does
not
result
in
derecognition
of
the
original
loan,
except
in
circumstances
where
debt
is
exchanged
for
equity.
Both
performing
and
non
-performing
forbearance
assets
are
classified
as
Stage
3
except
where
it
is
established
that
the
concession
granted
has
not
resulted
in
diminished
financial
obligation
and
that
no
other
regulatory
definitions
of
default
criteria
has
been
triggered,
in
which
case
the
asset
is
classified
as
Stage
2.
The
minimum
probationary
period
for
non
-
performing
forbearance
is
12
months
and
for
performing
forbearance,
24
months.
Hence,
a
minimum
of
36
months
is
required
for
non
-
performing
forbearance
to
move
out
of
a
forborne
state.
No
financial
instrument
in
forbearance
can
transfer
back
to
Stage
1
until
all
of
the
Stage
2
thresholds
are
no
longer
met
and
can
only
move
out
of
Stage
3
when
no
longer
credit
impaired.
Accounting
for
the
impairment
of
financial
assets
under
IAS
39
for
2017
Loans
and
other
assets
held
at
amortised
cost
In
accordance
with
IAS
39,
the
Barclays
Bank
Group
assesses
at
each
balance
sheet
date
whether
there
is
objective
evidence
that
loan
assets
will
not
be
recovered
in
full
and,
wherever
necessary,
recognises
an
impairment
loss
in
the
income
statement.
An
impairment
loss
is
recognised
if
there
is
objective
evidence
of
impairment
as
a
result
of
events
that
have
occurred
and
these
have
adversely
impacted
the
estimated
future
cash
flows
fro
m
the
assets.
These
events
include:
◾
◾
◾
◾
◾
◾
observable
data
at
a
portfolio
level
indicating
that
there
is
a
measurable
decrease
in
the
estimated
future
cash
flows,
although
the
decrease
cannot
yet
be
ascribed
to
individual
financial
assets
in
the
portfolio
–
such
as
adverse
changes
in
the
payment
status
of
borrowers
in
the
portfolio
or
national
or
local
economic
conditions
that
correlate
with
defaults
on
the
assets
in
the
portfolio.
Impairment
assessments
are
conducted
individually
for
significant
assets,
which
comprise
all
wholesale
customer
loans
and
larger
retail
business
loans,
and
collectively
for
smaller
loans
and
for
portfolio
level
risks,
such
as
country
or
sectoral
risks.
For
the
purposes
of
the
assessment,
loans
with
similar
credit
risk
characteristics
are
grouped
together
–
generally
on
the
basis
of
their
product
type,
industry,
geographical
location,
collateral
type,
past
due
status
and
other
factors
relevant
to
the
evaluation
of
expected
future
cash
flows.
The
impairment
assessment
includes
estimating
the
expected
future
cash
flows
from
the
asset
or
the
group
of
assets,
which
are
then
discounted
using
the
original
effective
interest
rate
calculated
for
the
asset.
If
this
is
lower
than
the
carrying
value
of
the
asset
or
the
portfolio,
an
impairment
allowance
is
raised.
If,
in
a
subsequent
period,
the
amount
of
the
impairment
loss
decreases,
and
the
decrease
can
be
related
objectively
to
an
event
occurring
after
the
impairment
was
recognised,
the
previously
recognised
impairment
loss
is
reversed
by
adju
sting
the
allowance
account.
The
amount
of
the
reversal
is
recognised
in
the
income
statement.
Following
impairment,
interest
income
continues
to
be
recognised
at
the
original
effective
interest
rate
on
the
restated
carrying
amount,
representing
the
unwind
of
the
discount
of
the
expected
cash
flows,
including
the
principal
due
on
non
-
accrual
loans.
Uncollectable
loans
are
written
off
against
the
related
allowance
for
loan
impairment
on
completion
of
the
Barclays
Bank
Group
’s
internal
processes
when
all
reasonably
expected
recoverable
amounts
have
been
collected.
Subsequent
recoveries
of
amounts
previously
written
off
are
credited
to
the
income
statement.
Available
for
sale
financial
assets
Impairment
of
available
for
sale
debt
instruments
Debt
instruments
are
assessed
for
impairment
in
the
same
way
as
loans.
If
impairment
is
deemed
to
have
occurred,
the
cumulative
decline
in
the
fair
value
of
the
instrument
that
has
previously
been
recognised
in
the
available
for
sale
reserve
is
removed
from
res
erves
and
recognised
in
the
income
statement.
This
may
be
reversed
if
there
is
evidence
that
the
circumstances
of
the
issuer
have
improved.
Impairment
of
available
for
sale
equity
instruments
Where
there
has
been
a
prolonged
or
significant
decline
in
the
fair
value
of
an
equity
instrument
below
its
acquisition
cost,
it
is
deemed
to
be
impaired.
The
cumulative
net
loss
that
has
been
previously
recognised
directly
in
the
available
for
sale
reserve
is
removed
from
reserves
and
recognised
in
the
income
statement.
Notes
to
the
financial
statements
Performance/return
Barclays
Bank
PLC
2019
Annual
Report
on
Form
20-F
119
Increases
in
the
fair
value
of
equity
instruments
after
impairment
are
recognised
directly
in
other
comprehensive
income.
Further
declines
in
the
fair
value
of
equity
instruments
after
impairment
are
recognised
in
the
income
statement.
Critical
accounting
estimates
and
judgements
IFRS
9
impairment
involves
several
important
areas
of
judgement,
including
estimating
forward
looking
modelled
parameters
(PD,
LGD
and
EAD),
developing
a
range
of
unbiased
future
economic
scenarios,
estimating
expected
lives
and
assessing
significant
increases
in
credit
risk,
based
on
the
Barclays
Bank
Group’s
experience
of
managing
credit
risk.
The
determination
of
expected
life
is
most
material
for
Barclays
credit
card
portfolios
which
is
obtained
via
behavioural
life
analysis
to
materially
capture
the
risk
of
these
facilities.
The
behavioural
life
analysis
for
US
Cards
has
been
updated
during
the
year
to
include
more
recent
portfolio
data,
as
a
consequence
the
expected
life
of
the
US
credit
card
portfolio
has
fallen
fr
o
m
10
years
to
7
years.
These
reductions
led
to
management
adjustment
releases
against
impairment
of
£28m
for
US
Cards.
Within
the
retail
and
small
businesses
portfolios,
which
comprise
large
numbers
of
small
homogenous
assets
with
similar
risk
characteristics
where
credit
scoring
techniques
are
generally
used,
the
impairment
allowance
is
calculated
using
forward
looking
modelled
parameters
which
are
typically
run
at
account
level.
There
are
many
models
in
use,
each
tailored
to
a
product,
line
of
business
or
customer
category.
Judgement
and
knowledge
is
needed
in
selecting
the
statistical
methods
to
use
when
the
models
are
developed
or
revised.
The
impairment
allowance
reflected
in
the
financial
statements
for
these
portfolios
is
therefore
conside
red
to
be
reasonable
and
supportable.
For
individually
significant
assets
in
Stage
3,
impairment
allowances
are
calculated
on
an
individual
basis
and
all
relevant
considerations
that
have
a
bearing
on
the
expected
future
cash
flows
across
a
range
of
econo
mic
scenarios
are
taken
into
account.
These
considerations
can
be
subjective
and
can
include
the
business
prospects
for
the
customer,
the
realisable
value
of
collateral,
the
Barclays
Bank
Group’s
position
relative
to
other
claimants,
the
reliability
of
customer
information
and
the
likely
cost
and
duration
of
the
work
-
out
process.
The
level
of
the
impairment
allowance
is
the
difference
between
the
value
of
the
discounted
expected
future
cash
flows
(discounted
at
the
loan’s
original
effective
interest
rate),
and
its
carrying
amount.
Furthermore,
judgements
change
with
time
as
new
information
becomes
available
or
as
work
-
out
strategies
evolve,
resulting
in
frequent
revisions
to
the
impairment
allowance
as
individual
decisions
are
taken.
Changes
in
these
estimates
would
result
in
a
change
in
the
allowances
and
have
a
direct
impact
on
the
impairment
charge.
2019
2018
2017
a
Impairment
Charges
Recoveries
b
Total
Impairment
Charges
Recoveries
b
Total
Impairment
Charges
Recoveries
b
Total
£m
£m
£m
£m
£m
£m
£m
£m
£m
Loans
and
advances
1,214
(73)
1,141
774
(86)
688
1,724
(188)
1,536
Provision
for
undrawn
contractually
committed
facilities
and
guarantees
provided
55
-
55
(48)
-
(48)
14
-
14
Loans
impairment
1,269
(73)
1,196
726
(86)
640
1,738
(188)
1,550
Cash
collateral
and
settlement
balances
1
-
1
(1)
-
(1)
-
-
-
Financial
investments
-
-
-
-
-
-
3
-
3
Financial
instruments
at
fair
value
through
OCI
-
-
-
4
-
4
-
-
-
Other
financial
assets
measured
at
cost
5
-
5
-
-
-
-
-
-
Credit
impairment
charges
c
1,275
(73)
1,202
729
(86)
643
1,741
(188)
1,553
Notes
a
2017
numbers
are
pre
sented
on
an
IAS
39
basis
.
b
Cash
recoveries
of
previously
written
off
amounts
c
Barclays
Bank
PLC
transferred
its
UK
banking
business
on
1
April
2018
to
Barclays
Bank
UK
PLC.
Results
relating
to
the
UK
banking
business
for
the
three
months
ended
31
March
2018
(Impairment
charges
:
£217m
and
recoveries
:
£16m
)
and
for
the
twelve
months
ended
31
December
2017
(Impairment
charges
:
£
929m
and
recoveries
:
£1
46m)
have
been
reported
as
discontinued
operations
Write-offs
subject
to
enforcement
activity
The
contractual
amount
outstanding
on
financial
assets
that
were
written
off
during
the
period
ended
31
December
201
9
and
that
are
still
subject
to
enforcement
activity
is
£1,119m
(2018:
£1,152
m).
This
is
lower
than
the
write-
offs
presented
in
the
movement
in
gross
exposures
and
impairment
allowance
table
due
to
assets
sold
during
the
year
post
write-
offs
and
post
write-
off
recoveries.
Mo
dification
of
financial
assets
Financial
assets
of
£1,311m
(2018:
£784m)
were
subject
to
non
-
substantial
modification
during
the
period,
with
a
resulting
loss
of
£20
m
(2018:
£19m).
The
gross
carrying
amount
at
31
December
201
9
of
financial
assets
for
which
the
loss
allowance
has
changed
to
a
12
month
ECL
during
the
year
amounts
to
£
401
m
(2018:
£:114m)
.
Notes
to
the
financial
statements
Performance/return
Barclays
Bank
PLC
2019
Annual
Report
on
Form
20-F
120
8
Operating
expenses
2019
2018
2017
£m
£m
£m
Infrastructure
costs
Property
and
equipment
368
380
792
Depreciation
and
amortisation
a
457
395
637
Lease
payments
a
7
158
248
Impairment
of
property,
equipment
and
intangible
assets
3
2
19
Total
infrastructure
costs
835
935
1,696
Administration
and
general
costs
Consultancy,
legal
and
professional
fees
362
400
505
Marketing
and
advertising
258
316
292
UK
bank
levy
185
223
306
Other
administration
and
general
expenses
3,513
3,285
3,038
Total
administration
and
general
costs
4,318
4,224
4,141
Staff
costs
4,565
4,874
4,393
Provisions
for
litigation
and
conduct
264
1,706
448
Operating
expenses
9,982
11,739
10,678
Note
a
With
adoption
of
IFRS
16
from
1
January
2019,
the
depreciation
charge
associated
with
right
of
use
assets
is
reported
within
the
depreciation
and
amortisation
charge
for
2019.
For
further
details
on
staff
costs
including
accounting
policies,
refer
to
Not
e
30.
9
Tax
Accounting
for
income
taxes
Barclays
Bank
Group
applies
IAS
12
Income
Taxes
in
accounting
for
taxes
on
income.
Income
tax
payable
on
taxable
profits
(current
tax)
is
recognised
as
an
expense
in
the
periods
in
which
the
profits
arise.
Withholding
taxes
are
also
treated
as
income
taxes.
Income
tax
recoverable
on
tax
allowable
losses
is
recognised
as
a
current
tax
asset
only
to
the
extent
that
it
is
regarded
as
recoverab
le
by
offsetting
against
taxable
profits
arising
in
the
current
or
prior
periods.
Current
tax
is
measured
using
tax
rates
and
tax
laws
that
have
been
enacted
or
substantively
enacted
at
the
balance
sheet
date.
Deferred
tax
assets
are
recognised
to
the
extent
that
it
is
probable
that
taxable
profit
will
be
available
against
which
the
deductible
temporary
differences,
and
the
carry
forward
of
unused
tax
credits
and
unused
tax
losses
can
be
utilised,
except
in
certain
circumstances
where
the
deferred
tax
asset
relating
to
the
deductible
temporary
difference
arises
from
the
initial
recognition
of
an
asset
or
liability
in
a
transaction
that
is
not
a
business
combination
and,
at
the
time
of
the
transaction,
affects
neither
the
accounting
profit
nor
taxable
prof
it
or
loss.
Deferred
tax
is
determined
using
tax
rates
and
legislation
enacted
or
substantively
enacted
by
the
balance
sheet
date
which
are
expected
to
apply
when
the
deferred
tax
asset
is
realised
or
the
deferred
tax
liability
is
settled.
Deferred
tax
assets
and
liabilities
are
only
offset
when
there
is
both
a
legal
right
to
set-off
and
an
intention
to
settle
on
a
net
basis.
Barclays
Bank
Group
considers
an
uncertain
tax
position
to
exist
when
it
considers
that
ultimately,
in
the
future,
the
amount
of
pr
ofit
subject
to
tax
may
be
greater
than
the
amount
initially
reflected
in
the
Barclays
Bank
Group’s
tax
returns.
The
Barclays
Bank
Group
accounts
for
provisions
in
respect
of
uncertain
tax
positions
in
two
different
ways.
A
current
tax
provision
is
recogn
ised
when
it
is
considered
probable
that
the
outcome
of
a
review
by
a
tax
authority
of
an
uncertain
tax
position
will
alter
the
amount
of
cash
tax
due
to,
or
from,
a
tax
authority
in
the
future.
From
recognition,
the
current
tax
provision
is
then
measured
at
the
amount
the
Barclays
Bank
Group
ultimately
expects
to
pay
the
tax
authorit
y
to
resolve
the
position.
Effective
from
1
January
2019,
the
Barclays
Bank
Group
changed
its
accounting
policy
on
the
accrual
of
interest
and
penalty
amounts
in
respect
of
unc
ertain
income
tax
positions
and
now
recognises
such
amounts
as
an
expense
within
profit
before
tax
and
will
continue
to
do
so
in
future
periods.
The
prior
periods’
tax
charges
have
not
been
restated
because
the
accrual
for
interest
and
penalties
in
those
p
eriods
in
respect
of
uncertain
tax
positions
was
not
material.
Deferred
tax
provisions
are
adjustments
made
to
the
carrying
value
of
deferred
tax
assets
in
respect
of
uncertain
tax
positions.
A
deferred
tax
provision
is
recognised
when
it
is
considered
pr
obable
that
the
outcome
of
a
review
by
a
tax
authority
of
an
uncertain
tax
position
will
result
in
a
reduction
in
the
carrying
value
of
the
deferred
tax
asset.
From
recognition
of
a
provision,
measurement
of
the
underlying
deferred
tax
asset
is
adjusted
to
take
into
account
the
expected
impact
of
resolving
the
uncertain
tax
position
on
the
loss
or
temporary
difference
giving
rise
to
the
deferred
tax
asset.
The
approach
taken
to
measurement
takes
account
of
whether
the
uncertain
tax
position
is
a
discrete
position
that
will
be
reviewed
by
the
tax
authority
in
isolation
from
any
other
position,
or
one
of
a
number
of
issues
which
are
expected
to
be
reviewed
together
concurrently
and
resolved
simultaneously
with
a
tax
authority.
The
Barclays
Bank
Gr
oup’s
measurement
of
provisions
is
based
upon
its
best
estimate
of
the
additional
profit
Notes
to
the
financial
statements
Performance/return
Barclays
Bank
PLC
2019
Annual
Report
on
Form
20-F
121
that
will
become
subject
to
tax.
For
a
discrete
position,
consideration
is
given
only
to
the
merits
of
that
position.
Where
a
number
of
issues
are
expected
to
be
revi
ewed
and
resolved
together,
the
Barclays
Bank
Group
will
take
into
account
not
only
the
merits
of
its
position
in
respect
of
each
particular
issue
but
also
the
overall
level
of
provision
relative
to
the
aggregate
of
the
uncertain
tax
positions
across
all
the
issues
that
are
expected
to
be
resolved
at
the
same
time.
In
addition,
in
assessing
provision
levels,
it
is
assumed
that
tax
authorities
will
review
uncertain
tax
positions
and
that
all
facts
will
be
fully
and
transparently
disclosed.
Critical
accounting
estimates
and
judgements
There
are
two
key
areas
of
judgement
that
impact
the
reported
tax
position.
Firstly,
the
level
of
provisioning
for
uncertain
tax
positions;
and
secondly,
the
recognition
and
measurement
of
deferred
tax
assets.
The
Barc
lays
Bank
Group
does
not
consider
there
to
be
a
significant
risk
of
a
material
adjustment
to
the
carrying
amount
of
current
and
deferred
tax
balances,
including
provisions
for
uncertain
tax
positions
in
the
next
financial
year.
The
provisions
for
uncertai
n
tax
positions
cover
a
diverse
range
of
issues
and
reflect
advice
from
external
counsel
where
relevant.
It
should
be
noted
that
only
a
proportion
of
the
total
uncertain
tax
positions
will
be
under
audit
at
any
point
in
time,
and
could
therefore
be
subjec
t
to
challenge
by
a
tax
authority
over
the
next
year.
Deferred
tax
assets
have
been
recognised
based
on
business
profit
forecasts.
Details
on
the
recog
nition
of
deferred
tax
assets
are
provided
in
this
note.
2019
2018
2017
£m
£m
£m
Current
tax
charge/(credit)
Current
year
a
327
94
(489)
Adjustments
in
respect
of
prior
years
(50)
(200)
44
277
(106)
(445)
Deferred
tax
charge/(credit)
Current
year
157
372
1,862
Adjustments
in
respect
of
prior
years
(102)
(37)
(65)
55
335
1,797
Tax
charge
332
229
1,352
Note
a
From
2019,
due
to
an
IAS
12
update,
the
tax
relief
on
payments
in
relation
to
AT1
instruments
has
been
recognised
in
the
tax
charge
of
the
income
statement,
whereas
it
was
previously
recorded
in
retained
earnings.
Comparatives
have
been
restated,
reducing
the
tax
charge
for
2018
by
£175m
and
2017
by
£174m.
Further
detail
can
be
found
in
Note
1.
The
table
below
shows
the
reconciliation
between
the
actual
tax
charge
and
the
tax
charge
that
would
result
from
applying
the
standard
UK
corporation
tax
rate
to
the
Ba
rclays
Bank
Group’s
profit
before
tax.
Notes
to
the
financial
statements
Performance/return
Barclays
Bank
PLC
2019
Annual
Report
on
Form
20-F
122
2019
2019
2018
2018
2017
2017
£m
%
£m
%
£m
%
Profit
before
tax
from
continuing
operations
3,112
1,286
1,758
Tax
charge
based
on
the
standard
UK
corporation
tax
rate
of
19%
(2018:
19%,
2017:
19.25%)
593
19.0%
244
19.0%
339
19.3%
Impact
of
profits/losses
earned
in
territories
with
different
statutory
rates
to
the
UK
(weighted
average
tax
rate
is
26%
(2018:
27.1%,
2017:
38.2%))
217
7.0%
104
8.1%
333
18.9%
Recurring
items:
Non
-
creditable
taxes
including
withholding
taxes
146
4.7%
156
12.1%
191
10.9%
Impact
of
UK
bank
levy
being
non
-
deductible
35
1.1%
42
3.3%
59
3.4%
Non
-
deductible
expenses
34
1.1%
67
5.2%
76
4.3%
Impact
of
Barclays
Bank
PLC's
overseas
branches
being
taxed
both
locally
and
in
the
UK
15
0.5%
16
1.2%
(61)
(3.5%)
Tax
adjustments
in
respect
of
share
-
based
payments
(7)
(0.2%)
11
0.9%
2
0.1%
Changes
in
recognition
of
deferred
tax
and
effect
of
unrecognised
tax
losses
(85)
(2.7%)
(104)
(8.1%)
(72)
(4.1%)
Banking
surcharge
and
other
items
a
(103)
(3.3%)
(69)
(5.4%)
(108)
(6.1%)
AT1
tax
credit
a
(121)
(3.9%)
(123)
(9.6%)
(123)
(7.0%)
Adjustments
in
respect
of
prior
years
(152)
(4.9%)
(237)
(18.4%)
(21)
(1.2%)
Non
-
taxable
gains
and
income
(240)
(7.7%)
(232)
(18.0%)
(191)
(10.9%)
Non
-
recurring
items:
One
off
re
-
measurement
of
US
deferred
tax
assets
-
-
-
-
1,177
67.0%
Impact
of
the
UK
branch
exemption
on
deferred
tax
assets
-
-
-
-
(276)
(15.7%)
Non
-
deductible
provisions
for
UK
customer
redress
-
-
8
0.6%
-
-
Non
-
deductible
provisions
for
investigations
and
litigation
-
-
346
26.9%
66
3.8%
Non
-
taxable
gains
and
income
on
divestments
-
-
-
-
(39)
(2.2%)
Total
tax
charge
332
10.7%
229
17.8%
1,352
76.9%
Note
a
From
2019,
due
to
an
IAS
12
update,
the
tax
relief
on
payments
in
relation
to
AT1
instruments
has
been
recognised
in
the
tax
charge
of
the
income
statement,
whereas
it
was
previously
recorded
in
retained
earnings.
The
tax
charge
for
the
current
period
has
been
reduced
by
£
171m
(relief
at
the
standar
d
UK
corporation
tax
rate
is
£121m
and
the
relief
at
the
banking
surcharge
rate
is
£
50m).
Comparatives
have
been
restated,
reducing
the
tax
charge
for
2018
by
£175m
and
2017
by
£174m
(relief
at
the
standard
UK
corporation
tax
rate
is
£123m
(2017
and
2018)
and
the
relief
at
the
banking
surcharge
rate
is
£52m
(2018)
and
£51m
(2017)).
The
table
above
has
the
AT1
tax
credit
for
the
current
year
and
prior
periods
split
between
the
AT1
tax
cr
edit
line
and
the
banking
surcharge
line.
Further
detail
can
be
found
in
Note
1.
Factors
driving
the
effective
tax
rate
The
effective
tax
rate
of
10.7%
is
lower
than
the
UK
corporation
tax
rate
of
19
%
primarily
due
to
the
impact
of
non
-
taxable
gains
and
income
in
the
period,
adjustments
in
respect
of
prior
periods
and
tax
relief
on
payments
made
under
AT1
instruments.
These
factors,
which
have
each
decreased
the
effective
tax
rate,
are
partially
offset
by
the
impact
of
profits
earned
outside
the
UK
being
taxed
at
local
statutory
tax
rates
that
are
higher
than
the
UK
tax
rate
and
non
-
creditable
taxes.
Effective
from
1
January
2019,
a
change
in
accounting
standards
requires
the
tax
consequences
of
all
p
ayments
on
financial
instruments
that
are
classified
as
equity
for
accounting
purposes,
where
those
payments
are
considered
to
be
a
distribution
of
profit,
to
be
included
in
the
income
statement
tax
charge.
Excluding
this
accounting
change
which
resulted
in
tax
relief
on
payments
in
relation
to
AT1
instruments
of
£
171
m
(2018:
£175m)
being
included
in
the
income
statement
tax
charge,
the
Barclays
Bank
Group’s
effective
tax
rate
would
have
been
16.2
%
(2018:
31
.4%).
Barclays
Bank
Group’s
future
tax
charge
will
be
sensitive
to
the
geographic
mix
of
profits
earned
and
the
tax
rates
in
force
in
the
jurisdictions
that
the
Group
operates
in.
In
the
UK,
legislation
to
reduce
the
corporation
tax
rate
to
17%
from
1
April
2020
has
been
enacted.
However,
the
UK
Gover
nment
has
announced
its
intention
to
introduce
legislation
to
reverse
the
planned
rate
reduction
and
to
maintain
the
current
rate
of
19%.
Tax
in
other
comprehensive
income
Tax
relating
to
each
component
of
other
comprehensive
income
on
page
98
can
be
found
in
the
consolidated
statement
of
comprehensive
income
which
includes
within
Other
a
tax
credit
of
£16m
(2018:
£27m
credit)
on
other
items
including
share
based
payments
.
Tax
in
respect
of
discontinued
operations
Tax
relating
to
the
discontinued
operations
can
be
found
in
the
disposal
groups
income
statement
(see
Note
39).
The
tax
charge
of
£nil
(2018:
£138m)
relates
to
the
profit
from
the
ordinary
activities
of
the
discontinued
operations.
Notes
to
the
financial
statements
Performance/return
Barclays
Bank
PLC
2019
Annual
Report
on
Form
20-F
123
Current
tax
assets
and
liabilities
Movements
on
current
assets
and
liabilities
were
as
follows:
Barclays
Bank
Group
2019
2018
£m
£m
Assets
1,713
376
Liabilities
(621)
(494)
As
at
1
January
1,092
(118)
Income
statement
from
continuing
operations
a
(277)
106
Income
statement
from
discontinued
UK
banking
business
-
(90)
Other
comprehensive
income
and
reserves
a
293
(7)
Corporate
income
tax
(received)/paid
(894)
409
Transfer
to
Barclays
Bank
UK
PLC
b
-
677
Other
movements
364
115
578
1,092
Assets
898
1,713
Liabilities
(320)
(621)
As
at
31
December
578
1,092
Note
a
Due
to
the
IAS
12
update
impacting
AT1
tax
credits,
the
2018
comparative
has
been
restated
to
reflect
the
£175m
tax
credit
in
the
income
statement
,
whereas
it
was
previously
recorded
in
retained
earnings
.
Further
detail
can
be
found
in
Note
1.
b
Related
to
the
transfer
of
current
tax
liabilities
to
Barclays
Bank
UK
PLC
as
part
of
the
disposal
of
the
UK
banking
business.
Deferred
tax
assets
and
liabilities
The
deferred
tax
amounts
on
the
balance
sheet
were
as
follows:
Barclays
Bank
Group
2019
2018
£m
£m
Intermediate
Holding
Company
("IHC
Tax
Group")
1,037
1,454
US
Branch
Tax
Group
1,015
1,087
UK
Tax
Group
-
3
Other
408
426
Deferred
tax
asset
2,460
2,970
Deferred
tax
liability
-
UK
Tax
Group
(80)
-
Net
deferred
tax
2,380
2,970
US
deferred
tax
assets
in
the
IHC
and
the
US
Branch
The
deferred
tax
asset
in
the
IHC
Tax
Group
of
£1,037m
(2018:
£1,454m)
includes
£54m
(2018:
£220m)
relating
to
tax
losses
and
the
deferred
tax
asset
in
Barclays
Bank
PLC’s
US
Branch
Tax
Group
of
£1,015m
(2018:
£1,087m)
includes
£84m
(2018:
£167m)
relating
to
tax
losses.
Under
US
tax
rules,
losses
occurring
prior
to
1
January
2018
can
be
carried
forward
and
offset
against
profits
for
a
period
of
20
years.
The
losses
first
arose
in
2011
in
the
IHC
Tax
Group
and
2008
in
the
US
Branch
Tax
Group
and
therefore,
any
unused
amounts
may
begin
to
expire
in
2031
and
2028
respectively.
The
deferred
tax
assets
for
the
IHC
and
the
US
Branch
Tax
Groups’
tax
losses
are
currently
projected
to
be
fully
utilised
by
2020.
UK
Tax
Group
deferred
tax
assets/liabilities
The
deferred
tax
liability
in
the
UK
Tax
Group
of
£
80
m
(2018:
£3m
deferred
tax
asset)
includes
a
deferred
tax
asset
o
f
£268m
(2018:
£nil)
relating
to
tax
losses
which
is
offset
by
a
£348m
deferred
tax
liability
relating
to
temporary
differences.
There
is
no
time
limit
on
utilisation
of
UK
tax
losses
and
business
profit
forecasts
indicate
these
will
be
fully
recovered.
Other
deferred
tax
assets
The
deferred
tax
asset
of
£408m
(2018:
£426m)
in
other
entities
within
the
Barclays
Bank
Group
includes
£117m
(2018:
£142m)
relating
to
tax
losses.
These
deferred
tax
assets
relate
to
a
number
of
different
territories
and
their
recognition
is
based
on
profit
forecasts
or
local
country
law
which
indicate
that
it
is
probable
that
the
losses
and
temporary
differences
will
be
utilised.
Notes
to
the
financial
statements
Performance/return
Barclays
Bank
PLC
2019
Annual
Report
on
Form
20-F
124
Of
the
deferred
tax
asset
of
£408m
(2018:
£426m),
an
amount
of
£148m
(2018:
£245m)
relates
to
entities
which
have
suffered
a
loss
in
either
the
current
or
prior
year.
This
has
been
taken
into
acco
unt
in
reaching
the
above
conclusion
that
these
deferred
tax
assets
will
be
fully
recovered
in
the
future.
The
table
below
shows
movements
on
deferred
tax
assets
and
liabilities
during
the
year.
The
amounts
are
different
from
those
disclosed
on
the
balance
sheet
and
in
the
preceding
table
as
they
are
presented
before
offsetting
asset
and
liability
balances
where
there
is
a
legal
right
to
set-off
and
an
intention
to
settle
on
a
net
basis.
Barclays
Bank
Group
Fixed
asset
timing
differences
Fair
value
through
other
comprehensiv
e
income
Cash
flow
hedges
Retirement
benefit
obligations
Loan
impairment
allowance
Other
provisions
Tax
losses
carried
forward
Share
based
payments
and
deferred
compensati
on
Other
Total
£m
£m
£m
£m
£m
£m
£m
£m
£m
£m
Assets
758
175
38
39
359
112
529
309
1,336
3,655
Liabilities
(16)
(35)
(2)
(434)
-
-
-
-
(198)
(685)
At
1
January
2019
742
140
36
(395)
359
112
529
309
1,138
2,970
Income
statement
66
-
-
(5)
(55)
23
17
(7)
(94)
(55)
Other
comprehensive
income
and
reserves
-
(46)
(175)
(205)
(10)
2
-
8
71
(355)
Other
movements
(118)
(2)
-
(4)
(10)
(10)
(23)
(5)
(8)
(180)
690
92
(139)
(609)
284
127
523
305
1,107
2,380
Assets
719
110
-
31
284
127
523
305
1,329
3,428
Liabilities
(29)
(18)
(139)
(640)
-
-
-
-
(222)
(1,048)
At
31
December
2019
690
92
(139)
(609)
284
127
523
305
1,107
2,380
Assets
a
1,232
188
1
49
735
157
596
341
1,346
4,645
Liabilities
(28)
(143)
(69)
(218)
-
-
-
-
(208)
(666)
At
1
January
2018
a
1,204
45
(68)
(169)
735
157
596
341
1,138
3,979
Income
statement
from
continuing
operations
61
(9)
-
(124)
(76)
(62)
(104)
(28)
7
(335)
Income
statement
from
discontinued
UK
banking
business
(48)
-
-
-
-
-
-
-
-
(48)
Other
comprehensive
income
and
reserves
-
97
103
(98)
(18)
8
1
(10)
(8)
75
Transfer
to
Barclays
Bank
UK
PLC
b
(447)
-
-
-
(279)
-
-
-
(21)
(747)
Other
movements
(28)
7
1
(4)
(3)
9
36
6
22
46
742
140
36
(395)
359
112
529
309
1,138
2,970
Assets
758
175
38
39
359
112
529
309
1,336
3,655
Liabilities
(16)
(35)
(2)
(434)
-
-
-
-
(198)
(685)
At
31
December
2018
742
140
36
(395)
359
112
529
309
1,138
2,970
Notes
a
Due
to
the
adoption
of
IFRS
9
and
IFRS
15
on
1
January
2018,
additional
deferred
tax
assets
of
£627m
were
recognised.
b
Related
to
the
transfer
of
deferred
tax
assets
to
Barclays
Bank
UK
PLC
as
part
of
the
disposal
of
the
UK
banking
business.
Unrecognised
deferred
tax
Tax
losses
and
temporary
differences
Deferred
tax
assets
have
not
been
recognised
in
respect
of
gross
deductible
temporary
differences
of
£208m
(2018:
£1
7
4
m),
unused
tax
credits
of
£247m
(2018:
£203
m),
and
gross
tax
losses
of
£18,582m
(2018:
£16,313
m).
The
tax
losses
include
capital
losses
of
£2,980m
(2018:
£3,225
m).
Of
these
tax
losses,
£41m
(2018:
£240
m)
expire
within
five
years,
£239m
(2018:
£259
m)
expire
within
six
to
ten
years,
£5,178m
(2018:
£948
m)
expire
w
ithin
11
to
20
years
and
£13,124m
(2018:
£14,866
m)
can
be
carried
forward
indefinitely.
Deferred
tax
assets
have
not
been
recognised
in
respect
o
f
these
items
because
it
is
not
probable
that
future
taxable
profits
and
gains
will
be
available
against
which
they
can
be
utilised.
Barclays
Bank
Group
investments
in
subsidiaries,
branches
and
associates
Deferred
tax
is
not
recognised
in
respect
of
the
value
of
Barclays
Bank
Group's
investments
in
subsidiaries,
branches
and
associates
where
the
Barclays
Bank
Group
is
able
to
control
the
timing
of
the
reversal
of
the
temporary
differences
and
it
is
probable
that
such
differences
will
not
reverse
in
the
foreseeable
future.
The
aggregate
amount
of
these
temporary
differences
for
which
deferred
tax
liabilities
have
not
been
reco
gnised
was
£0.7bn
(2018:
£0.6
bn).
Notes
to
the
financial
statements
Performance/return
Barclays
Bank
PLC
2019
Annual
Report
on
Form
20-F
125
10
Dividends
on
ordinary
shares
and
other
equity
instruments
The
2019
financial
statements
include
£233m
(2018:
£14,585m)
of
dividends
paid.
A
half
year
dividend
was
paid
of
£233m
(2018:
£149m).
There
was
£nil
final
dividend
paid
in
relation
to
the
prior
year
(2018:
£142m)
or
£nil
dividend
in
specie
paid
(2018:
£14
,294m).
These
result
in
a
total
dividend
for
the
year
of
£0.10
(2018:
£6.23)
per
ordinary
share.
Dividends
paid
on
preference
shares
amounted
to
£
41
m
(2018:
£204m).
Dividends
paid
on
the
4.75%
€100
preference
shares
amounted
to
£
409.44
per
share
(2018:
£421.16).
Dividends
paid
on
the
6.278%
US$100
preference
shares
amounted
to
£485.94
per
share
(2018:
£446.17).
Dividends
paid
on
the
8.125%
US$0.25
preference
shares
amounted
to
£
nil
per
share
(2018:
£1.54).
Dividends
paid
on
other
equity
instruments
amo
unted
to
£660m
(2018:
£647m).
For
further
detail
on
other
equity
instruments,
please
refer
to
Note
27.
The
Directors
have
approved
a
full
year
dividend
in
respect
of
2019
of
£263m,
which
will
be
paid
on
25
March
2020.
The
financial
statements
for
the
year
ended
31
December
2019
do
not
reflect
this
dividend,
which
will
be
accounted
for
in
shareholders’
equity
as
an
appropriation
of
retained
profits
in
the
year
ending
31
December
2020.
Dividends
are
funded
out
of
distributable
reserves
Notes
to
the
financial
statements
Assets
and
liabilities
held
at
fair
value
Barclays
Bank
PLC
2019
Annual
Report
on
Form
20-F
126
The
notes
included
in
this
section
focus
on
assets
and
liabilities
the
Barclays
Bank
Group
holds
and
recognises
at
fair
value.
Fair
value
refers
to
the
price
that
would
be
received
to
sell
an
asset
or
the
price
that
would
be
paid
to
transfer
a
liability
in
an
arm’s-
length
transaction
with
a
willing
counterparty,
which
may
be
an
observable
marke
t
price
or,
where
there
is
no
quoted
price
for
the
instrument,
may
be
an
estimate
based
on
available
market
data.
Detail
regarding
the
Barclays
Bank
Group
’s
approach
to
managing
market
risk
can
be
found
on
page
39.
11
Trading
portfolio
Accounting
for
trading
portfolio
assets
and
liabilities
In
accordance
with
IFRS
9,
all
assets
and
liabilities
held
for
trading
purposes
are
held
at
fair
value
with
gains
and
losses
in
the
changes
in
fair
value
taken
to
the
income
statement
in
net
trading
income
(Note
5).
Barclays
Bank
Group
2019
2018
£m
£m
Debt
securities
and
other
eligible
bills
51,881
57,134
Equity
securities
56,000
39,565
Traded
loans
5,378
7,234
Commodities
78
105
Trading
portfolio
assets
113,337
104,038
Debt
securities
and
other
eligible
bills
(22,038)
(24,125)
Equity
securities
(13,174)
(12,489)
Trading
portfolio
liabilities
(35,212)
(36,614)
12
Financial
assets
at
fair
value
through
the
income
statement
Accounting
for
financial
assets
mandatorily
at
fair
value
Financial
assets
that
are
held
for
trading
are
recognised
at
fair
value
through
profit
or
loss.
In
addition,
financial
assets
are
held
at
fair
value
through
profit
or
loss
if
they
do
not
contain
contractual
terms
that
give
rise
on
specified
dates
to
cash
flows
that
are
SPPI,
or
if
the
financial
asset
is
not
held
in
a
business
model
that
is
either
(i)
a
business
model
to
collect
the
contractual
cash
flows
or
(ii)
a
business
model
that
is
achieved
by
both
collecting
contractual
cash
flows
and
selling.
Accounting
for
financial
assets
designated
at
fair
value
Financial
assets,
other
than
those
held
for
trading,
are
classified
in
this
category
if
they
are
so
irrevocably
designated
at
inception
and
the
use
of
the
designation
removes
or
significantly
reduces
an
accounting
mismatch.
Subsequent
changes
in
fair
value
for
these
instruments
are
recognised
in
the
income
statement
in
net
investment
income,
except
if
reporting
it
in
trading
income
reduces
an
accounting
mismatch.
The
details
on
how
the
fair
value
amounts
are
derived
for
financial
assets
at
fair
value
are
described
in
Note
16.
Barclays
Bank
Group
2019
2018
£m
£m
Loans
and
advances
1,333
1,387
Debt
securities
3,995
3,855
Reverse
repurchase
agreements
and
other
similar
secured
lending
40
106
Financial
assets
designated
at
fair
value
5,368
5,348
Loans
and
advances
17,804
14,257
Debt
securities
1,225
660
Equity
securities
6,548
5,172
Reverse
repurchase
agreements
and
other
similar
secured
lending
97,783
119,285
Other
financial
assets
742
528
Financial
assets
mandatorily
at
fair
value
124,102
139,902
Total
129,470
145,250
Notes
to
the
financial
statements
Assets
and
liabilities
held
at
fair
value
Barclays
Bank
PLC
2019
Annual
Report
on
Form
20-F
127
Credit
risk
of
financial
assets
designated
at
fair
value
and
related
credit
derivatives
The
following
table
shows
the
maximum
exposure
to
credit
risk,
the
changes
in
fair
value
attributable
to
changes
in
credit
risk,
and
the
cumulative
changes
in
fair
value
since
initial
recognition
for
loans
and
advances.
The
table
does
not
include
debt
securities
and
reverse
repurchase
agreements
and
other
similar
secured
lending
designated
at
FV
as
they
have
minimal
exposure
to
credit
risk.
Reverse
repurchase
agreements
are
collateralised
and
debt
securities
are
primarily
relating
to
high
quality
sovereigns.
Barclays
Bank
Group
Maximum
exposure
as
at
31
December
Changes
in
fair
value
during
the
year
ended
Cumulative
changes
in
fair
value
from
inception
2019
2018
2019
2018
2019
2018
£m
£m
£m
£m
£m
£m
Loans
and
advances
designated
at
fair
value,
attributable
to
credit
risk
a
1,333
1,387
2
2
(5)
(8)
Note
a
Loans
and
advances
credit
risk
hedged
by
credit
derivatives
for
Barclays
Bank
Group
is
£nil
(2018:
£nil)
and
for
Barclays
Bank
PLC
is
£nil
(2018:
£nil)
13
Derivative
financial
instruments
Accounting
for
derivatives
Derivative
instruments
are
contracts
whose
value
is
derived
from
one
or
more
underlying
financial
instruments
or
indices
defined
in
the
contract.
They
include
swaps,
forward
-
rate
agreements,
futures,
options
and
combinations
of
these
instruments
and
primarily
affect
the
Barclays
Bank
Group’s
net
interest
income,
net
trading
income
and
derivative
assets
and
liabilities.
Notional
amounts
of
the
contracts
are
not
recorded
on
the
balance
sheet.
Derivatives
are
used
to
hedge
interest
rate,
credit
risk,
inflation
risk,
exchange
rate,
commodity,
and
equity
exposures
and
exposures
to
certain
indices
such
as
house
price
indices
and
retail
price
indices
related
to
non
-
trading
positions
All
derivative
instruments
are
held
at
fair
value
through
profit
or
loss,
except
for
derivatives
that
are
in
a
designated
cash
flow
or
net
investment
hedge
accounting
relationship.
Derivatives
are
classified
as
assets
when
their
fair
value
is
positive
or
as
liabilities
when
their
fair
value
is
negative.
This
includes
terms
included
in
a
contract
or
financial
liability
(the
ho
st),
which,
had
it
been
a
standalone
contract,
would
have
met
the
definition
of
a
derivative.
If
these
are
separated
from
the
host,
i.e.
when
the
economic
characteristics
of
the
embedded
derivative
are
not
closely
related
with
those
of
the
host
contract
an
d
the
combined
instrument
is
not
measured
at
fair
value
through
profit
or
loss,
then
they
are
accounted
for
in
the
same
way
as
derivatives.
For
financial
assets,
the
requirements
are
whether
the
financial
asset
contain
contractual
terms
that
give
rise
on
specified
dates
to
cash
flows
that
are
SPPI,
and
consequently
the
requirements
for
accounting
for
embedded
derivatives
are
not
applicable
to
financial
assets.
Hedge
accounting
The
Barclays
Bank
Group
applies
the
requirements
of
IAS
39
Financial
Instruments:
Recognition
and
Measurement
The
Barclays
Bank
Group
applies
hedge
accounting
to
represent
,
the
economic
effects
of
its
interest
rate,
currency
and
contractually
linked
inflation
risk
management
strategies.
Where
derivative
s
are
held
for
risk
management
purposes,
and
when
transactions
meet
the
required
criteria
for
documentation
and
hedge
effectiveness,
the
Barclays
Bank
Group
applies
fair
value
hedge
accounting,
cash
flow
hedge
accounting,
or
hedging
of
a
net
investment
in
a
foreign
operation,
as
appropriate
to
the
risks
being
hedged.
The
Barclays
Bank
Group
has
elected
to
early
adopt
the
‘Amendments
to
IAS
39
and
IFRS
7
Interest
Rate
Benchmark
Reform’
issued
in
September
2019.
In
accordance
with
the
transition
provisions,
the
amendments
have
been
adopted
retrospectively
to
hedging
relationships
that
existed
at
the
start
of
the
reporting
period
or
were
designated
thereafter,
and
to
the
amount
accumulated
in
the
cash
flow
hedge
reserve
at
that
date.
The
amendments
provide
temporary
relief
from
applying
specific
hedge
accounting
requirements
to
hedging
relation
ships
directly
affected
by
IBOR
(‘Interbank
Offered
Rates’)
reform.
The
reliefs
have
the
effect
that
IBOR
reform
should
not
generally
cause
hedge
accounting
to
terminate.
However,
any
hedge
ineffectiveness
continues
to
be
recorded
in
the
income
statement.
Furthermore,
the
amendments
set
out
triggers
for
when
the
reliefs
will
end,
which
include
the
uncertainty
arising
from
interest
rate
benchmark
reform
no
longer
being
present.
In
summary,
the
reliefs
provided
by
the
amendments
that
apply
to
the
Barclays
Ba
nk
Group
are:
◾
When
considering
the
‘highly
probable’
requirement,
the
Barclays
Bank
Group
has
assumed
that
the
IBOR
interest
rates
upon
which
our
hedged
items
are
based
do
not
change
as
a
result
of
IBOR
Reform.
◾
In
assessing
whether
the
hedge
is
expected
to
be
highly
effective
on
a
forward
-
looking
basis
the
Barclays
Bank
Group
has
assumed
that
the
IBOR
interest
rates
upon
which
the
cash
flows
of
the
hedged
items
and
the
interest
rate
swaps
that
hedge
them
are
based
are
not
altered
by
IBOR
reform.
Notes
to
the
financial
statements
Assets
and
liabilities
held
at
fair
value
Barclays
Bank
PLC
2019
Annual
Report
on
Form
20-F
128
◾
The
Barclays
Bank
Group
will
not
discontinue
hedge
accounting
during
the
period
o
f
IBOR
-
related
uncertainty
solely
because
the
retrospective
effectiveness
falls
outside
the
required
80
–125%
range.
◾
The
Barclays
Bank
Group
has
not
recycled
the
cash
flow
hedge
reserve
relating
to
the
period
after
the
reforms
are
expected
to
take
effect.
◾
The
Barclays
Bank
Group
has
assessed
whether
the
hedged
IBOR
risk
component
is
a
separately
identifiable
risk
only
when
it
first
designates
a
hedged
item
in
a
fair
value
hedge
and
not
on
an
ongoing
basis.
Further
amendments
are
expected
for
future
accounting
periods
following
completion
of
the
second
part
of
the
IASB’s
two
-
phased
project
which
focuses
on
the
impacts
of
IBOR
reform
on
financial
reporting.
Fair
value
hedge
accounting
Changes
in
fair
value
of
derivatives
that
q
ualify
and
are
designated
as
fair
value
hedges
are
recorded
in
the
income
statement,
together
with
changes
in
the
fair
value
of
the
hedged
asset
or
liability
that
are
attributable
to
the
hedged
risk.
The
fair
value
changes
adjust
the
carrying
value
of
the
hedged
asset
or
liability
held
at
amortised
cost.
If
hedge
relationships
no
longer
meet
the
criteria
for
hedge
accounting,
hedge
accounting
is
discontinued.
For
fair
value
hedges
of
interest
rate
risk,
the
fair
value
adjustment
to
the
hedged
item
is
amort
ised
to
the
income
statement
over
the
period
to
maturity
of
the
previously
designated
hedge
relationship
using
the
effective
interest
method.
If
the
hedged
item
is
sold
or
repaid,
the
unamortised
fair
value
adjustment
is
recognised
immediately
in
the
incom
e
statement.
For
items
classified
as
fair
value
through
other
comprehensive
income,
the
hedge
accounting
adjustment
is
included
in
other
comprehensive
income.
Cash
flow
hedge
accounting
For
qualifying
cash
flow
hedges,
the
fair
value
gain
or
loss
associated
with
the
effective
portion
of
the
cash
flow
hedge
is
recognised
initially
in
other
comprehensive
income,
and
then
recycled
to
the
income
statement
in
the
periods
when
the
hedged
item
will
affect
profit
o
r
loss.
Any
ineffective
portion
of
the
gain
or
loss
on
the
hedging
instrument
is
recognised
in
the
income
statement
immediately.
When
a
hedging
instrument
expires
or
is
sold,
or
when
a
hedge
no
longer
meets
the
criteria
for
hedge
accounting,
any
cumulativ
e
gain
or
loss
existing
in
equity
at
that
time
remains
in
equity
and
is
recognised
when
the
hedged
item
is
ultimately
recognised
in
the
income
statement.
When
a
forecast
transaction
is
no
longer
expected
to
occur,
the
cumulative
gain
or
loss
that
was
recog
nised
in
equity
is
immediately
transferred
to
the
income
statement.
Hedges
of
net
investments
The
Barclays
Bank
Group’s
net
investments
in
foreign
operations,
including
monetary
items
accounted
for
as
part
of
the
net
investment,
are
hedged
for
foreign
cu
rrency
risks
using
both
derivatives
and
foreign
currency
borrowings.
Hedges
of
net
investments
are
accounted
for
similarly
to
cash
flow
hedges;
the
effective
portion
of
the
gain
or
loss
on
the
hedging
instrument
is
being
recognised
directly
in
other
compre
hensive
income
and
the
ineffective
portion
being
recognised
immediately
in
the
income
statement.
The
cumulative
gain
or
loss
recognised
in
other
comprehensive
income
is
recognised
in
the
income
statement
on
the
disposal
or
partial
disposal
of
the
foreign
o
peration,
or
other
reductions
in
the
Barclays
Bank
Group’s
investment
in
the
operation.
Barclays
Bank
Group
Notional
contract
amount
Fair
value
Assets
Liabilities
£m
£m
£m
As
at
31
December
2019
Total
derivative
assets/(liabilities)
held
for
trading
41,778,195
229,459
(228,338)
Total
derivative
assets/(liabilities)
held
for
risk
management
109,762
182
(602)
Derivative
assets/(liabilities)
41,887,957
229,641
(228,940)
As
at
31
December
2018
Total
derivative
assets/(liabilities)
held
for
trading
43,920,658
222,522
(219,527)
Total
derivative
assets/(liabilities)
held
for
risk
management
116,441
161
(65)
Derivative
assets/(liabilities)
44,037,099
222,683
(219,592)
Notes
to
the
financial
statements
Assets
and
liabilities
held
at
fair
value
Barclays
Bank
PLC
2019
Annual
Report
on
Form
20-F
129
Further
information
on
netting
arrangements
of
derivative
financial
instruments
can
be
found
within
Note
17.
The
fair
values
and
notional
amounts
of
derivatives
held
for
trading
are
set
out
in
the
following
table:
Derivatives
held
for
trading
and
risk
management
Barclays
Bank
Group
Notional
contract
amount
Fair
value
Assets
Liabilities
£m
£m
£m
Derivatives
held
for
trading
As
at
31
December
2019
Foreign
exchange
derivatives
OTC
derivatives
4,910,084
56,535
(56,793)
Derivatives
cleared
by
central
counterparty
74,136
84
(145)
Exchange
traded
derivatives
18,520
12
(31)
Foreign
exchange
derivatives
5,002,740
56,631
(56,969)
Interest
rate
derivatives
OTC
derivatives
12,631,723
140,553
(133,408)
Derivatives
cleared
by
central
counterparty
17,088,755
862
(859)
Exchange
traded
derivatives
5,041,948
1,251
(1,265)
Interest
rate
derivatives
34,762,426
142,666
(135,532)
Credit
derivatives
OTC
derivatives
399,386
5,253
(5,399)
Derivatives
cleared
by
central
counterparty
426,130
2,962
(2,687)
Credit
derivatives
825,516
8,215
(8,086)
Equity
and
stock
index
derivatives
OTC
derivatives
232,050
10,628
(15,785)
Exchange
traded
derivatives
841,994
10,178
(10,849)
Equity
and
stock
index
derivatives
1,074,044
20,806
(26,634)
Commodity
derivatives
OTC
derivatives
7,327
303
(256)
Exchange
traded
derivatives
106,142
838
(861)
Commodity
derivatives
113,469
1,141
(1,117)
Derivatives
with
subsidiaries
-
-
-
Derivative
assets/(liabilities)
held
for
trading
41,778,195
229,459
(228,338)
Total
OTC
derivatives
held
for
trading
18,180,570
213,272
(211,641)
Total
derivatives
cleared
by
central
counterparty
held
for
trading
17,589,021
3,908
(3,691)
Total
exchange
traded
derivatives
held
for
trading
6,008,604
12,279
(13,006)
Derivatives
with
subsidiaries
held
for
trading
Derivative
assets/(liabilities)
held
for
trading
41,778,195
229,459
(228,338)
Derivatives
held
for
risk
management
Derivatives
designated
as
cash
flow
hedges
Interest
rate
swaps
2,085
28
(1)
Interest
rate
derivatives
cleared
by
central
counterparty
43,594
-
-
Derivatives
designated
as
cash
flow
hedges
45,679
28
(1)
Derivatives
designated
as
fair
value
hedges
Interest
rate
swaps
7,619
124
(601)
Forward
foreign
exchange
-
-
-
Interest
rate
derivatives
cleared
by
central
counterparty
55,319
-
-
Derivatives
designated
as
fair
value
hedges
62,938
124
(601)
Derivatives
designated
as
hedges
of
net
investments
Forward
foreign
exchange
1,145
30
-
Foreign
exchange
derivatives
cleared
by
central
counterparty
-
-
-
Derivatives
designated
as
hedges
of
net
investments
1,145
30
-
Derivative
assets/(liabilities)
held
for
risk
management
109,762
182
(602)
Total
OTC
derivatives
held
for
risk
management
10,849
182
(602)
Total
derivatives
cleared
by
central
counterparty
held
for
risk
management
98,913
-
-
Derivative
assets/(liabilities)
held
for
risk
management
109,762
182
(602)
Notes
to
the
financial
statements
Assets
and
liabilities
held
at
fair
value
Barclays
Bank
PLC
2019
Annual
Report
on
Form
20-F
130
Derivatives
held
for
trading
and
risk
management
Barclays
Bank
Group
Notional
contract
amount
Fair
value
Assets
Liabilities
£m
£m
£m
Derivatives
held
for
trading
As
at
31
December
2018
Foreign
exchange
derivatives
OTC
derivatives
5,200,824
63,982
(63,832)
Derivatives
cleared
by
central
counterparty
72,526
163
(233)
Exchange
traded
derivatives
23,585
7
(7)
Foreign
exchange
derivatives
5,296,935
64,152
(64,072)
Interest
rate
derivatives
OTC
derivatives
9,978,858
123,962
(119,295)
Derivatives
cleared
by
central
counterparty
15,794,162
974
(1,014)
Exchange
traded
derivatives
11,087,714
356
(323)
Interest
rate
derivatives
36,860,734
125,292
(120,632)
Credit
derivatives
OTC
derivatives
386,508
6,575
(5,239)
Derivatives
cleared
by
central
counterparty
372,567
4,180
(4,280)
Credit
derivatives
759,075
10,755
(9,519)
Equity
and
stock
index
derivatives
OTC
derivatives
190,496
9,711
(11,830)
Exchange
traded
derivatives
692,435
11,171
(12,066)
Equity
and
stock
index
derivatives
882,931
20,882
(23,896)
Commodity
derivatives
OTC
derivatives
9,756
521
(408)
Exchange
traded
derivatives
111,227
920
(1,000)
Commodity
derivatives
120,983
1,441
(1,408)
Derivatives
with
subsidiaries
-
-
-
Derivative
assets/(liabilities)
held
for
trading
43,920,658
222,522
(219,527)
Total
OTC
derivatives
held
for
trading
15,766,442
204,751
(200,604)
Total
derivatives
cleared
by
central
counterparty
held
for
trading
16,239,255
5,317
(5,527)
Total
exchange
traded
derivatives
held
for
trading
11,914,961
12,454
(13,396)
Derivatives
with
subsidiaries
held
for
trading
-
-
-
Derivative
assets/(liabilities)
held
for
trading
43,920,658
222,522
(219,527)
Derivatives
held
for
risk
management
Derivatives
designated
as
cash
flow
hedges
OTC
interest
rate
derivatives
2,622
18
(7)
Interest
rate
derivatives
cleared
by
central
counterparty
45,995
-
-
Derivatives
designated
as
cash
flow
hedges
48,617
18
(7)
Derivatives
designated
as
fair
value
hedges
OTC
interest
rate
derivatives
2,598
143
(48)
Interest
rate
derivatives
cleared
by
central
counterparty
62,258
-
-
Derivatives
designated
as
fair
value
hedges
64,856
143
(48)
Derivatives
designated
as
hedges
of
net
investments
OTC
foreign
exchange
derivatives
2,968
-
(10)
Derivatives
designated
as
hedges
of
net
investment
2,968
-
(10)
Derivative
assets/(liabilities)
held
for
risk
management
116,441
161
(65)
Total
OTC
derivatives
held
for
risk
management
8,188
161
(65)
Total
derivatives
cleared
by
central
counterparty
held
for
risk
management
108,253
-
-
Derivative
assets/(liabilities)
held
for
risk
management
116,441
161
(65)
Notes
to
the
financial
statements
Assets
and
liabilities
held
at
fair
value
Barclays
Bank
PLC
2019
Annual
Report
on
Form
20-F
131
Hedge
accounting
Hedge
accounting
is
applied
predominantly
for
the
following
risks:
◾
Interest
rate
risk
–
arises
due
to
a
mismatch
between
fixed
interest
rates
and
floating
interest
rates.
Interest
rate
risk
also
includes
exposure
to
inflation
risk
for
certain
types
of
investments.
◾
Currency
risk
–
arises
due
to
assets
or
liabilities
being
denominated
in
different
currencies
than
the
functiona
l
currency
of
the
relevant
entity.
At
a
consolidated
level,
currency
risk
also
arises
when
the
functional
currency
of
subsidiaries
are
different
from
the
parent.
◾
Contractually
linked
inflation
risk
–
arises
from
financial
instruments
within
contractually
specified
inflation
risk.
The
Barclays
Bank
Group
does
not
hedge
inflation
risk
that
arises
from
other
activities.
In
order
to
hedge
these
risks,
the
Barclays
Bank
Group
uses
the
following
hedging
instruments:
◾
Interest
rate
derivatives
to
swap
interest
rat
e
exposures
into
either
fixed
or
variable
rates.
◾
Currency
derivatives
to
swap
foreign
currency
net
investment
exposure
to
local
currency.
◾
Inflation
derivatives
to
swap
inflation
exposure
into
either
fixed
or
variable
interest
rates.
In
some
cases,
certain
items
which
are
economically
hedged
may
be
ineligible
hedged
items
for
the
purposes
of
IAS
39,
such
as
core
deposits
and
equity.
In
these
instances,
a
proxy
hedging
solution
can
be
utilised
whereby
portfolios
of
floating
rate
assets
are
designated
as
eligible
hedged
items
in
cash
flow
hedges.
In
some
hedging
relationships,
the
Barclays
Bank
Group
designates
risk
components
of
hedged
items
as
follows:
◾
Benchmark
interest
rate
risk
as
a
component
of
interest
rate
risk,
such
as
the
LIBOR
or
Risk
Free
Rate
(RFR)
component.
◾
Inflation
risk
as
a
contractually
specified
component
of
a
debt
instrument.
◾
Spot
exchange
rate
risk
for
foreign
currency
financial
assets
or
financial
liabilities.
◾
Components
of
cash
flows
of
hedged
items,
for
example
ce
rtain
interest
payments
for
part
of
the
life
of
an
instrument.
Using
the
benchmark
interest
rate
risk
results
in
other
risks,
such
as
credit
risk
and
liquidity
risk,
being
excluded
from
the
hedge
accounting
relationship.
LIBOR
is
considered
the
predominan
t
interest
rate
risk
and
therefore
the
hedged
items
change
in
fair
value
on
a
fully
proportionate
basis
with
reference
to
this
risk.
In
respect
of
many
of
the
Barclays
Bank
Group’s
hedge
accounting
relationships,
the
hedged
item
and
hedging
instrument
change
frequently
due
to
the
dynamic
nature
of
the
risk
management
and
hedge
accounting
strategy.
The
Barclays
Bank
Group
applies
hedge
acc
ounting
to
dynamic
scenarios,
predominantly
in
relation
to
interest
rate
risk,
with
a
combination
of
hedged
items
in
order
for
its
financial
statements
to
reflect
as
closely
as
possible
the
economic
risk
management
undertaken.
In
some
cases,
if
the
hedge
accounting
objective
changes,
the
relevant
hedge
accounting
relationship
is
de
-
designated
and
is
replaced
with
a
different
hedge
accounting
relationship.
Changes
in
the
GBP
value
of
net
investments
due
to
foreign
currency
movements
are
captured
in
the
curr
ency
translation
reserve,
resulting
in
a
movement
in
CET1
capital.
The
Barclays
Bank
Group
mitigates
this
by
matching
the
CET1
capital
movements
to
the
revaluation
of
the
foreign
currency
RWA
exposures.
Net
investment
hedges
are
designated
where
necessary
to
reduce
the
exposure
to
movement
in
a
particular
exchange
rate
to
within
limits
mandated
by
Risk.
As
far
as
possible,
existing
external
currency
liabilities
are
designated
as
the
hedging
instruments.
The
hedging
instruments
share
the
same
risk
exposures
as
the
hedged
items.
Hedge
effectiveness
is
determined
with
reference
to
quantitative
tests,
predominantly
regression
testing,
but
to
the
extent
hedging
instruments
are
exposed
to
different
risks
than
the
hedged
items,
this
could
result
in
hedge
ineffectiveness
or
hedge
accounting
failures.
Sources
of
ineffectiveness
include
the
following:
◾
Mismatches
between
the
contractual
terms
of
the
hedged
item
and
hedging
instrument,
including
basis
differences.
◾
Changes
in
credit
risk
of
the
hedging
instruments.
◾
If
a
hedging
relationship
becomes
over
-
hedged,
for
example
in
hedges
of
net
investments
if
the
net
asset
value
designated
at
the
start
of
the
period
falls
below
the
amount
of
the
hedging
instrument.
◾
Cash
flow
hedges
using
external
swaps
with
non
-
zero
fair
valu
es.
◾
The
effects
of
the
forthcoming
reforms
to
IBOR
,
because
these
might
take
effect
at
a
different
time
and
have
a
different
impact
on
hedged
items
and
hedging
instruments
Across
all
benchmarks
which
Barclays
is
materially
exposed
to,
there
is
still
uncertainty
regarding
the
precise
timing
and
effects
of
IBOR
reform.
There
is
yet
to
be
full
consensus
regarding
methodologies
for
converging
existing
IBORs
to
their
final
benchmark
rates.
As
such,
Barclays
has
not
incorporated
any
change
in
assumptions
fo
r
affected
benchmarks
into
its
expectations
or
calculations.
Barclays
does,
however,
assume
sufficient
liquidity
in
IBOR
linked
benchmarks
to
provide
reliable
valuation
calculations
of
both
hedged
items
and
hedging
instruments
(notwithstanding
reliefs
alre
ady
applied
within
the
financial
reporting).
Interest
Rate
Benchmark
Reform
Following
the
financial
crisis,
the
reform
and
replacement
of
benchmark
interest
rates
such
as
IBOR
has
become
a
priority
for
global
regulators.
Since
the
changes
are
market
driven,
there
is
currently
some
uncertainty
around
the
timing
and
precise
nature
of
these
changes.
The
Barclays
Bank
Group’s
r
isk
exposure
is
directly
affected
by
interest
rate
benchmark
reform,
across
both
its
cash
flow
hedge
accounting
activities;
where
IBOR
-
linked
derivatives
are
designated
as
a
cash
flow
hedge
of
IBOR
-
linked
cash
flows,
and
its
fair
value
hedge
accounting
activities;
where
IBOR
-
linked
derivatives
are
designated
as
a
fair
value
hedge
of
fixed
interest
rate
assets
and
liabilities.
Notes
to
the
financial
statements
Assets
and
liabilities
held
at
fair
value
Barclays
Bank
PLC
2019
Annual
Report
on
Form
20-F
132
The
Barclays
Bank
Group’s
risk
exposure
is
predominately
to
GBP,
USD,
EUR,
JPY
and
AUD
LIBOR
with
the
vast
majority
concentrated
in
derivatives
within
the
Corporate
and
Investment
Bank.
Some
additional
exposure
resides
on
floating
rate
loans
and
advances
and
debt
securities
held
and
issued
within
the
Corporate
and
Investment
Bank.
Approaches
to
transition
will
vary
product
by
product,
and
counterparty
by
counterparty.
Barclays
expected
derivative
contracts
facing
central
clearing
counterparties
to
follow
a
market
-
wide,
standardised
approach
to
reform.
Whereas
bilateral
derivative
agreements,
loan
agreements
and
other
cash
securities
to
largely
be
negotiated
bilaterally
with
the
counterparty.
There
are
key
differences
between
IBORs
and
RFRs.
IBORs
are
‘term
rates’,
which
means
that
they
are
published
for
a
borrowing
period
(for
example
three
months),
and
they
are
‘forward
-
looking’,
because
they
are
published
at
the
beginning
of
a
borrowing
period,
based
upon
an
estimated
inter
-
bank
borrowing
cost
for
the
period.
RFRs
are
typically
‘backward
-
looking’
rates,
as
they
are
based
upon
overnight
rates
from
actual
transactions,
and
are
there
fore
published
at
the
end
of
the
overnight
borrowing
period.
Furthermore,
IBORs
include
a
credit
spread
over
the
RFR.
Therefore,
to
transition
existing
contracts
and
agreements
to
RFR,
adjustments
for
term
and
credit
differences
may
need
to
be
applied
to
RFR-
linked
rates
to
enable
the
two
benchmarks
to
be
economically
equivalent
upon
transition.
The
methodologies
for
determining
these
adjustments
are
undergoing
in-
depth
consultations
by
industry
working
groups,
on
behalf
of
the
respective
global
regulators
and
related
market
participants.
Barclays
has
established
a
Group
-
wide
LIBOR
Transition
Programme,
with
oversight
from
the
Barclays
Group
Finance
Director
and
with
cross-
business
line
and
functions
-
support
governance.
The
Transition
Programme
follows
a
ri
sk
management
approach,
based
upon
recognised
‘change
delivery’
control
standards,
to
drive
strategic
execution,
and
identify,
manage
and
resolve
key
risks
and
issues
as
they
arise.
Accountable
Executives
are
in
place
within
key
working
groups,
with
overal
l
Board
oversight
delegated
to
the
Barclays
PLC
Board
Risk
Committee
and
the
Barclays
PLC
Group
Finance
Director.
Barclays
performs
a
prominent
stewardship
role
to
drive
orderly
transition
via
our
representation
on
official
sector
and
industry
working
grou
ps
across
all
major
jurisdictions
and
product
classes.
The
Barclays
Bank
Group
is
actively
engaging
with
the
counterparties
to
include
appropriate
fallback
provisions
in
its
floating
rate
assets
and
liabilities
with
maturities
after
2021,
when
most
IBORs
are
expected
to
cease
to
exist.
We
expect
that
the
hedging
instruments
will
be
modified
by
the
amendments
to
the
2006
ISDA
definitions
that
will
include
fallback
provisions
for
when
the
existing
IBORs
are
permanently
discontinued.
Additionally,
the
Barclays
Group
Finance
Director
is
Chair
of
the
UK’s
‘Working
Group
on
Sterling
Risk-Free
Reference
Rates’,
whose
mandate
is
to
catalyse
a
broad
-
based
transition
to
using
SONIA
(‘Sterling
Overnight
Index
Average’)
as
the
primary
sterling
interest
rate
benchmark
in
bond,
loan
and
derivatives
markets.
Further,
hedge
accounting
specific
impacts
of
IBOR
reform
are
expected
as
transition
progresses,
with
impact
on
financial
reporting
becoming
clearer
following
anticipated
completion
of
Phase
2
of
the
IASB’s
IBOR
Reform
project.
The
following
table
summarises
the
significant
hedge
accounting
exposures
impacted
by
the
IBOR
reform
as
at
31
December
2019:
Barclays
Bank
Group
Nominal
amount
of
hedged
items
directly
impacted
by
IBOR
reform
Nominal
amount
of
hedging
instruments
directly
impacted
by
IBOR
reform
Current
benchmark
rate
Expected
convergence
to
RFR
£m
£m
GBP
London
Interbank
Offered
rate
(LIBOR)
Reformed
Sterling
Overnight
Index
Average
(SONIA)
23,911
24,339
USD
LIBOR
/
Effective
Federal
Funds
Rate
(EFFR)
Secured
Overnight
Financing
Rate
(SOFR)
38,667
37,911
JPY
LIBOR
Tokyo
Overnight
Average
(TONA)
1,567
1,511
AUD
LIBOR
Bank
Bill
Swap
Rate
(BBSW)
/
Overnight
Cash
Rate
(AONIA)
1,183
1,183
All
Other
IBORs
Various
Other
RFRs
1,281
1,102
Total
IBOR
Notionals
66,609
66,046
The
Barclays
Bank
Group
’s
exposure
risk
management
also
includes
the
use
of
the
Euro
Interbank
Offered
Rate
(‘EURIBOR’).
The
calculation
methodology
of
EURIBOR
changed
during
2019.
In
July
2019,
the
Belgian
Financial
Services
and
Markets
Authority
granted
authorisation
with
respect
to
EURIBOR
under
the
European
Union
Benchmarks
Regulation.
This
allows
market
participants
to
continue
to
use
EURIBOR
after
1
January
2020
for
both
existing
and
new
contracts.
The
Barclays
Bank
Group
expects
that
EURIBOR
will
continue
to
exist
as
a
benchmark
rate
for
the
foreseeable
future.
The
Barclays
Bank
Group
does
not
anticipate
changing
the
hedged
risk
to
a
different
benchmark.
For
these
reasons,
the
Barclays
Bank
Group
does
not
consider
its
fair
v
alue
or
cash
flow
hedges
of
the
EURIBOR
benchmark
interest
rate
to
be
directly
affected
by
interest
rate
benchmark
reform
at
31
December
2019.
Notes
to
the
financial
statements
Assets
and
liabilities
held
at
fair
value
Barclays
Bank
PLC
2019
Annual
Report
on
Form
20-F
133
Amount,
timing
and
uncertainty
of
future
cash
flows
The
following
table
shows
the
hedging
instruments
which
are
carried
on
the
Barclays
Bank
’s
balance
sheet:
Barclays
Bank
Group
Carrying
value
Nominal
amount
Change
in
fair
value
used
as
a
basis
to
determine
ineffectiveness
Nominal
amount
directly
impacted
by
IBOR
reform
Derivative
assets
Derivative
liabilities
Loan
liabilities
Hedge
type
Risk
category
£m
£m
£m
£m
£m
£m
As
at
31
December
2019
Fair
value
Interest
rate
risk
111
(104)
-
55,691
(786)
33,805
Inflation
risk
13
(497)
-
7,247
(92)
5,345
Cash
flow
Interest
rate
risk
24
(1)
-
44,421
816
26,896
Inflation
risk
4
-
-
1,258
31
-
Net
investment
Foreign
exchange
risk
30
-
(8,076)
9,221
(282)
-
Total
Hedging
Instruments
182
(602)
(8,076)
117,838
(313)
66,046
As
at
31
December
2018
Fair
value
Interest
rate
risk
125
(44)
-
61,331
(329)
n/a
Inflation
risk
18
(4)
-
3,525
29
n/a
Cash
flow
Interest
rate
risk
18
(7)
-
48,617
(248)
n/a
Net
investment
Foreign
exchange
risk
-
(10)
(12,332)
15,300
(745)
n/a
Total
Hedging
Instruments
161
(65)
(12,332)
128,773
(1,293)
n/a
Notes
to
the
financial
statements
Assets
and
liabilities
held
at
fair
value
Barclays
Bank
PLC
2019
Annual
Report
on
Form
20-F
134
The
followi
ng
table
shows
the
hedged
items
effect
on
the
Barclays
Bank:
Hedged
items
in
fair
value
hedges
Barclays
Bank
Group
Accumulated
fair
value
adjustment
included
in
carrying
amount
Carrying
amount
Total
Of
which:
Accumulated
fair
value
adjustment
on
items
no
longer
in
a
hedge
relationship
Change
in
fair
value
used
as
a
basis
to
determine
ineffectiveness
Hedge
ineffectiveness
recognised
in
the
income
statement
a
Hedged
item
statement
of
financial
position
classification
and
risk
category
£m
£m
£m
£m
£m
2019
Assets
Loans
and
advances
at
amortised
cost
-
Interest
rate
risk
1,083
91
24
36
(1)
-
Inflation
risk
525
325
-
3
-
Financial
assets
at
fair
value
through
other
comprehensive
income
-
Interest
rate
risk
21,243
734
467
1,699
(15)
-
Inflation
risk
7,146
94
-
118
(13)
Debt
securities
classified
as
amortised
cost
-
Interest
rate
risk
600
-
-
-
-
-
Inflation
risk
2,258
(41)
-
(41)
1
Liabilities
Debt
securities
in
issue
-
Interest
rate
risk
(32,304)
(782)
(460)
(938)
27
Total
Hedged
Items
551
421
31
877
(1)
2018
Assets
Loans
and
advances
at
amortised
cost
-
Interest
rate
risk
924
63
54
(236)
(84)
-
Inflation
risk
512
312
-
2
(1)
Financial
assets
at
fair
value
through
other
comprehensive
income
-
Interest
rate
risk
26,340
392
-
(75)
20
-
Inflation
risk
2,907
(21)
-
(50)
(18)
Liabilities
Debt
securities
in
issue
-
Interest
rate
risk
(32,508)
(295)
(317)
590
14
Total
Hedged
Items
(1,825)
451
(263)
231
(69)
Note
a
Hedge
ineffectiveness
is
recognised
in
net
interest
income.
For
items
classified
as
fair
value
through
other
comprehensive
income
,
the
hedge
accounting
adjustment
is
not
included
in
the
carrying
amount,
but
rather
adjusts
other
comprehensive
income
.
Notes
to
the
financial
statements
Assets
and
liabilities
held
at
fair
value
Barclays
Bank
PLC
2019
Annual
Report
on
Form
20-F
135
Hedged
items
in
cash
flow
hedges
and
hedges
of
net
investments
in
foreign
operations
Barclays
Bank
Group
Change
in
value
of
hedged
item
used
as
the
basis
for
recognising
ineffectiveness
Balance
in
cash
flow
hedging
reserve
for
continuing
hedges
Balance
in
currency
translation
reserve
for
continuing
hedges
Balances
remaining
in
cash
flow
hedging
reserve
for
which
hedge
accounting
is
no
longer
applied
Balances
remaining
in
currency
translation
reserve
for
which
hedge
accounting
is
no
longer
applied
Hedging
gains
or
losses
recognised
in
other
comprehensiv
e
income
Hedge
ineffectivenes
s
recognised
in
the
income
statement
a
Description
of
hedge
relationship
and
hedged
risk
£m
£m
£m
£m
£m
£m
£m
2019
Cash
flow
hedge
of
interest
rate
risk
Loans
and
advances
at
amortised
cost
(826)
(142)
-
(366)
-
(802)
(10)
Cash
flow
hedge
of
inflation
risk
Debt
securities
classified
as
amortised
cost
(28)
(26)
-
-
-
(26)
3
Total
cash
flow
hedges
(854)
(168)
-
(366)
-
(828)
(7)
Hedge
of
net
investment
in
foreign
operations
USD
foreign
operations
209
-
1,092
-
-
209
-
EUR
foreign
operations
70
-
(1)
-
15
70
-
Other
foreign
operations
3
-
1
-
217
3
-
Total
foreign
operations
282
-
1,092
-
232
282
-
2018
Cash
flow
hedge
of
interest
rate
risk
Loans
and
advances
at
amortised
cost
191
61
-
88
-
189
(57)
Total
cash
flow
hedges
191
61
-
88
-
189
(57)
Hedge
of
net
investment
in
foreign
operations
USD
foreign
operations
719
-
1,646
-
-
719
-
EUR
foreign
operations
-
-
-
-
86
-
-
Other
foreign
operations
25
-
(3)
-
239
25
(1)
Total
foreign
operations
744
-
1,643
-
325
744
(1)
Note
a
Hedge
ineffectiveness
is
recognised
in
net
interest
income.
The
following
table
profiles
the
expected
notional
values
of
current
hedging
instruments
for
fair
value
hedging
in
future
years:
2020
2021
2022
2023
2024
2025
and
later
As
at
31
December
2019
£m
£m
£m
£m
£m
£m
Barclays
Bank
Group
Fair
value
hedges
of
interest
rate
risk
Notional
amount
52,734
42,100
34,228
28,698
22,077
19,754
Fair
value
hedges
of
inflation
risk
Notional
amount
6,360
5,204
4,495
3,524
3,021
2,009
For
Barclays
Bank
Group,
there
are
876
(2018:
975)
interest
rate
risk
fair
value
hedges
with
an
average
fixed
rate
of
1.6%
(2018:
2.3%)
across
the
relationships
and
82
(2018:
44)
inflation
risk
fair
value
hedges
with
an
average
rate
of
0.8%
(2018:
1.0%)
across
the
relatio
nships.
The
Barclays
Bank
Group
has
hedged
the
following
forecast
cash
flows,
which
primarily
vary
with
interest
rates.
These
cash
flows
are
expected
to
impact
the
income
statement
in
the
following
periods,
excluding
any
hedge
adjustments
that
may
be
applied:
Notes
to
the
financial
statements
Assets
and
liabilities
held
at
fair
value
Barclays
Bank
PLC
2019
Annual
Report
on
Form
20-F
136
To
tal
Up
to
one
year
One
to
two
years
Two
to
three
years
Three
to
four
years
Four
to
five
years
More
than
five
years
£m
£m
£m
£m
£m
£m
£m
2019
Barclays
Bank
Group
Forecast
receivable
cash
flows
1,870
365
335
320
309
259
282
2018
Barclays
Bank
Group
Forecast
receivable
cash
flows
2,526
562
592
477
356
255
284
The
maximum
length
of
time
over
which
the
Barclays
Bank
Group
hedges
exposure
to
the
variability
in
future
cash
flows
for
forecast
transactions,
excluding
those
forecast
transactions
related
to
the
payment
of
variable
interest
on
existing
financial
instruments
is
10
years
(2018
:
10
years).
The
effect
on
the
income
statement
and
other
comprehensive
income
of
recycling
amounts
in
respect
of
cash
flow
hedges
and
net
investment
hedges
of
foreign
operations
is
set
out
in
the
following
table:
Barclays
Bank
Group
2019
2018
Amount
recycled
from
other
comprehensive
income
due
to
hedged
item
affecting
income
statement
Amount
recycled
from
other
comprehensive
income
due
to
sale
or
disposal
of
investment
Amount
recycled
from
other
comprehensive
income
due
to
hedged
item
affecting
income
statement
Amount
recycled
from
other
comprehensive
income
due
to
sale
or
disposal
of
investment
Description
of
hedge
relationship
and
hedged
risk
£m
£m
£m
£m
Cash
flow
hedge
of
interest
rate
risk
Recycled
to
interest
income
105
36
213
-
Hedge
of
net
investment
in
foreign
operations
Recycled
to
other
income
-
(15)
-
(41)
A
detailed
reconciliation
of
the
movements
of
the
cash
flow
hedging
reserve
and
the
currency
translation
reserve
is
as
follows:
2019
2018
Cash
flow
hedging
reserve
Currency
translation
reserve
Cash
flow
hedging
reserve
Currency
translation
reserve
£m
£m
£m
£m
Barclays
Bank
Group
Balance
on
1
January
(123)
3,928
184
3,084
Currency
translation
movements
(5)
(771)
(8)
803
Hedging
gains/(losses)
for
the
year
828
240
(189)
-
Amounts
reclassified
in
relation
to
cash
flows
affecting
profit
or
loss
(141)
(15)
(213)
41
Tax
(171)
-
103
-
Balance
on
31
December
388
3,382
(123)
3,928
14
Financial
assets
at
fair
value
through
other
comprehensive
income
Accounting
for
financial
assets
at
fair
value
through
other
comprehensive
income
(‘FVOCI’)
under
IFRS
9
effective
from
1
January
2018
Financial
assets
that
are
debt
instruments
held
in
a
business
model
that
is
achieved
by
both
collecting
contractual
cash
flows
and
selling
and
that
contain
contractual
terms
that
give
rise
on
specified
dates
to
cash
flows
that
are
SPPI
are
measured
at
FVOCI.
They
are
subsequently
re
-
measured
at
fair
value
and
changes
therein
(except
for
those
relating
to
impairment,
interest
income
and
foreign
currency
exchange
gains
and
losses)
are
recognised
in
other
comprehensi
ve
income
until
the
assets
are
sold.
Interest
(calculated
using
the
effective
interest
method)
is
recognised
in
the
income
statement
in
net
interest
income
(Note
3).
Upon
disposal,
the
cumulative
gain
or
loss
recognised
in
other
comprehensive
income
is
inc
luded
in
net
investment
income.
In
determining
whether
the
business
model
is
achieved
by
both
collecting
contractual
cash
flows
and
selling
financial
assets,
it
is
determined
that
both
collecting
contractual
cash
flows
and
selling
financial
assets
are
integral
to
achieving
the
objective
of
the
business
model.
The
Barclays
Bank
Group
will
consider
past
sales
and
expectations
about
future
sales
to
establish
if
the
business
model
is
achieved
.
For
equity
securities
that
are
not
held
for
trading,
the
Barclays
Bank
Group
may
make
an
irrevocable
election
on
initial
recognition
to
present
subsequent
changes
in
the
fair
value
of
the
instrument
in
other
comprehensive
income
(except
for
dividend
income
which
is
recognised
in
profit
or
Notes
to
the
financial
statements
Assets
and
liabilities
held
at
fair
value
Barclays
Bank
PLC
2019
Annual
Report
on
Form
20-F
137
loss).
Gains
or
losses
on
the
de
-
recognition
of
these
equity
securities
are
not
transferred
to
profit
or
loss.
These
assets
are
also
not
subject
to
the
impairment
requirements
and
therefore
no
amounts
are
recycled
to
the
income
statement.
Where
the
Barclays
Bank
Group
has
not
ma
de
the
irrevocable
election
to
present
subsequent
changes
in
the
fair
value
of
the
instrument
in
other
comprehensive
income,
equity
securities
are
measured
at
fair
value
through
profit
or
loss.
Accounting
for
financial
investments
under
IAS
39
for
2017
Available
for
sale
financial
assets
are
held
at
fair
value
with
gains
and
losses
being
included
in
other
comprehensive
income.
The
Barclays
Bank
Group
uses
this
classification
for
assets
that
are
not
derivatives
and
are
not
held
for
trading
purposes
or
otherwise
designated
at
fair
value
through
profit
or
loss,
or
at
amortised
cost.
Dividends
and
interest
(calculated
using
the
effective
interest
method)
are
recognised
in
the
income
statement
in
net
interest
income
or,
net
investment
income.
On
disposal,
the
cumulative
gain
or
loss
recognised
in
other
comprehensive
income
is
also
included
in
net
investment
income.
Held
to
maturity
assets
are
held
at
amort
ised
cost.
The
Barclays
Bank
Group
uses
this
classification
when
there
is
an
intent
and
ability
to
hold
the
asset
to
maturity.
Interest
on
the
investments
are
recognised
in
the
income
statement
within
net
interest
income.
Barclays
Bank
Group
2019
2018
£m
£m
Debt
securities
and
other
eligible
bills
44,781
44,315
Equity
securities
1
11
Loans
and
advances
624
668
Financial
assets
at
fair
value
through
other
comprehensive
income
45,406
44,994
15
Financial
liabilities
designated
at
fair
value
Accounting
for
liabilities
designated
at
fair
value
through
profit
and
loss
In
accordance
with
IFRS
9,
financial
liabilities
may
be
designated
at
fair
value,
with
gains
and
losses
taken
to
the
income
statement
within
net
trading
income
(Note
5)
and
net
inv
estment
income
(Note
6).
Movements
in
own
credit
are
reported
thro
ugh
other
comprehensive
income,
unless
the
effects
of
changes
in
the
liability's
credit
risk
would
creat
e
or
enlarge
an
accounting
mismatch
in
profit
and
loss.
In
these
scenarios,
all
gains
and
losses
on
that
liability
(including
the
effects
of
changes
in
the
credit
risk
of
the
liability)
are
presented
in
profit
and
loss.
On
derecognition
of
the
financial
liability
no
amount
relating
to
own
credit
risk
are
recycled
to
the
income
statement.
Th
e
Barclays
Bank
Group
has
the
ability
to
make
the
fair
value
designation
when
holding
the
instruments
at
fair
value
reduces
an
accounting
mismatch
(caused
by
an
offsetting
liability
or
asset
being
held
at
fair
value),
or
is
managed
by
the
Barclays
Bank
Gro
up
on
the
basis
of
its
fair
value,
or
includes
terms
that
have
substantive
derivative
characteristics
(Note
13).
The
details
on
how
the
fair
value
amounts
are
arrived
for
financial
liabilities
designated
at
fair
value
are
described
in
Note
16.
Barclays
Bank
Group
2019
2018
Fair
value
Contractual
amount
due
on
maturity
Fair
value
Contractual
amount
due
on
maturity
£m
£m
£m
£m
Debt
securities
49,559
56,891
46,649
54,159
Deposits
25,526
25,725
31,706
32,053
Repurchase
agreements
and
other
similar
secured
borrowing
128,686
128,845
139,386
139,626
Other
financial
liabilities
675
675
-
-
Financial
liabilities
designated
at
fair
value
204,446
212,136
217,741
225,838
The
cumulative
own
credit
net
loss
recognis
ed
for
Barclays
Bank
Group
is
£
373
m
(
2018:
£121m).
Notes
to
the
financial
statements
Assets
and
liabilities
held
at
fair
value
Barclays
Bank
PLC
2019
Annual
Report
on
Form
20-F
138
16
Fair
value
of
financial
instruments
Accounting
for
financial
assets
and
liabilities
–
fair
values
Financial
instruments
that
are
held
for
trading
are
recognised
at
fair
value
through
profit
or
loss.
In
addition,
financial
assets
are
held
at
fair
value
through
profit
or
loss
if
they
do
not
contain
contractual
terms
that
give
rise
on
specified
dates
to
cash
flows
that
are
SPPI,
or
if
the
financial
asset
is
not
held
in
a
business
model
that
is
either
(i)
a
business
model
to
collect
the
contractual
cash
flows
or
(ii)
a
business
model
that
is
achieved
by
both
collecting
contractual
cash
flows
and
selling.
Subsequent
changes
in
fair
value
for
these
instruments
are
recognised
in
the
income
statement
in
net
investment
income,
except
if
reporting
it
in
trading
income
reduces
an
accounting
mismatch.
All
financial
instruments
are
initially
recognised
at
fair
value
on
the
date
of
initial
recognition
(including
transaction
costs,
other
than
financial
instruments
held
at
fair
va
lue
through
profit
or
loss)
and
depending
on
the
subsequent
classification
of
the
financial
asset
or
liability,
may
continue
to
be
held
at
fair
value
either
through
profit
or
loss
or
other
comprehensive
income.
The
fair
value
of
a
financial
instrument
is
the
price
that
would
be
received
to
sell
an
asset
or
paid
to
transfer
a
liability
in
an
orderly
transaction
between
market
participants
at
the
measurement
date.
Wherever
possible,
fair
value
is
determined
by
reference
to
a
quoted
market
price
for
that
instrument.
For
many
of
the
Barclays
Bank
Group’s
financial
assets
and
liabilities,
especially
derivatives,
quoted
prices
are
not
available
and
valuation
models
are
used
to
estimate
fair
value.
The
models
calculate
the
expected
cash
flows
under
the
terms
of
each
specific
contract
and
then
discount
these
values
back
to
a
present
value.
These
models
use
as
their
basis
independently
sourced
market
inputs
including,
for
example,
interest
rate
yield
curves,
equities
and
commodities
prices,
option
volatilities
and
currency
rates.
For
financial
liabilities
measured
at
fair
value,
the
carrying
amount
reflects
the
effect
on
fair
value
of
changes
in
own
credit
spreads
derived
from
observable
market
data
such
as
in
primary
issuance
and
redemption
activity
for
structured
notes.
On
initial
recognition,
it
is
presumed
that
the
transaction
price
is
the
fair
value
unless
there
is
observable
information
available
in
an
active
market
to
the
contrary.
The
best
evidence
of
an
instrument’s
fair
value
on
initial
recognition
is
typically
the
transaction
price.
However,
if
fair
value
can
be
evidenced
by
comparison
with
other
observable
current
market
transactions
in
the
same
instrument,
or
is
based
on
a
valuation
technique
whose
inputs
include
only
data
from
observable
markets,
then
the
instrument
should
be
recognised
at
the
fair
value
derived
from
such
observable
market
data.
For
valuations
that
have
made
use
of
unob
servable
inputs,
the
difference
between
the
model
valuation
and
the
initial
transaction
price
(Day
One
profit)
is
recognised
in
profit
or
loss
either:
on
a
straight-
line
basis
over
the
term
of
the
transaction;
or
over
the
period
until
all
model
inputs
will
become
observable
where
appropriate;
or
released
in
full
when
previously
unobservable
inputs
become
observable.
Various
factors
influence
the
availability
of
observable
inputs
and
these
may
vary
from
product
to
product
and
change
over
time.
Factors
inclu
de
the
depth
of
activity
in
the
relevant
market,
the
type
of
product,
whether
the
product
is
new
and
not
widely
traded
in
the
marketplace,
the
maturity
of
market
modelling
and
the
nature
of
the
transaction
(bespoke
or
generic).
To
the
extent
that
valuation
is
based
on
models
or
inputs
that
are
not
observable
in
the
market,
the
determination
of
fair
value
can
be
more
subjective,
dependent
on
the
significance
of
the
unobservable
input
to
the
overall
valuation.
Unobservable
inputs
are
determined
based
on
the
b
est
information
available,
for
example
by
reference
to
similar
assets,
similar
maturities
or
other
analytical
techniques.
The
sensitivity
of
valuations
used
in
the
financial
statements
to
possible
changes
in
significant
unobservable
inputs
is
shown
on
page
147
.
Critical
accounting
estimates
and
judgements
The
valuation
of
financial
instruments
often
involves
a
significant
degree
of
judgement
and
complexity,
in
particular
where
valuation
models
make
use
of
unobservable
inputs
(‘Level
3’
assets
and
liabilities).
This
note
provides
information
on
these
instruments,
including
the
related
unrealised
gains
and
losses
recognised
in
the
period,
a
description
of
significant
valuation
techniques
and
unobservable
inputs,
and
a
sensitivity
analysis.
Valuation
IFRS
13
Fair
value
measurement
significant
market
inputs.
The
three
levels
of
the
fair
value
hierarchy
are
defined
below.
Quoted
market
prices
–
Level
1
Assets
and
liabilities
are
classified
as
Level
1
if
their
value
is
observable
in
an
active
market.
Such
instruments
are
valued
by
reference
to
unadjusted
quoted
prices
for
identical
assets
or
liabilities
in
active
markets
wh
ere
the
quoted
price
is
readily
available,
and
the
price
represents
actual
and
regularly
occurring
market
transactions.
An
active
market
is
one
in
which
transactions
occur
with
sufficient
volume
and
frequency
to
provide
pricing
information
on
an
ongoing
ba
sis.
Valuation
technique
using
observable
inputs
–
Level
2
Assets
and
liabilities
classified
as
Level
2
have
been
valued
using
models
whose
inputs
are
observable
either
directly
or
indirectly.
Valuations
based
on
observable
inputs
include
assets
and
liabilities
such
as
swaps
and
forwards
which
are
valued
using
market
standard
pricing
techniques,
and
options
that
are
commonly
traded
in
markets
where
all
the
inputs
to
the
market
standard
pricing
models
are
observable.
Valuation
technique
using
significant
unobservable
inputs
–
Level
3
Assets
and
liabilities
are
classified
as
Level
3
if
their
valuation
incorporates
significant
inputs
that
are
not
based
on
observable
market
data
(unobservable
inputs).
A
valuation
input
is
considered
observable
if
it
can
be
directly
observed
from
transactions
in
an
active
market,
or
if
there
is
compelling
external
evidence
demonstrating
an
executable
exit
price.
Unobservable
input
levels
are
generally
determined
via
reference
to
observable
inputs,
historical
observations
or
using
other
analytical
techniques.
Notes
to
the
financial
statements
Assets
and
liabilities
held
at
fair
value
Barclays
Bank
PLC
2019
Annual
Report
on
Form
20-F
139
The
following
table
shows
Barclays
Bank
Group’s
assets
and
liabilities
that
are
held
at
fair
value
disaggregated
by
valuation
technique
(fair
value
hierarchy)
and
balance
sheet
classification:
Assets
and
liabilities
held
at
fair
value
2019
2018
Valuation
technique
using
Valuation
technique
using
Level
1
Level
2
Level
3
Total
Level
1
Level
2
Level
3
Total
Barclays
Bank
Group
£m
£m
£m
£m
£m
£m
£m
£m
Trading
portfolio
assets
59,968
51,105
2,264
113,337
51,029
49,396
3,613
104,038
Financial
assets
at
fair
value
through
the
income
statement
10,300
115,008
4,162
129,470
8,918
131,682
4,650
145,250
Derivative
financial
assets
5,439
221,048
3,154
229,641
6,813
210,655
5,215
222,683
Financial
assets
at
fair
value
through
other
comprehensive
income
11,577
33,400
429
45,406
15,751
28,888
355
44,994
Investment
property
-
-
13
13
-
-
9
9
Total
assets
87,284
420,561
10,022
517,867
82,511
420,621
13,842
516,974
Trading
portfolio
liabilities
(19,645)
(15,567)
-
(35,212)
(19,401)
(17,210)
(3)
(36,614)
Financial
liabilities
designated
at
fair
value
(82)
(204,021)
(343)
(204,446)
(76)
(217,404)
(261)
(217,741)
Derivative
financial
liabilities
(5,305)
(219,646)
(3,989)
(228,940)
(6,152)
(208,697)
(4,743)
(219,592)
Total
liabilities
(25,032)
(439,234)
(4,332)
(468,598)
(25,629)
(443,311)
(5,007)
(473,947)
The
following
table
shows
Barclays
Bank
Group’s
Level
3
assets
and
liabilities
that
are
held
at
fair
value
disaggregated
by
product
type:
Level
3
Assets
and
liabilities
held
at
fair
value
by
product
type
2019
2018
Assets
Liabilities
Assets
Liabilities
Barclays
Bank
Group
£m
£m
£m
£m
Interest
rate
derivatives
605
(812)
2,478
(2,456)
Foreign
exchange
derivatives
291
(298)
192
(185)
Credit
derivatives
539
(342)
1,381
(331)
Equity
derivatives
1,710
(2,528)
1,136
(1,743)
Commodity
derivatives
9
(9)
28
(28)
Corporate
debt
521
-
456
-
Reverse
repurchase
and
repurchase
agreements
-
(167)
768
-
Non
-
asset
backed
loans
3,280
-
4,452
-
Asset
backed
securities
756
-
688
-
Equity
cash
products
1,228
-
698
(3)
Private
equity
investments
112
-
190
-
Other
a
971
(176)
1,375
(261)
Total
10,022
(4,332)
13,842
(5,007)
Note
a
Other
includes
commercial
real
estate
loans,
funds
and
fund-linked
products
,
issued
debt,
government
sponsored
debt
and
investment
property.
Notes
to
the
financial
statements
Assets
and
liabilities
held
at
fair
value
Barclays
Bank
PLC
2019
Annual
Report
on
Form
20-F
140
Valuation
techniques
and
sensitivity
analysis
Sensitivity
analysis
is
performed
on
products
with
significant
unobservable
inputs
(Level
3)
to
generate
a
range
of
reasonably
possible
alternative
valuations.
The
sensitivity
methodologies
applied
take
account
of
the
nature
of
the
valuation
techniques
used,
as
well
as
the
availability
an
d
reliability
of
observable
proxy
and
historical
data
and
the
impact
of
using
alternative
models.
Sensitivities
are
dynamically
calculated
on
a
monthly
basis.
The
calculation
is
based
on
range
or
spread
data
of
a
reliable
reference
source
or
a
scenario
b
ased
on
relevant
market
analysis
alongside
the
impact
of
using
alternative
models.
Sensitivities
are
calculated
without
reflecting
the
impact
of
any
diversification
in
the
portfolio.
The
valuation
techniques
used,
observability
and
sensitivity
analysis
for
material
products
within
Level
3,
are
described
below.
Interest
rate
derivatives
Description:
floors,
inflation
options,
balance
guaranteed
swaps
and
other
exotic
interest
rate
derivatives.
Valuation:
discount
the
expected
future
cash
flows
of
trades.
Instruments
with
optionality
are
valued
using
volatilities
implied
from
market
inputs,
and
use
industry
standard
or
bespoke
models
depending
on
the
product
type.
Observability:
Unobservable
inputs
are
generally
set
by
referencing
liquid
market
instruments
and
applying
extrapolation
techniques
or
inferred
via
another
reasonable
method.
Foreign
exchange
d
erivatives
Description:
Derivatives
linked
to
the
foreign
exchange
(FX)
market.
The
category
includes
FX
forward
contracts,
FX
swaps
and
FX
options.
The
majority
are
traded
as
over
the
counter
(OTC)
derivatives.
Valuation:
interest
rates,
FX
volatilities,
interest
rate
volatilities,
FX
interest
rate
correlations
and
others
as
appropriate.
Observability:
input
and
underlying.
Unobservable
inputs
are
set
by
referencing
liquid
market
instruments
and
applying
extrapolation
techniques,
or
inferred
via
another
reasonable
method.
Credit
derivatives
Description:
securitised
pro
duct).
The
category
includes
single
name
and
index
credit
default
swaps
(CDS)
and
asset
backed
CDS.
Valuation:
from
broker
data,
third
party
vendors
or
priced
to
proxies.
Observability:
observable
if
products
with
significant
sensitivity
to
the
inputs
are
actively
traded
in
a
liquid
market.
Unobservable
valuation
inputs
are
generally
determined
with
reference
to
recent
transactions
or
inferred
from
observable
trades
of
the
same
issuer
or
similar
entities.
Equity
derivatives
Description
:
Exchange
traded
or
OTC
derivatives
linked
to
equity
indices
and
single
names.
The
category
includes
vanilla
and
exotic
equity
products.
Valuation:
equity
repurchase
curves
and,
for
multi-asset
products,
correlations.
Observability:
Unob
servable
inputs
are
set
by
referencing
liquid
market
instruments
and
applying
extrapolation
techniques,
or
inferred
via
another
reasonable
method.
Commodity
derivatives
Description:
power
and
natural
gas.
Valuation:
techniques.
Valuation
inputs
include
forward
curves,
volatilities
implied
from
market
observable
inputs
and
correlations.
Observability:
each
input
and
underlying.
Unobservable
inputs
are
set
with
reference
to
similar
observable
products,
or
by
applying
extrapolation
techniques
to
observable
inputs.
Notes
to
the
financial
statements
Assets
and
liabilities
held
at
fair
value
Barclays
Bank
PLC
2019
Annual
Report
on
Form
20-F
141
Corporate
debt
Description:
Valuation:
sources.
Observability:
yields
or
CDS
spreads
for
actively
traded
instruments
issued
by
or
referencing
the
same
(or
a
similar)
issuer.
Level
3
sensitivity:
market
for
similar
bonds.
Reverse
repurchase
and
repurchase
agreements
Description:
lending
agreements.
The
agreements
are
primarily
short
-
term
in
nature.
Valuation:
standard
models
that
incorporate
market
interest
rates
and
repurchase
rates,
based
on
the
specific
details
of
the
transaction.
Observability:
Unobservable
inputs
are
generally
set
by
referencing
liquid
market
instruments
and
applying
extrapolation
techniques,
or
inferred
via
another
reasonable
method.
Non
-
asset
backed
loans
Description:
Valuation:
Observability:
funding
costs,
the
level
of
comparable
assets
such
as
gilts,
issuer
credit
quality
and
other
factors.
Asset
backed
securities
Description:
backed
securities,
commercial
mortgage
backed
securities,
CDOs,
collateralised
loan
obligations
(CLOs)
and
other
asset
backed
securities.
Valuation:
valuations
are
determined
using
industry
standard
discounted
cash
flow
analysis
that
calculates
the
fair
value
based
on
valuation
inputs
such
as
constant
default
rate,
conditional
prepayment
rate,
loss
given
default
and
yield.
These
inputs
are
determined
by
reference
to
a
number
of
sources
including
proxying
to
observed
transactions,
market
indices
or
market
research,
and
by
assessing
underlying
collateral
performance.
Proxying
to
observed
transactions,
indices
or
research
requires
an
assessment
and
comparison
of
the
relevant
securities’
underlying
attributes
including
collateral,
tranche,
vintage,
underlying
asset
composition
(
historical
losses,
borrower
characteristics
and
loan
attributes
such
as
loan
to
value
ratio
and
geographic
concentration)
and
credit
ratings
(original
and
current).
Observability:
flow
analysis,
the
instrument
is
considered
unobservable.
Equity
cash
products
Description:
Valuation:
Observability:
reference
to
actively
traded
instruments
that
are
similar
in
nature,
or
inferred
via
another
reasonable
method.
Private
equity
investments
Description:
Valuation:
which
require
the
use
of
a
number
of
individual
pricing
benchmarks
such
as
the
prices
of
recent
transactions
in
the
same
or
similar
entities,
discounted
cash
flow
analysis
and
comparison
with
the
earnings
multiples
of
listed
companies.
While
the
valuation
of
unquoted
equity
instruments
is
subjective
by
nature,
the
relevant
methodologies
are
commonly
applied
by
other
market
part
icipants
and
have
been
consistently
applied
over
time.
Observability:
Unobservable
inputs
include
earnings
estimates,
mu
ltiples
of
comparative
companies,
marketability
discounts
and
discount
rates.
Notes
to
the
financial
statements
Assets
and
liabilities
held
at
fair
value
Barclays
Bank
PLC
2019
Annual
Report
on
Form
20-F
142
Other
Description:
investment
property.
Assets
and
liabilities
reclas
sified
between
Level
1
and
Level
2
During
the
period
,
there
were
no
material
transfers
between
Level
1
to
Level
2.
(2018:
there
were
no
material
transfers
between
Level
1
and
Level
2).
Level
3
movement
analysis
The
following
table
summarises
the
movements
in
the
Level
3
balances
during
the
period.
Transfers
have
been
reflected
as
if
they
had
taken
place
at
the
beginning
of
the
year.
Assets
and
liabilities
included
in
disposal
groups
classified
as
held
for
sale
and
measured
at
fair
value
less
cost
to
sell
are
not
included
as
these
are
measured
at
fair
value
on
a
non
-
recurring
basis.
Asset
and
liability
transfers
between
Level
2
and
Level
3
are
primarily
due
to
1)
an
increase
or
decrease
in
observable
market
activity
related
to
an
input
or
2)
a
change
in
the
significance
of
the
unobservable
input,
with
assets
and
liabilities
classified
as
Level
3
if
an
unobservable
input
is
deemed
significant.
Notes
to
the
financial
statements
Assets
and
liabilities
held
at
fair
value
Barclays
Bank
PLC
2019
Annual
Report
on
Form
20-F
143
Analysis
of
movements
in
Level
3
assets
and
liabilities
As
at
1
January
2019
Total
gains
and
losses
in
the
period
recognised
in
the
income
statement
Total
gains
or
losses
recognised
in
OCI
Transfers
As
at
31
December
2019
Purchases
Sales
Issues
Settlements
Trading
income
Other
income
In
Out
Barclays
Bank
Group
£m
£m
£m
£m
£m
£m
£m
£m
£m
£m
£m
Corporate
debt
388
126
(52)
(311)
1
45
(77)
120
Non
-
asset
backed
loans
2,263
1,844
(2,799)
(134)
24
200
(424)
974
Asset
backed
securities
664
202
(166)
(30)
16
(30)
656
Equity
cash
products
136
62
(40)
(31)
293
(28)
392
Other
162
(1)
(24)
(15)
122
Trading
portfolio
assets
3,613
2,234
(3,057)
(446)
(60)
554
(574)
2,264
Non
-
asset
backed
loans
1,836
235
(204)
99
(1)
(1)
1,964
Equity
cash
products
559
66
(2)
3
209
835
Private
equity
investments
191
5
(9)
(2)
(17)
(55)
113
Other
2,064
5,716
(5,720)
(9)
12
(33)
24
(804)
1,250
Financial
assets
at
fair
value
through
the
income
statement
4,650
6,022
(5,729)
(217)
114
158
24
(860)
4,162
Non
-
asset
backed
loans
283
60
343
Asset
backed
securities
116
(30)
86
Equity
cash
products
2
(1)
(1)
Other
353
(135)
(218)
Financial
assets
at
fair
value
through
other
comprehensive
income
355
399
(31)
(135)
59
(218)
429
Investment
property
9
5
(1)
13
Trading
portfolio
liabilities
(3)
3
Financial
liabilities
designated
at
fair
value
(261)
(179)
10
(42)
41
67
(2)
(27)
50
(343)
Interest
rate
derivatives
22
(9)
88
(92)
(177)
(38)
(206)
Foreign
exchange
derivatives
7
25
(12)
(32)
5
(7)
Credit
derivatives
1,050
(59)
3
(866)
76
(9)
3
198
Equity
derivatives
(607)
(296)
(35)
(2)
(296)
(37)
453
(820)
Net
derivative
financial
instruments
a
472
(364)
(32)
(755)
(324)
(255)
423
(835)
Total
8,835
8,117
(8,839)
(42)
(1,512)
(203)
155
59
296
(1,176)
5,690
Notes
to
the
financial
statements
Assets
and
liabilities
held
at
fair
value
Barclays
Bank
PLC
2019
Annual
Report
on
Form
20-F
144
Analysis
of
movements
in
Level
3
assets
and
liabilities
As
at
1
January
2018
Purchases
Sales
Issues
Settlements
Total
gains
and
losses
in
the
period
recognised
in
the
income
statement
Total
gains
or
losses
recognised
in
OCI
Transfers
As
at
31
December
2018
Trading
income
Other
income
In
Out
Barclays
Bank
Group
£m
£m
£m
£m
£m
£m
£m
£m
£m
£m
£m
Corporate
debt
871
108
(88)
(23)
9
39
(528)
388
Non
-
asset
backed
loans
166
5,514
(3,480)
-
-
71
(8)
2,263
Asset
backed
securities
627
205
(168)
(2)
(21)
58
(35)
664
Equity
cash
products
68
18
(9)
-
(16)
107
(32)
136
Other
245
18
(55)
-
(20)
(32)
-
-
145
(139)
162
Trading
portfolio
assets
1,977
5,863
(3,800)
(45)
(60)
-
420
(742)
3,613
Non
-
asset
backed
loans
6,073
364
(4,432)
(194)
25
-
1,836
Private
equity
investments
688
188
(7)
(231)
2
(10)
60
(499)
191
Equity
cash
products
398
87
(1)
-
1
74
-
-
559
Other
360
6,624
(4,920)
(47)
29
18
-
-
2,064
Financial
assets
at
fair
value
through
the
income
statement
7,519
7,263
(9,360)
(472)
57
82
60
(499)
4,650
Equity
cash
products
36
(16)
(18)
2
Private
equity
investments
129
(129)
Other
40
(1)
314
353
Financial
assets
at
fair
value
through
other
comprehensive
income
205
(16)
(1)
314
(147)
355
Investment
property
116
9
(115)
(1)
9
Trading
portfolio
liabilities
(4)
-
-
-
-
(3)
-
-
-
4
(3)
Financial
liabilities
designated
at
fair
value
(480)
-
-
(4)
14
33
(3)
-
(225)
404
(261)
Interest
rate
derivatives
(150)
1
(1)
-
196
(25)
-
-
(71)
72
22
Foreign
exchange
derivatives
37
-
-
-
(9)
5
-
-
(13)
(13)
7
Credit
derivatives
1,146
(6)
3
-
(12)
(85)
-
-
7
(3)
1,050
Equity
derivatives
(896)
72
(570)
-
125
73
1
-
128
460
(607)
Commodity
derivatives
-
-
-
-
-
-
-
-
-
-
-
Net
derivative
financial
instruments
a
137
67
(568)
-
300
(32)
1
-
51
516
472
Total
9,470
13,202
(13,859)
(4)
(203)
(5)
79
(1)
620
(464)
8,835
Note
a
The
derivative
financial
instruments
are
represented
on
a
net
basis.
On
a
gross
basis,
derivative
financial
assets
are
£3,154m
(2018:
£5,215m)
and
derivative
financial
liabilit
ies
are
£3,989m
(2018:
£4,743
m).
Notes
to
the
financial
statements
Assets
and
liabilities
held
at
fair
value
Barclays
Bank
PLC
2019
Annual
Report
on
Form
20-F
145
Unrealised
gains
and
losses
on
Level
3
financial
assets
and
liabilities
The
following
tables
disclose
the
unrealised
gains
and
losses
recognised
in
the
year
arising
on
Level
3
financial
assets
and
liabilities
held
at
year
end.
Unrealised
gains
and
losses
recognised
during
the
period
on
Level
3
assets
and
liabilities
held
at
year
end
2019
2018
Income
statement
Other
compre
-
hensive
income
Income
statement
Other
compre
-
hensive
income
Barclays
Bank
Group
Trading
income
Other
income
Total
Trading
income
Other
income
Total
As
at
31
December
£m
£m
£m
£m
£m
£m
£m
£m
Trading
portfolio
assets
(57)
-
-
(57)
(60)
-
-
(60)
Financial
assets
at
fair
value
through
the
income
statement
101
199
-
300
44
68
-
112
Fair
value
through
other
comprehensive
income
-
-
60
60
-
-
(1)
(1)
Investment
property
-
(1)
-
(1)
-
(1)
-
(1)
Trading
portfolio
liabilities
-
-
-
-
(3)
-
-
(3)
Financial
liabilities
designated
at
fair
value
64
-
-
64
55
-
-
55
Net
derivative
financial
instruments
(459)
-
-
(459)
(14)
-
-
(14)
Total
(351)
198
60
(93)
22
67
(1)
88
Significant
unobservable
inputs
The
following
table
discloses
the
valuation
techniques
and
significant
unobservable
inputs
for
assets
and
liabilities
recognised
at
fair
value
and
classified
as
Level
3
along
with
the
range
of
values
used
for
those
significant
unobservable
inputs:
Valuation
technique(s)
a
Significant
unobservable
inputs
2019
Range
2018
Range
Min
Max
Min
Max
Units
b
Derivative
financial
instruments
c
Interest
rate
derivatives
Discounted
cash
flows
Inflation
forwards
1
3
1
2
%
Credit
spread
41
1,620
6
897
bps
Comparable
pricing
Price
-
37
-
100
points
Option
model
Inflation
volatility
47
190
33
174
bps
vol
Interest
rate
volatility
8
431
10
199
bps
vol
IR
-
IR
correlation
(30)
100
(26)
100
%
Credit
derivatives
Discounted
cash
flows
Credit
spread
72
200
142
209
bps
Comparable
pricing
Price
-
155
10
96
points
Equity
derivatives
Option
model
Equity
volatility
1
200
2
81
%
Equity
-
equity
correlation
(20)
100
(100)
100
%
Discounted
cash
flow
Discounted
margin
(500)
1,100
(171)
301
bps
Non
-derivative
financial
instruments
Non
-
asset
backed
loans
Discounted
cash
flows
Loan
spread
31
624
30
196
bps
Credit
spread
180
1,223
25
800
bps
Price
-
133
-
118
points
Comparable
pricing
Price
-
123
-
100
points
Asset
backed
securities
Comparable
pricing
Price
-
99
-
102
points
Other
d
Discounted
cash
flows
Credit
spread
126
649
143
575
bps
Notes
a
A
range
has
not
been
provided
for
Net
Asset
Value
as
there
would
be
a
wide
range
reflecting
the
diverse
nature
of
the
positions
.
b
The
units
used
to
disclose
ranges
for
significant
unobservable
inputs
are
percentages,
points
and
basis
points.
Points
are
a
percentage
of
par;
for
example,
100
points
equals
100%
of
par
.
A
basis
point
equals
1/100th
of
1%;
for
example,
150
basis
points
equals
1.5%.
c
Certain
derivative
instruments
are
classified
as
Level
3
due
to
a
significant
unobservable
credit
spread
input
into
the
calculation
of
the
Credit
Valuation
Adjustment
for
the
instruments.
The
range
of
significant
unobservable
credit
spreads
is
between
41-1,620bps
(2018:
6-897bps).
d
Other
includes
commercial
real
estate
loans,
funds
and
fu
nd-linked
products,
issued
debt,
government
sponsored
debt
and
investment
property.
Notes
to
the
financial
statements
Assets
and
liabilities
held
at
fair
value
Barclays
Bank
PLC
2019
Annual
Report
on
Form
20-F
146
The
following
section
describes
the
significant
unobservable
inputs
identified
in
the
table
above,
and
the
sensitivity
of
fair
value
measurement
of
the
instruments
categorised
as
Level
3
assets
or
liabilities
to
increases
in
significant
unobservable
inputs.
Where
sensitivities
are
described,
the
inverse
relationship
will
also
generally
apply.
Where
reliable
interrelationships
can
be
identified
between
significant
unobservable
inputs
used
in
fair
value
measurement,
a
description
of
those
interrelationships
is
included
below.
Forwards
A
price
or
rate
that
is
applicable
to
a
financial
transaction
that
will
take
place
in
the
future.
In
general,
a
significant
increase
in
a
forward
in
isolation
will
result
in
a
fair
value
increase
for
the
contracted
receiver
of
the
underlying
(currency,
bond,
commodity,
etc.),
but
the
sensitivity
is
dependent
on
the
specific
terms
of
the
instrument.
Cred
it
spread
Credit
spreads
typically
represent
the
difference
in
yield
between
an
instrument
and
a
benchmark
security
or
reference
rate.
Credit
spreads
reflect
the
additional
yield
that
a
market
participant
demands
for
taking
on
exposure
to
the
credit
risk
o
f
an
instrument
and
form
part
of
the
yield
used
in
a
discounted
cash
flow
calculation.
In
general,
a
significant
increase
in
credit
spread
in
isolation
will
result
in
a
movement
in
a
fair
value
decrease
for
a
cash
asset.
For
a
derivative
instrument,
a
significant
increase
in
credit
spread
in
isolation
can
result
in
a
fair
value
increase
or
decrease
depending
on
the
specific
terms
of
the
instrument.
Volatility
Volatility
is
a
measure
of
the
variability
or
uncertainty
in
return
for
a
given
derivative
underlying.
It
is
an
estimate
of
how
much
a
particular
underlying
instrument
input
or
index
will
change
in
value
over
time.
In
general,
volatilities
are
implied
from
observed
option
prices.
For
unobservable
options
the
implied
volatility
may
reflect
additional
assumptions
about
the
nature
of
the
underlying
risk,
and
the
strike/maturity
profile
of
a
specific
contract.
In
general
a
significant
increase
in
volatility
in
isolation
will
result
in
a
fair
value
increase
for
the
holder
of
a
simple
option,
but
the
sensitivity
is
dependent
on
the
specific
terms
of
the
instrument.
There
may
be
interrelationships
between
unobservable
volatilities
and
other
unobservable
inputs
(
e.g.
when
equity
prices
fall,
implied
equity
volatilities
generally
rise)
but
these
are
generally
specific
to
individual
markets
and
may
vary
over
time.
Correlation
Correlation
is
a
measure
of
the
relationship
between
the
movements
of
two
variables.
Corre
lation
can
be
a
significant
input
into
valuation
of
derivative
contracts
with
more
than
one
underlying
instrument.
Credit
correlation
generally
refers
to
the
correlation
between
default
processes
for
the
separate
names
that
make
up
the
reference
pool
of
a
CDO
structure.
A
significant
increase
in
correlation
in
isolation
can
result
in
a
fair
value
increase
or
decrease
depending
on
the
specific
terms
of
the
instrument.
Comparable
price
Comparable
instrument
prices
are
used
in
valuation
by
calculating
an
implied
yield
(or
spread
over
a
liquid
benchmark)
from
the
price
of
a
comparable
observable
instrument,
then
adjusting
that
yield
(or
spread)
to
account
for
relevant
differences
such
as
maturity
or
credit
quality.
Alternatively,
a
price
-
to-
price
basis
can
be
assumed
between
the
comparable
and
unobservable
instruments
in
order
to
establish
a
value.
In
general,
a
significant
increase
in
comparable
price
in
isolation
will
result
in
an
increase
in
the
price
of
the
unobservable
instrument.
For
derivatives,
a
ch
ange
in
the
comparable
price
in
isolation
can
result
in
a
fair
value
increase
or
decrease
depending
on
the
specific
terms
of
the
instrument.
Loan
spread
Loan
spreads
typically
represent
the
difference
in
yield
between
an
instrument
and
a
benchmark
security
or
reference
rate.
Loan
spreads
typically
reflect
credit
quality,
the
level
of
comparable
assets
such
as
gilts
and
other
factors,
and
form
part
of
the
yield
used
in
a
discounted
cash
flow
calculation.
The
ESHLA
portfolio
primarily
consists
of
long
-
dated
fixed
rate
loans
extended
to
counterparties
in
the
UK
Education,
Social
Housing
and
Local
Authority
sectors.
The
loans
are
categorised
as
Level
3
in
the
fair
value
hierarchy
due
to
their
illiquid
nature
and
the
significance
of
unobservable
loan
spreads
to
the
valuation.
Valuation
uncertainty
arises
from
the
long
-
dated
nature
of
the
portfolio,
the
lack
of
secondary
market
in
the
loans
and
the
lack
of
observable
loan
spreads.
The
majority
of
ESHLA
loans
are
to
borrowers
in
heavily
regulated
sectors
that
are
considered
extremely
low
credit
risk,
and
have
a
history
of
near
zero
defaults
since
inception.
Wh
ile
the
overall
loan
spread
range
is
from
31bps
to
624
bps
(2018
:
30bps
to
196
bps),
the
vast
majority
of
spreads
are
concentrated
towards
the
bottom
end
of
this
range,
with
99%
of
the
loan
notional
being
valued
with
spreads
less
than
200bps
consistently
for
both
years.
In
general,
a
significant
increase
in
loan
spreads
in
isolation
will
result
in
a
fair
value
decrease
for
a
loan.
Notes
to
the
financial
statements
Assets
and
liabilities
held
at
fair
value
Barclays
Bank
PLC
2019
Annual
Report
on
Form
20-F
147
Sensitivity
analysi
s
of
valuations
using
unobservable
inputs
2019
2018
Favourable
changes
Unfavourable
changes
Favourable
changes
Unfavourable
changes
Income
statement
Equity
Income
statement
Equity
Income
statement
Equity
Income
statement
Equity
£m
£m
£m
£m
£m
£m
£m
£m
Interest
rate
derivatives
44
-
(127)
-
80
-
(162)
-
Foreign
exchange
derivatives
5
-
(7)
-
7
-
(10)
-
Credit
derivatives
73
-
(47)
-
126
-
(73)
-
Equity
derivatives
114
-
(119)
-
110
-
(112)
-
Commodity
derivatives
-
-
-
-
1
-
(1)
-
Corporate
debt
11
-
(16)
-
10
-
(2)
-
Non
asset
backed
loans
125
8
(228)
(8)
141
-
(210)
-
Equity
cash
products
123
-
(175)
-
121
-
(155)
-
Private
equity
investments
16
-
(25)
-
-
-
(10)
-
Other
a
1
-
(1)
-
2
-
(2)
-
Total
512
8
(745)
(8)
598
-
(737)
-
Note
a
Other
includes
commercial
real
estate
loans,
funds
and
fund-linked
products,
issued
debt,
government
sponsored
debt
and
investment
property.
The
effect
of
stressing
unobservable
inputs
to
a
range
of
reasonably
possible
alternatives,
alongside
considering
the
impact
of
using
alternative
models,
would
be
to
increase
fair
values
by
up
to
£
520
m
(2018:
£598
m)
or
to
decrease
fair
values
by
up
to
£
753
m
(2018
:
£737m)
with
substantially
all
the
potential
effect
impacting
prof
it
and
loss
rather
than
reserves
.
Fair
value
adjustments
Key
balance
sheet
valuation
adjustments
are
quantified
below
:
2019
2018
£m
£m
Exit
price
adjustments
derived
from
market
bid
-
offer
spreads
(420)
(451)
Uncollateralised
derivative
funding
(57)
(47)
Derivative
credit
valuation
adjustments
(135)
(125)
Derivative
debit
valuation
adjustments
155
237
Exit
price
adjustments
derived
from
market
bid
-
offer
spreads
Barclays
Bank
Group
uses
mid
-
market
pricing
where
it
is
a
market
maker
and
has
the
ability
to
transact
at,
or
better
than,
mid
price
(which
is
the
case
for
certain
equity,
bond
and
vanilla
derivative
markets).
For
other
financial
assets
and
liabilities,
bi
d
-
offer
adjustments
are
recorded
to
reflect
the
exit
level
for
the
expected
close
out
strategy.
The
methodology
for
determining
the
bid
-
offer
adjustment
for
a
derivative
portfolio
involves
calculating
the
net
risk
exposure
by
offsetting
long
and
short
positions
by
strike
and
term
in
accordance
with
the
risk
management
and
hedging
strategy.
Bid
-
offer
levels
are
generally
derived
from
market
quotes
such
as
broker
data.
Less
liquid
instruments
may
not
have
a
directly
observable
bid
-
offer
level.
In
such
instances,
an
exit
price
adjustment
may
be
derived
from
an
observable
bid
-
offer
level
for
a
comparable
liquid
instrument,
or
determined
by
calibrating
to
derivative
prices,
or
by
scenario
or
historical
analysis.
Exit
price
adjustments
derived
from
market
bid
-
of
fer
spreads
h
ave
decreased
by
£31m
to
£420m
as
a
result
of
movements
in
market
bid
offer
spreads.
Discounting
approaches
for
derivative
instruments
Collateralised
In
line
with
market
practice,
the
methodology
for
discounting
collateralised
derivatives
takes
into
account
the
nature
and
currency
of
the
collateral
that
can
be
posted
within
the
relevant
credit
support
annex
(CSA).
The
CSA
aware
discounting
approach
recognises
the
‘cheapest
to
deliver’
option
that
reflects
the
ability
of
the
party
posting
collateral
to
change
the
currency
of
the
collateral.
Uncollateralised
A
fair
value
adjustment
of
£57
m
is
applied
to
account
for
the
impact
of
incorporating
the
cost
of
funding
into
the
valuation
of
uncollateralised
and
partially
collateralised
derivative
portfolios
and
collateralised
derivatives
where
the
terms
of
the
agreement
do
not
allow
the
rehypothec
ation
of
collateral
received.
This
adjustment
is
referred
to
as
the
Funding
Fair
Valu
e
Adjustment
(FFVA).
FFVA
has
increased
by
£10m
to
£57
m
as
a
result
of
increase
in
underlying
derivative
exposures.
Notes
to
the
financial
statements
Assets
and
liabilities
held
at
fair
value
Barclays
Bank
PLC
2019
Annual
Report
on
Form
20-F
148
FFVA
incorporates
a
scaling
factor
which
is
an
estimate
of
the
extent
to
which
the
cost
of
funding
is
incorporated
into
observed
traded
levels.
On
calibrating
the
scaling
factor,
it
is
with
the
assumption
that
Credit
Valuation
Adjustments
(CVA)
and
Debit
Valuation
Adjustments
(DVA)
are
retained
as
valu
ation
components
incorporated
into
such
levels.
The
effect
of
incorporating
this
scaling
factor
at
31
December
2019
was
to
reduce
FFVA
by
£170
m
(2018:
£141
m).
Derivative
credit
and
debit
valuation
adjustments
CVA
and
DVA
are
incorporated
into
derivative
valuations
to
reflect
the
impact
on
fair
value
of
counte
rparty
credit
risk
and
Barclays
Bank
Group’s
own
credit
quality
respectively.
These
adjustments
are
calculated
for
uncollateralised
and
partially
collateralised
derivatives
across
all
asset
classes.
CVA
and
DVA
are
calculated
using
estimates
of
exposure
at
default,
probability
of
default
and
recovery
rates,
at
a
counterparty
level.
Counterparties
include
(but
are
not
limited
to)
corporates,
sovereigns
and
sovereign
agencies
and
supranationals.
Exposu
re
at
default
is
generally
estimated
through
the
simulation
of
underlying
risk
factors
through
approximating
with
a
more
vanilla
structure,
or
by
using
current
or
scenario
-
based
mark
to
market
as
an
estimate
of
future
exposure.
Probability
of
default
and
recovery
rate
information
is
generally
sourced
from
the
CDS
markets.
Where
this
information
is
not
available,
or
considered
unreliable,
alternative
approaches
are
taken
based
on
mapping
internal
counterparty
ratings
onto
historical
or
market
-
based
default
and
recovery
information.
In
particular,
this
applies
to
sovereign
related
names
where
the
effect
of
using
the
recovery
assumptions
implied
in
CDS
levels
would
imply
a
£36
m
(2018:
£50m)
increase
in
CVA.
Correlation
between
counterparty
credit
and
underlying
derivative
risk
factors,
termed
‘wrong
-
way,’
or
‘right
-
way’
risk,
is
not
systematically
incorporated
into
the
CVA
calculation
but
is
adjusted
where
the
underlying
exposure
is
directly
related
to
the
counterparty.
CVA
increased
by
£10m
to
£135
m
as
a
result
of
increase
in
underlying
derivative
exposures
offset
by
general
tightening
in
Credit
Spreads.
DVA
decreased
by
£82m
to
£155
m,
as
a
result
of
tightening
in
Barclays’
credit
spreads.
Barclays
continues
to
monitor
market
practices
and
activity
to
ensure
the
approach
to
uncollateralised
derivative
valuation
remains
appropriate.
Portfolio
exemptions
Barclays
Bank
Group
uses
the
portfolio
exemption
in
IFRS
13
Fair
Value
Measurement
liabilities.
Instruments
are
measured
using
the
price
that
would
be
received
to
sell
a
net
long
position
(i.e.
an
asset)
for
a
particular
risk
exposure
or
to
transfer
a
net
short
position
(i.e.
a
liability)
for
a
particular
risk
exposure
in
an
orderly
transaction
between
market
participants
at
the
balance
sheet
date
under
current
mar
ket
conditions.
Accordingly,
Barclays
Bank
Group
measures
the
fair
value
of
the
group
of
financial
assets
and
liabilities
consistently
with
how
market
participants
would
price
the
net
risk
exposure
at
the
measurement
date.
Unrecognised
gains
as
a
result
of
the
use
of
valuation
models
using
unobse
rvable
inputs
The
amount
that
has
yet
to
be
recognised
in
income
that
relates
to
the
difference
between
the
transaction
price
(the
fair
value
at
initial
recognition)
and
the
amount
that
would
have
arisen
had
valuation
models
using
unobservable
inputs
been
used
on
initial
recognition,
less
amounts
subsequently
recognised,
is
£100
m
(201
8:
£127
m)
for
financial
instruments
measured
at
fair
value
and
£
31
m
(2018:
£31
m)
for
financial
instruments
carried
at
amortised
cost.
The
decrease
in
financial
instruments
measured
at
fair
value
of
£27
m
(2018:
£32m
increase)
was
driven
by
additions
£40
m
(2018:
£65
m)
offset
by
a
transfer
out
of
£nil
(2018:
£15m)
to
Barclays
Bank
UK
PLC
and
£67
m
(2018:
£18
m)
of
amortisation
and
r
eleases.
The
decrease
of
£
nil
(2018:
£222m)
in
financial
instruments
carried
at
amortised
cost
was
driven
by
the
transfer
out
of
£nil
(2018:
£222m)
to
Barclays
Bank
UK
PLC
and
£2m
(2018:
£2m)
of
amortization
and
releases
offset
by
additions
of
£2m
(2018:
£2m).
Third
party
credit
enhancements
Structured
and
brokered
certificates
of
deposit
issued
by
Barclays
Bank
Group
are
insured
up
to
$250,000
per
depositor
by
the
Federal
Deposit
Insurance
Corporation
(FDIC)
in
the
US.
The
FDIC
is
funded
by
premiums
that
Barclays
Bank
Group
and
other
banks
pay
for
deposit
insurance
coverage.
The
carrying
value
of
these
issued
certificates
of
deposit
that
are
designated
under
the
IFRS
9
fair
value
option
includes
this
third
party
credit
enhancement.
The
on
-
balance
sheet
value
of
these
brokered
certificates
of
deposit
amounted
to
£3,218
m
(2018:
£4,797
m).
Notes
to
the
financial
statements
Assets
and
liabilities
held
at
fair
value
Barclays
Bank
PLC
2019
Annual
Report
on
Form
20-F
149
Comparison
of
carrying
amounts
and
fair
values
The
following
tables
summarises
the
fair
value
of
financial
assets
and
liabilities
m
easured
at
amortised
cost
on
Barclays
Bank
Group’s
and
Barclays
Bank
PLC
’s
balance
sheet:
Barclays
Bank
Group
2019
2018
Carrying
amount
Fair
value
Level
1
Level
2
Level
3
Carrying
amount
Fair
value
Level
1
Level
2
Level
3
As
at
31
December
£m
£m
£m
£m
£m
£m
£m
£m
£m
£m
Financial
assets
Loans
and
advances
at
amortised
cost
a
141,636
141,251
6,827
69,289
63,133
136,959
137,435
223
66,703
68,452
Reverse
repurchase
agreements
and
other
similar
secured
lending
1,731
1,731
-
1,731
-
1,613
1,613
-
1,613
-
Financial
liabilities
Deposits
at
amortised
cost
(213,881)
(213,897)
(135,398)
(78,494)
(5)
(199,337)
(199,337)
(157,440)
(41,897)
-
Repurchase
agreements
and
other
similar
secured
borrowing
(2,032)
(2,032)
-
(2,032)
-
(7,378)
(7,378)
-
(7,378)
-
Debt
securities
in
issue
(33,536)
(33,529)
-
(31,652)
(1,877)
(39,063)
(39,083)
-
(36,967)
(2,116)
Subordinated
liabilities
(33,425)
(34,861)
-
(34,861)
-
(35,327)
(36,174)
-
(36,174)
-
Note
a
The
fair
value
hierarchy
for
finance
lease
receivables
presented
within
loans
and
advances
at
amortised
cost,
with
fair
value
amounting
to
£2,002m
(2018:
£2,057m),
is
not
required
as
part
of
the
standard.
The
fair
value
is
an
estimate
of
the
price
that
would
be
received
to
sell
an
asset
or
paid
to
transfer
a
liability
in
an
orderly
transaction
between
market
participants
at
the
measurement
date.
As
a
wide
range
of
valuation
techniques
are
available,
it
may
not
be
appropriate
to
directly
compare
this
fair
value
information
to
independent
market
sources
or
other
financial
institutions.
Different
valuation
methodologies
and
assumptions
can
have
a
significant
impact
on
fair
values
which
are
based
on
unobservable
inputs.
Financial
assets
The
carrying
value
of
financial
assets
held
at
amortised
cost
(including
loans
and
advances
to
banks
and
customers,
and
other
lending
such
as
reverse
repurchase
agreements
and
cash
collateral
on
securities
borrowed)
is
determined
in
accordance
with
the
relevant
accounting
policy
in
Note
18.
Loans
and
advances
at
amortised
cost
The
fair
value
of
loans
and
advances,
for
the
purpose
of
this
disclosure,
is
derived
from
discounting
expected
cash
flows
in
a
way
that
reflects
the
current
market
price
for
lending
to
issuers
of
similar
credit
quality.
Where
market
data
or
credit
information
on
the
underlying
borrowers
is
unavailable,
a
number
of
proxy/extrapolation
techniques
are
employed
to
determine
the
appropriate
discount
rat
es.
Reverse
repurchase
agreements
and
other
similar
secured
lending
The
fair
value
of
reverse
repurchase
agreements
approximates
carrying
amount
as
these
balances
are
generally
short
dated
and
fully
collateralised.
Financial
liabilities
The
carrying
value
of
financial
liabilities
held
at
amortised
cost
(including
customer
accounts,
other
deposits,
repurchase
agreements
and
cash
collateral
on
securities
lent,
debt
securities
in
issue
and
subordinated
liabilities)
is
determined
in
accordance
with
the
accounting
policy
in
Note
1.
Deposits
at
amortised
cost
In
many
cases,
the
fair
value
disclosed
approximates
carrying
value
because
the
instruments
are
short
term
in
nature
or
have
interest
rates
that
reprice
frequently,
such
as
customer
accounts
and
other
deposits
and
short
-
term
debt
securities.
The
fair
valu
e
for
deposits
with
longer
-
term
maturities,
mainly
time
deposits,
are
estimated
using
discounted
cash
flows
applying
either
market
rates
or
current
rates
for
deposits
of
similar
remaining
maturities.
Consequently
the
fair
value
discount
is
minimal.
Repurc
hase
agreements
and
other
similar
secured
borrowing
The
fair
value
of
repurchase
agreements
approximates
carrying
amounts
as
these
balances
are
generally
short
dated.
Debt
securities
in
issue
Fair
values
of
other
debt
securities
in
issue
are
based
on
quoted
prices
where
available,
or
where
the
instruments
are
short
dated,
carrying
amount
approximates
fair
value.
Subordinated
liabilities
Fair
values
for
dated
and
undated
convertible
and
non
-
convertible
loan
capital
are
based
on
quoted
market
rates
for
the
issuer
concerned
or
issuers
with
similar
terms
and
conditions.
Notes
to
the
financial
statements
Assets
and
liabilities
held
at
fair
value
Barclays
Bank
PLC
2019
Annual
Report
on
Form
20-F
150
17
Offsetting
financial
assets
and
financial
liabilities
In
accordance
with
IAS
32
Financial
Instruments:
Presentation
,
the
Barclays
Bank
Group
reports
financial
assets
and
financial
liabilities
on
a
net
basis
on
the
balance
sheet
only
if
there
is
a
legally
enforceable
right
to
set-off
the
recognised
amounts
and
there
is
intention
to
settle
on
a
net
basis,
or
to
realise
the
asset
and
settle
the
liability
simultaneously.
The
following
table
shows
the
impact
of
netting
arrangements
on:
◾
all
financial
assets
and
liabilities
that
are
reported
net
on
the
balance
sheet
◾
all
derivative
financial
instruments
and
reverse
repurchase
and
repurchase
agreements
and
other
similar
secured
lending
and
borrowing
agreements
that
are
subject
to
enforceable
master
netting
arrangements
or
similar
agreements,
but
do
not
qualify
for
balan
ce
sheet
netting.
The
‘Net
amounts’
presented
in
the
table
below
are
not
intended
to
represent
the
Barclays
Bank
Group
’s
actual
exposure
to
credit
risk,
as
a
variety
of
credit
mitigation
strategies
are
employed
in
addition
to
netting
and
collateral
arrange
ments.
Barclays
Bank
Group
Amounts
subject
to
enforceable
netting
arrangements
Amounts
not
subject
to
enforceable
netting
arrangements
c
Balance
sheet
total
d
Effects
of
offsetting
on
-balance
sheet
Related
amounts
not
offset
Gross
amounts
Amounts
offset
a
Net
amounts
reported
on
the
balance
sheet
Financial
instruments
Financial
collateral
b
Net
amount
As
at
31
December
2019
£m
£m
£m
£m
£m
£m
£m
£m
Derivative
financial
assets
260,611
(32,546)
228,065
(176,022)
(38,872)
13,171
1,576
229,641
Reverse
repurchase
agreements
and
other
similar
secured
lending
e
373,775
(276,234)
97,541
-
(97,541)
-
2,013
99,554
Total
assets
634,386
(308,780)
325,606
(176,022)
(136,413)
13,171
3,589
329,195
Derivative
financial
liabilities
(255,005)
31,180
(223,825)
176,022
38,343
(9,460)
(5,115)
(228,940)
Repurchase
agreements
and
other
similar
secured
borrowing
e
(405,166)
276,234
(128,932)
-
128,930
(2)
(1,786)
(130,718)
Total
liabilities
(660,171)
307,414
(352,757)
176,022
167,273
(9,462)
(6,901)
(359,658)
As
at
31
December
2018
Derivative
financial
assets
239,344
(18,687)
220,657
(172,014)
(36,977)
11,666
2,026
222,683
Reverse
repurchase
agreements
and
other
similar
secured
lending
e
353,660
(235,703)
117,957
-
(117,515)
442
3,047
121,004
Total
assets
593,004
(254,390)
338,614
(172,014)
(154,492)
12,108
5,073
343,687
Derivative
financial
liabilities
(233,492)
18,229
(215,263)
172,014
32,900
(10,349)
(4,329)
(219,592)
Repurchase
agreements
and
other
similar
secured
borrowing
e
(375,841)
235,703
(140,138)
-
140,099
(39)
(5,724)
(145,862)
Total
liabilities
(609,333)
253,932
(355,401)
172,014
172,999
(10,388)
(10,053)
(365,454)
Notes
a
Amounts
offset
for
Derivative
financial
assets
additionally
includes
cash
collateral
netted
of
£4,099m
(2018:
£2,187m).
Amounts
offset
for
Derivative
financial
liabilities
additionally
include
s
cash
collateral
netted
of
£
5,465m
(2018:
£
2,645m).
Settlements
assets
and
liabilities
have
been
offset
amounting
to
£
14,079m
(2018:
£
23,095m).
b
Financial
collateral
of
£
38,872m
(2018:
£36,977m)
was
received
in
respect
of
derivative
assets,
including
£
33,469m
(2018:
£31,475m)
of
cash
collateral
and
£
5,403m
(2018:
£
5,502m)
of
non
-cash
collateral.
Financial
collateral
of
£38,343m
(2018:
£32,900m)
was
placed
in
respect
of
derivat
ive
liabilities,
including
£35,423m
(2018:
£
29,783m)
of
cash
collateral
and
£
2,920m
(2018:
£
3,117
m)
of
non
-cash
collateral.
The
collateral
amounts
are
limited
to
net
balance
sheet
exposure
so
as
to
not
include
over
-collateralisation.
c
This
column
includes
contractual
rights
of
set-off
that
are
subject
to
uncertainty
under
the
laws
of
the
relevant
jurisdiction.
d
The
balance
sheet
total
is
the
sum
of
‘Net
amounts
reported
on
the
balance
sheet’
that
are
subject
to
enforceable
netting
arrang
ements
and
‘Amounts
not
subject
to
enforceable
netting
arrangements’.
e
Reverse
Repurchase
agreements
and
other
similar
secured
lending
of
£
99,554m
(2018:
£1
21,004m)
is
split
by
fair
value
£
97,
823m
(2018:
£1
19,391m)
and
amortised
cost
£
1,731m
(2018:
£
1,613m).
Repurchase
agreements
and
other
similar
secured
borrowing
of
£
130,718m
(2018:
£1
45,862m)
is
split
by
fa
ir
value
£
128,686m
(2018:
£138,484m)
and
amortised
cost
£
2,032m
(2018:
£
7,378m).
Derivative
assets
and
liabilities
The
‘Financial
instruments’
column
identifies
financial
assets
and
liabilities
that
are
subject
to
set
off
under
netting
agreements,
such
as
the
ISDA
Master
Agreement
or
derivative
exchange
or
clearing
counterparty
agreements,
whereby
all
outstanding
transactions
with
the
same
counterparty
can
be
offset
and
close-out
netting
applied
across
all
outstanding
transactions
covered
by
the
agreements
if
an
event
of
default
or
other
predetermined
events
occur.
Financial
collateral
refers
to
cash
and
non
-
cash
collateral
obtained,
typically
daily
or
weekly,
to
cover
the
net
exposure
between
counterparties
by
enabling
the
collateral
to
be
realised
in
an
event
of
default
or
if
other
predetermined
events
occur.
Reverse
repurchase
and
repurchase
agreements
and
other
similar
secured
lending
and
borrowing
The
‘Amounts
offset’
column
identifies
financial
assets
and
liabilities
that
are
subject
to
set
off
under
netting
agreements,
such
as
Global
Master
Repurchase
Agreements
and
Global
Master
Securities
Lending
Agreements,
whereby
all
outstanding
transactions
with
the
same
counterparty
can
Notes
to
the
financial
statements
Assets
and
liabilities
held
at
fair
value
Barclays
Bank
PLC
2019
Annual
Report
on
Form
20-F
151
be
offset
and
close-out
netting
applied
across
all
outstanding
transactions
covered
by
the
agreements
if
an
event
of
default
or
other
predetermined
events
occur.
Financial
collateral
typically
comprises
highly
liquid
securities
which
are
legally
transferred
and
can
be
liquidated
in
the
event
of
counterparty
default.
These
offsetting
and
collateral
arrangements
and
other
credit
risk
mitigation
strategies
used
by
the
Barclays
Bank
Group
are
further
explained
in
the
Credit
risk
mitigation
section
on
page
s
38
and
39.
Notes
to
the
financial
statements
Assets
at
amortised
cost
and
other
investments
Barclays
Bank
PLC
2019
Annual
Report
on
Form
20-F
152
The
notes
included
in
this
section
focus
on
the
Barclays
Bank
Group’s
loans
and
advances
and
deposits
at
amortised
cost,
leases,
property,
plant
and
equipment
and
goodwill
and
intangible
assets.
Details
regarding
the
Barclays
Bank
Group’s
liquidity
and
capital
position
can
be
found
on
pages
72
to
83.
18
Loans
and
advances
and
deposits
at
amortised
cost
Accounting
for
loans
and
advances
and
deposits
held
at
amortised
cost
under
IFRS
9
effective
from
1
January
2018
Loans
and
advances
to
customers
and
banks,
customer
accounts,
debt
securities
and
most
financial
liabilities,
are
held
at
amortised
cost.
That
is,
the
initial
fair
value
(which
is
normally
the
amount
advanced
or
borrowed)
is
adjusted
for
repayments
and
the
amortisation
of
coupon,
fees
and
ex
penses
to
represent
the
effective
interest
rate
of
the
asset
or
liability.
Balances
deferred
on
-
balance
sheet
as
effective
interest
rate
adjustments
are
amortised
to
interest
income
over
the
life
of
the
financial
instrument
to
which
they
relate.
Financial
assets
that
are
held
in
a
business
model
to
collect
the
contractual
cash
flows
and
that
contain
contractual
terms
that
give
rise
on
specified
dates
to
cash
flows
that
are
SPPI,
are
measured
at
amortised
cost.
The
carrying
value
of
these
financial
assets
at
initial
recognition
includes
any
directly
attributable
transaction
costs.
Refer
to
note
1
for
details
on
‘solely
payments
of
principal
and
interest’.
In
determining
whether
the
business
model
is
a
‘hold
to
collect’
model,
the
objective
of
the
business
model
must
be
to
hold
the
financial
asset
to
collect
contractual
cash
flows
rather
than
holding
the
financial
asset
for
trading
or
short
-
term
profit
taking
purposes.
While
the
objective
of
the
business
model
must
be
to
hold
the
financial
asset
to
collect
contractual
cash
flows
this
does
not
mean
the
Barclays
Bank
Group
is
required
to
hold
the
financial
assets
until
maturity.
When
determining
if
the
business
model
objective
is
to
collect
contractual
cash
flows
the
Barclays
Bank
Group
will
consider
past
sales
and
expectations
about
future
sales.
Accounting
for
loans
and
advances
and
deposits
held
at
amortised
cost
under
IAS
39
for
2017
Loans
and
advances
to
customers
and
banks,
customer
accounts,
debt
securities
and
most
financial
liabilities,
are
held
at
amortised
cost.
That
is,
the
initial
fair
value
(which
is
normally
the
amount
advanced
or
borrowed)
is
adjusted
for
repayments
and
the
amortisation
of
coupon,
fees
and
expenses
to
represent
the
effective
interest
rate
of
the
asset
or
liability.
Balances
deferred
on
-
balanc
e
sheet
as
effective
interest
rate
adjustments
are
amortised
to
interest
income
over
the
life
of
the
financial
instrument
to
which
they
relate.
Loans
and
advances
and
deposits
at
amortised
cost
Barclays
Bank
Group
2019
2018
As
at
31
December
£m
£m
Loans
and
advances
at
amortised
cost
to
banks
9,722
10,228
Loans
and
advances
at
amortised
cost
to
customers
121,015
124,891
Debt
securities
at
amortised
cost
10,899
1,840
Total
loans
and
advances
at
amortised
cost
141,636
136,959
Deposits
at
amortised
cost
from
banks
18,144
15,569
Deposits
at
amortised
cost
from
customers
195,737
183,768
Total
deposits
at
amortised
cost
213,881
199,337
19
Property,
plant
and
equipment
Accounting
for
property,
plant
and
equipment
The
Barclays
Bank
Group
applies
IAS
16
Property
Plant
and
Equipment
Investment
Properties
.
Property,
plant
and
equipment
is
stated
at
cost,
which
includes
direct
and
incremental
acquisition
costs
less
accumulated
depreciation
and
provisions
for
imp
airment,
if
required.
Subsequent
costs
are
capitalised
if
these
result
in
enhancement
of
the
asset.
Depreciation
is
provided
on
the
depreciable
amount
of
items
of
property,
plant
and
equipment
on
a
straight-
line
basis
over
their
estimated
useful
economic
lives.
Depreciation
rates,
methods
and
the
residual
values
underlying
the
calculation
of
depreciation
of
items
of
property,
plant
and
equipment
are
kept
under
review
to
take
account
of
any
change
in
circumstances.
The
Barclays
Bank
Group
uses
the
followin
g
annual
rates
in
calculating
depreciation:
Annual
rates
in
calculating
depreciation
Depreciation
rate
Freehold
land
Freehold
buildings
and
long
-
leasehold
property
(more
than
50
years
to
run)
Leasehold
property
over
the
remaining
life
of
the
lease
(less
than
50
years
to
run)
Costs
of
adaptation
of
freehold
and
leasehold
property
Equipment
installed
in
freehold
and
leasehold
property
Computers
and
similar
equipment
Fixtures
and
fittings
and
other
equipment
Not
depreciated
2
-
3.3%
Over
the
remaining
life
of
the
lease
6
-
10%
6
-
10%
17
-
33%
9
-20%
Notes
to
the
financial
statements
Assets
at
amortised
cost
and
other
investments
Barclays
Bank
PLC
2019
Annual
Report
on
Form
20-F
153
Costs
of
adaptation
and
installed
equipment
are
depreciated
over
the
shorter
of
the
life
of
the
lease
or
the
depreciation
rates
noted
in
the
table
above.
Investment
property
The
Barclays
Bank
Group
initially
recognises
investment
property
at
cost,
and
subsequently
at
fair
value
at
each
balance
sheet
date,
reflecting
market
conditions
at
the
reporting
date.
Gains
and
losses
on
remeasurement
are
included
in
the
income
statement.
Barclays
Bank
Group
Investment
property
Property
Equipment
Leased
assets
Right
of
use
assets
a
Total
£m
£m
£m
£m
£m
£m
Cost
As
at
31
December
2018
9
1,463
1,079
9
-
2,560
Effects
of
changes
in
accounting
policies
(see
Note
1)
-
-
-
-
580
580
As
at
1
January
2019
9
1,463
1,079
9
580
3,140
Additions
5
233
182
-
45
465
Disposals
-
(19)
(144)
-
(6)
(169)
Exchange
and
other
movements
(1)
(42)
(46)
-
2
(87)
As
at
31
December
2019
13
1,635
1,071
9
621
3,349
Accumulated
depreciation
and
impairment
As
at
31
December
2018
-
(658)
(946)
(9)
-
(1,613)
Effects
of
changes
in
accounting
policies
(see
Note
1)
-
-
-
-
(71)
(71)
As
at
1
January
2019
-
(658)
(946)
(9)
(71)
(1,684)
Additions
-
-
(31)
-
-
(31)
Depreciation
charge
-
(72)
(65)
-
(75)
(212)
Disposals
-
13
142
-
-
155
Exchange
and
other
movements
-
20
34
-
-
54
As
at
31
December
2019
-
(697)
(866)
(9)
(146)
(1,718)
Net
book
value
13
938
205
-
475
1,631
Cost
As
at
1
January
2018
116
2,243
1,066
9
-
3,434
Transfer
of
UK
banking
business
-
(958)
-
-
-
(958)
Additions
9
155
79
-
-
243
Disposals
(115)
(45)
(101)
-
-
(261)
Change
in
fair
value
of
investment
properties
(3)
-
-
-
-
(3)
Exchange
and
other
movements
2
68
35
-
-
105
As
at
31
December
2018
9
1,463
1,079
9
-
2,560
Accumulated
depreciation
and
impairment
As
at
1
January
2018
-
(983)
(923)
(9)
-
(1,915)
Transfer
of
UK
banking
business
-
448
-
-
-
448
Additions
-
(60)
(32)
-
-
(92)
Depreciation
charge
-
(61)
(58)
-
-
(119)
Impairment
charge
-
(1)
-
-
-
(1)
Disposals
-
22
94
-
-
116
Exchange
and
other
movements
-
(23)
(27)
-
-
(50)
As
at
31
December
2018
-
(658)
(946)
(9)
-
(1,613)
Net
book
value
9
805
133
-
-
947
Note
a
Right
of
use
(ROU)
asset
balances
relate
to
Property
Leases
under
IFRS
16,
which
Barclays
adopted
on
1
January
2019.
Refer
to
Note
20
for
further
details.
Property
rentals
of
£
1
0
m
(2018:
£6m)
have
been
included
in
other
income
within
Barclays
Bank
Group.
The
fair
value
of
investment
property
is
determined
by
reference
to
current
market
prices
for
similar
properties,
adjusted
as
necessary
for
condition
and
location,
or
by
reference
to
recent
transactions
updated
to
reflect
current
economic
conditions.
Discounted
cash
flow
techniques
may
be
employed
to
calculate
fair
value
where
there
have
been
no
recent
transactions,
using
current
external
market
inputs
such
as
market
rents
and
interest
rates.
Valuations
are
carried
out
by
management
with
the
support
of
appr
opriately
qualified
independent
valuers.
Refer
to
Note
16
for
further
details.
Notes
to
the
financial
statements
Assets
at
amortised
cost
and
other
investments
Barclays
Bank
PLC
2019
Annual
Report
on
Form
20-F
154
20
Leases
Accounting
for
leases
under
IFRS
16
effective
from
1
January
2019
IFRS
16
applies
to
all
leases
with
the
exception
of
licenses
of
intellectual
property,
rights
held
by
licensing
agree
ment
within
the
scope
of
IAS
38
Intangible
Assets,
Agriculture
natural
gas
and
similar
non
-
regenerative
resources.
IFRS
16
includes
an
accounting
policy
choice
for
a
lessee
to
elect
not
to
apply
IFRS
16
to
remaining
assets
within
the
scope
of
IAS
38
When
the
Barclays
Bank
Group
is
the
lessee,
it
is
required
to
recognise
both:
◾
A
lease
liability,
measured
at
the
present
value
of
remaining
cash
flows
on
the
lease,
and
◾
A
right
of
use
(ROU)
asset,
measured
at
the
amount
of
the
initial
measurement
of
the
lease
liability,
plus
any
lease
payments
made
prior
to
commencement
date,
initial
direct
costs,
and
estimated
costs
of
restoring
the
underlying
asset
to
the
condition
required
by
the
lease,
less
any
lease
incentives
received
.
Subsequently
the
lease
liability
will
increase
for
the
accrual
of
interest,
resulting
in
a
constant
rate
of
return
throughout
the
life
of
the
lease,
and
reduce
when
payments
are
made.
The
right
of
use
asset
will
amortise
to
the
income
statement
over
the
life
of
the
lease.
The
lease
liability
is
remeasured
when
there
is
a
cha
nge
in
the
one
of
the
following:
◾
Future
lease
payments
arising
from
a
change
in
an
index
or
rate;
◾
The
Barclays
Bank
Group
’s
estimate
of
the
amount
expected
to
be
payable
under
a
residual
value
guarantee;
or
◾
The
Barclays
Bank
Group
’s
assessment
of
whether
it
will
exercise
a
purchase,
extension
or
termination
option.
When
the
lease
liability
is
remeasured
a
corresponding
adjustment
is
made
to
the
carrying
amount
of
the
ROU
asset,
o
r
is
recorded
in
the
income
statement
if
the
carrying
amount
of
the
ROU
asset
has
been
reduced
to
nil.
On
the
balance
sheet,
the
ROU
assets
are
included
within
property,
plant
and
equipment
and
the
lease
liabilities
are
included
within
other
liabilities.
The
Barclays
Bank
Group
applies
the
recognition
exemption
in
IFRS
16
for
leases
with
a
term
not
exceeding
12
months
.
For
these
leases
the
lease
payments
are
recognised
as
an
expense
on
a
straight
line
basis
over
the
lease
term
unless
another
systematic
basis
is
more
appropriate.
When
the
Barclays
Bank
Group
is
the
lessor,
the
lease
must
be
classified
as
either
a
finance
lease
or
an
operating
lease.
A
finance
lease
is
a
lease
which
confers
substantially
all
the
risks
and
rewards
of
the
leased
assets
on
the
lessee.
An
operating
lease
is
a
lease
where
substantially
all
of
the
risks
and
rewards
of
the
leased
asset
remain
with
the
lessor.
When
the
lease
is
deemed
a
finance
lease,
the
leased
asset
is
not
held
on
the
balance
sheet;
instead
a
finance
lease
receivable
is
recognised
representing
the
minimum
lease
payments
receivable
under
the
terms
of
the
lease,
discounted
at
the
rate
of
interest
implicit
in
the
lease.
When
the
lease
is
deemed
an
operating
lease,
the
lease
income
is
recognised
on
a
straight-
line
basis
over
the
period
of
the
lease
unless
another
systematic
basis
is
more
appropriate.
The
Barclays
Bank
Group
holds
the
leased
assets
on
-
balance
sheet
within
property,
plant
and
equipment.
Accounting
for
finance
leases
under
IAS
17
for
2018
and
2017
Under
IAS
17,
a
finance
lease
is
a
lease
which
confers
substantially
all
the
risks
and
rewards
of
the
leased
assets
on
the
lessee.
Where
the
Barclays
Bank
Group
is
the
lessor,
the
leased
asset
is
not
held
on
the
balance
sheet;
instead
a
finance
lease
receivable
is
recognised
representing
the
minimum
lease
payments
receivable
under
the
terms
of
the
lease,
discounted
at
the
rate
of
interest
implicit
in
the
lease.
Where
the
Barclays
Bank
Group
is
the
lessee,
the
leased
asset
is
recognised
in
property,
plant
and
equipment
and
a
finance
lease
liability
is
recognised,
representing
the
minimum
lease
payments
payable
under
the
lease,
discounted
at
the
rate
of
interest
implicit
in
the
lease.
Interest
income
or
expense
is
recognised
in
interest
receivable
or
payable,
allocated
to
accounting
periods
to
reflect
a
constant
periodic
rate
of
return.
Accounting
for
operating
leases
under
IAS
17
for
2018
and
2017
An
operating
lease
under
IAS
17
is
a
lease
where
substantially
all
of
the
risks
and
rewards
of
the
leased
assets
remain
with
the
lessor.
Where
the
Barclays
Bank
Group
is
the
lessor,
lease
income
is
recognised
on
a
straight-
line
basis
over
the
period
of
the
lease
unless
another
systematic
basis
is
more
appropriate.
The
Barclays
Bank
Gr
oup
holds
the
leased
assets
on
-
balance
sheet
within
property,
plant
and
equipment.
Where
the
Barclays
Bank
Group
is
the
lessee,
rentals
payable
are
recognised
as
an
expense
in
the
income
statement
on
a
straight-
line
basis
over
the
lease
term
unless
anothe
r
systematic
basis
is
more
appropriate.
As
a
Lessor
Finance
lease
receivables
are
included
within
loans
and
advances
at
amortised
cost.
The
Barclays
Bank
Group
specialises
in
the
provision
of
leasing
and
other
asset
finance
facilities
across
a
broad
range
of
asset
types
to
business
and
individual
customers.
Notes
to
the
financial
statements
Assets
at
amortised
cost
and
other
investments
Barclays
Bank
PLC
2019
Annual
Report
on
Form
20-F
155
The
following
table
sets
out
a
maturity
analysis
of
lease
receivables,
showing
the
lease
payments
to
be
received
after
the
reporting
date:
2019
2018
Gross
investment
in
finance
lease
receivables
Future
finance
income
Present
value
of
minimum
lease
payments
receivable
Un-
guaranteed
residual
values
Gross
investment
in
finance
lease
receivables
Future
finance
income
Present
value
of
minimum
lease
payments
receivable
Un
-guaranteed
residual
values
£m
£m
£m
£m
£m
£m
£m
£m
Barclays
Bank
Group
-
-
-
-
Not
more
than
one
year
1,403
(115)
1,288
77
1,333
(110)
1,223
86
One
to
two
year
909
(76)
833
53
827
(69)
758
53
Two
to
three
year
593
(49)
544
45
599
(49)
550
55
Three
to
four
year
354
(28)
326
43
401
(38)
363
20
Four
to
five
year
123
(8)
115
19
185
(15)
170
20
Over
five
years
115
(17)
98
22
381
(44)
337
22
Total
3,497
(293)
3,204
259
3,726
(325)
3,401
256
The
Barclays
Bank
Group
does
not
have
any
material
operating
leases
as
a
lessor.
The
impairment
allowance
for
finance
lease
receivables
amounted
to
£55m
(2018:
£87m).
Finance
lease
income
Finance
lease
income
is
included
within
interest
income.
The
following
table
shows
amounts
recognised
in
the
income
statement
during
the
year.
Barclays
Bank
Group
2019
£m
Finance
income
from
net
investment
in
lease
141
Profit
on
sales
6
As
a
Lessee
The
Barclays
Bank
Group
leases
various
offices,
branches
and
other
premises
under
non
-
cancellable
lease
arrangements
to
meet
its
operational
business
requirements.
In
some
instances,
Barclays
Bank
Group
will
sublease
property
to
third
parties
when
it
is
no
longer
need
ed
to
meet
business
requirements.
Currently,
Barclays
Bank
Group
does
not
have
any
material
subleasing
arrangements
.
ROU
asset
balances
relate
to
property
leases
only.
Refer
to
Note
19
for
a
breakdown
of
the
carrying
amount
of
ROU
assets.
The
Barclays
Bank
Group
recognised
total
expense
of
£
3
m
for
short
term
leases
during
the
year
.
The
portfolio
of
short
term
leases
to
which
Barclays
Bank
Group
is
exposed
at
the
end
of
the
year
is
not
dissimilar
to
the
expenses
recognised
in
the
year.
Lease
liabilities
2019
£m
As
at
31
December
2018
-
Effect
of
changes
in
accounting
policies
(see
Note
1)
569
As
at
1
January
2019
569
Interest
expense
25
New
leases
43
Disposals
(7)
Cash
payments
(106)
Exchange
and
other
movements
5
As
at
31
December
2019
(see
Note
22)
529
Notes
to
the
financial
statements
Assets
at
amortised
cost
and
other
investments
Barclays
Bank
PLC
2019
Annual
Report
on
Form
20-F
156
The
below
table
sets
out
a
maturity
analysis
of
undiscounted
lease
liabilities,
showing
the
lease
payments
to
be
paid
after
the
reporting
date.
Undiscounted
lease
liabilities
maturity
analysis
Barclays
Bank
Group
Barclays
Bank
PLC
2019
2019
£m
£m
Not
more
than
one
year
112
34
One
to
two
years
86
30
Two
to
three
years
66
28
Three
to
four
years
57
27
Four
to
five
years
52
26
Five
to
ten
years
199
120
Greater
than
ten
years
84
53
Total
undiscounted
lease
liabilities
as
at
31
December
2019
656
318
In
addition
to
the
cash
flows
identified
above,
Barclays
Bank
Group
is
exposed
to:
◾
Variable
lease
payments:
This
variability
will
typically
arise
from
either
inflation
index
instruments
or
market
based
pricing
adjustments.
Currently,
Barclays
Bank
Group
has
71
leases
out
of
the
total
143
leases
which
have
variable
lease
payment
terms
based
on
market
based
pricing
adjustments.
Of
the
gross
cash
flows
identified
above,
£
403
m
is
attributable
to
leases
with
some
degree
of
variability
predominately
linked
to
market
based
pricing
adjustments.
◾
Extension
and
termination
options:
The
table
above
represents
Barclays
Bank
Group’s
best
estimate
of
future
cash
out
flows
for
leases,
including
assumptions
regarding
the
exercising
of
contractual
extension
and
termination
options.
The
above
gross
cash
flows
have
been
reduced
by
£408m
for
leases
where
Barclays
Bank
Group
are
highly
expected
to
exercise
an
early
termination
option.
However,
there
is
no
significant
impact
where
Barclays
Bank
Group
is
expected
to
exercise
an
extension
option.
The
Barclays
Bank
Group
currently
does
not
have
any
significant
sale
and
lease
back
transactions.
The
Barclays
Bank
Group
does
not
have
any
restrictions
or
covenants
imposed
by
the
lessor
on
its
property
leases
which
restrict
its
businesses.
Operating
lease
commitments
under
IAS
17
in
2018
In
2018,
o
perating
lease
rentals
of
£158
m
were
included
in
infrastructure
costs.
The
prior
year
comparative
table
for
future
minimum
lease
payments
by
the
Barclays
Bank
Group
under
non
-
cancellable
operating
leases
ar
e
as
follows:
Barclays
Bank
Group
2018
Property
£m
Not
more
than
one
year
115
Over
one
year
but
not
more
than
five
years
258
Over
five
years
698
Total
1,071
21
Goodwill
and
intangible
assets
Accounting
for
goodwill
and
intangible
assets
Goodwill
The
carrying
value
of
goodwill
is
determined
in
accordance
with
IFRS
3
Business
Combinations
Impairment
of
Assets.
Goodwill
arising
on
the
acquisition
of
subsidiaries
represents
the
excess
of
the
fair
value
of
the
purchase
consideration
over
the
fair
value
of
the
Barclays
Bank
Group’s
share
of
the
assets
acquired
and
the
liabilities
and
contingent
liabilities
assumed
on
the
date
of
the
acquisition.
Goodwill
is
reviewed
annually
for
impairment,
or
more
frequently
when
there
are
indications
that
impairment
may
have
occurred.
The
test
involves
comparing
the
carrying
value
of
the
cash
generating
unit
(CGU)
including
goodwill
with
the
present
value
of
the
pre
-
tax
cash
flows,
discounted
at
a
rate
of
interest
that
reflects
the
inhe
rent
risks,
of
the
CGU
to
which
the
goodwill
relates,
or
the
CGU’s
fair
value
if
this
is
higher.
Intangible
assets
Notes
to
the
financial
statements
Assets
at
amortised
cost
and
other
investments
Barclays
Bank
PLC
2019
Annual
Report
on
Form
20-F
157
Intangible
assets
other
than
goodwill
are
accounted
for
in
accordance
with
IAS
38
Intangible
Assets
.
Intangible
assets
are
initially
reco
gnised
when
they
are
separable
or
arise
from
contractual
or
other
legal
rights,
the
cost
can
be
measured
reliably
and,
in
the
case
of
intangible
assets
not
acquired
in
a
business
combination,
where
it
is
probable
that
future
economic
benefits
attributable
to
the
assets
will
flow
from
their
use.
Intangible
assets
are
stated
at
cost
(which
is,
in
the
case
of
assets
acquired
in
a
business
combination,
the
acquisition
date
fair
value)
less
accumulated
amortisation
and
provisions
for
impairment,
if
any,
and
are
amortised
over
their
useful
lives
in
a
manner
that
reflects
the
pattern
to
which
they
contribute
to
future
cash
flows,
generally
using
the
amortisation
periods
set
out
below:
Annual
rates
in
calculating
amortisation
Amortisation
period
Goodwill
Internally
generated
software
a
Other
software
Customer
lists
Licences
and
other
Not
amortised
12
months
to
6
years
1
2
months
to
6
years
12
months
to
25
years
12
months
to
25
years
Intangible
assets
are
reviewed
for
impairment
when
there
are
indications
that
impairment
may
have
occurred.
Note
a
Exceptions
to
the
above
rate
relate
to
useful
lives
of
certain
core
banking
platforms
that
are
assessed
individually
and,
if
appropriate,
amortised
over
longer
periods
ranging
from
10
to
15
years.
Intangible
assets
Goodwill
Internally
generated
software
Other
software
Customer
lists
Licences
and
other
Total
£m
£m
£m
£m
£m
£m
Barclays
Bank
Group
Cost
As
at
1
January
2019
Additions
and
disposals
(33)
(15)
(128)
(39)
(82)
Exchange
and
other
movements
(6)
(45)
(4)
(41)
(35)
(131)
As
at
31
December
2019
Accumulated
amortisation
and
impairment
As
at
1
January
2019
(111)
(812)
(78)
(1,277)
(354)
(2,632)
Disposals
-
Amortisation
charge
-
(154)
(13)
(44)
(34)
(245)
Impairment
charge
-
(2)
-
-
-
(2)
Exchange
and
other
movements
-
As
at
31
December
2019
(111)
(870)
(54)
(1,159)
(340)
(2,534)
Net
book
value
Notes
to
the
financial
statements
Assets
at
amortised
cost
and
other
investments
Barclays
Bank
PLC
2019
Annual
Report
on
Form
20-F
158
Goodwill
Internally
generated
software
Other
software
Customer
lists
Licences
and
other
Total
£m
£m
£m
£m
£m
£m
Barclays
Bank
Group
Cost
As
at
1
January
2018
4,710
1,287
96
1,547
490
8,130
Transfer
of
UK
banking
business
(4,276)
(90)
(4,366)
Additions
and
disposals
(8)
11
13
16
Exchange
and
other
movements
11
63
(7)
83
29
179
As
at
31
December
2018
445
1,342
100
1,540
532
3,959
Accumulated
amortisation
and
impairment
As
at
1
January
2018
(860)
(787)
(75)
(1,210)
(313)
(3,245)
Transfer
of
UK
banking
business
750
79
829
Additions
and
disposals
161
(1)
12
172
Amortisation
charge
(156)
(11)
(78)
(31)
(276)
Impairment
charge
(1)
(1)
Exchange
and
other
movements
(1)
(29)
9
(68)
(22)
(111)
As
at
31
December
2018
(111)
(812)
(78)
(1,277)
(354)
(2,632)
Net
book
value
334
530
22
263
178
1,327
Goodwill
Goodwill
is
allocated
to
business
operations
according
to
business
segments
as
follows:
Barclays
Bank
Group
2019
2018
£m
£m
Consumer,
Cards
and
Payments
295
334
Total
net
book
value
of
goodwill
295
334
Goodwill
Testing
goodwill
for
impairment
involves
a
significant
amount
of
judgement.
This
includes
the
identification
of
independent
CGUs
and
the
allocation
of
goodwill
to
these
units
based
on
which
units
are
expected
to
benefit
from
the
acquisition.
Cash
flow
projections
take
into
account
change
s
in
the
market
in
which
a
business
operates
including
the
level
of
growth,
competitive
activity,
and
the
impacts
of
regulatory
change.
The
estimation
of
pre
-
tax
cash
flows
is
sensitive
to
the
periods
for
which
detailed
forecasts
are
available
and
to
assumptions
regarding
long
-
term
sustainable
cash
flows.
Goodwill
within
the
Consumer,
Cards
and
Payments
segment
was
£
295
m
(201
8:
£334
m).
The
carrying
value
of
the
CGUs
have
been
determined
by
using
net
asset
values.
The
recoverable
amounts
of
the
CGUs,
calculated
as
value
in
use,
have
been
determined
using
cash
flow
predictions
based
on
financial
budgets
approved
by
management,
covering
a
five-
year
period,
with
a
terminal
growth
rat
e
of
1.5%
(2018:
0.0%
to
3.5
%)
applied
thereafter.
The
forecasted
cash
flows
have
been
discounted
at
a
pre
-
tax
rate
of
1
1
.0%
to
13.
2
%
(2018
:
11.1%
to
13.
7
%).
Based
on
these
assumptions,
the
total
recoverable
amount
exceeded
the
carrying
amount
including
goodwill
by
£7,288m
(2018:
£10
,553
m).
A
one
percentage
point
change
in
the
discount
rate
or
terminal
growth
rate
would
increase
or
decrease
the
recoverable
amount
by
£1,108m
(2018:
£1,618m)
and
£730m
(2018:
£1,148
m)
respectively.
A
reduction
in
the
forecast
cash
flows
of
1
5
%
per
annum
(2018:
10%)
would
redu
ce
the
recoverable
amount
by
£896m
(2018:
£1,675
m).
Other
intangible
assets
Determining
the
estimated
useful
lives
of
intangible
assets
(such
as
those
arising
from
contractual
relationships)
requires
an
analysis
of
circumstances.
The
assessment
of
whether
an
asset
is
exhibiting
indicators
of
impairment
as
well
as
the
calculation
of
impairment,
which
requires
the
estimate
of
future
cash
flows
and
fair
values
less
costs
to
sell,
also
requires
the
preparation
of
cash
flow
forecasts
and
fair
values
for
assets
that
may
not
be
regula
rly
bought
and
sold.
Notes
to
the
financial
statements
Accruals,
provisions,
contingent
liabilities
and
legal
proceedings
Barclays
Bank
PLC
2019
Annual
Report
on
Form
20-F
159
The
notes
included
in
this
section
focus
on
the
Barclays
Bank
Group’s
accruals,
provisions
and
contingent
liabilities.
Provisions
are
recognised
for
present
obligations
arising
as
consequences
of
past
events
where
it
is
probable
that
a
transfer
of
economic
benefit
will
be
necessary
to
settle
the
obligat
ion,
and
it
can
be
reliably
estimated.
Contingent
liabilities
reflect
potential
liabilities
that
are
not
recognised
on
the
balance
sheet.
22
Other
liabilities
Barclays
Bank
Group
2019
2018
£m
£m
Accruals
and
deferred
income
2,419
2,680
Other
creditors
2,116
2,345
Items
in
the
course
of
collection
due
to
other
banks
175
141
Obligation
under
Finance
Lease
-
4
Lease
liabilities
a
529
-
Other
liabilities
5,239
5,170
Note
a
Lease
liabilities
represents
the
minimum
lease
payments
under
the
lease
discounted
at
the
rate
implicit
in
the
lease.
23
Provisions
Accounting
for
provisions
The
Barclays
Bank
Group
applies
IAS
37
Provisions,
Contingent
Liabilities
and
Contingent
Assets
in
accounting
for
non
-
financial
liabilities.
Provisions
are
recognised
for
present
obligations
arising
as
consequences
of
past
events
where
it
is
more
likely
than
not
that
a
transfer
of
economic
benefit
will
be
necessary
to
settle
the
obligation,
which
can
be
reliably
estimated.
Provision
is
made
for
the
anticipated
cost
of
restructuring,
including
redundancy
costs
when
an
obligation
exists;
for
example,
when
the
Barclays
Bank
Group
has
a
detailed
formal
plan
for
restructuring
a
business
and
has
raised
v
alid
expectations
in
those
affected
by
the
restructuring
by
announcing
its
main
features
or
starting
to
implement
the
plan.
Provision
is
made
for
undrawn
loan
commitments
if
it
is
probable
that
the
facility
will
be
drawn
and
result
in
the
recognition
of
an
asset
at
an
amount
less
than
the
amount
advanced.
Critical
accounting
estimates
and
judgements
The
financial
reporting
of
provisions
involves
a
significant
degree
of
judgement
and
is
complex.
Identifying
whether
a
present
obligation
exists
and
estimating
the
probability,
timing,
nature
and
quantum
of
the
outflows
that
may
arise
from
past
events
requires
judgements
to
be
made
based
on
the
specific
facts
and
circumstances
relating
to
individual
events
and
often
requires
specialist
professional
advice.
When
matters
are
at
an
early
stage,
accounting
judgements
and
estimates
can
be
difficult
because
of
the
high
degree
of
uncertainty
involved.
Management
continues
to
monitor
matters
as
they
develop
to
re
-
evaluate
on
an
ongoing
basis
whether
provisions
should
be
recognised,
however
there
can
remain
a
wide
range
of
possible
outcomes
and
uncertainties,
particularly
in
relation
to
legal,
competition
and
regulatory
matters,
and
as
a
result
it
is
often
not
practicable
to
make
meaningful
estimates
even
when
matters
are
at
a
more
advanced
stage.
The
complexity
of
such
matters
often
requires
the
input
of
specialist
professional
advice
in
making
assessments
to
produce
estimates.
Customer
redress
and
legal,
competition
and
regulatory
matters
are
areas
where
a
higher
degree
of
professional
judgement
is
required.
The
amount
that
is
recognised
as
a
provision
can
also
be
very
sensitive
to
the
assumptions
made
in
calculating
it.
This
gives
rise
to
a
large
range
of
potential
outcomes
which
require
judgement
in
determining
an
appr
opriate
provision
level.
See
below
for
information
on
payment
protection
redress
and
Note
25
for
more
detail
of
legal,
competition
and
regulatory
matters.
Notes
to
the
financial
statements
Accruals,
provisions,
contingent
liabilities
and
legal
proceedings
Barclays
Bank
PLC
2019
Annual
Report
on
Form
20-F
160
Undrawn
contractually
committed
facilities
and
guarantees
provided
a
Legal,
competition
and
regulatory
matters
Onerous
contracts
Redundancy
and
restructuring
Customer
redress
Sundry
provisions
Total
£m
£m
£m
£m
£m
£m
£m
Barclays
Bank
Group
As
at
December
2018
90
68
217
127
411
214
1,127
Effects
of
changes
in
accounting
policies
b
(46)
-
-
-
-
-
(46)
As
at
1
January
2019
44
68
217
127
411
214
1,081
Additions
11
86
373
20
286
35
811
Amounts
utilised
(30)
(60)
-
(66)
(302)
(48)
(506)
Unused
amounts
reversed
-
(29)
(332)
(15)
(16)
(13)
(405)
Exchange
and
other
movements
(5)
(2)
(6)
5
(5)
(17)
(30)
As
at
31
December
2019
20
63
252
71
374
171
951
Note
a
Undrawn
contractually
committed
facilities
and
guarantees
provisions
are
accounted
for
under
IFRS
9.
b
Upon
adoption
of
IFRS
16
on
1
January
2019,
£46m
of
onerous
lease
provisions
in
Barclays
Bank
Group
were
transferred
to
right
of
use
asset
impairment
allowance.
Please
see
page
107
in
note
1
for
further
detail.
Provisions
expected
to
be
recovered
or
settled
within
no
more
than
12
months
after
31
December
201
9
for
Barclays
Bank
Group
were
£739
m
(2018:
£791
m)
.
Onerous
contracts
Onerous
contract
provisions
comprise
an
estimate
of
the
costs
involved
with
fulfilling
the
terms
and
conditions
of
contracts
net
of
any
expected
benefits
to
be
received.
Redundancy
and
restructuring
These
provisions
comprise
the
estimated
cost
of
restructuring,
including
redundancy
costs
where
an
obligation
exists.
Additions
made
during
the
year
relate
to
formal
restructuring
plans
and
have
either
been
utilised,
or
reversed,
where
total
costs
are
now
expected
to
be
lower
than
the
original
provision
amount.
Undrawn
contractually
committed
facilities
and
guarantees
Impairment
allowance
under
IFRS
9
considers
both
the
drawn
and
the
undrawn
counterparty
exposure.
For
retail
portfolios,
the
total
impairment
allowance
is
allocated
to
the
drawn
exposure
to
the
extent
that
the
allowance
does
not
exceed
the
exposure
as
ECL
is
not
reported
separately.
Any
excess
is
reported
on
the
liability
side
of
the
balance
sheet
as
a
provision.
For
wholesale
portfolios
the
impairment
allowance
on
the
undrawn
exposure
is
reported
on
the
liability
side
of
the
balance
sheet
as
a
provision
.
P
rovisions
are
made
if
it
is
probable
that
a
facility
will
be
drawn
and
the
resulting
asset
is
expected
to
have
a
realisable
value
that
is
less
than
the
amount
advanced.
Customer
redress
Customer
redress
provisions
comprise
the
estimated
cost
of
making
redress
payments
to
customers,
clients
and
counterparties
for
losses
or
damages
associated
with
inappropriate
judgement
in
the
execution
of
Barclays
Bank
Group
’s
business
activities.
Provisions
for
other
customer
redress
include
smaller
p
rovisions
across
the
corporate
businesses
which
are
expected
to
be
utilised
in
the
next
12
-
24
months.
Legal,
competition
and
regulatory
matters
The
Barclays
Bank
Group
is
engaged
in
various
legal
proceedings,
both
in
the
UK
and
a
number
of
other
overseas
jurisdictions,
including
the
US.
For
further
information
in
relation
to
legal
proceedings
and
discussion
of
the
associated
uncertainties,
please
refer
to
Note
25.
Sundry
provisions
This
category
includes
provisions
that
do
not
fit
into
any
of
the
other
categories,
such
as
fraud
losses
and
dilapidation
provisions
.
Notes
to
the
financial
statements
Accruals,
provisions,
contingent
liabilities
and
legal
proceedings
Barclays
Bank
PLC
2019
Annual
Report
on
Form
20-F
161
24
Contingent
liabilities
and
commitments
Accounting
for
contingent
liabilities
Contingent
liabilities
are
possible
obligations
whose
existence
will
be
confirmed
only
by
uncertain
future
events,
and
present
obligations
where
the
transfer
of
economic
resources
is
uncertain
or
cannot
be
reliably
measured.
Contingent
liabilities
are
not
recognised
on
the
balance
sheet
but
are
disclosed
unless
the
likelihood
of
an
outflow
of
economic
resources
is
remote.
The
following
table
summarises
the
nominal
principal
amount
of
contingent
liabilities
and
commitments
which
are
not
recorded
on
-
balance
sheet:
Barclays
Bank
Group
2019
2018
£m
£m
Guarantees
and
letters
of
credit
pledged
as
collateral
security
17,006
15,046
Performance
guarantees,
acceptances
and
endorsements
6,771
4,348
Total
contingent
liabilities
23,777
19,394
43
4
Documentary
credits
and
other
short
-
term
trade
related
transactions
1,291
1,741
Standby
facilities,
credit
lines
and
other
commitments
268,736
256,027
Total
commitments
270,027
257,768
17,660
11,703
Provisions
held
against
contingent
liabilities
and
commitments
equal
£252m
(2018:
£217m)
for
Barclays
Bank
Group
.
Further
details
on
contingent
liabilities
relating
to
legal
and
competition
and
regulatory
matters
can
be
found
in
Note
25.
25
Legal,
competition
and
regulatory
matters
Barclays
Bank
Group
face
legal,
competition
and
regulatory
challenges,
many
of
which
are
beyond
our
control.
The
extent
of
the
impact
of
these
matters
cannot
always
be
predicted
but
may
materially
impact
our
operations,
financial
results,
condition
and
prospects.
Matters
arising
from
a
set
of
similar
circumstances
can
give
rise
to
either
a
contingent
liability
or
a
provision,
or
both,
depending
on
the
relevant
facts
and
circumstances.
The
recognition
of
provisions
in
relation
to
such
matters
involves
critical
accounting
estimates
and
judgments
in
accordance
with
the
relevant
accounting
po
licies
as
described
in
Note
23,
Provisions.
We
have
not
disclosed
an
estimate
of
the
potential
financial
impact
or
effect
on
the
Barclays
Bank
Group
of
contingent
liabilities
where
it
is
not
currently
practicable
to
do
so.
Various
matters
detailed
in
this
note
seek
damages
of
an
unspecified
amount.
While
certain
matters
specify
the
damages
claimed,
such
claimed
amounts
do
not
necessarily
reflect
the
Barclays
Bank
Group’s
potential
financial
exposure
in
respect
of
those
matters.
Investigations
into
certain
advisory
services
agreements
and
other
matters
and
civil
action
FCA
proceedings
In
2008,
Barclays
Bank
PLC
and
Qatar
Holdings
LLC
entered
into
two
advisory
service
agreements
(the
Agreements).
The
Financial
Conduct
Authority
(FCA),
is
conducting
an
inve
stigation
into
whether
the
Agreements
may
have
related
to
Barclays
PLC’s
capital
raisings
in
June
and
November
2008
(the
Capital
Raisings)
and
therefore
should
have
been
disclosed
in
the
announcements
or
public
documents
relating
to
the
Capital
Raisings.
I
n
2013,
the
FCA
issued
warning
notices
(the
Notices)
finding
that
Barclays
PLC
and
Barclays
Bank
PLC
acted
recklessly
and
in
breach
of
certain
disclosure
-
related
listing
rules,
and
that
Barclays
PLC
was
also
in
breach
of
Listing
Principle
3.
The
financial
penalty
provided
in
the
Notices
is
£50m.
Barclays
PLC
and
Barclays
Bank
PLC
continue
to
contest
the
findings.
The
FCA
action
has
been
stayed
due
to
the
UK
Serious
Fraud
Office
(SFO)
proceedings
pending
against
certain
former
Barclays
executives.
All
charge
s
brought
by
the
SFO
against
Barclays
PLC
and
Barclays
Bank
PLC
in
relation
to
the
Agreements
were
dismissed
in
2018.
Civil
action
PCP
Capital
Partners
LLP
and
PCP
International
Finance
Limited
(PCP)
are
seeking
damages
of
approximately
£1.6bn
from
Barclays
Bank
PLC
for
fraudulent
misrepresentation
and
deceit,
arising
from
alleged
statements
made
by
Barclays
Bank
PLC
to
PCP
in
relation
to
the
terms
on
which
securities
were
to
be
issued
to
potential
investors,
allegedly
including
PCP,
in
the
November
2008
capital
raising.
Barclays
Bank
PLC
is
defending
the
claim
and
trial
is
scheduled
to
commence
in
June
2020.
Investigation
into
historic
hiring
practices
In
2019,
the
Barclays
Group
reached
a
settlement
of
$6.4m
with
the
US
Securities
and
Exchanges
Co
mmission
(SEC)
in
relation
to
certain
of
its
hiring
practices
in
Asia,
resolving
this
matter.
Investigations
into
LIBOR
and
other
b
enchmarks
and
related
civil
actions
Regulators
and
law
enforcement
agencies,
including
certain
competition
authorities,
from
a
number
of
governments
have
been
conducting
investigations
relating
to
Barclays
Bank
PLC’s
involvement
in
allegedly
manipulating
certain
financial
benchmarks,
such
as
LIBOR.
The
SFO
has
closed
its
investigation
with
no
action
to
be
taken
against
the
Barclays
Group.
Various
individuals
and
corporates
in
a
range
of
jurisdictions
have
Notes
to
the
financial
statements
Accruals,
provisions,
contingent
liabilities
and
legal
proceedings
Barclays
Bank
PLC
2019
Annual
Report
on
Form
20-F
162
threatened
or
brought
civil
actions
against
the
Barclays
Group
and
other
banks
in
relation
to
the
alleged
manipulation
of
LIBOR
and/or
other
benchmarks.
Certain
actions
rem
ain
pending.
USD
LIBOR
civil
actions
The
majority
of
the
USD
LIBOR
cases,
which
have
been
filed
in
various
US
jurisdictions,
have
been
consolidated
for
pre
-
trial
purposes
in
the
US
District
Court
in
the
Southern
District
of
New
York
(SDNY).
The
complaints
are
substantially
similar
and
allege,
among
other
things,
that
Barclays
PLC,
Barclays
Bank
PLC,
Barclays
Capital
Inc.
(BCI)
and
other
financial
institutions
individually
and
collectively
violated
provisions
of
the
US
Sherman
Antitrust
Act
(Antitrust
Act),
the
US
Commodity
Exchange
Act
(CEA),
the
US
Racketeer
Influenced
and
Corrupt
Organizations
Act
(RICO),
the
Securities
Exchange
Act
of
1934
and
various
state
laws
by
manipulating
USD
LIBOR
rates.
Putative
class
actions
and
individual
actions
seek
unspecif
ied
damages
with
the
exception
of
five
lawsuits,
in
which
the
plaintiffs
are
seeking
a
combined
total
in
excess
of
$1.25bn
in
actual
damages
and
additional
punitive
damages
against
all
defendants,
including
Barclays
Bank
PLC.
Some
of
the
lawsuits
also
seek
trebling
of
damages
under
the
Antitrust
Act
and
RICO.
Barclays
has
previously
settled
certain
claims.
Two
of
the
class
action
settlements
where
Barclays
has
paid
$20m
and
$7.1m,
respectively,
remain
subject
to
final
court
approval
and/or
the
right
of
class
members
to
opt
out
of
the
settlement
to
file
their
own
claims.
Sterling
LIBOR
civil
actions
In
2016,
two
putative
class
actions
filed
in
the
SDNY
against
Barclays
Bank
PLC,
BCI
and
other
Sterling
LIBOR
panel
banks
alleging,
among
other
things,
that
the
defendants
manipulated
the
Sterling
LIBOR
rate
in
violation
of
the
Antitrust
Act,
CEA
and
RICO,
were
consolidated.
The
defendants’
motion
to
dismiss
the
claims
was
granted
in
December
2018.
The
plaintiffs
have
appealed
the
dismissal.
Japanese
Yen
LIBOR
civil
actions
In
2012,
a
putative
class
action
was
filed
in
the
SDNY
against
Barclays
Bank
PLC
and
other
Japanese
Yen
LIBOR
panel
banks
by
a
lead
plaintiff
involved
in
exchange
-
traded
derivatives
and
members
of
the
Japanese
Bankers
Association’s
Euroyen
Tokyo
Interbank
Offered
Rate
(Euroyen
TIBOR)
panel.
The
complaint
alleges,
among
other
things,
manipulation
of
the
Euroyen
TIBOR
and
Yen
LIBOR
rates
and
breaches
of
the
CEA
and
the
Antitrust
Act.
In
2014,
the
court
dismissed
the
plaintiff’s
antitrust
claims
in
full,
but
the
plaintiff’s
CEA
claims
remain
pending.
In
2015,
a
second
putative
class
action,
making
similar
allegations
to
the
above
class
action,
was
filed
in
the
SDNY
against
Barclays
PLC,
Barclays
Bank
PLC
and
BCI.
In
2017,
this
action
was
dismissed
in
full
and
the
plaintiffs
have
appealed
the
dismissal.
SIBOR/SOR
civil
action
In
2016,
a
putative
class
action
was
filed
in
the
SDNY
against
Barclays
PLC,
Barclays
Bank
PLC,
BCI
and
other
defendants,
alleging
manipulation
of
the
Singapore
Interbank
Offered
Rate
(SIBOR)
and
Singapore
Swap
Offer
Rate
(SOR).
In
October
2018,
the
court
dismissed
all
claims
against
Barclays
PLC,
Barclays
Bank
PLC
and
BCI.
The
plaintiffs
have
appealed
the
dismissal.
ICE
LIBOR
civil
actions
In
2019,
several
putative
class
actions
have
been
filed
in
the
SDNY
against
Barclays
PLC,
Barclays
Bank
PLC,
BCI,
other
financial
institution
defendants
and
Intercontinental
Exchange
Inc.
and
certain
of
its
affiliates
(ICE),
asserting
antitrust
claims
that
defendants
manipulated
USD
LIBO
R
through
defendants’
submissions
to
ICE.
These
actions
have
been
consolidated.
The
defendants
have
filed
a
motion
to
dismiss.
Non
-US
benchmarks
civil
actions
Legal
proceedings
(which
include
the
claims
referred
to
below
in
‘Local
authority
civil
actions
concerning
LIBOR’)
have
been
brought
or
threatened
against
Barclays
Bank
PLC
(and,
in
certain
cases,
Barclays
Bank
UK
PLC)
in
the
UK
in
connection
with
alleged
manipulation
of
LIBOR,
EURIBOR
and
other
benchmarks.
Proceedings
have
also
been
brought
in
a
num
ber
of
other
jurisdictions
in
Europe
and
Israel.
Additional
proceedings
in
other
jurisdictions
may
be
brought
in
the
future.
Foreign
Exchange
i
nvestigations
and
related
civil
actions
In
2015,
the
Barclays
Group
reached
settlements
totalling
approximately
$2.38bn
with
various
US
federal
and
state
authorities
and
the
FCA
in
relation
to
investigations
into
certain
sales
and
trading
practices
in
the
Foreign
Exchange
market.
Under
the
related
plea
agreement
with
the
US
Department
of
Justice
(DoJ),
which
receiv
ed
final
court
approval
in
January
2017,
the
Barclays
Group
agreed
to
a
term
of
probation
of
three
years.
The
Barclays
Group
also
continues
to
provide
relevant
information
to
certain
authorities.
The
European
Commission
is
one
of
a
number
of
authorities
still
conducting
an
investigation
into
certain
trading
practices
in
Foreign
Exchange
markets.
The
European
Commission
announced
two
settlements
in
May
2019
and
the
Barclays
Group
paid
penalties
totalling
approximately
€210m.
In
June
2019,
the
Swiss
Competi
tion
Commission
announced
two
settlements
and
the
Barclays
Group
paid
penalties
totalling
approximately
CHF
27m.
The
financial
impact
of
the
ongoing
matters
is
not
expected
to
be
material
to
the
Barclays
Bank
Group’s
operating
results,
cash
flows
or
financ
ial
position.
A
number
of
individuals
and
corporates
in
a
range
of
jurisdictions
have
also
threatened
or
brought
civil
actions
against
the
Barclays
Group
and
other
banks
in
relation
to
alleged
manipulation
of
Foreign
Exchange
markets,
and
may
do
so
in
the
future.
Certain
actions
remain
pending.
FX
opt
out
civil
action
In
2018,
Barclays
Bank
PLC
and
BCI
settled
a
consolidated
action
filed
in
the
SDNY,
alleging
manipulation
of
Foreign
Exchange
markets
(Consolidated
FX
Action),
for
a
total
amount
of
$384m.
Also
in
2018,
a
group
of
plaintiffs
who
opted
out
of
the
Consolidated
FX
Action
filed
a
complaint
in
the
SDNY
against
Barclays
PLC,
Barclays
Bank
PLC,
BCI
and
other
defendants.
Notes
to
the
financial
statements
Accruals,
provisions,
contingent
liabilities
and
legal
proceedings
Barclays
Bank
PLC
2019
Annual
Report
on
Form
20-F
163
Retail
basis
civil
action
In
2015,
a
putative
class
action
was
filed
against
several
international
banks,
including
Barclays
PLC
and
BCI,
on
behalf
of
a
proposed
class
of
individuals
who
exchanged
currencies
on
a
retail
basis
at
bank
branches
(Retail
Basis
Claims).
The
SDNY
has
ruled
that
the
Retail
Basis
Claims
are
not
covered
by
the
settlement
agreement
in
the
Consolidated
FX
Actio
n.
The
Court
subsequently
dismissed
all
Retail
Basis
Claims
against
the
Barclays
Group
and
all
other
defendants.
The
plaintiffs
have
filed
an
amended
complaint.
State
law
FX
civil
action
In
2017,
the
SDNY
dismissed
consolidated
putative
class
actions
brought
under
federal
and
various
state
laws
on
behalf
of
proposed
classes
of
(i)
stockholders
of
Exchange
Traded
Funds
and
others
who
purportedly
were
indirect
investors
in
FX
instruments,
and
(ii)
investors
who
traded
FX
instruments
through
FX
dealers
or
brokers
not
alleged
to
have
manipulated
Foreign
Exchange
Rates.
The
plaintiffs’
amended
complaint
as
to
their
state
law
claims
is
pending.
Non
-US
FX
civil
actions
In
addition
to
the
actions
describe
d
above,
legal
proceedings
have
been
brought
or
are
threatened
against
Barclays
PLC,
Barclays
Bank
PLC,
BCI
and
Barclays
Execution
Services
Limited
(BX)
in
connection
with
alleged
manipulation
of
Foreign
Exchange
in
the
UK,
a
number
of
other
jurisdictions
in
Europe,
Israel
and
Australia
and
additional
proceedings
may
be
brought
in
the
future.
Metals
investigations
and
related
civil
actions
Barclays
Bank
PLC
previously
provided
information
to
the
DoJ,
the
US
Commodity
Futures
Trading
Commission
and
other
authorities
in
connection
with
investigations
into
metals
and
metals-based
financial
instruments.
A
number
of
US
civil
complaints,
each
on
behalf
of
a
proposed
class
of
plaintiffs,
have
been
consolidated
and
transferred
to
the
SDNY.
The
complaints
allege
that
Barclays
Bank
PLC
and
other
members
of
The
London
Gold
Market
Fixing
Ltd.
manipulated
the
prices
of
gold
and
gold
derivative
contracts
in
violation
of
US
antitrust
and
other
federal
laws.
This
consolidated
putative
class
action
remains
pending.
A
separate
US
civil
complaint
by
a
proposed
class
of
plaintiffs
against
a
number
of
banks,
including
Barclays
Bank
PLC,
BCI
and
BX
(formerly,
Bar
clays
Capital
Services
Limited),
alleging
manipulation
of
the
price
of
silver
in
violation
of
the
CEA,
the
Antitrust
Act
and
state
antitrust
and
consumer
protection
laws,
has
been
dismissed
as
against
the
Barclays
entities.
The
plaintiffs
have
the
option
to
seek
the
court’s
permission
to
appeal.
Civil
actions
have
also
been
filed
in
Canadian
courts
against
Barclays
PLC,
Barclays
Bank
PLC,
Barclays
Capital
Canada
Inc.
and
BCI
on
behalf
of
proposed
classes
of
plaintiffs
alleging
manipulation
of
gold
and
silver
prices.
US
residential
mortgage
related
civil
actions
There
are
various
pending
civil
actions
relating
to
US
Residential
Mortgage
-
Backed
Securities
(RMBS),
including
four
actions
arising
from
unresolved
repurch
ase
requests
submitted
by
Trustees
for
certain
RMBS,
alleging
breaches
of
various
loan
-
level
representations
and
warranties
(R&Ws)
made
by
Barclays
Bank
PLC
and/or
a
subsidiary
acquired
in
2007
(the
Acquired
Subsidiary).
The
unresolved
repurchase
requests
received
as
at
31
December
2019
had
an
original
unpaid
principal
balance
of
approximately
$2.1bn.
The
Trustees
have
also
alleged
that
the
relevant
R&Ws
may
have
been
breached
with
respect
to
a
greater
(but
unspecified)
amount
of
loans
than
previously
stated
in
the
unresolved
repurchase
requests.
These
repurchase
actions
are
ongoing.
In
one
repurchase
action,
the
New
York
Court
of
Appeals
held
that
claims
related
to
certain
R&Ws
are
time-
barred.
Barclays
Bank
PLC
has
reached
a
settlement
to
resolve
two
of
the
repurchase
actions,
which
is
subject
to
final
court
approval.
The
financial
impact
of
the
settlement
is
not
expected
to
be
material
to
the
Barclays
Bank
Group’s
operating
results,
cash
flows
or
financial
position.
The
remaining
two
repurchase
actions
are
pending.
Government
and
agency
securities
civil
actions
and
related
matters
Certain
governmental
authorities
are
conducting
investigations
into
activities
relating
to
the
trading
of
certain
government
and
agency
securities
in
various
markets.
The
Barclays
Group
provided
information
in
cooperation
with
such
investigations.
Civil
actions
have
also
been
filed
on
the
basis
of
similar
allegations,
as
described
below.
Treasury
auction
securities
civil
actions
Consolidated
putative
class
action
complaints
filed
in
US
federal
court
against
Barclays
Bank
PLC,
BCI
and
other
financial
institutions
under
the
Antitrust
Act
and
state
common
law
allege
that
the
defendants
(i)
conspired
to
manipulate
the
US
Treasury
securities
market
and/or
(ii)
conspired
to
prevent
the
creation
of
certain
platforms
by
boycotting
or
threatening
to
boycott
such
trading
platforms.
The
defendants
have
filed
a
motion
to
dismiss.
In
addition,
certain
plaintiffs
have
filed
a
related,
direct
action
against
BCI
and
certain
other
financial
institutions,
alleging
that
defendants
conspired
to
fix
and
manipulate
the
US
Treasury
securities
mar
ket
in
violation
of
the
Antitrust
Act,
the
CEA
and
state
common
law.
Supranational,
Sovereign
and
Agency
bonds
civil
actions
Civil
antitrust
actions
have
been
filed
in
the
SDNY
and
Federal
Court
of
Canada
in
Toronto
against
Barclays
Bank
PLC,
BCI,
BX
(for
merly,
Barclays
Services
Limited),
Barclays
Capital
Securities
Limited
and,
with
respect
to
the
civil
action
filed
in
Canada
only,
Barclays
Capital
Canada,
Inc.
and
other
financial
institutions
alleging
that
the
defendants
conspired
to
fix
prices
and
restrain
competition
in
the
market
for
US
dollar
-
denominated
Supranational,
Sovereign
and
Agency
bonds.
In
one
of
the
actions
filed
in
the
SDNY,
the
court
granted
the
defendants’
motion
to
dismiss
the
plaintiffs’
complaint
with
respect
to
Barclays
Bank
P
LC
and
certain
Barclays
Group
entities.
Defendants
have
filed
a
motion
to
dismiss
those
plaintiffs’
remaining
claims
against
BCI.
The
remaining
action
filed
in
the
SDNY
is
stayed.
Notes
to
the
financial
statements
Accruals,
provisions,
contingent
liabilities
and
legal
proceedings
Barclays
Bank
PLC
2019
Annual
Report
on
Form
20-F
164
Variable
Rate
Demand
Obligations
civil
actions
Civil
actions
have
been
filed
against
Barclays
Bank
PLC
and
BCI
and
other
financial
institutions
alleging
the
defendants
conspired
or
colluded
to
artificially
inflate
interest
rates
set
for
Variable
Rate
Demand
Obligations
(VRDOs).
VRDOs
are
municipal
bond
s
with
interest
rates
that
reset
on
a
periodic
basis,
most
commonly
weekly.
Two
actions
in
state
court
have
been
filed
by
private
plaintiffs
on
behalf
of
the
states
of
Illinois
and
California.
Two
putative
class
action
complaints,
which
have
been
consolida
ted,
have
been
filed
in
the
SDNY.
Government
bond
civil
actions
In
a
putative
class
action
filed
in
the
SDNY
in
2019,
plaintiffs
alleged
that
BCI
and
certain
other
bond
dealers
conspired
to
fix
the
prices
of
US
government
sponsored
entity
bonds
in
violation
of
US
antitrust
law.
BCI
has
agreed
a
settlement
of
$87m,
subject
to
court
approval.
In
2019,
the
Louisiana
Attorney
General
and
the
City
of
Baton
Rouge
each
filed
a
complaint
against
Barclays
Bank
PLC
and
other
financial
institutions
m
aking
similar
allegations
as
the
class
action
plaintiffs.
In
2018,
a
separate
putative
class
action
against
various
financial
institutions
including
Barclays
PLC,
Barclays
Bank
PLC,
BCI,
Barclays
Bank
Mexico,
S.A.,
and
certain
other
subsidiaries
of
the
Gr
oup
was
consolidated
in
the
SDNY.
The
plaintiffs
asserted
antitrust
and
state
law
claims
arising
out
of
an
alleged
conspiracy
to
fix
the
prices
of
Mexican
Government
bonds.
Barclays
PLC
has
settled
the
claim,
subject
to
court
approval.
The
financial
impact
of
the
settlement
is
not
material
to
the
Barclays
Bank
Group’s
operating
results,
cash
flows
or
financial
position.
BDC
Finance
L.L.C.
In
2008,
BDC
Finance
L.L.C.
(BDC)
filed
a
complaint
in
the
NY
Supreme
Court,
demanding
damages
of
$298m,
alleging
that
Barclays
Bank
PLC
had
breached
a
contract
in
connection
with
a
portfolio
of
total
return
swaps
governed
by
an
ISDA
Master
Agreement
(collectively,
the
Agreement).
Following
a
trial
on
certain
liability
issues,
the
court
ruled
in
December
2018
that
Barclay
s
Bank
PLC
was
not
a
defaulting
party,
which
was
affirmed
on
appeal.
In
2011,
BDC’s
investment
advisor,
BDCM
Fund
Adviser,
L.L.C.
and
its
parent
company,
Black
Diamond
Capital
Holdings,
L.L.C.
also
sued
Barclays
Bank
PLC
and
BCI
in
Connecticut
State
Court
for
unspecified
damages
allegedly
resulting
from
Barclays
Bank
PLC’s
conduct
relating
to
the
Agreement,
asserting
claims
for
violation
of
the
Connecticut
Unfair
Trade
Practices
Act
and
tortious
interference
with
business
and
prospective
business
relations.
This
case
is
currently
stayed.
Civil
actions
in
r
espect
of
the
US
Anti
-Terrorism
Act
There
are
a
number
of
civil
actions,
on
behalf
of
more
than
4,000
plaintiffs,
filed
in
US
federal
courts
in
the
US
District
Court
in
the
Eastern
District
of
New
York
(
EDNY)
and
SDNY
against
Barclays
Bank
PLC
and
a
number
of
other
banks.
The
complaints
generally
allege
that
Barclays
Bank
PLC
and
those
banks
engaged
in
a
conspiracy
to
facilitate
US
dollar
-
denominated
transactions
for
the
Government
of
Iran
and
various
Ira
nian
banks,
which
in
turn
funded
acts
of
terrorism
that
injured
or
killed
plaintiffs
or
plaintiffs’
family
members.
The
plaintiffs
seek
to
recover
damages
for
pain,
suffering
and
mental
anguish
under
the
provisions
of
the
US
Anti-
Terrorism
Act,
which
allow
for
the
trebling
of
any
proven
damages.
The
court
granted
the
defendants’
motion
to
dismiss
one
action
in
the
EDNY,
and
plaintiffs
have
filed
a
notice
of
appeal.
The
defendants
have
moved
to
dismiss
two
other
EDNY
actions.
The
court
also
granted
the
defendants’
motion
to
dismiss
another
action
in
the
SDNY,
but
the
plaintiffs
have
moved
to
file
an
amended
complaint.
The
remaining
actions
are
stayed
pending
decisions
in
these
cases.
Interest
rate
swap
and
credit
default
swap
US
civil
actions
Barclays
PLC,
Barclays
Bank
PLC
and
BCI,
together
with
other
financial
institutions
that
act
as
market
makers
for
interest
rate
swaps
(IRS)
are
named
as
defendants
in
several
antitrust
class
actions
which
were
consolidated
in
the
SDNY
in
2016.
The
complaints
allege
the
defendants
conspired
to
prevent
the
development
of
exchanges
for
IRS
and
demand
unspecified
money
damages.
In
2018,
trueEX
LLC
filed
an
antitrust
class
action
in
the
SDNY
against
a
number
of
financial
institutions
including
Barclays
PLC,
Barclays
B
ank
PLC
and
BCI
based
on
similar
allegations
with
respect
to
trueEX
LLC’s
development
of
an
IRS
platform.
In
2017,
Tera
Group
Inc.
filed
a
separate
civil
antitrust
action
in
the
SDNY
claiming
that
certain
conduct
alleged
in
the
IRS
cases
also
caused
the
plaintiff
to
suffer
harm
with
respect
to
the
Credit
Default
Swaps
market.
In
November
2018
and
July
2019,
respectively,
the
court
dismissed
certain
claims
in
both
cases
for
unjust
enrichment
and
tortious
interference
but
denied
motions
to
dismiss
the
federal
and
state
antitrust
claims,
which
remain
pending.
Portuguese
Competition
Authority
investigation
The
Portuguese
Competition
Authority
found
that
a
subsidiary
of
Barclays
Bank
PLC
and
other
banks
violated
competition
law
by
exchanging
information
about
retail
credit
products
relating
to
mortgages,
consumer
lending
and
lending
to
small
and
medium
enterprises.
The
Barclays
Group
applied
for
immunity
and
received
no
fine.
Investigation
into
collections
and
recoveries
relating
to
unsecured
lending
Since
February
2018,
the
FCA
has
been
investigating
whether
the
Barclays
Group
implemented
effective
systems
and
controls
with
respect
to
collections
and
recoveries
and
whether
it
paid
due
consideration
to
the
interests
of
customers
in
default
and
arrears.
The
FCA
investigation
is
at
an
advanced
stage.
HM
Revenue
&
Customs
(HMRC)
assessments
concerning
UK
Value
Added
Tax
In
2018,
HMRC
issued
notices
that
have
the
effect
of
removing
certain
overseas
subsidiaries
that
have
operations
in
the
UK
from
Barclays’
UK
VAT
group,
in
which
group
supplies
between
members
are
generally
free
from
VAT.
The
notices
have
retrospective
effect
and
correspond
to
assessments
of
£181m
(
inclusive
of
interest),
of
which
Barclays
would
expect
to
attribute
an
amount
of
approximately
£128m
to
Barclays
Bank
UK
PLC
and
£53m
to
Barclays
Bank
PLC.
HMRC’s
decision
has
been
appealed
to
the
First
Tier
Tribunal
(Tax
Chamber).
Notes
to
the
financial
statements
Accruals,
provisions,
contingent
liabilities
and
legal
proceedings
Barclays
Bank
PLC
2019
Annual
Report
on
Form
20-F
165
Local
authority
civil
actions
concerning
LIBOR
Following
settlement
by
Barclays
Bank
PLC
of
various
governmental
investigations
concerning
certain
benchmark
interest
rate
submissions
referred
to
above
in
‘Investigations
into
LIBOR
and
other
benchmarks
and
related
civil
actions’,
in
the
UK,
certain
local
authorities
have
brought
claims
against
Barclays
Bank
PLC
(and,
in
certain
cases,
Barclays
Bank
UK
PLC)
asserting
that
they
entered
into
loans
in
reliance
on
misrepresentations
made
by
Barclays
Bank
PLC
in
respect
of
its
conduct
in
relation
to
LIBOR.
Barclays
has
applied
to
strike
out
the
claims.
General
The
Barclays
Bank
Group
is
engaged
in
various
other
legal,
competition
and
regulatory
matters
in
the
UK,
the
US
and
a
number
of
other
overseas
jurisdictions.
It
is
subject
to
legal
proceedings
brought
by
and
against
the
Barclays
Bank
Group
which
arise
in
the
ordinary
course
of
business
from
time
to
time,
including
(but
not
limited
to)
disputes
in
relation
to
contracts,
securities,
debt
collection,
consumer
credit,
fraud,
trusts,
client
assets,
competition,
data
management
and
protection,
money
laundering,
financial
crime,
employment,
environmental
and
other
statutory
and
common
law
issues.
The
Barclays
Bank
Group
is
also
subject
to
enquiries
and
examinations,
requests
for
infor
mation,
audits,
investigations
and
legal
and
other
proceedings
by
regulators,
governmental
and
other
public
bodies
in
connection
with
(but
not
limited
to)
consumer
protection
measures,
compliance
with
legislation
and
regulation,
wholesale
trading
activity
and
other
areas
of
banking
and
business
activities
in
which
the
Barclays
Bank
Group
is
or
has
been
engaged.
The
Barclays
Bank
Group
is
cooperating
with
the
relevant
authorities
and
keeping
all
relevant
agencies
briefed
as
appropriate
in
relation
to
these
m
atters
and
others
described
in
this
note
on
an
ongoing
basis.
At
the
present
time,
Barclays
Bank
PLC
does
not
expect
the
ultimate
resolution
of
any
of
these
other
matters
to
have
a
material
adverse
effect
on
its
financial
position.
However,
in
light
of
the
uncertainties
involved
in
such
matters
and
the
matters
specifically
described
in
this
note,
there
can
be
no
assurance
that
the
outcome
of
a
particular
matter
or
matters
(including
formerly
active
matters
or
those
matters
arising
after
the
date
of
this
note)
will
not
be
material
to
Barclays
Bank
PLC’s
results,
operations
or
cash
flow
for
a
particular
period,
depending
on,
among
other
things,
the
amount
of
the
loss
resulting
from
the
matter(s)
and
the
amount
of
profit
otherwise
reported
for
the
reporting
period.
Notes
to
the
financial
statements
Capital
instruments,
equity
and
reserves
Barclays
Bank
PLC
2019
Annual
Report
on
Form
20-F
166
The
notes
included
in
this
section
focus
on
the
Barclays
Bank
Group
’s
loan
capital
and
shareholders’
equity
including
issued
share
capital,
retained
earnings,
other
equity
balances
and
interests
of
minority
shareholders
in
our
subsidiary
entities
(non
-
cont
rolling
interests).
For
more
information
on
capital
management
and
how
the
Barclays
Bank
Group
maintains
sufficient
capital
to
meet
our
regulatory
requirements
refer
to
page
40
.
26
Subordinated
liabilities
Accounting
for
subordinated
liabilities
Subordinated
liabilities
are
measured
at
amortised
cost
using
the
effective
interest
method
under
IFRS
9.
Barclays
Bank
Group
2019
2018
£m
£m
As
at
1
January
35,327
24,193
Issuances
6,785
221
Redemptions
(7,804)
(3,246)
Other
(883)
14,159
As
at
31
December
33,425
35,327
Issuances
of
£6,785m
comprises
£3,534m
intra
-
group
loans
from
and
£3,093m
intra
-
group
notes
to
Barclays
PLC
as
well
as
£158m
externally
issued
USD
Floating
Rate
Notes.
Redemptions
of
£7,804m
comprises
£3,033m
externally
issued
Step-up
Callable
Perpetual
Reserve
Capital
Instruments,
£43m
externally
issued
EUR
Floating
Rate
Notes,
£
4,556m
intra
-
gr
oup
loans
from
Barclays
PLC,
£158m
externally
issued
USD
Floating
Rate
Notes
and
£14m
externally
issued
JPY
Floating
Rate
Loans.
Other
movements
predominantly
include
foreign
exchange
and
accrued
interest,
partially
offset
by
fair
value
hedge
adjustments.
Subordinated
liabilities
include
accrued
interest
and
compris
e
undated
and
dated
subordinated
liabilities
as
follows:
Barclays
Bank
Group
2019
2018
£m
£m
Undated
subordinated
liabilities
1,073
4,313
Dated
subordinated
liabilities
32,352
31,014
Total
subordinated
liabilities
33,425
35,327
None
of
the
Ba
rclays
Bank
Group’s
subordinated
liabilities
are
secured.
Undated
subordinated
liabilities
Barclays
Bank
Group
2019
2018
Initial
call
date
£m
£m
Barclays
Bank
PLC
externally
issued
subordinated
liabilities
Tier
One
Notes
(TONs)
6%
Callable
Perpetual
Core
Tier
One
Notes
2032
16
16
6.86%
Callable
Perpetual
Core
Tier
One
Notes
(USD
179m)
2032
203
199
Reserve
Capital
Instruments
(RCIs)
6.3688%
Step-up
Callable
Perpetual
Reserve
Capital
Instruments
2019
-
34
14%
Step-up
Callable
Perpetual
Reserve
Capital
Instruments
2019
-
3,189
5.3304%
Step-up
Callable
Perpetual
Reserve
Capital
Instruments
2036
53
51
Undated
Notes
7.125%
Undated
Subordinated
Notes
2020
165
173
6.125%
Undated
Subordinated
Notes
2027
42
42
Junior
Undated
Floating
Rate
Notes
(USD
38m)
Any
interest
payment
date
29
30
Undated
Floating
Rate
Primary
Capital
Notes
Series
1
(USD
167m)
Any
interest
payment
date
92
95
Undated
Floating
Rate
Primary
Capital
Notes
Series
2
(USD
295m)
Any
interest
payment
date
191
199
Undated
Floating
Rate
Primary
Capital
Notes
Series
3
Any
interest
payment
date
21
21
Bonds
9.25%
Perpetual
Subordinated
Bonds
(ex
-
Woolwich
Plc)
2021
81
83
9%
Permanent
Interest
Bearing
Capital
Bonds
At
any
time
44
44
Loans
5.03%
Reverse
Dual
Currency
Undated
Subordinated
Loan
(JPY
8,000m)
2028
55
56
5%
Reverse
Dual
Currency
Undated
Subordinated
Loan
(JPY
12,000m)
2028
81
81
Total
undated
subordinated
liabilities
1,073
4,313
Notes
to
the
financial
statements
Capital
instruments,
equity
and
reserves
Barclays
Bank
PLC
2019
Annual
Report
on
Form
20-F
167
Undated
subordinated
liabilities
Undated
subordinated
liabilities
are
issued
by
Barclays
Bank
PLC
and
its
subsidiaries
for
the
development
and
expansion
of
their
business
and
to
strengthen
their
capital
bases.
The
principal
terms
of
the
undated
subordinated
liabilities
are
described
below:
Subordination
All
undated
subordinated
liabilities
rank
be
hind
the
claims
against
the
bank
of
depositors
and
other
unsecured
unsubordinated
creditors
and
holders
of
dated
subordinated
liabilities
in
the
following
order:
Junior
Undated
Floating
Rate
Notes;
other
issues
of
Undated
Notes,
Bonds
and
Loans
ranking
par
i
passu
with
each
other;
followed
by
TONs
and
RCIs
ranking
pari
passu
with
each
other.
Interest
All
undated
subordinated
liabilities
bear
a
fixed
rate
of
interest
until
the
initial
call
date,
with
the
exception
of
the
9%
Bonds
which
are
fixed
for
the
life
of
the
issue,
and
the
Junior
and
Series
1,
Series
2
and
Series
3
Undated
Notes
which
are
floating
rate
at
rates
fixed
periodically
in
advance
based
on
the
related
interbank
rate.
After
the
initial
call
date,
in
the
event
that
they
are
not
redeemed,
the
7
.125%,
6.125%
Undated
Notes,
and
the
9.25%
Bonds
will
bear
interest
at
rates
fixed
periodically
in
advance
for
five-
year
periods
based
on
market
rates.
All
other
undated
subordinated
liabilities
will
bear
interest
at
rates
fixed
periodically
in
advance
based
on
London
interbank
rates.
Payment
of
interest
Barclays
Bank
PLC
is
not
obliged
to
make
a
payment
of
interest
on
its
Undated
Notes,
Bonds
and
Loans
excluding
the
9.25%
Bonds
if,
in
the
preceding
six
months,
a
dividend
has
not
been
declared
or
paid
on
any
class
of
shares
of
Barclays
PLC
or,
in
certain
cases,
any
class
of
preference
shares
of
Barclays
Bank
PLC.
Barclays
Bank
PLC
is
not
obliged
to
make
a
payment
of
interest
on
its
9.25%
Perpetual
Subordinated
Bonds
if,
in
the
imm
ediately
preceding
12
month
interest
period,
a
dividend
has
not
been
paid
on
any
class
of
its
share
capital.
Interest
not
paid
becomes
payable
in
each
case
if
such
a
dividend
is
subsequently
paid
or
in
certain
other
circumstances.
During
the
year,
Barclays
Bank
PLC
and
Barclays
PLC
declared
and
paid
dividends
on
its
ordinary
shares
and
on
all
classes
of
preference
shares.
No
payment
of
principal
or
any
interest
may
be
made
unless
Barclays
Bank
PLC
satisfies
a
specified
solvency
test.
Barclays
Bank
PLC
may
elect
to
defer
any
payment
of
interest
on
the
RCIs.
Any
such
deferred
payment
of
interest
must
be
paid
on
the
earlier
of:
(i)
the
date
of
redemption
of
the
RCIs,
and
(ii)
the
coupon
payment
date
falling
on
or
nearest
to
the
tenth
anniversary
of
the
d
ate
o
f
deferral
of
such
payment.
Whilst
such
deferral
is
continuing,
neither
Barclays
Bank
PLC
nor
Barclays
PLC
may
(i)
declare
or
pay
a
dividend,
subject
to
certain
exceptions,
on
any
of
its
ordin
ary
shares
or
preference
shares
and
(ii)
certain
restrictions
on
the
redemption,
purchase
or
reduction
of
their
respective
share
capital
and
certain
other
securities
also
apply.
Barclays
Bank
PLC
may
elect
to
defer
any
payment
of
interest
on
the
TONs
if
it
determines
that
it
is,
or
such
payment
would
result
in
it
bein
g,
in
non
-
compliance
with
capital
adequacy
requirements
and
policies
of
the
PRA.
Any
such
deferred
payment
of
interest
will
only
be
payable
on
a
redemption
of
the
TONs.
Until
such
time
as
Barclays
Bank
PLC
next
makes
a
payment
of
interest
on
the
TONs,
neither
Barclays
Bank
PLC
nor
Barclays
PLC
may
(i)
declare
or
pay
a
dividend,
subject
to
certain
exceptions,
on
any
of
their
respective
ordinary
shares
or
Preference
Shares,
or
make
payments
of
interest
in
respect
of
Barclays
Bank
PLC’s
Reserve
Capital
Instrum
ents
and
(ii)
certain
restrictions
on
the
redemption,
purchase
or
reduction
of
their
respective
share
capital
and
certain
other
securities
also
apply.
Repayment
All
undated
subordinated
liabilities
are
repayable,
at
the
option
of
Barclays
Bank
PLC
general
ly
in
whole
at
the
initial
call
date
and
on
any
subsequent
coupon
or
interest
payment
date
or
in
the
case
of
the
7.125%,
6.125%
Undated
Notes
and
the
9.25%
Bonds
on
any
fifth
anniversary
after
the
initial
call
date.
In
addition,
each
issue
of
undated
subor
dinated
liabilities
is
repayable,
at
the
option
of
Barclays
Bank
PLC,
in
whole
for
certain
tax
reasons,
either
at
any
time,
or
on
an
interest
payment
date.
There
are
no
events
of
default
except
non
-
payment
of
principal
or
mandatory
interest.
Any
repayments
require
the
prior
approval
of
the
PRA.
Other
All
issues
of
undated
subordinated
liabilities
are
non
-convertible.
Notes
to
the
financial
statements
Capital
instruments,
equity
and
reserves
Barclays
Bank
PLC
2019
Annual
Report
on
Form
20-F
168
26
Subordinated
liabilities
continued
Dated
subordinated
liabilities
Barclays
Bank
Group
2019
2018
Initial
call
date
Maturity
date
£m
£m
Barclays
Bank
PLC
externally
issued
subordinated
liabilities
Floating
Rate
Subordinated
Notes
(EUR
50m)
2019
-
45
5.14%
Lower
Tier
2
Notes
(USD
1,094m)
2020
832
851
6%
Fixed
Rate
Subordinated
Notes
(EUR
1,500m)
2021
1,375
1,474
9.5%
Subordinated
Bonds
(ex
-
Woolwich
Plc)
2021
239
256
Subordinated
Floating
Rate
Notes
(EUR
100m)
2021
85
89
10%
Fixed
Rate
Subordinated
Notes
2021
2,157
2,194
10.179%
Fixed
Rate
Subordinated
Notes
(USD
1,521m)
2021
1,123
1,143
Subordinated
Floating
Rate
Notes
(EUR
50m)
2022
43
45
6.625%
Fixed
Rate
Subordinated
Notes
(EUR
1,000m)
2022
957
1,032
7.625%
Contingent
Capital
Notes
(USD
3,000m)
2022
2,453
2,502
Subordinated
Floating
Rate
Notes
(EUR
50m)
2023
42
45
5.75%
Fixed
Rate
Subordinated
Notes
2026
350
351
5.4%
Reverse
Dual
Currency
Subordinated
Loan
(JPY
15,000m)
2027
105
107
6.33%
Subordinated
Notes
2032
62
61
Subordinated
Floating
Rate
Notes
(EUR
68m)
2040
58
61
External
issuances
by
other
subsidiaries
2021
-
2024
358
384
Barclays
Bank
PLC
notes
issued
intra
-group
to
Barclays
PLC
2%
Fixed
Rate
Subordinated
Callable
Notes
(EUR
1,500m)
2023
2028
1,309
1,361
3.75%
Fixed
Rate
Resetting
Subordinated
Callable
Notes
(SGD
200m)
2025
2030
116
116
5.20%
Fixed
Rate
Subordinated
Notes
(USD
1,367m)
2026
1,036
1,001
4.836%
Fixed
Rate
Subordinated
Callable
Notes
(USD
1,200m)
2027
2028
944
911
5.088%
Fixed
-
to-
Floating
Rate
Subordinated
Callable
Notes
(USD
1,300m)
2029
2030
994
-
5.25%
Fixed
Rate
Subordinated
Notes
(USD
827m)
2045
651
-
4.95%
Fixed
Rate
Subordinated
Notes
(USD
1,250m)
2047
849
-
Floating
Rate
Subordinated
Notes
(USD
456m)
2047
350
-
Barclays
Bank
PLC
intra
-group
loans
from
Barclays
PLC
Various
Fixed
Rate
Subordinated
Loans
7,548
10,147
Various
Subordinated
Floating
Rate
Loans
1,094
1,023
Various
Fixed
Rate
Subordinated
Callable
Loans
5,225
3,754
Total
dated
subordinated
liabilities
32,352
31,014
Dated
subordinated
liabilities
Dated
subordinated
liabilities
are
issued
by
Barclays
Bank
PLC
and
respective
subsidiaries
for
the
development
and
expansion
of
their
business
and
to
strengthen
their
respective
capital
bases.
The
principal
terms
of
the
dated
subordinated
liabilities
are
describ
ed
below:
Currency
and
maturity
In
addition
to
the
individual
dated
subordinated
liabilities
listed
in
the
table,
the
£1
5
,864
m
of
intra
-
group
loans
is
made
up
of
various
fixed,
fixed
to
floating
and
floating
rate
loans
from
Barclays
PLC
with
notio
nal
amou
nts
denominated
in
USD
13,
187
m
,
EUR
3,024m
,
GBP
250m
,
JPY
2
33,600m,
AUD
1,
715m,
SEK
500m
,
NOK
970m
and
CHF
175m
,
with
maturities
ranging
from
2020
to
2047.
Certain
intra
-
group
loans
have
a
call
date
one
year
prior
to
their
maturity
.
Subordination
All
dated
subordinated
liabilities,
both
externally
issued
and
issued
intra
-
group
to
Barclays
PLC,
rank
behind
the
claims
against
the
bank
of
depositors
and
other
unsecured
unsubordinated
creditors
but
before
the
claims
of
the
undated
subordinated
liabilities
and
the
holders
of
their
equity.
The
Barclays
Bank
PLC
intra
-
group
loans
from
Barclays
PLC
rank
pari
passu
amongst
themselves
but
ahead
of
the
Barclays
Bank
PLC
notes
issued
intra
-
group
to
Barclays
PLC
and
the
Barclays
Bank
PLC
externally
issued
subor
dinated
liabilities.
The
external
dated
subordinated
liabilities
issued
by
subsidiaries,
are
similarly
subordinated
as
the
external
subordinated
liabilities
issued
by
Barclays
Bank
PLC
.
Interest
Interest
on
floating
rate
notes
and
loans
is
set
by
referen
ce
to
market
rates
at
the
time
of
issuance
and
fixed
periodically
in
advance,
based
on
the
related
interbank
or
local
bank
rates.
Interest
on
fixed
rate
notes
and
loans
is
set
by
reference
to
market
rates
at
the
time
of
issuance
and
fixed
until
maturity.
Notes
to
the
financial
statements
Capital
instruments,
equity
and
reserves
Barclays
Bank
PLC
2019
Annual
Report
on
Form
20-F
169
Interest
on
fixed
rate
callable
notes
and
loans
is
set
by
reference
to
market
rates
at
the
time
of
issuance
and
fixed
until
the
call
date.
After
the
call
date,
in
the
event
that
the
notes
or
loans
are
not
redeemed,
the
interest
rate
will
be
re
-
set
to
either
a
fixed
or
floating
rate
until
maturity
based
on
market
rates.
Repayment
Those
subordinated
liabilities
with
a
call
date
are
repayable
at
the
option
of
the
issuer,
on
conditions
governing
the
respective
debt
obligations,
some
in
whole
or
in
part,
and
some
only
in
whole.
The
remaining
dated
subordinated
liabilities
outstanding
at
31
December
2019
are
redeemable
only
on
maturity,
subject
in
particular
cases,
to
provisions
allowing
an
early
redemption
in
the
event
of
certain
changes
in
tax
law
or,
to
cert
ain
changes
in
legislation
or
regulations.
Any
repayments
prior
to
maturity
may
require,
in
the
case
of
Barclays
Bank
PLC,
the
prior
approval
of
the
PRA,
or
in
the
case
of
the
overseas
issues,
the
approval
of
the
local
regulator
for
that
jurisdiction
and
of
the
PRA
in
certain
circumstances.
There
are
no
committed
facilities
in
existence
at
the
balance
sheet
date
which
permit
the
refinancing
of
debt
beyond
the
date
of
maturity.
Other
The
7.625%
Contingent
Capital
Notes
will
be
automatically
transferred
from
investors
to
Barclays
PLC
(or
another
entity
within
the
Barclays
Group)
for
nil
consideration
in
the
event
the
Barclays
PLC
consolidated
CRD
IV
CET1
ratio
(FSA
October
2012
transitional
statement)
falls
below
7.0%.
27
Ordinary
shares,
share
premium,
and
other
equity
Called
up
share
capital,
allotted
and
fully
paid
Ordinary
share
capital
Preference
share
capital
Share
premium
Total
share
capital
and
share
premium
Other
equity
instruments
£m
£m
£m
£m
£m
As
at
1
January
2019
2,342
6
-
2,348
7,595
AT1
securities
issuance
-
-
-
-
2,302
AT1
securities
redemption
-
-
-
-
(1,574)
As
at
31
December
2019
2,342
6
-
2,348
8,323
As
at
1
January
2018
2,342
19
12,092
14,453
8,982
AT1
securities
issuance
-
-
-
-
1,925
AT1
securities
redemption
-
-
-
-
(1,242)
Redemption
of
preference
shares
-
(13)
-
(13)
-
Capital
reorganisation
-
-
(12,092)
(12,092)
-
Net
equity
impact
of
intra
-
group
transfers
-
-
-
-
(2,070)
As
at
31
December
2018
2,342
6
-
2,348
7,595
Ordinary
shares
The
issued
ordinary
share
capital
of
Barclays
Bank
PLC,
as
at
31
December
2019,
comprised
2,342
m
(201
8:
2,342m)
ordinary
shares
of
£1
each.
Preference
shares
The
issued
preference
share
capital
of
Barclays
Bank
PLC,
as
at
31
December
201
9
,
comprised
1,000
Sterling
Preference
Shares
of
£1
each
(201
8
:
1,000);
31,856
Euro
Preference
Shares
of
€100
each
(201
8:
31,856);
and
58,133
US
Dollar
Preference
Shares
of
$100
each
(201
8
:
58,133).
Ordinary
share
capital,
p
reference
share
Capital
and
share
premium
constitutes
100
%
(201
8
:
10
0%)
of
total
share
capital
and
share
premium
issued.
Sterling
£1
Preference
Shares
1,000
Sterling
cumulative
callable
preference
shares
of
£1
each
(the
£1
Preference
Shares)
were
issued
on
31
December
2004
at
nil
premium.
The
£1
Preference
Shares
entitle
the
holders
thereof
to
receive
Sterling
cumulative
cash
dividends
out
of
distributable
profits
of
Barclays
Bank
PLC,
semi-annually
at
a
rate
reset
semi-annually
equal
to
the
Sterling
interbank
offered
rate
for
six-month
sterling
deposits.
Barclays
Bank
PLC
shall
be
obliged
to
pay
such
dividends
if:
(1)
it
has
profits
available
for
the
purpose
of
distribution
under
the
Companies
Act
2006
as
at
each
dividend
payment
date;
and
(2)
it
is
solvent
on
the
relevant
dividend
payment
date,
provided
that
a
capital
regulations
condition
is
satisfied
on
such
dividend
payment
date.
The
dividends
shall
not
be
due
and
payable
on
the
relevant
dividend
payment
date
except
to
the
extent
that
Barclays
Bank
PLC
could
make
such
pa
yment
and
still
be
solvent
immediately
thereafter.
Barclays
Bank
PLC
shall
be
considered
solvent
on
any
date
if:
(1)
it
is
able
to
pay
its
debts
to
senior
creditors
as
they
fall
due;
and
(2)
its
auditors
have
reported
within
the
previous
six
months
that
its
Notes
to
the
financial
statements
Capital
instruments,
equity
and
reserves
Barclays
Bank
PLC
2019
Annual
Report
on
Form
20-F
170
assets
exceed
its
liabilities.
If
Barclays
Bank
PLC
shall
not
pay,
or
shall
pay
only
in
part,
a
dividend
for
a
period
of
seven
days
or
more
after
the
due
date
for
payment,
the
holders
of
the
£1
Preference
Shares
may
institute
proceedings
for
the
winding
-
up
of
Barclays
Bank
PLC.
No
remedy
against
Barclays
Bank
PLC
shall
be
available
to
the
holder
of
any
£1
Preference
Shares
for
the
recovery
of
amounts
owing
in
respect
of
£1
Preference
Shares
other
than
the
institution
of
proceedings
for
the
winding
-
up
of
B
arclays
Bank
PLC
and/or
proving
in
such
winding
-
up.
On
a
winding
-
up
or
other
return
of
capital
(other
than
a
redemption
or
purchase
by
Barclays
Bank
PLC
of
any
of
its
issued
shares,
or
a
reduction
of
share
capital,
permitted
by
the
Articles
of
Barclays
Ba
nk
PLC
and
under
applicable
law),
the
assets
of
Barclays
Bank
PLC
available
to
shareholders
shall
be
applied
in
priority
to
any
payment
to
the
holders
of
ordinary
shares
and
any
other
class
of
shares
in
the
capital
of
Barclays
Bank
PLC
then
in
issue
rankin
g
junior
to
the
£1
Preference
Shares
on
such
a
return
of
capital
and
pari
passu
on
such
a
return
of
capital
with
the
holders
of
any
other
class
of
shares
in
the
capital
of
Barclays
Bank
PLC
then
in
issue
(other
than
any
class
of
shares
in
the
capital
of
Ba
rclays
Bank
PLC
then
in
issue
ranking
in
priority
to
the
£1
Preference
Shares
on
a
winding
-
up
or
other
such
return
of
capital),
in
payment
to
the
holders
of
the
£1
Preference
Shares
of
a
sum
equal
to
the
aggregate
of:
(1)
an
amount
equal
to
the
dividends
accrued
thereon
for
the
then
current
dividend
period
(and
any
accumulated
arrears
thereof)
to
the
date
of
the
commencement
of
the
winding
-
up
or
other
such
return
of
capital;
and
(2)
an
amount
equal
to
£1
per
£1
Preference
Share.
After
payment
of
the
full
am
ount
of
the
liquidating
distributions
to
which
they
are
entitled,
the
holders
of
the
£1
Preference
Shares
will
have
no
right
or
claim
to
any
of
the
remaining
assets
of
Barclays
Bank
PLC
and
will
not
be
entitled
to
any
further
participation
in
such
return
o
f
capital.
The
£1
Preference
Shares
are
redeemable
at
the
option
of
Barclays
Bank
PLC,
in
whole
but
not
in
part
only,
subject
to
the
Companies
Act
2006
and
its
Articles.
Holders
of
the
£1
Preference
Shares
are
not
entitled
to
receive
notice
of,
or
to
attend,
or
vote
at,
any
general
meeting
of
Barclays
Bank
PLC.
Euro
Preference
Shares
140,000
Euro
4.75%
non-
cumulative
callable
preference
shares
of
€100
each
(the
4.75%
Preference
Shares)
were
issued
on
15
March
2005
for
a
consideration
of
€1,383.3m
(£966.7m
),
of
which
the
nominal
value
was
€14m
and
the
balance
was
share
premium.
The
4.75%
Preference
Shares
entitle
the
holders
thereof
to
receive
Euro
non
-
cumulative
cash
dividends
out
of
distributable
profits
of
Barclays
Bank
PLC,
annually
at
a
fixed
rate
of
4
.75%
per
annum
on
the
amount
of
€10,000
per
preference
share
until
15
March
2020,
and
thereafter
quarterly
at
a
rate
reset
quarterly
equal
to
0.71%
per
annum
above
the
Euro
interbank
offered
rate
for
three
-
month
Euro
deposits.
The
4.75%
Preference
Shares
are
redeemable
at
the
option
of
Barclays
Bank
PLC,
in
whole
but
not
in
part
only,
on
15
March
2020,
and
on
each
dividend
payment
date
thereafter
at
€10,000
per
share
plus
any
dividends
accrued
for
the
then
current
dividend
period
to
the
date
fixed
for
red
emption.
US
Dollar
Preference
Shares
100,000
US
Dollar
6.278%
non
-
cumulative
callable
preference
shares
of
$100
each
(the
6.278%
Preference
Shares),
represented
by
100,000
American
Depositary
Shares,
Series
1,
were
issued
on
8
June
2005
for
a
consideration
of
$995.4m
(£548.1m),
of
which
the
nominal
value
was
$10m
and
the
balance
was
share
premium.
The
6.278%
Preference
Shares
entitle
the
holders
thereof
to
receive
US
Dollar
non
-
cumulative
cash
dividends
out
of
distributable
profits
of
Barclays
Bank
PLC,
semi-annually
at
a
fixed
rate
of
6.278%
per
annum
on
the
amount
of
$10,000
per
preference
share
until
15
December
2034,
and
thereafter
quarterly
at
a
rate
reset
quarterly
equal
to
1.55%
per
annum
above
the
London
interbank
offered
rate
for
three
-
month
US
Dollar
deposits.
The
6.278%
Preference
Shares
are
redeemable
at
the
option
of
Barclays
Bank
PLC,
in
whole
but
not
in
part
only,
on
15
December
2034,
and
on
each
dividend
payment
date
thereafter
at
$10,000
per
share
plus
any
dividends
accrued
for
the
then
current
dividend
period
to
the
date
fixed
for
redemption.
106
million
US
Dollar
8.125%
non
-
cumulative
callable
preference
shares
of
$0.25
each
(the
8.125%
Preference
Shares),
represented
by
106
million
American
Depositary
Shares,
Series
5,
were
issued
on
11
April
2008
and
25
April
2008
for
a
total
consideration
of
$2,650m
(£1,345m),
of
which
the
nominal
value
was
$26.5m
and
the
balance
was
share
premium.
The
8.125%
Preference
Shares
entitle
the
holders
thereof
to
receive
US
Dollar
non
-
cumulative
c
ash
dividends
out
of
distributable
profits
of
Barclays
Bank
PLC,
quarterly
at
a
fixed
rate
of
8.125%
per
annum
on
the
amount
of
$25
per
preference
share.
The
8.125%
Preference
Shares
were
redeemed
in
full
on
December
15,
2018,
with
payment
being
made
on
M
onday,
December
17,
2018.
No
redemption
or
purchase
of
any
4.75%
Preference
Shares
and
the
6.278%
Preference
Shares
(together,
the
Preference
Shares)
may
be
made
by
Barclays
Bank
PLC
without
the
prior
approval
of
the
UK
PRA
and
any
such
redemption
will
be
subject
to
the
Companies
Act
2006
and
the
Articles
of
Barclays
Bank
PLC.
On
a
winding
-
up
of
Barclays
Bank
PLC
or
other
return
of
capital
(other
than
a
redemption
or
purchase
of
shares
of
Barclays
Bank
PLC,
or
a
reduction
of
share
capital),
a
holder
of
Pr
eference
Shares
will
rank
in
the
application
of
assets
of
Barclays
Bank
PLC
available
to
shareholders:
(1)
junior
to
the
holder
of
any
shares
of
Barclays
Bank
PLC
in
issue
ranking
in
priority
to
the
Preference
Shares;
(2)
equally
in
all
respects
with
holde
rs
of
other
preference
shares
and
any
other
shares
of
Barclays
Bank
PLC
in
issue
ranking
pari
passu
with
the
Preference
Shares;
and
(3)
in
priority
to
the
holders
of
ordinary
shares
and
any
other
shares
of
Barclays
Bank
PLC
in
issue
ranking
junior
to
the
P
reference
Shares.
The
holders
of
the
£13m
6%
Callable
Perpetual
Core
Tier
One
Notes
and
the
$179m
6.86%
Callable
Perpetual
Core
Tier
One
Notes
of
Barclays
Bank
PLC
(together,
the
TONs)
and
the
holders
of
the
£35m
5.3304%
Step-up
Callable
Perpetual
Reserve
Capital
Instruments,
the
£33m
6.3688%
Step-
up
Callable
Perpetual
Reserve
Capital
Instruments
and
the
£3,000m
14%
Step-up
Callable
Perpetual
Reserve
Capital
Instruments
of
Barclays
Bank
PLC
(together,
the
RCIs)
would,
for
the
purposes
only
of
calculating
the
amounts
payable
in
respect
of
such
securities
on
a
winding
-
up
of
Barclays
Notes
to
the
financial
statements
Capital
instruments,
equity
and
reserves
Barclays
Bank
PLC
2019
Annual
Report
on
Form
20-F
171
Bank
PLC,
subject
to
limited
exceptions
and
to
the
extent
that
the
TONs
and
the
RCIs
are
then
in
issue,
rank
pari
passu
with
the
holders
of
the
most
senior
class
or
classes
of
pre
ference
shares
then
in
issue
in
the
capital
of
Barclays
Bank
PLC.
Accordingly,
the
holders
of
the
preference
shares
would
rank
equally
with
the
holders
of
such
TONs
and
RCIs
on
such
a
winding
-
up
of
Barclays
Bank
PLC
(unless
one
or
more
classes
of
shares
of
Barclays
Bank
PLC
ranking
in
priority
to
the
preference
shares
are
in
issue
at
the
time
of
such
winding
-
up,
in
which
event
the
holders
of
such
TONs
and
RCIs
would
rank
equally
with
the
holders
of
such
shares
and
in
priority
to
the
holders
of
the
preferenc
e
shares).
Subject
to
such
ranking,
in
such
event,
holders
of
the
preference
shares
will
be
entitled
to
receive
out
of
assets
of
Barclays
Bank
PLC
available
for
distributions
to
shareholders,
liquidating
distributions
in
the
amount
of
€10,000
per
4.75%
Preference
Share
and
$10,000
per
6.278%
Preference
Share,
plus,
in
each
case,
an
amount
equal
to
the
accrued
dividend
for
the
then
current
dividend
period
to
the
date
of
the
commencement
of
the
winding
-
up
or
other
such
return
of
capital.
If
a
dividend
is
not
paid
in
full
on
any
preference
shares
on
any
dividend
payment
date,
then
a
dividend
restriction
shall
apply.
This
dividend
restriction
will
mean
that
neither
Barclays
Bank
PLC
nor
Barclays
PLC
may
(a)
declare
or
pay
a
dividend
(other
than
payment
by
Barclays
PLC
of
a
final
dividend
declared
by
its
shareholders
prior
to
the
relevant
dividend
payment
date,
or
a
div
idend
paid
by
Barclays
Bank
PLC
to
Barclays
PLC)
on
any
of
their
respective
ordinary
shares,
other
preference
shares
or
other
share
capital
or
(b)
redeem,
purchase,
reduce
or
otherwise
acquire
any
of
their
respective
share
capital,
other
than
shares
of
Bar
clays
Bank
PLC
held
by
Barclays
PLC
or
a
wholly
owned
subsidiary,
until
the
earlier
of:
(1)
the
date
on
which
Barclays
Bank
PLC
next
declares
and
pays
in
full
a
preference
dividend;
and
(2)
the
date
on
or
by
which
all
the
preference
shares
are
redeemed
in
full
or
purchased
by
Barclays
Bank
PLC.
Holders
of
the
preference
shares
are
not
entitled
to
receive
notice
of,
or
to
attend,
or
vote
at,
any
general
meeting
of
Barclays
Bank
PLC.
Barclays
Bank
PLC
is
not
permitted
to
create
a
class
of
shares
ranking
as
r
egards
participation
in
the
profits
or
assets
of
Barclays
Bank
PLC
in
priority
to
the
preference
shares,
save
with
the
sanction
of
a
special
resolution
of
a
separate
general
meeting
of
the
holders
of
the
preference
shares
(requiring
a
majority
of
not
less
than
three
-
fourths
of
the
holders
of
the
preference
shares
voting
at
the
separate
general
meeting)
or
with
the
consent
in
writing
of
the
holders
of
three
-
fourths
of
the
preference
shares.
Except
as
described
above,
the
holders
of
the
preference
shares
hav
e
no
right
to
participate
in
the
surplus
assets
of
Barclays
Bank
PLC.
Capital
Reorganisation
On
11
September
2018,
the
High
Court
of
Justice
in
England
and
Wales
confirmed
the
cancellation
of
the
share
premium
account
of
Barclays
Bank
PLC,
with
the
balanc
e
of
£
12,092
m
credited
to
retained
earnings.
Other
equity
instruments
Other
equity
instruments
of
£
8,323
m
(201
8
:
£
7
,595
m)
include
AT1
securities
that
are
issued
to
the
market
by
Barclays
PLC
.
Barclays
PLC
uses
funds
from
the
market
issuance
to
purchase
AT1
from
Barclays
Bank
Group
.
The
AT1
securities
are
perpetual
securities
with
no
fixed
maturity
and
are
structured
to
q
ualify
as
AT1
instruments
under
prevailing
capital
rules
applicable
as
at
the
relevant
issue
date.
In
201
9,
there
were
three
issuances
of
AT1
instruments,
in
the
form
of
Fixed
Rate
Resetting
Perpetual
Subordinated
Contingent
Convertible
Securities
(201
8
:
one
issuance)
totalling
£
2
,302
m
(201
8
:
£
1
,925
m
).
There
w
ere
also
two
redemption
s
in
201
9
(201
8
:
one
redemption)
totalling
£
1,574
m
(2018:
£1,242m)
.
AT1
equity
instruments
2019
2018
Initial
call
date
£m
£m
AT1
equity
instruments
-
Barclays
Bank
Group
6.625%
Perpetual
Subordinated
Contingent
Convertible
Securities
(USD
1,211m)
2019
-
715
6.5%
Perpetual
Subordinated
Contingent
Convertible
Securities
(EUR
1,077m)
2019
-
860
8.0%
Perpetual
Subordinated
Contingent
Convertible
Securities
(EUR
1,000m)
2020
836
836
7.875%
Perpetual
Subordinated
Contingent
Convertible
Securities
2022
1,000
1,000
7.875%
Perpetual
Subordinated
Contingent
Convertible
Securities
(USD
1,500m)
2022
1,136
1,136
7.25%
Perpetual
Subordinated
Contingent
Convertible
Securities
2023
500
500
7.75%
Perpetual
Subordinated
Contingent
Convertible
Securities
(USD
2,500m)
2023
1,925
1,925
5.875%
Perpetual
Subordinated
Contingent
Convertible
Securities
2024
623
623
8%
Perpetual
Subordinated
Contingent
Convertible
Securities
(USD
2,000m)
2024
1,509
-
7.125%
Perpetual
Subordinated
Contingent
Convertible
Securities
2025
299
-
6.375%
Perpetual
Subordinated
Contingent
Convertible
Securities
2025
495
-
Total
AT1
equity
instruments
8,323
7,595
28
Reserves
Currency
translation
reserve
The
currency
translation
reserve
represents
the
cumulative
gains
and
losses
on
the
retranslation
of
the
Barclays
Bank
Group
net
investment
in
foreign
operations,
net
of
the
effects
of
hedging.
Notes
to
the
financial
statements
Capital
instruments,
equity
and
reserves
Barclays
Bank
PLC
2019
Annual
Report
on
Form
20-F
172
Fair
value
through
other
comprehensive
income
reserve
The
fair
value
through
other
comprehensive
income
reserve
represent
s
the
changes
in
the
fair
value
of
fair
value
through
other
comprehensive
income
investments
since
initial
recognition.
Cash
flow
hedging
reserve
The
cash
flow
hedging
reserve
represents
the
cumulative
gains
and
losses
on
effective
cash
flow
hedging
instruments
that
will
be
recycled
to
the
income
statement
when
the
hedged
transactions
affect
profit
or
loss.
Own
credit
r
eserve
The
own
credit
reserve
reflects
the
cumulative
own
credit
gains
and
losses
on
financial
liabilities
at
fair
value.
Amounts
in
the
own
credit
reserve
are
not
recycled
to
profit
or
loss
in
future
periods.
Other
reserves
and
other
shareholders’
equity
Other
reserves
relate
to
redeemed
ordinary
and
preference
shares
issued
by
the
Barclays
Bank
Group.
Included
in
other
shareholders’
equity
are
capital
notes
which
bear
interest
at
rates
fixed
periodically
in
advance,
based
on
London
interbank
rates.
These
notes
are
repayable
at
the
option
of
the
Barclays
Bank
PLC
,
in
whole
on
any
interest
payment
date.
B
arclays
Bank
PLC
is
not
obliged
to
make
a
payment
of
interest
on
its
capital
notes
if,
in
the
preceding
six
months,
a
dividend
has
not
been
declared
or
paid
on
any
class
of
shares
of
Barclays
PLC
.
Barclays
Bank
Group
2019
2018
£m
£m
Currency
translation
reserve
3,383
3,927
Fair
value
through
other
comprehensive
income
reserve
(139)
(298)
Cash
flow
hedging
reserve
388
(123)
Own
credit
reserve
(373)
(121)
Other
reserves
and
other
shareholders'
equity
(24)
(24)
Total
3,235
3,361
29
Non
-controlling
interests
Profit
attributable
to
non-
controlling
interest
Equity
attributable
to
non-
controlling
interest
Dividends
paid
to
non-
controlling
interest
2019
2018
2019
2018
2019
2018
£m
£m
£m
£m
£m
£m
Other
non
-
controlling
interests
-
-
-
2
-
-
Notes
to
the
financial
statements
Employee
benefits
Barclays
Bank
PLC
2019
Annual
Report
on
Form
20-F
173
The
notes
included
in
this
section
focus
on
the
costs
and
commitments
associated
with
employing
our
staff.
30
Staff
costs
Accounting
for
staff
costs
The
Barclays
Bank
Group
applies
IAS
19
Employee
benefits
Short-
term
employee
benefits
provide
the
services
to
which
the
payments
relate.
Performance
costs
and
are
recognised
over
the
period
of
service
that
employees
are
required
to
work
to
qualify
for
the
payment
s.
Deferred
cash
and
share
awards
are
made
to
employees
to
incentivise
performance
over
the
period
employees
provide
services.
To
receive
payment
under
an
award,
employees
must
provide
service
over
the
vesting
period.
The
period
over
which
the
expense
for
deferred
cash
and
share
awards
is
recognised
is
based
upon
the
period
employees
consider
their
services
contribute
to
the
awards.
For
past
awards,
the
Barclays
Bank
Group
considers
that
it
is
appropriate
to
recognise
the
awards
over
the
period
from
the
date
of
grant
to
the
date
that
the
awards
vest.
In
r
elation
to
awards
granted
from
2017
,
the
Ba
rclays
Bank
Group,
taking
into
account
the
changing
employee
understanding
surrounding
those
awards,
considered
it
appropriate
for
expense
to
be
recognised
over
four
years
including
the
financial
year
prior
to
the
grant
date.
The
accounting
policies
for
share
-
based
payments,
and
pensions
and
other
post-
retirement
benefits
are
included
in
Note
31
and
Note
32
respectively.
2019
2018
2017
c
£m
£m
£m
Performance
costs
1,104
1,300
917
Salaries
a
2,373
2,269
2,229
Social
security
costs
269
263
272
Post
-retirement
benefits
b
184
302
208
Other
compensation
costs
237
246
119
Total
compensation
costs
4,167
4,380
3,745
Other
resourcing
costs
Outsourcing
211
287
472
Redundancy
and
restructuring
69
87
24
Temporary
staff
costs
48
54
100
Other
70
66
52
Total
other
resourcing
costs
398
494
648
Total
staff
costs
4,565
4,874
4,393
Notes
a
£
123m
(2018:
£
54m;
2017:
£238m)
of
Group
compensation
was
capitalised
as
internally
generated
software.
b
Post
-retirem
ent
benefits
charge
includes
£126m
(2018:
£
99m;
2017:
£1
10m)
in
respect
of
defin
ed
contribution
schemes
and
£57m
(2018:
£
203m;
2017:
£
97m)
in
respect
of
defined
benefit
schemes.
c
In
2017,
£472m
of
performance
costs
recharged
by
Barclays
Execution
Services
Limited
to
B
arclays
B
ank
PLC
has
been
included
in
Other
administration
and
general
expenses
within
Operating
expenses.
For
further
details
on
Operating
expenses
refer
to
Note
8.
31
Share
-based
payments
Accounting
for
share
-based
payments
The
Barclays
Group
applies
IFRS
2
Share
-
based
Payments
Employee
incentives
include
awards
in
the
form
of
shares
and
share
options,
as
well
as
offering
employees
the
opportunity
to
purchase
shares
on
favourable
terms.
The
cost
of
the
empl
oyee
services
received
in
respect
of
the
shares
or
share
options
granted
is
recognised
in
the
income
statement
over
the
period
that
employees
provide
services.
The
overall
cost
of
the
award
is
calculated
using
the
number
of
shares
and
options
expected
to
v
est
and
the
fair
value
of
the
shares
or
options
at
the
date
of
grant.
The
number
of
shares
and
options
expected
to
vest
takes
into
account
the
likelihood
that
performance
and
service
conditions
included
in
the
terms
of
the
awards
will
be
met.
Failure
to
meet
the
non
-
vesting
condition
is
treated
as
a
cancellation,
resulting
in
an
acceleration
of
recognition
of
the
cost
of
the
employee
services.
The
fair
value
of
shares
is
the
market
price
ruling
on
the
grant
date,
in
some
cases
adjusted
to
reflect
restrictions
on
transferability.
The
fair
value
of
options
granted
is
determined
using
option
pricing
models
to
estimate
the
numbers
of
shares
likely
to
vest.
These
take
into
account
the
exercise
price
of
the
option,
the
current
share
price,
the
risk-free
intere
st
rate,
the
expected
volatility
of
the
share
price
over
the
life
of
the
option
and
other
Notes
to
the
financial
statements
Employee
benefits
Barclays
Bank
PLC
2019
Annual
Report
on
Form
20-F
174
relevant
factors.
Market
conditions
that
must
be
met
in
order
for
the
award
to
vest
are
also
reflected
in
the
fair
value
of
the
award,
as
are
any
other
non
-
vesting
co
nditions
–
such
as
continuing
to
make
payments
into
a
share
-
based
savings
scheme.
The
charge
for
the
year
arising
from
share
based
payment
schemes
was
as
follows:
Charge
for
the
year
2019
2018
2017
£m
£m
£m
Share
Value
Plan
4
40
87
Deferred
Share
Value
Plan
240
195
65
Others
148
131
55
Total
equity
settled
392
366
207
Cash
settled
3
1
1
Total
share
based
payments
395
367
208
The
terms
of
the
main
current
plans
are
as
follows:
Share
Value
Plan
(SVP)
The
SVP
was
introduced
in
March
2010.
SVP
awards
have
been
granted
to
participants
in
the
form
of
a
conditional
right
to
receive
Barclays
PLC
shares
or
provisional
allocations
of
Barclays
PLC
shares
which
vest
or
are
considered
for
release
over
a
period
of
three,
five
or
seven
years.
Participants
do
not
pay
to
receive
an
award
or
to
receive
a
release
of
shares.
For
awards
granted
before
Dec
ember
2017
,
the
grantor
may
also
make
a
dividend
equivalent
payment
to
participants
on
release
of
a
SVP
award.
SVP
awar
ds
are
also
made
to
eligible
employees
for
recruitment
purposes.
All
awards
are
subject
to
potential
forfeiture
in
certain
leaver
scenarios.
Deferred
Share
Value
Plan
(DSVP)
The
DSVP
was
introduced
in
February
2017.
The
terms
of
the
DSVP
are
materially
the
same
as
the
terms
of
the
SVP
as
described
above,
save
that
Executive
Directors
are
not
eligible
to
participate
in
the
DSVP
and
the
DSVP
operates
ov
er
market
purchase
shares
only.
Other
schemes
In
addition
to
the
SVP
and
DSVP,
the
Barclays
Group
opera
tes
a
number
of
other
schemes
settled
in
Barclays
PLC
Shares
including
Sharesave
(both
UK
and
Ireland
),
Sharepurchase
(both
UK
and
overseas),
and
the
Barclays
Group
Long
Term
Incentive
Plan
.
A
delivery
of
upfront
shares
to
‘Material
Risk
Takers’
can
be
mad
e
as
a
Share
Incentive
Award
(Holding
Period)
.
Share
option
and
award
plans
The
weighted
average
fair
value
per
award
granted,
weighted
average
share
price
at
the
date
of
exercise/release
of
shares
during
the
year,
weighted
average
contractual
remaining
life
and
number
of
options
and
awards
outstanding
(including
those
exercisable)
at
the
balance
sheet
date
were
as
follows:
2019
2018
Weighted
average
fair
value
per
award
granted
in
year
Weighted
average
share
price
at
exercise/
release
during
year
Weighted
average
remaining
contractual
life
in
years
Number
of
options/
awards
outstanding
(000s)
Weighted
average
fair
value
per
award
granted
in
year
Weighted
average
share
price
at
exercise/
release
during
year
Weighted
average
remaining
contractual
life
in
years
Number
of
options/
awards
outstanding
(000s)
£
£
£
£
SVP
a,b
1.43
1.59
1
2,940
1.99
2.11
<1
58,370
DSVP
a,b
1.43
1.60
1
294,209
1.94
2.10
1
183,962
Others
a
0.40
-1.60
1.57
-1.70
0
-3
37,481
0.36
-
2.11
1.82
-
2.11
0
-
3
38,092
SVP
and
DSVP
are
nil
cost
awards
on
which
the
performance
conditions
are
substantially
completed
at
the
date
of
grant.
Consequently,
the
fair
value
of
these
awards
is
based
on
the
market
value
at
that
date.
Notes
to
the
financial
statements
Employee
benefits
Barclays
Bank
PLC
2019
Annual
Report
on
Form
20-F
175
Movements
in
options
and
awards
The
movement
in
the
number
of
options
and
awards
for
the
major
schemes
and
the
weighted
average
exercise
price
of
options
was:
SVP
a,b
DSVP
a,b
Others
a,c
Number
(000s)
Number
(000s)
Number
(000s)
Weighted
average
ex.
price
(£)
2019
2018
2019
2018
2019
2018
2019
2018
Outstanding
at
beginning
of
year/acquisition
date
58,370
167,476
183,962
115,929
38,092
129,307
1.39
1.39
Transfers
in
the
year
d
823
(2,450)
2,111
(2,547)
(3,042)
(90,609)
-
-
Granted
in
the
year
1,653
855
197,231
119,668
101,881
61,736
1.19
1.51
Exercised/released
in
the
year
(56,316)
(102,752)
(74,379)
(39,820)
(91,337)
(56,498)
1.21
1.50
Less:
forfeited
in
the
year
(1,590)
(4,759)
(14,716)
(9,268)
(7,081)
(5,844)
1.51
1.52
Less:
expired
in
the
year
-
-
-
-
(1,032)
-
2.00
1.72
Outstanding
at
end
of
year
2,940
58,370
294,209
183,962
37,481
38,092
1.27
1.39
Of
which
exercisable:
-
-
-
-
5,499
4,083
1.31
1.90
Notes
a
Options/award
granted
over
Barclays
PLC
shares.
b
Weighted
average
exercise
price
is
not
applicable
for
SVP
and
DSVP
awards
as
these
are
not
share
option
schemes.
c
The
number
of
awards
within
Others
at
the
end
of
the
year
principally
relates
to
Sharesave
(number
of
awards
exercisable
at
end
of
year
was
2,693,798).
The
weighted
average
exercise
price
relates
to
Shar
esave.
d
Awards
of
employees
transferred
between
Barclays
Bank
Group
and
the
rest
of
the
Group.
Awards
and
options
granted
to
employees
and
former
employees
of
Barclays
Bank
Group
under
the
Barclays
Group
share
plans
may
be
satisfied
using
new
issue
shares,
treasury
shares
and
market
purchase
shares
of
Barclays
PLC.
Awards
granted
to
employees
and
former
employees
of
Barclays
Bank
Group
under
DSVP
may
only
be
satisfied
using
market
purchase
shares
of
Barclays
PLC.
There
were
no
significant
modifications
to
the
share
based
payments
arrangements
in
201
9
and
201
8.
As
at
31
December
201
9
,
the
total
liability
arising
from
cash-
settled
share
based
payments
transactions
was
£
3m
(2018
:
£2m).
Notes
to
the
financial
statements
Employee
benefits
Barclays
Bank
PLC
2019
Annual
Report
on
Form
20-F
176
32
Pensions
and
post
-retirement
benefits
Accounting
for
pensions
and
post
-retirement
benefits
The
Barclays
Bank
Group
operates
a
number
of
pension
schemes
and
post-
employment
benefit
schemes.
Defined
contribution
schemes
Any
contributions
unpaid
at
the
balance
sheet
date
are
included
as
a
liability.
Defined
benefit
schemes
the
scheme
assets
after
applying
the
asset
ceiling
test.
Each
scheme’s
obligations
are
calculated
using
the
projected
unit
credit
me
thod.
Scheme
assets
are
stated
at
fair
value
as
at
the
period
end.
Changes
in
pension
scheme
liabilities
or
assets
(remeasurements)
that
do
not
arise
from
regular
pension
cost,
net
interest
on
net
defined
benefit
liabilities
or
assets,
past
service
costs,
settlements
or
contributions
to
the
scheme,
are
recognised
in
other
comprehensive
income.
Remeasurements
comprise
experience
adjustments
(differences
between
previous
actuarial
assumptions
and
what
has
actually
occurred),
the
effects
of
changes
in
actuari
al
assumptions,
return
on
scheme
assets
(excluding
amounts
included
in
the
interest
on
the
assets)
and
any
changes
in
the
effect
of
the
asset
ceiling
restriction
(excluding
amounts
included
in
the
interest
on
the
restriction).
Post
-
employment
benefit
schemes
statements
over
the
period
that
the
employees
provide
services
to
the
Barclays
Bank
Group
,
using
a
methodology
similar
to
that
for
defined
b
enefit
pension
schemes.
Pension
schemes
UK
Retirement
Fund
(UKRF)
The
UKRF
is
Barclays
Bank
Group’s
main
scheme,
representing
97%
of
Barclays
Bank
Group’s
total
retirement
benefit
obligations.
Barclays
Bank
PLC
is
the
principal
employer
of
the
UKRF.
The
UKRF
was
closed
to
new
entrants
on
1
October
2012,
and
comprises
10
sections,
the
two
most
significant
of
which
are:
◾
Afterwork,
which
comprises
a
contributory
cash
balance
defined
benefit
element,
and
a
voluntary
defined
contribution
element.
The
cash
balance
element
is
accrued
each
year
and
revalued
until
Normal
Retirement
Age
in
line
with
the
increase
in
Retail
Price
Index
(RPI)
(up
to
a
maximum
of
5%
p.a.).
An
increase
of
up
to
2%
a
year
may
also
be
added
at
Barclays’
discretion.
The
costs
of
ill-health
retirements
and
death
in
service
benefits
for
Afterwork
members
are
borne
by
the
UKRF.
The
main
risks
that
Barclays
runs
in
relation
to
Afterwork
are
limited
although
additional
contributions
are
required
if
pre
-
retirement
investment
returns
are
n
ot
sufficient
to
provide
for
the
benefits.
◾
The
1964
Pension
Scheme.
Most
employees
recruited
before
July
1997
built
up
benefits
in
this
non
-
contributory
defined
benefit
scheme
in
respect
of
service
up
to
31
March
2010.
Pensions
were
calculated
by
reference
to
service
and
pensionable
salary.
From
1
April
2010,
members
became
eligible
to
accrue
future
service
benefits
in
either
Afterwork
or
the
Pension
Investment
Plan
(PIP),
a
historic
defined
contribution
section
which
is
now
closed
to
future
contri
butions.
The
risks
that
Barclays
runs
in
relation
to
the
1964
section
are
typical
of
final
salary
pension
schemes,
principally
that
investment
returns
fall
short
of
expectations,
that
inflation
exceeds
expectations,
and
that
retirees
live
longer
than
expec
ted.
Barclays
Pension
Savings
Plan
(BPSP)
The
BPSP
is
a
defined
contribution
scheme
providing
benefits
for
all
new
UK
hires
from
1
October
2012,
BPSP
is
not
subject
to
the
same
investment
return,
inflation
or
life
expectancy
risks
for
Barclays
that
define
d
benefit
schemes
are.
Members’
benefits
reflect
contributions
paid
and
the
level
of
investment
returns
achieved.
Other
Apart
from
the
UKRF
and
the
BPSP,
Barclays
operates
a
number
of
smaller
pension
and
long
-
term
employee
benefits
and
post-
retirement
health
care
plans
globally,
the
largest
of
which
are
the
US
defined
benefit
schemes.
Many
of
the
schemes
are
funded,
with
assets
backing
the
obligations
held
in
separate
legal
vehicles
such
as
trusts.
Others
are
operated
on
an
unfunded
basis.
The
benefits
provided,
the
approach
to
funding,
and
the
legal
basis
of
the
schemes,
reflect
local
environments.
Governance
The
UKRF
operates
under
trust
law
and
is
managed
and
administered
on
behalf
of
the
members
in
accordance
with
the
terms
of
the
Trust
Deed
and
Rules
and
all
relevant
legislation.
The
Corporate
Trustee
is
Barclays
Pension
Funds
Trustees
Limited,
a
private
limited
company
and
a
wholly
owned
subsidiary
of
Barclays
Bank
PLC.
The
Trustee
is
the
legal
owner
of
the
assets
of
the
UKRF
which
are
held
separately
from
the
assets
of
Barclays
Bank
P
lc.
The
Trustee
Board
comprises
six
Management
Directors
selected
by
Barclays,
of
whom
three
are
independent
Directors
with
no
relationship
with
Barclays
(and
who
are
not
members
of
the
UKRF),
plus
three
Member
Nominated
Directors
selected
from
eligible
active
staff,
deferred
and
pensioner
members
who
apply
for
the
role.
The
BPSP
is
a
Group
Personal
Pension
arrangement
which
operates
as
a
collection
of
personal
pension
plans.
Each
personal
pension
plan
is
a
direct
contract
between
the
employee
and
the
BPSP
pro
vider
(Legal
&
General
Assurance
Society
Limited),
and
is
regulated
by
the
FCA.
Similar
principles
of
pension
governance
apply
to
Barclays
Bank
PLC’s
other
pension
schemes,
depending
on
local
legislation.
Notes
to
the
financial
statements
Employee
benefits
Barclays
Bank
PLC
2019
Annual
Report
on
Form
20-F
177
Amounts
recognised
The
following
tables
include
amounts
recognised
in
the
income
statement
and
an
analysis
of
benefit
obligations
and
scheme
assets
for
all
Barclays
Bank
Group
defined
benefit
schemes.
The
net
position
is
reconciled
to
the
assets
and
liabilities
recognised
on
the
balance
sheet.
The
tables
include
funded
and
unfunded
post-
retirement
benefits.
Income
statement
charge
2019
2018
£m
£m
Current
service
cost
58
64
Net
finance
cost
(48)
(24)
Past
service
cost
-
134
Other
movements
1
5
Total
11
179
The
Barclays
Bank
Group
is
the
principal
employer
of
the
UKRF
and
hence
Scheme
Assets
and
Defined
Benefit
Obligations
relating
to
the
UKRF
are
recognised
within
the
Barclays
Bank
Group.
Barclays
Bank
UK
Plc
and
Barclays
Execution
services
Limited
are
participa
ting
employers
in
the
UKRF
and
their
share
of
the
UKRF
service
cost
is
borne
by
them.
Of
the
£226
m
current
service
cost
in
the
table
on
the
next
page,
£90
m
rela
tes
to
Barclays
Bank
UK
Plc
and
£78
m
relates
to
Ba
rclays
Execution
services
Limited.
While
the
entire
current
service
cost
is
accounted
for
in
the
Barclays
Bank
Group
on
balance
sheet,
the
income
statement
charge
is
accounted
for
across
all
the
participating
employers.
Balance
sheet
reconciliation
2019
2018
Barclays
Bank
Group
Total
Of
which
relates
to
UKRF
Barclays
Bank
Group
Total
Of
which
relates
to
UKRF
£m
£m
£m
£m
Benefit
obligation
at
beginning
of
the
year
(28,237)
(27,301)
(30,243)
(29,160)
Current
service
cost
(226)
(210)
(240)
(226)
Interest
costs
on
scheme
liabilities
(747)
(718)
(705)
(677)
Past
service
cost
(134)
(140)
Remeasurement
(loss)/gain
-
financial
(3,087)
(2,964)
1,129
1,075
Remeasurement
(loss)/gain
-
demographic
223
214
(242)
(245)
Remeasurement
(loss)/gain
-
experience
277
266
(75)
(94)
Employee
contributions
(5)
(1)
(4)
(1)
Benefits
paid
1,459
1,410
2,205
2,167
Exchange
and
other
movements
45
72
Benefit
obligation
at
end
of
the
year
(30,298)
(29,304)
(28,237)
(27,301)
Fair
value
of
scheme
assets
at
beginning
of
the
year
29,722
29,036
30,922
30,112
Interest
income
on
scheme
assets
795
774
729
709
Employer
contribution
755
731
754
741
Settlements
(2)
(106)
-
Remeasurement
-
return
on
plan
assets
greater
than
discount
rate
2,312
2,230
(400)
(360)
Employee
contributions
5
1
4
1
Benefits
paid
(1,459)
(1,410)
(2,205)
(2,167)
Exchange
and
other
movements
(35)
24
Fair
value
of
scheme
assets
at
the
end
of
the
year
32,093
31,362
29,722
29,036
Net
surplus/(deficit)
1,795
2,058
1,485
1,735
Retirement
benefit
assets
2,108
2,058
1,768
1,735
Retirement
benefit
liabilities
(313)
(283)
-
Net
retirement
benefit
assets/(liabilities)
1,795
2,058
1,485
1,735
Included
within
the
Barclays
Bank
Group’s
benefit
obligation
was
£
760
m
(2018:
£757
m)
relating
to
overseas
pensions
and
£
166
m
(2018:
£172
m)
relating
to
other
post-
employment
benefits.
Notes
to
the
financial
statements
Employee
benefits
Barclays
Bank
PLC
2019
Annual
Report
on
Form
20-F
178
As
at
31
December
2019
,
the
UKRF’s
scheme
assets
were
in
surplus
versus
IAS
19
obligations
by
£2,
058m
(2018
:
£
1
,735
m).
The
movement
for
the
UKRF
was
driven
by
higher
than
assumed
asset
returns,
payment
of
deficit
reduction
contributions,
updated
mortality
assumptions,
and
lower
than
expected
inflation,
partially
offset
by
a
decrease
in
the
discount
rate
.
The
weighted
average
duration
of
the
benefit
payments
reflected
in
the
defined
benefit
obligation
for
the
UKRF
is
17
years.
The
UKRF
expected
benefits
are
projected
to
be
paid
out
for
in
excess
of
50
years,
although
25%
of
the
total
benefits
are
expected
to
be
paid
in
the
next
10
years;
30%
in
years
11
to
20
and
25%
in
years
20
to
30.
The
remainder
of
the
benefits
are
expected
to
be
paid
beyond
30
years.
Of
the
£1,410
m
(2018:
£2,16
7m)
UKRF
bene
fits
paid
out,
£580
m
(2018:
£1,420
m)
related
to
transfers
out
of
the
fund.
Where
a
scheme’s
assets
exceed
its
obligation,
an
asset
is
recognised
to
the
extent
that
it
does
not
exceed
the
present
value
of
future
contribution
holidays
or
refunds
of
contribu
tions
(the
asset
ceiling).
In
the
case
of
the
UKRF
the
asset
ceiling
is
not
applied
as,
in
certain
specified
circumstances
such
as
wind
-
up,
the
Barclays
Bank
Group
expects
to
be
able
to
recover
any
surplus.
Similarly,
a
liability
in
respect
of
future
minimum
funding
requirements
is
not
recognised.
The
Trustee
does
not
have
a
substantive
right
to
augment
benefits,
nor
do
they
have
the
right
to
wind
up
the
plan
except
in
the
dissolution
of
the
Barclays
Bank
Group
or
termination
of
contributions
by
the
Barclays
Bank
Grou
p.
The
application
of
the
asset
ceiling
to
other
plans
and
recognition
of
additional
liabilities
in
respect
of
future
minimum
funding
requirements
are
considered
on
an
individual
plan
basis.
Critical
accounting
estimates
and
judgements
Actuarial
valuation
of
the
schemes’
obligation
is
dependent
upon
a
series
of
assumptions.
Below
is
a
summary
of
the
main
financial
and
demographic
assumptions
adopted
for
the
UKRF.
Key
UKRF
financial
assumptions
2019
2018
%
p.a.
%
p.a.
Discount
rate
1.92
2.71
Inflation
rate
(RPI)
3.02
3.25
The
UKRF
discount
rate
assumption
for
2019
was
based
on
a
variant
of
the
standard
Willis
Towers
Watson
RATE
Link
model.
This
variant
includes
all
bonds
rated
AA
by
at
least
one
of
the
four
major
ratings
agencies,
and
assumes
that
forward
rates
after
year
3
0
are
flat.
The
RPI
inflation
assumption
for
2019
was
set
by
reference
to
the
Bank
of
England’s
implied
inflation
curve,
assuming
the
forward
rates
remain
flat
after
30
years.
The
inflation
assumption
incorporates
a
deduction
of
20
basis
points
as
an
allow
ance
for
an
inflation
risk
premium.
The
methodology
used
to
derive
the
discount
rate
and
price
inflation
assumptions
is
consistent
with
that
used
at
the
prior
year
end,
except
for
a
switch
to
holding
forward
rates
rather
spot
rates
flat
after
year
30.
The
UKRF’s
post-
retirement
mortality
assumptions
are
based
on
a
best
estimate
assumption
derived
from
an
analysis
in
2019
of
the
UKRF’s
own
post-
retirement
mortality
experience,
and
taking
account
of
recent
evidence
from
published
mortality
surveys.
An
allowa
nce
has
been
made
for
future
mortality
improvements
based
on
the
2018
core
projection
model
published
by
the
Continuous
Mortality
Investigation
Bureau
subject
to
a
long
-
term
trend
of
1.5%
per
annum
in
future
improvements.
The
methodology
used
is
consistent
with
the
prior
year
end,
except
that
the
2017
core
projection
model
was
used
at
2018,
and
a
long
-
trend
of
1.25%
p
er
annum
was
applied.
The
table
below
shows
how
the
assumed
life
expectancy
at
60,
for
members
of
the
UKRF,
has
varied
over
the
past
three
yea
rs:
Assumed
life
expectancy
2019
2018
2017
Life
expectancy
at
60
for
current
pensioners
(years)
–
Males
27.1
27.7
27.8
–
Females
29.3
29.4
29.4
Life
expectancy
at
60
for
future
pensioners
currently
aged
40
(years)
–
Males
28.9
29.2
29.3
–
Females
31.1
31.0
31.0
The
assumption
for
future
transfers
out
has
been
removed,
to
reflect
lower
volumes
experienced
in
2019
and
immaterial
volumes
expected
going
forwards.
The
previous
assumption
was
that
5%
of
the
benefit
obligation
in
respect
of
deferred
members
will
transfer
out
during
2020,
2.5%
in
2021,
tapering
down
to
0%
from
2022
onwards.
Sensitivity
analysis
on
actuarial
assumptions
The
sensitivity
analysis
has
been
calculated
by
valuing
the
UKRF
liabilities
using
the
amended
assumptions
shown
in
the
table
below
and
keeping
the
remaining
assumptions
the
same
as
disclosed
in
the
table
above,
except
in
the
case
of
the
inflation
sensitivity
where
other
assumptions
that
depend
on
assumed
inflation
have
also
been
amended
correspondingly.
The
difference
between
the
recalculated
liability
figure
and
that
stated
in
the
balance
sheet
reconciliation
table
above
is
the
figure
shown.
The
selection
of
these
movements
to
illustrate
the
sensitivity
of
the
defined
benefit
obligation
to
key
assumptions
shou
ld
not
be
interpreted
as
Barclays
expressing
any
specific
view
of
the
probability
of
such
movements
happening.
Notes
to
the
financial
statements
Employee
benefits
Barclays
Bank
PLC
2019
Annual
Report
on
Form
20-F
179
Change
in
key
assumptions
2019
2018
(Decrease)/Incre
ase
in
UKRF
defined
benefit
obligation
(Decrease)/Increa
se
in
UKRF
defined
benefit
obligation
£bn
£bn
Discount
rate
0.50%
p.a.
increase
(2.3)
(2.1)
0.25%
p.a.
increase
(1.2)
(1.1)
0.25%
p.a.
decrease
1.2
1.1
0.50%
p.a.
decrease
2.6
2.4
Assumed
RPI
0.50%
p.a.
increase
1.5
1.3
0.25%
p.a.
increase
0.8
0.7
0.25%
p.a.
decrease
(0.7)
(0.6)
0.50%
p.a.
decrease
(1.4)
(1.3)
Life
expectancy
at
60
One
year
increase
1
0.9
One
year
decrease
(1)
(0.9)
Assets
A
long
-
term
investment
strategy
has
been
set
for
the
UKRF,
with
its
asset
allocation
comprising
a
mixture
of
equities,
bonds,
property
and
other
appropriate
assets.
This
recognises
that
different
asset
classes
are
likely
to
produce
different
long
-
term
retu
rns
and
some
asset
classes
may
be
more
volatile
than
others.
The
long
-
term
investment
strategy
ensures,
among
other
aims,
that
investments
are
adequately
diversified.
The
UKRF
also
employs
derivative
instruments,
where
appropriate,
to
achieve
a
desired
exposure
or
return,
or
to
match
assets
more
closely
to
liabilities.
The
value
of
assets
shown
reflects
the
assets
held
by
the
scheme,
with
any
derivative
holdings
reflected
on
a
fair
value
basis.
The
value
of
the
assets
of
the
schemes
and
their
percentage
in
relation
to
total
scheme
assets
were
as
follows:
Analysis
of
scheme
assets
Barclays
Bank
Group
Total
Of
which
relates
to
UKRF
Value
%
of
total
fair
value
of
scheme
assets
Value
%
of
total
fair
value
of
scheme
assets
£m
%
£m
%
As
at
31
December
2019
Equities
2,349
7.3
2,174
6.9
Private
equities
2,083
6.5
2,083
6.6
Bonds
-
fixed
government
3,447
10.7
3,175
10.1
Bonds
-
index
-
linked
government
11,036
34.4
11,027
35.2
Bonds
-
corporate
and
other
9,234
28.8
9,042
28.8
Property
1,644
5.1
1,633
5.2
Infrastructure
1,558
4.9
1,558
5.0
Cash
and
liquid
assets
742
2.3
670
2.2
Fair
value
of
scheme
assets
32,093
100.0
31,362
100.0
As
at
31
December
2018
Equities
3,349
11.3
3,211
11.1
Private
equities
1,995
6.7
1,995
6.9
Bonds
-
fixed
government
3,320
11.2
3,062
10.5
Bonds
-
index
-
linked
government
10,945
36.8
10,936
37.7
Bonds
-
corporate
and
other
6,371
21.4
6,197
21.3
Property
1,712
5.8
1,702
5.9
Infrastructure
1,196
4.0
1,196
4.1
Cash
and
liquid
assets
834
2.8
737
2.5
Fair
value
of
scheme
assets
29,722
100.0
29,036
100.0
Notes
to
the
financial
statements
Employee
benefits
Barclays
Bank
PLC
2019
Annual
Report
on
Form
20-F
180
Included
within
the
fair
value
of
scheme
assets
were
nil
(2018
:
nil)
relating
to
shares
in
Barclays
PLC
and
nil
(2018:
nil)
relating
to
bonds
issued
by
Barclays
PLC.
The
UKRF
also
invests
in
pooled
investment
vehicles
which
may
hold
shares
or
debt
issued
by
Barclays
PLC.
The
UKRF
assets
above
do
not
include
the
Senior
Notes
asset
referred
to
in
the
section
below
on
Triennial
Valuation,
as
these
are
non
-
transferable
instrument
s
and
not
recognised
under
IAS19.
Approximately
44
%
of
the
UKRF
assets
are
invested
in
liability-driven
investment
strategies;
primarily
UK
gilts
as
well
as
interest
rate
and
inflation
swaps.
These
are
used
to
better
match
the
assets
to
its
liabilities.
Th
e
swaps
are
used
to
reduce
the
scheme’s
inflation
and
duration
risks
against
its
liabilities.
Triennial
Valuation
The
latest
triennial
actuarial
valuation
of
the
UKRF
with
an
effective
date
of
30
September
2019
has
been
completed.
This
valuation
showed
a
funding
deficit
of
£2.3bn
and
a
funding
level
of
94%,
compared
to
a
£4.0bn
funding
deficit
in
the
30
September
2018
update,
and
a
£7.9bn
funding
deficit
in
the
previous
triennial
valuation
(effective
date
30
September
2016).
The
decrease
in
funding
deficit
over
the
year
to
30
September
2019
was
mainly
driven
by
the
payment
of
deficit
reduction
contributions
and
changes
to
mortality
assumptions.
The
Bank
and
UKRF
Trustee
have
agreed
a
revised
statement
of
funding
principles,
schedule
of
contributions,
and
recovery
plan
to
seek
to
eliminate
the
funding
deficit.
The
main
differences
between
the
funding
and
accounting
assumptions
are
a
different
approach
to
setting
the
discount
rate
and
a
more
conservative
longevity
assumption
for
funding.
The
deficit
reduc
tion
contributions
agreed
with
the
UKRF
Trustee
as
part
of
the
30
September
2019
triennial
valuation
recovery
plan
are
show
n
alongside
the
deficit
reduction
contributions
agreed
in
2017
for
the
prior
30
September
2016
triennial
valuation.
Deficit
reduction
contributions
under
the
Deficit
reduction
contributions
under
the
30
September
2016
valuation
30
September
2019
valuation
Year
£m
£m
Cash
paid:
2019
-
paid
in
two
installments
of
£250m
in
April
and
September
500
-
2019
-
paid
in
December
-
500
Future
commitments:
2020
500
500
2021
1,000
700
2022
1,000
294
2023
1,000
286
2024
-
2026
1,000
each
year
-
As
part
of
the
triennial
actuarial
valuation,
Barclays
Bank
PLC
agreed
to
pay
a
£500
m
contribution
on
11
December
2019
and
at
the
same
time
the
UKRF
subscribed
for
non
-
transferrable
listed
senior
fixed
rate
notes
for
£500m,
backed
by
UK
gilts
(the
Senior
Notes).
The
Senior
Notes
were
issued
by
Heron
Issuer
Limited
(Heron),
an
entity
that
is
consolidated
within
the
Barclays
Group
under
IFRS10.
The
Senior
Notes
entitle
the
UKRF
to
semi-
annual
coupon
payments
for
five
years,
and
full
repayment
of
the
subscription
in
cash
at
maturity
in
2024.
Heron
acquired
the
gilts
from
BBPLC
for
cash
of
£60
0m
to
support
these
payments.
BBPLC
also
subscrib
ed
for
Junior
notes
issued
by
Heron
for
£100m.
The
contribution
forms
part
of
the
recovery
plan
agreed
as
part
of
the
2019
valuation
of
the
UKRF.
No
liability
is
rec
o
gnised
under
IAS19
for
the
obligation
to
make
deficit
reduction
contributions,
for
the
obligation
of
Heron
to
repay
the
Senior
Notes,
or
for
the
cash
received
by
BBPLC
from
Heron
for
the
transfer
of
the
gilts,
as
settlement
in
2024
gives
rise
to
both
a
reduction
in
cash
and
a
corresponding
increa
se
in
net
defined
benefit
assets.
The
deficit
reduction
contributions
are
in
addition
to
the
regular
contributions
to
meet
the
Barclays
Bank
Group’s
share
of
the
cost
of
benefits
accruing
over
each
year.
The
next
funding
valuation
of
the
UKRF
is
due
to
be
completed
in
202
3
with
an
effective
date
of
30
September
20
22
.
Other
support
measures
agreed
which
remain
in
place
Collateral
–
The
UKRF
Trustee
and
Barclays
Bank
PLC
have
entered
into
an
arrangement
whereby
a
collateral
pool
has
been
put
in
place
to
provide
security
for
the
UKRF
funding
deficit
as
it
increases
or
decreases
over
time.
The
collateral
pool
is
currently
made
up
of
government
securities,
and
agreement
was
made
with
the
Trustee
to
cover
100%
of
the
funding
deficit
with
an
overall
cap
of
£9b
n.
The
arrangement
provides
the
UKRF
Trustee
with
dedicated
access
to
the
pool
of
assets
in
the
event
of
Barclays
Bank
PLC
not
paying
a
deficit
reduction
contribution
to
the
UKRF
or
in
the
event
of
B
arclays
Bank
PLC’s
insolvency.
These
assets
are
included
within
Note
37
Assets
pledged,
collateral
received
and
assets
transferred.
Support
from
Barclays
PLC
–
In
the
event
of
Barclays
Bank
PLC
not
paying
a
deficit
reduction
contribution
payment
required
by
a
specified
pre-
payment
date,
Barclays
PLC
has
entered
into
an
arrangement
whereby
it
will
be
required
to
use,
in
first
priority,
dividends
received
from
Barclays
Bank
UK
PLC
(if
any)
to
invest
the
proceeds
in
Barclays
Bank
PLC
(up
to
the
maximum
amount
of
the
deficit
reduction
contribution
unpaid
by
Barclays
Bank
PLC).
The
proceeds
of
the
investment
will
be
used
to
discharge
Barclays
Bank
PLC’s
unpaid
deficit
reduction
contribution.
Notes
to
the
financial
statements
Employee
benefits
Barclays
Bank
PLC
2019
Annual
Report
on
Form
20-F
181
Participation
–
As
permitted
under
the
Financial
Services
and
Markets
Act
2000
(Banking
Reform)
(Pensions)
Regulations
2015,
Barclays
Bank
UK
PLC
is
a
participating
employer
in
the
UKRF
and
will
remain
so
during
a
transitional
phase
until
September
2025
as
set
out
in
a
deed
of
participation.
Barclays
Bank
UK
PLC
will
make
contributions
for
the
future
service
of
its
employees
who
are
currently
Afterwork
members
and,
in
the
event
of
Barclays
Bank
PLC’s
insolvency
during
this
period
provision
has
been
made
to
require
Barclays
Bank
UK
PLC
to
become
the
principal
employer
of
the
UKRF.
Barclays
Bank
PLC’s
Section
75
debt
would
be
trigg
ered
by
the
insolvency
(the
debt
would
be
calculated
after
allowing
for
the
payment
to
the
UKRF
of
the
collateral
above)
.
Defined
benefit
c
ontributions
paid
with
respect
to
the
UKRF
were
as
follows:
Contributions
paid
£m
2019
1,231
2018
741
2017
1,124
There
were
nil
(2018:
nil;
2017:
£153
m)
Section
75
contributions
included
within
the
Barclays
Bank
Group’s
contributions
paid
as
no
participating
employ
ers
left
the
UKRF
scheme
in
2019
.
The
Barclays
Bank
Group’s
expected
contribution
to
the
UKRF
in
respect
of
defined
benefits
in
2020
is
£
560m
(2019
:
£
562
m).
In
addition,
the
expected
contributions
to
UK
defined
con
tribution
schemes
in
2020
is
£7
m
(2019:
£7m)
to
the
UKRF
and
£41m
(2019:
£37
m)
to
the
BPSP.
Notes
to
the
financial
statements
Scope
of
consolidation
Barclays
Bank
PLC
2019
Annual
Report
on
Form
20-F
182
The
section
presents
information
on
the
Barclays
Bank
Group
’s
investments
in
subsidiaries,
joint
ventures
and
associates
and
its
interests
in
structured
entities.
Detail
is
also
given
on
securitisation
transactions
the
Barclays
Bank
Group
has
entered
into
and
arrangements
that
are
held
off-
balance
sheet.
33
Principal
subsidiaries
Barclays
Bank
Group
applies
IFRS
10
Consolidated
Financial
Statements
.
The
consolidated
financial
statements
combine
the
financial
statements
of
Barclays
Bank
PLC
and
all
of
its
subsidiaries.
Subsidiaries
are
entities
over
which
Barclays
Bank
Group
has
con
trol.
Under
IFRS
10,
this
is
when
Barclays
Bank
Group
is
exposed
or
has
rights
to
variable
returns
from
its
involvement
in
the
entity
and
has
the
ability
to
affect
those
returns
through
its
power
over
the
entity.
Barclays
Bank
Group
reassesses
whether
it
controls
an
entity
if
facts
and
circumstances
indicate
that
there
have
been
changes
to
its
power,
its
rights
to
variable
returns
or
its
ability
to
use
its
power
to
affect
the
amount
of
its
returns.
Intra
-
group
transactions
and
balances
are
eliminated
on
consolidation
and
consistent
accounting
policies
are
used
throughout
the
Barclays
Bank
Group
for
the
purposes
of
the
consolidation.
Changes
in
ownership
interests
in
subsidiaries
are
accounted
for
as
equity
transactions
if
they
occur
after
control
has
been
obtained
and
they
do
not
result
in
loss
of
control.
The
significant
judgements
used
in
applying
this
policy
are
set
out
below.
Accounting
for
investment
in
subsidiaries
In
the
individual
financial
statements
of
Barclays
Bank
PLC,
investments
in
subsidiaries
are
stated
at
cost
less
impairment.
Investment
s
in
subsidiaries,
the
majority
of
which
are
engaged
in
banking
related
activities,
are
recorded
on
the
balance
sheet
at
historical
cost
less
any
impairment.
At
31
December
201
9
the
historical
cost
of
inve
stments
in
subsidiaries
was
£16,606m
(2018:
£15,452
m),
and
impairment
allowances
recognised
against
these
inve
stments
totalled
£501m
(2018:
£494m).
The
increase
in
historical
cost
is
predominantly
due
to
capital
injections
into
Barclays
Bank
Ireland
PLC,
partially
offset
by
intra
-
group
transfers.
At
the
end
of
each
reporting
period
an
impairment
review
is
undertaken
in
respect
of
investment
in
subsidiaries.
Impairment
is
required
where
the
investment
exceeds
the
recoverable
amou
nt.
The
recoverable
amount
is
calculated
using
a
value
in
use
(VIU)
methodology
to
arrive
at
the
present
value
of
future
cash
flows
expected
to
be
derived
from
the
investment.
The
VIU
calculation
uses
forecast
attributable
profit,
based
on
financial
budget
s
approved
by
management,
covering
a
five-
year
period,
as
an
approximation
of
future
cash
flows.
Terminal
growth
rates
ranging
from
0.5%
to
1.5%
have
been
applied
to
arrive
at
cash
flows
thereafter,
which
are
based
on
long
term
expected
growth
rates
publis
hed
by
the
International
Monetary
Fund.
The
forecasted
cash
flows
have
been
discounted
at
pre
-
tax
rate
s
ranging
from
13.7%
to
15.3%
.
There
has
been
no
material
change
to
the
carrying
value
of
investments
in
subsidiaries
as
a
result
of
the
impairment
review
.
Principal
subsidiaries
for
the
Barclays
Bank
Group
are
set
out
below.
This
includes
those
subsidiaries
that
are
most
significant
in
the
context
of
the
Barclays
Bank
Group’s
business,
results
or
financial
position.
Principal
place
of
business
or
incorporation
Percentage
of
voting
rights
held
Non
-controlling
interests
-
proportion
of
ownership
interests
Non
-controlling
interests
-
proportion
of
voting
interests
Company
Name
Nature
of
business
%
%
%
Barclays
Bank
Ireland
PLC
Ireland
Banking,
holding
company
100
-
-
Barclays
Capital
Inc.
United
States
Securities
dealing
100
-
-
Barclays
Capital
Securities
Limited
United
Kingdom
Securities
dealing
100
-
-
Barclays
Securities
Japan
Limited
Japan
Securities
dealing
100
-
-
Barclays
US
LLC
United
States
Holding
company
100
-
-
Barclays
Bank
Delaware
United
States
Credit
card
issuer
100
-
-
The
country
of
registration
or
incorporation
is
also
the
principal
area
of
operation
of
each
of
the
above
subsidiaries.
Ownership
interests
are
in
some
cases
different
to
voting
interests
due
to
the
existence
of
non
-
voting
equity
interests,
such
as
preference
shares.
See
Note
29
for
more
information.
Significant
judgements
and
assumptions
used
to
determine
the
scope
of
the
consolidation
Determining
whether
the
Barclays
Bank
Group
has
control
of
an
entity
is
generally
straightforward
based
on
ownership
of
the
majority
of
the
voting
capital.
However,
in
certain
instances,
this
determination
will
involve
significant
judgement,
particularly
in
the
case
of
structured
entities
where
voting
rights
are
often
not
the
determining
factor
in
decisions
over
the
relevant
activities.
This
judgement
will
involve
assessing
the
purpose
and
design
of
the
entity.
It
will
also
often
be
necessary
to
consider
whether
the
B
arclays
Bank
Group,
or
another
involved
party
with
power
over
the
relevant
activities,
is
acting
as
a
principal
in
its
own
right
or
as
an
agent
on
behalf
of
others.
Notes
to
the
financial
statements
Scope
of
consolidation
Barclays
Bank
PLC
2019
Annual
Report
on
Form
20-F
183
There
is
also
often
considerable
judgement
involved
in
the
ongoing
assessment
of
control
over
structured
entities.
In
this
regard,
where
market
conditions
have
deteriorated
such
that
the
other
investors’
exposures
to
the
structure’s
variable
returns
have
been
substantively
eliminated,
the
Barclays
Bank
Group
may
conclude
that
the
managers
of
the
structured
entity
are
acting
as
its
agent
and
therefore
will
consolidate
the
structured
entity.
An
interest
in
equity
voting
rights
exceeding
50%
would
typically
indicate
that
the
Barclays
Bank
Group
has
control
of
an
entity.
However,
the
entity
set
out
below
is
excluded
from
consolidation
because
the
Barclays
Bank
Group
does
not
have
exposure
to
its
variable
returns.
Country
of
registration
or
incorporation
Company
name
Percentage
of
voting
rights
held
(%)
Equity
shareholders'
funds
(£m)
Retained
profit
for
the
year
(£m)
Cayman
Islands
Palomino
Limited
100
-
-
This
entity
is
managed
by
an
external
counterparty
and
consequently
is
not
controlled
by
the
Barclays
Bank
Group.
Interests
relating
to
this
entity
are
included
in
Note
34.
Significant
restrictions
As
is
typical
for
a
g
roup
of
its
size
and
international
scope,
there
are
restrictions
on
the
ability
of
the
Barclays
Bank
Group
to
obtain
distributions
of
capital,
access
the
assets
or
repay
the
liabilities
of
members
of
its
Group
due
to
the
statutory,
regulatory
and
contractual
requirements
of
its
subsidiaries
and
due
to
the
protective
rights
of
non
-
controlling
interests.
These
are
considered
below.
Regulatory
requirements
The
Barclays
Bank
Group’s
principal
subsidiary
companies
have
assets
and
liabilities
before
intercompany
eliminations
of
£307bn
(2018:
£265bn)
and
£285bn
(2018
:
£2
46bn)
respectively.
The
assets
and
liabilities
are
subject
to
prudential
regulation
and
regulatory
capital
requirements
in
the
countries
in
which
they
are
regulat
ed.
These
require
entities
to
maintain
minimum
capital
levels
which
cannot
be
returned
to
the
p
arent
company,
Barclays
Bank
PLC
on
a
going
concern
basis.
In
order
to
meet
capital
requirements,
subsidiaries
may
issue
certain
equity
accounted
and
debt
accounted
financial
instruments
such
as
Tier
1
and
Tier
2
capital
instruments
and
other
forms
of
subordinated
liabilities.
Refer
to
Note
26
and
Note
27
for
particulars
of
these
instruments.
These
instruments
may
be
subject
to
cancellation
clauses
or
preference
share
restrictions
that
would
limit
the
ability
of
the
entity
to
repatriate
the
capital
on
a
timely
basis.
Liquidity
requirements
Regulated
subsidiaries
of
the
Barclays
Bank
Group
are
required
to
meet
PRA
or
local
regulatory
requirements
pertaining
to
liquidity.
Some
of
the
regulated
subsidiaries
include
Barclays
Capital
Securities
Limited
(which
is
regulated
on
a
combined
basis
with
Barclays
Bank
PLC
under
a
Domestic
Liquidity
Sub
-
Group
(DoLSub)
arrangement
)
,
Barclays
Bank
Ireland
PLC,
Barclays
Capital
Inc.
and
Barc
lays
Bank
Delaware.
See
pages
72
to
76
for
further
details
of
liquidity
requirements,
including
those
of
the
Barclays
Ba
nk
Group’s
significant
subsidiaries.
Statutory
requirements
The
Barclays
Bank
Group’s
subsidiaries
are
subject
to
statutory
requirements
not
to
make
distributions
of
capital
and
unrealised
profits
and
generally
to
maintain
solvency.
These
requirements
restrict
the
ability
of
subsidiaries
to
make
remittances
of
dividends
to
Barclays
Bank
PLC,
the
parent,
except
in
the
event
of
a
legal
capital
reduction
or
liquidation.
In
most
cases
the
regulatory
restrictions
referred
to
above
exceed
the
statutory
restrictions.
Contractual
requirements
Asset
encumbrance
The
Barclays
Bank
Group
uses
its
financial
assets
to
raise
finance
in
the
form
of
securitisations
and
through
the
liquidity
schemes
of
central
banks
,
as
well
as
to
provide
security
for
the
UK
Retirement
Fund
.
Once
encumbered,
the
assets
are
not
available
for
transfer
around
the
Barclays
Bank
Group.
The
assets
typically
affected
are
disclosed
in
Note
37.
Other
restrictions
The
Barclays
Bank
Group
is
required
to
maintain
balances
with
central
banks
and
other
regulatory
authorit
ies
and
these
amounted
to
£4,505m
(2018:
£4,717
m).
34
Structured
entities
A
structured
entity
is
an
entity
in
which
voting
or
similar
rights
are
not
the
dominant
factor
in
deciding
control.
Structured
entities
are
generally
created
to
achieve
a
narrow
and
well-defined
objective
with
restrictions
around
their
ongoing
activities.
Depending
on
the
Barclays
Bank
Group’s
power
over
the
activities
of
the
entity
and
its
exposure
to
and
ability
to
influence
its
own
returns,
it
may
consolidate
the
entity.
In
other
cases,
it
may
sponsor
or
have
exposure
to
such
an
entity
but
not
consolida
te
it.
Consolidated
structured
entities
The
Barclays
Bank
Group
has
contractual
arrangements
which
may
require
it
to
provide
financial
support
to
the
following
types
of
consolidated
structured
entities:
Notes
to
the
financial
statements
Scope
of
consolidation
Barclays
Bank
PLC
2019
Annual
Report
on
Form
20-F
184
Securitisation
vehicles
The
Barclays
Bank
Group
uses
securitisation
as
a
source
of
financing
and
a
means
of
risk
transfer.
Refer
to
Note
36
for
further
detail.
Commercial
paper
(CP)
and
medium
-
term
note
conduits
The
Barclays
Bank
Group
provided
£8.3
bn
(2018:
£1
1.7
bn)
in
undrawn
contractual
backstop
liquidity
facilities
to
CP
conduits.
Fund
management
entities
In
previous
periods,
Barclays
Bank
Group
had
contractually
guaranteed
the
performance
of
certain
cash
investments
in
a
number
of
managed
investment
funds
which
resulted
in
their
consolidation.
As
at
31
December
2019,
the
notional
value
of
the
guarantees
were
£
nil
(2018:
£nil)
as
the
European
Wealth
Funds
associated
with
these
guarantees
were
either
closed
or
ownership
has
been
transferred
outside
the
Barclays
Bank
Group
and
they
are
no
longer
conso
lidated.
Employee
benefit
and
other
trusts
The
Barclays
Bank
Group
provides
capital
contributions
to
employee
benefit
trusts
to
enable
them
to
meet
obligations
to
employees
in
relation
to
share
-
based
remuneration
arrangements.
During
2019,
the
Barclays
Bank
Group
provided
undrawn
liquidity
facilities
of
£2.5
bn
(2018:
£2
.6
bn)
to
certain
trusts.
Unconsolidated
structured
entities
in
which
the
Barclays
Bank
Group
has
an
interest
An
interest
in
a
structured
entity
is
any
form
of
contractual
or
non
-
contractual
involvement
which
creates
variability
in
returns
arising
from
the
performance
of
the
entity
for
the
Barclays
Bank
Group.
Such
interests
include
holdings
of
debt
or
equity
securities,
derivatives
that
transfer
financial
risks
from
the
entity
to
the
Barclays
Bank
Group,
lending,
loan
commitments,
financial
guarantees
and
investment
management
agreements.
Interest
rate
swaps,
foreign
exchange
derivatives
that
are
not
complex
and
which
expose
the
Barclays
Bank
Group
to
insignificant
credit
risk
by
being
senior
in
the
payment
waterfall
of
a
securitisation
and
derivatives
that
are
determined
to
introduce
risk
or
variability
to
a
structured
entity
are
not
considered
to
be
an
interest
in
an
entity
and
have
been
excluded
from
the
disclosures
below.
The
nature
and
extent
of
the
Barclays
Bank
Group’s
interests
in
structured
entities
is
summarised
below:
Notes
to
the
financial
statements
Scope
of
consolidation
Barclays
Bank
PLC
2019
Annual
Report
on
Form
20-F
185
Summary
of
interests
in
unconsolidated
structured
entities
Secured
financing
Short
-term
traded
interests
Traded
derivatives
Other
interests
Total
£m
£m
£m
£m
£m
As
at
31
December
2019
Assets
Trading
portfolio
assets
-
9,585
-
76
9,661
Financial
assets
at
fair
value
through
the
income
statement
32,859
-
-
2,500
35,359
Derivative
financial
instruments
-
-
2,369
-
2,369
Financial
assets
at
fair
value
through
other
comprehensive
income
-
-
-
391
391
Loans
and
advances
at
amortised
cost
-
-
-
17,092
17,092
Reverse
repurchase
agreements
and
other
similar
secured
lending
77
-
-
-
77
Other
assets
-
-
-
22
22
Total
assets
32,936
9,585
2,369
20,081
64,971
Liabilities
Derivative
financial
instruments
-
-
3,171
2,437
5,608
As
at
31
December
2018
Assets
Trading
portfolio
assets
-
12,206
-
-
12,206
Financial
assets
at
fair
value
through
the
income
statement
32,359
-
-
2,595
34,954
Derivative
financial
instruments
-
-
5,236
-
5,236
Financial
assets
at
fair
value
through
other
comprehensive
income
-
-
-
-
-
Loans
and
advances
at
amortised
cost
-
-
-
15,019
15,019
Reverse
repurchase
agreements
and
other
similar
secured
lending
-
-
-
-
-
Other
assets
-
-
-
13
13
Total
assets
32,359
12,206
5,236
17,627
67,428
Liabilities
Derivative
financial
instruments
-
-
6,438
2,586
9,024
Secured
financing
arrangements,
short
-
term
traded
interests
and
traded
derivatives
are
typically
managed
under
market
risk
manageme
nt
policies
described
on
page
39
which
includes
an
indication
of
the
change
of
risk
measures
compared
to
last
year.
For
this
reason,
the
total
assets
of
these
entities
are
not
considered
meaningful
for
the
purposes
of
understanding
the
related
risks
and
so
have
not
been
presented.
Other
interests
include
conduits
and
lending
where
the
interest
is
driven
by
normal
customer
demand
.
Secured
financing
The
Barclays
Bank
Group
routinely
enters
into
reverse
repurchase
contracts,
stock
borrow
ing
and
similar
arrangements
on
normal
commercial
terms
where
the
counterparty
to
the
arrangement
is
a
structured
entity.
Due
to
the
nature
of
these
arrangements,
especially
the
transfer
of
collateral
and
ongoing
margining,
the
Barclays
Bank
Group
has
minimal
exposure
to
the
performance
of
the
structured
entity
counterparty.
This
includes
margin
lending
which
is
presented
under
financial
assets
at
fair
value
through
the
income
statement
to
align
to
the
balance
sheet
presentation.
Short-
term
traded
interests
The
Barclays
Bank
Group
buys
and
sells
interests
in
structured
entities
as
part
of
its
trading
activities,
for
example,
retail
mortgage
-
backed
securities,
collateralised
debt
obligations
and
similar
interests.
Such
interests
are
typically
held
individually
or
as
part
of
a
larger
portfoli
o
for
no
more
than
90
days.
In
such
cases,
the
Barclays
Bank
Group
typically
has
no
other
involvement
with
the
structured
entity
other
than
the
securities
it
holds
as
part
of
trading
activities
and
its
maximum
exposure
to
loss
is
restricted
to
the
carrying
value
of
the
asset.
As
at
31
December
2019,
£
8
,903
m
(2018:
£
8
,436
m)
of
the
Barclays
Bank
Group’s
£
9,585
m
(2018:
£12,206m)
short-term
traded
interests
were
comprised
of
debt
securities
issued
by
asset
securitisation
vehicles.
Traded
derivatives
The
Barclays
Bank
Group
enters
into
a
variety
of
derivative
contracts
with
structured
entities
which
reference
market
risk
variables
such
as
interest
rates,
foreign
exchange
rates
and
credit
indices
among
other
things.
The
main
derivative
types
which
are
consi
dered
interests
in
structured
entities
include
index
-
based
and
entity
specific
credit
default
swaps,
balance
guaranteed
swaps,
total
return
swaps,
commodities
swaps,
and
equity
swaps.
A
description
of
the
types
of
derivatives
and
the
risk
management
practi
ces
are
detailed
in
Note
13.
The
risk
of
loss
may
be
mitigated
through
ongoing
margining
requirements
as
well
as
a
right
to
cash
flows
from
the
structured
entity
which
are
senior
in
the
payment
waterfall.
Such
Notes
to
the
financial
statements
Scope
of
consolidation
Barclays
Bank
PLC
2019
Annual
Report
on
Form
20-F
186
margining
requirements
are
consistent
with
mar
ket
practice
for
many
derivative
arrangements
and
in
line
with
the
Barclays
Bank
Group’s
normal
credit
policies.
Derivative
transactions
require
the
counterparty
to
provide
cash
or
other
collateral
under
margining
agreements
to
mitigate
counterparty
credit
risk.
The
Barclays
Bank
Group
is
mainly
exposed
to
settlement
risk
on
these
derivatives
which
is
mitigated
through
daily
margining
.
Total
notionals
amounted
to
£
314
,170
m
(2018:
£246,774
m).
Except
for
credit
default
swaps
where
the
maximum
exposure
to
loss
is
the
swap
notional
amount,
it
is
not
possible
to
estimate
the
maximum
exposure
to
loss
in
respect
of
der
ivative
positions
as
the
fair
value
of
derivatives
is
subject
to
changes
in
market
rates
of
interest,
exchange
rates
and
credit
indices
which
by
their
nature
are
uncertain.
In
addition,
the
Barclays
Bank
Group’s
losses
would
be
subject
to
mitigating
action
under
its
traded
market
risk
and
credit
risk
policies
that
require
the
counterparty
to
provide
collateral
in
cash
or
other
assets
in
most
cases.
Other
interests
in
unconsolidated
structured
entities
The
Barclays
Bank
Group’s
interests
in
structured
entities
not
held
for
the
purposes
of
short
-
term
trading
activities
are
set
out
below,
summarised
by
the
purpose
of
the
entities
and
limited
to
significant
categories,
based
on
maximum
exposure
to
loss.
Nature
of
interest
Multi
-seller
conduit
programmes
Lending
Investment
funds
and
trusts
Others
Total
£m
£m
£m
£m
£m
As
at
31
December
2019
Trading
portfolio
assets
-
-
-
76
76
Financial
assets
at
fair
value
through
the
income
statement
–
Debt
securities
-
-
-
80
80
–
Loans
and
advances
-
-
-
2,417
2,417
–
Equity
securities
-
-
-
3
3
Financial
assets
at
fair
value
through
other
comprehensive
income
-
-
-
391
391
Loans
and
advances
at
amortised
cost
5,930
7,874
-
3,288
17,092
Other
assets
17
4
1
-
22
Total
on
-balance
sheet
exposures
5,947
7,878
1
6,255
20,081
Total
off
-
balance
sheet
notional
amounts
8,649
3,732
-
1,621
14,002
Maximum
exposure
to
loss
14,596
11,610
1
7,876
34,083
Total
assets
of
the
entity
78,716
139,210
501
15,638
234,065
As
at
31
December
2018
Trading
portfolio
assets
-
-
-
-
-
Financial
assets
at
fair
value
through
the
income
statement
–
Debt
securities
444
-
-
114
558
–
Loans
and
advances
-
-
-
2,037
2,037
–
Equity
securities
-
-
-
-
-
Financial
assets
at
fair
value
through
other
comprehensive
income
-
-
-
-
-
Loans
and
advances
at
amortised
cost
6,100
8,269
-
650
15,019
Other
assets
9
3
1
-
13
Total
on
-balance
sheet
exposures
6,553
8,272
1
2,801
17,627
Total
off
-
balance
sheet
notional
amounts
11,671
4,172
-
431
16,274
Maximum
exposure
to
loss
18,224
12,444
1
3,232
33,901
Total
assets
of
the
entity
73,109
187,176
455
21,255
281,995
Maximum
exposure
to
loss
Unless
specified
otherwise
below,
the
Barclays
Bank
Group’s
maximum
exposure
to
loss
is
the
total
of
its
on
-
balance
sheet
positions
and
its
off-
balance
sheet
arrangements,
being
loan
commitments
and
financial
guarantees.
Exposure
to
loss
is
mitigated
through
collateral,
financial
guarantees,
the
availability
of
netting
and
credit
protection
held.
Multi-seller
conduit
programme
Notes
to
the
financial
statements
Scope
of
consolidation
Barclays
Bank
PLC
2019
Annual
Report
on
Form
20-F
187
The
multi-seller
conduit
engages
in
providing
financing
to
various
clients
and
holds
whole
or
partial
interests
in
pools
of
receivables
or
similar
obligations.
These
instruments
are
protected
from
loss
through
over
-
collateralisation,
seller
guarantees,
or
other
credit
enhancements
provided
to
the
conduit.
The
Barclays
Bank
Group’s
off
-
balance
sheet
exposure
included
in
the
table
above
represents
liquidity
facilities
that
are
provided
to
the
conduit
for
the
benefit
of
the
holders
of
the
commercial
paper
issued
by
the
conduit
and
will
only
be
drawn
where
the
conduit
is
unable
to
access
the
commercial
paper
market.
If
these
liquidity
facilities
are
drawn,
the
Barclays
Bank
Group
is
protected
from
loss
through
over
-
collateralisation,
seller
guarantees,
or
other
credit
enhanc
ements
provided
to
the
conduit.
Lending
The
portfolio
includes
lending
provided
by
the
Barclays
Bank
Group
to
unconsolidated
structured
entities
in
the
normal
course
of
its
lending
business
to
earn
income
in
the
form
of
interest
and
lending
fees
and
includes
loans
to
structured
entities
that
are
generally
collateralised
by
property,
equipment
or
other
assets.
All
loans
are
subject
to
the
Barclays
Bank
Group’s
credit
sanctioning
process.
Collateral
arrangements
are
specific
to
the
circumstances
of
each
loan
with
additional
guarantees
and
collateral
sought
from
the
sponsor
of
the
structured
entity
for
certain
arrangements.
During
the
period
the
Barclays
Bank
Gr
oup
incurred
an
impairment
of
£7m
(2018:
£66
m)
against
such
facilities.
Investment
funds
and
trusts
In
the
course
of
its
fund
management
activities,
the
Barclays
Bank
Group
establishes
pooled
investment
funds
that
comprise
investments
of
various
kinds,
tailored
to
meet
certain
investors’
requirements.
The
Barclays
Bank
Group’s
interest
in
funds
is
generally
restricted
to
a
fund
management
fee,
the
value
of
which
is
typ
ically
based
on
the
performance
of
the
fund.
The
Barclays
Bank
Group
acts
as
trustee
to
a
number
of
trusts
established
by
or
on
behalf
of
its
clients.
The
purpose
of
the
trusts,
which
meet
the
definition
of
structured
entities,
is
to
hold
assets
on
behalf
of
beneficiaries.
The
Barclays
Bank
Group’s
interest
in
trusts
is
generally
restricted
to
unpaid
fees
which,
depending
on
the
trust,
may
be
fixed
or
based
on
the
value
of
the
trust
assets.
Barclays
Bank
PLC
has
no
other
risk
exposure
to
the
trusts.
Other
This
includes
fair
value
loans
with
structured
entities
where
the
market
risk
is
materially
hedged
with
corresponding
derivative
contracts,
interests
in
debt
securities
issued
by
securitisation
vehicles
and
drawn
and
undrawn
loan
facilities
to
these
entities.
Assets
transferred
to
sponsored
unconsolidated
structured
entities
Assets
transferred
to
sponsored
unconsolidated
structured
entities
were
£471m
(2
018:
£516m).
35
Investments
in
associates
and
joint
ventures
Accounting
for
associates
and
joint
ventures
The
Barclays
Bank
Group
applies
IAS
28
Investments
in
Associates
Joint
Arrangements
.
Associates
are
entities
in
which
the
Barclays
Bank
Group
has
significant
influence,
but
not
control,
over
the
operating
and
financial
policies.
Generally
the
Barclays
Bank
Group
holds
more
than
20%,
but
less
than
50%,
of
their
voting
shares.
Joint
ventures
are
arrangements
where
the
Barclays
Bank
Group
has
joint
control
and
rights
to
the
net
assets
of
the
entity.
The
Barclays
Bank
Group’s
investments
in
associates
and
joint
ventures
are
initially
recorded
at
cost
and
increased
(or
decreased)
each
year
by
the
Barclays
Bank
Group’s
share
of
the
post
acquisition
profit/(loss).
The
Barclays
Bank
Group
ceases
to
recognise
its
share
of
the
losses
of
equity
accounted
associates
when
its
share
of
the
net
assets
and
amounts
due
from
the
entity
have
been
written
off
in
full,
unless
it
has
a
contractual
or
constructi
ve
obligation
to
make
good
its
share
of
the
losses.
In
some
cases,
investments
in
these
entities
may
be
held
at
fair
value
through
profit
or
loss,
for
example,
those
held
by
private
equity
businesses.
There
are
no
individually
significant
investments
in
joint
ventures
or
associates
held
by
Barclays
Bank
Group.
2019
2018
Associates
Joint
ventures
Total
Associates
Joint
ventures
Total
£m
£m
£m
£m
£m
£m
Equity
accounted
30
265
295
481
281
762
Held
at
fair
value
through
profit
or
loss
-
516
516
-
509
509
Total
30
781
811
481
790
1,271
Summarised
financial
information
for
the
Barclays
Bank
Group’s
equity
accounted
associates
and
joint
ventures
is
set
out
below.
The
amounts
shown
are
the
net
income
of
the
investees,
not
just
the
Barclays
Bank
Group’s
share
,
for
the
year
ended
31
December
2019,
with
the
exception
of
certain
undertakings
for
which
the
amounts
are
based
on
accounts
made
up
to
dates
not
earlier
than
three
months
before
the
balance
sheet
date.
Notes
to
the
financial
statements
Scope
of
consolidation
Barclays
Bank
PLC
2019
Annual
Report
on
Form
20-F
188
Associates
Joint
ventures
2019
2018
2019
2018
£m
£m
£m
£m
Profit
from
continuing
operations
83
173
86
54
Other
comprehensive
income
/
(expenses)
-
28
3
32
Total
comprehensive
income
from
continuing
operations
83
201
89
86
Unrecognised
shares
of
the
losses
of
individually
immaterial
associates
and
joint
ventures
were
£nil
(2018:
£nil).
The
Barclays
Bank
commitments
and
contingencies
to
its
associates
and
joint
ventures
comprised
unutilised
credit
facilities
provided
to
customers
of
£1,726
m
(2018:
£1,71
5m).
In
addition,
the
Barclays
B
ank
Group
has
made
commitments
to
finance
or
otherwise
provide
resources
to
its
joint
ventures
and
associates
of
£nil
(2018:
£318m).
36
Securitisations
Accounting
for
securitisations
The
Barclays
Bank
Group
uses
securitisations
as
a
source
of
finance
and
a
means
of
risk
transfer.
Such
transactions
generally
result
in
the
transfer
of
contractual
cash
flows
from
portfolios
of
financial
assets
to
holders
of
issued
debt
securities.
Securitisations
may,
dependin
g
on
the
individual
arrangement,
result
in
continued
recognition
of
the
securitised
assets
and
the
recognition
of
the
debt
securities
issued
in
the
transaction;
lead
to
partial
continued
recognition
of
the
assets
to
the
extent
of
the
Barclays
Bank
Group’s
continuing
involvement
in
those
assets
or
to
derecognition
of
the
assets
and
the
separate
recognition,
as
assets
or
liabilities,
of
any
rights
and
obligations
created
or
retained
in
the
transfer.
Full
derecognition
only
occurs
when
the
Barclays
Bank
Group
transfers
both
its
contractual
right
to
receive
cash
flows
from
the
financial
assets,
or
retains
the
contractual
rights
to
receive
the
cash
flows,
but
assumes
a
contractual
obligation
to
pay
the
cash
flows
to
another
party
without
material
delay
or
reinves
tment,
and
also
transfers
substantially
all
the
risks
and
rewards
of
ownership,
including
credit
risk,
prepayment
risk
and
interest
rate
risk.
In
the
course
of
its
normal
banking
activities,
Barclays
Bank
Group
makes
transfers
of
financial
assets,
either
where
legal
rights
to
the
cash
flows
from
the
asset
are
passed
to
the
counterparty
or
beneficially,
where
Barclays
Bank
Group
retains
the
rights
to
the
cash
flows
but
assumes
a
responsibility
to
transfer
them
to
the
counterparty.
Depending
on
the
nature
of
the
transaction,
this
may
result
in
derecognition
of
the
assets
in
their
entirety,
partial
derecognition
or
no
derecognition
of
the
assets
subject
to
the
transfer.
A
summary
of
the
main
transactions,
and
the
assets
and
liabilities
and
the
financial
risks
arising
from
these
transactions,
is
set
out
below:
Transfers
of
financial
assets
that
do
not
result
in
derecognition
Securitisations
Barclays
Bank
Group
was
party
to
securitisation
transactions
involving
its
credit
card
balances.
In
these
transactions,
the
assets,
interests
in
the
assets,
or
beneficial
interests
in
the
cash
flows
arising
from
the
assets,
are
transferred
to
a
special
purpose
entity,
which
then
issues
interest
bearing
debt
securities
to
third
party
investors.
Securitisations
may,
depending
on
the
individual
arrangement,
result
in
continued
recognition
of
the
securitised
assets
and
the
recognition
of
the
debt
securities
issued
in
the
transaction.
Partial
continued
recognition
of
the
assets
to
the
extent
of
Barclays
Bank
Group’s
cont
inuing
involvement
in
those
assets
can
also
occur
or
derecognition
of
the
assets
and
the
separate
recognition,
as
assets
or
liabilities,
of
any
rights
and
obligations
created
or
retained
in
the
transfer.
The
following
table
shows
the
carrying
amount
of
securitised
assets
that
have
not
resulted
in
full
derecognition,
together
with
the
associated
liabilities,
for
each
category
of
asset
on
the
balance
sheet:
2019
2018
Assets
Liabilties
Assets
Liabilties
Carrying
amount
Fair
value
Carrying
amount
Fair
value
Carrying
amount
Fair
value
Carrying
amount
Fair
value
£m
£m
£m
£m
£m
£m
£m
£m
Barclays
Bank
Group
Loans
and
advances
at
amortised
cost
Credit
cards,
unsecured
loans
and
other
retail
lending
3,035
3,183
(2,426)
(2,429)
3,042
3,094
(2,975)
(2,962)
Balances
included
within
loans
and
advances
at
amortised
cost
represent
securitisations
where
substantially
all
the
risks
and
rewards
of
the
asset
have
been
retained
by
Barclays
Bank
Group.
Notes
to
the
financial
statements
Scope
of
consolidation
Barclays
Bank
PLC
2019
Annual
Report
on
Form
20-F
189
The
relationship
between
the
transferred
assets
and
the
associated
liabilities
is
that
holders
of
notes
may
only
look
to
cash
flows
from
the
securitised
assets
for
payments
of
principal
and
interest
due
to
them
under
the
terms
of
their
notes,
although
the
contractual
terms
of
their
no
tes
may
be
different
to
the
maturity
and
interest
of
the
transferred
assets.
For
transfers
of
assets
in
relation
to
r
epurchase
agreements,
see
Note
37
Continuing
involvement
in
fin
ancial
assets
that
have
been
derecognised
In
some
cases,
the
Barclays
Bank
Group
may
have
transferred
a
financial
asset
in
its
entirety
but
may
hav
e
continuing
involvement
in
it.
This
arises
in
asset
securitisations
where
loans
and
asset
backed
securities
were
derecognised
as
a
result
of
the
Barcl
ays
Bank
Gr
oup’s
involvement
with
commercial
mortgage
backed
securities.
Continuing
involvement
largely
arises
from
providing
financing
into
these
structures
in
the
form
of
retained
notes,
which
do
not
bear
first
losses.
The
table
below
shows
the
potent
ial
financial
implications
of
such
continuing
involvement:
Continuing
involvement
a
Gain/(loss)
from
continuing
involvement
Carrying
amount
Fair
value
Maximum
exposure
to
loss
For
the
year
ended
Cumulative
to
31
December
Type
of
transfer
£m
£m
£m
£m
£m
2019
Commercial
mortgage
backed
securities
189
188
189
1
4
2018
Commercial
mortgage
backed
securities
135
135
135
2
3
Note
a
Assets
which
represent
the
Barclays
Bank
Group’s
continuing
involvement
in
derecognised
assets
are
recorded
in
Loans
and
advances
at
amortised
cost.
37
Assets
pledge
d,
collateral
received
and
assets
transferred
Assets
are
pledged
or
transferred
as
collateral
to
secure
liabilities
under
repurchase
agreements,
securitisations
and
stock
lending
agreements
or
as
security
deposits
relating
to
derivatives.
Assets
transferred
are
non
-
cash
assets
transferred
to
a
third
party
that
do
not
qualify
for
derecognition
from
the
Barclays
Bank
Group
balance
sheet,
for
example
because
Barclays
retains
substantially
all
the
exposure
to
those
assets
under
an
agreement
to
repurchase
them
in
the
future
for
a
fixed
price.
Where
non
-
cash
assets
are
pledged
or
transferred
as
collateral
for
cash
received,
the
asset
continues
to
be
recognised
in
full,
and
a
related
liability
is
also
recognised
on
the
balance
sheet.
Liabilities
are
shown
on
a
net
basis
in
acc
ordance
with
IAS
32.
Where
non
-
cash
assets
are
pledged
or
transferred
as
collateral
in
an
exchange
for
non
-
cash
assets,
the
transferred
asset
continues
to
be
recognised
in
full,
and
there
is
no
associated
liability
as
the
non
-
cash
collateral
received
is
not
recognised
on
the
balance
sheet.
The
Barclays
Bank
Group
is
unable
to
use,
sell
or
pledge
the
transferred
assets
for
the
duration
of
the
transaction
and
re
mains
exposed
to
interest
rate
risk
and
credit
risk
on
these
pledged
assets.
Unless
stated,
the
counterparty's
recourse
is
not
limited
to
the
transferred
assets.
The
following
table
summarises
the
nature
and
carrying
amount
of
the
assets
pledged
as
secur
ity
against
these
liabilities:
Barclays
Bank
Group
2019
2018
£m
£m
Cash
collateral
and
settlements
61,158
53,540
Loans
and
advances
at
amortised
cost
18,726
12,597
Trading
portfolio
assets
65,341
63,373
Financial
assets
at
fair
value
through
the
income
statement
8,107
7,450
Financial
assets
at
fair
value
through
other
comprehensive
income
8,011
9,179
Assets
pledged
161,343
146,139
Notes
to
the
financial
statements
Scope
of
consolidation
Barclays
Bank
PLC
2019
Annual
Report
on
Form
20-F
190
The
following
table
summarises
the
transferred
financial
assets
and
the
associated
liabilities:
Barclays
Bank
Group
Transferred
assets
Associated
liabilities
£m
£m
At
31
December
2019
Derivatives
64,061
(64,061)
Repurchase
agreements
35,562
(22,981)
Securities
lending
arrangements
53,099
-
Other
8,621
(4,430)
161,343
(91,472)
At
31
December
2018
Derivatives
55,082
(55,082)
Repurchase
agreements
38,811
(25,721)
Securities
lending
arrangements
41,766
-
Other
10,480
(7,840)
146,139
(88,643)
Included
within
other
are
agreements
where
a
counterparty's
recourse
is
limited
to
the
transferred
assets.
The
relationship
between
the
transferred
assets
and
the
associated
liabilities
is
that
holders
of
notes
may
only
look
to
cash
flows
from
the
securitised
assets
for
payments
of
principal
and
interest
due
to
them
under
the
terms
of
their
notes.
Carrying
value
Fair
value
Transferred
assets
Associated
liabilities
Transferred
assets
Associated
liabilities
Net
position
£m
£m
£m
£m
£m
Barclays
Bank
Group
2019
Recourse
to
transferred
assets
only
3,035
(2,426)
3,183
(2,429)
754
2018
Recourse
to
transferred
assets
only
3,042
(2,975)
3,094
(2,962)
132
Barclays
Bank
Group
has
an
additional
£
2.5bn
(2018:
£4.0bn)
of
loans
and
advances
within
its
asset
backed
funding
programmes
that
can
readily
be
used
to
raise
additional
secured
funding
and
are
available
to
support
future
issuances.
Total
assets
pledged
includes
a
collateral
pool
put
in
place
to
provide
security
for
the
UKRF
funding
deficit.
Refer
to
Note
32
for
further
details.
Collateral
held
as
security
for
assets
Under
certain
transactions,
including
reverse
repurchase
agreements
and
stock
borrowing
transactions,
Barclays
Bank
Group
is
allowed
to
resell
or
re
-
pledge
the
collateral
held.
The
fair
value
at
the
balance
sheet
date
of
collateral
accepted
and
re
-
pledged
to
others
was
as
follows:
Barclays
Bank
Group
2019
2018
£m
£m
Fair
value
of
securities
accepted
as
collateral
660,999
597,100
Of
which
fair
value
of
securities
re
-
pledged/transferred
to
others
554,111
530,364
Additional
disclosure
has
been
included
in
collateral
and
other
credit
enhancements
on
pages
47
to
48.
Notes
to
the
financial
statements
Other
disclosure
matters
Barclays
Bank
PLC
2019
Annual
Report
on
Form
20-F
191
The
notes
included
in
this
section
focus
on
related
party
transactions,
Auditors’
remuneration,
Directors’
remuneration
and
Transition
disclosures.
Related
parties
include
any
subsidiaries,
associates,
joint
ventures
and
Key
Management
Personnel.
38
Related
party
transactions
and
Directors’
remuneration
Related
party
transactions
Parties
are
considered
to
be
related
if
one
party
has
the
ability
to
control
the
other
party
or
exercise
significant
influence
over
the
other
party
in
making
financial
or
operational
decisions,
or
one
other
party
controls
both.
The
transfer
of
European
operations
to
Barclays
Bank
Ireland
PLC
has
materially
affected
the
financial
statements
of
Barclays
Bank
PLC
during
the
year
with
regards
to
its
related
party
transactions.
There
was
no
impact
on
the
consolidated
financial
statements
of
the
Barclays
Bank
Group.
Refer
to
Note
39
for
further
details,
including
intra
-
group
bal
ances.
Parent
company
The
parent
company,
which
is
also
the
ultimate
parent
company,
is
Barclays
PLC,
which
holds
100%
of
the
issued
ordinary
shares
of
Barclays
Bank
PLC.
Subsidiaries
Transactions
between
Barclays
Bank
PLC
and
its
subsidiaries
also
meet
the
definition
of
related
party
transactions.
Where
these
are
eliminated
on
consolidation,
they
are
not
disclosed
in
the
Barclays
Bank
Group’s
financial
statements.
A
list
of
the
Barclays
Bank
Group’s
principal
subsidiaries
is
shown
in
Note
33.
Fellow
su
bsidiaries
Transactions
between
the
Barclays
Bank
Group
and
other
subsidiaries
of
the
parent
company
also
meet
the
definition
of
related
party
transactions.
Associates,
jo
int
ventures
and
other
entities
The
Barclays
Bank
Group
provides
banking
services
to
its
associates,
joint
ventures
and
the
Barclays
Bank
Group
pension
funds
(principally
the
UK
Retirement
Fund),
providing
loans,
overdrafts,
interest
and
non
-
interest
bearing
deposits
and
current
accounts
to
these
entities
as
well
as
other
services.
Barc
lays
Bank
Group
companies
also
provide
investment
management
and
custodian
services
to
the
Barclays
Bank
Group
pension
schemes.
All
of
these
transactions
are
conducted
on
the
same
terms
as
third
party
transactions.
Summarised
financial
information
for
the
Barclays
Bank
Group’s
investments
in
associates
and
joint
ventures
is
set
out
in
Note
35.
Amounts
included
in
the
Barclays
Bank
Group’s
financial
statements,
in
aggregate,
by
category
of
related
party
entity
are
as
follows:
Parent
Fellow
subsidiaries
Associates
Joint
ventures
Pension
funds
£m
£m
£m
£m
£m
For
the
year
ended
and
as
at
31
December
2019
Total
income
(717)
53
-
12
3
Credit
impairment
charges
-
-
-
-
-
Operating
expenses
(90)
(3,023)
(5)
-
-
Total
assets
2,097
2,165
-
1,303
3
Total
liabilities
24,876
1,600
-
-
75
For
the
year
ended
and
as
at
31
December
2018
Total
income
(416)
(3)
-
7
3
Credit
impairment
charges
-
-
-
-
-
Operating
expenses
(122)
(3,630)
(1)
(7)
-
Total
assets
727
1,091
12
1,288
3
Total
liabilities
21,405
2,058
85
2
139
An
entity
that
is
consolidated
within
the
Group
under
IFRS
10
has
issued
Senior
No
tes
to
the
UKRF
with
a
nominal
value
of
£500m.
This
is
not
included
within
the
table
above.
Refer
to
Note
32
for
further
details.
Total
liabilities
includes
total
liabilities
are
d
erivatives
transacted
on
behalf
of
the
pensions
funds
of
£6
m
(
2018:
£3
m).
Key
Management
Personnel
Key
Management
Personnel
are
defined
as
those
persons
having
authority
and
responsibility
for
planning,
directing
and
controlling
the
activities
of
Barclays
Bank
PLC
(directly
or
indirectly)
and
comprise
the
Directors
and
Officers
of
Barclays
Bank
PLC,
certain
direct
reports
of
the
Chief
Executive
Officer
and
the
heads
of
major
business
units
and
functions.
Notes
to
the
financial
statements
Other
disclosure
matters
Barclays
Bank
PLC
2019
Annual
Report
on
Form
20-F
192
The
Barclays
B
ank
Group
provides
banking
services
to
Key
Management
Personnel
and
persons
connected
to
them.
Transactions
during
the
year
and
the
balances
outstanding
were
as
follows:
Loans
outstanding
2019
2018
£m
£m
As
at
1
January
14.6
4.8
Loans
issued
during
the
year
a
0.1
12.6
Loan
repayments
during
the
year
b
(14.7)
(2.8)
As
at
31
December
-
14.6
Notes
a
Includes
loans
issued
to
existing
Key
Management
Personnel
and
new
or
existing
loans
issued
to
newly
appointed
Key
Management
Personnel.
b
Includes
loan
repayments
by
existing
Key
Management
Personnel
and
loans
to
former
Key
Management
Personnel.
No
allowances
for
impairment
were
recognised
in
respect
of
loans
to
Key
Management
Personnel
(or
any
connected
person).
Deposits
outstanding
2019
2018
£m
£m
As
at
1
January
2.9
6.9
Deposits
received
during
the
year
a
11.5
17.4
Deposits
repaid
during
the
year
b
(10.2)
(21.4)
As
at
31
December
4.2
2.9
Notes
a
Includes
deposits
received
from
existing
Key
Management
Personnel
and
new
or
existing
deposits
received
from
newly
appointed
Key
Management
Personnel.
b
Includes
deposits
repaid
by
existing
Key
Management
Personnel
and
deposits
of
former
Key
Management
Personnel.
Total
commitments
outstanding
Total
commitments
outstanding
refer
to
the
total
of
any
undrawn
amounts
on
credit
card
and/or
overdraft
facilities
provided
to
Key
Management
Personnel.
Total
commitments
outstanding
as
at
31
December
2019
were
£0.1m
(2018:
£0.5
m).
Loans
to
Key
Management
Personnel
(and
persons
connected
to
them)
were
made
in
the
ordinary
course
of
business;
were
made
on
substantially
the
same
terms,
including
interest
rates
and
collateral,
as
those
prevailing
at
the
same
time
for
comparable
transactions
with
other
persons
;
and
did
not
involve
more
than
a
normal
risk
of
collectability
or
present
other
unfavourable
features.
Notes
to
the
financial
statements
Other
disclosure
matters
Barclays
Bank
PLC
2019
Annual
Report
on
Form
20-F
193
Remuneration
of
Key
Management
Personnel
Total
remuneration
awarded
to
Key
Management
Personnel
below
represents
the
awards
made
to
individuals
that
have
been
approved
by
the
Board
Remuneration
Committee
as
part
of
the
latest
remuneration
decisions.
Costs
recognised
in
the
income
statement
reflect
the
accounting
charge
for
the
year
included
within
operating
expenses.
The
difference
between
the
values
awarde
d
and
the
recognised
income
statement
charge
principally
relates
to
the
recognition
of
deferred
costs
for
prior
year
awards.
Figures
are
provided
for
the
period
that
individuals
met
the
definition
of
Key
Management
Personnel.
2019
2018
£m
£m
Salaries
and
other
short
-
term
benefits
37.6
50.7
Pension
costs
0.2
0.3
Other
long
-
term
benefits
9.1
12.6
Share
-
based
payments
14.2
24.8
Employer
social
security
charges
on
emoluments
6.0
8.5
Costs
recognised
for
accounting
purposes
67.1
96.9
Employer
social
security
charges
on
emoluments
(6.0)
(8.5)
Other
long
-
term
benefits
–
difference
between
awards
granted
and
costs
recognised
(1.0)
4.5
Share
-
based
payments
–
difference
between
awards
granted
and
costs
recognised
(0.7)
(2.1)
Total
remuneration
awarded
59.4
90.8
Disclosure
required
by
the
Companies
Act
2006
The
following
information
regarding
Barclays
Bank
PLC
Board
of
Directors
is
presented
in
accordance
with
the
Companies
Act
2006:
2019
2018
£m
£m
Aggregate
emoluments
a
7.6
10.5
Amounts
paid
under
LTIPs
b
0.2
0.6
7.8
11.1
Notes
a
The
aggregate
emoluments
include
amounts
paid
for
the
2019
year
.
In
addition,
deferr
ed
cash
and
share
awards
for
2019
with
a
total
value
at
grant
of
£
1.9m
will
be
made
to
Directors
which
will
only
vest
subjec
t
to
meeting
certain
conditions
.
b
The
figure
above
for
‘Amounts
paid
under
LTIPs’
for
2019
re
lates
to
an
LTIP
award
released
to
a
Director
in
2019.
Dividend
shares
released
on
the
award
are
excluded.
Pen
sion
contributions
totalling
£11,
932
were
paid
to
defined
contribution
schemes
on
behalf
of
Directors
(2018:
£11,848
).
There
were
no
notional
pension
contributions
to
defined
contribution
schemes.
As
at
31
December
2019,
there
were
no
Directors
accruing
benefits
under
a
defined
benefit
scheme
(2018:
nil).
The
aggregate
amou
nt
of
compensation
payable
to
departing
officer
s
in
respect
of
loss
of
office
was
£3,929,875.
Of
the
figures
in
the
table
above,
the
amounts
attributable
to
the
highest
paid
Director
in
respect
of
qualifying
services
are
as
follows:
2019
2018
£m
£m
Aggregate
emoluments
a
3.2
3.6
Amounts
paid
under
LTIPs
-
-
3.2
3.6
Note
a
The
aggregate
emoluments
include
amounts
paid
for
the
2019
year.
In
addition,
a
deferred
share
award
for
2019
with
a
value
at
grant
of
£1.2m
will
be
made
to
the
highest
paid
Director
which
will
only
vest
subject
to
meeting
certain
conditions.
There
were
no
actual
pension
contributions
to
defined
contribution
schemes
on
behalf
of
the
highest
paid
Director
(2
018:
£nil).
There
were
no
notional
pension
contributions
to
defined
contribution
schemes.
Advances
and
credit
to
Directors
and
guarantees
on
behalf
of
Directors
In
accordance
with
Section
413
of
the
Companies
Act
2006,
the
total
amount
of
advances
and
credits
made
available
in
2019
to
persons
who
served
as
Directors
during
the
year
was
£nil
(2018:
£nil).
The
total
value
of
guarantees
entered
into
on
behalf
of
Directors
during
2019
was
£nil
(2018:
£nil).
Notes
to
the
financial
statements
Other
disclosure
matters
Barclays
Bank
PLC
2019
Annual
Report
on
Form
20-F
194
39
Discontinued
operations
and
assets
included
in
disposal
groups
classified
as
held
for
sale
and
associated
liabilities
Accounting
for
non
-current
assets
held
for
sale
and
associated
liabilities
The
Barclays
Bank
Group
applies
IFRS
5
Non
-
current
Assets
Held
for
Sale
and
Discontinued
Operations.
Non
-
current
assets
(or
disposal
groups)
are
classified
as
held
for
sale
when
their
carrying
amount
is
to
be
recovered
principally
through
a
sale
transaction
rather
than
continuing
use.
In
order
to
be
classified
as
held
for
sale,
the
asset
must
be
available
for
immediate
sale
in
its
present
condition
subject
only
to
terms
that
are
usual
and
customary
and
the
sale
must
be
highly
probable.
Non
-
current
assets
(or
disposal
groups)
held
for
sale
are
measured
at
the
lower
of
carrying
amount
and
fair
value
less
cost
to
sell.
A
component
of
the
Barclays
Bank
Group
that
has
either
been
disposed
of
or
is
classified
as
held
for
sale
is
presented
as
a
discontinued
operation
if
it
represents
a
separate
major
line
of
business
or
g
eographical
area
of
operations,
is
part
of
a
single
coordinated
plan
to
dispose
of
the
separate
major
line
or
geographical
area
of
operations,
or
if
it
is
a
subsidiary
acquired
exclusively
with
a
view
to
re
-
sale.
Barclays
Bank
Group
On
21
November
2019
Barclays
Bank
PLC
sold
its
investment
in
The
Logic
Group
Holdings
Limited
to
Barclays
Principal
Investments
Limited
at
its
fair
value
of
£112m.
On
26
December
2019
Barclays
Bank
PLC
sold
its
investment
in
Barclays
Funds
Investments
Limited
to
Barclays
Equity
Holdings
Limited
at
its
fair
value
of
£505m.
Barclays
Bank
PLC
recorded
profit
on
disposal
of
£56m
and
£23m
respectively.
UK
banking
business
Following
the
court
approval
of
the
ring
-
fencing
transfer
scheme
on
9
March
2018,
the
UK
banking
business
largely
comprising
Personal
Banking,
Barclaycard
Consumer
UK
and
Business
Banking
customers,
and
related
assets
and
liabilities
was
transferred
to
Barclays
Bank
UK
PLC
on
1
April
2018,
to
meet
the
regulatory
ring
-
fencing
requirement
under
the
Financial
Services
(Banking
Reform)
Act
2013
and
related
legislation.
Following
the
transfer
of
the
UK
banking
business,
Barclays
Bank
PLC
transferred
the
equity
ownership
in
Barclays
Bank
UK
PLC
to
Barclays
PLC
through
a
dividend
in
specie
on
the
same
day.
Accordingly,
Barclays
Bank
UK
PLC
ceased
to
be
a
subsidiary
of
Barclays
Bank
PLC
and
became
a
direct
subsidiary
of
the
ultimate
parent,
Barclays
PLC.
The
results
of
Barclays
Bank
UK
PLC
and
its
subsidiaries
for
the
three
months
ended
31
March
2018
,
the
date
prior
to
the
transfer
of
ownership
to
Barclays
PLC,
are
included
in
the
consolidated
financial
statements
of
Barclays
Bank
Group.
The
transfer
of
the
ownership
of
Barclays
Bank
UK
PLC
to
Barclays
PLC
resulted
in
a
material
change
to
the
consoli
dated
financial
position
and
results
of
Barclays
Bank
Group
in
2018,
in
comparison
to
prior
periods.
It
had
no
impact
on
the
share
capital
and
share
premium
of
Barclays
Bank
Group.
Other
equity
instruments
reduced
by
£2,070m
relating
to
additional
tier
1
(
AT1)
securities
transferred
to
Barclays
Bank
UK
PLC.
The
fair
value
through
other
comprehensive
income
reserve
increased
by
£16m
and
retained
earnings
reduced
by
£14,187m.
Upon
disposal
of
the
equity
ownership
of
Barclays
Bank
UK
PLC
on
1
April
2018,
the
UK
banking
business
met
the
requirements
for
presentation
as
a
discontinued
operation.
As
such,
the
results,
which
have
been
presented
as
the
profit
after
tax
in
respect
of
discontinued
operations
on
the
face
of
the
Barclays
Bank
Group
income
statement,
are
analysed
in
the
income
statement
below.
In
2018,
discontinued
operations
relating
to
the
UK
banking
business
incurred
a
loss
after
tax
of
£47m
and
in
2017
discontinued
op
erations
related
to
the
UK
banking
business
generated
a
profit
of
£809m
(discontinued
operations
in
total
incurred
a
loss
after
tax
of
£1,386m,
which
includes
a
loss
of
£2,195m
loss
relating
to
BAGL).
The
income
statement
and
cash
flow
statement
below
rep
resent
three
months
of
results
as
a
discontinued
operation
to
31
March
2018,
compared
to
the
full
year
ended
31
December
2017.
Notes
to
the
financial
statements
Other
disclosure
matters
Barclays
Bank
PLC
2019
Annual
Report
on
Form
20-F
195
UK
banking
business
disposal
group
income
statement
2019
2018
2017
For
the
year
ended
31
December
£m
£m
£m
Net
interest
income
-
1,449
5,872
Net
fee
and
commission
income
-
296
1,176
Net
trading
income
-
(5)
(9)
Net
investment
income
-
6
160
Other
income
-
2
8
Total
income
-
1,748
7,207
Credit
impairment
charges
and
other
provisions
-
(201)
(783)
Net
operating
income
-
1,547
6,424
Staff
costs
-
(321)
(2,052)
Administration
and
general
expenses
-
(1,135)
(2,959)
Operating
expenses
-
(1,456)
(5,011)
Share
of
post-
tax
results
of
associates
and
joint
ventures
-
-
(5)
Profit
before
tax
-
91
1,408
Taxation
-
(138)
(599)
(Loss)/profit
after
tax
-
(47)
809
Attributable
to:
Equity
holders
of
the
parent
-
(47)
809
Non
-
controlling
interests
-
-
-
(Loss)/profit
after
tax
-
(47)
809
The
cash
flows
attributed
to
the
UK
banking
business
discontinued
operation
are
as
follows:
2019
2018
2017
For
the
year
ended
31
December
£m
£m
£m
Net
cash
flows
from
operating
activities
-
(522)
(355)
Net
cash
flows
from
investing
activities
-
54
470
Net
cash
flows
from
financing
activities
-
-
(128)
Net
(decrease)/increase
in
cash
and
cash
equivalents
-
(468)
(13)
Barclays
Africa
Group
Holdings
Limited
and
Barclays
Africa
Group
Limited
On
1
August
2018
Barclays
Bank
PLC
transferred
the
equity
ownership
of
its
subsidiary
Barclays
Africa
Group
Holdings
Limited
(BAGHL)
to
Barclays
PLC
through
a
dividend
in
specie.
Accordingly,
BAGHL
ceased
to
be
a
subsidiary
of
Barclays
Bank
PLC
and
became
a
direct
subsidiary
of
the
ultimate
parent,
Barclays
PLC.
The
value
of
this
dividend,
representing
the
historic
cost
of
investment
of
Barclays
Bank
PLC
in
BAGHL
was
£269m.
BAGHL
was
subsequently
renamed
Barclays
Principal
Investments
Limited.
Notes
to
the
financial
statements
Other
disclosure
matters
Barclays
Bank
PLC
2019
Annual
Report
on
Form
20-F
196
Following
the
reduction
of
the
Barclays
Bank
Group’s
interest
in
BAGL
in
2017,
Barclays
Bank
Group’s
remaining
interest
in
BAGL
was
reported
as
a
financial
asset
at
fair
value
through
other
comprehensive
income.
Prior
to
the
disposal
of
shares
on
1
June
2017,
BAGL
met
the
requirements
for
presentation
as
a
discontinued
operation.
As
such,
the
results,
which
have
been
presented
as
the
profit
after
tax
and
non
-
controlling
interest
in
respect
of
the
discontinued
operation
on
the
face
of
the
Barclays
Bank
Group
income
statement,
are
analysed
in
the
income
statement
below,
which
represents
five
months
of
results
as
a
discontinued
operation
to
31
May
2017.
Barclays
Africa
disposal
group
income
statement
2019
2018
2017
For
the
year
ended
31
December
£m
£m
£m
Net
interest
income
-
-
1,024
Net
fee
and
commission
income
-
-
522
Net
trading
income
-
-
149
Net
investment
income
-
-
30
Other
income
-
-
61
Total
income
-
-
1,786
Credit
impairment
charges
and
other
provisions
-
-
(177)
Net
operating
income
-
-
1,609
Staff
costs
-
-
(586)
Administration
and
general
expenses
a
-
-
(1,634)
Operating
expenses
-
-
(2,220)
Share
of
post-
tax
results
of
associates
and
joint
ventures
-
-
5
Loss
before
tax
-
-
(606)
Taxation
-
-
(154)
Loss
after
tax
b
-
-
(760)
Attributable
to:
Equity
holders
of
the
parent
-
-
(900)
Non
-
controlling
interests
-
-
140
Loss
after
tax
b
-
-
(760)
Notes
a
Includes
impairment
of
£1,090
in
2017.
b
Total
loss
in
respect
of
the
discontinued
operation
in
2017
was
£2,195m,
which
included
the
£60m
loss
on
sale
and
£1,375m
loss
on
recycling
of
other
comprehensive
loss
on
reserves.
40
Auditor
’s
remuneration
Auditor
’s
remuneration
is
included
within
consultancy,
legal
and
professional
fees
in
administration
and
general
expenses
and
comprises:
2019
2018
2017
£m
£m
£m
Audit
of
the
Barclays
Bank
Group's
annual
accounts
16
14
11
Other
services:
Audit
of
the
Company's
subsidiaries
a
12
10
27
Other
audit
related
fees
b
6
6
8
Other
services
1
1
2
Total
Auditor's
remuneration
35
31
48
Notes
a
Comprises
the
fees
for
the
statutory
audit
of
the
subsidiaries
both
inside
and
outside
UK
and
fees
for
the
work
performed
by
associates
of
KPMG
in
respect
of
the
consolidated
financial
statements
of
the
Company.
b
Comprises
services
in
relation
to
statutory
and
regulatory
filings.
These
include
audit
services
for
the
review
of
the
interim
financial
information
under
the
Listing
Rules
of
the
UK
listing
authority.
The
figures
shown
in
the
above
table
relate
to
fees
paid
to
KPMG
as
principal
auditor,
of
which
the
fees
paid
in
relation
to
discontinued
operations
were
£
nil
(2018:
£nil,
2017
:
£4
m).
Under
SEC
regulations,
the
remuneration
of
our
auditors
is
required
to
be
presented
as
follows:
audit
fees
£31m
(2018:
£27m,
2017:
£42m),
audit-
related
fees
£3m
(2018:
£3m,
2017:
£4m),
tax
fees
£nil
(2018:
£nil,
2017:
£nil),
and
all
other
fees
£1m
(2018:
£
1m,
2017:
£2m).
Additional
information
Barclays
Bank
PLC
2019
Annual
Report
on
Form
20-F
197
Shareholder
information
Additional
shareholder
information
Articles
of
Association
Barclays
Bank
PLC
(the
“Company”)
is
a
public
limited
company
registered
in
England
and
Wales
under
company
number
01026167
(formerly
called
Barclays
Bank
International
Limited,
a
company
incorporated
under
the
name
The
Colonial
Bank
by
the
Colonial
Bank
Act
1925
and
which
changed
its
name
on
15
September
1925
to
Barclays
Bank
(Dominion,
Colonial
and
Overseas)
and
further
changed
its
name
on
22
September
1954
to
Barclays
Bank
D.C.O.
and
on
1
October
1971
to
Barclays
Bank
International
Limited)
was
incorporated
under
the
Companies
Acts
1948
to
1967
as
a
limited
company
on
4
October
1971
and
changed
its
name
on
1
January
1985
to
Barclays
Bank
PLC.
Under
the
Companies
Act
2006
a
company’s
Memorandum
of
Association
now
need
only
contain
the
names
of
the
subscribers
and
the
number
of
shares
each
subscriber
has
agreed
to
take.
For
companies
in
existence
as
of
1
October
2009,
all
other
provisions
which
were
contain
ed
in
the
company’s
Memorandum
of
Association,
including
the
company’s
objects,
are
now
deemed
to
be
contained
in
the
company’s
articles.
The
Companies
Act
2006
also
states
that
a
company’s
objects
are
unrestricted
unless
the
company’s
articles
provide
otherwise.
The
Articles
of
Association
were
adopted
by
Special
Resolution
on
30
April
2010.
The
following
is
a
summary
and
explanation
of
the
current
Articles
of
Association,
which
are
available
for
inspection.
Directors
(i)
The
minimum
number
of
Directors
(excluding
alternate
Directors)
is
five.
There
is
no
maximum
limit.
There
is
no
age
limit
for
Directors.
A
director
shall
not
be
required
to
hold
any
shares
in
the
Company
by
way
of
qualification.
(ii)
Excluding
executive
remuneration
and
any
other
entitlement
to
remuneration
for
extra
services
(including
service
on
board
committees)
under
the
Articles,
a
Director
is
entitled
to
a
fee
at
a
rate
determined
by
the
Board
but
the
aggregate
fees
paid
to
all
Directors
shall
not
exceed
£2,000,000
per
annum
or
such
higher
amount
as
may
be
approved
by
an
ordinary
resolution
of
the
Company.
Each
Director
is
entitled
to
reimbursement
for
all
reasonable
travelling,
hotel
and
other
expenses
properly
incurred
by
him/her
in
or
about
the
performance
of
his/her
duties.
(iii)
A
Director
may
hold
any
other
office
of
the
Company
on
such
terms
as
the
Board
shall
determine.
(iv)
No
director
shall
be
required
to
retire
from
office
at
any
annual
general
meeting
by
rotational
retirement.
(v)
The
Board
has
the
power
to
appoint
additional
Directors
or
to
fill
a
casual
vacancy
amongst
the
Directors.
Any
Director
so
appointed
holds
office
until
the
next
AGM,
when
he/she
may
offer
himself/herself
for
reappointment.
(vi)
The
Board
may
appoint
any
Director
to
any
executive
position
o
r
employment
in
the
Company
on
such
terms
as
they
determine.
(vii)
The
Company
may
by
ordinary
resolution
remove
a
Director
before
the
expiry
of
his/her
period
of
office
(without
prejudice
to
a
claim
for
damages
for
breach
of
contract
or
otherwise)
and
ma
y
by
ordinary
resolution
appoint
another
person
who
is
willing
to
act
to
be
a
Director
in
his/her
place.
(viii)
A
Director
may
appoint
either
another
Director
or
some
other
person
approved
by
the
Board
to
act
as
his/her
alternate
with
power
to
attend
Boar
d
meetings
and
generally
to
exercise
the
functions
of
the
appointing
Director
in
his/her
absence
(other
than
the
power
to
appoint
an
alternate).
(ix)
The
Board
may
authorise
any
matter
in
relation
to
which
a
Director
has,
or
can
have,
a
direct
interest
that
conflicts,
or
possibly
may
conflict
with,
the
Company’s
interests.
Only
Directors
who
have
no
interest
in
the
matter
being
considered
will
be
able
to
authorise
the
relevant
matter
and
they
may
impose
limits
or
conditions
when
giving
authorisation
if
they
think
this
is
appropriate.
(x)
A
Director
may
hold
positions
with
or
be
interested
in
other
companies
and,
subject
to
legislation
applicable
to
the
Company
and
the
FCA’s
requirements,
may
contract
with
the
Company
or
any
other
company
in
which
the
Compa
ny
is
interested.
A
Director
may
not
vote
or
count
towards
the
quorum
on
any
resolution
concerning
any
proposal
in
which
he/she
(or
any
person
connected
with
him/her)
has
a
material
interest
(other
than
by
virtue
of
his/her
interest
in
securities
of
the
Co
mpany)
or
if
he/she
has
a
duty
which
conflicts
or
may
conflict
with
the
interests
of
the
Company,
unless
the
resolution
relates
to
any
proposal:
(a)
to
indemnify
a
Director
or
provide
him/her
with
a
guarantee
or
security
in
respect
of
money
lent
by
him/he
r
to,
or
any
obligation
incurred
by
him/her
or
any
other
person
for
the
benefit
of
(or
at
the
request
of),
the
Company
(or
any
other
member
of
the
Group);
(b)
to
indemnify
or
give
security
or
a
guarantee
to
a
third
party
in
respect
of
a
debt
or
obligation
of
the
Company
(or
any
other
member
of
the
Group)
for
which
the
Director
has
personally
assumed
responsibility;
Additional
information
Barclays
Bank
PLC
2019
Annual
Report
on
Form
20-F
198
(c)
to
obtain
insurance
for
the
benefit
of
Directors;
(d)
involving
the
acquisition
by
a
Director
of
any
securities
of
the
Company
(or
any
other
member
of
the
Group)
pursuant
to
an
offer
to
existing
holders
of
securities
or
to
the
public;
(e)
concerning
any
other
company
in
which
the
Director
is
interested
as
an
officer
or
creditor
or
Shareholder
but,
broadly,
only
if
he/she
(together
with
his/her
connected
persons)
is
directly
or
indirectly
interested
in
less
than
1%
of
either
any
class
of
the
issued
equity
share
capital
or
of
the
voting
rights
of
that
company;
and
(f)
concerning
any
other
arrangement
for
the
benefit
of
employees
of
the
Co
mpany
(or
any
other
member
of
the
Group)
under
which
the
Director
benefits
or
stands
to
benefit
in
a
similar
manner
to
the
employees
concerned
and
which
does
not
give
the
Director
any
advantage
which
the
employees
to
whom
the
arrangement
relates
would
not
receive.
(g)
to
obtain
insurance
for
the
benefit
of
Directors.
Classes
of
Shares
The
Company
authorized
capital
comprise
of
Ordinary
Shares,
Euro,
US
Dollar
and
Sterling
Preference
Shares
(collectively,
the
“Preference
Shares”)
and
Series
1
Sterling
Preference
Shares.
A
list
and
description
the
outstanding
Ordinary
Shares
and
Preference
Shares
of
the
Company
is
included
in
Note
27
to
the
Financial
Statements
(Ordinary
shares,
share
premium,
and
other
equity).
Dividends
Subject
to
the
provisions
of
the
Articles
and
applicable
legislation,
the
Company
in
general
meeting
may
declare
dividends
on
the
Ordinary
Shares
by
ordinary
resolution,
but
any
such
dividend
may
not
exc
eed
the
amount
recommended
by
the
Board.
The
Board
may
also
pay
interim
or
final
dividends
if
it
appears
they
are
justified
by
the
Company’s
financial
position.
Each
Preference
Share
confers
the
right
to
a
preferential
dividend
(“Preference
Dividend”)
pay
able
in
such
currency
at
such
rates
(whether
fixed
or
calculated
by
reference
to
or
in
accordance
with
a
specified
procedure
or
mechanism),
on
such
dates
and
on
such
other
terms
as
may
be
determined
by
the
Board
prior
to
allotment
thereof.
The
Preference
Shares
rank
in
regard
to
payment
of
dividends
in
priority
to
the
holders
of
Ordinary
Shares
and
any
other
class
of
shares
in
the
Company
ranking
junior
to
the
Preference
Shares.
Dividends
may
be
paid
on
the
Preference
Shares
if,
in
the
opinion
of
the
Boar
d,
the
Company
has
sufficient
distributable
profits,
after
payment
in
full
or
the
setting
aside
of
a
sum
to
provide
for
all
dividends
payable
on
(or
in
the
case
of
shares
carrying
a
cumulative
right
to
dividends,
before)
the
relevant
dividend
payment
date
on
any
class
of
shares
in
the
Company
ranking
pari
passu
with
or
in
priority
to
the
relevant
series
of
Preference
Shares
as
regards
participation
in
the
profits
of
the
Company.
If
the
Board
considers
that
the
distributable
profits
of
the
Company
available
for
distribution
are
insufficient
to
cover
the
payment
in
full
of
Preference
Dividends,
Preference
Dividends
shall
be
paid
to
the
extent
of
the
distributable
profits
on
a
pro
rata
basis.
Notwithstanding
the
above,
the
Board
may,
at
its
absolute
discretio
n,
determine
that
any
Preference
Dividend
which
would
otherwise
be
payable
may
either
not
be
payable
at
all
or
only
payable
in
part.
If
any
Preference
Dividend
on
a
series
of
Preference
Shares
is
not
paid,
or
is
only
paid
in
part,
for
the
reasons
described
above,
holders
of
Preference
Shares
will
not
have
a
claim
in
respect
of
such
non
-payment.
If
any
dividend
on
a
series
of
Preference
Shares
is
not
paid
in
full
on
the
relevant
dividend
payment
date,
a
dividend
restriction
shall
apply.
The
dividen
d
restriction
means
that,
subject
to
certain
exceptions,
neither
the
Company
nor
Barclays
Bank
may
(a)
pay
a
dividend
on,
or
(b)
redeem,
purchase,
reduce
or
otherwise
acquire,
any
of
their
respective
ordinary
shares,
other
preference
shares
or
other
share
capital
ranking
equal
or
junior
to
the
relevant
series
of
Preference
Shares
until
the
earlier
of
such
time
as
the
Company
next
pays
in
full
a
dividend
on
the
relevant
series
of
Preference
Shares
or
the
date
on
which
all
of
the
relevant
series
of
Preference
Shares
are
redeemed.
All
unclaimed
dividends
payable
in
respect
of
any
share
may
be
invested
or
otherwise
made
use
of
by
the
Board
for
the
benefit
of
the
Company
until
claimed.
If
a
dividend
is
not
claimed
after
12
years
of
it
becoming
payable,
it
is
fo
rfeited
and
reverts
to
the
Company.
Redemption
and
Purchase
Subject
to
applicable
legislation
and
the
rights
of
the
other
shareholders,
any
share
may
be
issued
on
terms
that
it
is,
at
the
option
of
the
Company
or
the
holder
of
such
share,
redeemable.
The
Directors
are
authorised
to
determine
the
terms,
conditions
and
manner
of
redemption
of
any
such
shares
under
the
Articles
of
Association.
Calls
on
capital
Additional
information
Barclays
Bank
PLC
2019
Annual
Report
on
Form
20-F
199
The
Directors
may
make
calls
upon
the
members
in
respect
of
any
monies
unpaid
on
their
shares.
A
p
erson
upon
whom
a
call
is
made
remains
liable
even
if
the
shares
in
respect
of
which
the
call
is
made
have
been
transferred.
Interest
will
be
chargeable
on
any
unpaid
amount
called
at
a
rate
determined
by
the
Board
(of
not
more
than
20%
per
annum).
If
a
member
fails
to
pay
any
call
in
full
(following
notice
from
the
Board
that
such
failure
will
result
in
forfeiture
of
the
relevant
shares),
such
shares
(including
any
dividends
declared
but
not
paid)
may
be
forfeited
by
a
resolution
of
the
Board,
and
will
b
ecome
the
property
of
the
Company.
Forfeiture
shall
not
absolve
a
previous
member
for
amounts
payable
by
him/her
(which
may
continue
to
accrue
interest).
The
Company
also
has
a
lien
over
all
partly
paid
shares
of
the
Company
for
all
monies
payable
or
called
on
that
share
and
over
the
debts
and
liabilities
of
a
member
to
the
Company.
If
any
monies
which
are
the
subject
of
the
lien
remain
unpaid
after
a
notice
from
the
Board
demanding
payment,
the
Company
may
sell
such
shares.
Annual
and
other
general
meetings
The
Company
is
required
to
hold
an
AGM
in
addition
to
such
other
general
meetings
as
the
Directors
think
fit.
The
type
of
the
meeting
will
be
specified
in
the
notice
calling
it.
Under
the
Companies
Act
2006,
the
AGM
must
be
held
within
six
months
of
the
accounting
reference
date.
A
general
meeting
may
be
convened
by
the
Board
on
requisition
in
accordance
with
the
applicable
legislation.
In
the
case
of
an
AGM,
a
minimum
of
21
clear
days’
notice
is
required.
The
notice
must
be
in
writing
and
must
specify
the
place,
the
day
and
the
hour
of
the
meeting,
and
the
general
nature
of
the
business
to
be
transacted.
A
notice
convening
a
meeting
to
pass
a
special
resolution
shall
specify
the
intention
to
propose
the
resolution
as
such.
The
accid
ental
failure
to
give
notice
of
a
general
meeting
or
the
non
-
receipt
of
such
notice
will
not
invalidate
the
proceedings
at
such
meeting.
Subject
as
noted
above,
all
Shareholders
are
entitled
to
attend
and
vote
at
general
meetings.
The
Articles
do,
however
,
provide
that
arrangements
may
be
made
for
simultaneous
attendance
at
a
satellite
meeting
place
or,
if
the
meeting
place
is
inadequate
to
accommodate
all
members
and
proxies
entitled
to
attend,
another
meeting
place
may
be
arranged
to
accommodate
such
per
sons
other
than
that
specified
in
the
notice
of
meeting,
in
which
case
Shareholders
may
be
excluded
from
the
principal
place.
Holders
of
Preference
Shares
have
no
right
to
receive
notice
of,
attend
or
vote
at,
any
general
meetings
of
the
Company
as
a
resu
lt
of
holding
Preference
Shares.
Notices
Save
where
the
articles
expressly
require
otherwise,
a
document
or
information
may
be
sent
by
the
Company
in
hard
copy
form,
electronic
form,
by
being
made
available
on
a
website,
or
by
another
means
agreed
with
the
recipient,
in
accordance
with
the
provisions
set
out
in
the
Companies
Act
2006.
Accordingly,
a
document
or
information
may
only
be
sent
in
electronic
form
to
a
person
who
has
agreed
to
receive
it
in
that
form
or,
in
the
case
of
a
company,
who
has
been
de
emed
to
have
so
agreed
pursuant
to
applicable
legislation.
A
document
or
information
may
only
be
sent
by
being
made
available
on
a
website
if
the
recipient
has
agreed
to
receive
it
in
that
form
or
has
been
deemed
to
have
so
agreed
pursuant
to
applicable
legislation,
and
has
not
revoked
that
agreement.
In
respect
of
joint
holdings,
documents
or
information
shall
be
sent
to
the
joint
holder
whose
name
stands
first
in
the
register.
A
member
who
(having
no
registered
address
within
the
UK)
has
not
supplied
an
address
in
the
UK
at
which
documents
or
information
may
be
sent
in
hard
copy
form,
or
an
address
to
which
notices,
documents
or
information
may
be
sent
or
supplied
by
electronic
means,
is
not
entitled
to
have
documents
or
information
sent
to
him/her.
In
addition,
the
Company
may
cease
to
send
notices
to
any
member
who
has
been
sent
documents
on
two
consecutive
occasions
over
a
period
of
at
least
12
months
and
when
each
of
those
documents
is
returned
undelivered
or
notification
is
received
that
they
have
n
ot
been
delivered.
Capitalisation
of
profits
The
Company
may,
by
ordinary
resolution,
upon
the
recommendation
of
the
Board
capitalise
all
or
any
part
of
an
amount
standing
to
the
credit
of
a
reserve
or
fund
to
be
set
free
for
distribution
provided
that
am
ounts
from
the
share
premium
account,
capital
redemption
reserve
or
any
profits
not
available
for
distribution
should
be
applied
only
in
paying
up
unissued
shares
to
be
allotted
to
members
credited
as
fully
paid
and
no
unrealised
profits
shall
be
applied
in
paying
up
debentures
of
the
Company
or
any
amount
unpaid
on
any
share
in
the
capital
of
the
Company.
Indemnity
Subject
to
applicable
legislation,
every
current
and
former
Director
or
other
officer
of
the
Company
(other
than
any
person
engaged
by
the
com
pany
as
auditor)
shall
be
indemnified
by
the
Company
against
any
liability
in
relation
to
the
Company,
other
than
(broadly)
any
liability
to
the
Company
or
a
member
of
the
Group,
or
any
criminal
or
regulatory
fine.
Variation
of
Rights
The
rights
attached
to
any
class
of
shares
may
be
varied
either
with
the
consent
in
writing
of
the
holders
of
at
least
75%
in
nominal
value
of
the
issued
shares
of
that
class,
or
with
the
sanction
of
a
special
resolution
passed
at
a
separate
meeting
of
the
holders
of
the
shar
es
of
that
class.
The
rights
of
shares
shall
not
(unless
expressly
provided
by
the
rights
attached
to
such
shares)
be
deemed
varied
by
the
creation
of
further
shares
ranking
equally
with
them
or
subsequent
to
them.
Additional
information
Barclays
Bank
PLC
2019
Annual
Report
on
Form
20-F
200
Limitations
on
foreign
shareholders
Ther
e
are
no
restrictions
imposed
by
the
Articles
of
Association
or
(subject
to
the
effect
of
any
economic
sanctions
that
may
be
in
force
from
time
to
time)
by
current
UK
laws
which
relate
only
to
non
-
residents
of
the
UK
and
which
limit
the
rights
of
such
non
-
residents
to
hold
or
(when
entitled
to
do
so)
vote
the
ordinary
shares.
Special
rights
There
are
no
persons
holding
securities
that
carry
special
rights
with
regard
to
the
control
of
the
company.
Additional
information
Barclays
Bank
PLC
2019
Annual
Report
on
Form
20-F
201
Taxation
of
UK
holders
The
following
is
a
summary
of
certain
UK
tax
issues
which
are
likely
to
be
material
to
the
holding
and
disposal
of
Preference
Shares
of
Barclays
Bank
PLC
or
ADSs
representing
such
Preference
Shares
(the
‘Shares’).
It
is
based
on
the
current
laws
of
England
and
Wales,
UK
tax
law
and
the
practice
of
Her
Majesty’s
Revenue
and
Customs
(‘HMRC’),
each
of
which
may
be
subject
to
change,
possibly
with
retrospective
effect.
It
is
a
general
guide
for
information
purposes
and
should
be
treated
with
appropriate
caution.
It
is
not
intended
as
tax
advice
and
it
does
not
purport
to
describe
all
of
the
tax
considerations
that
may
be
relevant
to
a
prospective
purchaser,
holder
or
disposer
of
Shares.
In
particular,
save
where
expressly
stated
to
the
contrary,
this
summary
deals
with
shareholders
who
are
resident
and,
in
the
case
of
individuals,
domiciled
in
(and
only
in)
the
UK
for
UK
tax
purposes,
who
hold
their
Shares
as
investments
(other
than
under
an
individual
savings
account)
and
who
are
the
absolute
beneficial
owners
of
their
Shares
and
any
divide
nds
paid
on
them.
The
statements
are
not
addressed
to:
(i)
shareholders
who
own
(or
are
deemed
to
own)
10%
or
more
of
the
voting
power
of
Barclays
Bank
PLC;
(ii)
shareholders
who
hold
Shares
as
part
of
hedging
transactions;
(iii)
investors
who
have
(or
are
deemed
to
have)
acquired
their
Shares
by
virtue
of
an
office
or
employment;
and
(iv)
shareholders
who
hold
Shares
in
connection
with
a
trade,
profession
or
vocation
carried
on
in
the
UK
(whether
through
a
branch
or
agency
or,
in
the
case
of
a
corporate
shareholder,
through
a
permanent
establishment,
or
otherwise).
It
does
not
discuss
the
tax
treatment
of
classes
of
shareholder
subject
to
special
rules,
such
as
dealers
in
securities.
Persons
who
are
in
any
doubt
as
to
their
tax
position
should
consult
their
professional
advisers.
Persons
who
may
be
liable
to
taxation
in
jurisdictions
other
than
the
UK
in
respect
of
their
acquisition,
holding
or
disposal
of
Shares
are
particularly
advised
to
consult
their
professional
advisers
as
to
whether
they
are
so
liable.
(i)
Taxation
of
dividends
In
accordance
with
UK
law,
Barclays
Bank
PLC
pays
dividends
on
the
Shares
without
any
deduction
or
withholding
for
or
on
account
of
any
taxes
imposed
by
the
UK
government
or
any
UK
taxing
authority.
The
total
dividends
(including
any
dividends
paid
by
Barclays
Bank
PLC)
paid
to
a
UK
resident
individual
shareholder
in
a
tax
year
(the
‘Total
Dividend
Income’)
will
generally
form
part
of
that
shareholder’s
total
income
for
UK
income
tax
purposes,
and
will
be
subject
to
UK
income
tax
at
the
rates
discussed
below.
For
dividends
paid
on
or
after
6
April
2016,
the
rate
of
UK
income
tax
applicable
to
the
Total
Dividend
Income
will
depend
on
the
amount
of
the
Total
Dividend
Income
and
the
UK
income
tax
band(s)
that
the
Total
Dividend
Income
falls
within
when
included
as
part
of
the
shareholder’s
total
income
for
UK
income
tax
purposes
for
that
tax
year.
For
the
tax
year
from
6
April
2019
to
5
April
2020
(inclusive),
a
nil
rate
of
UK
income
tax
applies
to
the
first
£2,00
0
of
Total
Dividend
Income
received
by
an
individual
shareholder
in
that
tax
year
(the
‘Nil
Rate
Amount’).
For
the
2018
-
2019
tax
year,
the
Nil
Rate
Amount
was
£2,000.
For
the
2016
-
2017
and
2017
-
2018
tax
years,
the
Nil
Rate
Amount
was
£5,000.
Where
the
Tot
al
Dividend
Income
received
by
an
individual
shareholder
in
a
tax
year
exceeds
the
relevant
Nil
Rate
Amount
for
that
tax
year,
the
excess
amount
(the
‘Remaining
Dividend
Income’)
will
be
subject
to
UK
income
tax
at
the
following
rates:
(a)
at
the
rate
of
7.5%
on
any
portion
of
the
Remaining
Dividend
Income
that
falls
within
the
basic
tax
band;
(b)
at
the
rate
of
32.5%
on
any
portion
of
the
Remaining
Dividend
Income
that
falls
within
the
higher
tax
band;
and
(c)
at
the
rate
of
38.1%
on
any
portion
of
the
Remaining
Dividend
Income
that
falls
within
the
additional
tax
band.
In
determining
the
tax
band
the
Remaining
Dividend
Income
falls
within
for
a
tax
year,
the
individual
shareholder’s
Total
Dividend
Income
for
the
tax
year
in
question
(including
the
portion
comprising
the
Nil
Rate
Amount)
will
be
treated
as
the
top
slice
of
the
shareholder’s
total
income
for
UK
income
tax
purposes.
Subject
to
special
rules
for
small
companies,
UK
resident
shareholders
within
the
charge
to
U
K
corporation
tax
will
not
generally
be
subject
to
UK
corporation
tax
on
the
dividends
paid
on
the
Shares,
provided
the
dividend
falls
within
an
exempt
class
and
certain
conditions
are
met.
(ii)
Taxation
of
capital
gains
The
disposal
of
Shares
may,
depending
on
the
shareholder’s
circumstances,
give
rise
to
a
liability
to
UK
tax
on
chargeable
capital
gains.
Where
Shares
are
sold,
a
liability
to
UK
tax
may
result
if
the
proceeds
from
that
sale
exceed
the
sum
of
the
base
cost
of
the
Shares
sold
an
d
any
other
allowable
deductions
such
as
share
dealing
costs
and,
in
certain
circumstances,
indexation
relief
(discussed
further
below).
For
this
purpose,
current
legislation
permits
the
market
valuation
at
31
March
1982
to
be
substituted
for
the
original
cost
of
shares
purchased
before
that
date,
subject
to
certain
exceptions
for
shareholders
within
the
charge
to
UK
corporation
tax.
Shareholders
other
than
those
within
the
charge
to
UK
corporation
tax
should
note
that,
following
the
Finance
Act
2008,
no
indexation
allowance
will
be
available.
Following
the
Finance
Act
2018,
shareholders
within
the
charge
to
UK
corporation
tax
may
be
eligible
for
indexation
allowance
for
the
period
of
ownership
of
their
Shares
up
to
December
2017,
but
no
indexation
allowance
will
be
available
in
respect
of
the
period
of
ownership
starting
on
or
after
1
January
2018.
Chargeable
capital
gains
may
also
arise
from
the
gifting
of
Shares
to
connected
parties
such
as
relatives
(although
not
spouses
or
civil
partners)
and
family
tru
sts.
The
calculations
required
to
compute
chargeable
capital
gains
may
be
complex.
Shareholders
are
advised
to
consult
their
personal
financial
adviser
if
further
information
regarding
a
possible
tax
liability
in
respect
of
their
holdings
of
shares
is
req
uired.
Additional
information
Barclays
Bank
PLC
2019
Annual
Report
on
Form
20-F
202
(iii)
Stamp
duty
and
stamp
duty
reserve
tax
Dealings
in
Shares
will
generally
be
subject
to
UK
stamp
duty
or
stamp
duty
reserve
tax
(although
see
the
comments
below
as
regards
ADSs
in
the
section
‘Taxation
of
US
holders
–
UK
stamp
duty
and
stamp
duty
reserve
tax’).
The
transfer
on
sale
of
Shares
will
generally
be
liable
to
stamp
duty
at
0.5%
of
the
consideration
paid
for
that
transfer
(rounded
up
to
the
next
£
5).
An
unconditional
agreement
to
transfer
Shares,
or
any
interest
therein,
will
generally
be
subject
to
stamp
duty
reserve
tax
at
0.5%
of
the
consideration
given.
Such
liability
to
stamp
duty
reserve
tax
will
be
cancelled,
or
a
right
to
a
repayment
(generally
with
interest)
in
respect
of
the
stamp
duty
reserve
tax
liability
will
arise,
if
the
agreement
is
completed
by
a
duly
stamped
transfer
within
six
years
of
the
agreement
having
become
unconditional.
Both
stamp
duty
and
stamp
duty
reserve
tax
are
normally
the
liability
of
the
transferee.
Paperless
transfers
of
Shares
within
CREST
ar
e
liable
to
stamp
duty
reserve
tax
rather
than
stamp
duty.
Stamp
duty
reserve
tax
on
transactions
settled
within
the
CREST
system
or
reported
through
it
for
regulatory
purposes
will
be
collected
by
CREST.
Special
rules
apply
to
certain
categories
of
person,
including
intermediaries,
market
makers,
brokers,
dealers
and
persons
connected
with
depositary
arrangements
and
clearance
services.
(iv)
Inheritance
tax
An
individual
may
be
liable
to
inheritance
tax
on
the
transfer
of
Shares.
Where
an
individual
is
so
liable,
inheritance
tax
may
be
charged
on
the
amount
by
which
the
value
of
his
or
her
estate
is
reduced
as
a
result
of
any
transfer
by
way
of
gift
or
other
gratuitous
transaction
made
by
them
or
treated
as
made
by
them.
Taxation
of
US
Hol
ders
The
following
is
a
summary
of
certain
US
federal
income
tax
considerations
and
certain
UK
tax
considerations
to
the
purchase,
ownership,
and
disposition
of
Preference
Shares
of
Barclays
Bank
PLC
or
ADSs
representing
such
Preference
Shares
(the
"
Shares
")
that
are
likely
to
be
relevant
for
US
Holders
(as
defined
below)
who
own
the
Shares
as
capital
assets
for
tax
purposes.
This
discussion
is
not
a
comprehensive
analysis
of
all
the
potential
US
or
UK
tax
consequences
that
may
be
relevant
to
US
Holders
and
does
not
discuss
particular
tax
consequences
that
may
be
applicable
to
US
Holders
who
may
be
subject
to
special
tax
rules
such
as
banks,
brokers
or
dealers
in
securities
or
currencies,
traders
in
securities
that
elect
to
use
a
mark
-
to-
market
method
of
acc
ounting
for
securities
holdings,
financial
institutions,
tax-exempt
organisations,
regulated
investment
companies,
life
insurance
companies,
entities
or
arrangements
that
are
treated
as
partnerships
for
US
federal
income
tax
purposes
(or
partners
therein),
holders
that
own
or
are
treated
as
owning
10%
or
more
of
the
stock
of
Barclays
Bank
PLC
measured
either
by
voting
power
or
value,
holders
that
hold
Shares
as
part
of
a
straddle
or
a
hedging
or
conversion
transaction,
holders
that
purchase
or
sell
Shares
as
part
of
a
wash
sale,
holders
whose
functional
currency
is
not
the
US
Dollar,
or
holders
who
are
resident,
or
who
are
carrying
on
a
trade,
in
the
UK.
The
summary
also
does
not
address
state
or
local
taxes
or
any
aspect
of
US
federal
taxation
other
than
US
federal
income
taxation
(such
as
the
estate
and
gift
tax,
the
alternative
minimum
tax
or
the
Medicare
tax
on
net
investment
income).
Investors
are
advised
to
consult
their
tax
advisers
regarding
the
tax
implications
of
their
particular
holdings,
including
the
consequences
under
applicable
state
and
local
law,
and
in
particular
whether
they
are
eligible
for
the
benefits
of
the
Treaty
(as
defined
below).
This
discussion
is
based
on
the
Internal
Revenue
Code
of
1986,
as
amended
(the
‘Code’),
its
legislative
history,
existing
and
proposed
regulations,
published
rulings
and
court
decisions,
and
on
the
Double
Taxation
Convention
between
the
UK
and
the
US
as
entered
into
force
in
March
2003
(the
‘Treaty’),
and,
in
respect
of
UK
tax,
the
Estate
and
Gift
Tax
Conven
tion
between
the
UK
and
the
US
as
entered
into
force
on
11
November
1979
(the
‘Estate
and
Gift
Tax
Convention’),
the
current
UK
tax
law
and
the
practice
of
HMRC,
all
of
which
are
subject
to
change,
possibly
on
a
retroactive
basis.
This
discussion
is
based
in
part
upon
the
representations
of
the
ADR
Depositary
and
the
assumption
that
each
obligation
of
the
Deposit
Agreement
and
any
related
agreement
will
be
performed
in
accordance
with
its
terms.
A
“US
Holder”
is
a
beneficial
owner
of
Shares
that
is
a
citizen
or
resident
of
the
United
States
or
a
US
domestic
corporation
or
that
otherwise
is
subject
to
US
federal
income
taxation
on
a
net
income
basis
in
respect
of
such
Shares
and
that
is
fully
eligible
for
benefits
under
the
Treaty.
In
general,
the
holders
o
f
ADRs
evidencing
ADSs
will
be
treated
as
owners
of
the
underlying
Preference
Shares
for
the
purposes
of
the
Treaty,
the
Estate
and
Gift
Tax
Convention,
and
the
Code.
Generally,
exchanges
of
shares
for
ADRs
and
ADRs
for
shares
will
not
be
subject
to
US
fed
eral
income
tax
or
to
UK
capital
gains
tax.
Taxation
of
dividends
Subject
to
the
PFIC
rules
discussed
below,
the
gross
amount
of
any
distribution
of
cash
or
property
with
respect
to
the
Shares
(including
any
amount
withheld
in
respect
of
UK
taxes)
that
is
paid
out
of
Barclays
Bank
PLC’s
current
or
accumulated
earnings
and
profits
(as
determined
for
US
federal
income
tax
purposes)
will
be
includible
in
a
US
Holder’s
taxable
income
as
ordinary
dividend
income
on
the
day
such
US
Holder
receives
the
dividend,
in
the
case
of
Preference
Shares,
or
the
date
the
Depositary
receives
the
dividends,
in
the
case
of
ADRs,
and
will
not
be
eligible
for
the
dividends
-
received
deduction
allowed
to
corporations
under
the
Code.
Subject
to
certain
exceptions
for
short
-
term
positions,
dividends
paid
by
Barclays
Bank
PLC
to
an
individual
with
respect
to
the
Shares
will
generally
be
subject
to
taxation
at
a
preferential
rate
if
the
dividends
are
“qualified
dividend
income.”
Dividends
paid
on
the
Shares
will
be
treated
as
qualified
dividend
income
if
(i)
the
Shares
are
readily
tradable
on
an
established
securities
market
in
the
United
States
or
Barclays
Bank
PLC
is
eligible
for
the
benefits
of
a
comprehensive
tax
treaty
with
the
United
States
that
the
US
Treasury
determines
is
satisfactory
for
purposes
of
this
provision
and
that
includes
an
exchange
of
information
program,
and
(ii)
Barclays
Bank
PLC
was
not
a
PFIC
(as
defined
below)
in
the
year
of
the
distribution
or
the
immediately
preceding
taxable
year.
The
US
Treasury
ha
s
determined
that
the
Treaty
meets
the
requirements
for
reduced
rates
of
taxation,
and
Barclays
Bank
PLC
believes
that
it
is
eligible
for
the
benefits
of
the
Treaty.
Based
on
its
audited
financial
statements
and
relevant
market
and
shareholder
date,
Barcla
ys
Bank
PLC
believes
that
it
was
not
treated
as
a
PFIC
for
US
federal
income
tax
purposes
with
respect
to
its
2019
or
2018
Additional
information
Barclays
Bank
PLC
2019
Annual
Report
on
Form
20-F
203
taxable
years.
In
addition,
based
on
its
audited
financial
statements
and
current
expectations
regarding
the
value
and
nature
of
its
assets,
the
sources
and
nature
of
its
income,
and
relevant
market
and
shareholder
data,
Barclays
Bank
PLC
does
not
anticipate
becoming
a
PFIC
for
its
current
taxable
year
or
in
the
foreseeable
future.
Dividends
paid
by
Barclays
Bank
PLC
to
a
US
Holder
with
respect
to
the
Shares
will
not
be
subject
to
UK
withholding
tax.
For
foreign
tax
credit
purposes,
dividends
will
generally
be
income
from
sources
outside
the
US
and
will
generally
be
“passive”
income
for
purposes
of
computing
the
foreign
tax
credit
allow
able
to
a
US
Holder.
The
amount
of
the
dividend
distribution
includable
in
income
will
be
the
US
Dollar
value
of
the
distribution,
determined
at
the
spot
Pound
Sterling/US
Dollar
rate
on
the
date
the
dividend
distribution
is
includable
in
income,
regardle
ss
of
whether
the
payment
is
in
fact
converted
into
US
Dollars.
Generally,
any
gain
or
loss
resulting
from
currency
exchange
fluctuations
during
the
period
from
the
date
the
dividend
payment
is
includable
in
income
to
the
date
the
payment
is
converted
into
US
Dollars
will
be
treated
as
ordinary
income
or
loss
and,
for
foreign
tax
credit
limitation
purposes,
from
sources
within
the
US,
and
will
not
be
eligible
for
the
special
tax
rates
applicable
to
qualified
dividend
income.
Distributions
in
excess
of
curr
ent
or
accumulated
earnings
and
profits,
as
determined
for
US
federal
income
tax
purposes,
will
be
treated
as
a
return
of
capital
to
the
extent
of
the
US
Holder’s
basis
in
the
Shares
and
thereafter
as
capital
gain.
Because
Barclays
Bank
PLC
does
not
curren
tly
maintain
calculations
of
earnings
and
profits
for
US
federal
income
tax
purposes,
US
Holders
should
expect
that
distributions
with
respect
to
the
Shares
will
generally
be
treated
as
dividends.
US
Holders
that
receive
a
distribution
of
additional
share
s
or
rights
to
subscribe
for
additional
shares
as
part
of
a
pro
rata
distribution
to
all
our
shareholders
generally
will
not
be
subject
to
US
federal
income
tax
in
respect
of
the
distribution,
unless
the
US
Holder
has
the
right
to
receive
cash
or
property,
in
which
case
the
US
Holder
will
be
treated
as
if
it
received
cash
equal
to
the
fair
market
value
of
the
distribution.
Taxable
sale
or
other
disposition
of
Shares
Subject
to
the
PFIC
rules
discussed
below,
upon
a
sale
or
other
taxable
disposition
of
the
Shares,
US
Holders
generally
will
not
be
subject
to
UK
tax,
but
will
realise
gain
or
loss
for
US
federal
income
tax
purposes
in
an
amount
equal
to
the
difference
between
the
US
Dollar
value
of
the
amount
realised
on
the
disposition
and
the
US
Holder’s
adju
sted
tax
basis
in
the
Shares,
as
determined
in
US
Dollars.
Such
gain
or
loss
will
be
capital
gain
or
loss,
and
will
generally
be
long
-
term
capital
gain
or
loss
if
the
Shares
have
been
held
for
more
than
one
year.
Long
-
term
capital
gain
of
a
noncorporate
US
Holder
is
generally
taxed
at
preferential
rates.
The
gain
or
loss
will
generally
be
income
or
loss
from
sources
within
the
United
States
for
foreign
tax
credit
limitation
purposes.
The
deductibility
of
capital
losses
is
subject
to
limitations.
Taxation
of
passive
foreign
investment
companies
(PFICs)
Barclays
Bank
PLC
believes
that
its
Shares
should
not
be
treated
as
stock
of
a
passive
foreign
investment
company
(“PFIC”)
for
US
federal
income
tax
purposes,
but
this
conclusion
is
a
factual
determination
that
is
made
annually
and
thus
may
be
subject
to
change.
In
general,
Barclays
Bank
PLC
will
be
a
PFIC
with
respect
to
a
US
Holder
if,
for
any
taxable
year
in
which
a
US
Holder
holds
the
Shares,
either
(i)
at
least
75%
of
the
gross
income
of
Barclays
Bank
PLC
for
the
taxable
year
is
passive
income,
or
(ii)
at
least
50%
of
the
value,
determined
on
the
basis
of
a
quarterly
average,
of
Barclays
Bank
PLC’s
assets
is
attributable
to
assets
that
produce
or
are
held
for
the
production
of
passive
income
(including
cash).
With
certain
exceptions,
a
US
Holder’s
Shares
will
be
treated
as
stock
of
a
PFIC
if
Barclays
Bank
PLC
was
a
PFIC
at
any
time
during
such
holder’s
holding
period
in
its
Shares.
If
Barclays
Bank
PLC
were
to
be
treated
as
a
PFIC
with
respect
to
a
US
Hold
er,
unless
such
US
Holder
elected
to
be
taxed
annually
on
a
mark
-
to-
market
basis
with
respect
to
its
Shares,
such
gain
and
certain
‘excess
distributions’
would
be
treated
as
having
been
realised
ratably
over
a
US
Holder’s
holding
period
for
the
Shares
and
generally
would
be
taxed
at
the
highest
tax
rate
in
effect
for
each
such
year
to
which
the
gain
was
allocated,
together
with
an
interest
charge
in
respect
of
the
tax
attributable
to
each
such
year.
UK
stamp
duty
and
stamp
duty
reserve
tax
No
obligation
to
pay
UK
stamp
duty
will
arise
on
the
transfer
on
sale
of
an
ADS,
provided
that
any
instrument
of
transfer
is
not
executed
in,
and
remains
at
all
times
outside,
the
UK.
No
UK
stamp
duty
reserve
tax
is
payable
in
respect
of
an
agreement
to
transfer
an
ADS.
For
the
UK
stamp
duty
and
stamp
duty
reserve
tax
implications
of
dealings
in
Preference
Shares,
see
the
section
“Taxation
of
UK
holders
–
(iii)
Stamp
duty
and
stamp
duty
reserve
tax”
above.
UK
estate
and
gift
tax
Under
the
Estate
and
Gift
Tax
Convention,
Shares
held
by
an
individual
a
US
holder
who
is
US
domiciled
for
the
purposes
of
the
Estate
and
Gift
Tax
Convention
and
who
is
not
for
such
purposes
a
UK
national
generally
will
not,
provided
any
US
federal
estate
or
gift
tax
chargeable
has
been
paid,
be
subject
to
UK
inheritance
tax
on
the
individual’s
death
or
on
a
lifetime
transfer
of
Shares,
except
in
certain
cases
where
the
Shares
are
comprised
in
a
settlement
(unless
the
settlor
was
US
domiciled
and
not
a
UK
national
at
the
time
of
the
settlement),
ar
e
part
of
the
business
property
of
a
UK
permanent
establishment
of
an
enterprise,
or
pertain
to
a
UK
fixed
base
of
an
individual
used
for
the
performance
of
independent
personal
services.
In
cases
where
the
Shares
are
subject
to
both
UK
inheritance
tax
and
US
federal
estate
or
gift
tax,
the
Estate
and
Gift
Tax
Convention
generally
provides
a
credit
against
US
federal
tax
liability
for
the
amount
of
any
inheritance
tax
paid
in
the
UK.
Foreign
Financial
Asset
Reporting
Certain
US
Holders
that
own
“specified
foreign
financial
assets”
with
an
aggregate
value
in
excess
of
US$50,000
on
the
last
day
of
the
taxable
year
or
US$75,000
at
any
time
during
the
taxable
year
are
generally
required
to
file
an
information
statement
along
with
their
tax
returns,
currently
on
Form
8938,
with
respect
to
such
assets.
“Specified
foreign
financial
assets”
include
any
financial
accounts
held
at
a
non
-
US
financial
institution,
as
well
as
securities
issued
by
a
non
-
US
issuer
that
are
not
held
in
accounts
maintained
by
financial
institutions.
The
understatement
of
income
Additional
information
Barclays
Bank
PLC
2019
Annual
Report
on
Form
20-F
204
attributable
to
“specified
foreign
financial
assets”
in
excess
of
US$5,000
extends
the
statute
of
limitations
with
respect
to
the
tax
return
to
six
years
after
the
return
was
filed.
US
Holders
who
fail
to
report
the
req
uired
information
could
be
subject
to
substantial
penalties.
Prospective
investors
are
encouraged
to
consult
with
their
own
tax
advisors
regarding
the
possible
application
of
these
rules,
including
the
application
of
the
rules
to
their
particular
circumsta
nces.
Backup
Withholding
and
Information
Reporting
Dividends
paid
on,
and
proceeds
from
the
sale
or
other
disposition
of,
the
Shares
to
a
US
Holder
generally
may
be
subject
to
the
information
reporting
requirements
of
the
Code
and
may
be
subject
to
backup
withholding
unless
the
US
Holder
provides
an
accurate
taxpayer
identification
number
and
makes
any
other
required
certification
or
otherwise
establishes
an
exemption.
Backup
withholding
is
not
an
additional
tax.
The
amount
of
any
backup
withholding
from
a
payment
to
a
US
Holder
will
be
allowed
as
a
refund
or
credit
against
the
US
Holder’s
US
federal
income
tax
liability,
provided
the
required
information
is
furnished
to
the
US
Internal
Revenue
Service
(“IRS”)
in
a
timely
manner.
A
holder
that
is
not
a
US
Ho
lder
may
be
required
to
comply
with
certification
and
identification
procedures
in
order
to
establish
its
exemption
from
information
reporting
and
backup
withholding.
FATCA
Risk
Factor
In
certain
circumstances,
payments
on
shares
or
ADSs
may
be
subject
to
US
withholding
taxes
on
“passthru
payments,”
starting
on
the
date
that
is
two
years
after
the
date
on
which
final
regulations
defining
this
concept
are
adopted
in
the
United
States.
Under
the
“Foreign
Account
Tax
Compliance
Act”
(or
“FATCA”),
as
well
as
intergovernmental
agreements
between
the
United
States
and
other
countries
and
implementing
laws
in
respect
of
the
foregoing,
certain
US-
source
payments
(including
dividends
and
interest)
and
certain
payments
mad
e
by,
and
financial
accounts
held
with,
entities
that
are
classified
as
financial
institutions
under
FATCA
are
subject
to
a
special
information
reporting
and
withholding
tax
regime.
Regulations
implementing
withholding
in
respect
of
“passthru
payments”
und
er
FATCA
have
not
yet
been
adopted
or
proposed.
The
United
States
has
entered
into
an
intergovernmental
agreement
regarding
the
implementation
of
FATCA
with
the
UK
(the
“UK
IGA”).
Under
the
UK
IGA,
as
currently
drafted,
it
is
not
expected
that
Barclays
Ban
k
PLC
will
be
required
to
withhold
tax
under
FATCA
on
payments
made
with
respect
to
the
shares
or
ADSs.
However,
significant
aspects
of
when
and
how
FATCA
will
apply
remain
unclear,
and
no
assurance
can
be
given
that
withholding
under
FATCA
will
not
become
relevant
with
respect
to
payments
made
on
or
with
respect
to
the
shares
or
ADSs
in
the
future.
Investors
should
consult
their
own
tax
advisers
regarding
the
potential
impact
of
FATCA.
The
Barclays
Group
has
registered
with
the
Internal
Revenue
Service
(‘IRS’)
for
FATCA.
The
Global
Intermediary
Identification
Number
(GIIN)
for
Barclays
Bank
PLC
in
the
United
Kingdom
is
E1QAZN.00001.ME.826
and
it
is
a
Reporting
Model
1
FFI.
The
GIINs
for
other
parts
of
the
Barclays
Group
or
Barclays
branches
outside
of
the
UK
may
be
obtained
from
your
usual
Barclays
contact
on
request.
The
IRS
list
of
registered
Foreign
Financial
Institutions
is
publicly
available
on
the
IRS
website.
Exchange
controls
and
other
limitations
affecting
security
holders
Other
than
certain
economic
sanctions
which
may
be
in
force
from
time
to
time,
there
are
currently
no
UK
laws,
decrees
or
regulations
which
would
affect
the
transfer
of
capital
or
remittance
of
dividends,
interest
and
other
payments
to
holders
of
Barclays
securities
who
are
not
residents
of
the
UK.
There
are
also
no
restrictions
under
the
Articles
of
Association
of
Barclays
Bank
PLC
,
or
(subject
to
the
effect
of
any
such
economic
sanctions)
under
current
UK
laws,
which
relate
only
to
non
-
residents
of
the
UK,
and
which
limit
the
right
of
such
non
-
residents
to
hold
Barclays
securities
or,
when
entitled
to
vote,
to
do
so.
Documents
on
display
It
is
possible
to
read
and
copy
documents
that
have
been
filed
by
Barclays
Bank
PLC
with
the
US
Securities
and
Exchange
Commission
via
commercial
document
retrieval
services,
and
from
the
website
maintained
by
the
US
Securities
and
Exchange
Commission
at
www.sec.gov
.
Additional
information
Barclays
Bank
PLC
2019
Annual
Report
on
Form
20-F
205
External
auditor
objectivity
and
independence:
non
-audit
services
Our
policy
on
the
provision
of
services
by
the
Barclays
Bank
Group
’s
statutory
Auditor
(the
‘Policy’)
sets
out
the
circumstances
in
which
the
auditor
may
be
permitted
to
undertake
non
-
audit
work
for
the
Barclays
Bank
Group.
The
Board
Audit
Committee
overs
ees
compliance
with
the
Policy
and
considers
and,
if
appropriate,
approves
requests
to
use
the
Auditor
for
non-
audit
work.
Allowable
services
are
pre
-
approved
up
to
but
not
including
£100,000
.
The
Group
Finance
Director
and
the
Company
Secretary
and
their
teams
deal
with
day
-
to-
day
administration
of
the
Policy,
facilitating
requests
for
approval.
Details
of
the
services
that
are
prohibited
and
allowed
under
the
Policy
are
set
out
below:
Services
that
are
prohibited
include:
◾
b
ookkeeping;
◾
design
and
implementation
of
financial
information
systems;
◾
design
or
implementation
of
internal
controls
or
risk
management
services
related
to
financial
information
;
◾
*appraisal
or
valuation
services;
◾
fairness
opinions
or
contribution
-
in-
kind
reports;
◾
*actuarial
services;
◾
internal
audit;
◾
management
and
Human
Resources
functions;
◾
broker
or
dealer,
investment
advisor
or
investment
banking
services;
◾
legal,
expert
and
certain
*tax
services
or
personal
services
to
persons
in
a
financial
reporting
role;
and
◾
transaction
-
related
and
restructuring
services.
*these
may
be
permissible
subject
to
compliance
with
certain
requirements
.
Allowable
services
that
the
Board
Audit
Committee
considers
for
approval
include:
◾
statutory
audit
and
audit
related
services
and
regulatory
non
-
audit
services;
◾
other
attest
and
assurance
services;
◾
training,
surveys
and
software;
◾
risk
management
and
controls
advice;
◾
transaction
support;
◾
tax
compliance
services;
◾
business
support
and
recoveries;
and
◾
translation
services.
Disclosure
controls
and
procedures
The
Chief
Executive
Officer,
Jes
Staley,
and
the
Chief
Financial
Officer,
Steven
Ewart
,
conducted
with
Barclays
Bank
Group
Management
an
evaluation
of
the
effectiveness
of
the
design
and
operation
of
the
Barclays
Bank
Group’s
disclosure
co
ntrols
and
procedures
of
Barclays
Bank
PLC
as
at
31
December
2019,
which
are
defined
as
those
controls
and
procedures
designed
to
ensure
that
information
required
to
be
disclosed
in
reports
filed
or
submitted
under
the
US
Securities
Exchange
Act
of
1934
is
recorded,
processed,
summarised
and
reported
within
the
time
periods
specified
in
the
US
Securities
and
Exchange
Commission’s
rules
and
forms.
As
of
the
date
of
the
evaluation,
the
Chief
Executive
Officer
and
Chief
Financial
Officer
concluded
that
the
design
and
operation
of
these
disclosure
controls
and
procedures
were
effective.
Additional
information
Barclays
Bank
PLC
2019
Annual
Report
on
Form
20-F
206
Section
13(r)
to
the
US
Securities
Exchange
Act
of
1934
(Iran
sanctions
and
related
disclosure)
Section
13(r)
of
the
U.S.
Securities
Exchange
Act
of
1934,
as
amended
(the
“Exchange
Act”)
requires
each
SEC
reporting
issuer
to
disclose
in
its
annual
and,
if
applicable,
quarterly
reports
whether
it
or
any
of
its
affiliates
have
knowingly
engaged
in
certain
activities,
transactions
or
dealings
relating
to
Iran
o
r
with
the
Government
of
Iran
or
certain
designated
natural
persons
or
entities
involved
in
terrorism
or
the
proliferation
of
weapons
of
mass
destruction
during
the
period
covered
by
the
report.
The
requirement
includes
disclosure
of
activities
not
prohibi
ted
by
U.S.
or
other
law
even
if
conducted
outside
the
U.S.
by
non
-
U.S.
companies
or
affiliates
in
compliance
with
local
law.
Pursuant
to
Section
13(r)
of
the
Exchange
Act
we
note
the
following
in
relation
to
activity
occurring
in
2019,
the
period
covered
by
this
annual
report,
or
in
relation
to
activity
we
became
aware
of
in
2019
relating
to
disclosable
activity
prior
to
the
reporting
period.
Except
as
noted
below,
Barclays
intends
to
continue
the
activities
described.
Barclays
does
not
allocate
profits
at
the
level
of
these
activities,
which
in
any
event
would
not
be
significant,
and
we
therefore
report
only
gross
revenue
where
measurable.
Barclays
attributed
revenue
of
approximately
GBP
665
in
2019
in
relation
to
the
activities
disclosed
below.
Legacy
Guarantees
Between
1993
and
2006,
Barclays
entered
into
several
guarantees
for
the
benefit
of
Iranian
banks
in
connection
with
the
supply
of
goods
and
services
by
Barclays
customers
to
Iranian
buyers.
These
were
counter
guarantees
issued
to
the
Iranian
ban
ks
to
support
guarantees
issued
by
these
banks
to
the
Iranian
buyers.
The
Iranian
banks
and
a
number
of
the
Iranian
buyers
were
subsequently
designated
as
Specially
Designated
Nationals
and
Blocked
Persons
(“SDN”)
by
the
U.S.
Department
of
the
Treasury,
Office
of
Foreign
Assets
Control
(“OFAC”).
In
addition,
between
1993
and
2005,
Barclays
entered
into
similar
guarantees
for
the
benefit
of
a
Syrian
bank
that
was
subsequently
designated
pursuant
to
the
Weapons
of
Mass
Destruction
Proliferators
Sanctions
Regu
lations
in
August
2011.
The
guarantees
were
issued
either
on:
(i)
an
“extend
or
pay”
basis
which
means
that,
although
the
guarantee
is
of
limited
duration
on
its
face,
until
there
is
full
performance
under
the
contract
to
provide
goods
and
services,
the
terms
of
the
guarantee
require
Barclays
to
either
maintain
the
guarantee
or
pay
the
beneficiary
bank
the
full
amount
of
the
guarantee;
or
(ii)
the
basis
that
Barclays
obligations
can
only
be
discharged
with
the
consent
of
the
beneficiary
counterparty.
Barclays
is
not
able
to
exit
its
obligations
under
the
guarantees
unilaterally,
and
thus
maintains
a
limited
legacy
portfolio
of
these
guarantees.
The
guarantees
were
in
compliance
with
applicable
laws
and
regulations
at
the
time
at
which
they
were
entered
into.
Barclays
intends
to
terminate
the
guarantees
where
an
agreement
can
be
reached
with
the
counterparty,
in
accordance
with
applicable
laws
and
regulations.
Barclays
attributed
no
revenue
in
2019
in
relation
to
this
activity.
Lease
Payments
Barclays
is
party
to
a
long
-
term
lease,
entered
into
in
1979,
with
the
National
Iranian
Oil
Company
(“NIOC”),
pursuant
to
which
Barclays
rents
part
of
NIOC
House
in
London
for
a
Barclays
bank
branch.
The
lease
is
for
60
years,
contains
no
early
termination
clause,
and
has
20
years
remaining.
Barclays
makes
quarterly
lease
payments
in
GBP
to
an
entity
that
is
owned
by
the
Government
of
Iran.
The
payments
are
made
in
accordance
with
applicable
laws
and
regulations.
Barclays
attributed
no
revenue
in
2019
in
relation
to
this
activity.
Local
Clearing
Systems
Banks
in
the
United
Arab
Emirates
(“UAE”),
including
certain
Iranian
banks
that
are
SDNs,
participate
in
the
various
banking
payment
and
settlement
systems
used
in
the
UAE
(the
“UAE
Clearing
Systems”).
Barclays,
by
v
irtue
of
its
banking
activities
in
the
UAE,
participates
in
the
UAE
Clearing
Systems,
in
accordance
with
applicable
laws
and
regulations.
However,
in
order
to
help
mitigate
the
risk
of
engaging
in
transactions
in
which
participant
Iranian
SDN
banks
may
be
involved,
Barclays
has
implemented
restrictions
relating
to
its
involvement
in
the
UAE
Image
Cheque
Clearance
System
and
the
UAE
Funds
Transfer
System
activity,
as
well
as
restricting
activity
via
the
Wages
Protection
Scheme.
Barclays
attributed
no
revenue
in
2019
in
relation
to
this
activity.
Payments
Notified
A
Barclays
customer
was
designated
pursuant
to
the
Global
Terrorism
Sanctions
Regulations
(“GTSR”)
in
March
2016.
Barclays
continues
to
receive
credit
card
repayments
from
this
customer
in
accordanc
e
with
applicable
laws
and
regulations.
A
block
continues
to
be
applied
to
the
card
to
prevent
any
further
spending.
Barclays
attributed
revenue
of
approximately
GBP
480
in
2019
in
relation
to
this
activity.
In
2019,
Barclays
processed
three
euro
payments
relating
to
overflight
charges,
a
portion
of
which
were
for
the
overflight
of
Iranian
airspace.
It
is
presumed
that
the
ultimate
beneficiary
of
the
outbound
payments
was
a
Government
of
Iran
owned
entity.
The
payments
were
made
in
accordance
with
applicable
laws
and
regulations.
No
payments
were
made
directly
to
Iran
or
any
entity
owned
or
controlled
by
the
Government
of
Iran.
Although
OFAC
has
issued
a
general
license
relating
to
payments
for
overflights
of
Iranian
airspace,
it
does
not
technically
apply
to
aircraft
owned
by
non
-
U.S.
persons,
or
registered
outside
of
the
U.S.
Barclays
attributed
revenue
of
approximately
GBP
30
in
2019
in
relation
to
this
activity.
Barclays
maintains
customer
relationships
with
UK
-
incorporated
medical
manufacturing
companies.
In
2018
and
2019,
Barclays
processed
several
payments,
for
the
benefit
of
our
customer,
relating
to
the
export
of
medical
devices
to
privately
-
owned
Iranian
entities.
The
end
users
of
these
medical
devices
include
hospitals
or
clinics
that
may
be
owned
or
controlled
by
the
Government
of
Iran.
The
payments
were
made
in
accordance
with
applicable
laws
and
regulations.
All
payments
were
received
from
the
privately
-
owned
Iranian
entities;
no
payments
were
received
directly
from
any
entity
owned
or
controlled
by
the
Government
of
Iran.
Although
OFAC
has
issued
general
licenses
relating
to
the
sale
of
medical
devices,
they
do
not
technically
apply
to
sales
of
non
-
U.S.
origin
items
by
non
-
U.S.
persons.
Barclays
attributed
revenue
of
approximately
GBP
60
in
2019
in
relation
to
this
activity.
Barclays
maintains
customer
relationships
with
several
individuals
who
work
for
UK
-
based
entities
that
are
ultimately
owned
by
the
Government
of
Iran
and
are
OFAC
SDNs.
Payments
are
received,
in
GBP,
from
a
UK
-
based
payment
services
company,
in
cash,
or
from
the
customer’s
account
at
Additional
information
Barclays
Bank
PLC
2019
Annual
Report
on
Form
20-F
207
another
UK
-
based
financial
institution,
and
are
credited
to
the
customers’
accounts
with
Barclays.
The
payments
are
processed
in
accordance
with
applicable
laws
and
regulations.
No
paymen
ts
are
received
directly
from
any
entity
owned
by
the
Government
of
Iran
or
any
OFAC
SDN.
Barclays
attributed
no
revenue
in
2019
in
relation
to
this
activity.
Barclays
maintains
a
relationship
with
HM
Revenue
&
Customs
(“HMRC”),
a
UK
government
agency,
wh
ich
receives
funds
from
an
Iranian
SDN
financial
institution
in
relation
to
the
settlement
of
tax
liabilities
with
the
UK
Government.
The
payments
are
received
by
Barclays
and
credited
to
the
HMRC
account.
The
payment
activity
is
covered
by
a
license
issued
by
UK
HM
Treasury.
Barclays
attributed
revenue
of
approximately
GBP
40
in
2019
in
relation
to
this
activity.
Barclays
processed
three
transactions
to
embassies
of
the
Government
of
Iran
in
the
European
Union
in
relation
to
fees
for
renewing
Iranian
passports
or
replacing
Iranian
passports
that
had
been
lost
or
stolen.
The
payments
were
processed
in
accordance
with
applicable
laws
and
regulations.
Barclays
attributed
revenue
of
approximately
GBP
55
in
2019
in
relation
to
this
activity.
In
April
2019,
a
Barclays
customer
was
designated
by
OFAC
as
an
SDN
pursuant
to
the
GTSR.
Barclays
exited
the
relationship
with
the
customer
and
their
account
was
closed.
Barclays
attributed
no
revenue
in
2019
in
relation
to
this
activity.
Barclays
remitted
one
transac
tion
to
the
Embassy
of
the
Government
of
Iran
in
the
UK
in
relation
to
redress
owed
to
the
Embassy
following
the
application
of
an
incorrect
foreign
exchange
rate
being
applied
to
a
payment
the
Embassy
remitted
from
Barclays
in
2012,
which
was
identified
d
uring
a
remediation
project.
The
one
-
time
payment
was
processed
in
accordance
with
applicable
laws
and
regulations.
Barclays
attributed
no
revenue
in
2019
in
relation
to
this
activity.
Additional
information
Barclays
Bank
PLC
2019
Annual
Report
on
Form
20-F
208
Related
Undertakings
The
Barclays
Bank
PLC
corporate
structure
consists
of
a
number
of
related
undertakings,
comprising
subsidiaries,
joint
ventures,
associates
and
significant
other
interests.
A
full
list
of
these
undertakings,
the
country
of
incorporation
and
the
ownership
of
each
share
class
is
set
out
below.
The
information
is
provided
as
at
31
December
2019.
The
entities
are
grouped
by
the
countries
in
which
they
are
incorporated.
The
profits
earned
by
the
activities
of
these
entities
are
in
some
cases
taxed
in
countries
other
than
the
country
of
incorporation.
Barclays
PLC’s
2019
Country
Snapshot
provides
details
of
where
the
Barclays
PLC
Group
carries
on
its
business,
where
its
profits
are
subject
to
tax
and
the
taxes
it
pays
in
each
country
it
operates
in.
Wholly
owned
subsidiaries
Unless
otherwise
stated
the
undertakings
below
are
wholly
owned
and
consolidated
by
Barclays
Bank
PLC
and
the
share
capital
disclosed
comprises
ordinary
and/or
common
shares,
100%
of
the
nominal
value
of
which
is
held
by
Barclays
Bank
PLC
Group
subsidiaries.
Notes
A
Directly
held
by
Barclays
Bank
PLC
Ordinary
Shares,
Class
C
Preference
Shares,
B
Partnership
Interest
Class
D
Ordinary
Shares,
Class
D
Preference
C
Membership
Interest
Shares,
Class
E
Ordinary
Shares,
Class
E
D
Trust
Interest
Preference
Shares,
Class
F
Ordinary
Shares,
E
Guarantor
Class
F
Preference
Shares,
Class
H
2012
F
Preference
Shares
Ordinary
Shares,
Class
H
2012
Preference
G
A
Preference
Shares
Shares,
Class
H
Ordinary
Shares,
Class
H
H
B
Preference
Shares
Preference
Shares,
Class
I
Preference
Shares,
I
Ordinary/Common
Shares
in
addition
to
other
Class
J
Ordinary
Shares,
Class
J
Preference
Shares
shares
W
First
Class
Common
Shares,
Second
Class
J
A
Ordinary
Shares
Common
Shares
K
B
Ordinary
Shares
X
Class
B
Redeemable
Preference
Shares
L
C
Ordinary
Shares
Y
EUR
Tracker
1
Shares,
GBP
Tracker
1
N
W
Ordinary
Shares
Shares,
USD
Tracker
3
Shares,
M
F
Ordinary
Shares
USD
Tracker
1
Shares,
USD
Tracker
2
Shares
O
First
Preference
Shares,
Second
Preference
Z
Not
Consolidated
(see
Note34
Structured
Shares
entities)
P
Registered
Address
not
in
country
of
AA
USD
Linked
Ordinary
Shares
incorporation
BB
Redeemable
Class
B
Shares
Q
Core
Shares,
Insurance
(Classified)
Shares
CC
Class
A
Redeemable
Preference
Shares
R
Capital
Contribution
Shares
DD
Nominal
Shares
S
A
Unit
Shares,
B
Unit
Shares
Shares,
Class
E
Ordinary
Shares,
Class
E
T
Non-Redeemable
Ordinary
Shares
Preference
Shares,
Class
F
Ordinary
Shares,
U
C
Preference
Shares,
D
Preference
Shares
V
Class
A
Ordinary
Shares,
Class
A
Preference
Shares,
Class
B
Ordinary
Shares,
Class
C
Wholly
owned
subsidiaries
Note
Wholly
owned
subsidiaries
Note
Wholly
owned
subsidiaries
Note
United
Kingdom
Dorset
Home
Loans
Limited
A
Gerrard
Management
Services
Limited
(In
A
-
1
Churchill
Place,
London,
E14
5HP
Durlacher
Nominees
Limited
A
Liquidation)
Aequor
Investments
Limited
Eagle
Financial
and
Leasing
Services
(UK)
A
Lombard
Street
Nominees
Limited
(In
A
Ardencroft
Investments
Limited
A
Limited
Liquidation)
B
D
&
B
Investments
Limited
Equity
Value
Investments
No.1
Limited
A
Ruthenium
Investments
Limited
(In
A
B.P.B.
(Holdings)
Limited
A
Equity
Value
Investments
No.2
Limited
Liquidation)
Barafor
Limited
Finpart
Nominees
Limited
A
Woolwich
Plan
Managers
Limited
(In
A
Barclay
Leasing
Limited
Foltus
Investments
Limited
Liquidation)
Barclays
(Barley)
Limited
J,
K
Hawkins
Funding
Limited
A
Woolwich
Surveying
Services
Limited
(In
A
Barclays
Aldersgate
Investments
Limited
A
Heraldglen
Limited
I,
O
Liquidation)
Barclays
Capital
Asia
Holdings
Limited
A
J.V.
Estates
Limited
-
1
More
London
Place,
London
SE1
2AF
Barclays
Capital
Finance
Limited
A
Isle
of
Wight
Home
Loans
Limited
A
CP
Propco
1
Limited
(In
Liquidation)
Barclays
Capital
Japan
Securities
Holdings
Kirsche
Investments
Limited
A
CP
Propco
2
Limited
(In
Liquidation)
Limited
Long
Island
Assets
Limited
CP
Topco
Limited
(In
Liquidation)
J,
K
Barclays
Capital
Nominees
(No.2)
Limited
Maloney
Investments
Limited
A
-
5
The
North
Colonnade,
London,
E14
4BB
Barclays
Capital
Nominees
(No.3)
Limited
A
Menlo
Investments
Limited
A
Leonis
Investments
LLP
A,
B
Barclays
Capital
Nominees
Limited
A
Mercantile
Credit
Company
Limited
A
-
9,
allée
Scheffer,
L-2520,
Luxembourg
Barclays
Capital
Principal
Investments
Limited
A
Mercantile
Leasing
Company
(No.132)
A
Barclays
Claudas
Investments
Partnership
B,
P
Barclays
Capital
Securities
Client
Nominee
A
Limited
Barclays
Pelleas
Investments
Limited
B,
P
Limited
MK
Opportunities
LP
B
Partnership
Barclays
Capital
Securities
Limited
A,
F,
I
Murray
House
Investment
Management
A
Blossom
Finance
General
Partnership
B,
P
Barclays
CCP
Funding
LLP
A,
B
Limited
Barclays
Directors
Limited
A
Naxos
Investments
Limited
A
Argentina
Barclays
Executive
Schemes
Trustees
Limited
A
Northwharf
Nominees
Limited
A
-
855
Leandro
N.Alem
Avenue,
8th
Floor,
Barclays
Group
Holdings
Limited
A
Real
Estate
Participation
Management
Buenos
Aires
Barclays
Investment
Management
Limited
A
Limited
Compañía
Sudamerica
S.A.
A
Barclays
Leasing
(No.9)
Limited
Real
Estate
Participation
Services
Limited
-
Marval,
O’Farrell
&
Mairal,
Av.
Leandro
N.
Barclays
Long
Island
Limited
A
Relative
Value
Investments
UK
Limited
B
Alem
882,
Buenos
Aires,
C1001AAQ
Barclays
Marlist
Limited
A
Liability
Partnership
Compañia
Regional
del
Sur
S.A.
A
Barclays
Mercantile
Business
Finance
Limited
A
Relative
Value
Trading
Limited
Barclays
Nominees
(George
Yard)
Limited
A
Roder
Investments
No.
1
Limited
A,
I,
Y
Brazil
Barclays
Pension
Funds
Trustees
Limited
A
Roder
Investments
No.
2
Limited
A,
I,
Y
-
Av.
Brigadeiro
Faria
Lima,
No.
4.440,
12th
Barclays
Private
Bank
RVT
CLO
Investments
LLP
B
Floor,
Bairro
Itaim
Bibi,
Sao
Paulo,
CEP,
Barclays
Services
(Japan)
Limited
A
Surety
Trust
Limited
A
04538
-132
Barclays
Shea
Limited
A
Swan
Lane
Investments
Limited
Barclays
Brasil
Assessoria
Financeira
Ltda.
A
Barclays
Term
Funding
Limited
Liability
B
US
Real
Estate
Holdings
No.1
Limited
BNC
Brazil
Consultoria
Empresarial
Ltda
A
Partnership
US
Real
Estate
Holdings
No.2
Limited
Barclays
Wealth
Nominees
Limited
A
US
Real
Estate
Holdings
No.3
Limited
Canada
Barcosec
Limited
A
Wedd
Jefferson
(Nominees)
Limited
A
-
333
Bay
Street,
Suite
4910,
Toronto
ON
M5H
Barsec
Nominees
Limited
A
Westferry
Investments
Limited
A
2R2
BB
Client
Nominees
Limited
A
Woolwich
Qualifying
Employee
Share
A
Barclays
Capital
Canada
Inc.
BMBF
(No.24)
Limited
Ownership
Trustee
Limited
-
Stikeman
Elliot
LLP,
199
Bay
Street,
5300
BMI
(No.9)
Limited
Zeban
Nominees
Limited
A
Commerce
Court
West,
Toronto
ON
M5L
1B9
Carnegie
Holdings
Limited
A,
I,
J,
K
-
Hill
House,
1
Little
New
Street,
London,
Barclays
Corporation
Limited
A
Chapelcrest
Investments
Limited
EC4A
3TR
Clydesdale
Financial
Services
Limited
Barclays
Nominees
(Branches)
Limited
(In
A
Cayman
Islands
Cobalt
Investments
Limited
A
Liquidation)
-
Maples
Corporate
Services
Limited,
PO
Box
Cornwall
Homes
Loans
Limited
A
Barclays
Nominees
(K.W.S.)
Limited
(In
A
CP
Flower
Guaranteeco
(UK)
Limited
A,
E
Liquidation)
(Dissolved
on
22
January
Cayman,
KY1-1104
DMW
Realty
Limited
A
2020)
Alymere
Investments
Limited
G,
H,
I
Additional
information
Barclays
Bank
PLC
2019
Annual
Report
on
Form
20-F
209
Wholly
owned
subsidiaries
Note
Wholly
owned
subsidiaries
Note
Wholly
owned
subsidiaries
Note
Analytical
Trade
UK
Limited
A
Isle
of
Man
Servicios
Barclays,
S.A.
de
C.V.
Barclays
Capital
(Cayman)
Limited
A
-
P
O
Box
9,
Victoria
Street,
Barclays
Securities
Financing
Limited
F,
I
Douglas,
IM99
1AJ
Monaco
Braven
Investments
No.1
Limited
Barclays
Nominees
(Manx)
Limited
A
-
31
Avenue
de
la
Costa,
Monte
Carlo
Calthorpe
Investments
Limited
Barclays
Private
Clients
International
A,
J,
K
BP
339
Capton
Investments
Limited
A
Limited
Barclays
Private
Asset
Management
Claudas
Investments
Limited
A,
I,
CC,
X
(Monaco)
S.A.M
Claudas
Investments
Two
Limited
Japan
CPIA
Investments
No.1
Limited
V
-
10
-1,
Roppongi
6-chome,
Minato-ku,
Netherlands
CPIA
Investments
No.2
Limited
F,
I
Tokyo
-
Prins
Bernhardplein
200,
1097
JB
Gallen
Investments
Limited
Barclays
Funds
and
Advisory
Japan
Limited
Amsterdam
Hurley
Investments
No.1
Limited
Barclays
Securities
Japan
Limited
Chewdef
BidCo
BV.
(In
Liquidation)
A
JV
Assets
Limited
L
Barclays
Wealth
Services
Limited
Mintaka
Investments
No.
4
Limited
Philippines
OGP
Leasing
Limited
Jersey
-
21/F,
Philamlife
Tower,
8767
Paseo
de
Palomino
Limited
A,
Z
-
2
nd
Roxas,
Makati
City,
1226
Pelleas
Investments
Limited
A
Esplanade,
St.
Helier,
JE1
1GH
Meridian
(SPV-AMC)
Corporation
Pippin
Island
Investments
Limited
A
CP
Newco
1
Limited
(In
liquidation)
A
Razzoli
Investments
Limited
A,
F,
I
CP
Newco2
Limited
(In
liquidation)
J,
K
Saudi
Arabia
RVH
Limited
A,
F,
I
CP
Newco3
Limited
(In
liquidation)
-
3
rd
Wessex
Investments
Limited
Barclays
Services
Jersey
Limited
A
Street,
PO
Box
1454,
Riyadh
11431
-
Walkers
Corporate
Limited,
Cayman
-
39
-
41
Broad
Street,
St
Helier,
JE2
3RR
Barclays
Saudi
Arabia
(In
Liquidation)
A
Corporate
Centre,
27
Hospital
Road,
George
Barclays
Wealth
Management
Jersey
A
Town,
KY1-
9008
Limited
Singapore
Long
Island
Holding
B
Limited
A
BIFML
PTC
Limited
A
-
10
Marina
Boulevard,
#24-01
Marina
Bay
-
13
Castle
Street,
St.
Helier,
JE4
5UT
Germany
Barclays
Index
Finance
Trust
S
Barclays
Capital
Futures
(Singapore)
Private
-
TaunusTurm,
Taunustor
1,
60310,
-
Lime
Grove
House,
Green
Street,
Limited
St
Helier,
JE1
2ST
Barclays
Capital
Holdings
(Singapore)
A
Barclays
Capital
Effekten
GmbH
A
Barbridge
Limited
(In
Liquidation)
A,
I,
DD
Private
Limited
-
Stuttgarter
Straße
55-57,
73033
-
13
Library
Place,
St
Helier,
JE4
8NE
Barclays
Merchant
Bank
(Singapore)
Ltd.
Göppingen
Barclays
Nominees
(Jersey)
Limited
A
Holding
Stuttgarter
Straße
GmbH
Barclaytrust
Channel
Islands
Limited
A
Spain
-
Estera
Trust
(Jersey)
Limited,
13-14
-
Calle
Jose,
Abascal
51,
28003,
Madrid
Guernsey
Esplanade,
St
Helier,
JE1
1EE
Barclays
Tenedora
De
Inmuebles
SL.
A
-
P.O.
Box
33,
Dorey
Court,
Admiral
Park,
St.
MK
Opportunities
GP
Ltd
A
BVP
Galvani
Global,
S.A.U.
A
Barclays
Insurance
Guernsey
PCC
Limited
A,
Q
Luxembourg
Switzerland
-
PO
BOX
41,
Floor
2,
Le
Marchant
House,
Le
-
9,
allée
Scheffer,
L-2520
-
Chemin
de
Grange
Canal
18-20,
PO
Box
Barclays
Alzin
Investments
S.à
r.l.
3941,
1211,
Geneva
Barclays
Nominees
(Guernsey)
Limited
A
Barclays
Bayard
Investments
S.à
r.l.
J,
K
Barclays
Bank
(Suisse)
SA
Barclays
Bedivere
Investments
S.à
r.l.
BPB
Holdings
SA
Hong
Kong
Barclays
Bordang
Investments
S.à
r.l.
-
42nd
floor
Citibank
Tower,
Citibank
Plaza,
Barclays
BR
Investments
S.à
r.l.
United
States
3
Garden
Road
Barclays
Cantal
Investments
S.à
r.l.
Barclays
Bank
(Hong
Kong
Nominees)
Limited
A
Barclays
Capital
Luxembourg
S.à
r.l.
Trust
Center,
1209
Orange
Street,
(in
Liquidation)
Barclays
Capital
Trading
Luxembourg
S.à
r.l.
J,
K
Wilmington
,
DE
19801
Barclays
Capital
Asia
Nominees
Limited
(In
Barclays
Claudas
Investments
S.à
r.l.
Archstone
Equity
Holdings
Inc
Liquidation)
Barclays
Equity
Index
Investments
S.à
r.l.
Barclays
Capital
Derivatives
Funding
LLC
C
-
Level
41,
Cheung
Kong
Center,
2
Queen's
Barclays
International
Luxembourg
Dollar
Barclays
Capital
Energy
Inc.
Road,
Central
Holdings
S.à
r.l.
Barclays
Capital
Holdings
Inc.
G,
H,
I
Barclays
Asia
Limited
(In
Liquidation)
A
Barclays
Lamorak
Investments
S.à
r.l.
T
Barclays
Capital
Real
Estate
Finance
Inc.
Barclays
Capital
Asia
Limited
A
Barclays
Leto
Investments
S.à
r.l.
Barclays
Capital
Real
Estate
Holdings
Inc.
Barclays
Luxembourg
EUR
Holdings
S.à
r.l
T
Barclays
Capital
Real
Estate
Inc.
India
Barclays
Luxembourg
Finance
S.à
r.l.
Barclays
Commercial
Mortgage
Securities
C
-
208
Ceejay
House,
Shivsagar
Estate,
Dr
A
Barclays
Luxembourg
GBP
Holdings
S.à
r.l.
T
LLC
Beasant
Road,
Worli,
Mumbai,
400
018
Barclays
Luxembourg
Global
Funding
S.à
r.l.
Barclays
Electronic
Commerce
Holdings
Inc.
Barclays
Securities
(India)
Private
Limited
Barclays
Luxembourg
Holdings
S.à
r.l.
I,
AA
Barclays
Financial
LLC
C
Barclays
Wealth
Trustees
(India)
Private
Barclays
Luxembourg
Holdings
SSC
B
Barclays
Group
US
Inc.
G,
I
Limited
Barclays
Pelleas
Investments
S.à
r.l.
Barclays
Oversight
Management
Inc.
-
Level
10,
Block
B6,
Nirlon
Knowledge
-
68
-70
Boulevard
de
la
Petrusse,
L-2320
Barclays
Receivables
LLC
C
Park,
Off
Western
Express
Highway
Adler
Toy
Holding
Sarl
Barclays
Services
Corporation
Barclays
US
CCP
Funding
LLC
C
Barclays
Investments
&
Loans
(India)
A,
F,
I
Mauritius
Barclays
US
Funding
LLC
C
Private
Limited
-
C/O
Rogers
Capital
Corporate
Services
Barclays
US
Investments
Inc.
J,
K
Limited,
3
rd
Barclays
US
LLC
G,H,I,
U
Ireland
President
John
Kennedy
Street,
Port
Louis
BCAP
LLC
C
-
One
Molesworth
Street,
Dublin
2,
Barclays
Capital
Mauritius
Limited
A
Crescent
Real
Estate
Member
LLC
C
D02RF29
Barclays
Capital
Securities
Mauritius
A
Gracechurch
Services
Corporation
Barclaycard
International
Payments
Limited
A
Limited
Long
Island
Holding
A
LLC
C
Barclays
Bank
Ireland
Public
Limited
A
-
Fifth
Floor,
Ebene
Esplanade,
24
LTDL
Holdings
LLC
C
Company
Cybercity,
Ebene
Marbury
Holdings
LLC
Barclays
Europe
Client
Nominees
Barclays
Mauritius
Overseas
Holdings
A
Protium
Finance
I
LLC
C
Designated
Activity
Company
Limited
Protium
Master
Mortgage
LP
B
Barclays
Europe
Firm
Nominees
Designated
Protium
REO
I
LP
B
Activity
Company
Mexico
Sutton
Funding
LLC
C
Barclays
Europe
Nominees
Designated
-
Paseo
de
la
Reforma
505,
41
Floor,
Torre
TPProperty
LLC
C
Mayor,
Col.
Cuauhtemoc,
CP
06500
US
Secured
Investments
LLC
R
-
25
-28
North
Wall
Quay,
Dublin
1,
Barclays
Bank
Mexico,
S.A.
-
1201
North
Market
Street,
P.O.
Box
1347
D01H104
Barclays
Capital
Casa
de
Bolsa,
S.A.
de
C.V.
Wilmington,
DE19801
Erimon
Home
Loans
Ireland
Limited
A
Grupo
Financiero
Barclays
Mexico,
A,
K,
M
Barclays
Bank
Delaware
F,
I
S.A.
de
C.V.
Procella
Investments
No.2
LLC
C
Additional
information
Barclays
Bank
PLC
2019
Annual
Report
on
Form
20-F
210
Wholly
owned
subsidiaries
Note
Other
Related
Undertakings
Unless
otherwise
stated,
the
undertakings
below
are
consolidated
and
the
share
capital
disclosed
comprises
ordinary
and/or
common
shares
which
are
held
by
subsidiaries
of
the
Barclays
Bank
PLC
Group.
The
Barclays
Bank
PLC
Group’s
overall
ownership
percentage
is
provided
for
each
undertaking.
Other
Related
Undertakings
%
Note
Procella
Investments
No.3
LLC
C
Portugal
Verain
Investments
LLC
Av.
Manuel
Júlio
Carvalho
e
-
2711
Centerville
Road,
Suite
400,
Costa
no.
15
-A,
2750
-423
Wilmington,
DE
19808
Cascais
Protium
Master
Grantor
Trust
D
Projepolska,
S.A.
24.50
Z
-
251
Little
Falls
Drive,
New
Castle
County,
Sweden
Wilmington
DE
19808
-
c/o
ForeningsSparbanken
Barclays
Capital
Equities
Trading
GP
B
Other
Related
Undertakings
%
Note
AB,
105
34
Stockholm
Lagalla
Investments
LLC
United
Kingdom
EnterCard
Group
AB
40.00
Relative
Value
Holdings,
LLC
-
1
Churchill
Place,
London,
E14
5HP
Surrey
Funding
Corporation
PSA
Credit
Company
Limited
50.00
A,
J,
L
United
States
of
America
Sussex
Purchasing
Corporation
(In
Liquidation)
-
Corporation
Trust
Company,
-
745
Seventh
Avenue,
New
York
NY
10019
-
3
-
5
London
Road,
Rainham,
Kent,
Corporation
Trust
Center,
Alynore
Investments
Limited
Partnership
B
ME8
7RG
1209
Orange
Street,
Barclays
Payment
Solutions
Inc.
Trade
Ideas
Limited
20.00
A,
Z
Wilmington,
DE
19801
Curve
Investments
GP
B
-
50
Lothian
Road,
Festival
Square,
DG
Solar
Lessee
II,
LLC
75.00
C,
Z
Preferred
Liquidity,
LLC
J
Edinburgh,
EH3
9WJ
DG
Solar
Lessee,
LLC
75.00
C,
Z
-
CT
Corporation
System,
One
Corporate
Equistone
Founder
Partner
II
L.P.
20.00
A,
B,
Z
VS
BC
Solar
Lessee
I
LLC
50.00
C,
Z
Center,
Floor
11,
Hartford
CT
06103
-3220
Equistone
Founder
Partner
III
L.P.
35.00
A,
B,
Z
-1415
Louisiana
Street
Suite
Barclays
Capital
Inc.
-
Enigma,
Wavendon
Business
Park
1600
Houston,
Texas,
77002
-
c/o
RL&F
Service
Corp,
One
Rodney
Milton
Keynes,
MK17
8LX
Sabine
Oil
&
Gas
Holdings,
Inc.
23.25
Z
Square,
10th
Floor,
Tenth
and
King
Streets,
Intelligent
Processing
Solutions
Limited
19.50
A,
Z
Subsidiaries
by
virtue
of
control
The
related
undertakings
below
are
Subsidiaries
in
accordance
with
s.1162
Companies
Act
2006
as
Barclays
can
exercise
dominant
influence
or
control
over
them.
Wilmington,
DE
19801
-
65A
Basinghall
Street,
London,
Analytical
Trade
Holdings
LLC
EC2V
5DZ
Analytical
Trade
Investments
LLC
BB
Cyber
Defence
Alliance
Limited
25.00
A,
E,
Z
-
100
South
West
Street,
Wilmington
DE
-
15
Canada
Square,
London,
E14
5GL
19801
Woolwich
Countryside
Limited
50.00
A,
N,
Z
Barclays
Dryrock
Funding
LLC
C
In
Liquidation)
Wilmington
Riverfront
Receivables
LLC
J,
K
Korea,
Republic
of
Subsidiaries
by
virtue
of
control
%
Note
-
15
East
North
Street,
Dover
DE
19801
-
18
th
United
Kingdom
Barclays
Services
LLC
C
343,
Samil-daero,
Jung
-go,
Seoul
-
1
Churchill
Place,
London,
-
CT
Corporation
System,
225
Hillsborough
Woori
BC
Pegasus
70.00
A,
W
E14
5HP
Street,
Raleigh,
NC
27603
Securitization
Specialty
Co.,
Oak
Pension
Asset
0.00
Z
Barclays
US
GPF
Inc.
Limited
Management
Limited
-
500
Forest
Point
Circle,
Charlotte,
North
Water
Street
Investments
0.00
Z
Carolina
28273
Luxembourg
Limited
Equifirst
Corporation
(In
Liquidation)
-
9,
allée
Scheffer,
L-2520
33.33
X
-
Aon
Insurance
Managers,
76
Paul
Street,
Preferred
Funding
S.à
r.l.
33.33
I,
X
Cayman
Islands
Suite
500,
Burlington,
VT05401
Preferred
Investments
S.à
r.l.
-
PO
Box
309GT,
Ugland
Barclays
Insurance
U.S.
Inc.
House
South
Church
Street,
Malta
Grand
Cayman,
KY1
-1104
Zimbabwe
-
RS2
Buildings,
Fort
Road,
18.25
A,
Z
Hornbeam
Limited
0.00
Z
-
2
Premium
Close,
Mount
Pleasant
Business
Mosta
MST
1859
Barclays
US
Holdings
Limited
10.00
A,
J
Park,
Mount
Pleasant,
Harare
RS2
Software
PLC
Branchcall
Computers
(Pvt)
Limited
Monaco
75.00
A
-
31
Avenue
de
la
Costa,
Monte
Carlo
Societe
Civile
Immobiliere
31
Additional
information
Income
statement
commentary
Barclays
Bank
PLC
2019
Annual
Report
on
Form
20-F
211
Income
Statement
commentary
2019
Compared
to
2018
Profit
before
tax
increased
142%
to
£
3,112m
driven
by
reduced
losses
in
Head
Office
of
£598m
(2018:
£2,245m),
primarily
due
to
a
non-
recurrence
of
the
£1.4bn
settlement
with
US
Department
of
Justice
relating
to
Residential
Mortgage
-
Backed
Securities
(RMBS),
and
an
8%
increase
in
CIB
to
£2,590m
(2018:
2,394m).
This
was
partially
offset
by
a
decrease
in
CC&P
to
£1,120m
(2018:
£1,137m).
The
4%
appreciation
of
average
USD
against
GBP
positively
impacted
income
and
profits,
and
adversely
impacted
credit
impairment
charges
and
operating
expenses.
Total
Income
increased
4%
to
£14,151m.
CIB
income
increased
3%
to
£10,009m.
Within
CIB,
Markets
income
increased
3%,
reflecting
further
gains
in
market
share
in
a
declining
revenue
pool
a
.
FICC
income
increased
reflecting
a
strong
performance
in
rates
and
growth
in
securitised
products.
Equities
income
decreased
driven
by
equity
derivatives,
which
were
impacted
by
reduced
client
activity.
Banking
fees
income
increas
ed
1%.
The
Banking
business
also
continued
to
gain
market
share
in
a
declining
fee
pool
b
.
CC&P
income
increased
5%
to
£4,462m
reflecting
growth
in
US
co
-
branded
cards
and
payments
partnerships.
Head
Office
income
expense
improved
22%
to
£320m
(2018:
£408m)
driven
by
lower
hedge
accounting
losses
and
legacy
capital
funding
costs,
partially
offset
by
non
-
recurrence
of
a
prior
year
gain
of
£155m
from
the
settlement
of
receivables
relating
to
the
Lehman
Brothers
acquisition
and
the
Absa
Group
Limited
(for
merly
known
as
BAGL)
dividend
income.
Credit
impairment
charges
increased
87%
to
£1,202m.
CIB
credit
impairment
charges
increased
to
£157m
(2018:
release
of
£152m)
due
to
the
non
-
recurrence
of
favourable
macroeconomic
scenario
updates
and
single
name
reco
veries
in
2018.
CC&P
credit
impairment
charges
increased
to
£1,016m
(2018:
£808m)
due
to
cards
balance
growth
and
the
non
-
recurrence
of
favourable
US
macroeconomic
scenario
updates
in
2018,
as
well
as
higher
unsecured
gross
exposures
due
to
balance
growth
in
cards.
Credit
metrics
remained
stable,
with
US
cards
30
and
90
day
arrears
of
2.7%
(Q418:
2.7%)
and
1.4%
(Q418:
1.4%)
respectively
.
Total
operating
expenses
decreased
15%
to
£
9,982m
.
Head
Office
total
operating
expenses
decreased
to
£241m
(2018:
£1,849
m)
due
to
the
non-
recurrence
of
a
settlement
relating
to
RMBS
with
the
US
DoJ
of
£1.4bn
and
the
£140m
charge
for
the
GMP
in
relation
to
the
equalisation
of
obligations
for
members
of
the
Barclays
Bank
UKRF.
CIB
total
operating
expenses
decreased
2%
to
£7
,375m
as
cost
efficiencies
were
partially
offset
by
continued
investment.
CC&P
total
operating
expenses
were
stable
at
£2,366m
(2018:
£2,363m)
reflecting
continued
investment
and
efficiencies.
Other
net
income
increased
to
£145m
(2018:
£68m)
reflecting
ga
ins
on
disposals
following
the
sale
of
number
of
subsidiaries
to
Barclays
Principal
Investment
Limited
in
Q4
2019.
Please
refer
to
the
Financial
review
section
in
the
Annual
Report
on
form
20
-
F
2018
for
a
comparative
discussion
of
2018
financial
results
compared
to
2017.
Notes
a
Data
Source:
Coalition,
FY19
Preliminary
Competitor
Analysis.
Market
share
represents
Barclays
share
of
the
total
industry
Revenue
Pool.
Analysis
is
based
on
Barclays
internal
business
structure
and
internal
revenues.
b
Data
Source:
Dealogic,
for
the
period
covering
1
January
to
31
December
2019.
2019
2018
For
the
year
ended
31
December
£m
£m
Return
on
average
total
assets
0.21
%
0.04
%
Dividend
payout
ratio
11
%
80
%
Average
total
equity
to
average
total
assets
5.0
%
5.
0
%
Guide
3
ratios
Additional
information
Balance
sheet
commentary
Barclays
Bank
PLC
2019
Annual
Report
on
Form
20-F
212
Total
assets
Total
assets
decreased
by
£1bn
to
£877bn.
Cash
and
balances
at
central
banks
decreased
£10bn
to
£126bn
mainly
due
to
a
reduction
in
cash
at
central
banks
held
as
part
of
the
liquidity
pool.
Cash
collateral
and
settlement
balances
increased
£5bn
to
£79bn
as
a
result
of
£7bn
increase
in
cash
collateral
predominantly
held
in
relation
to
derivatives,
partially
offset
by
a
£2bn
decrease
in
settlement
balances.
Loans
and
advances
increased
£5bn
to
£142bn
mainly
due
to
an
increase
in
debt
securities.
Reverse
repurchase
agreements
and
other
similar
secured
lending
remained
flat
at
£2bn.
Trading
portfolio
assets
increased
£9bn
to
£113bn
due
to
increased
trading
activity,
principally
relating
to
the
Equities
business.
Financial
assets
at
fair
value
through
the
income
statement
decreased
£16bn
to
£129bn
d
riven
by
a
focus
on
capital-efficient
secured
financing.
Derivative
financial
instruments
increased
£7bn
to
£230bn,
driven
by
a
decrease
in
major
interest
rate
curves,
partially
offset
by
a
decrease
in
foreign
exchange
volumes.
Financial
assets
at
fair
value
through
other
comprehensive
income
remained
flat
at
£45bn.
Total
liabilities
Total
liabilities
decreased
£4bn
to
£826bn.
Deposits
at
amortised
cost
increased
£15bn
to
£214bn
due
to
increased
deposits
within
CIB
including
the
broadening
of
the
business
across
Europe.
Cash
collateral
and
settlement
balances
remained
flat
at
£68bn.
Repurchase
agreements
and
other
similar
secured
borrowing
decreased
£5bn
to
£2bn
reflecting
a
reduct
ion
in
funding
requirements.
Debt
securities
in
issue
and
subordinated
liabilities
had
a
net
decrease
of
£7bn
due
to
the
maturity
of
a
number
of
issuances
which
were
not
refinanced.
Trading
portfolio
liabilities
remained
broadly
flat
at
£35bn
Financial
liabilities
designated
at
fair
value
decreased
£13bn
to
£204bn
primarily
due
to
capital-efficient
secured
lending
partially
offset
by
increased
issuances
of
equity
linked
notes.
Derivative
financial
instruments
increased
£9bn
to
£229bn,
driven
by
a
decre
ase
in
major
interest
rate
curves,
partially
offset
by
a
decrease
in
foreign
exchange
volumes.
This
is
consistent
with
the
movement
in
derivative
financial
instrument
assets.
Total
shareholders’
equity
Total
shareholders’
equity
increased
£3bn
to
£51bn.
Other
equity
instruments
increased
£0.7bn
to
£8.3bn
driven
by
AT1
instrument
issuances
of
£2.3bn,
partially
offset
by
AT1
redemptions
during
the
year
with
principal
amounts
of
£1.6bn.
AT1
securities
are
perpetual
subordinated
contingent
convertible
securities
structured
to
qualify
as
AT1
instruments
under
prevailing
capital
rules
applicable
as
at
the
relevant
issue
date.
The
fair
value
through
other
comprehensive
income
reserve
decreased
£0.2bn
to
£0.1bn
The
cash
flow
hedging
reserve
increased
£0.5bn
as
a
result
of
the
fair
value
movements
of
interest
rate
swaps
held
for
hedging
purposes
due
to
a
decrease
in
major
interest
rate
curves
The
currency
translation
reserve
decreased
£0.5bn
to
£3.3bn
reflecting
the
increase
in
value
of
period
end
GBP
against
USD
and
EUR
of
3%
and
5%
respectively
.
The
own
credit
reserve
decreased
£0.3bn
to
£0.4bn
debit
due
to
a
tightening
of
Barclays’
credit
spreads
increasing
the
fair
value
of
liabilities
on
balance
sheet.
Retained
earnings
increased
£2.3bn
driven
by
£2.1bn
profit
after
tax
and
a
£1.0bn
capital
contribution
received
from
Barclays
PLC,
partially
offset
by
£0.4bn
foreign
exchange
impact
on
redemption
of
AT1
instruments
and
dividends
paid
on
ordinary
and
preference
shares
totalling
£0.3bn
Additional
information
Additional
financial
disclosure
Barclays
Bank
PLC
2019
Annual
Report
on
Form
20-F
213
Deposits
and
short-term
borrowings
Deposits
Deposits
include
deposits
from
banks
and
customer
accounts.
2019
2018
Average
for
the
year
ended
31
December
£m
£m
Deposits
at
amortised
cost
UK
130,726
211,002
Europe
39,496
25,560
Americas
31,815
24,073
Asia
9,268
5,089
Africa
7,802
5,007
Total
deposits
at
amortised
cost
219,107
270,731
2019
2018
For
the
year
ended
31
December
a
£m
£m
Deposits
at
amortised
cost
213,881
199,337
In
offices
in
the
United
Kingdom:
Current
and
demand
accounts
-
interest
free
31,865
31,624
-
interest
bearing
25,040
22,695
Savings
accounts
14,059
13,801
Other
time
deposits
-
retail
4,846
3,353
Other
time
deposits
-
wholesale
62,949
61,523
Total
repayable
in
offices
in
the
United
Kingdom
138,759
132,996
In
offices
outside
the
United
Kingdom:
Current
and
demand
accounts
-
interest
free
10,613
10,747
-
interest
bearing
12,932
12,198
Savings
accounts
14,110
13,179
Other
time
deposits
37,467
30,217
Total
repayable
in
offices
outside
the
United
Kingdom
75,122
66,341
Deposits
at
amortised
cost
amounts
in
offices
in
the
United
Kingdom
received
from
non
-
residents
amounted
to
£32,499
m
(
2018
:
£31,089m).
b
Note
a
The
UK/Non
UK
Deposit
analysis
has
been
updated
for
comparative
periods
reflecting
a
geographical
analysis
based
on
location
of
office
which
is
consistent
with
Group
disclosures.
UK
balances
received
from
non-residents
have
been
updated
accordingly.
b
T
he
changes
were
£25bn
in
2018
and
£23bn
in
2017
moving
from
UK
to
Non
UK.
UK
non-resident
balances
were
reduced
by
£25bn
in
2018
and
£7bn
in
2017
as
a
result.
Additional
information
Additional
financial
disclosure
Barclays
Bank
PLC
2019
Annual
Report
on
Form
20-F
214
Short
-term
borrowings
Short
-
term
borrowings
include
deposits
from
banks,
commercial
paper,
negotiable
certificates
of
deposit
and
repurchase
agreements.
Deposits
from
banks
Deposits
from
banks
are
taken
from
a
wide
range
of
counterparties
and
generally
have
maturities
of
less
than
one
year.
2019
2018
£m
£m
Year
-
end
balance
18,144
15,569
Average
balance
a,b
24,812
21,105
Maximum
balance
a
29,754
27,810
Average
interest
rate
during
year
1.5%
2.0%
Year
-
end
interest
rate
2.2%
2.7%
Notes
a
Calculated
based
on
month
-end
balances.
Commercial
paper
Commercial
paper
is
issued
by
the
Group,
mainly
in
the
United
States,
generally
in
denominations
of
not
less
than
$100,000,
with
maturities
of
up
to
270
days.
2019
2018
£m
£m
Year
-
end
balance
13,874
13,381
Average
balance
a
17,475
11,279
Maximum
balance
a
20,381
14,108
Average
interest
rate
during
year
1.0%
1.2%
Year
-
end
interest
rate
1.2%
1.0%
Note
a
Calculated
based
on
month
-end
balances.
Negotiable
certificates
of
deposit
Negotiable
certificates
of
deposits
are
issued
mainly
in
the
United
Kingdom
and
United
States,
generally
in
denominations
of
not
less
than
$100,000.
2019
2018
£m
£m
Year
-
end
balance
7,716
10,585
Average
balance
a
10,619
18,406
Maximum
balance
a
13,315
24,098
Average
interest
rate
during
year
3.0%
1.2%
Year
-
end
interest
rate
4.1%
2.0%
Note
a
Calculated
based
on
month
-end
balances.
Repurchase
agreements
Repurchase
agreements
are
entered
into
with
both
customers
and
banks
and
generally
have
maturities
of
not
more
than
three
months.
2019
2018
£m
£m
Year
-
end
balance
2,032
7,378
Average
balance
a
4,542
11,719
Maximum
balance
a
9,739
17,705
Average
interest
rate
during
year
0.7%
0.2%
Year
-
end
interest
rate
1.5%
0.3%
Note
a
Calculated
based
on
month
-end
balances.
Additional
information
Additional
financial
disclosure
Barclays
Bank
PLC
2019
Annual
Report
on
Form
20-F
215
Commitments
and
contractual
obligations
Commercial
commitments
include
guarantees,
contingent
liabilities
and
standby
facilities.
Commercial
commitments
Amount
of
commitment
expiration
per
period
Less
than
one
year
Between
one
to
three
years
Between
three
to
five
years
After
five
years
Total
amounts
committed
£m
£m
£m
£m
£m
As
at
31
December
2019
Guarantees
and
letters
of
credit
pledged
as
collateral
security
-
Performance
guarantees,
acceptances
and
endorsements
Documentary
credits
and
other
short
-
term
trade
related
transactions
-
-
-
Standby
facilities,
credit
lines
and
other
commitments
As
at
31
December
2018
Guarantees
and
letters
of
credit
pledged
as
collateral
security
Performance
guarantees,
acceptances
and
endorsements
Documentary
credits
and
other
short
-
term
trade
related
transactions
-
-
Standby
facilities,
credit
lines
and
other
commitments
Contractual
obligations
include
debt
securities.
Contractual
obligations
Less
than
one
year
Between
one
to
three
years
Between
three
to
five
years
After
five
years
Total
£m
£m
£m
£m
£m
As
at
31
December
2019
Long
-term
debt
a
25,786
21,979
13,457
18,779
80,001
As
at
31
December
2018
Long
-term
debt
a
28,620
15,931
13,615
22,008
80,174
Operating
lease
obligations
b
115
167
91
698
1,071
Total
28,735
16,098
13,706
22,706
81,245
Note
a
Long-term
debt
has
been
prepared
to
reflect
cash
flows
on
an
undiscounted
basis
,
which
includes
interest
payments.
b
Following
the
adoption
of
accounting
standard
IFRS
16
on
1
January
2019,
operating
lease
obligations
are
recorded
On
balance
sheet
Net
cash
flows
from
derivatives
used
to
hedge
long
-
term
debt
amount
to
£1.6
bn
(201
8
:
£
1
.4
bn).
Further
information
on
the
contractual
maturity
of
the
Group
’s
assets
and
liabilities
is
given
in
the
Liquidity
section
of
the
Risk
Review.
Additional
information
Additional
financial
disclosure
Barclays
Bank
PLC
2019
Annual
Report
on
Form
20-F
216
Securities
Analysis
of
securities
2019
2018
2017
As
at
31
December
£m
£m
£m
Investment
securities
a
US
government,
other
public
bodies
and
agencies
11,628
9,078
13,284
United
Kingdom
government
12,880
7,516
15,096
Other
government
11,685
15,483
17,077
Mortgage
and
asset
backed
securities
1,019
617
546
Corporate
and
other
issuers
18,476
13,466
11,126
Debt
securities
55,688
46,160
57,129
Equity
securities
1
11
1,834
Investment
securities
55,689
46,171
58,963
Other
securities
b
US
government,
other
public
bodies
and
agencies
19,410
23,890
16,168
United
Kingdom
government
10,380
10,005
4,379
Other
government
11,622
9,825
11,839
Mortgage
and
asset
backed
securities
2,354
2,023
1,974
Corporate
and
other
issuers
13,334
15,906
16,850
Debt
securities
57,100
61,649
51,210
Equity
securities
62,549
44,737
64,009
Other
securities
119,649
106,386
115,219
Notes
a
Investment
securities
for
2019
&
2018
includes
securities
reported
within
loans
and
advances
at
amortised
cost
and
financial
assets
at
fair
value
through
other
comprehensive
income.
Investment
securities
for
2017
includes
securities
reported
within
financial
investments.
b
Other
securities
include
securities
reported
within
trading
portfolio
and
financial
assets
at
fair
value
through
the
income
statement.
Investment
debt
securities
include
government
securities
held
as
part
of
the
Group’s
treasury
management
portfolio
for
asset
and
liability,
liquidity
and
regulatory
purposes
and
are
for
use
on
a
continuing
basis
in
the
activities
of
the
Group.
In
addition,
the
Group
holds
as
investments
listed
and
unlisted
corporate
securities.
Maturities
and
yield
of
investment
debt
securities
Maturing
within
one
year
Maturing
after
one
but
within
five
years
Maturing
after
five
but
within
ten
years
Maturing
after
ten
years
Total
Amount
Yield
Amount
Yield
Amount
Yield
Amount
Yield
Amount
Yield
As
at
31
December
2019
£m
%
£m
%
£m
%
£m
%
£m
%
US
government,
other
public
bodies
and
agencies
1,131
0.6%
5,341
0.9%
3,961
1.2%
1,195
2.4%
11,628
1.2%
United
Kingdom
government
3,522
2.1%
3,075
1.6%
3,871
1.7%
2,412
1.3%
12,880
1.7%
Other
government
1,258
0.8%
2,959
2.7%
5,831
1.5%
1,637
2.6%
11,685
1.9%
Other
issuers
3,079
1.6%
9,449
2.1%
4,820
1.8%
2,148
1.3%
19,496
1.9%
Total
book
value
8,990
1.6%
20,824
1.8%
18,483
1.6%
7,392
1.8%
55,689
1.7%
The
yield
for
each
range
of
maturities
is
calculated
by
dividing
the
annualised
interest
income
prevailing
at
reporting
date
by
the
book
value
of
securities
held
at
that
date.
Additional
information
Additional
financial
disclosure
Barclays
Bank
PLC
2019
Annual
Report
on
Form
20-F
217
Average
balance
sheet
Average
balances
are
based
upon
monthly
averages.
Assets
2019
Average
balance
Interest
presented
within
net
interest
income
Interest
presented
elsewhere
Total
interest
Rate
£m
£m
£m
£m
%
Cash
and
balances
at
central
banks
UK
38,450
293
-
293
0.8
Cash
and
balances
at
central
banks
Non
-
UK
101,371
626
(153)
473
0.5
Cash
and
balances
at
central
banks
Total
139,821
919
(153)
766
0.5
Loans
and
advances
at
amortised
cost
UK
74,894
1,746
(13)
1,733
2.3
Loans
and
advances
at
amortised
cost
Non
-
UK
71,925
3,768
-
3,768
5.2
Loans
and
advances
at
amortised
cost
a
Total
146,819
5,514
(13)
5,501
3.7
Cash
collateral
UK
56,091
394
-
394
0.7
Cash
collateral
Non
-
UK
7,400
49
-
49
0.7
Cash
collateral
c
Total
63,491
443
-
443
0.7
Reverse
repurchase
agreements
UK
1,284
46
-
46
3.6
Reverse
repurchase
agreements
Non
-
UK
2,041
11
-
11
0.5
Reverse
repurchase
agreements
Total
3,325
57
-
57
1.7
Interest
earning
assets
at
fair
value
through
other
comprehensive
income
UK
49,399
756
-
756
1.5
Interest
earning
assets
at
fair
value
through
other
comprehensive
income
Non
-
UK
2,961
75
-
75
2.5
Interest
earning
assets
at
fair
value
through
other
comprehensive
income
Total
52,360
831
-
831
1.6
Other
interest
income
b
321
-
321
-
Total
interest
earning
assets
not
at
fair
value
through
P&L
405,816
8,085
(166)
7,919
2.0
Less
interest
expense
(4,178)
166
(4,012)
-
Net
interest
405,816
3,907
-
3,907
1.0
Interest
earning
assets
at
fair
value
through
P&L
UK
188,811
Interest
earning
assets
at
fair
value
through
P&L
Non
-
UK
68,031
Interest
earning
assets
at
fair
value
through
P&L
Total
256,842
Total
interest
earning
assets
662,658
Impairments
(3,776)
Non
-
interest
earning
assets
348,215
Total
1,007,097
Percentage
of
total
average
interest
earning
assets
in
offices
outside
the
UK
38%
Notes
a
Loans
and
advances
at
amortised
cost
include
all
doubtful
lendings,
including
non
-accrual
lendings.
Interest
receivable
on
such
lendings
has
been
included
to
the
extent
to
which
either
cash
payments
have
been
received
or
interest
has
been
accrued
in
accordance
with
the
income
recognition
policy
of
the
Barclays
Bank
Group
b
Other
interest
income
principally
relates
to
hedging
activity.
Additional
information
Additional
financial
disclosure
Barclays
Bank
PLC
2019
Annual
Report
on
Form
20-F
218
Assets
2018
Average
balance
Interest
presented
within
net
interest
income
Interest
presented
elsewhere
c
Total
interest
Rate
£m
£m
£m
£m
%
Cash
and
balances
at
central
banks
UK
42,611
93
127
220
0.5
Cash
and
balances
at
central
banks
Non
-
UK
106,344
826
-
826
0.8
Cash
and
balances
at
central
banks
Total
148,955
919
127
1,046
0.7
Loans
and
advances
at
amortised
cost
UK
133,590
2,225
1,518
3,743
2.8
Loans
and
advances
at
amortised
cost
Non
-
UK
65,851
3,329
-
3,329
5.1
Loans
and
advances
at
amortised
cost
a
Total
199,441
5,554
1,518
7,072
3.5
Cash
collateral
UK
50,437
324
-
324
0.6
Cash
collateral
Non
-
UK
5,343
47
-
47
0.9
Cash
collateral
b
Total
55,780
371
-
371
0.7
Reverse
repurchase
agreements
UK
580
2
-
2
0.3
Reverse
repurchase
agreements
Non
-
UK
855
10
-
10
1.2
Reverse
repurchase
agreements
Total
1,435
12
-
12
0.8
Interest
earning
assests
at
fair
value
through
other
comprehensive
income
UK
49,733
589
132
721
1.4
Interest
earning
assests
at
fair
value
through
other
comprehensive
income
Non
-
UK
2,857
73
-
73
2.6
Interest
earning
assets
at
fair
value
through
other
comprehensive
income
Total
52,590
662
132
794
1.5
Other
interest
income
d
-
(59)
(11)
(70)
-
Total
interest
earning
assets
not
at
fair
value
through
P&L
458,201
7,459
1,766
-
9,225
2.3
Less
interest
expense
(4,329)
(316)
(4,646)
Net
interest
458,201
3,130
1,449
4,579
1.0
Interest
earning
assests
at
fair
value
through
P&L
UK
170,459
Interest
earning
assests
at
fair
value
through
P&L
Non
-
UK
77,129
Interest
earning
assests
at
fair
value
through
P&L
Total
247,588
Total
interest
earning
assets
705,789
Impairments
(4,851)
Non
-
interest
earning
assets
335,903
Total
1,036,841
Percentage
of
total
average
interest
earning
assets
in
offices
outside
the
UK
37%
Notes
a
Loans
and
advances
at
amortised
cost
include
all
doubtful
lendings,
including
non
-accrual
lendings.
Interest
receivable
on
such
lendings
has
been
included
to
the
extent
to
which
either
cash
payments
have
been
received
or
interest
has
been
accrued
in
accordance
with
the
income
recognition
policy
of
the
Barclays
Bank
Group.
b
Prior
year
balances
have
been
restated
to
provide
additi
onal
detail
on
cash
collateral
and
repurchase
agreements.
c
Net
Interest
Income
from
discontinued
operations
is
included
within
Interest
presented
elsewhere.
d
Other
interest
income
principally
relates
to
hedging
activity.
Additional
information
Additional
financial
disclosure
Barclays
Bank
PLC
2019
Annual
Report
on
Form
20-F
219
Liabilities
2019
Average
balance
Interest
presented
within
net
interest
income
Interest
presented
elsewhere
Total
interest
Rate
£m
£m
£m
£m
%
Deposits
at
amortised
cost
UK
110,455
636
-
636
0.6
Deposits
at
amortised
cost
Non
-
UK
67,628
1,142
(153)
989
1.5
Deposits
at
amortised
cost
Total
178,083
1,778
(153)
1,625
0.9
Cash
collateral
UK
50,985
214
(13)
201
0.4
Cash
collateral
Non
-
UK
8,332
82
-
82
1.0
Cash
collateral
Total
59,317
296
(13)
283
0.5
Debt
securities
in
issue
UK
15,832
101
-
101
0.6
Debt
securities
in
issue
Non
-
UK
25,730
772
-
772
3.0
Debt
securities
in
issue
Total
41,562
873
-
873
2.1
Subordinated
liabilities
UK
35,590
1,072
-
1,072
3.0
Subordinated
liabilities
Non
-
UK
374
24
-
24
6.4
Subordinated
liabilities
Total
35,964
1,096
-
1,096
3.0
Repurchase
agreements
UK
2,160
11
-
11
0.5
Repurchase
agreements
Non
-
UK
2,381
20
-
20
0.8
Repurchase
agreements
Total
4,541
31
-
31
0.7
Other
interest
expense
a
104
-
104
-
Total
interest
bearing
liabilities
not
at
fair
value
through
P&L
319,467
4,178
(166)
4,012
1.3
Interest
bearing
liabilities
at
fair
value
through
P&L
UK
231,224
Interest
bearing
liabilities
at
fair
value
through
P&L
Non
-
UK
62,304
Interest
bearing
liabilities
at
fair
value
through
P&L
Total
293,528
Total
interest
bearing
liabilities
612,995
Interest
free
customer
deposits
UK
30,688
Interest
free
customer
deposits
Non
-
UK
10,375
Interest
free
customer
deposits
Total
41,063
Other
non
-
interest
bearing
liabilities
303,005
Shareholders'
equity
50,034
Total
1,007,097
Percentage
of
total
average
interest
bearing
liabilities
in
offices
outside
the
UK
27%
Note
a
Other
interest
expense
principally
relates
to
hedging
activity.
Additional
information
Additional
financial
disclosure
Barclays
Bank
PLC
2019
Annual
Report
on
Form
20-F
220
Liabilities
2018
Average
balance
Interest
presented
within
net
interest
income
Interest
presented
elsewhere
b
Total
interest
Rate
£m
£m
£m
£m
%
Deposits
at
amortised
cost
UK
154,191
641
218
859
0.6
Deposits
at
amortised
cost
Non
-
UK
57,664
950
-
950
1.6
Deposits
at
amortised
cost
Total
211,855
1,591
218
1,809
0.9
Cash
collateral
UK
44,782
176
-
176
0.4
Cash
collateral
Non
-
UK
5,498
70
-
70
1.3
Cash
collateral
a
Total
50,280
246
-
246
0.5
Debt
securities
in
issue
UK
22,570
75
233
308
1.4
Debt
securities
in
issue
Non
-
UK
32,176
418
-
418
1.3
Debt
securities
in
issue
Total
54,746
493
233
726
1.3
Subordinated
liabilities
UK
20,753
1,382
-
1,382
6.7
Subordinated
liabilities
Non
-
UK
143
15
-
15
10.5
Subordinated
liabilities
Total
20,896
1,397
-
1,397
6.7
Repurchase
agreements
UK
5,416
9
-
9
0.2
Repurchase
agreements
Non
-
UK
6,302
12
-
12
0.2
Repurchase
agreements
Total
11,718
21
-
21
0.2
Other
interest
expense
c
581
(134)
447
-
Total
interest
bearing
liabilities
not
at
fair
value
through
P&L
349,495
4,329
317
4,646
1.3
Interest
bearing
liabilities
at
fair
value
through
P&L
UK
250,273
Interest
bearing
liabilities
at
fair
value
through
P&L
Non
-
UK
51,249
Interest
bearing
liabilities
at
fair
value
through
P&L
Total
301,522
Total
interest
bearing
liabilities
651,017
Interest
free
customer
deposits
UK
49,380
Interest
free
customer
deposits
Non
-
UK
9,496
Interest
free
customer
deposits
Total
58,876
Other
non
-
interest
bearing
liabilities
276,409
Shareholders'
equity
50,539
Total
1,036,841
Percentage
of
total
average
interest
bearing
liabilities
in
offices
outside
the
UK
24%
Notes
a
Prior
year
balances
have
been
restated
to
provide
additional
detail
on
cash
collateral
and
repurchase
agreements.
b
Interest
Income
from
discontinued
operations
is
included
within
Interest
presented
elsewhere.
c
Other
interest
expense
principally
relates
to
hedging
activity.
Additional
information
Additional
financial
disclosure
Barclays
Bank
PLC
2019
Annual
Report
on
Form
20-F
221
Changes
in
total
interest
–
volume
and
rate
analysis
The
following
tables
allocate
changes
in
interest
between
changes
in
volume
and
changes
in
interest
rates
for
the
last
two
years.
Volume
and
rate
variances
have
been
calculated
on
the
movement
in
the
average
balances
and
the
change
in
the
interest
rates
o
n
average
interest
earning
assets
and
average
interest
bearing
liabilities.
Where
variances
have
arisen
from
changes
in
both
volumes
and
interest
rates,
these
have
been
allocated
proportionately
between
the
two.
Interest
income
2019/2018
Change
due
to
increase/(decrease)
in:
2018/2017
Change
due
to
increase/(decrease)
in:
Total
change
Volume
Rate
Total
change
Volume
Rate
Other
a
£m
£m
£m
£m
£m
£m
£m
Cash
and
balances
at
central
banks
UK
(23)
(40)
-
Cash
and
balances
at
central
banks
Non
-
UK
(353)
(37)
(316)
-
Cash
and
balances
at
central
banks
Total
(280)
(60)
(220)
-
Loans
and
advances
at
amortised
cost
UK
(2,010)
(1,439)
(571)
(5,093)
(3,371)
(1,722)
-
Loans
and
advances
at
amortised
cost
Non
-
UK
(211)
(915)
-
Loans
and
advances
at
amortised
cost
Total
(1,571)
(1,124)
(447)
(5,304)
(2,667)
(2,637)
-
Cash
collateral
UK
-
Cash
collateral
Non
-
UK
(14)
(2)
(2)
-
-
Cash
collateral
b
Total
-
Financial
investments
UK
-
-
-
(651)
-
-
(651)
Financial
investments
Non
-
UK
-
-
-
(103)
-
-
(103)
Financial
investments
Total
-
-
-
(754)
-
-
(754)
Reverse
repurchase
agreements
UK
(69)
(33)
(36)
-
Reverse
repurchase
agreements
Non
-
UK
(8)
(394)
(244)
(150)
-
Reverse
repurchase
agreements
Total
(463)
(277)
(186)
-
Interest
earning
assets
at
fair
value
through
other
comprehensive
income
UK
(5)
(57)
Interest
earning
assets
at
fair
value
through
other
comprehensive
income
Non
-
UK
(1)
(37)
Interest
earning
assets
at
fair
value
through
other
comprehensive
income
Total
(2)
(94)
Other
interest
income
-
-
-
Total
interest
receivable
(1,306)
(1,119)
(187)
(5,111)
(3,006)
(2,105)
-
Note
a
Included
in
Other
is
the
movement
related
to
the
adoption
of
IFRS9
where
financial
investment
assets
were
reclassified
to
assets
held
at
fair
value
through
other
comprehensive
income,
which
is
neither
volume
or
rate
driven.
b.
Prior
year
balances
have
been
restated
to
provide
additional
detail
on
cash
collateral
and
repurchase
agreements
.
Additional
information
Additional
financial
disclosure
Barclays
Bank
PLC
2019
Annual
Report
on
Form
20-F
222
Interest
expense
2019/2018
Change
due
to
increase/(decrease)
in:
2018/2017
Change
due
to
increase/(decrease)
in:
Total
change
Volume
Rate
Total
change
Volume
Rate
£m
£m
£m
£m
£m
£m
Deposits
at
amortised
cost
UK
(223)
(251)
(417)
Deposits
at
amortised
cost
Non
-
UK
(113)
(417)
(553)
Deposits
at
amortised
cost
Total
(183)
(98)
(85)
(413)
(281)
(132)
Cash
collateral
liabilities
UK
Cash
collateral
liabilities
Non
-
UK
(18)
(2)
(11)
Cash
collateral
liabilities
a
Total
(17)
(9)
Debt
securities
in
issue
UK
(207)
(74)
(133)
(506)
(273)
(233)
Debt
securities
in
issue
Non
-
UK
(99)
(6)
Debt
securities
in
issue
Total
(173)
(172)
(279)
Subordinated
liabilities
UK
(310)
(992)
(198)
Subordinated
liabilities
Non
-
UK
(7)
-
Subordinated
liabilities
Total
(301)
(999)
(198)
Repurchase
agreements
UK
(7)
(215)
(106)
(109)
Repurchase
agreements
Non
-
UK
(11)
(326)
(128)
(198)
Repurchase
agreements
a
Total
(18)
(541)
(234)
(307)
Other
interest
expense
(344)
-
(344)
-
Total
interest
payable
(634)
(1,097)
(483)
(1,001)
a.
Prior
year
balances
have
been
restated
to
provide
additional
detail
on
cash
collateral
and
repurchase
agreements.
Additional
information
Additional
financial
disclosure
Barclays
Bank
PLC
2019
Annual
Report
on
Form
20-F
223
Credit
risk
additional
disclosure
This
section
of
the
report
contains
supplementary
information
that
is
more
detailed
or
contains
longer
histories
than
the
data
presented
in
the
Risk
review
section.
Risk
elements
in
loans
and
advances
at
amortised
cost
There
are
three
main
higher
credit
risk
elements
identified
in
loans
and
advances:
Loans
assessed
as
S
tage
3
credit
impaired
Stage
3
credit
impaired
loans
are
loans
in
default
assessed
for
lifetime
expected
credit
losses.
Further
details
on
the
approach
to
expected
credit
loss
provisioning,
including
the
classification
into
stages
of
gross
exposures
and
approach
to
the
measurement
of
lifetime
expected
credit
losses,
can
be
found
in
Note
1
Significant
Accounting
Policies
.
Loans
greater
than
9
0
days
past
due
not
considered
S
tage
3
credit
impaired
Under
a
US
reporting
framework,
all
accruing
loans
greater
than
90
days
past
due
are
considered
to
be
at
higher
risk
of
loss.
Barclays
Bank
Group
classifies
all
loans
and
advances
past
d
ue
90
days
except
mortgages
as
Stage
3
credit
impaired
loans
and
therefore
these
are
already
considered
a
higher
credit
risk.
However,
in
addition
to
Stage
3
gross
loans
and
advances
past
due
90
days
as
at
31
December
2019,
there
are
a
further
£8
m
of
Stage
2
mortgages
loans
between
90
to
180
days
past
due.
Restructured
loans
not
included
above
Restructured
loans:
comprises
loans
not
included
above
where,
for
economic
or
legal
reasons
related
to
the
debtor’s
financial
difficulties,
a
concession
has
been
granted
to
the
debtor
that
would
not
otherwise
be
considered.
Restruc
tured
loans
not
classified
as
Stage
3
credit
impaired
and
not
great
er
than
90
days
past
due
are
£118m
as
at
31
December
2019
.
These
risk
elements
in
loans
and
advances
at
amortised
cost
may
be
analysed
between
the
United
Kingdom
and
Rest
of
the
World
as
follows:
Risk
elements
in
loans
and
advances
at
amortised
cost
2019
2018
2017
a
As
at
31
December
£m
£m
£m
Gross
stage
3
credit
impaired
loans
(2017:
Individually
impaired
loans):
United
Kingdom
1,037
872
2,648
Rest
of
the
world
3,311
3,317
1,756
Total
4,348
4,189
4,404
Accruing
gross
loans
which
are
not
stage
3
credit
impaired
loans
and
are
contractually
overdue
90
days
or
more
as
to
principal
or
interest
(2017:
Accruing
gross
loans
which
are
not
individually
impaired
loans
and
are
contractually
overdue
90
days
or
more
as
to
principal
or
interest)
United
Kingdom
8
19
752
Rest
of
the
world
-
-
516
Total
8
19
1,268
Other
gross
restructured
loans
(2017
Impaired
and
restructured
loans):
United
Kingdom
-
-
179
Rest
of
the
world
118
115
143
Total
118
115
322
Total
risk
elements
in
loans
and
advances
at
amortised
cost
United
Kingdom
1,045
891
3,579
Rest
of
the
world
3,429
3,432
2,415
Total
4,474
4,323
5,994
Notes
a
The
comparatives
for
2017
ha
s
been
presented
on
an
IAS
39
basis
.
Additional
information
Additional
financial
disclosure
Barclays
Bank
PLC
2019
Annual
Report
on
Form
20-F
224
Interest
forgone
on
risk
elements
in
loans
and
advances
2019
2018
2017
£m
£m
£m
Interest
income
that
would
have
been
recognised
under
the
original
contractual
terms
United
Kingdom
-
-
87
Rest
of
the
World
184
180
151
Total
184
180
238
Potential
Problem
Loans
Potential
problem
loans
are
those
loans
for
which
serious
doubt
exists
as
to
the
ability
of
the
borrower
to
continue
to
comply
with
repayment
terms
in
the
near
future.
Loans
and
advances
at
amortised
cost
by
product
on
page
49
includes
gross
exposure
and
associated
impairment
allowance
for
assets
classified
as
Stage
2,
but
not
past
due
i.e.
assets
satisfying
the
criteria
for
a
Significant
Increase
in
Credit
Risk,
but
which
are
still
complying
with
repayment
terms.
Forbearance
measures
consist
of
concessions
towards
a
debtor
that
is
experiencing
or
is
about
to
experience
difficulties
in
meeting
their
financial
commitments.
Both
performing
and
non-
performing
forbearance
assets
are
classified
as
Stage
3
except
where
it
is
established
that
the
concession
granted
has
not
resulted
in
diminished
financial
obligation
and
that
no
other
regulatory
definition
of
default
criteria
has
been
triggered,
in
which
case
the
asset
is
classified
as
Stage
2.
The
minimum
probationary
period
for
non-
performing
forbearance
is
12
months
and
for
performing
forbearance,
24
months.
Hence,
a
minimum
of
36
months
is
required
for
non
-
performing
forbearance
to
move
out
of
a
forborne
state.
In
order
to
assess
asset
credit
quality,
12
-
month
PDs
are
used
to
map
assets
into
strong,
satisfactory,
higher
risk
or
credit
impaired.
A
credit
risk
profile
by
internal
PD
grade
for
gross
loans
and
advances
at
amortised
cost
and
allowance
for
ECL
is
shown
in
the
credit
risk
section
on
page
58
,
analysing
each
of
these
categor
ies
by
stage.
Wholesale
accounts
that
are
deemed
to
contain
heightened
levels
of
risk
are
recorded
on
graded
watchlists
comprising
four
categories,
graded
in
line
with
the
perceived
severity
of
the
risk
attached
to
the
lending,
and
its
probability
of
defa
ult.
Where
a
counterparty’s
financial
health
gives
grounds
for
concern,
it
is
immediately
placed
into
the
appropriate
category.
Once
an
account
has
been
placed
on
a
watchlist,
the
exposure
is
monitored
and,
where
appropriate,
exposure
reductions
are
effected.
Additional
information
Additional
financial
disclosure
Barclays
Bank
PLC
2019
Annual
Report
on
Form
20-F
225
Impairment
The
comparatives
for
2017
are
presented
on
an
IAS
39
basis.
Movements
in
allowance
for
impairment
by
geography
2019
a
2018
a
2017
£m
£m
£m
Allowance
for
impairment
as
at
1
January
3,843
7,102
4,620
Exchange
and
other
adjustments
(168)
(2,837)
(293)
Amounts
written
off:
United
Kingdom
(146)
(514)
(1,111)
Europe
(96)
(62)
(157)
Americas
(1,036)
(862)
(1,038)
Africa
and
Middle
East
(9)
-
(9)
Asia
(6)
(18)
(14)
New
and
increased/(released)
impairment
allowance:
United
Kingdom
147
91
1,345
Europe
116
84
110
Americas
1,071
809
1,192
Africa
and
Middle
East
(30)
32
23
Asia
10
18
(16)
Allowance
for
impairment
as
at
31
December
3,696
3,843
4,652
Average
loans
and
advances
at
amortised
cost
for
the
year
210,310
199,441
296,799
Analysis
of
impairment
charges
2019
2018
2017
As
at
31
December
£m
£m
£m
Impairment
charges:
United
Kingdom
93
(163)
354
Europe
127
52
92
Americas
927
758
1,084
Africa
and
Middle
East
(14)
16
22
Asia
8
25
(16)
Loans
and
advances
at
amortised
cost
1,141
688
1,536
Provision
for
undrawn
contractually
committed
facilities
and
guarantees
provided
55
(48)
14
Loans
impairment
1,196
640
1,550
Cash
collateral
and
settlement
balances
1
(1)
-
Financial
instruments
at
fair
value
through
other
comprehensive
income
-
4
3
Other
financial
assets
measured
at
amortised
cost
5
-
-
Impairment
charges
1,202
643
1,553
Additional
information
Additional
financial
disclosure
Barclays
Bank
PLC
2019
Annual
Report
on
Form
20-F
226
The
industry
classifications
in
the
tables
below
have
been
prepared
at
the
level
of
the
borrowing
entity.
This
means
that
a
loan
to
a
subsidiary
of
a
major
corporation
is
classified
by
the
industry
in
which
the
subsidiary
operates,
even
though
the
Parent’s
predominant
business
may
be
in
a
different
indu
stry.
Total
impairment
charges
on
loans
and
advances
at
amortised
cost
by
industry
2019
2018
2017
As
at
31
December
£m
£m
£m
United
Kingdom:
Financial
institutions
(4)
66
(42)
Manufacturing
(7)
(4)
(12)
Construction
(6)
(2)
4
Property
(5)
(26)
(19)
Energy
and
water
6
(1)
35
Wholesale
and
retail
distribution
and
leisure
32
(45)
39
Business
and
other
services
10
(116)
232
Home
loans
-
(15)
9
Cards,
unsecured
and
other
personal
lending
43
54
104
Other
24
(74)
4
Total
United
Kingdom
93
(163)
354
Overseas
1,048
851
1,182
Total
Impairment
charges
1,141
688
1,536
Allowance
for
impairment
by
industry
2019
a
2018
2017
As
at
31
December
£m
%
£m
%
£m
%
United
Kingdom:
Financial
institutions
63
1.7
66
1.7
11
0.2
Manufacturing
33
0.9
30
0.8
34
0.7
Construction
25
0.7
27
0.7
37
0.8
Property
38
1.0
39
1.0
48
1.0
Government
and
central
bank
-
-
-
-
1
-
Energy
and
water
20
0.5
5
0.1
108
2.3
Wholesale
and
retail
distribution
and
leisure
103
2.8
93
2.4
186
4.0
Business
and
other
services
138
3.7
135
3.5
482
10.4
Home
loans
11
0.3
19
0.5
137
2.9
Cards,
unsecured
and
other
personal
lending
181
4.9
193
5.0
1,671
35.9
Other
33
0.9
38
1.0
42
0.9
Total
United
Kingdom
645
17.4
645
16.8
2,757
59.3
Overseas
3,051
82.6
3,198
83.2
1,895
40.7
Total
3,696
100
3,843
100.0
4,652
100.0
Note
a
Other
financial
assets
subject
to
impairment
not
included
in
the
table
above
include
£22m
impairment
allowance
relating
to
cash
collateral
and
settlement
balances,
financial
assets
at
fair
value
through
other
comprehensive
income
and
other
assets.
Additional
information
Additional
financial
disclosure
Barclays
Bank
PLC
2019
Annual
Report
on
Form
20-F
227
Amounts
written
off
and
recov
ered
by
industry
Amounts
written
off
Recoveries
of
amounts
previously
written
off
2019
2018
2017
2019
2018
2017
As
at
31
December
£m
£m
£m
£m
£m
£m
United
Kingdom:
Financial
institutions
6
2
2
5
1
47
Manufacturing
2
11
2
4
3
-
Construction
6
7
10
1
-
-
Property
2
31
22
5
4
-
Energy
and
water
-
4
32
-
-
-
Wholesale
and
retail
distribution
and
leisure
12
34
23
19
14
-
Business
and
other
services
39
214
105
6
6
(5)
Home
loans
4
5
13
-
-
-
Cards,
unsecured
and
other
personal
lending
71
191
897
-
-
19
Other
4
15
5
4
2
-
Total
United
Kingdom
146
514
1,111
44
30
61
Overseas
1,147
942
1,218
29
56
127
Total
1,293
1,456
2,329
73
86
188
Impairment
ratios
2019
2018
2017
%
%
%
Impairment
charges
as
a
percentage
of
average
loans
and
advances
at
amortised
cost
0.57
0.32
0.52
Amounts
written
off
(net
of
recoveries)
as
a
percentage
of
average
loans
and
advances
at
amortised
cost
0.58
0.69
0.72
Allowance
for
impairment
balance
as
a
percentage
of
loans
and
advances
at
amortised
cost
as
at
31
December
2.54
2.73
1.41
Additional
information
Additional
financial
disclosure
Barclays
Bank
PLC
2019
Annual
Report
on
Form
20-F
228
Maturity
analysis
of
Gross
l
oans
and
advances
at
amortised
cost
Maturity
analysis
of
Gross
loans
and
advances
at
amortised
cost
On
demand
Not
more
than
three
months
Over
three
months
but
not
more
than
six
months
Over
six
months
but
not
more
than
one
year
Over
one
year
but
not
more
than
three
years
Over
three
years
but
not
more
than
five
years
Over
five
years
but
not
more
than
ten
years
Over
ten
years
Total
As
at
31
December
2019
£m
£m
£m
£m
£m
£m
£m
£m
£m
United
Kingdom
Corporate
lending
2,150
3,063
937
2,987
13,614
10,105
3,844
8,592
45,292
Other
lending
to
customers
in
the
United
Kingdom
1,156
930
3,646
1,020
4,869
1,354
1,204
3,742
17,921
Total
United
Kingdom
3,306
3,993
4,583
4,007
18,483
11,459
5,048
12,334
63,213
Europe
2,762
1,892
961
2,405
6,833
4,303
2,573
3,514
25,243
Americas
4,450
2,454
2,473
3,907
10,748
9,732
7,285
6,978
48,027
Africa
and
Middle
East
482
662
267
126
375
761
167
95
2,935
Asia
1,245
1,414
1,634
455
531
532
84
19
5,914
Total
loans
and
advances
at
amortised
cost
12,245
10,415
9,918
10,900
36,970
26,787
15,157
22,940
145,332
As
at
31
December
2018
United
Kingdom
Corporate
lending
447
2,185
1,236
2,697
12,864
9,914
4,619
11,144
45,106
Other
lending
to
customers
in
the
United
Kingdom
1,036
1,226
1,041
872
2,267
1,738
798
1,261
10,239
Total
United
Kingdom
1,483
3,411
2,277
3,569
15,131
11,652
5,417
12,405
55,345
Europe
2,756
1,990
1,122
2,050
8,489
3,919
3,266
4,703
28,295
Americas
4,325
2,228
1,707
3,288
13,700
9,933
6,813
7,043
49,037
Africa
and
Middle
East
344
662
562
188
724
480
48
131
3,139
Asia
647
1,672
541
512
1,095
357
127
35
4,986
Total
loans
and
advances
at
amortised
cost
9,555
9,963
6,209
9,607
39,139
26,341
15,671
24,317
140,802
Additional
information
Additional
financial
disclosure
Barclays
Bank
PLC
2019
Annual
Report
on
Form
20-F
229
Industrial
and
g
eographical
concentrations
of
Gross
l
oans
and
advances
at
amortised
cost
Gross
Loans
and
advances
at
amortised
cost
by
industry
2019
2018
2017
a
As
at
31
December
£m
£m
£m
Financial
institutions
29,516
27,540
36,196
Manufacturing
8,000
8,444
9,193
Construction
2,574
2,486
3,284
Property
11,121
10,745
20,364
Government
and
central
bank
11,404
3,476
9,090
Energy
and
water
5,373
5,508
5,644
Wholesale
and
retail
distribution
and
leisure
8,363
9,831
12,605
Business
and
other
services
14,816
17,438
20,381
Home
loans
11,334
13,530
147,460
Cards,
unsecured
loans
and
other
personal
lending
36,109
35,498
57,245
Other
6,722
6,306
7,780
Loans
and
advances
at
amortised
cost
145,332
140,802
329,242
Gross
Loans
and
advances
at
amortised
cost
in
the
UK
2019
2018
2017
a
As
at
31
December
£m
£m
£m
Financial
institutions
7,821
5,605
6,820
Manufacturing
4,512
4,035
6,198
Construction
2,320
2,277
3,025
Property
8,373
7,892
18,168
Government
and
central
bank
7,997
1,012
7,906
Energy
and
water
2,707
2,595
2,501
Wholesale
and
retail
distribution
and
leisure
6,686
7,993
10,617
Business
and
other
services
9,859
12,542
16,385
Home
loans
2,502
2,521
134,820
Cards,
unsecured
loans
and
other
personal
lending
6,903
6,122
30,786
Other
3,533
2,751
6,220
Loans
and
advances
at
amortised
cost
in
the
UK
63,213
55,345
243,446
Loans
and
advances
at
amortised
cost
in
Europe
2019
2018
2017
a
As
at
31
December
£m
£m
£m
Financial
institutions
5,668
5,937
6,130
Manufacturing
1,072
1,335
1,347
Construction
133
85
80
Property
504
708
734
Government
and
central
bank
1,459
1,778
323
Energy
and
water
828
675
621
Wholesale
and
retail
distribution
and
leisure
752
735
808
Business
and
other
services
907
991
1,023
Home
loans
7,985
10,157
11,578
Cards,
unsecured
loans
and
other
personal
lending
5,090
5,055
4,483
Other
845
839
632
Loans
and
advances
at
amortised
cost
in
Europe
25,243
28,295
27,759
Additional
information
Additional
financial
disclosure
Barclays
Bank
PLC
2019
Annual
Report
on
Form
20-F
230
Gross
Loans
and
advances
at
amortised
cost
in
the
Americas
2019
2018
2017
a
As
at
31
December
£m
£m
£m
Financial
institutions
12,308
12,430
18,559
Manufacturing
1,782
2,426
1,262
Construction
77
71
147
Property
2,123
2,071
1,272
Government
and
central
bank
319
424
-
Energy
and
water
1,437
1,667
1,986
Wholesale
and
retail
distribution
and
leisure
635
612
660
Business
and
other
services
3,620
2,970
2,629
Home
loans
380
433
567
Cards,
unsecured
loans
and
other
personal
lending
23,439
23,746
21,486
Other
1,907
2,187
523
Loans
and
advances
at
amortised
cost
in
the
Americas
48,027
49,037
49,091
Gross
Loans
and
advances
at
amortised
cost
in
Africa
and
Middle
East
2019
2018
2017
a
As
at
31
December
£m
£m
£m
Financial
institutions
948
1,319
1,067
Manufacturing
160
51
13
Property
55
52
112
Government
and
central
bank
269
262
860
Energy
and
water
116
200
252
Wholesale
and
retail
distribution
and
leisure
67
123
219
Business
and
other
services
363
221
64
Home
loans
391
331
378
Cards,
unsecured
loans
and
other
personal
lending
530
484
406
Other
36
96
97
Loans
and
advances
at
amortised
cost
in
Africa
and
Middle
East
2,935
3,139
3,468
Gross
Loans
and
advances
at
amortised
cost
in
Asia
2019
2018
2017
a
As
at
31
December
£m
£m
£m
Financial
institutions
2,771
2,249
3,620
Manufacturing
474
597
373
Construction
44
53
32
Property
66
22
78
Government
and
central
bank
1,360
-
1
Energy
and
water
285
371
284
Wholesale
and
retail
distribution
and
leisure
223
368
301
Business
and
other
services
67
714
280
Home
loans
76
88
117
Cards,
unsecured
loans
and
other
personal
lending
147
91
84
Other
401
433
308
Loans
and
advances
at
amortised
cost
in
Asia
5,914
4,986
5,478
Note
a
The
comparatives
for
2017
have
been
presented
on
an
IAS
39
basis.
Interest
rate
sensitivity
of
gross
loans
and
advances
at
amortised
cost
2019
2018
Fixed
rate
Variable
rate
Total
Fixed
rate
a
Variable
rate
a
Total
As
at
31
December
£m
£m
£m
£m
£m
£m
Gross
loans
and
advances
at
amortised
cost
39,282
106,050
145,332
30,937
109,865
140,802
Note
a
Comparatives
have
been
restated
to
better
reflect
the
interest
rate
classifications.
Additional
information
Additional
financial
disclosure
Barclays
Bank
PLC
2019
Annual
Report
on
Form
20-F
231
Foreign
outstandings
for
countries
where
this
exceeds
0.75%
of
total
Group
assets
a
As
%
of
assets
Total
Banks
and
other
financial
institutions
Government
and
official
institutions
Commercial
industrial
and
other
private
sectors
Financial
guarantees
%
£m
£m
£m
£m
£m
As
at
31
December
2019
b
United
States
11.5
100,677
64,463
15,053
20,378
783
Germany
1.3
11,031
9,488
-
1,447
96
France
1.2
10,314
9,158
-
1,097
59
Netherlands
1.1
9,988
7,018
686
2,084
200
As
at
31
December
2018
b
United
States
10.8
95,199
61,382
14,375
18,241
1,201
Germany
0.9
8,101
4,554
1,612
1,819
116
France
2.2
19,556
11,976
3,508
4,037
35
As
at
31
December
2017
b
United
States
7.5
84,215
46,888
13,081
23,609
637
Germany
1.6
17,642
2,818
12,554
2,206
64
France
2.3
25,599
15,156
4,067
6,248
128
Note
a
Foreign
outstanding
includes
cross
border
exposure
in
non
-local
currency
of
the
Barclays
branches
and
subsidiaries,
and
in
country
foreign
currency
exposure.
b
Comparatives
have
been
restated
to
reflect
the
carrying
value
on
the
balance
sheet.
Figures
are
net
of
short
securities
.
Off-balance
sheet
and
other
credit
exposures
2019
2018
2017
As
at
31
December
£m
£m
£m
Off-balance
sheet
exposures
Contingent
liabilities
23,777
19,394
19,012
Commitments
270,027
257,768
315,573
On-balance
sheet
exposures
Trading
portfolio
assets
113,337
104,038
113,755
Financial
assets
at
fair
value
through
the
income
statement
129,470
145,250
116,282
Derivative
financial
instruments
229,641
222,683
237,987
Financial
investments
a
-
-
58,963
Financial
assets
at
fair
value
through
other
comprehensive
income
45,406
44,994
-
Note
a
Following
the
adoption
of
IFRS
9
in
2018,
financial
investments
classification
is
no
longer
applicable.
Notional
principal
amounts
of
credit
derivatives
2019
2018
2017
As
at
31
December
£m
£m
£m
Credit
derivatives
held
or
issued
for
trading
purposes
a
825,516
759,075
715,741
Note
a
Includes
credit
derivatives
held
as
economic
hedges
which
are
not
designated
as
hedges
for
accounting
purposes.
Glossary
of
terms
Barclays
Bank
PLC
2019
Annual
Report
on
Form
20-F
232
‘A
-
IRB’
/
‘Advanced
-
Internal
Ratings
Based’
‘ABS
CDO
Super
Senior’
of
super
senior
tranches
takes
priority
over
other
obligations.
‘Acceptances
and
endorsements’
Group
expects
most
acceptances
to
be
presented,
but
reimbursement
by
the
customer
is
normally
immediate.
Endorsements
are
residual
liabilities
of
the
Barclays
Bank
Group
in
respect
of
bills
of
exchange
which
have
been
paid
and
subsequently
rediscounted.
‘Additional
Tier
1
(AT1)
capital’
‘Additional
Tier
1
(AT1)
securities’
‘Advanced
Measurement
Approach
(AMA)’
for
operational
risk.
Banks
can
only
use
this
approach
subject
to
approval
from
their
local
regulators.
‘Agencies’
‘Agency
Mortgage
-
Backed
Securities’
‘All
price
risk
(APR)’
An
estimate
of
all
the
material
market
risks,
including
rating
migration
and
defaul
t
for
the
correlation
trading
portfolio.
‘American
Depository
Receipts
(ADR)’
A
negotiable
certificate
that
represents
the
ownership
of
shares
in
a
non
-
US
company
(for
example
Barclays)
trading
in
US
financial
markets.
‘Americas’
‘Annual
Earnings
at
Risk
(AEaR)’
A
measure
of
the
potential
change
in
Net
Interest
Income
(NII)
due
to
an
interest
rate
movement
over
a
one
-
year
perio
d.
‘Annualised
cumulative
weighted
average
lifetime
PD’
The
probability
of
default
over
the
remaining
life
of
the
asset,
expressed
as
an
annual
rate,
reflecting
a
range
of
possible
economic
scenarios.
‘Application
scorecards’
Algorithm
based
decision
tools
used
to
aid
business
decisions
and
manage
credit
risk
based
on
available
customer
data
at
the
point
of
application
for
a
product.
‘Arrears’
overdue.
Such
customers
are
also
said
to
be
in
a
state
of
delinquency.
When
a
customer
is
in
arrears,
their
entire
outstanding
balance
is
said
to
be
delinquent,
meaning
that
delinquent
balances
are
the
total
outstanding
loans
on
which
payments
are
overdue.
‘Asia’
‘Asset
Backed
Commercial
Paper’
purposes.
‘Asset
Backed
Securities
(ABS)’
any
assets
which
attract
a
set
of
associated
cash
flows
but
are
commonly
pools
of
residential
or
commercial
mortgages
and,
in
the
case
of
Collateralised
Debt
Obligations
(CDOs),
the
referenced
pool
may
be
ABS
or
other
classes
of
assets.
‘Attributa
ble
profit’
classified
as
equity.
‘Average
allocated
tangible
equity’
Calculated
as
the
average
of
the
previous
month’s
period
end
allocated
tangible
equity
and
the
current
month’s
period
end
allocated
tangible
equity.
The
average
allocated
tangible
equity
for
the
period
is
the
average
of
the
monthly
averages
within
that
period.
‘Average
tangible
shareholders’
equity’
Calculated
as
the
average
of
the
previous
month’s
period
end
tangible
equity
and
the
current
month’s
period
end
tangible
equity.
The
average
tangible
shareholders’
equity
for
the
period
is
the
average
of
the
monthly
averages
within
that
period.
Glossary
of
terms
Barclays
Bank
PLC
2019
Annual
Report
on
Form
20-F
233
‘Average
UK
leverage
ratio’
As
per
the
PRA
rulebook,
is
calculated
as
the
average
capital
measure
based
on
the
last
day
of
each
month
in
the
quarter
divided
by
the
average
exposure
measure
for
the
quarter,
where
the
average
exposure
is
based
on
each
day
in
the
quarter.
‘Back
testing’
Includes
a
number
of
techniques
that
assess
the
continued
statistical
validity
of
a
model
by
simulating
how
the
model
would
have
predicted
recent
experience.
‘Barclays
Africa’
or
‘Absa’
Barclays
Africa
Group
Limited
(now
Absa
Group
Limited),
which
was
previously
a
subsidiary
of
the
Barclays
Group.
‘Balance
weighted
Loan
to
Value
(LTV)
ratio’
market
LTVs
derived
by
calculating
individual
LTVs
at
account
level
and
weighting
it
by
the
balances
to
arrive
at
the
average
position.
Balance
weighted
loan
to
value
is
calculated
using
the
following
formula:
LTV
=
((loan
balance
1
x
MTM
LTV%
for
loan
1)
+
(loan
balance
2
x
MTM
LTV%
for
loan
2)
+
...)
/
total
outstandings
in
portfolio.
‘Barclaycard’
lending,
merchant
acquiring,
com
mercial
cards
and
point
of
sale
finance.
Barclaycard
has
scaled
operations
in
the
UK,
US,
Germany
and
Scandinavia.
‘Barclaycard
Consumer
UK’
‘Barclays’
or
’Barclays
Group’
‘Barclays
Bank
Group’
‘Barclays
Bank
UK
Group’
‘Barclays
Operating
businesses’
The
core
Barclays
businesses
operated
by
Barclays
UK
(which
include
the
UK
Personal
banking;
UK
business
banking
and
the
Barclaycard
consumer
UK
businesses)
and
Barclays
International
(the
large
UK
Corporate
business;
the
international
Corporate
and
Private
Bank
businesses;
the
Investment
Bank;
the
international
Barclaycard
business;
and
payments).
‘Barclays
Direct’
‘Barclays
Execution
Services’
or
‘BX’
or
‘BSerL’
or
‘Group
Service
Company’
Barclays
Execution
Services
Limited,
the
Group
services
company
set
up
to
provide
services
to
Barclays
UK
and
Barclays
International
to
deliver
operational
continuity.
‘Barclays
International’
The
segment
of
Barclays
held
by
Barclays
Bank
PLC
which
has
not
been
ring
-
fenced
as
part
of
regulatory
ring
fencing
requirements.
The
division
includes
the
large
UK
Corporate
business;
the
international
Corporate
and
Private
Bank
businesses;
the
Investment
Bank;
the
international
Barclaycard
business;
and
payments.
‘Barclays
Non
-
Core’
The
previously
reported
unit
comprising
of
a
group
of
businesses
and
assets
that
were
exited
or
run
down
by
Barclays,
which
was
closed
in
2017.
‘Barclays
UK’
The
segment
of
Barclays
held
by
Barclays
Bank
UK
PLC
which
has
been
ring
-
fenced
as
part
of
regulatory
ring
fencing
requirements.
The
division
includes
the
UK
Personal
banking;
UK
business
banking
and
the
Barclaycard
consumer
UK
businesses.
‘Basel
3’
measures
developed
by
the
Basel
Committee
on
Banking
Supervision
aiming
to
strengthen
the
regulation,
supervision
and
risk
management
of
banks.
‘Basel
Committee
of
Banking
Supervision
(BCBS
or
The
Basel
Committee)’
develops
global
supervisory
standards
for
the
banking
industry.
Its
45
members
are
officials
from
central
banks
or
prudential
supervisors
from
28
jurisdictions.
‘Basic
Indicator
Approach
(BIA)’
Under
the
BIA,
banks
are
required
to
hold
regulatory
capital
for
operational
risk
equal
to
15%
of
the
annual
average,
calculated
over
a
rolling
three
-
year
period,
of
the
relevant
income
indicator
for
the
bank
as
whole.
‘Basis
point(s)’
/
‘bp(s)’
yields
on
securities
and
for
other
purposes.
Glossary
of
terms
Barclays
Bank
PLC
2019
Annual
Report
on
Form
20-F
234
‘Basis
risk’
especially
under
stressed
market
conditions.
‘Behavioural
scorecards’
Algorithm
based
decision
tools
used
to
aid
business
decisions
and
manage
credit
risk
based
on
existing
customer
data
derived
from
account
usage.
‘Book
quality’
In
the
context
of
the
Capital
Risk
section,
changes
in
RWAs
caused
by
factors
such
as
underlying
customer
behaviour
or
demographics
leading
to
changes
in
risk
profile.
‘Book
size’
In
the
context
of
the
Capital
Risk
section
,
‘Business
Banking’
Offers
specialist
advice,
products
and
services
to
small
and
medium
enterprises
in
the
UK.
‘Business
Lending’
Business
Lending
in
Barclays
UK
that
primarily
relates
to
small
and
medium
enterprises
typically
with
exposures
up
to
£3m
or
with
a
turnover
up
to
£5m.
‘Business
scenario
stresses’
Investment
Bank.
‘Buy
to
let
mortgage’
A
mortgage
where
the
intention
of
the
customer
(investor)
was
to
let
the
property
at
origination.
‘Capital
Conservation
Buffer
(CCB)’
A
capital
buffer
of
2.5%
of
a
bank’s
total
exposures
that
needs
to
be
met
with
an
additional
amount
of
Common
Equity
Tier
1
capital
above
the
4.5%
minimum
requirement
for
Common
Equity
Tier
1
set
out
in
CRR.
Its
objective
is
to
conserve
a
bank’s
capital
by
ensuring
that
banks
build
up
surplus
capital
outside
periods
of
stress
which
can
be
drawn
down
if
losses
are
incurred.
‘Capital
ratios’
‘Capital
Requirements
Directive
(CRD)’
Directive
2013/36/EU,
a
component
of
the
CRD
IV
package
which
accompanies
the
Capital
Requirements
Regulation
and
sets
out
macroprudential
standards
including
the
countercyclical
capital
buffer
and
capital
buffers
for
systemically
important
institutions.
Directive
(EU)
2019/878,
published
as
part
of
the
EU
Risk
Reduction
Measure
package
amends
CRD.
These
amendments
enter
into
force
from
27
June
2019,
with
EU
member
states
required
to
adopt
the
measures
within
the
Directive
by
28
December
2020.
‘Capital
Requ
irements
Regulation
(CRR)’
Regulation
(EU)
No
575/2013,
a
component
of
the
CRD
IV
package
which
accompanies
the
Capital
Requirements
Directive
and
sets
out
detailed
rules
for
capital
eligibility,
the
calculation
of
RWAs,
the
measurement
of
leverage,
the
ma
nagement
of
large
exposures
and
minimum
standards
for
liquidity.
Between
27
June
2019
and
28
June
2023,
this
regulation
will
be
amended
in
line
with
the
requirements
of
amending
Regulation
(EU)
2019/876
(CRR
II).
‘Capital
Requirements
Regulation
II
(CRR
II
)’
Regulation
(EU)
2019/876,
amending
Regulation
(EU)
No
575/2013
(CRR).
This
is
a
component
of
the
EU
Risk
Reduction
Measure
package.
The
requirements
set
out
in
CRR
II
will
be
introduced
between
27
June
2019
and
28
June
2023.
‘Capital
requirements
on
the
underlying
exposures
(KIRB)’
An
approach
available
to
banks
when
calculating
RWAs
for
securitisation
exposures.
This
is
based
upon
the
RWA
amounts
that
would
be
calculated
under
the
IRB
approach
for
the
underlying
pool
of
securitised
exposures
in
the
program,
had
such
exposures
not
been
securitised.
‘Capital
resources’
as
‘own
funds’
within
EU
regulatory
texts.
‘Capital
risk’
meet
its
regulatory
capital
requirements
under
normal
operating
environments
or
stressed
conditions
(both
actual
and
as
defined
for
internal
planning
or
regulatory
testing
purposes).
This
includes
the
risk
from
the
Barclays
Bank
Group’s
pension
plans.
‘Central
Counterparty’
/
‘Central
Clearing
Counterparties
(CCPs)’
transaction,
such
as
a
derivative
contract
or
repurchase
agreement
(repo).
Where
a
central
counterparty
is
used,
a
single
bi-
lateral
contract
between
the
buyer
and
seller
is
replaced
with
two
contracts,
one
between
the
buyer
and
the
CCP
and
one
between
the
CCP
and
the
seller.
The
use
of
CCPs
allows
for
greater
oversight
and
improved
credit
risk
mitigation
in
over
-
the-
counter
(OTC)
markets.
‘Charge
-off’
the
full
balance.
This
is
normally
when
six
payments
are
in
arrears.
Glossary
of
terms
Barclays
Bank
PLC
2019
Annual
Report
on
Form
20-F
235
‘Client
Assets’
Assets
managed
or
administered
by
Barclays
Bank
Group
on
behalf
of
clients
including
assets
under
management
(A
UM),
custody
assets,
assets
under
administration
and
client
deposits.
‘CLOs
and
Other
insured
assets’
with
Credit
Support
Annex
(CSA)
protection.
‘Collateralised
Debt
Obligation
(CDO)’
certain
other
related
assets
purchased
by
the
issuer.
CDOs
may
feature
exposure
to
sub
-
prime
mortgage
assets
thr
ough
the
underlying
assets.
‘Collateralised
Loan
Obligation
(CLO)’
different
classes
of
owners
(in
tranches).
‘Collateralised
Mortgage
Obligation
(CMO)’
and
passes
them
on
to
investors
of
the
security.
‘Combined
Buffer
Requirement’
In
the
context
of
the
CRD
capital
obligations,
the
combined
requirements
of
the
Capital
Conservation
Buffer,
the
GSII
Buffer,
the
OSII
buffer,
the
Systemic
Risk
buffer
and
an
institution
specific
counter
-
cyclical
buffer.
‘Commercial
paper
(CP)’
‘Commercia
l
real
estate
(CRE)’
Commercial
real
estate
includes
office
buildings,
industrial
property,
medical
centres,
hotels,
retail
stores,
shopping
centres,
farm
land,
multifamily
housing
buildings,
warehouses,
garages,
and
industrial
properties
and
other
similar
properties.
Commercial
real
estate
loans
are
loans
backed
by
a
package
of
commercial
real
estate.
Note:
for
the
purposes
of
the
Credit
Risk
section,
the
UK
CRE
portfolio
includes
property
investment,
development,
trading
and
housebuilders
but
excludes
soc
ial
housing
contractors.
‘Committee
of
Sponsoring
Organisations
of
the
Treadway
Commission
Framework
(COSO)’
A
joint
initiative
of
five
private
sector
organisations
dedicated
to
the
development
of
frameworks
and
providing
guidance
on
enterprise
risk
manage
ment,
internal
control
and
fraud
deterrence.
‘Commodity
derivatives’
oil
and
oil
related,
power
and
natural
gas).
‘Commodity
risk’
vs.
WTI
crude
prices).
‘Common
Equity
Tier
1
(CET1)
capital’
share
premium,
retained
earnings
and
other
reserves,
less
specified
regulatory
adjustments.
‘Common
Equity
Tier
1
(CET1)
ratio’
‘Compensation:
income
ratio’
The
ratio
of
compensation
expense
over
total
income.
Compensation
represents
total
staff
costs
less
non-
compensation
items
consisting
of
outsourcing,
staff
training,
redundancy
costs
and
retirement
costs.
‘
Comprehensive
Capital
Analysis
and
Review
(CCAR)’
An
annual
exercise,
required
by
and
evaluated
by
the
Federal
Reserve,
through
which
the
largest
bank
holding
companies
operating
in
the
US
assess
whether
they
have
sufficient
capital
to
continue
operations
through
periods
of
ec
onomic
and
financial
stress
and
have
robust
capital-planning
processes
that
account
for
their
unique
risks.
‘Comprehensive
Risk
Measure
(CRM)’
An
estimate
of
all
the
material
market
risks,
including
rating
migration
and
default
for
the
correlation
trading
portfolio.
Also
referred
to
as
All
Price
Risk
(APR)
and
Comprehensive
Risk
Capital
Charge
(CRCC).
‘Conduct
risk’
services,
inc
luding
instances
of
wilful
or
negligent
misconduct.
‘Constant
Currency
Basis’
Excluding
the
impact
of
foreign
currency
conversion
to
GBP
when
comparing
financial
results
in
two
different
financial
periods.
‘Consumer,
Cards
and
Payments’
Barclays
US
Consume
r
Bank,
Barclaycard
Germany,
Barclays
Partner
Finance,
Barclaycard
Commercial
Payments,
Barclaycard
Payment
Solutions
(including
merchant
acquiring)
and
the
international
Wealth
business.
Glossary
of
terms
Barclays
Bank
PLC
2019
Annual
Report
on
Form
20-F
236
‘Contingent
capital
notes
(CCNs)’
written
off
or
converted
into
an
equity
instrument
from
the
issuer's
perspective
in
the
event
of
the
Common
Equity
Tier
1
(CET1)
ratio
of
the
re
levant
Barclays
Bank
Group
entity
falling
below
a
specific
level,
or
at
the
direction
of
regulators.
‘Conversion
Trigger’
Used
in
the
context
of
Contingent
Capital
Notes
and
AT1
securities.
A
capital
adequacy
trigger
event
occurs
when
the
CET1
ratio
of
the
bank
falls
below
a
certain
level
(the
trigger)
as
defined
in
the
Terms
&
Conditions
of
the
instruments
issued.
See
‘Contingent
capital
notes’.
‘Core
deposit
intangibles’
‘Correlation
risk’
time.
‘Corporate
and
Investment
Bank
(CIB)’
Barclays
Corporate
and
Investment
Bank
businesses
which
form
part
of
Barclays
Internation
al.
‘Cost:
income
ratio’
‘Cost
of
Equity’
‘Cost:
net
operating
income
ratio’
‘Count
ercyclical
Capital
Buffer
(CCyB)’
An
additional
buffer
introduced
as
part
of
the
CRD
IV
package
that
requires
banks
to
have
an
additional
cushion
of
CET
1
capital
with
which
to
absorb
potential
losses,
enhancing
their
resilience
and
contributing
to
a
stable
financial
system.
‘Countercyclical
leverage
ratio
buffer
(CCLB)’
A
macroprudential
buffer
that
has
applied
to
specific
PRA
regulated
institutions
since
2018
and
is
calculated
at
35%
of
any
risk
weighted
countercyclical
capital
buffer
set
by
the
Financial
Policy
Committee
(FPC).
The
CCLB
applies
in
addition
to
the
minimum
of
3.25%
and
any
G
-
SII
additional
Leverage
Ratio
Buffer
that
applies.
‘Counterparty
credit
risk’
RWAs,
a
component
of
RWAs
that
represents
the
risk
of
loss
in
derivatives,
repurchase
agreements
and
similar
transactions
resulting
from
the
default
of
the
counterparty.
‘Coverage
ratio’
‘Covered
bonds’
holders
of
the
covered
bonds.
‘CRD
IV’
The
Fourth
Capital
Requirements
Directive,
an
EU
Directive
and
an
accompanying
Regulation
(CRR)
that
together
prescribe
EU
capital
adequacy
and
liquidity
requirements
and
implements
Basel
3
in
the
European
Union.
‘CRD
V’
The
Fifth
Capital
Requirements
Directive,
comprising
an
EU
amending
Directive
and
an
accompanying
amending
Regulation
(CRR
II)
that
together
prescribe
EU
capital
adequacy
and
liquidity
requirements
and
implements
enhanced
Basel
3
proposals
in
the
European
Union.
‘Credit
conversion
factor
(CCF)’
Factor
used
to
estimate
the
risk
from
off
-
balance
sheet
commitments
for
the
purpose
of
calculating
the
total
Exposure
at
Default
(EAD)
used
to
calculate
RWAs.
‘Credit
default
swaps
(CDS)’
to
make
payments
to
the
protection
buyer
in
the
event
of
a
defined
credit
event.
Credit
events
normally
include
bankruptcy,
payment
default
on
a
reference
asset
or
assets,
or
downgrades
by
a
rating
agency.
‘Credit
derivatives
(CDs)’
protection.
‘Credit
impairment
charges’
impairment
charges
on
fair
value
through
other
comprehensive
income
assets
and
reverse
repurchase
agreements.
Glossary
of
terms
Barclays
Bank
PLC
2019
Annual
Report
on
Form
20-F
237
‘Credit
market
exposures’
significantly
impacted
by
the
deterioration
in
the
global
credit
markets.
The
exposures
include
positions
subject
to
fair
value
movements
in
the
Income
Statement,
positions
that
are
classified
as
loans
and
advances
and
available
for
sale
and
other
assets.
‘Credit
quality
step’
assessments
of
a
recognised
credit
rating
agency
or
export
credit
agency
to
credit
quality
steps
that
determine
the
risk
weight
to
be
applied
to
an
exposure.
‘Credit
Rating’
An
evaluation
of
the
creditworthiness
of
an
entity
seeking
to
enter
into
a
credit
agreement.
‘Credit
risk’
obligations
to
Barclays,
including
the
whole
and
timely
payment
of
principal,
interest,
collateral
and
other
receivables.
In
the
context
of
RWAs,
it
is
the
component
of
RWAs
that
represents
the
risk
of
loss
in
loans
and
advances
and
similar
transactions
resulting
from
the
default
of
the
counterparty.
‘Credit
risk
mitigation’
divided
into
three
types;
collateral,
netting
and
set-off,
and
risk
transfer.
‘Credit
spread’
‘Credit
Valuation
Adjustment
(CVA)’
account
the
counterparty’s
risk
of
default.
The
CVA
therefore
represents
an
estimate
of
the
adjustment
to
fair
value
that
a
market
participant
would
make
to
incorporate
the
credit
risk
of
the
counterparty
due
to
any
failure
to
perform
on
contractual
agreements.
‘CRR
leverage
exposure’
‘CRR
leverage
ratio’
Is
calculated
using
the
CRR
definition
of
Tier
1
capital
for
the
numerator
and
the
CRR
definition
of
leverage
exposure
as
the
denominator.
‘Customer
assets’
date
divided
by
number
of
days
in
the
year
to
date.
‘Customer
deposits’
Such
funds
are
recorded
as
liabilities
in
the
Barclays
Bank
Group’s
balance
sheet
under
deposits
at
amortised
cost.
‘Customer
liabilities’
‘Customer
net
interest
income’
related
to
customer
assets
and
liabilities
only
and
does
not
include
any
interest
on
securities
or
other
non
-
customer
assets
and
liabilities.
‘CVA
volatility
charge’
counterparty.
This
is
to
reflect
the
current
market
value
of
the
credit
risk
associated
with
the
counterparty
to
the
Barclays
Bank
Group.
The
charge
is
prescribed
by
the
CRR.
‘DBRS’
‘Debit
Valuation
Adjustment
(DVA)’
portfolio
of
trades
and
the
market
value
which
takes
into
account
the
Barclays
Bank
Grou
p’s
risk
of
default.
The
DVA,
therefore,
represents
an
estimate
of
the
adjustment
to
fair
value
that
a
market
participant
would
make
to
incorporate
the
credit
risk
of
the
Barclays
Bank
Group
due
to
any
failure
to
perform
on
contractual
obligations.
The
DVA
decreases
the
value
of
a
liability
to
take
into
account
a
reduction
in
the
remaining
balance
that
would
be
settled
should
the
Barclays
Bank
Group
default
or
not
perform
any
contractual
obligations.
‘Debt
buybacks’
recognition
from
the
balance
sheet.
‘Debt
securities
in
issue’
Group
and
include
certificates
of
deposit
and
commercial
paper.
Glossary
of
terms
Barclays
Bank
PLC
2019
Annual
Report
on
Form
20-F
238
‘Default
grades’
differences
in
the
probabilit
y
of
default
risk.
‘Default
fund
contributions’
to
this
fund
in
advance
of
using
a
CCP.
The
default
fund
can
be
used
by
the
CCP
to
cover
losses
incurred
by
the
CCP
where
losses
are
greater
than
the
margins
provided
by
that
member.
‘Derivatives
netting’
netting
agreements
and
eligible
cash
collateral
received
in
derivative
transactions
that
meet
the
requirements
of
BCBS
270.
‘Diversification
effect’
the
sum
of
the
individual
asset
class
DVaR
estimates
less
the
total
DVaR.
‘Dodd
-
Frank
Act
(DFA)’
‘Early
warning
lists
(EWL)’
difficulties
may
develop,
allowing
timely
corrective
action
to
be
taken.
There
are
three
categories
of
EWL,
with
risk
increasing
from
EWL
1
(caution)
to
EWL
2
(medium)
and
EWL
3
(high).
It
is
expected
that
most
cases
would
be
categorised
EWL
1
before
moving
to
2
or
3,
but
it
is
recognised
that
some
cases
may
be
categorised
to
EWL
2
or
3
directly.
‘Early
Warning
List
(EWL)
Managed
accounts’
EWL
Managed
accounts
are
Business
Len
ding
customers
that
exceed
the
Arrears
Managed
Accounts
limits
and
are
monitored
with
standard
processes
that
record
heightened
levels
of
risk
through
an
EWL
grading.
‘Earnings
per
Share
contribution’
The
attributable
profit
or
loss
generated
by
a
particul
ar
business
or
segment
divided
by
the
weighted
average
number
of
Barclays
shares
in
issue
to
illustrate
on
a
per
share
basis
how
that
business
or
segment
contributes
total
earnings
per
share.
‘Economic
Value
of
Equity
(EVE)’
movement,
based
on
existing
balance
sheet
run
-
off
profile.
'Effective
Expected
Positive
Exposure
(EEPE)'
The
weighted
average
over
time
of
effective
exp
ected
exposure.
The
weights
are
the
proportion
that
an
individual
exposure
represents
of
the
entire
exposure
horizon
time
interval.
‘Eligible
liabilities’
Liabilities
and
capital
instruments
that
are
eligible
to
meet
MREL
that
do
not
already
qualify
as
own
funds.
‘Encumbrance’
The
use
of
assets
to
secure
liabilities,
such
as
by
way
of
a
lien
or
charge.
‘Enterprise
Risk
Management
Framework
(ERMF)’
Management
Framework
,
which
describes
how
Barclays
identifies
and
manages
risk.
The
framework
identifies
the
principal
risks
faced
by
the
Barclays
Bank
Group;
sets
out
risk
appetite
requirements;
sets
out
roles
and
responsibilities
for
risk
management;
and
sets
out
risk
commi
ttee
structure.
‘Equities’
‘Equity
and
stock
index
derivatives’
and
options
(including
warrants,
which
are
equity
options
listed
on
an
exchange).
The
Barclays
Bank
Group
also
enters
into
fund
-
linked
derivatives,
being
swaps
and
options
whose
underlyings
include
mutual
funds,
hedge
funds,
indices
and
multi-asset
portfolios.
An
equity
swap
is
an
agreement
between
two
parties
to
exchange
periodic
payments,
based
upon
a
notional
principal
amount,
with
one
side
paying
fixed
or
floating
interest
and
the
other
side
paying
based
on
the
actual
return
of
the
stock
or
stock
index.
An
equity
option
provides
the
buyer
with
the
right,
but
not
the
obligation,
either
to
purchase
or
sell
a
specified
stock,
basket
of
stocks
or
stock
index
at
a
specified
price
or
level
on
or
before
a
specified
date.
‘Equity
risk’
‘Equity
structural
hedge’
smoothen
the
income
over
a
medium/long
term.
‘EU
Risk
Reduction
Measure
package’
A
collection
of
amending
Regulations
and
Directives
that
update
core
EU
regulatory
texts
and
which
came
into
force
on
27
June
2019.
‘Euro
Interbank
Offered
Rate
(EURIBOR)’
market.
Glossary
of
terms
Barclays
Bank
PLC
2019
Annual
Report
on
Form
20-F
239
‘Europe’
Europe.
‘European
Banking
Authority
(EBA)’
The
European
Banking
Authority
(EBA)
is
an
independent
EU
Authority
which
works
to
ensure
effective
and
consistent
prudential
regulation
and
supervision
across
the
European
banking
sector.
Its
overall
objectives
are
to
maintain
financial
stability
in
the
EU
and
to
safeguard
the
integrity,
efficiency
and
orderly
functioning
of
the
banking
sector.
‘European
Securities
and
Markets
Authority
(ESMA)’
An
independent
European
Supervisory
Authority
with
the
rem
it
of
enhancing
the
protection
of
investors
and
reinforcing
stable
and
well-functioning
financial
markets
in
the
European
Union.
‘Eurozone’
Represents
the
19
European
Union
countries
that
have
adopted
the
euro
as
their
common
currency.
The
19
countries
are
Austria,
Belgium,
Cyprus,
Estonia,
Finland,
France,
Germany,
Greece,
Ireland,
Italy,
Latvia,
Lithuania,
Luxembourg,
Malta,
Netherlands,
Portugal,
Slovakia,
Slovenia
and
Spain.
‘Expected
Credit
Losses
(ECL)’
period
of
time.
ECLs
must
reflect
the
present
value
of
cash
shortfalls,
and
must
reflect
the
unbiased
and
probability
weighted
assessment
of
a
range
of
outcomes.
‘Expected
Losses’
capital
adequacy
calculations.
It
is
measured
as
the
Barclays
Bank
Group's
modelled
view
of
anticipated
losses
based
on
Probability
o
f
Default
(PD),
Loss
Given
Default
(LGD)
and
Exposure
at
Default
(EAD),
with
a
one
-
year
time
horizon.
’Expert
lender
models’
counterparty,
but
where
there
is
insufficient
data
to
support
the
construction
of
a
statistical
model.
These
models
utilise
the
knowledge
of
credit
experts
that
have
in
depth
experience
of
the
specific
customer
type
being
modelled.
‘Exposure’
Generally
refers
to
positions
or
actions
taken
by
the
bank,
or
consequences
thereof,
that
may
put
a
certain
amount
of
a
bank’s
resources
at
risk.
‘Exposure
at
Default
(EAD)’
of,
and
at
the
time
of,
that
counterparty’s
default.
At
default,
the
customer
may
not
have
drawn
the
loan
fully
or
may
already
have
repaid
some
of
the
principal,
so
that
exposure
may
be
less
than
the
approved
loan
limit.
‘External
Credit
Assessment
Institutions
(ECAI)’
Institutions
whose
credit
assessments
may
be
used
by
credit
institutions
for
the
determination
of
risk
weight
exposures
according
to
CRR.
‘Federal
Reserve
Board
(FRB)’
Is
the
governing
board
of
the
Federal
Reserve
System
of
the
US,
in
charge
of
making
the
country's
monetary
policy.
'FICC'
Represents
Macro
(including
rates
and
currency),
Credit
and
Securitised
products.
'Financial
Policy
Committee
(FPC)'
reduce
systemic
risks
with
a
view
to
protecting
and
enhancing
the
resilience
of
the
UK
financial
system.
The
FPC
also
has
a
secondary
objective
to
support
the
economic
policy
of
the
UK
Government.
‘F-IRB
/
Foundation
-
Internal
Ratings
Based’
‘Financial
Conduct
Authority
(FCA)’
FCA
also
has
responsibility
for
the
prudential
regulation
of
firms
that
do
not
fall
within
the
PRA’s
scope.
‘Financial
Services
Compensation
Scheme
(FSCS)’
claims.
‘Financial
collateral
comprehensive
method
(FCCM)’
A
counterparty
credit
risk
exposure
calculation
approach
which
applies
volatility
adjustments
to
the
market
value
of
exposure
and
collateral
when
calculating
RWA
values.
‘Financial
Stability
Board
(FSB)’
An
international
body
that
monitors
and
makes
recommendations
about
the
global
financial
system.
It
promotes
international
financial
stability
by
coordinating
national
financial
authorities
and
international
standard
-
setting
bodies
as
they
work
toward
developing
strong
regulatory,
supervisory
and
other
financial
sector
policies.
It
fosters
a
level
playing
field
by
encouraging
coherent
implementation
of
these
policies
across
sectors
and
jurisdictions.
‘Fitch’
Glossary
of
terms
Barclays
Bank
PLC
2019
Annual
Report
on
Form
20-F
240
‘Forbearance
Programmes’
amounts
due
where
financial
distress
would
otherwise
prevent
satisfactory
repayment
within
the
original
terms
and
conditions
of
the
contr
act.
These
agreements
may
be
initiated
by
the
customer,
Barclays
or
a
third
party
and
include
approved
debt
counselling
plans,
minimum
due
reductions,
interest
rate
concessions
and
switches
from
capital
and
interest
repayments
to
interest-only
payments.
‘Forbearance
Programmes
for
Credit
Cards’
Can
be
split
into
2
main
types:
Repayment
plans-
A
temporary
reduction
in
the
minimum
payment
due,
for
a
maximum
of
60
months.
This
may
involve
a
reduction
in
interest
rates
to
prevent
negative
amortization;
Fully
amortising
-
A
permanent
conversion
of
the
outstanding
balance
into
a
fully
amortising
loan,
over
a
maximum
period
of
60
months.
‘Forbearance
Programmes
for
Home
Loans’
Can
be
split
into
4
main
types:
Interest
-
only
conversions
-
A
temporary
change
from
a
cap
ital
and
interest
repayment
to
an
interest-only
repayment,
for
a
maximum
of
24
months;
Interest
rate
reductions
-
A
temporary
reduction
in
interest
rate,
for
a
maximum
of
12
months;
Payment
concessions
-
An
agreement
to
temporarily
accept
reduced
loan
repaym
ents,
for
a
maximum
of
24
months;
Term
extensions-
A
permanent
extension
to
the
loan
maturity
date
which
may
involve
a
reduction
in
interest
rates,
and
usually
involves
the
capitalisation
of
arrears.
‘Forbearance
Programmes
for
Unsecured
Loans’
Can
be
split
into
3
main
types:
Payment
concessions
-
An
agreement
to
temporarily
accept
reduced
loan
repayments,
for
a
maximum
of
12
months;
Term
extensions-
A
permanent
extension
to
the
loan
maturity
date,
usually
involving
the
capitalisation
of
arrears;
Fully
amort
ising-
A
permanent
conversion
of
the
outstanding
balance
into
a
fully
amortising
loan,
over
a
maximum
period
of
120
months
for
loans.
‘Foreclosures
in
Progress’
The
process
by
which
the
bank
initiates
legal
action
against
a
customer
with
the
intention
of
terminating
a
loan
agreement
whereby
the
bank
may
repossess
the
property
subject
to
local
law
and
recover
amounts
it
is
owed.
‘Foreign
exchange
derivatives’
currency
swaps
and
currency
options.
Forward
foreign
exchange
contracts
are
agreements
to
buy
or
sell
a
specified
quantity
of
foreign
currency,
usually
on
a
specified
future
date
at
an
agreed
rate.
Currency
swaps
generally
involves
the
exchange,
or
notional
exchange,
of
equivalent
amounts
of
two
currencies
and
a
commitment
to
exchange
interest
periodically
until
the
principal
amounts
are
re
-
exchanged
on
a
future
date.
Currency
options
provide
the
buyer
with
the
right,
but
not
the
obligat
ion,
either
to
purchase
or
sell
a
fixed
amount
of
a
currency
at
a
specified
exchange
rate
on
or
before
a
future
date.
As
compensation
for
assuming
the
option
risk,
the
option
writer
generally
receives
a
premium
at
the
start
of
the
option
period.
‘Foreign
exchange
risk’
‘Front
Arena’
A
deal
solution
that
helps
to
trade
and
manage
positions
and
risk
in
the
global
capital
markets.
‘Full
time
equivalent’
Full
time
equivalent
units
are
the
on
-
job
hours
paid
for
employee
services
divided
by
the
number
of
ordinary-
time
hours
normally
paid
for
a
full-time
staff
member
when
on
the
job
(or
contract
employees
where
applicable).
‘Fully
loaded’
When
a
measure
is
presented
or
described
as
being
on
a
fully
loaded
basis,
it
is
calculated
without
applying
the
transitional
provisions
set
out
in
Part
Ten
of
CRR.
‘Funded
credit
protection’
from
the
right
of
that
institution,
in
the
event
of
the
default
of
the
counterparty
or
on
the
occurrence
of
other
specified
credit
events
relating
to
the
counterparty,
to
liquidate,
or
to
obtain
transfer
or
appropriation
of,
or
to
retain
certain
assets
or
amounts,
or
to
reduce
the
amount
of
the
exposure
to,
or
to
replace
it
with,
the
amount
of
the
difference
between
the
amount
of
the
exposure
and
the
amount
of
a
claim
on
the
institution.
‘Funding
for
Lending
Scheme
(FLS)’
households
and
non
-
financial
companies
through
reduced
funding
costs,
the
benefits
of
which
are
passed
on
to
UK
borrowers
in
the
form
of
cheaper
and
more
easily
available
loans.
‘Funding
mismatch’
customer
loans,
over
local
euro
denominated
liabilities,
such
as
customer
deposits.
‘Gains
o
n
acquisitions’
recognised
in
a
business
combination,
exceeds
the
cost
of
the
combination.
‘General
Data
Protection
Regulation
(GDPR)’
GDPR
(Regulation
(EU)
2016/679)
is
a
regulation
by
which
the
European
Parliament,
the
Council
of
the
European
Union
and
the
European
Commission
intend
to
strengthen
and
unify
data
protection
for
all
individuals
w
ithin
the
European
Union.
‘General
market
risk’
movement
unrelated
to
any
specific
attributes
of
individual
securities.
Glossary
of
terms
Barclays
Bank
PLC
2019
Annual
Report
on
Form
20-F
241
‘Global
-
Systemically
Important
Banks
(G
-
SIBs
or
G
-SIIs)’
mean
that
their
distress
or
failure
would
cause
significant
disruption
to
the
wider
financial
system
and
economic
activity.
The
Financial
Stability
Board
and
the
Basel
Committee
on
Banking
Supervision
publish
a
list
of
globally
systemically
important
banks.
‘G-SII
additional
leverage
ratio
buffer
(G
-
SII
ALRB)’
A
macroprudential
buffer
that
applies
to
globally
systemically
important
banks
(G
-
SIBs)
and
other
major
domestic
UK
banks
and
building
societies,
including
banks
that
are
subject
to
ring
-
fencing
requirements.
The
G
-
SII
ALRB
will
be
calibrated
as
35%
(on
a
phased
basis)
of
the
combined
systemic
risk
buffers
that
applies
to
the
bank.
‘GSII
Buffer’
Common
Equity
Tier
1
capital
required
to
be
held
under
CRD
to
ensure
that
G
-
SIBs
build
up
surplus
capital
to
compensate
for
the
systemic
risk
that
such
institutions
represent
to
the
financial
system.
’Grandfathering’
non
-
compliant
capital
instruments
to
be
included
in
regulatory
capital
subject
to
certain
thresholds
which
decrease
over
the
tra
nsitional
period.
‘Gross
charge
-
off
rates’
outstanding
balances
excluding
balances
in
recoveries.
Charge
-
off
to
recoveries
generally
occurs
when
the
collections
focus
switches
from
the
collection
of
arrears
to
the
recovery
of
the
entire
outstanding
balance,
and
represents
a
fundamental
change
in
the
relationship
between
the
bank
and
the
customer.
This
is
a
measure
of
the
proportion
of
customers
that
have
gone
into
default
during
the
period.
‘Gross
write-
off
rates’
held
at
amortised
cost
at
the
balance
sheet
date.
‘Gross
new
lending’
‘Guarantee’
substitution.
‘Head
Office’
and
Tax
and
other
operations.
‘High
-
Net-Worth’
‘High
Risk’
In
retail
banking,
‘High
Risk’
is
defined
as
the
subset
of
up
-
to-
date
customers
who,
either
through
an
event
or
observed
behaviour
exhibit
potential
financial
difficulty.
Where
appropriate,
these
customers
are
pro
actively
contacted
to
assess
whether
assistance
is
required.
‘Home
loan’
gives
the
lender
a
lien
against
the
property
and
the
lender
can
foreclose
on
the
property
if
the
borrower
does
not
repay
the
loan
per
the
agreed
terms.
Also
known
as
a
residential
mortgage.
‘IHC’
or
‘US
IHC’
Barclays
US
LLC,
the
intermediate
holding
company
established
by
Barclays
in
July
2016,
which
holds
most
of
Barclays’
subsidiaries
and
assets
in
the
US.
‘IMA
/
Internal
Model
Approach’
In
the
context
of
RWAs,
RWAs
for
which
the
exposure
amount
has
been
derived
via
the
use
of
a
PRA
approved
internal
market
risk
model.
‘IMM
/
Internal
Model
Method’
In
the
context
of
RWAs,
RWAs
for
which
the
exposure
amount
has
been
derived
via
the
use
of
a
PRA
approved
internal
counterparty
credit
risk
model.
‘Identified
Impairment
(II)’
‘IFRS
9
transitional
arrangements’
Following
the
application
of
IFRS
9
as
of
1
January
2018,
Article
473a
of
CRR
permits
institutions
to
phase
-
in
the
impact
on
capital
and
leverage
ratios
of
the
impairment
requirements
under
the
new
accounting
standard.
‘Impairment
Allowances’
book.
An
impairment
allowance
may
either
be
identified
or
unidentified
and
individual
or
collective.
‘Income’
‘Incremental
Risk
Charge
(IRC)’
An
estimate
of
the
incremental
risk
arising
from
rating
migrations
and
defaults
for
traded
debt
instruments
beyond
what
is
already
captured
in
specific
market
risk
VaR
for
the
non
-
correlation
trading
portfolio.
Glossary
of
terms
Barclays
Bank
PLC
2019
Annual
Report
on
Form
20-F
242
‘Independent
Commission
on
Banking
(ICB)’
banking
system
and
promote
competition.
‘Independent
Validation
Unit
(IVU)’
The
function
within
the
bank
responsible
for
independent
review,
challenge
and
approval
of
all
models.
‘Individual
liquidity
guidance
(ILG)’
asked
the
bank
to
maintain.
‘Inflation
risk’
‘Insurance
Risk’
The
risk
of
the
Barclays
Bank
Group’s
aggregate
insurance
premiums
received
from
policyholders
under
a
portfolio
of
insurance
contracts
being
inadequate
to
cover
the
claims
arising
from
those
policies.
‘Interchange’
‘Interest-
only
home
loans’
Under
the
terms
of
these
loans,
the
customer
makes
payments
of
interest
only
for
the
entire
term
of
the
mortgage,
although
customers
may
make
early
repayments
of
the
principal
within
the
terms
of
their
agreement.
The
customer
is
responsible
fo
r
repaying
the
entire
outstanding
principal
on
maturity,
which
may
require
the
sale
of
the
mortgaged
property.
‘Interest
rate
derivatives’
interest
rate
swap
is
an
agreement
between
two
parties
to
exchange
fixed
rate
and
floating
rate
interest
by
means
of
periodic
payments
based
upon
a
notional
principal
amount
and
the
interest
rates
defined
in
the
contract.
Certain
agreements
combine
interest
rate
and
foreign
currency
swap
transactions,
which
may
or
may
not
include
the
exchange
of
principal
amounts.
A
basis
swap
is
a
form
of
interest
rate
swap,
in
which
both
parties
exchange
interest
payments
based
on
floating
rates,
where
the
floating
rates
are
based
upon
different
underlying
reference
indices.
In
a
forward
rate
agreement,
two
parties
agree
a
future
settlement
of
the
difference
between
an
agreed
rate
and
a
future
interest
rate,
applied
to
a
notional
principal
amount.
The
settlement,
wh
ich
generally
occurs
at
the
start
of
the
contract
period,
is
the
discounted
present
value
of
the
payment
that
would
otherwise
be
made
at
the
end
of
that
period.
‘Interest
rate
risk’
calculation
of
market
risk
DVaR,
measures
the
impact
of
changes
in
interest
(swap)
rates
and
volatilities
on
cash
instruments
and
derivatives.
‘Interest
rate
risk
in
the
banking
book
(IRRBB)’
The
risk
that
the
Barclays
Bank
Group
is
exposed
to
capital
or
income
volatility
because
of
a
mismatch
between
the
interest
rate
exposures
of
its
(non
-
traded)
assets
and
liabilities.
‘Internal
Assessment
Approach
(IAA)’
One
of
three
types
of
calculation
that
a
bank
with
permission
to
use
the
Internal
Ratings
Based
(IRB)
approach
may
apply
to
securitisation
exposures.
It
consists
of
mapping
a
bank's
internal
rating
methodology
for
credit
exposures
to
those
of
an
External
Credit
Assessment
Institution
(ECAI)
to
determ
ine
the
appropriate
risk
weight
based
on
the
ratings
based
approach.
Its
applicability
is
limited
to
ABCP
programmes
related
to
liquidity
facilities
and
credit
enhancement.
‘Internal
Capital
Adequacy
Assessment
Process
(ICAAP)’
Companies
are
required
to
perform
a
formal
Internal
Capital
Adequacy
Assessment
Process
(ICAAP)
as
part
of
the
Pillar
2
requirements
(BIPRU)
and
to
provide
this
document
to
the
PRA
on
a
yearly
basis.
The
ICAAP
document
summarises
the
Barclays
Bank
Group’s
risk
management
framework,
including
approach
to
managing
all
risks
(i.e.
Pillar
1
and
non
-
Pillar
1
risks);
and,
the
Barclays
Bank
Group’s
risk
appetite,
economic
capital
and
stress
testing
frameworks.
‘Internal
model
method
(IMM)’
internal
counterparty
credit
risk
model.
‘Internal
Ratings
Based
(IRB)’
approach
is
d
ivided
into
two
alternative
applications,
Advanced
and
Foundation:
–
Advanced
IRB
(A
-
IRB):
the
bank
uses
its
own
estimates
of
probability
of
default
(PD),
loss
given
default
(LGD)
and
credit
conversion
factor
to
model
a
given
risk
exposure.
–
Foundation
IRB:
the
bank
applies
its
own
PD
as
for
Advanced,
but
it
uses
standard
parameters
for
the
LGD
and
the
credit
conversion
factor.
The
Foundation
IRB
approach
is
specifically
designed
for
wholesale
credit
exposures.
Hence
retail,
equity,
securitisation
positions
and
non
-
credit
obligations
asset
exposures
are
treated
under
standardised
or
A
-
IRB.
‘Investment
Bank’
The
Barclays
Bank
Group’s
investment
bank
which
consists
of
origination
led
and
returns
focused
markets
and
banking
business
which
forms
part
of
the
Corp
orate
and
Investment
Bank
segment
of
Barclays
International
.
Glossary
of
terms
Barclays
Bank
PLC
2019
Annual
Report
on
Form
20-F
243
‘Investment
Banking
Fees’
including
financial
advisory,
debt
and
equity
underwriting.
‘Investment
grade’
agencies.
‘ISDA
Master
Agreement’
documents,
designed
to
enable
OTC
deriv
atives
to
be
documented
fully
and
flexibly.
The
framework
consists
of
a
master
agreement,
a
schedule,
confirmations,
definition
booklets,
and
a
credit
support
annex.
The
ISDA
master
agreement
is
published
by
the
International
Swaps
and
Derivatives
Association
(ISDA).
‘Key
Risk
Scenarios
(KRS)’
Key
Risk
Scenarios
are
a
summary
of
the
extreme
potential
risk
exposure
for
each
Key
Risk
in
each
business
and
function,
including
an
assessment
of
the
potential
frequency
of
risk
events,
the
average
size
of
losses
and
three
extreme
scenarios.
The
Key
Risk
Scenario
assessments
are
a
key
input
to
the
Advanced
Measurement
Approach
calculation
of
regulatory
and
economic
capital
requirements.
‘Large
exposure’
A
large
exposure
is
defined
as
the
total
exposure
of
a
bank
to
a
counterparty
or
group
of
connected
clients,
whether
in
the
banking
book
or
trading
book
or
both,
which
in
aggregate
equals
or
exceeds
10%
of
the
bank's
eligible
capital.
‘Legal
risk’
including
regulatory
or
contractual
requirements.
‘Lender
Option
Borrower
Option
(LOBO)’
interest
rate
on
the
loan,
upon
which
the
borrower
had
the
option
to
either
continue
with
the
loan
at
the
higher
rate,
or
re
-
pay
the
loan
at
par.
‘Lending’
In
the
context
of
Investment
Bank
Analysis
of
Total
Income,
lending
income
includes
net
interest
income,
gains
or
losses
on
loan
sale
activity,
and
risk
management
activity
relating
to
the
loan
portfolio.
‘Letters
of
credit’
time
and
in
full.
In
the
event
that
the
debtor
is
unable
to
make
payment,
the
bank
will
be
required
to
cover
the
full
or
rem
aining
amount
of
the
purchase.
‘Level
1
assets’
High
quality
liquid
assets
under
the
Basel
Committee’s
Liquidity
Coverage
Ratio
(LCR),
including
cash,
central
bank
reserves
and
higher
quality
government
securities.
‘Level
2
assets’
with
the
latter
comprised
of
Level
2A
and
Level
2B
assets.
Level
2A
assets
include,
for
example,
lower
quality
government
securities,
covered
bonds
and
corporate
debt
securities.
Level
2B
assets
include,
for
example,
lower
rated
corporate
bonds,
residential
mortgage
backed
securities
and
equities
that
meet
certain
conditions.
‘Lifetime
expected
credit
losses’
reflecting
the
present
value
of
cash
shortfalls
over
the
remaining
expected
life
of
the
asset.
‘Lifetime
Probability’
‘Liquidity
Coverage
Ratio
(LCR)’
liquid
assets
should
be
unencumbered,
liquid
in
markets
during
a
time
of
stress
and,
ideally,
be
central
bank
eligible.
These
include,
for
example,
cash
and
claims
on
central
governments
and
central
banks.
‘Liquidity
Pool’
Bank
Group
as
a
contingency
to
ena
ble
the
bank
to
meet
cash
outflows
in
the
event
of
stressed
market
conditions.
‘Liquidity
Risk’
The
risk
that
the
Barclays
Bank
Group
is
unable
to
meet
its
contractual
or
contingent
obligations
or
that
is
does
not
have
the
appropriate
amount,
tenor
and
composition
of
funding
and
liquidity
to
support
its
assets.
‘Liquidity
risk
appetite
(LRA)’
meeting
its
regulatory
obligations.
‘Liquidity
Risk
Management
Framework
(the
Liquidity
Framework)’
The
Liquidity
Risk
Management
Framework
(the
Liquidity
Framework),
which
is
sanctioned
by
the
Board
Risk
Committee
(BRC)
and
which
incorporates
liquidity
policies,
systems
and
controls
that
the
Barclays
Bank
Group
has
implemented
to
manage
liquidity
risk
within
tolerances
approved
by
the
Board
and
regulatory
agencies.
Glossary
of
terms
Barclays
Bank
PLC
2019
Annual
Report
on
Form
20-F
244
‘Litigation
and
conduct
charges’
or
‘Litigation
and
conduct’
Litigation
and
conduct
charges
include
regulatory
fines,
litigation
settlements
and
conduct
related
customer
redress.
‘Loan
loss
rate’
balance
sheet
date.
‘Loan
to
deposit
ratio’
‘Loan
to
value
(LTV)
ratio’
The
ratios
are
used
in
determini
ng
the
appropriate
level
of
risk
for
the
loan
and
are
generally
reported
as
an
average
for
new
mortgages
or
an
entire
portfolio.
Also
see
‘Marked
to
market
(MTM)
LTV
ratio.’
‘London
Interbank
Offered
Rate
(LIBOR)’
market.
‘Long
-
term
refinancing
operation
(LTRO)’
‘Loss
Given
Default
(LGD)’
comprises
the
actual
loss
(the
part
that
is
not
expected
to
be
recovered),
together
with
the
economic
costs
associated
with
the
recovery
process.
‘Management
VaR’
positions
were
to
be
held
unchanged
for
predefined
period.
Corporate
and
Investment
Bank
uses
Management
VaR
with
a
two
-
year
equally
weighted
historical
period,
at
a
95%
confidence
level,
with
a
one
day
holding
period.
‘Mandatory
break
clause’
In
the
context
of
counterparty
credit
risk,
a
contract
clause
that
means
a
trade
will
be
ended
on
a
particular
date.
‘Marked
to
market
approach’
positions
as
well
as
a
potential
future
exposure
add
-
on
to
calculate
an
exposure
to
which
a
risk
weight
can
be
applied.
Thi
s
is
also
known
as
the
Current
Exposure
Method.
‘Marked
to
market
(MTM)
LTV
ratio’
weighted
Loan
to
Value
(LTV)
ratio’
and
‘Valuation
weighted
Loan
to
Value
(LTV)
ratio.’
‘Market
risk’
in
market
variables
including,
but
not
limited
to,
interest
rates,
foreign
excha
nge,
equity
prices,
commodity
prices,
credit
spreads,
implied
volatilities
and
asset
correlations.
‘Master
netting
agreements’
agreement
in
the
event
of
the
counterparty’s
default
or
bankruptcy
or
insolvency,
resulting
in
a
reduced
exposure.
‘Master
trust
securitisation
programmes’
trust
issues
multiple
series
of
securities
backed
by
these
receivables.
‘Matchbook
(or
matched
book)’
maturity.
‘Material
Risk
Takers
(MRTs)’
Categories
o
f
staff
whose
professional
activities
have
or
are
deemed
to
have
a
material
impact
on
Barclays’
risk
profile,
as
determined
in
accordance
with
the
European
Banking
Authority
regulatory
technical
standard
on
the
identification
of
such
staff.
‘Medium
-
Term
Notes’
from
differing
maturities,
ranging
from
nine
months
to
30
years.
They
can
be
issued
on
a
fixed
or
floating
coupon
basis
or
with
an
exotic
coupon;
with
a
fixed
maturity
date
(non
-
callable)
or
with
embedded
call
or
put
options
or
early
repayment
triggers.
MTNs
are
most
generally
issued
as
senior,
unsecured
debt.
‘Methodology
and
policy’
In
the
context
of
the
Capital
Risk
section,
the
effect
on
RWAs
of
methodology
changes
driven
by
regulatory
policy
changes
.
‘MiFId
II’
The
Markets
in
Financial
Instruments
Directive
2004/39/EC
(known
as
"MiFID"
I)
as
subsequently
amended
to
MiFID
II
is
a
European
Union
law
that
provides
harmonised
regulation
for
investment
services
across
the
31
member
states
of
the
European
Economic
Area.
Glossary
of
terms
Barclays
Bank
PLC
2019
Annual
Report
on
Form
20-F
245
‘Minimum
requirement
for
own
funds
and
eligible
liabilities
(MREL)’
A
European
Union
wide
requirement
under
the
Bank
Recovery
and
Resolution
Directive
for
all
European
banks
and
investment
banks
to
hold
a
minimum
level
of
equity
and/or
loss
absorbing
eligible
liabilities
to
ensure
the
operation
of
the
bail-
in
tool
to
absorb
losses
and
recapitalise
an
institution
in
resolution.
An
institution’s
MREL
requirement
is
set
by
its
resolution
authority.
Amendments
in
the
EU
Risk
Reduction
Measure
package
are
designed
to
align
MREL
and
TLAC
for
EU
G
-
SIBs.
The
risk
of
the
potential
adverse
consequences
from
financial
assessments
or
decisions
based
on
incorrec
t
or
misused
model
outputs
and
reports.
‘Model
updates’
In
the
context
of
the
Capital
Risk
section,
changes
in
RWAs
caused
by
model
implementation,
changes
in
model
scope
or
any
changes
required
to
address
model
malfunctions.
‘Model
validation’
Process
through
which
models
are
independently
challenged,
tested
and
verified
to
prove
that
they
have
been
built,
implemented
and
used
correctly,
and
that
they
continue
to
be
fit-for
-purpose.
‘Modelled
—VaR’
‘Money
market
funds’
‘Monoline
derivatives’
‘Moody’s’
‘Mortgage
Current
Accounts
(MCA)
Reserves’
A
secured
overdraft
facility
available
to
home
loan
customers
which
allows
them
to
borrow
against
the
equity
in
their
home.
It
allows
draw
-
down
up
to
an
agreed
available
limit
on
a
separate
but
connected
account
to
the
main
mortgage
loan
facility.
The
balance
drawn
must
be
repaid
on
redemption
of
the
mortgage.
‘Multilateral
development
banks’
boundaries.
‘National
discretion’
in
its
jurisdiction.
‘Net
asset
value
per
share’
number
of
issued
ordinary
shares.
‘Net
interest
income
(NII)’
‘Net
interest
margin
(NIM)’
‘Net
investment
income’
of
available
for
sale
assets.
‘Net
Stable
Funding
Ratio
(NSFR)’
scenario.
The
ratio
is
required
to
be
over
100%.
Available
stable
funding
would
include
such
items
as
equity
capital,
preferred
stock
with
a
maturity
of
over
1
year,
or
liabilities
with
a
m
aturity
of
over
1
year.
The
required
amount
of
stable
funding
is
calculated
as
the
sum
of
the
value
of
the
assets
held
and
funded
by
the
institution,
multiplied
by
a
specific
required
stable
funding
(RSF)
factor
assigned
to
each
particular
asset
type,
adde
d
to
the
amount
of
potential
liquidity
exposure
multiplied
by
its
associated
RSF
factor.
‘Net
trading
income’
business,
together
with
interest,
dividends
and
funding
costs
relating
to
trading
activities.
‘Net
write-
off
rate’
by
gross
loans
and
advances
held
at
amortised
cost
at
the
balance
sheet
date.
‘Net
written
credit
protection’
protection
bought.
‘New
bookings’
The
total
of
the
original
balance
on
accounts
opened
in
the
reporting
period,
including
any
applicable
fees
and
charges
included
in
the
loan
amount.
Glossary
of
terms
Barclays
Bank
PLC
2019
Annual
Report
on
Form
20-F
246
‘Non
-
asset
backed
debt
instruments’
commercial
paper;
certificates
of
deposit;
convertible
bonds;
corporate
bonds
and
issued
notes.
‘Non
-
customer
net
interest
income’
/
‘Non
-
customer
interest
income’
well
as
certain
other
net
interest
income
received
on
government
bonds
and
other
debt
securities
held
for
the
pu
rposes
of
interest
rate
hedging
and
liquidity
for
local
banking
activities.
‘Non
-
model
method
(NMM)’
of
CRR
norms,
as
opposed
to
an
internal
model.
‘Non
-
performance
costs’
‘Non
-
performing
proportion
of
outstanding
balances’
than
90
days
and
accounts
charged
off
to
recoveries),
expressed
as
a
percentage
of
outstanding
balances.
‘Non
-
performing
balances
impairment
coverage
ratio’
non
performing
balances.
‘Non
-
Traded
Market
Risk’
The
risk
that
the
current
or
future
exposure
in
the
banking
book
(i.e.
non
-
traded
book)
will
impact
bank's
capital
and/or
earnings
due
to
adverse
movements
in
Intere
st
or
foreign
exchange
rates.
‘Non
-
Traded
VaR’
Reflects
the
volatility
in
the
value
of
the
fair
value
through
other
comprehensive
income
(FVOCI)
investments
in
the
liquidity
pool
which
flow
directly
through
capital
via
the
FVOCI
reserve.
The
underlying
methodology
to
calculate
non
-
traded
VaR
is
similar
to
Traded
Management
VaR,
but
the
two
measures
are
not
directly
comparable.
The
Non
-
Traded
VaR
represents
the
volatility
to
capital
driven
by
the
FVOCI
exposures.
These
exposures
are
in
the
banking
book
and
d
o
not
meet
the
criteria
for
trading
book
treatment.
‘Notch’
‘Notional
amount’
The
nominal
or
face
amount
of
a
financial
instrument,
such
as
a
loan
or
a
derivative,
that
is
used
to
calculate
payments
m
ade
on
that
instrument.
‘Open
Banking’
The
Payment
Services
Directive
(PSD2)
and
the
Open
API
standards
and
data
sharing
remedy
imposed
by
the
UK
Competition
and
Markets
Authority
following
its
Retail
Banking
Market
Investigation
Order.
‘Operational
risk’
fraud)
where
the
root
cause
is
not
due
to
credit
or
market
risks.
‘Operational
Riskdata
eXchange
(ORX)’
advancing
the
measurement
and
management
of
operational
risk
in
the
global
financial
services
industry.
Barclays
is
a
member
of
ORX.
‘Origination
led’
‘Origination
exposure
model’
options
and
other
derivatives
contracts
in
the
event
the
counterparty
to
the
contract
should
default.
‘OSII’
Other
systemically
important
institutions
are
institutions
that
are
deemed
to
create
risk
to
financial
stability
due
to
their
systemic
importance.
‘Over
-
the-
counter
(OTC)
derivatives’
flexibility
because,
unlike
standardised
exchange
-
traded
products,
they
can
be
tailored
to
fit
specific
needs.
‘Overall
capital
requirement’
The
overall
capital
requirement
is
the
sum
of
capital
required
to
meet
the
total
of
a
Pillar
1
requirement,
a
Pillar
2A
requirement,
a
Global
Systemically
Important
Institution
(G
-
SII)
buffer,
a
Capital
Conservation
Buffer
(CCB)
and
a
Countercyclical
Capital
Buffer
(CCyB).
‘Own
credit’
‘Owner
occupied
mortgage’
A
mortgage
where
the
intention
of
the
customer
was
to
occupy
the
property
at
origination.
‘Own
funds’
The
sum
of
Tier
1
and
Tier
2
capital.
Glossary
of
terms
Barclays
Bank
PLC
2019
Annual
Report
on
Form
20-F
247
‘Past
due
items’
Refers
to
loans
where
the
borrower
has
failed
to
make
a
payment
when
due
under
the
terms
of
the
loan
contract.
‘Payment
Protection
Insurance
(PPI)
redress’
‘Pension
Risk’
The
risk
of
the
Barclays
Bank
Group’s
earnings
and
capital
being
adversely
impacted
by
the
Barclays
Bank
Group’s
defined
benefit
obligations
increa
sing
or
the
value
of
the
assets
backing
these
defined
benefit
obligations
decreasing
due
to
changes
in
both
the
level
and
volatility
of
prices.
‘Performance
costs’
accounting
charge
is
spread
over
the
relevant
periods
in
which
the
employee
delivers
service.
‘Personal
Banking’
Offers
retail
ad
vice,
products
and
services
to
community
and
premier
customers
in
the
UK.
‘Period
end
allocated
tangible
equity’
deductions,
excluding
goodwill
and
intangible
assets,
reflecting
assumptions
the
Barclays
Bank
Group
uses
for
capital
planning
purposes.
Head
Office
allocated
tangible
equity
represents
the
difference
between
the
Barclays
Bank
Group’s
tangible
shareholders’
equity
and
the
amounts
allocated
to
businesses.
‘Pillar
1
requirements’
The
minimum
regulatory
capital
requirements
to
meet
the
sum
of
credit
(including
counterparty
credit),
market
and
operational
risk.
‘Pillar
2A
requirements’
The
additional
regulatory
capital
requirement
to
meet
risks
not
captured
under
Pillar
1
requirements.
This
requirement
is
the
outcome
of
the
bank’s
Internal
Capital
Adequacy
Assessment
Process
(ICAAP)
and
the
complementary
supervisory
review
and
evaluation
carried
out
by
the
PRA.
‘Post
-
model
adjustment
(PMA)’
account
for
model
input
data
deficiencies,
inadequate
model
performance
or
changes
to
regulatory
definitions
(e.g.
definition
of
defau
lt)
to
ensure
the
model
output
is
accurate,
complete
and
appropriate.
‘Potential
Future
Exposure
(PFE)
on
Derivatives’
both
exchange
traded
and
OTC
derivat
ive
contracts,
calculated
by
assigning
a
standardised
percentage
(based
on
the
underlying
risk
category
and
residual
trade
maturity)
to
the
gross
notional
value
of
each
contract.
‘PRA
waivers’
organisation
and
require
applications
being
submitted
to
and
approved
by
the
PRA.
‘Primary
securitisations’
The
issuance
of
securities
(bonds
and
commercial
papers)
for
fund
-raising.
‘Primary
Stress
Tests’
arise
from
extreme
market
moves
or
scenarios.
Primary
Stress
Tests
apply
stress
moves
to
key
liquid
risk
factors
for
each
of
the
major
trading
asset
classes.
‘Prime
Services’
provides
brokerage
facilitation
services
for
hedge
fund
clients
offering
execution
and
clearance
facilities
for
a
variety
of
asset
classes.
‘Principal’
‘Principal
Investments’
‘Principal
Risks’
‘Private
equity
investments’
often
involves
the
investment
of
capital
in
private
companies
or
the
acquisition
of
a
public
company
that
results
in
the
delisting
of
public
equity.
Capital
for
private
equity
investment
is
raised
b
y
retail
or
institutional
investors
and
used
to
fund
investment
strategies
such
as
leveraged
buyouts,
venture
capital,
growth
capital,
distressed
investments
and
mezzanine
capital.
‘Private
-
label
securitisation’
the
government.
Glossary
of
terms
Barclays
Bank
PLC
2019
Annual
Report
on
Form
20-F
248
‘Probability
of
Default
(PD)’
The
likelihood
that
a
loan
will
not
be
repaid
and
will
fall
into
default.
PD
may
be
calculated
for
each
client
who
has
a
loan
(normally
applicable
to
wholesale
customers/clients)
or
for
a
portfolio
of
clients
with
similar
attributes
(normally
applicable
to
retail
customers).
To
calculate
PD,
Barclays
assesses
the
credit
quality
of
borrowers
and
other
counterparties
and
assigns
them
an
internal
risk
rating.
Multiple
rating
methodologies
may
be
used
to
inform
the
rating
decision
on
individual
large
credits,
such
as
internal
and
external
models,
rating
agency
ratings,
and
for
wholesale
assets
market
information
such
as
credit
spreads.
For
smaller
credits,
a
single
source
may
suffice
such
as
the
result
from
an
internal
rating
model.
‘Product
structural
hedge’
interest
bearing
current
accounts
and
managed
rate
deposits)
and
to
smoothen
the
income
over
a
medium/long
term.
‘Properties
in
Possession
held
as
’Loans
and
Advances
to
Customers’’
Properties
in
the
UK
and
Italy
where
the
customer
continues
to
retain
legal
title
but
where
the
bank
has
enforced
the
possession
order
as
part
of
the
foreclosure
process
to
allow
for
the
disposal
of
the
asset
or
the
court
has
ordered
the
auction
of
the
property.
‘Properties
in
Possession
held
as
‘Other
Real
Estate
Owned’’
Properties
in
South
Africa,
where
the
bank
has
taken
legal
ownership
of
the
title
as
a
result
of
purchase
at
an
auction
or
similar
and
treated
as
‘Other
Real
Estate
Owned’
within
other
assets
on
the
bank’s
balance
sheet.
‘Proprietary
trading’
customers,
so
as
to
make
a
profit
for
itself.
‘Prudential
Regulation
Authority
(PRA)’
small
number
of
significant
investment
banks
in
the
UK.
The
PRA
is
a
subsidiary
of
the
Bank
of
England.
‘Prudential
valuation
adjustment
(PVA)’
with
regulatory
valuation
standards,
which
place
greater
emphasis
on
the
inherent
uncertainty
around
the
value
at
which
a
trading
book
position
could
be
exited.
‘Public
benchmark’
‘Qualifying
central
bank
claims’
An
amount
calculated
in
line
with
the
PRA
policy
statement
allowing
banks
to
exclude
claims
on
the
central
bank
from
the
calculation
of
the
leverage
exposure
measure,
as
long
as
these
are
matched
by
deposits
denominated
in
the
same
currency
and
of
identical
or
longer
maturity.
‘Qualifying
Revolving
Retail
Exposure
(QRRE)’
In
the
context
of
the
IRB
approach
to
credit
risk
RWA
calculations,
an
exposure
meeting
the
criter
ia
set
out
in
BIPRU
4.6.42
R
(2).
It
includes
most
types
of
credit
card
exposure.
‘Rates’
‘Re-
aging’
The
returning
of
a
de
linquent
account
to
up
-
to-
date
status
without
collecting
the
full
arrears
(principal,
interest
and
fees).
‘Real
Estate
Mortgage
Investment
Conduits
(REMICs)’
An
entity
that
holds
a
fixed
pool
of
mortgages
and
that
is
separated
into
multiple
classes
of
interests
for
issuance
to
investors.
‘Recoveries
Impairment
Coverage
Ratio’
‘Recoveries
proportion
of
outstanding
balances’
have
charged
-
off)
as
at
the
period
end
compared
to
total
outstanding
balances.
The
size
of
the
recoveries
book
would
ultimately
have
an
impact
on
the
overall
impairment
requirement
on
the
p
ortfolio.
Balances
in
recoveries
will
decrease
if:
assets
are
written
-
off;
amounts
are
collected;
or
assets
are
sold
to
a
third
party
(i.e.
debt
sale).
‘Recovery
book’
recover
the
Group’s
exposure.
‘Regulatory
capital’
‘Renegotiated
loans’
circumstances
of
the
borrower.
In
the
latter
case
renegotiation
can
result
in
an
extension
of
the
due
date
of
payment
or
repayment
plans
under
which
the
Barclays
Bank
Group
offers
a
concessionary
rate
of
interest
to
genuinely
distressed
borrowers.
This
will
result
in
the
asset
continuing
to
be
overdue
and
will
be
individually
impaired
where
the
renegotiated
payments
of
interest
and
principal
will
not
recover
the
original
carrying
amount
of
the
asset.
In
other
cases,
renegotiation
will
lead
to
a
new
agreement,
which
is
treated
as
a
new
loan.
Glossary
of
terms
Barclays
Bank
PLC
2019
Annual
Report
on
Form
20-F
249
‘Repurchase
agreement
(Repo)’
/
‘Reverse
repurchase
agreement
(Reverse
repo)’
securities
as
collateral
for
an
interest
bearing
cash
loan.
The
borrower
agrees
to
sell
a
security
to
the
lender
subject
to
a
commitment
to
repurchase
the
asset
at
a
specified
price
on
a
given
date.
For
the
party
selling
the
security
(and
agreeing
to
repurchase
it
in
the
future)
it
is
a
Repurchase
agreement
or
Repo;
for
the
counterparty
to
the
transaction
(buying
the
security
and
agreeing
to
sell
in
the
future)
it
is
a
Reverse
repurchase
agreement
or
Reverse
repo.
‘Reputation
risk’
clients,
counterparties,
investors,
regulators,
employees
or
the
public.
‘Re-securitisations’
underlying
assets
are
also
predominantly
securitisation
positions.
‘Reserve
Capital
Instruments
(RCIs)’
‘Residential
Mortgage
-
Backed
Securities
(RMBS)’
have
the
right
to
cash
received
from
future
mortgage
payments
(interest
and/or
principal).
‘Residual
maturity’
The
remaining
contractual
term
of
a
credit
obligation
associated
with
a
credit
exposure.
‘Restructured
loans’
granted
to
the
d
ebtor
that
would
not
otherwise
be
considered.
Where
the
concession
results
in
the
expected
cash
flows
discounted
at
the
original
effective
interest
rate
being
less
than
the
loan’s
carrying
value,
an
impairment
allowance
will
be
raised.
‘Retail
Loans’
secured
and
unsecured
loans
such
as
mortgages
and
credit
card
balances,
as
well
as
loans
to
certain
smaller
business
custom
ers,
typically
with
exposures
up
to
£3m
or
with
a
turnover
up
to
£5m.
‘Return
on
average
Risk
Weighted
Assets’
‘Return
on
average
tangible
shareholders’
equity’
(RoTE)
Profit
after
tax
attributa
ble
to
ordinary
equity
holders
of
the
parent,
as
a
proportion
of
average
shareholders’
equity
excluding
non
-
controlling
interests
and
other
equity
instruments
adjusted
for
the
deduction
of
intangible
assets
and
goodwill.
‘Return
on
average
allocated
tangible
equity’
Profit
after
tax
attributable
to
ordinary
equity
holders
of
the
parent,
as
a
proportion
of
average
allocated
tangible
equity.
‘Risk
appetite’
business
plans
are
implemented.
‘Risk
weighted
assets
(RWAs)’
the
Basel
rules
as
implemented
by
CRR
and
local
regulators.
‘Roll
rate
analysis’
The
measurement
of
the
rate
at
which
retail
accounts
deteriorate
through
delinquency
phases.
‘Sales
commissions,
commitments
and
other
incentives’
Incentive
Plan
awards.
‘Sarbanes
-
Oxley
requirements’
governance
scandals
such
as
Enron,
WorldCom
and
Tyco.
All
US-
listed
companies
must
comply
with
SOX.
‘Second
Lien’
this
debt
will
only
be
received
after
the
first
lien
has
been
repaid
and
thus
represents
a
riskier
investment
than
the
first
lien.
‘Secondary
Stress
Tests’
reduced
within
the
time
period
covered
in
Primary
Stress
Tests.
‘Secured
Overnight
Financing
Rate
(SOFR)’
A
broad
measure
of
the
cost
of
borrowing
cash
overnight
collateralized
by
U.S.
Treasury
securities
in
the
repurchase
agreement
(repo)
market.
Glossary
of
terms
Barclays
Bank
PLC
2019
Annual
Report
on
Form
20-F
250
‘Securities
Financing
Transactions
(SFT)’
commodities
lending
or
borrowing
transaction,
or
a
margin
lending
transaction
whereby
cash
collateral
is
received
or
paid
in
respect
of
the
transfer
of
a
related
asset.
‘Securities
financing
transactions
adjustments’
into
account
master
netting
agreements.
‘Securities
lending
arrangements’
at
a
future
date.
The
counterparty
generally
provides
collateral
against
non
performance
in
the
form
of
cash
or
other
assets.
‘Securitisation’
used
to
back
new
securities.
A
company
sells
assets
to
a
special
purpose
vehicle
(SPV)
which
then
issues
securities
backed
b
y
the
assets.
This
allows
the
credit
quality
of
the
assets
to
be
separated
from
the
credit
rating
of
the
original
borrower
and
transfers
risk
to
external
investors.
‘Set-off
clauses’
In
the
context
of
Counterparty
credit
risk,
contract
clauses
that
allow
Barclays
to
set
off
amounts
owed
to
us
by
a
counterparty
against
amounts
owed
by
us
to
the
counterparty.
‘Settlement
balances’
purchased
or
otherwise
closed
out,
and
the
date
the
asset
is
delivered
by
or
to
the
entity
(the
settlement
date)
and
cash
is
received
or
paid.
‘Settlement
risk’
settlement
obligations.
‘Significant
Increase
in
Credit
Risk
(SICR)’
qualitative
assessments.
‘Slotting’
factors
such
as
the
financial
strength
of
the
counterparty.
The
requirements
for
the
application
of
the
Slotting
approach
are
detailed
in
BIPRU
4
.5.
‘Sovereign
exposure(s)’
‘Specific
market
risk’
investment
due
to
factors
related
to
the
issuer
or,
in
the
case
of
a
derivative,
the
issuer
of
the
underlying
investment.
‘Spread
risk’
‘SRB
ALRB’
The
systemic
risk
buffer
(SRB)
additional
leverage
ratio
buffer
(ALRB)
is
firm
specific
requirement
set
by
the
PRA
using
its
powers
under
section
55M
of
the
Financial
Services
and
Markets
Act
(2000).
Barclays
is
required
to
hold
an
amount
of
CET1
capital
that
is
equal
to
or
greater
than
its
ALRB.
‘Stage
1’
recognition.
Stage
1
financial
instruments
are
required
to
recognise
a
12
month
expected
credit
loss
allowance.
‘Stage
2’
Stage
2
financial
instruments
are
required
to
recognise
a
lifetime
expected
credit
loss
allowance.
‘Stage
3’
recognise
a
lifetime
expected
credit
loss
allowance.
‘Standard
&
Poor’s’
‘Standby
facilities,
credit
lines
and
other
commitments’
commitments
are
either
made
for
a
fixed
period,
or
have
no
specific
maturity
but
are
cancellable
by
the
lender
subject
to
notice
requirements.
‘Statutory’
Act
2006
and
the
requirements
of
International
Financial
Reporting
Standards
(IFRS).
‘Statutory
return
on
average
shareholders’
equity’
shareholders’
equity.
Glossary
of
terms
Barclays
Bank
PLC
2019
Annual
Report
on
Form
20-F
251
‘STD’
/
‘Standardised
Approach’
based
on
counterparty
type
and
a
credit
rating
provided
by
an
External
Credit
Assessment
Institute.
‘Sterling
Over
Night
Index
Average
(SONIA)’
market
administrated
and
calculated
by
the
Bank
of
England
.
‘Stress
Testing’
unfavourable
effects
on
the
Barclays
Bank
Group
(either
financial
or
non
-
financial),
assessing
the
Barclays
Bank
Group’s
ability
to
withstand
such
changes,
and
identifying
management
actions
to
mitigate
the
impact.
‘Stressed
Value
at
Risk
(SVaR)’
An
estimate
of
the
potential
loss
arising
from
a
12
-
month
p
eriod
of
significant
financial
stress
calibrated
to
99%
confidence
level
over
a
10
-
day
holding
period.
‘Structured
entity’
create
d
to
achieve
a
narrow
and
well
defined
objective
with
restrictions
around
their
ongoing
activities.
‘Structural
hedge’
/
‘hedging’
on
positions
that
exist
within
the
balance
sheet
and
do
not
re
-
price
in
line
with
market
rates.
See
also
‘Equity
structural
hedge’
and
‘Product
structural
hedge’.
‘Structural
model
of
default’
A
model
based
on
the
assumption
that
an
obligor
will
default
when
its
assets
are
insufficient
to
cover
its
liabilities.
‘Structured
credit’
vehicles.
‘Structured
finance/notes’
sometimes
offers
capital
protection
if
the
value
declines.
Structured
notes
can
be
linked
to
equities,
interest
rates,
funds,
commodities
and
foreign
currency
.
‘Sub
-prime’
potentially
more
severe
problems
such
as
court
judgments
and
bankruptcies.
They
may
also
display
reduced
repayment
capacity
as
measured
by
credit
scores,
high
debt
-
to-
income
ratios,
or
other
criteria
indicating
heightened
risk
of
default.
‘Subordinated
liabilities’
other
creditors
of
the
issuer.
‘Supranational
bonds’
Bonds
issued
by
an
international
organisation,
where
membership
transcends
n
ational
boundaries
(e.g.
the
European
Union
or
World
Trade
Organisation).
‘Synthetic
Securitisation
Transactions’
Securitisation
transactions
effected
through
the
use
of
derivatives.
‘Systemic
Risk
Buffer’
CET1
capital
that
may
be
required
to
be
held
as
pa
rt
of
the
Combined
Buffer
Requirement
increasing
the
capacity
of
UK
banks
to
absorb
stress
and
limiting
the
damage
to
the
economy
as
a
result
of
restricted
lending.
‘Tangible
net
asset
value’
‘Tangible
net
asset
value
per
share
(TNAV)’
instruments,
less
goodwill
and
intangible
assets,
by
the
number
of
issued
ordinary
shares.
‘Tangible
shareholders’
equity’
intangibl
e
assets
and
goodwill.
‘Term
premium’
‘The
Fundamental
Review
of
the
Trading
Book
(FRTB)’
Supervision
as
part
of
Basel
III
applicable
to
banks’
wholesale
trading
activities.
‘The
Standardised
Approach
(TSA)’
Under
the
TSA,
banks
are
required
to
hold
regulatory
capital
for
operational
risk
equal
to
the
annual
average,
calculated
over
a
rolling
three
-
year
period,
of
the
relevant
income
indicator
(across
all
business
lines),
multiplied
by
a
supervisory
defined
percentage
factor
by
business
lines.
Glossary
of
terms
Barclays
Bank
PLC
2019
Annual
Report
on
Form
20-F
252
‘The
three
lines
of
defence’
The
three
lines
of
defence
operating
model
enables
Barclays
to
separate
risk
management
activities
between
those
client
facing
areas
of
the
Barclays
Bank
Group
and
associated
support
functions
responsible
for
identifying
risk,
operating
within
applicable
limits
and
escalating
risk
events
(first
line);
colleagues
in
Risk
and
Compliance
who
establish
the
limits,
rules
and
constraints
under
which
the
first
line
operates
and
monitors
their
performance
against
those
limits
and
constraints
(second
line);
and,
col
leagues
in
Internal
Audit
who
provide
assurance
to
the
Board
and
Executive
Management
over
the
effectiveness
of
governance,
risk
management
and
control
over
risks
(third
line).
The
Legal
function
does
not
sit
in
any
of
the
three
lines,
but
supports
them
all.
The
Legal
function
is,
however,
subject
to
oversight
from
Risk
and
Compliance
with
respect
to
operational
and
conduct
risks.
‘Tier
1
capital’
‘Tier
1
capital
ratio’
‘Tier
2
(T2)
capita
l’
accounts
where
qualifying
conditio
ns
have
been
met.
‘Tier
2
(T2)
securities’
‘Total
capital
ratio’
Total
Regulatory
capital
as
a
percentage
of
RWAs.
‘Total
Loss
Absorbing
Capacity
(TLAC)’
A
standard
published
by
the
FSB
which
is
applicable
to
G
-
SIBs
and
requires
a
G
-
SIB
to
hold
a
prescriptive
minimum
level
of
instruments
and
liabilities
that
should
be
readily
available
for
bail-
in
within
resolution
to
absorb
losses
and
recapitalise
the
institution.
‘Total
outstanding
balance’
In
retail
banking,
total
outstanding
balance
is
defined
as
the
gross
month
-
end
customer
balances
on
all
accounts
including
accounts
charged
off
to
recoveries.
‘Total
return
swap’
capital
value
of
the
asset.
The
buyer
of
the
protection
in
return
receives
a
predetermined
amount.
‘Total
balances
on
forbearance
programmes
coverage
ratio’
balance
in
forbearance.
‘Traded
Market
Risk’
The
risk
of
a
reduction
to
earnings
or
capital
due
to
volatility
of
trading
book
positions.
‘Trading
book’
All
positions
in
financial
instrument
s
and
commodities
held
by
an
institution
either
with
trading
intent,
or
in
order
to
hedge
positions
held
with
trading
intent.
‘Traditional
Securitisation
Transactions’
Securitisation
transactions
in
which
an
underlying
pool
of
assets
generates
cash
flows
to
service
payments
to
investors.
‘Transitional’
provisions
set
out
in
Part
Ten
of
CRR.
‘Treasury
and
Capital
Risk’
‘Twelve
month
expected
credit
losses’
period
if
the
expected
life
is
less
than
12
months),
weighted
by
the
probability
of
said
default
occurring.
‘Twelve
month
PD’
‘Unencumbered’
‘United
Kingdom
(UK)’
‘UK
Bank
levy’
of
the
chargeable
equity
and
liabilities
of
the
bank
on
its
balance
sheet
date.
Glossary
of
terms
Barclays
Bank
PLC
2019
Annual
Report
on
Form
20-F
253
‘UK
leverage
exposure’
Is
calculated
as
per
the
PRA
rulebook,
where
the
exposure
calculation
also
includes
the
FPC’s
recommendation
to
allow
banks
to
exclude
claims
on
the
central
bank
from
the
calculation
of
the
leverage
exposure
measure,
as
long
as
these
are
matched
by
deposits
denominated
in
the
same
currency
and
of
identical
or
longer
maturity.
‘UK
leverage
ratio’
A
s
per
the
PRA
rulebook,
means
a
bank’s
tier
1
capital
divided
by
its
total
exposure
measure,
with
this
ratio
expressed
as
a
percentage.
‘Unfunded
credit
protection’
from
the
obligation
of
a
third
party
to
pay
an
amount
in
the
event
of
the
default
of
the
borrower
or
the
occurrence
of
other
specified
credit
events.
‘US
Partner
Portfolio’
sectors.
‘US
Residential
Mortgages’
‘Utilisation
rate’
‘Valuation
weighted
Loan
to
Value
(LTV)
Ratio’
market
LTVs
derived
by
comparing
total
outstanding
balance
and
the
value
of
total
collateral
we
hold
against
these
balances.
Valuation
weighted
loan
to
value
is
calculated
using
the
following
formula:
LTV
=
total
outstandings
in
portfolio/total
property
values
of
total
outstandings
in
portfolio.
‘Value
at
Risk
(VaR)’
a
specific
timeframe.
‘Weighted
off
balance
sheet
commitments’
Standardised
Approach
to
credit
risk.
‘Wholesale
loans’
/
‘lending’
‘Write-off
(gross)’
the
asset
or
it
is
deemed
immaterial
or
full
and
final
settlement
is
reached
and
the
shortfall
written
off.
In
the
event
of
write-
off,
the
customer
balance
is
removed
from
the
balance
sheet
and
the
impairment
allowance
held
against
the
asset
is
released.
Net
write-
offs
represent
gross
write-
offs
less
post
write-
off
recoveries.
‘Wrong
-
way
risk’
Arises,
in
a
trading
exposure,
when
there
is
significant
correlation
between
the
u
nderlying
asset
and
the
counterparty,
which
in
the
event
of
default
would
lead
to
a
significant
mark
to
market
loss.
When
assessing
the
credit
exposure
of
a
wrong
-
way
trade,
analysts
take
into
account
the
correlation
between
the
counterparty
and
the
underl
ying
asset
as
part
of
the
sanctioning
process.
Barclays
Bank
PLC
2019
Annual
Report
on
Form
20-F
254
EXHIBIT
INDEX
Exhibit
Description
1.1
2.1
Long
Term
Debt
Instruments:
Barclays
Bank
PLC
is
not
party
to
any
single
instrument
relating
to
long
-
term
debt
pursuant
to
which
a
total
amount
of
securities
exceeding
10%
of
its
total
assets
(on
a
consolidated
basis)
is
authorised
to
be
issued.
Barclays
PLC
hereby
agrees
to
furnish
to
the
Securities
and
Exchange
Commission
(the
“Commission”),
upon
its
request,
a
copy
of
any
instrument
defining
the
r
ights
of
holders
of
its
long
-
term
debt
or
the
rights
of
holders
of
the
long
-
term
debt
of
any
of
its
subsidiaries
for
which
consolidated
or
unconsolidated
financial
statements
are
required
to
be
filed
with
the
Commission.
2.2
4.1
4.2
4.3
4.4
12.1
13.1
15.1
99.1
101.INS
XBRL
Instance
Document
101.SCH
XBRL
Taxonomy
Extension
Schema
101.CAL
XBRL
Taxonomy
Extension
Schema
Calculation
Linkbase
101.DEF
XBRL
Taxonomy
Extension
Schema
Definition
Linkbase
101.LAB
XBRL
Taxonomy
Extension
Schema
Label
Linkbase
101.PRE
XBRL
Taxonomy
Extension
Schema
Presentation
Linkbase
Barclays
Bank
PLC
2019
Annual
Report
on
Form
20-F
255
Signatures
The
registrant
hereby
certifies
that
it
meets
all
of
the
requirements
for
filing
on
Form
20
-
F
and
that
it
has
duly
caused
and
authorised
the
undersigned
to
sign
this
annual
report
on
its
behalf.
Date
February
13,
2020
Barclays
Bank
PLC
(Registrant)
By
/s/
Steven
Ewart
Steven
Ewart,
Chief
Financial
Officer
TABLE OF CONTENTS
Note 13 Where These Disclosures Have Been IncludedNote 27 To The Financial Statements (ordinary Shares, Share Premium, and Other Equity)