AIR TRANSPORT SERVICES GROUP, INC.
10-Ks and 10-Qs
|
|
|
|
|
|
|
|
|
|
|
|
|
|
|
|
|
|
|
|
|
|
|
|
|
|
|
|
|
|
|
|
|
|
|
|
|
|
|
|
|
|
|
|
|
|
|
|
|
|
UNITED STATES
SECURITIES AND EXCHANGE COMMISSION
Washington, D.C. 20549
________________________________________________________________
FORM 10-K
ANNUAL REPORT PURSUANT TO SECTION 13 OR 15(D)
OF THE SECURITIES EXCHANGE ACT OF 1934
For the fiscal year ended
December 31, 2018
Commission file number 000-50368
________________________________________________________________
(Exact name of registrant as specified in its charter)
________________________________________________________________
|
Delaware
|
26-1631624
|
|
|
(State of Incorporation)
|
|
(I.R.S. Employer Identification No.)
|
145 Hunter Drive, Wilmington, OH 45177
(Address of principal executive offices)
937-382-5591
(Registrant’s telephone number, including area code)
________________________________________________________________
Securities registered pursuant to Section 12(b) of the Act:
Common Stock, Par Value $.01 per share
(Title of class)
Name of each exchange on which registered: NASDAQ Stock Market LLC
Securities registered pursuant to Section 12(g) of the Act: None
________________________________________________________________
Indicate by check mark if the registrant is a well-known seasoned issuer, as defined in Rule 405 of the Securities Act. YES
x
NO
o
Indicate by check mark if the registrant is not required to file reports pursuant to Section 13 or Section 15(d) of the Act. YES
o
NO
x
Indicate by check mark whether the registrant (1) has filed all reports required to be filed by Section 13 or 15(d) of the Securities Exchange Act of 1934 during the preceding 12 months (or for such shorter period that the registrant was required to file such reports), and (2) has been subject to such filing requirements for the past 90 days. YES
x
NO
o
Indicate by check mark whether the registrant has submitted electronically every Interactive Data File required to be submitted pursuant to Rule 405 of Regulations S-T (§232.405 of this chapter) during the preceding 12 months (or for such shorter period that the registrant was required to submit such files). YES
x
NO
o
Indicate by check mark if disclosure of delinquent filers pursuant to Item 405 of Regulation S-K (§229.405 of this chapter) is not contained herein, and will not be contained, to the best of registrant’s knowledge, in definitive proxy or information statements incorporated by reference in Part III of this Form 10-K or any amendment to this Form 10-K.
o
Indicate by check mark whether the registrant is a large accelerated filer, an accelerated filer, a non accelerated filer, a smaller reporting company, or an emerging growth company. See the definitions of “large accelerated filer,” “accelerated filer,” “smaller reporting company” and "emerging growth company" in Rule 12b-2 of the Exchange Act. (Check one):
|
Large accelerated filer
x
|
|
Accelerated filer
o
|
Smaller reporting company
o
|
|
Non-accelerated filer
o
|
|
Emerging growth company
o
|
|
If an emerging growth company, indicate by check mark if the registrant has elected not to use the extended transition period for complying with any new or revised financial accounting standards provided pursuant to Section 13(a) of the Exchange Act.
o
Indicate by check mark whether the registrant is a shell company (as defined in Rule 12b-2 of the Act). YES
o
NO
x
The aggregate market value of the voting and non-voting common equity held by non-affiliates computed by reference to the price at which the common equity was last sold, as of the last business day of the registrant’s most recently completed second fiscal quarter:
$1,307,024,419
. As of March 1, 2019,
59,142,273
shares of the registrant’s common stock, par value $0.01, were outstanding.
DOCUMENTS INCORPORATED BY REFERENCE
Portions of the Proxy Statement for the Annual Meeting of Stockholders scheduled to be held May 9, 2019 are incorporated by reference into Parts II and III.
FORWARD LOOKING STATEMENTS
This annual report on Form 10-K, including “Management’s Discussion and Analysis of Financial Condition and Results of Operations,” in Item 7, contains forward-looking statements, within the meaning of the Private Securities Litigation Reform Act of 1995, that involve risks and uncertainties. Forward-looking statements provide current expectations of future events based on certain assumptions and include any statement that does not directly relate to any historical or current fact. Forward-looking statements can also be identified by words such as “future,” “anticipates,” “believes,” “estimates,” “expects,” “intends,” “plans,” “predicts,” “will,” “would,” “could,” “can,” “may,” and similar terms. Forward-looking statements are not guarantees of future performance and the Company’s actual results may differ significantly from the results discussed in the forward-looking statements. Factors that might cause such differences include, but are not limited to, those discussed in “Risk Factors” in Item 1A . The Company assumes no obligation to revise or update any forward-looking statements for any reason, except as required by law.
AIR TRANSPORT SERVICES GROUP, INC. AND SUBSIDIARIES
2018 FORM 10-K ANNUAL REPORT
TABLE OF CONTENTS
|
|
|
|
Page
|
|
PART I
|
|||
|
Item 1.
|
|
||
|
Item 1A.
|
|
||
|
Item 1B.
|
|
||
|
Item 2.
|
|
||
|
Item 3.
|
|
||
|
Item 4.
|
|
||
|
PART II
|
|||
|
Item 5.
|
|
||
|
Item 6.
|
|
||
|
Item 7.
|
|
||
|
Item 7A.
|
|
||
|
Item 8.
|
|
||
|
Item 9.
|
|
||
|
Item 9A.
|
|
||
|
Item 9B.
|
|
||
|
PART III
|
|||
|
Item 10.
|
|
||
|
Item 11.
|
|
||
|
Item 12.
|
|
||
|
Item 13.
|
|
||
|
Item 14.
|
|
||
|
PART IV
|
|||
|
Item 15.
|
|
||
PART I
ITEM 1. BUSINESS
Company Overview
Air Transport Services Group, Inc. leases aircraft and provides airline operations, ground services, aircraft modification and maintenance services, and other support services to the air transportation and logistics industries. Through the Company's subsidiaries, we offer a range of complementary services to delivery businesses, freight forwarders, airlines and government customers. (When the context requires, we may use the terms “Company” and “ATSG” in this report to refer to the business of ATSG and its subsidiaries on a consolidated basis.) We offer standalone services along with bundled, customized solutions, scalable to our customers' needs. Our services are summarized below.
Aircraft leasing
: We lease aircraft through the Company's leasing subsidiary, Cargo Aircraft Management, Inc. (“CAM”). CAM's fleet consists of Boeing 737, 757 and 767 cargo aircraft, Boeing 767 and 777 passenger aircraft and Boeing 757 "combi" aircraft which simultaneously carry passengers and cargo on the main deck. CAM services global demand for cargo airlift by offering Boeing 767, 757 and 737 aircraft leases. CAM is able to provide competitive lease rates by converting passenger aircraft into cargo freighters. CAM monitors the market for available passenger aircraft, typically 15 to 20 years beyond their original manufacture date. After evaluation of an aircraft's condition and technical specifications, CAM acquires passenger aircraft that meet its requirements for projected into-service costs and rate of return targets. After conversion to freighter configuration, CAM's aircraft can be deployed into markets more economically than newly built freighters. CAM's aircraft leases are typically under multi-year agreements.
Airline operations
: We offer combinations of aircraft, crews, maintenance and insurance services to provide customized transportation capacity to our customers. ATSG wholly owns three airlines, ABX Air, Inc. (“ABX”), Air Transport International, Inc. (“ATI”), and Omni Air International, LLC ("OAI") which are each independently certificated by the U.S. Department of Transportation and separately offer services to customers. ABX operates Boeing 767 freighter aircraft, ATI operates Boeing 767 and 757 freighter and Boeing 757 combi aircraft and OAI operates Boeing 767 and 777 passenger aircraft.
Support services:
We provide transportation related services such as aircraft maintenance, crew training and ground handling to delivery companies, freight forwarders and other airlines. Customers who lease our aircraft often need related support services. Offering support services provides us with a competitive advantage for diversification and incremental revenues. Our businesses and subsidiaries providing support services are summarized below:
|
•
|
Ground services: We provide load transfer and sorting services, as well as related maintenance services for material handling equipment, ground equipment and facilities through our LGSTX Services, Inc. (“LGSTX”) subsidiary. LGSTX also rents ground equipment and sells aviation fuel in Ohio.
|
|
•
|
Aircraft maintenance and modification services: We provide airframe modification and maintenance, component repairs, engineering services and aircraft line maintenance through our subsidiaries Airborne Maintenance and Engineering Services, Inc. (“AMES”) and Pemco World Air Services, Inc. ("Pemco"). AMES Material Services, Inc. ("AMS") resells and brokers aircraft parts. We provide line maintenance services at certain airports.
|
|
•
|
Flight support services: We also offer flight crew training.
|
The business development and marketing activities of our operating subsidiaries are supported by the Company's Airborne Global Solutions, Inc. ("AGS") subsidiary. AGS markets the various services and products offered by our subsidiaries by bundling solutions that leverage the entire portfolio of our subsidiaries' capabilities and experience in global cargo operations. Our bundled services are flexible and scalable to complement our customers' own resources and support our operational growth. Further, AGS assists our subsidiaries in achieving their sales and marketing plans by identifying their customers' business and operational requirements while providing sales leads.
Business Development
The Company is incorporated in Delaware and its headquarters is in Wilmington, Ohio. The Company's common shares are publicly traded on the NASDAQ Stock Market under the symbol ATSG. ATSG was formed in 2007 for the
1
purpose of creating a holding company structure that resulted in its predecessor, ABX, which was incorporated in 1980, becoming a subsidiary of the Company.
We have had multi-year contracts with DHL Network Operations (USA), Inc. and its affiliates ("DHL") since August 2003. In 2010, we entered into commercial agreements with DHL under which DHL leased thirteen Boeing 767 freighter aircraft from CAM and ABX operates those aircraft under a separate crew, maintenance and insurance agreement. The initial term of the operating agreement was five years, while the terms of the aircraft leases were seven years. Effective April 1, 2015, the Company and DHL amended and restated the agreements (together, the "CMI agreement") which extended the Boeing 767 aircraft lease terms and the operation of those aircraft through March 2019. The expiring Boeing 767 aircraft leases and CMI agreement with DHL are expected to be renewed in March 2019 under terms similar to the existing terms.
On November 9, 2018, we acquired OAI, a passenger airline, along with related entities Advanced Flight Services, LLC; Omni Aviation Leasing, LLC; and T7 Aviation Leasing, LLC (referred to collectively herein as "Omni"). OAI is a leading provider of contracted passenger airlift for the U.S. Department of Defense ("DoD") via the Civil Reserve Air Fleet ("CRAF") program, and a provider of full-service passenger charter and ACMI services. OAI carries passengers worldwide for a variety of private sector customers and other government services agencies. The addition of Omni expanded our customer solution offerings primarily through additional passenger transportation capabilities and the authority to operate Boeing 777 aircraft. The acquisition increased the Company's revenues, cash flows and customer diversification. (Additional information about the acquisition of Omni is presented in Note B to the accompanying consolidated financial statements.)
In September 2015, we began to operate a trial air network for Amazon.com Services, Inc. ("ASI"), the successor to Amazon Fulfillment Services, Inc., a subsidiary of Amazon.com, Inc. (“Amazon”). We provided cargo handling and logistical support as the network grew to five dedicated Boeing 767 freighter aircraft during 2015. On March 8, 2016, the Company and ASI entered into an Air Transportation Services Agreement (the “ATSA”) which became effective April 1, 2016. Pursuant to the ATSA, CAM leases 20 Boeing 767 freighter aircraft to ASI, including 12 Boeing 767-200 freighter aircraft for a term of five years and eight Boeing 767-300 freighter aircraft for a term of seven years. Under the ATSA, ABX and ATI operate those aircraft for an initial term of five years while our LGSTX subsidiary provides gateway services for ASI at certain airports.
In conjunction with the execution of the original ATSA, the Company and Amazon entered into an Investment Agreement and a Stockholders Agreement, each dated March 8, 2016. The Investment Agreement calls for the Company to issue warrants in three tranches, which will result in Amazon having the right to acquire up to 19.9% of the Company’s outstanding common shares measured as further described below. The first tranche of warrants, issued upon execution of the Investment Agreement, grants Amazon the right to purchase approximately 12.81 million ATSG common shares, all of which are now vested. The second tranche of warrants, which were issued and vested on March 8, 2018, grants Amazon the right to purchase approximately 1.59 million ATSG common shares. The third tranche of warrants will be issued on September 8, 2020 and will also vest immediately upon issuance. The third tranche of warrants will grant Amazon the right to purchase such additional number of ATSG common shares as is necessary to bring Amazon’s ownership to 19.9% of the Company’s pre-transaction outstanding common shares measured on a GAAP-diluted basis, adjusted for share issuances and repurchases by the Company following the date of the Investment Agreement, after giving effect to the issuance of the warrants. Each of the three tranches of warrants will be exercisable in accordance with its terms through the fifth anniversary of the date of the Investment Agreement. The exercise price of the warrants is $9.73 per share, which represents the closing price of ATSG’s common shares on February 9, 2016.
On December 22, 2018 we announced amendments to the agreements with Amazon to 1) lease and operate ten additional Boeing 767-300 aircraft for ASI, 2) extend the term of the 12 Boeing 767-200 aircraft currently leased to ASI by two years to 2023, with an option for three additional years, 3) extend the term of the eight Boeing 767-300 aircraft currently leased to ASI by three years to 2026 and 2027, with an option for three additional years and 4) extend the ATSA for five years through March 2026, with an option to extend for an additional three years. We plan to deliver five of the 767-300 aircraft in 2019 and the remainder in 2020, each under a ten year lease.
In conjunction with the commitment for ten additional 767 aircraft leases, extensions of twenty existing Boeing 767 aircraft leases and the ATSA described above, Amazon will be issued warrants for 14.8 million common shares which could expand its potential ownership in the Company to approximately 33.2%, including the warrants described above for the 2016 agreements. These new warrants will vest as existing leases are extended and additional aircraft
2
leases are executed and added to the ATSA operations. These new warrants will expire if not exercised within seven years from their issuance date. They have an exercise price of $21.53 per share, based on the volume-weighted average price of the Company's shares over the 30 trading days' immediately preceding execution of a non-binding term sheet by the parties on October 29, 2018.
Additionally, Amazon will be able to earn incremental warrant rights, increasing its potential ownership from 33.2% up to approximately 39.9% of the Company, by leasing up to seventeen more cargo aircraft from the Company before January 2026. Incremental warrants granted for Amazon’s commitment to any such future aircraft leases will have an exercise price of the $21.53 referenced above, provided the parties reach binding agreements on future lease terms before April 2019. Beginning in April 2019, the exercise price of incremental warrants related to future aircraft leases will be based on the volume-weighted average price of ATSG’s shares during the 30 trading days immediately preceding the contractual commitment for each lease.
The warrants potentially issuable under these new agreements with Amazon will require an increase in the number of authorized common shares of ATSG. We intend to submit a proposal calling for an appropriate increase in the number of authorized common shares for shareholder consideration at the Company’s next annual meeting of shareholders in May 2019.
In December 2018, we entered into an agreement to acquire twenty Boeing 767-300 extended-range passenger aircraft over the next three years. The aircraft covered by this agreement are currently operated by American Airlines. They were manufactured between 1993 and 2003, and are powered by General Electric CF6-series engines. We will begin to acquire the aircraft during 2019 and currently expect to begin freighter modification of six of the twenty Boeing 767-300 aircraft during 2019, up to nine during 2020, and no fewer than five in 2021.
In January 2014, we acquired a 25 percent equity interest in West Atlantic AB of Gothenburg, Sweden. West Atlantic AB, through its two airlines, Atlantic Airlines Ltd. and West Atlantic Sweden AB, operates a fleet of approximately 40 cargo aircraft. West Atlantic AB operates its aircraft on behalf of European regional mail carriers and express logistics providers. The airlines operate a combined fleet of British Aerospace ATPs, Bombardier CRJ-200-PFs, and Boeing 767 and 737 aircraft. We account for our equity interest under the equity method of accounting.
In December 2016, we acquired Pemco. Pemco provides aircraft maintenance, modification, and engineering services. Pemco is based at the Tampa International Airport where it operates a two-hangar aircraft facility of 311,500 square feet and employs approximately 370 people. Pemco is a leading provider of passenger-to-freighter conversions for Boeing 737-300 and 737-400 aircraft, having redelivered over 50 Boeing 737 converted aircraft to Chinese operators over ten years. Pemco's aircraft conversion capabilities and aircraft hangar operations are marketed with our other air transportation support services.
On August 3, 2017, we entered into a joint-venture agreement with Precision Aircraft Solutions, LLC, to develop a passenger-to-freighter conversion program for Airbus A321-200 aircraft. We anticipate approval of a supplemental type certificate in 2020. We expect to make contributions equal to our 49% ownership percentage of the program's total costs over the next year. We account for our investment in the joint venture under the equity method of accounting.
Revenue Information
The Company has three reportable segments, "CAM" which includes aircraft and engine leasing, “ACMI Services" which includes the airlines' operations and "MRO Services." which includes the operations of AMES and Pemco. Our other business operations, including load transfer and package sorting services as well as ground equipment leasing and maintenance do not constitute reportable segments due to their size. Segment revenues for 2018 are summarized below (in thousands):
|
CAM
|
ACMI Services
|
MRO Services
|
Other Support Services
|
||||||
|
External revenues
(in thousands)
|
$156,516
|
$548,804
|
$117,832
|
$69,193
|
|||||
3
Customer revenues for 2018 are summarized below.
|
DHL
|
Amazon
|
DoD
|
Other
|
||||||
|
Percent of consolidated revenues
|
26%
|
27%
|
15%
|
32%
|
|||||
Revenues include the activities of Omni for periods since its acquisition by the Company on November 9, 2018. Additional financial information about our segments and revenues is presented in Note O to the accompanying consolidated financial statements.
Description of Business
CAM
CAM leases aircraft to ATSG's airlines and to external customers, including DHL and Amazon, usually under multi-year contracts with a schedule of fixed monthly payments. Under a typical lease arrangement, the customer maintains the aircraft in serviceable condition at its own cost. At the end of the lease term, the customer is typically required to return the aircraft in approximately the same maintenance condition that existed at the inception of the lease, as measured by airframe and engine time and cycles since the last scheduled maintenance event. CAM examines the credit worthiness of potential customers, their short and long-term growth prospects, their financial condition and backing, the experience of their management, and the impact of governmental regulation when determining the lease rate that is offered to the customer. In addition, CAM monitors the customer’s business and financial status throughout the term of the lease.
As of December 31, 2018, CAM’s fleet consisted of 91 serviceable Boeing 777, 767, 757 and 737 passenger and cargo aircraft. A complete list of the Company's aircraft is included in Item 2, Properties. Through CAM and the acquisition of Omni, we have expanded in recent years the Company's combined fleet of Boeing 777, 767, 757 and 737 aircraft. Since the beginning of 2016, CAM has managed the modification of 23 Boeing 767-300 passenger aircraft to a freighter configuration and two Boeing 737 passenger aircraft to a freighter configuration. CAM added two Boeing 767-200 passenger aircraft, six Boeing 767-300 passenger aircraft and three Boeing 777-200 passenger aircraft through the Company's acquisition of Omni on November 9, 2018.
ACMI Services
ACMI Services consists of the operations of the Company's three airline subsidiaries. Through the airlines, we provide airlift operations to DHL, Amazon, the DoD and other transportation customers. A typical operating agreement requires our airline to supply, at a specific rate per block hour and/or per month, a combination of aircraft, crew, maintenance and insurance for specified transportation operations. These services are commonly referred to as ACMI, CMI or Charter services depending on the selection of services contracted by the customer. The customer bears the responsibility for capacity utilization and unit pricing in all cases.
ACMI - The airline provides the aircraft, flight crews, aircraft maintenance and aircraft hull and liability insurance while the customer is typically responsible for substantially all other aircraft operating expenses, including fuel, landing fees, parking fees and ground and cargo handling expenses.
CMI -The customer is responsible for providing the aircraft, in addition to the fuel and other operating expenses. The airline provides the flight crews, aircraft hull and liability insurance and typically aircraft line maintenance as needed between network flights.
Charter - The airline is responsible for providing full service, including fuel, aircraft, flight crews, maintenance, aircraft hull and liability insurance, landing fees, parking fees, ground and cargo handling expenses and other operating expenses for an all-inclusive price.
Our airlines participate in the DoD CRAF Program which allows our airlines to bid for military charter operations for passenger and cargo transportation. Our airlines provide charter operations to the Air Mobility Command ("AMC") through contracts awarded by the U.S. Transportation Command ("USTC"), both of which are organized under the DoD. The USTC secures airlift capacity through fixed awards, which are awarded annually, and through bids for "expansion routes" which are awarded on a quarterly, monthly and as-needed basis. Under the contracts, we are
4
responsible for all operating expenses including fuel, landing and ground handling expenses. We receive reimbursements from the USTC each month if the price of fuel paid by us for the flights exceeds a previously set peg price. If the price of fuel paid by us is less than the peg price, then we pay the difference to the USTC. Airlines may participate in the CRAF program either independently, or through teaming arrangements with other airlines. Our airlines are members of the Patriot Team of CRAF airlines. We pay a commission to the Patriot Team, based on certain revenues we receive under USTC contracts.
ATI contracts with the USTC to operate its unique fleet of four Boeing 757 "combi" aircraft, which are capable of simultaneously carrying passengers and cargo containers on the main flight deck. ATI has been operating combi aircraft for the DoD since 1993. In January 2018, the USTC contracted with ATI to provide combi aircraft operations through December 2021 and awarded ATI three international routes for combi aircraft for 2019. OAI has been operating aircraft for the DoD since 1995. Contracts with the USTC are typically for a one-year period, however, the current passenger international charter contract has a two year term with option periods through September 2024.
Approximately
8%
of the Company's consolidated revenues for 2018 were derived from providing airline operations for customers other than DHL, Amazon and the DoD. These ACMI and charter operations are typically provided to delivery companies, freight forwarders, vacation businesses and other airlines.
We provide contracted transportation capacity to our customers. We do not sell passenger travel tickets, nor do we sell individual package delivery services. Our airlines operate wide-body and medium wide-body aircraft usually on intra-continental flights and medium and long range inter-continental flights. The airlines typically operate our freighter aircraft in the customers' regional networks that connect to and from global cargo networks. The aircraft types we operate have lower investment and ongoing maintenance costs and can operate cost efficiently with smaller loads on shorter routes than the larger capacity aircraft, such as the Boeing 747 and Airbus A380.
Demand for air transportation services correlates closely with general economic conditions and the level of commercial activity in a geographic area. Stronger general economic conditions and growth in a region typically increase the need for air transportation. Historically, the cargo industry has experienced higher volumes during the fourth calendar quarter of each year due to increased shipments during the holiday season. Generally, time-critical delivery needs, such as just-in-time inventory management, increase the demand for air cargo delivery, while higher costs of aviation fuel generally reduces the demand for air delivery services. When aviation fuel prices increase, shippers will consider using ground transportation if the delivery time allows.
We have limited exposure to fluctuations in the price of aviation fuel under contracts with our customers. DHL and Amazon, like most of our ACMI customers, procure the aircraft fuel and fueling services necessary for their flights. Our charter agreements with the U.S. Military are based on a preset pegged fuel price and include a subsequent true-up to the actual fuel prices.
Aircraft Maintenance and Modification Services
We provide aircraft maintenance and modification services to other air carriers through our ABX, AMES and Pemco subsidiaries. These subsidiaries have technical expertise related to aircraft modifications through a long history in aviation. They own many Supplemental Type Certificates (“STCs”). An STC is granted by the FAA and represents an ownership right, similar to an intellectual property right, which authorizes the alteration of an airframe, engine or component. We market our subsidiaries capabilities by identifying aviation-related maintenance and modification opportunities and matching them to customer needs.
AMES operates in Wilmington, Ohio, a repair station certified by the Federal Aviation Administration (“FAA”) under Part 145 of the Federal Aviation Regulations, including hangars, a component shop and engineering capabilities. AMES is AS9100 quality certified for the aerospace industry. AMES’ marketable capabilities include the installation of avionics systems and flat panel displays for Boeing 757 and 767 aircraft. The Wilmington facility is capable of servicing airframes as large as the Boeing 747-400 and the Boeing 777 aircraft. AMES , through its Pemco subsidiary, also operates an FAA certificated Part 145 repair station from a two hangar facility in Tampa, Florida. The Tampa location has the capability to perform airframe maintenance on Boeing 767, 757, 737, McDonnell Douglas MD-80, Airbus A320, A321 and various regional jet model aircraft. We have the ability to perform line maintenance and airframe maintenance on McDonnell Douglas MD-80, Boeing 767, 757, 737, 777, 727 and Airbus A320 aircraft. We also have the capability to refurbish airframe components, including approximately 60% of the components utilized by Boeing
5
767 aircraft. Through Pemco, we also perform aircraft modification and engineering services, including passenger-to-freighter and passenger-to-combi conversions for Boeing 737-200, Boeing 737-300, Boeing 737-400, and 737-700 series aircraft.
AMS is an Aviation Suppliers Association, ASA 100 Accredited reseller and broker of aircraft parts. AMS carries an inventory of Boeing 767, 757 and 737 spare parts and also maintains inventory on consignment from original equipment manufacturers, resellers, lessors and other airlines. AMS's customers include the commercial air cargo industry, passenger airlines, aircraft manufacturers and contract maintenance companies serving the commercial aviation industry, as well as other resellers.
Ground Services
Through the Company's LGSTX subsidiaries, we provide labor and management for load transfer and sorting services at certain facilities inside or near airports in the U.S. LGSTX also arranges similar load transfer services to support ASI at certain locations. ASI can terminate these services at one or any location after giving a brief notice period. LGSTX also provides maintenance services for material handling and sorting equipment as well as ground support equipment throughout the U.S. LGSTX has a large inventory of ground support equipment, such as power units, airstarts, deicers and pushback vehicles that it rents to airports, ground handlers, airlines and other customers. LGSTX is also licensed to resell aircraft fuel. Additionally, we provide international mail forwarding services through the John F. Kennedy International Airport and the O'Hare International Airport.
We provided mail sorting services at various United States Postal Service ("USPS") locations between September 2004 and September 2018. The contracts for the five USPS facilities we serviced were not renewed with us after they expired during September 2018.
Flight Support
ABX and OAI are FAA certificated to offer flight crew training to customers. ABX has three flight simulators which can be rented for customer outside training programs. The Boeing 767 and DC-9 level C simulators allow ABX to qualify flight crewmembers under FAA requirements without performing check flights in an aircraft.
Competitive Conditions
Our airline subsidiaries compete with other airlines to place aircraft under ACMI arrangements and charter contracts. Other cargo airlines include Amerijet International, Inc., Atlas Air, Inc., Kalitta Air LLC, Northern Air Cargo, LLC, National Air Cargo Group, Inc., Southern Air, Inc. and Western Global Airlines, LLC. Of these, Atlas Air, Inc. also operates passenger aircraft. The primary competitive factors in the air transportation industry are operating costs, fuel efficiency, geographic coverage, aircraft range, aircraft reliability and capacity. The cost of airline operations is significantly impacted by the cost of flight crewmembers, which can vary among airlines depending on their collective bargaining agreements. Cargo airlines also compete for cargo volumes with passenger airlines that have substantial belly cargo capacity. The air transportation industry is capital intensive and highly competitive, especially during periods of excess capacity of aircraft compared to commercial cargo volumes and DoD requirements.
The scheduled delivery industry is dominated by integrated door-to-door delivery companies including DHL, the USPS, FedEx Corporation, United Parcel Service, Inc. and ASI. Although the volume of our business is impacted by competition among these integrated carriers, we do not usually compete directly with them.
Competition for aircraft lease placements is generally affected by aircraft type, aircraft availability and lease rates. We target our leases to cargo airlines and delivery companies seeking medium widebody airlift. The Airbus A300-600 and A330 aircraft can provide capabilities similar to the Boeing 767 for medium wide-body airlift. Competitors in the aircraft leasing markets include GE Capital Aviation Services and Altavair Aviation Leasing, among others.
The aircraft maintenance industry is labor intensive and typically competes based on cost, capabilities and reputation for quality. U.S. airlines may contract for aircraft maintenance with maintenance and repair organizations ("MROs") in other countries or geographies with a lower labor wage base, making the industry highly cost competitive. Other aircraft MROs include AAR Corp and Hong Kong Aircraft Engineering Co.
6
Airline Operations
Flight Operations and Control
The Company's airline operations are conducted pursuant to authority granted to each of them by the FAA and the U.S. Department of Transportation ("DOT"). Airline flight operations, including aircraft dispatching, flight tracking, crew training and crew scheduling are planned and controlled by personnel within each airline. The Company staffs aircraft dispatching and flight tracking 24 hours per day, 7 days per week. The FAA prescribes the requirements, methods and means by which air carrier flight operations are conducted, including but not limited to the qualifications and training of flight crew members, the release of aircraft for flight, the tracking of flights, the time crew members can be on duty, aircraft operating procedures, proper navigation of aircraft, compliance with air traffic control instructions and other operational functions.
Aircraft Maintenance
Our airlines’ operations are regulated by the FAA for aircraft safety and maintenance. Each airline performs routine inspections and airframe maintenance in accordance with applicable FAA-approved aircraft maintenance programs. In addition, the airlines build into their maintenance programs FAA-mandated Airworthiness Directive and manufacturer Service Bulletin compliance on all of their aircraft. The airlines’ maintenance and engineering personnel coordinate routine and non-routine maintenance requirements. Each airline’s maintenance program includes tracking the maintenance status of each aircraft, consulting with manufacturers and suppliers about procedures to correct irregularities and training maintenance personnel on the requirements of its FAA-approved maintenance program. The airlines contract with MROs, including AMES and Pemco, to perform heavy maintenance on airframes and engines. Each airline owns and maintains an inventory of spare aircraft engines, auxiliary power units, aircraft parts and consumable items. The quantity of spare items maintained is based on the fleet size, engine type operated and the reliability history of the item types.
Security
The Transportation Security Administration (“TSA”) requires ABX and ATI to comply with security protocols as set out in each carrier’s standard all-cargo aircraft operator security plan containing extensive security practices and procedures that must be followed. The security plan provides for the conducting of background checks on those with access to cargo and/or aircraft, the securing of the aircraft while on the ground, the acceptance and screening of cargo to be moved by air, the handling of suspicious cargo and the securing of cargo ground facilities, among other requirements. Comprehensive internal audit and evaluation programs are actively mandated and maintained. In the case of OAI, a passenger carrier, additional requirements apply including passenger and baggage screening, airport terminal security, assessment and distribution of intelligence including the TSA "no-fly" list, and threat response.
Customers are required to inform the airlines in writing of the nature and composition of any freight which is classified as "Hazardous Materials" or “Dangerous Goods” by the DOT. Notwithstanding these procedures, our airline subsidiaries could unknowingly transport contraband or undeclared hazardous materials for customers, or could unknowingly transport an unauthorized passenger or one on possession of an unauthorized item, which could result in fines and penalties and possible damage to the aircraft.
Insurance
Our airline subsidiaries are required by the DOT to carry a minimum amount of aircraft liability insurance. Their aircraft leases, loan agreements and ACMI agreements also require them to carry such insurance. The Company currently maintains public liability and property damage insurance, and our airline subsidiaries currently maintain aircraft hull and liability insurance and war risk insurance for their respective aircraft fleets in amounts consistent with industry standards. CAM’s customers are also required to maintain similar insurance coverage.
Employees
As of December 31, 2018, the Company had approximately 3,830 full-time and part-time employees. The Company employed approximately 770 flight crewmembers, 350 flight attendants, 1,800 aircraft maintenance technicians and flight support personnel, 560 employees for airport maintenance and logistics, 45 employees for sales and marketing and 305 employees for administrative functions. In addition to full time and part time employees, the Company
7
typically has approximately 300 temporary employees mainly serving the aircraft line maintenance operations. On December 31, 2017, the Company had approximately 3,010 full-time and part-time employees.
Labor Agreements
The Company’s flight crewmembers are unionized employees. The table below summarizes the representation of the Company’s flight crewmembers at December 31, 2018.
|
Airline
|
|
Labor Agreement Unit
|
|
Contract
Amendable
Date
|
|
Percentage of
the Company’s
Employees
|
|
ABX
|
|
International Brotherhood of Teamsters
|
|
12/31/2014
|
|
6.5%
|
|
ATI
|
|
Air Line Pilots Association
|
|
11/14/2023
|
|
6.7%
|
|
Omni
|
International Brotherhood of Teamsters
|
4/1/2021
|
6.9%
|
|||
|
ATI
|
|
Association of Flight Attendants
|
|
11/14/2023
|
|
1.0%
|
|
Omni
|
Association of Flight Attendants
|
12/1/2021
|
8.2%
|
|||
Under the Railway Labor Act (“RLA”), as amended, the crewmember labor agreements do not expire, so the existing contract remains in effect throughout any negotiation process. If required, mediation under the RLA is conducted by the National Mediation Board, which has the sole discretion as to how long mediation can last and when it will end. In addition to direct negotiations and mediation, the RLA includes a provision for potential arbitration of unresolved issues and a 30-day “cooling-off” period before either party can resort to self-help, including, but not limited to, a work stoppage.
Training
The flight crewmembers are required to be licensed in accordance with Federal Aviation Regulations (“FARs”), with specific ratings for the aircraft type to be flown, and to be medically certified as physically fit to operate aircraft. Licenses and medical certifications are subject to recurrent requirements as set forth in the FARs, to include recurrent training and minimum amounts of recent flying experience.
The FAA mandates initial and recurrent training for most flight, maintenance and engineering personnel. Mechanics and quality control inspectors must also be licensed and qualified to perform maintenance on Company operated and maintained aircraft. Our airline subsidiaries pay for all of the recurrent training required for their flight crewmembers and provide training for their ground service and maintenance personnel. Their training programs have received all required FAA approvals. Similarly, our flight dispatchers and flight followers receive FAA approved training on the airlines' requirements and specific aircraft.
Intellectual Property
The Company owns many STCs issued by the FAA. The Company uses these STCs mainly in support of its own fleets; however, AMES and Pemco have marketed certain STCs to other airlines.
Information Systems
We are dependent on technology to conduct our daily operations including data processing, communications and regulatory compliance. We rely on critical computerized systems for aircraft maintenance records, flight planning, crew scheduling, employee training, financial records and other processes. We utilize information systems to maintain records about the maintenance status and history of each major aircraft component, as required by FAA regulations. Using the systems, we track maintenance schedules and also control inventories and maintenance tasks, including the work directives of personnel performing those tasks. We rely on information systems to track crewmember flight and duty times, and crewmember training status. The Company’s flight operations systems coordinate flight schedules and crew schedules.
We invest significant time and financial resources to acquire, develop and maintain information systems to facilitate our operations. Our information technology infrastructure includes security measures, backup procedures and
8
redundancy capabilities. We rely increasingly on third party applications and hosted technologies. To remain competitive we must continue to deploy new technologies while controlling its costs and maintaining regulatory compliance.
Regulation
Our subsidiaries’ airline operations are primarily regulated by the DOT, the FAA and the TSA. Those operations must comply with numerous economic, safety, security and environmental laws, ordinances and regulations. In addition, they must comply with various other federal, state, local and foreign laws and regulations.
Environment
The U.S. Environmental Protection Agency ("EPA") is authorized to regulate aircraft emissions and has historically implemented emissions control standards adopted by the International Civil Aviation Organization ("ICAO"). In 2016, however, the EPA issued a finding on greenhouse gas ("GHG") emissions from aircraft and its relationship to air pollution. This finding is a regulatory prerequisite to the EPA’s adoption of a new certification standard for aircraft emissions. Our subsidiaries’ aircraft currently meet all known requirements for engine emission levels as applicable by engine design date. Under the Clean Air Act, individual states or the EPA may adopt regulations requiring reductions in emissions for one or more localities based on the measured air quality at such localities. These regulations may seek to limit or restrict emissions by restricting the use of emission-producing ground service equipment or aircraft auxiliary power units. Further, the U.S. Congress has, in the past, considered legislation that would regulate GHG emissions, and some form of federal climate change legislation is possible in the future.
In addition, the European Commission has approved the extension of the European Union Emissions Trading Scheme ("ETS") for GHG emissions to the airline industry. Currently, under the European Union’s ETS, all ABX, ATI and OAI flights that are wholly within the European Union are covered by the ETS requirements, and each year our airlines are required to submit emission allowances in an amount equal to the carbon dioxide emissions from such flights. If the airline's flight activity during the year produced carbon emissions exceeding the number of carbon emissions allowances that it had been awarded, the airline must acquire allowances from other airlines in the open market. Our airlines
operate intra-EU flights from time to time and management believes that such flights are operated in compliance with ETS requirements.
Similarly, in 2016, the ICAO passed a resolution adopting the Carbon Offsetting and Reduction Scheme for International Aviation (“CORSIA”), which is a global, market-based emissions offset program to encourage carbon-neutral growth beyond 2020. A pilot phase is scheduled to begin in 2021 in which countries may voluntarily participate, and full mandatory participation is scheduled to begin in 2027. ICAO continues to develop details regarding implementation, but compliance with CORSIA will increase our operating costs.
However, the U.S. recently withdrew from the Paris climate accord, an agreement among 196 countries to reduce GHG emissions, and the effect of that withdrawal on future U.S. policy regarding GHG emissions, on CORSIA and on other GHG regulation is uncertain.
The federal government generally regulates aircraft engine noise at its source. However, local airport operators may, under certain circumstances, regulate airport operations based on aircraft noise considerations. The Airport Noise and Capacity Act of 1990 provides that, in the case of Stage 3 aircraft (all of our operating aircraft satisfy Stage 3 noise compliance requirements), an airport operator must obtain the carriers’ consent to, or the government’s approval of, the rule prior to its adoption. We believe the operation of our airline subsidiaries’ aircraft either complies with or is exempt from compliance with currently applicable local airport rules. However, some airport authorities have adopted local noise regulations, and, to the extent more stringent aircraft operating regulations are adopted on a widespread basis, our airline subsidiaries may be required to spend substantial funds, make schedule changes or take other actions to comply with such local rules.
Department of Transportation
The DOT maintains authority over certain aspects of domestic and international air transportation serving the United States, such as consumer protection, accommodation of passengers with disabilities, requiring a minimum level of insurance and the requirement that a company be “fit” to hold a certificate to engage in air transportation. In addition, the DOT continues to regulate many aspects of international aviation, including the award of certain international routes.
9
The DOT has issued to ABX a Domestic All-Cargo Air Service Certificate for air cargo transportation between all points within the U.S., the District of Columbia, Puerto Rico, and the U.S. Virgin Islands. The DOT has issued ATI certificate authority to engage in scheduled interstate air transportation, which is currently limited to all-cargo operations. ATI's DOT certificate authority also authorizes it to engage in interstate and foreign charter air transportation of persons, property and mail. Additionally, the DOT has issued ABX and ATI Certificates of Public Convenience and Necessity authorizing each of them to engage in scheduled foreign air transportation of cargo and mail between the U.S. and all current and future U.S. open-skies partner countries, which currently consists of more than 120 foreign countries. ABX and ATI also hold exemption authorities issued by the DOT to conduct scheduled all-cargo operations between the U.S. and certain foreign countries with which the U.S. does not have an open-skies air transportation agreement. The DOT has issued to OAI a Certificate of Public Convenience and Necessity for Interstate Charter Air Transportation and a Certificate of Public Convenience and Necessity for Foreign Charter Air Transportation that authorizes it to engage in interstate and foreign charter air transportation of persons, property and mail.
By maintaining these certificates, the Company, through ABX and ATI, can and currently does conduct all-cargo charter operations worldwide subject to the receipt of any necessary foreign government approvals. Further, the certificates issued to ATI and OAI authorize the air carriers to conduct passenger charter operations worldwide subject to the receipt of any necessary foreign government approvals. Prior to issuing such certificates, and periodically thereafter, the DOT examines a company’s managerial competence, financial resources and plans, compliance disposition and citizenship in order to determine whether the carrier is fit, willing and able to engage in the transportation services it has proposed to and does undertake.
The DOT has the authority to impose civil penalties, or to modify, suspend or revoke our certificates and exemption authorities for cause, including failure to comply with federal laws or DOT regulations. A corporation or a limited liability company structured like a corporation holding the above-referenced certificates and exemption authorities must continuously qualify as a citizen of the United States, which, pursuant to federal law, requires that (1) it be organized under the laws of the U.S. or a state, territory or possession thereof, (2) that its president and at least two-thirds of its Board of Directors and other managing officers be U.S. citizens, (3) that no more than 25% of its voting interest be owned or controlled by non-U.S. citizens, and (4) that it not otherwise be subject to foreign control. We believe our airline subsidiaries possess all necessary DOT-issued certificates and authorities to conduct our current operations and each continue to qualify as a citizen of the United States.
Federal Aviation Administration
The FAA regulates aircraft safety and flight operations generally, including equipment, ground facilities, maintenance, flight dispatch, training, communications, the carriage of hazardous materials and other matters affecting air safety. The FAA issues operating certificates and detailed "operations specifications" to carriers that possess the technical competence to safely conduct air carrier operations. In addition, the FAA issues certificates of airworthiness to each aircraft that meets the requirements for aircraft design and maintenance. ABX, ATI and OAI believe they hold all airworthiness and other FAA certificates and authorities required for the conduct of their business and the operation of their aircraft. The FAA has the power to suspend, modify or revoke such certificates for cause and to impose civil penalties for any failure to comply with federal laws and FAA regulations.
The FAA has the authority to issue regulations, airworthiness directives and other mandatory orders relating to, among other things, the inspection, maintenance and modification of aircraft and the replacement of aircraft structures, components and parts, based on industry safety findings, the age of the aircraft and other factors. For example, the FAA has required ABX to perform inspections of its Boeing 767 aircraft to determine if certain of the aircraft structures and components meet all aircraft certification requirements. If the FAA were to determine that the aircraft structures or components are not adequate, it could order operators to take certain actions, including but not limited to, grounding aircraft, reducing cargo loads, strengthening any structure or component shown to be inadequate, or making other modifications to the aircraft. New mandatory directives could also be issued requiring the Company’s airline subsidiaries to inspect and replace aircraft components based on their age or condition. As a routine matter, the FAA issues airworthiness directives applicable to the aircraft operated by our airline subsidiaries, and our airlines comply, sometimes at considerable cost, as part of their aircraft maintenance program.
In addition to the FAA practice of issuing regulations and airworthiness directives as conditions warrant, the FAA has adopted new regulations to address issues involving aging, but still economically viable, aircraft on a more systematic basis. FAA regulations mandate that aircraft manufacturers establish aircraft limits of validity and service action
10
requirements based on the number of aircraft flight cycles (a cycle being one takeoff and one landing) and flight hours before widespread fatigue damage might occur. Service action requirements include inspections and modifications to preclude development of significant fatigue damage in specific aircraft structural areas. The Boeing Company has provided its recommendations of the limits of validity to the FAA, and the FAA has now approved the limits for the Boeing 757, 767 and 777 model aircraft. Consequently, after the limit of validity is reached for a particular model aircraft, air carriers will be unable to continue to operate the aircraft without the FAA first granting an extension of time to the operator. There can be no assurance that the FAA would extend the deadline, if an extension were to be requested. For the oldest aircraft in our fleets, we estimate the limit of validity would not be reached for at least 20 years.
The FAA requires each of our airline subsidiaries to implement a drug and alcohol testing program with respect to all employees performing safety sensitive functions and, unless already subject to testing, contractor employees that engage in safety sensitive functions. Each of the Company's airlines complies with these regulations.
Transportation Security Administration
The TSA, an administration within the Department of Homeland Security, is responsible for the screening of passengers and their baggage. TSA rules also dictate the manner in which cargo must be screened prior to being loaded on aircraft. Our airline subsidiaries comply with all applicable aircraft, passenger and cargo security requirements. The TSA has adopted cargo security-related rules that have imposed additional burdens on our airlines and our customers. The TSA also requires each airline to perform criminal history background checks on all employees. In addition, we may be required to reimburse the TSA for the cost of security services it may provide to the Company’s airline subsidiaries in the future. The TSA holds (and has exercised) authority to issue regulations, including in cases of emergency the authority to do so without advance notice, including issuance of a grounding order as occurred on September 11, 2001. TSA's enforcement powers are similar to the DOT's and FAA's described above.
International Regulations
When operating in other countries, our airlines are subject to aviation agreements between the U.S. and the respective countries or, in the absence of such an agreement, by principles of reciprocity. International aviation agreements are periodically subject to renegotiation, and changes in U.S. or foreign governments could result in the alteration or termination of the agreements affecting our international operations. Commercial arrangements such as ACMI agreements between our airlines and our customers in other countries, may require the approval of foreign governmental authorities. Foreign authorities may limit or restrict the use of our aircraft in certain countries. Also, foreign government authorities often require licensing and business registration before beginning operations. Such authorities have enforcement powers generally similar to those of the U.S. agencies described above.
Data Protection
There has recently been increased regulatory and enforcement focus on data protection in the U.S. (at both the state and federal level) and in other countries. For example, the European Union ("E.U.") General Data Protection Regulation ("GDPR"), which became effective in May 2018, greatly increases the jurisdictional reach of E.U. law and increases the requirements related to personal data, including individual notice and opt-out preferences and public disclosure of significant data breaches. Additionally, violations of the GDPR can result in significant fines. Other governments have enacted or are enacting similar data protection laws, and are considering data localization laws that would govern the use of data outside of their respective jurisdictions.
Other Regulations
Various regulatory authorities have jurisdiction over significant aspects of our business, and it is possible that new laws or regulations or changes in existing laws or regulations or the interpretations thereof could have a material adverse effect on our operations. In addition to the above, other laws and regulations to which we are subject, and the agencies responsible for compliance with such laws and regulations, include the following:
|
•
|
The labor relations of our airline subsidiaries are generally regulated under the Railway Labor Act, which vests in the National Mediation Board certain regulatory powers with respect to disputes between airlines and labor unions arising under collective bargaining agreements;
|
11
|
•
|
The Federal Communications Commission regulates our airline subsidiaries’ use of radio facilities pursuant to the Federal Communications Act of 1934, as amended;
|
|
•
|
U.S. Customs and Border Protection issues landing rights, inspects passengers entering the United States, and inspects cargo imported to the U.S. from our subsidiaries’ international operations, and those operations are subject to similar regulatory requirements in foreign jurisdictions;
|
|
•
|
The Company and its subsidiaries must comply with U.S. Citizenship and Immigration Services regulations regarding the eligibility of our employees to work in the U.S., and the entry of passengers to the U.S.;
|
|
•
|
The Company and its subsidiaries must comply with wage, work conditions and other regulations of the Department of Labor regarding our employees.
|
|
•
|
The Office of Foreign Assets Control (OFAC) of the U.S. Department of the Treasury and other government agencies administer and enforce economic and trade sanctions based on U.S. foreign policy, which may limit our business activities in and for certain areas.
|
Executive Officers of the Registrant
Information about executive officers of the Company is provided in Item 10. Directors, Executive Officers and Corporate Governance, of this report, and is incorporated in this item by reference.
Available Information
Our filings with the Securities and Exchange Commission ("SEC"), including annual reports on Form 10-K, quarterly reports on Form 10-Q, current reports on Form 8-K and amendments to these reports, are available free of charge from our website at
www.atsginc.com
as soon as reasonably practicable after filing with the SEC. The SEC maintains an Internet site that contains reports, proxy and information statements and other information regarding Air Transport Services Group, Inc. at
www.sec.gov
.
ITEM 1A. RISK FACTORS
The risks described below could adversely affect our financial condition or results of operations. The risks below are not the only risks that the Company faces. Additional risks that are currently unknown to us or that we currently consider immaterial or unlikely could also adversely affect the Company.
A limited number of key customers are critical to our business and the loss of one or more of such customers could materially adversely affect our business, results of operations and financial condition.
Our business is dependent on a limited number of key customers. There is a risk that any one of our key customers may not renew their contracts with us on favorable terms or at all, perhaps due to reasons beyond our control. As discussed below, certain key customers have the opportunity to terminate their agreements in advance of the expiration date.
The economic conditions in the U.S. and in other markets may negatively impact the demand for the Company’s aircraft and services.
Air transportation volumes are strongly correlated to general economic conditions, including the price of aviation fuel. An economic downturn could reduce the demand for delivery services offered by DHL, Amazon and other delivery businesses, in particular expedited shipping services utilizing aircraft, as well as the demand for the chartered passenger flights OAI operates. Further, during an economic slowdown, cargo customers generally prefer to use ground-based or marine transportation services instead of more expensive air transportation services. Accordingly, an economic downturn could reduce the demand for airlift and aircraft leases. Additionally, if the price of aviation fuel rises significantly, the demand for aircraft and air transportation services may decline. During periods of downward economic trends and rising fuel costs, freight forwarders and integrated delivery businesses are more likely to defer market expansion plans. When the cost of air transportation increases, the demand for passenger transportation may decline. We may experience delays in the deployment of available aircraft with customers under lease, ACMI or charter arrangements and our revenues may be adversely affected.
12
Our costs incurred in providing airline services could be more than the contractual revenues generated.
Each airline develops business proposals for the performance of ACMI, CMI, charter and other services for its customers, including DHL, ASI and the DoD, by projecting operating costs, crew productivity and maintenance expenses. Projections contain key assumptions, including maintenance costs, flight hours, aircraft reliability, crewmember productivity and crewmember compensation and benefits. We may overestimate revenues, the level of crewmember productivity, and/or underestimate the actual costs of providing services when preparing business proposals. If actual costs are higher than projected or aircraft reliability is less than expected, future operating results may be negatively impacted. Lastly, because the majority of OAI's business currently consists of flights chartered by the U.S. Department of Defense (DoD) for the transportation of DoD personnel, a downturn in DoD's need for such services could adversely affect OAI's operating results.
The Company’s airlines rely on flight crews that are unionized. If collective bargaining agreements increase our costs and we cannot recover such increases, our operating results would be negatively impacted. It may be necessary for us to terminate customer contracts or curtail planned growth.
Our operating results could be adversely impacted by negotiations regarding collective bargaining agreements with flight crewmember representatives.
The flight crewmembers for each of the Company's airlines are unionized. ABX and OAI's crewmembers are represented by the International Brotherhood of Teamsters ("IBT") while ATI's crewmembers are represented by the Air Line Pilots Association ("ALPA"). The collective bargaining agreement ("CBA") between ABX and the IBT is currently amendable. The IBT and ABX management are in the process of renegotiating the terms of the CBA. The airline and the union are each required to maintain the status quo during the renegotiation of the CBA; neither the airline nor the union may engage in a lock-out, strike or other self-help until such time as they are released from further negotiations by the mediator for the National Mediation Board ("NMB"), and after the conclusion of a mandatory 30-day “cooling off” period. It is rare for mediators to declare an impasse and release the parties. Instead, the NMB prefers to require the parties to remain in negotiations until such time as they come to an agreement. Despite this process, it's possible for disruptions in customer service to occur from time to time, resulting in increased costs for the airline and monetary penalties under certain customer agreements if monthly reliability thresholds are not achieved. Further, if we do not maintain minimum reliability thresholds over an extended period of time, we could be found in default of one or more customer agreements.
Contract negotiations with the union could result in reduced flexibility for scheduling crewmembers and higher operating costs for the airlines, making the Company's airlines less competitive than other airlines.
During 2017, the NMB ruled that ABX and ATI do not constitute a single transportation system for the purposes of collective bargaining. The NMB could reconsider whether the airlines constitute a single transportation system and require that the ABX and ATI crewmembers, or that the ABX, ATI and Omni crewmembers, be represented by the same union. A single transportation system determination by the NMB could give rise to complex contractual issues, including integrating the airlines' seniority lists, and materially impact the dynamics with respect to future CBA negotiations. While it is unlikely that the NMB would reconsider or find that ABX and ATI, or that ABX, ATI and Omni, constitute a single transportation system, the case-by-case analysis used by the NMB makes such predictions uncertain.
The rate of aircraft deployments may impact the Company’s operating results and financial condition.
The Company's future operating results and financial condition will depend in part on our subsidiaries’ ability to successfully deploy aircraft in support of customers' operations while generating a positive return on investment. Our success will depend, in part, on our customers' ability to secure additional cargo volumes, in both U.S. and international markets. Deploying aircraft in international markets can pose additional risks, costs and regulatory requirements which could result in periods of delayed deployments. Deploying an aircraft into service typically requires various approvals from the FAA. Aircraft deployments could be delayed if FAA approval is delayed.
The actual demand for Boeing 777, 767, 757 and 737 aircraft may be less than we anticipate. The actual lease rates for aircraft available for lease may be less than we projected, or new leases may start later than we expect. Further, other airlines and lessors may be willing to offer aircraft to the market under terms more favorable to lessees.
13
We may fail to meet the scheduled delivery date for aircraft required by customer agreements
.
If CAM cannot meet the agreed delivery schedule for an aircraft lease, the customer may have the right to cancel the aircraft lease, thus delaying revenues until the aircraft can be completed and re-marketed successfully and exposing CAM to potential liability to the original customer.
Our airline operating agreements include on-time reliability requirements which can impact the Company's operating results and financial condition.
Certain of our airline operating agreements contain monthly incentive payments for reaching specific on-time reliability thresholds. Additionally, such airline operating agreements contain monetary penalties for aircraft reliability below certain thresholds. As a result, our operating revenues may vary from period to period depending on the achievement of monthly incentives or the imposition of penalties. Further, an airline could be found in default of an agreement if it does not maintain minimum thresholds over an extended period of time. If our airlines are placed in default due to the failure to maintain reliability thresholds, the customer may elect to terminate all or part of the services we provide under certain customer agreements after a cure period.
If ABX fails to maintain aircraft reliability above a minimum threshold under the restated CMI agreement with DHL for two consecutive calendar months or three months in a rolling twelve month period, we would be in default of the restated CMI agreement with DHL. In that event, DHL may elect to terminate the restated CMI agreement, unless we maintain the minimum reliability threshold
during a 60-day cure period.
If DHL terminates the CMI agreement due to an ABX event of default, we would be subject to a monetary penalty payable to DHL.
If our airlines fail to maintain aircraft reliability above a minimum threshold under the ATSA with ASI for either a specified number of consecutive calendar months or a specified number of calendar months (whether or not consecutive) in a specified trailing period, we could be held in default. In that event, ASI may elect to terminate the ATSA and pursue those rights and remedies available to it at law or in equity.
If OAI fails to maintain reliability above a minimum threshold under its contract with the DoD with respect to the flight segments flown during a given month, we could be held in default. In that event, the DoD may elect to terminate the contract. In addition, missions that experience carrier controllable delays are subject to monetary penalties. Depending on the delay interval, the compensation paid to OAI for the performance of the services can be reduced by a specified percentage amount.
Under the provisions of airline operating and aircraft lease agreements with customers, customers may be able to terminate the operating agreements or aircraft lease agreements, subject to early termination provisions.
Customers can typically terminate one or more of the aircraft from their related airline operating agreement for convenience at any time during the term, subject to a 60 day notice period and paying the Company a fee. Additionally, the lease agreements may contain provisions for terminating an aircraft lease for convenience, including a notice period and paying a lump sum amount to the Company.
Amazon may terminate the ATSA in its entirety after providing 180 days of advance notice and paying to the Company a termination fee which reduces over the term of the agreement.
DHL may terminate the restated CMI agreement in its entirety after providing 180 days of advance notice and paying a significant termination fee which amortizes down during the term of the agreement.
The DoD may not renew our contracts or may reduce the number of routes that we operate.
Our contracts with the DoD are typically for one year and are not required to be renewed. The DoD may terminate the contracts for convenience or in the event we were to fail to satisfy reliability requirements or for other reasons. The number and frequency of routes is sensitive to changes in military priorities and U.S. defense budgets.
The anticipated strategic and financial benefits of our relationship with Amazon may not be realized.
We entered into the agreements with Amazon with the expectation that the transactions would result in various benefits including, among others, growth in revenues, improved cash flows and operating efficiencies. Achieving the anticipated benefits from the agreements is subject to a number of challenges and uncertainties, such as unforeseen costs and less flying than expected.
I
f we are unable to achieve our objectives the expected benefits may be only partially realized or not at all, or may take longer to realize than expected, which could adversely impact our financial condition and results of operations.
14
The Company's future earnings and earnings per share, as reported under generally accepted accounting principles, will be impacted by the Amazon stock warrants.
We expect that the warrants issuable to Amazon will increase the number of diluted shares reported. The warrants are subject to fair value measurements during periods that they are outstanding. Accordingly, future fluctuations in the fair value of the warrants may adversely impact the Company's reported earnings measures. See Note D in the accompanying consolidated financial statements for further information about warrants.
If Amazon exercises its right to acquire shares of our common stock pursuant to the warrants, it will dilute the owenership interests of our then-existing stockholders and could adversely affect the market price of our common stock.
If Amazon exercises its right to acquire shares of our common stock pursuant to the warrants, it will dilute the ownership interests of our then-existing stockholders and reduce our earnings per share. In addition, any sales in the public market of any common stock issuable upon the exercise of the warrants by Amazon could adversely affect prevailing market prices of our common stock.
Changes in the fair value of certain financial instruments could impact the financial results of the Company.
Certain financial instruments are subject to fair value measurements at the end of each reporting period. Accordingly, future fluctuations in their fair value may adversely impact the Company's reported earnings. See Note E in the accompanying consolidated financial statements for further information about the fair value of our financial instruments.
The convertible note hedge transactions and the warrant transactions that we entered into in September 2017 may affect the value of our common stock.
In connection with the pricing of our 1.125% senior convertible notes due 2024 (the "Notes") and the exercise by the initial purchasers of their option to purchase additional Notes, we entered into privately-negotiated convertible note hedge transactions with the hedge counterparties. The convertible note hedge transactions cover, subject to customary anti-dilution adjustments, the number of shares of common stock that initially underlie the Notes. We also entered into separate, privately-negotiated warrant transactions with the hedge counterparties relating to the same number of shares of our common stock that initially underlie the Notes, subject to customary anti-dilution adjustments.
The hedge counterparties and/or their affiliates may modify their hedge positions with respect to the convertible note hedge transactions and the warrant transactions from time to time. They may do so by purchasing and/or selling shares of our common stock and/or other securities of ours, including the Notes in privately-negotiated transactions and/or open-market transactions or by entering into and/or unwinding various over-the-counter derivative transactions with respect to our common stock. The hedge counterparties are likely to modify their hedge positions during any observation period for the Notes.
The effect, if any, of these activities on the market price of our common stock will depend on a variety of factors, including market conditions, and cannot be determined at this time. Any of these activities could, however, adversely affect the market price of our common stock. In addition, the hedge counterparties and/or their affiliates may choose to engage in, or to discontinue engaging in, any of these transactions with or without notice at any time, and their decisions will be at their sole discretion and not within our control.
We are subject to counterparty risk with respect to the convertible note hedge transactions. The hedge counterparties are financial institutions, and we will be subject to the risk that they might default under the convertible note hedge transactions. Our exposure to the credit risk of the hedge counterparties is unsecured by any collateral. Global economic conditions have from time to time resulted in failure or financial difficulties for many financial institutions. If a hedge counterparty becomes subject to insolvency proceedings, we will become an unsecured creditor in those proceedings with a claim equal to our exposure at that time under our transactions with that hedge counterparty. Our exposure will depend on many factors but, generally, the increase in our exposure will be correlated to the increase in the market price and volatility of our common stock. In addition, upon a default by a hedge counterparty, we may suffer adverse tax consequences and more dilution than we currently anticipate with respect to our common stock. We can provide no assurances as to the financial stability or viability of any hedge counterparty.
Conversion of the Notes or exercise of the warrants may dilute the ownership interest of stockholders. Any sales in the public market of the common stock issuable upon such conversion of the Notes or such exercise of the warrants could adversely affect prevailing market prices of our common stock. In addition, the existence of the Notes may
15
encourage short selling by market participants because the conversion of the Notes could depress the price of our common stock.
Our business could be negatively impacted by adverse audit findings by the U.S. Government.
Our DoD contracts are subject to audit by government agencies, including with respect to performance, costs, internal controls and compliance with applicable laws and regulations. If an audit uncovers improprieties, we may be subject to civil or criminal penalties, including termination of such contracts, forfeiture of profits, fines and suspension from doing business with the DoD. In addition, the DOT, FAA and TSA can initiate announced or unannounced investigations of our subsidiary air carriers and repair stations to determine if they are continuously conducting their operations in accordance with all applicable laws, rules and regulations.
Our participation in the CRAF Program could adversely restrict our commercial business in times of national emergency.
All three of our airlines participate in the CRAF Program, which permits the DoD to utilize participants’ aircraft during national emergencies when the need for military airlift exceeds the capability of military aircraft.
Proposed rules from the DOT, FAA and TSA could increase the Company's operating costs and reduce customer utilization of airfreight.
FAA rules for Flightcrew Member Duty and Rest Requirements (FMDRR) for passenger airline operations became effective in January 2014. The rules apply to our operation of passenger and combi aircraft for the DoD and other customers and impact the required amount and timing of rest periods for pilots between work assignments and modified duty and rest requirements based on the time of day, number of scheduled segments, flight types, time zones and other factors. Failure to remain in compliance with these rules may subject us to fines or other enforcement action.
There are separate crew rest requirements applicable to all-cargo aircraft of the type operated by the Company. The FAA has rejected, as have the Courts, an attempt to apply the passenger airline crew rest rules to all-cargo operations. If such rest requirements and restrictions were imposed on our cargo operations, these rules could have a significant impact on the costs incurred by our airlines. The airlines would attempt to pass such additional costs through to their customers in the form of price increases. Customers, as a result, may seek to reduce their utilization of aircraft in favor of less expensive transportation alternatives.
The concentration of aircraft types and engines in the Company's airlines could adversely affect our operating and financial results.
The combined aircraft fleet is concentrated in three aircraft types. If any of these aircraft types encounter technical difficulties that resulted in significant FAA airworthiness directives or grounding, our ability to lease the aircraft would be adversely impacted, as would our airlines' operations. The market growth in demand for the Boeing 777, 767 and 757 aircraft types and configurations may be less than we anticipate. Customers may develop preferences for the Airbus A300-600 and A330 aircraft or other mid-size aircraft types, instead of the Boeing 777, 767 and 757 aircraft.
The cost of aircraft repairs and unexpected delays in the time required to complete aircraft maintenance could negatively affect our operating results.
Our airlines provide flight services throughout the world, sometimes operating in remote regions. Our aircraft may experience maintenance events in locations that do not have the necessary repair capabilities or are difficult to reach. As a result, we may incur additional expenses and lose billable revenues that we would have otherwise earned. Under certain customer agreements, we are required to provide a spare aircraft while scheduled maintenance is completed. If delays occur in the completion of aircraft maintenance, we may incur additional expense to provide airlift capacity and forgo revenues.
Lessees of our aircraft may fail to make contractual payments or fail to maintain the aircraft as required.
Our financial results depend in part on our lease customers' ability to make lease payments and maintain the related aircraft. Our customers' ability to make payments could be adversely impacted by changes to their financial liquidity, competitiveness, economic conditions and other factors. A default of an aircraft lease by a customer could negatively impact our operating results and cash flows and result in the repossession of the aircraft.
While we often require leasing customers to pay monthly maintenance deposits, customers are normally responsible for maintaining our aircraft during the lease term. Failure of a customer to perform required maintenance and maintain the appropriate records during the lease term could result in higher maintenance costs, a decrease in the value of the
16
aircraft, a lengthy delay in or even our inability to place the aircraft in a subsequent lease, any of which could have an adverse effect on our results of operations and financial condition.
We rely on third parties to modify aircraft and provide aircraft and engine maintenance.
We rely on certain third party aircraft modification service providers and aircraft and engine maintenance service providers that have expertise or resources that we do not have. Third party service providers may seek to impose price increases that could negatively affect our competitiveness in the airline markets. An unexpected termination or delay involving service providers could have a material adverse effect on our operations and financial results. A delay in an aircraft modification could adversely impact our revenues and our ability to place the aircraft in the market. We must manage third party service providers to meet schedules and turn-times and to control costs in order to remain competitive to our customers.
Delta TechOps, a division of Delta Airlines, Inc., is the primary engine maintenance provider for the Company's General Electric CF6 engines that power our fleet of Boeing 767 aircraft. If Delta TechOps does not complete the refurbishment of our engines within the contractual turn-times or if we must replace Delta TechOps as the maintenance provider for some or all of the Company's CF6 engines, our operations and financial results may be adversely impacted.
The Company's operating results could be negatively impacted by disruptions of its information technology and communication systems and data breaches.
Our businesses depend heavily on information technology and computerized systems to communicate and operate effectively. The Company's systems and technologies, or those of third parties on which we rely, could fail or become unreliable due to equipment failures, software viruses, cyberattacks, natural disasters, power failures, telecommunication outages, or other causes. Certain disruptions could prevent our airlines from flying as scheduled, possibly for an extended period of time, which could have a negative impact on our financial results and operating reliability. We continually monitor the risks of disruption, take preventative measures, develop backup plans and maintain redundancy capabilities. The measures we use may not prevent the causes of disruptions we could experience or help us recover failed systems quickly.
The costs of maintaining safeguards, recovery capabilities and preventive measures may continue to rise. Further, the costs of recovering or replacing a failed system could be very expensive.
In addition, the provision of service to our customers and the operation of our networks and systems involve the storage and transmission of significant amounts of proprietary information and sensitive or confidential data, including personal information of customers, employees and others. To conduct our operations, we regularly move data across national borders, and consequently we are subject to a variety of continuously evolving and developing laws and regulations in the United States and abroad regarding privacy, data protection and date security. The scope of the laws that may be applicable to us is often uncertain and may be conflicting, particularly with respect to foreign laws. For example, the European Union's General Data Protection Regulation ("GDPR"), which greatly increases the jurisdictional reach of European Union law and adds a broad array of requirements for handling personal data, including the public disclosure of significant data breaches, became effective in May 2018. Other countries have enacted or are enacting data localization laws that require data to stay within their borders. All of these evolving compliance and operational requirements impose significant costs that are likely to increase over time.
The costs of our aircraft maintenance facilities could negatively impact our financial results.
We lease and operate a 310,000 square foot aircraft maintenance facility and a 100,000 square foot component repair shop in Wilmington, Ohio. Additionally, we lease and operate a 311,500 square foot, two-hangar aircraft maintenance complex in Tampa, Florida. Accordingly, a large portion of the operating costs for our aircraft maintenance and conversion business are fixed. As a result, we need to retain existing aircraft maintenance business levels to maintain a profitable operation. The actual level of revenues may not be sufficient to cover our operating costs. Additionally, revenues from aircraft maintenance can vary among periods due to the timing of scheduled maintenance events and the completion level of work during a period.
The Company could violate debt covenants.
The Senior Credit Agreement contains covenants including, among other requirements, limitations on certain additional indebtedness and guarantees of indebtedness. The Senior Credit Agreement is collateralized by certain of the Company's Boeing 777, 767 and 757 aircraft. Under the terms of the Senior Credit Agreement, the Company is
17
required to maintain aircraft collateral coverage equal to 110% of the outstanding balance of the term loan and the total funded revolving credit facility. The Senior Credit Agreement stipulates events of default, including unspecified events that may have material adverse effects on the Company. If an event of default occurs, the Company may be forced to repay, renegotiate or replace the Senior Credit Agreement and loans. In such an event, the Company’s cost of borrowings could increase, and our ability to modify and deploy aircraft could be limited as a result.
Operating results may be affected by fluctuations in interest rates.
The Company enters into interest rate derivative instruments from time to time in conjunction with its debt levels. The Company's Senior Credit Agreement requires the Company to maintain derivative instruments for fluctuating interest rates for at least 50% of the outstanding balance of the unsubordinated term loans. We typically do not designate the derivative instruments as hedges for accounting purposes. Future fluctuations in LIBOR interest rates will result in the recording of gains and losses on interest rate derivatives that the Company holds.
Under the Senior Credit Agreement, interest rates are adjusted quarterly based on the prevailing LIBOR or prime rates and a ratio of the Company's outstanding debt level to earnings before interest, taxes, depreciation and amortization expenses ("EBITDA"). At the Company's current debt-to-EBITDA ratio, the unsubordinated term loans and the revolving credit facility both bear a variable interest rate of
4.78%
,
4.64%
and
4.78%
, respectively. Additional debt or lower EBITDA may result in higher interest rates on the variable rate portion of the Company's debt.
The Company sponsors defined benefit pension plans and post-retirement healthcare plans for certain eligible employees. The Company's related pension expense, the plans' funded status and funding requirements are sensitive to changes in interest rates. The plans' funded status and annual pension expense are recalculated at the beginning of each calendar year using the fair value of plan assets and market-based interest rates at that point in time, as well as assumptions for asset returns and other actuarial assumptions. Future fluctuations in interest rates, including the impact on asset returns, could result in the recording of additional expense for pension and other post-retirement healthcare plans.
The costs of insurance coverage or changes to our reserves for self-insured claims could affect our operating results and cash flows.
The Company is self-insured for certain claims related to workers’ compensation, aircraft, automobile, general liability and employee healthcare. We record a liability for reported claims and an estimate for incurred claims that have not yet been reported. Accruals for these claims are estimated utilizing historical paid claims data and recent claims trends. Changes in claim severity and frequency could impact our results of operations and cash flows.
The ability to use net operating loss carryforwards to offset future taxable income for U.S. federal income tax purposes may be further limited.
Limitations imposed on the ability to use net operating losses (“NOLs”) to offset future taxable income could cause U.S. federal income taxes to be paid earlier than otherwise would be paid if such limitations were not in effect and could cause such NOLs to expire unused, in each case reducing or eliminating the benefit of those NOLs. Similar rules and limitations may apply for state income tax purposes.
Changes in the ownership of the Company on the part of significant shareholders could limit our ability to use NOLs to offset future taxable income. In general, under Section 382 of the Internal Revenue Code of 1986, as amended (the “Code”), a corporation that undergoes an “ownership change” is subject to limitations on its ability to utilize its pre-change NOLs to offset future taxable income. In general, an ownership change occurs if the aggregate stock ownership of significant stockholders increases by more than 50 percentage points over such stockholders’ lowest percentage ownership during the testing period (generally three years).
Strategic investments in other businesses may not result in the desired benefits.
We enter into joint venture and other business ownership agreements with the expectation that such investment will result in various benefits including revenue growth through geographic diversification and product diversification, improved cash flows and better operating efficiencies. Achieving the anticipated benefits from such agreements is subject to a number of challenges and uncertainties.
T
he expected benefits may be only partially realized or not at all, or may take longer to realize than expected, which could adversely impact our financial condition and results of operations. We may make additional capital contributions to these businesses.
18
We may need to reduce the carrying value of the Company’s assets.
The Company owns a significant amount of aircraft, aircraft parts and related equipment. Additionally, the balance sheet reflects assets for income tax carryforwards and other deferred tax assets. The removal of aircraft from service or continual losses from aircraft operations could require us to evaluate the recoverability of the carrying value of those aircraft, related parts and equipment and record an impairment charge through earnings to reduce the carrying value.
We have recorded goodwill and other intangible assets related to acquisitions and equity investments. If we are unable to achieve the projected levels of operating results, it may be necessary to record an impairment charge to reduce the carrying value of goodwill, equity investments and related intangible assets. Similarly, if we were to lose a key customer or one of our airlines were to lose its authority to operate, it could be necessary to record an impairment charge.
If the Company incurs operating losses or our estimates of expected future earnings indicate a decline, it may be necessary to reassess the need for a valuation allowance for some or all of the Company’s net deferred tax assets.
We may be impacted by government requirements associated with transacting business in foreign jurisdictions.
The U.S and other governments have imposed trade and economic sanctions in certain geopolitical areas. The U.S. Departments of Justice, Commerce and Treasury, as well as other government agencies have a broad range of civil and criminal penalties they may seek to impose for violations of the Foreign Corrupt Practices Act (“FCPA”), sanctions administered by the Office of Foreign Assets Control (“OFAC”) and other regulations. In addition, the DOT, FAA and TSA may at times limit the ability of our airline subsidiaries to conduct flight operations in certain areas of the world. Under such laws and regulations, we may be obliged to limit our business activities, we may incur costs for compliance programs and we may be subject to enforcement actions or penalties for noncompliance. In recent years, the U.S. government has increased their oversight and enforcement activities with respect to these laws and the relevant agencies may continue to increase these activities.
Penalties, fines and sanctions levied by governmental agencies or the costs of complying with government regulations and trade policies could negatively affect our results of operations.
The operations of the Company’s subsidiaries are subject to complex aviation, transportation, security, environmental, labor, employment and other laws and regulations. These laws and regulations generally require our subsidiaries to maintain and comply with terms of a wide variety of certificates, permits, licenses and other approvals. Their inability to maintain required certificates, permits or licenses, or to comply with applicable laws, ordinances or regulations could result in substantial fines or, in the case of DOT and FAA requirements, possible suspension or revocation of their authority to conduct operations.
Recently, trade discussions between the U.S. and some of its trading partners have been fluid and any trade agreements that may be entered into are subject to a number of uncertainties, including the imposition of new tariffs or adjustments and changes to the products covered by existing tariffs. The impact of new laws, regulations and policies that affect global trade cannot be predicted.
The costs of maintaining our aircraft in compliance with government regulations could negatively affect our results of operations and require further investment in our aircraft fleet.
Manufacturer Service Bulletins and FAA regulations and FAA airworthiness directives issued under its “Aging Aircraft” program cause operators of older aircraft to be subject to additional inspections and modifications to address problems of corrosion and structural fatigue at specified times. The FAA may issue airworthiness directives that could require significant costly inspections and major modifications to such aircraft. The FAA may issue airworthiness directives that could limit the usability of certain aircraft types. In 2012, the FAA issued an airworthiness directive that requires the replacement of the aft pressure bulkhead on Boeing 767-200 aircraft based on a certain number of takeoff-and-landing cycles. As a result, some of the Company's Boeing 767-200 aircraft have been affected. The cost of compliance is estimated to be approximately $1.0 million per aircraft.
In addition, FAA regulations require that aircraft manufacturers establish limits on aircraft flight cycles to address issues involving aging, but still economically viable, aircraft, as described in Item 1 of this report, under "Federal Aviation Administration." These regulations may increase our maintenance costs and eventually limit the use of our aircraft. See Item 2. Properties, for a description of the company's aircraft, including year of manufacture.
19
The FAA and ICAO are in the process of developing programs to modernize air traffic control and management systems. The FAA's program, Next Generation Air Transportation Systems, is an integrated system that requires updating aircraft navigation and communication equipment. The FAA has mandated the replacement of current ground based radar systems with more accurate satellite based systems on our aircraft by 2020. The ICAO began phasing in similar requirements for aircraft operating in Europe during 2015. These programs may increase our costs and limit the use of our aircraft. Aircraft not equipped with advanced communication systems may be restricted to certain airspace.
Failure to maintain the operating certificates and authorities of our airlines would adversely affect our business.
The airline subsidiaries have the necessary authority to conduct flight operations pursuant to the economic authority issued by the DOT and the safety based authority issued by the FAA. The continued effectiveness of such authority is subject to their compliance with applicable statutes and DOT, FAA and TSA rules and regulations, including any new rules and regulations that may be adopted in the future. The loss of such authority by an airline subsidiary could cause a default of covenants within the Senior Credit Agreement and would materially and adversely affect its airline operations, effectively eliminating the airline's ability to continue to provide air transportation services.
The Company may be affected by global climate change or by legal, regulatory or market responses to such potential climate change.
The Company is subject to the regulations of the U.S. Environmental Protection Agency ("EPA") and state and local governments regarding air quality and other matters. In part, because of the highly industrialized nature of many of the locations where the Company operates, there can be no assurance that we have discovered all environmental contamination or other matters for which the Company may be responsible.
Concern over climate change, including the impact of global warming, has led to significant federal, state and international legislative and regulatory efforts to limit greenhouse gas ("GHG") emissions. The European Commission has mandated the extension of the European Union Emissions Trading Scheme ("ETS") for GHG emissions to the airline industry. Under the European Union ETS, all ABX, ATI and OAI flights that are wholly within the European Union are now covered by the ETS requirements, and each year we are required to submit emission allowances in an amount equal to the carbon dioxide emissions from such flights. Exceedance of the airlines' emission allowances would require the airlines to purchase additional emission allowances on the open market.
Similarly, in 2016, the International Civil Aviation Organization (“ICAO”) passed a resolution adopting the Carbon Offsetting and Reduction Scheme for International Aviation (“CORSIA”), which is a global, market-based emissions offset program to encourage carbon-neutral growth beyond 2020. A pilot phase is scheduled to begin in 2021 in which countries may voluntarily participate, and full mandatory participation is scheduled to begin in 2027. ICAO continues to develop details regarding implementation, but compliance with CORSIA will increase our operating costs.
The U.S. Congress and certain states have also considered legislation regulating GHG emissions. In addition, even in the absence of such legislation, the EPA could regulate greenhouse GHG emissions, especially aircraft engine emissions. In July 2016, the EPA, issued a finding that aircraft engine emissions cause or contribute to air pollution that may reasonably be anticipated to endanger public health. This finding is a regulatory prerequisite to the EPA’s adoption of a new certificate standard for aircraft emissions. However, the U.S. recently withdrew from the Paris climate accord, an agreement among 196 countries to reduce GHG emissions, and the effect of that withdrawal on future U.S. policy regarding GHG emissions, on CORSIA and on other GHG regulations is uncertain.
The cost to comply with potential new laws and regulations could be substantial for the Company. These costs could include an increase in the cost of fuel and capital costs associated with updating aircraft. Until the timing, scope and extent of any future regulation becomes known, we cannot predict its effect on the Company’s cost structure or operating results. Further, even without such legislation or regulation, increased awareness and adverse publicity in the global marketplace about greenhouse gas emitted by companies in the airline and transportation industries could harm our reputation and reduce demand for our services.
20
Severe weather or other natural or manmade disasters could adversely affect our business.
Severe weather conditions and other natural or manmade disasters, including storms, floods, fires or earthquakes, epidemics or pandemics, conflicts or unrest, or terrorist attacks, may result in decreased revenues, as our customers reduce their transportation needs, or increased costs to operate our business, which could have a material adverse effect on our results or operations for a quarter or year. Any such event affecting one of our major facilities could result in a significant interruption in or disruption of our business.
ITEM 1B. UNRESOLVED STAFF COMMENTS
None.
ITEM 2. PROPERTIES
The Company leases portions of the air park in Wilmington, Ohio, under lease agreements with a regional port authority, the terms of which expire in May of 2019 and June 2036 with options to extend. The leases include corporate offices, 310,000 square feet of maintenance hangars and a 100,000 square foot component repair shop at the air park. We also have the non-exclusive right to use the Wilmington airport, which includes one active runway, taxiways and ramp space. We also lease and operate a 311,500 square foot, two hangar aircraft maintenance complex at the Tampa International Airport in Florida. We lease approximately 82,500 square feet of office and warehouse space at the Tulsa International Airport in Oklahoma. In addition, we lease smaller maintenance stations, offices and ramp space at certain airport and regional locations typically on a short-term basis. Further, we lease warehousing space inside or near certain U.S. airports to support our customers' parcel handling requirements.
As of December 31, 2018, the Company and its subsidiaries' in-service aircraft fleet consisted of 88 owned aircraft and two aircraft leased from external companies. The majority of the aircraft were formerly passenger aircraft that have been modified for cargo operations. These cargo aircraft are generally described as being mid-size or having medium wide-body cargo capabilities. The cargo aircraft carry gross payloads ranging from approximately 47,900 to 129,000 pounds. These cargo aircraft are well suited for intra-continental flights and medium range inter-continental flights.
The table below shows the combined fleet of aircraft in service condition.
|
In-service Aircraft as of December 31, 2018
|
||||||||||||
|
Aircraft Type
|
Total
|
Owned
|
Operating Lease
|
Year of
Manufacture
|
Gross Payload
(Lbs.)
|
Still Air Range
(Nautical Miles)
|
||||||
|
767-200 SF (1)
|
34
|
34
|
—
|
1982 - 1987
|
85,000 - 100,000
|
1,700 - 5,300
|
||||||
|
767-200 Passenger
|
3
|
2
|
1
|
2001
|
63,000 - 73,000
|
6,500 - 7,600
|
||||||
|
767-300 SF (1)
|
33
|
33
|
—
|
1988 - 1997
|
121,000 - 129,000
|
3,200 - 7,100
|
||||||
|
767-300 Passenger
|
7
|
6
|
1
|
1993 - 2002
|
85,000 - 99,700
|
6,300 - 7,200
|
||||||
|
777-200 Passenger
|
3
|
3
|
—
|
2004 - 2007
|
119,500 - 123,900
|
8,700 - 9,500
|
||||||
|
757-200 PCF (1)
|
4
|
4
|
—
|
1984 - 1991
|
68,000
|
2,100 - 4,800
|
||||||
|
757-200 Combi (2)
|
4
|
4
|
—
|
1989 - 1992
|
58,000
|
2,600 - 4,300
|
||||||
|
737-400 SF (1)
|
2
|
2
|
—
|
1991
|
47,900
|
2,200 - 2,800
|
||||||
|
Total in-service
|
90
|
88
|
2
|
|||||||||
____________________
|
(1)
|
These aircraft are configured for standard cargo containers loaded through large standard main deck cargo doors.
|
|
(2)
|
These aircraft are configured as “combi” aircraft capable of simultaneously carrying passengers and cargo containers on the main flight deck.
|
21
In addition, as of December 31, 2018, CAM had one Boeing 767-200 passenger aircraft that is not reflected in the table above. The Boeing 767-200 aircraft discontinued passenger service when a customer's operation ended. CAM also owns five Boeing 767-300 aircraft which were undergoing or preparing to undergo modification to a standard freighter configuration and are expected to be completed in 2019. Additionally, CAM has one Boeing 767-200 cargo aircraft being prepped for future leasing.
We believe that our existing facilities and aircraft fleet are appropriate for our current operations. As described in Note I to the accompanying financial statements, we plan to invest in additional aircraft to meet our growth plans. We may make additional investments in aircraft and facilities if we identify favorable opportunities in the markets that we serve.
ITEM 3. LEGAL PROCEEDINGS
We are currently a party to legal proceedings in various federal and state jurisdictions arising out of the operation of the Company's business. The amount of alleged liability, if any, from these proceedings cannot be determined with certainty; however, we believe that the Company's ultimate liability, if any, arising from the pending legal proceedings, as well as from asserted legal claims and known potential legal claims which are probable of assertion, taking into account established accruals for estimated liabilities, should not be material to our financial condition or results of operations.
ITEM 4. MINE SAFETY DISCLOSURES
Not applicable
PART II
ITEM 5. MARKET FOR REGISTRANT’S COMMON EQUITY, RELATED STOCKHOLDER MATTERS, AND ISSUER PURCHASES OF EQUITY SECURITIES
Market Information
The Company's common stock is publicly traded on the NASDAQ Global Select Market under the symbol ATSG. The closing price of ATSG’s common stock was $23.27 on February 28, 2019.
Holders
On February 28, 2019, there were 1,434 stockholders of record of ATSG’s common stock.
Dividends
We are restricted from paying dividends on ATSG's common stock in excess of $100.0 million during any calendar year under the provisions of the Senior Credit Agreement. No cash dividends have been paid or declared.
Securities authorized for issuance under equity compensation plans
For the response to this Item, see Item 12
Purchases of equity securities by the issuer and affiliated purchasers
On August 5, 2014, the Board of Directors authorized the Company to repurchase up to $50.0 million of outstanding common stock. In May 2016, the Board amended the Company's common stock repurchase program increasing the amount that management may repurchase from $50.0 million to $100.0 million of outstanding common stock. In February 2018, the Board increased the authorization from $100.0 million to $150.0 million (less amounts previously repurchased). The Board's authorization does not require the Company to repurchase a specific number of shares or establish a time frame for any repurchase and the Board may terminate the repurchase program at any time. Repurchases may be made from time to time in the open market or in privately negotiated transactions. There is no expiration date for the repurchase program. There were no repurchases made during the fourth quarter of 2018. As of December 31, 2018, the Company had repurchased 6,592,349 shares and the maximum dollar value of shares that could then be purchased under the program was $61.3 million.
22
Performance Graph
The graph below compares the cumulative total stockholder return on a $100 investment in ATSG’s common stock with the cumulative total return of a $100 investment in the NASDAQ Composite Index and the cumulative total return of a $100 investment in the NASDAQ Transportation Index for the period beginning on December 31, 2013 and ending on December 31, 2018.
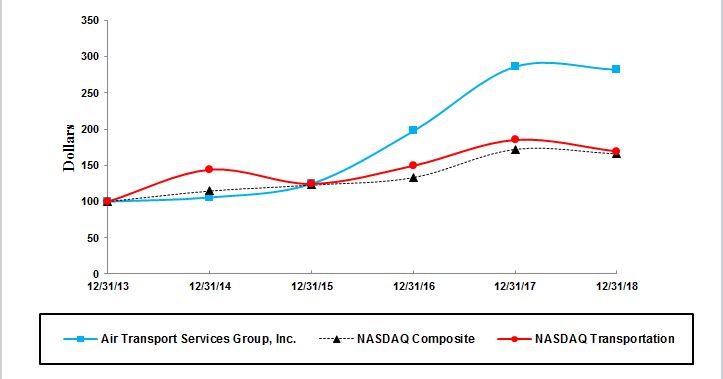
|
|
12/31/2013
|
12/31/2014
|
12/31/2015
|
12/31/2016
|
12/31/2017
|
12/31/2018
|
|||||||||||
|
Air Transport Services Group, Inc.
|
100.00
|
|
105.81
|
|
124.60
|
|
197.28
|
|
286.03
|
|
281.95
|
|
|||||
|
NASDAQ Composite Index
|
100.00
|
|
114.62
|
|
122.81
|
|
133.19
|
|
172.11
|
|
165.84
|
|
|||||
|
NASDAQ Transportation Index
|
100.00
|
|
144.06
|
|
124.46
|
|
149.57
|
|
185.07
|
|
169.26
|
|
|||||
23
ITEM 6. SELECTED CONSOLIDATED FINANCIAL DATA
The following selected consolidated financial data should be read in conjunction with the consolidated financial statements and the notes thereto and the information contained in Item 7 “Management’s Discussion and Analysis of Financial Condition and Results of Operations.” The selected consolidated financial data and the consolidated operations data below are derived from the Company’s audited consolidated financial statements.
|
|
As of and for the Years Ended December 31
|
||||||||||||||||||
|
|
2018
|
2017
|
2016
|
2015
|
2014
|
||||||||||||||
|
|
(In thousands, except per share data)
|
||||||||||||||||||
|
OPERATING RESULTS:
|
|||||||||||||||||||
|
Revenues from continuing operations (1)
|
$
|
892,345
|
|
$
|
1,068,200
|
|
$
|
768,870
|
|
$
|
619,264
|
|
$
|
589,592
|
|
||||
|
Operating expenses (3)
|
781,327
|
|
968,800
|
|
698,307
|
|
547,514
|
|
526,519
|
|
|||||||||
|
Net interest expense and other non operating charges
|
30,836
|
|
26,147
|
|
18,002
|
|
10,107
|
|
12,393
|
|
|||||||||
|
Financial instrument (gain) loss (2)
|
(7,296
|
)
|
79,789
|
|
18,107
|
|
(920
|
)
|
(1,096
|
)
|
|||||||||
|
Earnings (loss) from continuing operations before income taxes
|
87,478
|
|
(6,536
|
)
|
34,454
|
|
62,563
|
|
51,776
|
|
|||||||||
|
Income tax gain (expense) (4)
|
(19,595
|
)
|
28,276
|
|
(13,394
|
)
|
(23,408
|
)
|
(19,702
|
)
|
|||||||||
|
Earnings (loss) from continuing operations
|
67,883
|
|
21,740
|
|
21,060
|
|
39,155
|
|
32,074
|
|
|||||||||
|
Earnings (loss) from discontinued operations, net of taxes (3)
|
1,402
|
|
(3,245
|
)
|
2,428
|
|
2,067
|
|
(2,214
|
)
|
|||||||||
|
Consolidated net earnings (loss)
|
$
|
69,285
|
|
$
|
18,495
|
|
$
|
23,488
|
|
$
|
41,222
|
|
$
|
29,860
|
|
||||
|
EARNINGS (LOSS) PER SHARE FROM CONTINUING OPERATIONS:
|
|||||||||||||||||||
|
Basic
|
$
|
1.16
|
|
$
|
0.37
|
|
$
|
0.34
|
|
$
|
0.61
|
|
$
|
0.50
|
|
||||
|
Diluted
|
$
|
0.89
|
|
$
|
0.36
|
|
$
|
0.33
|
|
$
|
0.60
|
|
$
|
0.49
|
|
||||
|
FINANCIAL DATA:
|
|||||||||||||||||||
|
Cash and cash equivalents
|
$
|
59,322
|
|
$
|
32,699
|
|
$
|
16,358
|
|
$
|
17,697
|
|
$
|
30,560
|
|
||||
|
Property and equipment, net
|
1,555,005
|
|
1,159,962
|
|
1,000,992
|
|
875,401
|
|
847,268
|
|
|||||||||
|
Goodwill and intangible assets (5)
|
535,359
|
|
44,577
|
|
45,586
|
|
38,729
|
|
39,010
|
|
|||||||||
|
Total assets
|
2,470,585
|
|
1,548,844
|
|
1,259,330
|
|
1,041,721
|
|
1,011,203
|
|
|||||||||
|
Post-retirement liabilities (3)
|
68,907
|
|
63,266
|
|
79,528
|
|
110,166
|
|
94,368
|
|
|||||||||
|
Long term debt and current maturities, other than leases
|
1,401,252
|
|
515,758
|
|
458,721
|
|
318,200
|
|
344,094
|
|
|||||||||
|
Deferred income tax liability (4)
|
113,243
|
|
99,444
|
|
122,532
|
|
96,858
|
|
83,223
|
|
|||||||||
|
Stockholders’ equity
|
436,438
|
|
395,279
|
|
311,902
|
|
364,157
|
|
347,489
|
|
|||||||||
____________________
|
(1)
|
Revenues reflect the adoption of Financial Accounting Standards Board's Accounting Standards Update No. 2014-09, “Revenue from Contracts with Customers (Topic 606)” using a modified retrospective approach, under which financial statements are prepared under the revised guidance for the year of adoption, but not for prior years. (See Note O to the accompanying consolidated financial statements.)
|
|
(2)
|
During 2018, 2017, and 2016 the re-measurement of financial instrument fair values, primarily for warrants granted to a customer resulted in gains of $7.3 million and losses of $79.8 million and $18.1 million, respectively, before income taxes. (See Note D to the accompanying consolidated financial statements.)
|
|
(3)
|
During 2014, ABX settled $98.7 million of pension obligation from the pension plans assets. The settlement resulted in pre-tax charges of $6.7 million to continued operations and $5.0 million to discontinued operations for 2014. Effective December 31, 2016, ABX modified its unfunded, non-pilot retiree medical plan to terminate benefits to all participants. As a result, ABX settled $0.6 million of retiree medical obligations and recorded a pre-tax gain of $2.0 million to continued operations. On August 30, 2017, the ABX transferred investment assets from the pension plan trust to purchase a group annuity contract. As a result, ABX recorded pre-tax settlement charges of $5.3 million to continued operations and $7.6 million to discontinued operations. As a result of fluctuating interest rates and investment returns, the funded status of the Company's defined benefit pension and retiree medical plans vary from year to year. (See Note J to the accompanying consolidated financial statements.)
|
|
(4)
|
Earnings from continuing operations for 2017 was impacted by a
$59.9 million
reduction in deferred income taxes related to the Tax Cuts and Jobs Act legislation enacted in December 2017. (See Note K to the accompanying consolidated financial statements.)
|
|
(5)
|
On November 9, 2018, the Company acquired Omni. (see Note B and Note C to the accompanying consolidated financial statements.)
|
24
ITEM 7. MANAGEMENT’S DISCUSSION AND ANALYSIS OF FINANCIAL CONDITION AND RESULTS OF OPERATIONS
The following Management’s Discussion and Analysis has been prepared with reference to the historical financial condition and results of operations of Air Transport Services Group, Inc., and its subsidiaries. It should be read in conjunction with the accompany consolidated financial statements and related notes included in Item 8 of this report as well as business development described in Item 1 and risk factors in Item 1A of this report.
OVERVIEW
We lease aircraft and provide airline operations, aircraft modification and maintenance services, ground services, and other support services to the air transportation and logistics industries. Through the Company's subsidiaries, we offer a range of complementary services to delivery companies, freight forwarders, e-commerce operators, airlines and government customers. Our principal subsidiaries include three independently certificated airlines, (ABX, ATI and OAI) and an aircraft leasing company, (CAM ). CAM provides competitive aircraft lease rates by converting passenger aircraft into cargo freighters and offering them to customers under long-term leases.
We have three reportable segments: CAM, which leases Boeing 777, 767, 757 and 737 aircraft and aircraft engines; ACMI Services, which includes the cargo and passenger transportation operations of the three airlines; and MRO Services, which provides aircraft maintenance and modification services to customers. Our other business operations, which primarily provide support services to the transportation industry, include load transfer and sorting services as well as related equipment maintenance services. These operations do not constitute reportable segments due to their size. On November 9, 2018, the Company acquired OAI, a passenger airline, along with related entities (referred to collectively as Omni). Revenues and operating expenses include the activities of Omni for periods since their acquisition by the Company on November 9, 2018.
At December 31, 2018, CAM owned 88 aircraft that were in revenue service. This fleets consists of 34 Boeing 767-200 freighter aircraft, two Boeing 767-200 passenger aircraft, 33 Boeing 767-300 freighter aircraft, six Boeing 767-300 passenger aircraft, three Boeing 777-200 passenger aircraft, four Boeing 757-200 freighter aircraft, four Boeing 757 "combi" aircraft and two Boeing 737-400 freighter aircraft. At December 31, 2018, CAM also owned five Boeing 767-300 aircraft either already undergoing, or awaiting induction into the freighter conversion process and one Boeing 767-200 aircraft being staged for redeployment. Our largest customers are DHL Network Operations (USA), Inc. and its affiliates, ASI, which is a subsidiary of Amazon, and the U.S. Department of Defense.
We have had long-term contracts with DHL since August 2003. DHL accounted for
26%
,
30%
and
37%
of the Company's consolidated revenues excluding directly reimbursed revenues during the years ended December 31, 2018, 2017 and 2016, respectively. Under a 2015 CMI agreement with DHL, ABX operates and maintains aircraft based on pre-defined fees scaled for the number of aircraft hours flown, aircraft scheduled and flight crews provided to DHL for its network. Under the pricing structure of the CMI agreement, ABX is responsible for complying with FAA airworthiness directives, the cost of Boeing 767 airframe maintenance and certain engine maintenance events for the DHL-leased aircraft that it operates. As of December 31, 2018, the Company, through CAM, leased 16 Boeing 767 aircraft to DHL comprised of nine Boeing 767-200 aircraft through March 2019 and seven Boeing 767-300 aircraft expiring between 2019 and 2024. Ten of the 16 Boeing 767 were being operated by the Company's airlines for DHL. We also operate four CAM-owned Boeing 757 aircraft under other operating arrangements with DHL. All but two of the expiring Boeing 767 aircraft leases and CMI agreement with DHL are expected to be renewed in March 2019 under terms similar to the existing terms.
We have been providing freighter aircraft and services for cargo handling and logistical support for Amazon's ASI since September 2015. Revenues from our commercial arrangements with ASI comprised approximately
27%
,
27%
and
18%
of our consolidated revenues excluding directly reimbursed revenues during the years ended December 31, 2018, 2017 and 2016, respectively. On March 8, 2016, we entered into an Air Transportation Services Agreement (the “ATSA”) with ASI pursuant to which CAM leased 20 Boeing 767 freighter aircraft to ASI, including 12 Boeing 767-200 freighter aircraft for a term of five years and eight Boeing 767-300 freighter aircraft for a term of seven years. The ATSA also provides for the operation of those aircraft by our airline subsidiaries, for a term of five years, and the performance of ground handling services by our subsidiary, LGSTX. In December 2018, the Company announced agreements with Amazon to 1) lease and operate ten additional Boeing 767-300 aircraft for ASI, 2) extend the term of the 12 Boeing 767-200 aircraft currently leased to ASI by two years to 2023 with an option for three more years, 3)
25
extend the term of the eight Boeing 767-300 aircraft currently leased to ASI by three years to 2026 and 2027 with an
option for three more years and 4) extend the ATSA by five years through March 2026, with an option to extend for an additional three years. During January, 2019, amendments to extend the terms of aircraft leases were executed. We plan to deliver five of the 767-300 aircraft in 2019 and the remainder in 2020 for lease. All ten of these aircraft leases will be for ten years. Under the ATSA, we operate the aircraft based on pre-defined fees scaled for the number of aircraft hours flown, aircraft scheduled and flight crews provided to ASI for its network.
In conjunction with the execution of the ATSA, the Company and Amazon entered into an Investment Agreement and a Stockholders Agreement on March 8, 2016. The Investment Agreement calls for the Company to issue warrants in three tranches which grant Amazon the right to acquire up to 19.9% of the Company’s pre-transaction outstanding common shares measured on a GAAP-diluted basis, adjusted for share issuances and repurchases by the Company following the date of the Investment Agreement and after giving effect to the warrants granted. In conjunction with the commitment for the ten additional 767 aircraft leases, extensions of twenty existing Boeing 767 aircraft leases and additional aircraft operations under the ATSA, Amazon will be issued warrants for 14.8 million common shares which could expand its potential ownership in the Company to approximately 33.2%, including the warrants described above for the 2016 agreements. These new warrants will vest as existing leases are extended and additional aircraft leases are executed and added to the ATSA operations. Additionally, Amazon can earn incremental warrant rights, increasing its potential ownership from 33.2% up to approximately 39.9% of the Company, by leasing up to seventeen more cargo aircraft from the Company before January 2026. For additional information about the warrants see Note D to the accompanying consolidated financial statements.
Our accounting for the warrants issued to Amazon has been determined in accordance with the financial reporting guidance for equity-based payments to non-employees and for financial instruments. The fair value of the warrants issued or issuable to Amazon are recorded as a lease incentive asset and are amortized against revenues over the duration of the aircraft leases. The warrants are accounted for as financial instruments, and accordingly, the fair value of the outstanding warrants are measured and classified in liabilities at the end of each reporting period. As of December 31, 2018, our liabilities reflected
14.83 million
outstanding warrants having a fair value of
$13.76
per share. During 2018, the re-measurements of the warrants to fair value resulted in a non-operating gain of
$7.4 million
before the effect of income taxes compared to a
$81.8 million
loss for the year ended December 31, 2017.
The DoD comprised
15%
,
10%
and
14%
of the Company's consolidated revenues excluding directly reimbursed revenues during the years ended December 31, 2018, 2017 and 2016, respectively. The Company's airlines provide passenger airlift services to the U.S. DoD as participants in the CRAF program. Due to the acquisition of OAI, we expect the DoD to comprise 35% of our 2019 consolidated revenues.
RESULTS OF OPERATIONS
Aircraft Fleet Summary
Our fleet of cargo and passenger aircraft is summarized in the following table as of
December 31, 2018
, 2017 and 2016. Our CAM-owned operating aircraft fleet has increased by 29 aircraft since the end of 2016, driven by customer demand for the Boeing 767-300 converted freighter as well as the purchase of 11 passenger aircraft operated by OAI. Our freighters, converted from passenger aircraft, utilize standard shipping containers and can be deployed into regional cargo markets more economically than larger capacity aircraft, newly built freighters or other competing alternatives. At
December 31, 2018
, the Company owned five Boeing 767-300 aircraft that were either already undergoing, or awaiting induction into the freighter conversion process.
Aircraft fleet activity during
2018
is summarized below:
- CAM completed the modification of nine Boeing 767-300 freighter aircraft, six purchased in the previous year and three purchased in 2018. CAM began to lease seven of those aircraft under multi-year leases to external customers. CAM began to lease the other two aircraft to ATI.
- CAM completed the modification of one Boeing 737-400 freighter aircraft purchased in the previous year and entered into a multi-year lease with an external customer.
26
- With the Company's acquisition of Omni, CAM added two Boeing 767-200 passenger aircraft, six Boeing 767-300 passenger aircraft and three Boeing 777-200 passenger aircraft. All eleven of these passenger aircraft are being leased to OAI. Additionally, OAI leases two other Boeing 767 aircraft from third party lessors.
- ABX returned one Boeing 767-300 and two Boeing 767-200 freighter aircraft to CAM. The 767-300 aircraft was then leased to an external customer under a multi-year lease and is being operated by ABX while the two 767-200 aircraft were leased to different external customers under multi-year leases.
- CAM sold one Boeing 767-300 freighter aircraft, which was under lease to an external customer.
- CAM purchased eight Boeing 767-300 passenger aircraft for the purpose of converting the aircraft into a standard freighter configuration.
- External lessees returned two Boeing 767-200 freighter aircraft to CAM. One of these aircraft is being prepped for redeployment to another lessee while the other aircraft was removed from service.
|
2018
|
2017
|
2016
|
||||||||||||||||||
|
|
ACMI
Services
|
CAM
|
Total
|
ACMI
Services |
CAM
|
Total
|
ACMI
Services |
CAM
|
Total
|
|||||||||||
|
In-service aircraft
|
||||||||||||||||||||
|
Aircraft owned
|
||||||||||||||||||||
|
Boeing 767-200 Freighter
|
5
|
|
29
|
|
34
|
|
7
|
|
29
|
|
36
|
|
6
|
|
29
|
|
35
|
|
||
|
Boeing 767-200 Passenger
|
2
|
|
—
|
|
2
|
|
—
|
|
—
|
|
—
|
|
—
|
|
—
|
|
—
|
|
||
|
Boeing 767-300 Freighter
|
5
|
|
28
|
|
33
|
|
4
|
|
21
|
|
25
|
|
4
|
|
12
|
|
16
|
|
||
|
Boeing 767-300 Passenger
|
6
|
|
—
|
|
6
|
|
—
|
|
—
|
|
—
|
|
—
|
|
—
|
|
—
|
|
||
|
Boeing 777-200 Passenger
|
3
|
|
—
|
|
3
|
|
—
|
|
—
|
|
—
|
|
—
|
|
—
|
|
—
|
|
||
|
Boeing 757-200 Freighter
|
4
|
|
—
|
|
4
|
|
4
|
|
—
|
|
4
|
|
4
|
|
—
|
|
4
|
|
||
|
Boeing 757-200 Combi
|
4
|
|
—
|
|
4
|
|
4
|
|
—
|
|
4
|
|
4
|
|
—
|
|
4
|
|
||
|
Boeing 737-400 Freighter
|
—
|
|
2
|
|
2
|
|
—
|
|
1
|
|
1
|
|
—
|
|
—
|
|
—
|
|
||
|
Total
|
29
|
|
59
|
|
88
|
|
19
|
|
51
|
|
70
|
|
18
|
|
41
|
|
59
|
|
||
|
Operating lease
|
||||||||||||||||||||
|
Boeing 767-200 Passenger
|
1
|
|
—
|
|
1
|
|
—
|
|
—
|
|
—
|
|
—
|
|
—
|
|
—
|
|
||
|
Boeing 767-300 Passenger
|
1
|
|
—
|
|
1
|
|
—
|
|
—
|
|
—
|
|
—
|
|
—
|
|
—
|
|
||
|
Total
|
2
|
|
—
|
|
2
|
|
—
|
|
—
|
|
—
|
|
—
|
|
—
|
|
—
|
|
||
|
Other aircraft
|
||||||||||||||||||||
|
Owned Boeing 767-300 under modification
|
—
|
|
5
|
|
5
|
|
—
|
|
6
|
|
6
|
|
—
|
|
7
|
|
7
|
|
||
|
Owned Boeing 737-400 under modification
|
—
|
|
—
|
|
—
|
|
—
|
|
1
|
|
1
|
|
—
|
|
—
|
|
—
|
|
||
|
Owned Boeing 767 available or staging for lease
|
—
|
|
1
|
|
1
|
|
—
|
|
—
|
|
—
|
|
—
|
|
1
|
|
1
|
|
||
As of
December 31, 2018
, ABX, ATI and OAI were leasing 29 in-service aircraft internally from CAM for use in ACMI Services. As of
December 31, 2018
, three of CAM's 29 Boeing 767-200 freighter aircraft shown in the fleet table above and seven of the 28 Boeing 767-300 freighter aircraft were leased to DHL and operated by ABX. Additionally, 12 of CAM's 29 Boeing 767-200 freighter aircraft and eight of CAM's 28 Boeing 767-300 freighter aircraft were leased to ASI and operated by ABX or ATI. CAM leased the other 14 Boeing 767-200 freighter aircraft and 13 Boeing 767-300 aircraft to external customers, including six Boeing 767-200 aircraft to DHL that are being operated by a DHL-owned airline. The carrying values of the total in-service fleet as of December 31, 2018, 2017 and 2016 were $1,334.9 million, $955.2 million and $793.9 million, respectively. The table above does not reflect one Boeing 767-200 passenger aircraft owned by CAM that is not in service condition or the process of freighter modification.
27
Revenue and Earnings Summary
External customer revenues from continuing operations decreased by
$175.9 million
to
$892.3 million
during 2018 compared to 2017. Effective January 1, 2018, the Company adopted Accounting Standards Update ("ASU") No. 2014-09, “Revenue from Contracts with Customers (Topic 606)” ("Topic 606”). As a result of adopting Topic 606 beginning January 1, 2018, the Company reported certain revenues net of related expenses that are directly reimbursed by customers. Corresponding 2017 and 2016 revenues include such expense reimbursements. Excluding revenues directly reimbursed in 2017 and 2016, customer revenues increased by
$113.6 million
, or
15%
during 2018 compared to 2017 and increased by $136.7 million, or 21% during 2017 compared to 2016. These external customer revenues increased during 2018 and 2017 due to additional aircraft leases from CAM's leasing operations, expanded CMI and logistic services for ASI and increased aircraft maintenance and modification services for various customers. Revenues in 2018 also grew for additional passenger transportation services provided to the DoD after the company completed its acquisition of OAI in November 2018.
The consolidated net earnings from continuing operations were
$67.9 million
for 2018 compared to
$21.7 million
for 2017 and $21.1 million for 2016. The pre-tax earnings from continuing operations were
$87.5 million
for 2018 compared to pre-tax losses of
$6.5 million
for 2017 and pre-tax earnings of 34.5 million for 2016. Earnings were affected by specific events and certain adjustments that do not directly reflect our underlying operations among the years presented. Consolidated net earnings for 2017 were impacted by
$59.9 million
of tax benefits for the re-measurement of the Company's deferred tax assets and liabilities at the new federal corporate tax rate of 21% enacted by the Tax Cuts and Jobs Act legislation ("Tax Act") in December 2017. Consolidated net earnings for 2018 benefited from the lower corporate tax rate, reduced from 35% in 2017 and 2016. On a pre-tax basis, earnings included net gains of
$7.3 million
and losses of
$79.8 million
and
$18.1 million
for the years ended December 31, 2018, 2017 and 2016, respectively, for the re-measurement of financial instruments, including warrant obligations granted to Amazon. Pre-tax earnings were also reduced by
$16.9 million
,
$14.0 million
and $4.5 million for the years ended December 31, 2018, 2017 and 2016, respectively, for the amortization of lease incentives given to ASI in the form of warrants. Additionally, pre-tax earnings from continuing operations included gains of
$8.2 million
and expenses of
$6.1 million
and
$6.8 million
for the years ended December 31, 2018, 2017 and 2016, respectively, for settlement charges, curtailments and other non-service components of retiree benefit plans. Pre-tax earnings included losses of
$10.5 million
and
$3.1 million
for the years ended December 31, 2018 and 2017, respectively, for the Company's share of development costs for a joint venture. Pre-tax earnings for 2018 also included expense of
$5.3 million
for acquisition fees incurred during the Company's acquisition of Omni. Pre-tax earnings for the year ended December 31, 2016, also included a $1.2 million charge for the Company's share of capitalized debt issuance costs that were expensed when West Atlantic AB, a non-consolidated affiliate, restructured its debt. After removing the effects of these items, adjusted pre-tax earnings from continuing operations, a non-GAAP measure (a definition and reconciliation of adjusted pre-tax earnings from continuing operations follows) were
$104.6 million
for 2018 compared to
$96.5 million
for 2017 and
$65.1 million
for 2016.
Adjusted pre-tax earnings from continuing operations for 2018 improved by
8.5%
compared to 2017, driven primarily by additional revenues and the improved financial results of our airline operations. We experienced additional revenues and earnings due to the acquisition of Omni in November 2018. Adjusted pre-tax earnings from continuing operations also improved due to additional aircraft leases and the expansion of gateway ground operations for ASI. Growth in revenue was partially offset by the cost necessary to support expanded flight operations, higher costs for flight crews, higher depreciation expense and employee expenses, particularly in support of logistical services. Pre-tax earnings for 2018 and 2017 included additional interest expense due to the acquisition of Omni and the expansion of the fleet and included
$8.3 million
and
$2.1 million
for the amortization of convertible debt discount and issuance costs. Operating results for 2016 were negatively impacted when ABX flight crewmembers went on strike for two days, which disrupted our customers' operations and reduced our revenues.
28
A summary of our revenues and pre-tax earnings and adjusted pre-tax earnings from continuing operations is shown below (in thousands):
|
|
Years Ending December 31
|
||||||||||
|
|
2018
|
2017
|
2016
|
||||||||
|
Revenues from Continuing Operations:
|
|||||||||||
|
CAM
|
|||||||||||
|
Aircraft leasing and related services
|
$
|
245,860
|
|
$
|
223,546
|
|
$
|
199,598
|
|
||
|
Lease incentive amortization
|
(16,904
|
)
|
(13,986
|
)
|
(4,506
|
)
|
|||||
|
Total CAM
|
228,956
|
|
209,560
|
|
195,092
|
|
|||||
|
ACMI Services
|
548,839
|
|
459,272
|
|
410,598
|
|
|||||
|
MRO Services
|
207,539
|
|
205,401
|
|
111,913
|
|
|||||
|
Other Activities
|
79,040
|
|
93,856
|
|
105,608
|
|
|||||
|
Total Revenues
|
1,064,374
|
|
968,089
|
|
823,211
|
|
|||||
|
Eliminate internal revenues
|
(172,029
|
)
|
(189,309
|
)
|
(181,111
|
)
|
|||||
|
Customer Revenues - non reimbursed
|
$
|
892,345
|
|
$
|
778,780
|
|
$
|
642,100
|
|
||
|
Revenues for reimbursed expenses
|
—
|
|
289,420
|
|
126,770
|
|
|||||
|
Customer Revenues
|
$
|
892,345
|
|
$
|
1,068,200
|
|
$
|
768,870
|
|
||
|
Pre-Tax Earnings from Continuing Operations:
|
|||||||||||
|
CAM, inclusive of interest expense
|
$
|
65,576
|
|
$
|
61,510
|
|
$
|
68,608
|
|
||
|
ACMI Services
|
17,717
|
|
8,557
|
|
(25,016
|
)
|
|||||
|
MRO Services
|
14,499
|
|
19,741
|
|
12,308
|
|
|||||
|
Other Activities
|
9,107
|
|
5,590
|
|
9,519
|
|
|||||
|
Inter-segment earnings eliminated
|
(12,436
|
)
|
(11,583
|
)
|
(5,498
|
)
|
|||||
|
Net unallocated interest expense
|
(6,729
|
)
|
(1,322
|
)
|
(545
|
)
|
|||||
|
Net financial instrument re-measurement (loss) gain
|
7,296
|
|
(79,789
|
)
|
(18,107
|
)
|
|||||
|
Transaction fees
|
(5,264
|
)
|
—
|
|
—
|
|
|||||
|
Other non-service components of retiree benefits costs, net
|
8,180
|
|
(6,105
|
)
|
(6,815
|
)
|
|||||
|
Loss from non-consolidated affiliate
|
(10,468
|
)
|
(3,135
|
)
|
—
|
|
|||||
|
Pre-Tax Earnings from Continuing Operations
|
87,478
|
|
(6,536
|
)
|
34,454
|
|
|||||
|
Add other non-service components of retiree benefit costs, net
|
(8,180
|
)
|
6,105
|
|
6,815
|
|
|||||
|
Add charges for non-consolidated affiliate
|
10,468
|
|
3,135
|
|
1,229
|
|
|||||
|
Add lease incentive amortization
|
16,904
|
|
13,986
|
|
4,506
|
|
|||||
|
Add transaction fees
|
5,264
|
|
—
|
|
—
|
|
|||||
|
Add net loss (gain) on financial instruments
|
(7,296
|
)
|
79,789
|
|
18,107
|
|
|||||
|
Adjusted Pre-Tax Earnings from Continuing Operations
|
$
|
104,638
|
|
$
|
96,479
|
|
$
|
65,111
|
|
||
Adjusted pre-tax earnings from continuing operations, a non-GAAP measure, is pre-tax earnings excluding settlement charges and other non-service components of retiree benefit costs, gains and losses for the fair value re-measurement of financial instruments, lease incentive amortization, the transaction fees related to the acquisition of Omni, the start-up costs of a non-consolidated joint venture and the charge off of debt issuance costs from a non-consolidated affiliate during the first quarter of 2016. We exclude these items from adjusted pre-tax earnings because they are distinctly different in their predictability or not closely related to our on-going operating activities. Management uses adjusted pre-tax earnings to compare the performance of core operating results between periods. Presenting this measure provides investors with a comparative metric of fundamental operations while highlighting changes to certain items among periods. Adjusted pre-tax earnings should not be considered in isolation or as a substitute for analysis of the Company's results as reported under GAAP.
We adopted Topic 606 using a modified retrospective approach, under which financial statements are prepared under the revised guidance for the year of adoption, but not for prior years. We determined that under Topic 606, the Company is an agent for aircraft fuel and certain other costs reimbursed under its ACMI and CMI contracts and for certain ground services that it arranges for ASI. Under the new standard, such reimbursed amounts are reported net of
29
the corresponding expenses beginning in 2018. Revenues during 2017 and 2016 included
$289.4 million
and
$126.8 million
for reimbursable revenues under its ACMI and CMI contracts and for directly reimbursed ground services, which under the new standard, would have been reported net of the related expenses in 2018.
2018 and 2017
CAM
CAM offers aircraft leasing and related services to external customers and also leases aircraft internally to the Company's airlines. CAM acquires passenger aircraft and manages the modification of the aircraft into freighters. The follow-on aircraft leases normally cover a term of five to eight years.
As of December 31, 2018 and 2017, CAM had 59 and 51 aircraft under lease to external customers, respectively. CAM's revenues grew by
$19.4 million
during 2018 compared to 2017, primarily as a result of additional aircraft leases. Revenues from external customers totaled
$156.5 million
and
$140.4 million
for 2018 and 2017, respectively. CAM's revenues from the Company's airlines totaled
$72.4 million
during 2018, compared to $69.1 million for 2017, reflecting lease revenues for the addition of the eleven passenger aircraft acquired with Omni in November 2018. CAM's aircraft leasing and related services revenues, which exclude customer lease incentive amortization, increased
$22.3 million
in 2018 compared to 2017, primarily as a result of new aircraft leases in 2018. Since the beginning of 2018, CAM has added nine Boeing 767-300 freighter aircraft and one Boeing 737-400 freighter aircraft to its lease portfolio. CAM also added two Boeing 767-200 passenger aircraft, six Boeing 767-300 passenger aircraft and three Boeing 777-200 passenger aircraft to its lease portfolio after the Company's acquisition of Omni in November 2018.
CAM's pre-tax earnings, inclusive of internally allocated interest expense, were
$65.6 million
and
$61.5 million
during 2018 and 2017, respectively. Increased pre-tax earnings reflect the eleven passenger aircraft leased to Omni as well as the ten freighter aircraft placed into service in 2018, offset by a $6.2 million increase in internally allocated interest expense due to higher debt levels, the
$2.9 million
increase in the amortization of the ASI lease incentive in 2018 compared to 2017, and
$18.8 million
more depreciation expense driven by the addition of ten Boeing aircraft in 2018 compared to 2017.
During 2018, CAM purchased eight 767-300 passenger aircraft for freighter conversion, two of which were leased to external customers and one leased internally during 2018 after completing the conversion process. As of
December 31, 2018
, the remaining five of these Boeing 767-300 passenger aircraft were being modified from passenger to freighter configuration. The Company also leased one Boeing 737-400 aircraft which was purchased during 2017 to an external customer after completing the conversion process in 2018.
We expect CAM to complete the freighter modification of the five passenger aircraft which were in the modification process at December 31, 2018. We have customer commitments or letters of intent for these five aircraft. In December, 2018, we entered into an agreement to acquire twenty Boeing 767-300 extended-range passenger aircraft over the next three years. The aircraft covered by this agreement are currently operated by American Airlines. Additionally, the Company has agreements to acquire three more Boeing 767-300 passenger aircraft. CAM will begin to acquire the aircraft during 2019 and currently expects to begin freighter modification of at least eight Boeing 767-300s during 2019, up to nine during 2020 and no fewer than six in 2021. CAM's operating results will depend on its continuing ability to convert passenger aircraft into freighters within planned costs and within the time frames required by customers. CAM's future operating results will also depend on the timing and lease rates under which these aircraft are ultimately leased. CAM's future operating results will also be impacted by the amortization of additional warrants committed to Amazon in conjunction with the recent agreements for ten additional long-term aircraft leases and amendments to extend the terms of existing aircraft leases.
ACMI Services
The ACMI Services segment provides airline operations to its customers, typically under contracts providing for a combination of aircraft, crews, maintenance, insurance and aviation fuel. Our customers are typically responsible for supplying the necessary aviation fuel and cargo handling services and reimbursing our airline for other operating expenses such as landing fees, ramp expenses, certain aircraft maintenance expenses and fuel procured directly by the airline. Aircraft charter agreements, including those for the DoD, usually require the airline to provide full service, including fuel and other operating expenses for a fixed, all-inclusive price. As of
December 31, 2018
, ACMI Services
30
included 62 in-service aircraft, including 29 leased internally from CAM, ten CAM-owned freighter aircraft which are under lease to DHL and operated by ABX under a CMI agreement, 20 CAM-owned freighter aircraft which are under lease to ASI and operated by ATI and ABX under the ATSA, two passenger aircraft leased from an external lessor and another CAM-owned freighter operated by ATI.
Total revenues from ACMI Services decreased
$65.9 million
during 2018 compared with 2017 to
$548.8 million
. ACMI Services revenues for the 2017 year included
$155.5 million
for the reimbursement of fuel and certain operating expenses. Such revenues for 2018 are reported net of expenses after the adoption of Topic 606. Airline services revenues from external customers, excluding revenues for the reimbursement of fuel and certain operating expenses, increased
$89.6 million
. Improved revenues, excluding directly reimbursed expenses, were driven by additional aircraft operations for ASI, a 5% increase in billable block hours as well as the acquisition of OAI. As of December 31, 2018, ACMI Services revenues included the operation of eleven more CAM-owned aircraft compared to December 31, 2017.
ACMI Services had pre-tax earnings of
$17.7 million
during 2018, compared to
$8.6 million
for 2017. Improved pre-tax results in 2018 compared to 2017 were bolstered by expanded revenues, the timing of scheduled airframe maintenance events, and the acquisition of OAI. Scheduled airframe maintenance expense decreased $0.7 million during 2018 compared to 2017. Airframe maintenance expense varies depending upon the number of C-checks and the scope of the checks required for those airframes scheduled for maintenance. In March 2018, ATI began to implement an amendment to the collective bargaining agreement with its crewmembers. The amendment resulted in increased wages for the ATI crewmembers beginning in the second quarter of 2018.
The future growth for ACMI Service may be impacted by additional aircraft operations for Amazon. As a result of recent agreements, we expect Amazon to lease at least ten additional Boeing 767-300 aircraft from CAM with placements beginning in the second half of 2019. Amazon may contract the operation of those aircraft through our existing ATSA. Future operating results would also be impacted by the vesting of additional warrants committed to Amazon in exchange for adding aircraft into the ATSA.
Maintaining profitability in ACMI Services will depend on a number of factors, including customer flight schedules, crewmember productivity and pay, employee benefits, aircraft maintenance schedules and the number of aircraft we operate. ABX is negotiating with its flight crewmembers' collective bargaining unit. These negotiations could result in changes that may effect our productivity, employee compensation levels and the marketability of our services.
MRO Services
MRO Services sells aircraft parts and provides aircraft maintenance and modification services through the AMES and Pemco subsidiaries. Total revenues from MRO Services were
$207.5 million
and
$205.4 million
for 2018 and 2017, respectively. External customer revenues increased
$11.1 million
during 2018 compared to 2017. Revenues for 2018 reflect the change in accounting standards beginning in 2018 after the adoption of Topic 606 to recognize certain aircraft maintenance and modification services over time instead of upon completion. During 2017, revenues were recognized in large amounts upon completion and redelivery of an aircraft to the customer.
The pre-tax earnings from MRO Services decreased by
$5.2 million
to
$14.5 million
in 2018. The decline in MRO Services profitability reflects a mix of more lower margin maintenance services revenues and longer completion times.
Other Activities
We provide other support services to our ACMI Services customers and other airlines by leveraging our knowledge and capabilities developed for our own operations over the years. Through September 30, 2018, we provided mail and package sorting and logistical support to the U.S. Postal Service (“USPS”) at five USPS facilities. We arrange and perform similar services for certain ASI gateway locations in the U.S. We provide maintenance for ground equipment, facilities and material handling equipment. We also resell aviation fuel in Ohio and provide flight training.
External customer revenues from all other activities, excluding directly reimbursed revenues, decreased
$3.1 million
in 2018 compared to 2017. Declines in USPS revenue during 2018 were offset partially by additional ground support services provided to ASI. During June of 2018, we began to provide cargo handling and related ground support services directly to ASI at one of its gateway locations.
31
The pre-tax earnings from other activities increased by
$3.5 million
to
$9.1 million
in 2018. Additional earnings were a result of additional ASI services and improved results from an airline affiliate accounted for under the equity method.
Expenses from Continuing Operations
Salaries, wages and benefits expense increased
$24.4 million
during 2018 compared to 2017 driven by higher headcount for flight operations, maintenance services and package sorting services. The increase in expense for 2018 included $13.4 million for Omni, acquired in November 2018. The increase during 2018 also included higher flight crew wages in conjunction with an amendment to the collective bargaining agreement with the ATI crewmembers, additional employees and additional aircraft maintenance technician time to support increased block hours and increased MRO services revenues.
Depreciation and amortization expense increased
$24.3 million
during 2018 compared to 2017. The increase in depreciation expense included $8.7 million for Omni assets acquired in November 2018. The increase also reflects incremental depreciation for 15 Boeing 767-300 aircraft and additional aircraft engines added to the operating fleet since mid-2017, as well as capitalized heavy maintenance and navigation technology upgrades. We expect depreciation expense to increase during future periods in conjunction with our fleet expansion and capital spending plans.
Maintenance, materials and repairs expense increased by
$5.1 million
during 2018 compared to 2017. The increase in expense for 2018 included $2.8 million for Omni, acquired in November 2018. The remainder of the increase was due primarily to MRO Services for external customers. During 2018, MRO Services had an increased level of customer revenues and direct expenses compared to 2017. Aircraft maintenance and material expenses can vary among periods due to the number of maintenance events and the scope of airframe checks that are performed.
Fuel expense decreased by
$110.3 million
during 2018 compared to 2017. In 2017, fuel expense included reimbursable fuel billed to DHL, ASI and other ACMI customers which is being netted against the revenue in 2018 after the adoption of Topic 606. The customer-reimbursed fuel for 2017 was $133.5 million. Fuel expense includes the cost of fuel to operate DoD charters as well as fuel used to position aircraft for service and for maintenance purposes. Fuel expense, excluding customer-reimbursed fuel, increased $23.2 million for 2018 compared to 2017. The increase for 2018 included $13.8 million for Omni. The remainder of the increase was due to more block hours flown for military customers in 2018.
Contracted ground and aviation services expense includes navigational services, aircraft and cargo handling services, baggage handling services and other airport services. Contracted ground and aviation services decreased
$130.5 million
during 2018 compared to 2017. The decrease is primarily due to the netting of reimbursable revenues from certain ground services arranged for ASI against the expense in 2018 due to the adoption of Topic 606. The customer-reimbursed expenses in 2017 were $138.4 million. Without these customer-reimbursed expenses, contracted ground and aviation services increased $7.9 million during 2018 compared to 2017. This increase included $5.8 million for Omni.
Travel expense increased by
$7.1 million
during 2018 compared to 2017. The increase for 2018 included $6.3 million for Omni.
Landing and ramp expense, which includes the cost of deicing chemicals, decreased by
$16.3 million
during 2018 compared to 2017. The decrease is primarily due to the netting of reimbursable revenues from landing and ramp fees billed to DHL, ASI and other ACMI customers against expense in 2018 due to the adoption of Topic 606.
Rent expense increased by
$0.3 million
during 2018 compared to 2017. This increase included $1.1 million for Omni. This increase was partially offset by decreases in building rent after the expiration of the contracts for the five USPS facilities.
Insurance expense increased by
$1.3 million
during 2018 compared to 2017. Aircraft fleet insurance has increased due to additional aircraft operations during 2018 compared to 2017.
Other operating expenses increased by
$1.8 million
during 2018 compared to 2017. Other operating expenses include professional fees, employee training and utilities. The increase for 2018 included $4.0 million for Omni. Other operating expenses during 2018 were partially offset by improved operating results of an airline affiliate accounted for under the equity method.
32
Interest expense increased by
$11.8 million
during 2018 compared to 2017. Interest expense increased due to a higher average debt level, including an additional term loan under the Senior Credit Agreement of $675.0 million to finance the acquisition of Omni and higher interest rates on the Company's outstanding loans. Interest expense in 2018 and 2017 was also impacted by the convertible notes issued in September 2017. The convertible notes have a principal value of $258.8 million and bear interest at a cash coupon rate of 1.125%. At the time of issuance, the value of the conversion feature of the convertible notes was recorded as a debt discount and is being amortized along with debt issuance cost to interest expense over the seven year term of the convertible notes. The amortization of the convertible debt discount and issuance costs was $8.3 million and $2.1 million during 2018 and 2017, respectively. We expect interest expense to increase for 2019 reflecting our additional level of borrowings and higher interest rates.
The Company recorded pre-tax net gains on financial instruments of
$7.3 million
during the year ended December 31, 2018, compared to losses of
$79.8 million
during 2017. The gains and losses are primarily a result of re-measuring, as of December 31, 2018 and 2017, the fair value of the stock warrants granted to Amazon. A decrease in the fair value of the warrant obligation since December 31, 2017 corresponded to a decrease in the traded price of the Company's shares and resulted in a non-cash gain for 2018. The increase in the fair value of the warrant obligation since December 31, 2016 corresponded to an increase in the traded price of the Company's shares and resulted in a non-cash loss in 2017. The non-cash gains and losses resulting from quarterly re-measurements of the warrants may vary widely among quarters.
Non service components of retiree benefits were a net gain of $8.2 million for 2018 compared to a net loss of $6.1 million for 2017. The non service component gain and losses of retiree benefits are actuarially determined and include the amortization of unrecognized gain and loss stemming from changes in assumptions regarding discount rates, expected investment returns and other retirement plan assumptions. Non service components also include the effects of large pension settlement transactions. As a result of a pension settlement transaction, the Company recognized pre-tax settlement charges of
$5.3 million
to continued operations during 2017. Non service components of retiree benefits can varying significantly from one year to the next based on investment results and changes in discount rates used to account for defined benefit retirement plans.
Income tax expense from earnings from continuing operations decreased
$47.9 million
for 2018 compared to 2017. Income tax benefits from earnings from continuing operations for 2017 included a benefit of
$59.9 million
due to the enactment of the Tax Act in December 2017. The re-measurement of deferred tax balances using the lower federal rates enacted by the Tax Act resulted in a reduction in our net deferred tax liability and the recognition of a deferred tax benefit. Income taxes included deferred income tax effects for the gains and losses from warrants re-measurements and the amortization of the customer lease incentive. The income tax effects of the warrant re-measurements and the amortization of the customer lease incentive are different than the book expenses and benefits required by generally accepted accounting principles because for tax purposes, the warrants are valued at a different time and under a different valuation method. The effective tax rate, before including the warrant revaluations, incentive amortization and the 2017 re-measurement effects of the Tax Act, was 24.0% for 2018 compared to 37.5% for the year ended December 31, 2017. The effective tax rate declined for 2018 due to the effects of the lower statutory tax rates enacted by the Tax Act.
The effective rate for 2019 will be impacted by a number of factors, including the re-measurement of the stock warrants at the end of each reporting period. As a result of the warrant re-measurements and related income tax treatment, the overall effective tax can vary significantly from period to period. We estimate that the Company's effective tax rate for 2019, before applying the deductibility of the stock warrant re-measurement and related incentive amortization and the benefit of the stock compensation, will be approximately 25%.
As of December 31, 2018, the Company had operating loss carryforwards for U.S. federal income tax purposes of approximately
$253.8 million
which will begin to expire in 2031 if not utilized before then. We expect to utilize the loss carryforwards to offset federal income tax liabilities in the future. As a result, we do not expect to pay federal income taxes until 2024 or later. The Company may, however, be required to pay minimum taxes and certain state and local income taxes before then. The Company's taxable income earned from international flights is primarily sourced to the United States under international aviation agreements and treaties. When we operate in countries without such agreements, the Company could incur additional foreign income taxes.
33
Discontinued Operations
The financial results of discontinued operations primarily reflect pension, workers' compensation cost adjustments and other benefits for former employees previously associated with ABX's former hub operations, package sorting and aircraft fueling services provided to DHL. Pre-tax gains related to the former sorting operations were
$1.8 million
for 2018 compared to pre-tax losses of
$5.1 million
for 2017. Pre-tax earnings during 2018 were a result of reductions in self- insurance reserves for former employee claims and pension credits. During 2017, pension expense for discontinued operations included a
$7.6 million
pre-tax charge for the settlement of certain retirement obligations through a third party group annuity contract.
2017 compared to 2016
Fleet Summary 2017 & 2016
As of December 31, 2017, ABX and ATI were leasing 19 in-service aircraft internally from CAM for use in ACMI Services. As of December 31, 2017, six of CAM's 29 Boeing 767-200 aircraft shown in the aircraft fleet table above and six of the 21 Boeing 767-300 aircraft were leased to DHL and operated by ABX. Additionally, 12 of CAM's 29 Boeing 767-200 aircraft and eight of CAM's 21 Boeing 767-300 aircraft were leased to ASI and operated by ABX or ATI. CAM leased the other 11 Boeing 767-200 aircraft and seven Boeing 767-300 aircraft to external customers, including four Boeing 767-200 aircraft to DHL that are being operated by a DHL-owned airline. The carrying values of the total in-service fleet as of December 31, 2017, 2016 and 2015 were $955.2 million, $793.9 million and $742.6 million, respectively. The table above does not reflect one Boeing 767-200 passenger aircraft owned by CAM.
Aircraft fleet activity during 2017 is summarized below:
- CAM completed the modification of seven Boeing 767-300 freighter aircraft purchased in the previous year and began to lease five of those aircraft, which are being operated by ATI, under a multi-year lease to ASI. CAM began to lease the sixth aircraft to ATI and the Company leased the seventh aircraft under a multi-year lease to an external customer.
- CAM leased one Boeing 767-300 freighter aircraft, which was modified during 2016, to ASI under a multi-year lease. ATI was separately contracted to operate that aircraft.
- CAM leased one Boeing 767-200 freighter, which was being staged for leasing, to ATI.
- External lessees returned two Boeing 767-200 freighter aircraft which were operated by ABX. Two Boeing 767-200 aircraft were redeployed to external customers.
- CAM purchased eight Boeing 767-300 passenger aircraft during 2017 for the purpose of converting the aircraft into standard freighter configuration. Two of these aircraft completed the freighter modification and entered into multi-year leases with external customers.
- The Company purchased two Boeing 737-400 passenger aircraft during 2017 for the purpose of converting the aircraft into standard freighter configuration. One aircraft completed the freighter modification process and entered into a multi-year lease with an external customer.
As of December 31, 2016, ACMI Services leased 18 of its in-service aircraft internally from CAM. As of December 31, 2016, eight of CAM's 29 Boeing 767-200 aircraft shown in the aircraft fleet table above and six of the 12 Boeing 767-300 aircraft, were leased to DHL and operated by ABX. Additionally, 12 of CAM's 29 Boeing 767-200 aircraft and two of CAM's 12 Boeing 767-300 aircraft were leased to ASI and operated by ABX or ATI. CAM leased the other nine Boeing 767-200 aircraft and four Boeing 767-300 aircraft to external customers, including two Boeing 767-200 aircraft to DHL for operation by a DHL affiliate. Aircraft fleet activity during 2016 is summarized below:
- CAM completed the modification of two Boeing 767-300 freighter aircraft purchased in the previous year and began to lease both aircraft under a multi-year lease to external customers. One of these aircraft is being operated by ABX for the customer.
- CAM purchased eleven Boeing 767-300 passenger aircraft during 2016 for the purpose of converting the aircraft into standard freighter configuration. Two aircraft completed the freighter modification and entered into long-term leases with ASI in 2016, and are both being operated by ATI under multi-year leases. CAM sold one of
34
the eleven aircraft to an external customer during 2016. One aircraft completed the freighter modification and entered into service with ATI during the fourth quarter. This aircraft was subsequently entered into a long-term lease with ASI in January 2017, and is being operated by ATI under a multi-year agreement. The remaining seven Boeing 767-300 passenger aircraft were undergoing or preparing to undergo modification to a standard freighter configuration as of December 31, 2016 and are expected to be completed in 2017.
- In conjunction with the ATSA, ABX and ATI returned a total of ten Boeing 767-200 freighter aircraft to CAM and external lessees returned two Boeing 767-200 freighter aircraft. All twelve were subsequently leased to ASI under multi-year leases. ABX and ATI were separately contracted to operate the aircraft for ASI.
- Five other Boeing 767-200 freighter aircraft were returned from external lessees. Four were subsequently leased to ABX or ATI while one is now being prepped for other leasing.
- ABX returned one Boeing 767-200 freighter and one Boeing 767-300 freighter to CAM, which were subsequently leased to different external lessees. ABX is operating the Boeing 767-300 freighter for the customer.
- ATI ceased operating one DHL-owned Boeing 757-200 freighter aircraft during the third quarter.
CAM
As of December 31, 2017 and 2016, CAM had 51 and 41 aircraft under lease to external customers, respectively. CAM's revenues grew by $14.5 million during 2017 compared to 2016, primarily as a result of additional aircraft leases. Revenues from external customers totaled $140.4 million and $117.6 million for 2017 and 2016, respectively. CAM's revenues from the Company's airlines totaled $69.1 million during 2017, compared to $77.5 million for 2016, reflecting the transition of CAM owned aircraft to long-term leases with external customers. CAM's aircraft leasing and related services revenues, which excludes customer lease incentive amortization, increased $23.9 million in 2017 compared to 2016, primarily as a result of new aircraft leases since mid-2016, additional engine maintenance agreements and the timing of maintenance related revenues. From mid-2016 through the end of December 2017, we have added 13 Boeing 767-300 freighter aircraft and one Boeing 737-400 freighter aircraft to CAM's lease portfolio.
CAM's pre-tax earnings, inclusive of internally allocated interest expense, were $61.5 million and $68.6 million during 2017 and 2016, respectively. Decreased pre-tax earnings reflect a $5.0 million increase in internally allocated interest expense due to higher debt levels, the $9.5 million increase in the amortization of the ASI lease incentive in 2017 compared to 2016, and $15.7 million more depreciation expense driven by the addition of ten Boeing aircraft in 2017 compared to 2016. These increases were partially offset by additional external lease revenues and the timing of customer maintenance revenues.
CAM's agreement to lease 20 Boeing 767 freighter aircraft to ASI includes 12 Boeing 767-200 freighter aircraft for a term of five years and eight Boeing 767-300 freighter aircraft for a term of seven years. Leases for six of these aircraft began in April 2016, and the remaining fourteen were executed by the third quarter of 2017, to fulfill the 20 aircraft requirement.
During 2017, CAM purchased eight 767-300 passenger aircraft for freighter conversion, two of which were leased to external customers during 2017 after completing the conversion process. As of December 31, 2017, the remaining six of these Boeing 767-300 passenger aircraft were being modified from passenger to freighter configuration. The Company also purchased two Boeing 737-400 aircraft during 2017 and one aircraft was being modified from passenger to freighter configuration as of December 31, 2017, while the other was leased to an external customer after completing the conversion process.
ACMI Services
As of December 31, 2017, ACMI Services included 51 in-service aircraft, including 19 leased internally from CAM, 12 CAM-owned freighter aircraft which are under lease to DHL and operated by ABX under the restated CMI agreement, and 20 CAM-owned freighter aircraft which are under lease to ASI and operated by ATI and ABX under the ATSA.
Total revenues from ACMI Services increased $121.9 million during 2017 compared with 2016 to $614.7 million. Airline services revenues from external customers, which do not include revenues for the reimbursement of fuel and
35
certain operating expenses, increased
$48.7 million
. Improved revenues were driven by additional aircraft operations for ASI and reflect a 22% increase in billable block hours. As of December 31, 2017, ACMI Services included the operation of five more CAM-owned aircraft compared to December 31, 2016. Beginning in April 2016, in conjunction with the long-term leases executed between ASI and CAM, the related aircraft rent revenues for five aircraft operated for ASI during the first quarter of 2016 are reflected under CAM instead of ACMI Services.
ACMI Services had pre-tax earnings of $2.5 million during 2017, compared to pre-tax losses of $32.1 million for 2016. Improved pre-tax results in 2017 compared to 2016 were bolstered by expanded revenues, the timing of scheduled airframe maintenance events, lower flight crew and related training expenses and decreased pension expense. Scheduled airframe maintenance expense decreased $5.5 million during 2017 compared to 2016. Airframe maintenance expense varies depending upon the number of C-checks and the scope of the checks required for those airframes scheduled for maintenance. Pension expense for ACMI Services, including the non-service components of retiree benefit costs, decreased $1.0 million as actuarially determined for 2017, compared to 2016. The pension expense in 2017 included a $5.3 million pre-tax charge for the settlement of certain retirement obligations through a third party group annuity contract.
Operating results for ACMI Services were negatively impacted in 2016 by $7.0 million in lost revenue due to a work stoppage by ABX crewmembers represented by the Airline Professionals Association of the International Brotherhood of Teamsters in November 2016. Although the flight crews were ordered back to work within two days through a temporary restraining order issued by a U.S. district court, the full revenue schedule of flying operations did not resume for nearly three weeks. During 2016, we incurred additional costs for flight crews to keep pace with ASI's expanding air network. During 2016, flight crew compensation increased by $13.0 million to pay additional crews while being trained for expanded aircraft operations and when ABX's flight crews stopped volunteering for additional flight time, ABX paid a premium to assign trips to crewmembers and awarded additional compensatory days off.
MRO Services
Total revenues from MRO Services were $205.4 million and $111.9 million for 2017 and 2016, respectively. External customer revenues increased $66.0 million to $106.8 million during 2017 compared to 2016. The increase in revenue was driven by an increase in airframe maintenance and modification revenues due to the addition of Pemco, which was acquired at the end of 2016. The pre-tax earnings from MRO Services increased by $7.4 million to $19.7 million in 2017, reflecting expanded aircraft maintenance and modification services with the addition of Pemco.
Other Activities
External customer revenues from all other activities increased $88.7 million to $206.3 million for 2017. Customer revenues increased due to increased volumes at the USPS and ASI locations. The pre-tax earnings from other activities decreased by $3.9 million to $5.6 million in 2017, reflecting the termination of hub logistics services we provided through May of 2017 for ASI at the airport in Wilmington, Ohio along with reduced aviation fuel sales after ASI discontinued its hub.
Expenses from Continuing Operations
Salaries, wages and benefits expense increased $50.5 million during 2017 compared to 2016 driven by higher headcount for flight operations, maintenance services and package sorting services. The increase in expense for 2017 included $33.6 million for Pemco, acquired in December 2016. The increase during 2017 also included additional line maintenance resources to support our customers expanded network and increased block hours. During 2017, employee benefit expenses increased due to the higher level of headcount.
Depreciation and amortization expense increased $19.1 million during 2017 compared to 2016. The increase in depreciation expense reflects incremental depreciation for 13 Boeing 767-300 aircraft, one Boeing 737-400 aircraft and additional aircraft engines added to the operating fleet since mid-2016, as well as capitalized heavy maintenance and navigation technology upgrades.
Maintenance, materials and repairs expense increased by $22.5 million during 2017 compared to 2016. The increase is primarily due to the addition of Pemco's maintenance and materials, which added $36.4 million of expenses for 2017 compared to 2016. The additional expense from Pemco was partially offset by fewer airframe checks for the Company's airlines and lower airframe maintenance costs for third party customers during 2017 compared to 2016. Aircraft
36
maintenance expenses can vary among periods due to the number of scheduled airframe maintenance checks and the scope of the checks that are performed. In May 2017, our airlines entered into maintenance agreements for certain General Electric CF6 engines that power many of the Boeing 767-300 aircraft leased from CAM. Under the agreement, the engines are maintained by the service provider for a fixed fee per cycle. As a result, beginning in June 2017, the airlines began to record engine maintenance expense as flights occur. As a result, our airlines recorded an additional $4.2 million of engine maintenance expense, partially offset by a reduction to engine depreciation expense.
Fuel expense increased by $62.4 million during 2017 compared to 2016. Fuel expense includes the cost of fuel to operate DoD charters, reimbursable fuel billed to DHL, ASI and other ACMI customers, as well as fuel used to position aircraft for service and for maintenance purposes. The increase in fuel expense was due to a higher level of customer-reimbursed fuel which increased $66.9 million for 2017 compared to 2016. Fuel expense for military customers and other purposes declined due to fewer block hours flown for military customers in 2017.
Contracted ground and aviation services expense includes navigational services, aircraft and cargo handling services and other airport services. Contracted ground and aviation services increased $89.6 million during 2017 compared to 2016. The increase is primarily due to additional logistical support services arranged for ASI gateways.
Travel expense increased by $7.3 million during 2017 compared to 2016. The increase reflects additional airline services and a higher level of employee headcount in airline operations during 2017 compared to 2016.
Landing and ramp expense, which includes the cost of deicing chemicals, increased by $8.8 million during 2017 compared to 2016, driven by additional flight operations. Landing and ramp fees can vary based on the flight schedules and the airports that are used in a period.
Rent expense increased by $2.0 million during 2017 compared to 2016. Rent expense increased due to the acquisition of Pemco, acquired at the end of 2016, as well as increases in aircraft simulators rented to train new flight crews.
Insurance expense increased by $0.4 million during 2017 compared to 2016. Aircraft fleet insurance has increased due to additional aircraft operations during 2017 compared to 2016.
Other operating expenses increased by $7.2 million during 2017 compared to 2016. Other operating expenses include professional fees, employee training and utilities. Other operating expenses during the first quarter of 2016 included a $1.2 million charge for the Company's share of capitalized debt issuance costs that were written off when West Atlantic AB, a non-consolidated affiliate, restructured its debt. Other operating expenses increased by $3.1 million due to the addition of Pemco.
Interest expense increased by $5.7 million during 2017 compared to 2016. Interest expense increased due to a higher average debt level and interest rates on the Company's outstanding loans, offset by more capitalized interest related to our fleet expansion during 2017. Capitalized interest increased $0.5 million during 2017 to $1.8 million. Interest expense in 2017 was also impacted by the convertible notes issued in September 2017. At the time of issuance, the value of the conversion feature of the convertible notes was recorded as a debt discount and is being amortized along with debt issuance cost to interest expense over the seven year term of the convertible notes. The amortization of the debt discount and issuance costs was $2.1 million during 2017.
The Company recorded pre-tax net losses on financial instruments of $79.8 million during the year ended December 31, 2017, compared to losses of $18.1 million during 2016. The losses are primarily a result of re-measuring, as of December 31, 2017 and 2016, the fair value of the stock warrants granted to Amazon. Increases in the fair value of the warrant obligation since the previous re-measurement dates of December 31, 2016 and 2015, respectively, corresponded to an increase in the traded price of the Company's shares and resulted in non-cash losses.
Income tax benefits increased $41.7 million for 2017 compared to 2016. Income tax benefits from earnings from continuing operations for 2017 included a benefit of $59.9 million due to the enactment of the Tax Act in December 2017. The re-measurement of deferred tax balances using the lower federal rates enacted by the Tax Act, resulted in a reduction in our net deferred tax liability and the recognition of a deferred tax benefit. The effective tax rate, before including the effects of the Tax Act, warrant losses and incentive amortization was 37.5% for 2017 compared to 35.3% for the year ended December 31, 2016. The higher effective tax rate for 2017 compared to 2016 reflects a lesser amount of discrete tax benefits related to state income taxes and employee stock incentive awards during 2017 compared to 2016.
37
Discontinued Operations
Pre-tax losses related to the former sorting operations were $5.1 million for 2017 compared to pre-tax gains of $3.8 million for 2016. During 2017, discontinued operations included a $7.6 million pre-tax charge for the settlement of certain retirement obligations through a third party group annuity contract. Pre-tax earnings during 2016 were a result of reductions in self- insurance reserves for former employee claims and pension credits.
FINANCIAL CONDITION, LIQUIDITY AND CAPITAL RESOURCES
Cash Flows
Net cash generated from operating activities totaled
$298.0 million
, $235.0 million and $193.1 million in 2018, 2017 and 2016, respectively. Improved cash flows generated from operating activities during 2018 and 2017, were driven primarily by additional aircraft leases to customers and by increased operating levels of the ACMI Services segment. Cash outlays for pension contributions were
$22.2 million
, $4.5 million and $6.3 million in 2018, 2017 and 2016, respectively.
Capital spending levels were primarily the result of aircraft modification costs and the acquisition of aircraft for freighter modification. Cash payments for capital expenditures were
$292.9 million
, $296.9 million and $264.5 million in 2018, 2017 and 2016, respectively. Capital expenditures in 2018 included $197.1 million for the acquisition of eight Boeing 767-300 aircraft and freighter modification costs; $61.7 million for required heavy maintenance; and $34.1 million for other equipment, including purchases of aircraft engines and rotables. Capital expenditures in 2017 included $209.4 million for the acquisition of eight Boeing 767-300 aircraft and two Boeing 737-400 aircraft and freighter modification costs; $53.3 million for required heavy maintenance; and $34.2 million for other equipment, including purchases of aircraft engines and rotables. Our capital expenditures in 2016 included $185.3 million for the acquisition of eleven Boeing 767-300 aircraft, freighter modification costs and next generation navigation modifications; $30.4 million for required heavy maintenance; and $48.8 million for other equipment, including purchases of aircraft engines and rotables.
Cash proceeds of
$17.6 million
, $0.4 million and $12.4 million were received in 2018, 2017 and 2016, respectively, for the sale of aircraft engines, airframes and parts.
During 2018 and 2017, we spent
$866.6 million
and
$11.8 million
, respectively, to purchase equity interests in other businesses and to acquire Omni. Spending in 2018 included
$855.1 million
for the acquisition of Omni, net of cash acquired. Spending during 2018 and 2017 included entry and subsequent contributions into a joint-venture with Precision Aircraft Solutions, LLC, to develop a passenger-to-freighter conversion program for Airbus A321-200 aircraft.
Net cash provided by financing activities was
$870.5 million
, $79.7 and $75.1 million in 2018, 2017 and 2016, respectively. On November 9, 2018, in conjunction with the Omni acquisition, the Company amended its Senior Credit Agreement to include a new term loan of $675.0 million and drew an additional $180.0 million from the revolving credit facility. We paid related debt issuance cost of $9.5 million during 2018. During 2018, we drew a total
$945.0 million
from the revolving credit facility with the proceeds used to fund the acquisition of Omni and other capital spending. We made debt principal payments of
$58.6 million
. Our borrowing activities were necessary to complete the acquisition of Omni as well as purchase and modify aircraft for deployment into air cargo markets.
In September 2017, we received proceeds of $258.8 million from the issuance of convertible notes. In conjunction with the issuance of convertible notes, we received $38.5 million for the issuance of stock warrants and paid $56.1 million for related convertible note hedges. We paid issuance costs of $6.5 million for these transactions. The net proceeds from these transactions were $234.7 million, of which $205.0 million was used to pay down the balance of our revolving credit facility, thereby increasing the amount available for future draws under that facility. The convertible notes and the related transactions are described further in Note G of the accompanying condensed consolidated financial statements.
During 2018, we spent
$3.6 million
to buy 157,000 shares of the Company's common stock pursuant to a share repurchase plan authorized in 2014. The repurchase plan, which originally authorized the Company to purchase up to $50.0 million of common stock, was amended by the Board in May 2016 to increase such authorization to up to $100 million and amended by the Board again in February 2018 to increase such authorization to up to $150 million. We
38
spent $11.2 million and $63.6 million during 2017 and 2016, respectively, to repurchase shares under the authorized plan.
Commitments
The table below summarizes the Company's contractual obligations and commercial commitments (in thousands) as of December 31, 2018.
|
|
Payments Due By Year
|
||||||||||||||||||
|
Contractual Obligations
|
Total
|
2019
|
2020 and 2021
|
2022 and 2023
|
2024 and after
|
||||||||||||||
|
Debt obligations, including interest payments
|
$
|
1,728,957
|
|
$
|
90,750
|
|
$
|
209,183
|
|
$
|
1,167,727
|
|
$
|
261,297
|
|
||||
|
Facility leases
|
47,983
|
|
10,898
|
|
18,251
|
|
8,373
|
|
10,461
|
|
|||||||||
|
Aircraft and modification obligations
|
53,845
|
|
53,845
|
|
—
|
|
—
|
|
—
|
|
|||||||||
|
Aircraft and other leases
|
21,481
|
|
6,607
|
|
9,870
|
|
3,003
|
|
2,001
|
|
|||||||||
|
Total contractual cash obligations
|
$
|
1,852,266
|
|
$
|
162,100
|
|
$
|
237,304
|
|
$
|
1,179,103
|
|
$
|
273,759
|
|
||||
The long term debt bears interest at
1.125%
to
4.78%
per annum at December 31, 2018. For additional information about the Company's debt obligations, see Note G of the accompanying financial statements.
The Company provides defined benefit pension plans to certain employee groups. The table above does not include cash contributions for pension funding, due to the absence of scheduled maturities. The timing of pension and post-retirement healthcare payments cannot be reasonably determined, except for
$8.5 million
expected to be funded in 2019. For additional information about the Company's pension obligations, see Note J of the accompanying financial statements.
As of December 31, 2018, the Company has
five
aircraft that were in or awaiting the modification process. The Company is committed to induct one more aircraft into the freighter modification process through 2019. Additionally, we placed non-refundable deposits to purchase 20 more Boeing 767-300 passenger aircraft through 2021. We estimate that capital expenditures for 2019 will total $400 million of which the majority will be related to aircraft purchases and freighter modifications. Actual capital spending for any future period will be impacted by aircraft acquisitions, maintenance and modification processes. We expect to finance the capital expenditures from current cash balances, future operating cash flow and the Senior Credit Agreement. The Company outsources a significant portion of the aircraft freighter modification process to a non-affiliated third party. The modification primarily consists of the installation of a standard cargo door and loading system. For additional information about the Company's aircraft modification obligations, see Note I of the accompanying financial statements.
Since August 3, 2017, the Company has been part of a joint-venture with Precision Aircraft Solutions, LLC, to develop a passenger-to-freighter conversion program for Airbus A321-200 aircraft. We anticipate approval of a supplemental type certificate from the FAA in 2020. We expect to make contributions equal to the Company's 49% ownership percentage of the program's total costs during 2019.
Liquidity
The Company has a Senior Credit Agreement with a consortium of banks that includes two unsubordinated term loans of
$721.4 million
, net of debt issuance costs, and a revolving credit facility from which the Company has drawn
$475.0 million
, net of repayments, as of December 31, 2018. The revolving credit facility has a capacity of
$545.0 million
, permitted additional indebtedness of
$300.0 million
of which
$258.8 million
has been utilized for the issuance of convertible notes, and an accordion feature whereby the Company can draw up to an additional
$400.0 million
subject to the lenders' consent. The Senior Credit Agreement is collateralized by the Company's fleet of Boeing 777, 767 and 757 freighter aircraft. Under the terms of the Senior Credit Agreement, the Company is required to maintain collateral coverage equal to
110%
of the outstanding balances of the term loans and the total funded revolving credit facility. The minimum collateral coverage which must be maintained is
50%
of the outstanding balance of the term loan plus the revolving credit facility commitment, which was
$545.0 million
. Each year, through May 6, 2019, the Company may request a one year extension of the final maturity date, subject to the lenders' consent. Absent such future extensions, the maturity date is currently set to expire on May 30, 2023.
39
Under the Senior Credit Agreement, the Company is subject to covenants and warranties that are usual and customary including, among other things, limitations on certain additional indebtedness, guarantees of indebtedness, as well as a total debt-to-EBITDA (earnings before interest, taxes, depreciation and amortization expenses) ratio and a fixed charge coverage ratio. The Senior Credit Agreement stipulates events of default including unspecified events that may have a material adverse effect on the Company. If an event of default occurs, the Company may be forced to repay, renegotiate or replace the Senior Credit Agreement.
Additional debt or lower EBITDA may result in higher interest rates. Under the Senior Credit Agreement, interest rates are adjusted quarterly based on the prevailing LIBOR or prime rates and a ratio of the Company's outstanding debt level to EBITDA. At the Company's current debt-to-EBITDA ratio, the unsubordinated term loans and the revolving credit facility bear variable interest rates of
4.78%
,
4.64%
and
4.78%
, respectively.
At December 31, 2018, the Company had
$59.3 million
of cash balances. The Company had
$57.9 million
available under the revolving credit facility, net of outstanding letters of credit, which totaled
$12.1 million
. Also, the Company has up to $400 million of additional borrowing capacity available under the accordion feature of its Senior Credit Agreement, subject to lender consent. We believe that the Company's current cash balances and forecasted cash flows provided from its operating agreements, combined with its Senior Credit Agreement, will be sufficient to fund operations, capital spending, scheduled debt payments and required pension funding for at least the next 12 months.
Off-Balance Sheet Arrangements
As part of our ongoing business, we do not participate in transactions that generate relationships with unconsolidated entities or financial partnerships, such as entities often referred to as structured finance or special purpose entities (“SPEs”), which would have been established for the purpose of facilitating off-balance sheet arrangements or other contractually narrow or limited purposes. As of
December 31, 2018
and
2017
, we were not involved in any material unconsolidated SPE transactions.
Certain of our operating leases and agreements contain indemnification obligations to the lessor or one or more other parties that are considered usual and customary (e.g. use, tax and environmental indemnifications), the terms of which range in duration and are often limited. Such indemnification obligations may continue after the expiration of the respective lease or agreement. No amounts have been recognized in our financial statements for the underlying fair value of guarantees and indemnifications.
CRITICAL ACCOUNTING POLICIES AND ESTIMATES
“Management’s Discussion and Analysis of Financial Condition and Results of Operations,” as well as certain disclosures included elsewhere in this report, are based upon our consolidated financial statements, which have been prepared in accordance with accounting principles generally accepted in the United States of America. The preparation of these financial statements requires us to select appropriate accounting policies and make estimates and judgments that affect the reported amounts of assets, liabilities, revenues and expenses, and related disclosures of contingencies. In certain cases, there are alternative policies or estimation techniques which could be selected. On an ongoing basis, we evaluate our selection of policies and the estimation techniques we use, including those related to revenue recognition, post-retirement liabilities, bad debts, self-insurance reserves, valuation of spare parts inventory, useful lives, salvage values and impairment of property and equipment, income taxes, contingencies and litigation. We base our estimates on historical experience, current conditions and on various other assumptions that are believed to be reasonable under the circumstances. Those factors form the basis for making judgments about the carrying values of assets and liabilities that are not readily apparent from other sources, as well as for identifying and assessing our accounting treatment with respect to commitments and contingencies. Actual results may differ from these estimates under different assumptions or conditions. We believe the following significant and critical accounting policies involve the more significant judgments and estimates used in preparing the consolidated financial statements.
Revenue Recognition
Aircraft lease revenues are recognized as operating lease revenues on a straight-line basis over the term of the applicable lease agreements. Revenues generated from airline service agreements are typically recognized based on hours flown or the amount of aircraft and crew resources provided during a reporting period. Certain agreements include provisions for incentive payments based upon on-time reliability. These incentives are typically measured on
40
a monthly basis and recorded to revenue in the corresponding month earned. Revenues for operating expenses that are reimbursed through airline service agreements, including consumption of aircraft fuel, are generally recognized as the costs are incurred, on a net basis. Revenues from charter service agreements are recognized on scheduled and non-scheduled flights when the specific flight has been completed. Revenues from the sale of aircraft parts and engines are recognized when the parts are delivered. Effective January 1, 2018 the Company records revenues and estimated earnings for its airframe maintenance and aircraft modification contracts using the percentage-of-completion cost input method. Prior to January 1, 2018, revenues earned and expenses incurred in providing aircraft-related maintenance, repair or modification services were usually recognized in the period in which the services were completed and delivered to the customer. Revenues derived from sorting parcels are recognized in the reporting period in which the services are performed.
Goodwill and Intangible Assets
We assess in the fourth quarter of each year whether the Company’s goodwill acquired in acquisitions is impaired in accordance with the Financial Accounting Standards Board Accounting Standards Codification (“FASB ASC”) Topic 350-20
Intangibles—Goodwill and Other
. Additional assessments may be performed on an interim basis whenever events or changes in circumstances indicate an impairment may have occurred. Indefinite-lived intangible assets are not amortized but are assessed for impairment annually, or more frequently if impairment indicators occur. Finite-lived intangible assets are amortized over their estimated useful economic lives and are periodically reviewed for impairment.
The goodwill impairment test requires significant judgment, including the determination of the fair value of each reporting unit that has goodwill. We estimate the fair value using a market approach and an income approach utilizing discounted cash flows applied to a market-derived rate of return. The market approach utilizes market multiples from comparable publicly traded companies. The market multiples include revenues and EBITDA (earnings before interest, taxes, depreciation and amortization). We derive cash flow assumptions from many factors including recent market trends, expected revenues, cost structure, aircraft maintenance schedules and long term strategic plans for the deployment of aircraft. Key assumptions under the discounted cash flow models include projections for the number of aircraft in service, capital expenditures, long term growth rates, operating cash flows and market-derived discount rates.
The performance of the goodwill impairment test is the comparison of the fair value of the reporting unit to its respective carrying value. If the carrying value of a reporting unit is less than its fair value no impairment exists. If the carrying value of a reporting unit is higher than its fair value an impairment loss is recorded for the difference and charged to operations. See additional information about the goodwill impairment tests in Note C of the accompanying consolidated financial statements.
We have used the assistance of an independent business valuation firm in estimating an expected market rate of return, and in the development of a market approach for CAM, OAI and Pemco, separately, using multiples of EBITDA and revenues from comparable publicly traded companies. Based on our analysis, the individual fair values of CAM, OAI and Pemco exceeded their respective carrying values as of December 31, 2018. Our key assumptions used for CAM's goodwill testing include uncertainties, including the level of demand for cargo aircraft by shippers, the DoD and freight forwarders and CAM's ability to lease aircraft and the lease rates that will be realized. The demand for customer airlift is projected based on input from customers, management's interface with customer planning personnel and aircraft utilization trends. Our key assumptions used for OAI's goodwill testing include the number of aircraft that OAI will operate, the amount of revenues that the aircraft will generate, the number of flight crews and cost of flight crews needed. Our key assumptions used for Pemco's goodwill testing include the level of revenues that customers will seek from Pemco and the cost of labor and contract resources Pemco is expected to incur. Certain events or changes in circumstances could negatively impact our key assumptions. Customer preferences may be impacted by changes in aviation fuel prices. Key customers, including DHL, Amazon and the DoD, may decide that they do not need as many aircraft as projected or may find alternative providers.
Long-lived assets
Aircraft and other long-lived assets are tested for impairment whenever events or changes in circumstances indicate the carrying value of the assets may not be recoverable. Factors which may cause an impairment include termination of aircraft from a customer's network, extended operating cash flow losses from the assets and management's decisions regarding the future use of assets. To conduct impairment testing, we group assets and liabilities at the lowest level for which identifiable cash flows are largely independent of cash flows of other assets and liabilities. For assets that are to be held and used, impairment is recognized when the estimated undiscounted cash flows associated with an asset
41
group is less than the carrying value. If impairment exists, an adjustment is made to write the assets down to fair value, and a loss is recorded as the difference between the carrying value and fair value. Fair values are determined considering quoted market values, discounted cash flows or internal and external appraisals, as applicable.
Depreciation
Depreciation of property and equipment is provided on a straight-line basis over the lesser of an asset’s useful life or lease term. We periodically evaluate the estimated service lives and residual values used to depreciate our property and equipment. The acceleration of depreciation expense or the recording of significant impairment losses could result from changes in the estimated useful lives of our assets. We may change the estimated useful lives due to a number of reasons, such as the existence of excess capacity in our air networks, or changes in regulations grounding or limiting the use of aircraft.
Self-Insurance
We self-insure certain claims related to workers’ compensation, aircraft, automobile, general liability and employee healthcare. We record a liability for reported claims and an estimate for incurred claims that have not yet been reported. Accruals for these claims are estimated utilizing historical paid claims data and recent claims trends. Changes in claim severity and frequency could result in actual claims being materially different than the costs provided for in our results of operations. We maintain excess claim coverage with common insurance carriers to mitigate our exposure to large claim losses.
Contingencies
We are involved in legal matters that have a degree of uncertainty associated with them. We continually assess the likely outcomes of these matters and the adequacy of amounts, if any, provided for these matters. There can be no assurance that the ultimate outcome of these matters will not differ materially from our assessment of them. There also can be no assurance that we know all matters that may be brought against us at any point in time.
Income Taxes
We account for income taxes under the provisions of FASB ASC Topic 740-10
Income Taxes
. The objectives of accounting for income taxes are to recognize the amount of taxes payable or refundable for the current year and deferred tax liabilities and assets for the future tax consequences of events that have been recognized in the Company’s financial statements or tax returns. Judgment is required in assessing the future tax consequences of events that have been recognized in the Company’s financial statements or tax returns. Fluctuations in the actual outcome of expected future tax consequences could materially impact the Company’s financial position or its results of operations.
The Company has significant deferred tax assets including net operating loss carryforwards (“NOL CFs”) for federal income tax purposes which begin to expire in 2031. Based upon projections of taxable income, we determined that it was more likely than not that the NOL CF’s will be realized prior to their expiration. Accordingly, we do not have an allowance against these deferred tax assets at this time.
We recognize the impact of a tax position, if that position is more likely than not of being sustained on audit, based on the technical merits of the position.
Stock Warrants
The Company’s accounting for warrants issued to a lessee is determined in accordance with the financial reporting guidance for equity-based payments to non-employees and for financial instruments. The warrants issued to lessees are recorded as a lease incentive asset using their fair value at the time that the lessee has met its performance obligation. The lease incentive is amortized against revenues over the duration of related aircraft leases. The unexercised warrants are classified in liabilities and re-measured to fair value at the end of each reporting period, resulting in a non-operating gain or loss.
Post-retirement Obligations
The Company sponsors qualified defined benefit pension plans for ABX’s flight crewmembers and other eligible employees. The Company also sponsors non-qualified, unfunded excess plans that provide benefits to executive management and crewmembers that are in addition to amounts permitted to be paid through our qualified plans under
42
provisions of the tax laws. Employees are no longer accruing benefits under any of the defined benefit pension plans. The Company also sponsors unfunded post-retirement healthcare plans for ABX’s flight crewmembers.
The accounting and valuation for these post-retirement obligations are determined by prescribed accounting and actuarial methods that consider a number of assumptions and estimates. The selection of appropriate assumptions and estimates is significant due to the long time period over which benefits will be accrued and paid. The long term nature of these benefit payouts increases the sensitivity of certain estimates on our post-retirement costs. In actuarially valuing our pension obligations and determining related expense amounts, key assumptions include discount rates, expected long term investment returns, retirement ages and mortality. Actual results and future changes in these assumptions could result in future costs that are materially different than those recorded in our annual results of operations.
Our actuarial valuation includes an assumed long term rate of return on pension plan assets of 6.20%. Our assumed rate of return is based on a targeted long term investment allocation of 30% equity securities, 65% fixed income securities and 5% cash. The actual asset allocation at December 31, 2018 was 25% equities, 74% fixed income and 1% cash. The pension trust includes $4.6 million of investments (1% of the plans' assets) whose fair values have been estimated in the absence of readily determinable fair values. Such investments include private equity, hedge fund investments and real estate funds. Management’s estimates are based on information provided by the fund managers or general partners of those funds.
In evaluating our assumptions regarding expected long term investment returns on plan assets, we consider a number of factors, including our historical plan returns in connection with our asset allocation policies, assistance from investment consultants hired to provide oversight over our actively managed investment portfolio, and long term inflation assumptions. The selection of the expected return rate materially affects our pension costs. Our expected long term rate of return was 6.20% after analyzing expected returns on investment vehicles and considering our long term asset allocation expectations. Fluctuations in long-term interest rates can have an impact on the actual rate of return. If we were to lower our long term rate of return assumption by a hypothetical 100 basis points, expense in 2018 would be increased by approximately $6.1 million. We use a market value of assets as of the measurement date for determining pension expense.
In selecting the interest rate to discount estimated future benefit payments that have been earned to date to their net present value (defined as the projected benefit obligation), we match the plan’s benefit payment streams to high-quality bonds of similar maturities. The selection of the discount rate not only affects the reported funded status information as of December 31 (as shown in Note J to the accompanying consolidated financial statements), but also affects the succeeding year’s pension and post-retirement healthcare expense. The discount rates selected for December 31, 2018, based on the method described above, were 4.65% for crewmembers and 4.65% for non-crewmembers. If we were to lower our discount rates by a hypothetical 50 basis points, pension expense in 2018 would be increased by approximately $7.2 million.
Our mortality assumptions at December 31, 2018, reflect the most recent projections released by the Actuaries Retirement Plans Experience Committee, a committee within the Society of Actuaries, a professional association in North America. The assumed future increase in salaries and wages is not a significant estimate in determining pension costs because each defined benefit pension plan was frozen during 2009 with respect to additional benefit accruals.
The following table illustrates the sensitivity of the aforementioned assumptions on our pension expense, pension obligation and accumulated other comprehensive income (in thousands):
|
|
Effect of change
|
||||||||||
|
|
|
December 31, 2018
|
|||||||||
|
Change in assumption
|
2018
Pension
expense
|
Pension obligation
|
Accumulated
other
comprehensive
income (pre-tax)
|
||||||||
|
100 basis point decrease in rate of return
|
$
|
6,116
|
|
$
|
—
|
|
$
|
—
|
|
||
|
50 basis point decrease in discount rate
|
7,187
|
|
(41,348
|
)
|
41,348
|
|
|||||
|
Aggregate effect of all the above changes
|
13,303
|
|
(41,348
|
)
|
41,348
|
|
|||||
43
New Accounting Pronouncements
For information regarding recently issued accounting pronouncements and the expected impact on our annual statements, see Note A "SUMMARY OF FINANCIAL STATEMENT PREPARATION AND SIGNIFICANT ACCOUNTING POLICIES" in the accompanying notes to Consolidated Financial Statements included in Part II, Item 8 of this Form 10-K.
ITEM 7A. QUANTITATIVE AND QUALITATIVE DISCLOSURES ABOUT MARKET RISK
The Company is exposed to market risk for changes in interest rates.
The Company's Senior Credit Agreement requires the Company to maintain derivative instruments for fluctuating interest rates, for at least fifty percent of the outstanding balance of the original unsubordinated term loan and twenty-five percent of the outstanding balance of the second term loan issued in November 2018. Accordingly, in February 2016, the Company entered into an interest rate swap instrument. Additionally, the Company entered into more interest rate swaps in February 2017, April 2017, June 2017 and December 2018, respectively. As a result, future fluctuations in LIBOR interest rates will result in the recording of unrealized gains and losses on interest rate derivatives held by the Company. The combined notional values were
$331.3 million
as of December 31, 2018. See Note H in the accompanying consolidated financial statements for a discussion of our accounting treatment for these hedging transactions.
As of December 31, 2018, the Company has
$204.8 million
of fixed interest rate convertible debt and
$1,196.4 million
of variable interest rate debt outstanding. Variable interest rate debt exposes us to differences in future cash flows resulting from changes in market interest rates. Variable interest rate risk can be quantified by estimating the change in annual cash flows resulting from a hypothetical 20% increase in interest rates. A hypothetical 20% increase or decrease in interest rates would have resulted in a change in interest expense of approximately $5.1 million for the year ended December 31, 2018.
The convertible debt issued at fixed interest rates is exposed to fluctuations in fair value resulting from changes in market interest rates. Fixed interest rate risk can be quantified by estimating the increase in fair value of our long term convertible debt through a hypothetical 20% increase in interest rates. As of December 31, 2018, a 20% increase in interest rates would have decreased the fair value of our fixed interest rate convertible debt by approximately $0.6 million.
The Company is exposed to concentration of credit risk primarily through cash deposits, cash equivalents, marketable securities and derivatives. As part of its risk management process, the Company monitors and evaluates the credit standing of the financial institutions with which it does business. The financial institutions with which it does business are generally highly rated. The Company is exposed to counterparty risk, which is the loss it could incur if a counterparty to a derivative contract defaulted.
As of December 31, 2018, the Company's liabilities reflected
14.83 million
stock warrants issued to a customer. The fair value of the stock warrant obligation is re-measured at the end of each reporting period and marked to market. The fair value of the stock warrant is dependent on a number of factors which change, including the Company's common stock price, the volatility of the Company’s common stock and the risk-free interest rate. See Note E in the accompanying consolidated financial statements for further information about the fair value of the stock warrants
The Company sponsors defined benefit pension plans and post-retirement healthcare plans for certain eligible employees. The Company's related pension expense, plans' funded status, and funding requirements are sensitive to changes in interest rates. The funded status of the plans and the annual pension expense is recalculated at the beginning of each calendar year using the fair value of plan assets. market-based interest rates at that point in time, as well as assumptions for asset returns and other actuarial assumptions. Higher interest rates could result in a lower fair value of plan assets and increased pension expense in the following years. At December 31, 2018, ABX's defined benefit pension plans had total investment assets of $625.6 million under investment management. See Note J in the accompanying consolidated financial statements for further discussion of these assets.
The Company is exposed to market risk for changes in the price of jet fuel. The risk associated with jet fuel, however, is largely mitigated by reimbursement through the agreements with its customers.
44
ITEM 8. FINANCIAL STATEMENTS AND SUPPLEMENTARY DATA
Index to Consolidated Financial Statements
|
|
Page
|
45
REPORT OF INDEPENDENT REGISTERED PUBLIC ACCOUNTING FIRM
To the stockholders and the Board of Directors of Air Transport Services Group, Inc.
Opinion on the Financial Statements
We have audited the accompanying consolidated balance sheets of Air Transport Services Group, Inc. and subsidiaries (the "Company") as of December 31, 2018 and 2017, the related consolidated statements of operations, comprehensive income, cash flows, and stockholders' equity, for each of the three years in the period ended December 31, 2018, and the related notes and the schedule listed in the Table of Contents at Item 15a (2) (collectively referred to as the "financial statements"). In our opinion, the financial statements present fairly, in all material respects, the financial position of the Company as of December 31, 2018 and 2017, and the results of its operations and its cash flows for each of the three years in the period ended December 31, 2018, in conformity with accounting principles generally accepted in the United States of America.
We have also audited, in accordance with the standards of the Public Company Accounting Oversight Board (United States) (PCAOB), the Company's internal control over financial reporting as of December 31, 2018, based on criteria established in Internal Control - Integrated Framework (2013) issued by the Committee of Sponsoring Organizations of the Treadway Commission and our report dated March 1, 2019, expressed an unqualified opinion on the Company's internal control over financial reporting.
Change in Accounting Principle
As discussed in Note A to the financial statements, the Company has changed its method of accounting for revenue from contracts with customers in fiscal year 2018 due to the adoption of the new revenue standard. The Company adopted the new revenue standard using the modified retrospective approach.
Emphasis of a Matter
As discussed in Note D to the consolidated financial statements, the Company's three principal customers account for a substantial portion of the Company's revenue. The Company's financial security is dependent on its ongoing relationship with its three principal customers existing as of December 31, 2018.
Basis for Opinion
These financial statements are the responsibility of the Company's management. Our responsibility is to express an opinion on the Company's financial statements based on our audits. We are a public accounting firm registered with the PCAOB and are required to be independent with respect to the Company in accordance with the U.S. federal securities laws and the applicable rules and regulations of the Securities and Exchange Commission and the PCAOB.
We conducted our audits in accordance with the standards of the PCAOB. Those standards require that we plan and perform the audit to obtain reasonable assurance about whether the financial statements are free of material misstatement, whether due to error or fraud. Our audits included performing procedures to assess the risks of material misstatement of the financial statements, whether due to error or fraud, and performing procedures that respond to those risks. Such procedures included examining, on a test basis, evidence regarding the amounts and disclosures in the financial statements. Our audits also included evaluating the accounting principles used and significant estimates made by management, as well as evaluating the overall presentation of the financial statements. We believe that our audits provide a reasonable basis for our opinion.
/s/ DELOITTE & TOUCHE LLP
Cincinnati, Ohio
March 1, 2019
We have served as the Company's auditor since 2002.
46
AIR TRANSPORT SERVICES GROUP, INC. AND SUBSIDIARIES
CONSOLIDATED BALANCE SHEETS
(In thousands, except share data)
|
|
December 31,
|
December 31,
|
|||||
|
|
2018
|
2017
|
|||||
|
ASSETS
|
|||||||
|
CURRENT ASSETS:
|
|||||||
|
Cash, cash equivalents and restricted cash
|
$
|
59,322
|
|
$
|
32,699
|
|
|
|
Accounts receivable, net of allowance of $1,444 in 2018 and $2,445 in 2017
|
147,755
|
|
109,114
|
|
|||
|
Inventory
|
33,536
|
|
22,169
|
|
|||
|
Prepaid supplies and other
|
18,608
|
|
20,521
|
|
|||
|
TOTAL CURRENT ASSETS
|
259,221
|
|
184,503
|
|
|||
|
Property and equipment, net
|
1,555,005
|
|
1,159,962
|
|
|||
|
Lease incentive
|
63,780
|
|
80,684
|
|
|||
|
Goodwill and acquired intangibles
|
535,359
|
|
44,577
|
|
|||
|
Convertible note hedges
|
—
|
|
53,683
|
|
|||
|
Other assets
|
57,220
|
|
25,435
|
|
|||
|
TOTAL ASSETS
|
$
|
2,470,585
|
|
$
|
1,548,844
|
|
|
|
LIABILITIES AND STOCKHOLDERS’ EQUITY
|
|||||||
|
CURRENT LIABILITIES:
|
|||||||
|
Accounts payable
|
$
|
109,843
|
|
$
|
99,728
|
|
|
|
Accrued salaries, wages and benefits
|
50,932
|
|
40,127
|
|
|||
|
Accrued expenses
|
19,623
|
|
10,455
|
|
|||
|
Current portion of debt obligations
|
29,654
|
|
18,512
|
|
|||
|
Unearned revenue
|
19,082
|
|
15,850
|
|
|||
|
TOTAL CURRENT LIABILITIES
|
229,134
|
|
184,672
|
|
|||
|
Long term debt
|
1,371,598
|
|
497,246
|
|
|||
|
Convertible note obligations
|
—
|
|
54,359
|
|
|||
|
Stock warrant obligations
|
203,782
|
|
211,136
|
|
|||
|
Post-retirement obligations
|
64,485
|
|
61,355
|
|
|||
|
Other liabilities
|
51,905
|
|
45,353
|
|
|||
|
Deferred income taxes
|
113,243
|
|
99,444
|
|
|||
|
TOTAL LIABILITIES
|
2,034,147
|
|
1,153,565
|
|
|||
|
Commitments and contingencies (Note I)
|
|
|
|||||
|
STOCKHOLDERS’ EQUITY:
|
|||||||
|
Preferred stock, 20,000,000 shares authorized, including 75,000 Series A Junior Participating Preferred Stock
|
—
|
|
—
|
|
|||
|
Common stock, par value $0.01 per share; 110,000,000 shares authorized; 59,134,173 and 59,057,195 shares issued and outstanding in 2018 and 2017, respectively
|
591
|
|
591
|
|
|||
|
Additional paid-in capital
|
471,158
|
|
471,456
|
|
|||
|
Accumulated earnings (deficit)
|
56,051
|
|
(13,748
|
)
|
|||
|
Accumulated other comprehensive loss
|
(91,362
|
)
|
(63,020
|
)
|
|||
|
TOTAL STOCKHOLDERS’ EQUITY
|
436,438
|
|
395,279
|
|
|||
|
TOTAL LIABILITIES AND STOCKHOLDERS’ EQUITY
|
$
|
2,470,585
|
|
$
|
1,548,844
|
|
|
See notes to consolidated financial statements.
47
AIR TRANSPORT SERVICES GROUP, INC. AND SUBSIDIARIES
CONSOLIDATED STATEMENTS OF OPERATIONS
(In thousands, except per share data)
|
|
Year Ended December 31
|
||||||||||
|
|
2018
|
2017
|
2016
|
||||||||
|
REVENUES
|
$
|
892,345
|
|
$
|
1,068,200
|
|
$
|
768,870
|
|
||
|
OPERATING EXPENSES
|
|||||||||||
|
Salaries, wages and benefits
|
300,514
|
|
276,106
|
|
224,852
|
|
|||||
|
Depreciation and amortization
|
178,895
|
|
154,556
|
|
135,496
|
|
|||||
|
Maintenance, materials and repairs
|
146,692
|
|
141,575
|
|
119,123
|
|
|||||
|
Fuel
|
39,293
|
|
149,579
|
|
87,134
|
|
|||||
|
Contracted ground and aviation services
|
16,640
|
|
147,092
|
|
57,491
|
|
|||||
|
Travel
|
34,443
|
|
27,390
|
|
20,048
|
|
|||||
|
Landing and ramp
|
5,968
|
|
22,271
|
|
13,455
|
|
|||||
|
Rent
|
13,899
|
|
13,629
|
|
11,625
|
|
|||||
|
Insurance
|
6,112
|
|
4,820
|
|
4,456
|
|
|||||
|
Transaction fees
|
5,264
|
|
—
|
|
—
|
|
|||||
|
Other operating expenses
|
33,607
|
|
31,782
|
|
24,627
|
|
|||||
|
781,327
|
|
968,800
|
|
698,307
|
|
||||||
|
OPERATING INCOME
|
111,018
|
|
99,400
|
|
70,563
|
|
|||||
|
OTHER INCOME (EXPENSE)
|
|||||||||||
|
Interest income
|
251
|
|
116
|
|
131
|
|
|||||
|
Non-service component of retiree benefit (costs) gains
|
8,180
|
|
(6,105
|
)
|
(6,815
|
)
|
|||||
|
Net gain (loss) on financial instruments
|
7,296
|
|
(79,789
|
)
|
(18,107
|
)
|
|||||
|
Loss from non-consolidated affiliate
|
(10,468
|
)
|
(3,135
|
)
|
—
|
|
|||||
|
Interest expense
|
(28,799
|
)
|
(17,023
|
)
|
(11,318
|
)
|
|||||
|
(23,540
|
)
|
(105,936
|
)
|
(36,109
|
)
|
||||||
|
EARNINGS (LOSS) FROM CONTINUING OPERATIONS BEFORE INCOME TAXES
|
87,478
|
|
(6,536
|
)
|
34,454
|
|
|||||
|
INCOME TAX BENEFIT (EXPENSE)
|
(19,595
|
)
|
28,276
|
|
(13,394
|
)
|
|||||
|
EARNINGS FROM CONTINUING OPERATIONS
|
67,883
|
|
21,740
|
|
21,060
|
|
|||||
|
EARNINGS (LOSS) FROM DISCONTINUED OPERATIONS, NET OF TAXES
|
1,402
|
|
(3,245
|
)
|
2,428
|
|
|||||
|
NET EARNINGS
|
$
|
69,285
|
|
$
|
18,495
|
|
$
|
23,488
|
|
||
|
BASIC EARNINGS (LOSS) PER SHARE
|
|||||||||||
|
Continuing operations
|
$
|
1.16
|
|
$
|
0.37
|
|
$
|
0.34
|
|
||
|
Discontinued operations
|
0.02
|
|
(0.06
|
)
|
0.04
|
|
|||||
|
TOTAL BASIC EARNINGS PER SHARE
|
$
|
1.18
|
|
$
|
0.31
|
|
$
|
0.38
|
|
||
|
DILUTED EARNINGS (LOSS) PER SHARE
|
|||||||||||
|
Continuing operations
|
$
|
0.89
|
|
$
|
0.36
|
|
$
|
0.33
|
|
||
|
Discontinued operations
|
0.02
|
|
(0.05
|
)
|
0.04
|
|
|||||
|
TOTAL DILUTED EARNINGS PER SHARE
|
$
|
0.91
|
|
$
|
0.31
|
|
$
|
0.37
|
|
||
|
WEIGHTED AVERAGE SHARES
|
|||||||||||
|
Basic
|
58,765
|
|
58,907
|
|
61,330
|
|
|||||
|
Diluted
|
68,356
|
|
59,686
|
|
62,994
|
|
|||||
See notes to consolidated financial statements.
48
AIR TRANSPORT SERVICES GROUP, INC. AND SUBSIDIARIES
CONSOLIDATED STATEMENTS OF COMPREHENSIVE INCOME
(In thousands)
|
Years Ended December 31
|
|||||||||||
|
2018
|
2017
|
2016
|
|||||||||
|
NET EARNINGS
|
$
|
69,285
|
|
$
|
18,495
|
|
$
|
23,488
|
|
||
|
OTHER COMPREHENSIVE INCOME (LOSS):
|
|||||||||||
|
Defined Benefit Pension
|
(28,467
|
)
|
16,513
|
|
20,214
|
|
|||||
|
Defined Benefit Post-Retirement
|
256
|
|
204
|
|
(986
|
)
|
|||||
|
Foreign Currency Translation
|
(131
|
)
|
129
|
|
(82
|
)
|
|||||
|
TOTAL COMPREHENSIVE INCOME (LOSS), net of tax
|
$
|
40,943
|
|
$
|
35,341
|
|
$
|
42,634
|
|
||
See notes to consolidated financial statements.
49
AIR TRANSPORT SERVICES GROUP, INC. AND SUBSIDIARIES
CONSOLIDATED STATEMENTS OF CASH FLOWS
(In thousands)
|
Years Ended December 31
|
|||||||||||
|
|
2018
|
2017
|
2016
|
||||||||
|
OPERATING ACTIVITIES:
|
|||||||||||
|
Net earnings (loss) from continuing operations
|
$
|
67,883
|
|
$
|
21,740
|
|
$
|
21,060
|
|
||
|
Net earnings (loss) from discontinued operations
|
1,402
|
|
(3,245
|
)
|
2,428
|
|
|||||
|
Adjustments to reconcile net earnings to net cash provided by operating activities:
|
|||||||||||
|
Depreciation and amortization
|
204,559
|
|
170,751
|
|
140,002
|
|
|||||
|
Pension and post-retirement
|
3,766
|
|
20,933
|
|
11,532
|
|
|||||
|
Deferred income taxes
|
18,986
|
|
(30,771
|
)
|
13,807
|
|
|||||
|
Amortization of stock-based compensation
|
5,047
|
|
3,632
|
|
3,165
|
|
|||||
|
Net (gain) loss on financial instruments
|
(7,296
|
)
|
79,789
|
|
18,107
|
|
|||||
|
Changes in assets and liabilities:
|
|||||||||||
|
Accounts receivable
|
25,380
|
|
(31,313
|
)
|
(9,597
|
)
|
|||||
|
Inventory and prepaid supplies
|
(3,273
|
)
|
(4,107
|
)
|
(5,269
|
)
|
|||||
|
Accounts payable
|
10,724
|
|
23,500
|
|
5,603
|
|
|||||
|
Unearned revenue
|
(3,824
|
)
|
(7,331
|
)
|
(3,216
|
)
|
|||||
|
Accrued expenses, salaries, wages, benefits and other liabilities
|
3,605
|
|
780
|
|
5,678
|
|
|||||
|
Pension and post-retirement assets
|
(35,293
|
)
|
(13,083
|
)
|
(11,819
|
)
|
|||||
|
Other
|
6,359
|
|
3,717
|
|
1,611
|
|
|||||
|
NET CASH PROVIDED BY OPERATING ACTIVITIES
|
298,025
|
|
234,992
|
|
193,092
|
|
|||||
|
INVESTING ACTIVITIES:
|
|||||||||||
|
Expenditures for property and equipment
|
(292,915
|
)
|
(296,939
|
)
|
(264,477
|
)
|
|||||
|
Proceeds from property and equipment
|
17,570
|
|
381
|
|
12,380
|
|
|||||
|
Acquisitions and investments in businesses, net of cash acquired
|
(866,558
|
)
|
(11,792
|
)
|
(17,395
|
)
|
|||||
|
Redemption of long term deposits
|
—
|
|
9,975
|
|
—
|
|
|||||
|
NET CASH (USED IN) INVESTING ACTIVITIES
|
(1,141,903
|
)
|
(298,375
|
)
|
(269,492
|
)
|
|||||
|
FINANCING ACTIVITIES:
|
|||||||||||
|
Principal payments on long term obligations
|
(58,640
|
)
|
(254,446
|
)
|
(44,069
|
)
|
|||||
|
Proceeds from borrowings
|
945,000
|
|
115,000
|
|
185,000
|
|
|||||
|
Payments for financing costs
|
(9,953
|
)
|
(7,887
|
)
|
—
|
|
|||||
|
Proceeds from convertible notes
|
—
|
|
258,750
|
|
—
|
|
|||||
|
Purchase convertible note hedges
|
—
|
|
(56,097
|
)
|
—
|
|
|||||
|
Proceeds from issuance of warrants
|
—
|
|
38,502
|
|
—
|
|
|||||
|
Purchase of common stock
|
(3,581
|
)
|
(11,184
|
)
|
(63,570
|
)
|
|||||
|
Withholding taxes paid for conversion of employee stock awards
|
(2,325
|
)
|
(2,914
|
)
|
(2,300
|
)
|
|||||
|
NET CASH PROVIDED BY FINANCING ACTIVITIES
|
870,501
|
|
79,724
|
|
75,061
|
|
|||||
|
NET INCREASE (DECREASE) IN CASH AND CASH EQUIVALENTS
|
26,623
|
|
16,341
|
|
(1,339
|
)
|
|||||
|
CASH AND CASH EQUIVALENTS AT BEGINNING OF YEAR
|
32,699
|
|
16,358
|
|
17,697
|
|
|||||
|
CASH AND CASH EQUIVALENTS AT END OF PERIOD
|
$
|
59,322
|
|
$
|
32,699
|
|
$
|
16,358
|
|
||
|
SUPPLEMENTAL CASH FLOW INFORMATION:
|
|||||||||||
|
Interest paid, net of amount capitalized
|
$
|
17,278
|
|
$
|
13,693
|
|
$
|
10,738
|
|
||
|
Federal alternative minimum and state income taxes paid
|
$
|
1,213
|
|
$
|
1,938
|
|
$
|
923
|
|
||
|
SUPPLEMENTAL NON-CASH INFORMATION:
|
|||||||||||
|
Accrued expenditures for property and equipment
|
$
|
11,234
|
|
$
|
25,142
|
|
$
|
9,118
|
|
||
|
Accrued consideration for acquisition
|
$
|
7,845
|
|
$
|
—
|
|
$
|
—
|
|
||
See notes to consolidated financial statements.
50
AIR TRANSPORT SERVICES GROUP, INC.
CONSOLIDATED STATEMENTS OF STOCKHOLDERS’ EQUITY
(In thousands, except share data)
|
|
Common Stock
|
Additional
Paid-in
Capital
|
Accumulated Earnings (Deficit)
|
Accumulated
Other
Comprehensive
Income (Loss)
|
Total
|
|||||||||||||||||
|
|
Number
|
Amount
|
||||||||||||||||||||
|
BALANCE AT JANUARY 1, 2016
|
64,077,140
|
|
$
|
641
|
|
$
|
518,259
|
|
$
|
(55,731
|
)
|
$
|
(99,012
|
)
|
$
|
364,157
|
|
|||||
|
Stock-based compensation plans
|
||||||||||||||||||||||
|
Grant of restricted stock
|
171,500
|
|
2
|
|
(2
|
)
|
—
|
|
||||||||||||||
|
Issuance of common shares, net of withholdings
|
42,796
|
|
—
|
|
(2,300
|
)
|
(2,300
|
)
|
||||||||||||||
|
Forfeited restricted stock
|
(4,600
|
)
|
—
|
|
—
|
|
—
|
|
||||||||||||||
|
Purchase of common stock
|
(4,825,545
|
)
|
(48
|
)
|
(63,522
|
)
|
(63,570
|
)
|
||||||||||||||
|
Tax benefit from common stock compensation
|
1,087
|
|
1,087
|
|
||||||||||||||||||
|
Warrants granted to customer
|
(13,271
|
)
|
(13,271
|
)
|
||||||||||||||||||
|
Amortization of stock awards and restricted stock
|
3,165
|
|
3,165
|
|
||||||||||||||||||
|
Total comprehensive income (loss)
|
23,488
|
|
19,146
|
|
42,634
|
|
||||||||||||||||
|
BALANCE AT DECEMBER 31, 2016
|
59,461,291
|
|
$
|
595
|
|
$
|
443,416
|
|
$
|
(32,243
|
)
|
$
|
(79,866
|
)
|
$
|
331,902
|
|
|||||
|
Stock-based compensation plans
|
||||||||||||||||||||||
|
Grant of restricted stock
|
113,000
|
|
1
|
|
(1
|
)
|
—
|
|
||||||||||||||
|
Issuance of common shares, net of withholdings
|
17,441
|
|
—
|
|
(2,914
|
)
|
(2,914
|
)
|
||||||||||||||
|
Forfeited restricted stock
|
(3,900
|
)
|
—
|
|
—
|
|
—
|
|
||||||||||||||
|
Purchase of common stock
|
(530,637
|
)
|
(5
|
)
|
(11,179
|
)
|
(11,184
|
)
|
||||||||||||||
|
Warrants issued
|
38,502
|
|
38,502
|
|
||||||||||||||||||
|
Amortization of stock awards and restricted stock
|
3,632
|
|
3,632
|
|
||||||||||||||||||
|
Total comprehensive income (loss)
|
18,495
|
|
16,846
|
|
35,341
|
|
||||||||||||||||
|
BALANCE AT DECEMBER 31, 2017
|
59,057,195
|
|
$
|
591
|
|
$
|
471,456
|
|
$
|
(13,748
|
)
|
$
|
(63,020
|
)
|
$
|
395,279
|
|
|||||
|
Stock-based compensation plans
|
||||||||||||||||||||||
|
Grant of restricted stock
|
198,900
|
|
2
|
|
(2
|
)
|
—
|
|
||||||||||||||
|
Issuance of common shares, net of withholdings
|
36,378
|
|
—
|
|
(2,329
|
)
|
(2,329
|
)
|
||||||||||||||
|
Forfeited restricted stock
|
(1,300
|
)
|
—
|
|
—
|
|
—
|
|
||||||||||||||
|
Purchase of common stock
|
(157,000
|
)
|
(2
|
)
|
(3,578
|
)
|
(3,580
|
)
|
||||||||||||||
|
Reclassification of bond hedge, net of taxes
|
(50,435
|
)
|
(50,435
|
)
|
||||||||||||||||||
|
Reclassification of note conversion obligation, net of taxes
|
50,999
|
|
50,999
|
|
||||||||||||||||||
|
Cumulative effect in change in accounting principle
|
514
|
|
514
|
|
||||||||||||||||||
|
Amortization of stock awards and restricted stock
|
5,047
|
|
5,047
|
|
||||||||||||||||||
|
Total comprehensive income
|
69,285
|
|
(28,342
|
)
|
40,943
|
|
||||||||||||||||
|
BALANCE AT DECEMBER 31, 2018
|
59,134,173
|
|
$
|
591
|
|
$
|
471,158
|
|
$
|
56,051
|
|
$
|
(91,362
|
)
|
$
|
436,438
|
|
|||||
See notes to consolidated financial statements.
51
AIR TRANSPORT SERVICES GROUP, INC. AND SUBSIDIARIES
NOTES TO CONSOLIDATED FINANCIAL STATEMENTS
NOTE A—SUMMARY OF FINANCIAL STATEMENT PREPARATION AND SIGNIFICANT ACCOUNTING POLICIES
Nature of Operations
Air Transport Services Group, Inc. is a holding company whose subsidiaries primarily operate within the airfreight and logistics industry. The Company leases aircraft and provides airline operations, ground services, aircraft modification and maintenance services and other support services mainly to the cargo transportation and package delivery industries. The Company's subsidiaries offer a range of complementary services to delivery companies, freight forwarders, airlines and government customers.
The Company's leasing subsidiary, Cargo Aircraft Management, Inc. (“CAM”), leases aircraft to each of the Company's airlines as well as to non-affiliated airlines and other lessees. The airlines, ABX Air, Inc. (“ABX”), Air Transport International, Inc. (“ATI”), Omni Air International LLC ("OAI" ) each have the authority, through their separate U.S. Department of Transportation ("DOT") and Federal Aviation Administration ("FAA") certificates, to transport cargo worldwide. The Company provides air transportation services to a concentrated base of customers. The Company provides a combination of aircraft, crews, maintenance and insurance services for a customer's transportation network through customer "CMI" and "ACMI" agreements and through charter contracts in which aircraft fuel is also included. In addition to its aircraft leasing and airline services the Company sells aircraft parts, provides aircraft maintenance and modification services, equipment maintenance services and arranges load transfer and package sorting services for customers.
Basis of Presentation
The accompanying consolidated financial statements include the accounts of Air Transport Services Group, Inc. and its wholly-owned subsidiaries. Investments in an affiliate in which the Company has significant influence but does not exercise control are accounted for using the equity method of accounting. Using the equity method, the Company’s share of a non-consolidated affiliate's income or loss is recognized in the consolidated statement of earnings and cumulative post-acquisition changes in the investment are adjusted against the carrying amount of the investment. Inter-company balances and transactions are eliminated. The financial statements of the Company are prepared in accordance with accounting principles generally accepted in the United States of America ("GAAP").
On November 9, 2018, the Company acquired OAI, a passenger airline, along with related entities Advanced Flight Services, LLC; Omni Aviation Leasing, LLC; and T7 Aviation Leasing, LLC (referred to collectively herein as "Omni"). OAI is a leading provider of contracted passenger airlift for the U.S. Department of Defense ("DoD") via the Civil Reserve Air Fleet ("CRAF") program, and a provider of full-service passenger charter and ACMI services. OAI carries passengers worldwide for a variety of private sector customers and other government services agencies. Revenues and operating expenses include the activities of Omni for periods since their acquisition by the Company on November 9, 2018.
Use of Estimates
The preparation of financial statements in conformity with GAAP requires management to make estimates and assumptions that affect amounts reported in the consolidated financial statements. Estimates and assumptions are used to record allowances for uncollectible amounts, self-insurance reserves, spare parts inventory, depreciation and impairments of property, equipment, goodwill and intangibles, stock warrants and other financial instruments, post-retirement obligations, income taxes, contingencies and litigation. Changes in estimates and assumptions may have a material impact on the consolidated financial statements.
Cash and Cash Equivalents
The Company classifies short-term, highly liquid investments with maturities of three months or less at the time of purchase as cash and cash equivalents. These investments, consisting of money market funds, are recorded at cost, which approximates fair value. Substantially all deposits of the Company’s cash are held in accounts that exceed
52
federally insured limits. The Company deposits cash in common financial institutions which management believes are financially sound.
Cash includes restricted cash of
$5.3 million
as of December 31, 2018 and
none
as of December 31, 2017. Restricted cash is customers’ deposits held in an escrow account as required by DOT regulations. The cash is restricted to the extent of customers’ deposits on flights not yet flown. Restricted cash is released from escrow upon completion of specific flights, which are scheduled to occur within the twelve months.
Accounts Receivable and Allowance for Uncollectible Accounts
The Company's accounts receivable is primarily due from its significant customers (see Note D), other airlines, the U.S. Postal Services ("USPS"), delivery companies and freight forwarders. The Company performs a quarterly evaluation of the accounts receivable and the allowance for uncollectible accounts by reviewing specific customers' recent payment history, growth prospects, financial condition and other factors that may impact a customer's ability to pay. The Company establishes an allowance for uncollectible accounts for probable losses due to a customer's potential inability or unwillingness to make contractual payments. Account balances are written off against the allowance when the Company ceases collection efforts.
Inventory
The Company’s inventory is comprised primarily of expendable aircraft parts and supplies used for aircraft maintenance. Inventory is generally charged to expense when issued for use on a Company aircraft. The Company values its inventory of aircraft parts and supplies at weighted-average cost and maintains a related obsolescence reserve. The Company records an obsolescence reserve on a base stock of inventory. The Company monitors the usage rates of inventory parts and segregates parts that are technologically outdated or no longer used in its fleet types. Slow moving and segregated items are actively marketed and written down to their estimated net realizable values based on market conditions.
Management analyzes the inventory reserve for reasonableness at the end of each quarter. That analysis includes consideration of the expected fleet life, amounts expected to be on hand at the end of a fleet life, and recent events and conditions that may impact the usability or value of inventory. Events or conditions that may impact the expected life, usability or net realizable value of inventory include additional aircraft maintenance directives from the FAA, changes in DOT regulations, new environmental laws and technological advances.
Goodwill and Intangible Assets
The Company assesses, during the fourth quarter of each year, the carrying value of goodwill. The assessment also requires an estimation of fair value of each reporting unit that has goodwill. The goodwill impairment test requires a comparison of the fair value of the reporting unit to its respective carrying value. If the carrying value of a reporting unit is less than its fair value no impairment exists. If the carrying amount of a reporting unit is higher than its fair value an impairment loss is recorded for the difference and charged to operations.
The Company also conducts impairment assessments of goodwill, indefinite-lived intangible assets and finite-lived intangible assets whenever events or changes in circumstance indicate an impairment may have occurred. Finite-lived intangible assets are amortized over their estimated useful economic lives.
Property and Equipment
Property and equipment held for use is stated at cost, net of any impairment recorded. The cost and accumulated depreciation of disposed property and equipment are removed from the accounts with any related gain or loss reflected in earnings from operations.
53
Depreciation of property and equipment is provided on a straight-line basis over the lesser of the asset’s useful life or lease term. Depreciable lives are summarized as follows:
|
Boeing 777, 767, 757 and 737 aircraft and flight equipment
|
7 to 18 years
|
|
Ground equipment
|
3 to 10 years
|
|
Leasehold improvements, facilities and office equipment
|
3 to 25 years
|
The Company periodically evaluates the useful lives, salvage values and fair values of property and equipment. Acceleration of depreciation expense or the recording of significant impairment losses could result from changes in the estimated useful lives of assets due to a number of reasons, such as excess aircraft capacity or changes in regulations governing the use of aircraft.
Aircraft and other long-lived assets are tested for impairment when circumstances indicate the carrying value of the assets may not be recoverable. To conduct impairment testing, the Company groups assets and liabilities at the lowest level for which identifiable cash flows are largely independent of cash flows of other assets and liabilities. For assets that are to be held and used, impairment is recognized when the estimated undiscounted cash flows associated with the asset group is less than the carrying value. If impairment exists, an adjustment is recorded to write the assets down to fair value, and a loss is recorded as the difference between the carrying value and fair value. Fair values are determined considering quoted market values, discounted cash flows or internal and external appraisals, as applicable. For assets held for sale, impairment is recognized when the fair value less the cost to sell the asset is less than the carrying value.
The Company’s accounting policy for major airframe and engine maintenance varies by subsidiary and aircraft type. The costs of airframe maintenance for Boeing 767-200 aircraft operated by ABX are expensed as they are incurred. The costs of major airframe maintenance for the Company's other aircraft are capitalized and amortized over the useful life of the overhaul. Many of the Company's General Electric CF6 engines that power the Boeing 767-200 aircraft are maintained under “power by the hour” and "power by the cycle" agreements with an engine maintenance provider. Further, in May 2017, the Company entered into similar maintenance agreements for certain General Electric CF6 engines that power many of the Company's Boeing 767-300 aircraft. Under these agreements, the engines are maintained by the service provider for a fixed fee per cycle and/or flight hour. As a result, the cost of maintenance for these engines is generally expensed as flights occur. Maintenance for the airlines’ other aircraft engines, including Boeing 777 and Boeing 757 aircraft, are typically contracted to service providers on a time and material basis and the costs of those engine overhauls are capitalized and amortized over the useful life of the overhaul.
For aircraft leased from external lessors, the Company may be required to make periodic payments to the lessor under certain aircraft leases for future maintenance events such as engine overhauls and major airframe maintenance. Such payments are recorded as deposits until drawn for qualifying maintenance costs. The maintenance costs are expensed or capitalized in accordance with the airline's accounting policy for major airframe and engine maintenance. The Company evaluates at the balance sheet date, whether it is probable that an amount on deposit will be returned by the lessor to reimburse the costs of the maintenance activities. When it is less than probable that a deposit will be returned, it is recognized as additional maintenance expense.
Capitalized Interest
Interest costs incurred while aircraft are being modified are capitalized as an additional cost of the aircraft until the date the asset is placed in service. Capitalized interest was
$1.8 million
,
$1.8 million
and
$1.3 million
for the years ended December 31, 2018, 2017 and 2016, respectively.
Discontinued Operations
A business component whose operations are discontinued is reported as discontinued operations if the cash flows of the component have been eliminated from the ongoing operations of the Company and represents a strategic shift that had a major impact on the Company. The results of discontinued operations are aggregated and presented separately in the consolidated statements of operations.
54
Self-Insurance
The Company is self-insured for certain workers’ compensation, employee healthcare, automobile, aircraft, and general liability claims. The Company maintains excess claim coverage with common insurance carriers to mitigate its exposure to large claim losses. The Company records a liability for reported claims and an estimate for incurred claims that have not yet been reported. Accruals for these claims are estimated utilizing historical paid claims data and recent claims trends. Other liabilities included
$17.6 million
and
$18.4 million
at
December 31, 2018
and
December 31, 2017
, respectively, for self-insured reserves. Changes in claim severity and frequency could result in actual claims being materially different than the costs accrued.
Pension and Post-Retirement Benefits
The funded status of any of the Company's defined benefit pension or post-retirement health care plan is the difference between the fair value of plan assets and the accumulated benefit obligations to plan participants. The over funded or underfunded status of a plan is reflected in the consolidated balance sheet as an asset for over funded plans, or as a liability for underfunded plans.
The funded status is ordinarily re-measured annually at year end using the fair value of plans assets, market based discount rates and actuarial assumptions. Changes in the funded status of the plans as a result of re-measuring plan assets and benefit obligations, are recorded to accumulated comprehensive loss and amortized into operating expense using a corridor approach. The Company's corridor approach amortizes variances in plan assets and benefit obligations that are a result of the previous measurement assumptions into earnings when the net deferred variances exceed 10% of the greater of the market value of plan assets or the benefit obligation at the beginning of the year. The amount in excess of the corridor is amortized over the average remaining service period to retirement date of active plan participants. Costs adjustments for plan amendments are also deferred and amortized over the expected working life or the life expectancy of plan participants. Irrevocable settlement transactions that relieve the Company from responsibilities of providing retiree benefits and significantly eliminate the Company's related risk may result in recognition of gains or losses from accumulated other comprehensive loss.
Customer Security and Maintenance Deposits
The Company's customer leases typically obligate the lessee to maintain the Company's aircraft in compliance with regulatory standards for flight and aircraft maintenance. The Company may require an aircraft lessee to pay a security deposit or provide a letter of credit until the expiration of the lease. Additionally, the Company's leases may require a lessee to make monthly payments toward future expenditures for scheduled heavy maintenance events. The Company records security and maintenance deposits in other liabilities. If a lease requires monthly maintenance payments, the Company is typically required to reimburse the lessee for costs they incur for scheduled heavy maintenance events after completion of the work and receipt of qualifying documentation. Reimbursements to the lessee are recorded against the previously paid maintenance deposits.
Income Taxes
Income taxes have been computed using the asset and liability method, under which deferred income taxes are provided for the temporary differences between the financial reporting basis and the tax basis of the Company’s assets and liabilities. Deferred taxes are measured using provisions of currently enacted tax laws. A valuation allowance against net deferred tax assets is recorded when it is more likely than not that such assets will not be fully realized. Tax credits are accounted for as a reduction of income taxes in the year in which the credit originates. All deferred income taxes are classified as noncurrent in the statement of financial position.
The Company recognizes the benefit of a tax position taken on a tax return, if that position is more likely than not of being sustained on audit, based on the technical merits of the position. An uncertain income tax position is not recognized if it has less than a 50% likelihood of being sustained. The Company recognizes interest and penalties accrued related to uncertain tax positions in operating expense.
55
Purchase of Common Stock
The Company's Board of Directors has authorized management to repurchase outstanding common stock of the Company from time to time on the open market or in privately negotiated transactions. The authorization does not require the Company to repurchase a specific number of shares and the Company may terminate the repurchase program at any time. Upon the retirement of common stock repurchased, the excess purchase price over the par value for retired shares of common stock is recorded to additional paid-in-capital.
Stock Warrants
The Company’s accounting for warrants issued to a lessee is determined in accordance with the financial reporting guidance for equity-based payments to non-employees and for financial instruments. The warrants issued to a lessee are recorded as a lease incentive asset using their fair value at the time that the lessee has met its performance obligation. The lease incentive is amortized against revenues over the duration of related aircraft leases. The unexercised warrants are classified in liabilities and re-measured to fair value at the end of each reporting period, resulting in a non-operating gain or loss.
Comprehensive Income
Comprehensive income includes net earnings and other comprehensive income or loss. Other comprehensive income or loss results from certain changes in the Company’s liabilities for pension and other post-retirement benefits, gains and losses associated with interest rate hedging instruments and fluctuations in currency exchange rates related to the foreign affiliate.
Fair Value Information
Assets or liabilities that are required to be measured at fair value are reported using the exchange price that would be received for an asset or paid to transfer a liability (an exit price) in the principal or most advantageous market for the asset or liability in an orderly transaction between market participants on the measurement date. FASB ASC Topic 820-10
Fair Value Measurements and Disclosures
establishes three levels of input that may be used to measure fair value:
|
•
|
Level 1:
Unadjusted quoted prices in active markets that are accessible at the measurement date for identical, unrestricted assets or liabilities.
|
|
•
|
Level 2:
Observable inputs other than Level 1 prices such as quoted prices for similar assets or liabilities; quoted prices in markets that are not active; or other inputs that are observable or can be corroborated by observable market data for substantially the full term of the assets or liabilities.
|
|
•
|
Level 3:
Unobservable inputs that are supported by little or no market activity and that are significant to the fair value of the assets or liabilities. Level 3 assets and liabilities include items where the determination of fair value requires significant management judgment or estimation.
|
Revenue Recognition
Aircraft lease revenues are recognized as operating lease revenues on a straight-line basis over the term of the applicable lease agreements. Revenues generated from airline service agreements are typically recognized based on hours flown or the amount of aircraft and crew resources provided during a reporting period. Certain agreements include provisions for incentive payments based upon on-time reliability. These incentives are typically measured on a monthly basis and recorded to revenue in the corresponding month earned. Revenues for operating expenses that are reimbursed through airline service agreements, including consumption of aircraft fuel, are generally recognized as the costs are incurred. Revenues from charter service agreements are recognized on scheduled and non-scheduled flights when the specific flight has been completed. Contracts for the sale of aircraft parts typically result in the recognition of revenue when the parts are delivered. Effective January 1, 2018 the Company records revenues and estimated earnings over time for its airframe maintenance and aircraft modification contracts using the percentage-of-completion cost input method. Prior to January 1, 2018, revenues earned and expenses incurred in providing aircraft-related maintenance, repair or modification services were usually recognized in the period in which the services were completed
56
and delivered to the customer. Revenues derived from sorting parcels are recognized in the reporting period in which the services are performed.
Accounting Standards Updates
Effective January 1, 2018 the Company adopted the Financial Accounting Standards Board's ("FASB") Accounting Standards Update ("ASU") No. 2014-09, “Revenue from Contracts with Customers (Topic 606)” ("Topic 606”) which superseded previous revenue recognition guidance. Topic 606 is a comprehensive new revenue recognition model that requires a company to recognize revenue to depict the transfer of goods or services to a customer at an amount that reflects the consideration it expects to receive in exchange for those goods or services. The Company's lease revenues within the scope of Accounting Standards Codification 840, Leases, ("Topic 840") are specifically excluded from Topic 606.
The Company adopted the standard using a modified retrospective approach, under which financial statements are prepared under the revised guidance for the year of adoption, but not for prior years. Under this method, entities recognize a cumulative catch-up adjustment to the opening balance of retained earnings at the effective date for open contract performance at that time. The Company's adoption efforts included the identification of revenue within the scope of the standard, the evaluation of customer contracts in conjunction with new guidance and an assessment of the qualitative and quantitative impacts of the new standard on its financial statements. The evaluation included the application of each of the five steps identified in the Topic 606 revenue recognition model.
The Company determined that under Topic 606, it is an agent for aviation fuel and certain other costs reimbursed by customers under its ACMI and CMI contracts and for certain cargo handling services that it arranges for a customer. Under the new revenue standard, such reimbursed amounts are reported net of the corresponding expenses beginning in 2018. This application of Topic 606 did not have a material impact on the Company's reported earnings in any period. Additionally under Topic 606, the Company is required to record revenue over time, instead of at the time of completion, for certain customer contracts for airframe and modification services that do not have an alternative use and for which the Company has an enforceable right to payment during the service cycle. The Company adopted the provisions of this new standard using the modified retrospective method which requires the Company to record a one time adjustment to retained deficit for the cumulative effect that the standard has on open contracts at the time of adoption. Upon adoption of the new standard the Company accelerated $3.6 million of revenue resulting in an immaterial adjustment to its January 1, 2018 retained deficit for open airframe and modification services contracts.
In
January 2017, the FASB issued ASU "Intangibles-Goodwill and Other (Topic 350): Simplifying the Test for Goodwill Impairment" (“ASU 2017-04”). This new standard eliminates Step 2 from the goodwill impairment test and requires an entity to perform its goodwill impairment test by comparing the fair value of a reporting unit with its carrying amount. An entity recognizes an impairment charge for the amount by which the carrying amount exceeds the reporting unit’s fair value. ASU 2017-04 is effective for any annual or interim goodwill impairment tests in the fiscal years beginning after December 15, 2019 and must be applied prospectively. Early adoption is permitted for interim or annual goodwill impairment tests performed on testing dates after January 1, 2017. The Company adopted this new accounting guidance on January 1, 2018. The adoption did not have an impact on the Company's financial position, results of operations, or cash flows.
In March 2017, the FASB issued ASU "Compensation - Retirement Benefits (Topic 715): Improving the Presentation of Net Periodic Pension Cost and Net Periodic Postretirement Benefit Cost "(ASU 2017-07"). ASU 2017-07 requires an employer to report the service cost component of retiree benefits in the same line item or items as other compensation costs arising from services rendered by the pertinent employees during the period. The other components of net benefit cost are required to be presented separately from the service cost component and outside a subtotal of income from operations. The Company adopted ASU 2017-07 on January 1, 2018, retrospectively to all periods presented. As a result, retiree benefit plan interest expense, investment returns, settlements and other non-service cost components of retiree benefit expenses are excluded from the Company's operating income subtotal as reported in the Company's Consolidated Statement of Operations, but remain included in earnings before income taxes. Information about retiree
benefit plans' interest expense, investment returns and other components of retiree benefit expenses can be found in
Note J.
In February 2016, the FASB issued ASU "Leases (Topic 842)" ("Topic 842"), which will require the recognition of right to-use-assets and lease liabilities for leases previously classified as operating leases by lessees. Topic 842 is
57
effective for annual reporting periods beginning after December 15, 2018 and must be adopted using a modified retrospective approach which allows entities to either apply the new guidance to all periods presented or only to the most current period presented.
Under Topic 842, operating leases result in the recognition of right-of-use (“ROU”) assets and lease liabilities on the balance sheet. ROU assets represent the lessee's right to use the leased asset for the lease term and lease liabilities represent the obligation to make lease payments. Under Topic 842, operating lease ROU assets and liabilities are recognized at commencement date based on the present value of lease payments over the lease term.
The adoption of Topic 842 will have a material impact on the Company's consolidated balance sheet due to the recognition of the ROU assets and lease liabilities. The adoption of Topic 842 is not expected to have a material impact on the Company's consolidated statement of operations or consolidated statement of cash flows. Because the Company is using the modified retrospective transition method to adopt Topic 842, it will not be applied to prior periods and have no impact on previously reported results. Upon adoption of Topic 842, the Company estimates that it will record ROU assets and a related lease liability of approximately $52 million based on the present value of operating lease payments.
The Company's aircraft lease revenues, which were about 19% of total revenues for the year December 31, 2018, are accounted for under the current lease standard, Topic 840 through December 31, 2018 and will be accounted for under Topic 842 upon adoption. The Company does not expect the adoption of Topic 842 to have a significant impact on its revenue accounting or its consolidated financial statements.
In February 2018, the FASB issued ASU “Reclassification of Certain Tax Effects From Accumulated Other Comprehensive Income" ("ASU 2018-02"). ASU 2018-02 amends ASC 220, Income Statement - Reporting Comprehensive Income, to allow a reclassification from accumulated other comprehensive income to retained earnings for stranded tax effects resulting from U.S. federal tax legislation known as the Tax Cuts and Jobs Act. In addition, under the ASU 2018-02, a Company will be required to provide certain disclosures regarding stranded tax effects. ASU 2018-02 is effective for years beginning after December 15, 2018, and interim periods within those fiscal years. The Company is currently evaluating the impact of the standard on its financial statements and disclosures.
In June 2018, the FASB issued ASU “Improvements to Non-employee Share-based Payment Accounting" ("ASU 2018-07"). ASU 2018-07 amends ASC 718, "Compensation - Stock Compensation" ("ASC 718"), to simplify the accounting for share-based payments granted to non-employees for goods and services. ASU 2018-07 supersedes ASC 505-50, "Equity-Based Payments to Non-employees" ("ASC 505-50"). ASU 2018-07 aligns much of the accounting for share-based payments granted to non-employees for goods and services with the accounting for share-based payments granted to employees. ASU 2018-07 is effective for years beginning after December 15, 2018. Companies will apply the new guidance to equity classified non-employee awards for which a measurement date has not been established and liability-classified non-employee awards that have not been settled as of the date of adoption by recognizing a cumulative-effect adjustment to retained earnings as of the beginning of the annual period of adoption. The Company is currently evaluating the impact of the standard on its financial statements and disclosures.
NOTE B—ACQUISITION OF OMNI
On November 9, 2018, the Company acquired Omni including OAI and its aircraft fleet. The Company acquired Omni for cash consideration of
$867.7 million
. The Company funded the all-cash acquisition by amending its senior credit agreement to issue a new term loan for
$675.0 million
, drawing
$180.0 million
from its revolving credit facility and using its available cash.
The acquisition of Omni by the Company is reported in accordance with Accounting Standards Codification 805,
Business Combinations
, in which the total purchase price is allocated to Omni’s tangible and intangible assets acquired and liabilities assumed based on their estimated fair values as of the date of the acquisition. The excess of the purchase price over the estimated fair value of net assets acquired was recorded as goodwill. The purchase price exceeded the fair value of the net assets acquired due to the strategic opportunities and expected benefits associated with adding Omni's capabilities to the Company's existing offerings in the market. The benefits of adding Omni include the following:
|
•
|
Additional passenger transportation capabilities
|
|
•
|
FAA operating authority for the Boeing 777 aircraft
|
|
•
|
Increased revenues, cash flows and customer diversification
|
|
•
|
Passenger aircraft life cycle leading to potential freighter conversion
|
58
The allocation of the purchase price to specific assets and liabilities is based, in part, upon internal estimates of assets and liabilities and independent appraisals. Based on the preliminary valuations, the following table summarizes estimated fair values of the assets acquired and liabilities assumed (in thousands) for the consideration paid:
|
Cash
|
$
|
4,693
|
|
|
Accounts receivable
|
63,041
|
|
|
|
Other current assets
|
8,366
|
|
|
|
Other assets
|
7,836
|
|
|
|
Intangibles
|
140,000
|
|
|
|
Goodwill
|
353,466
|
|
|
|
Property and equipment
|
328,869
|
|
|
|
Current liabilities
|
(32,646
|
)
|
|
|
Customer deposits
|
(5,950
|
)
|
|
|
Net assets acquired
|
$
|
867,675
|
|
Property and equipment acquired includes the engines and airframes of eight Boeing 767 and three Boeing 777 passenger aircraft owned by Omni and leasehold improvements for two Boeing 767 aircraft under operating leases. The fair values assigned to the acquired aircraft were derived from market comparisons with the assistance of an independent appraiser. Depreciation expense of property and equipment is provided on a straight-line basis over the lesser of the asset’s remaining useful life or lease term. The estimated remaining life of these airframes range between seven and eighteen years. The estimated life of the airframes and engines include the Company's intent to convert a portion of Omni's passenger aircraft to freighter aircraft after the aircraft are no longer used for passengers. The value of major airframe maintenance and engine overhauls are depreciated over the useful life of the overhaul. Intangible assets consisted of $134.0 million for customer relationships and $6.0 million for airline certificates. The value assigned to Omni's customer relationships was determined by discounting the estimated cash flows associated with the existing customers as of the acquisition date, taking into consideration expected attrition of the existing customer base. The estimated cash flows were based on revenues for those existing customers, net of operating expenses and net contributory asset charges associated with servicing those customers. The estimated revenues were based on revenue growth rates and customer renewal rates. Operating expenses were estimated based on the supporting infrastructure expected to sustain the assumed revenue levels. The customer relationship intangibles are estimated to amortize over seven to twenty years on a straight-line basis and airline certificates have indefinite lives and therefore are not amortized. The goodwill is deductible for U.S. income tax purposes over 15 years.
The following table provides unaudited pro forma financial results (in thousands) for the Company after giving effect to the acquisition of Omni and adjustments described below. This information is based on adjustments to the historical consolidated financial statements of Omni using the purchase method of accounting for business combinations as if the acquisition had taken place on January 1, 2017. The unaudited pro forma adjustments do not include any of the cost savings and other synergies which may result from the acquisition. These unaudited pro forma financial results are based on assumptions considered appropriate by management and include all material adjustments as considered necessary. These unaudited pro forma results have been prepared for comparative purposes only and do not purport to be indicative of results that would have actually been reported as of the date or for the year presented had the acquisition taken place on such date or at the beginning of the year indicated, or to project the Company’s financial position or results of operations which may be reported in the future (in thousands).
|
Year Ended December 31,
|
||||||
|
2018
|
2017
|
|||||
|
Pro forma revenues
|
1,320,234
|
|
1,425,823
|
|
||
|
Pro forma net earnings from continuing operations
|
88,454
|
|
13,660
|
|
||
Revenues for 2018 reflect the adoption of Topic 606 prospectively on January 1, 2018, as described in Note O. Under this new revenue standard, such reimbursed amounts are reported net of the corresponding expenses beginning
59
in 2018. Pro forma revenues for 2017 included $289.4 million of reimbursed expenses. The following adjustments were made to the historical financial records to create the unaudited pro forma information in the table above:
|
•
|
Adjustments to eliminate transactions between the Company and Omni during the years ended December 31, 2017 and the ten and one half months ended November 9, 2018 respectively.
|
|
•
|
Adjustment to reflect estimated additional depreciation and amortization expense of
$10.6 million
and
$10.0 million
for the year ended December 31, 2017 and the ten and one half months ended November 9, 2018, respectively, resulting primarily from the fair value adjustments to Omni’s intangible assets. Pro forma combined depreciation expense for the periods presented reflect the increased fair values of the aircraft acquired and longer useful lives of the aircraft, indicative of the Company's polices and intent to modify certain aircraft to freighters as an aircraft is removed from passenger service.
|
|
•
|
Adjustment to reflect additional interest expense and amortization of debt issuance costs for the year ended December 31, 2017 and the ten and one half months ended November 9, 2018, related to the combined $855 million from an unsubordinated term loan and revolving facility draws using the prevailing rates of 4.57%.
|
|
•
|
Adjustment to apply the statutory tax rate of the Company to the pre-tax earnings of Omni and the pro forma adjustments for the year ended December 31, 2017 and the ten and one half months ended November 9, 2018. Omni had historically elected to be treated as pass-through entities for income tax purposes. Accordingly, no provision for income taxes had been made in Omni's consolidated statements of earnings. The adjustments reflect tax rates of 35% for 2017 and 22.58% for the first ten and one half months ended November 9, 2018.
|
|
•
|
Adjustment to remove acquisition related expenses of
$5.3 million
for professional fees and classified as "Transaction fees " within the consolidated statement of operations for 2018.
|
NOTE C—GOODWILL, INTANGIBLES AND EQUITY INVESTMENTS
As of December 31, 2018, 2017 and 2016, the goodwill amount for CAM was tested for impairment. To perform the goodwill impairment test, the Company determined the fair value of CAM using industry market multiples and discounted cash flows utilizing a market-derived rate of return (level 3 fair value inputs). The goodwill included in the CAM segment was not impaired. Similarly, as of December 31, 2018 and 2017, the goodwill amount recorded for the acquisition of PEMCO World Air Services, Inc., ("Pemco"), a business unit included in MRO Services, was tested for impairment. To perform the goodwill impairment test, the Company determined the fair value of Pemco, using industry market multiples and discounted cash flows utilizing a market-derived rate of return (level 3 fair value inputs). The goodwill recorded from the Pemco acquisition was not impaired.
As disclosed in Note B, on November 9, 2018, the Company acquired Omni. The purchase price was allocated to tangible and identifiable intangible assets acquired and liabilities assumed based on their estimated fair values at the date of acquisition. The excess purchase price over the estimated fair value of net assets acquired was recorded as goodwill. Identified intangible assets included OAI's certificated authority granted by the FAA to operate as an airline and OAI's long term customer relationships.
The carrying amounts of goodwill are as follows (in thousands):
|
CAM
|
ACMI Services
|
MRO Services
|
Total
|
|||||||||||||
|
Carrying value as of December 31, 2016
|
$
|
34,395
|
|
$
|
—
|
|
$
|
2,738
|
|
$
|
37,133
|
|
||||
|
Purchase price adjustment for the acquisition of Pemco
|
—
|
|
—
|
|
146
|
|
146
|
|
||||||||
|
Carrying value as of December 31, 2017
|
$
|
34,395
|
|
$
|
—
|
|
$
|
2,884
|
|
$
|
37,279
|
|
||||
|
Acquisition of Omni
|
118,895
|
|
234,571
|
|
—
|
|
353,466
|
|
||||||||
|
Carrying value as of December 31, 2018
|
$
|
153,290
|
|
$
|
234,571
|
|
$
|
2,884
|
|
$
|
390,745
|
|
||||
60
The Company's acquired intangible assets are as follows (in thousands):
|
Airline
|
Amortizing
|
|||||||||||
|
Certificates
|
Intangibles
|
Total
|
||||||||||
|
Carrying value as of December 31, 2016
|
$
|
3,000
|
|
$
|
5,453
|
|
$
|
8,453
|
|
|||
|
Amortization
|
—
|
|
(1,155
|
)
|
(1,155
|
)
|
||||||
|
Carrying value as of December 31, 2017
|
$
|
3,000
|
|
$
|
4,298
|
|
$
|
7,298
|
|
|||
|
Acquisition of Omni
|
6,000
|
|
134,000
|
|
140,000
|
|
||||||
|
Amortization
|
—
|
|
(2,684
|
)
|
(2,684
|
)
|
||||||
|
Carrying value as of December 31, 2018
|
$
|
9,000
|
|
$
|
135,614
|
|
$
|
144,614
|
|
|||
The airline certificates have an indefinite life and therefore are not amortized. The Company amortizes finite-lived intangibles assets, including customer relationship and STC intangibles, over 4 to 20 years. The Company recorded intangible amortization expense of
$2.7 million
,
$1.2 million
and
$0.3 million
for the years ending December 31, 2018, 2017 and 2016, respectively. Estimated amortization expense for the next five years is
$11.7 million
,
$11.7 million
,
$10.9 million
,
$10.9 million
and
$10.9 million
.
Stock warrants issued to a lessee (see Note D) as an incentive are recorded as a lease incentive asset using their fair value at the time that the lessee has met its performance obligation and amortized against revenues over the duration of related aircraft leases. The Company's lease incentive granted to the lessee was as follows (in thousands):
|
Lease
|
||||
|
Incentive
|
||||
|
Carrying value as of December 31, 2016
|
$
|
54,730
|
|
|
|
Warrants granted
|
39,940
|
|
||
|
Amortization
|
(13,986
|
)
|
||
|
Carrying value as of December 31, 2017
|
$
|
80,684
|
|
|
|
Amortization
|
(16,904
|
)
|
||
|
Carrying value as of December 31, 2018
|
$
|
63,780
|
|
|
The lease incentive began to amortize in April 2016, with the commencement of certain aircraft leases. Based on the warrants granted as of December 31, 2018, the Company expects to record amortization, as a reduction to the lease revenue, of
$16.9 million
,
$16.9 million
,
$11.7 million
,
$8.3 million
and
$7.9 million
for each of the next five years ending December 31, 2023.
In January 2014, the Company acquired a 25 percent equity interest in West Atlantic AB of Gothenburg, Sweden ("West"). West, through its two airlines, Atlantic Airlines Ltd. and West Air Sweden AB, operates a fleet of aircraft on behalf of European regional mail carriers and express logistics providers. The airlines operate a combined fleet of British Aerospace ATPs, Bombardier CRJ-200-PFs, and Boeing 767 and 737 aircraft. West leases four Boeing 767 aircraft and two Boeing 737 from the Company.
On August 3, 2017 the Company entered into a joint-venture agreement with Precision Aircraft Solutions, LLC, to develop a passenger-to-freighter conversion program for Airbus A321-200 aircraft. The Company anticipates approval of a supplemental type certificate from the FAA in 2020. The Company expects to make contributions equal to its 49% ownership percentage of the program's total costs over the next two years. During the 2018 and 2017 years, the Company contributed
$11.4 million
and
$8.7 million
to the joint venture, respectively.
The Company accounts for its investment in West and the aircraft conversion joint venture under the equity method of accounting, in which the carrying value of each investment is reduced for the Company's share of the non-consolidated affiliates operating results. The carrying value of West and the joint venture totaled
$12.5 million
and
$12.7 million
at December 31, 2018 and 2017, respectively. and are reflected in “Other Assets” in the Company’s consolidated balance sheets. The Company’s carrying value of West included
$5.5 million
of excess purchase price over the Company's fair value of West's identified nets assets in January of 2014 and
$2.4 million
paid to West in 2017 for a preferred equity
61
instrument. The Company monitors its investments in affiliates for indicators of other-than-temporary declines in value on an ongoing basis in accordance with GAAP. If the Company determines that an other-than-temporary decline in value has occurred, it recognizes an impairment loss, which is measured as the difference between the recorded carrying value and the fair value of the investment. The fair value is generally determined using an income approach based on discounted cash flows or using negotiated transaction values.
NOTE D—SIGNIFICANT CUSTOMERS
DHL
The Company has had long term contracts with DHL Network Operations (USA), Inc. and its affiliates ("DHL") since August 2003. Revenues from aircraft leases and related services performed for DHL were approximately
26%
,
24%
and
34%
of the Company's consolidated revenues from continuing operations for the years ended December 31, 2018, 2017 and 2016, respectively. Revenues excluding directly reimbursed expenses from continuing operations performed for DHL comprised approximately
30%
and
37%
of the Company's consolidated revenues from continuing operations for the years ended December 31, 2017 and 2016, respectively. The Company’s balance sheets include accounts receivable with DHL of
$13.4 million
and
$15.7 million
as of
December 31, 2018
and December 31, 2017, respectively.
The Company leases Boeing 767 aircraft to DHL under both long-term and short-term lease agreements. Under a separate crew, maintenance and insurance (“CMI”) agreement, the Company operates Boeing 767 aircraft that DHL leases from the Company. Pricing for services provided through the CMI agreement is based on pre-defined fees, scaled for the number of aircraft operated and the number of flight crews provided to DHL for its U.S. network. The Company provides DHL with scheduled maintenance services for aircraft that DHL leases. The Company also provides Boeing 767 and Boeing 757 air cargo transportation services for DHL through additional ACMI agreements in which the Company provides the aircraft, crews, maintenance and insurance under a single contract. Revenues generated from the ACMI agreements are typically based on hours flown. The Company also provides ground equipment, such as power units, air starts and related maintenance services to DHL under separate agreements.
Amazon
The Company has been providing freighter aircraft and services for cargo handling and logistical support for Amazon.com Services, Inc. ("ASI"), successor to Amazon Fulfillment Services, Inc., a subsidiary of Amazon.com, Inc. ("Amazon") since September 2015. On March 8, 2016, the Company entered into an Air Transportation Services Agreement (the “ATSA”) with ASI, pursuant to which CAM leases 20 Boeing 767 freighter aircraft to ASI, including 12 Boeing 767-200 freighter aircraft for a term of five years and eight Boeing 767-300 freighter aircraft for a term of seven years. The ATSA also provides for the operation of those aircraft by the Company’s airline subsidiaries, and the management of ground services by the Company's subsidiary LGSTX Services Inc. ("LGSTX"). The ATSA became effective on April 1, 2016 and had an original term of five years.
In conjunction with the execution of the ATSA, the Company and Amazon entered into an Investment Agreement and a Stockholders Agreement on March 8, 2016. The Investment Agreement calls for the Company to issue warrants in three tranches which will grant Amazon the right to acquire up to 19.9% of the Company’s outstanding common shares as described below. The first tranche of warrants, issued upon the execution of the Investment Agreement and all of which are now fully vested, granted Amazon the right to purchase approximately 12.81 million ATSG common shares, with the first 7.69 million common shares vesting upon issuance on March 8, 2016, and the remaining 5.12 million common shares vesting as the Company delivered additional aircraft leased under the ATSA. The second tranche of warrants, which were issued and vested on March 8, 2018, grants Amazon the right to purchase approximately 1.59 million ATSG common shares. The third tranche of warrants will be issued and vest on September 8, 2020, and will grant Amazon the right to purchase such additional number of ATSG common shares as is necessary to bring Amazon’s ownership to 19.9% of the Company’s pre-transaction outstanding common shares measured on a GAAP-diluted basis, adjusted for share issuances and repurchases by the Company following the date of the Investment Agreement and after giving effect to the warrants granted. The exercise price of the warrants is $9.73 per share, which represents the closing price of ATSG’s common shares on February 9, 2016. Each of the three tranches of warrants are exercisable in accordance with its terms through March 8, 2021.
62
The Company’s accounting for the warrants has been determined in accordance with the financial reporting guidance for equity-based payments to non-employees and for financial instruments. The warrants issued to Amazon as of March 8, 2016, were recorded to stockholders equity, having a fair value of
$4.89
per share. At that time, the fair value of the
7.69 million
vested warrants issued to Amazon was recorded as a lease incentive asset and is being amortized against revenues over the duration of the aircraft leases. On May 12, 2016, the Company’s stockholders approved an amendment to the Certificate of Incorporation of the Company at the annual meeting of stockholders to increase the number of authorized common shares and to approve the warrants in full as required under the rules of the Nasdaq Global Select Market. The stockholders' approval enabled features of the warrants that required the vested warrants of the first tranche and the warrants of the second and third tranches to be classified as financial instruments as of May 12, 2016. Accordingly, the fair value of those warrants was measured and classified in liabilities on that date. Since May 12, 2016,
5.1 million
additional warrants vested in conjunction with the execution of eight aircraft leases. As of December 31, 2018, the Company's liabilities reflected
14.83 million
warrants having a fair value of
$13.76
per share. During the years ended December 31, 2018 and 2017, the re-measurements of the warrants to fair value resulted in a non-operating gain of
$7.4 million
and non-operating losses of
$81.8 million
before the effect of income taxes, respectively.
On December 22, 2018 the Company announced agreements with Amazon to 1) lease and operate ten additional Boeing 767-300 aircraft for ASI, 2) extend the term of the 12 Boeing 767-200 aircraft currently leased to ASI by two years to 2023 with an option for three more years, 3) extend the term of the eight Boeing 767-300 aircraft currently leased to ASI by three years to 2026 and 2027 with an option for three more years.and 4) extend the ATSA by five years through March 2026, with an option to extend for an additional three years. The Company plans to deliver five of the 767-300 aircraft in 2019 and the remainder in 2020. All ten of these aircraft leases will be for ten years.
In conjunction with the commitment for ten additional 767 aircraft leases, extensions of twenty existing Boeing 767 aircraft leases and the ATSA described above, Amazon will be issued warrants for 14.8 million common shares which could expand its potential ownership in the Company to approximately 33.2%, including the warrants described above for the 2016 agreements. These new warrants will vest as existing leases are extended and additional aircraft leases are executed and added to the ATSA operations. These new warrants will expire if not exercised within seven years from their issuance date. They have an exercise price of $21.53 per share, based on the volume-weighted average price of the Company's shares over the 30 trading days immediately preceding execution of a non-binding term sheet by the parties on October 29, 2018.
Additionally, Amazon will be able to earn incremental warrant rights, increasing its potential ownership from 33.2% up to approximately 39.9% of the Company, by leasing up to seventeen more cargo aircraft from the Company before January 2026. Incremental warrants granted for Amazon’s commitment to any such future aircraft leases will have an exercise price of the $21.53 referenced above, provided the parties reach binding agreements on future lease terms before April 2019. Beginning in April 2019, pricing of warrants related to future aircraft leases will be based on the volume-weighted average price of ATSG’s shares during the 30 trading days immediately preceding contractual commitment for each lease.
The warrants potentially issuable under these new agreements with Amazon will require an increase in the number of authorized common shares of the Company. Management intends to submit a proposal calling for an appropriate increase in the number of authorized common shares for shareholder consideration at the Company’s next annual meeting of shareholders in May 2019. None of these warrants had been issued or vested as of December 31, 2018.
Revenues from continuing operations performed for Amazon comprised approximately
27%
,
44%
and
29%
of the Company's consolidated revenues from continuing operations for the years ending December 31, 2018, 2017 and 2016, respectively. Revenues excluding directly reimbursed expenses from continuing operations performed for Amazon comprised approximately
27%
and
18%
of the Company's consolidated revenues from continuing operations for the years ended December 31, 2017 and 2016, respectively. The Company’s balance sheets include accounts receivable with Amazon of
$29.2 million
and
$44.2 million
as of
December 31, 2018
and December 31, 2017, respectively.
The Company's earnings in future periods will be impacted by the number of warrants granted, the re-measurements of warrant fair value, amortizations of the lease incentive asset and the related income tax effects. For income tax calculations, the value and timing of related tax deductions will differ from the guidance described above for financial reporting.
63
DoD
The Company is a provider of cargo and passenger airlift services to the DoD. The DoD awards flights to U.S. certificated airlines through annual contracts and through temporary "expansion" routes. Revenues from services performed for the DoD were approximately
15%
,
7%
and
12%
of the Company's total revenues from continuing operations for the years ended
December 31, 2018
, 2017 and 2016, respectively, including revenues for Omni beginning November 9, 2018. Revenues excluding directly reimbursed expenses from continuing operations performed for the DoD comprised approximately
10%
and
14%
of the Company's consolidated revenues from continuing operations for the years ended December 31, 2017 and 2016, respectively. The Company's balance sheets included accounts receivable with the DoD of
$50.5 million
and
$6.7 million
as of
December 31, 2018
and December 31, 2017, respectively.
NOTE E—FAIR VALUE MEASUREMENTS
The Company’s money market funds and interest rate swaps are reported on the Company’s consolidated balance sheets at fair values based on market values from identical or comparable transactions. The fair value of the Company’s money market funds, stock warrant obligations, convertible note, convertible note hedges and interest rate swaps are based on observable inputs (Level 2) from comparable market transactions. The fair value of the stock warrant obligations were determined using a Black-Scholes pricing model which considers the Company’s common stock price and various assumptions, such as the volatility of the Company’s common stock, the expected dividend yield, and the risk-free interest rate. The fair value of the note conversion obligations and the convertible note hedges were estimated using a Black-Scholes pricing model and incorporate the terms and conditions of the underlying financial instruments. The valuations are, among other things, subject to changes in both the Company's credit worthiness and the counter-parties to the instruments as well as change in general market conditions. While the change in fair value of the note conversion obligations and the convertible note hedges are generally expected to move in opposite directions, the net change in any given period may be material.
The following table reflects assets and liabilities that are measured at fair value on a recurring basis (in thousands):
|
As of December 31, 2018
|
Fair Value Measurement Using
|
Total
|
|||||||||||||
|
|
Level 1
|
Level 2
|
Level 3
|
||||||||||||
|
Assets
|
|||||||||||||||
|
Cash equivalents—money market
|
$
|
—
|
|
$
|
17,986
|
|
$
|
—
|
|
$
|
17,986
|
|
|||
|
Interest rate swap
|
—
|
|
2,971
|
|
—
|
|
2,971
|
|
|||||||
|
Total Assets
|
$
|
—
|
|
$
|
20,957
|
|
$
|
—
|
|
$
|
20,957
|
|
|||
|
Liabilities
|
|||||||||||||||
|
Interest rate swap
|
$
|
—
|
|
$
|
(1,138
|
)
|
$
|
—
|
|
$
|
(1,138
|
)
|
|||
|
Stock warrant obligations
|
—
|
|
(203,782
|
)
|
—
|
|
(203,782
|
)
|
|||||||
|
Total Liabilities
|
$
|
—
|
|
$
|
(204,920
|
)
|
$
|
—
|
|
$
|
(204,920
|
)
|
|||
|
As of December 31, 2017
|
Fair Value Measurement Using
|
Total
|
|||||||||||||
|
|
Level 1
|
Level 2
|
Level 3
|
||||||||||||
|
Assets
|
|||||||||||||||
|
Cash equivalents—money market
|
$
|
—
|
|
$
|
1,326
|
|
$
|
—
|
|
$
|
1,326
|
|
|||
|
Interest rate swap
|
—
|
|
1,840
|
|
—
|
|
1,840
|
|
|||||||
|
Convertible note hedges
|
—
|
|
53,683
|
|
—
|
|
53,683
|
|
|||||||
|
Total Assets
|
$
|
—
|
|
$
|
56,849
|
|
$
|
—
|
|
$
|
56,849
|
|
|||
|
Liabilities
|
|||||||||||||||
|
Note conversion obligations
|
$
|
—
|
|
$
|
(54,359
|
)
|
$
|
—
|
|
$
|
(54,359
|
)
|
|||
|
Stock warrant obligation
|
—
|
|
(211,136
|
)
|
—
|
|
(211,136
|
)
|
|||||||
|
Total Liabilities
|
$
|
—
|
|
$
|
(265,495
|
)
|
$
|
—
|
|
$
|
(265,495
|
)
|
|||
64
At December 31, 2018 each stock warrant was valued at
$13.76
using a risk-free interest rate of
2.5%
and a stock volatility of
37.5%
, based on the time period corresponding with the expiration period of the warrants (see Note D). At December 31, 2017, each stock warrant was valued at
$14.24
using a risk-free rate of
2%
and a stock volatility of
34%
. At December 31, 2018 the value of the convertible note hedges and note conversion obligations were valued was valued at
$50.0 million
and
$50.8 million
respectively using a risk free interest rate of
2.5%
and stock volatility of
36%
. At December 31, 2017 the value of the convertible note hedges and note conversion obligations were valued using a risk free interest rate of
2.3%
and stock volatility of
34%
.
As a result of higher market interest rates compared to the stated interest rates of the Company’s fixed rate debt obligations, the fair value of the Company’s debt obligations, based on Level 2 observable inputs, was approximately
$6.0 million
less than the carrying value, which was
$1,401.3 million
at
December 31, 2018
. As of December 31, 2017, the fair value of the Company’s debt obligations was approximately
$9.1 million
more than the carrying value, which was
$515.8 million
. The non-financial assets, including goodwill, intangible assets and property and equipment are measured at fair value on a non-recurring basis.
NOTE F—PROPERTY AND EQUIPMENT
The Company's property and equipment consists primarily of cargo aircraft, aircraft engines and other flight equipment. Property and equipment, to be held and used, is summarized as follows (in thousands):
|
|
December 31,
2018 |
December 31,
2017 |
|||||
|
Flight equipment
|
$
|
2,340,840
|
|
$
|
1,801,808
|
|
|
|
Ground equipment
|
57,455
|
|
53,523
|
|
|||
|
Leasehold improvements, facilities and office equipment
|
28,745
|
|
26,897
|
|
|||
|
Aircraft modifications and projects in progress
|
74,449
|
|
121,760
|
|
|||
|
2,501,489
|
|
2,003,988
|
|
||||
|
Accumulated depreciation
|
(946,484
|
)
|
(844,026
|
)
|
|||
|
Property and equipment, net
|
$
|
1,555,005
|
|
$
|
1,159,962
|
|
|
CAM owned aircraft with a carrying value of
$803.7 million
and
$697.4 million
that were under leases to external customers as of December 31, 2018 and 2017, respectively. Minimum future payments from external customers for leased aircraft and equipment as of December 31, 2018 is scheduled to be
$142.3 million
,
$127.1 million
,
$124.3 million
,
$121.2 million
and
$87.1 million
for each of the next five years ending December 31, 2023.
NOTE G—DEBT OBLIGATIONS
Debt obligations consisted of the following (in thousands):
|
|
December 31,
|
December 31,
|
|||||
|
|
2018
|
2017
|
|||||
|
Unsubordinated term loans
|
$
|
721,406
|
|
$
|
70,568
|
|
|
|
Revolving credit facility
|
475,000
|
|
245,000
|
|
|||
|
Aircraft loan
|
—
|
|
3,640
|
|
|||
|
Convertible debt
|
204,846
|
|
196,550
|
|
|||
|
Total debt obligations
|
1,401,252
|
|
515,758
|
|
|||
|
Less: current portion
|
(29,654
|
)
|
(18,512
|
)
|
|||
|
Total long term obligations, net
|
$
|
1,371,598
|
|
$
|
497,246
|
|
|
The Company executed a syndicated credit agreement ("Senior Credit Agreement") in May 2011 which includes an unsubordinated term loan and a revolving credit facility. Effective November 9, 2018, in conjunction with the
65
acquisition of Omni, the Company amended its Senior Credit Agreement. The amendment continued the secured revolving credit facility and the existing secured term loan while securing a second term loan of
$675.0 million
. The amendment also increased the accordion feature such that the Company can draw up to an additional
$400.0 million
subject to the lenders' consent. The Senior Credit Agreement expires May 30, 2023. Each year, through May 6, 2019, the Company may request a one year extension of the final maturity date, subject to the lenders' consent. The Senior Credit Agreement permits additional indebtedness of up to
$300.0 million
of which
$258.8 million
has been utilized for the issuance of convertible notes. The Senior Credit Agreement limits the amount of dividends the Company can pay and the amount of common stock it can repurchase to
$100.0 million
during any calender year, provided the Company's total secured debt to earnings before interest, taxes, depreciation and amortization expenses ("EBITDA") ratio is under 3.00 times, after giving effect to the dividend or repurchase. As of December 31, 2018, the unused revolving credit facility totaled
$57.9 million
, net of draws of
$475.0 million
and outstanding letters of credit of
$12.1 million
.
The Senior Credit Agreement is collateralized by certain of the Company's Boeing 777, 767 and 757 aircraft. Under the terms of the Senior Credit Agreement, the Company is required to maintain collateral coverage equal to
110%
of the outstanding balance of the term loans and the total funded revolving credit facility. The minimum collateral coverage which must be maintained is
50%
of the outstanding balance of the term loan plus the revolving credit facility commitment which was
$545.0 million
.
During 2018, the aircraft loan was paid in full. The balance of the unsubordinated term loans is net of debt issuance costs of
$9.8 million
and
$0.7 million
for the years ended December 31, 2018 and 2017, respectively. Under the terms of the Senior Credit Agreement, interest rates are adjusted at least quarterly based on the Company's EBITDA, its outstanding debt level and prevailing LIBOR or prime rates. At the Company's current debt-to-EBITDA ratio, the LIBOR based financing for the unsubordinated term loans and revolving credit facility bear variable interest rates of
4.78%
,
4.64%
and
4.78%
, respectively.
The Senior Credit Agreement contains covenants including, among other things, limitations on certain additional indebtedness, guarantees of indebtedness, as well as a total debt to EBITDA ratio and a fixed charge coverage ratio. The Senior Credit Agreement stipulates events of default, including unspecified events that may have material adverse effects on the Company. If an event of default occurs, the Company may be forced to repay, renegotiate or replace the Senior Credit Agreement.
In September 2017, the Company issued
$258.8 million
aggregate principal amount of
1.125%
Convertible Senior Notes due 2024 ("Notes") in a private offering to qualified institutional buyers pursuant to Rule 144A under the Securities Act. The Notes bear interest at a rate of 1.125% per year payable semi-annually in arrears on April 15 and October 15 each year, beginning April 15, 2018. The Notes mature on October 15, 2024, unless repurchased or converted in accordance with their terms prior to such date. The Notes are unsecured indebtedness, subordinated to the Company's existing and future secured indebtedness and other liabilities, including trade payables. Conversion of the Notes can only occur upon satisfaction of certain conditions and during certain periods, beginning any calendar quarter commencing after December 31, 2017 and thereafter, until the close of business on the second scheduled trading day immediately preceding the maturity date. Upon the occurrence of certain fundamental changes, holders of the Notes can require the Company to repurchase their notes at the cash repurchase price equal to the principal amount of the notes, plus any accrued and unpaid interest.
The Notes may be settled in cash, the Company’s common shares or a combination of cash and the Company’s common shares, at the Company’s election. The initial conversion rate is 31.3475 common shares per $1,000 principal amount of Notes (equivalent to an initial conversion price of approximately $31.90 per common share). If a “make-whole fundamental change” (as defined in the offering circular with the Notes) occurs, the Company will, in certain circumstances, increase the conversion rate for a specified period of time.
In conjunction with the Notes, the Company purchased convertible note hedges under privately negotiated transactions for
$56.1 million
, having the same number of the Company's common shares,
8.1 million
shares and same strike price of $31.90, that underlie the Notes. The convertible note hedges are expected to reduce the potential equity dilution with respect to the Company's common stock, and/or offset any cash payments in excess of the principal amount due, as the case may be, upon conversion of the Notes. The Company's current intent and policy is to settle all Note conversions through a combination settlement which satisfies the principal amount of the Notes outstanding with cash. The Notes could have a dilutive effect on the computation of earnings per share in accordance with accounting principles
66
to the extent that the average traded market price of the Company’s common shares for a reporting period exceeds the conversion price.
The conversion feature of the Notes required bifurcation from the principal amount under the applicable accounting guidance. Settlement provisions of the Notes and the convertible note hedges required cash settlement of these instruments until the Company's shareholders increased the number of authorized shares of common stock to cover the full number of shares underlying the Notes. As a result, the conversion feature of the Notes and the convertible note hedges were initially accounted for as liabilities and assets, respectively, and marked to market at the end of each period. The fair value of the note conversion obligation at issuance was
$57.4 million
.
On May 10, 2018, the Company's shareholders increased the number of authorized shares of common stock to cover the full number of shares underlying the Notes. The Company reevaluated the Notes and convertible note hedges under the applicable accounting guidance including ASC 815, "Derivatives and Hedging," and determined that the instruments, which meet the definition of derivative and are indexed to the Company's own stock, should be classified in shareholder's equity. The fair value of the the conversion feature of the Notes and the convertible note hedges of
$51.3 million
and
$50.6 million
, respectively on May 10, 2018 were reclassified to paid-in capital.
The net proceeds from the issuance of the Notes were approximately
$252.3 million
, after deducting initial issuance costs. These unamortized issuance costs and discount are being amortized to interest expense through October 2024, using an effective interest rate of approximately
5.15%
. The carrying value of the Company's Convertible debt is shown below.
|
December 31,
|
December 31,
|
|||||
|
2018
|
2017
|
|||||
|
Principal value, Convertible Senior Notes, due 2024
|
258,750
|
|
258,750
|
|
||
|
Unamortized issuance costs
|
(5,799
|
)
|
(6,685
|
)
|
||
|
Unamortized discount
|
(48,105
|
)
|
(55,515
|
)
|
||
|
Convertible debt
|
204,846
|
|
196,550
|
|
||
In conjunction with the offering of the Notes, the Company also sold warrants to the convertible note hedge counterparties in separate, privately negotiated warrant transactions at a higher strike price and for the same number of the Company’s common shares, subject to customary anti-dilution adjustments. The amount received for these warrants and recorded in Stockholders' Equity in the Company’s consolidated balance sheets was
$38.5 million
. These warrants could result in 8.1 million additional shares of the Company's common stock, if the Company's traded market price exceeds the strike price which is $41.35 per share and is subject to certain adjustments under the terms of the warrant transactions. The warrants could have a dilutive effect on the computation of earnings per shares to the extent that the average traded market price of the Company's common shares for a reporting periods exceed the strike price.
The scheduled cash principal payments for the Company's debt obligations, as of December 31, 2018, for the next five years are as follows (in thousands):
|
|
Principal
Payments
|
||
|
2019
|
$
|
31,875
|
|
|
2020
|
48,750
|
|
|
|
2021
|
48,750
|
|
|
|
2022
|
45,000
|
|
|
|
2023
|
1,031,875
|
|
|
|
2024 and beyond
|
258,750
|
|
|
|
Total principal cash payments
|
1,465,000
|
|
|
|
Less: unamortized issuance costs and discounts
|
(63,748
|
)
|
|
|
Total debt obligations
|
$
|
1,401,252
|
|
67
NOTE H—DERIVATIVE INSTRUMENTS
The Company's Senior Credit Agreement requires the Company to maintain derivative instruments for protection from fluctuating interest rates, for at least fifty percent of the outstanding balance of the original term loan and twenty-five percent of the outstanding balance of the second term loan issued in November 2018. Accordingly, the Company entered into an additional interest rate swap in December 2018 having an initial value of
$150.0 million
and a forward start date of December 31, 2018. The table below provides information about the Company’s interest rate swaps (in thousands):
|
|
|
December 31, 2018
|
December 31, 2017
|
|||||||||||
|
Expiration Date
|
Stated
Interest
Rate
|
Notional
Amount
|
Market
Value
(Liability)
|
Notional
Amount
|
Market
Value
(Liability)
|
|||||||||
|
May 5, 2021
|
1.090
|
%
|
28,125
|
|
650
|
|
35,625
|
|
719
|
|
||||
|
May 30, 2021
|
1.703
|
%
|
28,125
|
|
366
|
|
35,625
|
|
240
|
|
||||
|
December 31, 2021
|
2.706
|
%
|
150,000
|
|
(1,138
|
)
|
—
|
|
—
|
|
||||
|
March 31, 2022
|
1.900
|
%
|
50,000
|
|
829
|
|
50,000
|
|
416
|
|
||||
|
March 31, 2022
|
1.950
|
%
|
75,000
|
|
1,126
|
|
75,000
|
|
465
|
|
||||
The outstanding interest rate swaps are not designated as hedges for accounting purposes. The effects of future fluctuations in LIBOR interest rates on derivatives held by the Company will result in the recording of unrealized gains and losses into the statement of operations. The Company recorded a net loss on derivatives of
$8.0 thousand
and net gains of
$1.4 million
and
$1.0 million
for the years ending December 31, 2018, 2017 and 2016, respectively. The liability for outstanding derivatives is recorded in other liabilities and in accrued expenses.
The Company recorded a net loss before the effects of income taxes of
$0.1 million
and a net gain before the effects of income taxes of
$0.6 million
during the years ended December 31, 2018 and 2017, respectively, for the revaluation of the convertible note hedges and the note conversion obligations to fair value before these instruments were reclassified to paid-in-capital.
NOTE I—COMMITMENTS AND CONTINGENCIES
Lease Commitments
The Company leases portions of the air park in Wilmington, Ohio, under lease agreements with a regional port authority, the terms of which expire in May of 2019 and June of 2036 with options to extend the leases. The leased facilities include corporate offices, 310,000 square feet of maintenance hangars and a 100,000 square foot component repair shop at the air park. ABX also has the non-exclusive right to use the airport, which includes one active runway, taxi ways and ramp space. The Company also leases and operates a 311,500 square foot, two hangar aircraft maintenance complex in the Tampa International Airport in Florida. Additionally, the Company leases approximately 82,500 square
feet of office and warehouse space at the Tulsa International Airport in Oklahoma. The Company leases two Boeing 767 aircraft, certain equipment and airport facilities, office space, and maintenance facilities at locations outside of the airpark in Wilmington.
68
The future minimum lease payments of the Company as of December 31, 2018 are scheduled below (in thousands):
|
Facility Leases
|
Aircraft and Other Leases
|
|||||||
|
2019
|
$
|
10,898
|
|
$
|
6,607
|
|
||
|
2020
|
9,903
|
|
5,515
|
|
||||
|
2021
|
8,348
|
|
4,355
|
|
||||
|
2022
|
5,233
|
|
1,502
|
|
||||
|
2023
|
3,140
|
|
1,501
|
|
||||
|
2024 and beyond
|
10,461
|
|
2,001
|
|
||||
|
Total minimum lease payments
|
$
|
47,983
|
|
$
|
21,481
|
|
||
Purchase Commitments
The Company has agreements with Israel Aerospace Industries Ltd. ("IAI") for the conversion of Boeing 767 passenger aircraft into a standard configured freighter aircraft. The conversions primarily consist of the installation of a standard cargo door and loading system. At December 31, 2018, the Company had commitments to acquire three Boeing 767-300 passenger aircraft and complete the freighter modification of two aircraft, totaling
$39.1 million
. Additionally, the Company placed non-refundable deposits of
$29.4 million
to purchase 20 more Boeing 767-300 passenger aircraft through 2021. The Company could incur a cancellation fee with IAI for unused modification part kits.
Guarantees and Indemnifications
Certain leases and agreements of the Company contain guarantees and indemnification obligations to the lessor, or one or more other parties that are considered reasonable and customary (e.g. use, tax and environmental indemnifications), the terms of which range in duration and are often limited. Such indemnification obligations may continue after expiration of the respective lease or agreement.
Other
In addition to the foregoing matters, the Company is also a party to legal proceedings in various federal and state jurisdictions from time to time arising out of the operation of the Company's business. The amount of alleged liability, if any, from these proceedings cannot be determined with certainty; however, the Company believes that its ultimate liability, if any, arising from pending legal proceedings, as well as from asserted legal claims and known potential legal claims which are probable of assertion, taking into account established accruals for estimated liabilities, should not be material to our financial condition or results of operations.
Employees Under Collective Bargaining Agreements
As of
December 31, 2018
, the flight crewmember employees of ABX, ATI and Omni and flight attendant employees of ATI and Omni were represented by the labor unions listed below:
|
Airline
|
Labor Agreement Unit
|
Percentage of
the Company’s
Employees
|
|
ABX
|
International Brotherhood of Teamsters
|
6.5%
|
|
ATI
|
Air Line Pilots Association
|
6.7%
|
|
Omni
|
International Brotherhood of Teamsters
|
6.9%
|
|
ATI
|
Association of Flight Attendants
|
1.0%
|
|
Omni
|
Association of Flight Attendants
|
8.2%
|
69
NOTE J—PENSION AND OTHER POST-RETIREMENT BENEFIT PLANS
Defined Benefit and Post-retirement Healthcare Plans
ABX sponsors a qualified defined benefit pension plan for ABX crewmembers and a qualified defined benefit pension plan for a major portion of its other ABX employees that meet minimum eligibility requirements. ABX also sponsors non-qualified defined benefit pension plans for certain employees. These non-qualified plans are unfunded. Employees are no longer accruing benefits under any of the defined benefit pension plans. ABX also sponsors a post-retirement healthcare plan for its ABX employees, which is unfunded. Benefits for covered individuals terminate upon reaching age 65 under the post-retirement healthcare plans.
The accounting and valuation for these post-retirement obligations are determined by prescribed accounting and actuarial methods that consider a number of assumptions and estimates. The selection of appropriate assumptions and estimates is significant due to the long time period over which benefits will be accrued and paid. The long term nature of these benefit payouts increases the sensitivity of certain estimates of our post-retirement costs. The assumptions considered most sensitive in actuarially valuing ABX’s pension obligations and determining related expense amounts are discount rates and expected long term investment returns on plan assets. Additionally, other assumptions concerning retirement ages, mortality and employee turnover also affect the valuations. Actual results and future changes in these assumptions could result in future costs significantly higher than those recorded in our results of operations.
ABX measures plan assets and benefit obligations as of December 31 of each year. Information regarding ABX’s sponsored defined benefit pension plans and post-retirement healthcare plans follow below. The accumulated benefit obligation reflects pension benefit obligations based on the actual earnings and service to-date of current employees.
On August 30, 2017, the Company transferred investment assets totaling $106.6 million from the pension plan trust to purchase a group annuity contract from Mutual of America Life Insurance Company ("MUA"). The group annuity contract transfers payment obligations for pension benefits owed to certain former, non-pilot retirees of ABX (or their beneficiaries) to MUA. As a result of the transaction, the Company recognized pre-tax settlement charges of
$5.3 million
to continued operations and
$7.6 million
to discontinued operations due to the reclassification of
$12.9 million
of pretax losses from accumulated other comprehensive loss.
70
Funded Status
(in thousands):
|
|
Pension Plans
|
Post-retirement
Healthcare Plans
|
|||||||||||||
|
|
2018
|
2017
|
2018
|
2017
|
|||||||||||
|
Accumulated benefit obligation
|
$
|
690,729
|
|
$
|
740,783
|
|
$
|
3,824
|
|
$
|
4,056
|
|
|||
|
Change in benefit obligation
|
|||||||||||||||
|
Obligation as of January 1
|
$
|
740,783
|
|
$
|
791,182
|
|
$
|
4,056
|
|
$
|
4,231
|
|
|||
|
Service cost
|
—
|
|
—
|
|
123
|
|
158
|
|
|||||||
|
Interest cost
|
29,135
|
|
33,585
|
|
127
|
|
142
|
|
|||||||
|
Curtailment gain
|
—
|
|
8,483
|
|
—
|
|
—
|
|
|||||||
|
Plan transfers
|
1,603
|
|
2,643
|
|
—
|
|
—
|
|
|||||||
|
Benefits paid
|
(29,439
|
)
|
(33,779
|
)
|
(365
|
)
|
(412
|
)
|
|||||||
|
Curtailments and settlement
|
—
|
|
(106,742
|
)
|
—
|
|
—
|
|
|||||||
|
Actuarial (gain) loss
|
(51,353
|
)
|
45,411
|
|
(117
|
)
|
(63
|
)
|
|||||||
|
Obligation as of December 31
|
$
|
690,729
|
|
$
|
740,783
|
|
$
|
3,824
|
|
$
|
4,056
|
|
|||
|
Change in plan assets
|
|||||||||||||||
|
Fair value as of January 1
|
$
|
681,573
|
|
$
|
715,885
|
|
$
|
—
|
|
$
|
—
|
|
|||
|
Actual gain (loss) on plan assets
|
(51,274
|
)
|
99,090
|
|
—
|
|
—
|
|
|||||||
|
Plan transfers
|
1,603
|
|
2,643
|
|
—
|
|
—
|
|
|||||||
|
Return of excess premiums
|
963
|
|
—
|
|
—
|
|
—
|
|
|||||||
|
Employer contributions
|
22,220
|
|
4,476
|
|
365
|
|
412
|
|
|||||||
|
Benefits paid
|
(29,439
|
)
|
(33,779
|
)
|
(365
|
)
|
(412
|
)
|
|||||||
|
Settlement payments
|
$
|
—
|
|
$
|
(106,742
|
)
|
$
|
—
|
|
$
|
—
|
|
|||
|
Fair value as of December 31
|
$
|
625,646
|
|
$
|
681,573
|
|
$
|
—
|
|
$
|
—
|
|
|||
|
Funded status
|
|||||||||||||||
|
Underfunded plans
|
|||||||||||||||
|
Current liabilities
|
$
|
(3,971
|
)
|
$
|
(1,497
|
)
|
$
|
(451
|
)
|
$
|
(414
|
)
|
|||
|
Non-current liabilities
|
$
|
(61,112
|
)
|
$
|
(57,713
|
)
|
$
|
(3,373
|
)
|
$
|
(3,642
|
)
|
|||
Components of Net Periodic Benefit Cost
ABX’s net periodic benefit costs for its defined benefit pension plans and post-retirement healthcare plans for the years ended December 31, 2018, 2017 and 2016, are as follows (in thousands):
|
|
Pension Plans
|
Post-Retirement Healthcare Plan
|
|||||||||||||||||||||
|
|
2018
|
2017
|
2016
|
2018
|
2017
|
2016
|
|||||||||||||||||
|
Service cost
|
$
|
—
|
|
$
|
—
|
|
$
|
—
|
|
$
|
123
|
|
$
|
158
|
|
123
|
|
||||||
|
Interest cost
|
29,135
|
|
33,585
|
|
35,872
|
|
127
|
|
142
|
|
170
|
|
|||||||||||
|
Expected return on plan assets
|
(42,093
|
)
|
(42,080
|
)
|
(41,056
|
)
|
—
|
|
—
|
|
—
|
|
|||||||||||
|
Curtailments and settlements
|
—
|
|
12,923
|
|
—
|
|
—
|
|
—
|
|
(1,997
|
)
|
|||||||||||
|
Amortization of prior service cost
|
—
|
|
—
|
|
—
|
|
—
|
|
(51
|
)
|
(103
|
)
|
|||||||||||
|
Amortization of net (gain) loss
|
3,547
|
|
7,778
|
|
13,472
|
|
219
|
|
283
|
|
160
|
|
|||||||||||
|
Net periodic benefit cost (income)
|
$
|
(9,411
|
)
|
$
|
12,206
|
|
$
|
8,288
|
|
$
|
469
|
|
$
|
532
|
|
$
|
(1,647
|
)
|
|||||
71
Unrecognized Net Periodic Benefit Expense
The pre-tax amounts in accumulated other comprehensive loss that have not yet been recognized as components of net periodic benefit expense at December 31 are as follows (in thousands):
|
|
Pension Plans
|
Post-Retirement
Healthcare Plans
|
|||||||||||||
|
|
2018
|
2017
|
2018
|
2017
|
|||||||||||
|
Unrecognized prior service cost
|
$
|
—
|
|
$
|
—
|
|
$
|
—
|
|
$
|
—
|
|
|||
|
Unrecognized net actuarial loss
|
126,192
|
|
88,689
|
|
1,210
|
|
1,547
|
|
|||||||
|
Accumulated other comprehensive loss
|
$
|
126,192
|
|
$
|
88,689
|
|
$
|
1,210
|
|
$
|
1,547
|
|
|||
The amounts of unrecognized net actuarial loss recorded in accumulated other comprehensive loss that is expected to be recognized as components of net periodic benefit expense during 2019 is
$15.5 million
and
$0.2 million
for the pension plans and the post-retirement healthcare plans, respectively.
Assumptions
Assumptions used in determining the funded status of ABX’s pension plans at December 31 were as follows:
|
|
Pension Plans
|
||||
|
|
2018
|
2017
|
2016
|
||
|
Discount rate - crewmembers
|
4.65%
|
4.00%
|
4.50%
|
||
|
Discount rate - non-crewmembers
|
4.65%
|
4.05%
|
4.60%
|
||
|
Expected return on plan assets
|
6.20%
|
6.25%
|
6.25%
|
||
Net periodic benefit cost was based on the discount rate assumptions at the end of the previous year.
The discount rate used to determine post-retirement healthcare obligations was
4.10%
,
3.30%
and
3.55%
for pilots at December 31, 2018, 2017 and 2016, respectively. Post-retirement healthcare plan obligations have not been funded. The Company's retiree healthcare contributions have been fixed for each participant, accordingly, healthcare cost trend rates do not effect the post-retirement healthcare obligations.
Plan Assets
The weighted-average asset allocations by asset category are as shown below:
|
|
Composition of Plan Assets
as of December 31
|
||||
|
Asset category
|
2018
|
2017
|
|||
|
Cash
|
1
|
%
|
1
|
%
|
|
|
Equity securities
|
25
|
%
|
31
|
%
|
|
|
Fixed income securities
|
74
|
%
|
68
|
%
|
|
|
100
|
%
|
100
|
%
|
||
ABX uses an investment management firm to advise it in developing and executing an investment policy. The portfolio is managed with consideration for diversification, quality and marketability. The investment policy permits the following ranges of asset allocation: equities –
15%
to
35%
; fixed income securities –
60%
to
80%
; cash –
0%
to
10%
. Except for U.S. Treasuries, no more than
10%
of the fixed income portfolio and no more than
5%
of the equity portfolio can be invested in securities of any single issuer.
The overall expected long term rate of return was developed using various market assumptions in conjunction with the plans’ targeted asset allocation. The assumptions were based on historical market returns.
72
Cash Flows
In 2018 and 2017, the Company made contributions to its defined benefit plans of
$22.2 million
and
$4.5 million
, respectively. The Company estimates that its contributions in 2019 will be approximately
$8.1 million
for its defined benefit pension plans and
$0.5 million
for its post-retirement healthcare plans.
The following benefit payments, which reflect expected future service, as appropriate, are expected to be paid out of the respective plans as follows (in thousands):
|
|
Pension
Benefits
|
Post-retirement
Healthcare
Benefits
|
|||||
|
2019
|
$
|
35,680
|
|
$
|
451
|
|
|
|
2020
|
36,175
|
|
492
|
|
|||
|
2021
|
38,835
|
|
530
|
|
|||
|
2022
|
41,192
|
|
529
|
|
|||
|
2023
|
43,347
|
|
550
|
|
|||
|
Years 2024 to 2028
|
232,465
|
|
2,009
|
|
|||
Fair Value Measurements
The pension plan assets are stated at fair value. The following is a description of the valuation methodologies used for the investments measured at fair value, including the general classification of such instruments pursuant to the valuation hierarchy.
Common Trust Funds—Common trust funds are composed of shares or units in non-publicly traded funds whereby the underlying assets in these funds (cash, cash equivalents, fixed income securities and equity securities) are publicly traded on exchanges and price quotes for the assets held by these funds are readily available. Holdings of common trust funds are classified as Level 2 investments.
Corporate Stock—This investment category consists of common and preferred stock issued by domestic and international corporations that are regularly traded on exchanges and price quotes for these shares are readily available. These investments are classified as Level 1 investments.
Mutual Funds—Investments in this category include shares in registered mutual funds, unit trust and commingled funds. These funds consist of domestic equity, international equity and fixed income strategies. Investments in this category that are publicly traded on an exchange and have a share price published at the close of each business day are classified as Level 1 investments and holdings in the other mutual funds are classified as Level 2 investments.
Fixed Income Investments—Securities in this category consist of U.S. Government or Agency securities, state and local government securities, corporate fixed income securities or pooled fixed income securities. Securities in this category that are valued utilizing published prices at the close of each business day are classified as Level 1 investments. Those investments valued by bid data prices provided by independent pricing sources are classified as Level 2 investments.
73
The pension plan assets measured at fair value on a recurring basis were as follows (in thousands):
|
As of December 31, 2018
|
Fair Value Measurement Using
|
Total
|
|||||||||
|
|
Level 1
|
Level 2
|
|||||||||
|
Plan assets
|
|||||||||||
|
Common trust funds
|
$
|
—
|
|
$
|
3,961
|
|
$
|
3,961
|
|
||
|
Corporate stock
|
13,142
|
|
—
|
|
13,142
|
|
|||||
|
Mutual funds
|
48,645
|
|
91,085
|
|
139,730
|
|
|||||
|
Fixed income investments
|
2,065
|
|
462,149
|
|
464,214
|
|
|||||
|
Benefit Plan Assets
|
$
|
63,852
|
|
$
|
557,195
|
|
$
|
621,047
|
|
||
|
Investments measured at net asset value ("NAV")
|
4,599
|
|
|||||||||
|
Total benefit plan assets
|
|
|
|
|
$
|
625,646
|
|
||||
|
As of December 31, 2017
|
Fair Value Measurement Using
|
Total
|
|||||||||
|
|
Level 1
|
Level 2
|
|||||||||
|
Plan assets
|
|||||||||||
|
Common trust funds
|
$
|
—
|
|
$
|
3,792
|
|
$
|
3,792
|
|
||
|
Corporate stock
|
17,361
|
|
—
|
|
17,361
|
|
|||||
|
Mutual funds
|
53,391
|
|
113,426
|
|
166,817
|
|
|||||
|
Fixed income investments
|
3,926
|
|
462,480
|
|
466,406
|
|
|||||
|
Benefit Plan Assets
|
$
|
74,678
|
|
$
|
579,698
|
|
$
|
654,376
|
|
||
|
Investments measured at net asset value ("NAV")
|
27,197
|
|
|||||||||
|
Total benefit plan assets
|
|
|
|
|
$
|
681,573
|
|
||||
Investments that were measured at NAV per share (or its equivalent) as a practical expedient have not been classified in the fair value hierarchy. These investments include hedge funds, private equity and real estate funds. Management’s estimates are based on information provided by the fund managers or general partners of those funds.
Hedge Funds and Private Equity—These investments are not readily tradeable and have valuations that are not based on readily observable data inputs. The fair value of these assets is estimated based on information provided by the fund managers or the general partners. These assets have been valued using NAV as a practical expedient.
74
The following table presents investments measured at fair value based on NAV per share as a practical expedient:
|
|
Fair Value
|
Redemption Frequency
|
Redemption Notice Period
|
Unfunded Commitments
|
|||||||
|
As of December 31, 2018
|
|||||||||||
|
Hedge Funds & Private Equity
|
$
|
4,599
|
|
(1) (2)
|
90 days
|
$
|
—
|
|
|||
|
Real Estate
|
—
|
|
(3)
|
90 days
|
—
|
|
|||||
|
Total investments measured at NAV
|
$
|
4,599
|
|
$
|
—
|
|
|||||
|
|
|||||||||||
|
As of December 31, 2017
|
|||||||||||
|
Hedge Funds & Private Equity
|
$
|
27,197
|
|
(1) (2)
|
90 days
|
$
|
—
|
|
|||
|
Real Estate
|
—
|
|
(3)
|
90 days
|
—
|
|
|||||
|
Total investments measured at NAV
|
$
|
27,197
|
|
$
|
—
|
|
|||||
(1) Quarterly - hedge funds
(2) None - private equity
(3) Monthly
Defined Contribution Plans
The Company sponsors defined contribution capital accumulation plans (401k) that are funded by both voluntary employee salary deferrals and by employer contributions. Expenses for defined contribution retirement plans were
$9.0 million
,
$7.8 million
and
$7.1 million
for the years ended December 31, 2018, 2017 and 2016, respectively.
NOTE K—INCOME TAXES
The Company's deferred income taxes reflect the value of its net operating loss carryforwards and the tax effects of temporary differences between the carrying amounts of assets and liabilities for financial reporting purposes and their amounts used for income tax calculations. Federal legislation known as the The Tax Cuts and Jobs Acts ("Tax Act") was enacted on December 22, 2017. The Tax Act reduces the U.S. federal corporate tax rate from the previous rate of 35% to 21% effective January 1, 2018. The Tax Act also made broad and complex changes to the U.S. tax code, including, but not limited to a one time tax on earnings of certain foreign subsidiaries, limitations of net operating loss carryforwards created in tax years beginning after December 31, 2017, bonus depreciation for full expensing of qualified property, and limitations on the deductibility of certain executive compensation. At December 31, 2017, the Company calculated the effects of the enactment of the Tax Act as written, and made an estimate of the effects on the existing deferred tax balances. The re-measurement of deferred tax balances in 2017 using the lower federal rates enacted by the Tax Act, resulted in a reduction in the Company's net deferred tax liability and the recognition of a deferred tax benefit as depicted by the change in federal statutory tax rate included below. The Company continues to analyze and monitor the effects of the Tax Act on its operations.
At December 31, 2018, the Company had cumulative net operating loss carryforwards (“NOL CFs”) for federal income tax purposes of approximately
$253.8 million
, which begin to expire in 2031 if not utilized before then. The deferred tax asset balance includes
$2.3 million
net of a
$0.3 million
valuation allowance related to state NOL CFs, which have remaining lives ranging from
one
to
twenty
years. These NOL CFs are attributable to excess tax deductions related primarily to the accelerated tax depreciation of fixed assets and cash contributions for its defined benefit pension plans. At December 31, 2018 and 2017, the Company determined that, based upon projections of taxable income, it was more likely than not that the NOL CF’s will be realized prior to their expiration, accordingly, no allowance against these deferred tax assets was recorded. The Company had alternative minimum tax credits of
$3.1 million
which will be recovered over then the next four years.
75
The significant components of the deferred income tax assets and liabilities as of December 31, 2018 and 2017 are as follows (in thousands):
|
|
December 31
|
||||||
|
|
2018
|
2017
|
|||||
|
Deferred tax assets:
|
|||||||
|
Net operating loss carryforward and federal credits
|
$
|
55,760
|
|
$
|
17,021
|
|
|
|
Warrants
|
7,314
|
|
3,974
|
|
|||
|
Post-retirement employee benefits
|
13,777
|
|
8,716
|
|
|||
|
Employee benefits other than post-retirement
|
8,751
|
|
9,229
|
|
|||
|
Inventory reserve
|
2,374
|
|
1,739
|
|
|||
|
Deferred revenue
|
4,389
|
|
3,016
|
|
|||
|
Other
|
4,713
|
|
4,317
|
|
|||
|
Deferred tax assets
|
97,078
|
|
48,012
|
|
|||
|
Deferred tax liabilities:
|
|||||||
|
Accelerated depreciation
|
(189,719
|
)
|
(129,201
|
)
|
|||
|
Partnership items
|
(5,850
|
)
|
(5,858
|
)
|
|||
|
State taxes
|
(14,474
|
)
|
(12,119
|
)
|
|||
|
Valuation allowance against deferred tax assets
|
(278
|
)
|
(278
|
)
|
|||
|
Deferred tax liabilities
|
(210,321
|
)
|
(147,456
|
)
|
|||
|
Net deferred tax (liability)
|
$
|
(113,243
|
)
|
$
|
(99,444
|
)
|
|
The following summarizes the Company’s income tax provisions (benefits) (in thousands):
|
|
Years Ended December 31
|
||||||||||
|
|
2018
|
2017
|
2016
|
||||||||
|
Current taxes:
|
|||||||||||
|
Federal
|
$
|
—
|
|
$
|
9
|
|
$
|
820
|
|
||
|
Foreign
|
—
|
|
48
|
|
—
|
|
|||||
|
State
|
1,043
|
|
590
|
|
151
|
|
|||||
|
Deferred taxes:
|
|||||||||||
|
Federal
|
15,642
|
|
27,625
|
|
11,338
|
|
|||||
|
Foreign
|
(63
|
)
|
—
|
|
—
|
|
|||||
|
State
|
2,973
|
|
3,396
|
|
1,085
|
|
|||||
|
Change in federal statutory tax rates
|
—
|
|
(59,944
|
)
|
—
|
|
|||||
|
Total deferred tax expense
|
18,552
|
|
(28,923
|
)
|
12,423
|
|
|||||
|
Total income tax expense (benefit) from continuing operations
|
$
|
19,595
|
|
$
|
(28,276
|
)
|
$
|
13,394
|
|
||
|
Income tax expense (benefit) from discontinued operations
|
$
|
434
|
|
$
|
(1,848
|
)
|
$
|
1,384
|
|
||
76
The reconciliation of income tax from continuing operations computed at the U.S. statutory federal income tax rates to effective income tax rates is as follows:
|
|
Years Ended December 31
|
|||||||
|
|
2018
|
2017
|
2016
|
|||||
|
Statutory federal tax rate
|
21.0
|
%
|
35.0
|
%
|
35.0
|
%
|
||
|
Foreign income taxes
|
(0.1
|
)%
|
(0.5
|
)%
|
—
|
%
|
||
|
State income taxes, net of federal tax benefit
|
(0.2
|
)%
|
(39.7
|
)%
|
2.3
|
%
|
||
|
Tax effect of non-deductible warrant expense
|
(1.5
|
)%
|
(485.0
|
)%
|
4.0
|
%
|
||
|
Tax effect of stock compensation
|
(0.8
|
)%
|
21.7
|
%
|
(3.4
|
)%
|
||
|
Tax effect of other non-deductible expenses
|
0.8
|
%
|
(19.6
|
)%
|
1.6
|
%
|
||
|
Change in federal statutory tax rates
|
—
|
%
|
917.2
|
%
|
—
|
%
|
||
|
Change to state statutory tax rates
|
3.8
|
%
|
—
|
%
|
—
|
%
|
||
|
Other
|
(0.6
|
)%
|
3.5
|
%
|
(0.6
|
)%
|
||
|
Effective income tax rate
|
22.4
|
%
|
432.6
|
%
|
38.9
|
%
|
||
The income tax deductibility of the warrant expense is less than the expense required by GAAP because for tax purposes, the warrants are valued at a different time and under a different valuation method.
The reconciliation of income tax from discontinued operations computed at the U.S. statutory federal income tax rates to effective income tax rates is as follows:
|
|
Years Ended December 31
|
|||||||
|
|
2018
|
2017
|
2016
|
|||||
|
Statutory federal tax rate
|
21.0
|
%
|
35.0
|
%
|
35.0
|
%
|
||
|
State income taxes, net of federal tax benefit
|
2.6
|
%
|
1.3
|
%
|
1.3
|
%
|
||
|
Change in federal statutory tax rates
|
—
|
%
|
—
|
%
|
—
|
%
|
||
|
Effective income tax rate
|
23.6
|
%
|
36.3
|
%
|
36.3
|
%
|
||
The Company files income tax returns in the U.S. federal jurisdiction and various international, state and local jurisdictions. The returns may be subject to audit by the Internal Revenue Service (“IRS”) and other jurisdictional authorities. International returns consist primarily of disclosure returns where the Company is covered by the sourcing rules of U.S. international treaties. The Company recognizes the impact of an uncertain income tax position in the financial statements if that position is more likely than not of being sustained on audit, based on the technical merits of the position. At December 31, 2018, 2017 and 2016, the Company's unrecognized tax benefits were
$0.0 million
,
$0.0 million
and
$0.0 million
respectively. Accrued interest and penalties on tax positions are recorded as a component of interest expense. Interest and penalties expense was immaterial for 2018, 2017 and 2016.
The Company began to file, effective in 2008, federal tax returns under a common parent of the consolidated group that includes ABX and all the wholly-owned subsidiaries. The returns for 2017, 2016 and 2015 related to the consolidated group remain open to examination. The consolidated federal tax returns prior to 2015 remain open to federal examination only to the extent of net operating loss carryforwards carried over from or utilized in those years. Pemco and Omni filed returns on their own behalf prior to their acquisition by the Company. State and local returns filed for 2005 through 2017 are generally also open to examination by their respective jurisdictions, either in full or limited to net operating losses. Th Company files tax returns with the Republic of Ireland for its leasing operations based in Ireland.
77
NOTE L—ACCUMULATED OTHER COMPREHENSIVE INCOME (LOSS)
Accumulated other comprehensive income (loss) includes the following items by components for the years ended December 31, 2018, 2017 and 2016 (in thousands):
|
Defined Benefit Pension
|
Defined Benefit Post-Retirement
|
Foreign Currency Translation
|
Total
|
|||||||||
|
Balance as of January 1, 2016
|
(97,302
|
)
|
(315
|
)
|
(1,395
|
)
|
(99,012
|
)
|
||||
|
Other comprehensive income (loss) before reclassifications:
|
||||||||||||
|
Actuarial gain (loss) for retiree liabilities
|
18,424
|
|
394
|
|
—
|
|
18,818
|
|
||||
|
Foreign currency translation adjustment
|
—
|
|
—
|
|
(126
|
)
|
(126
|
)
|
||||
|
Amounts reclassified from accumulated other comprehensive income:
|
||||||||||||
|
Plan curtailment and settlement
|
—
|
|
(1,997
|
)
|
—
|
|
(1,997
|
)
|
||||
|
Actuarial costs (reclassified to salaries, wages and benefits)
|
13,472
|
|
160
|
|
—
|
|
13,632
|
|
||||
|
Negative prior service cost (reclassified to salaries, wages and benefits)
|
—
|
|
(103
|
)
|
—
|
|
(103
|
)
|
||||
|
Income Tax (Expense) or Benefit
|
(11,682
|
)
|
560
|
|
44
|
|
(11,078
|
)
|
||||
|
Other comprehensive income (loss), net of tax
|
20,214
|
|
(986
|
)
|
(82
|
)
|
19,146
|
|
||||
|
Balance as of December 31, 2016
|
(77,088
|
)
|
(1,301
|
)
|
(1,477
|
)
|
(79,866
|
)
|
||||
|
Other comprehensive income (loss) before reclassifications:
|
||||||||||||
|
Actuarial gain (loss) for retiree liabilities
|
3,116
|
|
63
|
|
—
|
|
3,179
|
|
||||
|
Foreign currency translation adjustment
|
—
|
|
—
|
|
195
|
|
195
|
|
||||
|
Amounts reclassified from accumulated other comprehensive income:
|
||||||||||||
|
Plan curtailment and settlement
|
12,923
|
|
—
|
|
—
|
|
12,923
|
|
||||
|
Actuarial costs (reclassified to salaries, wages and benefits)
|
7,778
|
|
283
|
|
—
|
|
8,061
|
|
||||
|
Negative prior service cost (reclassified to salaries, wages and benefits)
|
—
|
|
(51
|
)
|
—
|
|
(51
|
)
|
||||
|
Income Tax (Expense) or Benefit
|
(7,304
|
)
|
(91
|
)
|
(66
|
)
|
(7,461
|
)
|
||||
|
Other comprehensive income (loss), net of tax
|
16,513
|
|
204
|
|
129
|
|
16,846
|
|
||||
|
Balance as of December 31, 2017
|
(60,575
|
)
|
(1,097
|
)
|
(1,348
|
)
|
(63,020
|
)
|
||||
|
Other comprehensive income (loss) before reclassifications:
|
||||||||||||
|
Actuarial gain (loss) for retiree liabilities
|
(41,051
|
)
|
117
|
|
—
|
|
(40,934
|
)
|
||||
|
Foreign currency translation adjustment
|
—
|
|
—
|
|
(171
|
)
|
(171
|
)
|
||||
|
Amounts reclassified from accumulated other comprehensive income:
|
||||||||||||
|
Actuarial costs (reclassified to salaries, wages and benefits)
|
3,547
|
|
219
|
|
—
|
|
3,766
|
|
||||
|
Income Tax (Expense) or Benefit
|
9,037
|
|
(80
|
)
|
40
|
|
8,997
|
|
||||
|
Other comprehensive income (loss), net of tax
|
(28,467
|
)
|
256
|
|
(131
|
)
|
(28,342
|
)
|
||||
|
Balance as of December 31, 2018
|
(89,042
|
)
|
(841
|
)
|
(1,479
|
)
|
(91,362
|
)
|
||||
78
NOTE M—STOCK-BASED COMPENSATION
The Company's Board of Directors has granted stock incentive awards to certain employees and board members pursuant to a long term incentive plan which was approved by the Company's stockholders in May 2005 and in May 2015. Employees have been awarded non-vested stock units with performance conditions, non-vested stock units with market conditions and non-vested restricted stock. The restrictions on the non-vested restricted stock awards lapse at the end of a specified service period, which is typically
three
years from the date of grant. Restrictions could lapse sooner upon a business combination, death, disability or after an employee qualifies for retirement. The non-vested stock units will be converted into a number of shares of Company stock depending on performance and market conditions at the end of a specified service period, lasting approximately
three
years. The performance condition awards will be converted into a number of shares of Company stock based on the Company's average return on invested capital during the service period. Similarly, the market condition awards will be converted into a number of shares depending on the appreciation of the Company's stock compared to the NASDAQ Transportation Index. Board members were granted time-based awards with vesting periods of approximately
six
or
twelve
months. The Company expects to settle all of the stock unit awards by issuing new shares of stock. The table below summarizes award activity.
|
|
Year Ended December 31
|
|||||||||||||||||||
|
|
2018
|
2017
|
2016
|
|||||||||||||||||
|
|
Number of
Awards
|
Weighted
average
grant-date
fair value
|
Number of
Awards
|
Weighted
average
grant-date
fair value
|
Number of
Awards
|
Weighted
average
grant-date
fair value
|
||||||||||||||
|
Outstanding at beginning of period
|
873,849
|
|
$
|
12.30
|
|
1,040,569
|
|
$
|
9.97
|
|
1,157,659
|
|
$
|
7.52
|
|
|||||
|
Granted
|
304,795
|
|
24.18
|
|
243,940
|
|
17.52
|
|
314,060
|
|
15.47
|
|
||||||||
|
Converted
|
(205,616
|
)
|
12.74
|
|
(320,810
|
)
|
9.47
|
|
(329,200
|
)
|
7.32
|
|
||||||||
|
Expired
|
(500
|
)
|
28.38
|
|
(82,050
|
)
|
9.22
|
|
(92,750
|
)
|
7.44
|
|
||||||||
|
Forfeited
|
(2,600
|
)
|
26.76
|
|
(7,800
|
)
|
13.55
|
|
(9,200
|
)
|
10.23
|
|
||||||||
|
Outstanding at end of period
|
969,928
|
|
$
|
15.89
|
|
873,849
|
|
$
|
12.30
|
|
1,040,569
|
|
$
|
9.97
|
|
|||||
|
Vested
|
463,422
|
|
$
|
10.25
|
|
441,424
|
|
$
|
7.61
|
|
472,294
|
|
$
|
6.60
|
|
|||||
The average grant-date fair value of each performance condition award, non-vested restricted stock award and time-based award granted by the Company was
$25.15
,
$16.72
and
$14.39
for 2018, 2017 and 2016, respectively, the fair value of the Company’s stock on the date of grant. The average grant-date fair value of each market condition award granted was
$31.60
,
$20.18
and
$19.65
for 2018, 2017 and 2016, respectively. The market condition awards were valued using a Monte Carlo simulation technique based on volatility over
three
years for the awards granted in 2018, 2017 and 2016 using daily stock prices and using the following variables:
|
2018
|
2017
|
2016
|
|||
|
Risk-free interest rate
|
2.4%
|
1.7%
|
1.1%
|
||
|
Volatility
|
33.8%
|
34.7%
|
36.9%
|
||
For the years ended December 31, 2018, 2017 and 2016, the Company recorded expense of
$5.0 million
,
$3.6 million
and
$3.2 million
, respectively, for stock incentive awards. At December 31, 2018, there was
$6.5 million
of unrecognized expense related to the stock incentive awards that is expected to be recognized over a weighted-average period of
1.5
years. As of December 31, 2018, none of the awards were convertible,
326,928
units of the Board members' time-based awards had vested and none of the outstanding shares of the restricted stock had vested. These awards could result in a maximum number of
1,204,978
additional outstanding shares of the Company’s common stock depending on service, performance and market results through December 31, 2020.
79
NOTE N—COMMON STOCK AND EARNINGS PER SHARE
Earnings per Share
The calculation of basic and diluted earnings per common share are as follows (in thousands, except per share amounts):
|
December 31
|
|||||||||||
|
|
2018
|
2017
|
2016
|
||||||||
|
Numerator:
|
|||||||||||
|
Earnings from continuing operations - basic
|
$
|
67,883
|
|
$
|
21,740
|
|
$
|
21,060
|
|
||
|
Gain from stock warrants revaluation, net of tax
|
(7,118
|
)
|
—
|
|
—
|
|
|||||
|
Earnings from continuing operations - diluted
|
$
|
60,765
|
|
$
|
21,740
|
|
$
|
21,060
|
|
||
|
Denominator:
|
|||||||||||
|
Weighted-average shares outstanding for basic earnings per share
|
58,765
|
|
58,907
|
|
61,330
|
|
|||||
|
Common equivalent shares:
|
|||||||||||
|
Effect of stock-based compensation awards and warrants
|
9,591
|
|
779
|
|
1,664
|
|
|||||
|
Weighted-average shares outstanding assuming dilution
|
68,356
|
|
59,686
|
|
62,994
|
|
|||||
|
Basic earnings per share from continuing operations
|
$
|
1.16
|
|
$
|
0.37
|
|
$
|
0.34
|
|
||
|
Diluted earnings per share from continuing operations
|
$
|
0.89
|
|
$
|
0.36
|
|
$
|
0.33
|
|
||
Basic weighted average shares outstanding for purposes of basic earnings per share are less than the shares outstanding due to
329,600
shares,
241,000
shares and
327,700
shares of restricted stock for 2018, 2017 and 2016, respectively, which are accounted for as part of diluted weighted average shares outstanding in diluted earnings per share.
The determination of diluted earnings per share requires the exclusion of the fair value re-measurement of the stock warrants recorded as a liability (see Note D), if such warrants have a anti-dilutive effect on earnings per share. The dilutive effect of the weighted-average diluted shares outstanding is calculated using the treasury method for periods in which equivalent shares have a dilutive effect on earnings per share. Under this method, the number of diluted shares is determined by dividing the assumed proceeds of the warrants recorded as a liability by the average stock price during the period and comparing that amount with the number of corresponding warrants outstanding.
The underlying warrants recorded as a liability as of December 31, 2018 and 2017 would have resulted in
14.8 million
and
14.8 million
additional shares of the Company's common stock, respectively, if the warrants were settled by tendering cash.
The number of equivalent shares that were not included in weighted average shares outstanding assuming dilution because their effect would have been anti-dilutive, were
7.8 million
and
1.9 million
for the years ended December 31, 2017 and 2016, respectively.
Purchase of Common Stock
The Company's Board of Directors has authorized management to repurchase outstanding common stock of the Company from time to time on the open market or in privately negotiated transactions. The authorization does not require the Company to repurchase a specific number of shares and the Company may terminate the repurchase program at any time. Upon the retirement of common stock repurchased, the excess purchase price over the par value for retired shares of common stock is recorded to additional paid-in-capital.
The Company repurchased common stock during 2017, including
380,637
shares on June 6, 2017 from an underwriter in conjunction with an underwritten secondary offering by its largest shareholder, Red Mountain Partners, L.P., a fund that is affiliated with Red Mountain Capital Partners, LLC (“Red Mountain”), a related party, for an aggregate purchase price of
$8.5 million
. The share price of
$22.42
was equal to the price per share paid by the underwriter to Red Mountain.
80
NOTE O—SEGMENT AND REVENUE INFORMATION
The Company operates in
three
reportable segments. The CAM segment consists of the Company's aircraft leasing operations and its segment earnings include an allocation of interest expense. The ACMI Services segment consists of the Company's airline operations, including CMI agreements as well as ACMI, charter service and passenger service agreements that the Company has with its customers. The MRO Services segment provides airframe maintenance services, aircraft modifications and other maintenance services. The MRO Services became reportable during 2018 due to the size of its revenues. Prior periods presented below have been prepared by separating MRO Services from "All other" for comparative purposes. The Company's ground services and other activities, which include load transfer and sorting service, maintenance services for ground equipment, facilities and material handling equipment, the sales of aviation fuel and other services, are not large enough to constitute reportable segments and are combined in All other. Intersegment revenues are valued at arms-length market rates.
The Company's segment information from continuing operations is presented below (in thousands):
|
|
Year Ended December 31
|
||||||||||
|
|
2018
|
2017
|
2016
|
||||||||
|
Total revenues:
|
|||||||||||
|
CAM
|
$
|
228,956
|
|
$
|
209,560
|
|
$
|
195,092
|
|
||
|
ACMI Services
|
548,839
|
|
614,741
|
|
492,859
|
|
|||||
|
MRO Services
|
207,539
|
|
205,401
|
|
111,913
|
|
|||||
|
All other
|
79,040
|
|
227,807
|
|
150,117
|
|
|||||
|
Eliminate inter-segment revenues
|
(172,029
|
)
|
(189,309
|
)
|
(181,111
|
)
|
|||||
|
Total
|
$
|
892,345
|
|
$
|
1,068,200
|
|
$
|
768,870
|
|
||
|
Customer revenues:
|
|||||||||||
|
CAM
|
$
|
156,516
|
|
$
|
140,434
|
|
$
|
117,642
|
|
||
|
ACMI Services
|
548,804
|
|
614,721
|
|
492,859
|
|
|||||
|
MRO Services
|
117,832
|
|
106,767
|
|
40,754
|
|
|||||
|
All other (primarily ground services)
|
69,193
|
|
206,278
|
|
117,615
|
|
|||||
|
Total
|
$
|
892,345
|
|
$
|
1,068,200
|
|
$
|
768,870
|
|
||
The Company adopted Topic 606 for revenue recognition using a modified retrospective approach, under which financial statements are prepared under the revised guidance for the year of adoption, but not for prior years. The effects of Topic 606 on the Company's customer revenues and earnings are summarized below:
|
For the year ended December 31, 2018
|
||||||||||||
|
As Reported
|
Without Topic 606
|
Increase (decrease)
|
||||||||||
|
Revenue
|
||||||||||||
|
CAM
|
$
|
156,516
|
|
$
|
156,516
|
|
$
|
—
|
|
|||
|
ACMI Services
|
548,804
|
|
743,112
|
|
(194,308
|
)
|
||||||
|
MRO Services
|
117,832
|
|
100,790
|
|
17,042
|
|
||||||
|
All other
|
69,193
|
|
249,222
|
|
(180,029
|
)
|
||||||
|
Total Revenue
|
892,345
|
|
1,249,640
|
|
(357,295
|
)
|
||||||
|
Operating Expense
|
781,327
|
|
1,138,462
|
|
(357,135
|
)
|
||||||
|
Earnings (Loss) from Continuing Operations before Income Taxes
|
87,478
|
|
87,638
|
|
(160
|
)
|
||||||
|
Income Tax Benefit (Expense)
|
(19,595
|
)
|
(19,559
|
)
|
(36
|
)
|
||||||
|
Income from Continuing Operations
|
$
|
67,883
|
|
$
|
68,079
|
|
$
|
(196
|
)
|
|||
81
ACMI Services revenues are generated from airline service agreements and are typically based on hours flown, the amount of aircraft operated and crew resources provided during a month. ACMI Services revenues are recognized over time using the invoice practical expedient as flight hours are performed for the customer. Certain agreements include provisions for incentive payments based upon on-time reliability. These incentives are measured on a monthly basis and recorded to revenue in the corresponding month earned. Under CMI agreements, the Company's airlines have an obligation to provide integrated services including flight crews, aircraft maintenance and insurance for the customer's cargo network. Under ACMI agreements, the Company's airlines are also obligated to provide aircraft. Under CMI and ACMI agreements, customers are generally responsible for aviation fuel, landing fees, navigation fees and certain other flight expenses. When functioning as the customers' agent for arranging such services, the Company records amounts reimbursable from the customer as revenues net of the related expenses as the costs are incurred. Under charter agreements the Company's airline is obligated to provide full services for one or more flights having specific origins and destinations. Under charter agreements in which the Company's airline is responsible for fuel, airport fees and all flight services, the related costs are recorded in operating expenses. ACMI Services are invoiced monthly or more frequently. (There are no customer rewards programs associated with services offered by the Company nor does the Company sell passenger tickets or issue freight bills.)
MRO Services revenues for customer contracts for airframe maintenance and aircraft modification services that do not have an alternative use and for which the Company has an enforceable right to payment are generally recognized over time based on the percentage of costs completed. Other MRO Services revenues for aircraft part sales, component repairs and line service are recognized at a point in time typically when the parts are delivered to the customer and the the services are completed. For airframe maintenance, aircraft modifications and aircraft component repairs, contracts include assurance warranties that are not sold separately. Effective January 1, 2018 the Company records revenues and estimated earnings over time for its airframe maintenance and aircraft modification contracts using the percentage-of-completion cost input method. For such services, the Company estimates the earnings on a contract as the difference between the expected revenue and estimated costs to complete a contract and recognizes revenues and earnings based on the proportion of costs incurred compared to the total estimated costs. The Company's estimates consider the timing and extent of the services, including the amount and rates of labor, materials and other resources required to perform the services. The Company recognizes adjustments in estimated earnings on a contract under the cumulative catch-up method in which the impact of the adjustment on estimated earnings of a contract is recognized in the period the adjustment is identified. The Company's external customer revenues for providing load transfer and sorting services and related equipment maintenance were
$66.6 million
,
$204.1 million
and
$114.8 million
for 2018, 2017 and 2016 respectively. During 2018, the Company netted
$180.0 million
of customer reimbursable revenues against the related expenses when functioning as the customers' agent for arranging ground services. These revenues are reported in All other. The Company's external customer revenues from providing load transfer and sorting services are recognized as the services are performed for the customer over time. Revenues from related equipment maintenance services are recognized over time and at a point in time depending on the nature of the customer contracts. For customers that are not a governmental agency or department, the Company generally receives partial payment in advance of services, otherwise customer balances are typically paid within 30 to 60 days of service. The Company recognized
$9.3 million
of non lease revenue that was reported in deferred revenue at the beginning of the year. Deferred revenue was
$3.1 million
and
$9.5 million
at December 31, 2018 and 2017, respectively, for contracts with customers.
CAM's aircraft lease revenues are recognized as operating lease revenues on a straight-line basis over the term of the applicable lease agreements. Customer payments for leased aircraft and equipment are typically paid monthly in advance.
The Company had revenues of approximately
$231.8 million
,
$170.1 million
and
$168.2 million
for 2018, 2017 and 2016, respectively, derived primarily from aircraft leases in foreign countries, routes with flights departing from or arriving in foreign countries or aircraft maintenance and modification services performed in foreign countries. All revenues from the CMI agreement with DHL and the ATSA agreement with ASI are attributed to U.S. operations. As of December 31, 2018 and 2017, the Company had 23 and 16 aircraft, respectively, deployed outside of the United States.
82
The Company's other segment information from continuing operations is presented below (in thousands):
|
|
Year Ended December 31
|
||||||||||
|
|
2018
|
2017
|
2016
|
||||||||
|
Depreciation and amortization expense:
|
|||||||||||
|
CAM
|
$
|
126,856
|
|
$
|
108,106
|
|
$
|
92,396
|
|
||
|
ACMI Services
|
49,068
|
|
41,929
|
|
41,487
|
|
|||||
|
MRO Services
|
3,397
|
|
3,324
|
|
1,477
|
|
|||||
|
All other
|
(426
|
)
|
1,197
|
|
136
|
|
|||||
|
Total
|
$
|
178,895
|
|
$
|
154,556
|
|
$
|
135,496
|
|
||
|
Segment earnings (loss):
|
|||||||||||
|
CAM
|
$
|
65,576
|
|
$
|
61,510
|
|
$
|
68,608
|
|
||
|
ACMI Services
|
17,717
|
|
8,557
|
|
(25,016
|
)
|
|||||
|
MRO Services
|
14,499
|
|
19,741
|
|
12,308
|
|
|||||
|
All other
|
9,107
|
|
5,590
|
|
9,519
|
|
|||||
|
Inter-segment earnings eliminated
|
(12,436
|
)
|
(11,583
|
)
|
(5,498
|
)
|
|||||
|
Net unallocated interest expense
|
(6,729
|
)
|
(1,322
|
)
|
(545
|
)
|
|||||
|
Net gain (loss) on financial instruments
|
7,296
|
|
(79,789
|
)
|
(18,107
|
)
|
|||||
|
Transaction fees
|
(5,264
|
)
|
—
|
|
—
|
|
|||||
|
Other non-service components of retiree benefit costs, net
|
8,180
|
|
(6,105
|
)
|
(6,815
|
)
|
|||||
|
Loss from non-consolidated affiliate
|
(10,468
|
)
|
(3,135
|
)
|
—
|
|
|||||
|
Pre-tax earnings from continuing operations
|
$
|
87,478
|
|
$
|
(6,536
|
)
|
$
|
34,454
|
|
||
The Company's assets are presented below by segment (in thousands). Cash and cash equivalents are reflected in Assets - All other..
|
December 31
|
|||||||||||
|
|
2018
|
2017
|
2016
|
||||||||
|
Assets:
|
|||||||||||
|
CAM
|
$
|
1,577,182
|
|
$
|
1,192,890
|
|
$
|
971,986
|
|
||
|
ACMI Services
|
759,131
|
|
189,379
|
|
164,489
|
|
|||||
|
MRO Services
|
108,244
|
|
87,177
|
|
77,918
|
|
|||||
|
All other
|
26,028
|
|
79,398
|
|
44,937
|
|
|||||
|
Total
|
$
|
2,470,585
|
|
$
|
1,548,844
|
|
$
|
1,259,330
|
|
||
Interest expense allocated to CAM was
$21.8 million
,
$15.6 million
and
$10.6 million
for the years ending
December 31, 2018
, 2017 and 2016, respectively.
During 2018, the Company had capital expenditures for property and equipment of
$38.9 million
,
$249.4 million
and
$2.2 million
for the ACMI Services, CAM and MRO Services segments, respectively.
83
NOTE P—DISCONTINUED OPERATIONS
The Company's results of discontinued operations consist primarily of changes in liabilities related to benefits for former employees previously associated with ABX's former hub operation for DHL. The Company may incur expenses and cash outlays in the future related to pension obligations, self-insurance reserves for medical expenses and wage loss for former employees. Carrying amounts of significant assets and liabilities of the discontinued operations are below (in thousands):
|
|
December 31
|
||||||
|
|
2018
|
2017
|
|||||
|
Liabilities
|
|||||||
|
Employee compensation and benefits
|
$
|
16,807
|
|
$
|
17,880
|
|
|
|
Post-retirement
|
846
|
|
4,652
|
|
|||
|
Total Liabilities
|
$
|
17,653
|
|
$
|
22,532
|
|
|
During 2018, pre-tax earnings from discontinued operations were
$1.8 million
. Pre-tax results from discontinued operations were losses of
$5.1 million
and earnings of
$3.8 million
during 2017 and 2016, respectively.
NOTE Q—INVESTMENTS IN NON- CONSOLIDATED AFFIITATES
(Unaudited)
As described in Note C, the Company has investments in two non-consolidated affiliates. These investments are intended to expand the Company's freighter aircraft lease portfolio internationally and bring a freighter aircraft variant to market. While management considers the Company's participation in these non-consolidated affiliates as potentially beneficial to future operating results, such participation is not essential to the Company. The Company shares in the earnings (losses) of these non-consolidated affiliates generally in accordance with the respective equity interests. The following table presents combined condensed information from the statements of operations of the Company's non-consolidated affiliates (in thousands):
|
Year Ended December 31,
|
||||||||||||
|
2018
|
2017
|
2016
|
||||||||||
|
Revenues
|
$
|
202,028
|
|
$
|
172,526
|
|
$
|
157,945
|
|
|||
|
Expenses
|
(228,169
|
)
|
(196,334
|
)
|
(170,317
|
)
|
||||||
|
Income (Loss)
|
$
|
(26,141
|
)
|
$
|
(23,808
|
)
|
$
|
(12,372
|
)
|
|||
The following table presents combined condensed balance sheet information for our unconsolidated joint ventures (in thousands):
|
December 31,
|
||||||||
|
2018
|
2017
|
|||||||
|
Current assets
|
$
|
64,262
|
|
$
|
50,516
|
|
||
|
Non current assets
|
80,724
|
|
103,174
|
|
||||
|
Current liabilities
|
(38,938
|
)
|
(33,315
|
)
|
||||
|
Non current liabilities
|
(102,657
|
)
|
(117,338
|
)
|
||||
|
Equity
|
$
|
(3,391
|
)
|
$
|
(3,037
|
)
|
||
84
NOTE R—QUARTERLY RESULTS
(Unaudited)
The following is a summary of quarterly results of operations (in thousands, except per share amounts):
|
|
1st
Quarter
|
2nd
Quarter
|
3rd
Quarter
|
4th
Quarter
|
|||||||||||
|
2018
(1)
|
|||||||||||||||
|
Revenues from continuing operations
|
$
|
203,040
|
|
$
|
203,607
|
|
$
|
204,919
|
|
$
|
280,779
|
|
|||
|
Operating income from continuing operations
|
27,643
|
|
23,898
|
|
26,827
|
|
32,650
|
|
|||||||
|
Net earnings (loss) from continuing operations
|
15,682
|
|
24,464
|
|
32,933
|
|
(5,196
|
)
|
|||||||
|
Net earnings from discontinued operations
|
196
|
|
170
|
|
170
|
|
866
|
|
|||||||
|
Weighted average shares:
|
|||||||||||||||
|
Basic
|
58,840
|
|
58,739
|
|
58,739
|
|
58,740
|
|
|||||||
|
Diluted
|
59,558
|
|
68,363
|
|
68,323
|
|
58,740
|
|
|||||||
|
Earnings (loss) per share from continuing operations
|
|||||||||||||||
|
Basic
|
$
|
0.27
|
|
$
|
0.42
|
|
$
|
0.56
|
|
$
|
(0.09
|
)
|
|||
|
Diluted
|
$
|
0.26
|
|
$
|
0.21
|
|
$
|
0.24
|
|
$
|
(0.09
|
)
|
|||
|
2017
(3)
|
|||||||||||||||
|
Revenues from continuing operations
|
$
|
237,917
|
|
$
|
253,211
|
|
$
|
254,101
|
|
$
|
322,971
|
|
|||
|
Operating income from continuing operations
|
17,930
|
|
23,125
|
|
24,452
|
|
33,893
|
|
|||||||
|
Net earnings (loss) from continuing operations (2)
|
9,796
|
|
(53,918
|
)
|
(28,229
|
)
|
94,091
|
|
|||||||
|
Net earnings (loss) from discontinued operations
|
192
|
|
192
|
|
(4,655
|
)
|
1,026
|
|
|||||||
|
Weighted average shares:
|
|||||||||||||||
|
Basic
|
59,133
|
|
59,035
|
|
58,733
|
|
58,733
|
|
|||||||
|
Diluted
|
64,949
|
|
59,035
|
|
58,733
|
|
68,987
|
|
|||||||
|
Earnings (loss) per share from continuing operations
|
|||||||||||||||
|
Basic
|
$
|
0.17
|
|
$
|
(0.91
|
)
|
$
|
(0.48
|
)
|
$
|
1.60
|
|
|||
|
Diluted
|
$
|
0.13
|
|
$
|
(0.91
|
)
|
$
|
(0.48
|
)
|
$
|
1.11
|
|
|||
|
1.
|
During 2018, the Company recorded a
$0.9 million
loss, a
$11.7 million
gain, a
$17.9 million
gain and a
$21.4 million
loss on the remeasurement of financial instruments, primarily related to the warrants issued to Amazon for the quarters ended March 31, 2018, June 30, 2018, September 30, 2018 and December 31, 2018, respectively.
|
|
2.
|
During 2017, the Company recorded a
$59.9 million
deferred tax gain during the quarter ended December 31, 2017 due to the enactment of lower U.S. federal corporate tax rates.
|
|
3.
|
During 2017, the Company recorded a
1.9 million
gain, a
67.6 million
loss, a
34.4 million
loss and a
20.4 million
gain on the remeasurement of financial instruments, primarily related to the warrants issued to Amazon for the quarters ended March 31, 2017, June 30, 2017, September 30, 2017 and December 31, 2017, respectively.
|
85
ITEM 9. CHANGES IN AND DISAGREEMENTS WITH ACCOUNTANTS ON ACCOUNTING AND FINANCIAL DISCLOSURE
None.
ITEM 9A. CONTROLS AND PROCEDURES
(a) Evaluation of Disclosure Controls and Procedures
As of
December 31, 2018
, the Company carried out an evaluation, under the supervision and with the participation of the Company's Chief Executive Officer and Chief Financial Officer of the effectiveness of the design and operation of the Company's disclosure controls and procedures (as defined in Rules 13a-15(e) and 15d-15(e) under the Securities Exchange Act of 1934, as amended (the "Exchange Act")). Based upon the evaluation, the Company's Chief Executive Officer and Chief Financial Officer concluded that the Company's disclosure controls and procedures were effective to ensure that information required to be disclosed by the Company in the reports filed or submitted by it under the Exchange Act is recorded, processed, summarized and reported within time periods specified in the Securities and Exchange Commission rules and forms and is accumulated and communicated to management, including the Chief Executive Officer and Chief Financial Officer, or persons performing similar functions, as appropriate to allow timely decisions regarding required disclosure.
(b) Changes in Internal Controls
Except for the internal controls of Omni, which was acquired on November 9, 2018, there were no changes in internal control over financial reporting during the most recently completed fiscal year that has materially affected, or is reasonably likely to materially affect, the Company's internal control over financial reporting.
Management’s Annual Report on Internal Controls over Financial Reporting
The management of the Company is responsible for establishing and maintaining adequate internal control over financial reporting. The Company’s internal control system is designed to provide reasonable assurance regarding the reliability of financial reporting and the preparation of financial statements for external purposes, in accordance with generally accepted accounting principles.
All internal control systems, no matter how well designed, have inherent limitations. Therefore, even those systems determined to be effective can provide only reasonable assurance with respect to financial statement preparation and presentation.
The Company’s management assessed the effectiveness of the Company’s internal control over financial reporting as of December 31, 2018. In making this assessment, it used the criteria set forth by the Committee of Sponsoring Organizations of the Treadway Commission (COSO) in
Internal Control—Integrated Framework (2013).
The Company’s assessment of and conclusion on the effectiveness of its internal control over financial reporting did not include the internal controls of Omni which was acquired on November 9, 2018 and was included in the 2018 consolidated financial statements. The Omni acquisition constituted 23% of the Company’s total assets as of December 31, 2018, and 7% of total net revenues, for the year end December 31, 2018.
Based on management’s assessment of those criteria, management believes that, as of December 31, 2018, the Company’s internal control over financial reporting was effective.
The effectiveness of our internal controls over financial reporting as of December 31, 2018 has been audited by our independent registered accounting firm as stated in its attestation report that follows this report.
March 1, 2019
86
REPORT OF INDEPENDENT REGISTERED PUBLIC ACCOUNTING FIRM
To the stockholders and the Board of Directors of Air Transport Services Group, Inc.
Opinion on Internal Control over Financial Reporting
We have audited the internal control over financial reporting of Air Transport Services Group, Inc. and subsidiaries (the “Company”) as of December 31, 2018, based on criteria established in Internal Control - Integrated Framework (2013) issued by the Committee of Sponsoring Organizations of the Treadway Commission (COSO). In our opinion, the Company maintained, in all material respects, effective internal control over financial reporting as of December 31, 2018, based on criteria established in Internal Control - Integrated Framework (2013) issued by COSO.
We have also audited, in accordance with the standards of the Public Company Accounting Oversight Board (United States) (PCAOB), the consolidated financial statements and financial statement schedule as of and for the year ended December 31, 2018, of the Company and our report dated March 1, 2019, expressed an unqualified opinion on those consolidated financial statements and financial statement schedule and includes an explanatory regarding the Company's three principal customers and an explanatory paragraph regarding the Company's adoption of the new revenue accounting standard.
As described in Management’s Annual Report on Internal Controls over Financial Reporting, management excluded from its assessment the internal control over financial reporting at Omni Air International, Inc. and subsidiaries, which was acquired on November 9, 2018, and whose financial statements constitute 23% of total assets and 7% of revenues of the consolidated financial statement amounts as of and for the year ended December 31, 2018. Accordingly, our audit did not include the internal control over financial reporting at Omni Air International, Inc. and subsidiaries.
Basis for Opinion
The Company’s management is responsible for maintaining effective internal control over financial reporting and for its assessment of the effectiveness of internal control over financial reporting, included in the accompanying Management's Annual Report on Internal Controls over Financial Reporting. Our responsibility is to express an opinion on the Company’s internal control over financial reporting based on our audit. We are a public accounting firm registered with the PCAOB and are required to be independent with respect to the Company in accordance with the U.S. federal securities laws and the applicable rules and regulations of the Securities and Exchange Commission and the PCAOB.
We conducted our audit in accordance with the standards of the PCAOB. Those standards require that we plan and perform the audit to obtain reasonable assurance about whether effective internal control over financial reporting was maintained in all material respects. Our audit included obtaining an understanding of internal control over financial reporting, assessing the risk that a material weakness exists, testing and evaluating the design and operating effectiveness of internal control based on the assessed risk, and performing such other procedures as we considered necessary in the circumstances. We believe that our audit provides a reasonable basis for our opinion.
Definition and Limitations of Internal Control over Financial Reporting
A company’s internal control over financial reporting is a process designed to provide reasonable assurance regarding the reliability of financial reporting and the preparation of financial statements for external purposes in accordance with generally accepted accounting principles. A company’s internal control over financial reporting includes those policies and procedures that (1) pertain to the maintenance of records that, in reasonable detail, accurately and fairly reflect the transactions and dispositions of the assets of the company; (2) provide reasonable assurance that transactions are recorded as necessary to permit preparation of financial statements in accordance with generally accepted accounting principles, and that receipts and expenditures of the company are being made only in accordance with authorizations of management and directors of the company; and (3) provide reasonable assurance regarding prevention or timely detection of unauthorized acquisition, use, or disposition of the company’s assets that could have a material effect on the financial statements.
87
Because of its inherent limitations, internal control over financial reporting may not prevent or detect misstatements. Also, projections of any evaluation of effectiveness to future periods are subject to the risk that controls may become inadequate because of changes in conditions, or that the degree of compliance with the policies or procedures may deteriorate.
/s/ DELOITTE & TOUCHE LLP
Cincinnati, Ohio
March 1, 2019
88
ITEM 9B. OTHER INFORMATION
None.
PART III
ITEM 10. DIRECTORS, EXECUTIVE OFFICERS AND CORPORATE GOVERNANCE
The response to this Item is incorporated herein by reference to the definitive Proxy Statement for the 2019 Annual Meeting of Stockholders under the captions “Election of Directors,” “Section 16(a) Beneficial Ownership Reporting Compliance,” and “Corporate Governance and Board Matters.”
Executive Officers
The following table sets forth information about the Company’s executive officers. The executive officers serve at the pleasure of the Company’s Board of Directors.
|
Name
|
Age
|
Information
|
||
|
Joseph C. Hete
|
64
|
|
President and Chief Executive Officer, Air Transport Services Group, Inc., since December 2007 and Chief Executive Officer, ABX Air, Inc., since August 2003.
Mr. Hete was President of ABX Air, Inc. from January 2000 to February 2008. Mr. Hete was Chief Operating Officer of ABX Air, Inc. from January 2000 to August 2003. From 1997 until January 2000, Mr. Hete held the position of Senior Vice President and Chief Operating Officer of ABX Air, Inc. Mr. Hete served as Senior Vice President, Administration of ABX Air, Inc. from 1991 to 1997 and Vice President, Administration of ABX Air, Inc. from 1986 to 1991. Mr. Hete joined ABX Air, Inc. in 1980.
|
|
|
Quint O. Turner
|
56
|
|
Chief Financial Officer, Air Transport Services Group, Inc., since February 2008 and Chief Financial Officer, ABX Air, Inc. since December 2004.
Mr. Turner was Vice President of Administration of ABX Air, Inc. from February 2002 to December 2004. Mr. Turner was Corporate Director of Financial Planning and Accounting of ABX Air, Inc. from 1997 to 2002. Prior to 1997, Mr. Turner held positions of Manager of Planning and Director of Financial Planning of ABX Air, Inc. Mr. Turner joined ABX Air, Inc. in 1988.
|
|
|
Richard F. Corrado
|
59
|
|
Chief Operating Officer, Air Transport Services Group, Inc., since September 2017. President of Cargo Aircraft Management Inc., since April 2010. President of Airborne Global Solutions, Inc. since July 2010. Mr. Corrado was Chief Commercial Officer, Air Transport Services Group, Inc., from April 2010 to September 2017
|
|
|
Before joining ATSG, Mr. Corrado was President of Transform Consulting Group from July 2006 through March 2010 and Chief Operating Officer of AFMS Logistics Management from February 2008 through March 2010. He was Executive Vice President of Air Services and Business Development for DHL Express from September 2003 through June of 2006; and Senior Vice President of Marketing for Airborne Express from August 2000 through August 2003.
|
||||
|
W. Joseph Payne
|
55
|
|
Chief Legal Officer & Secretary, Air Transport Services Group, Inc., since May 2016; Senior Vice President, Corporate General Counsel and Secretary, Air Transport Services Group, Inc., since February 2008; and Vice President, General Counsel and Secretary, ABX Air, Inc. since January 2004.
Mr. Payne was Corporate Secretary/Counsel of ABX Air, Inc. from January 1999 to January 2004, and Assistant Corporate Secretary from July 1996 to January 1999. Mr. Payne joined ABX Air, Inc. in April 1995.
|
|
89
|
Name
|
Age
|
Information
|
||
|
Michael L. Berger
|
57
|
|
Chief Commercial Officer, Air Transport Services Group, Inc. and President of Airborne Global Solutions since February 2018. Before joining ATSG, Mr. Berger was Chief Commercial Officer for Dicom Transportation group of Canada from March 2017 through February 2018. Mr. Berger was Global Head of Sales for TNT Express based in Amsterdam from September 2014 through February 2017.
Mr.Berger joined Airborne Express in 1986 and worked 28 years for Airborne Express and its successor, DHL Express where he held many roles including Head of Sales for the United States.
|
|
The executive officers of the Company are appointed annually at the Board of Directors meeting held in conjunction with the annual meeting of stockholders. There are no family relationships between any directors or executive officers of the Company.
ITEM 11. EXECUTIVE COMPENSATION
The response to this Item is incorporated herein by reference to the definitive Proxy Statement for the 2019 Annual Meeting of Stockholders under the captions “Executive Compensation” and “Director Compensation.”
ITEM 12. SECURITY OWNERSHIP OF CERTAIN BENEFICIAL OWNERS AND MANAGEMENT AND RELATED STOCKHOLDER MATTERS
The responses to this Item are incorporated herein by reference to the definitive Proxy Statement for the 2019 Annual Meeting of Stockholders under the captions “Equity Compensation Plan Information,” “Voting at the Meeting,” “Stock Ownership of Management” and “Common Stock Ownership of Certain Beneficial Owners.”
ITEM 13. CERTAIN RELATIONSHIPS AND RELATED TRANSACTIONS, AND DIRECTOR INDEPENDENCE
The response to this Item is incorporated herein by reference to the definitive Proxy Statement for the 2019 Annual Meeting of Stockholders under the captions “Related Person Transactions” and “Independence.”
ITEM 14. PRINCIPAL ACCOUNTING FEES AND SERVICES
The response to this Item is incorporated herein by reference to the definitive Proxy Statement for the 2019 Annual Meeting of Stockholders under the caption “Fees of the Independent Registered Public Accounting Firm.”
PART IV
ITEM 15. EXHIBITS AND FINANCIAL STATEMENT SCHEDULES
|
(a)
|
List of Documents filed as part of this report:
|
|
(1)
|
Consolidated Financial Statements
|
The following are filed in Part II, item 8 of this Form 10-K Annual Report:
Report of Independent Registered Public Accounting Firm
Consolidated Balance Sheets
Consolidated Statements of Operations
Consolidated Statements of Comprehensive Income
Consolidated Statements of Cash Flows
Consolidated Statements of Stockholders’ Equity
Notes to Consolidated Financial Statements
|
(2)
|
Financial Statement Schedules
|
90
Schedule II—Valuation and Qualifying Account
|
Description
|
Balance at
beginning
of period
|
Additions charged to
cost and expenses
|
Deductions
|
Balance at end
of period
|
|||||||||||
|
Accounts receivable reserve:
|
|||||||||||||||
|
Year ended:
|
|||||||||||||||
|
December 31, 2018
|
$
|
2,445,310
|
|
$
|
596,000
|
|
$
|
1,597,505
|
|
$
|
1,443,805
|
|
|||
|
December 31, 2017
|
1,264,211
|
|
1,184,099
|
|
3,000
|
|
2,445,310
|
|
|||||||
|
December 31, 2016
|
415,336
|
|
1,006,307
|
|
157,432
|
|
1,264,211
|
|
|||||||
All other schedules are omitted because they are not applicable or are not required, or because the required information is included in the consolidated financial statements or notes thereto.
|
(3)
|
Exhibits
|
The following exhibits are filed with or incorporated by reference into this report.
|
Exhibit No.
|
Description of Exhibit
|
|
Articles of Incorporation
|
|
|
3.1
|
|
|
3.2
|
|
|
Instruments defining the rights of security holders
|
|
|
4.1
|
|
|
4.2
|
|
|
Material Contracts
|
|
|
10.1
|
|
|
10.2
|
|
|
10.3
|
|
|
10.4
|
|
|
10.5
|
|
|
10.6
|
|
|
10.7
|
|
|
10.8
|
|
|
10.9
|
|
91
|
10.10
|
|
|
10.11
|
|
|
10.12
|
|
|
10.13
|
|
|
10.14
|
|
|
10.15
|
|
|
10.16
|
|
|
10.17
|
|
|
10.18
|
|
|
10.19
|
|
|
10.20
|
|
|
10.21
|
|
|
10.22
|
|
|
10.23
|
|
|
10.24
|
|
|
10.25
|
|
92
|
10.26
|
|
|
10.27
|
|
|
10.28
|
|
|
10.29
|
|
|
10.30
|
|
|
10.31
|
|
|
10.32
|
|
|
10.33
|
|
|
10.34
|
|
|
10.35
|
|
|
10.36
|
|
|
10.37
|
|
|
10.38
|
|
|
10.39
|
|
|
10.40
|
|
93
|
10.41
|
|
|
10.42
|
|
|
10.43
|
|
|
10.44
|
|
|
10.45
|
|
|
10.46
|
|
|
10.47
|
|
|
10.48
|
|
|
10.49
|
|
|
10.50
|
|
|
10.51
|
|
|
10.52
|
|
|
10.53
|
|
|
10.54
|
|
|
10.55
|
|
|
10.56
|
|
|
10.57
|
|
|
10.58
|
|
|
10.59
|
|
|
10.60
|
|
|
10.61
|
|
94
|
10.62
|
|
|
10.63
|
|
|
10.64
|
|
|
10.65
|
|
|
10.66
|
|
|
10.67
|
|
|
Code of Ethics
|
|
|
14.1
|
Code of Ethics—CEO and CFO. (1)
|
|
List of Significant Subsidiaries
|
|
|
21.1
|
|
|
Consent of experts and counsel
|
|
|
23.1
|
|
|
Certifications
|
|
|
31.1
|
|
|
31.2
|
|
|
32.1
|
|
|
32.2
|
|
95
|
101.INS
|
XBRL Instance Document
|
|
101.SCH
|
XBRL Taxonomy Extension Schema Document
|
|
101.CAL
|
XBRL Taxonomy Extension Calculation Linkbase Document
|
|
101.DEF
|
XBRL Taxonomy Extension Definition Linkbase Document
|
|
101.LAB
|
XBRL Taxonomy Extension Labels Linkbase Document
|
|
101.PRE
|
XBRL Taxonomy Extension Presentation Linkbase Document
|
____________________
|
(1)
|
The Company's Code of Ethics can be accessed from the Company's Internet website at www.atsginc.com.
|
|
(2)
|
Incorporated by reference to the Company’s Quarterly Report on Form 10-Q, filed with the Securities and Exchange Commission on November 9, 2006.
|
|
(3)
|
Incorporated by reference to the Company’s Annual Report on Form 10-K/A filed on August 14, 2007 with the Securities and Exchange Commission.
|
|
(4)
|
Incorporated by reference to the Company’s Quarterly Report on Form 10-Q/A, filed with the Securities and Exchange Commission on August 14, 2007.
|
|
(5)
|
Incorporated by reference to the Company’s Quarterly Report on Form 10-Q, filed with the Securities and Exchange Commission on August 14, 2007.
|
|
(6)
|
Incorporated by reference to the Company’s Quarterly Report on Form 10-Q, filed with the Securities and Exchange Commission on August 10, 2009.
|
|
(7)
|
Incorporated by reference to the Company’s Annual Report on Form 10-K filed on March 17, 2008 with the Securities and Exchange Commission.
|
|
(8)
|
Incorporated by reference to the Company's Proxy Statement for the 2018 Annual Meeting of Stockholders, Corporate Governance and Board Matters, filed March 30, 2018 with the Securities and Exchange Commission.
|
|
(9)
|
Incorporated by reference to the Company's Quarterly Report on Form 10-Q filed with the Securities and Exchange Commission on May 10, 2010.
|
|
(10)
|
Incorporated by reference to the Company's Quarterly Report on Form 10-Q filed with the Securities and Exchange Commission on November 3, 2010. Those portions of the Agreement marked with an [*] have been omitted pursuant to a request for confidential treatment and have been filed separately with the SEC.
|
|
(11)
|
Incorporated by reference to the Company's Quarterly Report on Form 10-Q filed with the Securities and Exchange Commission on August 3, 2011.
|
|
(12)
|
Incorporated by reference to the Company's Form 8-K filed with the Securities and Exchange Commission on June 18, 2012.
|
|
(13)
|
Incorporated by reference to the Company's Form 8-K filed with the Securities and Exchange Commission on July 24, 2012.
|
|
(14)
|
Incorporated by reference to the Company's Quarterly Report on Form 10-Q filed with the Securities and Exchange Commission on August 2, 2012.
|
|
(15)
|
Incorporated by reference to the Company's Annual Report on Form 10-K filed with the Securities and Exchange Commission on March 4, 2013. Those portions of the Agreement marked with an [*] have been omitted pursuant to a request for confidential treatment and have been filed separately with the SEC.
|
|
(16)
|
Incorporated by reference to the Company's Quarterly Report on Form 10-Q filed with the Securities and Exchange Commission on August 8, 2013.
|
|
(17)
|
Incorporated by reference to the Company's Quarterly Report on Form 10-Q filed with the Securities and Exchange Commission on November 6, 2013.
|
|
(18)
|
Incorporated by reference to the Company's Quarterly Report on Form 10-Q filed with the Securities and Exchange Commission on May 12, 2014.
|
|
(19)
|
Incorporated by reference to the Company's Quarterly Report on Form 10-Q filed with the Securities and Exchange Commission on August 5, 2014.
|
|
(20)
|
Incorporated by reference to the Company's Quarterly Report on Form 10-Q filed with the Securities and Exchange Commission on May 8, 2015, as amended by the Company's Quarterly Report on Form 10-Q/A filed with the Securities and Exchange Commission on August 7, 2015.
|
96
|
(21)
|
Incorporated by reference to the Company's Quarterly Report on Form 10-Q filed with the Securities and Exchange Commission on August 7, 2015.
|
|
(22)
|
Incorporated by reference to the Company's Quarterly Report on Form 10-Q filed with the Securities and Exchange Commission on May 10, 2016.
|
|
(23)
|
Incorporated by reference to the Company's Quarterly Report on Form 10-Q filed with the Securities and Exchange Commission on August 8, 2016.
|
|
(24)
|
Incorporated by reference to the Company's Form 8-K filed with the Securities and Exchange Commission on March 15, 2016.
|
|
(25)
|
Incorporated by reference to the Company's Form 8-K filed with the Securities and Exchange Commission on June 27, 2016.
|
|
(26)
|
Incorporated by reference to the Company's Quarterly Report on Form 10-Q filed with the Securities and Exchange Commission on May 8, 2017.
|
|
(27)
|
Incorporated by reference to the Company's Form 8-K filed with the Securities and Exchange Commission on June 2, 2017.
|
|
(28)
|
Incorporated by reference to the Company's Form 8-K filed with the Securities and Exchange Commission on September 29, 2017.
|
|
(29)
|
Incorporated by reference to the Company's Form 8-K filed with the Securities and Exchange Commission on September 25, 2017.
|
|
(30)
|
Incorporated by reference to the Company's Quarterly Report on Form 10-Q filed with the Securities and Exchange Commission on November 9, 2017.
|
|
(31)
|
Incorporated by reference to the Company's Quarterly Report on Form 10-Q filed with the Securities and Exchange Commission on August 8, 2018
|
97
SIGNATURES
Pursuant to the requirements of Section 13 or 15(d) of the Securities Exchange Act of 1934, the registrant has duly caused this report to be signed on its behalf by the undersigned, thereunto duly authorized.
Air Transport Services Group, Inc.
|
Signature
|
|
Title
|
|
Date
|
|
/
S
/ J
OSEPH
C. H
ETE
|
|
President and Chief Executive Officer (Principal Executive Officer)
|
|
March 1, 2019
|
|
Joseph C. Hete
|
||||
Pursuant to the requirements of the Securities Exchange Act of 1934, this report has been signed below by the following persons in the capacities and on the date indicated:
|
Signature
|
Title
|
|
Date
|
|
|
/S/ R
ANDY
D. R
ADEMACHER
|
Director and Chairman of the Board
|
|
March 1, 2019
|
|
|
Randy D. Rademacher
|
||||
|
/
S
/ R
ICHARD
M. B
AUDOUIN
|
Director
|
March 1, 2019
|
||
|
Richard M. Baudouin
|
||||
|
/
S
/ R
OBERT
K. C
ORETZ
|
Director
|
March 1, 2019
|
||
|
Robert K. Coretz
|
||||
|
/
S
/ J
OSEPH
C. H
ETE
|
Director, President and Chief Executive Officer (Principal Executive Officer)
|
|
March 1, 2019
|
|
|
Joseph C. Hete
|
||||
|
/
S
/ R
AYMOND
E. J
OHNS
J
R.
|
Director
|
March 1, 2019
|
||
|
Raymond E. Johns, Jr.
|
||||
|
/
S
/ L
AURA
J. P
ETERSON
|
Director
|
March 1, 2019
|
||
|
Laura J. Peterson
|
||||
|
/
S
/ J. C
HRISTOPHER
T
EETS
|
Director
|
|
March 1, 2019
|
|
|
J. Christopher Teets
|
||||
|
/
S
/ J
EFFREY
J. V
ORHOLT
|
Director
|
|
March 1, 2019
|
|
|
Jeffrey J. Vorholt
|
||||
|
/
S
/ Q
UINT
O. T
URNER
|
Chief Financial Officer (Principal Financial Officer and Principal Accounting Officer)
|
|
March 1, 2019
|
|
|
Quint O. Turner
|
||||
98
TABLE OF CONTENTS
Part IItem 1. BusinessItem 1A. Risk FactorsItem 1B. Unresolved Staff CommentsItem 2. PropertiesItem 3. Legal ProceedingsItem 4. Mine Safety DisclosuresPart IIItem 5. Market For Registrant S Common Equity, Related Stockholder Matters, and Issuer Purchases Of Equity SecuritiesItem 6. Selected Consolidated Financial DataItem 7. Management S Discussion and Analysis Of Financial Condition and Results Of OperationsItem 7A. Quantitative and Qualitative Disclosures About Market RiskItem 8. Financial Statements and Supplementary DataItem 9. Changes in and Disagreements with Accountants on Accounting and Financial DisclosureItem 9A. Controls and ProceduresItem 9B. Other InformationPart IIIItem 10. Directors, Executive Officers and Corporate GovernanceItem 11. Executive CompensationItem 12. Security Ownership Of Certain Beneficial Owners and Management and Related Stockholder MattersItem 13. Certain Relationships and Related Transactions, and Director IndependenceItem 14. Principal Accounting Fees and ServicesPart IVItem 15. Exhibits and Financial Statement Schedules