UNITED STATES SECURITIES AND EXCHANGE COMMISSION
WASHINGTON, D.C. 20549
FORM 10-K
(Mark One)
|
ý
|
ANNUAL REPORT PURSUANT TO SECTION 13 OR 15(d) OF THE SECURITIES EXCHANGE ACT OF 1934
|
|
|
For the fiscal year ended
|
December 31, 2018
|
|
OR
|
o
|
TRANSITION REPORT PURSUANT TO SECTION 13 OR 15(d) OF THE SECURITIES EXCHANGE ACT OF 1934
|
|
|
For the transition period from
|
|
to
|
|
|
|
Commission File Number
|
|
Registrant; State of Incorporation; Address and Telephone Number
|
|
IRS Employer Identification No.
|
|
|
|
|
|
|
|
001-38126
|

|
38-3980194
|
||
|
Altice USA, Inc.
|
||||
|
|
|
Delaware
|
|
|
|
|
|
1 Court Square West
|
|
|
|
|
|
Long Island City, New York 11101
|
|
|
|
|
|
(516) 803-2300
|
|
|
|
Securities registered pursuant to section 12(b) of the Act:
|
||
|
Title of each class
|
Name of exchange which registered
|
|
|
Class A Common Stock, par value $.01
|
New York Stock Exchange
|
|
Indicate by check mark if the Registrant is a well-known seasoned issuer, as defined in Rule 405 of the Securities Act.
Yes
ý
No
o
Indicate by check mark if the Registrant is not required to file reports pursuant to Section 13 or Section 15(d) of the Act.
Yes
o
No
ý
Indicate by check mark whether the Registrant (1) has filed all reports required to be filed by Section 13 or 15(d) of the Securities Exchange Act of 1934 during the preceding 12 months (or for such shorter period that the Registrant was required to file such reports), and (2) has been subject to such filing requirements for the past 90 days. Yes
ý
No
o
Indicate by check mark whether the Registrant has submitted electronically every Interactive Data File required to be submitted pursuant to Rule 405 of Regulation S-T (§232.405 of this chapter) during the preceding 12 months (or for such shorter period that the Registrants were required to submit such files). Yes
ý
No
o
Indicate by a check mark if disclosure of delinquent filers pursuant to Item 405 of Regulation S-K (§229.405) is not contained herein, and will not be contained, to the best of the Registrants' knowledge, in definitive proxy or information statements incorporated by reference in Part III of this Form 10-K or any amendment to this Form 10-K.
o
Indicate by check mark whether each Registrant is a large accelerated filer, an accelerated filer, a non-accelerated filer, a smaller reporting company or an emerging growth company. See the definitions of "large accelerated filer", "accelerated filer", "smaller reporting company", and "emerging growth company" in Rule 12b-2 of the Exchange Act. (Check one):
|
Large accelerated filer
|
ý
|
Accelerated filer
|
o
|
|
|
Non-accelerated filer
|
o
|
Smaller reporting company
|
o
|
|
|
(Do not check if a smaller reporting company)
|
Emerging growth company
|
o
|
||
If an emerging growth company, indicate by check mark if the registrant has elected not to use the extended transition period for complying with any new or revised financial accounting standards provided pursuant to Section 13(a) of the Exchange Act.
o
|
Indicate by check mark whether the Registrant is a shell company (as defined in Rule 12b-2 of the Act).
|
Yes
|
o
|
No
|
ý
|
Aggregate market value of the voting and non-voting common equity held by non-affiliates of Altice USA, Inc. computed by reference to the price at which the common equity was last sold on the New York Stock Exchange as of June 30, 2018: $
6,212,931,374
|
Number of shares of common stock outstanding as of February 22, 2019:
|
|
|
|
Class A common stock, par value $0.01
|
503,702,013
|
|
|
Class B common stock, par value $0.01
|
194,038,451
|
|
Documents incorporated by reference
- Altice USA, Inc. intends to file with the Securities and Exchange Commission, not later than 120 days after the close of its fiscal year, a definitive proxy statement or an amendment to this report filed under cover of Form 10-K/A containing the information required to be disclosed under Part III of Form 10-K.
TABLE OF CONTENTS
|
|
|
Page
|
|
|
Part I
|
|
|
|
|
|
1.
|
Business
|
|
|
|
|
|
|
|
|
1A.
|
Risk Factors
|
|
|
|
|
|
|
|
|
1B.
|
Unresolved Staff Comments
|
|
|
|
|
|
|
|
|
2.
|
Properties
|
|
|
|
|
|
|
|
|
3.
|
Legal Proceedings
|
|
|
|
|
|
|
|
|
4.
|
Mine Safety Disclosures
|
|
|
|
|
|
|
|
Part II
|
|
|
|
|
|
5.
|
Market for the Registrants' Common Equity, Related Stockholder Matters and Issuer Purchases of Equity Securities
|
|
|
|
|
|
|
|
|
6.
|
Selected Financial Data
|
|
|
|
|
|
|
|
|
7.
|
Management's Discussion and Analysis of Financial Condition and Results of Operations
|
|
|
|
|
|
|
|
|
7A.
|
Quantitative and Qualitative Disclosures About Market Risk
|
|
|
|
|
|
|
|
|
8.
|
Financial Statements and Supplementary Data
|
|
|
|
|
|
|
|
|
9.
|
Changes in and Disagreements with Accountants on Accounting and Financial Disclosure
|
|
|
|
|
|
|
|
|
9A.
|
Controls and Procedures
|
|
|
|
|
|
|
|
|
9B.
|
Other Information
|
|
|
|
|
|
|
|
Part III
|
|
|
|
|
|
10.
|
Directors and Executive Officers and Corporate Governance
|
*
|
|
|
|
|
|
|
|
11.
|
Executive Compensation
|
*
|
|
|
|
|
|
|
|
12.
|
Security Ownership of Certain Beneficial Owners and Management and Related Stockholders Matters
|
*
|
|
|
|
|
|
|
|
13.
|
Certain Relationships and Related Transactions, and Director Independence
|
*
|
|
|
|
|
|
|
|
14.
|
Principal Accountant Fees and Services
|
*
|
|
|
|
|
|
|
Part IV
|
|
|
|
|
|
15.
|
Exhibits and Financial Statement Schedules
|
|
|
*
|
Some or all of these items are omitted because Altice USA, Inc. intends to file with the Securities and Exchange Commission, not later than 120 days after the close of its fiscal year, a definitive proxy statement or an amendment to this report filed under cover of Form 10-K/A containing the information required to be disclosed under Part III of Form 10-K.
|
1
PART I
Item 1.
Business
Altice USA, Inc. ("Altice USA" or the "Company") was incorporated in Delaware on
September 14, 2015
. Prior to the Altice Europe Distribution discussed below, Altice USA was majority-owned by Altice Europe N.V. (formerly Altice N.V.), a public company with limited liability (naamloze vennootshcap) under Dutch law ("Altice Europe" and Altice Europe N.V. and its subsidiaries, the "Altice Group"). Since the completion of the Altice Europe Distribution discussed below, the Company is majority-owned by Patrick Drahi through Next Alt. S.a.r.l. ("Next Alt") rather than Altice Europe.
Altice USA is one of the largest broadband communications and video services providers in the United States and markets its services under two brands: Optimum, in the New York metropolitan area, and Suddenlink, principally in markets in the south-central United States. We deliver broadband, pay television, telephony services, proprietary content and advertising services to approximately
4.9 million
residential and business customers. Our footprint extends across 21 states through a fiber-rich broadband network with more than
8.7 million
homes passed as of
December 31, 2018
.
We acquired Cequel Corporation ("Suddenlink" or "Cequel") on December 21, 2015 and Cablevision Systems Corporation ("Optimum" or "Cablevision") on June 21, 2016. These acquisitions are referred to throughout this document as the "Suddenlink Acquisition" (or the "Cequel Acquisition") and the "Optimum Acquisition" (or the "Cablevision Acquisition"), respectively, and collectively as the "Acquisitions." We are a holding company that does not conduct any business operations of our own and we operate as one segment.
We are building a fiber-to-the-home ("FTTH") network, which will enable us to deliver more than 10 Gbps broadband speeds across our entire Optimum footprint and part of our Suddenlink footprint. Altice Gigabit fiber service provides a next-generation connectivity experience to support the most data-intensive activities, from streaming 4K ultra-high-definition ("UHD") and high-definition ("HD") video on multiple devices, online multi-player video game streaming platforms, video chatting, streaming music, high-quality virtual-and augmented reality experiences, and downloading large files simultaneously on dozens of devices at once. While building the FTTH network, we also continue to roll out enhanced broadband services to our customers on our existing hybrid fiber-coaxial ("HFC") network which is digital and data over cable service interface specification ("DOCSIS") 3.0. In addition to our Altice Gigabit fiber service, 1Gbps broadband services are expected to be available across our Optimum footprint in 2019 through Digital Switched Video upgrades. In addition, further 1Gbps capacity will be added in certain areas in our Suddenlink footprint.
During the fourth quarter of 2017, we introduced a home communications hub, Altice One, and we continue expanding the availability of this device. Altice One is an innovative, integrated platform with a dynamic and sophisticated user interface, combining a set-top box, Internet wireless router and cable modem in one device, and it is our most advanced home communications hub. The initial roll out of Altice One across our footprint is now complete, with availability to over 80% of our entire footprint. We have reached approximately 300 thousand Altice One customers as of December 31, 2018.
The following table presents certain financial data and metrics for the Company:
|
Years ended December 31,
|
|||||||||||
|
(in thousands except percentage data)
|
2018
|
2017
|
2016 (a)
|
||||||||
|
Customer Relationships
|
4,919.6
|
|
4,906.3
|
|
4,891.8
|
|
|||||
|
% growth
|
0.3
|
%
|
0.3
|
%
|
|||||||
|
Revenue
|
$
|
9,566,608
|
|
$
|
9,306,950
|
|
$
|
6,017,212
|
|
||
|
Adjusted EBITDA (b)
|
$
|
4,163,078
|
|
$
|
3,981,410
|
|
$
|
2,417,878
|
|
||
|
% of Revenue
|
43.5
|
%
|
42.8
|
%
|
40.2
|
%
|
|||||
|
Adjusted EBITDA less capital expenditures (cash basis) (b)
|
$
|
3,009,489
|
|
$
|
3,030,061
|
|
$
|
1,792,337
|
|
||
|
% of Revenue
|
31.5
|
%
|
32.6
|
%
|
29.8
|
%
|
|||||
|
Net income (loss) attributable to stockholders (c)
|
$
|
18,833
|
|
$
|
1,493,177
|
|
$
|
(832,030
|
)
|
||
|
(a)
|
The 2016 amounts include the operating results of Cablevision from the date of the Cablevision Acquisition and include results for Newsday Media Group ("Newsday"). Newsday's revenue, for the period from June 21, 2016 through its sale in July 2016, was approximately $8.8 million. Altice USA sold a 75% interest in Newsday in July 2016 and sold a 24% interest in April 2018.
|
2
|
(b)
|
For additional information regarding Adjusted EBITDA, including a reconciliation of Adjusted EBITDA to Net Income (Loss), please refer to "Management's Discussion and Analysis of Financial Condition and Results of Operations."
|
|
(c)
|
Pursuant to the enactment of the Tax Cuts & Jobs Act ("Tax Reform") on December 22, 2017, the Company recorded a non-cash deferred tax benefit of approximately
$2.3
billion in 2017 to remeasure the net deferred tax liability to adjust for the reduction in the corporate federal income tax rate from
35%
to
21%
which is effective on January 1, 2018. In 2018, the Company recorded a non-cash deferred tax benefit of $52.9 million based on a remeasurement of the Company's net deferred tax liability. See Note 14 to the consolidated financial statements for further details.
|
Altice Europe Distribution
On June 8, 2018, Altice Europe distributed substantially all of its equity interest in the Company through a distribution in kind to holders of Altice Europe's common shares A and common shares B (the “Distribution”). The Distribution took place by way of a special distribution in kind by Altice Europe of its 67.2% interest in the Company to Altice Europe shareholders. Each shareholder of Altice Europe on May 23, 2018, the Distribution record date, received
0.4163
shares of the Company's common stock for every share held by such shareholder in Altice Europe. Between May 24, 2018 and June 4, 2018, each Altice Europe shareholder was given the opportunity to elect the percentage of shares of the Company's Class A common stock and shares of the Company's Class B common stock such shareholder would receive in the Distribution, whereby the number of shares of the Company's Class B common stock to be distributed was subject to a cap of 50% of the total shares of the Company's common stock being distributed (the “Class B Cap”). Because the Class B Cap had been exceeded, the shares of the Company's Class B common stock delivered to Altice Europe’s shareholders of record who elected to receive them were subject to proration, and such shareholders received additional shares of the Company's Class A common stock to the extent of the excess.
Immediately following the Distribution, there were
489,384,523
shares of Altice USA Class A common stock and
247,684,443
shares of Altice USA Class B common stock outstanding.
Prior to Altice Europe's announcement of the Distribution, the Board of Directors of Altice USA, acting through its independent directors, approved the payment of a
$2.035
per share dividend to all shareholders of record on May 22, 2018. The payment of the dividend, aggregating approximately
$1.5
billion, was made on June 6, 2018, and was
funded with cash at CSC Holdings LLC, a wholly-owned subsidiary of Cablevision, from financings completed in January 2018, and cash generated from operations at Cequel. In connection with the payment of the dividend, the Company recorded a decrease in retained earnings of
$536.2
million, representing the cumulative earnings through the payment date, and a decrease in paid in capital of
$963.7
million.
In connection with the Distribution, the Management Advisory and Consulting Services Agreement with Altice Europe, which provided certain consulting, advisory and other services, was terminated. Compensation under the terms of the agreement was an annual fee of $30 million paid by the Company.
Our Products and Services
We provide broadband, pay television and telephony services to both residential and business customers. We also provide enterprise-grade fiber connectivity, bandwidth and managed services to enterprise customers through our Lightpath business (also marketed as Altice Business) and we provide advertising time and services to advertisers.
The prices we charge for our services vary based on the number of services and associated service level or tier our customers choose, coupled with any promotions we may offer. As part of our marketing strategy our customers are increasingly choosing to bundle their subscriptions to two (‘‘double product’’) or three (‘‘triple product’’) of our services at the same time. Customers who subscribe to a bundle generally receive a discount from the price of buying each of these services separately, as well as the convenience of receiving multiple services from a single provider, all on a single monthly bill. For example, we offer an ‘‘Optimum Triple Play’’ package that is a special promotion for new customers or eligible current customers where Optimum broadband, pay television and telephony services are each available at a reduced rate for a specified period when purchased together. Approximately 50% of our residential customers were triple product customers as of
December 31, 2018
.
Residential Services
The following tables show our residential customer relationships and revenues for broadband, pay television and telephony services provided to residential customers.
3
|
December 31,
|
||||||||
|
2018
|
2017
|
2016
|
||||||
|
|
(in thousands)
|
|||||||
|
Total residential customer relationships
|
4,542.1
|
|
4,535.0
|
|
4,528.2
|
|
||
|
Pay TV
|
3,307.5
|
|
3,405.5
|
|
3,534.5
|
|
||
|
Broadband
|
4,118.1
|
|
4,046.2
|
|
3,962.5
|
|
||
|
Telephony
|
2,531.2
|
|
2,557.4
|
|
2,559.0
|
|
||
|
December 31,
|
|||||||||||
|
2018
|
2017
|
2016
|
|||||||||
|
|
(in thousands)
|
||||||||||
|
Residential revenue:
|
|||||||||||
|
Pay TV
|
$
|
4,156,428
|
|
$
|
4,274,122
|
|
$
|
2,788,873
|
|
||
|
Broadband
|
2,887,455
|
|
2,608,595
|
|
1,651,574
|
|
|||||
|
Telephony
|
652,895
|
|
700,765
|
|
465,771
|
|
|||||
Broadband Services
We offer a variety of broadband service tiers tailored to meet the different needs of our residential customers. Current customer offers include five tiers with download speeds ranging from 20 Mbps to 400 Mbps for our residential customers in our Optimum service area and 50 Mbps to 1 Gbps for our residential customers in our Suddenlink service area. Our broadband services also include the Optimum wireless router, as well as Internet security software, including anti-virus, anti-spyware, personal firewall and anti-spam protection. Substantially all of our HFC network is digital and data over cable service interface specification DOCSIS 3.0 compatible, with approximately 280 homes per node and a bandwidth capacity of at least 750 MHz throughout. This network allows us to provide our customers with advanced broadband, pay television and telephony services.
In addition, we have deployed Wi-Fi across our New York metropolitan service area with approximately 1.94 million Wi-Fi hotspots as of
December 31, 2018
. The Wi-Fi network allows broadband customers to access the service while they are away from their home or office. Wi-Fi is delivered via wireless access points mounted on our broadband network, in certain retail partner locations, certain NJ Transit rail stations, New York City parks and other public venues. Similarly, our wireless router product includes a second network that enables all broadband customers to access the Wi-Fi network. Access to the Wi-Fi network is offered as a free value-added benefit to broadband customers and for a fee to non-customers in certain locations. Our Wi-Fi service also allows our broadband customers to access the Wi-Fi networks of Comcast Corporation ("Comcast"), Charter Communications, Inc. ("Charter") and Cox Communications, Inc. Through these relationships we offer our customers access to additional hotspots nationwide.
Pay Television Services
We currently offer a variety of pay television services, which include delivery of broadcast stations and cable networks, and advanced digital pay television services, such as video-on-demand ("VOD"), high-definition ("HD") channels, digital video recorder ("DVR") and pay-per-view, to our residential markets. Depending on the market and level of service, our pay television services include, among other programming, local broadcast networks and independent television stations, news, information, sports and entertainment channels, regional sports networks, international channels and premium services such as HBO, Showtime, Cinemax, Starz, and The Movie Channel. Our residential customers pay a monthly charge based on the pay television programming level of service, tier or package they receive and the type of equipment they select. Customers who subscribe to seasonal sports packages, international channels and premium services may be charged an additional monthly amount. We may also charge additional fees for pay-per-view programming and events, DVR and certain VOD services.
As of
December 31, 2018
, our residential customers were able to receive between 436 to 614 digital channels depending on their market and level of service. In addition, depending on the service area, we offer between 143 to 180 HD channels which represent the most widely watched programming, including all major broadcast networks, as well as most leading
4
national cable networks, premium channels and regional sports networks. HDTV features high-resolution picture quality, digital sound quality and a wide-screen, theater-like display when using an HDTV set and an HD-capable converter. We also continue to launch additional HD channels to continuously improve our customer's viewing experience. As of December 31, 2018, over 95% of our residential pay television customers were digital pay television customers who subscribed to HDTV services.
We also provide advanced services, such as pay-per-view and VOD, that give residential pay television customers control over when they watch their favorite programming. Our pay-per-view service allows customers to pay to view single showings of programming on an unedited, commercial-free basis, including feature films, live sporting events, concerts and other special events. Our VOD service provides on-demand access to movies, special events, free prime time content and general interest titles. Subscription-based VOD premium content such as HBO and Showtime is made available to customers who subscribe to one of our premium programming packages. Our customers have the ability to start the programs at whatever time is convenient, as well as pause, rewind and (for most content) fast forward both standard definition and HD VOD programming. As of
December 31, 2018
, pay-per-view services were available to over 99% of all our pay television customers and VOD services were available to over 95% of our pay television customers, and we offer thousands of HD titles on-demand.
For a monthly fee, we offer DVR services through the use of digital converters, the majority of which are HDTV-capable and have video recording capability. Customers can choose either a set-top box DVR with the ability to record, pause and rewind live television or the Cloud DVR Plus with remote-storage capability to record 15 shows simultaneously while watching any live or pre-recorded show, and pause and rewind live television. Depending on the service area and market, customers have the option to use a set-top box DVR or a TiVo HD/DVR converter, which delivers multi-room DVR capability using TiVo Mini devices that allow customers to pause and rewind live television, manage recordings from different television locations and play them back throughout the home. In addition, TiVo Stream service, which allows customers to stream live television channels and recorded programming wirelessly throughout their home to Android and iOS devices, and, subject to copyright restrictions, download previously recorded content to these devices so that it can be viewed outside the home, is provided to current TiVo DVR customers.
During the fourth quarter of 2017, we introduced a home communications hub, called Altice One. This hub is an innovative, integrated platform with a dynamic and sophisticated user interface, combining a set-top box, Internet wireless router and cable modem in one device. It is based on LaBox, which Altice Europe has successfully deployed in France, the Dominican Republic and Israel, and is initially offered to new customers subscribing to our double and triple-product packages. It is capable of delivering broadband Internet, Wi-Fi, digital television services, over-the-top ("OTT") services and fixed-line telephony and supports 4K video and Cloud DVR with the capacity to record 15 television programs simultaneously and the ability to rewind live television on the last two channels watched. Additional features include a point-anywhere voice-command remote control and a companion mobile app that allows viewing of all television content including DVR streaming. Additional televisions will be paired with "minis," which can also act as Wi-Fi extenders for an advanced Wi-Fi experience throughout the home. During the fourth quarter of 2018, the Company updated Altice One's operating system which added additional enhanced mobility and more advanced features for customers, including the ability to watch Cloud DVR content on the go on the Altice One mobile app. This operating system also brings Altice One customers access to the YouTube Kids app, the ability to use voice search on YouTube to discover videos, more 4K content for a vivid viewing experience, and live show restart on more than 20 additional networks.
For our customers without Altice One we also offer alternative viewing platforms for our pay television programming through mobile applications. Optimum customers have access to the Optimum App, available for the iPad, iPhone, iPod touch, personal computers, Kindle Fire and select Android phones and tablets, and Suddenlink customers have access to Suddenlink2GO, available for personal computers and select phones and tablets. Depending on the platform, the Optimum App features include the ability to watch live television, stream on-demand titles from various networks and use the device as a remote to control the customer's digital set-top box while inside the home. Suddenlink2GO enables customers to watch movies, shows and clips on a personal computer once authenticated via a customer portal and select television shows and movies on their mobile devices.
Telephony Services
Through voice over Internet protocol ("VoIP") telephone service we also offer unlimited local, regional and long-distance calling within the United States, Puerto Rico, Virgin Islands and Canada for a flat monthly rate, including popular calling
5
features such as caller ID with name and number, call waiting, three-way calling, enhanced emergency 911 dialing and television caller ID. We also offer additional options designed to meet our customers' needs, including directory assistance, voicemail services and international calling. Discount and promotional pricing are available when our telephony services are combined with our other service offerings.
Mobile
In the fourth quarter of 2017, we and Sprint Corporation ("Sprint") entered into a multi-year strategic agreement pursuant to which we will utilize Sprint's network to provide mobile voice and data services to our customers throughout the nation, and our broadband network will be utilized to accelerate the densification of Sprint's network. The Company continues to develop the core network to support its infrastructure-based mobile virtual network operator ("MVNO") including upgrading and expanding its Wi-Fi network. The Company’s full MVNO agreement with Sprint is differentiated from other light MVNOs in that it gives the Company full access control, including over its own core network, Home Location Register and SIM cards. This will allow the Company to fully control seamless data offloading and the handover between the fixed and wireless networks. In addition, the Company will have full product, features and marketing flexibility with its new mobile service. Mobile service for Altice USA customers is expected to be launched in 2019. We believe this product offering will enable us to deliver greater value and more benefits to our customers by offering mobile voice and data services, in addition to our broadband, pay television, and telephony services.
Business Services
Both our Optimum and Suddenlink businesses offer a wide and growing variety of products and services to both large enterprise and small and medium-sized business ("SMB") customers, including broadband, telephony, networking and pay television services. As of
December 31, 2018
, our Optimum business served approximately 263 thousand SMB customers and our Suddenlink business served approximately 114 thousand SMB customers. We serve enterprise customers primarily through our Lightpath business, a subsidiary of Cablevision.
Enterprise Customers
Lightpath provides Ethernet, data transport, IP-based virtual private networks, Internet access, telephony services, including session initiated protocol ("SIP") trunking and VoIP services to the business market in the New York metropolitan area. Our Lightpath bandwidth connectivity service offers speeds up to 100 Gbps. Lightpath also provides managed services to businesses, including hosted telephony services (cloud based SIP-based private branch exchange), managed Wi-Fi, managed desktop and server backup and managed collaboration services including audio and web conferencing. Through Lightpath, we also offer fiber-to-the-tower ("FTTT") services to wireless carriers for cell tower backhaul and enable wireline communications service providers to connect to customers that their own networks do not reach. Lightpath's customers include companies in health care, financial, education, legal and professional services, and other industries, as well as the public sector and communication providers, incumbent local exchange carriers ("ILEC"), and competitive local exchange carriers ("CLEC"). As of
December 31, 2018
, Lightpath had over 10,100 locations connected to its fiber network. Our Lightpath advanced fiber optic network extends more than 7,500 route miles, which includes approximately 375,000 miles of fiber, throughout the New York metropolitan area.
For enterprise and larger commercial customers, Suddenlink offers high capacity data services, including wide area networking and dedicated data access and advanced services such as wireless mesh networks. Suddenlink also offers enterprise class telephone services which include traditional multi-line phone service over DOCSIS and trunking solutions via SIP for our Primary Rate Interface and SIP trunking applications. Similar to Lightpath, Suddenlink also offers FTTT services. These Suddenlink services are offered on a standalone basis or in bundles that are developed specifically for our commercial customers.
SMB Customers
Both Optimum and Suddenlink provide broadband, pay television and telephony services to SMB customers. In addition to these services, we also offer managed services, including business e-mail, hosted private branch exchange, web space storage and network security monitoring for SMB customers. Telephony services include Optimum Voice for Business, Suddenlink Business Class Phones, Business Hosted Voice and Business Trunking (SIP and PRI). Optional telephony add-on services include international calling and toll free numbers.
6
Advertising
a4
a4 is the advanced advertising and data solutions subsidiary of Altice USA. It provides audience-based, IP-authenticated cross-screen advertising solutions to local, regional and national businesses and advertising clients. a4 enables advertisers to reach U.S. households across their devices through cable networks, on-demand and addressable inventory.
New York Interconnect
In many markets, we have entered into agreements commonly referred to as “Interconnects” with other cable operators to jointly sell local advertising. This simplifies our clients' purchase of local advertising and expanding their geographic reach. In some markets, we represent the advertising sales efforts of other cable operators; in others, other cable operators represent us. For example, we manage NY Interconnect, LLC, a partnership launched in the second quarter 2018 between Altice USA, Charter and Comcast. This provides national brands with television and digital advertising opportunities to millions of households across the New York designated market area ("DMA").
News 12 Networks
Our News 12 Networks consists of seven 24-hour local news channels in the New York metropolitan area—the Bronx, Brooklyn, Connecticut, Hudson Valley, Long Island, New Jersey and Westchester—providing each with complete access to hyper-local breaking news, traffic, weather, sports, and more. In addition, News 12 Networks also includes five traffic and weather channels that offer constantly updated information; the award-winning News12.com; the News 12 app available on Apple and Android products; the News 12 app on the Altice One Box; channel 612 on Optimum TV, providing local news on demand; and News 12 OTT products on Amazon, Apple, and Roku devices.
Since launching in 1986, News 12 Networks has been widely recognized by the news industry with numerous prestigious honors and awards, including Emmy Awards, plus multiple Edward R. Murrow Awards, NY Press Club Awards, and more. We derive revenue from our News 12 Networks for the sale of advertising and affiliation fees paid by cable operators.
i24NEWS
i24NEWS consists of three 24-hour global channels in New York, Paris, and Israel. Each channel provides global breaking news and world stories with a focus on the Middle East and Israel. In addition, i24NEWS allows viewers to access programming on i24NEWS.tv, the i24NEWS app available on Apple and Android products; the i24NEWS app on the Altice One Box; and i24NEWS OTT products on Amazon, Apple, and Roku devices. i24NEWS launched in English, French, and Arabic in July 2013.
In April 2018, Altice Europe transferred its ownership of i24NEWS to the Company for minimal consideration (the "i24 Acquisition"). As the acquisition was a combination of businesses under common control, the Company combined the results of operations and related assets and liabilities of i24NEWS as of April 1, 2018. Operating results for periods prior to April 1, 2018 and the balance sheet as of December 31, 2017 have not been revised to reflect the i24 Acquisition as the impact was deemed immaterial.
Altice Technical Services
In January 2018, the Company acquired
70%
of the equity interests in Altice Technical Services US Corp. ("ATS") for $
1.00
(the "ATS Acquisition") and the Company became the owner of 100% of the equity interests in ATS in March 2018. ATS was previously owned by Altice Europe and a member of ATS's management through a holding company. In light of Altice Europe's determination to focus on businesses other than the Company, we and Altice Europe concluded it was in Altice Europe's and the Company's interests for Altice USA to own and operate ATS. The ATS Acquisition was approved by our Audit Committee pursuant to the Company's related-party transaction approval policy. As the acquisition is a combination of businesses under common control, the Company combined the results of operations and related assets and liabilities of ATS for all periods since its formation.
ATS provides technical operating services, including field services, such as dispatch, customer installations, disconnects, service changes and other customer service visits, outside plant maintenance services and design and construction services for HFC and FTTH infrastructure.
7
Franchises
As of
December 31, 2018
, our systems operated in more than 1,300 communities pursuant to franchises, permits and similar authorizations issued by state and local governmental authorities. Franchise agreements typically require the payment of franchise fees and contain regulatory provisions addressing, among other things, service quality, cable service to schools and other public institutions, insurance and indemnity. Franchise authorities generally charge a franchise fee of not more than 5% of certain of our cable service revenues that are derived from the operation of the system within such locality. We generally pass the franchise fee on to our customers.
Franchise agreements are usually for a term of 5 to 15 years from the date of grant (a majority of which are for 10 years), however, approximately 400 of Altice’s communities are located in states (Connecticut, Missouri, North Carolina and Texas) where by law franchise agreements do not have an expiration date. Franchise agreements are usually terminable only if the cable operator fails to comply with material provisions and then only after the franchising authority complies with substantive and procedural protections afforded by the franchise agreement and federal and state law. Prior to the scheduled expiration of most franchises, we generally initiate renewal proceedings with the granting authorities. This process usually takes less than three years but can take a longer period of time. The Communications Act, which is the primary federal statute regulating interstate communications, provides for an orderly franchise renewal process in which granting authorities may not unreasonably withhold renewals. See "Regulation—Cable Television—Franchising." In connection with the franchise renewal process, many governmental authorities require the cable operator to make certain commitments, such as building out certain franchise areas, meeting customer service requirements and supporting and carrying public access channels.
Historically, we have been able to renew our franchises without incurring significant costs, although any particular franchise may not be renewed on commercially favorable terms or otherwise. We expect to renew or continue to operate under all or substantially all of these franchises. For more information regarding risks related to our franchises, see "Risk Factors—Risk Factors Relating to Regulatory and Legislative Matters—Our cable system franchises are subject to non-renewal or termination. The failure to renew a franchise in one or more key markets could adversely affect our business." Proposals to streamline cable franchising recently have been adopted at both the federal and state levels. For more information see "Regulation—Cable Television—Franchising."
Programming
We design our channel line-ups for each system according to demographics, programming contract requirements, market research, viewership, local programming preferences, channel capacity, competition, price sensitivity and local regulation. We believe offering a wide variety of programming influences a customer's decision to subscribe to and retain our pay television services. We obtain programming, including basic, expanded basic, digital, HD, HD 4K, VOD and broadband content, from a number of suppliers, including broadcast and cable networks.
We generally carry cable networks pursuant to written programming contracts, which continue for a fixed period of time, usually from three to five years, and are subject to negotiated renewal. Cable network programming is usually made available to us for a license fee, which is generally paid based on the number of customers who subscribe to the level of service that provides such programming. Such license fees may include "volume" discounts available for higher numbers of customers, as well as discounts for channel placement or service penetration. Where possible, we negotiate volume discount pricing structures. For home shopping channels, we receive a percentage of the revenue attributable to our customers' purchases, as well as, in some instances, incentives for channel placement.
We typically seek flexible distribution terms that would permit services to be made available in a variety of retail packages and on a variety of platforms and devices in order to maximize consumer choice. Suppliers typically insist that their most popular and attractive services be distributed to a minimum number or percentage of customers, which limits our ability to provide consumers full purchasing flexibility. Suppliers also typically seek to control or limit the terms on which we are able to make their services available on various platforms and devices yet this has become more flexible each year.
Our cable programming costs have increased in excess of customary inflationary and cost-of-living type increases. We expect programming costs to continue to increase due to a variety of factors including annual increases imposed by stations and programmers and additional programming being provided to customers, including HD, HD 4K, digital and VOD programming. In particular, broadcast and sports programming costs have increased significantly over the past
8
several years. In addition, contracts to purchase sports programming sometimes provide for optional additional programming to be available on a surcharge basis during the term of the contract. These increases have coincided with a significant increase in the quality of the programming, from high production value original cable series to enhanced camera and statistical data technology in sports broadcasts, and more flexible rights to make the content available on various platforms and devices.
We have programming contracts that have expired and others that will expire in the near term. We will seek to renegotiate the terms of these agreements, but there can be no assurance that these agreements will be renewed on favorable or comparable terms. To the extent that we are unable to reach agreement with certain programmers on terms that we believe are reasonable, we have been, and may in the future be, forced to remove such programming channels from our line-up, which may result in a loss of customers. For example, in 2017, we were unable to reach agreement with Starz on acceptable economic terms, and effective January 1, 2018, all Starz services were removed from our lineups, and we launched alternative networks offered by other programmers under new long-term contracts. On February 13, 2018, we and Starz reached a new carriage agreement and we started restoring the Starz services previously offered. Also in our Suddenlink business, we were unable to reach agreement with Viacom on acceptable economic terms for a long-term contract renewal, and effective October 1, 2014, all Viacom networks were removed from our channel lineups in our Suddenlink business, and we launched alternative networks offered by other programmers under new long-term contracts. We and Viacom did not reach a new agreement to include certain Viacom networks in the Suddenlink channel lineup until May 2017. For more information, see "Risk Factors—Risk Factors Relating to Our Business—Programming and retransmission costs are increasing and we may not have the ability to pass these increases on to our customers. Disputes with programmers and the inability to retain or obtain popular programming can adversely affect our relationship with customers and lead to customer losses."
Sales and Marketing
Sales are managed centrally and multiple sales channels allow us to reach each current and potential customers in a variety of ways, including in-bound customer care centers, outbound telemarketing, stores, field technician sales and door-to-door sales. E-commerce is also managed centrally on behalf of the organization and is a growing and dynamic part of our business and is our fastest growing sales channel. We also use mass media, including broadcast television, digital media, radio, newspaper and outdoor advertising, to attract customers and direct them to our in-bound customer care centers or website. Our sales and service employees use a variety of sales tools as they work to match customers' needs with our best-in-class products, with a focus on building and enhancing customer relationships.
Because of our local presence and market knowledge, we invest heavily in targeted marketing. Our strategic focus is on building new customer relationships and bundling broadband, pay television and telephony services. Our promotional materials and messaging focus on how our products and services deliver innovative solutions to customer pain points. Much of our advertising is developed centrally and customized for our regions. Among other factors, we monitor customer perceptions, marketing tactic impact and competition, to increase our responsiveness and the effectiveness of our efforts. Our footprint has several large college markets where we market specialized products and services to students for multiple dwelling units ("MDUs"), such as dormitories and apartment complexes.
We have separate dedicated sales teams for our SMB and enterprise offerings and dedicated service teams to support SMB and enterprise clients.
Customer Experience
We believe customer service is the cornerstone of our business, and our strategy is to prove in our markets that we are "reliable, technical experts, and simple to interact with"; and in the event of a service failure we are "responsive and courteous" to reconcile the relationship. Accordingly, we make a concerted effort to continually improve each customer's experience and have made significant investments in our people, processes and technology to enhance our customers' experience and to reduce the number of times customers need to contact us. We hire and develop talent to be customer-centric.
The insights from operational metrics help us focus our improvement efforts. Listening to and acting upon feedback is a major pillar in our customer experience program. We review feedback as part of our daily operations.
9
We provide technical service to our customers 24 hours a day, seven days a week, and we have systems that allow our customer care centers to be accessed and managed remotely in the event that systems functionality is temporarily lost, which provides our customers access to customer service with limited disruption.
We are prioritizing new capabilities such as engaging outbound messaging, automated digital assistance, searchable help, simpler self-service, and more efficient support operations, intended to foster a premium, digital customer experience that builds a foundation to anticipate customers’ needs.
We also utilize our customer portal to enable our customers to view and pay their bills online, obtain useful information and perform various equipment troubleshooting procedures. Our customers may also obtain support through our online chat, e-mail functionality and social media websites, including Twitter and Facebook.
Network Management
Our cable systems are generally designed with an HFC architecture that has proven to be highly flexible in meeting the increasing needs of our customers. We deliver our signals via laser-fed fiber optic cable from control centers known as headends and hubs to individual nodes. Each node is connected to the individual homes served by us. A primary benefit of this design is that it pushes fiber optics closer to our customers' homes, which allows us to subdivide our systems into smaller service groups and make capital investments only in service groups experiencing higher than average service growth.
As of
December 31, 2018
, approximately 95% of our basic pay television customers were served by systems with a capacity of at least 750 MHz and approximately 280 homes per node. Our Optimum network has been upgraded to nearly four times the maximum available broadband speeds since the Cablevision Acquisition, and we have expanded our Gbps broadband service to approximately 76% of our Suddenlink footprint, compared to approximately 40% prior to the Suddenlink Acquisition. More than 99% of our residential broadband Internet customers are connected to our national backbone with a presence in major carrier access points in New York, Dallas, Chicago, San Jose, Washington D.C. and Phoenix. This presence allows us to avoid significant Internet transit costs by establishing peering relationships with major Internet service and content providers enabling direct connectivity with them at these access points.
We also have a networking caching architecture that places highly viewed Internet traffic from the largest Internet-based content providers at the edge of the network closest to the customer to reduce bandwidth requirements across our national backbone, thus reducing operating expense. This collective network architecture also provides us with the capability to manage traffic across several Internet access points, thus helping to ensure Internet access redundancy and quality of service for our customers. Additionally, our national backbone connects most of our systems, which allows for an efficient and economical deployment of services from our centralized platforms that include telephone, VOD, network DVR, common pay television content, broadband Internet, hosted business solutions, provisioning, e-mail and other related services.
We have also commenced a plan to build a FTTH network, which will enable us to deliver more than 10 Gbps broadband speeds across our entire Optimum footprint and part of our Suddenlink footprint. We believe this FTTH network will be more resilient with reduced maintenance requirements, fewer service outages and lower power usage, which we expect will drive further structural cost efficiencies.
We have also focused on system reliability and disaster recovery as part of our national backbone and primary system strategy. For example, to help ensure a high level of reliability of our services, we implemented redundant power capability, as well as fiber route and carrier diversity in our networks serving most of our customers. With respect to disaster recovery, we invested in our telephone platform architecture for geo-redundancy to minimize downtime in the event of a disaster to any single facility. Additionally, we are working to implement a geo-redundant disaster recovery environment for our network operations center supporting both residential and business customers.
In addition, we have expanded and refined our bandwidth utilization in capacity constrained systems in order to meet demand for new and improved advanced services. A key component to reclaim bandwidth was the digital delivery of pay television channels that were previously distributed in analog through the launch of digital simulcast, which duplicates analog channels as digital channels. Additionally, the deployment of lower-cost digital customer premises equipment, such as HD digital transport adapters, enabled the use of more efficient digital channels instead of analog channels, thus allowing the reclamation of expanded basic analog bandwidth in the targeted systems. This reclaimed analog bandwidth could then be repurposed for other advanced services such as additional HDTV services and faster Internet access speeds.
10
This technology has the added benefit of providing improved picture and sound quality to customers for most of their pay television programming.
We have commenced building a nationwide mobile core network with four main interconnection points (New Jersey, Texas, California and Illinois), as well as the necessary interconnection points for Sprint and other roaming partners. We completed calls across our core network on September 6, 2018. As of December 31, 2018, we are continuing the development of carrier bundles with original equipment manufacturers in anticipation of the launch of our mobile voice and data business in 2019.
Information Technology
Our IT systems consist of billing, customer relationship management, business and operational support and sales force management systems. We are updating and simplifying our IT infrastructure through further investments, focusing on cost efficiencies, improved system reliability, functionality and scalability and enhancing the ability of our IT infrastructure to meet our ongoing business objectives. Additionally, through investment in our IT platforms and focus on process improvement, we have simplified and harmonized our service offering bundles and improved our technical service delivery and customer service. We contract with managed service providers to deliver core Business Support Systems and Operations Support Systems. These services are integrated into our overall IT ecosystems to ensure an efficient operation. Backup services are provided through alternate systems and infrastructure.
Suppliers
Customer Premise and Network Equipment
We purchase set-top boxes and other customer premise equipment from a limited number of vendors because our cable systems use one or two proprietary technology architectures. We also buy HD, HD/DVRs and VOD equipment, routers, including the components of our new home communications hub, and other network equipment from a limited number of suppliers, including Altice Labs, Altice Europe's technology, services and innovation center. See "Risk Factors—Risk Factors Relating to Our Business—We rely on network and information systems for our operations and a disruption or failure of, or defects in, those systems may disrupt our operations, damage our reputation with customers and adversely affect our results of operations."
Broadband and Telephone Connectivity
We deliver broadband and telephony services through our HFC network. We use circuits that are either owned by us or rented from third parties to connect to the Internet and the public switched telephone network. We pay fees for rented circuits based on the amount of capacity available to it and pay for Internet connectivity based on the amount of IP-based traffic received from and sent over the other carrier's network.
Mobile Voice and Data Equipment
We expect to purchase for resale mobile handsets from a limited number of vendors. Customers of our mobile service are expected to be able to purchase these handsets with upfront payments or financed without interest over a 24-month period.
Competition
We operate in a highly competitive, consumer-driven industry and we compete against a variety of broadband, pay television and mobile and fixed-line telephony providers and delivery systems, including broadband communications companies, wireless data and telephony providers, satellite delivered video signals, Internet-delivered video content and broadcast television signals available to residential and business customers in our service areas. We believe our leading market position in our footprint, technologically advanced network infrastructure, including our FTTH build-out, our home communications hub and our focus on enhancing the customer experience favorably position us to compete in our industry. See also "Risk Factors—Risk Factors Relating to Our Business—We operate in a highly competitive business environment which could materially adversely affect our business, financial condition, results of operations and liquidity."
11
Broadband Services Competition
Our broadband services face competition from broadband communications companies' digital subscriber line ("DSL"), FTTH and wireless broadband offerings as well as from a variety of companies that offer other forms of online services, including satellite-based broadband services. Current and future fixed and wireless Internet services, such as 3G, 4G and 5G fixed and wireless broadband services and Wi-Fi networks, and devices such as wireless data cards, tablets and smartphones, and mobile wireless routers that connect to such devices, may compete with our broadband services.
Pay Television Services Competition
We face intense competition from broadband communications companies with fiber-based networks, primarily Verizon Communications Inc. ("Verizon"), which has constructed a FTTH network plant that passes a significant number of households in our Optimum service area. We estimate that Verizon is currently able to sell a fiber-based pay television service, as well as broadband and VoIP services, to at least half of the households in our Optimum service area. In addition, Frontier Communications Corporation ("Frontier") offers pay television service in competition with us in most of our Connecticut service area.
We also compete with direct broadcast satellite ("DBS") providers, such as DirecTV (a subsidiary of AT&T Inc.) and DISH Network Corporation ("DISH"). DirecTV and DISH offer one-way satellite-delivered pre-packaged programming services that are received by relatively small and inexpensive receiving dishes. DirecTV has exclusive arrangements with the National Football League that give it access to programming that we cannot offer. In 2018 AT&T acquired Time Warner, which owns a number of cable networks, including TBS, CNN and HBO, as well as Warner Bros. Entertainment, which produces television, film and home-video content. AT&T's and DirecTV's potential access to Time Warner programming could allow AT&T and DirecTV to offer competitive and promotional packages. However, we believe cable-delivered VOD services, which include HD programming, offer a competitive advantage to DBS service because cable headends can provide two-way communication to deliver a large volume of programming which customers can access and control independently, whereas DBS technology can only make available a much smaller amount of programming with DVR-like customer control.
Our pay television services also face competition from a number of other sources, including companies that deliver movies, television shows and other pay television programming over broadband Internet connections to televisions, computers, tablets and mobile devices, such as Netflix, Hulu, iTunes, YouTube, Amazon Prime, Sling TV, Playstation Vue, DirecTV Now, and Locast.
Telephony Services Competition
Our telephony service competes with wireline, wireless and OTT phone providers, such as Vonage, Skype, GoogleTalk, Facetime, WhatsApp and magicJack, as well as companies that sell phone cards at a cost per minute for both national and international service. In addition, we compete with other forms of communication, such as text messaging on cellular phones, instant messaging, social networking services, video conferencing and email. The increase in the number of different technologies capable of carrying telephony services and the number of alternative communication options available to customers as well as the replacement of wireline services by wireless have intensified the competitive environment in which we operate our telephony services.
Mobile Wireless Competition
Our mobile wireless service, expected to launch in 2019, will face competition from a number of incumbent network-based mobile service providers (like AT&T, Verizon, T-Mobile US, Inc. ("T-Mobile") and Sprint), as well as a number of reseller or MVNO providers (such as Tracfone, Boost Mobile and Cricket Wireless). We believe that our approach to the mobile wireless service offering, including the construction and operation of our own "mobile core" and the ability to bundle and promote the product to our existing customer base, will give us advantages over resellers and incumbent network-based operators alike. Our mobile wireless strategy depends on the availability of wholesale access to radio access networks ("RAN") from one or more network-based providers with whom we are likely to compete. Our mobile service is vulnerable to constraints on the availability of wholesale access or increases in price from the incumbents. Consolidation among wholesale RAN access providers could impair our ability to launch and sustain our mobile service. In 2018, Sprint and T-Mobile announced an intent to merge. We believe the reduction of competition among mobile wireless network-based providers that would result from the merger likely will impact negatively the price and availability of wholesale RAN access to Altice, affect the operating cost for our mobile wireless data service, and impact our ability
12
to compete for mobile subscribers. In addition, improvements by incumbent mobile service providers on price, features, speeds, and service enhancements will continue to impact the competitiveness and attractiveness of our mobile service, and we will need to continue to invest in our services, product and marketing to answer that competition.
Business Services Competition
We operate in highly competitive business telecommunications market and compete primarily with local incumbent telephone companies, especially AT&T, CenturyLink, Inc. ("Centurylink"), Frontier and Verizon, as well as from a variety of other national and regional business services competitors.
Advertising Sales Competition
We face intense competition for advertising revenue across many different platforms and from a wide range of local and national competitors. Advertising competition has increased and will likely continue to increase as new formats seek to attract the same advertisers. We compete for advertising revenue against, among others, local broadcast stations, national cable and broadcast networks, radio stations, print media and online advertising companies and content providers.
Regulation
Our cable, related and other services are subject to a variety of federal, state and local law and regulations, including in instances where we operate outside of the U.S., the laws and regulations of the countries and regions where we operate. The Communications Act, and the rules, regulations and policies of the Federal Communications Commission ("FCC"), as well as other federal, state and other laws governing cable television, communications, consumer protection, privacy and related matters, affect significant aspects of the operations of our cable, related and other services.
The following paragraphs describe the existing legal and regulatory requirements we believe are most significant to our operations today. Our business can be dramatically impacted by changes to the existing regulatory framework, whether triggered by legislative, administrative or judicial rulings.
Cable Television
Franchising.
The Communications Act requires cable operators to obtain a non-exclusive franchise from state or local franchising authorities to provide cable service. Although the terms of franchise agreements differ from jurisdiction to jurisdiction, they typically require payment of franchise fees and contain regulatory provisions addressing, among other things, use of the right of way, service quality, cable service to schools and other public institutions, insurance, indemnity and sales of assets or changes in ownership. State and local franchising authority, however, must be exercised consistent with the Communications Act, which sets limits on franchising authorities' powers, including limiting franchise fees to no more than 5% of gross revenues from the provision of cable service, prohibiting franchising authorities from requiring us to carry specific programming services, and protecting the renewal expectation of franchisees by limiting the factors a franchising authority may consider and requiring a due process hearing before denying renewal. Even when franchises are renewed, however, the franchise authority may, except where prohibited by applicable law, seek to impose new and more onerous requirements as a condition of renewal. Similarly, if a franchising authority's consent is required for the purchase or sale of a cable system, the franchising authority may attempt to impose more burdensome requirements as a condition for providing its consent. Cable franchises generally are granted for fixed terms and in many cases include monetary penalties for noncompliance. They may also be terminable if the franchisee fails to comply with material provisions.
In recent years, the traditional local cable franchising regime underwent significant change as a result of various federal and state actions. Several states have reduced or eliminated the role of local, municipal government in franchising in favor of state or system-wide franchises, and the trend has been toward consolidation of franchising authority at the state level, in part to accommodate the interests of new broadband and cable entrants over the last decade. At the same time, the FCC has adopted rules that streamline entry for new competitors (such as those affiliated with broadband communications companies) and reduce certain franchising burdens for these new entrants. The FCC adopted more modest relief for existing cable operators, but a recent federal court decision curtailed a portion of this relief that relates to the cap on in-kind payments to franchising authorities.
Pricing and Packaging.
The Communications Act and the FCC's rules limit the scope of price regulation for cable television services. Among other limitations, franchising authorities may regulate rates for only "basic" cable service. In 2015, the FCC adopted a rule barring franchise authority rate regulation absent an affirmative showing by the
13
franchising authority that there is an absence of effective competition. Based on the 2015 FCC rule, none of our pay television customers are currently subject to basic rate regulation.
There have been frequent calls to impose further rate regulation on the cable industry. It is possible that Congress or the FCC may adopt new constraints on the retail pricing or packaging of cable programming. As we attempt to respond to a changing marketplace with competitive marketing and pricing practices, we may face regulations that impede our ability to compete.
Must-Carry/Retransmission Consent.
Cable operators are required to carry, without compensation, programming transmitted by most local commercial and noncommercial broadcast television stations that elect "must carry" status.
Alternatively, local commercial broadcast television stations may elect "retransmission consent," giving up their must-carry right and instead negotiating with cable systems the terms on which the cable systems may carry the station's programming content. Cable systems generally may not carry a broadcast station that has elected retransmission consent without the station's consent. The terms of retransmission consent agreements frequently include the payment of compensation to the station.
Broadcast stations must elect "must carry" or retransmission consent every three years. A substantial number of local broadcast stations currently carried by our cable systems have elected to negotiate for retransmission consent. In the most recent retransmission consent negotiations, popular television stations have demanded substantial compensation increases, thereby increasing our operating costs.
Ownership Limitations.
Federal regulation of the communications field traditionally included a host of ownership restrictions, which limited the size of certain media entities and restricted their ability to enter into competing enterprises. Through a series of legislative, regulatory, and judicial actions, most of these restrictions have been either eliminated or substantially relaxed. In 2017, the FCC relaxed some broadcast media ownership rules, and the broadcast industry subsequently experienced consolidation. The broadcast industry could consolidate further, which could impact the fees we pay broadcasters to license their signals.
Set-Top Boxes.
The Communications Act includes a provision that requires the FCC to take certain steps to support the development of a retail market for "navigation devices," such as cable set-top boxes. Several years ago, the FCC began a proceeding to consider requiring cable operators to accommodate third-party navigation devices, which if adopted could impose substantial development and operating requirements on the industry. Though there is currently no active effort to advance these proposals, the FCC may in the future consider implementing other measures to promote the competitive availability of retail set-top boxes or third-party navigation options that could impact our customers' experience, our ability to capture user interactions to refine and enhance our services, and our ability to provide a consistent customer support environment.
PEG and Leased Access.
Franchising authorities may require that we support the delivery and support for public, educational, or governmental ("PEG") channels on our cable systems. In addition to providing PEG channels, we must make a limited number of commercial leased access channels available to third parties (including parties with potentially competitive pay television services) at regulated rates. The FCC adopted revised rules several years ago mandating a significant reduction in the rates that operators can charge commercial leased access users. These rules were stayed, however, by a federal court, pending a cable industry appeal. This matter currently remains pending, and the revised rules are not yet in effect. Although commercial leased access activity historically has been relatively limited, increased activity in this area could further burden the channel capacity of our cable systems.
Pole Attachments.
The company makes extensive use of utility poles and conduit owned by other utilities to attach and install the facilities that are integral to our network and services. The Communications Act requires most utilities to provide cable systems with access to poles and conduits for access to attach such facilities at regulated rates. States (or, where states choose not to regulate, the FCC) regulate utility company rates for the rental of pole and conduit space used by companies, including operators like us, to provide cable, telecommunications services, and Internet access services, unless states establish their own regulations in this area. Many states in which we operate have elected to set their own pole attachment rules. Adverse changes to the pole attachment rate structure, rate, classifications, and access could significantly increase our annual pole attachment costs.
Program Access.
The program access rules generally prohibit a cable operator from improperly influencing an affiliated satellite-delivered cable programming service to discriminate unfairly against an unaffiliated distributor where the
14
purpose or effect of such influence is to significantly hinder or prevent the competitor from providing satellite-delivered cable programming. FCC rules also allow a competing distributor to bring a complaint against a cable-affiliated terrestrially-delivered programmer or its affiliated cable operator for alleged violations of this rule, and seek reformed terms of carriage as remedy.
Program Carriage.
The FCC's program carriage rules prohibit us from requiring that an unaffiliated programmer grant us a financial interest or exclusive carriage rights as a condition of its carriage on our cable systems and prohibit us from unfairly discriminating against unaffiliated programmers in the terms and conditions of carriage on the basis of their nonaffiliation.
Exclusive Access to Multitenant Buildings.
The FCC has prohibited cable operators from entering into or enforcing exclusive agreements with owners of multitenant buildings under which the operator is the only multichannel video programming distributor ("MVPD") with access to the building.
CALM Act.
The FCC's rules require us to ensure that all commercials carried on our cable service comply with specified volume standards.
Privacy and Data Security.
In the course of providing our services, we collect certain information about our customers and their use of our services. We also collect certain information regarding potential customers and other individuals. Our collection, use, disclosure and other handling of information is subject to a variety of federal and state privacy requirements, including those imposed specifically on cable operators and telecommunications service providers by the Communications Act. We are also subject to data security obligations, as well as requirements to provide notice to individuals and governmental entities in the event of certain data security breaches, and such breaches, depending on their scope and consequences, may lead to litigation and enforcement actions with the potential of substantial monetary forfeitures or to adversely affect our brand.
As cable operators provide interactive and other advanced services, additional privacy and data security requirements may arise through legislation, regulation or judicial decisions. For example, the Video Privacy Protection Act of 1988 has been extended to cover online interactive services through which customers can buy or rent movies. In addition, Congress, the Federal Trade Commission ("FTC"), and other lawmakers and regulators are all considering whether to adopt additional measures that could impact the collection, use, and disclosure of customer information in connection with the delivery of advertising and other services to consumers customized to their interests.
Federal Copyright Regulation.
We are required to pay copyright royalty fees on a semi-annual basis to receive a statutory compulsory license to carry broadcast television content. These fees are subject to periodic audit by the content owners. The amount of a cable operator's royalty fee payments are determined by a statutory formula that takes into account various factors, including the amount of "gross receipts" received from customers for "basic" service, the number of "distant" broadcast signals carried and the characteristics of those distant signals (e.g., network, independent or noncommercial). Certain elements of the royalty formula are subject to adjustment from time to time, which can lead to increases in the amount of our semi-annual royalty payments. The U.S. Copyright Office, which administers the collection of royalty fees, has made recommendations to Congress for changes in or elimination of the statutory compulsory licenses for cable television carriage of broadcast signals and the U.S. Government Accountability Office is conducting a statutorily-mandated inquiry into whether the cable compulsory license should be phased out. Changes to copyright regulations could adversely affect the ability of our cable systems to obtain such programming, and could increase the cost of such programming. Similarly, we must obtain music rights for locally originated programming and advertising from the major music performing rights organizations. These licensing fees have been the source of litigation in the past, and we cannot predict with certainty whether license fee disputes may arise in the future.
Access for Persons with Disabilities.
The FCC's rules require us to ensure that persons with disabilities can more fully access the programming we carry. We are required to provide closed captions and pass through video description to customers on some networks we carry, and to provide an easy means of activating closed captioning and to ensure the audio accessibility of emergency information and on-screen text menus and guides provided by our navigation devices.
Other Regulation.
We are subject to various other regulations, including those related to political broadcasting; home wiring; the blackout of certain network and syndicated programming; prohibitions on transmitting obscene programming; limitations on advertising in children's programming; and standards for emergency alerts, as well as telemarketing and general consumer protection laws and equal employment opportunity obligations. The FCC also imposes various
15
technical standards on our operations. In the aftermath of Superstorm Sandy, the FCC and the states are examining whether new requirements are necessary to improve the resiliency of communications networks, potentially including cable networks. Each of these regulations restricts our business practices to varying degrees. The FCC can aggressively enforce compliance with its regulations and consumer protection policies, including the imposition of substantial monetary sanctions. It is possible that Congress or the FCC will expand or modify its regulations of cable systems in the future, and we cannot predict at this time how that might impact our business.
Broadband
Regulatory Classification.
Broadband Internet access services were traditionally classified by the FCC as "information services" for regulatory purposes, a type of service that is subject to a lesser degree of regulation than "telecommunications services." In 2015, the FCC reversed this determination and classified broadband Internet access services as "telecommunications services." This reclassification had subjected our broadband Internet access service to greater regulation, although the FCC did not apply all telecommunications service obligations to broadband Internet access service. The 2015 Order could have had a material adverse impact on our business. In December 2017, the FCC adopted an order that in large part reversed again the 2015 Order and reestablished the "information service" classification for broadband Internet access service. The 2017 Order, came into effect, in June 2018, is the subject of legal challenges that may overturn or weaken the relief it provides.
Net Neutrality.
Congress and some states are considering legislation that may codify “net neutrality” rules, which could include prohibitions on blocking, throttling and prioritizing Internet traffic. A number of states, including California and New York, have adopted legislation and/or executive orders that apply “net neutrality” rules to ISPs.
Access for Persons with Disabilities.
The FCC's rules require us to ensure that persons with disabilities have access to "advanced communications services" ("ACS"), such as electronic messaging and interoperable video conferencing. They also require that certain pay television programming delivered via Internet Protocol include closed captioning and require entities distributing such programming to end users to pass through such captions and identify programming that should be captioned.
Other Regulation.
Providers of broadband Internet access services must comply with Communications Assistance for Law Enforcement Act (‘‘CALEA’’), which requires providers to make their services and facilities accessible for law enforcement intercept requests. Various other federal and state laws apply to providers of services that are accessible through broadband Internet access service, including copyright laws, telemarketing laws, prohibitions on obscenity, and a ban on unsolicited commercial e-mail, and privacy and data security laws. Online content we provide is also subject to some of these laws.
Other forms of regulation of broadband Internet access service currently being considered by the FCC, Congress or state legislatures include consumer protection requirements, cyber security requirements, consumer service standards, requirements to contribute to universal service programs and requirements to protect personally identifiable customer data from theft. Pending and future legislation in this area could adversely affect our operations as an Internet service provider and our relationship with our Internet customers.
Additionally, from time to time the FCC and Congress have considered whether to subject broadband Internet access services to the federal Universal Service Fund ("USF") contribution requirements. Any contribution requirements adopted for Internet access services would impose significant new costs on our broadband Internet service. At the same time, the FCC is changing the manner in which Universal Service funds are distributed. By focusing on broadband and wireless deployment, rather than traditional telephone service, the changes could assist some of our competitors in more effectively competing with our service offerings.
Telephony Services
We provide telephony services using VoIP technology ("interconnected VoIP"). The FCC has adopted several regulations for interconnected VoIP services, as have several states, especially as it relates to core customer and safety issues such as E911, local number portability, disability access, outage reporting, universal service contributions, and regulatory reporting requirements. The FCC has not, however, formally classified interconnected VoIP services as either information services or telecommunications services. In this vacuum, some states have asserted more expansive rights to regulate interconnected VoIP services, while others have adopted laws that bar the state commission from regulating VoIP service.
16
Universal Service.
Interconnected VoIP services must contribute to the USF used to subsidize communication services provided to low income households, to customers in rural and high cost areas, and to schools, libraries, and rural health care providers. The amount of universal service contribution required of interconnected VoIP service providers is based on a percentage of revenues earned from interstate and international services provided to end users. We allocate our end user revenues and remit payments to the universal service fund in accordance with FCC rules. The FCC has ruled that states may impose state universal service fees on interconnected VoIP providers.
Local Number Portability.
The FCC requires interconnected VoIP service providers and their "numbering partners" to ensure that their customers have the ability to port their telephone numbers when changing providers. We also contribute to federal funds to meet the shared costs of local number portability and the costs of North American Numbering Plan Administration.
Other Regulation.
Interconnected VoIP service providers are required to provide enhanced 911 emergency services to their customers; protect customer proprietary network information from unauthorized disclosure to third parties; report to the FCC on service outages; comply with telemarketing regulations and other privacy and data security requirements; comply with disabilities access requirements and service discontinuance obligations; comply with call signaling requirements; and comply with CALEA standards. In August 2015, the FCC adopted new rules to improve the resiliency of the communications network. Under the new rules, providers of telephony services, including interconnected VoIP service providers, must make available eight hours of standby backup power for consumers to purchase at the point of sale. The rules also require that providers inform new and current customers about service limitations during power outages and steps that consumers can take to address those risks.
We operate traditional telecommunications services under the trade name Lightpath in various state subsidiaries, and those services are largely governed under rules established for CLECs under the Communications Act. The Communications Act entitles our CLEC subsidiaries to certain rights, but as telecommunications carriers, it also subjects them to regulation by the FCC and the states. Their designation as telecommunications carriers also results in other regulations that may affect them and the services they offer.
Interconnection and Intercarrier Compensation.
The Communications Act requires telecommunications carriers to interconnect directly or indirectly with other telecommunications carriers and networks, including VoIP. Under the FCC's intercarrier compensation rules, we are entitled, in some cases, to compensation from carriers when they use our network to terminate or originate calls and in other cases are required to compensate another carrier for using its network to originate or terminate traffic. The FCC and state regulatory commissions, including those in the states in which we operate, have adopted limits on the amounts of compensation that may be charged for certain types of traffic. In an October 2011 Order, the FCC determined that intercarrier compensation for all terminating traffic, including VoIP traffic exchanged in time-division multiplexing ("TDM") format, would be phased down over several years to a "bill-and-keep" regime, with no compensation between carriers for most terminating traffic by 2018. The FCC is considering further reform that could reduce or eliminate compensation for originating traffic as well.
Universal Service.
Our CLEC subsidiaries are required to contribute to the USF. The amount of universal service contribution required of us is based on a percentage of revenues earned from interstate and international services provided to end users. We allocate our end user revenues and remit payments to the universal service fund in accordance with FCC rules. The FCC has ruled that states may impose state universal service fees on CLEC telecommunications services.
Other Regulation.
Our CLEC subsidiaries' telecommunications services are subject to other FCC requirements, including protecting the use and disclosure of customer proprietary network information; meeting certain notice requirements in the event of service termination; compliance with disabilities access requirements; compliance with CALEA standards; outage reporting; and the payment of fees to fund local number portability administration and the North American Numbering Plan. As noted above, the FCC and states are examining whether new requirements are necessary to improve the resiliency of communications networks. Communications with our customers are also subject to FCC, FTC and state regulations on telemarketing and the sending of unsolicited commercial e-mail and fax messages, as well as additional privacy and data security requirements.
State Regulation.
Our CLEC subsidiaries' telecommunications services are subject to regulation by state commissions in each state where we provide services. In order to provide our services, we must seek approval from the state regulatory commission or be registered to provide services in each state where we operate and may at times require local approval to construct facilities. Regulatory obligations vary from state to state and include some or all of the following requirements:
17
filing tariffs (rates, terms and conditions); filing operational, financial, and customer service reports; seeking approval to transfer the assets or capital stock of the broadband communications company; seeking approval to issue stocks, bonds and other forms of indebtedness of the broadband communications company; reporting customer service and quality of service requirements; outage reporting; making contributions to state universal service support programs; paying regulatory and state Telecommunications Relay Service and E911 fees; geographic build-out; and other matters relating to competition.
In 2019 we expect to launch a mobile wireless voice and data service. We will offer this service using wholesale RAN agreements that we have entered into, such as our agreement with Sprint, and that we expect to enter into with others, as well as with our existing Wi-Fi hotspot infrastructure in subscriber homes and at outdoor Wi-Fi hotspots. Our mobile wireless service will be subject to most of the same FCC and consumer protection regulations as typical, network-based wireless carriers (such as E911 services, local number portability, privacy protection, and constraints on billing and advertising practices). The FCC or other regulatory authorities may adopt new or different regulations that apply to our services or similarly situated providers, impose new taxes or fees, or modify the obligations of other network-based carriers to provide wholesale RAN access to providers like Altice.
Other Services
We may provide other services and features over our cable system, such as games and interactive advertising that may be subject to a range of federal, state and local laws such as privacy and consumer protection regulations. We also maintain various websites that provide information and content regarding our businesses. The operation of these websites is also subject to a similar range of regulations.
Privacy Regulations
Our cable, Internet, voice, wireless and advertising services are subject to various federal, state and local laws and regulations, including in instances where we operate outside of the U.S., the laws and regulations of the countries and regions where we operate regarding subscriber privacy, data security, data protection, and data use. Our provision of Internet services subjects us to the limitations on use and disclosure of user communications and records contained in the Electronic Communications Privacy Act of 1986. Broadband Internet access service is also subject to various privacy laws applicable to electronic communications. In 2018, California passed a comprehensive privacy act aimed at increasing disclosure requirements, privacy protections, and the rights of consumers to identify and delete stored private data, subject to some limited business exceptions. We expect further scrutiny of privacy practices at all levels of government in the areas where we operate, and implementing systems to comply with new rules could impact our business opportunities and impose operating costs on the business.
Our i24 operation has employees and offices in the European Union that are subject to the General Data Protection Regulation ("GDPR"). Further, our a4 advertising business conducts limited business with customers that advertise in the EU. As such, we have certain compliance obligations with EU and member state (and UK) laws and regulations, including compliance obligations under the GDPR, and bear potential enforcement risks if we fail to comply, even as the application of those regulations to some of our operations are unclear or are unknown.
Environmental Regulations
Our business operations are subject to environmental laws and regulations, including regulations governing the use, storage, disposal of, and exposure to, hazardous materials, the release of pollutants into the environment and the remediation of contamination. In part as a result of the increasing public awareness concerning the importance of environmental regulations, these regulations have become more stringent over time. Amended or new regulations could impact our operations and costs.
Employees and Labor Relations
As of
December 31, 2018
, we had 11,800 full-time, 118 part-time and 267 temporary employees of which 291 were covered under collective bargaining agreements and an additional 226 were represented by a union. As of
December 31, 2018
, we believe our relations with employees are satisfactory.
18
Available Information and Website
We make available free of charge, through our investor relations section at our website, http://www.alticeusa.com, our Annual Report on Form 10-K, Quarterly Reports on Form 10-Q and our Current Reports on Form 8-K and all amendments to those reports as soon as reasonably practicable after such material is electronically filed with or furnished to the U.S. Securities and Exchange Commission ("SEC"). The SEC maintains an Internet site that contains reports, proxy and information statements, and other information regarding issuers that file electronically with the Commission. The SEC's Internet address is www.sec.gov.
Item 1A.
Risk Factors
Risk Factors Relating to Our Business
We operate in a highly competitive business environment which could materially adversely affect our business, financial condition, results of operations and liquidity.
We operate in a highly competitive, consumer-driven industry and we compete against a variety of broadband, pay television and telephony providers and delivery systems, including broadband communications companies, wireless data and telephony providers, satellite-delivered video signals, Internet-delivered video content and broadcast television signals available to residential and business customers in our service areas. Some of our competitors include AT&T and its DirecTV subsidiary, CenturyLink, DISH Network, Frontier and Verizon. In addition, our pay television services compete with all other sources of leisure, news, information and entertainment, including movies, sporting or other live events, radio broadcasts, home-video services, console games, print media and the Internet.
In some instances, our competitors have fewer regulatory burdens, easier access to financing, greater resources, greater operating capabilities and efficiencies of scale, stronger brand-name recognition, longstanding relationships with regulatory authorities and customers, more customers, more flexibility to offer promotional packages at prices lower than ours and greater access to programming or other services. This competition creates pressure on our pricing and has adversely affected, and may continue to affect, our ability to add and retain customers, which in turn adversely affects our business, financial condition and results of operations. The effects of competition may also adversely affect our liquidity and ability to service our debt. For example, we face intense competition from Verizon, which has constructed FTTH network infrastructure that passes a significant number of households in our New York metropolitan service area. We estimate that Verizon is currently able to sell a fiber-based triple play, including broadband, pay television and telephony services, to at least half of the households in our New York metropolitan service area and may expand these and other service offerings to more customers in the future. Any estimate of Verizon's build-out and sales activity in our New York metropolitan service area is difficult to assess because it is based on visual inspections and other limited estimating techniques and therefore serves only as an approximation.
Our competitive risks are heightened by the rapid technological change inherent in our business, evolving consumer preferences and the need to acquire, develop and adopt new technology to differentiate our products and services from those of our competitors, and to meet consumer demand. We may need to anticipate far in advance which technology we should use for the development of new products and services or the enhancement of existing products and services. The failure to accurately anticipate such changes may adversely affect our ability to attract and retain customers, which in turn could adversely affect our business, financial condition and results of operations. Consolidation and cooperation in our industry may allow our competitors to acquire service capabilities or offer products that are not available to us or offer similar products and services at prices lower than ours. For example, Comcast and Charter Communications have agreed to jointly explore operational efficiencies to speed their respective entries into the wireless market, including in the areas of creating common operating platforms and emerging wireless technology platforms. In addition, changes in the regulatory and legislative environments may result in changes to the competitive landscape.
In addition, certain of our competitors own directly or are affiliated with companies that own programming content or have exclusive arrangements with content providers that may enable them to obtain lower programming costs or offer exclusive programming that may be attractive to prospective customers. For example, DirecTV has exclusive arrangements with the National Football League that give it access to programming we cannot offer. In 2018 AT&T acquired Time Warner, which owns a number of cable networks, including TBS, CNN and HBO, as well as Warner Bros. Entertainment, which produces television, film and home-video content. AT&T's and DirecTV's potential access to Time Warner programming could allow AT&T and DirecTV to offer competitive and promotional packages that could
19
negatively affect our ability to maintain or increase our existing customers and revenues. DBS operators such as DISH Network and DirecTV also have marketing arrangements with certain phone companies in which the DBS provider's pay television services are sold together with the phone company's broadband and mobile and traditional phone services.
Another source of competition for our pay television services is the delivery of video content over the Internet directly to customers, some of which is offered without charging a fee for access to the content. This competition comes from a number of different sources, including companies that deliver movies, television shows and other video programming over broadband Internet connections, such as Netflix, Hulu, iTunes, YouTube, Amazon Prime, Sling TV, Playstation Vue, DirecTV Now, and Locast. It is possible that additional competitors will enter the market and begin providing video content over the Internet directly to customers. Increasingly, content owners, such as HBO, CBS and ESPN, are selling their programming directly to consumers over the Internet without requiring a pay-television subscription. The availability of these services has and will continue to adversely affect customer demand for our pay television services, including premium and on-demand services. Further, due to consumer electronics innovations, consumers are able to watch such Internet-delivered content on television sets and mobile devices, such as smartphones and tablets. Internet access services are also offered by providers of wireless services, including traditional cellular phone carriers and others focused solely on wireless data services. All wireless carriers have started to offer unlimited data plans, which could, in some cases, become a substitute for the fixed broadband services we provide. The FCC is likely to continue to make additional radio spectrum available for these wireless Internet access services.
Our pay television services also face competition from broadcast television stations, entities that make digital video recorded movies and programs available for home rental or sale, satellite master antenna television ("SMATV") systems, which generally serve large MDUs under an agreement with the landlord and service providers and open video system operators. Private cable systems can offer improved reception of local television stations and many of the same satellite-delivered program services that are offered by cable systems. SMATV systems currently benefit from operating advantages not available to franchised cable systems, including fewer regulatory burdens. Cable television has also long competed with broadcast television, which consists of television signals that the viewer is able to receive without charge using an "off-air" antenna. The extent of such competition is dependent upon the quality and quantity of broadcast signals available through "off-air" reception, compared to the services provided by the local cable system. The use of radio spectrum now provides traditional broadcasters with the ability to deliver HD television pictures and multiple digital-quality program streams. There can be no assurance that existing, proposed or as yet undeveloped technologies will not become dominant in the future and render our video service offering less profitable or even obsolete.
Most broadband communications companies, which already have wired networks, an existing customer base and other operational functions in place (such as billing and service personnel), offer DSL services. We believe DSL service competes with our broadband service and is often offered at prices lower than our Internet services. However, DSL is often offered at speeds lower than the speeds we offer. In addition, DSL providers may currently be in a better position to offer Internet services to businesses since their networks tend to be more complete in commercial areas. They may also increasingly have the ability to combine video services with telephone and Internet services offered to their customers, particularly as broadband communications companies enter into co-marketing agreements with other service providers. In addition, current and future fixed and wireless Internet services, such as 3G, 4G and 5G fixed and wireless broadband services and Wi-Fi networks, and devices such as wireless data cards, tablets and smartphones, and mobile wireless routers that connect to such devices, may compete with our broadband services.
Our telephony services, including the mobile wireless voice and data service we expect to launch in 2019, compete directly with established broadband communications companies and other carriers, including wireless providers, as increasing numbers of homes are replacing their traditional telephone service with wireless telephone service. We also compete against VoIP providers like Vonage, Skype, GoogleTalk, Facetime, WhatsApp and magicJack that do not own networks but can provide service to any person with a broadband connection, in some cases free of charge. In addition, we compete against ILECs, other CLECs and long-distance voice-service companies for large commercial and enterprise customers. While we compete with the ILECs, we also enter into interconnection agreements with ILECs so that our customers can make and receive calls to and from customers served by the ILECs and other telecommunications providers. Federal and state law and regulations require ILECs to enter into such agreements and provide facilities and services necessary for connection, at prices subject to regulation. The specific price, terms and conditions of each agreement, however, depend on the outcome of negotiations between us and each ILEC. Interconnection agreements are also subject to approval by the state regulatory commissions, which may arbitrate negotiation impasses. We have entered into
20
interconnection agreements with Verizon for New York, New Jersey and portions of Connecticut, and with Frontier for portions of Connecticut, which have been approved by the respective state commissions. We have also entered into interconnection agreements with other ILECs in New York and New Jersey. These agreements, like all interconnection agreements, are for limited terms and upon expiration are subject to renegotiation, potential arbitration and approval under the laws in effect at that time.
We also face competition for our advertising sales from traditional and non-traditional media outlets, such as television and radio stations, traditional print media and the Internet, including Facebook, Google and others.
We face significant risks as a result of rapid changes in technology, consumer expectations and behavior.
The broadband communications industry has undergone significant technological development over time and these changes continue to affect our business, financial condition and results of operations. Such changes have had, and will continue to have, a profound impact on consumer expectations and behavior. Our video business faces technological change risks as a result of the continuing development of new and changing methods for delivery of programming content such as Internet-based delivery of movies, shows and other content which can be viewed on televisions, wireless devices and other developing mobile devices. Consumers' video consumption patterns are also evolving, for example, with more content being downloaded for time-shifted consumption. A proliferation of delivery systems for video content can adversely affect our ability to attract and retain customers and the demand for our services and it can also decrease advertising demand on our delivery systems. Our broadband business faces technological challenges from rapidly evolving wireless Internet solutions. Our telephony service offerings face technological developments in the proliferation of telephony delivery systems including those based on Internet and wireless delivery. If we do not develop or acquire and successfully implement new technologies, we will limit our ability to compete effectively for customers, content and advertising. We cannot provide any assurance that we will realize, in full or in part, the anticipated benefits we expect from the introduction of our home communications hub, Altice One, or that it will be rolled out across our footprint in the timeframe we anticipate. In addition, we may be required to make material capital and other investments to anticipate and to keep up with technological change. These challenges could adversely affect our business, financial condition and results of operations.
In the fourth quarter of 2017, we entered into a multi-year strategic agreement with Sprint pursuant to which we will utilize Sprint's network to provide mobile voice and data services to our customers throughout the nation, and our broadband network will be utilized to accelerate the densification of Sprint's network. We believe this additional product offering will enable us to deliver greater value and more benefits to our customers, by offering mobile voice and data services, in addition to our broadband, pay television and telephony services. Some of our competitors already offer, or have announced plans to offer, their own "quad-play" offerings that bundle broadband, pay television, telephony and mobile voice and data services. If our customers do not view our quad play offers as competitive with those offered by our competitors, we could experience increased customer churn. We cannot provide any assurance that we will realize, in full or in part, the anticipated benefits we expect from the introduction of our mobile voice and data services, or that they will be introduced to, or adopted by, customers to the extent or in the timeframe we anticipate. In addition, we may be required to make material capital and other investments to develop this business and to anticipate and to keep up with technological change. These challenges could adversely affect our business, financial condition and results of operations.
Programming and retransmission costs are increasing and we may not have the ability to pass these increases on to our customers. Disputes with programmers and the inability to retain or obtain popular programming can adversely affect our relationship with customers and lead to customer losses.
Programming costs are one of our largest categories of expenses. In recent years, the cost of programming in the cable and satellite video industries has increased significantly and is expected to continue to increase, particularly with respect to costs for sports programming and broadcast networks. We may not be able to pass programming cost increases on to our customers due to the increasingly competitive environment. If we are unable to pass these increased programming costs on to our customers, our results of operations would be adversely affected. Moreover, programming costs are related directly to the number of customers to whom the programming is provided. Our smaller customer base relative to our competitors may limit our ability to negotiate lower per-customer programming costs, which could result in reduced operating margins relative to our competitors with a larger customer base.
The expiration dates of our various programming contracts are staggered, which results in the expiration of a portion of our programming contracts throughout each year. We attempt to control our programming costs and, therefore, the cost
21
of our video services to our customers, by negotiating favorable terms for the renewal of our affiliation agreements with programmers. On certain occasions in the past, such negotiations have led to disputes with programmers that have resulted in temporary periods during which we did not carry or decided to stop carrying a particular broadcast network or programming service or services. For example, in 2017, we were unable to reach agreement with Starz on acceptable economic terms, and effective January 1, 2018, all Starz services were removed from our lineups in our Optimum and Suddenlink segments, and we launched alternative networks offered by other programmers under new long-term contracts. On February 13, 2018, we and Starz reached a new carriage agreement and we started restoring the Starz services previously offered by Optimum and Suddenlink. Also, in our Suddenlink segment, we were unable to reach agreement with Viacom on acceptable economic terms for a long-term contract renewal and, effective October 1, 2014, all Viacom networks were removed from our channel lineups in our Suddenlink footprint. We and Viacom did not reach a new agreement to include certain Viacom networks in the Suddenlink channel lineup until May 2017. To the extent we are unable to reach agreement with certain programmers on terms we believe are reasonable, we may be forced to, or determine for strategic or business reasons to, remove certain programming channels from our line-up and may decide to replace such programming channels with other programming channels, which may not be available on acceptable terms or be as attractive to customers. Such disputes, or the removal or replacement of programming, may inconvenience some of our customers and can lead to customer dissatisfaction and, in certain cases, the loss of customers, which could have a material adverse effect on our business, financial condition, results of operations and liquidity. There can be no assurance that our existing programming contracts will be renewed on favorable or comparable terms, or at all, or that the rights we negotiate will be adequate for us to execute our business strategy.
We may also be subject to increasing financial and other demands by broadcast stations. Federal law allows commercial television broadcast stations to make an election between "must-carry" rights and an alternative "retransmission consent" regime. Local stations that elect "must-carry" are entitled to mandatory carriage on our systems, but at no fee. When a station opts for retransmission consent, cable operators negotiate for the right to carry the station's signal, which typically requires payment of a per-customer fee. Our retransmission agreements with stations expire from time to time. Upon expiration of these agreements, we may carry some stations under short-term arrangements while we attempt to negotiate new long-term retransmission agreements. In connection with any negotiation of new retransmission agreements, we may become subject to increased or additional costs, which we may not be able to pass on to our customers. To the extent that we cannot pass on such increased or additional costs to customers or offset such increased or additional costs through the sale of additional services, our business, financial condition, results of operations and liquidity could be materially adversely affected. In addition, in the event contract negotiations with stations are unsuccessful, we could be required, or determine for strategic or business reasons, to cease carrying such stations' signals, possibly for an indefinite period. Any loss of stations could make our video service less attractive to our customers, which could result in a loss of customers, which could have a material adverse effect on our business, financial condition, results of operations and liquidity. There can be no assurance that any expiring retransmission agreements will be renewed on favorable or comparable terms, or at all.
We may not be able to successfully implement our growth strategy.
Our future growth, profitability and results of operations depend upon our ability to successfully implement our business strategy, which, in turn, is dependent upon a number of factors, including our ability to continue to:
|
•
|
simplify and optimize our organization;
|
|
•
|
reinvest in infrastructure and content;
|
|
•
|
invest in sales, marketing and innovation;
|
|
•
|
enhance the customer experience;
|
|
•
|
drive revenue and cash flow growth; and
|
|
•
|
opportunistically grow through value-accretive acquisitions.
|
There can be no assurance that we can successfully achieve any or all of the above initiatives in the manner or time period that we expect. Furthermore, achieving these objectives will require investments which may result in short-term costs without generating any current revenues and therefore may be dilutive to our earnings. We cannot provide any assurance that we will realize, in full or in part, the anticipated benefits we expect our strategy will achieve. The failure
22
to realize those benefits could have a material adverse effect on our business, financial condition and results of operations. In addition, if we are unable to continue improving our operational performance and customer experience we may face a decrease in new customers and an increase in customer churn, which could have a material adverse effect on our business, financial condition and results of operations. In particular, there can be no assurance that we will be able to successfully implement our plan to build a FTTH network within the anticipated timeline or at all or within the cost parameters we currently expect. Similarly, we may not be successful in deploying Altice One, or the mobile voice and data services we intend to offer, on our current timeline or realize, in full or in part, the anticipated benefits we expect from the introduction thereof, and we may face technological, financial, legal, regulatory or other challenges in pursuing these or other initiatives.
The financial markets are subject to volatility and disruptions, which have in the past, and may in the future, adversely affect our business, including by affecting the cost of new capital and our ability to fund acquisitions or other strategic transactions.
From time to time the capital markets experience volatility and disruption, including during recent periods when the markets have exerted extreme downward pressure on stock prices and upward pressure on the cost of new debt, which has severely restricted credit availability for many companies. Volatility in the capital markets may be impacted by a number of factors. Some of the main factors which contributed to high capital markets volatility in recent months included, for example, uncertainty between the United States and other countries with respect to trade policies, treaties, and tariffs, the outlook for interest rates, and continued uncertainty surrounding the referendum by British voters to exit the European Union. There can be no assurance that market conditions will not continue to be volatile or worsen in the future.
Historical market disruptions have typically been accompanied by a broader economic downturn, which has historically led to lower demand for our products, such as video services, as well as lower levels of television advertising, and increased incidence of customers' inability to pay for the services we provide. A recurrence of these conditions may further adversely impact our business, financial condition and results of operations.
We rely on the capital markets, particularly for offerings of debt securities and borrowings under syndicated facilities, to meet our financial commitments and liquidity needs if we are unable to generate sufficient cash from operations to fund such anticipated commitments and needs and to fund acquisitions or other strategic transactions. Disruptions or volatility in the capital markets could also adversely affect our ability to refinance on satisfactory terms, or at all, our scheduled debt maturities and could adversely affect our ability to draw on our revolving credit facilities.
Disruptions in the capital markets as well as the broader global financial market can also result in higher interest rates on any new debt securities we issue and increased costs under credit facilities which bear floating interest rates. Such disruptions could increase our interest expense, adversely affecting our business, financial position and results of operations.
Our access to funds under our revolving credit facilities is dependent on the ability of the financial institutions that are parties to those facilities to meet their funding commitments. Those financial institutions may not be able to meet their funding commitments if they experience shortages of capital and liquidity or if they experience excessive volumes of borrowing requests within a short period of time. Moreover, the obligations of the financial institutions under our revolving credit facilities are several and not joint and, as a result, a funding default by one or more institutions does not need to be made up by the others.
Longer term, volatility and disruptions in the capital markets and the broader global financial market as a result of uncertainty, changing or increased regulation of financial institutions, reduced alternatives or failures of significant financial institutions could adversely affect our access to the liquidity needed for our businesses. Such disruptions could require us to take measures to conserve cash or impede or delay potential acquisitions, strategic transactions and refinancing transactions until the markets stabilize or until alternative credit arrangements or other funding for our business needs can be arranged.
We are highly leveraged and have substantial indebtedness, which reduces our capability to withstand adverse developments or business conditions. If we incur additional indebtedness, such indebtedness could further exacerbate the risks associated with our substantial indebtedness.
Our subsidiaries have incurred substantial amounts of indebtedness to in connection with acquisitions or to finance the Acquisitions, our operations, upgrades to our cable plant and acquisitions of other cable systems, sources of programming
23
and other businesses. We have also incurred substantial indebtedness in order to offer new or upgraded services to our current and potential customers. At
December 31, 2018
, the carrying value of our total aggregate indebtedness, including collateralized indebtedness, was approximately
$22.8 billion
. Because we are highly leveraged, our payments on our indebtedness are significant in relation to our revenues and cash flow, which exposes us to significant risk in the event of downturns in our businesses (whether through competitive pressures or otherwise), our industry or the economy generally, since our cash flows would decrease, but our required payments under our indebtedness would not. Any decrease in our revenues or an increase in operating costs (and corresponding reduction in our cash flows) would therefore adversely affect our ability to make interest or principal payments on our indebtedness as they come due.
Economic downturns may impact our ability to comply with the covenants and restrictions in our indentures, credit facilities and other agreements governing our indebtedness and may impact our ability to pay or refinance our indebtedness as it comes due. If we do not repay or refinance our debt obligations when they become due and do not otherwise comply with the covenants and restrictions in our indentures, credit facilities and other agreements governing our indebtedness, we would be in default under those agreements and the underlying debt could be declared immediately due and payable. In addition, any default under any of our indentures, credit facilities or other agreements governing our indebtedness could lead to an acceleration of debt under any other debt instruments or agreements that contain cross-acceleration or cross-default provisions. If the indebtedness incurred under our indentures, credit facilities and other agreements governing our indebtedness were accelerated, we would not have sufficient cash to repay amounts due thereunder. To avoid a default, we could be required to defer capital expenditures, sell assets, seek strategic investments from third parties or otherwise reduce or eliminate discretionary uses of cash. However, if such measures were to become necessary, there can be no assurance that we would be able to sell sufficient assets or raise strategic investment capital sufficient to meet our scheduled debt maturities as they come due. In addition, any significant reduction in necessary capital expenditures could adversely affect our ability to retain our existing customer base and obtain new customers, which would adversely affect our business, financial position and results of operations.
Our overall leverage and the terms of our financing arrangements could also:
|
•
|
make it more difficult for us to satisfy obligations under our outstanding indebtedness;
|
|
•
|
limit our ability to obtain additional debt or equity financing in the future, including for working capital, capital expenditures or acquisitions, and increase the costs of such financing;
|
|
•
|
limit our ability to refinance our indebtedness on terms acceptable to us or at all;
|
|
•
|
limit our ability to adapt to changing market conditions;
|
|
•
|
restrict us from making strategic acquisitions or cause us to make non-strategic divestitures;
|
|
•
|
require us to dedicate a significant portion of our cash flow from operations to paying the principal of and interest on our indebtedness, thereby limiting the availability of our cash flow to fund future capital expenditures, working capital, research and development, and other corporate purposes;
|
|
•
|
increase our vulnerability to or limit our flexibility in planning for, or reacting to, changes in our business and the broadband communications industry generally as well as general economic conditions, including the risk of increased interest rates;
|
|
•
|
place us at a competitive disadvantage compared with competitors that have a less significant debt burden; and
|
|
•
|
adversely affect public perception of us and our brands.
|
In addition, a substantial portion of our indebtedness bears interest at variable rates. If market interest rates increase, our variable-rate debt will have higher debt service requirements, which could adversely affect our cash flows and financial condition. For more information, see "Management's Discussion and Analysis of Financial Condition and Results of Operations—Quantitative and Qualitative Disclosures About Market Risk—Interest Rate Risk." Although we have historically entered into, and may in the future enter into, hedging arrangements to limit our exposure to an increase in interest rates or to other risks, such arrangements may not offer complete protection from these risks. In addition, the nature of these hedges could prevent us from realizing benefits we would have received had the hedge not been put in place, such as if interest rates fall.
24
The terms of our existing indebtedness restrict, but do not prohibit, us from incurring additional indebtedness. We may increase our consolidated indebtedness for various business reasons, which might include, among others, financing acquisitions or other strategic transactions, funding prepayment premiums, if any, on the debt we refinance, funding distributions to our shareholders or general corporate purposes. If we incur additional indebtedness, such indebtedness will be added to our current debt levels and the above-described risks we currently face could be magnified.
We have in past periods incurred substantial losses from continuing operations, and we may do so in the future, which may reduce our ability to raise needed capital.
We have in the past incurred substantial losses from continuing operations and we may do so in the future. Significant losses from continuing operations could limit our ability to raise any needed financing, or to do so on favorable terms, as such losses could be taken into account by potential investors, lenders and the organizations that issue investment ratings on our indebtedness.
A lowering or withdrawal of the ratings assigned to our subsidiaries' debt securities and credit facilities by ratings agencies may further increase our future borrowing costs and reduce our access to capital.
Credit rating agencies continually revise their ratings for companies they follow. The condition of the financial and credit markets and prevailing interest rates have fluctuated in the past and are likely to fluctuate in the future. In addition, developments in our business and operations or the amount of indebtedness could lead to a ratings downgrade on our or our subsidiaries' indebtedness. The debt ratings for our subsidiaries' debt securities and credit facilities are currently below the "investment grade" category, which results in higher borrowing costs as well as a reduced pool of potential investors of that debt as some investors will not purchase debt securities or become lenders under credit facilities that are not rated in an investment grade rating category. In addition, there can be no assurance that any rating assigned will remain for any given period of time or that a rating will not be lowered or withdrawn entirely by a rating agency, if in that rating agency's judgment, future circumstances relating to the basis of the rating, such as adverse changes, so warrant. Our credit rating (including the credit rating assigned to our subsidiaries’ debt securities and credit facilities) has in the past been and may continue to be impacted by a number of factors, including the effects of the U.S. economy experiencing an uneven recovery following a protracted slowdown, factors affecting the broadband communications and video service industry, our operating performance and our financing activities. Any such fluctuation in the rating of us or our subsidiaries may impact our ability to access debt markets in the future or increase our cost of future debt which could have a material adverse effect on our business, financial condition and results of operations, which in return may adversely affect the market price of shares of our Class A common stock or Class B common stock.
Our subsidiaries' ability to meet obligations under their indebtedness may be restricted by limitations on our other subsidiaries' ability to send funds.
Our primary debt obligations have been incurred by our subsidiaries Cablevision Systems Corporation and CSC Holdings, LLC (which is a direct subsidiary of Cablevision Systems Corporation). The indebtedness incurred by Cablevision Systems Corporation is not guaranteed by any of our other subsidiaries and a portion of the indebtedness incurred by CSC Holdings, LLC is also unguaranteed. These subsidiaries are primarily holding companies whose ability to pay interest and principal on such indebtedness is wholly or partially dependent upon the operations of their respective subsidiaries and the distributions or other payments of cash, in the form of distributions, loans or advances, those other subsidiaries deliver to our indebted subsidiaries. Our subsidiaries are separate and distinct legal entities and, unless any such subsidiaries has guaranteed the underlying indebtedness, have no obligation, contingent or otherwise, to pay any amounts due on our indebted subsidiaries' indebtedness or to make any funds available to our indebted subsidiaries to do so. These subsidiaries may not generate enough cash to make such funds available to our indebted subsidiaries and in certain circumstances legal and contractual restrictions may also limit their ability to do so. In addition, the terms of certain of the indebtedness incurred by CSC Holdings restrict the amount of dividends or other distributions that can be made to Cablevision, including for the purpose of making payments on its indebtedness.
Also, our subsidiaries' creditors, including trade creditors, in the event of a liquidation or reorganization of any subsidiary, would be entitled to a claim on the assets of such subsidiaries, including any assets transferred to those subsidiaries, prior to any of our claims as a stockholder and those creditors are likely to be paid in full before any distribution is made to us. To the extent that we are a creditor of a subsidiary, our claims could be subordinated to any security interest in the assets of that subsidiary and/or any indebtedness of that subsidiary senior to that held by us.
25
We are subject to significant restrictive covenants under the agreements governing our indebtedness.
The indentures, credit facilities and agreements governing the indebtedness of our subsidiaries contain various negative covenants that restrict our subsidiaries' (and their respective subsidiaries') ability to, among other things:
|
•
|
incur additional indebtedness and guarantee indebtedness;
|
|
•
|
pay dividends or make other distributions, or repurchase or redeem capital stock;
|
|
•
|
prepay, redeem or repurchase subordinated debt or equity;
|
|
•
|
issue certain preferred stock;
|
|
•
|
make loans and investments;
|
|
•
|
sell assets;
|
|
•
|
incur liens;
|
|
•
|
enter into transactions with affiliates;
|
|
•
|
create or permit any encumbrances or restrictions on the ability of their respective subsidiaries to pay dividends or make other distributions, make loans or advances or transfer assets, in each case to such subsidiary, or its other restricted subsidiaries; and
|
|
•
|
consolidate, merge or sell all or substantially all of their assets.
|
We are also subject to certain affirmative covenants under our subsidiary's revolving credit facility, which, among other things, require our operating subsidiaries to maintain a specified financial ratio if there are any outstanding loans thereunder. Our ability to meet these financial ratios may be affected by events beyond our control and, as a result, there can be no assurance that we will be able to meet these ratios.
Violation of these covenants could result in a default that would permit the relevant creditors to require the immediate repayment of the borrowings thereunder, which could result in a default under other debt instruments and agreements that contain cross-default provisions and, in the case of our revolving credit facility, permit the relevant lenders to restrict the relevant borrower's ability to borrow undrawn funds under such revolving credit facility. A default under any of the agreements governing our indebtedness could materially adversely affect our financial condition and results of operations.
As a result, we may be:
|
•
|
limited in how we conduct our business;
|
|
•
|
unable to raise additional debt or equity financing to operate during general economic or business downturns; or
|
|
•
|
unable to compete effectively or to take advantage of new business opportunities.
|
These restrictions could have a material adverse effect on our ability to grow in accordance with our strategy and on the value of our debt and equity securities.
We will need to raise significant amounts of funding over the next several years to fund capital expenditures, repay existing obligations and meet other obligations and the failure to do so successfully could adversely affect our business. We may also engage in extraordinary transactions that involve the incurrence of large amounts of indebtedness.
Our business is capital intensive. Operating and maintaining our cable systems requires significant amounts of cash payments to third parties. Capital expenditures were $
1,153.6 million
, $
951.3 million
and
$625.5 million
in
2018
,
2017
and
2016
, respectively, and primarily included payments for customer premise equipment, network infrastructure, support and other costs.
We have commenced a plan to build a FTTH network, which will enable us to deliver more than 10 Gbps broadband speeds across our entire Optimum footprint and part of our Suddenlink footprint. We also introduced Altice One during the fourth quarter of 2017, which is our most advanced home communications hub, and as of December 31, 2018 it was available to 80% of our entire footprint. Also in the fourth quarter of 2017, we entered into a multi-year strategic agreement pursuant to which we will utilize Sprint's network to provide mobile voice and data services to our customers throughout
26
the nation, and our broadband network will be utilized to accelerate the densification of Sprint's network. We may not be able to execute these initiatives within the anticipated timelines and we may incur greater than anticipated costs and capital expenditures, fail to realize anticipated benefits, experience business disruptions or encounter other challenges to executing these initiatives which could have a material adverse effect on our business, financial condition and results of operations.
We expect these capital expenditures to continue to be significant as we further enhance our service offerings. We may have substantial future capital commitments in the form of long-term contracts that require substantial payments over a period of time. In the longer term, our ability to fund our operations, make planned capital expenditures, make scheduled payments on our indebtedness and repay our indebtedness depends on our future operating performance and cash flows and our ability to access the capital markets, which, in turn, are subject to prevailing economic conditions and to financial, business and other factors, some of which are beyond our control. Competition, market disruptions or deterioration in economic conditions could lead to lower demand for our products, as well as lower levels of advertising, and increased incidence of customers' inability to pay for the services we provide. These events would adversely impact our results of operations, cash flows and financial position. As such, we may not be able to generate sufficient cash internally to fund anticipated capital expenditures, make ongoing interest payments and repay our indebtedness at maturity. Accordingly, we may have to do one or more of the following:
|
•
|
refinance existing obligations to extend maturities;
|
|
•
|
raise additional capital, through debt or equity issuances or both;
|
|
•
|
cancel or scale back current and future spending programs; or
|
|
•
|
sell assets or interests in one or more of our businesses.
|
However, we may not be able to refinance existing obligations or raise any required additional capital on terms acceptable to us or at all. Borrowing costs related to future capital raising activities may be significantly higher than our current borrowing costs and we may not be able to raise additional capital on favorable terms, or at all, if financial markets experience volatility. If we are unable to pursue our current and future spending programs, we may be forced to cancel or scale back those programs. Our choice of which spending programs to cancel or reduce may be limited. Failure to successfully pursue our capital expenditure and other spending plans could materially and adversely affect our ability to compete effectively. It is possible that in the future we may also engage in extraordinary transactions and such transactions could result in the incurrence of substantial additional indebtedness.
We rely on network and information systems for our operations and a disruption or failure of, or defects in, those systems may disrupt our operations, damage our reputation with customers and adversely affect our results of operations.
Network and information systems are essential to our ability to conduct our business and deliver our services to our customers. While we have in place multiple security systems designed to protect against intentional or unintentional disruption, failure, misappropriation or corruption of our network and information systems, there can be no assurance that our efforts to protect our network and information systems will prevent any of the problems identified above. A problem of this type might be caused by events such as computer hacking, computer viruses, worms and other destructive or disruptive software, "cyber-attacks" and other malicious activity, defects in the hardware and software comprising our network and information systems, as well as natural disasters, power outages, terrorist attacks and similar events. Such events could have an adverse impact on us and our customers, including degradation of service, service disruption, excessive call volume to call centers, theft and damage to our plant, equipment and data. Operational or business delays may result from the disruption of network or information systems and the subsequent remediation activities. Moreover, these events may create negative publicity resulting in reputation or brand damage with customers and our results of operations could suffer.
We also use certain vendors to supply some of the hardware, software and support of our network, some of which have been customized or altered to fit our business needs. Certain of these vendors and suppliers may have leverage over us considering that there are limited suppliers of certain products and services, or that there is a long lead time and/or significant expense required to transition to another provider. In addition, some of these vendors and suppliers do not have a long operating history or may not be able to continue to supply the equipment and services we desire. Some of our hardware, software and operational support vendors and some of our service providers represent our sole source of
27
supply or have, either through contract or as a result of intellectual property rights, a position of some exclusivity. In addition, because of the pace at which technological innovations occur in our industry, we may not be able to obtain access to the latest technology on reasonable terms. Any delays or the termination or disruption in these relationships as a result of contractual disagreements, operational or financial failures on the part of our vendors and suppliers, or other adverse events that prevent such vendors and suppliers from providing the equipment or services we need, with the level of quality we require, in a timely manner and at reasonable prices, could result in significant costs to us and have a negative effect on our ability to provide services and rollout advanced services. Our ability to replace such vendors and suppliers may be limited and, as a result, our business, financial condition, results of operations and liquidity could be materially adversely affected.
If we experience a significant data security breach or fail to detect and appropriately respond to a significant data security breach, our results of operations and reputation could suffer.
The nature of our business involves the receipt and storage of information about our customers and employees. We have procedures in place to detect and respond to data security incidents. However, because the techniques used to obtain unauthorized access, disable or degrade service, or sabotage systems change frequently and may be difficult to detect for long periods of time, we may be unable to anticipate these techniques or implement adequate preventive measures. In addition, hardware, software or applications we develop or procure from third parties may contain defects in design or manufacture or other problems that could unexpectedly compromise information security. Unauthorized parties may also attempt to gain access to our systems or facilities and to our proprietary business information. If our efforts to protect the security of information about our customers and employees are unsuccessful, a significant data security breach may result in costly government enforcement actions, private litigation and negative publicity resulting in reputation or brand damage with customers, and our financial condition and results of operations could suffer.
A portion of our workforce is represented by labor unions under established collective bargaining agreements or negotiating for a first contract. The terms of existing or new collective bargaining agreements can increase our expenses. Labor disruptions could adversely affect our business, financial condition and results of operations.
As of
December 31, 2018
, 291 of the Company’s employees are represented by either the International Brotherhood of Electrical Workers ("IBEW") or Communication Workers of America ("CWA"). An existing collective bargaining agreement with the IBEW covering 86 technicians (and other technical positions) in Oakland, New Jersey was negotiated in 2018 for a four-year term, expiring June 25, 2022. The Company and the CWA are parties to an existing collective bargaining agreement covering 205 technicians (and other technical positions) in Brooklyn, New York, which expires on June 20, 2019 and is in the process of being renegotiated. The Company and the CWA have reached a tentative agreement for a successor collective bargaining agreement with a four-year term which was ratified on February 12, 2019. Two new bargaining units were certified by the National Labor Relations Board in 2018; on May 2, 2018, the IBEW was certified to represent approximately 50 technical employees in Lodi, New Jersey; and on August 6, 2018 the IBEW was certified to represent approximately 57 technical employees in Newark, New Jersey. On December 17, 2018, the Company recognized the IBEW to represent approximately 119 technical employees in Freeport and Bethpage, New York, based on majority status determined through a card check by a neutral third-party. We currently are negotiating first collective bargaining agreements with the IBEW relating to these employees and there can be no assurance that the Company will be able to reach an agreement on terms acceptable to us. The collective bargaining agreements with the CWA and IBEW covering these groups of employees or any other agreements with other unions may increase the Company’s expenses or affect our ability to implement operational changes. Increased unionization of our workforce and any labor disputes we experience could create disruption or have an adverse effect on our business, financial condition and results of operations.
A significant amount of our book value consists of intangible assets that may not generate cash in the event of a voluntary or involuntary sale.
At
December 31, 2018
, we reported approximately $
33.6 billion
of consolidated total assets, of which approximately $
25.2 billion
were intangible.
Intangible assets primarily included franchises from city and county governments to operate cable systems, goodwill, customer relationships and trade names. While we believe the carrying values of our intangible assets are recoverable, we may not receive any cash in the event of a voluntary or involuntary sale of these intangible assets, particularly if we were not continuing as an operating business. We urge our stockholders to read
28
carefully our consolidated financial statements contained herein, which provide more detailed information about these intangible assets.
We may engage in acquisitions, dispositions and other strategic transactions and the integration of such acquisitions, the sales of assets and other strategic transactions could materially adversely affect our business, financial condition and results of operations.
Our business has grown significantly as a result of acquisitions, which entail numerous risks including:
|
•
|
distraction of our management team in identifying potential acquisition targets, conducting due diligence and negotiating acquisition agreements;
|
|
•
|
difficulties in integrating the operations, personnel, products, technologies and systems of acquired businesses;
|
|
•
|
difficulties in enhancing our customer support resources to adequately service our existing customers and the customers of acquired businesses;
|
|
•
|
the potential loss of key employees or customers of the acquired businesses;
|
|
•
|
unanticipated liabilities or contingencies of acquired businesses;
|
|
•
|
unbudgeted costs which we may incur in connection with pursuing potential acquisitions which are not consummated;
|
|
•
|
failure to achieve projected cost savings or cash flow from acquired businesses, which are based on projections that are inherently uncertain;
|
|
•
|
fluctuations in our operating results caused by incurring considerable expenses to acquire and integrate businesses before receiving the anticipated revenues expected to result from the acquisitions; and
|
|
•
|
difficulties in obtaining regulatory approvals required to consummate acquisitions.
|
We also participate in competitive bidding processes, some of which may involve significant cable systems. We also may sell all or portions of the businesses we own, including cable systems or business units. If we engage in acquisitions, dispositions or other strategic transactions in the future, we may incur additional debt, contingent liabilities and amortization expenses, which could materially adversely affect our business, financial condition and results of operations. We could also issue substantial additional equity which could dilute existing stockholders.
If our acquisitions do not result in the anticipated operating efficiencies, are not effectively integrated, or result in costs which exceed our expectations, or if our dispositions fail to generate adequate consideration, result in contingent liabilities, adversely affect our ability to generate revenue or are disruptive to our other businesses, our business, financial condition and results of operations could be materially adversely affected.
Significant unanticipated increases in the use of bandwidth-intensive Internet-based services could increase our costs.
The rising popularity of bandwidth-intensive Internet-based services poses risks for our broadband and wireless services. Examples of such services include peer-to-peer file sharing services, gaming services and the delivery of video via streaming technology and by download. If heavy usage of bandwidth-intensive broadband and wireless services grows beyond our current expectations, we may need to incur more expenses than currently anticipated to expand the bandwidth capacity of our systems or our customers could have a suboptimal experience when using our broadband or wireless services. In order to provide quality services at attractive prices, we need the continued flexibility to develop and refine business models that respond to changing consumer uses and demands and to manage bandwidth usage efficiently. Our ability to undertake such actions could be restricted by regulatory and legislative efforts to impose so-called "net neutrality" requirements on broadband communication providers like us that provide broadband services. For more information, see "Regulation—Broadband."
29
Our business depends on intellectual property rights and on not infringing on the intellectual property rights of others.
We rely on our patents, copyrights, trademarks and trade secrets, as well as licenses and other agreements with our vendors and other parties, to use our technologies, conduct our operations and sell our products and services. Our intellectual property rights may be challenged and invalidated by third parties and may not be strong enough to provide meaningful commercial competitive advantage. Third parties have in the past, and may in the future, assert claims or initiate litigation related to exclusive patent, copyright, trademark and other intellectual property rights to technologies and related standards that are relevant to us. These assertions have increased over time as a result of our growth and the general increase in the pace of patent claims assertions, particularly in the United States. Because of the existence of a large number of patents in the networking field, the secrecy of some pending patents and the rapid rate of issuance of new patents, we believe it is not possible to determine in advance whether a product or any of its components infringes or will infringe on the patent rights of others. Asserted claims and/or initiated litigation can include claims against us or our manufacturers, suppliers or customers, alleging infringement of their proprietary rights with respect to our existing or future products and/or services or components of those products and/or services.
Regardless of the merit of these claims, they can be time-consuming, result in costly litigation and diversion of technical and management personnel, or require us to modify our business, develop a non-infringing technology, be enjoined from use of certain intellectual property, use alternate technology or enter into license agreements. There can be no assurance that licenses will be available on acceptable terms and conditions, if at all, or that our indemnification by our suppliers will be adequate to cover our costs if a claim were brought directly against us or our customers. Furthermore, because of the potential for high court awards that are not necessarily predictable, it is not unusual to find even arguably unmeritorious claims settled for significant amounts. If any infringement or other intellectual property claim made against us by any third-party is successful, if we are required to indemnify a customer with respect to a claim against the customer, or if we fail to modify our business, develop non-infringing technology, use alternate technology or license the proprietary rights on commercially reasonable terms and conditions, our business, financial condition and results of operations could be materially adversely affected.
We may be liable for the material that content providers distribute over our networks.
The law relating to the liability of private network operators for information carried on, stored or disseminated through their networks is still unsettled. As such, we could be exposed to legal claims relating to content disseminated on our networks. Claims could challenge the accuracy of materials on our network or could involve matters such as defamation, invasion of privacy or copyright infringement. If we need to take costly measures to reduce our exposure to these risks or are required to defend ourselves against such claims, our business, reputation, financial condition and results of operations could be materially adversely affected.
If we are unable to retain key employees, our ability to manage our business could be adversely affected.
Our operational results have depended, and our future results will depend, upon the retention and continued performance of our management team. The competitive environment for management talent in the broadband communications industry could adversely impact our ability to retain and hire new key employees for management positions. The loss of the services of key members of management and the inability or delay in hiring new key employees could adversely affect our ability to manage our business and our future operational and financial results.
Impairment of Altice Group's or Mr. Drahi's reputation could adversely affect current and future customers' perception of Altice USA.
Our ability to attract and retain customers depends, in part, upon the external perceptions of Altice Group's and Mr. Drahi's reputation and the quality of Altice Group's products and its corporate and management integrity. The broadband communications and video services industry is by its nature more prone to reputational risks than other industries. This has been compounded in recent years by the free flow of unverified information on the Internet and, in particular, on social media and concerns about data privacy. Impairment, including any loss of goodwill or reputational advantages, of Altice Group's or Mr. Drahi's reputation in markets in which we do not operate could adversely affect current and future customers', regulators', investors' and others perception of Altice USA.
30
Macroeconomic developments may adversely affect our business.
Our performance is subject to global economic conditions and the related impact on consumer spending levels. Continued uncertainty about global economic conditions poses a risk as consumers and businesses may postpone spending in response to tighter credit, unemployment, negative financial news, and/or declines in income or asset values, which could have a material negative effect on demand for our products and services. As our business depends on consumer discretionary spending, our results of operations are sensitive to changes in macroeconomic conditions. Our customers may have less money for discretionary purchases as a result of job losses, foreclosures, bankruptcies, increased fuel and energy costs, higher interest rates, higher taxes, reduced access to credit, and lower home values. These and other economic factors could adversely affect demand for our products, which in turn could adversely affect our financial condition and results of operations.
Online piracy of entertainment and media content could result in reduced revenues and increased expenditures which could materially harm our business, financial condition and results of operations.
Online entertainment and media content piracy is extensive in many parts of the world and is made easier by technological advances. This trend facilitates the creation, transmission and sharing of high quality unauthorized copies of entertainment and media content. The proliferation of unauthorized copies of this content will likely continue, and if it does, could have an adverse effect on our business, financial condition and results of operations because these products could reduce the revenue we receive for our products. Additionally, in order to contain this problem, we may have to implement elaborate and costly security and antipiracy measures, which could result in significant expenses and losses of revenue. There can be no assurance that even the highest levels of security and anti-piracy measures will prevent piracy.
Our mobile wireless service will be subject to startup risk, competition, and risks associated with the price and availability of wholesale access to RAN.
In 2019 we expect to launch a mobile wireless voice and data service. We will offer this service using wholesale RAN agreements we have entered into with Sprint and other RAN providers, as well as with our existing Wi-Fi hotspot infrastructure in subscriber homes and at outdoor Wi-Fi hotspots. We believe that our approach to the mobile wireless service offering, including the construction and operation of our own “mobile core” and the ability to bundle and promote the product to our existing customer base, will give us advantages over resellers and incumbent network-based operators alike. We nevertheless face competition from well-established incumbents like Verizon, T-Mobile, Sprint and AT&T. These incumbents have scale advantages over Altice and own their spectrum and RAN, affording them significant control over the quality and reach of their own wireless networks, the service quality, speed of improvement and investment, cost, and the handling of subscriber congestion, which our service because it relies in part on incumbent networks we do not fully control cannot replicate.
Our mobile wireless strategy depends on the availability of wholesale RAN access from one or more network-based providers with whom we are likely to compete. Our mobile service is vulnerable to constraints on the availability of wholesale access or increases in price from the incumbents. We are also dependent on our ability to extend our agreement with Sprint or another wholesale RAN access provider after the initial term of our Sprint Agreement expires.
Consolidation among wholesale RAN access providers could impair our ability to launch and sustain our mobile service. In 2018, Sprint and T-Mobile announced an intent to merge. We have advised antitrust authorities and regulators that we believe that the reduction of competition among mobile wireless network-based providers that would result from the merger likely will impact negatively the price and availability of wholesale RAN access to Altice, affect the operating cost for our mobile wireless data service, and impact our ability to compete for mobile subscribers.
Risk Factors Relating to Regulatory and Legislative Matters
Our business is subject to extensive governmental legislation and regulation, which could adversely affect our business, increase our operational and administrative expenses and limit our revenues.
Regulation of the cable, telephone, mobile, and broadband industries imposes operational and administrative expenses and limits their revenues. The Company operates in all of these industries and is therefore subject to, among other things:
|
•
|
rules governing the provisioning and marketing of cable equipment and compatibility with new digital technologies;
|
31
|
•
|
rules and regulations relating to data protection and customer and employee privacy;
|
|
•
|
rules establishing limited rate regulation of video service;
|
|
•
|
rules governing the copyright royalties that must be paid for retransmitting broadcast signals;
|
• rules governing when a cable system must carry a particular broadcast station and when it must first obtain retransmission consent to carry a broadcast station;
|
•
|
rules governing the provision of channel capacity to unaffiliated commercial leased access programmers;
|
|
•
|
rules limiting the ability to enter into exclusive agreements with MDUs and control inside wiring;
|
|
•
|
rules for cable franchise renewals and transfers;
|
|
•
|
other requirements covering a variety of operational areas such as equal employment opportunity, emergency alert systems, disability access, technical standards and customer service and consumer protection requirements;
|
|
•
|
rules, regulations and regulatory policies relating to the provision of broadband service, including "net neutrality" requirements;
|
|
•
|
rules, regulations and regulatory policies relating to the provision of telephony services; and
|
|
•
|
rules, regulations and regulatory policies relating to licensed mobile network operators, wholesale access to mobile networks by resellers or MVNOs, and regulation of the prices, terms, or service provided by mobile operators.
|
Many aspects of these regulations are currently the subject of judicial proceedings and administrative or legislative proposals. There are also efforts to amend or expand the federal, state and local regulation of some of our cable systems, which may compound the regulatory risks we already face, and proposals that might make it easier for our employees to unionize. The Permanent Internet Tax Freedom Act prohibits many taxes on Internet access service, but certain states and localities are considering new taxes and fees on our provision of cable, broadband, and telecommunications taxes that could increase operating expenses. Certain states are also considering adopting energy efficiency regulations governing the operation of equipment that we use, which could constrain innovation. Congress periodically considers whether to rewrite the entire Communications Act of 1934, as amended (the "Communications Act") to account for changes in the communications marketplace or to adopt more focused changes. In response to recent data breaches and increasing concerns regarding the protection of consumers' personal information, Congress, states, and regulatory agencies are considering the adoption of new privacy and data security laws and regulations that could result in additional privacy, as well as network and information security, requirements for our business. These new laws, as well as existing legal and regulatory obligations, could require significant expenditures.
Additionally, there have been statements by federal government officials indicating that some laws and regulations applicable to our industry may be repealed or modified in a way that could be favorable to us and our competitors. There can be no assurance that any such repeal or modification will be beneficial to us or will not be more beneficial to our current and future competitors.
Our cable system franchises are subject to non-renewal or termination. The failure to renew a franchise in one or more key markets could adversely affect our business.
Our cable systems generally operate pursuant to franchises, permits and similar authorizations issued by a state or local governmental authority controlling the public rights-of-way. Some franchises establish comprehensive facilities and service requirements, as well as specific customer service standards and monetary penalties for non-compliance. In many cases, franchises are terminable if the franchisee fails to comply with significant provisions set forth in the franchise agreement governing system operations. Franchises are generally granted for fixed terms and must be periodically renewed. Franchising authorities may resist granting a renewal if either past performance or the prospective operating proposal is considered inadequate. Franchise authorities often demand concessions or other commitments as a condition to renewal. In some instances, local franchises have not been renewed at expiration, and we have operated and are operating under either temporary operating agreements or without a franchise while negotiating renewal terms with the local franchising authorities.
32
As of
December 31, 2018
, one of our largest franchises, the Town of Hempstead, New York, comprising an aggregate of approximately 84,000 pay television customers, was expired. We are currently lawfully operating in the Town of Hempstead, New York franchise area under temporary authority recognized by the State of New York. Lightpath holds a franchise from New York City that expired on December 20, 2008 and the renewal process is ongoing. We believe New York City is treating the expiration date of this franchise as extended until a formal determination on renewal is made, but there can be no assurance that we will be successful in renewing this franchise on anticipated terms or at all. We expect to renew or continue to operate under all or substantially all of our franchises.
The traditional cable franchising regime is currently undergoing significant change as a result of various federal and state actions. Some state franchising laws do not allow incumbent operators like us to immediately opt into favorable statewide franchising as quickly as new entrants, and often require us to retain certain franchise obligations that are more burdensome than those applied to new entrants.
There can be no assurance that we will be able to comply with all significant provisions of our franchise agreements and certain of our franchisors have from time to time alleged that we have not complied with these agreements. Additionally, although historically we have renewed our franchises without incurring significant costs, there can be no assurance that we will be able to renew, or to renew on terms as favorable, our franchises in the future. A termination of or a sustained failure to renew a franchise in one or more key markets could adversely affect our business in the affected geographic area.
Our cable system franchises are non-exclusive. Accordingly, local and state franchising authorities can grant additional franchises and create competition in market areas where none existed previously, resulting in overbuilds, which could adversely affect our results of operations.
Cable systems are operated under non-exclusive franchises historically granted by local authorities. More than one cable system may legally be built in the same area, which is referred to as an overbuild. It is possible that a franchising authority might grant a second franchise to another cable operator and that such franchise might contain terms and conditions more favorable than those afforded to us. Although entry into the cable industry involves significant cost barriers and risks, well-financed businesses from outside the cable industry, such as online service providers, or public utilities that already possess fiber optic and other transmission lines in the areas they serve, may over time become competitors. In addition, there are a few cities that have constructed their own cable systems, in a manner similar to city-provided utility services, and private cable companies not affiliated with established local exchange carriers have also demonstrated an interest in constructing overbuilds. We believe that for any potential competitor to be successful, such competitor's overbuild would need to be able to serve the homes and businesses in the overbuilt area with equal or better service quality, on a more cost-effective basis than we can.
In some cases, local government entities and municipal utilities may legally compete with us without securing a local franchise or on more favorable franchise terms. In recent years, federal legislative and regulatory proposals have sought to facilitate the ability of municipalities to construct and deploy broadband facilities that could compete with our cable systems. In addition, certain telephone companies have sought or are seeking authority to operate in communities without first obtaining a local franchise. As a result, competing operators may build systems in areas in which we hold franchises. The FCC has adopted rules that streamline entry for new competitors (including those affiliated with telephone companies) and reduce franchising burdens for these new entrants. The FCC subsequently extended more modest relief to incumbent cable operators like the Company, but a recent federal court decision curtailed a portion of this relief that relates to the cap on in-kind payments to franchising authorities. At the same time, a substantial number of states have adopted franchising laws designed to streamline entry for new competitors, and they often provide advantages for these new entrants that are not immediately available to existing operators.
We believe the markets we serve are not significantly overbuilt. However, the FCC and some state regulatory commissions direct certain subsidies to entities deploying broadband to areas deemed to be "unserved" or "underserved." Many other organizations have applied for and received these funds, including broadband services competitors and new entrants into such services. We have generally opposed such subsidies when directed to areas that we serve and have deployed broadband capable networks. Despite those efforts, we could be placed at a competitive disadvantage if recipients use these funds to subsidize services that compete with our broadband services.
33
Local franchising authorities have the ability to impose additional regulatory constraints on our business, which could reduce our revenues or increase our expenses.
In addition to the franchise agreement, local franchising authorities in some jurisdictions have adopted cable regulatory ordinances that further regulate the operation of cable systems. This additional regulation increases the cost of operating our business. For example, some local franchising authorities impose minimum customer service standards on our operations. There are no assurances that the local franchising authorities will not impose new and more restrictive requirements.
Further regulation of the cable industry could restrict our marketing options or impair our ability to raise rates to cover our increasing costs.
The cable industry has operated under a federal rate regulation regime for more than three decades. Currently, rate regulation by franchising authorities is strictly limited to the basic service tier and associated equipment and installation activities. A franchising authority that wishes to regulate basic cable service offered by a particular cable system must certify and demonstrate that the cable system is not subject to "effective competition" as defined by federal law. Our franchise authorities have not certified to exercise this limited rate regulation authority. If any of our local franchising authorities obtain certification to regulate rates, they would have the power to reduce rates and order refunds on the rates charged for basic service and equipment, which could reduce our revenues. The FCC and Congress also continue to be concerned that cable rate increases are exceeding inflation. It is possible that either the FCC or Congress will adopt more extensive rate regulation for our pay television services or regulate our other services, such as broadband and telephony services, which could impede our ability to raise rates, or require rate reductions. To the extent we are unable to raise our rates in response to increasing costs, or are required to reduce our rates, our business, financial condition, results of operations and liquidity will be materially adversely affected. There has been legislative and regulatory interest in requiring cable operators to offer historically bundled programming services on an à la carte basis. It is possible that new marketing restrictions could be adopted in the future. These restrictions could affect how we provide, and limit, customer equipment used in connection with our services and how we provide access to video programming beyond conventional cable delivery.
There also continues to be interest at the FCC and in Congress in proposals that would allow customers to receive cable service without having to rent a set-top box from their cable operator. These proposals could, if adopted, adversely affect our relationship with our customers and programmers and our operations. It is also possible that regulations will be adopted affecting the negotiations between MVPDs (like us) and programmers. While these regulations might provide us with additional rights and protections in our programming negotiations, they might also limit our flexibility in ways that adversely affect our operations.
We may be materially adversely affected by regulatory changes related to pole attachment costs.
Pole attachments are cable wires that are attached to utility poles. Cable system pole attachments to utility poles historically have been regulated at the federal or state level, generally resulting in favorable pole attachment rates for attachments used to provide cable service. Any changes in the current pole attachment approach could result in a substantial increase in our pole attachment costs.
Changes in channel carriage regulations could impose significant additional costs on us.
Cable operators also face significant regulation affecting the carriage of broadcast and other programming channels. We can be required to devote substantial capacity to the carriage of programming that we might not otherwise carry voluntarily, including certain local broadcast signals; local public, educational and governmental access programming; and unaffiliated, commercial leased access programming (channel capacity designated for use by programmers unaffiliated with the cable operator). Regulatory changes in this area could disrupt existing programming commitments, interfere with our preferred use of limited channel capacity and limit our ability to offer services that would maximize our revenue potential. It is possible that other legal restraints will be adopted limiting our discretion over programming decisions.
34
Increasing regulation of our Internet-based products and services could adversely affect our ability to provide new products and services.
On February 26, 2015, the FCC adopted a new "net neutrality" or Open Internet order (the "2015 Order") that: (1) reclassified broadband Internet access service from an information service to a Title II common carrier service, (2) applied certain existing Title II provisions and associated regulations; (3) forbore from applying a range of other existing Title II provisions and associated regulations, but to varying degrees indicated that this forbearance may be only temporary and (4) issued new rules expanding disclosure requirements and prohibiting blocking, throttling, paid prioritization and unreasonable interference with the ability of end users and edge providers to reach each other. The 2015 Order also subjected broadband providers' Internet traffic exchange rates and practices to potential FCC oversight and created a mechanism for third parties to file complaints regarding these matters. The 2015 Order could have had a material adverse impact on our business by limiting our ability to efficiently manage our cable systems and respond to operational and competitive challenges. In December 2017, the FCC adopted an order (the "2017 Order") that in large part reverses the 2015 Order and reestablishes the “information service” classification for broadband services. The 2017 Order, which came into effect in June 2018, is the subject of legal challenges that may overturn or weaken the relief it provides. Additionally, Congress and some states are considering legislation that may codify "net neutrality" rules, which could include prohibitions on blocking, throttling and prioritizing Internet traffic. A number of states, including California, have adopted legislation and/or executive orders that apply “net neutrality” rules to ISPs.
Offering telephone services may subject us to additional regulatory burdens, causing us to incur additional costs.
We offer telephone services over our broadband network and continue to develop and deploy interconnected VoIP services. The FCC has ruled that competitive telephone companies that support VoIP services, such as those that we offer to our customers, are entitled to interconnect with incumbent providers of traditional telecommunications services, which ensures that our VoIP services can operate in the market. However, the scope of these interconnection rights are being reviewed in a current FCC proceeding, which may affect our ability to compete in the provision of telephony services or result in additional costs. It remains unclear precisely to what extent federal and state regulators will subject VoIP services to traditional telephone service regulation. Expanding our offering of these services may require us to obtain certain authorizations, including federal and state licenses. We may not be able to obtain such authorizations in a timely manner, or conditions could be imposed upon such licenses or authorizations that may not be favorable to us. The FCC has already extended certain traditional telecommunications requirements, such as E911 capabilities, USF contribution, CALEA, measures to protect Customer Proprietary Network Information, customer privacy, disability access, number porting, battery back-up, network outage reporting, rural call completion reporting and other regulatory requirements to many VoIP providers such as us. If additional telecommunications regulations are applied to our VoIP service, it could cause us to incur additional costs and may otherwise materially adversely impact our operations. In 2011, the FCC released an order significantly changing the rules governing intercarrier compensation for the origination and termination of telephone traffic between interconnected carriers. These rules have resulted in a substantial decrease in interstate compensation payments over a multi-year period. The FCC is currently considering additional reforms that could further reduce interstate compensation payments. Further, although the FCC recently declined to impose additional regulatory burdens on certain point to point transport ("special access") services provided by cable companies, that FCC decision has been appealed by multiple parties. If those appeals are successfully, there could be additional regulatory burdens and additional costs placed on these services.
We may be materially adversely affected by regulatory, legal and economic changes relating to our physical plant.
Our systems depend on physical facilities, including transmission equipment and miles of fiber and coaxial cable. Significant portions of those physical facilities occupy public rights-of-way and are subject to local ordinances and governmental regulations. Other portions occupy private property under express or implied easements, and many miles of the cable are attached to utility poles governed by pole attachment agreements. No assurances can be given that we will be able to maintain and use our facilities in their current locations and at their current costs. Changes in governmental regulations or changes in these relationships could have a material adverse effect on our business and our results of operations.
35
Risk Factors Relating to Ownership of Our Class A Common Stock and Class B Common Stock
An active, liquid trading market for our Class B common stock has not developed and we cannot assure you that an active, liquid trading market will develop in the future. Holders of shares of our Class B common stock may need to convert them into shares of our Class A common stock to realize their full potential value, which over time could further concentrate voting power with remaining holders of our Class B common stock. The factors that affect trading of our Class A and Class B common stock may differ.
Our Class B common stock is not listed on the NYSE or any other stock exchange and we do not currently intend to list our Class B common stock on the NYSE or any other stock exchange. There is currently no active, liquid trading market for the Class B common stock and we cannot assure you that an active trading market will develop or be sustained at any time in the future. If an active market is not developed or sustained, the market price and liquidity of the Class B common stock may be adversely affected. Because the Class B common stock is unlisted, holders of shares of Class B common stock may need to convert them into shares of our Class A common stock, which is listed on the NYSE, in order to realize their full potential value. Sellers of a significant amount of shares of Class B common stock may be more likely to convert them into shares of Class A common stock and sell them on the NYSE. This could over time reduce the number of shares of Class B common stock outstanding and potentially further concentrate voting power with remaining holders of Class B common stock.
The market price for shares of our Class A common stock may be affected by factors different from those affecting the market price for shares of our Class B common stock. These and other factors may materially reduce the market price of our Class A common stock or Class B common stock, regardless of our operating performance. In addition, price volatility may be greater if the public float and trading volume of our Class A common stock and Class B common stock is low or differ materially from each other.
Our stockholders' percentage ownership in us may be diluted by future issuances of capital stock, which could reduce their influence over matters on which stockholders vote.
Pursuant to our amended and restated certificate of incorporation, our Board of Directors has the authority, without action or vote of our stockholders, to issue all or any part of our authorized but unissued shares of Class A common stock, including shares issuable upon the exercise of options, Class B common stock, Class C common stock or shares of our authorized but unissued preferred stock. We may issue such capital stock to meet a number of our business needs, including funding any potential acquisitions or other strategic transactions. Future issuances of Class A common stock, Class B common stock or voting preferred stock could reduce our stockholders' influence over matters on which our stockholders vote and, in the case of issuances of preferred stock, would likely result in their interest in us being subject to the prior rights of holders of that preferred stock.
Because we have no current plans to pay cash dividends on our Class A common stock or Class B common stock for the foreseeable future, our stockholders may not receive any return on investment unless they sell their Class A common stock or Class B common stock.
We intend to retain future earnings, if any, for future operations, expansion and debt repayment and have no current plans to pay any cash dividends for the foreseeable future. The declaration, amount and payment of any future dividends on shares of Class A common stock and shares of Class B common stock will be at the sole discretion of our Board of Directors. Our Board of Directors may take into account general and economic conditions, our financial condition and results of operations, our available cash and current and anticipated cash needs, capital requirements, contractual, legal, tax and regulatory restrictions and implications on the payment of dividends by us to our stockholders or by our subsidiaries to us and such other factors as our Board of Directors may deem relevant. In addition, our ability to pay dividends is limited by covenants contained in the agreements governing our existing indebtedness and may be limited by covenants contained in any future indebtedness we or our subsidiaries incur. As a result, our stockholders may not receive any return on an investment in our Class A common stock or Class B common stock unless our stockholders sell our Class A common stock or Class B common stock.
36
Future sales, or the perception of future sales, by us or our existing stockholders in the public market could cause the market price for our Class A common stock or Class B common stock to decline.
The sale of substantial amounts of shares of our Class A common stock or Class B common stock, or the perception that such sales could occur, could cause the prevailing market price of shares of our Class A common stock or Class B common stock to decline. These sales, or the possibility that these sales may occur, also might make it more difficult for us to sell equity securities in the future at a time and at a price that we deem appropriate.
As of
December 31, 2018
, we had a total of
496.1 million
shares of Class A common stock outstanding and
213.0 million
shares of Class B common stock outstanding.
Any shares held by our affiliates, as that term is defined under Rule 144 ("Rule 144") of the Securities Act of 1933, as amended (the "Securities Act") , including Next Alt and its affiliates, may be sold only in compliance with certain limitations.
In addition, pursuant to a stockholders and registration rights agreement between the Company and Next Alt, Altice Europe, BC Partners LLP ("BCP") and entities affiliated with the Canada Pension Plan Investment Board ("CPPIB" and together with BCP, the "Sponsors"), the other parties thereto have the right, subject to certain conditions, to require us to register the sale of their shares of our Class A common stock, or shares of Class A common stock issuable on conversion of shares of Class B common stock, under the Securities Act. By exercising their registration rights and selling a large number of shares, our existing owners could cause the prevailing market price of our Class A common stock to decline. Registration of any of these outstanding shares of capital stock would result in such shares becoming freely tradable without compliance with Rule 144 upon effectiveness of the registration statement, except for shares received by individuals who are our affiliates.
As restrictions on resale end or if these stockholders exercise their registration rights, the market price of our Class A common stock or Class B common stock could drop significantly if the holders of Class A common stock or Class B common stock sell them or are perceived by the market as intending to sell them. These factors could also make it more difficult for us to raise additional funds through future offerings of our Class A common stock or Class B common stock or other securities. In the future, we may also issue our securities in connection with investments or acquisitions. The amount of shares of our Class A common stock, Class B common stock or Class C common stock issued in connection with an investment or acquisition could constitute a material portion of then-outstanding shares of our Class A common stock and Class B common stock. Any issuance of additional securities in connection with investments or acquisitions may result in additional dilution to our stockholders.
The tri-class structure of Altice USA common stock has the effect of concentrating voting control with Next Alt. This will limit or preclude our stockholders' ability to influence corporate matters, including the election of directors, amendments of our organizational documents and any merger, consolidation, sale of all or substantially all of our assets or other major corporate transaction requiring stockholder approval. Shares of Class B common stock will not automatically convert to shares of Class A common stock upon transfer to a third-party.
Each share of Class B common stock is entitled to twenty-five votes per share and each share of Class A common stock is entitled to one vote per share. If we issue any shares of Class C common stock, they will be non-voting.
Because of the twenty-five to one voting ratio between our Class B common stock and Class A common stock, a majority of the combined voting power of our capital stock is controlled by Next Alt. This allows Next Alt to control all matters submitted to our stockholders for approval until such date as Next Alt ceases to own, or to have the right to vote, shares of our capital stock representing a majority of the outstanding votes. This concentrated control will limit or preclude our stockholders' ability to influence corporate matters for the foreseeable future, including the election of directors, amendments of our organizational documents and any merger, consolidation, sale of all or substantially all of our assets or other major corporate transaction requiring stockholder approval. The disparate voting rights of Altice USA common stock may also prevent or discourage unsolicited acquisition proposals or offers for our capital stock that our stockholders may feel are in their best interest as one of our stockholders.
Shares of our Class B common stock are convertible into shares of our Class A common stock at the option of the holder at any time. Our amended and restated certificate of incorporation does not provide for the automatic conversion of shares of Class B common stock upon transfer under any circumstances. The holders of Class B common stock thus will be free to transfer them without converting them into shares of Class A common stock.
37
Next Alt controls us and its interests may conflict with ours or our stockholders in the future.
As of February 22, 2019, Next Alt owns and has the right to vote 43.8% of our issued and outstanding Class A and Class B common stock, which represents approximately 90.7% of the voting power of our outstanding capital stock. Next Alt has also entered into voting agreements with certain current and former officers and directors of Altice USA and Altice Europe and its consolidated subsidiaries with respect to all shares of Altice USA common stock they own. So long as Next Alt continues to control a majority of the voting power of our capital stock, Next Alt and, through his control of Next Alt, Mr. Drahi, will be able to significantly influence the composition of our Board of Directors and thereby influence our policies and operations, including the appointment of management, future issuances of Altice USA common stock or other securities, the payment of dividends, if any, on Altice USA common stock, the incurrence or modification of debt by us, amendments to our amended and restated certificate of incorporation and amended and restated bylaws and the entering into extraordinary transactions, and their interests may not in all cases be aligned with our stockholders' interests. In addition, Next Alt may have an interest in pursuing acquisitions, divestitures and other transactions that, in its judgment, could enhance its investment or improve its financial condition, even though such transactions might involve risks to our stockholders. For example, Next Alt could cause us to make acquisitions that increase our indebtedness or cause us to sell revenue-generating assets.
In addition, Next Alt is able to determine the outcome of all matters requiring stockholder approval and is able to cause or prevent a change of control of the Company or a change in the composition of our Board of Directors and could preclude any unsolicited acquisition of the Company. The concentration of ownership could deprive our stockholders of an opportunity to receive a premium for their shares of our Class A common stock or Class B common stock as part of a sale of the Company and ultimately might affect the market price of our Class A common stock or Class B common stock.
If conflicts arise between us and Next Alt, these conflicts could be resolved in a manner that is unfavorable to us and as a result, our business, financial condition and results of operations could be materially adversely affected. In addition, if Next Alt ceases to control us, our business, financial condition and results of operations could be adversely affected.
Anti-takeover provisions in our organizational documents could delay or prevent a change of control transaction.
Certain provisions of our amended and restated certificate of incorporation and amended and restated bylaws may have an anti-takeover effect and may delay, defer or prevent a merger, acquisition, tender offer, takeover attempt or other change of control transaction that a stockholder might consider in its best interest, including those attempts that might result in a premium over the market price for the shares held by our stockholders.
These provisions provide for, among other things:
|
•
|
a tri-class common stock structure, as a result of which Next Alt generally will be able to control the outcome of all matters requiring stockholder approval, including the election of directors and significant corporate transactions, such as a merger or other sale of our company or its assets;
|
|
•
|
the ability of our Board of Directors to, without further action by our stockholders, fix the rights, preferences, privileges and restrictions of up to an aggregate of 100,000,000 shares of preferred stock in one or more series and authorize their issuance; and
|
|
•
|
the ability of stockholders holding a majority of the voting power of our capital stock to call a special meeting of stockholders.
|
These anti-takeover provisions could make it more difficult for a third-party to acquire us, even if the third-party's offer may be considered beneficial by many of our stockholders. As a result, our stockholders may be limited in their ability to obtain a premium for their shares of our Class A common stock. In addition, so long as Next Alt controls a majority of our combined voting power it will be able to prevent a change of control of the Company.
Holders of a single class of Altice USA common stock may not have any remedies if an action by our directors has an adverse effect on only that class of Altice USA common stock.
Under Delaware law, the board of directors has a duty to act with due care and in the best interests of all of our stockholders, including the holders of all classes of Altice USA common stock. Principles of Delaware law established in cases involving differing treatment of multiple classes of stock provide that a board of directors owes an equal duty to all
38
common stockholders regardless of class and does not have separate or additional duties to any group of stockholders. As a result, in some circumstances, our Board of Directors may be required to make a decision that could be viewed as adverse to the holders of one class of Altice USA common stock. Under the principles of Delaware law and the business judgment rule, holders may not be able to successfully challenge decisions that they believe have a disparate impact upon the holders of one class of our stock if our Board of Directors is disinterested and independent with respect to the action taken, is adequately informed with respect to the action taken and acts in good faith and in the honest belief that the board is acting in the best interest of all of our stockholders.
We are a "controlled company" within the meaning of the rules of the NYSE. As a result, we qualify for, and rely on, exemptions from certain corporate governance requirements that would otherwise provide protection to stockholders of other companies.
Next Alt controls a majority of the voting power of our capital stock. As a result, we are a "controlled company" within the meaning of the corporate governance standards of the NYSE. Under these rules, a company of which more than 50% of the voting power is held by an individual, group or another company is a "controlled company" and may elect not to comply with certain corporate governance requirements, including:
|
•
|
the requirement that a majority of our Board of Directors consists of "independent directors" as defined under the rules of the NYSE; and
|
|
•
|
the requirement that we have a governance and nominating committee.
|
Consistent with these exemptions, we will continue not to have a majority of independent directors on our Board of Directors or a nominating and governance committee. Accordingly, our stockholders will not have the same protections afforded to stockholders of companies that are subject to all of the corporate governance requirements of the NYSE.
If securities or industry analysts do not publish research or reports about our business, if they adversely change their recommendations regarding our Class A common stock or Class B common stock, or if our operating results do not meet their expectations, the market price of our Class A common stock or Class B common stock could decline.
The trading market for our Class A common stock and Class B common stock will be influenced by the research and reports that industry or securities analysts publish about us or our business. We do not have any control over these analysts. If one or more of these analysts cease coverage of our company or fail to publish reports on us regularly, we could lose visibility in the financial markets, which in turn could cause our stock price or trading volume to decline. Moreover, if one or more of the analysts who cover our company downgrades our Class A common stock or Class B common stock, or if our operating results do not meet their expectations, the market price of our Class A common stock or Class B common stock could decline.
We are subject to securities class action litigation related to our 2017 initial public offering and we may be subject to additional securities class action litigation in the future.
We are subject to securities class action litigation related to our 2017 initial public offering (“IPO Litigation”) and we may be subject to additional securities class action litigation in the future.
In the past, securities class action litigation has often been instituted against companies whose securities have experienced periods of volatility in market price. Securities litigation brought against us following volatility in the price of our Class A common stock or Class B common stock, regardless of the merit or ultimate results of such litigation, could result in substantial costs, which would hurt our financial condition and results of operations and divert management's attention and resources from our business. While we believe the IPO Litigation is without merit, there can be no assurance that the outcome will not materially and adversely affect our financial condition and results of operations.
Our amended and restated bylaws provides that the Court of Chancery of the State of Delaware is the exclusive forum for substantially all disputes between us and our stockholders, which could limit our stockholders' ability to obtain a favorable judicial forum for disputes with us or our directors, officers or other stockholders.
Our amended and restated bylaws provides that the Court of Chancery of the State of Delaware (or, if the Court of Chancery does not have jurisdiction, another state or federal court located in the State of Delaware) is the exclusive forum for: (i) any derivative action or proceeding brought in our name or on our behalf; (ii) any action asserting a breach of fiduciary duty; (iii) any action asserting a claim against us arising under the General Corporation Law of the State of Delaware ("DGCL"); (iv) any action regarding our amended and restated certificate of incorporation or our amended
39
and restated bylaws; or (v) any action asserting a claim against us that is governed by the internal affairs doctrine. Our amended and restated bylaws permits our Board of Directors to approve the selection of an alternative forum. Unless waived, this exclusive forum provision may limit a stockholder's ability to bring a claim in a judicial forum that it finds favorable for disputes with us or our directors, officers or other stockholders, which may discourage such lawsuits against us and our directors, officers and other stockholders. Alternatively, if a court were to find this provision in our amended and restated bylaws to be inapplicable or unenforceable in an action, we may incur additional costs associated with resolving such action in other jurisdictions, which could adversely affect our business, financial condition and results of operations.
Item 1B.
Unresolved Staff Comments
None.
Item 2.
Properties
Our headquarters are located in Long Island City, New York, where we currently lease approximately 170,000 square feet of office space under a lease expiring in 2021. We also own a building located in Bethpage, New York, with approximately 558,000 square feet of space, where we maintain administrative offices. In addition, we own or lease real estate throughout our operating areas where certain of our call centers, corporate facilities, business offices, earth stations, transponders, microwave towers, warehouses, headend equipment, hub sites, access studios, and microwave receiving antennae are located.
Our principal physical assets consist of cable operating plant and equipment, including signal receiving, encoding and decoding devices, headend facilities, fiber optic transport networks, coaxial and distribution systems and equipment at or near customers' homes or places of business for each of the systems. The signal receiving apparatus typically includes a tower, antenna, ancillary electronic equipment and earth stations for reception of satellite signals. Headend facilities are located near the receiving devices. Our distribution system consists primarily of coaxial and fiber optic cables and related electronic equipment. Customer premise equipment consists of set-top devices, cable modems, Internet routers, wireless devices and media terminal adapters for telephone. Our cable plant and related equipment generally are attached to utility poles under pole rental agreements with local public utilities; although in some areas the distribution cable is buried in underground ducts or directly in trenches. The physical components of the cable systems require maintenance and periodic upgrading to improve system performance and capacity. In addition, we operate a network operations center that monitors our network 24 hours a day, seven days a week, helping to ensure a high quality of service and reliability for both our residential and commercial customers. We own most of our service vehicles.
We believe our properties, both owned and leased, are in good condition and are suitable and adequate for our operations.
Intellectual Property
We rely on our patents, copyrights, trademarks and trade secrets, as well as licenses and other agreements with our vendors and other parties, to use our technologies, conduct our operations and sell our products and services. We also rely on our access to the proprietary technology of Altice Europe, including through Altice Labs. However, no single patent, copyright, trademark, trade secret or content license is material to our business. We believe we own or have the right to use all of the intellectual property that is necessary for the operation of our business as we currently conduct it.
Item 3.
Legal Proceedings
Refer to Note 17 to our consolidated financial statements included in this Annual Report on Form 10-K for a discussion of our legal proceedings.
Item 4.
Mine Safety Disclosures
Not applicable.
40
PART II
|
Item 5.
|
Market for the Registrants' Common Equity, Related Stockholder Matters and Issuer Purchases of Equity Securities
|
Altice USA Class A common stock is listed for trading on the New York Stock Exchange ("NYSE") under the symbol "ATUS". Altice USA Class B common stock is not listed for trading on any stock exchange.
As of February 22, 2019, there were 7 holders of record of Altice USA Class A common stock and 2 holders of record of ATUS Class B common stock.
Stockholder Dividends and Distributions
The Company may pay dividends on its capital stock only from net profits and surplus as determined under Delaware law. If dividends are paid on the Altice USA common stock, holders of the Altice USA Class A common stock and Altice USA Class B common stock are entitled to receive dividends, and other distributions in cash, stock or property, equally on a per share basis, except that, subject to certain exceptions, stock dividends with respect to Altice USA Class A common stock may be paid only with shares of Altice USA Class A common stock and stock dividends with respect to Altice USA Class B common stock may be paid only with shares of Altice USA Class B common stock.
The Company's indentures restrict the amount of dividends and distributions in respect of any equity interest that can be made.
Equity Compensation Plan Information
The Equity Compensation Plan information under which the Company's equity securities are authorized for issuance required under Item 5 is hereby incorporated by reference from the Company's definitive proxy statement for its Annual Meeting of Stockholders or, if such definitive proxy statement is not filed with the Securities and Exchange Commission prior to 120 days after the close of its fiscal year, an amendment to this Annual Report on Form 10-K filed under cover of Form 10-K/A.
Unregistered Sales of Equity Securities and Use of Proceeds
|
(a)
|
Sales of Unregistered Securities
|
Set forth below is information related to transactions under the Company's share repurchase program for the quarter ended December 31, 2018.
|
|
(a)
Total Number of Shares (or Units) Purchased
|
(b)
Average Price Paid per Share (or Unit)
|
(c)
Total Number of Shares (or Units) Purchased as Part of Publicly Announced Plans or Programs (1)(2)
|
(d)
Maximum Number (or Approximate Dollar Value) of Shares (or Units) that May Yet Be Purchased Under the Plans or Programs (1)
|
|||||||||
|
|
|||||||||||||
|
October 1 - October 31
|
8,197,484
|
|
$
|
17.42
|
|
21,417,393
|
|
$
|
1,616,439,910
|
|
|||
|
November 1 - November 30
|
6,611,287
|
|
17.61
|
|
28,028,680
|
|
1,499,999,989
|
|
|||||
|
(1)
|
On June 8, 2018, the Company's Board of Directors authorized the repurchase of up to $2.0 billion of Altice USA Class A common stock. Under the repurchase program, shares of Altice USA Class A common stock may be purchased from time to time in the open market. The program does not have an expiration date and may be suspended at any time at the discretion of the Board of Directors.
|
|
(2)
|
This column reflects the cumulative number of shares acquired pursuant to the repurchase program at the end of the respective period.
|
41
Altice USA Stock Performance Graph
The chart below compares the performance of our Class A common stock with the performance of the S&P 500 Index and a Peer Group Index by measuring the changes in our Class A common stock prices from June 22, 2017 through December 31, 2018. As required by the SEC, the values shown assume the reinvestment of all dividends. Because no published index of comparable media companies currently reports values on a dividends-reinvested basis, the Company has created a Peer Group Index for purposes of this graph in accordance with the requirements of the SEC. The Peer Group Index is made up of companies that deliver broadband, video and telephony services as a significant element of their business, although not all of the companies included in the Peer Group Index participate in all of the lines of business in which we are engaged and some of the companies included in the Peer Group Index also engage in lines of business in which we do not participate. Additionally, the market capitalizations of many of the companies included in the Peer Group are quite different from ours. The common stocks of the following companies have been included in the Peer Group Index: AT&T, CenturyLink, Charter, Comcast, Frontier, DISH, Sprint, T-Mobile, Verizon, Windstream Holdings, Inc. and Liberty Media Corp. The chart assumes $100 was invested on June 22, 2017 in each of the Company's Class A common stock, the S&P 500 Index and in a Peer Group Index and reflects reinvestment of dividends on a quarterly basis and market capitalization weighting.
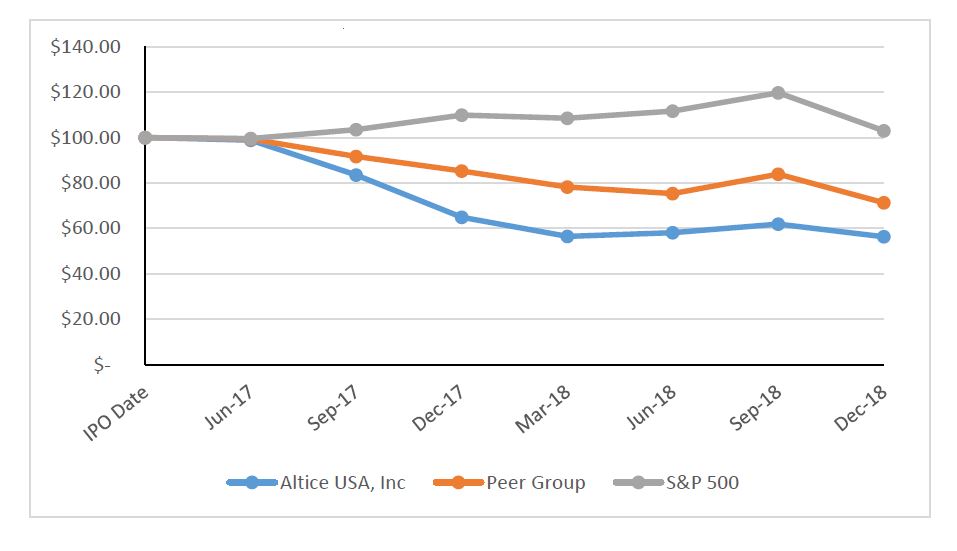
|
June 22,
|
June 30,
|
Sept. 30,
|
Dec. 31,
|
Mar. 31
|
June 30,
|
Sept. 30,
|
Dec. 31,
|
||||||||||||||||||||||||
|
2017
|
2017
|
2017
|
2017
|
2018
|
2018
|
2018
|
2018
|
||||||||||||||||||||||||
|
ALTICE USA CLASS A
|
$
|
100.00
|
|
$
|
98.75
|
|
$
|
83.49
|
|
$
|
64.90
|
|
$
|
56.50
|
|
$
|
58.14
|
|
$
|
61.82
|
|
$
|
56.30
|
|
|||||||
|
S&P 500 INDEX
|
$
|
100.00
|
|
$
|
99.54
|
|
$
|
103.49
|
|
$
|
109.82
|
|
$
|
108.48
|
|
$
|
111.66
|
|
$
|
119.70
|
|
$
|
102.97
|
|
|||||||
|
PEER GROUP INDEX
|
$
|
100.00
|
|
$
|
99.32
|
|
$
|
91.64
|
|
$
|
85.29
|
|
$
|
78.23
|
|
$
|
75.30
|
|
$
|
83.90
|
|
$
|
71.28
|
|
|||||||
42
|
Item 6.
|
Selected Historical Financial Data
|
The summary consolidated historical balance sheet and operating data of Altice USA as of
December 31, 2018
and
2017
and for the years ended
December 31, 2018
,
2017
and
2016
presented below have been derived from the audited consolidated financial statements of Altice USA included elsewhere herein. The operating data of Altice USA for the year ended December 31, 2016 include the operating results of Cequel for the year ended December 31, 2016 and the operating results of Cablevision for the period from the date of acquisition, June 21, 2016, through December 31, 2016. The balance sheet and operating data presented below also give effect to the ATS acquisition since its formation and the i24 acquisition from April 1, 2018.
The summary consolidated historical balance sheet and operating data of Cablevision have been presented for the periods prior to the Cablevision Acquisition as Cablevision is deemed to be the predecessor entity. The summary consolidated historical balance sheet and operating data of Cablevision presented below have been recast to reflect certain reclassifications to conform to the Altice USA presentation as a result of the adoption of Accounting Standards Update ("ASU") No. 2014-09,
Revenue from Contracts with Customers
and ASU No. 2017‑07
Compensation-Retirement Benefits (Topic 715).
The selected historical results presented below are not necessarily indicative of the results to be expected for any future period. This information should be read in conjunction with the audited consolidated financial statements of Altice USA and the notes thereto, and Management’s Discussion and Analysis of Financial Condition and Results of Operations of Altice USA.
|
|
Altice USA
|
Cablevision (a)
|
|||||||||||||||||||||
|
Years ended December 31,
|
January 1, 2016 to June 20, 2016
|
Years ended December 31,
|
|||||||||||||||||||||
|
2018
|
2017
|
2016
|
2015
|
2014
|
|||||||||||||||||||
|
(unaudited)
|
(unaudited)
|
(unaudited)
|
|||||||||||||||||||||
|
(in thousands)
|
|||||||||||||||||||||||
|
Revenue
|
$
|
9,566,608
|
|
$
|
9,306,950
|
|
$
|
6,017,212
|
|
$
|
3,137,604
|
|
$
|
6,545,545
|
|
$
|
6,508,557
|
|
|||||
|
Operating expenses
|
7,884,229
|
|
8,465,942
|
|
5,554,403
|
|
2,658,667
|
|
5,684,713
|
|
5,571,115
|
|
|||||||||||
|
Operating income
|
1,682,379
|
|
841,008
|
|
462,809
|
|
|
478,937
|
|
860,832
|
|
937,442
|
|
||||||||||
|
Other income (expense):
|
|
|
|
|
|||||||||||||||||||
|
Interest expense, net
|
(1,545,426
|
)
|
(1,601,211
|
)
|
(1,442,730
|
)
|
(285,508
|
)
|
(584,839
|
)
|
(575,580
|
)
|
|||||||||||
|
Gain (loss) on investments and sale of affiliate interests, net
|
(250,877
|
)
|
237,354
|
|
142,102
|
|
129,990
|
|
(30,208
|
)
|
129,659
|
|
|||||||||||
|
Gain (loss) on derivative contracts, net
|
218,848
|
|
(236,330
|
)
|
(53,696
|
)
|
(36,283
|
)
|
104,927
|
|
(45,055
|
)
|
|||||||||||
|
Gain (loss) on interest rate swap contracts, net
|
(61,697
|
)
|
5,482
|
|
(72,961
|
)
|
—
|
|
—
|
|
—
|
|
|||||||||||
|
Loss on extinguishment of debt and write-off of deferred financing costs
|
(48,804
|
)
|
(600,240
|
)
|
(127,649
|
)
|
—
|
|
(1,735
|
)
|
(10,120
|
)
|
|||||||||||
|
Other income (expense), net
|
(12,484
|
)
|
(13,651
|
)
|
980
|
|
1,224
|
|
(6,316
|
)
|
(11,196
|
)
|
|||||||||||
|
Income (loss) from continuing operations before income taxes
|
(18,061
|
)
|
(1,367,588
|
)
|
(1,091,145
|
)
|
|
288,360
|
|
342,661
|
|
425,150
|
|
||||||||||
|
Income tax benefit (expense) (b)
|
38,655
|
|
2,862,352
|
|
259,666
|
|
(124,848
|
)
|
(154,872
|
)
|
(115,768
|
)
|
|||||||||||
|
Income (loss) from continuing operations, net of income taxes
|
20,594
|
|
1,494,764
|
|
(831,479
|
)
|
|
163,512
|
|
187,789
|
|
309,382
|
|
||||||||||
|
Income (loss) from discontinued operations, net of income taxes (c)
|
—
|
|
—
|
|
—
|
|
—
|
|
(12,541
|
)
|
2,822
|
|
|||||||||||
|
Net income (loss)
|
20,594
|
|
1,494,764
|
|
(831,479
|
)
|
|
163,512
|
|
175,248
|
|
312,204
|
|
||||||||||
|
Net loss (income) attributable to noncontrolling interests
|
(1,761
|
)
|
(1,587
|
)
|
(551
|
)
|
236
|
|
201
|
|
(765
|
)
|
|||||||||||
|
Net income (loss) attributable to Altice USA / Cablevision stockholders
|
$
|
18,833
|
|
$
|
1,493,177
|
|
$
|
(832,030
|
)
|
|
$
|
163,748
|
|
$
|
175,449
|
|
$
|
311,439
|
|
||||
43
|
|
Altice USA
|
Cablevision (a)
|
|||||||||||||||||||||
|
Years ended December 31,
|
January 1, 2016 to June 20, 2016
|
Years ended December 31,
|
|||||||||||||||||||||
|
2018
|
2017
|
2016
|
2015
|
2014
|
|||||||||||||||||||
|
INCOME (LOSS) PER SHARE:
|
|||||||||||||||||||||||
|
Basic income (loss) per share attributable to Altice USA / Cablevision stockholders:
|
|||||||||||||||||||||||
|
Income (loss) from continuing operations, net of income taxes
|
$
|
0.03
|
|
$
|
2.15
|
|
$
|
(1.28
|
)
|
$
|
0.60
|
|
$
|
0.70
|
|
$
|
1.17
|
|
|||||
|
Income (loss) from discontinued operations, net of income taxes (c)
|
$
|
—
|
|
$
|
—
|
|
$
|
—
|
|
$
|
—
|
|
$
|
(0.05
|
)
|
$
|
0.01
|
|
|||||
|
Net income (loss)
|
$
|
0.03
|
|
$
|
2.15
|
|
$
|
(1.28
|
)
|
$
|
0.60
|
|
$
|
0.65
|
|
$
|
1.18
|
|
|||||
|
Basic weighted average common shares (in thousands)
|
730,088
|
|
696,055
|
|
649,525
|
|
272,035
|
|
269,388
|
|
264,623
|
|
|||||||||||
|
Diluted income (loss) per share attributable to Altice USA / Cablevision stockholders:
|
|||||||||||||||||||||||
|
Income (loss) from continuing operations, net of income taxes
|
$
|
0.03
|
|
$
|
2.15
|
|
$
|
(1.28
|
)
|
$
|
0.58
|
|
$
|
0.68
|
|
$
|
1.14
|
|
|||||
|
Income (loss) from discontinued operations, net of income taxes (c)
|
$
|
—
|
|
$
|
—
|
|
$
|
—
|
|
$
|
—
|
|
$
|
(0.05
|
)
|
$
|
0.01
|
|
|||||
|
Net income (loss)
|
$
|
0.03
|
|
$
|
2.15
|
|
$
|
(1.28
|
)
|
$
|
0.58
|
|
$
|
0.63
|
|
$
|
1.15
|
|
|||||
|
Diluted weighted average common shares (in thousands)
|
730,088
|
|
696,055
|
|
649,525
|
|
280,199
|
|
276,339
|
|
270,703
|
|
|||||||||||
|
Cash dividends declared per common share (d)
|
$
|
2.035
|
|
$
|
1.29
|
|
$
|
0.69
|
|
$
|
—
|
|
$
|
0.45
|
|
$
|
0.60
|
|
|||||
|
Amounts attributable to Altice USA / Cablevision stockholders:
|
|||||||||||||||||||||||
|
Income (loss) from continuing operations, net of income taxes
|
$
|
18,833
|
|
$
|
1,493,177
|
|
$
|
(832,030
|
)
|
$
|
163,748
|
|
$
|
187,990
|
|
$
|
308,617
|
|
|||||
|
Income (loss) from discontinued operations, net of income taxes (c)
|
—
|
|
—
|
|
—
|
|
—
|
|
(12,541
|
)
|
2,822
|
|
|||||||||||
|
Net income (loss)
|
$
|
18,833
|
|
$
|
1,493,177
|
|
$
|
(832,030
|
)
|
$
|
163,748
|
|
$
|
175,449
|
|
$
|
311,439
|
|
|||||
|
(a)
|
Represents the operating results of Cablevision for the periods prior to the Cablevision Acquisition (Predecessor periods).
|
|
(b)
|
Pursuant to the enactment of the Tax Reform on December 22, 2017, the Company recorded a non-cash deferred tax benefit of
$2,332,677
to remeasure the net deferred tax liability to adjust for the reduction in the corporate income tax rate from
35%
to
21%
which is effective on January 1, 2018. In 2018, the Company recorded a non-cash deferred tax benefit of $52,915 based on a remeasurement of the Company's net deferred tax liability. See Note 14 to the consolidated financial statements for further details.
|
|
(c)
|
Loss from discontinued operations for 2015 primarily reflects an expense related to the decision in a case relating to Rainbow Media Holdings LLC, a business whose operations were previously discontinued. Income from discontinued operations for 2014 resulted primarily from the settlement of a contingency related to Montana property taxes related to Bresnan Cable.
|
|
(d)
|
Represent distributions declared prior to the Company's IPO of $839,700 and $445,176 in 2017 and 2016, respectively, divided by the number of shares of common stock outstanding adjusted to reflect the retroactive impact of the organizational transactions, discussed in Note 1, that occurred prior to the IPO.
|
44
|
Balance Sheet Data:
|
|||||||||||||||||||
|
|
Altice USA
|
Cablevision
|
|||||||||||||||||
|
|
December 31,
|
||||||||||||||||||
|
|
2018
|
2017
|
2016
|
2015
|
2014
|
||||||||||||||
|
(unaudited)
|
(unaudited)
|
||||||||||||||||||
|
(dollars in thousands)
|
|||||||||||||||||||
|
Total assets
|
$
|
33,613,808
|
|
$
|
34,812,082
|
|
$
|
36,498,578
|
|
$
|
6,813,445
|
|
$
|
6,695,292
|
|
||||
|
Notes payable to affiliates and related parties
|
—
|
|
—
|
|
1,750,000
|
|
—
|
|
—
|
|
|||||||||
|
Credit facility debt
|
5,915,559
|
|
4,643,523
|
|
3,444,790
|
|
2,514,454
|
|
2,769,153
|
|
|||||||||
|
Collateralized indebtedness
|
1,406,182
|
|
1,349,474
|
|
1,286,069
|
|
1,191,324
|
|
986,183
|
|
|||||||||
|
Senior guaranteed notes and senior notes and debentures
|
15,359,561
|
|
15,860,432
|
|
17,507,325
|
|
5,801,011
|
|
5,784,213
|
|
|||||||||
|
Notes payable
|
106,108
|
|
65,902
|
|
13,726
|
|
14,544
|
|
23,911
|
|
|||||||||
|
Capital leases and other obligations
|
25,190
|
|
21,980
|
|
28,155
|
|
45,966
|
|
46,412
|
|
|||||||||
|
Total debt (a)
|
22,812,600
|
|
21,941,311
|
|
24,030,065
|
|
9,567,299
|
|
9,609,872
|
|
|||||||||
|
Redeemable equity
|
130,007
|
|
231,290
|
|
68,147
|
|
—
|
|
8,676
|
|
|||||||||
|
Stockholders' equity (deficiency)
|
3,670,941
|
|
5,503,214
|
|
2,042,221
|
|
(4,905,955
|
)
|
(5,036,108
|
)
|
|||||||||
|
Noncontrolling interest
|
9,295
|
|
1,539
|
|
287
|
|
(268
|
)
|
779
|
|
|||||||||
|
Total equity
|
3,680,236
|
|
5,504,753
|
|
2,042,508
|
|
(4,906,223
|
)
|
(5,035,329
|
)
|
|||||||||
The following table sets forth certain customer metrics for the Company (unaudited):
|
Altice USA
|
|||||||||||
|
December 31,
|
|||||||||||
|
2018
|
2017
|
2016
|
|||||||||
|
|
(in thousands, except per customer amounts)
|
||||||||||
|
Homes passed (a)
|
8,737.3
|
|
8,620.9
|
|
8,523.6
|
|
|||||
|
Total customers relationships (b)(c)
|
4,919.6
|
|
4,906.3
|
|
4,891.8
|
|
|||||
|
Residential
|
4,542.1
|
|
4,535.0
|
|
4,528.2
|
|
|||||
|
SMB
|
377.5
|
|
371.3
|
|
363.6
|
|
|||||
|
Residential customers:
|
|||||||||||
|
Pay TV
|
3,307.5
|
|
3,405.5
|
|
3,534.5
|
|
|||||
|
Broadband
|
4,118.1
|
|
4,046.2
|
|
3,962.5
|
|
|||||
|
Telephony
|
2,531.2
|
|
2,557.4
|
|
2,559.0
|
|
|||||
|
Residential triple product customers penetration (d)
|
49.5
|
%
|
50.2
|
%
|
50.5
|
%
|
|||||
|
Penetration of homes passed (e)
|
56.3
|
%
|
56.9
|
%
|
57.4
|
%
|
|||||
|
ARPU (f)
|
$
|
142.44
|
|
$
|
139.75
|
|
$
|
138.07
|
|
||
|
(a)
|
Represents the estimated number of single residence homes, apartments and condominium units passed by the cable distribution network in areas serviceable without further extending the transmission lines. In addition, it includes commercial establishments that have connected to our cable distribution network. Broadband services were not available to approximately 100 homes passed and telephony services were not available to approximately 500 homes passed.
|
|
(b)
|
Represents number of households/businesses that receive at least one of the Company's services.
|
|
(c)
|
Customers represent each customer account (set up and segregated by customer name and address), weighted equally and counted as one customer, regardless of size, revenue generated, or number of boxes, units, or outlets. In calculating the number of customers, we count all customers other than inactive/disconnected customers. Free accounts are included in the customer counts along with all active accounts, but they are limited to a prescribed group. Most of these accounts are
|
45
also not entirely free, as they typically generate revenue through pay-per-view or other pay services and certain equipment fees. Free status is not granted to regular customers as a promotion. In counting bulk residential customers, such as an apartment building, we count each subscribing family unit within the building as one customer, but do not count the master account for the entire building as a customer. We count a bulk commercial customer, such as a hotel, as one customer, and do not count individual room units at that hotel.
|
(d)
|
Represents the number of customers that subscribe to three of our services divided by total residential customer relationships.
|
|
(e)
|
Represents the number of total customer relationships divided by homes passed.
|
|
(f)
|
Calculated by dividing the average monthly revenue for the respective quarter (fourth quarter for annual periods) presented derived from the sale of broadband, pay television and telephony services to residential customers for the respective quarter by the average number of total residential customers for the same period.
|
Item 7.
Management's Discussion and Analysis of Financial Condition and Results of Operations
This Form 10-K contains statements that constitute forward-looking information within the meaning of the Private Securities Litigation Reform Act of 1995, Section 27A of the Securities Act and Section 21E of the Securities Act of 1934, as amended. In this Form 10-K there are statements concerning our future operating results and future financial performance. Words such as "expects", "anticipates", "believes", "estimates", "may", "will", "should", "could", "potential", "continue", "intends", "plans" and similar words and terms used in the discussion of future operating results, future financial performance and future events identify forward-looking statements. Investors are cautioned that such forward-looking statements are not guarantees of future performance, results or events and involve risks and uncertainties and that actual results or developments may differ materially from the forward-looking statements as a result of various factors.
We operate in a highly competitive, consumer and technology driven and rapidly changing business that is affected by government regulation and economic, strategic, technological, political and social conditions. Various factors could adversely affect our operations, business or financial results in the future and cause our actual results to differ materially from those contained in the forward‑looking statements. In addition, important factors that could cause our actual results to differ materially from those in our forward‑looking statements include:
|
•
|
competition for broadband, pay television and telephony customers from existing competitors (such as broadband communications companies, DBS providers and Internet-based providers) and new competitors entering our footprint;
|
|
•
|
changes in consumer preferences, laws and regulations or technology that may cause us to change our operational strategies;
|
|
•
|
increased difficulty negotiating programming agreements on favorable terms, if at all, resulting in increased costs to us and/or the loss of popular programming;
|
|
•
|
increasing programming costs and delivery expenses related to our products and services;
|
|
•
|
our ability to achieve anticipated customer and revenue growth, to successfully introduce new products and services and to implement our growth strategy;
|
|
•
|
our ability to complete our capital investment plans on time and on budget, including our plan to build a FTTH network, and deploy Altice One, our home communications hub;
|
|
•
|
our ability to develop and deploy mobile voice and data services pursuant to the agreement we entered into with Sprint in the fourth quarter of 2017, and our ability to attract customers to these services;
|
|
•
|
the effects of economic conditions or other factors which may negatively affect our customers’ demand for our current and future products and services;
|
|
•
|
the effects of industry conditions;
|
|
•
|
demand for digital and linear advertising products and services;
|
|
•
|
our substantial indebtedness and debt service obligations;
|
|
•
|
adverse changes in the credit market;
|
|
•
|
changes as a result of any tax reforms that may affect our business;
|
46
|
•
|
financial community and rating agency perceptions of our business, operations, financial condition and the industries in which we operate;
|
|
•
|
the restrictions contained in our financing agreements;
|
|
•
|
our ability to generate sufficient cash flow to meet our debt service obligations;
|
|
•
|
fluctuations in interest rates which may cause our interest expense to vary from quarter to quarter;
|
|
•
|
technical failures, equipment defects, physical or electronic break-ins to our services, computer viruses and similar problems;
|
|
•
|
the disruption or failure of our network, information systems or technologies as a result of computer hacking, computer viruses, “cyber-attacks,” misappropriation of data, outages, natural disasters and other material events;
|
|
•
|
our ability to obtain necessary hardware, software, communications equipment and services and other items from our vendors at reasonable costs;
|
|
•
|
our ability to effectively integrate acquisitions and to maximize expected operating efficiencies from our acquisitions or as a result of the transactions, if any;
|
|
•
|
significant unanticipated increases in the use of bandwidth-intensive Internet-based services;
|
|
•
|
the outcome of litigation, government investigations and other proceedings;
|
|
•
|
our ability to successfully operate our business following the completion of our separation from Altice Europe; and
|
|
•
|
other risks and uncertainties inherent in our cable and other broadband communications businesses and our other businesses, including those listed under the caption "Risk Factors" and "Management's Discussion and Analysis of Financial Condition and Results of Operations" contained herein.
|
These factors are not necessarily all of the important factors that could cause our actual results to differ materially from those expressed in any of our forward‑looking statements. Other unknown or unpredictable factors could cause our actual results to differ materially from those expressed in any of our forward‑looking statements.
Given these uncertainties, you are cautioned not to place undue reliance on such forward-looking statements. The forward-looking statements are made only as of the date of this Annual Report. Except to the extent required by law, we do not undertake, and specifically decline any obligation, to update any forward‑looking statements or to publicly announce the results of any revisions to any of such statements to reflect future events or developments. Comparisons of results for current and any prior periods are not intended to express any future trends or indications of future performance, unless expressed as such, and should only be viewed as historical data.
You should read this Annual Report with the understanding that our actual future results, levels of activity, performance and events and circumstances may be materially different from what we expect. We qualify all forward‑looking statements by these cautionary statements.
Certain numerical figures included in this Annual Report have been subject to rounding adjustments. Accordingly, such numerical figures shown as totals in various tables may not be arithmetic aggregations of the figures that precede them.
Overview
All dollar amounts, except per customer and per share data, included in the following discussion, are presented in thousands.
Our Business
We deliver broadband, pay television, telephony services, proprietary content and advertising services to approximately
4.9 million
residential and business customers in and around the New York metropolitan area and in the south-central United States, with the majority of our customers located in the ten states of Texas, West Virginia, Louisiana, Arkansas, North Carolina, Oklahoma, Arizona, California, Missouri and Ohio. Our footprint extends across 21 states through a fiber-rich broadband network with approximately
8.7 million
homes passed as of
December 31, 2018
.
47
Key Factors Impacting Operating Results and Financial Condition
Our future performance is dependent, to a large extent, on the impact of direct competition, general economic conditions (including capital and credit market conditions), our ability to manage our businesses effectively, and our relative strength and leverage in the marketplace, both with suppliers and customers. For more information see “Risk Factors” and “Business-Competition” included herein.
We derive revenue principally through monthly charges to residential customers of our pay television, broadband, and telephony services. We also derive revenue from DVR, VOD, pay-per-view, installation and home shopping commissions. Our residential pay television, broadband, and telephony services accounted for approximately
43%
,
30%
and
7%
, respectively, of our consolidated revenue for the year ended
December 31, 2018
. We also derive revenue from the sale of a wide and growing variety of products and services to both large enterprise and SMB customers, including broadband, telephony, networking and pay television services. For the year ended
December 31, 2018
,
14%
of our consolidated revenue was derived from these business services. In addition, we derive revenues from the sale of advertising time available on the programming carried on our cable television systems, digital advertising and data analytics revenue, which accounted for approximately
5%
of our consolidated revenue for the year ended
December 31, 2018
. Our other revenue for the year ended
December 31, 2018
accounted for less than 1% of our consolidated revenue.
Revenue is impacted by rate increases, changes in the number of customers to our services, including additional services sold to our existing customers, programming package changes by our pay television customers, speed tier changes by our broadband customers, and acquisitions of cable systems that result in the addition of new customers.
Our ability to increase the number of customers to our services is significantly related to our penetration rates.
We operate in a highly competitive consumer-driven industry and we compete against a variety of broadband, pay television and telephony providers and delivery systems, including broadband communications companies, wireless data and telephony providers, satellite-delivered video signals, Internet-delivered video content and broadcast television signals available to residential and business customers in our service areas. Our competitors include AT&T and its DirecTV subsidiary, CenturyLink, DISH, Frontier and Verizon. Consumers’ selection of an alternate source of service, whether due to economic constraints, technological advances or preference, negatively impacts the demand for our services. For more information on our competitive landscape, see "Risk Factors" and "Business-Competition" included herein.
Our programming costs, which are the most significant component of our operating expenses, have increased and are expected to continue to increase primarily as a result of contractual rate increases and new channel launches. See “-Results of Operations” below for more information regarding our key factors impacting our revenues and operating expenses.
Historically, we have made substantial investments in our network and the development of new and innovative products and other service offerings for our customers as a way of differentiating ourselves from our competitors and may continue to do so in the future. We are constructing a FTTH network, which will enable us to deliver more than 10 Gbps broadband speeds across our entire Optimum footprint and part of our Suddenlink footprint. In addition, in 2019 we will begin offering full service mobile voice and data services to our customers. We may incur greater than anticipated capital expenditures in connection with these initiatives, fail to realize anticipated benefits, experience delays and business disruptions or encounter other challenges to executing them as planned. See “-Liquidity and Capital Resources-Capital Expenditures” for additional information regarding our capital expenditures.
Certain Transactions
The following transactions occurred during the periods covered by this Management's Discussion and Analysis of Financial Condition and Results of Operations:
As discussed in Note 1 of the Company's consolidated financial statements, the Company completed the ATS Acquisition in January 2018. ATS was previously owned by Altice Europe and a member of ATS's management through a holding company. As the acquisition is a combination of businesses under common control, the Company combined the results of operations and related assets and liabilities of ATS for all periods since the formation of ATS.
In April 2018, Altice Europe transferred its ownership of i24NEWS, a 24/7 international news and current affairs channels, to the Company for minimal consideration. As the acquisition was a combination of businesses under common control,
48
the Company combined the results of operations and related assets and liabilities of i24NEWS as of April 1, 2018. Operating results for periods prior to April 1, 2018 and the balance sheet as of December 31, 2017 have not been revised to reflect the combination of i24NEWS as the impact was deemed immaterial.
On June 21, 2016, Altice USA acquired Cablevision for a total purchase price of approximately $9,958,323. The Altice USA operating results include the operating results of Cablevision from the date of acquisition.
In July 2016, we completed the sale of a 75% interest in Newsday LLC and retained the remaining 25% ownership interest. Effective July 7, 2016, the operating results of Newsday are no longer consolidated with our results and our 25% interest in the operating results of Newsday is recorded on the equity basis. In April 2018, the Company redeemed a
24%
interest in Newsday.
Non-GAAP Financial Measures
We define Adjusted EBITDA, which is a non-GAAP financial measure, as net income (loss) excluding income taxes, income (loss) from discontinued operations, non-operating income or expenses, loss on extinguishment of debt and write-off of deferred financing costs, gain (loss) on interest rate swap contracts, gain (loss) on derivative contracts, gain (loss) on investments and sale of affiliate interests, net, interest expense (including cash interest expense), interest income, depreciation and amortization (including impairments), share-based compensation expense or benefit, restructuring expense or credits and transaction expenses. We believe Adjusted EBITDA is an appropriate measure for evaluating the operating performance of the Company. Adjusted EBITDA and similar measures with similar titles are common performance measures used by investors, analysts and peers to compare performance in our industry. Internally, we use revenue and Adjusted EBITDA measures as important indicators of our business performance, and evaluate management’s effectiveness with specific reference to these indicators. We believe Adjusted EBITDA provides management and investors a useful measure for period-to-period comparisons of our core business and operating results by excluding items that are not comparable across reporting periods or that do not otherwise relate to the Company’s ongoing operating results. Adjusted EBITDA should be viewed as a supplement to and not a substitute for operating income (loss), net income (loss), and other measures of performance presented in accordance with GAAP. Since Adjusted EBITDA is not a measure of performance calculated in accordance with GAAP, this measure may not be comparable to similar measures with similar titles used by other companies.
49
Results of Operations - Altice USA
|
Altice USA
|
|||||||||||
|
Years Ended December 31,
|
|||||||||||
|
2018
|
2017
|
2016
|
|||||||||
|
Revenue:
|
|||||||||||
|
Residential:
|
|||||||||||
|
Pay TV
|
$
|
4,156,428
|
|
$
|
4,274,122
|
|
$
|
2,788,873
|
|
||
|
Broadband
|
2,887,455
|
|
2,608,595
|
|
1,651,574
|
|
|||||
|
Telephony
|
652,895
|
|
700,765
|
|
465,771
|
|
|||||
|
Business services and wholesale
|
1,362,758
|
|
1,298,213
|
|
819,541
|
|
|||||
|
Advertising
|
482,649
|
|
391,866
|
|
252,049
|
|
|||||
|
Other
|
24,423
|
|
33,389
|
|
39,404
|
|
|||||
|
Total revenue
|
9,566,608
|
|
9,306,950
|
|
6,017,212
|
|
|||||
|
Operating expenses:
|
|||||||||||
|
Programming and other direct costs
|
3,173,076
|
|
3,035,655
|
|
1,911,230
|
|
|||||
|
Other operating expenses
|
2,290,266
|
|
2,347,315
|
|
1,702,472
|
|
|||||
|
Restructuring and other expense
|
38,548
|
|
152,401
|
|
240,395
|
|
|||||
|
Depreciation and amortization (including impairments)
|
2,382,339
|
|
2,930,571
|
|
1,700,306
|
|
|||||
|
Operating income
|
1,682,379
|
|
841,008
|
|
462,809
|
|
|||||
|
Other income (expense):
|
|||||||||||
|
Interest expense, net
|
(1,545,426
|
)
|
(1,601,211
|
)
|
(1,442,730
|
)
|
|||||
|
Gain (loss) on investments and sale of affiliate interests, net
|
(250,877
|
)
|
237,354
|
|
142,102
|
|
|||||
|
Gain (loss) on derivative contracts, net
|
218,848
|
|
(236,330
|
)
|
(53,696
|
)
|
|||||
|
Gain (loss) on interest rate swap contracts
|
(61,697
|
)
|
5,482
|
|
(72,961
|
)
|
|||||
|
Loss on extinguishment of debt and write-off of deferred financing costs
|
(48,804
|
)
|
(600,240
|
)
|
(127,649
|
)
|
|||||
|
Other income (expense), net
|
(12,484
|
)
|
(13,651
|
)
|
980
|
|
|||||
|
Loss before income taxes
|
(18,061
|
)
|
(1,367,588
|
)
|
(1,091,145
|
)
|
|||||
|
Income tax benefit
|
38,655
|
|
2,862,352
|
|
259,666
|
|
|||||
|
Net income (loss)
|
20,594
|
|
1,494,764
|
|
(831,479
|
)
|
|||||
|
Net income attributable to noncontrolling interests
|
(1,761
|
)
|
(1,587
|
)
|
(551
|
)
|
|||||
|
Net income (loss) attributable to Altice USA, Inc. stockholders
|
$
|
18,833
|
|
$
|
1,493,177
|
|
$
|
(832,030
|
)
|
||
50
The following is a reconciliation of net income (loss) to Adjusted EBITDA:
|
Altice USA
|
|||||||||||
|
Years Ended December 31,
|
|||||||||||
|
2018
|
2017
|
2016
|
|||||||||
|
Net income (loss)
|
$
|
20,594
|
|
$
|
1,494,764
|
|
$
|
(831,479
|
)
|
||
|
Income tax benefit
|
(38,655
|
)
|
(2,862,352
|
)
|
(259,666
|
)
|
|||||
|
Other expense (income), net (a)
|
12,484
|
|
13,651
|
|
(980
|
)
|
|||||
|
Loss (gain) on interest rate swap contracts
|
61,697
|
|
(5,482
|
)
|
72,961
|
|
|||||
|
Loss (gain) on derivative contracts, net (b)
|
(218,848
|
)
|
236,330
|
|
53,696
|
|
|||||
|
Loss (gain) on investments and sales of affiliate interests, net
|
250,877
|
|
(237,354
|
)
|
(142,102
|
)
|
|||||
|
Loss on extinguishment of debt and write-off of deferred financing costs
|
48,804
|
|
600,240
|
|
127,649
|
|
|||||
|
Interest expense, net
|
1,545,426
|
|
1,601,211
|
|
1,442,730
|
|
|||||
|
Depreciation and amortization
|
2,382,339
|
|
2,930,571
|
|
1,700,306
|
|
|||||
|
Restructuring and other expense
|
38,548
|
|
152,401
|
|
240,395
|
|
|||||
|
Share-based compensation
|
59,812
|
|
57,430
|
|
14,368
|
|
|||||
|
Adjusted EBITDA
|
$
|
4,163,078
|
|
$
|
3,981,410
|
|
$
|
2,417,878
|
|
||
|
(a)
|
Includes the non-service cost components of the Company's pension expense, net of dividends received on Comcast common stock owned by the Company.
|
|
(b)
|
Consists of unrealized and realized losses (gains) due to the change in the fair value of derivative contracts.
|
The following table sets forth certain customer metrics for the Company (unaudited):
|
As of December 31, 2018
|
As of December 31, 2017
|
Increase
|
||||||||||||||||||||
|
Cablevision
|
Cequel
|
Total
|
Cablevision
|
Cequel
|
Total
|
(Decrease)
|
||||||||||||||||
|
(in thousands, except per customer amounts)
|
||||||||||||||||||||||
|
Homes passed (a)
|
5,209.4
|
|
3,527.9
|
|
8,737.3
|
|
5,163.9
|
|
3,457.1
|
|
8,620.9
|
|
116.4
|
|
||||||||
|
Total customer relationships (b)(c)
|
3,149.1
|
|
1,770.4
|
|
4,919.6
|
|
3,156.0
|
|
1,750.2
|
|
4,906.3
|
|
13.3
|
|
||||||||
|
Residential
|
2,886.1
|
|
1,656.0
|
|
4,542.1
|
|
2,893.4
|
|
1,641.5
|
|
4,535.0
|
|
7.1
|
|
||||||||
|
SMB
|
263.0
|
|
114.4
|
|
377.5
|
|
262.6
|
|
108.7
|
|
371.3
|
|
6.2
|
|
||||||||
|
Residential customers:
|
|
|
||||||||||||||||||||
|
Pay TV
|
2,290.5
|
|
1,017.0
|
|
3,307.5
|
|
2,363.2
|
|
1,042.4
|
|
3,405.5
|
|
(98.0
|
)
|
||||||||
|
Broadband
|
2,694.6
|
|
1,423.5
|
|
4,118.1
|
|
2,670.0
|
|
1,376.2
|
|
4,046.2
|
|
71.9
|
|
||||||||
|
Telephony
|
1,941.3
|
|
589.8
|
|
2,531.2
|
|
1,965.0
|
|
592.3
|
|
2,557.4
|
|
(26.2
|
)
|
||||||||
|
Residential triple product customer penetration (d)
|
63.2
|
%
|
25.6
|
%
|
49.5
|
%
|
64.2
|
%
|
25.7
|
%
|
50.2
|
%
|
|
|
||||||||
|
Penetration of homes passed (e)
|
60.5
|
%
|
50.2
|
%
|
56.3
|
%
|
61.1
|
%
|
50.6
|
%
|
56.9
|
%
|
|
|
||||||||
|
ARPU(f)
|
$
|
157.36
|
|
$
|
116.43
|
|
$
|
142.44
|
|
$
|
155.39
|
|
$
|
112.21
|
|
$
|
139.75
|
|
|
|
||
|
(a)
|
Represents the estimated number of single residence homes, apartments and condominium units passed by the cable distribution network in areas serviceable without further extending the transmission lines. In addition, it includes commercial establishments that have connected to our cable distribution network. For Cequel, broadband services were not available to approximately 100 homes passed and telephony services were not available to approximately 500 homes passed.
|
|
(b)
|
Represents number of households/businesses that receive at least one of the Company's services.
|
|
(c)
|
Customers represent each customer account (set up and segregated by customer name and address), weighted equally and counted as one customer, regardless of size, revenue generated, or number of boxes, units, or outlets. In calculating the number of customers, we count all customers other than inactive/disconnected customers. Free accounts are included in the customer counts along with all active accounts, but they are limited to a prescribed group. Most of these accounts are
|
51
also not entirely free, as they typically generate revenue through pay-per-view or other pay services and certain equipment fees. Free status is not granted to regular customers as a promotion. In counting bulk residential customers, such as an apartment building, we count each subscribing family unit within the building as one customer, but do not count the master account for the entire building as a customer. We count a bulk commercial customer, such as a hotel, as one customer, and do not count individual room units at that hotel.
|
(d)
|
Represents the number of customers that subscribe to three of our services divided by total residential customer relationships.
|
|
(e)
|
Represents the number of total customer relationships divided by homes passed.
|
|
(f)
|
Calculated by dividing the average monthly revenue for the respective quarter (fourth quarter for annual periods) derived from the sale of broadband, pay television and telephony services to residential customers for the respective quarter by the average number of total residential customers for the same period.
|
Altice USA - Comparison of Results for the Year Ended
December 31, 2018
compared to the Year Ended
December 31, 2017
and for the Year Ended December 31, 2017 compared to the Year Ended December 31, 2016
Pay Television Revenue
Pay television revenue for the years ended
December 31, 2018
,
2017
and
2016
was
$4,156,428
,
$4,274,122
and
$2,788,873
, respectively. Pay television revenue is derived principally through monthly charges to residential customers of our pay television services. Revenue is impacted by rate increases, changes in the number of customers, including additional services sold to our existing customers, and changes in programming packages.
Pay television revenue decreased
$117,694
(
3%
) for the year ended
December 31, 2018
compared to the year ended
December 31, 2017
. The decrease was due primarily to a decline in pay television customers, partially offset by higher average revenue per pay television customer primarily due to rate increases.
Pay television revenue increased $1,485,249 for the year ended December 31, 2017 compared to the year ended December 31, 2016. The increase is primarily due to the consolidation of the Cablevision results as of June 21, 2016, the date of the Cablevision Acquisition. Our 2016 results do not include pay television revenue of
$1,494,186
recognized by Cablevision for the period from January 1, 2016 through June 20, 2016. Pay television revenue declined $8,937 as compared to the prior year due to a decline in pay television customers, net of increases resulting from rate increases for certain video services implemented in 2016 and 2017, an increase in late fees and an increase in pay-per-view revenue.
We believe our pay television customer declines noted in the table above are largely attributable to competition, particularly from Verizon in our Optimum footprint and DBS providers in our Suddenlink footprint, as well as competition from companies that deliver video content over the Internet directly to customers. These factors are expected to continue to impact our ability to maintain or increase our existing customers and revenue in the future.
Broadband Revenue
Broadband revenue for the years ended
December 31, 2018
,
2017
and
2016
was
$2,887,455
,
$2,608,595
and
$1,651,574
, respectively. Broadband revenue is derived principally through monthly charges to residential subscribers of our broadband services. Revenue is impacted by rate increases, changes in the number of customers, including additional services sold to our existing subscribers, and changes in speed tiers.
Broadband revenue increased
$278,860
(
11%
) for the year ended
December 31, 2018
compared to the year ended
December 31, 2017
. The increases were due primarily to higher average recurring broadband revenue per broadband customer, primarily driven by certain rate increases and service level changes, and an increase in broadband customers.
Broadband revenue increased $957,021 for the year ended December 31, 2017 compared to the year ended December 31, 2016. The increase is primarily due to the consolidation of the Cablevision results as of June 21, 2016, the date of the Cablevision Acquisition. Our 2016 results do not include broadband revenue of
$702,811
recognized by Cablevision for the period January 1, 2016 through June 20, 2016. Broadband revenue also increased $254,210 as a result of higher average recurring broadband revenue per broadband customer (driven by rate increases, the impact of service level changes, and an increase in late fees) and an increase in broadband customers.
Telephony Revenue
Telephony revenue for the years ended
December 31, 2018
,
2017
and
2016
was
$652,895
,
$700,765
and
$465,771
, respectively. Telephony revenue is derived principally through monthly charges to residential customers of our telephony
52
services. Revenue is impacted by changes in rates for services, changes in the number of customers, and additional services sold to our existing customers.
Telephony revenue decreased
$47,870
(
7%
) for the year ended
December 31, 2018
compared to the year ended
December 31, 2017
. The decrease is due to lower average revenue per telephony customer and a decline in telephony customers.
Telephony revenue increased $234,994 for the year ended December 31, 2017 compared to the year ended December 31, 2016. The increase is primarily due to the consolidation of the Cablevision results as of June 21, 2016, the date of the Cablevision Acquisition. Our 2016 results do not include telephony revenue of
$286,161
recognized by Cablevision for the period January 1, 2016 through June 20, 2016. Partially offsetting this increase was a net decrease of $51,167 due primarily to lower average revenue per telephony customer, a decline in international calling and a decline in telephony customers.
Business Services and Wholesale Revenue
Business services and wholesale revenue for the years ended
December 31, 2018
,
2017
and
2016
was
$1,362,758
,
$1,298,213
,
$819,541
, respectively. Business services and wholesale revenue is derived primarily from the sale of fiber based telecommunications services to the business market, and the sale of broadband, pay television and telephony services to SMB customers.
Business services and wholesale revenue increased
$64,545
(
5%
) for the year ended
December 31, 2018
compared to the year ended
December 31, 2017
. The increase was primarily due to higher average recurring broadband revenue per SMB customer, higher Ethernet and managed services revenue and an increase in the number of customers, partially offset by reduced traditional voice and data services for commercial customers.
Business services and wholesale revenue increased $478,672 for the year ended December 31, 2017 compared to the year ended December 31, 2016. The increase is primarily due to the consolidation of the Cablevision results as of June 21, 2016, the date of the Cablevision Acquisition. Our 2016 results do not include revenue of
$411,102
recognized by Cablevision for the period January 1, 2016 through June 20, 2016. Business services revenue also increased $67,570 primarily due to higher average recurring telephony and broadband revenue per SMB customer and an increase in Ethernet revenue resulting from a larger number of services installed, and increases in commercial carrier services, partially offset by reduced traditional voice and data services for commercial customers.
Advertising Revenue
Advertising revenue for the years ended
December 31, 2018
,
2017
and
2016
, net of inter-segment revenue, was
$482,649
,
$391,866
and
$252,049
, respectively. Advertising revenue is primarily derived from the sale of advertising time available on the programming carried on our cable television systems, digital advertising and data analytics revenue.
Advertising revenue increased
$90,783
(
23%
) for the year ended
December 31, 2018
compared to the year ended
December 31, 2017
. The increase was primarily due to an increase in digital advertising, higher political spending, and an increase in data analytics revenue.
Advertising revenue for increased $139,817 for the year ended December 31, 2017 as compared to the year ended December 31, 2016. The increase is primarily due to the consolidation of the Cablevision results as of June 21, 2016, the date of the Cablevision Acquisition. Our 2016 results do not include advertising revenue of
$125,419
recognized by Cablevision for the period January 1, 2016 through June 20, 2016. The remaining increase in advertising revenue of $14,398 was due primarily to an increase in digital advertising revenue and an increase in data and analytics revenue, partially offset by a decrease in political, auto, retail, and restaurant advertising.
Other Revenue
Other revenue for the years ended
December 31, 2018
,
2017
and
2016
was
$24,423
,
$33,389
and
$39,404
, respectively. Other revenue includes other miscellaneous revenue streams.
Programming and Other Direct Costs
Programming and other direct costs for the years ended
December 31, 2018
,
2017
and
2016
amounted to
$3,173,076
,
$3,035,655
and
$1,911,230
, respectively. Programming and other direct costs include cable programming costs, which
53
are costs paid to programmers (net of amortization of any incentives received from programmers for carriage) for cable content (including costs of VOD and pay-per-view) and are generally paid on a per‑customer basis. These costs typically rise due to increases in contractual rates and new channel launches and are also impacted by changes in the number of customers receiving certain programming services. These costs also include interconnection, call completion, circuit and transport fees paid to other telecommunication companies for the transport and termination of voice and data services, which typically vary based on rate changes and the level of usage by our customers. These costs also include franchise fees which are payable to the state governments and local municipalities where we operate and are primarily based on a percentage of certain categories of revenue derived from the provision of pay television service over our cable systems, which vary by state and municipality. These costs change in relation to changes in such categories of revenues or rate changes.
The increase of
$137,421
(
5%
) for the year ended
December 31, 2018
, as compared to the prior year is primarily attributable to the following:
|
Increase in programming costs due primarily to contractual rate increases, partially offset by lower pay television customers and lower video-on-demand and pay-per-view costs
|
$
|
87,341
|
|
|
Increase primarily in costs of digital media and linear advertising spots for resale
|
42,635
|
|
|
|
Other net increases (including an increase of $4,201 in costs related to i24NEWS)
|
7,445
|
|
|
|
|
$
|
137,421
|
|
The increase of $1,124,425 for the year ended December 31, 2017 as compared to the prior year is primarily due to the consolidation of the Cablevision results as of June 21, 2016, the date of the Cablevision Acquisition. Our 2016 results do not include
$1,088,555
of programming and other direct costs recognized by Cablevision for the period January 1, 2016 through June 20, 2016. The remaining increase of $35,870 is attributable to the following:
|
Increase in programming costs due primarily to contractual rate increases and an increase in pay-per-view costs primarily from an event in August 2017, partially offset by lower pay television customers and lower video-on-demand costs
|
$
|
81,764
|
|
|
Increase in costs of digital media advertising spots for resale
|
23,601
|
|
|
|
Decrease in costs primarily related to the sale of Newsday in July 2016
|
(33,888
|
)
|
|
|
Decrease in call completion and transport costs primarily due to lower level of activity
|
(19,684
|
)
|
|
|
Decrease in cost of sales (which includes the bulk sale of handset inventory of $5,445 during the first quarter of 2016)
|
(11,579
|
)
|
|
|
Other net increases
|
(4,344
|
)
|
|
|
|
$
|
35,870
|
|
Programming costs
Programming costs aggregated $2,620,585,
$2,533,244
and
$1,567,688
for the years ended
December 31, 2018
,
2017
and
2016
, respectively. The 2016 amount does not include programming costs of
$883,792
recognized by Cablevision for the period January 1, 2016 through June 20, 2016. Our programming costs in 2019 will continue to be impacted by changes in programming rates, which we expect to increase by high single digits, and by changes in the number of pay television customers.
Other Operating Expenses
Other operating expenses for the years ended
December 31, 2018
,
2017
and
2016
amounted to
$2,290,266
,
$2,347,315
and
$1,702,472
, respectively. Other operating expenses include staff costs and employee benefits including salaries of company employees and related taxes, benefits and other employee related expenses, as well as third-party labor costs. Other operating expenses also include network management and field service costs, which represent costs associated with the maintenance of our broadband network, including costs of certain customer connections and other costs associated with providing and maintaining services to our customers.
Customer installation and repair and maintenance costs may fluctuate as a result of changes in the level of activities and the utilization of contractors as compared to employees. Also, customer installation costs fluctuate as the portion of our
54
expenses that we are able to capitalize changes. Costs associated with the initial deployment of new customer premise equipment necessary to provide broadband, pay television and telephony services are capitalized (asset-based). The redeployment of customer premise equipment is expensed as incurred. Network repair and maintenance and utility costs also fluctuate as capitalizable network upgrade and enhancement activity changes.
Other operating expenses also include costs related to the operation and maintenance of our call center facilities that handle customer inquiries and billing and collection activities and sales and marketing costs, which include advertising production and placement costs associated with acquiring and retaining customers. These costs vary period to period and certain of these costs, such as sales and marketing, may increase with intense competition. Additionally, other operating expenses include various other administrative costs, including legal fees, and product development costs.
The decrease in other operating expenses of
$57,049
(
2%
) for the year ended
December 31, 2018
as compared to the prior year is attributable to the following:
|
Decrease in labor costs and benefits (net of an increase in costs related to i24NEWS of $18,786), and an increase in capitalizable activity
|
$
|
(84,118
|
)
|
|
Decrease in management fee relating to certain executive, administrative and managerial services provided to the Company from Altice Europe prior to separation in June 2018
|
(16,750
|
)
|
|
|
Decrease in legal fees
|
(6,495
|
)
|
|
|
Decrease in share-based compensation and long-term incentive plan awards expense
|
(2,548
|
)
|
|
|
Increase in marketing costs
|
34,683
|
|
|
|
Increase in commissions primarily relating to the NY Interconnect business
|
10,438
|
|
|
|
Increase in insurance costs
|
1,740
|
|
|
|
Other net increases (includes an increase in costs related to i24NEWS of $9,936)
|
6,001
|
|
|
|
$
|
(57,049
|
)
|
|
The increase in other operating expenses of $644,843 for the year ended December 31, 2017 as compared to the prior year is primarily due to the consolidation of the Cablevision results as of June 21, 2016, the date of the Cablevision Acquisition. Our 2016 results do not include
$1,133,339
of other operating expenses recognized by Cablevision for the period January 1, 2016 through June 20, 2016. The remaining decrease of $488,496 is attributable to the following:
|
Decrease primarily in employee related costs related to the elimination of certain positions in connection with the initiatives to simplify the Company's organizational structure, lower net benefits, an increase in capitalizable activity, partially offset by merit increases
|
$
|
(425,210
|
)
|
|
Decrease in costs primarily related to the sale of Newsday in July 2016
|
(95,262
|
)
|
|
|
Decrease primarily related to maintenance agreements for equipment, as well as lower repairs and maintenance costs relating to our operations
|
(50,780
|
)
|
|
|
Decrease in rent and insurance
|
(21,314
|
)
|
|
|
Increase in consulting and professional fees
|
50,241
|
|
|
|
Increase in contractor costs
|
19,774
|
|
|
|
Increase in share-based compensation and long-term incentive plan awards expense
|
17,653
|
|
|
|
Increase in fees for certain executive services provided by Altice Europe (twelve months in 2017 compared to approximately six months in 2016)
|
9,444
|
|
|
|
Increase in sales and marketing costs
|
5,359
|
|
|
|
Other net increases
|
1,599
|
|
|
|
$
|
(488,496
|
)
|
|
Restructuring and Other Expense
Restructuring and other expense for the year ended
December 31, 2018
amounted to
$38,548
as compared to
$152,401
for the year ended
December 31, 2017
and
$240,395
for the year ended
December 31, 2016
. These amounts primarily relate to severance and other employee related costs resulting from headcount reductions related to initiatives which
55
commenced in 2016 that are intended to simplify the Company's organizational structure. We currently anticipate that additional restructuring expenses will be recognized as we continue to analyze our organizational structure.
Depreciation and Amortization
Depreciation and amortization for the years ended
December 31, 2018
,
2017
and
2016
amounted to
$2,382,339
,
$2,930,571
and
$1,700,306
, respectively.
The decrease in depreciation and amortization of $548,232 (
19%
) in 2018 as compared to the prior year is due primarily to certain fixed assets and intangible assets becoming fully depreciated or amortized. These decreases were partially offset by depreciation of new asset additions.
The increase in depreciation and amortization of $1,230,265 in 2017 as compared to the prior year is primarily due to the consolidation of the Cablevision results as of June 21, 2016, the date of the Cablevision Acquisition. Our 2016 results do not include $414,550 of depreciation and amortization recognized by Cablevision for the period January 1, 2016 through June 20, 2016. The remaining increase of $815,715 is primarily attributable to the acceleration of amortization of its trade name intangible assets in connection with the announcement, on May 23, 2017, of the adoption of a global brand to replace the Optimum brand in the future, as well as depreciation on new asset additions. In December 2017, the Company made a decision to postpone the adoption of a global brand that would have replaced the Optimum brand, increasing the useful life of the Optimum trade name intangible asset to 5 years.
Adjusted EBITDA
Adjusted EBITDA amounted to
$4,163,078
,
$3,981,410
and
$2,417,878
for the years ended
December 31, 2018
,
2017
and
2016
, respectively.
Adjusted EBITDA is a non-GAAP measure that is defined as net income (loss) excluding income taxes, income (loss) from discontinued operations, non-operating income or expenses, loss on extinguishment of debt and write-off of deferred financing costs, gain (loss) on interest rate swap contracts, gain (loss) on derivative contracts, gain (loss) on investments and sale of affiliate interests, net, interest expense (including cash interest expense), interest income, depreciation and amortization (including impairments), share-based compensation expense or benefit, restructuring expense or credits and transaction expenses. See reconciliation of net income (loss) to adjusted EBITDA above.
The increase in adjusted EBITDA for the year ended
December 31, 2018
as compared to the prior year was due to the increases in revenue and decreases in operating expenses (excluding depreciation and amortization, restructuring and other expense and share‑based compensation), as discussed above.
The increase in adjusted EBITDA for the year ended December 31, 2017 as compared to the prior year was due to the consolidation of the Cablevision results as of June 21, 2016, the date of the Cablevision Acquisition and the increases in revenue and decreases in operating expenses (excluding depreciation and amortization, restructuring and other expense and share‑based compensation), as discussed above.
Interest Expense, net
Interest expense, net was
$1,545,426
,
$1,601,211
and
$1,442,730
, for the years ended
December 31, 2018
,
2017
and
2016
, respectively, and includes interest on debt issued to finance the Cablevision Acquisition and Cequel Acquisition, as well as interest on debt assumed in connection with these acquisitions. The decrease of
$55,785
for the year ended
December 31, 2018
and increase of
$158,481
for the year ended December 31, 2017 as compared to the prior year are attributable to the following:
|
2018
|
2017
|
||||||
|
Increase (decrease) due to changes in average debt balances and interest rates on our indebtedness and collateralized debt
|
$
|
(101,740
|
)
|
$
|
142,236
|
|
|
|
Lower (higher) interest income
|
(8,935
|
)
|
11,890
|
|
|||
|
Other net increases, primarily amortization of deferred financing costs and original issue discounts
|
54,890
|
|
4,355
|
|
|||
|
$
|
(55,785
|
)
|
$
|
158,481
|
|
||
56
Gain (Loss) on Investments and Sale of Affiliate Interests, net
Gain (loss) on investments, net for the years ended
December 31, 2018
,
2017
and
2016
, of
$(250,877)
,
$237,354
and
$142,102
consists primarily of the increase (decrease) in the fair value of Comcast common stock owned by the Company for the periods. For 2016, the gain is for the period June 21, 2016 through December 31, 2016. The effects of these gains (losses) are partially offset by the losses (gains) on the related equity derivative contracts, net described below.
Gain (Loss) on Derivative Contracts, net
Gain (loss) on derivative contracts, net for the year ended
December 31, 2018
amounted to
$218,848
compared to
$(236,330)
for the year ended
December 31, 2017
and
$(53,696)
for the year ended
December 31, 2016
, and includes realized and unrealized gains or losses due to the change in fair value of equity derivative contracts relating to the Comcast common stock owned by the Company. For 2016, the loss is for the period June 21, 2016 through December 31, 2016. The effects of these gains (losses) are offset by losses (gains) on investment securities pledged as collateral, which are included in gain (loss) on investments, net discussed above. The loss for the year ended December 31, 2017 also includes the realized loss on the settlement of certain put-call options of $97,410.
Gain (loss) on Interest Rate Swap Contracts
Gain (loss) on interest rate swap contracts was
$(61,697)
,
$5,482
and
$(72,961)
for the years ended
December 31, 2018
,
2017
and
2016
, respectively. These amounts represent the increase or decrease in fair value of interest rate swaps. These swap contracts are not designated as hedges for accounting purposes.
Loss on Extinguishment of Debt and Write-off of Deferred Financing Costs
Loss on extinguishment of debt and write-off of deferred financing costs amounted to
$48,804
,
$600,240
and $127,649 for the years ended
December 31, 2018
,
2017
and
2016
, respectively. The 2018 amount primarily includes the write-off of unamortized discount and deferred financing costs and the premium paid in connection with early redemption of the Cequel 2020 Notes in the second quarter of 2018, the write-off of unamortized premium and deferred financing costs and the premium paid in connection with early redemption of the $750,000 7.75% Cablevision senior notes due in April 2018 in the first quarter of 2018, and write-off of unamortized deferred financing costs on the early repayment of the Cequel credit facility in November 2018.
The 2017 amount includes the premium of $513,723 related to the notes payable to affiliates and related parties that were converted into shares of the Company’s common stock, $18,976 related to the Cablevision Extension Amendment and the redemption of senior notes, $28,684 related to the Cequel Extension Amendment and the redemption of senior notes and $38,858 related to premiums paid upon the early repayment of certain senior notes outstanding.
The 2016 amount includes primarily the write-off of unamortized deferred financing costs and the unamortized discount relating to the prepayment of $1,290,500 outstanding under the term credit facility at Cablevision.
Other Income (Expense), Net
Other income (loss), net amounted to
$(12,484)
,
$(13,651)
and
$980
, for the years ended
December 31, 2018
,
2017
and
2016
, respectively. These amounts include the non-service cost components of the Company's pension expense of $9,529, $11,863 and $3,143, net of dividends received on Comcast common stock owned by the Company.
Income Tax Benefit
The Company recorded income tax benefit of
$38,655
for the year ended
December 31, 2018
. During 2018, the Company determined that it met the definition of a Qualified Technology Company for New York State tax purposes and thereby was eligible for the reduced tax rate. Additionally, during 2018, the state of New Jersey enacted significant tax law changes imposing a 2.5% surtax for tax years beginning January 1, 2018 and mandating combined return filing requirements for unitary corporations for tax years beginning January 1, 2019. Accordingly, the Company recorded a net non-cash deferred tax benefit of $52,915 based on a remeasurement of the net deferred tax liability.
The Company recorded income tax benefit of
$2,862,352
for the year ended
December 31, 2017
. Pursuant to the enactment of Tax Cuts and Jobs Act on December 22, 2017, the Company recorded a non-cash deferred tax benefit of
$2,332,677
to remeasure the net deferred tax liability to adjust for the reduction in the corporate federal income tax rate
57
from 35% to 21% which is effective on January 1, 2018. Nondeductible share-based compensation expense for the year ended December 31, 2017 reduced income tax benefit by $22,938.
The Company recorded income tax benefit of
$259,666
for the year ended December 31, 2016. Nondeductible share-based compensation expense for the year ended December 31, 2016 reduced income tax benefit by $5,747.
On June 9, 2016 the common stock of Cequel was contributed to the Company. On June 21, 2016, the Company completed its acquisition of Cablevision. Accordingly, Cequel and Cablevision joined the federal consolidated and certain state combined income tax returns of the Company. As a result, the applicate tax rate used to measure deferred tax assets and liabilities increased, resulting in a non-cash deferred income tax charge of $153,660 in the second quarter of 2016. In addition, there was no state income tax benefit on the pre-merger accrued interest at an indirect wholly-owned subsidiary of Altice Europe formed to complete the financing for the Cablevision Acquisition and the merger with CSC Holdings, resulting in additional deferred tax expense of $18,542 for the year ended December 31, 2016.
58
Results of Operations - Cablevision Systems Corporation
|
Cablevision Systems Corporation
|
|||||||||||
|
Successor
|
Predecessor
|
||||||||||
|
June 21, 2016 to December 31, 2016 (a)
|
January 1, 2016 to June 20, 2016 (a)
|
Year Ended December 31, 2015 (a)
|
|||||||||
|
(unaudited)
|
(unaudited)
|
||||||||||
|
Revenue:
|
(in thousands)
|
(in thousands)
|
|||||||||
|
Residential:
|
|||||||||||
|
Pay TV
|
$
|
1,668,348
|
|
$
|
1,494,186
|
|
$
|
3,174,059
|
|
||
|
Broadband
|
817,160
|
|
702,811
|
|
1,389,447
|
|
|||||
|
Telephony
|
311,832
|
|
286,161
|
|
631,584
|
|
|||||
|
Business services and wholesale
|
468,632
|
|
411,102
|
|
834,154
|
|
|||||
|
Advertising
|
163,678
|
|
125,419
|
|
263,839
|
|
|||||
|
Other
|
14,402
|
|
117,925
|
|
252,462
|
|
|||||
|
Total revenue
|
3,444,052
|
|
3,137,604
|
|
6,545,545
|
|
|||||
|
Operating expenses:
|
|||||||||||
|
Programming and other direct costs
|
1,164,925
|
|
1,088,555
|
|
2,269,290
|
|
|||||
|
Other operating expenses
|
1,025,304
|
|
1,133,339
|
|
2,533,958
|
|
|||||
|
Restructuring and other expense
|
212,150
|
|
22,223
|
|
16,213
|
|
|||||
|
Depreciation and amortization (including impairments)
|
963,665
|
|
414,550
|
|
865,252
|
|
|||||
|
Operating income
|
78,008
|
|
478,937
|
|
860,832
|
|
|||||
|
Other income (expense):
|
|||||||||||
|
Interest expense, net
|
(606,347
|
)
|
(285,508
|
)
|
(584,839
|
)
|
|||||
|
Gain (loss) on investments, net
|
141,896
|
|
129,990
|
|
(30,208
|
)
|
|||||
|
Gain (loss) on equity derivative contracts, net
|
(53,696
|
)
|
(36,283
|
)
|
104,927
|
|
|||||
|
Loss on extinguishment of debt and write-off of deferred financing costs
|
(102,894
|
)
|
—
|
|
(1,735
|
)
|
|||||
|
Other income (expense), net
|
1,186
|
|
1,224
|
|
(6,316
|
)
|
|||||
|
Income (loss) from continuing operations before income taxes
|
(541,847
|
)
|
288,360
|
|
342,661
|
|
|||||
|
Income tax benefit (expense)
|
213,065
|
|
(124,848
|
)
|
(154,872
|
)
|
|||||
|
Income (loss) from continuing operations, net of income taxes
|
(328,782
|
)
|
163,512
|
|
187,789
|
|
|||||
|
Loss from discontinued operations, net of income taxes
|
—
|
|
—
|
|
(12,541
|
)
|
|||||
|
Net income (loss)
|
(328,782
|
)
|
163,512
|
|
175,248
|
|
|||||
|
Net loss (income) attributable to noncontrolling interests
|
(551
|
)
|
236
|
|
201
|
|
|||||
|
Net income (loss) attributable to Cablevision stockholder(s)
|
$
|
(329,333
|
)
|
$
|
163,748
|
|
$
|
175,449
|
|
||
|
(a)
|
Reflects certain reclassifications to conform to the Altice USA presentation as a result of the adoption of ASC ASU No. 2014-09,
Revenue from Contracts with Customers
and ASU No. 2017‑07
Compensation-Retirement Benefits (Topic 715)
.
|
59
|
The following is a reconciliation of net income (loss) to Adjusted EBITDA:
|
|||||||||||
|
Cablevision
|
|||||||||||
|
|
Successor
|
Predecessor
|
|||||||||
|
June 21, 2016 to December 31, 2016
|
January 1, 2016 to June 20, 2016
|
Year Ended December 31, 2015
|
|||||||||
|
(unaudited)
|
(unaudited)
|
||||||||||
|
(in thousands)
|
(in thousands)
|
||||||||||
|
Net income (loss)
|
$
|
(328,782
|
)
|
$
|
163,512
|
|
$
|
175,248
|
|
||
|
Loss from discontinued operations, net of income taxes
|
—
|
|
—
|
|
12,541
|
|
|||||
|
Income tax (benefit) expense
|
(213,065
|
)
|
124,848
|
|
154,872
|
|
|||||
|
Other income (a)
|
(1,186
|
)
|
(1,224
|
)
|
6,316
|
|
|||||
|
Loss on extinguishment of debt and write-off of deferred financing costs
|
102,894
|
|
—
|
|
1,735
|
|
|||||
|
Loss (gain) on equity derivative contracts, net (b)
|
53,696
|
|
36,283
|
|
(104,927
|
)
|
|||||
|
Loss (gain) on investments, net
|
(141,896
|
)
|
(129,990
|
)
|
30,208
|
|
|||||
|
Interest expense, net
|
606,347
|
|
285,508
|
|
584,839
|
|
|||||
|
Depreciation and amortization (including impairments)
|
963,665
|
|
414,550
|
|
865,252
|
|
|||||
|
Restructuring and other expense
|
212,150
|
|
22,223
|
|
16,213
|
|
|||||
|
Share-based compensation
|
9,164
|
|
25,231
|
|
65,286
|
|
|||||
|
Adjusted EBITDA
|
$
|
1,262,987
|
|
$
|
940,941
|
|
$
|
1,807,583
|
|
||
|
(a)
|
Includes primarily dividends received on Comcast common stock owned by the Company.
|
|
(b)
|
Consists of unrealized and realized losses (gains) due to the change in fair value of equity derivative contracts relating to the Comcast common stock owned by the Company.
|
|
Cablevision Systems Corporation
|
||||||||||
|
Years Ended December 31,
|
Net Increase (Decrease)
|
|||||||||
|
|
2016
|
2015
|
2016
|
|||||||
|
|
(in thousands, except per customer amounts)
|
|||||||||
|
Homes passed (a)
|
5,116.2
|
|
5,075.9
|
|
40.3
|
|
||||
|
Total customers relationships (b)
|
3,141.1
|
|
3,115.5
|
|
25.6
|
|
||||
|
Residential
|
2,879.1
|
|
2,857.5
|
|
21.6
|
|
||||
|
SMB
|
262.0
|
|
258.0
|
|
4.0
|
|
||||
|
Residential customers (c):
|
||||||||||
|
Pay TV
|
2,427.8
|
|
2,486.5
|
|
(58.7
|
)
|
||||
|
Broadband
|
2,618.9
|
|
2,561.9
|
|
57.0
|
|
||||
|
Telephony
|
1,962.0
|
|
2,006.9
|
|
(44.9
|
)
|
||||
|
Residential triple product customer penetration (d):
|
64.8
|
%
|
67.6
|
%
|
|
|
||||
|
Penetration of homes passed (e):
|
61.4
|
%
|
61.4
|
%
|
|
|
||||
|
ARPU (f)
|
$
|
154.49
|
|
$
|
150.61
|
|
|
|
||
|
(a)
|
Represents the estimated number of single residence homes, apartments and condominium units passed by the cable distribution network in areas serviceable without further extending the transmission lines. In addition, it includes commercial establishments that have connected to our cable distribution network.
|
|
(b)
|
Represents number of households/businesses that receive at least one of the Company’s services.
|
60
|
(c)
|
Customers represent each customer account (set up and segregated by customer name and address), weighted equally and counted as one customer, regardless of size, revenue generated, or number of boxes, units, or outlets. In calculating the number of customers, we count all customers other than inactive/disconnected customers. Free accounts are included in the customer counts along with all active accounts, but they are limited to a prescribed group. Most of these accounts are also not entirely free, as they typically generate revenue through pay-per-view or other pay services and certain equipment fees. Free status is not granted to regular customers as a promotion. In counting bulk residential customers, such as an apartment building, we count each subscribing family unit within the building as one customer, but do not count the master account for the entire building as a customer. We count a bulk commercial customer, such as a hotel, as one customer, and do not count individual room units at that hotel.
|
|
(d)
|
Represents the number of customers that subscribe to three of our services divided by total residential customer relationships.
|
|
(e)
|
Represents the number of total customer relationships divided by homes passed.
|
|
(f)
|
Calculated by dividing the average monthly revenue for the respective quarter (fourth quarter for annual periods) presented derived from the sale of broadband, pay television and telephony services to residential customers for the respective quarter by the average number of total residential customers for the same period.
|
Cablevision - Comparison of Results for the Periods June 21, 2016 through December 31, 2016 and January 1, 2016 through June 20, 2016 to Results for the Year Ended December 31, 2015
Pay Television Revenue
Pay television revenue amounted to $1,668,348 and $1,494,186 for the period June 21, 2016 through December 31, 2016 and January 1, 2016 through June 20, 2016, respectively, compared to $3,174,059 for the year ended December 31, 2015. Pay television revenue for the Successor and Predecessor periods in 2016 was impacted by a decline in pay television customers, a decrease due to a pay-per-view boxing event that took place in 2015, partially offset by increases in revenue due primarily to rate increases for certain pay television services implemented during the first quarter of 2016 and an increase in fees charged to restore suspended services.
We believe our pay television customer declines noted in the table above are largely attributable to intense competition, particularly from Verizon, as well as competition from companies that deliver video content over the Internet directly to customers. Also, the declines are attributable to our disciplined pricing and credit policies. These factors are expected to continue to impact our ability to maintain or increase our existing customers and revenue in the future.
Broadband Revenue
Broadband revenue amounted to $817,160 and $702,811 for the period June 21, 2016 through December 31, 2016 and January 1, 2016 through June 20, 2016, respectively, compared to $1,389,447 for the year ended December 31, 2015. Broadband revenue for the Successor and Predecessor periods in 2016 was impacted by rate increases for certain broadband services implemented during the first quarter of 2016, an increase in broadband customers, and an increase in fees charged to restore suspended services.
Telephony Revenue
Telephony revenue amounted to $311,832 and $286,161 for the period June 21, 2016 through December 31, 2016 and January 1, 2016 through June 20, 2016, respectively, compared to $631,584 for the year ended December 31, 2015. Telephony revenue for the Successor and Predecessor periods in 2016 was impacted by a decline in telephony customers and a decline in international calling.
Business Services Revenue
Business services and wholesale revenue amounted to $468,632 and $411,102 for the period June 21, 2016 through December 31, 2016 and January 1, 2016 through June 20, 2016, respectively, compared to $834,154 for the year ended December 31, 2015. Business services and wholesale revenue for the Successor and Predecessor periods in 2016 was impacted by rate increases for certain broadband services implemented during the first quarter of 2016, an increase in broadband customers and an increase in Ethernet revenue from an increase in services installed, partially offset by reduced traditional voice and data services.
61
Advertising Revenue
Advertising revenue amounted to $163,678 and $125,419 for the period June 21, 2016 through December 31, 2016 and January 1, 2016 through June 20, 2016, respectively, compared to $263,839 for the year ended December 31, 2015. Advertising revenue for the Successor and Predecessor periods in 2016 was impacted by an increase in advertising sales to the political sector.
Other Revenue
Other revenue amounted to $14,402 and $117,925 for the period June 21, 2016 through December 31, 2016 and January 1, 2016 through June 20, 2016, respectively, compared to $252,462 for the year ended December 31, 2015. Other revenue for the Successor and Predecessor periods in 2016 includes revenue recognized by Newsday through July 7, 2016, affiliation fees paid by cable operators for carriage of our News 12 Networks and other revenue sources. On July 7, 2016, the Company sold a 75% interest in Newsday and as a result no longer consolidates its operating results. As of July 7, 2016, the Company’s 25% interest in the operating results of Newsday is recorded on the equity basis.
Programming and Other Direct Costs
Programming and other direct costs include cable programming costs, which are costs paid to programmers (net of amortization of any incentives received from programmers for carriage) for cable content (including costs of VOD and pay-per-view) and are generally paid on a per-customer basis.
These costs typically rise due to increases in contractual rates and new channel launches and are also impacted by changes in the number of customers receiving certain programming services. These costs also include interconnection, call completion, circuit and transport fees paid to other telecommunication companies for the transport and termination of voice and data services, which typically vary based on rate changes and the level of usage by our customers. These costs also include franchise fees which are payable to the state governments and local municipalities where we operate and are primarily based on a percentage of certain categories of revenue derived from the provision of pay television service over our cable systems, which vary by state and municipality. These costs change in relation to changes in such categories of revenues or rate changes. These costs also included content, production and distribution costs of the Newsday business.
Programming and other direct costs amounted to $1,164,925 and $1,088,555 for the period June 21, 2016 through December 31, 2016 and January 1, 2016 through June 20, 2016, respectively, compared to $2,269,290 for the year ended December 31, 2015. Programming and other direct costs for the Successor and Predecessor periods in 2016 were impacted by an increase in programming costs due primarily to contractual rate increases, partially offset by lower video customers. These costs were also impacted by the lower costs related to Newsday (due to the sale of our 75% interest in Newsday in July 2016), lower call completion and transport costs primarily due to lower level of activity, lower cost of sales related to wireless handset inventory and higher franchise and other fees due primarily to increases in rates in certain areas, partially offset by lower pay television customers.
Programming costs aggregated $978,120 and $883,792 for the period June 21, 2016 through December 31, 2016 and January 1, 2016 through June 20, 2016, respectively, compared to $1,796,021 for the year ended December 31, 2015. Our programming costs increased 4% for the 2016 periods due primarily to an increase in contractual programming rates and a pay-per-view boxing event in 2015, partially offset by a decrease in telephony customers.
Other Operating Expenses
Other operating expenses include staff costs and employee benefits including salaries of company employees and related taxes, benefits and other employee-related expenses. Other operating expenses also include network management and field service costs, which represent costs associated with the maintenance of our broadband network, including costs of certain customer connections and other costs associated with providing and maintaining services to our customers which are impacted by general cost increases for contractors, insurance and other various expenses.
Customer installation and repair and maintenance costs may fluctuate as a result of changes in the level of activities and the utilization of contractors as compared to employees. Also, customer installation costs fluctuate as the portion of our expenses that we are able to capitalize changes. Network repair and maintenance and utility costs also fluctuate as capitalizable network upgrade and enhancement activity changes.
Other operating expenses also include costs related to the operation and maintenance of our call center facilities that handle customer inquiries and billing and collection activities and sales and marketing costs, which include advertising production and placement costs associated with acquiring and retaining customers. These costs vary period to period and certain costs, such as sales and marketing, may increase with intense competition. Additionally, other operating expenses include various other administrative costs, including legal fees, and product development costs.
Other operating expenses amounted to
$1,025,304
and
$1,133,339
for the period June 21, 2016 through December 31, 2016
62
and January 1, 2016 through June 20, 2016, respectively, compared to $2,533,958 for the year ended December 31, 2015. Other operating expenses for the Successor and Predecessor periods in 2016 were impacted by a decrease in employee-related costs related to the elimination of certain positions, lower benefits and an increase in capitalizable activity, partially offset by merit increases. These costs were also impacted by the lower costs related to Newsday (due to the sale of our 75% interest in Newsday in July 2016), a decrease in share-based compensation, a decrease in long-term incentive plan awards, lower legal costs, lower sales and marketing costs, lower repair and maintenance expenses, lower contractor costs, a settlement of a class action legal matter in 2015, partially offset by an increase in the management fee to Altice Europe
Restructuring and Other Expense
Restructuring and other expense amounted to $212,150 and $22,223 for the period June 21, 2016 through December 31, 2016 and January 1, 2016 through June 20, 2016, respectively, compared to $16,213 for the year ended December 31, 2015. Restructuring and other expense for the Successor 2016 period is primarily related to severance and other employee related costs resulting from headcount reductions related to initiatives which commenced in the Successor period that are intended to simplify the Company’s organizational structure.
The restructuring and other expense for the Predecessor 2016 period is primarily related to transaction costs of $19,924 incurred in connection with the Cablevision Acquisition and adjustments related to prior restructuring plans of $2,299. Restructuring and other expense for 2015 includes transaction costs incurred in connection with the Cablevision Acquisition of $17,862, net of adjustments related to prior restructuring plans of $1,649.
Depreciation and Amortization
Depreciation and amortization (including impairments) amounted to $963,665 and $414,550 for the period June 21, 2016 through December 31, 2016 and January 1, 2016 through June 20, 2016, respectively, compared to $865,252 for the year ended December 31, 2015. Depreciation and amortization for the Successor period in 2016 was impacted by an increase in related to the step-up in the carrying value of property, plant and equipment and amortizable intangible assets recorded in connection with the Cablevision Acquisition on June 21, 2016, partially offset by certain assets being retired or becoming fully depreciated.
Adjusted EBITDA
Adjusted EBITDA amounted to $1,262,987 and $940,941 for the periods June 21, 2016 through December 31, 2016 and January 1, 2016 through June 20, 2016, respectively, compared to $1,807,583 for the year ended December 31, 2015. Adjusted EBITDA for the 2016 periods was impacted by an increase in revenue, and a decrease in operating expenses (excluding depreciation and amortization, restructuring and other expense and share-based compensation), as discussed above.
Interest Expense, net
Interest expense amounted to $606,347 and $285,508 for the period June 21, 2016 through December 31, 2016 and January 1, 2016 through June 20, 2016, respectively, compared to $584,839 for the year ended December 31, 2015. Interest expense for the Successor 2016 period includes additional interest related to the debt incurred to finance the Cablevision Acquisition.
Gain (Loss) on Investments, net
Gain (loss) on investments, net amounted to $141,896 and $129,990 for the period June 21, 2016 through December 31, 2016 and January 1, 2016 through June 20, 2016, respectively, and $(30,208) for the year ended December 31, 2015 and reflect the increase or decrease in the fair value of Comcast common stock owned by the Company. The effects of these gains (losses) are partially offset by the (losses) gains on the related equity derivative contracts, net described below.
Gain (Loss) on Equity Derivative Contracts, net
Gain (loss) on equity derivative contracts, net amounted to $(53,696) and $(36,283) for the periods June 21, 2016 through December 31, 2016 and January 1, 2016 through June 20, 2016, respectively, and $104,927 for the year ended December 31, 2015.
Gain (loss) on equity derivative contracts, net consists of unrealized and realized gains (losses) due to the change in fair value of the Company’s equity derivative contracts relating to the Comcast common stock owned by the Company. The effects of these gains (losses) are offset by the (losses) gains on investment securities pledged as collateral, which are included in gain (loss) on investments, net discussed above.
Loss on Extinguishment of Debt and Write-off of Deferred Financing Costs
Loss on extinguishment of debt and write-off of deferred financing costs amounted to $102,894 for the period June 21, 2016 through December 31, 2016 and $1,735 for the year ended December 31, 2015. The Successor 2016 amount includes the write-off of unamortized deferred financing costs and the unamortized discount related to the prepayment of $1,290,500
63
outstanding under the CSC Holdings, a wholly-owned subsidiary of Cablevision, term credit facility. The 2015 amount includes the write-off of unamortized deferred financing costs and the unamortized discount related to the $200,000 repayment of CSC Holdings term B loan facility.
Income Tax Expense
Income tax benefit (expense) amounted to $213,065 for the periods from June 21, 2016 through December 31, 2016 and $(124,848) for the period from January 1, 2016 through June 20, 2016. In the Successor period, excluding the impact of the nondeductible share-based compensation of $3,208, the effective tax rate would have been 40%. In the Predecessor period, certain acquisition-related costs were determined to be nondeductible, resulting in additional deferred tax expense of $9,392. Absent this item, the effective tax rate would have been 40%.
Income tax expense of $154,872 for the year ended December 31, 2015, reflected an effective tax rate of 45%. In April 2015, corporate income tax changes were enacted for both New York State and the City of New York. Those changes included a provision whereby investment income will be subject to higher taxes. Accordingly, in the second quarter of 2015, Cablevision recorded deferred tax expense of $16,334 to remeasure the deferred tax liability for the investment in Comcast common stock and associated derivative securities. Also in 2015, Cablevision recorded tax benefit of $2,630 related to research credits. Absent these items, the effective tax rate for the year ended December 31, 2015 would have been 41%.
Loss From Discontinued Operations
Loss from discontinued operations for the year ended December 31, 2015 amounted to $12,541, net of income taxes, and primarily reflects an expense related to the settlement of a legal matter relating to Rainbow Media Holdings LLC, a business whose operations were previously discontinued.
LIQUIDITY AND CAPITAL RESOURCES
Altice USA has no operations independent of its subsidiaries. Funding for our subsidiaries has generally been provided by cash flow from their respective operations, cash on hand and borrowings under their revolving credit facilities and the proceeds from the issuance of securities and borrowings under syndicated term loans in the capital markets. Our decision as to the use of cash generated from operating activities, cash on hand, borrowings under the revolving credit facility or accessing the capital markets has been based upon an ongoing review of the funding needs of the business, the optimal allocation of cash resources, the timing of cash flow generation and the cost of borrowing under the revolving credit facility, debt securities and syndicated term loans. We manage our business to a year-end leverage target of 4.5x to 5.0x. We calculate our consolidated net leverage ratio as net debt to L2QA EBITDA (Adjusted EBITDA for the two most recent consecutive fiscal quarters multiplied by 2.0).
We expect to utilize free cash flow and availability under the revolving credit facility, as well as future refinancing transactions, to further extend the maturities of, or reduce the principal on, our debt obligations. The timing and terms of any refinancing transactions will be subject to, among other factors, market conditions. Additionally, we may, from time to time, depending on market conditions and other factors, use cash on hand and the proceeds from other borrowings to repay the outstanding debt securities through open market purchases, privately negotiated purchases, tender offers, or redemptions.
We believe existing cash balances, operating cash flows and availability under our revolving credit facility will provide adequate funds to support our current operating plan, make planned capital expenditures and fulfill our debt service requirements for the next twelve months. However, our ability to fund our operations, make planned capital expenditures, make scheduled payments on our indebtedness and repay our indebtedness depends on our future operating performance and cash flows and our ability to access the capital markets, which, in turn, are subject to prevailing economic conditions and to financial, business and other factors, some of which are beyond our control. However, competition, market disruptions or a deterioration in economic conditions could lead to lower demand for our products, as well as lower levels of advertising, and increased incidence of customers' inability to pay for the services we provide. These events would adversely impact our results of operations, cash flows and financial position. Although we currently believe that amounts available under the revolving credit facility will be available when, and if, needed, we can provide no assurance that access to such funds will not be impacted by adverse conditions in the financial markets or other conditions. The obligations of the financial institutions under the revolving credit facility are several and not joint and, as a result, a funding default by one or more institutions does not need to be made up by the others.
In the longer term, we may not be able to generate sufficient cash from operations to fund anticipated capital expenditures, meet all existing future contractual payment obligations and repay our debt at maturity. As a result, we could be dependent upon our continued access to the capital and credit markets to issue additional debt or equity or refinance existing debt obligations. We intend to raise significant amounts of funding over the next several years to fund capital expenditures, repay existing obligations and meet other obligations, and the failure to do so successfully could adversely affect our business. If we are unable to do so, we will need to
take other actions including deferring capital expenditures, selling
64
assets, seeking strategic investments from third parties or reducing or eliminating stock repurchases and discretionary uses of cash.
Credit Silo Combination
In October 2018, the Company combined its Suddenlink and Optimum businesses under a single credit silo (the “Combination”). The integration of the Suddenlink and Optimum businesses was aimed at aligning Altice USA’s debt capital structure and to simplify Altice USA’s financing strategy and financial reporting requirements. The Combination was effected mainly by the following transactions:
|
•
|
In October 2018, Altice US Finance, Cequel Capital Corporation and Cequel Communications Holdings I, LLC (“CCHI”) commenced an offer to exchange (the "Exchange Offer") any and all outstanding senior notes and senior secured notes issued by them (the "Original Cequel Notes") for up to $5,520,000 aggregate principal amount of new notes (the "New Cequel Notes") and, in the case of the 5.375% senior secured notes due 2023 and 5.500% senior secured notes due 2026, and cash of $6,500. The Exchange Offer was accompanied by a consent solicitation to amend the terms of each series of the notes subject to the Exchange Offer (except the 5.125% senior notes due 2021) and the indentures governing such notes. Approximately $5,500,050 of the outstanding notes subject to the Exchange Offer were exchanged into corresponding series of New Cequel Notes. The proposed amendments in the consent solicitation, which have become operative effective November 27, 2018 (the “Combination Date”), eliminated or waived substantially all of the restrictive covenants, eliminated certain events of default, and modified or eliminated certain other provisions governing the Original Cequel Notes (except the 5.125% senior notes due 2021) to the extent that they remain outstanding.
|
|
•
|
In October 2018, CSC Holdings entered into a Sixth Amendment to the CSC Credit Facilities Agreement (the “Combination Incremental Term Loan Agreement”). The Combination Incremental Term Loan Agreement provided for, among other things, new incremental term loan commitments in an aggregate principal amount of $1,275,000.
|
On or following the Combination Date the following transactions were completed:
|
•
|
The Company redeemed $5,206 principal amount of the Original Cequel Notes that were outstanding after the consummation of the Exchange Offer.
|
|
•
|
New Cequel Notes with an aggregate principal balance of $5,500,050 were converted into $5,499,156 principal amount of CSC Holdings senior notes (see detail below).
|
|
•
|
Pursuant to the Combination Incremental Term Loan Agreement, on the Combination Date, CSC Holdings entered into a $1,275,000 7-year incremental term loan maturing January 2026 (the “Incremental Term Loan B-3”). The proceeds from the Incremental Term Loan B-3 were used to repay the entire principal amount of loans under Cequel’s existing Term Loan Facility and other transaction costs related to the Combination. The Incremental Term Loan B-3 has a margin of 2.25% over LIBOR and was issued with an original issue discount of 25 basis points. The Company is required to make scheduled quarterly payments equal to 0.25% (or $3,188) of the principal amount of the Incremental Term Loan B-3, beginning with the fiscal quarter ended June 30, 2019, with the remaining balance scheduled to be paid on January 15, 2026.
|
|
•
|
The Combination was implemented by a series of corporate transactions, including: (i) CCHI merging into Cablevision, with Cablevision as the surviving entity (the “Holdco Merger”), and (ii) Cequel Communications Holdings II, LLC (the direct parent of Cequel) merging into CSC Holdings, with CSC Holdings as the surviving entity. In connection with the Holdco Merger, Cablevision assumed all of the obligations of CCHI that remained outstanding after giving effect to the Combination Exchange under the indentures governing the outstanding Original Cequel Notes.
|
65
The following is a summary of the results of the Exchange Offer:
|
Original Cequel Notes
|
Remaining Original Cequel Notes
|
Notes Redeemed in Cash
|
Principal of New CSC Holdings Notes
|
||||||||||||
|
5.375% Senior Secured Notes due 2023
|
$
|
1,100,000
|
|
$
|
—
|
|
$
|
4,157
|
|
$
|
1,095,825
|
|
|||
|
5.5% Senior Secured Notes due 2026
|
1,500,000
|
|
—
|
|
1,049
|
|
1,498,806
|
|
|||||||
|
5.125% Senior Notes due 2021
|
1,250,000
|
|
8,886
|
|
—
|
|
1,240,762
|
|
|||||||
|
7.75% Senior Notes due 2025
|
620,000
|
|
1,740
|
|
—
|
|
617,881
|
|
|||||||
|
7.5% Senior Notes due 2028
|
1,050,000
|
|
4,118
|
|
—
|
|
1,045,882
|
|
|||||||
|
$
|
5,520,000
|
|
$
|
14,744
|
|
$
|
5,206
|
|
$
|
5,499,156
|
|
||||
Debt Outstanding
The following tables summarize the carrying value of our outstanding debt, net of unamortized deferred financing costs, discounts and premiums (excluding accrued interest), as well as interest expense.
|
As of December 31, 2018
|
|||||||||||
|
CSC Holdings
|
Cablevision
|
Total
|
|||||||||
|
Debt outstanding:
|
|||||||||||
|
Credit facility debt
|
$
|
5,915,559
|
|
$
|
—
|
|
$
|
5,915,559
|
|
||
|
Senior guaranteed notes
|
5,847,758
|
|
—
|
|
5,847,758
|
|
|||||
|
Senior notes and debentures
|
8,416,610
|
|
1,095,193
|
|
9,511,803
|
|
|||||
|
Subtotal
|
20,179,927
|
|
1,095,193
|
|
21,275,120
|
|
|||||
|
Capital lease obligations
|
25,190
|
|
—
|
|
25,190
|
|
|||||
|
Notes payable
|
106,108
|
|
—
|
|
106,108
|
|
|||||
|
Subtotal
|
20,311,225
|
|
1,095,193
|
|
21,406,418
|
|
|||||
|
Collateralized indebtedness relating to stock monetizations (a)
|
1,406,182
|
|
—
|
|
1,406,182
|
|
|||||
|
Total debt
|
$
|
21,717,407
|
|
$
|
1,095,193
|
|
$
|
22,812,600
|
|
||
|
Interest expense:
|
|||||||||||
|
Credit facility debt, senior notes, capital leases and notes payable
|
$
|
1,189,713
|
|
$
|
303,106
|
|
$
|
1,492,819
|
|
||
|
Collateralized indebtedness and notes payable relating to stock monetizations (a)
|
63,463
|
|
—
|
|
63,463
|
|
|||||
|
Total interest expense
|
$
|
1,253,176
|
|
$
|
303,106
|
|
$
|
1,556,282
|
|
||
|
(a)
|
This indebtedness is collateralized by shares of Comcast common stock. We intend to settle this debt by (i) delivering shares of Comcast common stock and the related equity contracts, or (ii) delivering cash from the net proceeds on new monetization contracts.
|
The following table provides details of our outstanding credit facility debt, net of unamortized discounts and deferred financing costs as of
December 31, 2018
:
|
Maturity Date
|
Interest Rate
|
Principal
|
Carrying Value
|
||||||||
|
CSC Holdings Revolving Credit Facility (a)
|
$20,000 on October 9, 2020, remaining balance on November 30, 2021
|
5.71%
|
$
|
250,000
|
|
$
|
231,425
|
|
|||
|
CSC Holdings Term Loan B
|
July 17, 2025
|
4.71%
|
2,955,000
|
|
2,939,425
|
|
|||||
|
CSC Holdings Incremental Term Loan B-2
|
January 25, 2026
|
4.96%
|
1,492,500
|
|
1,475,778
|
|
|||||
|
CSC Holdings Incremental Term Loan B-3 (b)
|
January 15, 2026
|
4.75%
|
1,275,000
|
|
1,268,931
|
|
|||||
|
$
|
5,972,500
|
|
$
|
5,915,559
|
|
||||||
|
(a)
|
At
December 31, 2018
,
$147,564
of the revolving credit facility was restricted for certain letters of credit issued on behalf of the Company and
$1,902,436
of the facility was undrawn and available, subject to covenant limitations.
|
66
|
(b)
|
Proceeds from the CSC Holdings term loan were used to repay the outstanding amount under the Cequel Term loan in
November 2018 in connection with the Combination. See discussion above.
|
Payment Obligations Related to Debt
As of
December 31, 2018
, total amounts payable by us in connection with our outstanding obligations, including related interest, as well as capital lease obligations, notes payable, and the value deliverable at maturity under monetization contracts are as follows:
|
Total
|
||||
|
2019
|
$
|
2,078,947
|
|
|
|
2020
|
1,981,190
|
|
||
|
2021 (a)
|
5,354,854
|
|
||
|
2022
|
1,892,672
|
|
||
|
2023
|
4,014,190
|
|
||
|
Thereafter
|
16,641,816
|
|
||
|
Total
|
$
|
31,963,669
|
|
|
|
(a)
|
Includes
$1,542,266
related to the Company's collateralized indebtedness (including related interest). This indebtedness is collateralized by shares of Comcast common stock. We intend to settle this debt by (i) delivering shares of Comcast common stock and the related equity contracts or (ii) delivering cash from the net proceeds on new monetization contracts.
|
The amounts in the table above do not include the effects of the debt transactions discussed in Note 21.
CSC Holdings Restricted Group
CSC Holdings and those of its subsidiaries which conduct our broadband, pay television and telephony services operations, as well as Lightpath, which provides Ethernet-based data, Internet, voice and video transport and managed services to the business market, comprise the "Restricted Group" as they are subject to the covenants and restrictions of the credit facility and indentures governing the notes and debentures issued by CSC Holdings. In addition, the Restricted Group is also subject to the covenants of the debt issued by Cablevision.
Sources of cash for the Restricted Group include primarily cash flow from the operations of the businesses in the Restricted Group, borrowings under its credit facility and issuance of securities in the capital markets, contributions from its parent, and, from time to time, distributions or loans from its subsidiaries. The Restricted Group's principal uses of cash include: capital spending, in particular, the capital requirements associated with the upgrade of its digital broadband, pay television and telephony services, including costs to build a FTTH network and enhancements to its service offerings such as Wi-Fi; debt service, including distributions made to Cablevision to service interest expense and principal repayments on its debt securities; other corporate expenses and changes in working capital; and investments that it may fund from time to time.
CSC Holdings Credit Facility
On October 9, 2015, Finco, which merged with and into CSC Holdings on June 21, 2016,
entered into a senior secured credit facility, which currently provides U.S. dollar term loans currently in an aggregate principal amount of $3,000,000 ($2,955,000 outstanding at December 31, 2018) (the “CSC Term Loan Facility”, and the term loans extended under the CSC Term Loan Facility, the “CSC Term Loans”) and U.S. dollar revolving loan commitments in an aggregate principal amount of $2,300,000 (the “CSC Revolving Credit Facility” and, together with the CSC Term Loan Facility, the “CSC Credit Facilities”), which are governed by a credit facilities agreement entered into by,
inter alios
, CSC Holdings certain lenders party thereto and JPMorgan Chase Bank, N.A. as administrative agent and security agent (as amended, restated, supplemented or otherwise modified on June 20, 2016, June 21, 2016, July 21, 2016, September 9, 2016, December 9, 2016, March 15, 2017, January 12, 2018, and October 15, 2018, respectively, and as further amended, restated, supplemented or otherwise modified from time to time, the “CSC Credit Facilities Agreement”).
In January 2018, CSC Holdings entered into a new $1,500,000 incremental term loan facility (the "Incremental Term Loan B-2") under its existing credit facilities agreement. The Incremental Term Loan B-2 was priced at 99.5% and will mature on January 25, 2026. The Incremental Term Loan B-2 is comprised of eurodollar borrowings or alternate base rate borrowings, and bears interest at a rate per annum equal to the adjusted LIBOR or the alternate base rate, as applicable, plus the applicable margin, where the applicable margin is (i) with respect to any alternate base rate loan, 1.50% per annum and (ii) with respect to any eurodollar loan, 2.50% per annum. The Company is required to make scheduled
67
quarterly payments equal to 0.25% (or $3,750) of the principal amount of the Incremental Term Loan B-2, beginning with the fiscal quarter ended September 30, 2018, with the remaining balance scheduled to be paid on January 26, 2026.
See discussion above under "Credit Silo Combination" regarding the Sixth Amendment to the CSC Credit Facilities Agreement, which provided for, among other things, new incremental term loan commitments in an aggregate principal amount of $1,275,000.
In January 2019, CSC Holdings obtained commitments to refinance its existing revolving credit facility, subject to customary closing conditions. After the refinancing, the total size of the new revolving credit facility is
$2,562,500
, including
$2,170,000
extended to January 2024 and priced at LIBOR plus 2.25%. The remaining $392,500 matures in November 2021.
Also in January 2019, CSC Holdings borrowed $200,000 under its revolving credit facility and in February 2019, repaid $250,000 of amounts outstanding under the revolving credit facility from the proceeds of the issuance of an additional
$250,000
principal amount of CSC Holdings 2029 Guaranteed Notes discussed below.
In February 2019, CSC Holdings entered into a
$1,000,000
senior secured Term Loan B ("Incremental Term Loan B-4") maturing on April 15, 2027, the proceeds of which were used to redeem
$894,700
in aggregate principal amount of CSC Holdings’
10.125%
senior notes due 2023, representing the entire aggregate principal amount outstanding, and paying related fees, costs and expenses. The Incremental Term Loan B-4 bears interest at a rate per annum equal to LIBOR plus 3.0% and was issued with an original issue discount of 1.0%.
During the year ended
December 31, 2018
, CSC Holdings borrowed
$725,000
under its revolving credit facility (and used a portion of the proceeds to repay the $500,000 principal amount of senior notes due July 15, 2018) and made voluntary repayments aggregating
$925,000
with cash on hand.
The Company was in compliance with all of its financial covenants under the CSC Credit Facilities Agreement as of
December 31, 2018
.
See Note 11 to our consolidated financial statements for further information regarding the CSC Credit Facilities Agreement.
Cequel Credit Facilities
In October 2018, in connection with the Combination described above, amounts outstanding pursuant to the Cequel credit facilities aggregating $1,249,188 were repaid from the proceeds of the CSC Holdings Senior Secured Term Loan B-3 and all commitments pursuant to the Cequel Credit Facilities were cancelled.
Senior Guaranteed Notes and Senior Notes
In January 2018, CSC Holdings issued $1,000,000 aggregate principal amount of 5 3/8% senior guaranteed notes due February 1, 2028 (the "2028 Guaranteed Notes"). The 2028 Guaranteed Notes are senior unsecured obligations and rank pari passu in right of payment with all of the existing and future senior indebtedness, including the existing senior notes and the Credit Facilities and rank senior in right of payment to all of existing and future subordinated indebtedness.
The proceeds from the 2028 Guaranteed Notes, together with proceeds from the Incremental Term Loan (discussed above), borrowings under the CVC revolving credit facility and cash on hand, were used in February 2018 to repay
$300,000
principal amount of CSC Holdings' senior notes due in February 2018 and
$750,000
principal amount of Cablevision senior notes due in April 2018 and a portion was used to fund the dividend of
$1,499,935
to the Company's stockholders on June 6, 2018.
In July 2018, CSC Holdings repaid $500,000 aggregate principal amount of its 7 5/8% Senior Debentures upon maturity with borrowings under CSC Holdings’ revolving credit facility agreement.
See Note 11 of our consolidated financial statements for further details of the Company’s outstanding senior guaranteed notes and senior notes.
As of
December 31, 2018
, the Company was in compliance with all of its financial covenants under the indentures under which these notes were issued.
68
In January 2019, CSC Holdings issued $1,500,000 in aggregate principal amount of senior guaranteed notes due 2029 ("CSC Holdings 2029 Guaranteed Notes"). The notes bear interest at a rate of 6.5% and will mature on February 1, 2029. The net proceeds from the sale of the notes was used to repay certain indebtedness, including to repay at maturity $526,000 aggregate principal amount of CSC Holdings' 8.625% senior notes due February 2019, redeem approximately $905,300 of the aggregate outstanding amount of CSC Holdings' 10.125% senior notes due 2023 at a redemption price of 107.594% plus accrued interest, and paid fees and expenses associated with the transactions.
In February 2019, CSC Holdings issued an additional $250,000 CSC Holdings 2029 Guaranteed Notes at a price of 101.75% of the principal value. The proceeds of these notes were to repay the outstanding balance on the CSC Revolving Credit Facility.
Capital Expenditures
|
Years Ended December 31,
|
|||||||||||
|
2018
|
2017
|
2016
|
|||||||||
|
Customer premise equipment
|
$
|
369,236
|
|
$
|
308,500
|
|
$
|
232,254
|
|
||
|
Network infrastructure
|
395,074
|
|
311,730
|
|
168,878
|
|
|||||
|
Support and other
|
226,409
|
|
189,209
|
|
128,489
|
|
|||||
|
Business services
|
162,870
|
|
141,910
|
|
95,920
|
|
|||||
|
Capital purchases (cash basis)
|
$
|
1,153,589
|
|
$
|
951,349
|
|
$
|
625,541
|
|
||
|
Capital purchases (including accrued not paid and financed capital)
|
$
|
1,305,104
|
|
$
|
1,020,761
|
|
$
|
700,679
|
|
||
Customer premise equipment includes expenditures for set-top boxes, cable modems, routers and other equipment that is placed in a customer's home, as well as installation costs for placing assets into service. Network infrastructure includes: (i) scalable infrastructure, such as headend equipment, (ii) line extensions, such as fiber/coaxial cable, amplifiers, electronic equipment, make-ready and design engineering, and (iii) upgrade and rebuild, including costs to modify or replace existing fiber/coaxial cable networks, including enhancements. Support and other capital expenditures includes costs associated with the replacement or enhancement of non-network assets, such as office equipment, buildings and vehicles. Business services capital expenditures include primarily equipment, installation, support, and other costs related to our fiber based telecommunications business.
Cash Flow Discussion
Operating Activities
Net cash provided by operating activities amounted to
$2,508,317
,
$2,018,247
and
$1,184,455
for the years ended
December 31, 2018
,
2017
and
2016
, respectively.
The 2018 cash provided by operating activities resulted from $2,644,639 of income before depreciation and amortization and non-cash items, an increase in deferred revenue of $72,426, an increase in liabilities related to interest rate swap contracts of $53,101, and a net increase in amounts due to affiliates of $11,049, partially offset by an increase in accounts receivable of $144,079, a decrease in accounts payable and accrued expenses of $118,176, and an increase in current and other assets of $10,643.
The 2017 cash provided by operating activities resulted from $2,318,941 of income before depreciation and amortization and non-cash items and an increase in deferred revenue of $12,310, partially offset by a decrease in accounts payable and accrued expenses of $167,813, a net increase in current and other assets of $109,944, a net decrease in amounts due to affiliates of $34,326, and a decrease in liabilities related to interest rate swap contracts of $921.
The 2016 cash provided by operating activities resulted from $746,341 of income before depreciation and amortization and non-cash items, $310,892 as a result of an increase in accounts payable, deferred revenue and other liabilities, $78,823 resulting from an increase in liabilities related to interest rate swap contracts and $48,399 resulting from a net decrease in current and other assets.
69
Investing Activities
Net cash used in investing activities for the years ended
December 31, 2018
,
2017
and
2016
was
$1,148,357
,
$1,092,199
and
$9,599,319
, respectively.
The 2018 investing activities consisted primarily of capital expenditures of $1,153,589, partially offset by other net cash receipts of $5,232.
The 2017 investing activities consisted primarily of capital expenditures of $951,349, payments of $97,410 related to the settlement of put-call options, and payments for acquisitions, net of cash acquired of $46,703, partially offset by $3,263 in other net cash proceeds.
The 2016 investing activities consisted primarily of $8,988,774 payment for the Cablevision Acquisition, net of cash acquired, $625,541 of capital expenditures, partially offset by cash receipt of $13,825 from the sale of an affiliate interest and other net cash receipts of $1,171.
Financing Activities
Net cash used in financing activities amounted to
$1,390,996
and
$1,099,041
for the years ended
December 31, 2018
and
December 31, 2017
compared to net cash provided by financing activities of
$131,421
for the year ended
December 31, 2016
. In 2018, the Company's financing activities consisted primarily of the redemption and repurchase of senior notes, including premiums and fees of $2,628,962, dividends to stockholders of $1,499,935, the purchase of common stock pursuant to a share repurchase program of $500,000, payments of collateralized indebtedness and related derivatives of $516,513, contingent payment for acquisition of $30,000, additions to deferred financing costs of $28,468, net repayment of notes payable of $16,677, and other net cash payments of $11,087, partially offset by net proceeds from credit facility debt of $1,268,138, proceeds from the issuance of senior notes of $2,050,000, proceeds from collateralized indebtedness of $516,513, and contributions from noncontrolling interests of $5,995.
In 2017, the Company's financing activities consisted primarily of the repayment of senior notes, including premiums and fees, of $1,729,400, cash distributions paid to stockholders of $919,317, principal payments on capital lease obligations of $15,157, and additions to deferred financing costs of $8,600, partially offset by net proceeds from credit facility debt of $1,182,094, net proceeds from collateralized indebtedness and related derivative contracts of $7,735, net proceeds from the Company's IPO of $349,071, proceeds from notes payable of $33,733, and other net cash receipt of $800.
In 2016, the Company's financing activities consisted of proceeds of $1,750,000 from the issuance of notes to affiliates and related parties, $1,310,000 from the issuance of senior notes, contribution from stockholders of $1,246,499, net proceeds from collateralized indebtedness of $36,286, and an excess tax benefit related to share-based awards of $31. Partially offsetting these increases were net repayments of credit facility debt of $3,623,287, distributions to stockholders of $365,559, payments of deferred financing costs of $203,712, and principal payments on capital lease obligations of $18,837.
70
Settlements of Collateralized Indebtedness
The following table summarizes the settlement of the Company's collateralized indebtedness relating to Comcast shares that were settled by delivering cash equal to the collateralized loan value, net of the value of the related equity derivative contracts during the year ended
December 31, 2018
:
|
Number of shares
|
16,139,868
|
|
|
|
Collateralized indebtedness settled
|
$
|
(516,537
|
)
|
|
Derivative contracts settled
|
24
|
|
|
|
(516,513
|
)
|
||
|
Proceeds from new monetization contracts
|
516,513
|
|
|
|
Net cash received
|
$
|
—
|
|
The cash to settle the collateralized indebtedness was obtained from the proceeds of new monetization contracts covering an equivalent number of Comcast shares. The terms of the new contracts allow the Company to retain upside participation in Comcast shares up to each respective contract's upside appreciation limit with downside exposure limited to the respective hedge price.
In April 2017, the Company entered into new monetization contracts related to 32,153,118 shares of Comcast common stock held by us, which synthetically reversed the then existing contracts related to these shares (the "Synthetic Monetization Closeout"). As the then existing collateralized debt matured, the Company settled the contracts with proceeds received from the new monetization contracts. The new monetization contracts mature on April 28, 2021. The new monetization contracts provide the Company with downside protection below the hedge price of $35.47 and upside benefit of stock price appreciation up to $44.72 per share.
Contractual Obligations and Off Balance Sheet Commitments
Our contractual obligations to affiliates and non-affiliates as of
December 31, 2018
, which consist primarily of our debt obligations and the effect such obligations are expected to have on our liquidity and cash flow in future periods, are summarized in the following table:
|
|
Payments Due by Period
|
||||||||||||||||||||||
|
|
Total
|
Year
1
|
Years
2-3
|
Years
4-5
|
More than
5 years
|
Other
|
|||||||||||||||||
|
Off balance sheet arrangements:
|
|||||||||||||||||||||||
|
Purchase obligations (a)
|
$
|
8,906,134
|
|
$
|
3,190,028
|
|
$
|
4,940,814
|
|
$
|
742,931
|
|
$
|
32,361
|
|
$
|
—
|
|
|||||
|
Operating lease obligations (b)
|
369,680
|
|
47,905
|
|
93,718
|
|
60,116
|
|
167,941
|
|
—
|
|
|||||||||||
|
Guarantees (c)
|
36,912
|
|
36,912
|
|
—
|
|
—
|
|
—
|
|
—
|
|
|||||||||||
|
Letters of credit (d)
|
147,564
|
|
120
|
|
147,444
|
|
—
|
|
—
|
|
—
|
|
|||||||||||
|
|
9,460,290
|
|
3,274,965
|
|
5,181,976
|
|
803,047
|
|
200,302
|
|
—
|
|
|||||||||||
|
Contractual obligations reflected on the balance sheet:
|
|
|
|
|
|
|
|
|
|
|
|
|
|||||||||||
|
Debt obligations (e)
|
31,934,892
|
|
2,071,890
|
|
7,325,438
|
|
5,898,170
|
|
16,639,394
|
|
—
|
|
|||||||||||
|
Capital lease obligations (f)
|
28,777
|
|
7,057
|
|
10,606
|
|
8,692
|
|
2,422
|
|
—
|
|
|||||||||||
|
Taxes (g)
|
4,900
|
|
—
|
|
—
|
|
—
|
|
—
|
|
4,900
|
|
|||||||||||
|
|
31,968,569
|
|
2,078,947
|
|
7,336,044
|
|
5,906,862
|
|
16,641,816
|
|
4,900
|
|
|||||||||||
|
Total
|
$
|
41,428,859
|
|
$
|
5,353,912
|
|
$
|
12,518,020
|
|
$
|
6,709,909
|
|
$
|
16,842,118
|
|
$
|
4,900
|
|
|||||
71
|
(a)
|
Purchase obligations primarily include contractual commitments with various programming vendors to provide video services to our customers and minimum purchase obligations to purchase goods or services, including contracts to acquire handsets and other equipment. Future fees payable under contracts with programming vendors are based on numerous factors, including the number of customers receiving the programming. Amounts reflected above related to programming agreements are based on the number of customers receiving the programming as of
December 31, 2018
multiplied by the per customer rates or the stated annual fee, as applicable, contained in the executed agreements in effect as of
December 31, 2018
. See Note 17 to our consolidated financial statements for a discussion of our program rights obligations.
|
|
(b)
|
Operating lease obligations represent primarily future minimum payment commitments on various long-term, noncancelable leases, at rates now in force, for office, production and storage space. Operating lease obligations presented in the table above do not include rent related to utility poles used in our operations. The Company's pole rental agreements are for varying terms, and management anticipates renewals as they expire. Rent expense incurred for pole rental attachments for the years ended December 31, 2018, 2017 and 2016 was
$33,082
,
$31,308
, and
$22,432
, respectively. See Note 9 to our consolidated financial statements for a discussion of our operating leases.
|
|
(c)
|
Includes franchise and performance surety bonds primarily for our cable television systems. Also includes outstanding guarantees primarily by CSC Holdings in favor of certain financial institutions in respect of ongoing interest expense obligations in connection with the monetization of our holdings of shares of Comcast common stock. Payments due by period for these arrangements represent the year in which the commitment expires.
|
|
(d)
|
Consists primarily of letters of credit obtained by CSC Holdings and Cequel in favor of insurance providers and certain governmental authorities. Payments due by period for these arrangements represent the year in which the commitment expires.
|
|
(e)
|
Includes interest and principal payments due on our (i) credit facility debt, (ii) senior guaranteed notes, senior secured notes, and senior notes and debentures, (iii) notes payable and (iv) collateralized indebtedness. See Notes 11 and 12 to our consolidated financial statements for a discussion of our long-term debt. These amounts do not include the effects of the debt transactions discussed in Note 21.
|
|
(f)
|
Reflects the principal amount of capital lease obligations, including related interest.
|
|
(g)
|
Represents tax liabilities, including accrued interest, relating to uncertain tax positions. See Note 14 to our consolidated financial statements for a discussion of our income taxes.
|
The table above does not include obligations for payments required to be made under multi-year franchise agreements based on a percentage of revenues generated from pay television services per year. For the years ended
December 31, 2018
,
2017
and
2016
, the amount of franchise fees and certain other taxes and fees included as a component of revenue aggregated
$257,467
,
$259,075
and
$154,732
, respectively.
Dividends and Distributions
In the second quarter of 2017, prior to the Company's IPO, the Company declared and paid cash distributions aggregating
$839,700
,
$500,000
of which were funded with proceeds from borrowings under CSC Holdings' revolving credit facility. In 2016, the Company declared cash distributions of $445,176, of which $365,559 were paid in 2016 and $79,617 were paid in the first quarter of 2017.
Prior to Altice Europe's announcement of the Distribution, the Board of Directors of Altice USA, acting through its independent directors, approved the payment of a
$2.035
dividend to all shareholders of record on May 22, 2018. The payment of the dividend, aggregating
$1,499,935
, was made on June 6, 2018, and was
funded with cash at CSC Holdings from financings completed in January 2018, and cash generated from operations at Cequel.
Share Repurchase Program
The Board of Directors of Altice USA also authorized a share repurchase program of
$2.0 billion
, effective June 8, 2018. Under the repurchase program, shares of Altice USA Class A common stock may be purchased from time to time in the open market and may include trading plans entered into with one or more brokerage firms in accordance with Rule
72
10b5-1 under the Securities Exchange Act of 1934. Size and timing of these purchases will be determined based on market conditions and other factors.
From inception through December 31, 2018, the Company repurchased an aggregate of
28,028,680
shares for a total purchase price of approximately
$500,000
. These acquired shares were retired and the cost for these shares was recorded in paid in capital in the Company's consolidated balance sheet. As of December 31, 2018, the Company had approximately
$1,500,000
of availability remaining under its stock repurchase program and had
709,040,286
combined Class A and Class B shares outstanding.
Managing our Interest Rate and Equity Price Risk
Interest Rate Risk
Interest rate risk is primarily a result of exposures to changes in the level, slope and curvature of the yield curve, the volatility of interest rates and credit spreads. Our exposure to interest rate risk results from changes in short-term interest rates. Interest rate risk exists primarily with respect to our credit facility debt, which bears interest at variable rate
To manage interest rate risk, we have from time to time entered into interest rate swap contracts to adjust the proportion of total debt that is subject to variable and fixed interest rates. Such contracts effectively fix the borrowing rates on floating rate debt to provide an economic hedge against the risk of rising rates and/or effectively convert fixed rate borrowings to variable rates to permit the Company to realize lower interest expense in a declining interest rate environment. We monitor the financial institutions that are counterparties to our interest rate swap contracts and we only enter into interest rate swap contracts with financial institutions that are rated investment grade. All such contracts are carried at their fair market values on our consolidated balance sheet, with changes in fair value reflected in the consolidated statement of operations.
See "Item 7A. Quantitative and Qualitative Disclosures About Market Risk for a summary of interest rate swap contracts outstanding at December 31, 2018.
As of December 31, 2018, our outstanding interest rate swap contracts in a liability position had an aggregate fair value and carrying value of $132,908 reflected in “Liabilities under derivative contracts” on our consolidated balance sheet. Our outstanding interest rate swap contracts in an asset position had an aggregate fair value and carrying value of $1,975 reflected in “Derivative contracts” in our consolidated balance sheet.
These outstanding swap contracts are not designated as hedges for accounting purposes. Accordingly, the changes in the fair value of these interest rate swap contracts are recorded through the statement of operations. For the year ended
December 31, 2018
, the Company recorded a loss on interest rate swap contracts of
$61,697
.
As of December 31, 2018, we did not hold and have not issued
derivative instruments for trading or speculative purposes.
See discussion above for further details of our credit facility debt and See "Item 7A. Quantitative and Qualitative Disclosures About Market Risk" below for a discussion regarding the fair value of our debt.
Equity Price Risk
We have entered into derivative contracts to hedge our equity price risk and monetize the value of our shares of common stock of Comcast. These contracts, at maturity, are expected to offset declines in the fair value of these securities below the hedge price per share while allowing us to retain upside appreciation from the hedge price per share to the relevant cap price. If any one of these contracts is terminated prior to its scheduled maturity date due to the occurrence of an event specified in the contract, we would be obligated to repay the fair value of the collateralized indebtedness less the sum of the fair values of the underlying stock and equity collar, calculated at the termination date. As of
December 31, 2018
we did not have an early termination shortfall relating to any of these contracts. The underlying stock and the equity collars are carried at fair value in our consolidated balance sheets and the collateralized indebtedness is carried at its principal value, net of discounts and the unamortized fair value adjustment for contracts that existed at the date of the Cablevision Acquisition. See "Item 7A. Quantitative and Qualitative Disclosures About Market Risk" for information on how we participate in changes in the market price of the stocks underlying these derivative contracts.
All of our monetization transactions are obligations of our wholly-owned subsidiaries that are not part of the Restricted Group; however, CSC Holdings provides guarantees of the subsidiaries' ongoing contract payment expense obligations and potential payments that could be due as a result of an early termination event (as defined in the agreements). The guarantee exposure approximates the net sum of the fair value of the collateralized indebtedness less the sum of the fair values of the underlying stock and the equity collar. All of our equity derivative contracts are carried at their current fair
73
value in our consolidated balance sheets with changes in value reflected in our consolidated statements of operations, and all of the counterparties to such transactions currently carry investment grade credit ratings.
Critical Accounting Policies
In preparing its financial statements, the Company is required to make certain estimates, judgments and assumptions that it believes are reasonable based upon the information available. These estimates and assumptions affect the reported amounts of assets and liabilities at the date of the financial statements and the reported amounts of revenues and expenses during the periods presented.
The significant accounting policies, which we believe are the most critical to aid in fully understanding and evaluating our reported financial results, include the following:
Impairment of Long-Lived and Indefinite-Lived Assets
The Company's long-lived and indefinite-lived assets at
December 31, 2018
include goodwill of
$8,012,416
, other intangible assets of
$17,212,905
(
$13,020,081
of which are indefinite-lived intangible assets), and
$5,828,881
of property, plant and equipment. Such assets accounted for approximately
92%
of the Company's consolidated total assets. Goodwill and identifiable indefinite-lived intangible assets, which primarily represent the Company's cable television franchises are tested annually for impairment during the fourth quarter ("annual impairment test date") and upon the occurrence of certain events or substantive changes in circumstances.
The Company is operated as two reporting units for the goodwill impairment test and one unit of accounting for the indefinite-lived asset impairment test. We assess qualitative factors and other relevant events and circumstances that affect the fair value of the reporting unit and its identifiable indefinite-lived intangible assets, such as:
|
•
|
macroeconomic conditions;
|
|
•
|
industry and market conditions;
|
|
•
|
cost factors;
|
|
•
|
overall financial performance;
|
|
•
|
changes in management, strategy or customers;
|
|
•
|
relevant specific events such as a change in the carrying amount of net assets, a more-likely-than-not expectation of selling or disposing all, or a portion, of a reporting unit or unit of accounting; and
|
|
•
|
sustained decrease in share price, as applicable.
|
The Company assesses these qualitative factors to determine whether it is necessary to perform the two-step quantitative goodwill impairment test. This quantitative test is required only if the Company concludes that it is more likely than not that the reporting unit's fair value is less than its carrying amount.
When the qualitative assessment is not used, or if the qualitative assessment is not conclusive, the Company is required to determine goodwill impairment using a two-step process. The first step of the goodwill impairment test is used to identify potential impairment by comparing the fair value of the reporting unit with its carrying amount, including goodwill utilizing an enterprise-value based premise approach. If the carrying amount of the reporting unit exceeds its fair value, the second step of the goodwill impairment test is performed to measure the amount of impairment loss, if any. The second step of the goodwill impairment test compares the implied fair value of the reporting unit's goodwill with the carrying amount of that goodwill. If the carrying amount of the reporting unit's goodwill exceeds the implied fair value of that goodwill, an impairment loss is recognized in an amount equal to that excess. The implied fair value of goodwill is determined in the same manner as the amount of goodwill that would be recognized in a business combination.
The Company assesses the qualitative factors discussed above to determine whether it is necessary to perform the one-step quantitative identifiable indefinite-lived intangible assets impairment test. This quantitative test is required only if the Company concludes that it is more likely than not that a unit of accounting's fair value is less than its carrying amount. When the qualitative assessment is not used, or if the qualitative assessment is not conclusive, the impairment test for identifiable indefinite-lived intangible assets requires a comparison of the estimated fair value of the intangible asset with its carrying value. If the carrying value of the intangible asset exceeds its fair value, an impairment loss is recognized in an amount equal to that excess. At
December 31, 2018
the Company had indefinite-lived cable television franchises
74
of
$13,020,081
, reflecting agreements we have with state and local governments that allow us to construct and operate a cable business within a specified geographic area and allow us to solicit and service potential customers in the service areas defined by the franchise rights currently held by the Company.
For other long-lived assets, including intangible assets that are amortized such as customer relationships and trade names, the Company evaluates assets for recoverability when there is an indication of potential impairment. If the undiscounted cash flows from a group of assets being evaluated is less than the carrying value of that group of assets, the fair value of the asset group is determined and the carrying value of the asset group is written down to fair value.
In assessing the recoverability of the Company's goodwill and other long-lived assets, the Company must make assumptions regarding estimated future cash flows and other factors to determine the fair value of the respective assets. These estimates and assumptions could have a significant impact on whether an impairment charge is recognized and also the magnitude of any such charge. Fair value estimates are made at a specific point in time, based on relevant information. These estimates are subjective in nature and involve uncertainties and matters of significant judgments and therefore cannot be determined with precision. Changes in assumptions could significantly affect the estimates. Estimates of fair value are primarily determined using discounted cash flows and comparable market transactions. These valuations are based on estimates and assumptions including projected future cash flows, discount rate, determination of appropriate market comparables and determination of whether a premium or discount should be applied to comparables. These valuations also include assumptions for average annual revenue per customer, number of homes passed, operating margin and market penetration as a percentage of homes passed, among other assumptions. Further, the projected cash flow assumptions consider contractual relationships, customer attrition, eventual development of new technologies and market competition. If these estimates or material related assumptions change in the future, the Company may be required to record impairment charges related to its long-lived assets.
During the fourth quarter of
2018
, the Company assessed the qualitative factors described above to determine whether it was necessary to perform the two-step quantitative goodwill impairment test and concluded that it was not more likely than not that the reporting unit's fair value was less than its carrying amount. The Company also assessed these qualitative factors to determine whether it was necessary to perform the one-step quantitative identifiable indefinite-lived intangible assets impairment test and concluded that it was not more likely than not that the unit of accounting's fair value was less than its carrying amount.
Plant and Equipment
Costs incurred in the construction of the Company's cable systems, including line extensions to, and upgrade of, the Company's HFC infrastructure and construction of the parallel FTTH infrastructure, are capitalized. This includes initial placement of the feeder cable to connect a customer that had not been previously connected, and headend facilities are capitalized. These costs consist of materials, subcontractor labor, direct consulting fees, and internal labor and related costs associated with the construction activities. The internal costs that are capitalized consist of salaries and benefits of the Company's employees and the portion of facility costs, including rent, taxes, insurance and utilities, that supports the construction activities. These costs are depreciated over the estimated life of the plant (10 to 25 years) and headend facilities (5 to 25 years). Costs of operating the plant and the technical facilities, including repairs and maintenance, are expensed as incurred.
Costs associated with the initial deployment of new customer premise equipment necessary to provide broadband, pay television and telephony services are also capitalized. These costs include materials, subcontractor labor, internal labor, and other related costs associated with the connection activities. The departmental activities supporting the connection process are tracked through specific metrics, and the portion of departmental costs that is capitalized is determined through a time weighted activity allocation of costs incurred based on time studies used to estimate the average time spent on each activity. These installation costs are amortized over the estimated useful lives of the CPE necessary to provide broadband, pay television and telephony services. The portion of departmental costs related to disconnecting services and removing CPE from a customer, costs related to connecting CPE that has been previously connected to the network, and repair and maintenance are expensed as incurred.
The estimated useful lives assigned to our property, plant and equipment are reviewed on an annual basis or more frequently if circumstances warrant and such lives are revised to the extent necessary due to changing facts and circumstances. Any changes in estimated useful lives are reflected prospectively.
75
Refer to Note 2 to our consolidated financial statements for a discussion of our accounting policies.
Business Combinations
The Company applied business combination accounting for the Cablevision Acquisition and the Cequel Acquisition. Business combination accounting requires that the assets acquired and liabilities assumed be recorded at their respective estimated fair values at the date of acquisition. The excess purchase price over fair value of the net assets acquired is recorded as goodwill. In determining estimated fair values, we are required to make estimates and assumptions that affect the recorded amounts, including, but not limited to, expected future cash flows, discount rates, remaining useful lives of long-lived assets, useful lives of identified intangible assets, replacement or reproduction costs of property and equipment and the amounts to be recovered in future periods from acquired net operating losses and other deferred tax assets. Our estimates in this area impact, among other items, the amount of depreciation and amortization, impairment charges in certain instances if the asset becomes impaired, and income tax expense or benefit that we report. Our estimates of fair value are based upon assumptions believed to be reasonable, but which are inherently uncertain. See Note 5 for a summary of the application of business combination accounting.
Recently Issued But Not Yet Adopted Accounting Pronouncements
See Note 3 to the accompanying consolidated financial statements contained in “Part II. Item 8. Financial Statements and Supplementary Data” for a discussion of recently issued accounting standards.
|
Item 7A.
|
Quantitative and Qualitative Disclosures About Market Risk
|
All dollar amounts, except per share data, included in the following discussion are presented in thousands.
Equity Price Risk
We are exposed to market risks from changes in certain equity security prices. Our exposure to changes in equity security prices stems primarily from the shares of Comcast common stock we hold. We have entered into equity derivative contracts consisting of a collateralized loan and an equity collar to hedge our equity price risk and to monetize the value of these securities. These contracts, at maturity, are expected to offset declines in the fair value of these securities below the hedge price per share while allowing us to retain upside appreciation from the hedge price per share to the relevant cap price. The contracts' actual hedge prices per share vary depending on average stock prices in effect at the time the contracts were executed. The contracts' actual cap prices vary depending on the maturity and terms of each contract, among other factors. If any one of these contracts is terminated prior to its scheduled maturity date due to the occurrence of an event specified in the contract, we would be obligated to repay the fair value of the collateralized indebtedness less the sum of the fair values of the underlying stock and equity collar, calculated at the termination date. As of December 31, 2018, we did not have an early termination shortfall relating to any of these contracts.
The underlying stock and the equity collars are carried at fair value on our consolidated balance sheet and the collateralized indebtedness is carried at its principal value, net of discounts, and the unamortized fair value adjustment for contracts that existed at the date of the Cablevision Acquisition. The fair value adjustment is being amortized over the term of the related indebtedness. The carrying value of our collateralized indebtedness amounted to $1,406,182 at December 31, 2018. At maturity, the contracts provide for the option to deliver cash or shares of Comcast common stock, with a value determined by reference to the applicable stock price at maturity.
As of December 31, 2018, the fair value and the carrying value of our holdings of Comcast common stock aggregated $1,462,626. Assuming a 10% change in price, the potential change in the fair value of these investments would be approximately $146,263. As of December 31, 2018, the net fair value and the carrying value of the equity collar component of the equity derivative contracts entered into to partially hedge the equity price risk of our holdings of Comcast common stock aggregated $109,344, a net asset position. For the year ended December 31, 2018, we recorded a net gain of $218,848 related to our outstanding equity derivative contracts and recorded an unrealized loss of $261,993 related to the Comcast common stock that we held.
76
|
Fair Value of Equity Derivative Contracts
|
|||
|
|
|||
|
Fair value as of December 31, 2017, net liability position
|
$
|
(109,504
|
)
|
|
Fair value of new equity derivative contracts
|
—
|
|
|
|
Change in fair value, net
|
218,848
|
|
|
|
Fair value as of December 31, 2018, net asset position
|
$
|
109,344
|
|
The maturity, number of shares deliverable at the relevant maturity, hedge price per share, and the lowest and highest cap prices received for the Comcast common stock monetized via an equity derivative prepaid forward contract are summarized in the following table:
|
Hedge Price
|
Cap Price (b)
|
|||||||||||
|
# of Shares Deliverable (a)
|
Maturity
|
per Share (a)
|
Low
|
High
|
||||||||
|
42,955,236
|
2021
|
$29.25- $35.47
|
$
|
43.88
|
|
$
|
44.80
|
|
||||
|
(a)
|
Represents the price below which we are provided with downside protection and above which we retain upside appreciation. Also represents the price used in determining the cash proceeds payable to us at inception of the contracts.
|
|
(b)
|
Represents the price up to which we receive the benefit of stock price appreciation.
|
Fair Value of Debt
At
December 31, 2018
, the fair value of our fixed rate debt of $17,263,072 was higher than its carrying value of $16,871,851 by $391,221. The fair value of these financial instruments is estimated based on reference to quoted market prices for these or comparable securities. Our floating rate borrowings bear interest in reference to current LIBOR-based market rates and thus their principal values approximate fair value. The effect of a hypothetical 100 basis point decrease in interest rates prevailing at
December 31, 2018
would increase the estimated fair value of our fixed rate debt by $593,424 to $17,856,496. This estimate is based on the assumption of an immediate and parallel shift in interest rates across all maturities.
Interest Rate Risk
To manage interest rate risk, we have from time to time entered into interest rate swap contracts to adjust the proportion of total debt that is subject to variable and fixed interest rates. Such contracts effectively fix the borrowing rates on floating rate debt to provide an economic hedge against the risk of rising rates and/or effectively convert fixed rate borrowings to variable rates to permit the Company to realize lower interest expense in a declining interest rate environment. We monitor the financial institutions that are counterparties to our interest rate swap contracts and we only enter into interest rate swap contracts with financial institutions that are rated investment grade. All such contracts are carried at their fair market values on our consolidated balance sheet, with changes in fair value reflected in the consolidated statement of operations.
77
The following is a summary of interest rate swap contracts outstanding at December 31, 2018:
|
Trade Date
|
Maturity Date
|
Notional Amount
|
Company Pays
|
Company Receives
|
||||||
|
May 2016
|
May 2026
|
$
|
750,000
|
|
Six- month LIBOR
|
Fixed rate of 1.665%
|
||||
|
June 2016
|
May 2026
|
750,000
|
|
Six- month LIBOR
|
Fixed rate of 1.68%
|
|||||
|
May 2018
|
April 2019
|
2,970,000
|
|
Three- month LIBOR
|
One- month LIBOR plus 0.226%
|
|||||
|
May 2018
|
April 2019
|
1,496,250
|
|
Three- month LIBOR
|
One- month LIBOR plus 0.226%
|
|||||
|
April 2018
|
April 2019
|
1,255,513
|
|
Three- month LIBOR minus 0.225%
|
One- month LIBOR
|
|||||
|
December 2018
|
January 2022
|
500,000
|
|
Fixed rate of 2.7177%
|
Three-month LIBOR
|
|||||
|
December 2018
|
January 2022
|
500,000
|
|
Fixed rate of 2.733%
|
Three-month LIBOR
|
|||||
|
December 2018
|
January 2022
|
500,000
|
|
Fixed rate of 2.722%
|
Three-month LIBOR
|
|||||
|
December 2018
|
December 2026
|
750,000
|
|
Fixed rate of 2.9155%
|
Three-month LIBOR
|
|||||
|
December 2018
|
December 2026
|
750,000
|
|
Fixed rate of 2.9025%
|
Three-month LIBOR
|
|||||
These swap contracts are not designated as hedges for accounting purposes. Accordingly, the changes in the fair value of these interest rate swap contracts are recorded through the statement of operations. For the year ended December 31, 2018, the Company recorded a loss on interest rate swap contracts of $61,697.
As of December 31, 2018, our outstanding interest rate swap contracts in a liability position had an aggregate fair value and carrying value of $132,908 reflected in “Liabilities under derivative contracts” on our consolidated balance sheet. Our outstanding interest rate swap contracts in an asset position had an aggregate fair value and carrying value of $1,975 reflected in “Derivative contracts” in our consolidated balance sheet.
As of December 31, 2018, we did not hold and have not issued derivative instruments for trading or speculative purposes.
|
Item 8.
|
Financial Statements and Supplementary Data
|
For information required by Item 8, refer to the Index to Financial Statements on page F-1.
|
Item 9.
|
Changes in and Disagreements with Accountants on Accounting and Financial Disclosure
|
None.
Item 9A.
Controls and Procedures
Evaluation of Disclosure Controls and Procedures
An evaluation was carried out under the supervision and with the participation of Altice USA's management, including our Chief Executive Officer and Chief Financial Officer, of the effectiveness of the design and operation of our disclosure controls and procedures (as defined under SEC rules). Based upon that evaluation, the Chief Executive Officer and Chief Financial Officer concluded that the design and operation of these disclosure controls and procedures were effective as of December 31, 2018.
Management's Annual Report on Internal Control Over Financial Reporting
The Company's management is responsible for establishing and maintaining effective internal control over financial reporting as defined in Rules 13a-15(f) under the Securities Exchange Act of 1934, as amended. The Company's internal control over financial reporting is a process designed under the supervision of the Company's Chief Executive Officer and Chief Financial Officer to provide reasonable assurance to the Company's management and Board of Directors regarding the reliability of financial reporting and the preparation of the Company's external financial statements, including estimates and judgments, in accordance with accounting principles generally accepted in the United States of America.
Because of its inherent limitations, internal control over financial reporting may not prevent or detect misstatements. Therefore, even those internal controls determined to be effective can provide only reasonable assurance with respect
78
to financial statement preparation and presentation. Also, the evaluation of the effectiveness of internal control over financial reporting was made as of a specific date, and continued effectiveness in future periods is subject to the risks that controls may become inadequate because of changes in conditions or that the degree of compliance with the policies and procedures may decline.
The Company's management conducted an assessment of the effectiveness of the Company's internal control over financial reporting based on the framework established in
Internal Control-Integrated Framework
issued by the Committee of Sponsoring Organizations of the Treadway Commission (COSO) (2013 framework). Based on this assessment, management concluded that the Company's internal control over financial reporting was effective as of December 31, 2018.
Audit Report of the Independent Registered Public Accounting Firm
The effectiveness of the Company's internal control over financial reporting as of December 31, 2018 has been audited by KPMG LLP, an independent registered public accounting firm, as stated in their audit report on the Company’s internal control over financial reporting appearing on page F-2.
Changes in Internal Control
During the year ended December 31, 2018, there were no changes in the Company's internal control over financial reporting that materially affected or are reasonably likely to materially affect the Company's internal control over financial reporting.
The Company migrated certain Cequel customers to the Cablevision billing system platform in the fourth quarter of 2018 and plans to migrate the remaining Cequel customers to the Cablevision platform in 2019. Additionally, the Company implemented and upgraded certain other customer billing systems in 2018 and plans to upgrade a billing system for certain advertising customers in 2019.
|
Item 9B.
|
Other Information
|
None.
PART III
Information required under Item 10, Directors, Executive Officers and Corporate Governance, Item 11, Executive Compensation, Item 12, Security Ownership of Certain Beneficial Owners and Management and Related Stockholder Matters, Item 13, Certain Relationships and Related Transactions, and Director Independence and Item 14, Principal Accountant Fees and Services, is hereby incorporated by reference from the Company's definitive proxy statement for its Annual Meeting of Stockholders or, if such definitive proxy statement is not filed with the Securities and Exchange Commission prior to April 30, 2019, an amendment to this Annual Report on Form 10-K filed under cover of Form 10-K/A.
Section 16(a) Beneficial Ownership Reporting Compliance
Pursuant to regulations promulgated by the Securities and Exchange Commission, the Company is required to identify, based solely on a review of reports filed under Section 16(a) of the Securities Exchange Act of 1934, each person who, at any time during its fiscal year ended
December 31, 2018
, was a director, officer or beneficial owner of more than 10% of the Company's Class A common stock that failed to file on a timely basis any such reports. Based on such review, the Company is aware of no such failure.
79
PART IV
Item 15.
Exhibits and Financial Statement Schedules
|
(a)
|
The following documents are filed as part of this report:
|
|
1.
|
The financial statements as indicated in the index set forth on page F-1.
|
|
2.
|
Financial statement schedules have been omitted, since they are either not applicable, not required or the information is included elsewhere herein.
|
|
3.
|
The Index to Exhibits is on page
81.
|
EXHIBIT INDEX
|
Exhibit No.
|
|
Exhibit Description
|
|
Form of Underwriting Agreement (incorporated herein by reference to Exhibit 1.1 to Altice USA's prospectus report on Form S-1/A (File No. 333-217240), filed on June 12, 2017)
|
||
|
|
|
|
|
Form of Amended and Restated Certificate of Incorporation (incorporated herein by reference to Exhibit 3.1 to Altice USA's prospectus report on Form S-1/A (File No. 333-217240), filed on June 12, 2017)
|
||
|
|
|
|
|
Form of Amended and Restated Bylaws of the Registrant (incorporated herein by reference to Exhibit 3.2 to Altice USA's prospectus report on Form S-1/A (File No. 333-217240), filed on June 12, 2017)
|
||
|
|
|
|
|
Form of Third Amended and Restated Certificate of Incorporation of the Company (incorporated by reference to Exhibit 3.3 of the Company's prospectus report on Form S-1/A (File No. 333-222475), filed on May 21, 2018)
|
||
|
Form of Second Amended and Restated Bylaws of the Company (incorporated by reference to Exhibit 3.4 of the Company's prospectus report on Form S-1/A (File No. 333-222475), filed on May 21, 2018)
|
||
|
4.1 +
|
Specimen Class A Common Stock Certificate
|
|
|
|
|
|
|
4.2 +
|
Specimen Class B Common Stock Certificate
|
|
|
Form of Stockholders and Registration Rights Agreement by and among Altice USA, Inc. and the stockholders party thereto (incorporated herein by reference to Exhibit 4.2 to Altice USA's prospectus report on Form S-1/A (File No. 333-217240), filed on June 12, 2017)
|
||
|
|
|
|
|
Indenture, dated as of April 2, 2010, relating to Cablevision's 7
3
/
4
% Senior Notes due 2018 and 8% Senior Notes due 2020 (incorporated herein by reference to Exhibit 4.4 to Altice USA's prospectus report on Form S-1/A (File No. 333-217240), filed on May 16, 2017)
|
||
|
|
|
|
|
First Supplemental Indenture, dated as of April 15, 2010, to the Indenture, dated as of April 2, 2010, relating to Cablevision's 7
3
/
4
% Senior Notes due 2018 and 8% Senior Notes due 2020 (incorporated herein by reference to Exhibit 4.5 to Altice USA's prospectus report on Form S-1/A (File No. 333-217240), filed on May 16, 2017)
|
||
|
|
|
|
|
Second Supplemental Indenture, dated as of September 27, 2012, to the Indenture dated as of April 2, 2010, relating to Cablevision's 5
7
/
8
% Senior Notes due 2022 (incorporated herein by reference to Exhibit 4.6 to Altice USA's prospectus report on Form S-1/A (File No. 333-217240), filed on May 16, 2017)
|
||
|
|
|
|
|
Indenture, dated as of December 1, 1997, relating to CSC Holdings' 7
7
/
8
% Senior Debentures due 2018 (incorporated herein by reference to Exhibit 4.7 to Altice USA's prospectus report on Form S-1/A (File No. 333-217240), filed on May 16, 2017)
|
||
|
|
|
|
|
Indenture, dated as of July 1, 1998, relating to CSC Holdings' 7
5
/
8
% Senior Debentures due 2018 (incorporated herein by reference to Exhibit 4.8 to Altice USA's prospectus report on Form S-1/A (File No. 333-217240), filed on May 16, 2017)
|
||
|
|
|
|
|
Indenture, dated as of February 12, 2009, relating to CSC Holdings' 8
5
/
8
% Senior Notes due 2019 and 8
5
/
8
% Series B Senior Notes due 2019 (incorporated herein by reference to Exhibit 4.9 to Altice USA's prospectus report on Form S-1/A (File No. 333-217240), filed on May 16, 2017)
|
||
|
|
|
|
|
Indenture, dated as of November 15, 2011, relating to CSC Holdings' 6
3
/
4
% Senior Notes due 2021 and 6
3
/
4
% Series B Senior Notes due 2021 (incorporated herein by reference to Exhibit 4.10 to Altice USA's prospectus report on Form S-1/A (File No. 333-217240), filed on May 16, 2017)
|
||
|
|
|
|
|
Indenture, dated as of May 23, 2014, relating to CSC Holdings' 5
1
/
4
% Senior Notes due 2024 and 5
1
/
4
% Series B Senior Notes due 2024 (incorporated herein by reference to Exhibit 4.11 to Altice USA's prospectus report on Form S-1/A (File No. 333-217240), filed on May 16, 2017)
|
||
|
|
|
|
|
Indenture, dated as of October 9, 2015, relating to CSC Holdings' 10
1
/
8
% Senior Notes due 2023 and 10
7
/
8
% Senior Notes due 2025 (incorporated herein by reference to Exhibit 4.12 to Altice USA's prospectus report on Form S-1/A (File No. 333-217240), filed on May 16, 2017)
|
||
|
|
|
|
81
|
Exhibit No.
|
|
Exhibit Description
|
|
Supplemental Indenture, dated as of June 21, 2016, to Indenture dated as of October 9, 2015, relating to CSC Holdings' 10
1
/
8
% Senior Notes due 2023 and 10
7
/
8
% Senior Notes due 2025 (incorporated herein by reference to Exhibit 4.13 to Altice USA's prospectus report on Form S-1/A (File No. 333-217240), filed on May 16, 2017)
|
||
|
Indenture, dated as of October 9, 2015, relating to CSC Holdings' 6
5
/
8
% Senior Guaranteed Notes due 2025 (incorporated herein by reference to Exhibit 4.14 to Altice USA's prospectus report on Form S-1/A (File No. 333-217240), filed on May 16, 2017)
|
||
|
|
|
|
|
Supplemental Indenture, dated as of June 21, 2016, to the Indenture dated as of October 9, 2015, relating to CSC Holdings' 6
5
/
8
% Senior Guaranteed Notes due 2025 (incorporated herein by reference to Exhibit 4.15 to Altice USA's prospectus report on Form S-1/A (File No. 333-217240), filed on May 16, 2017)
|
||
|
|
|
|
|
Indenture, dated as of September 23, 2016, relating to CSC Holdings' 5
1
/
2
% Senior Guaranteed Notes due 2027 (incorporated herein by reference to Exhibit 4.16 to Altice USA's prospectus report on Form S-1/A (File No. 333-217240), filed on May 16, 2017)
|
||
|
|
|
|
|
Indenture, dated as of June 12, 2015, relating to Altice US Finance I Corporation's 5
3
/
8
% Senior Secured Notes due 2023 (incorporated herein by reference to Exhibit 4.17 to Altice USA's prospectus report on Form S-1/A (File No. 333-217240), filed on May 16, 2017)
|
||
|
Supplemental Indenture, dated as of December 21, 2015, to the Indenture, dated as of June 12, 2015, relating to Altice US Finance I Corporation's 5
3
/
8
% Senior Secured Notes due 2023 (incorporated herein by reference to Exhibit 4.18 to Altice USA's prospectus report on Form S-1/A (File No. 333-217240), filed on May 16, 2017)
|
||
|
Notes Pledge and Security Agreement, dated as of December 21, 2015, by and between Cequel Communications Holdings II, LLC and JPMorgan Chase Bank, N.A. (incorporated herein by reference to Exhibit 4.19 to Altice USA's prospectus report on Form S-1/A (File No. 333-217240), filed on May 16, 2017)
|
||
|
|
|
|
|
Notes Pledge and Security Agreement, dated as of December 21, 2015, by and among the grantors party thereto and JPMorgan Chase Bank, N.A. (incorporated herein by reference to Exhibit 4.20 to Altice USA's prospectus report on Form S-1/A (File No. 333-217240), filed on May 16, 2017)
|
||
|
|
|
|
|
Trademark Security Agreement, dated as of December 21, 2015, by and among the grantors party thereto and JPMorgan Chase Bank, N.A. (incorporated herein by reference to Exhibit 4.21 to Altice USA's prospectus report on Form S-1/A (File No. 333-217240), filed on May 16, 2017)
|
||
|
|
|
|
|
Copyright Security Agreement, dated as of December 21, 2015, by and among the grantors party thereto and JPMorgan Chase Bank, N.A. (incorporated herein by reference to Exhibit 4.22 to Altice USA's prospectus report on Form S-1/A (File No. 333-217240), filed on May 16, 2017)
|
||
|
|
|
|
|
Indenture, dated as of April 26, 2016, relating to Altice US Finance I Corporation's 5
1
/
2
% Senior Secured Notes due 2026 (incorporated herein by reference to Exhibit 4.23 to Altice USA's prospectus report on Form S-1/A (File No. 333-217240), filed on May 16, 2017)
|
||
|
|
|
|
|
Notes Pledge and Security Agreement, dated May 20, 2016, by and between Cequel Communications Holdings II, LLC and JPMorgan Chase Bank, N.A. (incorporated herein by reference to Exhibit 4.24 to Altice USA's prospectus report on Form S-1/A (File No. 333-217240), filed on May 16, 2017)
|
||
|
|
|
|
|
Notes Pledge and Security Agreement, dated May 20, 2016, by and among each of the grantors party thereto and JPMorgan Chase Bank, N.A. (incorporated herein by reference to Exhibit 4.25 to Altice USA's prospectus report on Form S-1/A (File No. 333-217240), filed on May 16, 2017)
|
||
|
|
|
|
|
Trademark Security Agreement, dated as of May 20, 2016, by and among the grantors party thereto and JPMorgan Chase Bank, N.A. (incorporated herein by reference to Exhibit 4.26 to Altice USA's prospectus report on Form S-1/A (File No. 333-217240), filed on May 16, 2017)
|
||
|
|
|
|
|
Copyright Security Agreement, dated as of May 20, 2016, by and among the grantors party thereto and JPMorgan Chase Bank, N.A. (incorporated herein by reference to Exhibit 4.27 to Altice USA's prospectus report on Form S-1/A (File No. 333-217240), filed on May 16, 2017)
|
||
|
|
|
|
82
|
Exhibit No.
|
|
Exhibit Description
|
|
Indenture, dated as of October 25, 2012 relating to Cequel Communications Holdings I, LLC's and Cequel Capital Corporation's 6
3
/
8
% Senior Notes due 2020 (incorporated herein by reference to Exhibit 4.28 to Altice USA's prospectus report on Form S-1/A (File No. 333-217240), filed on May 16, 2017)
|
||
|
|
|
|
|
Indenture, dated as of May 16, 2013, relating to Cequel Communications Holdings I, LLC's and Cequel Capital Corporation's 5
1
/
8
% Senior Notes due 2021 (incorporated herein by reference to Exhibit 4.29 to Altice USA's prospectus report on Form S-1/A (File No. 333-217240), filed on May 16, 2017)
|
||
|
|
|
|
|
Indenture, dated as of September 9, 2014, relating to Cequel Communications Holdings I, LLC's and Cequel Capital Corporation's 5
1
/
8
% Senior Notes due 2021 (incorporated herein by reference to Exhibit 4.30 to Altice USA's prospectus report on Form S-1/A (File No. 333-217240), filed on May 16, 2017)
|
||
|
|
|
|
|
Indenture, dated as of June 12, 2015, relating to Cequel Communications Holdings I, LLC's and Cequel Capital Corporation's 7
3
/
4
% Senior Notes due 2025 (incorporated herein by reference to Exhibit 4.31 to Altice USA's prospectus report on Form S-1/A (File No. 333-217240), filed on May 16, 2017)
|
||
|
|
|
|
|
Supplemental Indenture, dated as of December 21, 2015, to the Indenture, dated as of June 12, 2015, relating to Cequel Communications Holdings I, LLC's and Cequel Capital Corporation's 7
3
/
4
% Senior Notes due 2025 (incorporated herein by reference to Exhibit 4.32 to Altice USA's prospectus report on Form S-1/A (File No. 333-217240), filed on May 16, 2017)
|
||
|
|
|
|
|
Indenture, dated as of January 29, 2018, relating to CSC Holdings, LLC's 5.375% Senior Notes due 2028 (incorporated by reference to Exhibit 4.1 of the Company's Current Report on Form 8-K (File No. 001-38126) filed with the Commission on February 2, 2018)
|
||
|
Indenture, dated as of April 5, 2018, relating to Cequel Communications Holdings I, LLC's and Cequel Capital Corporation's 7.500% Senior Notes due 2028 (incorporated by reference to Exhibit 4.1 of the Company's Current Report on Form 8-K (File No. 001-38126) filed with the Commission on April 6, 2018)
|
||
|
Form of Amended and Restated Stockholders and Registration Rights Agreement (incorporated by reference to Exhibit 4.35 of the Company's prospectus report on Form S-1/A (File No. 333-222475), filed on May 21, 2018)
|
||
|
2023 Supplemental Indenture, dated as of October 17, 2018, between Altice US Finance I Corporation, as Issuer and Deutsche Bank Trust Company Americas, as Trustee (incorporated by reference to Exhibit 4.1 of the Company's Current Report on Form 8-K (File No. 001-38126) filed with the Commission on October 19, 2018)
|
||
|
2026 Supplemental Indenture, dated as of October 17, 2018, between Altice US Finance I Corporation, as Issuer and Deutsche Bank Trust Company Americas, as Trustee (incorporated by reference to Exhibit 4.2 of the Company's Current Report on Form 8-K (File No. 001-38126) filed with the Commission on October 19, 2018)
|
||
|
2025 Supplemental Indenture, dated as of October 17, 2018, between Cequel Communications Holdings I, LLC and Cequel Capital Corporation, as Co-Issuers and Deutsche Bank Trust Company Americas, as Trustee (incorporated by reference to Exhibit 4.3 of the Company's Current Report on Form 8-K (File No. 001-38126) filed with the Commission on October 19, 2018)
|
||
|
2028 Supplemental Indenture, dated as of October 17, 2018, between Cequel Communications Holdings I, LLC and Cequel Capital Corporation, as Co-Issuers and Deutsche Bank Trust Company Americas, as Trustee (incorporated by reference to Exhibit 4.4 of the Company's Current Report on Form 8-K (File No. 001-38126) filed with the Commission on October 19, 2018)
|
||
|
|
2023 New Notes Indenture, dated as of October 18, 2018, between,
inter alios
, Altice US Finance I Corporation, as Issuer and Deutsche Bank Trust Company Americas, as Trustee (incorporated by reference to Exhibit 4.5 of the Company's Current Report on Form 8-K (File No. 001-38126) filed with the Commission on October 19, 2018)
|
|
|
2026 New Notes Indenture, dated as of October 18, 2018, between,
inter alios
, Altice US Finance I Corporation, as Issuer and Deutsche Bank Trust Company Americas, as Trustee (incorporated by reference to Exhibit 4.6 of the Company's Current Report on Form 8-K (File No. 001-38126) filed with the Commission on October 19, 2018)
|
||
83
|
Exhibit No.
|
|
Exhibit Description
|
|
2021 May New Notes Indenture, dated as of October 18, 2018, between Cequel Communications Holdings I, LLC and Cequel Capital Corporation, as Co-Issuers and Deutsche Bank Trust Company Americas, as Trustee (incorporated by reference to Exhibit 4.7 of the Company's Current Report on Form 8-K (File No. 001-38126) filed with the Commission on October 19, 2018)
|
||
|
2021 September New Notes Indenture, dated as of October 18, 2018, between Cequel Communications Holdings I, LLC and Cequel Capital Corporation, as Co-Issuers and Deutsche Bank Trust Company Americas, as Trustee (incorporated by reference to Exhibit 4.8 of the Company's Current Report on Form 8-K (File No. 001-38126) filed with the Commission on October 19, 2018)
|
||
|
2025 New Notes Indenture, dated as of October 18, 2018, between Cequel Communications Holdings I, LLC and Cequel Capital Corporation, as Co-Issuers and Deutsche Bank Trust Company Americas, as Trustee (incorporated by reference to Exhibit 4.9 of the Company's Current Report on Form 8-K (File No. 001-38126) filed with the Commission on October 19, 2018)
|
||
|
2028 New Notes Indenture, dated as of October 18, 2018, between Cequel Communications Holdings I, LLC and Cequel Capital Corporation, as Co-Issuers and Deutsche Bank Trust Company Americas, as Trustee (incorporated by reference to Exhibit 4.10 of the Company's Current Report on Form 8-K (File No. 001-38126) filed with the Commission on October 19, 2018)
|
||
|
Senior Guaranteed Notes Indenture, dated as of November 27, 2018, between,
inter alios
, CSC Holdings, LLC, as Issuer and Deutsche Bank Trust Company Americas, as Trustee (incorporated by reference to Exhibit 4.1 of the Company's Current Report on Form 8-K (File No. 001-38126) filed with the Commission on November 28, 2018)
|
||
|
|
Senior Notes Indenture, dated as of November 27, 2018, between,
inter alios
, CSC Holdings, LLC, as Issuer and Deutsche Bank Trust Company Americas, as Trustee (incorporated by reference to Exhibit 4.2 of the Company's Current Report on Form 8-K (File No. 001-38126) filed with the Commission on November 28, 2018)
|
|
|
Supplemental Indenture dated as of November 27, 2018, between,
inter alios
, CSC, as issuer, the guarantors (named therein) and Deutsche Bank Trust Company Americas, as trustee, to the 2015 Senior Guaranteed Notes Indenture (incorporated by reference to Exhibit 4.3 of the Company's Current Report on Form 8-K (File No. 001-38126) filed with the Commission on November 28, 2018)
|
||
|
Supplemental Indenture dated as of November 27, 2018, between,
inter alios
, CSC, as issuer, the guarantors (named therein) and Deutsche Bank Trust Company Americas, as trustee, to the 2016 Senior Guaranteed Notes Indenture (incorporated by reference to Exhibit 4.4 of the Company's Current Report on Form 8-K (File No. 001-38126) filed with the Commission on November 28, 2018)
|
||
|
Supplemental Indenture dated as of November 27, 2018, between,
inter alios
, CSC, as issuer, the guarantors (named therein) and Deutsche Bank Trust Company Americas, as trustee, to the 2018 Senior Guaranteed Notes Indenture (incorporated by reference to Exhibit 4.5 of the Company's Current Report on Form 8-K (File No. 001-38126) filed with the Commission on November 28, 2018)
|
||
|
Joinder Agreement dated as of November 27, 2018, between,
inter alios
, the additional guarantors (named therein) to the Facility Guaranty (incorporated by reference to Exhibit 4.6 of the Company's Current Report on Form 8-K (File No. 001-38126) filed with the Commission on November 28, 2018)
|
||
|
Joinder Agreement dated as of November 27, 2018, between,
inter alios
, the additional pledgors (named therein) to the Pledge Agreement (incorporated by reference to Exhibit 4.7 of the Company's Current Report on Form 8-K (File No. 001-38126) filed with the Commission on November 28, 2018)
|
||
|
Indenture, dated as of January 31, 2019 between CSC Holdings, LLC, as Issuer, and Deutsche Bank Trust Company Americas, as Trustee (incorporated by reference to Exhibit 4.1 of the Company's Current Report on Form 8-K (File No. 001-38126) filed with the Commission on February 5, 2019)
|
||
|
Opinion of Shearman & Sterling LLP (incorporated herein by reference to Exhibit 5.1 to Altice USA's prospectus report on Form S-1/A (File No. 333-222475), filed on May 21, 2018)
|
||
84
|
Exhibit No.
|
|
Exhibit Description
|
|
Credit Agreement, dated as of October 9, 2015, by and among CSC Holdings, LLC (as successor by merger to Neptune Finco Corp.), as borrower, certain lenders party thereto, JPMorgan Chase Bank, N.A., as administrative agent and security agent, Barclays Bank plc and BNP Paribas Securities Corp., as co-syndication agents, Credit Agricole Corporate and Investment Bank, Deutsche Bank Securities Inc., Royal Bank of Canada, Societe Generale, TD Securities (USA) LLC and the Bank of Nova Scotia, as co-documentation agents, and J.P. Morgan Securities LLC, Barclays Bank plc, BNP Paribas Securities Corp., Credit Agricole Corporate and Investment Bank, Deutsche Bank Securities Inc., Royal Bank of Canada, Societe Generale, TD Securities (USA) LLC and The Bank of Nova Scotia, as joint bookrunners and lead arrangers (incorporated herein by reference to Exhibit 10.1 to Altice USA's prospectus report on Form S-1/A (File No. 333-217240), filed on May 16, 2017)
|
||
|
|
|
|
|
First Amendment to Credit Agreement, dated as of June 20, 2016 (incorporated herein by reference to Exhibit 10.2 to Altice USA's prospectus report on Form S-1/A (File No. 333-217240), filed on May 16, 2017)
|
||
|
|
|
|
|
Incremental Loan Assumption Agreement, dated as of June 21, 2016 (incorporated herein by reference to Exhibit 10.3 to Altice USA's prospectus report on Form S-1/A (File No. 333-217240), filed on May 16, 2017)
|
||
|
|
|
|
|
Incremental Loan Assumption Agreement, dated as of July 21, 2016 (incorporated herein by reference to Exhibit 10.4 to Altice USA's prospectus report on Form S-1/A (File No. 333-217240), filed on May 16, 2017)
|
||
|
Second Amendment to Credit Agreement (Extension Amendment), dated as of September 9, 2016 (incorporated herein by reference to Exhibit 10.5 to Altice USA's prospectus report on Form S-1/A (File No. 333-217240), filed on May 16, 2017)
|
||
|
|
|
|
|
Third Amendment to Credit Agreement (Extension Amendment, Incremental Loan Assumption Agreement & Assignment and Acceptance), dated as of December 9, 2016 (incorporated herein by reference to Exhibit 10.6 to Altice USA's prospectus report on Form S-1/A (File No. 333-217240), filed on May 16, 2017)
|
||
|
Fourth Amendment to Credit Agreement (Incremental Loan Assumption Agreement & Refinancing Amendment), dated as of March 15, 2017 (incorporated herein by reference to Exhibit 10.7 to Altice USA's prospectus report on Form S-1/A (File No. 333-217240), filed on May 16, 2017)
|
||
|
Facility Guaranty, dated as of June 21, 2016, by and among the guarantors party thereto and JPMorgan Chase Bank, N.A. (incorporated herein by reference to Exhibit 10.8 to Altice USA's prospectus report on Form S-1/A (File No. 333-217240), filed on May 16, 2017)
|
||
|
Pledge Agreement, dated as of June 21, 2016, by and among CSC Holdings, LLC, certain pledgors party thereto and JPMorgan Chase Bank, N.A. (incorporated herein by reference to Exhibit 10.9 to Altice USA's prospectus report on Form S-1/A (File No. 333-217240), filed on May 16, 2017)
|
||
|
Credit Agreement, dated as of June 12, 2015, by and among Altice US Finance I Corporation, as borrower, certain lenders party thereto, JPMorgan Chase Bank, N.A., as administrative agent and security agent, and J.P. Morgan Securities LLC and BNP Paribas, as joint bookrunners and lead arrangers (incorporated herein by reference to Exhibit 10.10 to Altice USA's prospectus report on Form S-1/A (File No. 333-217240), filed on May 16, 2017)
|
||
|
|
|
|
|
First Amendment to Credit Agreement (Refinancing Amendment), dated as of October 25, 2016 (incorporated herein by reference to Exhibit 10.11 to Altice USA's prospectus report on Form S-1/A (File No. 333-217240), filed on May 16, 2017)
|
||
|
|
|
|
|
Second Amendment to Credit Agreement (Extension Amendment), dated as of December 9, 2016 (incorporated herein by reference to Exhibit 10.12 to Altice USA's prospectus report on Form S-1/A (File No. 333-217240), filed on May 16, 2017)
|
||
|
|
|
|
|
Third Amendment to Credit Agreement (Incremental Loan Assumption Agreement & Refinancing Amendment), dated as of March 15, 2017 (incorporated herein by reference to Exhibit 10.13 to Altice USA's prospectus report on Form S-1/A (File No. 333-217240), filed on May 16, 2017)
|
||
|
|
|
|
85
|
Exhibit No.
|
|
Exhibit Description
|
|
Loans Pledge and Security Agreement, dated as of December 21, 2015, by and between Cequel Communications Holdings II, LLC and JPMorgan Chase Bank, N.A. (incorporated herein by reference to Exhibit 10.14 to Altice USA's prospectus report on Form S-1/A (File No. 333-217240), filed on May 16, 2017)
|
||
|
Loans Pledge and Security Agreement, dated as of December 21, 2015, by and among the grantors party thereto and JPMorgan Chase Bank, N.A. (incorporated herein by reference to Exhibit 10.15 to Altice USA's prospectus report on Form S-1/A (File No. 333-217240), filed on May 16, 2017)
|
||
|
|
|
|
|
Facility Guaranty, dated as of December 21, 2015, by and among the guarantors party thereto and JPMorgan Chase Bank, N.A. (incorporated herein by reference to Exhibit 10.16 to Altice USA's prospectus report on Form S-1/A (File No. 333-217240), filed on May 16, 2017)
|
||
|
|
|
|
|
Trademark Security Agreement, dated as of December 21, 2015, by and among certain grantors thereunder and JPMorgan Chase Bank, N.A. (incorporated herein by reference to Exhibit 10.17 to Altice USA's prospectus report on Form S-1/A (File No. 333-217240), filed on May 16, 2017)
|
||
|
Copyright Security Agreement, dated as of December 21, 2015, by and between Cequel Communications, LLC and JPMorgan Chase Bank, N.A. (incorporated herein by reference to Exhibit 10.18 to Altice USA's prospectus report on Form S-1/A (File No. 333-217240), filed on May 16, 2017)
|
||
|
|
|
|
|
Form of Stockholders' Agreement by and among Altice USA, Inc., Altice N.V. and A4 S.A. (incorporated herein by reference to Exhibit 10.19 to Altice USA's prospectus report on Form S-1/A (File No. 333-217240), filed on June 12, 2017)
|
||
|
|
|
|
|
Altice USA 2017 Long Term Incentive Plan (incorporated by reference to Exhibit 99.1 of the Company's Registration Statement on Form S-8 (File No. 333-222170) filed with the Commission on December 20, 2017)
|
||
|
|
|
|
|
Altice USA Short Term Incentive Compensation Plan (incorporated by reference to Exhibit 10.21 of the Company's Registration Statement on Form S-1 (File No. 333-217240) filed with the Commission on June 12, 2017)
|
||
|
|
|
|
|
Altice USA 2017 Long Term Incentive Plan, Form of Nonqualified Stock Option Award Agreement (incorporated herein by reference to Exhibit 99.1 on Form 8-K (File No. 001-38126), filed on January 3, 2018)
|
||
|
Fifth Amendment to Credit Agreement, dated as of January 12, 2018, by and among the Borrower, the Additional Lenders and Lead Arrangers party thereto and JPMorgan Chase Bank, N.A. as Administrative Agent. (incorporated herein by reference to Exhibit 10.1 on Form 8-K (File No. 001-38126), filed on January 16, 2018)
|
||
|
Fourth Amendment to Credit Agreement (Extension Amendment), dated as of March 22, 2018 (incorporated by reference to Exhibit 10.1 of the Company's Current Report on Form 8-K (File No. 001-38126) filed with the Commission on March 28, 2018)
|
||
|
Master Separation Agreement, dated as of May 18, 2018, by and between Altice USA, Inc. and Altice N.V.(incorporated by reference to Exhibit 10.25 of the Company's prospectus report on Form S-1/A (File No. 333-222475), filed on May 21, 2018)
|
||
|
|
Form of Stockholders' Agreement by and among Altice USA, Inc., Next Alt S.à r.l. and A4 S.A. (incorporated by reference to Exhibit 10.26 of the Company's prospectus report on Form S-1/A (File No. 333-222475), filed on May 21, 2018)
|
|
|
Fourth Amendment to Credit Agreement, dated as of March 22, 2018, by and among the Borrower, each of the other Loan Parties, the Lenders and JPMorgan Chase Bank, N.A. as the Administrative Agent. (incorporated herein by reference to Exhibit 10.1 on Form 8-K (File No. 001-38126), filed on March 28, 2018)
|
||
|
Sixth Amendment, dated as of October 15, 2018, between, inter alios, CSC Holdings, LLC as Borrower, Goldman Sachs Bank USA as Additional Lender and JPMorgan Chase Bank, N.A. as Administrative Agent (incorporated by reference to Exhibit 4.11 of the Company's Current Report on Form 8-K (File No. 001-38126) filed with the Commission on October 19, 2018)
|
||
86
|
Exhibit No.
|
|
Exhibit Description
|
|
Seventh Amendment to Credit Agreement, dated as of January 24, 2019, by and among the Borrower, each of the other Loan Parties, the Lenders and JPMorgan Chase Bank, N.A. as the Administrative Agent (incorporated by reference to Exhibit 4.11 on Form 8-K (File No. 001-38126, filed with the Commission on January 30, 2019)
|
||
|
|
Eighth Amendment to Credit Agreement, dated as of February 7, 2019, by and among the Borrower, each of the other Loan Parties, the February 2019 Incremental Term Loan Lenders party thereto and JPMorgan Chase Bank, N.A. as the Administrative Agent (incorporated by reference to Exhibit 10.1 on Form 8-K (File No. 001-38126, filed with the Commission on February 8, 2019)
|
|
|
Stockholders’ Agreement, dated June 7, 2018, by and among Altice USA, Inc., Next Alt S.à r.l. and A4 S.A. (incorporated by reference to Exhibit 4.11 on Form 8-K (File No. 001-35126, filed with the Commission on June 13, 2018)
|
||
|
Altice USA 2017 Long Term Incentive Plan, as amended (incorporated by reference to Exhibit 99.1 on Form S-8 (File No. 333-228907), filed on December 19, 2018)
|
||
|
21
*
|
List of subsidiaries of the Registrant
|
|
|
23
*
|
Consent of Independent Registered Public Accounting Firm.
|
|
|
31.1
*
|
Section 302 Certification of the CEO.
|
|
|
31.2
*
|
Section 302 Certification of the CFO.
|
|
|
32
*
|
Section 906 Certifications of the CEO and CFO.
|
|
|
101
|
The following financial statements of Altice USA, Inc.as included in the Altice USA Form 10-K for the year ended December 31, 2018, filed with the Securities and Exchange Commission on February 28, 2019 formatted in XBRL (eXtensible Business Reporting Language): (i) the Consolidated Balance Sheets; (ii) the Consolidated Statements of Operations; (iii) the Consolidated Statements of Comprehensive Income (Loss); (iv) the Consolidated Statements of Stockholders' Equity; (v) the Consolidated Statements of Cash Flows; and (vi) the Notes to Consolidated Financial Statements.
|
|
|
+
|
Shares of Class A common stock and Class B common stock of the Company will be distributed in an uncertificated form. Therefore, the Company is not filing specimen Class A common stock or Class B common stock certificates. Reference is made to Exhibits 3.1, 3.2, 3.3 and 3.4 hereto.
|
|
*
|
Filed herewith.
|
87
SIGNATURES
Pursuant to the requirements of the Securities Exchange Act of 1934, as amended, the Registrant has duly caused this report to be signed on its behalf by the undersigned, thereunto duly authorized on the 1st day of March, 2019.
|
|
Altice USA, Inc.
|
|
|
|
|
By:
|
/s/ Charles Stewart
|
|
Name:
|
Charles Stewart
|
|
Title:
|
Co-President, Chief Financial Officer and Director
|
POWER OF ATTORNEY
KNOW ALL MEN BY THESE PRESENTS, that each person whose signature appears below constitutes and appoints Charles Stewart and David Connolly, and each of them, his true and lawful attorneys-in-fact and agents, with full power of substitution and resubstitution, for him in his name, place and stead, in any and all capacities, to sign this report, and file the same, with all exhibits thereto, and other documents in connection therewith, with the Securities and Exchange Commission, granting unto said attorneys-in-fact and agents, full power and authority to do and perform each and every act and thing requisite and necessary to be done as fully to all intents and purposes as he might or could do in person, hereby ratifying and confirming all that said attorneys-in-fact and agents or any of them may lawfully do or cause to be done by virtue hereof.
Pursuant to the requirements of the Securities Exchange Act of 1934, as amended, this report has been signed below by the following persons in the capacities and on the dates indicated on behalf of the Registrant.
|
Signature
|
Title
|
Date
|
||
|
/s/ Dexter Goei
|
Chief Executive Officer and Director
|
March 1, 2019
|
||
|
Dexter Goei
|
(Principal Executive Officer)
|
|||
|
|
|
|
||
|
/s/ Charles Stewart
|
Co-President, Chief Financial Officer and Director
|
March 1, 2019
|
||
|
Charles Stewart
|
(Principal Financial Officer)
|
|||
|
|
|
|
||
|
/s/ Layth Taki
|
Senior Vice President and Chief Accounting Officer
|
March 1, 2019
|
||
|
Layth Taki
|
(Principal Accounting Officer)
|
|||
|
/s/ Patrick Drahi
|
Chairman and Director
|
March 1, 2019
|
||
|
Patrick Drahi
|
||||
|
/s/ Gerrit Jan Bakker
|
Director
|
March 1, 2019
|
||
|
Gerrit Jan Bakker
|
||||
|
/s/ Manon Brouillette
|
Director
|
March 1, 2019
|
||
|
Manon Brouillette
|
||||
|
/s/ David Drahi
|
Director
|
March 1, 2019
|
||
|
David Drahi
|
||||
|
|
|
|
||
|
/s/ Mark Mullen
|
Director
|
March 1, 2019
|
||
|
Mark Mullen
|
||||
|
|
|
|
||
|
/s/ Dennis Okhuijsen
|
Director
|
March 1, 2019
|
||
|
Dennis Okhuijsen
|
||||
|
|
|
|
||
|
/s/ Raymond Svider
|
Director
|
March 1, 2019
|
||
|
Raymond Svider
|
||||
88
INDEX TO FINANCIAL STATEMENTS
|
Page
|
||
|
ALTICE USA, INC. AND SUBSIDIARIES
|
||
|
Reports of Independent Registered Public Accounting Firm
|
||
|
Consolidated Financial Statements
|
||
|
Consolidated Balance Sheets - December 31, 2018 and 2017
|
||
|
Consolidated Statements of Operations - years ended December 31, 2018, 2017 and 2016
|
||
|
Consolidated Statements of Comprehensive Income (Loss) - years ended December 31, 2018, 2017 and 2016
|
||
|
Consolidated Statements of Stockholders' Equity - years ended December 31, 2018, 2017 and 2016
|
||
|
Consolidated Statements of Cash Flows - years ended December 31, 2018, 2017 and 2016
|
||
|
Notes to Consolidated Financial Statements
|
||
|
CABLEVISION SYSTEMS CORPORATION
|
||
|
Report of Independent Registered Public Accounting Firm
|
||
|
Consolidated Financial Statements
|
||
|
|
Consolidated Balance Sheet-December 31, 2015
|
|
|
|
Consolidated Statements of Operations-period ended January 1, 2016 to June 20, 2016 and year ended December 31, 2015
|
|
|
|
Consolidated Statements of Comprehensive Income-period ended January 1, 2016 to June 20, 2016 and year ended December 31, 2015
|
|
|
|
Consolidated Statements of Stockholders’ Deficiency-period ended January 1, 2016 to June 20, 2016 and year ended December 31, 2015
|
|
|
|
Consolidated Statements of Cash Flows-period ended January 1, 2016 to June 20, 2016 and year ended December 31, 2015
|
|
|
Notes to Consolidated Financial Statements
|
||
F-1
Report of Independent Registered Public Accounting Firm
To the Stockholders and Board of Directors
Altice USA, Inc.:
Opinion on Internal Control Over Financial Reporting
We have audited Altice USA, Inc. and subsidiaries’ (the Company) internal control over financial reporting as of December 31, 2018, based on criteria established in Internal Control - Integrated Framework (2013) issued by the Committee of Sponsoring Organizations of the Treadway Commission. In our opinion, the Company maintained, in all material respects, effective internal control over financial reporting as of December 31, 2018, based on criteria established in Internal Control - Integrated Framework (2013) issued by the Committee of Sponsoring Organizations of the Treadway Commission.
We also have audited, in accordance with the standards of the Public Company Accounting Oversight Board (United States) (PCAOB), the consolidated balance sheets of the Company as of December 31, 2018 and 2017, the related consolidated statements of operations, comprehensive income (loss), stockholders’ equity, and cash flows for each of the years in the three-year period ended December 31, 2018, and the related notes (collectively, the consolidated financial statements), and our report dated March 1, 2019 expressed an unqualified opinion on those consolidated financial statements.
Basis for Opinion
The Company’s management is responsible for maintaining effective internal control over financial reporting and for its assessment of the effectiveness of internal control over financial reporting, included in the accompanying Form 10-K. Our responsibility is to express an opinion on the Company’s internal control over financial reporting based on our audit. We are a public accounting firm registered with the PCAOB and are required to be independent with respect to the Company in accordance with the U.S. federal securities laws and the applicable rules and regulations of the Securities and Exchange Commission and the PCAOB.
We conducted our audit in accordance with the standards of the PCAOB. Those standards require that we plan and perform the audit to obtain reasonable assurance about whether effective internal control over financial reporting was maintained in all material respects. Our audit of internal control over financial reporting included obtaining an understanding of internal control over financial reporting, assessing the risk that a material weakness exists, and testing and evaluating the design and operating effectiveness of internal control based on the assessed risk. Our audit also included performing such other procedures as we considered necessary in the circumstances. We believe that our audit provides a reasonable basis for our opinion.
Definition and Limitations of Internal Control Over Financial Reporting
A company’s internal control over financial reporting is a process designed to provide reasonable assurance regarding the reliability of financial reporting and the preparation of financial statements for external purposes in accordance with generally accepted accounting principles. A company’s internal control over financial reporting includes those policies and procedures that (1) pertain to the maintenance of records that, in reasonable detail, accurately and fairly reflect the transactions and dispositions of the assets of the company; (2) provide reasonable assurance that transactions are recorded as necessary to permit preparation of financial statements in accordance with generally accepted accounting principles, and that receipts and expenditures of the company are being made only in accordance with authorizations of management and directors of the company; and (3) provide reasonable assurance regarding prevention or timely detection of unauthorized acquisition, use, or disposition of the company’s assets that could have a material effect on the financial statements.
Because of its inherent limitations, internal control over financial reporting may not prevent or detect misstatements. Also, projections of any evaluation of effectiveness to future periods are subject to the risk that controls may become inadequate because of changes in conditions, or that the degree of compliance with the policies or procedures may deteriorate.
/s/ KPMG LLP
New York, NY
March 1, 2019
F-2
Report of Independent Registered Public Accounting Firm
To the Stockholders and Board of Directors
Altice USA, Inc.:
Opinion on the consolidated Financial Statements
We have audited the accompanying consolidated balance sheets of Altice USA, Inc. and subsidiaries (the Company) as of December 31, 2018 and 2017, the related consolidated statements of operations, comprehensive income (loss), stockholders’ equity, and cash flows for each of the years in the three-year period ended December 31, 2018, and the related notes (collectively, the consolidated financial statements). In our opinion, the consolidated financial statements present fairly, in all material respects, the financial position of the Company as of December 31, 2018 and 2017, and the results of its operations and its cash flows for each of the years in the three-year period ended December 31, 2018, in conformity with U.S. generally accepted accounting principles.
We also have audited, in accordance with the standards of the Public Company Accounting Oversight Board (United States) (PCAOB), the Company’s internal control over financial reporting as of December 31, 2018, based on criteria established in
Internal Control - Integrated Framework (2013)
issued by the Committee of Sponsoring Organizations of the Treadway Commission, and our report dated March 1, 2019 expressed an unqualified opinion on the effectiveness of the Company’s internal control over financial reporting.
Company Formation, Altice Technical Services (ATS) Acquisition and Change in Accounting Policies
- The Company was incorporated on September 14, 2015 and had no operations of its own other than the issuance of debt prior to the contribution of Cequel Corporation on June 9, 2016 by Altice Europe N.V. (formerly Altice N.V.). The results of operations of Cequel Corporation for the year ended December 31, 2016 have been included in the results of operations of the Company for the same period as Cequel Corporation was under common control with the Company throughout 2016.
- As discussed in Notes 1 and 4 to the consolidated financial statements, a substantial portion of the Company’s technical workforce at the Cablevision and Cequel segments became employees of ATS in the second and fourth quarters of 2017, respectively. Subsequent to December 31, 2017 the Company acquired 100% of ATS. As a result of the acquisition of ATS, an entity under common control, the Company has retroactively consolidated the results of operations and related assets and liabilities of ATS for all periods ATS was under common control.
- As discussed in Notes 3 and 4 to the consolidated financial statements, the Company adopted ASC 606 - Revenue from Contracts with Customers and ASU No. 2017-07 Compensation - Retirement Benefits (Topic 715).
Basis for Opinion
These consolidated financial statements are the responsibility of the Company’s management. Our responsibility is to express an opinion on these consolidated financial statements based on our audits. We are a public accounting firm registered with the PCAOB and are required to be independent with respect to the Company in accordance with the U.S. federal securities laws and the applicable rules and regulations of the Securities and Exchange Commission and the PCAOB.
We conducted our audits in accordance with the standards of the PCAOB. Those standards require that we plan and perform the audit to obtain reasonable assurance about whether the consolidated financial statements are free of material misstatement, whether due to error or fraud. Our audits included performing procedures to assess the risks of material misstatement of the consolidated financial statements, whether due to error or fraud, and performing procedures that respond to those risks. Such procedures included examining, on a test basis, evidence regarding the amounts and disclosures in the consolidated financial statements. Our audits also included evaluating the accounting principles used and significant estimates made by management, as well as evaluating the overall presentation of the consolidated financial statements. We believe that our audits provide a reasonable basis for our opinion.
/s/ KPMG LLP
We have served as the Company’s auditor since 2016.
New York, NY
March 1, 2019
F-3
|
ALTICE USA, INC. AND SUBSIDIARIES
CONSOLIDATED BALANCE SHEETS
December 31, 2018 and 2017
(In thousands)
|
|||||||
|
|
|||||||
|
ASSETS
|
|||||||
|
December 31, 2018
|
December 31, 2017
|
||||||
|
Current Assets:
|
|||||||
|
Cash and cash equivalents
|
$
|
298,781
|
|
$
|
329,848
|
|
|
|
Restricted cash
|
257
|
|
252
|
|
|||
|
Accounts receivable, trade (less allowance for doubtful accounts of $13,520 and $13,420)
|
448,399
|
|
370,765
|
|
|||
|
Prepaid expenses and other current assets
|
136,285
|
|
130,425
|
|
|||
|
Amounts due from affiliates
|
17,557
|
|
19,764
|
|
|||
|
Derivative contracts
|
1,975
|
|
52,545
|
|
|||
|
Total current assets
|
903,254
|
|
903,599
|
|
|||
|
Property, plant and equipment, net of accumulated depreciation of $4,044,671 and $2,599,579
|
5,828,881
|
|
6,023,826
|
|
|||
|
Investment securities pledged as collateral
|
1,462,626
|
|
1,720,357
|
|
|||
|
Derivative contracts
|
109,344
|
|
—
|
|
|||
|
Other assets
|
84,382
|
|
57,904
|
|
|||
|
Amortizable intangibles, net of accumulated amortization of $2,882,787 and $2,008,573
|
4,192,824
|
|
5,066,454
|
|
|||
|
Indefinite-lived cable television franchises
|
13,020,081
|
|
13,020,081
|
|
|||
|
Goodwill
|
8,012,416
|
|
8,019,861
|
|
|||
|
Total assets
|
$
|
33,613,808
|
|
$
|
34,812,082
|
|
|
See accompanying notes to consolidated financial statements.
F-4
|
ALTICE USA, INC. AND SUBSIDIARIES
CONSOLIDATED BALANCE SHEETS (continued)
December 31, 2018 and 2017
(In thousands, except share and per share amounts)
|
|||||||
|
LIABILITIES AND STOCKHOLDERS' EQUITY
|
December 31, 2018
|
December 31, 2017
|
|||||
|
Current Liabilities:
|
|||||||
|
Accounts payable
|
$
|
857,502
|
|
$
|
795,128
|
|
|
|
Accrued liabilities:
|
|
|
|||||
|
Interest
|
386,475
|
|
397,422
|
|
|||
|
Employee related costs
|
139,806
|
|
147,727
|
|
|||
|
Other accrued expenses
|
312,564
|
|
411,988
|
|
|||
|
Amounts due to affiliates
|
26,096
|
|
10,998
|
|
|||
|
Deferred revenue
|
140,053
|
|
111,197
|
|
|||
|
Liabilities under derivative contracts
|
70
|
|
52,545
|
|
|||
|
Credit facility debt
|
54,563
|
|
42,650
|
|
|||
|
Senior guaranteed notes and senior notes and debentures
|
—
|
|
507,744
|
|
|||
|
Capital lease obligations
|
5,928
|
|
9,539
|
|
|||
|
Notes payable
|
98,134
|
|
33,424
|
|
|||
|
Total current liabilities
|
2,021,191
|
|
2,520,362
|
|
|||
|
Defined benefit plan obligations
|
96,794
|
|
103,163
|
|
|||
|
Other liabilities
|
174,760
|
|
144,289
|
|
|||
|
Deferred tax liability
|
4,723,937
|
|
4,769,286
|
|
|||
|
Liabilities under derivative contracts
|
132,908
|
|
187,406
|
|
|||
|
Collateralized indebtedness
|
1,406,182
|
|
1,349,474
|
|
|||
|
Credit facility debt
|
5,860,996
|
|
4,600,873
|
|
|||
|
Senior guaranteed notes and senior notes and debentures
|
15,359,561
|
|
15,352,688
|
|
|||
|
Capital lease obligations
|
19,262
|
|
12,441
|
|
|||
|
Notes payable
|
7,974
|
|
32,478
|
|
|||
|
Deficit investments in affiliates
|
—
|
|
3,579
|
|
|||
|
Total liabilities
|
29,803,565
|
|
29,076,039
|
|
|||
|
Commitments and contingencies (Note 17)
|
|
|
|
|
|||
|
Redeemable equity
|
130,007
|
|
231,290
|
|
|||
|
Stockholders' Equity:
|
|||||||
|
Preferred stock, $.01 par value, 100,000,000 shares authorized, no shares issued and outstanding
|
—
|
|
—
|
|
|||
|
Class A common stock: $0.01 par value, 4,000,000,000 shares authorized, 496,064,027 and 246,982,292 issued and outstanding
|
4,961
|
|
2,470
|
|
|||
|
Class B common stock: $0.01 par value, 1,000,000,000 shares authorized, 490,086,674 issued and 212,976,259 and 490,086,674 outstanding
|
2,130
|
|
4,901
|
|
|||
|
Class C common stock: $0.01 par value, 4,000,000,000 shares authorized, no shares issued and outstanding
|
—
|
|
—
|
|
|||
|
Paid-in capital
|
3,423,803
|
|
4,665,229
|
|
|||
|
Retained earnings
|
251,830
|
|
840,636
|
|
|||
|
3,682,724
|
|
5,513,236
|
|
||||
|
Accumulated other comprehensive loss
|
(11,783
|
)
|
(10,022
|
)
|
|||
|
Total stockholders' equity
|
3,670,941
|
|
5,503,214
|
|
|||
|
Noncontrolling interest
|
9,295
|
|
1,539
|
|
|||
|
Total stockholders' equity
|
3,680,236
|
|
5,504,753
|
|
|||
|
|
$
|
33,613,808
|
|
$
|
34,812,082
|
|
|
F-5
|
ALTICE USA, INC. AND SUBSIDIARIES
CONSOLIDATED STATEMENTS OF OPERATIONS
Years ended December 31, 2018, 2017 and 2016
(In thousands, except per share amounts)
|
|||||||||||
|
2018
|
2017
|
2016
|
|||||||||
|
Revenue (including revenue from affiliates of $2,575, $1,100 and $1,086 respectively) (See Note 16)
|
$
|
9,566,608
|
|
$
|
9,306,950
|
|
$
|
6,017,212
|
|
||
|
Operating expenses:
|
|||||||||||
|
Programming and other direct costs (including charges from affiliates of $7,261, $4,176 and $1,947 respectively) (See Note 16)
|
3,173,076
|
|
3,035,655
|
|
1,911,230
|
|
|||||
|
Other operating expenses (including charges from affiliates of $16,307, $33,140 and $18,854 respectively) (See Note 16)
|
2,290,266
|
|
2,347,315
|
|
1,702,472
|
|
|||||
|
Restructuring and other expense
|
38,548
|
|
152,401
|
|
240,395
|
|
|||||
|
Depreciation and amortization (including impairments)
|
2,382,339
|
|
2,930,571
|
|
1,700,306
|
|
|||||
|
|
7,884,229
|
|
8,465,942
|
|
5,554,403
|
|
|||||
|
Operating income
|
1,682,379
|
|
841,008
|
|
462,809
|
|
|||||
|
Other income (expense):
|
|||||||||||
|
Interest expense (including interest expense to affiliates and related parties of $600, $90,405 and $112,712, respectively) (See Note 16)
|
(1,556,282
|
)
|
(1,603,132
|
)
|
(1,456,541
|
)
|
|||||
|
Interest income
|
10,856
|
|
1,921
|
|
13,811
|
|
|||||
|
Gain (loss) on investments and sale of affiliate interests, net
|
(250,877
|
)
|
237,354
|
|
142,102
|
|
|||||
|
Gain (loss) on derivative contracts, net
|
218,848
|
|
(236,330
|
)
|
(53,696
|
)
|
|||||
|
Gain (loss) on interest rate swap contracts
|
(61,697
|
)
|
5,482
|
|
(72,961
|
)
|
|||||
|
Loss on extinguishment of debt and write-off of deferred financing costs (including $513,723 related to affiliates and related parties in 2017) (See Note 16)
|
(48,804
|
)
|
(600,240
|
)
|
(127,649
|
)
|
|||||
|
Other income (expense), net
|
(12,484
|
)
|
(13,651
|
)
|
980
|
|
|||||
|
(1,700,440
|
)
|
(2,208,596
|
)
|
(1,553,954
|
)
|
||||||
|
Loss before income taxes
|
(18,061
|
)
|
(1,367,588
|
)
|
(1,091,145
|
)
|
|||||
|
Income tax benefit
|
38,655
|
|
2,862,352
|
|
259,666
|
|
|||||
|
Net income (loss)
|
20,594
|
|
1,494,764
|
|
(831,479
|
)
|
|||||
|
Net income attributable to noncontrolling interests
|
(1,761
|
)
|
(1,587
|
)
|
(551
|
)
|
|||||
|
Net income (loss) attributable to Altice USA, Inc. stockholders
|
$
|
18,833
|
|
$
|
1,493,177
|
|
$
|
(832,030
|
)
|
||
|
Income (loss) per share:
|
|||||||||||
|
Basic and diluted income (loss) per share:
|
$
|
0.03
|
|
$
|
2.15
|
|
$
|
(1.28
|
)
|
||
|
Basic and diluted weighted average common shares (in thousands)
|
730,088
|
|
696,055
|
|
649,525
|
|
|||||
|
Cash dividends declared per common share
|
$
|
2.035
|
|
$
|
1.29
|
|
$
|
0.69
|
|
||
See accompanying notes to consolidated financial statements.
F-6
|
ALTICE USA, INC. AND SUBSIDIARIES
CONSOLIDATED STATEMENTS OF COMPREHENSIVE INCOME (LOSS)
Years ended December 31, 2018, 2017 and 2016
(In thousands)
|
|||||||||||
|
2018
|
2017
|
2016
|
|||||||||
|
Net income (loss)
|
$
|
20,594
|
|
$
|
1,494,764
|
|
$
|
(831,479
|
)
|
||
|
Other comprehensive income (loss):
|
|||||||||||
|
Defined benefit pension plans:
|
|||||||||||
|
Unrecognized actuarial gain (loss)
|
830
|
|
(18,632
|
)
|
3,452
|
|
|||||
|
Applicable income taxes
|
(220
|
)
|
7,441
|
|
(1,381
|
)
|
|||||
|
Unrecognized gain (loss) arising during period, net of income taxes
|
610
|
|
(11,191
|
)
|
2,071
|
|
|||||
|
Settlement loss included in other expense, net
|
1,268
|
|
1,845
|
|
(154
|
)
|
|||||
|
Applicable income taxes
|
(342
|
)
|
(738
|
)
|
62
|
|
|||||
|
Settlement loss included in other expense, net, net of income taxes
|
926
|
|
1,107
|
|
(92
|
)
|
|||||
|
Curtailment loss
|
—
|
|
(3,195
|
)
|
—
|
|
|||||
|
Applicable income taxes
|
—
|
|
1,278
|
|
—
|
|
|||||
|
Curtailment loss, net of income taxes
|
—
|
|
(1,917
|
)
|
—
|
|
|||||
|
Foreign currency translation adjustment
|
967
|
|
—
|
|
—
|
|
|||||
|
Applicable income taxes
|
(261
|
)
|
—
|
|
—
|
|
|||||
|
Foreign currency translation adjustment, net
|
706
|
|
—
|
|
—
|
|
|||||
|
Other comprehensive gain (loss)
|
2,242
|
|
(12,001
|
)
|
1,979
|
|
|||||
|
Comprehensive income (loss)
|
22,836
|
|
1,482,763
|
|
(829,500
|
)
|
|||||
|
Comprehensive income attributable to noncontrolling interests
|
(1,761
|
)
|
(1,587
|
)
|
(551
|
)
|
|||||
|
Comprehensive income (loss) attributable to Altice USA, Inc. stockholders
|
$
|
21,075
|
|
$
|
1,481,176
|
|
$
|
(830,051
|
)
|
||
See accompanying notes to consolidated financial statements.
F-7
|
ALTICE USA, INC. AND SUBSIDIARIES
CONSOLIDATED STATEMENTS OF STOCKHOLDERS' EQUITY
Years ended December 31, 2018, 2017 and 2016
(In thousands)
|
|||||||||||||||||||||||||||
|
Class A
Common
Stock
|
Paid-in
Capital
|
Accumulated
Deficit
|
Accumulated
Other
Comprehensive
Income
|
Total
Stockholders'
Equity
|
Non-controlling
Interest
|
Total
Equity
|
|||||||||||||||||||||
|
Balance at January 1, 2016
|
$
|
—
|
|
$
|
2,252,028
|
|
$
|
(143,948
|
)
|
$
|
—
|
|
$
|
2,108,080
|
|
$
|
—
|
|
$
|
2,108,080
|
|
||||||
|
Impact of change in accounting policy in connection with the adoption of ASU No. 2014-09
|
—
|
|
—
|
|
12,666
|
|
—
|
|
12,666
|
|
—
|
|
12,666
|
|
|||||||||||||
|
Balance at January 1, 2016, as adjusted
|
—
|
|
2,252,028
|
|
(131,282
|
)
|
—
|
|
2,120,746
|
|
—
|
|
2,120,746
|
|
|||||||||||||
|
Net loss attributable to stockholders
|
—
|
|
—
|
|
(832,030
|
)
|
—
|
|
(832,030
|
)
|
—
|
|
(832,030
|
)
|
|||||||||||||
|
Noncontrolling interests acquired
|
—
|
|
—
|
|
—
|
|
—
|
|
—
|
|
(264
|
)
|
(264
|
)
|
|||||||||||||
|
Net income attributable to noncontrolling interests
|
—
|
|
—
|
|
—
|
|
—
|
|
—
|
|
551
|
|
551
|
|
|||||||||||||
|
Pension liability adjustments, net of income taxes
|
—
|
|
—
|
|
—
|
|
1,979
|
|
1,979
|
|
—
|
|
1,979
|
|
|||||||||||||
|
Share-based compensation expense
|
—
|
|
14,368
|
|
—
|
|
—
|
|
14,368
|
|
—
|
|
14,368
|
|
|||||||||||||
|
Change in fair value of redeemable equity
|
—
|
|
(68,148
|
)
|
—
|
|
—
|
|
(68,148
|
)
|
—
|
|
(68,148
|
)
|
|||||||||||||
|
Contributions from stockholders
|
—
|
|
1,246,499
|
|
—
|
|
—
|
|
1,246,499
|
|
—
|
|
1,246,499
|
|
|||||||||||||
|
Distributions to stockholders
|
—
|
|
(445,176
|
)
|
—
|
|
—
|
|
(445,176
|
)
|
—
|
|
(445,176
|
)
|
|||||||||||||
|
Excess tax benefit on share-based awards
|
—
|
|
31
|
|
—
|
|
—
|
|
31
|
|
—
|
|
31
|
|
|||||||||||||
|
Tax impact related to the Newsday Holdings, LLC transactions
|
—
|
|
3,952
|
|
—
|
|
—
|
|
3,952
|
|
—
|
|
3,952
|
|
|||||||||||||
|
Balance at December 31, 2016
|
$
|
—
|
|
$
|
3,003,554
|
|
$
|
(963,312
|
)
|
$
|
1,979
|
|
$
|
2,042,221
|
|
$
|
287
|
|
$
|
2,042,508
|
|
||||||
See accompanying notes to consolidated financial statements.
F-8
|
ALTICE USA, INC. AND SUBSIDIARIES
CONSOLIDATED STATEMENT OF STOCKHOLDERS' EQUITY (continued)
Years ended December 31, 2018, 2017 and 2016
(In thousands)
|
|||||||||||||||||||||||||||||||
|
Class A
Common
Stock
|
Class B
Common
Stock
|
Paid-in
Capital
|
Retained Earnings (Accumulated
Deficit)
|
Accumulated
Other
Comprehensive
Income (Loss)
|
Total
Stockholders'
Equity
|
Non-controlling
Interest
|
Total
Equity
|
||||||||||||||||||||||||
|
Balance at January 1, 2017
|
$
|
—
|
|
$
|
—
|
|
$
|
3,003,554
|
|
$
|
(963,312
|
)
|
$
|
1,979
|
|
$
|
2,042,221
|
|
$
|
287
|
|
$
|
2,042,508
|
|
|||||||
|
Net income attributable to stockholders
|
—
|
|
—
|
|
—
|
|
1,493,177
|
|
—
|
|
1,493,177
|
|
—
|
|
1,493,177
|
|
|||||||||||||||
|
Net income attributable to noncontrolling interests
|
—
|
|
—
|
|
—
|
|
—
|
|
—
|
|
—
|
|
1,587
|
|
1,587
|
|
|||||||||||||||
|
Pension liability adjustments, net of income taxes
|
—
|
|
—
|
|
—
|
|
—
|
|
(12,001
|
)
|
(12,001
|
)
|
—
|
|
(12,001
|
)
|
|||||||||||||||
|
Share-based compensation expense
|
—
|
|
—
|
|
57,430
|
|
—
|
|
—
|
|
57,430
|
|
—
|
|
57,430
|
|
|||||||||||||||
|
Change in redeemable equity
|
—
|
|
—
|
|
(163,142
|
)
|
—
|
|
—
|
|
(163,142
|
)
|
—
|
|
(163,142
|
)
|
|||||||||||||||
|
Contributions from stockholders
|
—
|
|
—
|
|
51,135
|
|
—
|
|
—
|
|
51,135
|
|
—
|
|
51,135
|
|
|||||||||||||||
|
Receivable from parent
|
—
|
|
—
|
|
(50,000
|
)
|
—
|
|
—
|
|
(50,000
|
)
|
—
|
|
(50,000
|
)
|
|||||||||||||||
|
Distributions to stockholders/non-controlling interest
|
—
|
|
—
|
|
(839,700
|
)
|
—
|
|
—
|
|
(839,700
|
)
|
(335
|
)
|
(840,035
|
)
|
|||||||||||||||
|
Recognition of previously unrealized excess tax benefits related to share-based awards in connection with the adoption of ASU 2016-09
|
—
|
|
—
|
|
—
|
|
310,771
|
|
—
|
|
310,771
|
|
—
|
|
310,771
|
|
|||||||||||||||
|
Issuance of common stock pursuant to organizational transactions prior to IPO
|
2,349
|
|
4,901
|
|
2,257,002
|
|
—
|
|
—
|
|
2,264,252
|
|
—
|
|
2,264,252
|
|
|||||||||||||||
|
Issuance of common stock pursuant to IPO
|
121
|
|
—
|
|
348,950
|
|
—
|
|
—
|
|
349,071
|
|
—
|
|
349,071
|
|
|||||||||||||||
|
Balance at December 31, 2017
|
$
|
2,470
|
|
$
|
4,901
|
|
$
|
4,665,229
|
|
$
|
840,636
|
|
$
|
(10,022
|
)
|
$
|
5,503,214
|
|
$
|
1,539
|
|
$
|
5,504,753
|
|
|||||||
See accompanying notes to consolidated financial statements.
F-9
|
ALTICE USA, INC. AND SUBSIDIARIES
CONSOLIDATED STATEMENT OF STOCKHOLDERS' EQUITY (continued)
Years ended December 31, 2018, 2017 and 2016
(In thousands)
|
|||||||||||||||||||||||||||||||
|
Class A
Common
Stock
|
Class B
Common
Stock
|
Paid-in
Capital
|
Retained Earnings (Accumulated
Deficit)
|
Accumulated
Other
Comprehensive
Income (Loss)
|
Total
Stockholders'
Equity
|
Non-controlling
Interest
|
Total
Equity
|
||||||||||||||||||||||||
|
Balance at January 1, 2018
|
$
|
2,470
|
|
$
|
4,901
|
|
$
|
4,665,229
|
|
$
|
840,636
|
|
$
|
(10,022
|
)
|
$
|
5,503,214
|
|
$
|
1,539
|
|
$
|
5,504,753
|
|
|||||||
|
Net income attributable to stockholders
|
—
|
|
—
|
|
—
|
|
18,833
|
|
—
|
|
18,833
|
|
—
|
|
18,833
|
|
|||||||||||||||
|
Net income attributable to noncontrolling interests
|
—
|
|
—
|
|
—
|
|
—
|
|
—
|
|
—
|
|
1,761
|
|
1,761
|
|
|||||||||||||||
|
Contributions from noncontrolling interests
|
—
|
|
—
|
|
—
|
|
—
|
|
—
|
|
—
|
|
5,995
|
|
5,995
|
|
|||||||||||||||
|
Pension liability adjustments, net of income taxes
|
—
|
|
—
|
|
—
|
|
—
|
|
1,536
|
|
1,536
|
|
—
|
|
1,536
|
|
|||||||||||||||
|
Foreign currency translation adjustment, net of income taxes
|
—
|
|
—
|
|
—
|
|
—
|
|
706
|
|
706
|
|
—
|
|
706
|
|
|||||||||||||||
|
Share-based compensation expense
|
—
|
|
—
|
|
59,812
|
|
—
|
|
—
|
|
59,812
|
|
—
|
|
59,812
|
|
|||||||||||||||
|
Redeemable equity vested
|
—
|
|
—
|
|
169,452
|
|
—
|
|
—
|
|
169,452
|
|
—
|
|
169,452
|
|
|||||||||||||||
|
Change in redeemable equity
|
—
|
|
—
|
|
(68,169
|
)
|
—
|
|
—
|
|
(68,169
|
)
|
—
|
|
(68,169
|
)
|
|||||||||||||||
|
Dividend payment
|
—
|
|
—
|
|
(963,711
|
)
|
(536,224
|
)
|
—
|
|
(1,499,935
|
)
|
—
|
|
(1,499,935
|
)
|
|||||||||||||||
|
Class A shares acquired through share repurchase program and retired
|
(280
|
)
|
—
|
|
(499,720
|
)
|
—
|
|
—
|
|
(500,000
|
)
|
—
|
|
(500,000
|
)
|
|||||||||||||||
|
Conversion of Class B to Class A shares, including $2,424 in connection with the Distribution
|
2,771
|
|
(2,771
|
)
|
—
|
|
—
|
|
—
|
|
—
|
|
—
|
|
—
|
|
|||||||||||||||
|
Impact of i24 Acquisition
|
—
|
|
—
|
|
61,769
|
|
(73,578
|
)
|
(1,840
|
)
|
(13,649
|
)
|
—
|
|
(13,649
|
)
|
|||||||||||||||
|
Other changes to equity
|
—
|
|
—
|
|
(859
|
)
|
—
|
|
—
|
|
(859
|
)
|
—
|
|
(859
|
)
|
|||||||||||||||
|
Adoption of ASU No. 2018-02
|
—
|
|
—
|
|
—
|
|
2,163
|
|
(2,163
|
)
|
—
|
|
—
|
|
—
|
|
|||||||||||||||
|
Balance at December 31, 2018
|
$
|
4,961
|
|
$
|
2,130
|
|
$
|
3,423,803
|
|
$
|
251,830
|
|
$
|
(11,783
|
)
|
$
|
3,670,941
|
|
$
|
9,295
|
|
$
|
3,680,236
|
|
|||||||
See accompanying notes to consolidated financial statements.
F-10
|
ALTICE USA, INC. AND SUBSIDIARIES
CONSOLIDATED STATEMENTS OF CASH FLOWS
Years ended December 31, 2018, 2017 and 2016
(In thousands)
|
|||||||||||
|
|
2018
|
2017
|
2016
|
||||||||
|
Cash flows from operating activities:
|
|||||||||||
|
Net income (loss)
|
$
|
20,594
|
|
$
|
1,494,764
|
|
$
|
(831,479
|
)
|
||
|
Adjustments to reconcile net income (loss) to net cash provided by operating activities:
|
|||||||||||
|
Depreciation and amortization (including impairments)
|
2,382,339
|
|
2,930,571
|
|
1,700,306
|
|
|||||
|
Impairment of assets included in restructuring charges
|
—
|
|
—
|
|
2,445
|
|
|||||
|
Equity in net loss of affiliates
|
10,849
|
|
10,040
|
|
1,132
|
|
|||||
|
Loss (gain) on investments and sale of affiliate interests, net
|
250,877
|
|
(237,354
|
)
|
(142,102
|
)
|
|||||
|
Loss (gain) on derivative contracts, net
|
(218,848
|
)
|
236,330
|
|
53,696
|
|
|||||
|
Loss on extinguishment of debt and write-off of deferred financing costs
|
48,804
|
|
600,240
|
|
127,649
|
|
|||||
|
Amortization of deferred financing costs and discounts (premiums) on indebtedness
|
85,121
|
|
31,046
|
|
27,799
|
|
|||||
|
Settlement loss related to pension plan
|
1,268
|
|
1,845
|
|
3,298
|
|
|||||
|
Share-based compensation expense
|
59,812
|
|
57,430
|
|
14,368
|
|
|||||
|
Deferred income taxes
|
(67,603
|
)
|
(2,880,154
|
)
|
(263,989
|
)
|
|||||
|
Excess tax benefit on share-based awards
|
—
|
|
—
|
|
(31
|
)
|
|||||
|
Provision for doubtful accounts
|
71,426
|
|
74,183
|
|
53,249
|
|
|||||
|
Change in assets and liabilities, net of effects of acquisitions and dispositions:
|
|||||||||||
|
Accounts receivable, trade
|
(144,079
|
)
|
(89,683
|
)
|
(58,760
|
)
|
|||||
|
Other receivables
|
4,246
|
|
(12,835
|
)
|
9,413
|
|
|||||
|
Prepaid expenses and other assets
|
(14,889
|
)
|
(7,426
|
)
|
56,395
|
|
|||||
|
Amounts due from and due to affiliates
|
11,049
|
|
(34,326
|
)
|
41,351
|
|
|||||
|
Accounts payable
|
12,455
|
|
73,888
|
|
(11,814
|
)
|
|||||
|
Accrued liabilities
|
(130,631
|
)
|
(241,701
|
)
|
312,871
|
|
|||||
|
Deferred revenue
|
72,426
|
|
12,310
|
|
9,835
|
|
|||||
|
Liabilities related to interest rate swap contracts
|
53,101
|
|
(921
|
)
|
78,823
|
|
|||||
|
Net cash provided by operating activities
|
2,508,317
|
|
2,018,247
|
|
1,184,455
|
|
|||||
|
Cash flows from investing activities:
|
|
|
|||||||||
|
Capital expenditures
|
(1,153,589
|
)
|
(951,349
|
)
|
(625,541
|
)
|
|||||
|
Payment for acquisitions, net of cash acquired
|
(10,753
|
)
|
(46,703
|
)
|
(8,988,774
|
)
|
|||||
|
Sale of affiliate interest
|
(3,537
|
)
|
—
|
|
13,825
|
|
|||||
|
Proceeds related to sale of equipment, including costs of disposal
|
10,779
|
|
9,743
|
|
5,885
|
|
|||||
|
Increase in other investments
|
9,327
|
|
(4,773
|
)
|
(4,608
|
)
|
|||||
|
Settlement of put call options
|
—
|
|
(97,410
|
)
|
—
|
|
|||||
|
Additions to other intangible assets
|
(584
|
)
|
(1,707
|
)
|
(106
|
)
|
|||||
|
Net cash used in investing activities
|
(1,148,357
|
)
|
(1,092,199
|
)
|
(9,599,319
|
)
|
|||||
|
ALTICE USA, INC. AND SUBSIDIARIES
CONSOLIDATED STATEMENTS OF CASH FLOWS (continued)
Years ended December 31, 2018, 2017 and 2016
(In thousands)
|
|||||||||||
|
2018
|
2017
|
2016
|
|||||||||
|
Cash flows from financing activities:
|
|||||||||||
|
Proceeds from credit facility debt, net of discounts
|
$
|
3,489,313
|
|
$
|
5,593,675
|
|
$
|
5,510,256
|
|
||
|
Repayment of credit facility debt
|
(2,221,175
|
)
|
(4,411,581
|
)
|
(9,133,543
|
)
|
|||||
|
Proceeds from notes payable to affiliates and related parties
|
—
|
|
—
|
|
1,750,000
|
|
|||||
|
Issuance of senior notes and debentures
|
2,050,000
|
|
—
|
|
1,310,000
|
|
|||||
|
Redemption of senior notes, including premiums and fees
|
(2,628,962
|
)
|
(1,729,400
|
)
|
—
|
|
|||||
|
Proceeds from collateralized indebtedness, net
|
516,513
|
|
838,794
|
|
179,388
|
|
|||||
|
Repayment of collateralized indebtedness and related derivative contracts, net
|
(516,513
|
)
|
(831,059
|
)
|
(143,102
|
)
|
|||||
|
Dividends to stockholders
|
(1,499,935
|
)
|
(919,317
|
)
|
(365,559
|
)
|
|||||
|
Proceeds from notes payable
|
15,955
|
|
33,733
|
|
—
|
|
|||||
|
Repayment of notes payable
|
(32,632
|
)
|
—
|
|
—
|
|
|||||
|
Excess tax benefit on share-based awards
|
—
|
|
—
|
|
31
|
|
|||||
|
Principal payments on capital lease obligations
|
(10,228
|
)
|
(15,157
|
)
|
(18,837
|
)
|
|||||
|
Purchase of shares of Altice USA, Inc. Class A common stock, pursuant to a share repurchase program
|
(500,000
|
)
|
—
|
|
—
|
|
|||||
|
Additions to deferred financing costs
|
(28,468
|
)
|
(8,600
|
)
|
(203,712
|
)
|
|||||
|
Other
|
(859
|
)
|
—
|
|
—
|
|
|||||
|
Contingent payment for acquisition
|
(30,000
|
)
|
—
|
|
—
|
|
|||||
|
Proceeds from IPO, net of fees
|
—
|
|
349,071
|
|
—
|
|
|||||
|
Contributions from stockholders
|
—
|
|
1,135
|
|
1,246,499
|
|
|||||
|
Contributions from noncontrolling interests, net
|
5,995
|
|
(335
|
)
|
—
|
|
|||||
|
Net cash provided by (used in) financing activities
|
(1,390,996
|
)
|
(1,099,041
|
)
|
131,421
|
|
|||||
|
Net decrease in cash and cash equivalents
|
(31,036
|
)
|
(172,993
|
)
|
(8,283,443
|
)
|
|||||
|
Effect of exchange rate changes on cash and cash equivalents
|
(26
|
)
|
—
|
|
—
|
|
|||||
|
Net increase in cash and cash equivalents
|
(31,062
|
)
|
(172,993
|
)
|
(8,283,443
|
)
|
|||||
|
Cash, cash equivalents and restricted cash at beginning of year
|
330,100
|
|
503,093
|
|
8,786,536
|
|
|||||
|
Cash, cash equivalents and restricted cash at end of year
|
$
|
299,038
|
|
$
|
330,100
|
|
$
|
503,093
|
|
||
See accompanying notes to consolidated financial statements.
F-11
ALTICE USA, INC. AND SUBSIDIARIES
NOTES TO CONSOLIDATED FINANCIAL STATEMENTS
(Dollars in thousands, except share and per share amounts)
NOTE 1. DESCRIPTION OF BUSINESS AND RELATED MATTERS
The Company and Related Matters
Altice USA, Inc. ("Altice USA" or the "Company") was incorporated in Delaware on
September 14, 2015
. Prior to the distribution discussed below, Altice USA was majority-owned by Altice N.V., a public company with limited liability (naamloze vennootshcap) under Dutch law. Since the completion of the Altice N.V. distribution discussed below, the Company is no longer majority-owned by Altice N.V. Altice N.V. changed its name to Altice Europe N.V. ("Altice Europe") upon completion of the distribution discussed below.
The Company provides broadband communications and video services in the United States and markets its services under two brands: Optimum, in the New York metropolitan area, and Suddenlink, principally in markets in the south-central United States. It delivers broadband, pay television, telephony services, proprietary content and advertising services to residential and business customers. As these brands are managed on a consolidated basis, the Company classifies its operations in
one
segment.
Altice Europe, through a subsidiary, acquired Cequel Corporation ("Cequel" or "Suddenlink") on
December 21, 2015
("Cequel Acquisition") and Cequel was contributed to Altice USA on
June 9, 2016
. Altice USA had no operations of its own other than the issuance of debt prior to the contribution of Cequel on
June 9, 2016
by Altice Europe. The results of operations of Cequel for the year ended December 31, 2016 have been included in the results of operations of Altice USA for the same period, as Cequel was under common control with Altice USA.
Altice USA acquired Cablevision Systems Corporation ("Cablevision" or "Optimum") on
June 21, 2016
(see discussion below) and the results of operations of Cablevision are included with the results of operations of Cequel since the date of acquisition.
The accompanying combined consolidated financial statements ("consolidated financial statements") include the accounts of the Company and all subsidiaries in which the Company has a controlling interest and gives effect to the ATS Acquisition and the i24 Acquisition discussed below. All significant inter-company accounts and transactions have been eliminated in consolidation.
The accompanying consolidated financial statements also reflect the retrospective adoption of Accounting Standards Update ("ASU") No. 2014-09,
Revenue from Contracts with Customers
and ASU No. 2017‑07
Compensation-Retirement Benefits (Topic 715).
See Note 4 for further details of the impact on the Company's historical financial statements.
Acquisition of Cablevision Systems Corporation
On
June 21, 2016
(the "Cablevision Acquisition Date"), pursuant to the Agreement and Plan of Merger (the "Merger Agreement"), dated as of
September 16, 2015
, by and among Cablevision, Altice Europe, Neptune Merger Sub Corp., a wholly-owned subsidiary of Altice Europe ("Merger Sub"), Merger Sub merged with and into Cablevision, with Cablevision surviving the merger (the "Cablevision Acquisition").
In connection with the Cablevision Acquisition, each outstanding share of the Cablevision NY Group Class A common stock, par value
$0.01
per share ("CNYG Class A Shares"), and Cablevision NY Group Class B common stock, par value
$0.01
per share ("CNYG Class B Shares", and together with the CNYG Class A Shares, the "Shares"), and together with the Cablevision NY Group Class A common stock, the "Shares" other than Shares owned by Cablevision, Altice Europe or any of their respective wholly-owned subsidiaries, in each case not held on behalf of third parties in a fiduciary capacity, received
$34.90
in cash without interest, less applicable tax withholdings (the "Cablevision Acquisition Consideration").
Pursuant to an agreement, dated
December 21, 2015
, by and among CVC 2 B.V., CIE Management IX Limited, for and on behalf of the limited partnerships BC European Capital IX-1 through 11 and Canada Pension Plan Investment Board, certain affiliates of BCP and CPPIB (the "Co-Investors") funded approximately
$1,000,000
toward the payment of the aggregate Per Share Cablevision Acquisition Consideration, and indirectly acquired approximately
30%
of the Shares of Cablevision.
Also in connection with the Cablevision Acquisition, outstanding equity-based awards granted under Cablevision’s equity plans were cancelled and converted into cash based upon the
$34.90
per Share Cablevision Acquisition
F-12
ALTICE USA, INC. AND SUBSIDIARIES
NOTES TO CONSOLIDATED FINANCIAL STATEMENTS (continued)
(Dollars in thousands, except share and per share amounts)
Consideration in accordance with the original terms of the awards. The total consideration for the outstanding CNYG Class A Shares, the outstanding CNYG Class B Shares, and the equity-based awards amounted to
$9,958,323
.
In connection with the Cablevision Acquisition, in October 2015, Neptune Finco Corp. ("Finco"), an indirect wholly-owned subsidiary of Altice Europe formed to complete the financing described herein and the merger with CSC Holdings, LLC ("CSC Holdings"), a wholly-owned subsidiary of Cablevision, borrowed an aggregate principal amount of
$3,800,000
under a term loan facility (the "Term Credit Facility") and entered into revolving loan commitments in an aggregate principal amount of
$2,000,000
(the "Revolving Credit Facility" and, together with the Term Credit Facility, the "Credit Facilities").
Finco also issued
$1,800,000
aggregate principal amount of
10.125%
senior notes due 2023 (the "2023 Notes"),
$2,000,000
aggregate principal amount of
10.875%
senior notes due 2025 (the "2025 Notes"), and
$1,000,000
aggregate principal amount of
6.625%
senior guaranteed notes due 2025 (the "2025 Guaranteed Notes") (collectively the "Cablevision Acquisition Notes").
On
June 21, 2016
, immediately following the Cablevision Acquisition, Finco merged with and into CSC Holdings, with CSC Holdings surviving the merger (the "CSC Holdings Merger"), and the Cablevision Acquisition Notes and the Credit Facilities became obligations of CSC Holdings.
On
June 21, 2016
, in connection with the Cablevision Acquisition, the Company issued notes payable to affiliates and related parties aggregating
$1,750,000
, of which
$875,000
bore interest at
10.75%
and
$875,000
bore interest at
11%
. See Note 11 for a discussion regarding the conversion of these notes payable to shares of the Company's common stock prior to the consummation of the IPO.
The Cablevision Acquisition was accounted for as a business combination in accordance with ASC Topic 805. Accordingly, the Company stepped up 100% of the assets and liabilities assumed to their fair value at the Cablevision Acquisition Date. See Note 5 for further details.
Acquisition of Altice Technical Services US Corp
Altice Technical Services US Corp. ("ATS") was formed to provide network construction and maintenance services and commercial and residential installations, disconnections, and maintenance. During the second quarter of 2017, a substantial portion of the Company's technical workforce at Cablevision either accepted employment with ATS or became employees of ATS and ATS commenced operations and began to perform services for the Company. A substantial portion of the Cequel technical workforce became employees of ATS in December 2017. Additionally, in the second quarter of 2017, the Company entered into an Independent Contractor Agreement with ATS that governed the terms of the services provided to the Company and entered into a Transition Services Agreement for the use of the Company's resources to provide various overhead functions to ATS, including accounting, legal and human resources and for the use of certain facilities, vehicles and technician tools during a transitional period. The Transition Services Agreement required ATS to reimburse the Company for its cost to provide such services.
In January 2018, the Company acquired
70%
of the equity interests in ATS for
$1.00
(the "ATS Acquisition") and the Company became the owner of 100% of the equity interests in ATS in March 2018. ATS was previously owned by Altice Europe and a member of ATS's management through a holding company. As the acquisition is a combination of businesses under common control, the Company combined the results of operations and related assets and liabilities of ATS for all periods since its formation. See Note 4 for the impact of the ATS Acquisition on the Company's consolidated balance sheet and statement of operations as of and for the year ended December 31, 2017. In connection with the ATS Acquisition, the Company recorded goodwill of
$23,101
, representing the amount previously transferred to ATS.
Acquisition of i24NEWS
In April 2018, Altice Europe transferred its ownership of i24 US and i24 Europe ("i24NEWS"), Altice Europe's 24/7 international news and current affairs channels to the Company for minimal consideration (the "i24 Acquisition"). As the acquisition was a combination of businesses under common control, the Company combined the results of operations and related assets and liabilities of i24NEWS as of April 1, 2018. Operating results for periods prior to April 1, 2018 and the balance sheet as of December 31, 2017 have not been revised to reflect the i24 Acquisition as the impact was deemed immaterial.
F-13
ALTICE USA, INC. AND SUBSIDIARIES
NOTES TO CONSOLIDATED FINANCIAL STATEMENTS (continued)
(Dollars in thousands, except share and per share amounts)
Initial Public Offering
In June 2017, the Company completed its initial public offering ("IPO") of
71,724,139
shares of its Class A common stock (
12,068,966
shares sold by the Company and
59,655,173
shares sold by existing stockholders) at a price to the public of
$30.00
per share, including the underwriters full exercise of their option to purchase
7,781,110
shares to cover overallotments. At the date of the IPO, Altice Europe owned approximately
70.2%
of the Company's issued and outstanding common stock, which represented approximately
98.2%
of the voting power of the Company's outstanding common stock. The Company’s Class A common stock began trading on June 22, 2017, on the New York Stock Exchange under the symbol "ATUS".
In connection with the sale of its Class A common stock, the Company received proceeds of approximately
$362,069
, before deducting the underwriting discount and expenses directly related to the issuance of the securities of
$12,998
. The Company did not receive any proceeds from the sale of shares by the selling stockholders. In July 2017, the Company used approximately
$350,120
of the proceeds to fund the redemption of
$315,779
principal amount of
10.875%
senior notes that mature in 2025 issued by CSC Holdings, an indirect wholly-owned subsidiary of the Company, and the related call premium of approximately
$34,341
.
The following organizational transactions were consummated prior to the IPO:
|
•
|
the Company amended and restated its certificate of incorporation to, among other things, provide for Class A common stock, Class B common stock and Class C common stock;
|
|
•
|
BC Partners LLP ("BCP") and Canada Pension Plan Investment Board (‘‘CPPIB and together with BCP, the‘‘Co-Investors’’) and Uppernext S.C.S.p. ("Uppernext"), an entity controlled by Mr. Patrick Drahi (founder and controlling stockholder of Altice Europe), exchanged their indirect ownership interest in the Company for shares of the Company’s common stock;
|
|
•
|
Neptune Management LP (‘‘Management LP’’) redeemed its Class B units for shares of the Company’s common stock that it received from the redemption of its Class B units in Neptune Holding US LP;
|
|
•
|
the Company converted
$525,000
aggregate principal amount of notes issued by the Company to the Co-Investors (together with accrued and unpaid interest and applicable premium) into shares of the Company’s common stock at the IPO price (see Note 11 for further details);
|
|
•
|
$1,225,000
aggregate principal amount of notes issued by the Company to a subsidiary of Altice Europe (together with accrued and unpaid interest and applicable premium) was transferred to CVC 3 B.V., an indirect subsidiary of Altice Europe ("CVC 3") and then the Company converted such notes into shares of the Company’s common stock at the IPO price (see Note 11 for further details);
|
|
•
|
the Co-Investors, Neptune Holding US LP, A4 S.A. (an entity controlled by the family of Mr. Drahi), and former Class B unitholders of Management LP (including Uppernext) exchanged shares of the Company’s common stock for new shares of the Company’s Class A common stock; and
|
|
•
|
CVC 3 and A4 S.A. exchanged shares of the Company’s common stock for new shares of the Company’s Class B common stock.
|
Altice Europe Distribution
On June 8, 2018, Altice Europe distributed substantially all of its equity interest in the Company through a distribution in kind to holders of Altice Europe's common shares A and common shares B (the “Distribution”). The Distribution took place by way of a special distribution in kind by Altice Europe of its
67.2%
interest in the Company to Altice Europe shareholders. Each shareholder of Altice Europe on May 23, 2018, the Distribution record date, received
0.4163
shares of the Company's common stock for every share held by such shareholder in Altice Europe. Between May 24, 2018 and June 4, 2018, each Altice Europe shareholder was given the opportunity to elect the percentage of shares of the Company's Class A common stock and shares of the Company's Class B common stock such shareholder would receive in the Distribution, whereby the number of shares of the Company's Class B common stock to be distributed was subject to a cap of
50%
of the total shares of the Company's common stock being distributed (the “Class B Cap”). Because the Class B Cap had been exceeded, the shares of the Company's Class B common stock delivered to Altice Europe’s shareholders of record who elected to receive them were subject to proration, and such shareholders received shares of
F-14
ALTICE USA, INC. AND SUBSIDIARIES
NOTES TO CONSOLIDATED FINANCIAL STATEMENTS (continued)
(Dollars in thousands, except share and per share amounts)
the Company's Class A common stock.
Immediately following the Distribution, there were
489,384,523
shares of Altice USA Class A common stock and
247,684,443
shares of Altice USA Class B common stock outstanding.
Prior to Altice Europe's announcement of the Distribution, the Board of Directors of Altice USA, acting through its independent directors, approved the payment of a
$2.035
dividend to all shareholders of record on May 22, 2018. The payment of the dividend, aggregating
$1,499,935
, was made on June 6, 2018, and was
funded with cash at CSC Holdings LLC, a wholly-owned subsidiary of Cablevision, from financings completed in January 2018, and cash generated from operations at Cequel. In connection with the payment of the dividend, the Company recorded a decrease in retained earnings of
$536,224
, representing the cumulative earnings through the payment date, and a decrease in paid in capital of
$963,711
.
In connection with the Distribution, the Management Advisory and Consulting Services Agreement with Altice Europe which provided certain consulting, advisory and other services was terminated. See Note 16 for further details.
In addition, the Board of Directors of Altice USA also authorized a share repurchase program of
$2.0 billion
, effective June 8, 2018. Under the repurchase program, shares of Altice USA Class A common stock may be purchased from time to time in the open market and may include trading plans entered into with one or more brokerage firms in accordance with Rule 10b5-1 under the Securities Exchange Act of 1934. Size and timing of these purchases will be determined based on market conditions and other factors.
From inception through December 31, 2018, the Company repurchased an aggregate of
28,028,680
shares for a total purchase price of approximately
$500,000
. These acquired shares were retired and the cost for these shares was recorded in paid in capital in the Company's consolidated balance sheet. As of December 31, 2018, the Company had approximately
$1,500,000
of availability remaining under its stock repurchase program and had
709,040,286
combined Class A and Class B shares outstanding.
NOTE 2. SUMMARY OF SIGNIFICANT ACCOUNTING POLICIES
Summary of Significant Accounting Policies
Revenue Recognition
Residential Services
The Company derives revenue through monthly charges to residential customers of its pay television, broadband, and telephony services, including installation services. In addition, the Company derives revenue from digital video recorder ("DVR"), video-on-demand ("VOD"), pay-per-view, and home shopping commissions which are reflected in "Residential pay TV" revenues. The Company recognizes pay television, broadband, and telephony revenues as the services are provided to a customer on a monthly basis. Revenue from the sale of bundled services at a discounted rate is allocated to each product based on the standalone selling price of each performance obligation within the bundled offer. The standalone selling price requires judgment and is typically determined based on the current prices at which the separate services are sold by the Company. Installation revenue for the Company's residential services is deferred and recognized over the benefit period, which is estimated to be less than one year. The estimated benefit period takes into account both quantitative and qualitative factors including the significance of average installation fees to total recurring revenue per customer.
The Company is assessed non-income related taxes by governmental authorities, including franchising authorities (generally under multi-year agreements), and collects such taxes from its customers. In instances where the tax is being assessed directly on the Company, amounts paid to the governmental authorities are recorded as programming and other direct costs and amounts received from the customers are recorded as revenue. For the years ended
December 31, 2018
,
2017
and
2016
, the amount of franchise fees and certain other taxes and fees included as a component of revenue aggregated
$257,467
,
$259,075
and
$154,732
, respectively.
Business and Wholesale Services
The Company derives revenue from the sale of products and services to both large enterprise and small and medium-sized business ("SMB") customers, including broadband, telephony, networking, and pay television services reflected in "Business services and wholesale" revenues. The Company's business services also include Ethernet, data transport, and
F-15
ALTICE USA, INC. AND SUBSIDIARIES
NOTES TO CONSOLIDATED FINANCIAL STATEMENTS (continued)
(Dollars in thousands, except share and per share amounts)
IP-based virtual private networks. The Company also provides managed services to businesses, including hosted telephony services (cloud based SIP-based private branch exchange), managed Wi-Fi, managed desktop and server backup and managed collaboration services including audio and web conferencing. The Company also offers fiber-to-the-tower services to wireless carriers for cell tower backhaul and enable wireline communications service providers to connect to customers that their own networks do not reach. The Company recognizes revenues for these services as the services are provided to a customer on a monthly basis.
Substantially all of our SMB customers are billed monthly and large enterprise customers are billed in accordance with the terms of their contracts which is typically also on a monthly basis. Contracts with large enterprise customers typically range from
three
to
five
years. Installation revenue related to our large enterprise customers is deferred and recognized over the average contract term. Installation revenue related to SMB customers is deferred and recognized over the benefit period, which is less than a year. The estimated benefit period for SMB customers takes into account both quantitative and qualitative factors including the significance of average installation fees to total recurring revenue per customer.
Advertising
As part of the agreements under which the Company acquires pay television programming, the Company typically receives an allocation of scheduled advertising time during such programming into which the Company's cable systems can insert commercials. In several of the markets in which the Company operates, it has entered into agreements commonly referred to as interconnects with other cable operators to jointly sell local advertising. In some of these markets, the Company represents the advertising sales efforts of other cable operators; in other markets, other cable operators represent the Company. Advertising revenues are recognized when commercials are aired. Arrangements in which the Company controls the sale of advertising and acts as the principal to the transaction, the Company recognizes revenue earned from the advertising customer on a gross basis and the amount remitted to the distributor as an operating expense. Arrangements in which the Company does not control the sale of advertising and acts as an agent to the transaction, the Company recognizes revenue net of any fee remitted to the distributor.
The Company's advanced advertising businesses provide data-driven, audience-based advertising solutions using advanced analytics tools that provide granular measurement of consumer groups, accurate hyper-local ratings and other insights into target audience behavior not available through traditional sample-based measurement services. Revenue earned from the Company's advanced advertising businesses are recognized when services are provided.
Other
Revenues derived from other sources are recognized when services are provided or events occur.
Contract Assets
Incremental costs incurred in obtaining a contract with a customer are deferred and recorded as a contract asset if the period of benefit is expected to be greater than one year. Sales commissions for enterprise and certain SMB customers are deferred and amortized over the average contract term. For sales commission expenses related to residential and SMB customers with a term of one year or less, the Company is utilizing the practical expedient and is recognizing the costs when incurred. Cost of fulfilling a contract with a customer are deferred and recorded as a contract asset if they generate or enhance resources of the Company that will be used in satisfying future performance obligations and are expected to be recovered. Installation costs related to residential and SMB customers that are not capitalized as part of the initial deployment of new customer premise equipment are expensed as incurred pursuant to industry-specific guidance.
The following table provides information about contracts assets and contract liabilities related to contracts with customers:
|
December 31,
|
|||||||
|
2018
|
2017
|
||||||
|
Contract assets (a)
|
$
|
26,405
|
|
$
|
24,329
|
|
|
|
Deferred revenue (b)
|
190,056
|
|
117,679
|
|
|||
|
(a)
|
Contract assets include primarily sales commissions for enterprise customers that are deferred and amortized over the average contract term.
|
F-16
ALTICE USA, INC. AND SUBSIDIARIES
NOTES TO CONSOLIDATED FINANCIAL STATEMENTS (continued)
(Dollars in thousands, except share and per share amounts)
|
(b)
|
Deferred revenue represents payments received from customers for services that have yet to be provided and installation revenue which is deferred and recognized over the benefit period. The majority of the Company's deferred revenue represents payments for services for up to one month in advance from residential and SMB customers which is realized within the following month as services are performed.
|
A significant portion of our revenue is derived from residential and SMB customer contracts which are month-to month. As such, the amount of revenue related to unsatisfied performance obligations is not necessarily indicative of the future revenue to be recognized from our existing customer base. Contracts with enterprise customers generally range from
three
to
five
years, and services may only be terminated in accordance with the contractual terms.
The following table presents the composition of revenue:
|
Years Ended December 31,
|
|||||||||||
|
2018
|
2017
|
2016
|
|||||||||
|
Residential:
|
|||||||||||
|
Pay TV
|
$
|
4,156,428
|
|
$
|
4,274,122
|
|
$
|
2,788,873
|
|
||
|
Broadband
|
2,887,455
|
|
2,608,595
|
|
1,651,574
|
|
|||||
|
Telephony
|
652,895
|
|
700,765
|
|
465,771
|
|
|||||
|
Business services and wholesale
|
1,362,758
|
|
1,298,213
|
|
819,541
|
|
|||||
|
Advertising
|
482,649
|
|
391,866
|
|
252,049
|
|
|||||
|
Other
|
24,423
|
|
33,389
|
|
39,404
|
|
|||||
|
Total revenue
|
$
|
9,566,608
|
|
$
|
9,306,950
|
|
$
|
6,017,212
|
|
||
Multiple-Element Transactions
In the normal course of business, the Company may enter into multiple-element transactions where it is simultaneously both a customer and a vendor with the same counterparty or in which it purchases multiple products and/or services, or settles outstanding items contemporaneously with the purchase of a product or service, from a single counterparty. The Company's policy for accounting for each transaction negotiated contemporaneously is to record each deliverable of the transaction based on its best estimate of selling price in a manner consistent with that used to determine the price to sell each deliverable on a standalone basis. In determining the fair value of the respective deliverable, the Company will utilize quoted market prices (as available), historical transactions or comparable transactions.
Technical and Operating Expenses
Costs of revenue related to sales of services are classified as "programming and other direct costs" in the accompanying consolidated statements of operations.
Programming Costs
Programming expenses related to the Company's pay television service represent fees paid to programming distributors to license the programming distributed to customers. This programming is acquired generally under multi-year distribution agreements, with rates usually based on the number of customers that receive the programming. If there are periods when an existing distribution agreement has expired and the parties have not finalized negotiations of either a renewal of that agreement or a new agreement for certain periods of time, the Company continues to carry and pay for these services until execution of definitive replacement agreements or renewals. The amount of programming expense recorded during the interim period is based on the Company's estimates of the ultimate contractual agreement expected to be reached, which is based on several factors, including previous contractual rates, customary rate increases and the current status of negotiations. Such estimates are adjusted as negotiations progress until new programming terms are finalized.
In addition, the Company has received, or may receive, incentives from programming distributors for carriage of the distributors' programming. The Company generally recognizes these incentives as a reduction of programming costs in "programming and other direct costs", generally over the term of the distribution agreement.
F-17
ALTICE USA, INC. AND SUBSIDIARIES
NOTES TO CONSOLIDATED FINANCIAL STATEMENTS (continued)
(Dollars in thousands, except share and per share amounts)
Advertising Expenses
Advertising costs are charged to expense when incurred and are reflected in "other operating expenses" in the accompanying consolidated statements of operations. Advertising costs amounted to
$240,273
,
$224,120
and
$135,513
for the years ended
December 31, 2018
,
2017
and
2016
, respectively.
Share-Based Compensation
Share-based compensation expense is based on the fair value of the portion of share-based payment awards that are ultimately expected to vest. Share-based compensation cost relates to awards of units in a carried unit plan and options.
For carried interest units, the Company measures share-based compensation cost at the grant date fair value and recognizes the expense over the requisite service period or when it is probable any related performance condition will be met. For carried interest units with graded vesting requirement, compensation cost is recognized on an accelerated method under the graded vesting method over the requisite service period for the carried interest unit. Carried interest units that vest entirely at the end of the vesting requirement are expensed on a straight-line basis.
The Company estimated the fair value of carried interest units using an option pricing model. Key inputs that were used in applying the option pricing method were total equity value, equity volatility, risk free rate and time to liquidity event. The estimate of total equity value was determined using a combination of the income approach, which incorporated cash flow projections that were discounted at an appropriate rate, and the market approach, which involved applying a market multiple to the Company’s projected operating results. The Company estimated volatility based on the historical equity volatility of comparable publicly-traded companies. Subsequent to the IPO, such subjective valuations and estimates were no longer necessary as the Company relied on the market price of the Company’s common stock to determine the fair value of share-based compensation awards. See Note 15 to the consolidated financial statements for additional information about our share-based compensation.
For stock option awards, the Company recognizes compensation expense based on the estimated grant date fair value using the Black-Scholes valuation model and amortizes the fair value to share-based compensation expense over the requisite service period.
Income Taxes
The Company's provision for income taxes is based on current period income, changes in deferred tax assets and liabilities and changes in estimates with regard to uncertain tax positions. Deferred tax assets are subject to an ongoing assessment of realizability. The Company provides deferred taxes for the outside basis difference of its investment in partnerships.
Cash and Cash Equivalents
The Company's cash investments are placed with money market funds and financial institutions that are investment grade as rated by S&P Global Ratings and Moody's Investors Service. The Company selects money market funds that predominantly invest in marketable, direct obligations issued or guaranteed by the United States government or its agencies, commercial paper, fully collateralized repurchase agreements, certificates of deposit, and time deposits.
The Company considers the balance of its investment in funds that substantially hold securities that mature within three months or less from the date the fund purchases these securities to be cash equivalents. The carrying amount of cash and cash equivalents either approximates fair value due to the short-term maturity of these instruments or are at fair value.
Accounts Receivable
Accounts receivable are recorded at net realizable value. The Company periodically assesses the adequacy of valuation allowances for uncollectible accounts receivable by evaluating the collectability of outstanding receivables and general factors such as historical collection experience, length of time individual receivables are past due, and the economic and competitive environment.
Investments
Investment securities and investment securities pledged as collateral are classified as trading securities and are stated at fair value with realized and unrealized holding gains and losses included in the consolidated statements of operations.
F-18
ALTICE USA, INC. AND SUBSIDIARIES
NOTES TO CONSOLIDATED FINANCIAL STATEMENTS (continued)
(Dollars in thousands, except share and per share amounts)
Long-Lived Assets and Amortizable Intangible Assets
Property, plant and equipment, including construction materials, are carried at cost, and include all direct costs and certain indirect costs associated with the construction of cable systems, and the costs of new equipment installations. Equipment under capital leases is recorded at the present value of the total minimum lease payments. Depreciation on equipment is calculated on the straight-line basis over the estimated useful lives of the assets or, with respect to equipment under capital leases and leasehold improvements, amortized over the shorter of the lease term or the assets' useful lives and reported in depreciation and amortization (including impairments) in the consolidated statements of operations.
The Company capitalizes certain internal and external costs incurred to acquire or develop internal-use software. Capitalized software costs are amortized over the estimated useful life of the software and reported in depreciation and amortization.
Customer relationships, trade names and other intangibles established in connection with acquisitions that are finite-lived are amortized in a manner that reflects the pattern in which the projected net cash inflows to the Company are expected to occur, such as the sum of the years' digits method, or when such pattern does not exist, using the straight-line basis over their respective estimated useful lives.
The Company reviews its long-lived assets (property, plant and equipment, and intangible assets subject to amortization that arose from acquisitions) for impairment whenever events or circumstances indicate that the carrying amount of an asset may not be recoverable. If the sum of the expected cash flows, undiscounted and without interest, is less than the carrying amount of the asset, an impairment loss is recognized as the amount by which the carrying amount of the asset exceeds its fair value.
Goodwill and Indefinite-Lived Intangible Assets
Goodwill and the value of franchises acquired in purchase business combinations which have indefinite useful lives are not amortized. Rather, such assets are tested for impairment annually or upon the occurrence of a triggering event.
The Company assesses qualitative factors for its reporting units that carry goodwill. If the qualitative assessment results in a conclusion that it is more likely than not that the fair value of a reporting unit exceeds the carrying value, then no further testing is performed for that reporting unit.
When the qualitative assessment is not used, or if the qualitative assessment is not conclusive and it is necessary to calculate the fair value of a reporting unit, then the impairment analysis for goodwill is performed at the reporting unit level using a two-step approach. The first step of the goodwill impairment test is used to identify potential impairment by comparing the fair value of the reporting unit with its carrying amount, including goodwill utilizing an enterprise-value based premise approach. If the carrying amount of the reporting unit exceeds its fair value, the second step of the goodwill impairment test is performed to measure the amount of goodwill impairment loss, if any. The second step of the goodwill impairment test compares the implied fair value of the reporting unit's goodwill with the carrying amount of that goodwill. If the carrying amount of the reporting unit's goodwill exceeds the implied fair value of that goodwill, an impairment loss is recognized in an amount equal to that excess. The implied fair value of goodwill is determined in the same manner as the amount of goodwill which would be recognized in a business combination.
The Company assesses qualitative factors to determine whether it is necessary to perform the one-step quantitative identifiable indefinite-lived intangible assets impairment test. This quantitative test is required only if the Company concludes that it is more likely than not that a unit of accounting’s fair value is less than its carrying amount. When the qualitative assessment is not used, or if the qualitative assessment is not conclusive, the impairment test for other intangible assets not subject to amortization requires a comparison of the fair value of the intangible asset with its carrying value. If the carrying value of the indefinite-lived intangible asset exceeds its fair value, an impairment loss is recognized in an amount equal to that excess.
Deferred Financing Costs
Deferred financing costs are being amortized to interest expense using the effective interest method over the terms of the related debt.
F-19
ALTICE USA, INC. AND SUBSIDIARIES
NOTES TO CONSOLIDATED FINANCIAL STATEMENTS (continued)
(Dollars in thousands, except share and per share amounts)
Derivative Financial Instruments
The Company accounts for derivative financial instruments as either assets or liabilities measured at fair value. The Company uses derivative instruments to manage its exposure to market risks from changes in certain equity prices and interest rates and does not hold or issue derivative instruments for speculative or trading purposes. These derivative instruments are not designated as hedges, and changes in the fair values of these derivatives are recognized in the consolidated statements of operations as gain (loss) on derivative contracts or gain (loss) on interest rate swap contracts.
Commitments and Contingencies
Liabilities for loss contingencies arising from claims, assessments, litigation, fines and penalties and other sources are recorded when the Company believes it is probable that a liability has been incurred and the amount of the contingency can be reasonably estimated.
Foreign Currency
Certain of the Company's i24NEWS subsidiaries are located outside the United States. The functional currency for these subsidiaries is determined based on the primary economic environment in which the subsidiary operates. Revenues and expenses for these subsidiaries are translated into U.S. dollars using rates that approximate those in effect during the period while the assets and liabilities are translated into U.S. dollars using exchange rates in effect at the end of each period. The resulting gains and losses from these translations are recognized in cumulative translation adjustment included in accumulated other comprehensive loss in stockholders’ equity on the consolidated balance sheets.
Common Stock of Altice USA
Each holder of Class A common stock has
one
vote per share while holders of Class B common stock have
twenty-five
votes per share. Class B shares can be converted to Class A common stock at anytime with a conversion ratio of
one
Class A common share for one Class B common share.
The following table provides details of the Company's shares of common stock outstanding:
|
|
Shares of Common Stock Outstanding
|
||||
|
|
Class A
Common Stock
|
Class B
Common Stock
|
|||
|
Balance at June 21, 2017 and December 31, 2017
|
246,982,292
|
|
|
490,086,674
|
|
|
Altice Europe Distribution on June 8, 2018 (see Note 1)
|
242,402,231
|
|
(242,402,231
|
)
|
|
|
Conversion of Class B common stock to Class A common stock
|
34,708,184
|
|
(34,708,184
|
)
|
|
|
Retirement of Class A common shares in connection with the Company's stock repurchase plan (see Note 1)
|
(28,028,680
|
)
|
—
|
|
|
|
Balance at December 31, 2018
|
496,064,027
|
|
212,976,259
|
|
|
Dividends and Distributions
The Company may pay dividends on its capital stock only from net profits and surplus as determined under Delaware law. If dividends are paid on the Altice USA common stock, holders of the Altice USA Class A common stock and Altice USA Class B common stock are entitled to receive dividends, and other distributions in cash, stock or property, equally on a per share basis, except that stock dividends with respect to Altice USA Class A common stock may be paid only with shares of Altice USA Class A common stock and stock dividends with respect to Altice USA Class B common stock may be paid only with shares of Altice USA Class B common stock.
The Company's indentures restrict the amount of dividends and distributions in respect of any equity interest that can be made.
In 2018, the Company paid dividends of
$1,499,935
(see discussion in Note 1). Prior to the Company's IPO, the Company declared and paid cash distributions to stockholders aggregating
$839,700
in the second quarter of 2017. In 2016, the Company declared cash distributions of
$445,176
of which
$365,559
were paid in 2016 and
$79,617
were paid in the first quarter of 2017.
F-20
ALTICE USA, INC. AND SUBSIDIARIES
NOTES TO CONSOLIDATED FINANCIAL STATEMENTS (continued)
(Dollars in thousands, except share and per share amounts)
Net Income (Loss) Per Share
Basic net income (loss) per common share attributable to Altice USA stockholders is computed by dividing net income (loss) attributable to Altice USA stockholders by the weighted average number of common shares outstanding during the period. Diluted income per common share attributable to Altice USA stockholders reflects the dilutive effects of stock options. Diluted net loss per common share attributable to Altice USA stockholders excludes the effects of common stock equivalents as they are anti-dilutive. The weighted average number of shares used to compute basic and diluted net income (loss) per share reflect the retroactive impact of the organizational transactions, discussed in Note 1, that occurred prior to the Company's IPO.
The weighted average shares used in the calculation of the diluted net income per share attributable to Altice USA stockholders for the years ended
December 31, 2018
and 2017 is the same as the weighted average shares used in the calculation of basic net income per share as the weighted average common stock equivalents totaling approximately
6,292,000
shares and
14,000
shares, respectively, were antidilutive.
Concentrations of Credit Risk
Financial instruments that may potentially subject the Company to a concentration of credit risk consist primarily of cash and cash equivalents and trade account receivables. The Company monitors the financial institutions and money market funds where it invests its cash and cash equivalents with diversification among counterparties to mitigate exposure to any single financial institution. The Company's emphasis is primarily on safety of principal and liquidity and secondarily on maximizing the yield on its investments. Management believes that no significant concentration of credit risk exists with respect to its cash and cash equivalents because of its assessment of the creditworthiness and financial viability of the respective financial institutions.
The Company did not have a single customer that represented
10%
or more of its consolidated revenues for the years ended
December 31, 2018
,
2017
and
2016
or
10%
or more of its consolidated net trade receivables at
December 31, 2018
, and
2017
, respectively.
Use of Estimates in Preparation of Financial Statements
The preparation of financial statements in conformity with U.S. generally accepted accounting principles ("GAAP") requires management to make estimates and assumptions that affect the reported amounts of assets and liabilities and disclosure of contingent liabilities at the date of the financial statements and the reported amounts of revenues and expenses during the reporting period. Actual results could differ from those estimates. See Note 13 for a discussion of fair value estimates.
Reclassifications
Certain reclassifications have been made to the 2017 and 2016 financial statements to conform to the 2018 presentation.
NOTE 3. ACCOUNTING PRONOUNCEMENTS
Recently Adopted Accounting Pronouncements
In February 2018, the FASB issued ASU No. 2018-02, Income Statement-Reporting Comprehensive Income (Topic 220) Reclassification of Certain Tax Effects from Accumulated Other Comprehensive Income. The primary provision of ASU No. 2018-02 allows for the reclassification from accumulated other comprehensive income to retained earnings for stranded tax effects resulting from the Tax Cuts and Jobs Act. ASU No. 2018-02 also requires certain disclosures about stranded tax effects. ASU No. 2018-02 is effective for the Company on January 1, 2019, with early adoption permitted and will be applied either in the period of adoption or retrospectively to each period (or periods) in which the effect of the change in the U.S. federal corporate income tax rate in the Tax Cuts and Jobs Act is recognized. The Company elected to adopt ASU No. 2018-02 during the first quarter of 2018. The adoption resulted in the reclassification of stranded tax amounts of
$2,163
associated with net unrecognized losses from the Company's pension plans from accumulated other comprehensive loss to retained earnings.
In May 2017, the FASB issued ASU No. 2017-09, Compensation-Stock Compensation (Topic 718). ASU No. 2017-09 provides clarity and guidance on which changes to the terms or conditions of a share-based payment award require an entity to apply modification accounting in Topic 718. ASU No. 2017-09 was adopted by the Company on January 1, 2018 and it had no impact to the Company's consolidated financial statements.
F-21
ALTICE USA, INC. AND SUBSIDIARIES
NOTES TO CONSOLIDATED FINANCIAL STATEMENTS (continued)
(Dollars in thousands, except share and per share amounts)
In March 2017, the FASB issued ASU No. 2017-07, Compensation-Retirement Benefits (Topic 715). ASU No. 2017-07 requires that an employer disaggregate the service cost component from the other components of net benefit cost. It also provides guidance on how to present the service cost component and the other components of net benefit cost in the income statement and what component of net benefit cost is eligible for capitalization. ASU No. 2017‑07 was adopted by the Company on January 1, 2018 and was applied retrospectively. As a result of the adoption, the Company reclassified the non-service cost components of the Company's pension expense for the year ended December 2017and 2016 from other operating expenses to other income (expense), net. The Company elected to apply the practical expedient which allowed it to reclassify amounts disclosed previously in the benefits plan note as the basis for applying retrospective presentation for comparative periods, as the Company determined it was impracticable to disaggregate the cost components for amounts capitalized and amortized in those periods. See Note 4 for information on the impact of the adoption of ASU No. 2017-07.
In January 2017, the FASB issued ASU No. 2017-01, Business Combinations (Topic 805), Clarifying the Definition of a Business, which amends Topic 805 to interpret the definition of a business by adding guidance to assist in evaluating whether transactions should be accounted for as acquisitions (or disposals) of assets or businesses. The Company adopted the new guidance on January 1, 2018 and it had no impact to the Company's consolidated financial statements.
In December 2016, the FASB issued ASU No. 2016-20, Technical Corrections and Improvements to Topic 606, Revenue from Contracts with Customers, in order to clarify the Codification and to correct any unintended application of the guidance. The amendments in this update affected the guidance in ASC 606. ASC 606 was adopted by the Company on January 1, 2018 on a full retrospective basis, which required the Company to reflect the impact of the updated guidance for all periods presented. The adoption of ASC 606 did not have a material impact on the Company’s financial position or results of operations. See Note 4 for information on the impact of the adoption of ASC 606.
In November 2016, the FASB issued ASU No. 2016-18, Statement of Cash Flows (Topic 230): Restricted Cash, which requires that the statement of cash flows disclose the change during the period in the total of cash, cash equivalents, restricted cash and restricted cash equivalents. Restricted cash should be included with cash and cash equivalents when reconciling the beginning-of-period and end-of period total amounts shown on the statement of cash flows. ASU No. 2016-18 provides specific guidance on the presentation of restricted cash in the statement of cash flows. ASU No. 2016-18 was adopted by the Company on January 1, 2018 and was applied retrospectively for all periods presented.
In August 2016, the FASB issued ASU No. 2016-15, Statement of Cash Flows (Topic 230): Classification of Certain Cash Receipts and Cash Payments which clarifies how entities should classify certain cash receipts and cash payments on the statement of cash flows. ASU No. 2016-15 also clarifies how the predominance principle should be applied when cash receipts and cash payments have aspects of more than one class of cash flows. The Company adopted the new guidance on January 1, 2018 and it had no impact to the Company's consolidated financial statements.
In January 2016, the FASB issued ASU No. 2016-01, Financial Instruments - Overall (Subtopic 825-10), Recognition and Measurement of Financial Assets and Financial Liabilities. ASU No. 2016-01 modifies how entities measure certain equity investments and also modifies the recognition of changes in the fair value of financial liabilities measured under the fair value option. Entities will be required to measure equity investments that do not result in consolidation and are not accounted for under the equity method at fair value and recognize any changes in fair value in net income. For financial liabilities measured using the fair value option, entities will be required to record changes in fair value caused by a change in instrument-specific credit risk (own credit risk) separately in other comprehensive income. ASU No. 2016-01 was adopted by the Company on January 1, 2018 and it had no impact to the Company's consolidated financial statements.
In May 2014, the FASB issued ASU No. 2014-09, Revenue from Contracts with Customers ("ASC 606"), requiring an entity to recognize the amount of revenue to which it expects to be entitled for the transfer of promised goods or services to customers. ASC 606 replaced most existing revenue recognition guidance in GAAP (See Note 4).
Recently Issued But Not Yet Adopted Accounting Pronouncements
In August 2018, the FASB issued ASU No. 2018-14, Changes to the Disclosure Requirements for Defined Benefit Plans, which amends ASC 715 to clarify certain disclosure requirements related to defined benefit pension and other postretirement plans. ASU 2018-14 becomes effective for the Company on January 1, 2022, although early adoption is
F-22
ALTICE USA, INC. AND SUBSIDIARIES
NOTES TO CONSOLIDATED FINANCIAL STATEMENTS (continued)
(Dollars in thousands, except share and per share amounts)
permitted. The Company does not expect the adoption of ASU 2017-14 to have a material impact on its consolidated financial statements.
Also in August 2018, the FASB issued ASU No. 2018-15, Customer’s Accounting for Implementation Costs in a Cloud Computing Arrangement That Is a Service Contract, which requires upfront implementation costs incurred in a cloud computing arrangement (or hosting arrangement) that is a service contract to be amortized to hosting expense over the term of the arrangement, beginning when the module or component of the hosting arrangement is ready for its intended use. ASU No. 2018-14 becomes effective for the Company on January 1, 2020, although early adoption is permitted. The Company is currently in the process of evaluating the impact that the adoption of ASU No. 2018-15 will have on its consolidated financial statements.
In January 2017, the FASB issued ASU No. 2017-04, Intangibles-Goodwill and Other (Topic 350). ASU No. 2017-04 simplifies the subsequent measurement of goodwill by removing the second step of the two‑step impairment test. The amendment requires an entity to perform its annual, or interim goodwill impairment test by comparing the fair value of a reporting unit with its carrying amount. An entity still has the option to perform the qualitative assessment for a reporting unit to determine if the quantitative impairment test is necessary. ASU No. 2017-04 becomes effective for the Company on January 1, 2020 with early adoption permitted and will be applied prospectively.
In February 2016, the FASB issued ASU No. 2016-02, Leases, which increases transparency and comparability by recognizing a lessee’s rights and obligations resulting from leases by recording them on the balance sheet as lease assets and lease liabilities. The new guidance became effective for the Company on January 1, 2019. The Company will adopt the new guidance using the modified retrospective approach with a cumulative-effect adjustment recorded at the beginning of the period of adoption. The Company will elect the package of practical expedients permitted within the standard, which allow an entity to forgo reassessing (1) whether a contract contains a lease, (2) classification of leases, and (3) whether capitalized costs associated with a lease meet the definition of initial direct costs. Also, the Company will elect the expedient allowing an entity to use hindsight to determine the lease term and impairment of right of-use assets and the expedient related to land easements which allows the Company not to retrospectively treat land easements as leases; however, must apply lease accounting prospectively to land easements if they meet the definition of a lease. While the Company is continuing to assess the impacts of ASU No. 2016-02, it estimates that the adoption of ASU No. 2016-02 will result in the recognition of right-of-use assets and lease liabilities for operating leases of approximately
1%
of its total assets on its consolidated balance sheet, with no material impact to its consolidated statements of operations.
NOTE 4. CHANGE IN ACCOUNTING POLICIES AND ATS ACQUISITION
Adoption of ASC 606 - Revenue from Contracts with Customers
On January 1, 2018, the Company adopted the guidance pursuant to ASC 606. The Company elected to apply the guidance on a full retrospective basis, which required the Company to reflect the impact of the updated guidance for all periods presented. The adoption of the guidance resulted in the deferral of certain installation revenue, the deferral of certain commission expenses, and a reduction of revenue due to the reclassification of certain third-party giveaways and incentives from operating expense. Additionally, the Company made changes in the composition of revenue resulting from the allocation of value related to bundled services sold to residential customers at a discount.
Installation Services Revenue
Pursuant to ASC 606, the Company's installation services revenue is deferred and recognized over the benefit period. For residential customers, the benefit period is less than one year. For business and wholesale customers, the benefit period is the contract term. Prior to the adoption of ASC 606, the Company recognized installation services revenue for residential and SMB customers when installations were completed. As a result of the deferral of installation services revenue for residential and SMB customers, the Company recognized contract liabilities of
$6,978
and recorded a cumulative effect adjustment of
$5,093
(net of tax of
$1,885
) to retained earnings. The accounting for installation services revenue related to business and wholesale customers has not changed.
Commission Expenses
Pursuant to ASC 606, the Company defers commission expenses related to obtaining a contract with a customer when the expected amortization is greater than one year and amortizes these costs over the average contract term. For commission expenses related to customer contracts with a term of one year or less, the Company is utilizing the practical
F-23
ALTICE USA, INC. AND SUBSIDIARIES
NOTES TO CONSOLIDATED FINANCIAL STATEMENTS (continued)
(Dollars in thousands, except share and per share amounts)
expedient and is recognizing the costs when incurred. Prior to the adoption of ASC 606, the Company recognized commission expenses related to the sale of its services when incurred. As a result of the change in the timing of recognition of these commission expenses, the Company recognized contract assets of
$24,329
and recorded a cumulative effect adjustment of
$17,759
(net of tax of
$6,570
) to retained earnings.
Third-Party Product Giveaways and Incentives
When the Company acts as the agent in providing certain product giveaways or incentives, revenue is recorded net of the costs of the giveaways and incentives. For the periods prior to January 1, 2018, costs for the giveaways and incentives recorded in other operating expense have been reclassified to revenue.
Bundled Services
The Company provides bundled services at a discounted rate to its customers. Under ASC 606, revenue should be allocated to separate performance obligations within a bundled offering based on the relative stand-alone selling price of each service within the bundle.
In connection with the adoption of ASC 606, the Company revised the amounts allocated to each performance obligation within its bundled offerings which reduced previously reported revenue for telephony services and increased previously reported revenue allocated to pay television and broadband services.
Adoption of ASU No. 2017-07 - Compensation-Retirement Benefits (Topic 715)
On January 1, 2018, the Company adopted the guidance pursuant to ASU No. 2017‑07. ASU No. 2017‑07 requires that an employer disaggregate the service cost component from the other components of net benefit cost. In connection with the adoption of ASU No. 2017‑07, the Company retroactively reclassified certain pension costs from other operating expenses to other income (expense), net. The adoption of ASU No. 2017-07 had no impact on the Company's consolidated balance sheet.
Acquisition of Altice Technical Services US Corp
As discussed in Note 1, the Company completed the ATS Acquisition in the first quarter of 2018. ATS was previously owned by Altice Europe and a member of ATS's management through a holding company. As the acquisition is a combination of businesses under common control, the Company combined the results of operations and related assets and liabilities of ATS for all periods since the formation of ATS, including goodwill of
$23,101
, representing the amount previously transferred to ATS.
F-24
ALTICE USA, INC. AND SUBSIDIARIES
NOTES TO CONSOLIDATED FINANCIAL STATEMENTS (continued)
(Dollars in thousands, except share and per share amounts)
The following table summarizes the impact of adopting ASC 606 and the impact of the ATS Acquisition on the Company's consolidated balance sheet:
|
December 31, 2017
|
|||||||||||||||
|
As Reported
|
Impact of ASC 606
|
Impact of ATS Acquisition
|
As Adjusted
|
||||||||||||
|
Cash and cash equivalents
|
$
|
273,329
|
|
$
|
—
|
|
$
|
56,519
|
|
$
|
329,848
|
|
|||
|
Other current assets
|
580,231
|
|
14,068
|
|
(20,548
|
)
|
573,751
|
|
|||||||
|
Property, plant and equipment, net
|
6,063,829
|
|
—
|
|
(40,003
|
)
|
6,023,826
|
|
|||||||
|
Goodwill
|
7,996,760
|
|
—
|
|
23,101
|
|
8,019,861
|
|
|||||||
|
Other assets, long-term
|
19,861,076
|
|
10,261
|
|
(6,541
|
)
|
19,864,796
|
|
|||||||
|
Total assets
|
$
|
34,775,225
|
|
$
|
24,329
|
|
$
|
12,528
|
|
$
|
34,812,082
|
|
|||
|
Current liabilities
|
$
|
2,492,983
|
|
$
|
6,978
|
|
$
|
20,401
|
|
$
|
2,520,362
|
|
|||
|
Deferred tax liability
|
4,775,115
|
|
4,685
|
|
(10,514
|
)
|
4,769,286
|
|
|||||||
|
Liabilities, long-term
|
21,779,997
|
|
—
|
|
6,394
|
|
21,786,391
|
|
|||||||
|
Total liabilities
|
29,048,095
|
|
11,663
|
|
16,281
|
|
29,076,039
|
|
|||||||
|
Redeemable equity
|
231,290
|
|
—
|
|
—
|
|
231,290
|
|
|||||||
|
Paid-in-capital
|
4,642,128
|
|
—
|
|
23,101
|
|
4,665,229
|
|
|||||||
|
Retained earnings
|
854,824
|
|
12,666
|
|
(26,854
|
)
|
840,636
|
|
|||||||
|
Total stockholders' equity
|
5,495,840
|
|
12,666
|
|
(3,753
|
)
|
5,504,753
|
|
|||||||
|
Total liabilities and stockholders' equity
|
$
|
34,775,225
|
|
$
|
24,329
|
|
$
|
12,528
|
|
$
|
34,812,082
|
|
|||
The following table summarizes the impact of adopting ASC 606 and ASU No. 2017-07 and the impact of the ATS Acquisition on the Company's consolidated statements of operations:
|
Year Ended December 31, 2017
|
|||||||||||||||||
|
|
As Reported
|
Impact of ASC 606
|
Impact of ASU No. 2017-07
|
Impact of ATS Acquisition
|
As Adjusted
|
||||||||||||
|
Residential:
|
|||||||||||||||||
|
Pay TV
|
$
|
4,214,745
|
|
$
|
59,878
|
|
$
|
—
|
|
$
|
(501
|
)
|
$
|
4,274,122
|
|
||
|
Broadband
|
2,563,772
|
|
45,192
|
|
—
|
|
(369
|
)
|
2,608,595
|
|
|||||||
|
Telephony
|
823,981
|
|
(122,981
|
)
|
—
|
|
(235
|
)
|
700,765
|
|
|||||||
|
Business services and wholesale
|
1,298,817
|
|
(604
|
)
|
—
|
|
—
|
|
1,298,213
|
|
|||||||
|
Advertising
|
391,866
|
|
—
|
|
—
|
|
—
|
|
391,866
|
|
|||||||
|
Other
|
33,389
|
|
—
|
|
—
|
|
—
|
|
33,389
|
|
|||||||
|
Total revenue
|
9,326,570
|
|
(18,515
|
)
|
—
|
|
(1,105
|
)
|
9,306,950
|
|
|||||||
|
Programming and other direct costs
|
3,035,655
|
|
—
|
|
—
|
|
—
|
|
3,035,655
|
|
|||||||
|
Other operating expenses
|
2,342,655
|
|
(18,515
|
)
|
(11,863
|
)
|
35,038
|
|
2,347,315
|
|
|||||||
|
Restructuring and other expense
|
152,401
|
|
—
|
|
—
|
|
—
|
|
152,401
|
|
|||||||
|
Depreciation and amortization
|
2,930,475
|
|
—
|
|
—
|
|
96
|
|
2,930,571
|
|
|||||||
|
Operating income
|
865,384
|
|
—
|
|
11,863
|
|
(36,239
|
)
|
841,008
|
|
|||||||
|
Other expense, net
|
(2,196,733
|
)
|
—
|
|
(11,863
|
)
|
—
|
|
(2,208,596
|
)
|
|||||||
|
Loss before income taxes
|
(1,331,349
|
)
|
—
|
|
—
|
|
(36,239
|
)
|
(1,367,588
|
)
|
|||||||
|
Income tax benefit
|
2,852,967
|
|
—
|
|
—
|
|
9,385
|
|
2,862,352
|
|
|||||||
|
Net income
|
$
|
1,521,618
|
|
$
|
—
|
|
$
|
—
|
|
$
|
(26,854
|
)
|
$
|
1,494,764
|
|
||
F-25
ALTICE USA, INC. AND SUBSIDIARIES
NOTES TO CONSOLIDATED FINANCIAL STATEMENTS (continued)
(Dollars in thousands, except share and per share amounts)
|
Year Ended December 31, 2016
|
||||||||||||||
|
As Reported
|
Impact of ASC 606
|
Impact of ASU No. 2017-07
|
As Adjusted
|
|||||||||||
|
Residential:
|
||||||||||||||
|
Pay TV
|
$
|
2,759,216
|
|
$
|
29,657
|
|
$
|
—
|
|
$
|
2,788,873
|
|
||
|
Broadband
|
1,617,029
|
|
34,545
|
|
—
|
|
1,651,574
|
|
||||||
|
Telephony
|
529,973
|
|
(64,202
|
)
|
—
|
|
465,771
|
|
||||||
|
Business services and wholesale
|
819,541
|
|
—
|
|
—
|
|
819,541
|
|
||||||
|
Advertising
|
252,049
|
|
—
|
|
—
|
|
252,049
|
|
||||||
|
Other
|
39,404
|
|
—
|
|
—
|
|
39,404
|
|
||||||
|
Total revenue
|
6,017,212
|
|
—
|
|
—
|
|
6,017,212
|
|
||||||
|
Programming and other direct costs
|
1,911,230
|
|
—
|
|
—
|
|
1,911,230
|
|
||||||
|
Other operating expenses
|
1,705,615
|
|
—
|
|
(3,143
|
)
|
1,702,472
|
|
||||||
|
Restructuring and other expense
|
240,395
|
|
—
|
|
—
|
|
240,395
|
|
||||||
|
Depreciation and amortization
|
1,700,306
|
|
—
|
|
—
|
|
1,700,306
|
|
||||||
|
Operating income
|
459,666
|
|
—
|
|
3,143
|
|
462,809
|
|
||||||
|
Other expense, net
|
(1,550,811
|
)
|
—
|
|
(3,143
|
)
|
(1,553,954
|
)
|
||||||
|
Loss before income taxes
|
(1,091,145
|
)
|
—
|
|
—
|
|
(1,091,145
|
)
|
||||||
|
Income tax benefit
|
259,666
|
|
—
|
|
—
|
|
259,666
|
|
||||||
|
Net loss
|
$
|
(831,479
|
)
|
$
|
—
|
|
$
|
—
|
|
$
|
(831,479
|
)
|
||
NOTE 5. BUSINESS COMBINATIONS
ATS Acquisition
As the ATS acquisition discussed in Note 1 is a combination of businesses under common control, the Company combined the results of operations and related assets and liabilities of ATS for all periods since its formation. See Note 4 for the impact of the ATS Acquisition on the Company's consolidated balance sheet and statement of operations as of and for the year ended December 31, 2017.
Cablevision Acquisition
As discussed in Note 1, the Company completed the Cablevision Acquisition on
June 21, 2016
. The acquisition was accounted for as a business combination in accordance with ASC Topic 805. Accordingly, the Company recorded the fair value of the assets and liabilities assumed at the date of acquisition.
The following table provides the allocation of the total purchase price of
$9,958,323
to the identifiable tangible and intangible assets and liabilities of Cablevision based on their respective fair values. The remaining useful lives represent the period over which acquired tangible and intangible assets with a finite life are being depreciated or amortized.
F-26
ALTICE USA, INC. AND SUBSIDIARIES
NOTES TO CONSOLIDATED FINANCIAL STATEMENTS (continued)
(Dollars in thousands, except share and per share amounts)
|
Fair Values
|
Estimated Useful Lives
|
||||
|
Current assets
|
$
|
1,923,071
|
|
||
|
Accounts receivable
|
271,305
|
|
|||
|
Property, plant and equipment
|
4,864,621
|
|
2-18 years
|
||
|
Goodwill
|
5,842,172
|
|
|||
|
Indefinite-lived cable television franchises
|
8,113,575
|
|
Indefinite-lived
|
||
|
Customer relationships
|
4,850,000
|
|
8 to 18 years
|
||
|
Trade names (a)
|
1,010,000
|
|
12 years
|
||
|
Amortizable intangible assets
|
23,296
|
|
1-15 years
|
||
|
Other non-current assets
|
748,998
|
|
|||
|
Current liabilities
|
(2,311,201
|
)
|
|||
|
Long-term debt
|
(8,355,386
|
)
|
|||
|
Deferred income taxes.
|
(6,832,773
|
)
|
|||
|
Other non-current liabilities
|
(189,355
|
)
|
|||
|
Total
|
$
|
9,958,323
|
|
||
|
(a)
|
See Note 10 for additional information regarding a change in the remaining estimated useful lives of the Company's trade names.
|
The fair value of customer relationships and cable television franchises were valued using derivations of the "income" approach. The future expected earnings from these assets were discounted to their present value equivalent.
Trade names were valued using the relief from royalty method, which is based on the present value of the royalty payments avoided as a result of the company owning the intangible asset.
The basis for the valuation methods was the Company’s projections. These projections were based on management’s assumptions including among others, penetration rates for pay television, broadband, and telephony; revenue growth rates; operating margins; and capital expenditures. The assumptions are derived based on the Company’s and its peers’ historical operating performance adjusted for current and expected competitive and economic factors surrounding the cable industry. The discount rates used in the analysis are intended to reflect the risk inherent in the projected future cash flows generated by the respective intangible asset. The value is highly dependent on the achievement of the future financial results contemplated in the projections. The estimates and assumptions made in the valuation are inherently subject to significant uncertainties, many of which are beyond the Company's control, and there is no assurance that these results can be achieved. The primary assumptions for which there is a reasonable possibility of the occurrence of a variation that would have significantly affected the value include the assumptions regarding revenue growth, programming expense growth rates, the amount and timing of capital expenditures and the discount rate utilized.
In establishing fair value for the vast majority of the acquired property, plant and equipment, the cost approach was utilized. The cost approach considers the amount required to replace an asset by constructing or purchasing a new asset with similar utility, then adjusts the value in consideration of physical depreciation, and functional and economic obsolescence as of the appraisal date. The cost approach relies on management’s assumptions regarding current material and labor costs required to rebuild and repurchase significant components of property, plant and equipment along with assumptions regarding the age and estimated useful lives of property, plant and equipment.
The estimates of expected useful lives take into consideration the effects of contractual relationships, customer attrition, eventual development of new technologies and market competition.
Long-term debt assumed was valued using quoted market prices (Level 2). The carrying value of most other assets and liabilities approximated fair value as of the acquisition date.
As a result of applying business combination accounting, the Company recorded goodwill, which represented the excess of organization value over amounts assigned to the other identifiable tangible and intangible assets arising from expectations of future operational performance and cash generation.
F-27
ALTICE USA, INC. AND SUBSIDIARIES
NOTES TO CONSOLIDATED FINANCIAL STATEMENTS (continued)
(Dollars in thousands, except share and per share amounts)
The following table presents the unaudited pro forma revenue and net loss for the period presented as if the Cablevision Acquisition had occurred on January 1, 2016:
|
Year Ended December 31, 2016
|
|||
|
Revenue
|
$
|
9,154,816
|
|
|
Net loss
|
$
|
(721,257
|
)
|
The pro forma results presented above include the impact of additional amortization expense related to the identifiable intangible assets recorded in connection with the Cablevision Acquisition, additional depreciation expense related to the fair value adjustment to property, plant and equipment and the incremental interest resulting from the issuance of debt to fund the Cablevision Acquisition, net of the reversal of interest and amortization of deferred financing costs related to credit facilities that were repaid on the date of the Cablevision Acquisition and the accretion/amortization of fair value adjustments associated with the long-term debt acquired.
Other Acquisitions
In connection with certain acquisitions completed in 2018, the Company recorded goodwill of
$7,608
which represents the excess of the estimated purchase price of approximately
$9,945
(based on current probability of contingent consideration) over the net book value of assets acquired.
In connection with certain acquisitions completed in the first and fourth quarters of 2017, the Company recorded amortizable intangibles of
$45,000
relating to customer relationships and
$9,400
relating to other amortizable intangibles. The Company recorded goodwill of
$23,936
, which represents the excess of the estimated purchase price of approximately
$80,000
over the net book value of assets acquired.
NOTE 6. SUPPLEMENTAL CASH FLOW INFORMATION
The Company's non-cash investing and financing activities and other supplemental data were as follows:
|
Years Ended December 31,
|
|||||||||||
|
2018
|
2017
|
2016
|
|||||||||
|
Non-Cash Investing and Financing Activities:
|
|||||||||||
|
Conversion of notes payable to affiliates and related parties of $1,750,000 (together with accrued and unpaid interest and applicable premium) to common stock (See Note 11)
|
$
|
—
|
|
$
|
2,264,252
|
|
$
|
—
|
|
||
|
Property and equipment accrued but unpaid
|
213,936
|
|
171,604
|
|
155,653
|
|
|||||
|
Distributions declared but not paid
|
—
|
|
—
|
|
79,617
|
|
|||||
|
Leasehold improvements paid by landlord
|
350
|
|
3,998
|
|
—
|
|
|||||
|
Notes payable issued to vendor for the purchase of equipment
|
95,394
|
|
40,131
|
|
12,449
|
|
|||||
|
Capital lease obligations
|
13,548
|
|
9,385
|
|
—
|
|
|||||
|
Deferred financing costs accrued but unpaid
|
1,005
|
|
—
|
|
2,570
|
|
|||||
|
Contingent consideration for acquisitions
|
6,195
|
|
32,233
|
|
—
|
|
|||||
|
Receivable related to the sale of an investment
|
4,015
|
|
—
|
|
—
|
|
|||||
|
Supplemental Data:
|
|||||||||||
|
Cash interest paid
|
1,481,468
|
|
1,765,126
|
|
1,192,370
|
|
|||||
|
Income taxes paid, net
|
13,667
|
|
29,006
|
|
1,538
|
|
|||||
F-28
ALTICE USA, INC. AND SUBSIDIARIES
NOTES TO CONSOLIDATED FINANCIAL STATEMENTS (continued)
(Dollars in thousands, except share and per share amounts)
NOTE 7. RESTRUCTURING AND OTHER EXPENSE
Restructuring
Beginning in the first quarter of 2016, the Company commenced restructuring initiatives that were intended to simplify the Company's organizational structure.
|
The following table summarizes the activity for these initiatives:
|
|||||||||||
|
Severance and Other Employee Related Costs
|
Facility Realignment and Other Costs
|
Total
|
|||||||||
|
Restructuring charges incurred in 2016
|
$
|
215,420
|
|
$
|
11,157
|
|
$
|
226,577
|
|
||
|
Payments and other
|
(113,301
|
)
|
(2,760
|
)
|
(116,061
|
)
|
|||||
|
Accrual balance at December 31, 2016
|
102,119
|
|
8,397
|
|
110,516
|
|
|||||
|
Restructuring charges
|
142,679
|
|
7,243
|
|
149,922
|
|
|||||
|
Payments and other
|
(131,324
|
)
|
(6,014
|
)
|
(137,338
|
)
|
|||||
|
Accrual balance at December 31, 2017
|
$
|
113,474
|
|
$
|
9,626
|
|
$
|
123,100
|
|
||
|
Restructuring charges
|
15,580
|
|
15,447
|
|
31,027
|
|
|||||
|
Payments and other
|
(107,600
|
)
|
(11,458
|
)
|
(119,058
|
)
|
|||||
|
Accrual balance at December 31, 2018
|
$
|
21,454
|
|
$
|
13,615
|
|
$
|
35,069
|
|
||
Cumulative costs to date relating to these initiatives amounted to
$407,526
.
Transaction Costs
For the year ended
December 31, 2018
, the Company incurred transaction costs of
$7,521
relating to the Distribution discussed in Note 1. For the year ended
December 31, 2017
, the Company incurred transaction costs of
$2,479
related to the acquisition of a business during the first quarter of 2017 and other transactions. For the year ended
December 31, 2016
, the Company incurred transaction costs of
$13,845
, related primarily to the acquisition of Cablevision.
NOTE 8. PROPERTY, PLANT AND EQUIPMENT
Costs incurred in the construction of the Company's cable systems, including line extensions to, and upgrade of, the Company's hybrid fiber/coaxial infrastructure and construction of the parallel fiber to the home ("FTTH") infrastructure, are capitalized. This includes initial placement of the feeder cable to connect a customer that had not been previously connected, and headend facilities. These costs consist of materials, subcontractor labor, direct consulting fees, and internal labor and related costs associated with the construction activities. The internal costs that are capitalized consist of salaries and benefits of the Company's employees and the portion of facility costs, including rent, taxes, insurance and utilities, that supports the construction activities. These costs are depreciated over the estimated life of the plant (
10
to
25
years) and headend facilities (
5
to
25
years). Costs of operating the plant and the technical facilities, including repairs and maintenance, are expensed as incurred.
Installation costs associated with the initial deployment of new customer premise equipment (“CPE”) necessary to provide pay television, broadband or telephony services are also capitalized. These costs include materials, subcontractor labor, internal labor, and other related costs associated with the connection activities. The departmental activities supporting the connection process are tracked through specific metrics, and the portion of departmental costs that is capitalized is determined through a time weighted activity allocation of costs incurred based on time studies used to estimate the average time spent on each activity. These installation costs are amortized over the estimated useful lives of the CPE necessary to provide pay television, broadband or telephony services. The portion of departmental costs related to disconnecting services and removing CPE from a customer, costs related to connecting CPE that has been previously connected to the network and repair and maintenance are expensed as incurred.
The estimated useful lives assigned to our property, plant and equipment are reviewed on an annual basis or more frequently if circumstances warrant and such lives are revised to the extent necessary due to changing facts and circumstances. Any changes in estimated useful lives are reflected prospectively.
F-29
ALTICE USA, INC. AND SUBSIDIARIES
NOTES TO CONSOLIDATED FINANCIAL STATEMENTS (continued)
(Dollars in thousands, except share and per share amounts)
Property, plant and equipment (including equipment under capital leases) consist of the following assets, which are depreciated or amortized on a straight-line basis over the estimated useful lives shown below:
|
|
December 31, 2018
|
December 31, 2017
|
Estimated
Useful Lives
|
||||||
|
Customer premise equipment
|
$
|
1,354,510
|
|
$
|
1,093,726
|
|
3 to 5 years
|
||
|
Headends and related equipment
|
1,852,105
|
|
1,626,293
|
|
5 to 25 years
|
||||
|
Infrastructure
|
4,595,143
|
|
4,003,845
|
|
5 to 25 years
|
||||
|
Equipment and software
|
1,083,166
|
|
918,298
|
|
3 to 10 years
|
||||
|
Construction in progress (including materials and supplies)
|
215,684
|
|
240,496
|
|
|
||||
|
Furniture and fixtures
|
57,448
|
|
52,545
|
|
5 to 8 years
|
||||
|
Transportation equipment
|
146,387
|
|
138,147
|
|
5 to 10 years
|
||||
|
Buildings and building improvements
|
411,573
|
|
394,421
|
|
10 to 40 years
|
||||
|
Leasehold improvements
|
109,110
|
|
108,071
|
|
Term of lease
|
||||
|
Land
|
48,426
|
|
47,563
|
|
|
||||
|
|
9,873,552
|
|
8,623,405
|
|
|
||||
|
Less accumulated depreciation and amortization
|
(4,044,671
|
)
|
(2,599,579
|
)
|
|
||||
|
|
$
|
5,828,881
|
|
$
|
6,023,826
|
|
|
||
For the years ended
December 31, 2018
,
2017
and
2016
the Company capitalized certain costs aggregating
$134,265
,
$151,646
and
$75,804
, respectively, related to the acquisition and development of internal use software, which are included in the table above.
Depreciation expense on property, plant and equipment (including capital leases) for the years ended
December 31, 2018
,
2017
and
2016
amounted to
$1,508,125
,
$1,588,764
and
$1,046,896
, respectively.
The gross amount of buildings and equipment and related accumulated depreciation recorded under capital leases is presented below:
|
December 31,
|
|||||||
|
2018
|
2017
|
||||||
|
Buildings and equipment
|
$
|
41,554
|
|
$
|
48,936
|
|
|
|
Less accumulated depreciation
|
(10,663
|
)
|
(12,972
|
)
|
|||
|
|
$
|
30,891
|
|
$
|
35,964
|
|
|
NOTE 9. OPERATING LEASES
The Company leases certain office, production, and transmission facilities, as well as office equipment, under terms of leases expiring at various dates through 2044. The leases generally provide for escalating rentals over the term of the lease plus certain real estate taxes and other costs or credits. Costs associated with such operating leases are recognized on a straight-line basis over the initial lease term. The difference between rent expense and rent paid is recorded as deferred rent. Rent expense for the years ended
December 31, 2018
,
2017
and
2016
amounted to
$104,298
,
$95,017
and
$65,881
, respectively.
The minimum future annual payments for all operating leases (with initial or remaining terms in excess of one year) during the next five years and thereafter, at rates now in force are as follows:
F-30
ALTICE USA, INC. AND SUBSIDIARIES
NOTES TO CONSOLIDATED FINANCIAL STATEMENTS (continued)
(Dollars in thousands, except share and per share amounts)
|
2019
|
$
|
47,905
|
|
|
2020
|
50,356
|
|
|
|
2021
|
43,362
|
|
|
|
2022
|
34,882
|
|
|
|
2023
|
25,234
|
|
|
|
Thereafter
|
167,941
|
|
|
NOTE 10. INTANGIBLE ASSETS
The following table summarizes information relating to the Company's acquired amortizable intangible assets:
|
As of December 31, 2018
|
As of December 31, 2017
|
||||||||||||||||||||||||
|
Gross Carrying Amount
|
Accumulated Amortization
|
Net Carrying Amount
|
Gross Carrying Amount
|
Accumulated Amortization
|
Net Carrying Amount
|
Estimated Useful Lives
|
|||||||||||||||||||
|
Customer relationships
|
$
|
5,970,884
|
|
$
|
(2,162,110
|
)
|
$
|
3,808,774
|
|
$
|
5,970,884
|
|
$
|
(1,409,021
|
)
|
$
|
4,561,863
|
|
8 to 18 years
|
||||||
|
Trade names (a)
|
1,067,083
|
|
(701,998
|
)
|
365,085
|
|
1,067,083
|
|
(588,574
|
)
|
478,509
|
|
2 to 5 years
|
||||||||||||
|
Other amortizable intangibles
|
37,644
|
|
(18,679
|
)
|
18,965
|
|
37,060
|
|
(10,978
|
)
|
26,082
|
|
1 to 15 years
|
||||||||||||
|
$
|
7,075,611
|
|
$
|
(2,882,787
|
)
|
$
|
4,192,824
|
|
$
|
7,075,027
|
|
$
|
(2,008,573
|
)
|
$
|
5,066,454
|
|
||||||||
|
(a)
|
On May 23, 2017, Altice Europe announced the adoption of a global brand to replace the Company's brands in the future, reducing the remaining useful lives of these trade name intangibles to
three years
from the date of the adoption, which reflected
one year
as an in-use asset and
two years
as a defensive asset. In December 2017, the Company made a decision to postpone the adoption of a global brand that would have replaced the Optimum brand, increasing the useful life of the Optimum trade name intangible asset to
5 years
.
|
Amortization expense for the years ended
December 31, 2018
,
2017
and
2016
aggregated
$874,214
,
$1,341,807
and
$653,410
, respectively.
The following table sets forth the estimated amortization expense on intangible assets for the periods presented:
|
Estimated amortization expense
|
|||
|
Year Ending December 31, 2019
|
$
|
778,922
|
|
|
Year Ending December 31, 2020
|
697,316
|
|
|
|
Year Ending December 31, 2021
|
617,794
|
|
|
|
Year Ending December 31, 2022
|
532,998
|
|
|
|
Year Ending December 31, 2023
|
371,198
|
|
|
F-31
ALTICE USA, INC. AND SUBSIDIARIES
NOTES TO CONSOLIDATED FINANCIAL STATEMENTS (continued)
(Dollars in thousands, except share and per share amounts)
The carrying amount of goodwill is presented below:
|
Goodwill as of January 1, 2016
|
$
|
2,040,402
|
|
|
Goodwill recorded in connection with Cablevision Acquisition
|
5,838,959
|
|
|
|
Adjustments to purchase accounting relating to Cequel Acquisition
|
113,339
|
|
|
|
Goodwill as of December 31, 2016
|
7,992,700
|
|
|
|
Goodwill recorded in connection with acquisitions in the first and fourth quarter of 2017
|
23,948
|
|
|
|
Adjustments to purchase accounting relating to Cablevision Acquisition
|
3,213
|
|
|
|
Goodwill as of December 31, 2017
|
8,019,861
|
|
|
|
Reclassification of goodwill to property, plant and equipment related to Cequel
|
(15,041
|
)
|
|
|
Goodwill recorded in connection with an acquisition during the third quarter of 2018
|
7,608
|
|
|
|
Adjustment to purchase accounting relating to business acquired in fourth quarter of 2017
|
(12
|
)
|
|
|
Goodwill as of December 31, 2018
|
$
|
8,012,416
|
|
NOTE 11. DEBT
Credit Silo Combination
In October 2018, the Company combined its Suddenlink and Optimum businesses under a single credit silo (the “Combination”). The integration of the Suddenlink and Optimum businesses was aimed at aligning Altice USA’s debt capital structure and to simplify Altice USA’s financing strategy and financial reporting requirements. The Combination was effected mainly by the following transactions:
|
•
|
In October 2018, Altice US Finance, Cequel Capital Corporation and Cequel Communications Holdings I, LLC (“CCHI”) commenced an offer to exchange (the "Exchange Offer") any and all outstanding senior notes and senior secured notes issued by them (the "Original Cequel Notes") for up to
$5,520,000
aggregate principal amount of new notes (the "New Cequel Notes") and, in the case of the
5.375%
secured notes due 2023 and
5.500%
secured notes due 2026, and cash of
$6,500
. The Exchange Offer was accompanied by a consent solicitation to amend the terms of each series of the notes subject to the Exchange Offer (except the
5.125%
Senior Notes due 2021) and the indentures governing such notes. Approximately
$5,500,050
of the outstanding notes subject to the Exchange Offer were exchanged into corresponding series of New Cequel Notes. The proposed amendments in the consent solicitation, which have become operative effective November 27, 2018 (the “Combination Date”), eliminated or waived substantially all of the restrictive covenants, eliminated certain events of default, and modified or eliminated certain other provisions governing the Original Cequel Notes (except the
5.125%
Senior Notes due 2021) to the extent that they remain outstanding.
|
|
•
|
In October 2018, CSC Holdings entered into a Sixth Amendment to the CSC Credit Facilities Agreement (the “Combination Incremental Term Loan Agreement”). The Combination Incremental Term Loan Agreement provided for, among other things, new incremental term loan commitments in an aggregate principal amount of
$1,275,000
.
|
On or following the Combination Date the following transactions were completed:
|
•
|
The Company redeemed
$5,206
principal amount of the Original Cequel Notes that were outstanding after the consummation of the Exchange Offer.
|
|
•
|
New Cequel Notes with an aggregate principal balance of
$5,500,050
were converted into
$5,499,156
principal amount of CSC Holdings senior note (see detail below).
|
|
•
|
Pursuant to the Combination Incremental Term Loan Agreement, on the Combination Date, CSC Holdings entered into a
$1,275,000
7
-year incremental term loan maturing January 2026 (the “Incremental Term Loan B-3”). The proceeds from the Incremental Term Loan B-3 were used to repay the entire principal amount of loans under Cequel’s existing Term Loan Facility and other transaction costs related to the Combination. The Incremental Term Loan B-3 has a margin of
2.25%
over LIBOR and was issued with an original issue discount of
25
basis points. The Company is required to make scheduled quarterly payments equal to
0.25%
(or
$3,188
)
|
F-32
ALTICE USA, INC. AND SUBSIDIARIES
NOTES TO CONSOLIDATED FINANCIAL STATEMENTS (continued)
(Dollars in thousands, except share and per share amounts)
of the principal amount of the Incremental Term Loan B-3, beginning with the fiscal quarter ended June 30, 2019, with the remaining balance scheduled to be paid on January 15, 2026.
|
•
|
The Combination was implemented by a series of corporate transactions, including: (i) CCHI merging into Cablevision, with Cablevision as the surviving entity (the “Holdco Merger”), and (ii) Cequel Communications Holdings II, LLC (the direct parent of Cequel) merging into CSC Holdings, with CSC Holdings as the surviving entity. In connection with the Holdco Merger, Cablevision assumed all of the obligations of CCHI that remained outstanding after giving effect to the Combination Exchange under the indentures governing the outstanding Original Cequel Notes.
|
The following is a summary of the results of the Exchange Offer:
|
Original Cequel Notes
|
Remaining Original Cequel Notes
|
Notes Redeemed in Cash
|
Principal of New CSC Holdings Notes
|
||||||||||||
|
5.375% Senior Secured Notes due 2023
|
$
|
1,100,000
|
|
$
|
—
|
|
$
|
4,157
|
|
$
|
1,095,825
|
|
|||
|
5.5% Senior Secured Notes due 2026
|
1,500,000
|
|
—
|
|
1,049
|
|
1,498,806
|
|
|||||||
|
5.125% Senior Notes due 2021
|
1,250,000
|
|
8,886
|
|
—
|
|
1,240,762
|
|
|||||||
|
7.75% Senior Notes due 2025
|
620,000
|
|
1,740
|
|
—
|
|
617,881
|
|
|||||||
|
7.5% Senior Notes due 2028
|
1,050,000
|
|
4,118
|
|
—
|
|
1,045,882
|
|
|||||||
|
$
|
5,520,000
|
|
$
|
14,744
|
|
$
|
5,206
|
|
$
|
5,499,156
|
|
||||
CSC Holdings Credit Facilities
In connection with the Cablevision Acquisition, in October 2015, Finco, a wholly-owned subsidiary of Altice USA, which merged with and into CSC Holdings on June 21, 2016, entered into a senior secured credit facility, which provides U.S. dollar term loans currently in an aggregate principal amount of
$3,000,000
(
$2,955,000
outstanding at
December 31, 2018
) (the “CSC Term Loan Facility”, and the term loans extended under the CSC Term Loan Facility, the “CSC Term Loans”) and U.S. dollar revolving loan commitments in an aggregate principal amount of
$2,300,000
(the “CSC Revolving Credit Facility” and, together with the Term Loan Facility, the “CSC Credit Facilities”), which are governed by a credit facilities agreement entered into by,
inter alios
, CSC Holdings, certain lenders party thereto and JPMorgan Chase Bank, N.A. as administrative agent and security agent (as amended, restated, supplemented or otherwise modified on June 20, 2016, June 21, 2016, July 21, 2016, September 9, 2016, December 9, 2016, March 15, 2017, January 12, 2018 and October 15, 2018, respectively, and as further amended, restated, supplemented or otherwise modified from time to time, the “CSC Credit Facilities Agreement”).
CSC Holdings and those of its subsidiaries which conduct our broadband, pay television and telephony services operations, as well as Lightpath, which provides Ethernet-based data, Internet, voice and video transport and managed services to the business market, comprise the "Restricted Group" as they are subject to the covenants and restrictions of the credit facility and indentures governing the notes and debentures issued by CSC Holdings. In addition, the Restricted Group is also subject to the covenants of the debt issued by Cablevision.
Borrowings under the CSC Revolving Credit Facility are comprised of eurodollar borrowings or alternate base rate borrowings, and bear interest at a rate per annum equal to the adjusted LIBO rate or the alternate base rate, as applicable, plus the applicable margin, where the applicable margin is (i) with respect to any alternate base rate loan,
2.25%
per annum and (ii) with respect to any eurodollar loan,
3.25%
per annum.
The amendment to the CSC Credit Facilities Agreement entered into on September 9, 2016, extended the maturity date of the CSC Term Loan Facility to October 11, 2024. In October 2016, CSC Holdings used the net proceeds from the sale of
$1,310,000
aggregate principal amount of
5.5%
senior guaranteed notes due 2027 (the ‘‘2027 Guaranteed Notes’’) (after the deduction of fees and expenses) to prepay outstanding loans under the CSC Holdings Term Credit Facility that were not extended pursuant to this amendment. In connection with the prepayment of the Term Credit Facility, the Company wrote-off the deferred financing costs and the unamortized discount related to the existing term loan aggregating
$102,894
. Additionally, the Company recorded deferred financing costs and an original issue discount of
$7,249
and
$6,250
, respectively, which were subsequently written-off in connection with the Extension Amendment discussed below.
F-33
ALTICE USA, INC. AND SUBSIDIARIES
NOTES TO CONSOLIDATED FINANCIAL STATEMENTS (continued)
(Dollars in thousands, except share and per share amounts)
The amendment to the CSC Credit Facilities Agreement entered into on March 15, 2017 (“Extension Amendment”) increased the Term Loan by
$500,000
to
$3,000,000
and the maturity date for this facility was extended to July 17, 2025. The closing of the Extension Amendment occurred in April 2017 and the proceeds were used to refinance the entire
$2,493,750
principal amount of existing Term Loans and redeem
$500,000
of the
8.625%
Senior Notes due September 2017 issued by Cablevision. In connection with the Extension Amendment and the redemption of the senior notes, the Company recorded a loss on extinguishment of debt and write-off of deferred financing costs aggregating
$18,976
. The Term Loan is comprised of eurodollar borrowings or alternate base rate borrowings, and bears interest at a rate per annum equal to the adjusted LIBO rate or the alternate base rate, as applicable, plus the applicable margin, where the applicable margin is (i) with respect to any alternate base rate loan,
1.25%
per annum and (ii) with respect to any eurodollar loan,
2.25%
per annum. The Company is required to make scheduled quarterly payments equal to
0.25%
(or
$7,500
) of the principal amount of the Term Loan, beginning with the fiscal quarter ended September 30, 2017, with the remaining balance scheduled to be paid on July 17, 2025. The Company recorded deferred financing costs and an original issue discount of
$4,390
and
$15,000
, respectively, which are both being amortized to interest expense over the term of the Term Loan.
In January 2018, CSC Holdings entered into a new
$1,500,000
incremental term loan facility (the "Incremental Term Loan B-2") under its existing credit facilities agreement. The Incremental Term Loan B-2 was priced at
99.5%
and will mature on January 25, 2026. The Incremental Term Loan B-2 is comprised of eurodollar borrowings or alternate base rate borrowings, and bears interest at a rate per annum equal to the adjusted LIBO rate or the alternate base rate, as applicable, plus the applicable margin, where the applicable margin is (i) with respect to any alternate base rate loan,
1.50%
per annum and (ii) with respect to any eurodollar loan,
2.50%
per annum. The Company is required to make scheduled quarterly payments equal to
0.25%
(or
$3,750
) of the principal amount of the Incremental Term Loan B-2, beginning with the fiscal quarter ended September 30, 2018, with the remaining balance scheduled to be paid on January 26, 2026.
See discussion above under "Credit Silo Combination" regarding the Sixth Amendment to the CSC Credit Facilities Agreement, which provided for, among other things, new incremental term loan commitments in an aggregate principal amount of
$1,275,000
.
The CSC Credit Facilities Agreement requires the prepayment of outstanding CSC Term Loans, subject to certain exceptions and deductions, with (i)
100%
of the net cash proceeds of certain asset sales, subject to reinvestment rights and certain other exceptions; and (ii) commencing with the fiscal year ending December 31, 2017, a pari ratable share (based on the outstanding principal amount of the Term Loans divided by the sum of the outstanding principal amount of all pari passu indebtedness and the Term Loans) of
50%
of annual excess cash flow, which will be reduced to
0%
if the consolidated net senior secured leverage ratio of CSC Holdings is less than or equal to
4.5
to 1.
The obligations under the CSC Credit Facilities are guaranteed by each restricted subsidiary of CSC Holdings (other than CSC TKR, LLC and its subsidiaries and certain excluded subsidiaries) (the “Initial Guarantors”) and, subject to certain limitations, will be guaranteed by each future material wholly-owned restricted subsidiary of CSC Holdings. The obligations under the CSC Credit Facilities (including any guarantees thereof) are secured on a first priority basis, subject to any liens permitted by the Credit Facilities, by capital stock held by CSC Holdings or any guarantor in certain subsidiaries of CSC Holdings, subject to certain exclusions and limitations.
The CSC Credit Facilities Agreement includes certain negative covenants which, among other things and subject to certain significant exceptions and qualifications, limit CSC Holdings' ability and the ability of its restricted subsidiaries to: (i) incur or guarantee additional indebtedness, (ii) make investments, (iii) create liens, (iv) sell assets and subsidiary stock, (v) pay dividends or make other distributions or repurchase or redeem our capital stock or subordinated debt, (vi) engage in certain transactions with affiliates, (vii) enter into agreements that restrict the payment of dividends by subsidiaries or the repayment of intercompany loans and advances; and (viii) engage in mergers or consolidations. In addition, the CSC Revolving Credit Facility includes a financial maintenance covenant solely for the benefit of the lenders under the CSC Revolving Credit Facility consisting of a maximum consolidated net senior secured leverage ratio of CSC Holdings and its restricted subsidiaries of
5.0
to 1.0. The financial covenant will be tested on the last day of any fiscal quarter, but only if on such day there are outstanding borrowings under the CSC Revolving Credit Facility (including swingline loans but excluding any cash collateralized letters of credit and undrawn letters of credit not to exceed
$15,000
).
F-34
ALTICE USA, INC. AND SUBSIDIARIES
NOTES TO CONSOLIDATED FINANCIAL STATEMENTS (continued)
(Dollars in thousands, except share and per share amounts)
The CSC Credit Facilities Agreement also contains certain customary representations and warranties, affirmative covenants and events of default (including, among others, an event of default upon a change of control). If an event of default occurs, the lenders under the CSC Credit Facilities will be entitled to take various actions, including the acceleration of amounts due under the CSC Credit Facilities and all actions permitted to be taken by a secured creditor.
CSC Holdings was in compliance with all of its financial covenants under the CSC Credit Facilities as of
December 31, 2018
.
Cequel Credit Facilities
In October 2018, in connection with the Combination described above, amounts outstanding pursuant to the Cequel Credit Facilities, defined below, aggregating
$1,249,188
were repaid from the proceeds of the CSC Holdings Senior Secured Term Loan B and all commitments pursuant to the Cequel Credit Facilities were cancelled.
Prior to the Combination, an indirect wholly-owned subsidiary of Cequel had entered into a senior secured credit facility which provided term loans in an aggregate principal amount of
$1,265,000
(the “Cequel Term Loan Facility”) and revolving loan commitments in an aggregate principal amount of
$350,000
(the “Cequel Revolving Credit Facility” and, together with the Cequel Term Loan Facility, the “Cequel Credit Facilities”). The Company was required to make scheduled quarterly payments equal to
0.25%
(or
$3,163
) of the principal amount of the outstanding Cequel term loan, beginning with the fiscal quarter ended September 30, 2017, with the remaining balance scheduled to be paid on July 28, 2025.
In April 2017, Cequel used proceeds from the term loan facility to refinance the entire
$812,963
principal amount of loans under the then outstanding term loan and redeem
$450,000
of the
6.375%
Senior Notes due September 15, 2020. In connection with the redemption of the senior notes, the Company recorded a loss on extinguishment of debt and write-off of deferred financing costs aggregating
$28,684
.
Loans comprising each eurodollar borrowing or alternate base rate borrowing, as applicable, bore interest at a rate per annum equal to the adjusted LIBO rate or the alternate base rate, as applicable, plus the applicable margin, where the applicable margin was:
|
•
|
in respect of the Cequel term loans, (i) with respect to any alternate base rate loan,
1.25%
per annum and (ii) with respect to any eurodollar loan,
2.25%
per annum, and
|
|
•
|
in respect of Cequel Revolving Credit Facility loans (i) with respect to any alternate base rate loan,
2.25%
per annum and (ii) with respect to any eurodollar loan,
3.25%
per annum.
|
The following table provides details of the Company's outstanding credit facility debt:
|
Interest Rate at December 31, 2018
|
December 31, 2018
|
December 31, 2017
|
|||||||||||||||||
|
|
Maturity Date
|
Principal Amount
|
Carrying Amount (a)
|
Principal Amount
|
Carrying Amount (a)
|
||||||||||||||
|
CSC Holdings Restricted Group:
|
|||||||||||||||||||
|
Revolving Credit Facility (b)
|
$20,000 on October 9, 2020, remaining balance on November 30, 2021 (d)
|
5.71%
|
$
|
250,000
|
|
$
|
231,425
|
|
$
|
450,000
|
|
$
|
425,488
|
|
|||||
|
Term Loan B
|
July 17, 2025
|
4.71%
|
2,955,000
|
|
2,939,425
|
|
2,985,000
|
|
2,967,818
|
|
|||||||||
|
Incremental Term Loan B-2
|
January 25, 2026
|
4.96%
|
1,492,500
|
|
1,475,778
|
|
—
|
|
—
|
|
|||||||||
|
Incremental Term Loan B-3 (c)
|
January 15, 2026
|
4.75%
|
1,275,000
|
|
1,268,931
|
|
—
|
|
—
|
|
|||||||||
|
Cequel:
|
|||||||||||||||||||
|
Term Loan Facility (c)
|
|
—
|
|
—
|
|
1,258,675
|
|
1,250,217
|
|
||||||||||
|
$
|
5,972,500
|
|
5,915,559
|
|
$
|
4,693,675
|
|
4,643,523
|
|
||||||||||
|
Less: Current portion
|
54,563
|
|
42,650
|
|
|||||||||||||||
|
Long-term debt
|
$
|
5,860,996
|
|
$
|
4,600,873
|
|
|||||||||||||
|
|
F-35
ALTICE USA, INC. AND SUBSIDIARIES
NOTES TO CONSOLIDATED FINANCIAL STATEMENTS (continued)
(Dollars in thousands, except share and per share amounts)
|
(a)
|
The carrying amount is net of the unamortized deferred financing costs and/or discounts/premiums.
|
|
(b)
|
At
December 31, 2018
,
$147,564
of the revolving credit facility was restricted for certain letters of credit issued on behalf of the Company and
$1,902,436
of the facility was undrawn and available, subject to covenant limitations.
|
|
(c)
|
Proceeds from the CSC Holdings term loan were used to repay outstanding amount under the Cequel Term loan in October 2018 in connection with the Combination. See discussion above.
|
|
(d)
|
See Note 21 for a discussion of the Company's refinancing of the Revolving Credit Facility.
|
F-36
ALTICE USA, INC. AND SUBSIDIARIES
NOTES TO CONSOLIDATED FINANCIAL STATEMENTS (continued)
(Dollars in thousands, except share and per share amounts)
Senior Guaranteed Notes, Senior Secured Notes, and Senior Notes and Debentures
The following table summarizes the Company's senior guaranteed notes, senior secured notes and senior notes and debentures:
|
Interest Rate
|
December 31, 2018
|
December 31, 2017
|
|||||||||||||||||||
|
Date Issued
|
Maturity Date
|
Principal Amount
|
Carrying Amount (a)
|
Principal Amount
|
Carrying Amount (a)
|
||||||||||||||||
|
CSC Holdings Senior Notes:
|
|||||||||||||||||||||
|
February 6, 1998
|
February 15, 2018
|
7.875
|
%
|
$
|
—
|
|
$
|
—
|
|
$
|
300,000
|
|
$
|
301,184
|
|
||||||
|
July 21, 1998
|
July 15, 2018
|
7.625
|
%
|
(e)
|
—
|
|
—
|
|
500,000
|
|
507,744
|
|
|||||||||
|
February 12, 2009
|
February 15, 2019
|
8.625
|
%
|
(h)
|
526,000
|
|
527,749
|
|
526,000
|
|
541,165
|
|
|||||||||
|
November 15, 2011
|
November 15, 2021
|
6.750
|
%
|
1,000,000
|
|
969,285
|
|
1,000,000
|
|
960,146
|
|
||||||||||
|
May 23, 2014
|
June 1, 2024
|
5.250
|
%
|
750,000
|
|
671,829
|
|
750,000
|
|
660,601
|
|
||||||||||
|
October 9, 2015
|
January 15, 2023
|
10.125
|
%
|
(h)
|
1,800,000
|
|
1,781,424
|
|
1,800,000
|
|
1,777,914
|
|
|||||||||
|
October 9, 2015
|
October 15, 2025
|
10.875
|
%
|
1,684,221
|
|
1,663,027
|
|
1,684,221
|
|
1,661,135
|
|
||||||||||
|
November 27, 2018
|
December 15, 2021
|
5.125
|
%
|
(g)
|
1,240,762
|
|
1,155,264
|
|
—
|
|
—
|
|
|||||||||
|
November 27, 2018
|
July 15, 2025
|
7.750
|
%
|
(g)
|
617,881
|
|
603,889
|
|
—
|
|
—
|
|
|||||||||
|
November 27, 2018
|
April 1, 2028
|
7.500
|
%
|
(g)
|
1,045,882
|
|
1,044,143
|
|
—
|
|
—
|
|
|||||||||
|
CSC Holdings Senior Guaranteed Notes:
|
|||||||||||||||||||||
|
October 9, 2015
|
October 15, 2025
|
6.625
|
%
|
1,000,000
|
|
988,052
|
|
1,000,000
|
|
986,717
|
|
||||||||||
|
September 23, 2016
|
April 15, 2027
|
5.500
|
%
|
1,310,000
|
|
1,304,936
|
|
1,310,000
|
|
1,304,468
|
|
||||||||||
|
January 29, 2018
|
February 1, 2028
|
5.375
|
%
|
1,000,000
|
|
992,064
|
|
—
|
|
—
|
|
||||||||||
|
November 27, 2018
|
July 15, 2023
|
5.375
|
%
|
(g)
|
1,095,825
|
|
1,078,428
|
|
—
|
|
—
|
|
|||||||||
|
November 27, 2018
|
May 15, 2026
|
5.500
|
%
|
(g)
|
1,498,806
|
|
1,484,278
|
|
—
|
|
—
|
|
|||||||||
|
Cablevision Senior Notes (b):
|
|||||||||||||||||||||
|
April 15, 2010
|
April 15, 2018
|
7.750
|
%
|
(d)
|
—
|
|
—
|
|
750,000
|
|
754,035
|
|
|||||||||
|
April 15, 2010
|
April 15, 2020
|
8.000
|
%
|
500,000
|
|
495,302
|
|
500,000
|
|
492,009
|
|
||||||||||
|
September 27, 2012
|
September 15, 2022
|
5.875
|
%
|
649,024
|
|
585,817
|
|
649,024
|
|
572,071
|
|
||||||||||
|
May 16, 2013 Sept. 9, 2014
|
December 15, 2021
|
5.125
|
%
|
(f)
|
8,886
|
|
8,274
|
|
—
|
|
—
|
|
|||||||||
|
June 12, 2015
|
July 15, 2025
|
7.750
|
%
|
(f)
|
1,740
|
|
1,690
|
|
—
|
|
—
|
|
|||||||||
|
April 5, 2018
|
April 1, 2028
|
7.500
|
%
|
(f)
|
4,118
|
|
4,110
|
|
—
|
|
—
|
|
|||||||||
|
Cequel and Cequel Capital Senior Notes:
|
|||||||||||||||||||||
|
October 25, 2012
|
September 15, 2020
|
6.375
|
%
|
(c)
|
—
|
|
—
|
|
1,050,000
|
|
1,027,493
|
|
|||||||||
|
May 16, 2013 Sept. 9, 2014
|
|
December 15, 2021
|
5.125
|
%
|
(g)
|
—
|
|
—
|
|
1,250,000
|
|
1,138,870
|
|
||||||||
|
June 12, 2015
|
July 15, 2025
|
7.750
|
%
|
(g)
|
—
|
|
—
|
|
620,000
|
|
604,374
|
|
|||||||||
|
Altice US Finance I Corporation Senior Secured Notes:
|
|||||||||||||||||||||
|
June 12, 2015
|
July 15, 2023
|
5.375
|
%
|
(g)
|
—
|
|
—
|
|
1,100,000
|
|
1,082,482
|
|
|||||||||
|
April 26, 2016
|
May 15, 2026
|
5.500
|
%
|
(g)
|
—
|
|
—
|
|
1,500,000
|
|
1,488,024
|
|
|||||||||
|
$
|
15,733,145
|
|
15,359,561
|
|
16,289,245
|
|
15,860,432
|
|
|||||||||||||
|
Less: current portion
|
—
|
|
507,744
|
|
|||||||||||||||||
|
Long-term debt
|
$
|
15,359,561
|
|
$
|
15,352,688
|
|
|||||||||||||||
|
(a)
|
The carrying amount is net of the unamortized deferred financing costs and/or discounts/premiums and with respect to certain notes, a fair value adjustment resulting from the Cequel and Cablevision acquisitions.
|
F-37
ALTICE USA, INC. AND SUBSIDIARIES
NOTES TO CONSOLIDATED FINANCIAL STATEMENTS (continued)
(Dollars in thousands, except share and per share amounts)
|
(b)
|
The issuers of these notes have no ability to service interest or principal on the notes, other than through any dividends or distributions received from CSC Holdings. CSC Holdings is restricted, in certain circumstances, from paying dividends or distributions to the issuers by the terms of the CSC Holdings credit facilities agreement.
|
|
(c)
|
These notes were repaid in April 2018 with the proceeds from the issuance of new senior notes.
|
|
(d)
|
These notes were repaid in February 2018 with the proceeds from the 2028 Guaranteed Notes (defined below) and with the proceeds from the Incremental Term Loan.
|
|
(e)
|
These notes were repaid in July 2018 with borrowings under CSC Holdings revolving credit facility agreement.
|
|
(f)
|
In connection with the Combination discussed above, Cablevision assumed all of the obligations of the Cequel Senior Notes that were not exchanged.
|
|
(g)
|
Issued or exchanged for new notes in connection with the Combination discussed above or new notes in connection with the Combination discussed above.
|
|
(h)
|
These notes were repaid subsequent to December 31, 2018 (see Note 21 for further details). In connection with this refinancing,
$526,000
of short-term senior notes were reclassified to long-term debt along with the associated unamortized fair value adjustment.
|
The Company may redeem some or more of all the notes at the redemption price set forth in the relevant indenture, plus accrued and unpaid interest. The indentures under which the senior notes and debentures were issued contain various covenants. The Company was in compliance with all of its financial covenants under these indentures as of
December 31, 2018
.
O
n April 26, 2016, Altice US Finance I Corporation issued
$1,500,000
aggregate principal amount of senior secured notes (the ‘‘Cequel 2026 Senior Secured Notes’’). The proceeds from the sale were used to repay the
$1,477,200
remaining balance under the previous credit facility and to pay related fees and expenses. The Cequel 2026 Senior Secured Notes mature on May 15, 2026 and bear interest at a rate of
5.50%
annually. Interest on the Cequel 2026 Senior Secured Notes is payable semi-annually on May 15 and November 15 of each year, commencing on November 15, 2016. Deferred financing costs recorded in connection with the issuance of these notes amounted to
$13,773
and are being amortized over the term of the notes. See discussion above regarding the exchange of these notes as a result of the Combination.
In September 2016, CSC Holdings issued
$1,310,000
aggregate principal amount of
5.50%
senior guaranteed notes due April 15, 2027. The 2027 Guaranteed Notes are senior unsecured obligations and rank pari passu in right of payment with all of the existing and future senior indebtedness, including the existing senior notes and the Credit Facilities and rank senior in right of payment to all of existing and future subordinated indebtedness.
As discussed above, in October 2016, CSC Holdings used the proceeds from the issuance of the 2027 Guaranteed Notes (after the deduction of fees and expenses) to prepay the outstanding loans under the CSC Term Credit Facility that were not extended pursuant to the extension amendment on September 9,2016. In connection with the issuance of the 2027 Guaranteed Notes, the Company incurred deferred financing costs of approximately
$6,106
, which are being amortized to interest expense over the term of the 2027 Guaranteed Notes.
In January 2018, CSC Holdings issued
$1,000,000
aggregate principal amount of
5.375%
senior guaranteed notes due February 1, 2028 (the "2028 Guaranteed Notes"). The 2028 Guaranteed Notes are senior unsecured obligations and rank pari passu in right of payment with all of the existing and future senior indebtedness, including the existing senior notes and the CSC Credit Facilities and rank senior in right of payment to all of existing and future subordinated indebtedness.
The proceeds from the 2028 Guaranteed Notes, together with proceeds from the Incremental Term Loan (discussed above), borrowings under the CSC revolving credit facility and cash on hand, were used in February 2018 to repay
$300,000
principal amount of CSC Holdings' senior notes due in February 2018 and
$750,000
principal amount of Cablevision senior notes due in April 2018 and a portion was used to fund the dividend of
$1,499,935
to the Company's stockholders immediately prior to and in connection with the Distribution discussed in Note 1. In connection with the redemption of Cablevision senior notes, the Company paid a call premium of approximately
$7,019
, which was recorded as a loss on extinguishment of debt and also recorded a write-off of the unamortized premium of
$2,314
.
In April 2018, CCHI and Cequel Capital Corporation each an indirect, wholly owned subsidiary of the Company, issued
$1,050,000
aggregate principal amount of
7.50%
senior notes due April 1, 2028 (the "2028 Senior Notes"). The proceeds of these notes were used in April 2018 to redeem the
$1,050,000
aggregate principal amount 6 3/8% senior notes due September 15, 2020. In connection with the redemption of these notes, the Company paid a call premium of approximately
F-38
ALTICE USA, INC. AND SUBSIDIARIES
NOTES TO CONSOLIDATED FINANCIAL STATEMENTS (continued)
(Dollars in thousands, except share and per share amounts)
$16,737
, which was recorded as a loss on extinguishment of debt and also recorded a write-off of deferred financing costs aggregating
$20,173
. See discussion above regarding the exchange of these notes as a result of the Combination.
The indentures under which the Senior Guaranteed Notes and Senior Notes and Debentures were issued contain certain covenants and agreements with respect to investment grade debt securities, including limitations on the ability of CSC Holdings and its restricted subsidiaries to (i) incur or guarantee additional indebtedness, (ii) make investments or other restricted payments, (iii) create liens, (iv) sell assets and subsidiary stock, (v) pay dividends or make other distributions or repurchase or redeem our capital stock or subordinated debt, (vi) engage in certain transactions with affiliates, (vii) enter into agreements that restrict the payment of dividends by subsidiaries or the repayment of intercompany loans and advances, and (viii) engage in mergers or consolidations, in each case subject to certain exceptions. The indentures also contain certain customary events of default. If an event of default occurs, the obligations under the notes may be accelerated.
See Note 21 for senior guaranteed notes issued subsequent to December 31, 2018.
Notes Payable to Affiliates and Related Parties
On June 21, 2016, in connection with the Cablevision Acquisition, the Company issued notes payable to affiliates and related parties aggregating
$1,750,000
, of which
$875,000
bore interest at
10.75%
and matured on December 20, 2023 and
$875,000
bore interest at
11%
and matured on December 20, 2024.
In connection with the Company's IPO in June 2017, the Company converted the notes payable to affiliates and related parties (together with accrued and unpaid interest of
$529
and applicable premium of
$513,723
) into shares of the Company’s common stock at the IPO price. The premium was recorded as a loss on extinguishment of debt on the Company's consolidated statement of operations for the year ended December 31, 2017. In connection with the conversion of the notes, the Company recorded a credit to paid in capital of
$2,264,252
for the year ended December 31, 2017.
For the year ended December 31,
2017
and
2016
the Company recognized interest expense of
$90,405
and
$102,557
related to these notes prior to their conversion.
The following table provides a summary of the loss (gain) on extinguishment of debt and the write-off of deferred financing costs recorded by the Company upon the redemption of senior notes and the refinancing of credit facilities:
|
For the Year Ended December 31, 2018:
|
||||
|
Cablevision 7.75% Senior Notes due 2018
|
$
|
4,706
|
|
|
|
Cequel 6.375% Senior Notes due 2020
|
36,910
|
|
||
|
Cequel Credit Facility
|
7,733
|
|
||
|
Cequel senior and senior secured notes pursuant to the Exchange Offer discussed above
|
(545
|
)
|
||
|
$
|
48,804
|
|
||
|
For the Year Ended December 31, 2017:
|
||||
|
Notes payable to affiliates
|
$
|
513,723
|
|
|
|
CSC Holdings Term Loan B
|
12,675
|
|
||
|
CSC Holdings 10.875% Senior Notes due 2025
|
38,858
|
|
||
|
CSC Holdings 8.625% Senior Notes due 2017
|
6,300
|
|
||
|
Cequel Term Loan Facility
|
2,027
|
|
||
|
Cequel 6.375% Senior Notes due 2020
|
26,657
|
|
||
|
$
|
600,240
|
|
||
|
For the Year Ended December 31, 2016:
|
||||
|
CSC Holdings Term Loan B
|
$
|
102,894
|
|
|
|
Cequel Term Loan Facility
|
24,755
|
|
||
|
$
|
127,649
|
|
||
F-39
ALTICE USA, INC. AND SUBSIDIARIES
NOTES TO CONSOLIDATED FINANCIAL STATEMENTS (continued)
(Dollars in thousands, except share and per share amounts)
Summary of Debt Maturities
The future maturities of debt payable by the Company under its various debt obligations outstanding as of
December 31, 2018
, including notes payable, collateralized indebtedness (see Note 12), and capital leases, are as follows:
|
Years Ending December 31,
|
|||
|
2019
|
$
|
684,624
|
|
|
2020
|
589,566
|
|
|
|
2021
|
4,002,251
|
|
|
|
2022
|
710,920
|
|
|
|
2023
|
2,957,403
|
|
|
|
Thereafter
|
14,351,818
|
|
|
The amounts in the table above do not include the effects of the debt transactions discussed in Note 21.
NOTE 12. DERIVATIVE CONTRACTS AND COLLATERALIZED INDEBTEDNESS
Prepaid Forward Contracts
The Company has entered into various transactions to limit the exposure against equity price risk on its shares of Comcast Corporation ("Comcast") common stock. The Company has monetized all of its stock holdings in Comcast through the execution of prepaid forward contracts, collateralized by an equivalent amount of the respective underlying stock. At maturity, the contracts provide for the option to deliver cash or shares of Comcast stock with a value determined by reference to the applicable stock price at maturity. These contracts, at maturity, are expected to offset declines in the fair value of these securities below the hedge price per share while allowing the Company to retain upside appreciation from the hedge price per share to the relevant cap price.
The Company received cash proceeds upon execution of the prepaid forward contracts discussed above which has been reflected as collateralized indebtedness in the accompanying consolidated balance sheets. In addition, the Company separately accounts for the equity derivative component of the prepaid forward contracts. These equity derivatives have not been designated as hedges for accounting purposes. Therefore, the net fair values of the equity derivatives have been reflected in the accompanying consolidated balance sheets as an asset or liability and the net increases or decreases in the fair value of the equity derivative component of the prepaid forward contracts are included in gain (loss) on derivative contracts in the accompanying consolidated statements of operations.
All of the Company's monetization transactions are obligations of its wholly-owned subsidiaries that are not part of the Restricted Group; however, CSC Holdings has provided guarantees of the subsidiaries' ongoing contract payment expense obligations and potential payments that could be due as a result of an early termination event (as defined in the agreements). If any one of these contracts were terminated prior to its scheduled maturity date, the Company would be obligated to repay the fair value of the collateralized indebtedness less the sum of the fair values of the underlying stock and equity collar, calculated at the termination date. As of
December 31, 2018
, the Company did not have an early termination shortfall relating to any of these contracts.
The Company monitors the financial institutions that are counterparties to its equity derivative contracts. All of the counterparties to such transactions carry investment grade credit ratings as of
December 31, 2018
.
Put/Call Options
In the third quarter of 2017, the Company entered into a put-call contract that expired in the third quarter of 2018 whereby the Company sold a put option and purchased a call option with the same strike price. These put-call options were settled as of December 31, 2017 and the Company recorded a loss on investments of
$97,410
for the year ended December 31, 2017, which represents the difference between the strike price and the closing price of the underlying shares.
Interest Rate Swap Contracts
To manage interest rate risk, we have from time to time entered into interest rate swap contracts to adjust the proportion of total debt that is subject to variable and fixed interest rates. Such contracts effectively fix the borrowing rates on floating rate debt to provide an economic hedge against the risk of rising rates and/or effectively convert fixed rate
F-40
ALTICE USA, INC. AND SUBSIDIARIES
NOTES TO CONSOLIDATED FINANCIAL STATEMENTS (continued)
(Dollars in thousands, except share and per share amounts)
borrowings to variable rates to permit the Company to realize lower interest expense in a declining interest rate environment. We monitor the financial institutions that are counterparties to our interest rate swap contracts and we only enter into interest rate swap contracts with financial institutions that are rated investment grade. All such contracts are carried at their fair market values on our consolidated balance sheet, with changes in fair value reflected in the consolidated statement of operations.
The following is a summary of interest rate swap contracts outstanding at December 31, 2018:
|
Trade Date
|
Maturity Date
|
Notional Amount
|
Company Pays
|
Company Receives
|
||||||
|
May 2016
|
May 2026
|
$
|
750,000
|
|
Six- month LIBOR
|
Fixed rate of 1.665%
|
||||
|
June 2016
|
May 2026
|
750,000
|
|
Six- month LIBOR
|
Fixed rate of 1.68%
|
|||||
|
May 2018
|
April 2019
|
2,970,000
|
|
Three- month LIBOR
|
One- month LIBOR plus 0.226%
|
|||||
|
May 2018
|
April 2019
|
1,496,250
|
|
Three- month LIBOR
|
One- month LIBOR plus 0.226%
|
|||||
|
April 2018
|
April 2019
|
1,255,513
|
|
Three- month LIBOR minus 0.225%
|
One- month LIBOR
|
|||||
|
December 2018
|
January 2022
|
500,000
|
|
Fixed rate of 2.7177%
|
Three-month LIBOR
|
|||||
|
December 2018
|
January 2022
|
500,000
|
|
Fixed rate of 2.733%
|
Three-month LIBOR
|
|||||
|
December 2018
|
January 2022
|
500,000
|
|
Fixed rate of 2.722%
|
Three-month LIBOR
|
|||||
|
December 2018
|
December 2026
|
750,000
|
|
Fixed rate of 2.9155%
|
Three-month LIBOR
|
|||||
|
December 2018
|
December 2026
|
750,000
|
|
Fixed rate of 2.9025%
|
Three-month LIBOR
|
|||||
As of December 31, 2018, the Company did not hold and has not issued derivative instruments for trading or speculative purposes.
The following represents the location of the assets and liabilities associated with the Company's derivative instruments within the consolidated balance sheets:
|
Derivatives Not Designated as Hedging Instruments
|
Balance Sheet Location
|
Fair Value at December 31,
|
||||||||
|
2018
|
2017
|
|||||||||
|
Asset Derivatives:
|
||||||||||
|
Prepaid forward contracts
|
Derivative contracts, current
|
$
|
—
|
|
$
|
52,545
|
|
|||
|
Interest rate swap contracts
|
Derivative contracts, current
|
1,975
|
|
—
|
|
|||||
|
Prepaid forward contracts
|
Derivative contracts, long-term
|
109,344
|
|
—
|
|
|||||
|
Interest rate swap contracts
|
Derivative contracts, long-term
|
—
|
|
—
|
|
|||||
|
111,319
|
|
52,545
|
|
|||||||
|
Liability Derivatives:
|
||||||||||
|
Prepaid forward contracts
|
Liabilities under derivative contracts, short-term
|
—
|
|
(52,545
|
)
|
|||||
|
Interest rate swap contracts
|
Liabilities under derivative contracts, short-term
|
(70
|
)
|
—
|
|
|||||
|
Prepaid forward contracts
|
Liabilities under derivative contracts, long-term
|
—
|
|
(109,504
|
)
|
|||||
|
Interest rate swap contracts
|
Liabilities under derivative contracts, long-term
|
(132,908
|
)
|
(77,902
|
)
|
|||||
|
|
$
|
(132,978
|
)
|
$
|
(239,951
|
)
|
||||
The gain (loss) from the Company's derivative contracts related to the Comcast common stock for the years ended
December 31, 2018
,
2017
and
2016
of
$218,848
,
$(138,920)
and
$(53,696)
, respectively, are reflected in gain (loss) on derivative contracts, net in the Company's consolidated statements of operations.
For the years ended
December 31, 2018
,
2017
and
2016
the Company recorded a gain (loss) on investments of
$(261,834)
,
$237,354
and
$141,896
, respectively, primarily representing the net increase (decrease) in the fair values of the investment securities pledged as collateral.
For the years ended
December 31, 2018
,
2017
and
2016
the Company recorded a gain (loss) on interest rate swap contracts of
$(61,697)
,
$5,482
and
$(72,961)
respectively.
F-41
ALTICE USA, INC. AND SUBSIDIARIES
NOTES TO CONSOLIDATED FINANCIAL STATEMENTS (continued)
(Dollars in thousands, except share and per share amounts)
Settlements of Collateralized Indebtedness
The following table summarizes the settlement of the Company's collateralized indebtedness relating to Comcast shares that were settled by delivering cash equal to the collateralized loan value, net of the value of the related equity derivative contracts during the years presented:
|
Years Ended December 31,
|
|||||||
|
2018
|
2017
|
||||||
|
Number of shares
|
16,139,868
|
|
26,815,368
|
|
|||
|
Collateralized indebtedness settled
|
$
|
(516,537
|
)
|
$
|
(774,703
|
)
|
|
|
Derivatives contracts settled
|
24
|
|
(56,356
|
)
|
|||
|
(516,513
|
)
|
(831,059
|
)
|
||||
|
Proceeds from new monetization contracts
|
516,513
|
|
838,794
|
|
|||
|
Net cash proceeds
|
$
|
—
|
|
$
|
7,735
|
|
|
The cash to settle the collateralized indebtedness was obtained from the proceeds of new monetization contracts covering an equivalent number of Comcast shares. The terms of the new contracts allow the Company to retain upside participation in Comcast shares up to each respective contract's upside appreciation limit with downside exposure limited to the respective hedge price.
In April 2017, the Company entered into new monetization contracts related to
32,153,118
shares of Comcast common stock held by us, which synthetically reversed the then existing contracts related to these shares (the "Synthetic Monetization Closeout"). As the then existing collateralized debt matured, the Company settled the contracts with proceeds received from the new monetization contracts. The new monetization contracts mature on April 28, 2021. The new monetization contracts provide the Company with downside protection below the hedge price of
$35.47
and upside benefit of stock price appreciation up to
$44.72
per share. In connection with the execution of these contracts, the Company recorded (i) the fair value of the equity derivative contracts of
$53,316
(in a net asset position), (ii) notes payable of
$111,657
, representing the fair value of the existing equity derivative contracts, in a liability position, and (iii) a discount on notes payable of
$58,341
.
NOTE 13. FAIR VALUE MEASUREMENT
The fair value hierarchy is based on inputs to valuation techniques that are used to measure fair value that are either observable or unobservable. Observable inputs reflect assumptions market participants would use in pricing an asset or liability based on market data obtained from independent sources while unobservable inputs reflect a reporting entity's pricing based upon their own market assumptions. The fair value hierarchy consists of the following three levels:
|
•
|
Level I - Quoted prices for identical instruments in active markets.
|
|
•
|
Level II - Quoted prices for similar instruments in active markets; quoted prices for identical or similar instruments in markets that are not active; and model-derived valuations whose inputs are observable or whose significant value drivers are observable.
|
|
•
|
Level III - Instruments whose significant value drivers are unobservable.
|
The following table presents for each of these hierarchy levels, the Company's financial assets and financial liabilities that are measured at fair value on a recurring basis:
F-42
ALTICE USA, INC. AND SUBSIDIARIES
NOTES TO CONSOLIDATED FINANCIAL STATEMENTS (continued)
(Dollars in thousands, except share and per share amounts)
|
Fair Value
Hierarchy
|
December 31, 2018
|
December 31, 2017
|
|||||||
|
Assets:
|
|||||||||
|
Money market funds
|
Level I
|
$
|
91,852
|
|
$
|
5,949
|
|
||
|
Investment securities pledged as collateral
|
Level I
|
1,462,626
|
|
1,720,357
|
|
||||
|
Prepaid forward contracts
|
Level II
|
109,344
|
|
52,545
|
|
||||
|
Interest rate swap contracts
|
Level II
|
1,975
|
|
—
|
|
||||
|
Liabilities:
|
|||||||||
|
Prepaid forward contracts
|
Level II
|
—
|
|
162,049
|
|
||||
|
Interest rate swap contracts
|
Level II
|
132,978
|
|
77,902
|
|
||||
|
Contingent consideration related to 2017 and 2018 acquisitions
|
Level III
|
6,195
|
|
32,233
|
|
||||
The Company's cash equivalents, investment securities and investment securities pledged as collateral are classified within Level I of the fair value hierarchy because they are valued using quoted market prices.
The Company's derivative contracts and liabilities under derivative contracts on the Company's consolidated balance sheets are valued using market-based inputs to valuation models. These valuation models require a variety of inputs, including contractual terms, market prices, yield curves, and measures of volatility. When appropriate, valuations are adjusted for various factors such as liquidity, bid/offer spreads and credit risk considerations. Such adjustments are generally based on available market evidence. Since model inputs can generally be verified and do not involve significant management judgment, the Company has concluded that these instruments should be classified within Level II of the fair value hierarchy.
The fair value of the contingent consideration as of December 31, 2018 relating to acquisitions in the third quarter of 2018 and fourth quarter of 2017 amounted to approximately
$4,500
and
$1,695
, respectively. The estimated amount recorded as of December 31, 2018 is
100%
of the contractual amount related to the acquisition in the third quarter 2018 and
42%
of the contractual amount related to the acquisition in the fourth quarter 2017. The fair value of the consideration was estimated based on a probability assessment of attaining the targets as of December 31, 2018.
Fair Value of Financial Instruments
The following methods and assumptions were used to estimate fair value of each class of financial instruments for which it is practicable to estimate:
Credit Facility Debt, Collateralized Indebtedness, Senior Notes and Debentures, Senior Secured Notes, Senior Guaranteed Notes, and Notes Payable
The fair values of each of the Company's debt instruments are based on quoted market prices for the same or similar issues or on the current rates offered to the Company for instruments of the same remaining maturities. The fair value of notes payable is based primarily on the present value of the remaining payments discounted at the borrowing cost.
The carrying values, estimated fair values, and classification under the fair value hierarchy of the Company's financial instruments, excluding those that are carried at fair value in the accompanying consolidated balance sheets, are summarized as follows:
F-43
ALTICE USA, INC. AND SUBSIDIARIES
NOTES TO CONSOLIDATED FINANCIAL STATEMENTS (continued)
(Dollars in thousands, except share and per share amounts)
|
December 31, 2018
|
December 31, 2017
|
||||||||||||||||
|
Fair Value
Hierarchy
|
Carrying
Amount (a)
|
Estimated
Fair Value
|
Carrying
Amount (a)
|
Estimated
Fair Value
|
|||||||||||||
|
CSC Holdings debt instruments:
|
|||||||||||||||||
|
Credit facility debt
|
Level II
|
$
|
5,915,559
|
|
$
|
5,972,500
|
|
$
|
3,393,306
|
|
$
|
3,435,000
|
|
||||
|
Collateralized indebtedness
|
Level II
|
1,406,182
|
|
1,374,203
|
|
1,349,474
|
|
1,305,932
|
|
||||||||
|
Senior guaranteed notes
|
Level II
|
5,847,758
|
|
5,646,468
|
|
2,291,185
|
|
2,420,000
|
|
||||||||
|
Senior notes and debentures
|
Level II
|
8,416,610
|
|
8,972,722
|
|
6,409,889
|
|
7,221,846
|
|
||||||||
|
Notes payable
|
Level II
|
64,212
|
|
63,940
|
|
56,956
|
|
55,289
|
|
||||||||
|
Cablevision debt instruments:
|
|||||||||||||||||
|
Senior notes and debentures
|
Level II
|
1,095,193
|
|
1,163,843
|
|
1,818,115
|
|
1,931,239
|
|
||||||||
|
Cequel debt instruments:
|
—
|
|
—
|
|
|
|
|
|
|||||||||
|
Cequel credit facility
|
Level II
|
—
|
|
—
|
|
1,250,217
|
|
1,258,675
|
|
||||||||
|
Senior secured notes
|
Level II
|
—
|
|
—
|
|
2,570,506
|
|
2,658,930
|
|
||||||||
|
Senior notes
|
Level II
|
—
|
|
—
|
|
2,770,737
|
|
2,983,615
|
|
||||||||
|
Notes payable
|
Level II
|
41,896
|
|
41,896
|
|
8,946
|
|
8,946
|
|
||||||||
|
$
|
22,787,410
|
|
$
|
23,235,572
|
|
$
|
21,919,331
|
|
$
|
23,279,472
|
|
||||||
|
(a)
|
Amounts are net of unamortized deferred financing costs and discounts/premiums.
|
The fair value estimates related to the Company's debt instruments presented above are made at a specific point in time, based on relevant market information and information about the financial instrument. These estimates are subjective in nature and involve uncertainties and matters of significant judgments and therefore cannot be determined with precision. Changes in assumptions could significantly affect the estimates.
NOTE 14. INCOME TAXES
The Company files a federal consolidated and certain state combined income tax returns with its
80%
or more owned subsidiaries.
Income tax benefit attributable to the Company's operations for the years ended
December 31, 2018
,
2017
and
2016
consist of the following components:
|
Years Ended December 31,
|
|||||||||||
|
|
2018
|
2017
|
2016
|
||||||||
|
Current expense (benefit):
|
|||||||||||
|
Federal
|
$
|
(1,865
|
)
|
$
|
5,261
|
|
$
|
(981
|
)
|
||
|
State
|
32,347
|
|
12,530
|
|
5,310
|
|
|||||
|
|
30,482
|
|
17,791
|
|
4,329
|
|
|||||
|
Deferred benefit:
|
|||||||||||
|
Federal
|
26,141
|
|
(2,095,930
|
)
|
(223,159
|
)
|
|||||
|
State
|
(93,744
|
)
|
(784,224
|
)
|
(40,830
|
)
|
|||||
|
|
(67,603
|
)
|
(2,880,154
|
)
|
(263,989
|
)
|
|||||
|
Tax expense (benefit) relating to uncertain tax positions
|
(1,534
|
)
|
11
|
|
(6
|
)
|
|||||
|
Income tax benefit
|
$
|
(38,655
|
)
|
$
|
(2,862,352
|
)
|
$
|
(259,666
|
)
|
||
F-44
ALTICE USA, INC. AND SUBSIDIARIES
NOTES TO CONSOLIDATED FINANCIAL STATEMENTS (continued)
(Dollars in thousands, except share and per share amounts)
The income tax benefit attributable to the Company's operations differs from the amount derived by applying the statutory federal rate to pretax loss principally due to the effect of the following items:
|
Years Ended December 31,
|
|||||||||||
|
2018
|
2017
|
2016
|
|||||||||
|
Federal tax benefit at statutory rate
|
$
|
(3,793
|
)
|
$
|
(478,656
|
)
|
$
|
(381,901
|
)
|
||
|
State income taxes, net of federal impact
|
(8,103
|
)
|
(61,698
|
)
|
(39,336
|
)
|
|||||
|
Changes in the valuation allowance
|
15,987
|
|
(111
|
)
|
297
|
|
|||||
|
Impact of Federal Tax Reform
|
—
|
|
(2,332,677
|
)
|
—
|
|
|||||
|
Changes in the state rates used to measure deferred taxes, net of federal impact
|
(52,915
|
)
|
(12,896
|
)
|
153,239
|
|
|||||
|
Tax benefit relating to uncertain tax positions
|
(514
|
)
|
(253
|
)
|
(120
|
)
|
|||||
|
Non-deductible share-based compensation related to the carried unit plan
|
8,677
|
|
20,101
|
|
5,029
|
|
|||||
|
Non-deductible Cablevision Acquisition transaction costs
|
—
|
|
—
|
|
4,457
|
|
|||||
|
Other non-deductible expenses
|
2,200
|
|
3,405
|
|
1,551
|
|
|||||
|
Other, net
|
(194
|
)
|
433
|
|
(2,882
|
)
|
|||||
|
Income tax benefit
|
$
|
(38,655
|
)
|
$
|
(2,862,352
|
)
|
$
|
(259,666
|
)
|
||
In late 2017, the United States enacted the Tax Cuts and Jobs Act of 2017 (the “Tax Reform”) which significantly changed the existing U.S. tax law by implementing a reduction in the corporate tax rate to 21%, moving from a worldwide tax system to a territorial system and imposing new or additional limitations on the deductibility of interest expense and executive compensation.
Given the significance of the legislation, the SEC issued Staff Accounting Bulletin No. 118 ("SAB 118"), which allowed registrants to record provisional amounts during a one year “measurement period” similar to that used when accounting for business combinations. The Company applied the guidance in SAB 118 when accounting for the enactment-date effects of the Tax Reform in 2017 and throughout 2018.
For the year ended December 31, 2017, the Company recognized a non-cash deferred tax benefit of
$2,332,677
resulting primarily from a decrease in the deferred tax liabilities with regard to fixed assets and intangibles, partially offset by a decrease in the deferred tax asset for the federal net operating loss carry forward (‘‘NOL’’).
At December 31, 2018, the Company completed its accounting of SAB 118 for all of the enactment-date income tax effects of the Tax Reform. The Company has not made any measurement-period adjustments and there were no additional material adjustments related to the Tax Reform.
During 2018, the Company determined that it met the definition of a Qualified Technology Company for New York State tax purposes and thereby was eligible for the reduced tax rate. Additionally, during 2018, the state of New Jersey enacted significant tax law changes imposing a
2.5%
surtax for tax years beginning January 1, 2018 and mandating combined return filing requirements for unitary corporations for tax years beginning January 1, 2019. Accordingly, the Company recorded a net non-cash deferred tax benefit of
$52,915
based on a remeasurement of the net deferred tax liability.
F-45
ALTICE USA, INC. AND SUBSIDIARIES
NOTES TO CONSOLIDATED FINANCIAL STATEMENTS (continued)
(Dollars in thousands, except share and per share amounts)
The tax effects of temporary differences which give rise to significant portions of deferred tax assets or liabilities and the corresponding valuation allowance are as follows:
|
|
December 31,
|
||||||
|
|
2018
|
2017
|
|||||
|
Noncurrent
|
|||||||
|
NOLs and tax credit carry forwards
|
$
|
571,413
|
|
$
|
785,809
|
|
|
|
Compensation and benefit plans
|
42,484
|
|
49,698
|
|
|||
|
Partnership investments
|
60,413
|
|
68,054
|
|
|||
|
Restructuring liability
|
9,364
|
|
33,247
|
|
|||
|
Other liabilities
|
38,473
|
|
40,149
|
|
|||
|
Liabilities under derivative contracts
|
20,846
|
|
21,034
|
|
|||
|
Interest deferred for tax purposes
|
166,668
|
|
128,516
|
|
|||
|
Other
|
11,531
|
|
8,849
|
|
|||
|
Deferred tax asset
|
921,192
|
|
1,135,356
|
|
|||
|
Valuation allowance
|
(25,400
|
)
|
(3,000
|
)
|
|||
|
Net deferred tax asset, noncurrent
|
895,792
|
|
1,132,356
|
|
|||
|
Fixed assets and intangibles
|
(5,496,103
|
)
|
(5,729,274
|
)
|
|||
|
Investments
|
(71,167
|
)
|
(113,628
|
)
|
|||
|
Prepaid expenses
|
(7,543
|
)
|
(8,105
|
)
|
|||
|
Fair value adjustments related to debt and deferred financing costs
|
(40,083
|
)
|
(40,215
|
)
|
|||
|
Other
|
(4,833
|
)
|
(10,420
|
)
|
|||
|
Deferred tax liability, noncurrent
|
(5,619,729
|
)
|
(5,901,642
|
)
|
|||
|
Total net deferred tax liability
|
$
|
(4,723,937
|
)
|
$
|
(4,769,286
|
)
|
|
As of
December 31, 2018
, the Company's federal NOLs were approximately
$1,915,759
. The utilization of certain pre-merger NOLs of Cablevision and Cequel are limited pursuant to Internal Revenue Code Section 382. The Company does not expect such limitations to impact the ability to utilize the NOLs prior to their expiration.
As of
December 31, 2018
, the Company has
$24,126
of alternative minimum tax credits which do not expire and
$17,806
of research credits, expiring in varying amounts from 2023 through 2035. Pursuant to the Tax Reform elimination of the AMT liability, the Company has submitted a refund request for
50%
of the prior year’s AMT, which reflects the portion not covered by the effects of the budget sequestration.
Deferred tax assets have resulted primarily from the Company's future deductible temporary differences and NOLs. In assessing the realizability of deferred tax assets, management considers whether it is more likely than not that some portion or all of the deferred tax asset will not be realized. In evaluating the need for a valuation allowance, management takes into account various factors, including the expected level of future taxable income, available tax planning strategies and reversals of existing taxable temporary differences. If such estimates and related assumptions change in the future, the Company may be required to record additional valuation allowances against its deferred tax assets, resulting in additional income tax expense in the Company's consolidated statements of operations. Management evaluates the realizability of the deferred tax assets and the need for additional valuation allowances quarterly. Pursuant to the Cablevision Acquisition and Cequel Acquisition, deferred tax liabilities resulting from the book fair value adjustment increased significantly and future taxable income that will result from the reversal of existing taxable temporary differences for which deferred tax liabilities are recognized is sufficient to conclude it is more likely than not that the Company will realize all of its gross deferred tax assets, except those deferred tax assets against which a valuation allowance has been recorded which relate to certain state NOLs.
In the normal course of business, the Company engages in transactions in which the income tax consequences may be uncertain. The Company's income tax returns are filed based on interpretation of tax laws and regulations. Such income tax returns are subject to examination by taxing authorities. For financial statement purposes, the Company only recognizes tax positions that it believes are more likely than not of being sustained. There is considerable judgment
F-46
ALTICE USA, INC. AND SUBSIDIARIES
NOTES TO CONSOLIDATED FINANCIAL STATEMENTS (continued)
(Dollars in thousands, except share and per share amounts)
involved in determining whether positions taken or expected to be taken on the tax return are more likely than not of being sustained.
A reconciliation of the beginning and ending amount of unrecognized tax benefits associated with uncertain tax positions, excluding associated deferred tax benefits and accrued interest, is as follows:
|
Balance at December 31, 2016
|
$
|
4,025
|
|
|
Increases related to prior year tax positions
|
11
|
|
|
|
Balance at December 31, 2017
|
4,036
|
|
|
|
Decreases related to prior year tax positions
|
(1,456
|
)
|
|
|
Balance at December 31, 2018
|
$
|
2,580
|
|
As of
December 31, 2018
, if all uncertain tax positions were sustained at the amounts reported or expected to be reported in the Company's tax returns, the elimination of the Company's unrecognized tax benefits, net of the deferred tax impact, would decrease income tax expense by
$2,104
.
In the second quarter of 2016, the Company changed its accounting policy on a prospective basis to present interest expense relating to uncertain tax positions as additional interest expense. For the year ended
December 31, 2018
, a net benefit of
$2,123
of interest expense relating to reversal of uncertain tax positions from prior years offset by current interest accrual was recorded to interest expense.
The most significant jurisdictions in which the Company is required to file income tax returns include the states of New York, New Jersey, Connecticut, the City of New York, Texas and West Virginia. The State and City of New York are presently auditing income tax returns for years 2012 through 2014. The State of New Jersey is presently auditing income tax returns for years 2014 through 2017.
Management does not believe that the resolution of the ongoing income tax examination described above will have a material adverse impact on the financial position of the Company. Changes in the liabilities for uncertain tax positions will be recognized in the interim period in which the positions are effectively settled or there is a change in factual circumstances.
NOTE 15. SHARE-BASED COMPENSATION
Carry Unit Plan
Certain employees of the Company and its affiliates received awards of units in a carry unit plan of Neptune Management LP, an entity which has an ownership interest in the Company. The awards generally vest as follows:
50%
on the second anniversary of June 21, 2016 for Cablevision employees or December 21, 2015 for Cequel employees ("Base Date"),
25%
on the third anniversary of the Base Date, and
25%
on the fourth anniversary of the Base Date. Neptune Holding US GP LLC, the general partner of Neptune Management LP, has the right to repurchase (or to assign to an affiliate, including the Company, the right to repurchase) vested awards held by employees for
sixty
days following their termination. For performance-based awards under the plan, vesting occurs upon achievement or satisfaction of a specified performance condition. The Company considered the probability of achieving the established performance targets in determining the share-based compensation with respect to these awards at the end of each reporting period.
Beginning on the fourth anniversary of the Base Date, the holders of carry units have an annual opportunity (a
sixty
day period determined by the administrator of the plan) to sell their units back to Neptune Holding US GP LLC (or affiliate, including the Company, designated by Neptune Holding US GP LLC). Accordingly, the carry units are presented as temporary equity on the consolidated balance sheets at fair value. Adjustments to fair value at each reporting period are recorded in paid-in capital.
The right of Neptune Holding US GP LLC to assign to an affiliate, including the Company, the right to repurchase an employee’s vested units during the sixty-day period following termination, or to satisfy its obligation to repurchase an employee’s vested units during annual
60
day periods following the fourth anniversary of the Base Date, may be exercised by Neptune Holding US GP LLC in its discretion at the time a repurchase right or obligation arises. The carry unit plan requires the purchase price payable to the employee or former employee, as the case may be, to be paid in cash, a promissory note (with a term of not more than
3 years
and bearing interest at the long-term applicable federal rate under Section 1274(d) of the Internal Revenue Code) or combination thereof, in each case as determined by Neptune Holding
F-47
ALTICE USA, INC. AND SUBSIDIARIES
NOTES TO CONSOLIDATED FINANCIAL STATEMENTS (continued)
(Dollars in thousands, except share and per share amounts)
US GP LLC in its discretion at the time of the repurchase. Neptune Holding US GP LLC expects that vested units will be redeemed for shares of the Company's Class A common stock upon vesting.
The Company measures the cost of employee services received in exchange for carry units based on the fair value of the award at grant date. In addition these units are presented as temporary equity on our consolidated balance sheet at fair value. For carry unit awards granted in 2016, an option pricing model was used which requires subjective assumptions for which changes in these assumptions could materially affect the fair value of the carry units outstanding. The time to liquidity event assumption was based on management’s judgment. The equity volatility assumption was estimated using the historical weekly volatility of publicly traded comparable companies. The risk-free rate assumed was based on the U.S. Constant Maturity Treasury Rates for a period matching the expected time to liquidity event. The discount for lack of marketability was based on Finnerty's (2012) average-strike put option model.
For carry unit awards granted in the first and second quarter of 2017, the Company estimated the grant date fair value based on the value established in the Company's IPO.
The following table summarizes activity relating to carry units:
|
Number of Time
Vesting Awards
|
Number of Performance
Based Vesting Awards
|
Weighted Average Grant Date Fair Value
|
|||||||
|
Balance, December 31, 2017
|
168,550,001
|
|
10,000,000
|
|
$
|
0.71
|
|
||
|
Vested
|
(68,037,500
|
)
|
—
|
|
0.37
|
|
|||
|
Forfeited
|
(16,937,501
|
)
|
—
|
|
0.62
|
|
|||
|
Balance, December 31, 2018
|
83,575,000
|
|
10,000,000
|
|
$
|
1.14
|
|
||
The weighted average fair value per unit was
$1.95
,
$2.50
, and
$1.76
as of
December 31, 2018
,
2017
and
2016
, respectively. For the years ended
December 31, 2018
,
2017
and
2016
the Company recognized an expense of
$41,321
,
$57,430
and
$14,368
, respectively, related to the push down of share-based compensation related to the carry unit plan.
Stock Option Plan
In connection with the Company's IPO, the Company adopted the Altice USA 2017 Long Term Incentive Plan (the "2017 LTIP"). Under the 2017 LTIP, the Company may grant awards of options, restricted shares, restricted share units, stock appreciation rights, performance stock, performance stock units and other awards. Under the 2017 LTIP, awards may be granted to officers, employees and consultants of the Company or any of its affiliates. The 2017 LTIP is administered by the Company's Board of Directors (the "Board"), subject to the provision of the stockholders' agreement. The Board has delegated its authority to the Company's Compensation Committee. The Compensation Committee has the full power and authority to, among other things, select eligible participants, to grant awards in accordance with the 2017 LTIP, to determine the number of shares subject to each award or the cash amount payable in connection with an award and determine the terms and conditions of each award.
In November 2018, the Board and the Company's stockholders holding a majority of the voting power of its capital stock approved an amendment to the 2017 LTIP, which increased the maximum aggregate number of shares that may be issued for all purposes under the Plan to
19,879,291
. The Board has the authority to amend, suspend, or terminate the 2017 LTIP. No amendment, suspension or termination will be effective without the approval of the Company's stockholders if such approval is required under applicable laws, rules and regulations.
Options outstanding under the 2017 LTIP Plan either cliff vest on the third anniversary of the date of grant or vest over
4
years, where
50%
vest on the second anniversary,
25%
on the third anniversary and
25%
on the fourth anniversary of the date of grant. The option awards generally are subject to continued employment with the Company, and expire
ten
years from the date of grant. Performance based option awards vest upon achievement of performance criteria.
F-48
ALTICE USA, INC. AND SUBSIDIARIES
NOTES TO CONSOLIDATED FINANCIAL STATEMENTS (continued)
(Dollars in thousands, except share and per share amounts)
The following table summarizes activity related to employee stock options:
|
|
Shares Under Option
|
Weighted Average
Exercise
Price Per Share
|
Weighted Average Remaining
Contractual Term
(in years)
|
|||||||||||||
|
|
Time
Vesting
|
Performance
Based Vesting
|
Aggregate Intrinsic
Value (a)
|
|||||||||||||
|
Balance at December 31, 2017
|
5,110,747
|
|
—
|
|
$
|
17.45
|
|
9.97
|
|
$
|
8,331
|
|
||||
|
Granted
|
6,753,659
|
|
95,953
|
|
17.58
|
|
||||||||||
|
Forfeited
|
(634,238
|
)
|
(22,314
|
)
|
17.92
|
|
||||||||||
|
Balance at December 31, 2018
|
11,230,168
|
|
73,639
|
|
17.50
|
|
9.47
|
|
(11,057
|
)
|
||||||
|
Options exercisable at December 31, 2018
|
—
|
|
—
|
|
—
|
|
—
|
|
—
|
|
||||||
|
(a)
|
The aggregate intrinsic value is calculated as the difference between the exercise price and the closing price of the Company's Class A common stock at the respective date.
|
The Company recognized share-based compensation expense related to employee stock options for the year ended December 31, 2018 of
$18,491
.
The Company calculated the fair value of each option award on the date of grant using the Black-Scholes valuation model. The Company's computation of expected life was determined based on the simplified method (the average of the vesting period and option term) due to the Company's lack of recent historical data for similar awards. The interest rate for periods within the contractual life of the stock option was based on interest yields for U.S. Treasury instruments in effect at the time of grant. The Company's computation of expected volatility was based on historical volatility of its common stock and the expected volatility of comparable publicly-traded companies who granted options that had similar expected lives.
The following weighted-average assumptions were used to calculate the fair values of stock option awards granted during the years ended December 31, 2018 and 2017:
|
Year Ended December 31,
|
|||
|
2018
|
2017
|
||
|
Risk-free interest rate
|
2.74%
|
2.30%
|
|
|
Expected life (in years)
|
6.49
|
6.44
|
|
|
Dividend yield
|
—%
|
—%
|
|
|
Volatility
|
35.72%
|
33.95%
|
|
|
Grant date fair value
|
$6.91
|
$8.77
|
|
NOTE 16. AFFILIATE AND RELATED PARTY TRANSACTIONS
Equity Method Investments
In April 2018, Altice Europe transferred its ownership of i24 US and i24 Europe ('i24NEWS"), Altice Europe's 24/7 international news and current affairs channels to the Company for minimal consideration (the "i24NEWS Acquisition"). As the acquisition was a combination of businesses under common control, the Company combined the results of operations and related assets and liabilities of i24NEWS as of April 1, 2018. Operating results for periods prior to April 1, 2018 and the balance sheet as of December 31, 2017 have not been revised to reflect the combination of i24NEWS as the impact was deemed immaterial.
The Company's equity in the net losses of i24NEWS prior to April 1, 2018 of
$1,130
and
$2,821
for the year ended December 31, 2017 were recorded using the equity method and reflected in other expense, net in the Company's consolidated statements of operations. The Company's investment in i24NEWS as of December 31, 2017 of
$930
is included in investment in affiliates on the Company's consolidated balance sheet.
F-49
ALTICE USA, INC. AND SUBSIDIARIES
NOTES TO CONSOLIDATED FINANCIAL STATEMENTS (continued)
(Dollars in thousands, except share and per share amounts)
In April 2018, the Company redeemed a
24%
interest in Newsday LLC ("Newsday") and recognized a gain of
$13,298
, reflected in gain (loss) on investments and sale of affiliate interests, net in the Company's consolidated statements of operations. For the year ended December 31, 2018, 2017 and 2016, the Company recorded equity in the net loss of Newsday of $
9,719
$7,219
and
$1,132
, respectively, reflected in other expense, net in the Company's consolidated statements of operations. The Company's deficit investment in Newsday as of December 31, 2017 of
$3,579
is included in deficit investments in affiliates on the Company's consolidated balance sheet. From July 7, 2016 through April 2018, the Company held a
25%
ownership interest in Newsday and prior to July 7, 2016, Newsday was a wholly-owned subsidiary of Cablevision.
Affiliate and Related Party Transactions
Altice USA is controlled by Patrick Drahi who is also the controlling stockholder of Altice Europe and its subsidiaries.
As the transactions discussed below were conducted between entities under common control by Mr. Drahi and equity method investees, amounts charged for certain services may not have represented amounts that might have been received or incurred if the transactions were based upon arm's length negotiations.
The following table summarizes the revenue and charges related to services provided to or received from subsidiaries of Altice Europe and Newsday:
|
Years Ended December 31,
|
|||||||||||
|
2018
|
2017
|
2016
|
|||||||||
|
Revenue
|
$
|
2,575
|
|
$
|
1,100
|
|
$
|
1,086
|
|
||
|
Operating expenses:
|
|||||||||||
|
Programming and other direct costs
|
$
|
(7,261
|
)
|
$
|
(4,176
|
)
|
$
|
(1,947
|
)
|
||
|
Other operating expenses, net
|
(16,307
|
)
|
(33,140
|
)
|
(18,854
|
)
|
|||||
|
Operating expenses, net
|
(23,568
|
)
|
(37,316
|
)
|
(20,801
|
)
|
|||||
|
Interest expense (see Note 11) (a)
|
(600
|
)
|
(90,405
|
)
|
(112,712
|
)
|
|||||
|
Other income. net
|
149
|
|
—
|
|
—
|
|
|||||
|
Loss on extinguishment of debt and write-off of deferred financing costs (see Note 11)
|
—
|
|
(513,723
|
)
|
—
|
|
|||||
|
Net charges
|
$
|
(21,444
|
)
|
$
|
(640,344
|
)
|
$
|
(132,427
|
)
|
||
|
Capital Expenditures
|
$
|
14,951
|
|
$
|
22,012
|
|
$
|
45,886
|
|
||
|
(a)
|
The 2016 amount includes
$10,155
related to Holdco Notes prior to the exchange in addition to the interest related to notes payable to affiliates and related parties discussed in Note 11. In connection with the Company's IPO in June 2017, the Company converted the notes payable to affiliates and related parties into shares of the Company’s common stock at the IPO price.
|
Revenue
The Company recognized revenue primarily from the sale of advertising to Teads.
Programming and other direct costs
Programming and other direct costs include costs incurred by the Company for the transport and termination of voice and data services provided by a subsidiary of Altice Europe.
Other operating expenses, net
A subsidiary of Altice Europe provided certain executive services, as well as consulting, advisory and other services, including, prior to the IPO, CEO, CFO and COO services, to the Company. Compensation under the terms of the agreement was an annual fee of
$30,000
to be paid by the Company. Fees associated with this agreement recorded by the Company amounted to approximately
$13,250
,
$30,000
and $
20,556
for the years ended
December 31, 2018
,
2017
and
2016
, respectively. As of June 20, 2017, the CEO, CFO and COO became employees of the Company and the
F-50
ALTICE USA, INC. AND SUBSIDIARIES
NOTES TO CONSOLIDATED FINANCIAL STATEMENTS (continued)
(Dollars in thousands, except share and per share amounts)
agreement was assigned to Altice Europe by a subsidiary of Altice Europe. This agreement was terminated upon the completion of the Distribution discussed in Note 1.
Other operating expenses also include charges for services provided by other subsidiaries of Altice Europe aggregating
$3,057
,
$4,057
and
$887
, for the years ended December 31, 2018, 2017 and 2016, respectively, net of a credit of
$917
and
$2,589
related to transition services provided to Newsday for the years ended December 31,
2017
and
2016
, respectively.
Capital Expenditures
Capital expenditures for the year ended
December 31, 2018
include
$14,951
for equipment purchased and software development services provided by subsidiaries of Altice Europe.
Capital expenditures for the year ended
December 31, 2017
include
$17,434
of equipment purchased from Altice Labs S.A., and
$4,578
of software development services, that were capitalized, from Altice Management International and other Altice Europe subsidiaries.
Capital expenditures for the year ended
December 31, 2016
include
$44,121
of equipment purchased from Altice Management International and
$1,025
from another Altice Europe subsidiary. In addition, the Company acquired certain software development services that were capitalized from Altice Labs S.A. aggregating
$740
.
Aggregate amounts that were due from and due to related parties are summarized below:
|
December 31,
|
|||||||
|
2018
|
2017
|
||||||
|
Due from:
|
|||||||
|
CVC 3 (a)
|
$
|
13,100
|
|
$
|
12,951
|
|
|
|
Newsday (b)
|
490
|
|
2,713
|
|
|||
|
Altice Europe (b)
|
1,271
|
|
33
|
|
|||
|
Altice Dominican Republic (b)
|
2,550
|
|
—
|
|
|||
|
i24NEWS (b)
|
—
|
|
4,036
|
|
|||
|
Other Altice Europe subsidiaries (b)
|
146
|
|
31
|
|
|||
|
$
|
17,557
|
|
$
|
19,764
|
|
||
|
Due to:
|
|||||||
|
Altice Europe (c)
|
$
|
15,235
|
|
$
|
—
|
|
|
|
Newsday (b)
|
22
|
|
33
|
|
|||
|
Altice Labs S.A. (d)
|
4,864
|
|
7,354
|
|
|||
|
Other Altice Europe subsidiaries (d)
|
5,975
|
|
3,611
|
|
|||
|
$
|
26,096
|
|
$
|
10,998
|
|
||
|
(a)
|
Represents interest on senior notes paid by the Company on behalf of Altice US Finance S.A., which merged into CVC 3 in 2018.
|
|
(b)
|
Represents amounts paid by the Company on behalf of or for services provided to the respective related party and for Newsday, the net amounts due from the related party also include charges for certain transition services provided.
|
|
(c)
|
Includes
$13,250
related to the agreement discussed above.
|
|
(d)
|
Represents amounts due to affiliates for the purchase of equipment and advertising services, as well as reimbursement for payments made on our behalf.
|
In the second quarter of 2017, prior to the Company's IPO, the Company declared and paid cash distributions aggregating
$839,700
to stockholders,
$500,000
of which were funded with proceeds from borrowings under CSC Holdings' revolving credit facility. In 2016, the Company declared cash distributions of
$445,176
, of which
$365,559
were paid in 2016 and
$79,617
were paid in the first quarter of 2017.
F-51
ALTICE USA, INC. AND SUBSIDIARIES
NOTES TO CONSOLIDATED FINANCIAL STATEMENTS (continued)
(Dollars in thousands, except share and per share amounts)
NOTE 17. COMMITMENTS AND CONTINGENCIES
Commitments
Future cash payments and commitments required under arrangements pursuant to contracts entered into by the Company in the normal course of business as of
December 31, 2018
are as follows:
|
|
Payments Due by Period
|
||||||||||||||||||
|
|
Total
|
Year 1
|
Years 2-3
|
Years 4-5
|
More than
5 years
|
||||||||||||||
|
Off balance sheet arrangements:
|
|||||||||||||||||||
|
Purchase obligations (a)
|
$
|
8,906,134
|
|
$
|
3,190,028
|
|
$
|
4,940,814
|
|
$
|
742,931
|
|
$
|
32,361
|
|
||||
|
Guarantees (b)
|
36,912
|
|
36,912
|
|
—
|
|
—
|
|
—
|
|
|||||||||
|
Letters of credit (c)
|
147,564
|
|
120
|
|
147,444
|
|
—
|
|
—
|
|
|||||||||
|
Total
|
$
|
9,090,610
|
|
$
|
3,227,060
|
|
$
|
5,088,258
|
|
$
|
742,931
|
|
$
|
32,361
|
|
||||
|
(a)
|
Purchase obligations primarily include contractual commitments with various programming vendors to provide video services to customers and minimum purchase obligations to purchase goods or services, including contracts to acquire handsets and other equipment. Future fees payable under contracts with programming vendors are based on numerous factors, including the number of customers receiving the programming. Amounts reflected above related to programming agreements are based on the number of customers receiving the programming as of December 31,
2018
multiplied by the per customer rates or the stated annual fee, as applicable, contained in the executed agreements in effect as of
December 31, 2018
.
|
|
(b)
|
Includes franchise and performance surety bonds primarily for the Company's cable television systems.
|
|
(c)
|
Represent letters of credit guaranteeing performance to municipalities and public utilities and payment of insurance premiums. Payments due by period for these arrangements represent the year in which the commitment expires although payments under these arrangements are required only in the event of nonperformance.
|
The table above does not include obligations for payments required to be made under multi-year franchise agreements based on a percentage of revenues generated from video service per year.
Many of the Company's franchise agreements and utility pole leases require the Company to remove its cable wires and other equipment upon termination of the respective agreements. The Company has concluded that the fair value of these asset retirement obligations cannot be reasonably estimated since the range of potential settlement dates is not determinable.
The table above does not include obligations for rent related to utility poles used in our operations. The Company's pole rental agreements are for varying terms, and management anticipates renewals as they expire. Rent expense incurred for pole rental attachments for the years ended
December 31, 2018
,
2017
and
2016
was
$33,082
,
$31,308
, and
$22,432
, respectively.
Legal Matters
Following expiration of the affiliation agreements for carriage of certain Fox broadcast stations and cable networks on October 16, 2010, News Corporation terminated delivery of the programming feeds to Cablevision, and as a result, those stations and networks were unavailable on Cablevision's cable television systems. On October 30, 2010, Cablevision and Fox reached an agreement on new affiliation agreements for these stations and networks, and carriage was restored. Several purported class action lawsuits alleging breach of contract, unjust enrichment, and consumer fraud and seeking unspecified compensatory damages, punitive damages and attorneys' fees were subsequently filed on behalf of Cablevision's customers seeking recovery for the lack of Fox programming. Those lawsuits were consolidated in an action before the U. S. District Court for the Eastern District of New York, and a consolidated complaint was filed in that court on February 22, 2011. On March 28, 2012, in ruling on Cablevision's motion to dismiss, the Court dismissed all of plaintiffs’ claims, except for breach of contract. On March 30, 2014, the Court granted plaintiffs’ motion for class certification. The parties have entered into a settlement agreement, which was granted final approval by the Court on
F-52
ALTICE USA, INC. AND SUBSIDIARIES
NOTES TO CONSOLIDATED FINANCIAL STATEMENTS (continued)
(Dollars in thousands, except share and per share amounts)
May 17, 2018. As of December 31, 2018, the Company had an estimated liability associated with the settlement totaling
$5,000
.
In October 2015, the New York Attorney General (“NYAG”) began an investigation into whether the major Internet Service Providers in New York State deliver advertised Internet speeds. On December 21, 2018, the Company entered into a settlement agreement with the NYAG, resolving the investigation.
In the latter half of 2018, eight named plaintiffs, each on behalf of a putative class of stockholders who purchased Company common stock in the Company's IPO pursuant to the Registration Statement and Prospectus, filed complaints (seven in New York State Supreme Court, one in United States District Court for the Eastern District of New York). The lawsuits name as defendants the Company, Altice Europe, and the Company's directors, among others, and assert that all defendants violated Sections 11 and 12 of the Securities Act of 1933 (the “Securities Act”) and that the individual defendants violated Section 15 of the Securities Act as control persons. Plaintiffs claim that the Registration Statement and Prospectus misrepresented or omitted material facts relating to the negative performance of Altice France and Altice Portugal, the disclosure of which in November 2017 negatively impacted the value of Altice USA’s stock. The New York State Supreme Court lawsuits are presently being consolidated into one action. The Company intends to vigorously defend the lawsuits. Although the outcome of the matter cannot be predicted and the impact of the final resolution of this matter on the Company’s results of operations in any particular subsequent reporting period is not known at this time, management does not believe that the ultimate resolution of the matter will have a material adverse effect on the operations or financial position of the Company or the ability of the Company to meet its financial obligations as they become due.
On November 6, 2018, Sprint Communications Company L.P (“Sprint”) filed a complaint in the U.S. District Court for the District of Delaware alleging that the Company infringes Sprint’s patents purportedly relating to Voice over Internet Protocol (“VoIP”) services. On December 3, 2018, Sprint filed a second complaint alleging that the Company infringes Sprint’s patents purportedly relating to VOD services. The lawsuits are part of a pattern of litigation that was initiated as far back as 2007 by Sprint against numerous broadband and telecommunications providers. The Company is investigating the allegations, and will vigorously defend the lawsuits. Although the outcome of the matter cannot be predicted and the impact of the final resolution of this matter on the Company’s results of operations in any particular subsequent reporting period is not known at this time, management does not believe that the ultimate resolution of the matter will have a material adverse effect on the operations or financial position of the Company or the ability of the Company to meet its financial obligations as they become due, but it could be material to the Company’s consolidated results of operations or cash flows for any one period.
The Company receives notices from third parties and, in some cases, is named as a defendant in certain lawsuits claiming infringement of various patents relating to various aspects of the Company's businesses. In certain of these cases other industry participants are also defendants. In certain of these cases the Company expects that any potential liability would be the responsibility of the Company's equipment vendors pursuant to applicable contractual indemnification provisions. In the event that the Company is found to infringe on any patent rights, the Company may be subject to substantial damages and/or an injunction that could require the Company or its vendors to modify certain products and services the Company offers to its subscribers, as well as enter into royalty or license agreements with respect to the patents at issue. The Company believes that the claims are without merit, but is unable to predict the outcome of these matters or reasonably estimate a range of possible loss.
In addition to the matters discussed above, the Company is party to various lawsuits, disputes and investigations, some of which may involve claims for substantial damages, fines or penalties. Although the outcome of these other matters cannot be predicted and the impact of the final resolution of these other matters on the Company's results of operations in a particular subsequent reporting period is not known, management does not believe that the resolution of these other lawsuits will have a material adverse effect on the financial position of the Company or the ability of the Company to meet its financial obligations as they become due.
F-53
ALTICE USA, INC. AND SUBSIDIARIES
NOTES TO CONSOLIDATED FINANCIAL STATEMENTS (continued)
(Dollars in thousands, except share and per share amounts)
NOTE 18. BENEFIT PLANS
Qualified and Non-qualified Defined Benefit Plans
Retirement Plans (collectively, the "Defined Benefit Plans")
The Company sponsors a non-contributory qualified defined benefit cash balance retirement plan (the "Pension Plan") for the benefit of non-union employees of Cablevision, as well as certain employees covered by a collective bargaining agreement in Brooklyn.
The Company maintains an unfunded non-contributory non-qualified defined benefit excess cash balance plan ("Excess Cash Balance Plan") covering certain current and former employees of Cablevision who participate in the Pension Plan. The Company also maintained an additional unfunded non-contributory, non-qualified defined benefit plan ("CSC Supplemental Benefit Plan") for the benefit of certain former officers and employees of Cablevision which provided that, upon retiring on or after normal retirement age, a participant receives a benefit equal to a specified percentage of the participant's average compensation, as defined. All participants were
100%
vested in the CSC Supplemental Benefit Plan. The benefits related to the CSC Supplemental Plan were paid to participants in January 2017 and the plan was terminated.
Cablevision's Pension Plan and the Excess Cash Balance Plan are frozen and no employee of Cablevision who was not already a participant could participate in the plans and no further annual Pay Credits (a certain percentage of employees' eligible pay) are made. Existing account balances under the plans continue to be credited with monthly interest in accordance with the terms of the plans.
Plan Results for Defined Benefit Plans
Summarized below is the funded status and the amounts recorded on the Company's consolidated balance sheets for all of the Company's Defined Benefit Plans at
December 31, 2018
and
2017
:
|
December 31,
|
|||||||
|
2018
|
2017
|
||||||
|
Change in projected benefit obligation:
|
|||||||
|
Projected benefit obligation at beginning of year
|
$
|
299,066
|
|
$
|
382,517
|
|
|
|
Interest cost
|
9,248
|
|
11,786
|
|
|||
|
Actuarial loss (gain)
|
(9,894
|
)
|
13,171
|
|
|||
|
Curtailments
|
—
|
|
6,332
|
|
|||
|
Settlements
|
2,373
|
|
6,910
|
|
|||
|
Benefits paid
|
(36,278
|
)
|
(121,650
|
)
|
|||
|
Projected benefit obligation at end of year
|
264,515
|
|
299,066
|
|
|||
|
Change in plan assets:
|
|
|
|||||
|
Fair value of plan assets at beginning of year
|
195,768
|
|
284,118
|
|
|||
|
Actual gain (loss) on plan assets, net
|
(5,705
|
)
|
6,356
|
|
|||
|
Employer contributions
|
13,725
|
|
26,944
|
|
|||
|
Benefits paid
|
(36,278
|
)
|
(121,650
|
)
|
|||
|
Fair value of plan assets at end of year
|
167,510
|
|
195,768
|
|
|||
|
Unfunded status at end of year
|
$
|
(97,005
|
)
|
$
|
(103,298
|
)
|
|
The accumulated benefit obligation for the Company's Defined Benefit Plans aggregated
$264,515
and
$299,066
at
December 31, 2018
and
2017
, respectively.
F-54
ALTICE USA, INC. AND SUBSIDIARIES
NOTES TO CONSOLIDATED FINANCIAL STATEMENTS (continued)
(Dollars in thousands, except share and per share amounts)
The Company's net funded status relating to its Defined Benefit Plans at
December 31, 2018
and
2017
, is as follows:
|
December 31,
|
|||||||
|
2018
|
2017
|
||||||
|
Defined Benefit Plans
|
$
|
(97,005
|
)
|
$
|
(103,298
|
)
|
|
|
Less: Current portion related to nonqualified plans
|
211
|
|
135
|
|
|||
|
Long-term defined benefit plan obligations
|
$
|
(96,794
|
)
|
$
|
(103,163
|
)
|
|
Components of the benefit costs, recorded in other income (expense), net, for the Defined Benefit Plans for the years ended
December 31, 2018
,
2017
and 2016, is as follows:
|
Years Ended December 31,
|
|||||||||||
|
2018
|
2017
|
2016
|
|||||||||
|
Interest cost
|
$
|
9,248
|
|
$
|
11,786
|
|
$
|
6,946
|
|
||
|
Expected return on plan assets, net
|
(987
|
)
|
(4,905
|
)
|
(3,880
|
)
|
|||||
|
Curtailment loss
|
—
|
|
3,137
|
|
231
|
|
|||||
|
Settlement loss (income) (reclassified from accumulated other comprehensive loss) (a)
|
1,268
|
|
1,845
|
|
(154
|
)
|
|||||
|
Non-operating pension costs
|
$
|
9,529
|
|
$
|
11,863
|
|
$
|
3,143
|
|
||
|
(a)
|
As a result of benefit payments to terminated or retired individuals exceeding the service and interest costs for the Pension Plan and the Excess Cash Balance Pension Plan during the years ended December 31, 2018 and 2017 and during the period June 21, 2016 through December 31, 2016, the Company recognized non-cash settlement losses that represent the acceleration of the recognition of a portion of the previously unrecognized actuarial losses recorded in accumulated other comprehensive loss on the Company’s consolidated balance sheets relating to these plans.
|
Plan Assumptions for Defined Benefit Plans
Weighted-average assumptions used to determine pension costs (made at the beginning of the year) and benefit obligations (made at the end of the year) for the Defined Benefit Plans are as follows:
|
|
Benefit Costs
|
Benefit Obligations at December 31,
|
||||||||||||
|
|
For the Year Ended December 31, 2018
|
For the Year Ended December 31, 2017
|
For the Period June 21, 2016 to December 31, 2016
|
2018
|
2017
|
|||||||||
|
Discount rate (a)
|
3.87
|
%
|
3.69
|
%
|
3.53
|
%
|
4.20
|
%
|
3.50
|
%
|
||||
|
Rate of increase in future compensation levels
|
—
|
%
|
—
|
%
|
—
|
%
|
—
|
%
|
—
|
%
|
||||
|
Expected rate of return on plan assets (Pension Plan only)
|
3.67
|
%
|
3.90
|
%
|
3.97
|
%
|
N/A
|
|
N/A
|
|
||||
|
(a)
|
The discount rates of
3.87%
3.69%
and
3.53%
for the years ended December 31, 2018 and 2017 and for the period June 21, 2016 through December 31, 2016, represents the average of the quarterly discount rates used to remeasure the Company's projected benefit obligation and benefit costs in connection with the recognition of settlement losses discussed above.
|
The discount rate used by the Company in calculating the benefit costs for the Cash Balance Plan and the Excess Cash Balance Plan was determined based on the expected future benefit payments for the plans and from the Willis Towers Watson U.S. Rate Link: 40-90 Discount Rate Model. The model was developed by examining the yields on selected highly rated corporate bonds.
The Company's expected long-term return on Pension Plan assets is based on a periodic review and modeling of the plan's asset allocation structure over a long-term horizon. Expectations of returns and risk for each asset class are the most important of the assumptions used in the review and modeling and are based on comprehensive reviews of historical data, forward looking economic outlook, and economic/financial market theory. The expected long-term rate of return
F-55
ALTICE USA, INC. AND SUBSIDIARIES
NOTES TO CONSOLIDATED FINANCIAL STATEMENTS (continued)
(Dollars in thousands, except share and per share amounts)
was chosen as a best estimate and was determined by (a) historical real returns, net of inflation, for the asset classes covered by the investment policy, and (b) projections of inflation over the long-term period during which benefits are payable to plan participants.
Pension Plan Assets and Investment Policy
The weighted average asset allocations of the Pension Plan at
December 31, 2018
and
2017
were as follows:
|
Plan Assets at December 31,
|
|||||
|
2018
|
2017
|
||||
|
Asset Class:
|
|||||
|
Mutual funds
|
29
|
%
|
32
|
%
|
|
|
Fixed income securities
|
65
|
|
66
|
|
|
|
Cash equivalents and other
|
6
|
|
2
|
|
|
|
100
|
%
|
100
|
%
|
||
The Pension Plan's investment objectives reflect an overall low risk tolerance to stock market volatility. This strategy allows for the Pension Plan to invest in portfolios that would obtain a rate of return throughout economic cycles, commensurate with the investment risk and cash flow needs of the Pension Plan. The investments held in the Pension Plan are readily marketable and can be sold to fund benefit payment obligations of the plan as they become payable.
Investment allocation decisions are formally made by the Company's Benefit Committee, which takes into account investment advice provided by its external investment consultant. The investment consultant takes into account expected long-term risk, return, correlation, and other prudent investment assumptions when recommending asset classes and investment managers to the Company's Benefit Committee. The major categories of the Pension Plan assets are cash equivalents and bonds which are marked-to-market on a daily basis. Due to the Pension Plan's significant holdings in long-term government and non-government fixed income securities, the Pension Plan's assets are subjected to interest rate risk; specifically, a rising interest rate environment. Consequently, an increase in interest rates may cause a decrease to the overall liability of the Pension Plan thus creating a hedge against rising interest rates. In addition, a portion of the Pension Plan's bond portfolio is invested in foreign debt securities where there could be foreign currency risks associated with them, as well as in non-government securities which are subject to credit risk of the bond issuer defaulting on interest and/or principal payments.
Investments at Estimated Fair Value
The fair values of the assets of the Pension Plan at
December 31, 2018
by asset class are as follows:
|
Asset Class
|
Level I
|
Level II
|
Level III
|
Total
|
|||||||||||
|
Mutual funds
|
$
|
49,140
|
|
$
|
—
|
|
$
|
—
|
|
$
|
49,140
|
|
|||
|
Fixed income securities held in a portfolio:
|
|||||||||||||||
|
Foreign issued corporate debt
|
—
|
|
14,002
|
|
—
|
|
14,002
|
|
|||||||
|
U.S. corporate debt
|
—
|
|
43,190
|
|
—
|
|
43,190
|
|
|||||||
|
Government debt
|
—
|
|
3,988
|
|
—
|
|
3,988
|
|
|||||||
|
U.S. Treasury securities
|
—
|
|
38,657
|
|
—
|
|
38,657
|
|
|||||||
|
Asset-backed securities
|
—
|
|
8,907
|
|
—
|
|
8,907
|
|
|||||||
|
Other
|
—
|
|
205
|
|
—
|
|
205
|
|
|||||||
|
Cash equivalents (a)
|
4,343
|
|
3,187
|
|
—
|
|
7,530
|
|
|||||||
|
Total (b)
|
$
|
53,483
|
|
$
|
112,136
|
|
$
|
—
|
|
$
|
165,619
|
|
|||
|
(a)
|
A significant portion represents an investment in a short-term investment fund that invests primarily in securities of high quality and low risk.
|
|
(b)
|
Excludes cash and net receivables relating to the sale of securities that were not settled as of
December 31, 2018
.
|
The fair values of the assets of the Pension Plan at
December 31, 2017
by asset class are as follows:
F-56
ALTICE USA, INC. AND SUBSIDIARIES
NOTES TO CONSOLIDATED FINANCIAL STATEMENTS (continued)
(Dollars in thousands, except share and per share amounts)
|
Asset Class
|
Level I
|
Level II
|
Level III
|
Total
|
|||||||||||
|
Mutual funds
|
$
|
61,833
|
|
$
|
—
|
|
$
|
—
|
|
$
|
61,833
|
|
|||
|
Fixed income securities held in a portfolio:
|
|
||||||||||||||
|
Foreign issued corporate debt
|
—
|
|
10,721
|
|
—
|
|
10,721
|
|
|||||||
|
U.S. corporate debt
|
—
|
|
39,992
|
|
—
|
|
39,992
|
|
|||||||
|
Government debt
|
—
|
|
4,645
|
|
—
|
|
4,645
|
|
|||||||
|
U.S. Treasury securities
|
—
|
|
62,601
|
|
—
|
|
62,601
|
|
|||||||
|
Asset-backed securities
|
—
|
|
10,978
|
|
—
|
|
10,978
|
|
|||||||
|
Cash equivalents (a)
|
6,691
|
|
2,782
|
|
—
|
|
9,473
|
|
|||||||
|
Total (b)
|
$
|
68,524
|
|
$
|
131,719
|
|
$
|
—
|
|
$
|
200,243
|
|
|||
|
(a)
|
A significant portion represents an investment in a short-term investment fund that invests primarily in securities of high quality and low risk.
|
|
(b)
|
Excludes cash and net payables relating to the purchase of securities that were not settled as of
December 31, 2017
.
|
The fair values of mutual funds and cash equivalents were derived from quoted market prices that the Pension Plan administrator has the ability to access.
The fair values of corporate and government debt, treasury securities and asset-back securities were derived from bids received from a vendor or broker not available in an active market that the Pension Plan administrator has the ability to access.
Benefit Payments and Contributions for Defined Benefit Plans
The following benefit payments are expected to be paid during the periods indicated:
|
2019
|
$
|
21,137
|
|
|
2020
|
17,067
|
|
|
|
2021
|
17,690
|
|
|
|
2022
|
16,837
|
|
|
|
2023
|
20,119
|
|
|
|
2024-2028
|
93,793
|
|
|
The Company currently expects to contribute approximately
$36,000
to the Pension Plan in
2019
.
Defined Contribution Plans
The Company maintains the Altice USA 401(k) Savings Plan (formerly known as the Cablevision 401(k) Savings Plan), a contributory qualified defined contribution plan for the benefit of non-union employees of Cablevision. Participants can contribute a percentage of eligible annual compensation and the Company will make a matching cash contribution or discretionary contribution, as defined in the plan. In addition, the Company maintains an unfunded non-qualified Excess Savings Plan which was frozen on January 1, 2017 for which the Company provided a matching contribution similar to the Altice USA 401(k) Savings Plan. Applicable employees of the Company were eligible for an enhanced employer matching contribution, as well as a year-end employer discretionary contribution to the Cablevision 401(k) Savings Plan and the Cablevision Excess Savings Plan.
Through September 30, 2017, the Company also maintained a 401(k) plan for employees of Cequel. Cequel employees that qualified for participation were able to contribute a percentage of eligible annual compensation and the Company would make a matching cash contribution, as defined in the plan. During the fourth quarter of 2017, the Cequel 401(k) plan assets were transferred to the Cablevision 401(k) Savings Plan and the plan was renamed the Altice USA 401(k) Savings Plan.
The cost associated with these plans (including the enhanced employer matching and discretionary contributions in 2016) was
$28,232
,
$27,577
and
$28,501
for the years ended
December 31, 2018
,
2017
and
2016
, respectively.
F-57
ALTICE USA, INC. AND SUBSIDIARIES
NOTES TO CONSOLIDATED FINANCIAL STATEMENTS (continued)
(Dollars in thousands, except share and per share amounts)
NOTE 19. ALLOWANCE FOR DOUBTFUL ACCOUNTS
Activity related to the Company's allowance for doubtful accounts is presented below:
|
|
Balance at Beginning of Period
|
Provision for Bad Debt
|
Deductions/ Write-Offs and Other Charges
|
Balance at End of Period
|
|||||||||||
|
Year Ended December 31, 2018
|
|||||||||||||||
|
Allowance for doubtful accounts
|
$
|
13,420
|
|
$
|
71,426
|
|
$
|
(71,326
|
)
|
$
|
13,520
|
|
|||
|
Year Ended December 31, 2017
|
|||||||||||||||
|
Allowance for doubtful accounts
|
$
|
11,677
|
|
$
|
74,183
|
|
$
|
(72,440
|
)
|
$
|
13,420
|
|
|||
|
Year Ended December 31, 2016
|
|||||||||||||||
|
Allowance for doubtful accounts
|
$
|
1,051
|
|
$
|
53,249
|
|
$
|
(42,623
|
)
|
$
|
11,677
|
|
|||
NOTE 20. INTERIM FINANCIAL INFORMATION (Unaudited)
The following is a summary of the Company's selected quarterly financial data:
|
Three Months Ended
|
|||||||||||||||||||
|
March 31,
2018
|
June 30,
2018 |
September 30,
2018 |
December 31,
2018 (a) |
Total
2018 |
|||||||||||||||
|
Residential:
|
|||||||||||||||||||
|
Pay TV
|
$
|
1,033,708
|
|
$
|
1,034,404
|
|
$
|
1,054,667
|
|
$
|
1,033,649
|
|
$
|
4,156,428
|
|
||||
|
Broadband
|
701,621
|
|
712,202
|
|
729,907
|
|
743,725
|
|
2,887,455
|
|
|||||||||
|
Telephony
|
166,038
|
|
163,499
|
|
161,351
|
|
162,007
|
|
652,895
|
|
|||||||||
|
Business services and wholesale
|
333,090
|
|
337,388
|
|
344,193
|
|
348,087
|
|
1,362,758
|
|
|||||||||
|
Advertising
|
87,582
|
|
109,898
|
|
123,066
|
|
162,103
|
|
482,649
|
|
|||||||||
|
Other
|
7,675
|
|
6,762
|
|
4,617
|
|
5,369
|
|
24,423
|
|
|||||||||
|
Revenue
|
2,329,714
|
|
2,364,153
|
|
2,417,801
|
|
2,454,940
|
|
9,566,608
|
|
|||||||||
|
Operating expenses
|
(2,016,676
|
)
|
(2,029,094
|
)
|
(1,912,243
|
)
|
(1,926,216
|
)
|
(7,884,229
|
)
|
|||||||||
|
Operating income
|
$
|
313,038
|
|
$
|
335,059
|
|
$
|
505,558
|
|
$
|
528,724
|
|
$
|
1,682,379
|
|
||||
|
Net income (loss)
|
$
|
(128,949
|
)
|
$
|
(98,004
|
)
|
$
|
33,739
|
|
$
|
213,808
|
|
$
|
20,594
|
|
||||
|
Net loss (income) attributable to noncontrolling interests
|
(2
|
)
|
149
|
|
(1,186
|
)
|
(722
|
)
|
(1,761
|
)
|
|||||||||
|
Net income (loss) attributable to Altice USA Inc.'s stockholders
|
$
|
(128,951
|
)
|
$
|
(97,855
|
)
|
$
|
32,553
|
|
$
|
213,086
|
|
$
|
18,833
|
|
||||
|
Basic and diluted net income (loss) per share attributable to Altice USA Inc.'s stockholders
|
$
|
(0.17
|
)
|
$
|
(0.13
|
)
|
$
|
0.04
|
|
$
|
0.30
|
|
$
|
0.03
|
|
||||
F-58
ALTICE USA, INC. AND SUBSIDIARIES
NOTES TO CONSOLIDATED FINANCIAL STATEMENTS (continued)
(Dollars in thousands, except share and per share amounts)
|
Three Months Ended
|
|||||||||||||||||||
|
March 31,
2017
|
June 30,
2017 |
September 30,
2017 |
December 31,
2017 (b) |
Total
2017 |
|||||||||||||||
|
Residential:
|
|||||||||||||||||||
|
Pay TV
|
$
|
1,083,878
|
|
$
|
1,071,163
|
|
$
|
1,069,946
|
|
$
|
1,049,135
|
|
$
|
4,274,122
|
|
||||
|
Broadband
|
625,918
|
|
642,620
|
|
658,278
|
|
681,779
|
|
2,608,595
|
|
|||||||||
|
Telephony
|
180,961
|
|
178,261
|
|
172,479
|
|
169,064
|
|
700,765
|
|
|||||||||
|
Business services and wholesale
|
319,420
|
|
323,641
|
|
324,642
|
|
330,510
|
|
1,298,213
|
|
|||||||||
|
Advertising
|
83,361
|
|
97,501
|
|
89,292
|
|
121,712
|
|
391,866
|
|
|||||||||
|
Other
|
8,721
|
|
9,176
|
|
7,884
|
|
7,608
|
|
33,389
|
|
|||||||||
|
Revenue
|
2,302,259
|
|
2,322,362
|
|
2,322,521
|
|
2,359,808
|
|
9,306,950
|
|
|||||||||
|
Operating expenses
|
(2,052,149
|
)
|
(2,069,094
|
)
|
(2,201,946
|
)
|
(2,142,753
|
)
|
(8,465,942
|
)
|
|||||||||
|
Operating income
|
$
|
250,110
|
|
$
|
253,268
|
|
$
|
120,575
|
|
$
|
217,055
|
|
$
|
841,008
|
|
||||
|
Net income (loss)
|
$
|
(76,188
|
)
|
$
|
(479,939
|
)
|
$
|
(192,434
|
)
|
$
|
2,243,325
|
|
$
|
1,494,764
|
|
||||
|
Net income attributable to noncontrolling interests
|
(237
|
)
|
(365
|
)
|
(135
|
)
|
(850
|
)
|
(1,587
|
)
|
|||||||||
|
Net income (loss) attributable to Altice USA, Inc. stockholders
|
$
|
(76,425
|
)
|
$
|
(480,304
|
)
|
$
|
(192,569
|
)
|
$
|
2,242,475
|
|
$
|
1,493,177
|
|
||||
|
Basic and diluted net income (loss) per share attributable to Altice USA Inc.'s stockholders
|
$
|
(0.12
|
)
|
$
|
(0.73
|
)
|
$
|
(0.26
|
)
|
$
|
3.04
|
|
$
|
2.15
|
|
||||
|
(a)
|
In the fourth quarter of 2018, the Company recorded a non-cash deferred tax benefit of
$52,915
based on a remeasurement of the Company's net deferred tax liability. See Note 14 to the consolidated financial statements for further details.
|
|
(b)
|
Pursuant to the enactment of the Tax Reform on December 22, 2017, the Company recorded a non-cash deferred tax benefit of
$2,332,677
to remeasure the net deferred tax liability to adjust for the reduction in the corporate federal income tax rate
35%
to
21%
which was effective on January 1, 2018.
|
The Company’s previously reported statement of cash flows for the three months ended March 31, 2017 reflected distributions to stockholders of
$79,617
in cash flows from operating activities. These distributions should have been reflected in cash flows from financing activities.
NOTE 21. SUBSEQUENT EVENTS
In January 2019, CSC Holdings issued
$1,500,000
in aggregate principal amount of senior guaranteed notes due 2029 ("CSC Holdings 2029 Guaranteed Notes"). The notes bear interest at a rate of
6.5%
and will mature on February 1, 2029. The net proceeds from the sale of the notes were used to repay certain indebtedness, including to repay at maturity
$526,000
aggregate principal amount of CSC Holdings'
8.625%
senior notes due February 2019 plus accrued interest, redeem approximately
$905,300
of the aggregate outstanding amount of CSC Holdings'
10.125%
senior notes due 2023 at a redemption price of
107.594%
plus accrued interest, and paid fees and expenses associated with the transactions. In connection with this refinancing,
$526,000
of short-term senior notes were reclassified to long-term debt.
In January 2019, CSC Holdings borrowed
$200,000
under its revolving credit facility and in February 2019, repaid
$250,000
of amounts outstanding under the revolving credit facility from the proceeds of the issuance of an additional
$250,000
principal amount of CSC Holdings 2029 Guaranteed Notes at a price of
101.75%
of the principal value.
Also, in January 2019, CSC Holdings obtained commitments to refinance its existing revolving credit facility, subject to customary closing conditions. After the refinancing, the total size of the new revolving credit facility is
$2,562,500
, including
$2,170,000
extended to January 2024 and priced at LIBOR plus
2.25%
. The remaining
$392,500
matures in November 2021.
In February 2019, CSC Holdings entered into a
$1,000,000
senior secured Term Loan B ("Incremental Term Loan B-4") maturing on April 15, 2027, the proceeds of which were used to redeem
$894,700
in aggregate principal amount of CSC
F-59
ALTICE USA, INC. AND SUBSIDIARIES
NOTES TO CONSOLIDATED FINANCIAL STATEMENTS (continued)
(Dollars in thousands, except share and per share amounts)
Holdings’
10.125%
Senior Notes due 2023, representing the entire aggregate principal amount outstanding, and paying related fees, costs and expenses. The Incremental Term Loan B-4 bears interest at a rate per annum equal to LIBOR plus
3.0%
and was issued with an original issue discount of
1.0%
.
F-60
REPORT OF INDEPENDENT REGISTERED PUBLIC ACCOUNTING FIRM
The Board of Directors
Cablevision Systems Corporation:
We have audited the accompanying consolidated balance sheet of Cablevision Systems Corporation and subsidiaries (the Company) as of December 31, 2015 and the related consolidated statements of operations and comprehensive income (loss), stockholders’ equity (deficiency), and cash flows for the period from January 1, 2016 to June 20, 2016, and the year ended December 31, 2015. These consolidated financial statements are the responsibility of the Company’s management. Our responsibility is to express an opinion on these consolidated financial statements based on our audits.
We conducted our audits in accordance with the standards of the Public Company Accounting Oversight Board (United States). Those standards require that we plan and perform the audit to obtain reasonable assurance about whether the financial statements are free of material misstatement. An audit includes examining, on a test basis, evidence supporting the amounts and disclosures in the financial statements. An audit also includes assessing the accounting principles used and significant estimates made by management, as well as evaluating the overall financial statement presentation. We believe that our audits provide a reasonable basis for our opinion.
In our opinion, the consolidated financial statements referred to above present fairly, in all material respects, the financial position of Cablevision Systems Corporation and subsidiaries as of December 31, 2015, and the results of their operations and their cash flows for the period from January 1, 2016 to June 20, 2016, and the year ended December 31, 2015, in conformity with U.S. generally accepted accounting principles.
/s/ KPMG LLP
New York, New York
April 10, 2017
F-61
|
CABLEVISION SYSTEMS CORPORATION AND SUBSIDIARIES
CONSOLIDATED BALANCE SHEET
December 31, 2015
(In thousands)
|
|||
|
ASSETS
|
|||
|
Current Assets:
|
December 31, 2015
|
||
|
Cash and cash equivalents
|
$
|
1,003,279
|
|
|
Restricted cash
|
1,600
|
|
|
|
Accounts receivable, trade (less allowance for doubtful accounts of $6,039)
|
266,383
|
|
|
|
Prepaid expenses and other current assets
|
123,242
|
|
|
|
Amounts due from affiliates
|
767
|
|
|
|
Deferred tax asset
|
14,596
|
|
|
|
Investment securities pledged as collateral
|
455,386
|
|
|
|
Derivative contracts
|
10,333
|
|
|
|
Total current assets
|
1,875,586
|
|
|
|
Property, plant and equipment, net of accumulated depreciation of $9,625,348
|
3,017,015
|
|
|
|
Investment in affiliates
|
—
|
|
|
|
Investment securities pledged as collateral
|
756,596
|
|
|
|
Derivative contracts
|
72,075
|
|
|
|
Other assets
|
32,920
|
|
|
|
Amortizable customer relationships, net of accumulated amortization of $27,778
|
11,636
|
|
|
|
Other amortizable intangibles, net of accumulated amortization of $32,532
|
25,315
|
|
|
|
Trademarks and other indefinite-lived intangible assets
|
7,250
|
|
|
|
Indefinite-lived cable television franchises
|
731,848
|
|
|
|
Goodwill
|
262,345
|
|
|
|
Deferred financing costs, net of accumulated amortization of $8,150
|
7,588
|
|
|
|
|
$
|
6,800,174
|
|
See accompanying notes to consolidated financial statements.
F-62
|
CABLEVISION SYSTEMS CORPORATION AND SUBSIDIARIES
CONSOLIDATED BALANCE SHEET (continued)
(In thousands, except share and per share amounts)
|
|||
|
LIABILITIES AND STOCKHOLDERS' DEFICIENCY
|
December 31, 2015
|
||
|
Current Liabilities:
|
|||
|
Accounts payable
|
$
|
453,653
|
|
|
Accrued liabilities:
|
|
|
|
|
Interest
|
119,005
|
|
|
|
Employee related costs
|
344,091
|
|
|
|
Other accrued expenses
|
169,899
|
|
|
|
Amounts due to affiliates
|
29,729
|
|
|
|
Deferred revenue
|
55,545
|
|
|
|
Liabilities under derivative contracts
|
2,706
|
|
|
|
Credit facility debt
|
562,898
|
|
|
|
Collateralized indebtedness
|
416,621
|
|
|
|
Senior notes and debentures
|
—
|
|
|
|
Capital lease obligations
|
20,350
|
|
|
|
Notes payable
|
13,267
|
|
|
|
Total current liabilities
|
2,187,764
|
|
|
|
Defined benefit plan obligations
|
99,228
|
|
|
|
Other liabilities
|
165,768
|
|
|
|
Deferred tax liability
|
704,835
|
|
|
|
Credit facility debt
|
1,951,556
|
|
|
|
Collateralized indebtedness
|
774,703
|
|
|
|
Senior guaranteed notes
|
—
|
|
|
|
Senior notes and debentures
|
5,801,011
|
|
|
|
Capital lease obligations
|
25,616
|
|
|
|
Notes payable
|
1,277
|
|
|
|
Total liabilities
|
11,711,758
|
|
|
|
Commitments and contingencies
|
|
|
|
|
Stockholders' Deficiency:
|
|
|
|
|
Preferred Stock, $.01 par value, 50,000,000 shares authorized, none issued
|
—
|
|
|
|
CNYG Class A common stock, $.01 par value, 800,000,000 shares authorized, 304,196,703 shares issued and 222,572,210 shares outstanding
|
3,042
|
|
|
|
CNYG Class B common stock, $.01 par value, 320,000,000 shares authorized, 54,137,673 shares issued and outstanding
|
541
|
|
|
|
RMG Class A common stock, $.01 par value, 600,000,000 shares authorized, none issued
|
—
|
|
|
|
RMG Class B common stock, $.01 par value, 160,000,000 shares authorized, none issued
|
—
|
|
|
|
Paid-in capital
|
792,351
|
|
|
|
Accumulated deficit
|
(4,059,411
|
)
|
|
|
|
(3,263,477
|
)
|
|
|
Treasury stock, at cost (81,624,493 CNYG Class A common shares)
|
(1,610,167
|
)
|
|
|
Accumulated other comprehensive loss
|
(37,672
|
)
|
|
|
Total stockholders' deficiency
|
(4,911,316
|
)
|
|
|
Noncontrolling interest
|
(268
|
)
|
|
|
Total deficiency
|
(4,911,584
|
)
|
|
|
|
$
|
6,800,174
|
|
See accompanying notes to consolidated financial statements.
F-63
|
CABLEVISION SYSTEMS CORPORATION AND SUBSIDIARIES
CONSOLIDATED STATEMENTS OF OPERATIONS
(In thousands, except per share amounts)
|
|||||||
|
|
January 1, 2016 to June 20, 2016
|
Year ended December 31, 2015
|
|||||
|
Revenue (including revenue from affiliates of $2,088 and $5,343, respectively) (See Note 16)
|
$
|
3,137,604
|
|
$
|
6,545,545
|
|
|
|
Operating expenses:
|
|
|
|
|
|||
|
Programming and other direct costs (including charges from affiliates of $84,636 and $176,909, respectively) (See Note 16)
|
1,088,555
|
|
2,269,290
|
|
|||
|
Other operating expenses (including charges (credits) from affiliates of $2,182 and $5,372, respectively) (See Note 16)
|
1,136,970
|
|
2,546,319
|
|
|||
|
Restructuring and other expense
|
22,223
|
|
16,213
|
|
|||
|
Depreciation and amortization (including impairments)
|
414,550
|
|
865,252
|
|
|||
|
|
2,662,298
|
|
5,697,074
|
|
|||
|
Operating income
|
475,306
|
|
848,471
|
|
|||
|
Other income (expense):
|
|
|
|
|
|||
|
Interest expense
|
(287,098
|
)
|
(585,764
|
)
|
|||
|
Interest income
|
1,590
|
|
925
|
|
|||
|
Gain (loss) on investments, net
|
129,990
|
|
(30,208
|
)
|
|||
|
Gain (loss) on equity derivative contracts, net
|
(36,283
|
)
|
104,927
|
|
|||
|
Loss on extinguishment of debt and write-off of deferred financing costs
|
—
|
|
(1,735
|
)
|
|||
|
Other expense, net
|
4,855
|
|
6,045
|
|
|||
|
|
(186,946
|
)
|
(505,810
|
)
|
|||
|
Income from continuing operations before income taxes
|
288,360
|
|
342,661
|
|
|||
|
Income tax expense
|
(124,848
|
)
|
(154,872
|
)
|
|||
|
Income from continuing operations, net of income taxes
|
163,512
|
|
187,789
|
|
|||
|
Loss from discontinued operations, net of income taxes
|
—
|
|
(12,541
|
)
|
|||
|
Net income
|
163,512
|
|
175,248
|
|
|||
|
Net loss attributable to noncontrolling interests
|
236
|
|
201
|
|
|||
|
Net income attributable to Cablevision Systems Corporation stockholders
|
$
|
163,748
|
|
$
|
175,449
|
|
|
|
INCOME PER SHARE:
|
|||||||
|
Basic income (loss) per share attributable to Cablevision Systems Corporation stockholder(s):
|
|||||||
|
Income from continuing operations, net of income taxes
|
$
|
0.60
|
|
$
|
0.70
|
|
|
|
Income (loss) from discontinued operations, net of income taxes
|
$
|
—
|
|
$
|
(0.05
|
)
|
|
|
Net income
|
$
|
0.60
|
|
$
|
0.65
|
|
|
|
Basic weighted average common shares (in thousands)
|
272,035
|
|
269,388
|
|
|||
|
Diluted income (loss) per share attributable to Cablevision Systems Corporation stockholder(s):
|
|||||||
|
Income from continuing operations, net of income taxes
|
$
|
0.58
|
|
$
|
0.68
|
|
|
|
Income (loss) from discontinued operations, net of income taxes
|
$
|
—
|
|
$
|
(0.05
|
)
|
|
|
Net income
|
$
|
0.58
|
|
$
|
0.63
|
|
|
|
Diluted weighted average common shares (in thousands)
|
280,199
|
|
276,339
|
|
|||
|
Amounts attributable to Cablevision Systems Corporation stockholder(s):
|
|
|
|
|
|||
|
Income from continuing operations, net of income taxes
|
$
|
163,748
|
|
$
|
187,990
|
|
|
|
Loss from discontinued operations, net of income taxes
|
—
|
|
(12,541
|
)
|
|||
|
Net income
|
$
|
163,748
|
|
$
|
175,449
|
|
|
|
Cash dividends declared and paid per share of common stock
|
$
|
—
|
|
$
|
0.45
|
|
|
See accompanying notes to consolidated financial statements.
F-64
|
CABLEVISION SYSTEMS CORPORATION AND SUBSIDIARIES
CONSOLIDATED STATEMENTS OF COMPREHENSIVE INCOME
(In thousands)
|
|||||||
|
|
January 1, 2016 to June 20, 2016
|
Year ended December 31, 2015
|
|||||
|
Net income
|
$
|
163,512
|
|
$
|
175,248
|
|
|
|
Other comprehensive income (loss):
|
|
|
|||||
|
Defined benefit pension and postretirement plans (see Note 14):
|
|
|
|||||
|
Unrecognized actuarial gain
|
68
|
|
2,694
|
|
|||
|
Applicable income taxes
|
(28
|
)
|
(1,106
|
)
|
|||
|
Unrecognized income arising during period, net of income taxes
|
40
|
|
1,588
|
|
|||
|
Amortization of actuarial losses, net included in net periodic benefit cost
|
929
|
|
1,224
|
|
|||
|
Applicable income taxes
|
(388
|
)
|
(502
|
)
|
|||
|
Amortization of actuarial losses, net included in net periodic benefit cost, net of income taxes
|
541
|
|
722
|
|
|||
|
Settlement loss included in net periodic benefit cost
|
1,655
|
|
3,822
|
|
|||
|
Applicable income taxes
|
(679
|
)
|
(1,569
|
)
|
|||
|
Settlement loss included in net periodic benefit cost, net of income taxes
|
976
|
|
2,253
|
|
|||
|
Other comprehensive income
|
1,557
|
|
4,563
|
|
|||
|
Comprehensive income
|
165,069
|
|
179,811
|
|
|||
|
Comprehensive loss attributable to noncontrolling interests
|
236
|
|
201
|
|
|||
|
Comprehensive income attributable to Cablevision Systems Corporation stockholder(s)
|
$
|
165,305
|
|
$
|
180,012
|
|
|
See accompanying notes to consolidated financial statements.
F-65
|
CABLEVISION SYSTEMS CORPORATION AND SUBSIDIARIES
CONSOLIDATED STATEMENTS OF STOCKHOLDERS' DEFICIENCY
(In thousands)
|
|||||||||||||||||||||||||||||||||||
|
CNYG
Class A
Common
Stock
|
CNYG
Class B
Common
Stock
|
Paid-in
Capital
|
Accumulated
Deficit
|
Treasury
Stock
|
Accumulated
Other
Comprehensive
Income (Loss)
|
Total
Stockholders'
Equity (Deficiency)
|
Non-controlling
Interest
|
Total
Equity (Deficiency)
|
|||||||||||||||||||||||||||
|
Balance at January 1, 2015
|
$
|
3,003
|
|
$
|
541
|
|
$
|
823,103
|
|
$
|
(4,234,860
|
)
|
$
|
(1,591,021
|
)
|
$
|
(42,235
|
)
|
$
|
(5,041,469
|
)
|
$
|
779
|
|
$
|
(5,040,690
|
)
|
||||||||
|
Net income attributable to Cablevision Systems Corporation stockholders
|
—
|
|
—
|
|
—
|
|
175,449
|
|
—
|
|
—
|
|
175,449
|
|
—
|
|
175,449
|
|
|||||||||||||||||
|
Net loss attributable to noncontrolling interests
|
—
|
|
—
|
|
—
|
|
—
|
|
—
|
|
—
|
|
—
|
|
(146
|
)
|
(146
|
)
|
|||||||||||||||||
|
Pension and postretirement plan liability adjustments, net of income taxes
|
—
|
|
—
|
|
—
|
|
—
|
|
—
|
|
4,563
|
|
4,563
|
|
—
|
|
4,563
|
|
|||||||||||||||||
|
Proceeds from exercise of options and issuance of restricted shares
|
39
|
|
—
|
|
18,648
|
|
—
|
|
—
|
|
—
|
|
18,687
|
|
—
|
|
18,687
|
|
|||||||||||||||||
|
Recognition of equity-based stock compensation arrangements
|
—
|
|
—
|
|
60,817
|
|
—
|
|
—
|
|
—
|
|
60,817
|
|
—
|
|
60,817
|
|
|||||||||||||||||
|
Treasury stock acquired from forfeiture and acquisition of restricted shares
|
—
|
|
—
|
|
5
|
|
—
|
|
(19,146
|
)
|
—
|
|
(19,141
|
)
|
—
|
|
(19,141
|
)
|
|||||||||||||||||
|
Excess tax benefit on share-based awards
|
—
|
|
—
|
|
5,694
|
|
—
|
|
—
|
|
—
|
|
5,694
|
|
—
|
|
5,694
|
|
|||||||||||||||||
|
Dividends on CNYG Class A and CNYG Class B common stock
|
—
|
|
—
|
|
(124,752
|
)
|
—
|
|
—
|
|
—
|
|
(124,752
|
)
|
—
|
|
(124,752
|
)
|
|||||||||||||||||
|
Adjustments to noncontrolling interests
|
—
|
|
—
|
|
8,836
|
|
—
|
|
—
|
|
—
|
|
8,836
|
|
(901
|
)
|
7,935
|
|
|||||||||||||||||
|
Balance at December 31, 2015
|
$
|
3,042
|
|
$
|
541
|
|
$
|
792,351
|
|
$
|
(4,059,411
|
)
|
$
|
(1,610,167
|
)
|
$
|
(37,672
|
)
|
$
|
(4,911,316
|
)
|
$
|
(268
|
)
|
$
|
(4,911,584
|
)
|
||||||||
See accompanying notes to consolidated financial statements.
F-66
|
CABLEVISION SYSTEMS CORPORATION AND SUBSIDIARIES
CONSOLIDATED STATEMENTS OF STOCKHOLDERS' DEFICIENCY (continued)
(In thousands)
|
|||||||||||||||||||||||||||||||||||
|
CNYG
Class A
Common
Stock
|
CNYG
Class B
Common
Stock
|
Paid-in
Capital
|
Accumulated
Deficit
|
Treasury
Stock
|
Accumulated
Other
Comprehensive
Income (Loss)
|
Total
Stockholders'
Equity (Deficiency)
|
Non-controlling
Interest
|
Total
Equity (Deficiency)
|
|||||||||||||||||||||||||||
|
Balance at January 1, 2016
|
$
|
3,042
|
|
$
|
541
|
|
$
|
792,351
|
|
$
|
(4,059,411
|
)
|
$
|
(1,610,167
|
)
|
$
|
(37,672
|
)
|
$
|
(4,911,316
|
)
|
$
|
(268
|
)
|
$
|
(4,911,584
|
)
|
||||||||
|
Net income attributable to Cablevision Systems Corporation stockholders
|
—
|
|
—
|
|
—
|
|
163,748
|
|
—
|
|
—
|
|
163,748
|
|
—
|
|
163,748
|
|
|||||||||||||||||
|
Net loss attributable to noncontrolling interests
|
—
|
|
—
|
|
—
|
|
—
|
|
—
|
|
—
|
|
—
|
|
(236
|
)
|
(236
|
)
|
|||||||||||||||||
|
Pension and postretirement plan liability adjustments, net of income taxes
|
—
|
|
—
|
|
—
|
|
—
|
|
—
|
|
1,557
|
|
1,557
|
|
—
|
|
1,557
|
|
|||||||||||||||||
|
Proceeds from exercise of options and issuance of restricted shares
|
15
|
|
—
|
|
14,544
|
|
—
|
|
—
|
|
—
|
|
14,559
|
|
—
|
|
14,559
|
|
|||||||||||||||||
|
Recognition of equity-based stock compensation arrangements
|
—
|
|
—
|
|
24,997
|
|
—
|
|
—
|
|
—
|
|
24,997
|
|
—
|
|
24,997
|
|
|||||||||||||||||
|
Treasury stock acquired from forfeiture and acquisition of restricted shares
|
—
|
|
—
|
|
1
|
|
—
|
|
(41,470
|
)
|
—
|
|
(41,469
|
)
|
—
|
|
(41,469
|
)
|
|||||||||||||||||
|
Tax withholding associated with shares issued for equity-based compensation
|
(4
|
)
|
—
|
|
(6,030
|
)
|
—
|
|
—
|
|
—
|
|
(6,034
|
)
|
—
|
|
(6,034
|
)
|
|||||||||||||||||
|
Excess tax benefit on share-based awards
|
—
|
|
—
|
|
82
|
|
—
|
|
—
|
|
—
|
|
82
|
|
—
|
|
82
|
|
|||||||||||||||||
|
Contributions from noncontrolling interests
|
—
|
|
—
|
|
—
|
|
—
|
|
—
|
|
—
|
|
—
|
|
240
|
|
240
|
|
|||||||||||||||||
|
Balance at June 20, 2016
|
$
|
3,053
|
|
$
|
541
|
|
$
|
825,945
|
|
$
|
(3,895,663
|
)
|
$
|
(1,651,637
|
)
|
$
|
(36,115
|
)
|
$
|
(4,753,876
|
)
|
$
|
(264
|
)
|
$
|
(4,754,140
|
)
|
||||||||
See accompanying notes to consolidated financial statements.
F-67
|
CABLEVISION SYSTEMS CORPORATION AND SUBSIDIARIES
CONSOLIDATED STATEMENTS OF CASH FLOWS
(In thousands)
|
|||||||
|
|
January 1, 2016 to June 20, 2016
|
Year ended December 31, 2015
|
|||||
|
Cash flows from operating activities:
|
|||||||
|
Net income
|
$
|
163,512
|
|
$
|
175,248
|
|
|
|
Adjustments to reconcile net income to net cash provided by (used in) operating activities:
|
|
|
|||||
|
Loss (income) from discontinued operations, net of income taxes
|
—
|
|
12,541
|
|
|||
|
Depreciation and amortization (including impairments)
|
414,550
|
|
865,252
|
|
|||
|
Loss (gain) on investments, net
|
(129,990
|
)
|
30,208
|
|
|||
|
Loss (gain) on equity derivative contracts, net
|
36,283
|
|
(104,927
|
)
|
|||
|
Loss on extinguishment of debt and write-off of deferred financing costs
|
—
|
|
1,735
|
|
|||
|
Amortization of deferred financing costs and discounts on indebtedness
|
11,673
|
|
23,764
|
|
|||
|
Share-based compensation expense
|
24,778
|
|
60,321
|
|
|||
|
Settlement loss and amortization of actuarial losses related to pension and postretirement plans
|
2,584
|
|
5,046
|
|
|||
|
Deferred income taxes
|
116,150
|
|
133,396
|
|
|||
|
Provision for doubtful accounts
|
13,240
|
|
35,802
|
|
|||
|
Excess tax benefits related to share-based awards
|
(82
|
)
|
(5,694
|
)
|
|||
|
Change in assets and liabilities, net of effects of acquisitions and dispositions:
|
|
|
|||||
|
Accounts receivable, trade
|
(18,162
|
)
|
(24,760
|
)
|
|||
|
Prepaid expenses and other assets
|
(844
|
)
|
38,860
|
|
|||
|
Amounts due from and due to affiliates, net
|
(5,082
|
)
|
1,043
|
|
|||
|
Accounts payable
|
36,147
|
|
6,896
|
|
|||
|
Accrued liabilities
|
(160,937
|
)
|
1,200
|
|
|||
|
Deferred revenue
|
(9,726
|
)
|
2,156
|
|
|||
|
Net cash provided by operating activities
|
494,094
|
|
1,258,087
|
|
|||
|
Cash flows from investing activities:
|
|
|
|||||
|
Capital expenditures
|
(330,131
|
)
|
(816,396
|
)
|
|||
|
Proceeds related to sale of equipment, including costs of disposal
|
1,106
|
|
4,407
|
|
|||
|
Decrease (increase) in other investments
|
610
|
|
(7,779
|
)
|
|||
|
Additions to other intangible assets
|
(1,709
|
)
|
(8,035
|
)
|
|||
|
Net cash used in investing activities
|
(330,124
|
)
|
(827,803
|
)
|
|||
F-68
|
CABLEVISION SYSTEMS CORPORATION AND SUBSIDIARIES
CONSOLIDATED STATEMENTS OF CASH FLOWS (continued)
(In thousands)
|
|||||||
|
|
January 1, 2016 to June 20, 2016
|
Year ended December 31, 2015
|
|||||
|
Cash flows from financing activities:
|
|||||||
|
Repayment of credit facility debt
|
$
|
(14,953
|
)
|
$
|
(260,321
|
)
|
|
|
Proceeds from issuance of senior notes
|
—
|
|
—
|
|
|||
|
Proceeds from collateralized indebtedness
|
337,149
|
|
774,703
|
|
|||
|
Repayment of collateralized indebtedness and related derivative contracts
|
(281,594
|
)
|
(639,237
|
)
|
|||
|
Redemption and repurchase of senior notes, including premiums and fees
|
—
|
|
—
|
|
|||
|
Repayment of notes payable
|
(1,291
|
)
|
(2,458
|
)
|
|||
|
Proceeds from stock option exercises
|
14,411
|
|
18,727
|
|
|||
|
Tax withholding associated with shares issued for equity-based awards
|
(6,034
|
)
|
—
|
|
|||
|
Dividend distributions to common stockholders
|
(4,066
|
)
|
(125,170
|
)
|
|||
|
Principal payments on capital lease obligations
|
(11,552
|
)
|
(20,250
|
)
|
|||
|
Deemed repurchases of restricted stock
|
(41,469
|
)
|
(19,141
|
)
|
|||
|
Additions to deferred financing costs
|
—
|
|
(250
|
)
|
|||
|
Payment for purchase of noncontrolling interest
|
—
|
|
(8,300
|
)
|
|||
|
Contributions from (distributions to) noncontrolling interests, net
|
240
|
|
(901
|
)
|
|||
|
Excess tax benefit related to share-based awards
|
82
|
|
5,694
|
|
|||
|
Net cash used in financing activities
|
(9,077
|
)
|
(276,904
|
)
|
|||
|
Net increase in cash and cash equivalents from continuing operations
|
154,893
|
|
153,380
|
|
|||
|
Cash flows of discontinued operations:
|
|
|
|||||
|
Net cash used in operating activities
|
(21,000
|
)
|
(484
|
)
|
|||
|
Net cash used in investing activities
|
—
|
|
(30
|
)
|
|||
|
Net decrease in cash and cash equivalents from discontinued operations
|
(21,000
|
)
|
(514
|
)
|
|||
|
Cash and cash equivalents at beginning of period
|
1,003,279
|
|
850,413
|
|
|||
|
Cash and cash equivalents at end of period
|
$
|
1,137,172
|
|
$
|
1,003,279
|
|
|
See accompanying notes to consolidated financial statements.
F-69
CABLEVISION SYSTEMS CORPORATION AND SUBSIDIARIES
NOTES TO CONSOLIDATED FINANCIAL STATEMENTS
(Dollars in thousands, except share and per share amounts)
NOTE 1. DESCRIPTION OF BUSINESS, RELATED MATTERS AND BASIS OF PRESENTATION
The Company and Related Matters
Cablevision Systems Corporation ("Cablevision"), through its wholly-owned subsidiary CSC Holdings, LLC ("CSC Holdings,") and collectively with Cablevision, the "Company"), owns and operates cable systems and owns companies that provide regional news, local programming and advertising sales services for the cable television industry and Ethernet-based data, Internet, voice and video transport and managed services to the business market. The Company operates and reports financial information in
one
segment. Prior to the sale of a
75%
interest in Newsday LLC on July 7, 2016, the Company consolidating the operating results of Newsday. Effective July 7, 2016, the operating results of Newsday are no longer consolidated with those of the Company and the Company's
25%
interest in the operating results of Newsday is recorded on the equity basis (see Note 16).
Altice Merger
On June 21, 2016 (the "Merger Date"), pursuant to the Agreement and Plan of Merger (the "Merger Agreement"), dated as of September 16, 2015, by and among Cablevision, Altice N.V. ("Altice"), Neptune Merger Sub Corp., a wholly-owned subsidiary of Altice ("Merger Sub"), Merger Sub merged with and into Cablevision, with Cablevision surviving the merger (the "Merger").
In connection with the Merger, each outstanding share of the Cablevision NY Group Class A common stock, par value
$0.01
per share ("CNYG Class A Shares"), and Cablevision NY Group Class B common stock, par value
$0.01
per share ("CNYG Class B Shares", and together with the CNYG Class A Shares, the "Shares") other than (i) Shares owned by Cablevision, Altice or any of their respective wholly-owned subsidiaries, in each case not held on behalf of third parties in a fiduciary capacity, received
$34.90
in cash without interest, less applicable tax withholdings (the "Merger Consideration").
Pursuant to an agreement, dated December 21, 2015, by and among CVC 2B.V., CIE Management IX Limited, for and on behalf of the limited partnerships BC European Capital IX-1through 11 and Canada Pension Plan Investment Board, certain affiliates of BCP and CPPIB (the "Co-Investors") funded approximately
$1,000,000
toward the payment of the aggregate Merger Consideration, and indirectly acquired approximately
30%
of the Shares of Cablevision.
Also in connection with the Merger, outstanding equity-based awards granted under Cablevision’s equity plans were cancelled and converted into cash based upon the
$34.90
per Share merger price in accordance with the original terms of the awards. The total consideration for the outstanding CNYG Class A Shares, the outstanding CNYG Class B Shares, and the equity-based awards amounted to
$9,958,323
.
In connection with the Merger, in October 2015, Neptune Finco Corp. ("Finco"), an indirect wholly-owned subsidiary of Altice formed to complete the financing described herein and the merger with CSC Holdings, borrowed an aggregate principal amount of
$3,800,000
under a term loan facility (the "Term Credit Facility") and entered into revolving loan commitments in an aggregate principal amount of
$2,000,000
(the "Revolving Credit Facility" and, together with the Term Credit Facility, the "Credit Facilities").
Finco also issued
$1,800,000
aggregate principal amount of
10.125%
senior notes due 2023 (the "2023 Notes"),
$2,000,000
aggregate principal amount of
10.875%
senior notes due 2025 (the "2025 Notes"), and
$1,000,000
aggregate principal amount of
6.625%
senior guaranteed notes due 2025 (the "2025 Guaranteed Notes") (collectively the "Merger Notes").
On June 21, 2016, immediately following the Merger, Finco merged with and into CSC Holdings, with CSC Holdings surviving the merger (the "CSC Holdings Merger"), and the Merger Notes and the Credit Facilities became obligations of CSC Holdings.
F-70
CABLEVISION SYSTEMS CORPORATION AND SUBSIDIARIES
NOTES TO CONSOLIDATED FINANCIAL STATEMENTS (continued)
(Dollars in thousands, except share and per share amounts)
The accompanying financial statements represent the operating results and cash flows of the Company for the period January 1, 2016 to June 20, 2016 (Predecessor) and for the year ended December 31, 2015. The operating results of the Company for the period June 21, 2016 to December 31, 2016 (Successor) are incorporated in the consolidated financial statements of Altice USA, Inc.
Basis of Presentation
Principles of Consolidation
The accompanying consolidated financial statements of Cablevision include the accounts of Cablevision and its majority-owned subsidiaries. Cablevision has no business operations independent of CSC Holdings, whose operating results and financial position are consolidated into Cablevision. All significant intercompany transactions and balances between Cablevision and CSC Holdings and their respective consolidated subsidiaries are eliminated in consolidation.
Use of Estimates in Preparation of Financial Statements
The preparation of financial statements in conformity with U.S. generally accepted accounting principles ("GAAP") requires management to make estimates and assumptions that affect the reported amounts of assets and liabilities and disclosure of contingent liabilities at the date of the financial statements and the reported amounts of revenues and expenses during the reporting period. Actual results could differ from those estimates. See Note 12 for a discussion of fair value estimates.
Reclassifications
Certain reclassifications have been made in the consolidated financial statements in the 2015 financial statements to conform to the 2016 presentation.
NOTE 2. SUMMARY OF SIGNIFICANT ACCOUNTING POLICIES
Summary of Significant Accounting Policies
Revenue Recognition
The Company recognizes video, high-speed data, and voice services revenues as the services are provided to customers. Revenue received from customers who purchase bundled services at a discounted rate is allocated to each product in a pro-rata manner based on the individual product’s selling price (generally, the price at which the product is regularly sold on a standalone basis). Installation revenue for the Company's video, consumer high-speed data and VoIP services is recognized as installations are completed, as direct selling costs have exceeded this revenue in all periods reported. Advertising revenues are recognized when commercials are aired.
Revenues derived from other sources are recognized when services are provided or events occur.
Multiple-Element Transactions
In the normal course of business, the Company may enter into multiple-element transactions where it is simultaneously both a customer and a vendor with the same counterparty or in which it purchases multiple products and/or services, or settles outstanding items contemporaneous with the purchase of a product or service from a single counterparty. The Company's policy for accounting for each transaction negotiated contemporaneously is to record each deliverable of the transaction based on its best estimate of selling price in a manner consistent with that used to determine the price to sell each deliverable on a standalone basis. In determining the fair value of the respective deliverable, the Company will utilize quoted market prices (as available), historical transactions or comparable transactions.
Gross Versus Net Revenue Recognition
In the normal course of business, the Company is assessed non-income related taxes by governmental authorities, including franchising authorities (generally under multi-year agreements), and collects such taxes from its customers. The Company's policy is that, in instances where the tax is being assessed directly on the Company, amounts paid to the governmental authorities and amounts received from the customers are recorded on a gross basis. That is, amounts paid to the governmental authorities are recorded as programming and other direct costs and amounts received from the customer are recorded as revenue. For the period January 1, 2016 through June 20, 2016 and for the year ended December
F-71
CABLEVISION SYSTEMS CORPORATION AND SUBSIDIARIES
NOTES TO CONSOLIDATED FINANCIAL STATEMENTS (continued)
(Dollars in thousands, except share and per share amounts)
31, 2015, the amount of franchise fees and certain other taxes and fees included as a component of revenue aggregated
$95,432
and
$199,701
, respectively.
Technical and Operating Expenses
Costs of revenue related to sales of services are classified as "programming and other direct costs" in the accompanying consolidated statements of operations.
Programming Costs
Programming expenses related to the Company's video service represent fees paid to programming distributors to license the programming distributed to subscribers. This programming is acquired generally under multi-year distribution agreements, with rates usually based on the number of subscribers that receive the programming. There have been periods when an existing distribution agreement has expired and the parties have not finalized negotiations of either a renewal of that agreement or a new agreement for certain periods of time. In substantially all these instances, the Company continues to carry and pay for these services until execution of definitive replacement agreements or renewals. The amount of programming expense recorded during the interim period is based on the Company's estimates of the ultimate contractual agreement expected to be reached, which is based on several factors, including previous contractual rates, customary rate increases and the current status of negotiations. Such estimates are adjusted as negotiations progress until new programming terms are finalized.
In addition, the Company has received, or may receive, incentives from programming distributors for carriage of the distributors' programming. The Company generally recognizes these incentives as a reduction of programming costs in "programming and other direct costs", generally over the term of the distribution agreement.
Advertising Expenses
Advertising costs are charged to expense when incurred and are reflected in "other operating expenses" in the accompanying consolidated statements of operations. Advertising costs amounted to
$62,760
and
$160,671
, for the period January 1, 2016 through June 20, 2016 and for the year ended December 31, 2015, respectively.
Share-Based Compensation
Share-based compensation expense is based on the fair value of the portion of share-based payment awards that are ultimately expected to vest. For share-based compensation awards that can be settled in cash, the Company recognizes compensation expense based on the estimated fair value of the award at each reporting period.
For options and performance based option awards, Cablevision recognized compensation expense based on the estimated grant date fair value using the Black-Scholes valuation model. For options not subject to performance based vesting conditions, Cablevision recognized the compensation expense using a straight-line amortization method. For options subject to performance based vesting conditions, Cablevision recognized compensation expense based on the probable outcome of the performance criteria over the requisite service period for each tranche of awards.
For restricted shares, Cablevision recognized compensation expense using a straight-line amortization method based on the grant date price of CNYG Class A common stock over the vesting period. For restricted stock units granted to non-employee director which vested
100%
on the date of grant, compensation expense was recognized on the date of grant based on the grant date price of CNYG Class A common stock.
For performance based restricted stock units ("PSUs") which cliff vested in
three
years, Cablevision recognized compensation expense on a straight-line basis over the vesting period based on the estimated number of shares of CNYG Class A common stock expected to be issued.
Income Taxes
The Company's provision for income taxes is based on current period income, changes in deferred tax assets and liabilities and changes in estimates with regard to uncertain tax positions. Deferred tax assets are subject to an ongoing assessment of realizability. The Company provides deferred taxes for the outside basis difference of its investment in partnerships. In the second quarter of 2016, the Company changed its accounting policy on a prospective basis to present interest expense relating to uncertain tax position as additional interest expense.
F-72
CABLEVISION SYSTEMS CORPORATION AND SUBSIDIARIES
NOTES TO CONSOLIDATED FINANCIAL STATEMENTS (continued)
(Dollars in thousands, except share and per share amounts)
Cash and Cash Equivalents
The Company's cash investments are placed with money market funds and financial institutions that are investment grade as rated by Standard & Poor's and Moody's Investors Service. The Company selects money market funds that predominantly invest in marketable, direct obligations issued or guaranteed by the United States government or its agencies, commercial paper, fully collateralized repurchase agreements, certificates of deposit, and time deposits.
The Company considers the balance of its investment in funds that substantially hold securities that mature within three months or less from the date the fund purchases these securities to be cash equivalents. The carrying amount of cash and cash equivalents either approximates fair value due to the short-term maturity of these instruments or are at fair value.
Accounts Receivable
Accounts receivable are recorded at net realizable value. The Company periodically assesses the adequacy of valuation allowances for uncollectible accounts receivable by evaluating the collectability of outstanding receivables and general factors such as historical collection experience, length of time individual receivables are past due, and the economic and competitive environment.
Investments
Investment securities and investment securities pledged as collateral are classified as trading securities and are stated at fair value with realized and unrealized holding gains and losses included in net income.
Long-Lived Assets and Amortizable Intangible Assets
Property, plant and equipment, including construction materials, are carried at cost, and include all direct costs and certain indirect costs associated with the construction of cable systems, and the costs of new equipment installations. Equipment under capital leases is recorded at the present value of the total minimum lease payments. Depreciation on equipment is calculated on the straight-line basis over the estimated useful lives of the assets or, with respect to equipment under capital leases and leasehold improvements, amortized over the shorter of the lease term or the assets' useful lives and reported in depreciation and amortization (including impairments) in the consolidated statements of operations.
The Company capitalizes certain internal and external costs incurred to acquire or develop internal-use software. Capitalized software costs are amortized over the estimated useful life of the software and reported in depreciation and amortization (including impairments).
Customer relationships, trade names and other intangibles established in connection with acquisitions that are finite-lived are amortized in a manner that reflects the pattern in which the projected net cash inflows to the Company are expected to occur, such as the sum of the years' digits method, or when such pattern does not exist, using the straight-line basis over their respective estimated useful lives.
The Company reviews its long-lived assets (property, plant and equipment, and intangible assets subject to amortization that arose from acquisitions) for impairment whenever events or circumstances indicate that the carrying amount of an asset may not be recoverable. If the sum of the expected cash flows, undiscounted and without interest, is less than the carrying amount of the asset, an impairment loss is recognized as the amount by which the carrying amount of the asset exceeds its fair value.
Goodwill and Indefinite-Lived Intangible Assets
Goodwill and the value of franchises, trademarks, and certain other intangibles acquired in purchase business combinations which have indefinite useful lives are not amortized. Rather, such assets are tested for impairment annually or upon the occurrence of a triggering event.
The Company assesses qualitative factors for its reporting units that carry goodwill. If the qualitative assessment results in a conclusion that it is more likely than not that the fair value of a reporting unit exceeds the carrying value, then no further testing is performed for that reporting unit.
When the qualitative assessment is not used, or if the qualitative assessment is not conclusive and it is necessary to calculate the fair value of a reporting unit, then the impairment analysis for goodwill is performed at the reporting unit level using a two-step approach. The first step of the goodwill impairment test is used to identify potential impairment
F-73
CABLEVISION SYSTEMS CORPORATION AND SUBSIDIARIES
NOTES TO CONSOLIDATED FINANCIAL STATEMENTS (continued)
(Dollars in thousands, except share and per share amounts)
by comparing the fair value of the reporting unit with its carrying amount, including goodwill utilizing an enterprise-value based premise approach. If the carrying amount of the reporting unit exceeds its fair value, the second step of the goodwill impairment test is performed to measure the amount of goodwill impairment loss, if any. The second step of the goodwill impairment test compares the implied fair value of the reporting unit's goodwill with the carrying amount of that goodwill. If the carrying amount of the reporting unit's goodwill exceeds the implied fair value of that goodwill, an impairment loss is recognized in an amount equal to that excess. The implied fair value of goodwill is determined in the same manner as the amount of goodwill which would be recognized in a business combination.
The Company assesses qualitative factors to determine whether it is necessary to perform the one-step quantitative identifiable indefinite-lived intangible assets impairment test. This quantitative test is required only if the Company concludes that it is more likely than not that a unit of accounting’s fair value is less than its carrying amount. When the qualitative assessment is not used, or if the qualitative assessment is not conclusive, the impairment test for other intangible assets not subject to amortization requires a comparison of the fair value of the intangible asset with its carrying value. If the carrying value of the indefinite-lived intangible asset exceeds its fair value, an impairment loss is recognized in an amount equal to that excess.
Deferred Financing Costs
Deferred financing costs are being amortized to interest expense using the effective interest method over the terms of the related debt.
Derivative Financial Instruments
The Company accounts for derivative financial instruments as either assets or liabilities measured at fair value. The Company uses derivative instruments to manage its exposure to market risks from changes in certain equity prices and interest rates and does not hold or issue derivative instruments for speculative or trading purposes. These derivative instruments are not designated as hedges, and changes in the fair values of these derivatives are recognized in the statements of income as gains (losses) on derivative contracts.
Commitments and Contingencies
Liabilities for loss contingencies arising from claims, assessments, litigation, fines and penalties and other sources are recorded when the Company believes it is probable that a liability has been incurred and the amount of the contingency can be reasonably estimated.
Recently Adopted Accounting Pronouncements
In November 2015, the Financial Accounting Standards Board ("FASB") issued Accounting Standards Update ("ASU") No. 2015-17 (Topic 740), Balance Sheet Classification of Deferred Taxes. This ASU amends existing guidance to require the presentation of deferred tax liabilities and assets as noncurrent within a classified statement of financial position. ASU No. 2015-17 was adopted by the Company as of June 30, 2016 and was applied prospectively to all deferred tax liabilities and assets.
In September 2015, the FASB issued ASU No. 2015-16, Simplifying the Accounting for Measurement-Period Adjustments, which requires that an acquirer recognize adjustments to provisional amounts that are identified during the measurement period in the reporting period in which the adjustment amounts are determined. Prior to the issuance of the standard, entities were required to retrospectively apply adjustments made to provisional amounts recognized in a business combination. ASU No. 2015-16 was adopted by the Company on January 1, 2016.
In April 2015, the FASB issued ASU No. 2015-05, Intangibles-Goodwill and Other-Internal-Use Software (Subtopic 350-40): Customer’s Accounting for Fees Paid in a Cloud Computing Arrangement. ASU No. 2015-05 provides guidance to customers about whether a cloud computing arrangement includes a software license. If a cloud computing arrangement includes a software license, then the customer should account for the software license element of the arrangement consistent with the acquisition of other software licenses. If a cloud computing arrangement does not include a software license, the customer should account for the arrangement as a service contract. ASU No. 2015-05 was adopted by the Company on January 1, 2016 and did not have a material impact on the Company's consolidated financial statements.
In April 2015, the FASB issued ASU No. 2015-03, Simplifying the Presentation of Debt Issuance Costs, which requires debt issuance costs to be presented in the balance sheet as a direct deduction from the carrying value of the associated
F-74
CABLEVISION SYSTEMS CORPORATION AND SUBSIDIARIES
NOTES TO CONSOLIDATED FINANCIAL STATEMENTS (continued)
(Dollars in thousands, except share and per share amounts)
debt liability, consistent with the presentation of a debt discount. In August 2015, the FASB issued ASU No. 2015-15, Presentation and Subsequent Measurement of Debt Issuance Costs Associated with Line-of-Credit Arrangements, which clarifies the treatment of debt issuance costs from line-of-credit arrangements after adoption of ASU No. 2015-03. ASU No. 2015-15 clarifies that the Securities and Exchange Commission staff would not object to an entity deferring and presenting debt issuance costs as an asset and subsequently amortizing the deferred debt issuance costs ratably over the term of the line-of-credit arrangement, regardless of whether there are any outstanding borrowings on the line-of-credit arrangement. ASU No. 2015-03 was adopted by the Company on January 1, 2016 representing a change in accounting principle and was applied retrospectively to all periods presented. Debt issuance costs, net for the Company of
$67,119
, as of December 31, 2015 were reclassified from deferred financing costs and presented as a reduction to debt in the consolidated balance sheets.
Debt issuance costs, net for the Company of
$7,588
as of December 31, 2015 relating to its revolving credit facility were not impacted by the adoption of ASU No. 2015-03 and are reflected as long-term assets in the accompanying consolidated balance sheets.
In August 2014, the FASB issued ASU No. 2014-15, Disclosures of Uncertainties about an Entity's Ability to Continue as a Going Concern, which requires management to evaluate whether there are conditions or events that raise substantial doubt about the entity's ability to continue as a going concern, and to provide certain disclosures when it is probable that the entity will be unable to meet its obligations as they become due within one year after the date that the financial statements are issued. ASU No. 2014-15 was adopted by the Company on January 1, 2016.
In June 2014, the FASB issued ASU No. 2014-12, Compensation - Stock Compensation (Topic 718): Accounting for Share-Based Payments When the Terms of an Award Provide That a Performance Target Could Be Achieved After the Requisite Service Period. ASU No. 2014-12 requires that a performance target that affects vesting and that could be achieved after the requisite service period be treated as a performance condition. Entities may apply the amendments in this ASU either: (a) prospectively to all awards granted or modified after the effective date; or (b) retrospectively to all awards with performance targets that are outstanding as of the beginning of the earliest annual period presented in the financial statements and to all new or modified awards thereafter. ASU No. 2014-12 was adopted by the Company on January 1, 2016 on a prospective basis and did not have any impact on the Company’s consolidated financial statements.
Recently Issued But Not Yet Adopted Accounting Pronouncements
In May 2014, the FASB issued ASU No. 2014-09, Revenue from Contracts with Customers, requiring an entity to recognize the amount of revenue to which it expects to be entitled for the transfer of promised goods or services to customers. ASU No. 2014-09 will replace most existing revenue recognition guidance in GAAP when it becomes effective and allows the use of either the retrospective or cumulative effect transition method. In August 2015, the FASB issued ASU No. 2015-14 that approved deferring the effective date by one year so that ASU No. 2014-09 would become effective for the Company on January 1, 2018. The FASB also approved, in July 2015, permitting the early adoption of ASU No. 2014-09, but not before the original effective date for the Company of January 1, 2017.
In December 2016, the FASB issued ASU No. 2016-20, Technical Corrections and Improvements to Topic 606, Revenue from Contracts with Customers, in order to clarify the Codification and to correct any unintended application of the guidance. These items are not expected to have a significant effect on the current accounting standard. The amendments in this update affect the guidance in ASU No. 2014-09, which is not yet effective. ASU No. 2014-09 will be effective, reflecting the one-year deferral, for interim and annual periods beginning after December 15, 2017 (January 1, 2018 for the Company). Early adoption of the standard is permitted but not before the original effective date. Companies can transition to the standard either retrospectively or as a cumulative-effect adjustment as of the date of adoption. The Company is in the process of evaluating the impact that the adoption of ASU No. 2014-09 will have on its consolidated financial statements and selecting the method of transition to the new standard. We currently expect the adoption to impact the timing of the recognition of residential installation revenue and the recognition of commission expenses.
In November 2016, the FASB issued ASU No. 2016-18, Statement of Cash Flows (Topic 230): Restricted Cash, which requires that the statement of cash flows disclose the change during the period in the total of cash, cash equivalents, restricted cash and restricted cash equivalents. Restricted cash should be included with cash and cash equivalents when reconciling the beginning-of-period and end-of period total amounts shown on the statement of cash flows. ASU No. 2016-18 provides specific guidance on the presentation of restricted cash in the statement of cash flows. The new
F-75
CABLEVISION SYSTEMS CORPORATION AND SUBSIDIARIES
NOTES TO CONSOLIDATED FINANCIAL STATEMENTS (continued)
(Dollars in thousands, except share and per share amounts)
guidance becomes effective for the Company on January 1, 2019 with early adoption permitted and will be applied retrospectively.
In August 2016, the FASB issued ASU No. 2016-15, Statement of Cash Flows (Topic 230): Classification of Certain Cash Receipts and Cash Payments which clarifies how entities should classify certain cash receipts and cash payments on the statement of cash flows. ASU No. 2016-15 also clarifies how the predominance principle should be applied when cash receipts and cash payments have aspects of more than one class of cash flows. The new guidance becomes effective for the Company on January 1, 2018 with early adoption permitted and will be applied retrospectively. The Company has not yet completed the evaluation of the effect that ASU No. 2016-15 will have on its consolidated financial statements.
In March 2016, the FASB issued ASU 2016-09, Compensation—Stock Compensation: Improvements to Employee Share-Based Payment Accounting, which provides simplification of income tax accounting for share-based payment awards. The new guidance becomes effective for the Company on January 1, 2017 with early adoption permitted. Amendments related to the timing of when excess tax benefits are recognized, minimum statutory withholding requirements, forfeitures, and intrinsic value will be applied using the modified retrospective transition method. Amendments requiring recognition of excess tax benefits and tax deficiencies in the income statement and the practical expedient for estimating expected term will be applied prospectively. The Company may elect to apply the amendments related to the presentation of excess tax benefits on the statement of cash flows using either a prospective transition method or a retrospective transition method. In connection with the adoption on January 1, 2017, a deferred tax asset of approximately
$309,000
for previously unrealized excess tax benefits will be recognized with the offset recorded to accumulated deficit.
In February 2016, the FASB issued ASU 2016-02, Leases
,
which increases transparency and comparability by recognizing a lessee’s rights and obligations resulting from leases by recording them on the balance sheet as lease assets and lease liabilities. The new guidance becomes effective for the Company on January 1, 2019 with early adoption permitted and will be applied using the modified retrospective method. The Company has not yet completed the evaluation of the effect that ASU No. 2016-02 will have on its consolidated financial statements.
Common Stock of Cablevision
Prior to the Merger, each holder of CNYG Class A common stock had
one
vote per share while holders of CNYG Class B common stock had
ten
votes per share. CNYG Class B shares could be converted to CNYG Class A common stock at anytime with a conversion ratio of
one
CNYG Class A common share for
one
CNYG Class B common share. CNYG Class A stockholders were entitled to elect
25%
of Cablevision's Board of Directors. CNYG Class B stockholders had the right to elect the remaining members of Cablevision's Board of Directors. In addition, CNYG Class B stockholders were parties to an agreement which had the effect of causing the voting power of these CNYG Class B stockholders to be cast as a block.
The following table provides details of Cablevision's shares of common stock through the Merger Date:
|
|
Shares of Common Stock Outstanding
|
||||
|
|
Class A
Common Stock
|
Class B
Common Stock
|
|||
|
Balance at December 31, 2014
|
220,219,935
|
|
54,137,673
|
|
|
|
Employee and non-employee director stock transactions (a)
|
2,352,275
|
|
—
|
|
|
|
Balance at December 31, 2015
|
222,572,210
|
|
54,137,673
|
|
|
|
Employee and non-employee director stock transactions (a)
|
(185,276
|
)
|
—
|
|
|
|
Balance at June 20, 2016
|
222,386,934
|
|
54,137,673
|
|
|
|
(a)
|
Primarily included issuances of common stock in connection with employee and non-employee director exercises of stock options and restricted shares granted to employees, offset by shares acquired by the Company in connection with the fulfillment of employees' statutory tax withholding obligation for applicable income and other employment taxes and forfeited employee restricted shares.
|
F-76
CABLEVISION SYSTEMS CORPORATION AND SUBSIDIARIES
NOTES TO CONSOLIDATED FINANCIAL STATEMENTS (continued)
(Dollars in thousands, except share and per share amounts)
Dividends
Pursuant to the terms of the Merger Agreement, Cablevision was not permitted to declare and pay dividends or repurchase stock, in each case, without the prior written consent of Altice. In accordance with these terms, Cablevision did not declare dividends during the period January 1, 2016 through June 20, 2016.
During the period January 1, 2016 through June 20, 2016, Cablevision paid
$4,066
related to restricted shares that vested in respect of dividends declared and accrued on the CNYG common stock in prior periods.
Prior to the Merger, the Board of Directors of Cablevision had declared and paid the following cash dividends to stockholders of record on both its CNYG Class A common stock and CNYG Class B common stock:
|
Declaration Date
|
Dividend per Share
|
Record Date
|
Payment Date
|
|||
|
August 6, 2015
|
$0.15
|
August 21, 2015
|
September 10, 2015
|
|||
|
May 1, 2015
|
$0.15
|
May 22, 2015
|
June 12, 2015
|
|||
|
February 24, 2015
|
$0.15
|
March 16, 2015
|
April 3, 2015
|
|||
Cablevision paid dividends aggregating
$125,170
during the year ended December 31, 2015, including accrued dividends on vested restricted shares of
$3,935
.
Cablevision's and CSC Holdings' indentures and CSC Holdings' credit agreement restrict the amount of dividends and distributions in respect of any equity interest that can be made.
Income (Loss) Per Share
Basic income per common share attributable to Cablevision stockholders was computed by dividing net income attributable to Cablevision stockholders by the weighted average number of common shares outstanding during the period. Diluted income per common share attributable to Cablevision stockholders reflected the dilutive effects of stock options, restricted stock and restricted stock units. For such awards that were performance based, the diluted effect was reflected upon the achievement of the performance criteria.
The following table presents a reconciliation of weighted average shares used in the calculations of the basic and diluted net income per share attributable to Cablevision stockholders:
|
January 1, 2016 to June 20, 2016
|
Years Ended December 31,
|
||||
|
|
2015
|
||||
|
Basic weighted average shares outstanding
|
272,035
|
|
269,388
|
|
|
|
Effect of dilution:
|
|
|
|||
|
Stock options
|
4,444
|
|
3,532
|
|
|
|
Restricted stock
|
3,720
|
|
3,419
|
|
|
|
Diluted weighted average shares outstanding
|
280,199
|
|
276,339
|
|
|
Anti-dilutive shares (options whose exercise price exceeds the average market price of Cablevision's common stock during the period and certain restricted shares) totaling approximately
1,160,000
shares were excluded from diluted weighted average shares outstanding for the years ended 2015. There were
no
anti-dilutive shares excluded from diluted weighted average shares outstanding for the period January 1, 2016 to June 20, 2016. In addition, approximately
1,772,000
performance based restricted stock units for the year ended December 31, 2015 issued pursuant to the Company's former employee stock plan were also excluded from the diluted weighted average shares outstanding as the performance criteria on these awards had not yet been satisfied for the respective period.
Net income (loss) per share for Cablevision subsequent to the merger is not presented since Cablevision's common stock is no longer publicly traded.
F-77
CABLEVISION SYSTEMS CORPORATION AND SUBSIDIARIES
NOTES TO CONSOLIDATED FINANCIAL STATEMENTS (continued)
(Dollars in thousands, except share and per share amounts)
Concentrations of Credit Risk
Financial instruments that may potentially subject the Company to a concentration of credit risk consist primarily of cash and cash equivalents and trade account receivables. The Company monitors the financial institutions and money market funds where it invests its cash and cash equivalents with diversification among counterparties to mitigate exposure to any single financial institution. The Company's emphasis is primarily on safety of principal and liquidity and secondarily on maximizing the yield on its investments. Management believes that no significant concentration of credit risk exists with respect to its cash and cash equivalents balances because of its assessment of the creditworthiness and financial viability of the respective financial institutions.
The Company did not have a single customer that represented 10% or more of its consolidated revenues for the period January 1, 2016 through June 20, 2016 and the year ended December 31, 2015, or 10% or more of its consolidated net trade receivables at December 31, 2015.
NOTE 3. ALLOWANCE FOR DOUBTFUL ACCOUNTS
Activity related to the allowance for doubtful accounts:
|
|
Balance at Beginning of Period
|
Provision for Bad Debt
|
Deductions/ Write-Offs and Other Charges
|
Balance at End of Period
|
|||||||||||
|
Period from January 1, 2016 through June 20, 2016
|
|||||||||||||||
|
Allowance for doubtful accounts
|
$
|
6,039
|
|
$
|
13,240
|
|
$
|
(12,378
|
)
|
$
|
6,901
|
|
|||
|
Year Ended December 31, 2015
|
|
|
|
|
|
|
|
|
|||||||
|
Allowance for doubtful accounts
|
$
|
12,112
|
|
$
|
35,802
|
|
$
|
(41,875
|
)
|
$
|
6,039
|
|
|||
NOTE 4. SUPPLEMENTAL CASH FLOW INFORMATION
The Company's non-cash investing and financing activities and other supplemental data were as follows:
|
|
January 1, 2016 to June 20, 2016
|
Years Ended December 31,
2015
|
|||||
|
|
|||||||
|
Non-Cash Investing and Financing Activities:
|
|||||||
|
Continuing Operations:
|
|||||||
|
Property and equipment accrued but unpaid
|
$
|
68,356
|
|
$
|
63,843
|
|
|
|
Notes payable to vendor
|
—
|
|
8,318
|
|
|||
|
Capital lease obligations
|
—
|
|
19,987
|
|
|||
|
Intangible asset obligations
|
290
|
|
1,121
|
|
|||
|
Non-Cash Investing and Financing Activities:
|
|
|
|||||
|
Dividends payable on unvested restricted share awards
|
—
|
|
3,517
|
|
|||
|
Supplemental Data:
|
|||||||
|
Continuing Operations:
|
|||||||
|
Cash interest paid
|
258,940
|
|
560,361
|
|
|||
|
Income taxes paid, net
|
7,082
|
|
3,849
|
|
|||
F-78
CABLEVISION SYSTEMS CORPORATION AND SUBSIDIARIES
NOTES TO CONSOLIDATED FINANCIAL STATEMENTS (continued)
(Dollars in thousands, except share and per share amounts)
NOTE 5. RESTRUCTURING AND OTHER EXPENSE
Restructuring
The Company recorded net restructuring charges (credits) of
$2,299
and
$(1,649)
, for the period January 1, 2016 through June 20, 2016 and for the year ended December 31, 2015, respectively. The 2016 and 2015 restructuring expense (credit) primarily related to changes to the Company's previous estimates recorded in connection with the Company's prior restructuring plans.
Subsequent to the Altice Merger, the Company commenced its restructuring initiatives (the "2016 Restructuring Plan") that are intended to simplify the Company's organizational structure. The 2016 Restructuring Plan resulted in charges of
$188,847
associated with the elimination of positions primarily in corporate, administrative and infrastructure functions across the Company and estimated charges of
$10,410
associated with facility realignment and other costs.
Other Expense
In connection with the Altice Merger, the Company incurred transaction costs of
$19,924
and
$17,862
for the period January 1, 2016 through June 20, 2016 and for the year ended December 31, 2015, respectively, which are reflected in restructuring and other expense in the consolidated statements of operations. Subsequent to the Altice Merger, the Company incurred transaction costs of
$12,920
.
NOTE 6. DISCONTINUED OPERATIONS
Loss from discontinued operations for the year ended December 31, 2015 amounted to
$21,272
(
$12,541
, net of income taxes) and primarily reflects an expense of
$21,000
(
$12,380
, net of income taxes) related to the settlement of a legal matter relating to Rainbow Media Holdings LLC, a business whose operations were previously discontinued (see Note 17).
NOTE 7. PROPERTY, PLANT AND EQUIPMENT
Costs incurred in the construction of the Company's cable systems, including line extensions to, and upgrade of, the Company's hybrid fiber/coaxial infrastructure, initial placement of the feeder cable to connect a customer that had not been previously connected, and headend facilities are capitalized. These costs consist of materials, subcontractor labor, direct consulting fees, and internal labor and related costs associated with the construction activities. The internal costs that are capitalized consist of salaries and benefits of the Company's employees and the portion of facility costs, including rent, taxes, insurance and utilities, that supports the construction activities. These costs are depreciated over the estimated life of the plant (
10
to
25
years) and headend facilities (
4
to
25
years). Costs of operating the plant and the technical facilities, including repairs and maintenance, are expensed as incurred.
Costs associated with initial customer installations and the additions of network equipment necessary to enable advanced services are also capitalized. Costs capitalized as part of new customer installations include materials, subcontractor costs and internal direct labor costs, including service technicians and internal overhead costs incurred to connect the customer to the plant from the time of installation scheduling through the time service is activated and functioning. The internal direct labor cost capitalized is based on a combination of the actual and estimated time to complete the installation. Overhead capitalized consists mainly of employee benefits, such as payroll taxes and health insurance, directly associated with that portion of the capitalized labor and vehicle operating costs related to capitalizable activities. New connections are amortized over the estimated useful life of
5
years for customer wiring and feeder cable to the home. The portion of departmental costs related to disconnecting services, reconnection of a customer, and repair and maintenance are expensed as incurred.
The estimated useful lives assigned to our property, plant and equipment are reviewed on an annual basis or more frequently if circumstances warrant and such lives are revised to the extent necessary due to changing facts and circumstances. Any changes in estimated useful lives are reflected prospectively.
F-79
CABLEVISION SYSTEMS CORPORATION AND SUBSIDIARIES
NOTES TO CONSOLIDATED FINANCIAL STATEMENTS (continued)
(Dollars in thousands, except share and per share amounts)
Property, plant and equipment (including equipment under capital leases) consist of the following assets, which are depreciated or amortized on a straight-line basis over the estimated useful lives shown below:
|
|
December 31, 2015
|
Estimated
Useful Lives
|
|||
|
Customer equipment
|
$
|
1,952,336
|
|
3 to 5 years
|
|
|
Headends and related equipment
|
2,388,289
|
|
4 to 25 years
|
||
|
Infrastructure
|
5,639,226
|
|
3 to 25 years
|
||
|
Equipment and software
|
1,577,616
|
|
3 to 10 years
|
||
|
Construction in progress (including materials and supplies)
|
87,412
|
|
|
||
|
Furniture and fixtures
|
96,561
|
|
5 to 12 years
|
||
|
Transportation equipment
|
210,013
|
|
5 to 18 years
|
||
|
Buildings and building improvements
|
322,267
|
|
10 to 40 years
|
||
|
Leasehold improvements
|
354,136
|
|
Term of lease
|
||
|
Land
|
14,507
|
|
|
||
|
|
12,642,363
|
|
|
||
|
Less accumulated depreciation and amortization
|
(9,625,348
|
)
|
|
||
|
|
$
|
3,017,015
|
|
|
|
During the period January 1, 2016 through June 20, 2016 and the year ended December 31, 2015, the Company capitalized certain costs aggregating
$58,409
and
$144,349
, respectively, related to the acquisition and development of internal use software, which are included in the table above.
Depreciation expense on property, plant and equipment (including capital leases) for the period January 1, 2016 through June 20, 2016 and the year ended December 31, 2015 amounted to
$404,234
and
$857,440
, respectively.
At December 31, 2015, the gross amount of equipment and related accumulated amortization recorded under capital leases was as follows:
|
|
December 31, 2015
|
||
|
Equipment
|
$
|
90,099
|
|
|
Less accumulated amortization
|
(28,119
|
)
|
|
|
|
$
|
61,980
|
|
NOTE 8. OPERATING LEASES
The Company leases certain office, production, and transmission facilities under terms of leases expiring at various dates through 2035. The leases generally provide for escalating rentals over the term of the lease plus certain real estate taxes and other costs or credits. Costs associated with such operating leases are recognized on a straight-line basis over the initial lease term. The difference between rent expense and rent paid is recorded as deferred rent. In addition, the Company rents space on utility poles for its operations. The Company's pole rental agreements are for varying terms, and management anticipates renewals as they expire. Rent expense, including pole rentals, for the period January 1, 2016 through June 20, 2016 and the year ended December 31, 2015 amounted to
$41,573
and
$82,704
, respectively.
The minimum future annual payments for all operating leases (with initial or remaining terms in excess of one year) during the next five years and thereafter, including pole rentals from January 1, 2017 through December 31, 2021, are as follows:
F-80
CABLEVISION SYSTEMS CORPORATION AND SUBSIDIARIES
NOTES TO CONSOLIDATED FINANCIAL STATEMENTS (continued)
(Dollars in thousands, except share and per share amounts)
|
2017
|
$
|
57,853
|
|
|
2018
|
52,206
|
|
|
|
2019
|
44,908
|
|
|
|
2020
|
41,221
|
|
|
|
2021
|
38,697
|
|
|
|
Thereafter
|
141,063
|
|
|
NOTE 9. INTANGIBLE ASSETS
The following table summarizes information relating to the Company's acquired intangible assets:
|
|
December 31, 2015
|
|||||||||
|
|
Gross Carrying Amount
|
Accumulated Amortization
|
Net Carrying Amount
|
Estimated Useful Lives
|
||||||
|
|
||||||||||
|
Customer relationships
|
$
|
39,414
|
|
$
|
(27,778
|
)
|
$
|
11,636
|
|
10 to 18 years
|
|
Trade names
|
—
|
|
—
|
|
—
|
|
||||
|
Other amortizable intangibles
|
57,847
|
|
(32,532
|
)
|
25,315
|
|
3 to 28 years
|
|||
|
|
$
|
97,261
|
|
$
|
(60,310
|
)
|
$
|
36,951
|
|
|
Amortization expense for the period January 1, 2016 through June 20, 2016 and the year ended December 31, 2015 amounted to
$10,316
and
$7,812
, respectively.
The following table summarizes information relating to the Company's acquired indefinite-lived intangible assets:
|
December 31, 2015
|
|||
|
Cable television franchises
|
$
|
731,848
|
|
|
Trademarks and other assets
|
7,250
|
|
|
|
Goodwill
|
262,345
|
|
|
|
Total
|
$
|
1,001,443
|
|
The carrying amount of goodwill is presented below:
|
Gross goodwill as of December 31, 2015 (Predecessor)
|
$
|
596,403
|
|
|
Accumulated impairment losses
|
(334,058
|
)
|
|
|
Net goodwill as of June 20, 2016
|
$
|
262,345
|
|
Impairment Charges
Goodwill and indefinite-lived intangible assets are tested annually for impairment or earlier upon the occurrence of certain events or substantive changes in circumstances.
No
goodwill impairments were recorded for the period January 1, 2016 through June 20, 2016 and for the year ended December 31, 2015, respectively.
F-81
CABLEVISION SYSTEMS CORPORATION AND SUBSIDIARIES
NOTES TO CONSOLIDATED FINANCIAL STATEMENTS (continued)
(Dollars in thousands, except share and per share amounts)
NOTE 10. DEBT
Restricted Group Credit Facility
Prior to the Merger, CSC Holdings and certain of its subsidiaries (the "Restricted Subsidiaries") had a credit agreement (the "Previous Credit Facility") that provided for (1) a revolving credit facility of
$1,500,000
, (2) a Term A facility of
$958,510
, and (3) a Term B facility of
$1,200,000
.
Loans under the Previous Credit Facility bore interest as follows:
|
•
|
Revolving credit loans and Term A loans, either (i) the Eurodollar rate (as defined) plus a spread ranging from
1.50%
to
2.25%
based on the cash flow ratio (as defined), or (ii) the base rate (as defined) plus a spread ranging from
0.50%
to
1.25%
based on the cash flow ratio;
|
|
•
|
Term B loans, either (i) the Eurodollar rate plus a spread of
2.50%
or (ii) the base rate plus a spread of
1.50%
.
|
There was a commitment fee of
0.30%
on undrawn amounts under the revolving credit facility in connection with the Previous Credit Facility.
Repayment of Restricted Group Credit Facility Debt
In April 2015, CSC Holdings made a repayment of
$200,000
on its outstanding Term B loan facility with cash on hand. In connection with the repayment, the Company recognized a loss on extinguishment of debt of
$731
and wrote-off unamortized deferred financing costs related to this loan facility of
$1,004
for the year ended December 31, 2015.
On June 21, 2016, in connection with the Merger, the Previous Credit Facility was repaid.
Newsday LLC Credit Facility
Newsday LLC ("Newsday") had a senior secured credit agreement (the "Newsday Credit Agreement"), which consisted of a
$480,000
floating rate term loan. Interest under the Newsday Credit Agreement was calculated, at the election of Newsday, at either the Eurodollar rate or the base rate, plus
3.50%
or
2.50%
, respectively, as specified in the Newsday Credit Agreement. Borrowings under the Newsday Credit Agreement were guaranteed by CSC Holdings on a senior unsecured basis and certain of its subsidiaries that own interests in Newsday on a senior secured basis. The Newsday Credit Agreement was secured by a lien on the assets of Newsday and Cablevision senior notes with an aggregate principal amount of
$611,455
owned by Newsday Holdings.
On June 21, 2016, in connection with the Merger, Newsday LLC repaid its outstanding indebtedness under the Newsday Credit Agreement.
The following table provides details of the Company's outstanding credit facility debt (net of unamortized financing costs and unamortized discounts):
|
|
Maturity
Date |
Interest Rate
|
Principal
|
December 31, 2015 (a)
|
|||||||
|
Restricted Group:
|
|
||||||||||
|
Term A loan facility (b)
|
April 17, 2018
|
2.17%
|
$
|
886,621
|
|
$
|
885,105
|
|
|||
|
Term B loan facility (b)
|
April 17, 2020
|
2.92%
|
1,159,031
|
|
1,150,227
|
|
|||||
|
Restricted Group Credit Facilities debt
|
$
|
2,035,332
|
|
||||||||
|
(a)
|
The unamortized discounts and deferred financing costs amounted to
$11,200
at December 31, 2015.
|
|
(b)
|
In connection with the Merger, the Company repaid the then outstanding Term A and Term B loan facilities (see discussion above).
|
F-82
CABLEVISION SYSTEMS CORPORATION AND SUBSIDIARIES
NOTES TO CONSOLIDATED FINANCIAL STATEMENTS (continued)
(Dollars in thousands, except share and per share amounts)
Senior Notes and Debentures
The following table summarizes the Company's senior notes and debentures as of December 31, 2015:
|
Interest
|
Principal
|
Carrying
|
||||||||||||
|
Issuer
|
Date Issued
|
Maturity Date
|
Rate
|
Amount
|
Amount (c)
|
|||||||||
|
CSC Holdings (a)
|
February 6, 1998
|
February 15, 2018
|
7.875
|
%
|
$
|
300,000
|
|
$
|
299,091
|
|
||||
|
CSC Holdings (a)
|
July 21, 1998
|
July 15, 2018
|
7.625
|
%
|
500,000
|
|
498,942
|
|
||||||
|
CSC Holdings (b)
|
February 12, 2009
|
February 15, 2019
|
8.625
|
%
|
526,000
|
|
511,079
|
|
||||||
|
CSC Holdings (b)
|
November 15, 2011
|
November 15, 2021
|
6.750
|
%
|
1,000,000
|
|
985,640
|
|
||||||
|
CSC Holdings (b)
|
May 23, 2014
|
June 1, 2024
|
5.250
|
%
|
750,000
|
|
737,500
|
|
||||||
|
Cablevision (b)
|
September 23, 2009
|
September 15, 2017
|
8.625
|
%
|
900,000
|
|
891,238
|
|
||||||
|
Cablevision (b)
|
April 15, 2010
|
April 15, 2018
|
7.750
|
%
|
750,000
|
|
744,402
|
|
||||||
|
Cablevision (b)
|
April 15, 2010
|
April 15, 2020
|
8.000
|
%
|
500,000
|
|
494,410
|
|
||||||
|
Cablevision (b)
|
September 27, 2012
|
September 15, 2022
|
5.875
|
%
|
649,024
|
|
638,709
|
|
||||||
|
Total
|
$
|
5,801,011
|
|
|||||||||||
|
(a)
|
The debentures are not redeemable by the Company prior to maturity.
|
|
(b)
|
The Company may redeem some or all of the notes at any time at a specified "make-whole" price plus accrued and unpaid interest to the redemption date.
|
|
(c)
|
The carrying amount of the notes is net of the unamortized deferred financing costs and/or discounts/premiums.
|
The table above excludes (i) the principal amount of Cablevision 7.75% senior notes due 2018 of
$345,238
and the principal amount of Cablevision 8.00% senior notes due 2020 of
$266,217
held by Newsday at December 31, 2015 which are eliminated in the consolidated balance sheets of Cablevision.
Debt Transaction Subsequent to Merger
In connection with the Merger, in October 2015, Finco borrowed an aggregate principal amount of
$3,800,000
under the Term Credit Facility and entered into revolving loan commitments in an aggregate principal amount of
$2,000,000
. The Term Credit Facility was to mature on October 9, 2022 and the Revolving Credit Facility was to mature on October 9, 2020 (see discussion below regarding the extension amendments). In addition, on June 21, 2016 and July 21, 2016, the Company entered into incremental loan assumption agreements whereby the Revolving Credit Facility was increased by
$70,000
and
$35,000
, respectively, to
$2,105,000
.
Finco also issued
$1,800,000
aggregate principal amount of the 2023 Notes,
$2,000,000
aggregate principal amount of the 2025 Notes, and
$1,000,000
aggregate principal amount of the 2025 Guaranteed Notes.
On June 21, 2016, immediately following the Merger, Finco merged with and into CSC Holdings, with CSC Holdings surviving the merger (the "CSC Holdings Merger"), and the Merger Notes and the Credit Facilities became obligations of CSC Holdings. The 2025 Guaranteed Notes are guaranteed on a senior basis by each restricted subsidiary of CSC Holdings (other than CSC TKR, LLC and its subsidiaries, which own and operate the New Jersey cable television systems, Cablevision Lightpath, Inc. and any subsidiaries of CSC Holdings that are "Excluded Subsidiaries" under the indenture governing the 2025 Guaranteed Notes) (such subsidiaries, the "Initial Guarantors") and the obligations under the Credit Facilities are (i) guaranteed on a senior basis by each Initial Guarantor and (ii) secured on a first priority basis by capital stock held by CSC Holdings and the guarantors in certain subsidiaries of CSC Holdings, subject to certain exclusions and limitations.
Altice used the proceeds from the Term Credit Facility and the Merger Notes, together with an equity contribution from Altice and its Co-Investors and existing cash at Cablevision, to (a) finance the Merger, (b) refinance the credit agreement, dated as of April 17, 2013 (the "Previous Credit Facility"), among CSC Holdings, certain subsidiaries of CSC Holdings and the lenders party thereto (
$2,030,699
outstanding at Merger Date), (c) repay the senior secured credit agreement,
F-83
CABLEVISION SYSTEMS CORPORATION AND SUBSIDIARIES
NOTES TO CONSOLIDATED FINANCIAL STATEMENTS (continued)
(Dollars in thousands, except share and per share amounts)
dated as of October 12, 2012, among Newsday LLC, CSC Holdings, and the lenders party thereto (the "Previous Newsday Credit Facility") of
$480,000
at Merger Debt, and (d) pay related fees and expenses.
The Credit Facilities permit CSC Holdings to request revolving loans, swing line loans or letters of credit from the revolving lenders, swingline lenders or issuing banks, as applicable, thereunder, from time to time prior to October 9, 2020, unless the commitments under the Revolving Credit Facility have been previously terminated.
Loans comprising each Eurodollar Borrowing or ABR Borrowing, as applicable, bear interest at a rate per annum equal to the Adjusted LIBO Rate or the Alternate Base Rate, as applicable, plus the Applicable Margin, where the Applicable Margin means: in respect of revolving credit loans with respect to any Eurodollar Loan,
3.25%
per annum and (ii) with respect to any ABR Loan,
2.25%
per annum.
On September 9, 2016, CSC Holdings entered into an amendment (the "Extension Amendment") to the Credit Facilities and the incremental loan assumption agreements dated June 21, 2016 and July 21, 2016 between CSC Holdings and certain lenders party thereto (the "Extending Lenders") pursuant to which each Extending Lender agreed to extend the maturity of its Term Credit Facility under the Credit Facilities to October 11, 2024 and to certain other amendments to the Credit Facilities. In October 2016, CSC Holdings used the net proceeds from the sale of
$1,310,000
aggregate principal amount of
5.5%
senior guaranteed notes due 2027 (the "2027 Guaranteed Notes") (after the deduction of fees
and expenses) to prepay outstanding loans under the Term Credit Facility that were not extended pursuant to the Extension Amendment. The total aggregate principal amount of the Term Credit Facility, after giving effect to the use of proceeds of the 2027 Guaranteed Notes, is
$2,500,000
(the "Extended Term Loan"). The Extended Term Loan was effective on October 11, 2016. In connection with the prepayment of the Term Credit Facility, the Company wrote-off the deferred financing costs and the unamortized discount related to the existing term loan aggregating
$102,894
. Additionally, the
Company recorded deferred financing costs and an original issue discount of
$7,249
and
$6,250
, respectively, which are both being amortized to interest expense over the term of the Extended Term Loan.
On December 9, 2016, the Credit Facilities were amended to increase the availability under the Revolving Credit Facility from
$2,105,000
to
$2,300,000
and extend the maturity on
$2,280,000
of this facility to November 30, 2021. The remaining
$20,000
will mature on October 9, 2020. The Credit Facilities require CSC Holdings to prepay outstanding term loans, subject to certain exceptions and deductions, with (i)
100%
of the net cash proceeds of certain asset sales, subject to reinvestment rights and certain other exceptions, and (ii) commencing with the first full fiscal year after the consummation of the Merger, a ratable share (based on the outstanding principal amount of the Extended Term Loan divided by the sum of the outstanding principal amount of all pari passu indebtedness and the Extended Term Loan) of
50%
of the annual excess cash flow of CSC Holdings and its restricted subsidiaries, which will be reduced to
0%
if the Consolidated Net Senior Secured Leverage Ratio of CSC Holdings is less than or equal to
4.5
to 1.
Under the Term Credit Facility, CSC Holdings was required to make and made scheduled quarterly payment of
$9,500
beginning with the fiscal quarter ending September 30, 2016. Under the Extended Term Loan, CSC Holdings is required to make scheduled quarterly payments equal to
0.25%
of the principal amount of the Extended Term Loan, with the remaining balance scheduled to be paid on October 11, 2024, beginning with the fiscal quarter ending March 31, 2017.
Interest will be calculated under the Extended Term Loan subject to a "floor" applicable to the Adjusted LIBO Rate of
0.75%
per annum, and the Applicable Margin is (1) with respect to any ABR Loan,
2.00%
per annum and (2) with respect to any Eurodollar Loan,
3.00%
per annum. If the Adjusted LIBO Rate for the Extended Term Loan is less than
0.75%
for any given period, the interest rate is fixed at
3.75%
per annum.
The Credit Facilities include negative covenants that are substantially similar to the negative covenants contained in the indentures under which the Merger Notes were issued (see discussion below). The Credit Facilities include one financial maintenance covenant (solely for the benefit of the Revolving Credit Facility), consisting of a maximum Consolidated Net Senior Secured Leverage Ratio of
5.0
to 1, which will be tested on the last day of any fiscal quarter but only if on such day there are outstanding borrowings under the Revolving Credit Facility (including swingline loans but excluding any cash collateralized letters of credit and undrawn letters of credit not to exceed
$15,000
). The Credit Facilities also contain certain customary representations and warranties, affirmative covenants and events of default (including, among
F-84
CABLEVISION SYSTEMS CORPORATION AND SUBSIDIARIES
NOTES TO CONSOLIDATED FINANCIAL STATEMENTS (continued)
(Dollars in thousands, except share and per share amounts)
others, an event of default upon a change of control). If an event of default occurs, the obligations under the Credit Facilities may be accelerated.
Total amounts payable by the Company under its various debt obligations outstanding, including the debt transaction subsequent to the merger discussed above and including notes payable, collateralized indebtedness, and capital leases, during the periods shown below, are as follows:
|
Years Ending December 31,
|
|
||
|
2017
|
$
|
1,719,180
|
|
|
2018
|
2,103,441
|
|
|
|
2019
|
557,348
|
|
|
|
2020
|
526,340
|
|
|
|
2021
|
1,200,256
|
|
|
|
Thereafter
|
9,884,024
|
|
|
NOTE 11. DERIVATIVE CONTRACTS AND COLLATERALIZED INDEBTEDNESS
The Company has entered into various transactions to limit the exposure against equity price risk on its shares of Comcast Corporation ("Comcast") common stock. The Company has monetized all of its stock holdings in Comcast through the execution of prepaid forward contracts, collateralized by an equivalent amount of the respective underlying stock. At maturity, the contracts provide for the option to deliver cash or shares of Comcast stock with a value determined by reference to the applicable stock price at maturity. These contracts, at maturity, are expected to offset declines in the fair value of these securities below the hedge price per share while allowing the Company to retain upside appreciation from the hedge price per share to the relevant cap price.
The Company received cash proceeds upon execution of the prepaid forward contracts discussed above which has been reflected as collateralized indebtedness in the accompanying consolidated balance sheets. In addition, the Company separately accounts for the equity derivative component of the prepaid forward contracts. These equity derivatives have not been designated as hedges for accounting purposes. Therefore, the net fair values of the equity derivatives have been reflected in the accompanying consolidated balance sheets as an asset or liability and the net increases or decreases in the fair value of the equity derivative component of the prepaid forward contracts are included in gain (loss) on derivative contracts in the accompanying consolidated statements of operations.
All of the Company's monetization transactions are obligations of its wholly-owned subsidiaries that are not part of the Restricted Group; however, CSC Holdings has provided guarantees of the subsidiaries' ongoing contract payment expense obligations and potential payments that could be due as a result of an early termination event (as defined in the agreements). If any one of these contracts were terminated prior to its scheduled maturity date, the Company would be obligated to repay the fair value of the collateralized indebtedness less the sum of the fair values of the underlying stock and equity collar, calculated at the termination date.
The Company monitors the financial institutions that are counterparties to its equity derivative contracts and it diversifies its equity derivative contracts among various counterparties to mitigate exposure to any single financial institution.
The following represents the location of the assets and liabilities associated with the Company's derivative instruments within the consolidated balance sheets:
|
Derivatives Not
Designated as
Hedging
Instruments
|
Balance
Sheet
Location
|
Asset Derivatives
|
Liability Derivatives
|
|||||||
|
Fair Value at December 31, 2015
|
||||||||||
|
Prepaid forward contracts
|
Current derivative contracts
|
$
|
10,333
|
|
$
|
2,706
|
|
|||
|
Prepaid forward contracts
|
Long-term derivative contracts
|
72,075
|
|
—
|
|
|||||
|
|
$
|
82,408
|
|
$
|
2,706
|
|
||||
F-85
CABLEVISION SYSTEMS CORPORATION AND SUBSIDIARIES
NOTES TO CONSOLIDATED FINANCIAL STATEMENTS (continued)
(Dollars in thousands, except share and per share amounts)
Unrealized and realized gains (losses) related to Company's equity derivative contracts related to the Comcast common stock for the period January 1, 2016 through June 20, 2016 and the year ended December 31, 2015 of
$(36,283)
and
$104,927
, respectively, are reflected in gain (loss) on equity derivative contracts, net in the Company's consolidated statements of operations.
For the period January 1, 2016 through June 20, 2016 and the year ended December 31, 2015 and , the Company recorded a gain (loss) on investments of
$129,510
and
$(33,935)
, respectively, representing the net increase (decrease) in the fair values of all investment securities pledged as collateral.
Settlements of Collateralized Indebtedness
The following table summarizes the settlement of the Company's collateralized indebtedness relating to Comcast shares that were settled by delivering cash equal to the collateralized loan value, net of the value of the related equity derivative contracts.
|
|
January 1 to June 20, 2016
|
Year Ended December 31, 2015
|
|||||
|
Number of shares (a)
|
10,802,118
|
|
26,815,368
|
|
|||
|
Collateralized indebtedness settled
|
$
|
(273,519
|
)
|
$
|
(569,562
|
)
|
|
|
Derivative contracts settled
|
(8,075
|
)
|
(69,675
|
)
|
|||
|
(281,594
|
)
|
(639,237
|
)
|
||||
|
Proceeds from new monetization contracts
|
337,149
|
|
774,703
|
|
|||
|
Net cash receipt
|
$
|
55,555
|
|
$
|
135,466
|
|
|
|
(a)
|
Share amounts adjusted for the
2
for 1 stock split in February 2017.
|
The cash was obtained from the proceeds of new monetization contracts covering an equivalent number of Comcast shares. The terms of the new contracts allow the Company to retain upside participation in Comcast shares up to each respective contract's upside appreciation limit with downside exposure limited to the respective hedge price.
NOTE 12. FAIR VALUE MEASUREMENT
The fair value hierarchy is based on inputs to valuation techniques that are used to measure fair value that are either observable or unobservable. Observable inputs reflect assumptions market participants would use in pricing an asset or liability based on market data obtained from independent sources while unobservable inputs reflect a reporting entity's pricing based upon their own market assumptions. The fair value hierarchy consists of the following three levels:
|
•
|
Level I - Quoted prices for identical instruments in active markets.
|
|
•
|
Level II - Quoted prices for similar instruments in active markets; quoted prices for identical or similar instruments in markets that are not active; and model-derived valuations whose inputs are observable or whose significant value drivers are observable.
|
|
•
|
Level III - Instruments whose significant value drivers are unobservable.
|
F-86
CABLEVISION SYSTEMS CORPORATION AND SUBSIDIARIES
NOTES TO CONSOLIDATED FINANCIAL STATEMENTS (continued)
(Dollars in thousands, except share and per share amounts)
The following table presents for each of these hierarchy levels, the Company's financial assets and financial liabilities that are measured at fair value on a recurring basis:
|
At December 31, 2015
|
|||||||||||||||
|
Level I
|
Level II
|
Level III
|
Total
|
||||||||||||
|
Assets:
|
|||||||||||||||
|
Money market funds
|
$
|
922,765
|
|
$
|
—
|
|
$
|
—
|
|
$
|
922,765
|
|
|||
|
Investment securities
|
130
|
|
—
|
|
—
|
|
130
|
|
|||||||
|
Investment securities pledged as collateral
|
1,211,982
|
|
—
|
|
—
|
|
1,211,982
|
|
|||||||
|
Prepaid forward contracts
|
—
|
|
82,408
|
|
—
|
|
82,408
|
|
|||||||
|
Liabilities:
|
|||||||||||||||
|
Prepaid forward contracts
|
—
|
|
2,706
|
|
—
|
|
2,706
|
|
|||||||
The Company's cash equivalents, investment securities and investment securities pledged as collateral are classified within Level I of the fair value hierarchy because they are valued using quoted market prices.
The Company's prepaid forward contracts reflected as derivative contracts and liabilities under derivative contracts on the Company's balance sheets are valued using market-based inputs to valuation models. These valuation models require a variety of inputs, including contractual terms, market prices, yield curves, and measures of volatility. When appropriate, valuations are adjusted for various factors such as liquidity, bid/offer spreads and credit risk considerations. Such adjustments are generally based on available market evidence. Since model inputs can generally be verified and do not involve significant management judgment, the Company has concluded that these instruments should be classified within Level II of the fair value hierarchy.
In addition, see Note 9 for a discussion of impairment charges related to nonfinancial assets not measured at fair value on a recurring basis.
Fair Value of Financial Instruments
The following methods and assumptions were used to estimate fair value of each class of financial instruments for which it is practicable to estimate:
Credit Facility Debt, Collateralized Indebtedness, Senior Notes and Debentures, Senior Guaranteed Notes and Notes Payable
The fair values of each of the Company's debt instruments are based on quoted market prices for the same or similar issues or on the current rates offered to the Company for instruments of the same remaining maturities. The fair value of notes payable is based primarily on the present value of the remaining payments discounted at the borrowing cost.
The carrying values, estimated fair values, and classification under the fair value hierarchy of the Company's financial instruments, excluding those that are carried at fair value in the accompanying consolidated balance sheets, are summarized as follows:
|
|
|
December 31, 2015
|
|||||||
|
|
Fair Value
Hierarchy
|
Carrying
Amount
|
Estimated
Fair Value
|
||||||
|
Debt instruments:
|
|
|
|
|
|
||||
|
Credit facility debt
|
Level II
|
$
|
2,514,454
|
|
$
|
2,525,654
|
|
||
|
Collateralized indebtedness
|
Level II
|
1,191,324
|
|
1,176,396
|
|
||||
|
Senior notes and debentures
|
Level II
|
5,801,011
|
|
5,756,608
|
|
||||
|
Notes payable
|
Level II
|
14,544
|
|
14,483
|
|
||||
|
Total debt instruments
|
|
$
|
9,521,333
|
|
$
|
9,473,141
|
|
||
The fair value estimates related to the Company's debt instruments and senior notes receivable presented above are made at a specific point in time, based on relevant market information and information about the financial instrument. These
F-87
CABLEVISION SYSTEMS CORPORATION AND SUBSIDIARIES
NOTES TO CONSOLIDATED FINANCIAL STATEMENTS (continued)
(Dollars in thousands, except share and per share amounts)
estimates are subjective in nature and involve uncertainties and matters of significant judgments and therefore cannot be determined with precision. Changes in assumptions could significantly affect the estimates.
NOTE 13. INCOME TAXES
Income tax expense attributable to the Company's continuing operations consists of the following components:
|
|
January 1 to June 20, 2016
|
Year Ended December 31, 2015
|
|||||
|
Current expense:
|
|||||||
|
Federal
|
$
|
6,473
|
|
$
|
4,844
|
|
|
|
State
|
1,917
|
|
15,869
|
|
|||
|
|
8,390
|
|
20,713
|
|
|||
|
Deferred (benefit) expense:
|
|
|
|
|
|||
|
Federal
|
93,253
|
|
97,927
|
|
|||
|
State
|
22,897
|
|
35,469
|
|
|||
|
|
116,150
|
|
133,396
|
|
|||
|
Tax (benefit) expense relating to uncertain tax positions
|
308
|
|
763
|
|
|||
|
Income tax expense
|
$
|
124,848
|
|
$
|
154,872
|
|
|
Income tax benefit attributable to discontinued operations for the year ended December 31, 2015 of
$8,731
is comprised of current and deferred income tax benefit of
$111
and
$8,620
, respectively.
|
The income tax (benefit) expense attributable to the Company's continuing operations differs from the amount derived by applying the statutory federal rate to pretax income principally due to the effect of the following items:
|
|||||||
|
|
January 1 to June 20, 2016
|
Year Ended December 31, 2015
|
|||||
|
Federal tax expense at statutory rate
|
$
|
100,926
|
|
$
|
119,931
|
|
|
|
State income taxes, net of federal impact
|
14,825
|
|
18,874
|
|
|||
|
Changes in the valuation allowance
|
86
|
|
(902
|
)
|
|||
|
Changes in the state rates used to measure deferred taxes, net of federal impact
|
—
|
|
(1,006
|
)
|
|||
|
Tax expense (benefit) relating to uncertain tax positions
|
178
|
|
574
|
|
|||
|
New York tax reform
|
—
|
|
16,334
|
|
|||
|
Non-deductible officers' compensation
|
462
|
|
846
|
|
|||
|
Non-deductible merger transaction costs
|
9,392
|
|
—
|
|
|||
|
Other non-deductible expenses
|
1,337
|
|
3,099
|
|
|||
|
Research credit
|
(850
|
)
|
(2,630
|
)
|
|||
|
Adjustment to prior year tax expense
|
—
|
|
(515
|
)
|
|||
|
Other, net
|
(1,508
|
)
|
267
|
|
|||
|
Income tax expense
|
$
|
124,848
|
|
$
|
154,872
|
|
|
The tax effects of temporary differences which give rise to significant portions of deferred tax assets or liabilities and the corresponding valuation allowance at December 31, 2015 are as follows.
F-88
CABLEVISION SYSTEMS CORPORATION AND SUBSIDIARIES
NOTES TO CONSOLIDATED FINANCIAL STATEMENTS (continued)
(Dollars in thousands, except share and per share amounts)
|
Deferred Tax Asset (Liability)
|
|||
|
Current
|
|||
|
NOLs and tax credit carry forwards
|
$
|
76,007
|
|
|
Compensation and benefit plans
|
80,831
|
|
|
|
Allowance for doubtful accounts
|
2,196
|
|
|
|
Merger transaction costs
|
7,332
|
|
|
|
Inventory
|
7,135
|
|
|
|
Other
|
26,216
|
|
|
|
Deferred tax asset
|
199,717
|
|
|
|
Valuation allowance
|
(2,098
|
)
|
|
|
Net deferred tax asset, current
|
197,619
|
|
|
|
Investments
|
(163,396
|
)
|
|
|
Prepaid expenses
|
(19,627
|
)
|
|
|
Deferred tax liability, current
|
(183,023
|
)
|
|
|
Net deferred tax asset, current
|
$
|
14,596
|
|
|
Noncurrent
|
|||
|
NOLs and tax credit carry forwards
|
36,866
|
|
|
|
Compensation and benefit plans
|
97,005
|
|
|
|
Partnership investments
|
123,529
|
|
|
|
Investments
|
9,798
|
|
|
|
Other
|
9,201
|
|
|
|
Deferred tax asset
|
276,399
|
|
|
|
Valuation allowance
|
(2,816
|
)
|
|
|
Net deferred tax asset, noncurrent
|
273,583
|
|
|
|
Fixed assets and intangibles
|
(978,418
|
)
|
|
|
Deferred tax liability, noncurrent
|
(978,418
|
)
|
|
|
Net deferred tax liability, noncurrent
|
(704,835
|
)
|
|
|
Total net deferred tax liability
|
$
|
(690,239
|
)
|
The Company used the 'with-and-without' approach to determine the recognition and measurement of excess tax benefits. Cash flows resulting from excess tax benefits were classified as cash flows from financing activities. Excess tax benefits are realized tax benefits from tax deductions for options exercised and restricted shares issued in excess of the deferred tax asset attributable to share-based compensation expense for such awards. The Company realized excess tax benefit of
$82
and
$5,694
for the period January 1, 2016 through June 20, 2016, and for the year ended December 31, 2015, respectively, resulting in an increase to paid-in-capital.
Deferred tax assets have resulted primarily from the Company's future deductible temporary differences and NOLs. In assessing the realizability of deferred tax assets, management considers whether it is more likely than not that some portion or all of the deferred tax asset will not be realized. The Company's ability to realize its deferred tax assets depends upon the generation of sufficient future taxable income and tax planning strategies to allow for the utilization of its NOLs and deductible temporary differences. If such estimates and related assumptions change in the future, the Company may be required to record additional valuation allowances against its deferred tax assets, resulting in additional income tax expense in the Company's consolidated statements of income. Management evaluates the realizability of the deferred tax assets and the need for additional valuation allowances quarterly. At this time, based on current facts and circumstances, management believes that it is more likely than not that the Company will realize benefit for its gross deferred tax assets, except those deferred tax assets against which a valuation allowance has been recorded which relate to certain state NOLs.
F-89
CABLEVISION SYSTEMS CORPORATION AND SUBSIDIARIES
NOTES TO CONSOLIDATED FINANCIAL STATEMENTS (continued)
(Dollars in thousands, except share and per share amounts)
In the normal course of business, the Company engages in transactions in which the income tax consequences may be uncertain. The Company's income tax returns are filed based on interpretation of tax laws and regulations. Such income tax returns are subject to examination by taxing authorities. For financial statement purposes, the Company only recognizes tax positions that it believes are more likely than not of being sustained. There is considerable judgment involved in determining whether positions taken or expected to be taken on the tax return are more likely than not of being sustained.
A reconciliation of the beginning and ending amount of unrecognized tax benefits associated with uncertain tax positions, excluding associated deferred tax benefits and accrued interest, is as follows:
|
Balance at December 31, 2015
|
$
|
4,022
|
|
|
Increases related to prior year tax positions
|
3
|
|
|
|
Increases related to current year tax positions
|
6
|
|
|
|
Balance at June 20, 2016
|
$
|
4,031
|
|
In the second quarter of 2016, the Company changed its accounting policy on a prospective basis to present interest expense relating to uncertain tax positions as additional interest expense. During the period ended June 20, 2016 and December 31, 2015, interest expense of
$209
and
$314
was included in income tax expense, respectively.
The most significant jurisdictions in which the Company is required to file income tax returns include the states of New York, New Jersey and Connecticut and the City of New York. The State of New York is presently auditing income tax returns for years 2009 through 2011.
Management does not believe that the resolution of the ongoing income tax examination described above will have a material adverse impact on the financial position of the Company. Changes in the liabilities for uncertain tax positions will be recognized in the interim period in which the positions are effectively settled or there is a change in factual circumstances.
NOTE 14. BENEFIT PLANS
Qualified and Non-qualified Defined Benefit Plans
Cablevision Retirement Plans (collectively, the "Defined Benefit Plans")
The Company sponsors a non-contributory qualified defined benefit cash balance retirement plan (the "Pension Plan") for the benefit of non-union employees other than those of Newsday, as well as certain employees covered by a collective bargaining agreement in Brooklyn.
The Company maintains an unfunded non-contributory non-qualified defined benefit excess cash balance plan ("Excess Cash Balance Plan") covering certain current and former employees of the Company who participate in the Pension Plan, as well as an additional unfunded non-contributory, non-qualified defined benefit plan ("CSC Supplemental Benefit Plan") for the benefit of certain former officers and employees of the Company which provided that, upon retiring on or after normal retirement age, a participant receives a benefit equal to a specified percentage of the participant's average compensation, as defined. All participants were 100% vested in the CSC Supplemental Benefit Plan. The benefits related to the CSC Supplemental Plan were paid to participants in January 2017 and the plan was terminated.
The Company amended the Pension Plan and the Excess Cash Balance Plan to freeze participation and future benefit accruals effective December 31, 2013 for all Company employees except those covered by a collective bargaining agreement in Brooklyn. Effective April 1, 2015, participation was frozen and future benefit accruals ceased for employees covered by a collective bargaining agreement in Brooklyn. Therefore, after April 1, 2015, no employee of the Company who was not already a participant could participate in the plans and no further annual Pay Credits (a certain percentage of employees' eligible pay) were made. Existing account balances under the plans continue to be credited with monthly interest in accordance with the terms of the plans.
Plan Results for Defined Benefit Plans
F-90
CABLEVISION SYSTEMS CORPORATION AND SUBSIDIARIES
NOTES TO CONSOLIDATED FINANCIAL STATEMENTS (continued)
(Dollars in thousands, except share and per share amounts)
Summarized below is the funded status and the amounts recorded on the Company's consolidated balance sheets for all of the Company's Defined Benefit Plans at December 31, 2015:
|
Change in projected benefit obligation:
|
|||
|
Projected benefit obligation at beginning of year
|
$
|
430,846
|
|
|
Service cost
|
344
|
|
|
|
Interest cost
|
15,523
|
|
|
|
Actuarial (gain) loss
|
(14,912
|
)
|
|
|
Curtailments
|
—
|
|
|
|
Benefits paid
|
(27,838
|
)
|
|
|
Projected benefit obligation at end of year
|
403,963
|
|
|
|
Change in plan assets:
|
|
|
|
|
Fair value of plan assets at beginning of year
|
303,676
|
|
|
|
Actual return (loss) on plan assets, net
|
(3,921
|
)
|
|
|
Employer contributions
|
25,929
|
|
|
|
Benefits paid
|
(27,838
|
)
|
|
|
Fair value of plan assets at end of year
|
297,846
|
|
|
|
Unfunded status at end of year
|
$
|
(106,117
|
)
|
The accumulated benefit obligation for the Company's Defined Benefit Plans aggregated
$403,963
at December 31, 2015.
The Company's net funded status relating to its Defined Benefit Plans at December 31, 2015 are as follows:
|
Defined Benefit Plans
|
$
|
(106,117
|
)
|
|
Less: Current portion related to nonqualified plans
|
6,889
|
|
|
|
Long-term defined benefit plan obligations
|
$
|
(99,228
|
)
|
Components of the net periodic benefit cost, recorded in other operating expenses, for the Defined Benefit Plans for the period January 1, 2016 to June 20, 2016 and for the year ended December 31, 2015, are as follows:
|
|
January 1, 2016 to
June 20, 2016
|
Year ended December 31, 2015
|
|||||
|
Service cost
|
$
|
—
|
|
$
|
344
|
|
|
|
Interest cost
|
7,130
|
|
15,523
|
|
|||
|
Expected return on plan assets, net
|
(3,565
|
)
|
(8,297
|
)
|
|||
|
Recognized actuarial loss (reclassified from accumulated other comprehensive loss)
|
(1,446
|
)
|
1,294
|
|
|||
|
Settlement (income) loss (reclassified from accumulated other comprehensive loss) (a)
|
1,655
|
|
3,822
|
|
|||
|
Net periodic benefit cost
|
$
|
3,774
|
|
$
|
12,686
|
|
|
|
(a)
|
As a result of benefit payments to terminated or retired individuals exceeding the service and interest costs for the Pension Plan and the Excess Cash Balance Pension Plan during the period January 1, 2016 through June 20, 2016, and year ended December 31, 2015, the Company recognized a non-cash settlement loss that represented the acceleration of the recognition of a portion of the previously unrecognized actuarial losses recorded in accumulated other comprehensive loss on the Company’s consolidated balance sheets relating to these plans.
|
Plan Assumptions for Defined Benefit Plans
Weighted-average assumptions used to determine net periodic cost (made at the beginning of the year) and benefit obligations (made at the end of the year) for the Defined Benefit Plans are as follows:
F-91
CABLEVISION SYSTEMS CORPORATION AND SUBSIDIARIES
NOTES TO CONSOLIDATED FINANCIAL STATEMENTS (continued)
(Dollars in thousands, except share and per share amounts)
|
|
Weighted-Average Assumptions
|
|||||||
|
|
Net Periodic Benefit Cost
|
Benefit Obligations
|
||||||
|
|
January 1, 2016 to
June 20, 2016
|
Year ended December 31, 2015
|
December 31, 2015
|
|||||
|
Discount rate (a)
|
3.76
|
%
|
3.83
|
%
|
3.94
|
%
|
||
|
Rate of increase in future compensation levels
|
—
|
%
|
—
|
%
|
—
|
%
|
||
|
Expected rate of return on plan assets (Pension Plan only)
|
3.97
|
%
|
4.03
|
%
|
N/A
|
|
||
|
(a)
|
The discount rates of
3.76%
and
3.83%
, for the period January 1, 2016 through June 20, 2016, and year ended December 31, 2015, respectively, represent the average of the quarterly discount rates used to remeasure the Company's projected benefit obligation and net periodic benefit cost in connection with the recognition of settlement losses discussed above.
|
The discount rate used by the Company in calculating the net periodic benefit cost for the Cash Balance Plan and the Excess Cash Balance Plan was determined based on the expected future benefit payments for the plans and from the Towers Watson U.S. Rate Link: 40-90 Discount Rate Model. The model was developed by examining the yields on selected highly rated corporate bonds.
The Company's expected long-term return on Pension Plan assets is based on a periodic review and modeling of the plan's asset allocation structure over a long-term horizon. Expectations of returns and risk for each asset class are the most important of the assumptions used in the review and modeling and are based on comprehensive reviews of historical data, forward looking economic outlook, and economic/financial market theory. The expected long-term rate of return was chosen as a best estimate and was determined by (a) historical real returns, net of inflation, for the asset classes covered by the investment policy, and (b) projections of inflation over the long-term period during which benefits are payable to plan participants.
Pension Plan Assets and Investment Policy
The weighted average asset allocations of the Pension Plan at December 31, 2015 are as follows:
|
Plan Assets at
December 31, |
||
|
2015
|
||
|
Asset Class:
|
||
|
Mutual funds
|
39
|
%
|
|
Fixed income securities
|
61
|
|
|
Cash equivalents and other
|
—
|
|
|
100
|
%
|
|
The Pension Plan's investment objectives reflect an overall low risk tolerance to stock market volatility. This strategy allows for the Pension Plan to invest in portfolios that would obtain a rate of return throughout economic cycles, commensurate with the investment risk and cash flow needs of the Pension Plan. The investments held in the Pension Plan are readily marketable and can be sold to fund benefit payment obligations of the plan as they become payable.
Investment allocation decisions are formally made by the Altice USA Benefits Committee, which takes into account investment advice provided by its external investment consultant. The investment consultant takes into account expected long-term risk, return, correlation, and other prudent investment assumptions when recommending asset classes and investment managers to the Company's Investment and Benefit Committee. The major categories of the Pension Plan assets are cash equivalents and bonds which are marked-to-market on a daily basis. Due to the Pension Plan's significant holdings in long-term government and non-government fixed income securities, the Pension Plan's assets are subjected to interest rate risk; specifically, a rising interest rate environment. Consequently, an increase in interest rates may cause a decrease to the overall liability of the Pension Plan thus creating a hedge against rising interest rates. In addition, a portion of the Pension Plan's bond portfolio is invested in foreign debt securities where there could be foreign currency
F-92
CABLEVISION SYSTEMS CORPORATION AND SUBSIDIARIES
NOTES TO CONSOLIDATED FINANCIAL STATEMENTS (continued)
(Dollars in thousands, except share and per share amounts)
risks associated with them, as well as in non-government securities which are subject to credit risk of the bond issuer defaulting on interest and/or principal payments.
Investments at Estimated Fair Value
The fair values of the assets of the Pension Plan at December 31, 2015 by asset class are as follows:
|
Asset Class
|
Level I
|
Level II
|
Level III
|
Total
|
|||||||||||
|
Mutual funds
|
$
|
117,174
|
|
$
|
—
|
|
$
|
—
|
|
$
|
117,174
|
|
|||
|
Fixed income securities held in a portfolio:
|
|||||||||||||||
|
Foreign issued corporate debt
|
—
|
|
12,825
|
|
—
|
|
12,825
|
|
|||||||
|
U.S. corporate debt
|
—
|
|
54,005
|
|
—
|
|
54,005
|
|
|||||||
|
Government debt
|
—
|
|
8,273
|
|
—
|
|
8,273
|
|
|||||||
|
U.S. Treasury securities
|
—
|
|
90,414
|
|
—
|
|
90,414
|
|
|||||||
|
Asset-backed securities
|
—
|
|
18,563
|
|
—
|
|
18,563
|
|
|||||||
|
Cash equivalents (a)
|
893
|
|
—
|
|
—
|
|
893
|
|
|||||||
|
Total (b)
|
$
|
118,067
|
|
$
|
184,080
|
|
$
|
—
|
|
$
|
302,147
|
|
|||
|
(a)
|
Represents an investment in a money market fund.
|
|
(b)
|
Excludes cash and net payables relating to the sale of securities that were not settled as of December 31, 2015.
|
The fair values of mutual funds and cash equivalents were derived from quoted market prices that the Pension Plan administrator has the ability to access.
The fair values of corporate and government debt, treasury securities and asset-back securities were derived from bids received from a vendor or broker not available in an active market that the Pension Plan administrator has the ability to access.
Defined Contribution Plans
The Company also maintains the Cablevision 401(k) Savings Plan, a contributory qualified defined contribution plan for the benefit of non-union employees of the Company. Employees can contribute a percentage of eligible annual compensation and the Company will make a matching cash contribution or discretionary contribution, as defined in the plan. In addition, the Company maintains an unfunded non-qualified excess savings plan for which the Company provides a matching contribution similar to the Cablevision 401(k) Savings Plan.
Applicable employees of the Company are eligible for an enhanced employer matching contribution, as well as a year-end employer discretionary contribution to the Cablevision 401(k) Savings Plan and the Cablevision Excess Savings Plan.
The cost associated with these plans (including the enhanced employer matching and discretionary contributions) was
$26,964
and
$61,343
for the period January 1, 2016 through June 20, 2016, and year ended December 31, 2015, respectively.
NOTE 15. EQUITY AND LONG-TERM INCENTIVE PLANS
Equity Plans
In connection with the Merger, outstanding equity-based awards granted under the Company’s equity plans were cancelled and converted into a right to receive cash based upon the
$34.90
per Share merger price in accordance with the original terms of the awards. On the Merger Date, the Company had
11,880,700
stock options,
3,769,485
restricted shares,
1,724,940
restricted stock units issued to employees and
466,283
restricted stock units issued to non-employee directors outstanding. The aggregate payment was
$439,167
and represents a portion of the merger consideration. Approximately
$63,484
of compensation costs related to the acceleration of the vesting of these awards in connection with the Merger and the related employer payroll taxes of
$7,929
were recorded on the black line and therefore are not reflected in either the Predecessor or Successor periods.
F-93
CABLEVISION SYSTEMS CORPORATION AND SUBSIDIARIES
NOTES TO CONSOLIDATED FINANCIAL STATEMENTS (continued)
(Dollars in thousands, except share and per share amounts)
In March 2015, the Company's Board of Directors approved the Cablevision Systems Corporation 2015 Employee Stock Plan ("2015 Plan"), which was approved by Cablevision's stockholders at its annual stockholders meeting on May 21, 2015. Under the 2015 Plan, the Company was authorized to grant stock options, restricted shares, restricted stock units, stock appreciation rights, and other equity-based awards. As of December 31, 2015,
79,780
equity based awards had been granted under the 2015 Plan.
The Company also had an employee stock plan ("2006 Plan") under which it was authorized to grant incentive stock options, nonqualified stock options, restricted shares, restricted stock units, stock appreciation rights and other equity-based awards and a 2006 Stock Plan for Non-Employee Directors, whereby the Company was authorized to grant nonqualified stock options, restricted stock units and other equity-based awards. In 2015, the Company granted its non-employee directors an aggregate of
73,056
restricted stock units. Total non-employee director restricted stock units outstanding as of December 31, 2015 were
466,283
.
Since share-based compensation expense is based on awards that are ultimately expected to vest, such compensation expense was reduced for estimated forfeitures. Forfeitures were estimated based primarily on historical experience.
The following table presents the share-based compensation expense recognized by the Company as other operating expenses:
|
|
January 1, 2016 to
June 20, 2016
|
Year ended December 31, 2015
|
|||||
|
Stock options
|
$
|
3,848
|
|
$
|
9,159
|
|
|
|
Restricted shares and restricted stock units
|
20,930
|
|
51,162
|
|
|||
|
Share-based compensation related to equity classified awards
|
24,778
|
|
60,321
|
|
|||
|
Other share-based compensation
|
453
|
|
4,965
|
|
|||
|
Total share-based compensation
|
$
|
25,231
|
|
$
|
65,286
|
|
|
An income tax benefit of
$10,357
and
$26,718
was recognized in continuing operations resulting from share-based compensation expense for the period from January 1, 2016 through June 20, 2016 and year ended December 31, 2015, respectively.
Cash received from stock option exercises for the period January 1, 2016 through June 20, 2016, and year ended December 31, 2015, respectively was
$14,411
and
$18,727
, respectively.
Valuation Assumptions - Stock Options
The Company calculated the fair value of each option award on the date of grant. The Company's computation of expected life was determined based on historical experience of similar awards, giving consideration to the contractual terms of the share-based awards and vesting schedules, or by using the simplified method (the average of the vesting period and option term), if applicable. The interest rate for periods within the contractual life of the stock option was based on interest yields for U.S. Treasury instruments in effect at the time of grant. The Company's computation of expected volatility was based on historical volatility of its common stock.
The following assumptions were used to calculate the fair values of stock option awards granted in the first quarter of 2015:
|
|
2015
|
||
|
Risk-free interest rate
|
1.82
|
%
|
|
|
Expected life (in years)
|
8
|
|
|
|
Dividend yield
|
3.63
|
%
|
|
|
Volatility
|
39.98
|
%
|
|
|
Grant date fair value
|
$
|
5.45
|
|
F-94
CABLEVISION SYSTEMS CORPORATION AND SUBSIDIARIES
NOTES TO CONSOLIDATED FINANCIAL STATEMENTS (continued)
(Dollars in thousands, except share and per share amounts)
Share-Based Payment Award Activity
The following table summarizes activity relating to Company employees who held Cablevision stock options for the period January 1, 2016 to June 20, 2016 and for the year ended December 31, 2015:
|
|
Shares
Under Option
|
Weighted Average
Exercise
Price Per Share
|
Weighted Average Remaining
Contractual Term
(in years)
|
||||||||||||
|
|
Time
Vesting Options
|
Performance
Based Vesting Options
|
Aggregate Intrinsic
Value (a)
|
||||||||||||
|
Balance, December 31, 2014
|
5,097,666
|
|
7,633,500
|
|
$
|
14.41
|
|
7.17
|
$
|
79,347
|
|
||||
|
Granted
|
2,000,000
|
|
—
|
|
19.17
|
|
|
|
|
||||||
|
Exercised
|
(353,666
|
)
|
(1,024,283
|
)
|
12.84
|
|
|
|
|
||||||
|
Balance, December 31, 2015
|
6,744,000
|
|
6,609,217
|
|
15.28
|
|
6.80
|
221,900
|
|
||||||
|
Exercised
|
(744,000
|
)
|
(728,517
|
)
|
13.97
|
|
|
|
|
||||||
|
Balance, June 20, 2016
|
6,000,000
|
|
5,880,700
|
|
$
|
15.45
|
|
||||||||
|
(a)
|
The aggregate intrinsic value is calculated as the difference between (i) the exercise price of the underlying award and (ii) the quoted price of CNYG Class A common stock on December 31, 2015, as indicated.
|
Restricted Stock Award Activity
The following table summarizes activity relating to Company employees who held Cablevision restricted shares and restricted stock units for the period January 1, 2016 to June 20, 2016 and for the year ended December 31, 2015:
|
Number of Restricted Shares
|
Number of Performance Restricted Shares
|
Number of Performance Based Restricted Stock Units ("PSU") (a)
|
Weighted Average Fair Value Per Share at Date of Grant
|
|||||||||
|
Unvested award balance, December 31, 2014
|
5,314,870
|
|
2,035,300
|
|
—
|
|
$
|
15.46
|
|
|||
|
Granted
|
1,747,870
|
|
584,400
|
|
1,851,700
|
|
19.43
|
|
||||
|
Vested
|
(1,598,363
|
)
|
(739,600
|
)
|
—
|
|
14.48
|
|
||||
|
Awards forfeited
|
(496,629
|
)
|
—
|
|
(79,270
|
)
|
17.28
|
|
||||
|
Unvested award balance, December 31, 2015
|
4,967,748
|
|
1,880,100
|
|
1,772,430
|
|
17.53
|
|
||||
|
Vested
|
(2,239,167
|
)
|
(753,296
|
)
|
—
|
|
15.35
|
|
||||
|
Awards forfeited
|
(85,900
|
)
|
—
|
|
(47,490
|
)
|
18.38
|
|
||||
|
Unvested award balance, June 20, 2016
|
2,642,681
|
|
1,126,804
|
|
1,724,940
|
|
||||||
|
(a)
|
The PSUs entitled the employee to shares of CNYG common stock up to
150%
of the number of PSUs granted depending on the level of achievement of the specified performance criteria. If the minimum performance threshold was not met, no shares were issued. Accrued dividends were paid to the extent that a PSU vested and the related stock was issued.
|
During the first quarter of 2016,
2,992,463
Cablevision restricted shares issued to employees of the Company vested. To fulfill the employees' statutory minimum tax withholding obligations for the applicable income and other employment taxes,
1,248,875
of these shares, with an aggregate value of
$41,469
, were surrendered to the Company. During the year ended December 31, 2015,
2,337,963
Cablevision restricted shares issued to employees of the Company vested. To fulfill the employees' statutory minimum tax withholding obligations for the applicable income and other employment
F-95
CABLEVISION SYSTEMS CORPORATION AND SUBSIDIARIES
NOTES TO CONSOLIDATED FINANCIAL STATEMENTS (continued)
(Dollars in thousands, except share and per share amounts)
taxes,
1,004,950
of these shares, with an aggregate value of
$19,141
were surrendered to the Company. These acquired shares had been classified as treasury stock.
Long-Term Incentive Plan Awards
In March 2011, the Company's Board of Directors approved the Cablevision Systems Corporation 2011 Cash Incentive Plan, which was approved by the Company's stockholders at its annual stockholders meeting in May 2011. The Company recorded expenses of
$9,169
and
$27,170
for the period January 1, 2016 through June 20, 2016, and year ended December 31, 2015, respectively, related to this plan.
Carried Unit Plan
Subsequent to the merger, in July 2016, certain employees of the Company and its affiliates received awards of units in a Carry Unit Plan of an entity which has an ownership interest in the Company’s parent, Neptune Holding. The awards generally will vest as follows:
50%
on the second anniversary of June 21, 2016 (“Base Date”),
25%
on the third anniversary of the Base Date, and
25%
on the fourth anniversary of the Base Date. Prior to the fourth anniversary, the Company has the right to repurchase vested awards held by employees upon their termination. The Carry Unit Plan has
259,442,785
units authorized for issuance, of which
102,500,000
have been issued to employees of the Company and
100,300,000
have been issued to employees of Altice and affiliated companies.
NOTE 16. AFFILIATE AND RELATED PARTY TRANSACTIONS
Equity Method Investments
In September 2015, the Company purchased the minority interest in Newsday Holdings LLC ("Newsday Holdings") held by Tribune Media Company ("Tribune") for approximately
$8,300
. As a result of this transaction, Newsday Holdings became a wholly-owned subsidiary of the Company. In addition, the indemnity provided by the Company to Tribune for certain taxes incurred by Tribune if Newsday Holdings or its subsidiary sold or otherwise disposed of Newsday assets in a taxable transaction or failed to maintain specified minimum outstanding indebtedness, was amended so that the restriction period lapsed on September 2, 2015.
Subsequent to the Merger, in July 2016, the Company completed the sale of a
75%
interest in Newsday LLC. The Company retained the remaining
25%
ownership interest.
In December 2016, the Company made an investment of
$1,966
in i24NEWS, Altice’s 24/7 international news and current affairs channel, representing a
25%
ownership interest and the
75%
interest is owned by a subsidiary of Altice.
Related Party Transactions
As the transactions discussed below were conducted between subsidiaries under common control, amounts charged for certain services may not have represented amounts that might have been received or incurred if the transactions were based upon arm's length negotiations.
Cablevision is controlled by Charles F. Dolan, certain members of his immediate family and certain family related entities (collectively the “Dolan Family”). Members of the Dolan Family are also the controlling stockholders of AMC Networks, The Madison Square Garden Company and MSG Networks Inc. ("MSG Networks").
The following table summarizes the revenue and charges (credits) related to services provided to or received from AMC Networks, Madison Square Garden Company and MSG Networks for the Predecessor periods:
F-96
CABLEVISION SYSTEMS CORPORATION AND SUBSIDIARIES
NOTES TO CONSOLIDATED FINANCIAL STATEMENTS (continued)
(Dollars in thousands, except share and per share amounts)
|
|
January 1, 2016 to June 20, 2016
|
Year Ended December 31, 2015
|
|||||
|
|
|||||||
|
Revenue
|
$
|
2,088
|
|
$
|
5,343
|
|
|
|
Operating expenses:
|
|
|
|
|
|||
|
Programming and other direct costs, net of credits
|
$
|
84,636
|
|
$
|
176,909
|
|
|
|
Other operating expenses, net of credits
|
2,182
|
|
5,372
|
|
|||
|
Operating expenses, net
|
86,818
|
|
182,281
|
|
|||
|
Net charges
|
$
|
84,730
|
|
$
|
176,938
|
|
|
Revenue
The Company recognized revenue in connection with television advertisements and print advertising, as well as certain telecommunication services charged by its subsidiaries to AMC Networks, Madison Square Garden and MSG Networks. The Company and its subsidiaries, together with AMC Networks, Madison Square Garden and MSG Networks may have entered into agreements with third parties in which the amounts paid/received by AMC Networks, Madison Square Garden and MSG Networks, their subsidiaries, or the Company may have differed from the amounts that would have been paid/received if such arrangements were negotiated separately. Where subsidiaries of the Company have incurred a cost incremental to fair value and AMC Networks, Madison Square Garden and MSG Networks have received a benefit incremental to fair value from these negotiations, the Company and its subsidiaries charged AMC Networks, Madison Square Garden and MSG Networks for the incremental amount.
Programming and other direct costs
Programming and other direct costs included costs incurred by the Company for the carriage of the MSG Networks, as well as for AMC, WE tv, IFC, Sundance Channel and BBC America (2015 period only) on the Company's cable systems. The Company also purchased certain programming signal transmission and production services from AMC Networks.
Other operating expenses (credits)
The Company, AMC Networks, Madison Square Garden and MSG Networks routinely entered into transactions with each other in the ordinary course of business. Such transactions included, but were not limited to, sponsorship agreements and cross-promotion arrangements. Additionally, amounts reflected in the tables were net of allocations to AMC Networks, Madison Square Garden and MSG Networks for services performed by the Company on their behalf. Amounts also included charges to the Company for services performed or paid by the affiliate on the Company's behalf.
Subsequent to the Merger, the Company continues to receive or provide services to these entities, but these entities are no longer related parties.
Transactions with Other Affiliates
During the period ended January 1, 2016 to June 20, 2016 and the year ended December 31, 2015, the Company provided services to or incurred costs on behalf of certain related parties, including from time to time, the Dolan Family. All costs incurred on behalf of these related parties were reimbursed to the Company. Aggregate amounts that were due from and due to AMC Networks, Madison Square Garden and MSG Networks and other affiliates at December 31, 2015 (Predecessor) is summarized below:
|
December 31,
|
|||
|
2015
|
|||
|
Amounts due from affiliates
|
$
|
767
|
|
|
Amounts due to affiliates
|
29,729
|
|
|
F-97
CABLEVISION SYSTEMS CORPORATION AND SUBSIDIARIES
NOTES TO CONSOLIDATED FINANCIAL STATEMENTS (continued)
(Dollars in thousands, except share and per share amounts)
NOTE 17. COMMITMENTS AND CONTINGENCIES
Legal Matters
Cable Operations Litigation
Marchese, et al. v. Cablevision Systems Corporation and CSC Holdings, LLC:
The Company is a defendant in a lawsuit filed in the U.S. District Court for the District of New Jersey by several present and former Cablevision subscribers, purportedly on behalf of a class of iO video subscribers in New Jersey, Connecticut and New York. After
three
versions of the complaint were dismissed without prejudice by the District Court, plaintiffs filed their third amended complaint on August 22, 2011, alleging that the Company violated Section 1 of the Sherman Antitrust Act by allegedly tying the sale of interactive services offered as part of iO television packages to the rental and use of set-top boxes distributed by Cablevision, and violated Section 2 of the Sherman Antitrust Act by allegedly seeking to monopolize the distribution of Cablevision compatible set-top boxes. Plaintiffs seek unspecified treble monetary damages, attorney's fees, as well as injunctive and declaratory relief. On September 23, 2011, the Company filed a motion to dismiss the third amended complaint. On January 10, 2012, the District Court issued a decision dismissing with prejudice the Section 2 monopolization claim, but allowing the Section 1 tying claim and related state common law claims to proceed. Cablevision's answer to the third amended complaint was filed on February 13, 2012. On December 7, 2015, the parties entered into a settlement agreement, which is subject to approval by the Court. On December 11, 2015, plaintiffs filed a motion for preliminary approval of the settlement, conditional certification of the settlement class, and approval of a class notice distribution plan. On March 10, 2016 the Court granted preliminary approval of the settlement and approved the class notice distribution plan.
Subsequent to the Merger, the class notice distribution and the claims submission process have now concluded. The Court granted final approval of the settlement on September 12, 2016 in the amount of
$15,600
, and the effective date of the settlement was October 24, 2016.
In re Cablevision Consumer Litigation:
Following expiration of the affiliation agreements for carriage of certain Fox broadcast stations and cable networks on October 16, 2010, News Corporation terminated delivery of the programming feeds to the Company, and as a result, those stations and networks were unavailable on the Company's cable television systems. On October 30, 2010, the Company and Fox reached an agreement on new affiliation agreements for these stations and networks, and carriage was restored. Several purported class action lawsuits were subsequently filed on behalf of the Company's customers seeking recovery for the lack of Fox programming. Those lawsuits were consolidated in an action before the U. S. District Court for the Eastern District of New York, and a consolidated complaint was filed in that court on February 22, 2011. Plaintiffs asserted claims for breach of contract, unjust enrichment, and consumer fraud, seeking unspecified compensatory damages, punitive damages and attorneys' fees. On March 28, 2012, the Court ruled on the Company's motion to dismiss, denying the motion with regard to plaintiffs' breach of contract claim, but granting it with regard to the remaining claims, which were dismissed. On April 16, 2012, plaintiffs filed a second consolidated amended complaint, which asserts a claim only for breach of contract. The Company's answer was filed on May 2, 2012. On October 10, 2012, plaintiffs filed a motion for class certification and on December 13, 2012, a motion for partial summary judgment. On March 31, 2014, the Court granted plaintiffs' motion for class certification, and denied without prejudice plaintiffs' motion for summary judgment. On May 30, 2014, the Court approved the form of class notice, and on October 7, 2014, approved the class notice distribution plan. The class notice distribution has been completed, and the opt-out period expired on February 27, 2015. Expert discovery commenced on May 5, 2014, and concluded on December 8 and 28, 2015, when the Court ruled on the pending expert discovery motions. On January 26, 2016, the Court approved a schedule for filing of summary judgment motions. Plaintiffs filed a motion for summary judgment on March 31, 2016. The Company filed its own summary judgment motion on June 13, 2016. The parties are actively engaged in settlement discussions although financial terms have not yet been finalized.
Patent Litigation
Cablevision is named as a defendant in certain lawsuits claiming infringement of various patents relating to various aspects of the Company's businesses. In certain of these cases other industry participants are also defendants. In certain of these cases the Company expects that any potential liability would be the responsibility of the Company's equipment
F-98
CABLEVISION SYSTEMS CORPORATION AND SUBSIDIARIES
NOTES TO CONSOLIDATED FINANCIAL STATEMENTS (continued)
(Dollars in thousands, except share and per share amounts)
vendors pursuant to applicable contractual indemnification provisions. The Company believes that the claims are without merit and intends to defend the actions vigorously, but is unable to predict the outcome of these lawsuits or reasonably estimate a range of possible loss.
In addition to the matters discussed above, the Company is party to various lawsuits, some involving claims for substantial damages. Although the outcome of these other matters cannot be predicted and the impact of the final resolution of these other matters on the Company's results of operations in a particular subsequent reporting period is not known, management does not believe that the resolution of these other lawsuits will have a material adverse effect on the financial position of the Company or the ability of the Company to meet its financial obligations as they become due.
Other Litigation
In April 2011, Thomas C. Dolan, a director and Executive Vice President, Strategy and Development, in the Office of the Chairman at Cablevision, filed a lawsuit against Cablevision and Rainbow Media Holdings LLC (which was subsequently dismissed as a party) in New York State Supreme Court. The lawsuit raised compensation-related claims related to events largely from 2005 to 2008. The matter was handled under the direction of an independent committee of the Board of Directors of Cablevision. In April 2015, the Court granted summary judgment in favor of the plaintiff on liability, with damages to be determined. On June 18, 2015, the Company filed a notice of appeal. On February 8, 2016, Cablevision and Thomas C. Dolan entered into a settlement pursuant to which the Company agreed to pay plaintiff
$21,000
and plaintiff released all claims. A stipulation of dismissal with prejudice was approved and entered by the Court on February 8, 2016, and payment was made the same day. The appeal has also been withdrawn. The Company recorded an expense of
$21,000
which is reflected in discontinued operations in the accompanying consolidated statements of operations for the year ended December 31, 2015 (see Note 6).
F-99
CABLEVISION SYSTEMS CORPORATION AND SUBSIDIARIES
NOTES TO CONSOLIDATED FINANCIAL STATEMENTS (continued)
(Dollars in thousands, except share and per share amounts)
NOTE 18. INTERIM FINANCIAL INFORMATION (Unaudited)
The following is a summary of the Company's selected quarterly financial data:
|
Predecessor
|
|||||||
|
2016:
|
March 31,
2016
|
April 1 to June 20, 2016
|
|||||
|
Revenue
|
$
|
1,645,890
|
|
$
|
1,491,714
|
|
|
|
Operating expenses
|
(1,394,635
|
)
|
(1,267,663
|
)
|
|||
|
Operating income
|
$
|
251,255
|
|
$
|
224,051
|
|
|
|
Net income
|
$
|
94,311
|
|
$
|
69,201
|
|
|
|
Net loss attributable to noncontrolling interests
|
66
|
|
170
|
|
|||
|
Net income attributable to Cablevision Systems Corporation stockholders
|
$
|
94,377
|
|
$
|
69,371
|
|
|
|
Basic income per share attributable to Cablevision Systems Corporation stockholders:
|
|||||||
|
Income from continuing operations, net of income taxes
|
$
|
0.35
|
|
$
|
0.25
|
|
|
|
Loss from discontinued operations, net of income taxes
|
$
|
—
|
|
$
|
—
|
|
|
|
Net income
|
$
|
0.35
|
|
$
|
0.25
|
|
|
|
Diluted income per share attributable to Cablevision Systems Corporation stockholders:
|
|||||||
|
Income from continuing operations, net of income taxes
|
$
|
0.34
|
|
$
|
0.25
|
|
|
|
Loss from discontinued operations, net of income taxes
|
$
|
—
|
|
$
|
—
|
|
|
|
Net income
|
$
|
0.34
|
|
$
|
0.25
|
|
|
|
Amounts attributable to Cablevision Systems Corporation stockholders:
|
|||||||
|
Income from continuing operations, net of income taxes
|
$
|
94,377
|
|
$
|
69,371
|
|
|
|
Loss from discontinued operations, net of income taxes
|
—
|
|
—
|
|
|||
|
Net income
|
$
|
94,377
|
|
$
|
69,371
|
|
|
|
Predecessor
|
|||||||||||||||||||
|
2015:
|
March 31,
2015
|
June 30,
2015
|
September 30,
2015
|
December 31,
2015
|
Total
2015
|
||||||||||||||
|
Revenue
|
$
|
1,622,352
|
|
$
|
1,661,940
|
|
$
|
1,624,828
|
|
$
|
1,636,425
|
|
$
|
6,545,545
|
|
||||
|
Operating expenses
|
(1,398,601
|
)
|
(1,417,476
|
)
|
(1,441,712
|
)
|
(1,439,285
|
)
|
(5,697,074
|
)
|
|||||||||
|
Operating income
|
$
|
223,751
|
|
$
|
244,464
|
|
$
|
183,116
|
|
$
|
197,140
|
|
$
|
848,471
|
|
||||
|
Income from continuing operations, net of income taxes
|
$
|
54,901
|
|
$
|
75,676
|
|
$
|
23,431
|
|
$
|
33,781
|
|
$
|
187,789
|
|
||||
|
Income (loss) from discontinued operations, net of income taxes
|
(10,502
|
)
|
—
|
|
(406
|
)
|
(1,633
|
)
|
(12,541
|
)
|
|||||||||
|
Net income
|
44,399
|
|
75,676
|
|
23,025
|
|
32,148
|
|
175,248
|
|
|||||||||
|
Net loss (income) attributable to noncontrolling interests
|
234
|
|
(81
|
)
|
78
|
|
(30
|
)
|
201
|
|
|||||||||
|
Net income attributable to Cablevision Systems Corporation stockholders
|
$
|
44,633
|
|
$
|
75,595
|
|
$
|
23,103
|
|
$
|
32,118
|
|
$
|
175,449
|
|
||||
F-100
CABLEVISION SYSTEMS CORPORATION AND SUBSIDIARIES
NOTES TO CONSOLIDATED FINANCIAL STATEMENTS (continued)
(Dollars in thousands, except share and per share amounts)
|
Basic income per share attributable to Cablevision Systems Corporation stockholders:
|
|||||||||||||||||||
|
Income from continuing operations, net of income taxes
|
$
|
0.21
|
|
$
|
0.28
|
|
$
|
0.09
|
|
$
|
0.12
|
|
$
|
0.70
|
|
||||
|
Income (loss) from discontinued operations, net of income taxes
|
$
|
(0.04
|
)
|
$
|
—
|
|
$
|
—
|
|
$
|
(0.01
|
)
|
$
|
(0.05
|
)
|
||||
|
Net income
|
$
|
0.17
|
|
$
|
0.28
|
|
$
|
0.09
|
|
$
|
0.12
|
|
$
|
0.65
|
|
||||
|
Diluted income per share attributable to Cablevision Systems Corporation stockholders:
|
|||||||||||||||||||
|
Income from continuing operations, net of income taxes
|
$
|
0.20
|
|
$
|
0.27
|
|
$
|
0.08
|
|
$
|
0.12
|
|
$
|
0.68
|
|
||||
|
Income (loss) from discontinued operations, net of income taxes
|
$
|
(0.04
|
)
|
$
|
—
|
|
$
|
—
|
|
$
|
(0.01
|
)
|
$
|
(0.05
|
)
|
||||
|
Net income
|
$
|
0.16
|
|
$
|
0.27
|
|
$
|
0.08
|
|
$
|
0.12
|
|
$
|
0.63
|
|
||||
|
Amounts attributable to Cablevision Systems Corporation stockholders:
|
|||||||||||||||||||
|
Income from continuing operations, net of income taxes
|
$
|
55,135
|
|
$
|
75,595
|
|
$
|
23,509
|
|
$
|
33,751
|
|
$
|
187,990
|
|
||||
|
Income (loss) from discontinued operations, net of income taxes
|
(10,502
|
)
|
—
|
|
(406
|
)
|
(1,633
|
)
|
(12,541
|
)
|
|||||||||
|
Net income
|
$
|
44,633
|
|
$
|
75,595
|
|
$
|
23,103
|
|
$
|
32,118
|
|
$
|
175,449
|
|
||||
NOTE 19. BUSINESS COMBINATION
As discussed in Note 1, Cablevision completed the Merger on June 21, 2016. The Merger was accounted for as a business combination in accordance with ASC Topic 805. The following table provides the preliminary allocation of the total purchase price of
$9,958,323
to the identifiable tangible and intangible assets and liabilities of Cablevision based on preliminary fair value information currently available, which is subject to change within the measurement period (up to one year from the acquisition date).
|
Estimates of Fair Values (As of December 31, 2016)
|
Estimated Useful Lives
|
|||
|
Current assets
|
$
|
1,923,071
|
|
|
|
Accounts receivable
|
271,305
|
|
||
|
Property, plant and equipment
|
4,864,621
|
|
2-18 years
|
|
|
Goodwill
|
5,838,959
|
|
||
|
Indefinite-lived cable television franchises
|
8,113,575
|
|
Indefinite-lived
|
|
|
Customer relationships
|
4,850,000
|
|
8 to 18 years
|
|
|
Trade names
|
1,010,000
|
|
12 years
|
|
|
Amortizable intangible assets
|
23,296
|
|
1-15 years
|
|
|
Other non-current assets
|
748,998
|
|
||
|
Current liabilities
|
(2,305,954
|
)
|
||
|
Long-term debt
|
(8,355,386
|
)
|
||
|
Deferred income taxes.
|
(6,834,807
|
)
|
||
|
Other non-current liabilities
|
(189,355
|
)
|
||
|
Total
|
$
|
9,958,323
|
|
|
F-101
CABLEVISION SYSTEMS CORPORATION AND SUBSIDIARIES
NOTES TO CONSOLIDATED FINANCIAL STATEMENTS (continued)
(Dollars in thousands, except share and per share amounts)
The fair value of identified intangible assets was estimated using derivations of the "income" approach. Customer relationships and cable television franchises were valued using the multiple period excess earnings method (“MPEEM”) approach. The MPEEM approach quantifies the expected earnings of an asset by isolating earnings attributable to the asset from the overall business enterprise earnings and then removing a charge for those assets that contribute to the generation of the isolated earnings. The future expected earnings are discounted to their present value equivalent.
Trade names were valued using the relief from royalty method, which is based on the present value of the royalty payments avoided as a result of the company owning the intangible asset.
The basis for the valuation methods was the Company’s projections. These projections were based on management’s assumptions including among others, penetration rates for video, high speed data, and voice; revenue growth rates; operating margins; and capital expenditures. The assumptions are derived based on the Company’s and its peers’ historical operating performance adjusted for current and expected competitive and economic factors surrounding the cable industry. The discount rates used in the analysis are intended to reflect the risk inherent in the projected future cash flows generated by the respective intangible asset. The value is highly dependent on the achievement of the future financial results contemplated in the projections. The estimates and assumptions made in the valuation are inherently subject to significant uncertainties, many of which are beyond the Company's control, and there is no assurance that these results can be achieved. The primary assumptions for which there is a reasonable possibility of the occurrence of a variation that would have significantly affected the value include the assumptions regarding revenue growth, programming expense growth rates, the amount and timing of capital expenditures and the discount rate utilized.
In establishing fair value for the vast majority of the Company’s property, plant and equipment, the cost approach was utilized. The cost approach considers the amount required to replace an asset by constructing or purchasing a new asset with similar utility, then adjusts the value in consideration of physical depreciation, and functional and economic obsolescence as of the appraisal date. The cost approach relies on management’s assumptions regarding current material and labor costs required to rebuild and repurchase significant components of our property, plant and equipment along with assumptions regarding the age and estimated useful lives of our property, plant and equipment.
The estimates of expected useful lives take into consideration the effects of contractual relationships, customer attrition, eventual development of new technologies and market competition.
As a result of applying business combination accounting, the Company recorded goodwill, which represented the excess of organization value over amounts assigned to the other identifiable tangible and intangible assets arising from expectations of future operational performance and cash generation.
The following table sets forth the estimated amortization expense on the intangible assets recorded in the connection with the Merger for the years ending December 31:
|
Estimated amortization expense
|
|
|
|
|
Year Ending December 31, 2017
|
$
|
701,908
|
|
|
Year Ending December 31, 2018
|
655,409
|
|
|
|
Year Ending December 31, 2019
|
609,245
|
|
|
|
Year Ending December 31, 2020
|
562,613
|
|
|
|
Year Ending December 31, 2021
|
515,430
|
|
|
The unaudited pro forma revenue, loss from continuing operations and net loss for the years ended December 31, 2015, as if the Merger had occurred on January 1, 2015, are as follows:
|
Revenue
|
$
|
6,545,545
|
|
|
Loss from continuing operations
|
$
|
(740,115
|
)
|
|
Net loss
|
$
|
(752,656
|
)
|
F-102
CABLEVISION SYSTEMS CORPORATION AND SUBSIDIARIES
NOTES TO CONSOLIDATED FINANCIAL STATEMENTS (continued)
(Dollars in thousands, except share and per share amounts)
The pro forma results presented above include the impact of additional interest expense related to the debt issued to finance the Merger. The pro forma results also reflect additional amortization expense related to the identifiable intangible assets recorded in connection with the Merger and additional depreciation expense related to the fair value adjustment to property, plant and equipment.
F-103
TABLE OF CONTENTS
Part IItem 1. BusinessItem 1A. Risk FactorsItem 1B. Unresolved Staff CommentsItem 2. PropertiesItem 3. Legal ProceedingsItem 4. Mine Safety DisclosuresPart IIItem 5. Market For The Registrants' Common Equity, Related Stockholder Matters and Issuer Purchases Of Equity SecuritiesItem 6. Selected Historical Financial DataItem 7. Management's Discussion and Analysis Of Financial Condition and Results Of OperationsItem 7A. Quantitative and Qualitative Disclosures About Market RiskItem 8. Financial Statements and Supplementary DataItem 9. Changes in and Disagreements with Accountants on Accounting and Financial DisclosureItem 9A. Controls and ProceduresItem 9B. Other InformationPart IIIPart IVItem 15. Exhibits and Financial Statement SchedulesNote 1. Description Of Business and Related MattersNote 2. Summary Of Significant Accounting PoliciesNote 3. Accounting PronouncementsNote 4. Change in Accounting Policies and Ats AcquisitionNote 5. Business CombinationsNote 6. Supplemental Cash Flow InformationNote 7. Restructuring and Other ExpenseNote 8. Property, Plant and EquipmentNote 9. Operating LeasesNote 10. Intangible AssetsNote 11. DebtNote 12. Derivative Contracts and Collateralized IndebtednessNote 13. Fair Value MeasurementNote 14. Income TaxesNote 15. Share-based CompensationNote 16. Affiliate and Related Party TransactionsNote 17. Commitments and ContingenciesNote 18. Benefit PlansNote 19. Allowance For Doubtful AccountsNote 20. Interim Financial Information (unaudited)Note 21. Subsequent EventsNote 1. Description Of Business, Related Matters and Basis Of PresentationNote 3. Allowance For Doubtful AccountsNote 4. Supplemental Cash Flow InformationNote 5. Restructuring and Other ExpenseNote 6. Discontinued OperationsNote 7. Property, Plant and EquipmentNote 8. Operating LeasesNote 9. Intangible AssetsNote 10. DebtNote 11. Derivative Contracts and Collateralized IndebtednessNote 12. Fair Value MeasurementNote 13. Income TaxesNote 14. Benefit PlansNote 15. Equity and Long-term Incentive PlansNote 18. Interim Financial Information (unaudited)Note 19. Business Combination