As filed with the Securities and Exchange Commission on 29 March 2018
|
UNITED STATES SECURITIES AND EXCHANGE COMMISSION
Washington, D.C. 2054
|
FORM 20-F
|
☐
|
REGISTRATION STATEMENT PURSUANT TO SECTION 12(B) OR 12(G) OF THE SECURITIES EXCHANGE ACT OF 1934 OR
|
|
☒
|
ANNUAL REPORT PURSUANT TO SECTION 13 OR 15(D) OF THE SECURITIES EXCHANGE ACT OF 1934 OR
|
|
☐
|
TRANSITION REPORT PURSUANT TO SECTION 13 OR 15(D) OF THE SECURITIES EXCHANGE ACT OF 1934 OR
|
|
☐
|
SHELL COMPANY REPORT PURSUANT TO SECTION 13 OR 15(D) OF THE SECURITIES EXCHANGE ACT OF 1934
|
FOR THE FINANCIAL YEAR ENDED 31 December 2017
Commission file number: 1-14846
AngloGold Ashanti Limited
(Exact Name of Registrant as Specified in its Charter)
Republic of South Africa
(Jurisdiction of Incorporation or Organisation)
76 Rahima Moosa Street, Newtown, Johannesburg, 2001
(P.O. Box 62117, Marshalltown, 2107)
South Africa
(Address of Principal Executive Offices)
|
Kandimathie Christine Ramon, Chief Financial Officer, Telephone: +27 11 6376019
E-mail: cramon@anglogoldashanti.com, 76 Rahima Moosa Street, Newtown, Johannesburg, 2001, South Africa
(Name, Telephone, E-mail and/or Facsimile number and Address of Company Contact Person)
|
Securities registered pursuant to Section 12(b) of the Act:
|
Title of each class
|
|
Name of each exchange on which registered
|
|
American Depositary Shares
|
|
New York Stock Exchange
|
|
Ordinary Shares
|
|
New York Stock Exchange*
|
|
5.375% Notes due 2020
|
|
New York Stock Exchange
|
|
5.125% Notes due 2022
|
|
New York Stock Exchange
|
|
6.50% Notes due 2040
|
|
New York Stock Exchange
|
*
Not for trading, but only in connection with the registration of American Depositary Shares pursuant to the requirements of the Securities and Exchange Commission
Securities registered pursuant to Section 12(g) of the Act:
None
Securities for which there is a reporting obligation pursuant to Section 15(d) of the Act:
None
Indicate the number of outstanding shares of each of the issuer’s classes of capital or common stock as of the close of the period covered by the annual report:
|
Ordinary Shares of 25 ZAR cents each
|
410,054,615
|
|
|
A Redeemable Preference Shares of 50 ZAR cents each
|
2,000,000
|
|
|
B Redeemable Preference Shares of 1 ZAR cent each
|
778,896
|
|
|
Indicate by check mark if the registrant is a well-known seasoned issuer, as defined in Rule 405 of the Securities Act.
|
Yes
☒
No
☐
|
|
|
If this report is an annual or transition report, indicate by check mark if the registrant is not required to file reports pursuant to Section 13 or 15(d) of the Securities Exchange Act of 1934.
|
Yes
☐
No
☒
|
|
|
Indicate by check mark whether the registrant (1) has filed all reports required to be filed by Section 13 or 15(d) of the Securities Exchange Act of 1934 during the preceding 12 months (or for such shorter period that the registrant was required to file such reports), and (2) has been subject to such filing requirements for the past 90 days.
|
Yes
☒
No
☐
|
|
|
Indicate by check mark whether the registrant (1) has submitted electronically and posted on its corporate web site, if any, every Interactive Data File required to be submitted and posted pursuant to Rule 405 of Regulation S-T during the preceding 12 months (or for such shorter period that the registrant was required to submit and post such files).
|
Yes
☒
No
☐
|
|
|
Indicate by check mark whether the registrant is a large accelerated filer, an accelerated filer, or a non-accelerated filer. See definition of “accelerated filer and large accelerated filer” in Rule 12b-2 of the Exchange Act.
|
||
|
(Check one): Large Accelerated Filer
☒
|
|
Accelerated Filer
☐
|
Non-Accelerated Filer
☐
|
|||
|
Indicate by check mark which basis of accounting the registrant has used to prepare the financial statements included in this filing:
|
||
|
|
U.S. GAAP
☐
|
|
International Financial Reporting Standards as issued by the International Accounting Standards Board
☒
Other
☐
|
If this is an annual report, indicate by check mark whether the registrant is a shell company (as defined in Rule 12b-2 of the Exchange Act).
|
|
Yes
☐
No
☒
|
|
TABLE OF CONTENTS
|
|||
|
Page
|
|||
|
Item 1:
|
|||
|
Item 2:
|
|||
|
Item 3:
|
|||
|
3A.
|
|||
|
3B.
|
|||
|
3C.
|
|||
|
3D.
|
|||
|
Item 4:
|
|||
|
4A.
|
|||
|
4B.
|
|||
|
4C.
|
|||
|
4D.
|
|||
|
Item 4A:
|
|||
|
Item 5:
|
|||
|
5A.
|
|||
|
5B.
|
|||
|
5C.
|
|||
|
5D.
|
|||
|
5E.
|
|||
|
5F.
|
|||
|
Item 6:
|
|||
|
6A.
|
|||
|
6B.
|
|||
|
6C.
|
|||
|
6D.
|
|||
|
6E.
|
|||
|
Item 7:
|
|||
|
7A.
|
|||
|
7B.
|
|||
|
7C.
|
|||
|
Item 8:
|
|||
|
8A.
|
|||
|
8B.
|
|||
2
|
Item 9:
|
|||||
|
9A.
|
|||||
|
9B.
|
|||||
|
9C.
|
|||||
|
9D.
|
|||||
|
9E.
|
|||||
|
9F.
|
|||||
|
Item 10:
|
|||||
|
10A.
|
|||||
|
10B.
|
|||||
|
10C.
|
|||||
|
10D.
|
|||||
|
10E.
|
|||||
|
10F.
|
|||||
|
10G.
|
|||||
|
10H.
|
|||||
|
10I.
|
|||||
|
Item 11:
|
|||||
|
Item 12:
|
|||||
|
12A.
|
|||||
|
12B.
|
|||||
|
12C.
|
|||||
|
12D.
|
|||||
|
12D.3
|
|||||
|
12D.4
|
|||||
|
Item 13:
|
|||||
|
Item 14:
|
|||||
|
Item 15:
|
|||||
|
Item 16A:
|
|||||
|
Item 16B:
|
|||||
|
Item 16C:
|
|||||
|
Item 16D:
|
|||||
|
Item 16E:
|
|||||
|
Item 16F:
|
|||||
|
Item 16G:
|
|||||
|
Item 16H:
|
|||||
|
Item 17:
|
|||||
|
Item 18:
|
|||||
|
Item 19
|
E-
2
|
||||
3
PRESENTATION OF INFORMATION
AngloGold Ashanti Limited
In this annual report on Form 20-F, unless the context otherwise requires, references to AngloGold, AngloGold Ashanti, AGA, the company, the Company and the group are references to AngloGold Ashanti Limited including, as appropriate, subsidiaries and associate companies of AngloGold Ashanti Limited.
IFRS financial statements
As a company incorporated in the Republic of South Africa, AngloGold Ashanti prepares annual audited consolidated financial statements and unaudited consolidated half-year financial statements in accordance with International Financial Reporting Standards (IFRS) as issued by the International Accounting Standards Board (IASB) in the English language. These financial statements are distributed to shareholders and are submitted to the JSE Limited (JSE), as well as the New York, Australian and Ghana stock exchanges.
Currency
AngloGold Ashanti presents its consolidated financial statements in United States dollars.
In this annual report, references to rands, ZAR and R are to the lawful currency of the Republic of South Africa, references to US dollars, dollar, US$ or $ are to the lawful currency of the United States, references to
€
and Euro are to the lawful currency of the European Union, references to ARS and Argentinean peso are to the lawful currency of Argentina, references to AUD, Australian dollars and A$ are to the lawful currency of Australia, references to BRL are to the lawful currency of Brazil, references to Tsh are to the lawful currency of the United Republic of Tanzania and references to GHC, cedi or Gh¢ are to the lawful currency of Ghana.
See “Item 3A: Selected financial data – Exchange rate information” for historical information regarding the US dollar/South African rand exchange rate. On 19 March 2018, the US dollar/South African rand exchange rate as reported by Reuters was R12.01/$1.00.
Non-GAAP financial measures
In this annual report on Form 20-F, AngloGold Ashanti presents the financial items “total cash costs”, “total cash costs per ounce”, “all-in sustaining costs”, “all-in sustaining costs per ounce”, “all-in costs” and “all-in costs per ounce”, which are not IFRS measures. An investor should not consider these items in isolation or as alternatives to cost of sales, profit/(loss) applicable to equity shareholders, profit/(loss) before taxation, cash flows from operating activities or any other measure of financial performance presented in accordance with IFRS.
While the Gold Institute provided definitions for the calculation of total cash costs and during June 2013 the World Gold Council published a Guidance Note on “all-in sustaining costs” and “all-in costs” metrics, the calculation of total cash costs, total cash costs per ounce, all-in sustaining costs, all-in sustaining costs per ounce, all-in costs and all-in costs per ounce may vary significantly among gold mining companies, and by themselves do not necessarily provide a basis for comparison with other gold mining companies. See “—Glossary of selected terms–Financial terms–Total cash costs”, “ —Glossary of selected terms–Financial terms–All-in sustaining costs” and “—Glossary of selected terms–Financial terms–All-in costs”. Nevertheless, AngloGold Ashanti believes that total cash costs, all-in sustaining costs and all-in costs in total and per ounce are useful indicators to investors and management as they provide:
|
•
|
an indication of profitability, efficiency and cash flows;
|
|
•
|
the trend in costs as the mining operations mature over time on a consistent basis; and
|
|
•
|
an internal benchmark of performance to allow for comparison against other mines, both within the AngloGold Ashanti group and at other gold mining companies.
|
Management prepares its internal management reporting documentation, for use and decision making by the Chief Operating Decision Maker, on an attributable basis. The key metrics are based on the attributable ounces, gold income, total cash costs, all-in costs and all-in sustaining costs from each operation and as a consequence includes our share of the total cash costs, all-in costs and all-in sustaining costs of our joint ventures that are accounted for on the equity method. In a capital intensive industry, this basis allows management to make operating and resource allocation decisions on a comparable basis between mining operations irrespective of whether they are consolidated or accounted for under the equity method. This basis of calculating the metrics, where costs should be reported on the same basis as sales (i.e. if sales are reported on an attributable basis, then costs should be reported on an attributable basis), is also consistent with the World Gold Council’s
Guidance Note on Non-GAAP Metrics - All-in Sustaining and All-In Costs
.
Although we have shareholder rights and board representation commensurate with our ownership interests in our equity accounted joint ventures and review the underlying operating results including total cash costs, all-in costs and all-in sustaining costs with them at each reporting period, we do not have direct control over their operations or resulting revenue and expenses, nor do we have a proportionate legal interest in each financial statement line item. Our use of total cash costs, all-in costs and all-in sustaining costs on an attributable basis, is not intended to imply that we have any such control or proportionate legal interest, but rather to reflect the non-GAAP measures on a basis consistent with our internal and external segmental reporting.
A reconciliation of both cost of sales and total cash costs as included in the company’s audited financial statements to total cash costs, all-in sustaining costs and all-in costs for each of the three years ended 31 December 2015, 2016 and 2017 is presented herein. See “Item 5: Operating and Financial Review and Prospects—Total all-in sustaining costs, all-in costs and total cash costs”.
4
Shares and shareholders
In this annual report on Form 20-F, references to ordinary shares, ordinary shareholders, equity shareholders and shareholders/members, should be read as common stock, common stockholders and stockholders, respectively, and vice versa.
5
CERTAIN FORWARD-LOOKING STATEMENTS
Certain statements contained in this document, other than statements of historical fact, including, without limitation, those concerning the economic outlook for the gold mining industry, expectations regarding gold prices, production, total cash costs, all-in sustaining costs, all-in costs, cost savings and other operating results, productivity improvements, growth prospects and outlook of AngloGold Ashanti’s operations, individually or in the aggregate, including the achievement of project milestones, commencement and completion of commercial operations of certain of AngloGold Ashanti’s exploration and production projects and the completion of acquisitions, dispositions or joint venture transactions, AngloGold Ashanti’s liquidity and capital resources and capital expenditures and the outcome and consequence of any potential or pending litigation or regulatory proceedings or environmental, health and safety issues, are forward-looking statements regarding AngloGold Ashanti’s operations, economic performance and financial condition.
These forward-looking statements or forecasts involve known and unknown risks, uncertainties and other factors that may cause AngloGold Ashanti’s actual results, performance or achievements to differ materially from the anticipated results, performance or achievements expressed or implied in these forward-looking statements. Although AngloGold Ashanti believes that the expectations reflected in such forward-looking statements are reasonable, no assurance can be given that such expectations will prove to have been correct. Accordingly, results could differ materially from those set out in the forward-looking statements as a result of among other factors, changes in economic, social and political and market conditions, the success of business and operating initiatives, changes in the regulatory environment and other government actions, including environmental approvals, fluctuations in gold prices and exchange rates, the outcome of pending or future litigation proceedings and business and operational risk management and other factors as described in “Item 3D: Risk factors” and elsewhere in this annual report. These factors are not necessarily all of the important factors that could cause AngloGold Ashanti’s actual results to differ materially from those expressed in any forward-looking statements. Other unknown or unpredictable factors could also have material adverse effects on future results. Consequently, readers are cautioned not to place undue reliance on forward-looking statements.
AngloGold Ashanti undertakes no obligation to update publicly or release any revisions to these forward-looking statements to reflect events or circumstances after the date of this annual report or to reflect the occurrence of unanticipated events, except to the extent required by applicable law. All subsequent written or oral forward-looking statements attributable to AngloGold Ashanti or any person acting on its behalf are qualified by the cautionary statements herein.
6
GLOSSARY OF SELECTED TERMS
7
Mining terms
|
All injury frequency rate:
The total number of injuries and fatalities that occurs per million hours worked.
|
|
BIF:
Banded Ironstone Formation. A chemically formed iron-rich sedimentary rock.
|
|
By-products:
Any products that emanate from the core process of producing gold, including silver, uranium and sulphuric acid.
|
|
Carbon-in-leach (CIL):
Gold is leached from a slurry of gold ore with cyanide in agitated tanks and adsorbed on to activated carbon granules at the same time (i.e. when cyanide is introduced in the leach tank, there is already activated carbon in the tank and there is no distinction between leach and adsorption stages). The carbon granules are separated from the slurry and treated in an elution circuit to remove the gold.
|
|
Carbon-in-pulp (CIP):
Gold is leached conventionally from a slurry of gold ore with cyanide in agitated tanks. The leached slurry then passes into the CIP circuit where activated carbon granules are mixed with the slurry and gold is adsorbed on to the activated carbon. The gold-loaded carbon is separated from the slurry and treated in an elution circuit to remove the gold.
|
|
CLR:
Carbon leader reef.
|
|
Comminution:
Comminution is the crushing and grinding of ore to make gold available for treatment. (See also “Milling”).
|
|
Contained gold:
The total gold content (tons multiplied by grade) of the material being described.
|
|
Depletion:
The decrease in the quantity of ore in a deposit or property resulting from extraction or production.
|
|
Development:
The process of accessing an orebody through shafts and/or tunneling in underground mining operations.
|
|
Diorite:
An igneous rock formed by the solidification of molten material (magma).
|
|
Doré:
Impure alloy of gold and silver produced at a mine to be refined to a higher purity.
|
|
Electro-winning:
A process of recovering gold from solution by means of electrolytic chemical reaction into a form that can be smelted easily into gold bars.
|
|
Elution:
Recovery of the gold from the activated carbon into solution before zinc precipitation or electro-winning.
|
|
Feasibility study:
A comprehensive technical and economic study of the selected development option for a mineral project that includes appropriately detailed assessments of applicable Modifying Factors together with any other relevant operational factors and detailed financial analysis that are necessary to demonstrate at the time of reporting that extraction is reasonably justified (economically mineable). The results of the study may reasonably serve as the basis for a final decision by a proponent or financial institution to proceed with, or finance, the development of the project. The confidence level of the study will be higher than that of a Pre-Feasibility Study (JORC 2012).
|
|
Flotation:
Concentration of gold and gold-hosting minerals into a small mass by various techniques (e.g. collectors, frothers, agitation, air-flow) that collectively enhance the buoyancy of the target minerals, relative to unwanted gangue, for recovery into an over-flowing froth phase.
|
|
Gold Produced:
Refined gold in a saleable form derived from the mining process.
|
|
Grade:
The quantity of gold contained within a unit weight of gold-bearing material generally expressed in ounces per short ton of ore (oz/t), or grams per metric tonne (g/t).
|
|
Greenschist:
A schistose metamorphic rock whose green colour is due to the presence of chlorite, epidote or actinolite.
|
|
Leaching:
Dissolution of gold from crushed or milled material, including reclaimed slime, prior to adsorption on to activated carbon or direct zinc precipitation.
|
|
Life of mine (LOM):
Number of years for which an operation is planning to mine and treat ore, and is taken from the current mine plan.
|
|
Metallurgical plant:
A processing plant constructed to treat ore and extract gold.
|
8
|
Milling:
A process of reducing broken ore to a size at which concentrating can be undertaken. (See also “Comminution”).
|
|
Mine call factor:
The ratio, expressed as a percentage, of the total quantity of recovered and unrecovered mineral product after processing with the amount estimated in the ore based on sampling. The ratio of contained gold delivered to the metallurgical plant divided by the estimated contained gold of ore mined based on sampling.
|
|
Mineral deposit:
A mineral deposit is a concentration (or occurrence) of material of possible economic interest in or on the earth’s crust.
|
|
Mineral Resource:
A concentration or occurrence of solid material of economic interest in or on the earth’s crust is such form, grade (or quality), and quantity that there are reasonable prospects for eventual economic extraction. The location, quantity, grade (or quality), continuity and other geological characteristics of a Mineral Resource are known, estimated or interpreted from specific geological evidence and knowledge, including sampling. Mineral Resources are sub-divided in order of increasing geological confidence, into Inferred, Indicated or Measured categories (JORC 2012).
|
|
Modifying Factors:
Modifying Factors’ are considerations used to convert Mineral Resource to Ore Reserve. These include, but are not restricted to, mining, processing, metallurgical, infrastructure, economic, marketing, legal, environmental, social and governmental factors.
|
|
Ore Reserve:
That part of a mineral deposit which could be economically and legally extracted or produced at the time of the Ore Reserve determination.
|
|
Ounce (oz) (troy):
Used in imperial statistics. A kilogram is equal to 32.1507 ounces. A troy ounce is equal to 31.1035 grams.
|
|
Pay limit:
The grade of a unit of ore at which the revenue from the recovered mineral content of the ore is equal to the sum of total cash costs, closure costs, Ore Reserve development and stay-in-business capital. This grade is expressed as an in-situ value in grams per tonne or ounces per short ton (before dilution and mineral losses).
|
|
Precipitate:
The solid product formed when a change in solution chemical conditions results in conversion of some pre-dissolved ions into solid state.
|
|
Probable Ore Reserve:
Ore Reserve for which quantity and grade are computed from information similar to that used for Proven Ore Reserve, but the sites for inspection, sampling, and measurement are further apart or are otherwise less adequately spaced. The degree of assurance, although lower than that for Proven Ore Reserve, is high enough to assume continuity between points of observation.
|
|
Productivity:
An expression of labour productivity based on the ratio of ounces of gold produced per month to the total number of employees in mining operations.
|
|
Project capital:
Capital expenditure to either bring a new operation into production; to materially increase production capacity; or to materially extend the productive life of an asset.
|
|
Proven Ore Reserve:
A ‘Proven Ore Reserve’ is the economically mineable part of a Measured Mineral Resource. A Proven Ore Reserve implies a high degree of confidence in the Modifying Factors.
|
|
Recovered grade:
The recovered mineral content per unit of ore treated.
|
|
Reef:
A gold-bearing sedimentary horizon, normally a conglomerate band that may contain economic levels of gold.
|
|
Refining:
The final purification process of a metal or mineral.
|
|
Rehabilitation:
The process of reclaiming land disturbed by mining to allow an appropriate post-mining use. Rehabilitation standards are defined by country-specific laws, including but not limited to the South African Department of Mineral Resources, the US Bureau of Land Management, the US Forest Service, and the relevant Australian mining authorities, and address among other issues, ground and surface water, topsoil, final slope gradient, waste handling and re-vegetation issues
|
|
Seismic event:
A sudden inelastic deformation within a given volume of rock that radiates detectable seismic energy.
|
|
Shaft:
A vertical or subvertical excavation used for accessing an underground mine; for transporting personnel, equipment and supplies; for hoisting ore and waste; for ventilation and utilities; and/or as an auxiliary exit.
|
|
Short ton:
Used in imperial statistics. Equal to 2,000 pounds.
|
|
Smelting:
A pyro-metallurgical operation in which gold precipitate from electro-winning or zinc precipitation is further separated from impurities.
|
9
|
Stoping:
The process of excavating ore underground.
|
|
Stripping ratio:
The ratio of waste tonnes to ore tonnes mined calculated as total tonnes mined less ore tonnes mined divided by ore tonnes mined.
|
|
Tailings:
Finely ground rock of low residual value from which valuable minerals have been extracted.
|
|
Tonnage:
Quantity of material measured in tonnes or tons.
|
|
Tonne:
Used in metric statistics. Equal to 1,000 kilograms.
|
|
Waste:
Material that contains insufficient mineralisation for consideration for future treatment and, as such, is discarded.
|
|
Yield:
The amount of valuable mineral or metal recovered from each unit mass of ore expressed as ounces per short ton or grams per metric tonne.
|
|
Zinc precipitation:
Zinc precipitation is the chemical reaction using zinc dust that converts gold in solution to a solid form for smelting into unrefined gold bars.
|
10
Financial terms
|
All-in costs:
All-in costs are all-in sustaining costs including additional non-sustaining costs which reflect the varying costs of producing gold over the life-cycle of a mine. Non-sustaining costs are those costs incurred at new operations and costs related to ‘major projects’ at existing operations where these projects will materially increase production. All-in costs per ounce is arrived at by dividing the dollar value of the sum of these cost metrics, by the ounces of gold sold.
|
|
All-in sustaining costs:
During June 2013 the World Gold Council (WGC), an industry body, published a Guidance Note on the “all-in sustaining costs” metric, which gold mining companies can use to supplement their overall non-GAAP disclosure. “All-in sustaining costs” is an extension of the existing “total cash cost” metric and incorporates all costs related to sustaining production and in particular recognises the sustaining capital expenditure associated with developing and maintaining gold mines. In addition, this metric includes the cost associated with developing and maintaining gold mines, the cost associated with corporate office structures that support these operations, the community and rehabilitation costs attendant with responsible mining and any exploration and evaluation costs associated with sustaining current operations. All-in sustaining costs per ounce is arrived at by dividing the dollar value of the sum of these cost metrics, by the ounces of gold sold.
|
|
Average number of employees:
The monthly average number of production and non-production employees and contractors employed during the year, where contractors are defined as individuals who have entered into a fixed-term contract of employment with a group company or subsidiary. Employee numbers of joint ventures represent the group’s attributable share.
|
|
Capital expenditure:
Total capital expenditure on tangible assets.
|
|
Effective tax rate:
Current and deferred taxation charge for the year as a percentage of profit before taxation.
|
|
Non-sustaining capital expenditure:
Capital expenditure incurred at new operations and capital expenditure related to ‘major projects’ at existing operations where these projects will materially increase production.
.
|
|
Rated bonds:
The $700 million 5.375 percent bonds due 2020, $300 million 6.5 percent bonds due 2040 and the $750 million 5.125 percent bonds due 2022.
|
|
Region:
Defines the operational management divisions within AngloGold Ashanti Limited, namely South Africa, Continental Africa (DRC, Ghana, Guinea, Mali and Tanzania), Australasia and the Americas (Argentina and Brazil).
|
|
Related party:
Parties are considered related if one party has the ability to control the other party or exercise significant influence over the other party in making financial and operating decisions or if such parties are under common control.
|
|
Significant influence:
The ability, directly or indirectly, to participate in, but not exercise control over, the financial and operating policy decision of an entity so as to obtain economic benefit from its activities.
|
|
Stay-in-business capital:
Capital expenditure to extend useful lives of existing production assets. This includes replacement of vehicles, plant and machinery, Ore Reserve development, deferred stripping and capital expenditure related to financial benefit initiatives, safety, health and the environment.
|
|
Strate:
The licensed Central Securities Depository (CSD) for the electronic settlement of financial instruments in South Africa.
|
|
Total cash costs:
Total cash costs include site costs for all mining, processing and administration, reduced by contributions from by-products and are inclusive of royalties and production taxes. Depreciation, depletion and amortisation, rehabilitation, corporate administration, employee severance costs, capital and exploration costs are excluded. Total cash costs per ounce are the attributable total cash costs divided by the attributable ounces of gold produced.
|
|
Total production costs:
Total cash costs plus depreciation, depletion and amortisation, employee severance costs, rehabilitation and other non-cash costs. Corporate administration, exploration costs, other operating expenditure and costs reflected as special items are excluded. Total production costs per ounce are the attributable total production costs divided by the attributable ounces of gold produced.
|
|
Weighted average number of ordinary shares:
The number of ordinary shares in issue at the beginning of the year, increased by shares issued during the year, weighted on a time basis for the period during which they have participated in the income of the group, and increased by share options that are virtually certain to be exercised.
|
11
Currencies
|
$, US$, USD, US dollars or dollar
|
United States dollars
|
|
ARS
|
Argentinean peso
|
|
A$, Australian dollars or AUD
|
Australian dollars
|
|
BRL
|
Brazilian real
|
|
€ or Euro
|
European Euro
|
|
GHC, cedi or Gh¢
|
Ghanaian cedi
|
|
Tsh
|
Tanzanian Shillings
|
|
ZAR, R or rand
|
South African rands
|
12
Abbreviations
|
ADR
|
American Depositary Receipt
|
|
ADS
|
American Depositary Share
|
|
AIFR
|
All injury frequency rate
|
|
ASX
|
Australian Securities Exchange
|
|
Au
|
Contained gold
|
|
BBBEE
|
Broad-Based Black Economic Empowerment
|
|
BBSY
|
Bank Bill Swap Bid Rate
|
|
BEE
|
Black Economic Empowerment
|
|
bn
|
Billion
|
|
CDI
|
Chess Depositary Interests
|
|
CHESS
|
Clearing House Electronic Settlement System
|
|
CLR
|
Carbon Leader Reef
|
|
CR
|
Crystalkop Reef
|
|
DMTNP
|
Domestic medium-term notes programme
|
|
DRC
|
Democratic Republic of the Congo
|
|
ERP
|
Enterprise resource planning
|
|
G or g
|
Grams
|
|
GhDS
|
Ghanaian Depositary Share
|
|
GhSE
|
Ghana Stock Exchange
|
|
IASB
|
International Accounting Standards Board
|
|
IFRS
|
International Financial Reporting Standards as issued by the IASB
|
|
JIBAR
|
Johannesburg Interbank Agreed Rate
|
|
JORC
|
Australasian Code for Reporting Exploration Results, Mineral Resources and Ore Reserves
|
|
JSE
|
JSE Limited (Johannesburg Stock Exchange)
|
|
King III and IV
|
The King Report on Corporate Governance for South Africa
|
|
Kg or kg
|
Kilograms
|
|
Km or km
|
Kilometres
|
|
Km2
|
Squared kilometres
|
|
Koz
|
Thousand ounces
|
|
LIBOR
|
London Interbank Offer Rate
|
|
M or m
|
Metre or million, depending on the context
|
|
Moz
|
Million ounces
|
|
Mt
|
Million tonnes or tons
|
|
Mtpa
|
Million tonnes/tons per annum
|
|
NYSE
|
New York Stock Exchange
|
|
Oz or oz
|
Ounces (troy)
|
|
oz/t
|
Ounces per ton
|
|
oz/TEC
|
Ounces per total employee costed
|
|
SAMREC
|
South African Code for the Reporting of Exploration Results, Mineral Resources and Mineral Reserves
|
|
SEC
|
United States Securities and Exchange Commission
|
|
The Companies Act
|
South African Companies Act, No. 71 of 2008, as amended
|
|
T or t
|
Tons (short) or tonnes (metric)
|
|
Tpa or tpa
|
Tonnes/tons per annum
|
|
US/USA/United States
|
United States of America
|
|
VR
|
Vaal Reef
|
|
VCR
|
Ventersdorp Contact Reef
|
|
XBRL
|
eXtensible Business Reporting Language
|
Note:
Rounding of figures in this report may result in computational discrepancies.
13
Not applicable.
14
Not applicable.
15
16
|
3A.
|
SELECTED FINANCIAL DATA
|
The selected financial information set forth below for the years ended and as at 31 December 2017, 2016 and 2015 has been derived from, and should be read in conjunction with, the IFRS financial statements included under Item 18 of this annual report. The selected financial information for the years ended and as at 31 December 2014 and 2013 has been derived from the IFRS financial statements not included in this annual report.
17
|
|
Year ended 31 December
|
|||||||||||||
|
2017
|
|
2016
|
|
2015
|
|
2014
|
|
2013
|
|
|||||
|
$
|
|
$
|
|
$
|
|
$
|
|
$
|
|
|||||
|
|
(in millions, except share and per share amounts)
|
|||||||||||||
|
|
||||||||||||||
|
Revenue
|
4,543
|
|
4,254
|
|
4,174
|
|
5,110
|
|
5,383
|
|
||||
|
Gold income
|
4,356
|
|
4,085
|
|
4,015
|
|
4,952
|
|
5,172
|
|
||||
|
Cost of sales
|
(3,582
|
)
|
(3,263
|
)
|
(3,294
|
)
|
(3,972
|
)
|
(3,947
|
)
|
||||
|
Gain (loss) on non-hedge derivatives and other commodity contracts
|
10
|
|
19
|
|
(7
|
)
|
13
|
|
94
|
|
||||
|
Gross profit
|
784
|
|
841
|
|
714
|
|
993
|
|
1,319
|
|
||||
|
Corporate administration, marketing, other expenses and other income
|
(64
|
)
|
(61
|
)
|
(78
|
)
|
(92
|
)
|
(201
|
)
|
||||
|
Exploration and evaluation costs
|
(114
|
)
|
(133
|
)
|
(132
|
)
|
(142
|
)
|
(250
|
)
|
||||
|
Other operating expenses
|
(88
|
)
|
(110
|
)
|
(96
|
)
|
(28
|
)
|
(19
|
)
|
||||
|
Special items
|
(438
|
)
|
(42
|
)
|
(71
|
)
|
(260
|
)
|
(2,951
|
)
|
||||
|
Operating profit (loss)
|
80
|
|
495
|
|
337
|
|
471
|
|
(2,102
|
)
|
||||
|
Dividends received
|
—
|
|
—
|
|
—
|
|
—
|
|
5
|
|
||||
|
Interest received
|
15
|
|
22
|
|
28
|
|
24
|
|
39
|
|
||||
|
Exchange gain (loss)
|
(11
|
)
|
(88
|
)
|
(17
|
)
|
(7
|
)
|
14
|
|
||||
|
Finance costs and unwinding of obligations
|
(169
|
)
|
(180
|
)
|
(245
|
)
|
(276
|
)
|
(293
|
)
|
||||
|
Fair value adjustment on issued bonds
|
—
|
|
9
|
|
66
|
|
(17
|
)
|
307
|
|
||||
|
Share of associates and joint ventures’ profit (loss)
|
22
|
|
11
|
|
88
|
|
(25
|
)
|
(162
|
)
|
||||
|
Profit (loss) before taxation
|
(63
|
)
|
269
|
|
257
|
|
170
|
|
(2,192
|
)
|
||||
|
Taxation
|
(108
|
)
|
(189
|
)
|
(211
|
)
|
(225
|
)
|
237
|
|
||||
|
Profit (loss) after taxation from continuing operations
|
(171
|
)
|
80
|
|
46
|
|
(55
|
)
|
(1,955
|
)
|
||||
|
Discontinued operations
|
||||||||||||||
|
Profit (loss) from discontinued operations
|
—
|
|
—
|
|
(116
|
)
|
16
|
|
(245
|
)
|
||||
|
Profit (loss) for the year
|
(171
|
)
|
80
|
|
(70
|
)
|
(39
|
)
|
(2,200
|
)
|
||||
|
Allocated as follows
|
||||||||||||||
|
Equity shareholders
|
||||||||||||||
|
- Continuing operations
|
(191
|
)
|
63
|
|
31
|
|
(74
|
)
|
(1,985
|
)
|
||||
|
- Discontinued operations
|
—
|
|
—
|
|
(116
|
)
|
16
|
|
(245
|
)
|
||||
|
Non-controlling interests
|
||||||||||||||
|
- Continuing operations
|
20
|
|
17
|
|
15
|
|
19
|
|
30
|
|
||||
|
(171
|
)
|
80
|
|
(70
|
)
|
(39
|
)
|
(2,200
|
)
|
|||||
|
Basic earnings (loss) per ordinary share (cents)
|
(46
|
)
|
15
|
|
(20
|
)
|
(14
|
)
|
(568
|
)
|
||||
|
Earnings (loss) per ordinary share from continuing operations
|
(46
|
)
|
15
|
|
8
|
|
(18
|
)
|
(506
|
)
|
||||
|
Earnings (loss) per ordinary share from discontinued operations
|
—
|
|
—
|
|
(28
|
)
|
4
|
|
(62
|
)
|
||||
|
Diluted earnings (loss) per ordinary share (cents)
|
(46
|
)
|
15
|
|
(20
|
)
|
(14
|
)
|
(631
|
)
|
||||
|
Earnings (loss) per ordinary share from continuing operations
|
(46
|
)
|
15
|
|
8
|
|
(18
|
)
|
(571
|
)
|
||||
|
Earnings (loss) per ordinary share from discontinued operations
|
—
|
|
—
|
|
(28
|
)
|
4
|
|
(62
|
)
|
||||
|
Dividend per ordinary share (cents)
|
10
|
|
—
|
|
—
|
|
—
|
|
10
|
|
||||
18
|
As at 31 December
|
||||||||||||||
|
2017
|
|
2016
|
|
2015
|
|
2014
|
|
2013
|
|
|||||
|
$
|
|
$
|
|
$
|
|
$
|
|
$
|
|
|||||
|
(in millions, except share and per share amounts)
|
||||||||||||||
|
|
||||||||||||||
|
ASSETS
|
||||||||||||||
|
Non-current assets
|
||||||||||||||
|
Tangible assets
|
3,742
|
|
4,111
|
|
4,058
|
|
4,863
|
|
4,815
|
|
||||
|
Intangible assets
|
138
|
|
145
|
|
161
|
|
225
|
|
267
|
|
||||
|
Investments in associates and joint ventures
|
1,507
|
|
1,448
|
|
1,465
|
|
1,427
|
|
1,327
|
|
||||
|
Other investments
|
131
|
|
125
|
|
91
|
|
126
|
|
131
|
|
||||
|
Inventories
|
100
|
|
84
|
|
90
|
|
636
|
|
586
|
|
||||
|
Trade, other receivables and other assets
|
67
|
|
34
|
|
13
|
|
20
|
|
29
|
|
||||
|
Deferred taxation
|
4
|
|
4
|
|
1
|
|
127
|
|
177
|
|
||||
|
Cash restricted for use
|
37
|
|
36
|
|
37
|
|
36
|
|
31
|
|
||||
|
Other non-current assets
|
—
|
|
—
|
|
18
|
|
25
|
|
41
|
|
||||
|
5,726
|
|
5,987
|
|
5,934
|
|
7,485
|
|
7,404
|
|
|||||
|
Current assets
|
||||||||||||||
|
Other investments
|
7
|
|
5
|
|
1
|
|
—
|
|
1
|
|
||||
|
Inventories
|
683
|
|
672
|
|
646
|
|
888
|
|
1,053
|
|
||||
|
Trade, other receivables and other assets
|
222
|
|
255
|
|
196
|
|
278
|
|
369
|
|
||||
|
Cash restricted for use
|
28
|
|
19
|
|
23
|
|
15
|
|
46
|
|
||||
|
Cash and cash equivalents
|
205
|
|
215
|
|
484
|
|
468
|
|
648
|
|
||||
|
1,145
|
|
1,166
|
|
1,350
|
|
1,649
|
|
2,117
|
|
|||||
|
Non-current assets held for sale
|
348
|
|
—
|
|
—
|
|
—
|
|
153
|
|
||||
|
1,493
|
|
1,166
|
|
1,350
|
|
1,649
|
|
2,270
|
|
|||||
|
Total assets
|
7,219
|
|
7,153
|
|
7,284
|
|
9,134
|
|
9,674
|
|
||||
|
EQUITY AND LIABILITIES
|
||||||||||||||
|
Share capital and premium
|
7,134
|
|
7,108
|
|
7,066
|
|
7,041
|
|
7,006
|
|
||||
|
Accumulated losses and other reserves
|
(4,471
|
)
|
(4,393
|
)
|
(4,636
|
)
|
(4,196
|
)
|
(3,927
|
)
|
||||
|
Shareholders’ equity
|
2,663
|
|
2,715
|
|
2,430
|
|
2,845
|
|
3,079
|
|
||||
|
Non-controlling interests
|
41
|
|
39
|
|
37
|
|
26
|
|
28
|
|
||||
|
Total equity
|
2,704
|
|
2,754
|
|
2,467
|
|
2,871
|
|
3,107
|
|
||||
|
Non-current liabilities
|
||||||||||||||
|
Borrowings
|
2,230
|
|
2,144
|
|
2,637
|
|
3,498
|
|
3,633
|
|
||||
|
Environmental rehabilitation and other provisions
|
942
|
|
877
|
|
847
|
|
1,052
|
|
963
|
|
||||
|
Provision for pension and post-retirement benefits
|
122
|
|
118
|
|
107
|
|
147
|
|
152
|
|
||||
|
Trade, other payables and deferred income
|
3
|
|
4
|
|
5
|
|
15
|
|
4
|
|
||||
|
Deferred taxation
|
363
|
|
496
|
|
514
|
|
567
|
|
579
|
|
||||
|
3,660
|
|
3,639
|
|
4,110
|
|
5,279
|
|
5,331
|
|
|||||
|
Current liabilities
|
||||||||||||||
|
Borrowings
|
38
|
|
34
|
|
100
|
|
223
|
|
258
|
|
||||
|
Trade, other payables and deferred income
|
638
|
|
615
|
|
516
|
|
695
|
|
820
|
|
||||
|
Bank overdraft
|
—
|
|
—
|
|
—
|
|
—
|
|
20
|
|
||||
|
Taxation
|
53
|
|
111
|
|
91
|
|
66
|
|
81
|
|
||||
|
729
|
|
760
|
|
707
|
|
984
|
|
1,179
|
|
|||||
|
Non-current liabilities held for sale
|
126
|
|
—
|
|
—
|
|
—
|
|
57
|
|
||||
|
855
|
|
760
|
|
707
|
|
984
|
|
1,236
|
|
|||||
|
Total liabilities
|
4,515
|
|
4,399
|
|
4,817
|
|
6,263
|
|
6,567
|
|
||||
|
Total equity and liabilities
|
7,219
|
|
7,153
|
|
7,284
|
|
9,134
|
|
9,674
|
|
||||
|
Number of ordinary shares as adjusted to reflect changes in share capital
|
410,054,615
|
|
408,223,760
|
|
405,265,315
|
|
404,010,360
|
|
402,628,406
|
|
||||
|
Share capital (exclusive of long-term debt and redeemable preference shares)
|
16
|
|
16
|
|
16
|
|
16
|
|
16
|
|
||||
|
Net assets
|
2,704
|
|
2,754
|
|
2,467
|
|
2,871
|
|
3,107
|
|
||||
19
Annual dividends
The table below sets forth the amounts of interim, final and total dividends declared in respect of the past five years in cents per ordinary share.
|
Year ended 31 December
(1)
|
2017
(3)
|
|
2016
|
|
2015
|
|
2014
|
|
2013
|
|
||||
|
South African cents per ordinary share
|
130
|
|
—
|
|
—
|
|
—
|
|
100
|
|
||||
|
US cents per ordinary share
(2)
|
10
|
|
—
|
|
—
|
|
—
|
|
10
|
|
||||
|
(1)
|
During 2013, the Company changed the frequency of dividend payments to be dependent upon the board’s ongoing assessment of AngloGold Ashanti’s earnings.
|
|
(2)
|
Dividends for these periods were declared in South African cents. US dollar cents per share figures have been calculated based on exchange rates prevailing on each of the respective payment dates.
|
|
(3)
|
The dividend policy allows the Board, at its discretion, to declare an annual dividend to be based on 10 percent of the free cash flow generated by the business, before growth capital expenditure, for that financial year.
|
For further information on the company’s policy on dividend distributions, see “Item 8A: Consolidated Financial Statements and Other Information—Dividends”.
Exchange rate information
The following table sets forth, for the periods and dates indicated, certain information concerning US dollar/South African rand exchange rates expressed in rands per $1.00. On 19 March 2018, the exchange rate between South African rands and US dollars as reported by Reuters was R12.01/$1.00.
|
Year ended 31 December
(2)
|
High
|
|
Low
|
|
Year end
|
|
Average
(1)
|
|
||||
|
2013
|
10.51
|
|
8.47
|
|
10.49
|
|
9.63
|
|
||||
|
2014
|
11.69
|
|
10.28
|
|
11.60
|
|
10.84
|
|
||||
|
2015
|
15.87
|
|
11.36
|
|
15.53
|
|
12.77
|
|
||||
|
2016
|
16.87
|
|
13.18
|
|
13.73
|
|
14.68
|
|
||||
|
2017
|
14.46
|
|
12.25
|
|
12.36
|
|
13.30
|
|
||||
|
2018
(3)
|
12.45
|
|
11.54
|
|
11.98
|
|
||||||
|
(1)
|
The average rate of exchange on the last business day of each month during the year.
|
|
(2)
|
Based on the exchange rate as reported by Reuters.
|
|
(3)
|
Through to 19 March 2018.
|
|
Exchange rate information for the months of
(1)
|
High
|
|
Low
|
|
|
|
September 2017
|
13.58
|
|
12.76
|
|
|
|
October 2017
|
14.23
|
|
13.26
|
|
|
|
November 2017
|
14.46
|
|
13.65
|
|
|
|
December 2017
|
13.73
|
|
12.25
|
|
|
|
January 2018
|
12.45
|
|
11.85
|
|
|
|
February 2018
|
12.16
|
|
11.54
|
|
|
|
March 2018
(2)
|
12.01
|
|
11.76
|
|
|
|
(1)
|
Based on the exchange rate as reported by Reuters.
|
|
(2)
|
Through to 19 March 2018.
|
20
|
3B.
|
|
Not applicable.
|
3C.
|
REASONS FOR THE OFFER AND USE OF PROCEEDS
|
Not applicable.
3D.
RISK FACTORS
This section describes many of the risks that could affect AngloGold Ashanti. There may, however, be additional risks unknown to AngloGold Ashanti and other risks, currently believed to be immaterial, that could turn out to be material. Additional risks may arise or become material subsequent to the date of this document. These risks, either individually or simultaneously, could significantly affect the group’s business, financial results and the price of its securities.
Risks related to AngloGold Ashanti’s results of operations and financial condition as a result of factors that impact the gold mining industry generally.
Commodity market price fluctuations could adversely affect the profitability of operations.
AngloGold Ashanti’s revenues are primarily derived from the sale of gold and, to a lesser extent, uranium, silver and sulphuric acid. The company’s current policy is to sell its products at prevailing market prices and not to enter into price hedging arrangements. The market prices for these commodities fluctuate widely. These fluctuations are caused by numerous factors beyond the company’s control. For example, the market price of gold may change for a variety of reasons, including:
|
•
|
speculative positions taken by investors or traders in gold;
|
|
•
|
monetary policies announced or implemented by central banks, including the U.S. Federal Reserve;
|
|
•
|
changes in the demand for gold as an investment ;
|
|
•
|
changes in the demand for gold used in jewellery and for other industrial uses, including as a result of prevailing economic conditions;
|
|
•
|
changes in the supply of gold from production, divestment, scrap and hedging;
|
|
•
|
financial market expectations regarding the rate of inflation;
|
|
•
|
the strength of the U.S. dollar (the currency in which gold trades internationally) relative to other currencies;
|
|
•
|
changes in interest rates;
|
|
•
|
actual or anticipated sales or purchases of gold by central banks and the International Monetary Fund (IMF);
|
|
•
|
gold hedging and de-hedging by gold producers;
|
|
•
|
global or regional political or economic events; and
|
|
•
|
the cost of gold production in major gold producing countries.
|
The market price of gold has been and continues to be significantly volatile. During 2017, the gold price traded from a low of $1,158.82 per ounce to a high of $1,348.80 per ounce, remaining well below a peak of $1,900 per ounce in September 2011. Between 1 January 2018 and 19 March 2018, the gold price traded between a low of $1,312.58 per ounce and a high of $1,358.09 per ounce. On 19 March 2018 the afternoon price for gold on the London Bullion Market was $1,316.56 per ounce. In addition to protracted declines such as the one experienced from 2011 through 2015, the price of gold is also often subject to sharp, short-term changes.
For example, during the three-day period from Friday, 12 April 2013, to Monday, 15 April 2013, the price of gold fell by $228 per ounce. Additionally, the spot price of gold fell by more than four percent to $1,086 per ounce in overnight trading on 20 July 2015 after traders sold 57 tonnes of gold in Shanghai and New York. By taking the price of gold below $1,100 per ounce, the July 2015 sell-off triggered a high volume of stop-loss orders that had been put in place by traders to automatically sell when the gold price reached a predetermined level. This caused the gold price to drop further. Any sharp or prolonged fluctuations in the price of gold can have a material adverse impact on the company’s profitability and financial condition.
Central banks’ policies can affect the price of gold. If gold is treated as a safe alternative investment during economic downturns, the price of gold may fall when central banks end quantitative easing or increase interest rates. For example, the price of gold fell to annual lows when the Chairman of the U.S. Federal Reserve announced a reduction in quantitative easing in June 2013, the end of the quantitative easing programme in October 2014 and an increase in interest rates in December 2015. Similarly, gold
21
prices continued on a downward trend after the Chairman’s announcement of an increase in interest rates in December 2016. However, the gold price has generally increased since the beginning of 2017 despite the Chairman’s announcement of another interest rate increase in March of 2017 and may continue to be unpredictable. Any future announcements or proposals by the U.S. Federal Reserve, or any of its board members or regional presidents or other similar officials in other major economies may materially and adversely affect the price of gold and, as a result, AngloGold Ashanti’s financial condition and results of operations.
Whilst overall supply and demand typically do not affect the gold price in the same manner or to the same degree as other commodities due to the considerable size of historical mined stocks of gold, events that affect supply and demand may nonetheless have an impact. According to the World Gold Council, demand for gold is generally driven by four main sectors, namely jewellery, investment, central banks and technology. The market for gold bullion bar, AngloGold Ashanti’s primary product, is generally limited to bullion banks, the number of which has declined in recent years. Central banks’ purchases can be adversely affected by declines in foreign exchange reserves. For example, this was one of the factors that drove a 33 percent decline in net gold purchases by central banks in 2016 compared to 2015. Demand for gold is also largely impacted by trends in China and India, which account for the highest gold consumption worldwide. Demand for gold may be particularly affected by government policies in these countries. For example, according to the World Gold Council, gold demand in China fell 38 percent in 2014 compared to 2013 and demand for gold bars and coins fell by 50 percent due in part to the government’s anti-corruption programme, which put limited pressure on demand for gold ornaments and so-called “gift bars”. In India, government intervention to try to reduce the trade deficit, a material portion of which is linked to gold imports, led to various import taxes being introduced, which unsettled the domestic market for gold in 2016. The Indian government also introduced measures in 2016 to reduce undeclared income, including a demonetisation policy put in place in November 2016. Although gold imports temporarily increased when the Indian government announced its decision to retire the 500-rupee and 1,000-rupee bank notes, as soon-to-be obsolete notes were used to buy gold, gold imports registered a 55 percent decline by value the following month due to the lack of liquidity resulting from the demonetisation. These and similar policies in India, China or other large gold-importing countries could adversely affect demand for, and consequently prices of, gold.
Furthermore, the shift in demand from physical gold to gold-related investments and speculative instruments may exacerbate the volatility of the gold price. For example, the Finance Ministry in India announced an offering of sovereign gold bonds as an alternative to the purchase of physical gold in March 2015 and conducted several follow-on offerings in 2016. This and other policies of the Indian government contributed to a 22 percent decline in gold jewellery demand in India between 2015 and 2016. Slower consumption of physical gold in India, resulting from a move toward gold-tracking investments or otherwise, may have an adverse impact on global demand for, and prices of, bullion.
A sustained period of significant gold price volatility may adversely affect the company’s ability to evaluate the feasibility of undertaking new capital projects or the continuity of existing operations, to meet its operational targets or to make other long-term strategic decisions. Lower and more volatile gold prices, together with other factors, have led AngloGold Ashanti to alter its expansion and development strategy and consider ways to align its asset portfolio to take account of such expectations and trends. As a result, the company may decide to curtail or temporarily or permanently shut down certain of its exploration and production operations, which may be difficult and costly to effect. A further sustained decrease in the price of gold could also have a material adverse effect on AngloGold Ashanti’s financial condition and results of operations, as it may be unable to quickly adjust its cost structure to reflect the reduced gold price environment. Mines with marginal headroom may be subject to decreases in value that are not temporary, which may result in impairment losses. See “-Certain factors may affect AngloGold Ashanti’s ability to support the carrying amount of its property, plant and equipment, intangible assets and goodwill on the balance sheet. If the carrying amount of its assets is not recoverable, AngloGold Ashanti may be required to recognise an impairment charge, which could be significant.” The market value of gold inventory may be reduced and marginal stockpile and heap leach inventories may be written down to net realisable value or may not be processed further as it may not be economically viable at lower gold prices. In addition, AngloGold Ashanti is obliged to meet certain financial covenants under the terms of its borrowing facilities and its ability to continue to meet these covenants could be adversely affected by a further sustained decrease in the price of gold. The use of lower gold prices in Ore Reserve estimates and life of mine plans could also result in material impairments of the company’s investment in mining properties or a reduction in its Ore Reserve estimates and corresponding restatements of its Ore Reserve and increased amortisation, reclamation and closure charges.
The spot price of uranium has been volatile in past years. During 2017, the price varied between a low of approximately $19 per pound and a high of $27 per pound. On 19 March 2018, the spot price of uranium was $ 22 per pound.
In 2016, high inventory levels, an increase in the use of uranium enrichment at the expense of mined uranium and a slowdown in China’s uranium purchases caused uranium prices to continue a ten-year decline. Uranium prices can also be affected by several other factors, including demand for nuclear reactors, uranium production shortfalls and restocking by utilities. Additionally, events like those surrounding the earthquake and tsunami that occurred in Japan in 2011 can have a material adverse impact on the price of and demand for uranium.
The price of silver has also experienced significant fluctuations in past years.
During 2017, the price varied between a low of $15.58 per ounce and a high of $18.52 per ounce. On 19 March 2018, the price of silver was $16.30 per ounce.
Factors affecting the price of silver include investor demand, physical demand for silver bars, industrial and retail off-take, and silver coin minting.
22
If revenue from sales of gold, uranium, silver or sulphuric acid falls below their respective cost of production for an extended period, AngloGold Ashanti may experience losses and curtail or suspend some or all of its exploration projects and existing operations or sell underperforming assets. Declining commodities prices may also force a reassessment of the feasibility of a particular project or projects, which could cause substantial delays or interrupt operations until the reassessment can be completed.
Foreign exchange fluctuations could have a material adverse effect on AngloGold Ashanti’s results of operations and financial condition.
Gold is principally a U.S. dollar-priced commodity and most of the company’s revenues are realised in, or linked to, U.S. dollars, whilst cost of sales are largely incurred in the local currency where the relevant operation is located. Given the company’s global operations and local foreign exchange regulations, some of its funds are held in local currencies, such as the South African rand, Ghanaian cedi, Brazilian real, Argentinian peso and the Australian dollar. The weakness of the U.S. dollar against local currencies results in higher cost of sales in U.S. dollar terms. Conversely, the strengthening of the dollar lowers local cost of sales in U.S. dollar terms.
From time to time, AngloGold Ashanti may implement currency hedges intended to reduce volatility in our foreign currency exposure. Such hedging strategies may not be successful, and any of AngloGold Ashanti unhedged exchange payments will continue to be subject to market fluctuations.
Exchange rate movements may have a material impact on AngloGold Ashanti’s operating results
.
For example, based on average exchange rates received in 2017, the company estimates that a one percent strengthening of all of the South African rand, Brazilian real, the Argentinian peso or the Australian dollar against the U.S. dollar will, other factors remaining equal, result in an increase in total cash costs of approximately $6.0 per ounce.
The profitability of mining companies’ operations and the cash flows generated by these operations are significantly affected by fluctuations in input production prices, many of which are linked to the prices of oil and steel.
Fuel, energy and consumables, including diesel, heavy fuel oil, chemical reagents, explosives, tyres, steel and mining equipment used or consumed in mining operations form a relatively large part of the operating costs and capital expenditure of any mining company.
AngloGold Ashanti has no influence over the cost of these consumables, many of which are linked to some degree to the price of oil and steel. Whilst, from time to time, AngloGold Ashanti may implement diesel hedges intended to reduce exposure to changes in the oil price, such hedging strategies may not always be successful, and any of the company’s unhedged diesel consumption will continue to be subject to market fluctuations.
The price of oil has fluctuated between $54 and $64 per barrel of Brent Crude in 2017. As of 19 March 2018, the price of oil was at $64 per barrel of Brent Crude. AngloGold Ashanti estimates that for each U.S. dollar per barrel rise or fall in the oil price, other factors remaining equal, total cash costs of all its operations change by approximately $1.00 per ounce. The total cash costs of certain of the company’s mines, particularly Sadiola, Siguiri, Geita, Tropicana, Iduapriem and Kibali are most sensitive to changes in the price of oil. Even when fuel prices are in decline, expected savings may be partly offset by increases in governments’ fixed fuel levies or the introduction by governments of new levies. For example, in Tanzania, fuel duty claims are required to be submitted after consumption of the related fuel and are subject to authorisation by the Customs and Excise authorities. The Minister of Finance and Economic Affairs revoked the Government Notice No. 480 of 2000, as from 1 July 2009. The notice applies to the excise duty exemption on fuel products granted to mining companies. While Anglogold Ashanti believes that this will not affect its status to claim exemption on fuel duty as the duty relief is protected by the Mine Development Agreement (MDA) there can be no assurance of protection under the MDA with respect to future changes to this or other duty exemptions. This has resulted in a cumulative cost impact at AngloGold Ashanti's Geita mine of approximately $25million.
Furthermore, the price of steel has also been volatile. Steel is used in the manufacture of most forms of fixed and mobile mining equipment, which is a relatively large contributor to the operating costs and capital expenditure of a mine. For example, in 2016 the price of flat hot rolled coil (North American Domestic FOB) steel traded between $379 per tonne as of 1 January 2016 and $630 per tonne as of 29 June 2016. On 19 March 2018, the price of flat hot rolled coil (North American Domestic FOB) was $822 per tonne.
Fluctuations in oil and steel prices have a significant impact on operating costs and capital expenditure estimates and, in the absence of other economic fluctuations, could result in significant changes in the total expenditure estimates for new mining projects or render certain projects non-viable, which could have a material adverse impact on the company’s results of operations and financial condition.
Energy cost increases and power fluctuations and stoppages could adversely impact the company’s results of operations and financial condition.
Increasing global demand for energy, concerns about nuclear power and the limited growth of new supply are impacting the price and supply of energy. The transition of emerging markets to higher energy consumption, actual and proposed taxation of carbon
23
emissions as well as unrest and potential conflict in the Middle East, amongst other factors, could result in increased demand or constrained supply and sharply escalating oil and energy prices.
AngloGold Ashanti’s mining operations are substantially dependent upon electrical power generated by local utilities or by power plants situated at some of its operations. The unreliability of these local sources of power can have a material adverse effect on the company’s operations, as large amounts of power are required for ventilation, exploration, development, extraction, processing and other mining activities on the company’s properties.
In South Africa, the company’s operations are dependent on electricity supplied by Eskom, a state-owned power generation company. Although other competitors in the renewable energy market have now entered the power supply market, the power supply is still channelled through the Eskom infrastructure. Electricity is used for most of our business and safety-critical operations, including cooling, hoisting and dewatering. Loss of power can therefore impact production and employee safety, and prolonged outages could lead to flooding of workings and ore sterilisation. In 2008, Eskom and the South African government declared a national emergency and warned that they could no longer guarantee the availability of electricity due to a national supply shortage which at the time was blamed on coal supply shortages, heavy rainfall and unplanned generation-set outages as a result of maintenance backlog and asset ages. The entire country went into a programme of rolling blackouts and AngloGold Ashanti and other mining companies operating in South Africa were forced in late January until mid-March of 2008 to curtail power consumption which negatively impacted operational performance.
A warning of the “very high” risk of blackouts was reissued at the start of 2011 and each year until 2015. On 20 February 2014, Eskom declared a power emergency pursuant to its regulatory protocols to protect the national electricity grid. The power emergency was caused by the loss of additional generating units, a 1,500MW reduction in imported electricity resulting from the failure of power lines at the Cahora Bassa hydro scheme in Mozambique and the extensive use of emergency reserves. Eskom alerted key industrial customers, including AngloGold Ashanti, asking them to reduce their load by a minimum of 10 percent during critical periods. Since February 2014, AngloGold Ashanti has reduced its electricity consumption in South Africa by more than 10 percent measured in Gigawatt hour usage. In November 2014, Eskom reintroduced a schedule of rolling blackouts, or “load shedding”. Although the last blackout was imposed in 2015, Eskom cannot guarantee that there will be no power interruptions in the future and the company's management expects that these interruptions may resume in the future. Since 2015, the company's South African region has been able to negotiate this period of load shedding with no impact on production due to curtailments using strict energy management and controls.
Since the beginning of 2017, the integrity of power supply to the company’s South African operations has improved due to Eskom's accelerated maintenance schedules and improved reliability as a result of reduced national demand for electricity. The reduced demand is on the back of high tariff increases and the poor economic growth rates experienced over this period.
Eskom and the National Energy Regulator of South Africa (NERSA) recognise the need to increase electricity supply capacity, and a series of tariff increases and proposals have been enacted since 2010 to assist in the funding of this expansion. In 2013, NERSA announced that Eskom would be allowed to increase electricity tariffs for the five-year period that began in April 2013 at an average yearly increase of 8 percent, which was half of that sought by the utility in its application. However, in October 2014, NERSA granted a 12.69 percent increase in electricity prices with effect from April 2015. In early 2016, NERSA heard a second application from Eskom to increase tariffs and an increase of 9.4 percent was granted, effective 1 April 2016. A lower increase of 2.2 percent was approved in February 2017, effective 1 April 2017, but greater tariff increases are expected to be imposed in future years. In June 2017, Eskom announced to consumers that it was aiming for a 19.9 percent tariff increase for 2018 on the back of lower sales and higher costs. On 18 December 2017, after a series of public hearings into the request from Eskom, NERSA rejected their application and granted them an increase of only 5.23 percent stating that Eskom needed to change its operating model and reduce costs for the benefit of the South African economy.
There can be no assurance as to the existence or nature of any government intervention with respect to tariff increases in the future. Other difficulties at Eskom, relating to a large financial deficit, may result in additional tariff increases.
Additionally, Eskom has been mired in allegations of corruption and is the subject of a parliamentary investigation which has implicated a number of its highest ranking executives. It is also running out of working capital, according to reports. As energy represents a large proportion of the company's operating costs in South Africa, these tariff increases have had, and any future increases will have, a materially adverse impact on the total cash costs of its South Africa operations
The company has also identified a risk of energy shortages in Ghana and Brazil. The company’s mining operations in Ghana depend on hydroelectric power supplied by the state-controlled Volta River Authority (VRA), which is supplemented by thermal power from the Takoradi plant and a smaller unit at Tema. AngloGold Ashanti negotiates rates directly with the VRA to power the Obuasi mining operations and the VRA may not agree to a satisfactory rate during future rounds of negotiations. AngloGold Ashanti procures electricity for Iduapriem from the Electricity Company of Ghana (ECG) which is supplied by the VRA.
Ghana has a major power generation deficit that has resulted in significant load shedding across the country. For example, the company experienced extended power interruptions in Ghana in the first quarter of 2014, which limited access to higher grade areas. It also experienced frequent load shedding at Iduapriem in 2015, at times experiencing multiple outages in a single day. During periods of below average inflows from the Volta reservoir, electricity supplies from the Akosombo Dam, the VRA’s primary
24
generation source, may be curtailed as occurred in 1998, 2003, 2006, 2007 and 2016. During periods of limited electricity availability, the grid is subject to disturbances and voltage fluctuations which can damage equipment. Disruptions in the natural gas supply from Nigeria in March 2015, via the West Africa Gas Pipeline, have led to some reduction in thermal generation capacity and the use of more expensive light crude oil, which is putting upward pressure on power tariffs. In the past, the VRA has obtained power from neighbouring Côte d’Ivoire, which has intermittently experienced political instability and civil unrest.
In Brazil, a two-year drought in 2014 and 2015 adversely affected hydro-electrical power generation. Similar water shortages in the future could have an adverse impact on AngloGold Ashanti’s operations in Brazil.
The company’s mining operations in Guinea, Tanzania and Mali are dependent on power supplied by outside contractors and supplies of fuel are delivered by road. Power supplies in these countries have been disrupted in the past, resulting in production losses due to equipment failure.
Increased energy prices could negatively impact operating costs and cash flow of AngloGold Ashanti’s operations.
Global economic conditions could adversely affect the profitability of operations.
AngloGold Ashanti’s operations and performance depend significantly on worldwide economic conditions. Despite signs of economic recovery in certain geographic markets, global economic conditions remain fragile with significant uncertainty regarding recovery prospects, levels of recovery and long-term economic growth effects. Concerns remain regarding the sustainability and future of the European Monetary Union and its common currency, the Euro, in their current form, particularly following the vote in favour of the United Kingdom’s exit from the European Union in June 2016 and the official triggering by the British Prime Minister, Theresa May, of the "Brexit" process in March 2017 and the uncertainty of the resulting terms of the withdrawal and subsequent negotiations. Concerns also exist regarding the negative impacts of the downgrade of the sovereign credit rating of the Republic of South Africa in recent years.
On 24 November 2017, S&P Global downgraded South Africa’s credit rating to full sub-investment grade, while its counterpart Moody’s placed the country on review for downgrade. S&P’s announcement followed a similar announcement by Fitch, affirming South Africa’s rating at sub-investment grade on 23 November 2017. Moody’s decision to put South Africa on review, rather than downgrade it outright, means that South Africa can remain in key global bond indices such as the Citigroup World Bond Index (WGBI). Moody’s held South Africa local and foreign issued debt on the cusp of investment and sub-investment grade. Membership in the WGBI requires that at least Moody’s or S&P Global rates a country’s local currency rating as investment grade. Moody's on 23 March 2018 affirmed South Africa's investment-grade credit rating at Baa3 and revised its credit outlook to stable from negative.
These conditions and other disruptions to international credit markets and financial systems caused a loss of investor confidence and resulted in widening credit spreads, a lack of price transparency, increased credit losses and tighter credit conditions. Although aggressive measures taken by governments, the private sector and central banks have resulted in a modest economic recovery since 2012, any such recovery may remain limited in geographic scope. A significant risk also remains that this recovery could be slow or that the global economy could quickly fall back into an even deeper and longer lasting recession or even a depression. In 2014 and 2015, the credit ratings of some of the largest South African banks were downgraded by major credit rating agencies. Any significant weakening of the South African banking system could have a negative effect on the overall South African economy including the results of the company's South African operations.
Global economic turmoil, or the expectation that economic turmoil could worsen, could have follow-on effects on AngloGold Ashanti’s business that include inflationary cost pressures, interest rate fluctuations and commodity market fluctuations. Other effects that could negatively affect AngloGold Ashanti’s financial results and results of operations include, for example:
|
•
|
the insolvency of key suppliers or contractors, which could result in contractual breaches and a supply chain breakdown;
|
|
•
|
the insolvency of one or more joint venture partners, which could result in contractual breaches and disruptions at the operations of the company’s joint ventures;
|
|
•
|
changes in other income and expense, which could vary materially from expectations, depending on gains or losses realised on the sale or exchange of financial instruments and impairment charges that may be incurred with respect to investments;
|
|
•
|
the inability of AngloGold Ashanti’s defined benefit pension fund to achieve expected returns on its investments, which could require the company to make substantial cash payments to fund any resulting deficits;
|
|
•
|
a reduction in the availability of credit, which may make it more difficult for the company to obtain financing for its operations and capital expenditures or make that financing more costly;
|
|
•
|
exposure to the liquidity and insolvency risks of the company’s lenders and customers; and
|
|
•
|
impairment of operations.
|
In addition to the potentially adverse impact on the profitability of the company’s operations, any deterioration in or increased uncertainty regarding global economic conditions may increase volatility or negatively impact the market value of AngloGold Ashanti’s securities.
25
Inflation may have a material adverse effect on results of operations.
Many of AngloGold Ashanti’s operations are located in countries that have experienced high rates of inflation during certain periods. It is possible that significantly higher future inflation in the countries in which the company operates may result in an increase in operational costs in local currencies (without a concurrent devaluation of the local currency of operations against the dollar or an increase in the dollar price of gold). This could have a material adverse effect on the company’s results of operations and financial condition. Significantly higher and sustained inflation, with a consequent increase in operational costs, could result in the rationalisation (including closure) of higher cost mines or projects.
Of particular concern is the inflation rate in Argentina which increased from an average of 10 percent in 2012 to 40.5 percent in 2016. Using IMF data, AngloGold Ashanti has determined that Argentina was not highly inflationary at 17.8 percent for the year ended 31 December 2017. If inflation reaches highly inflationary levels, social unrest and union activity may increase in Argentina, and this may have an adverse effect on AngloGold Ashanti’s operational costs and results of operation in that country.
Mining companies face many risks related to the development of mining projects that may adversely affect the company’s results of operations and profitability.
Development of AngloGold Ashanti’s mining projects may be subject to unexpected problems and delays that could increase the development and operating costs of the relevant project. In addition, a decrease in budgets relating to current or medium-term exploration and development could increase the company's development and operating costs in the long-term.
There are a number of uncertainties inherent in the development and construction of a new mine or the extension of an existing mine. These uncertainties include the:
|
•
|
timing and cost of construction of mining and processing facilities, which can be considerable;
|
|
•
|
availability and cost of mining and processing equipment;
|
|
•
|
availability and cost of skilled labour, power, water and transportation;
|
|
•
|
availability and cost of appropriate smelting and refining arrangements;
|
|
•
|
applicable requirements under national and municipal laws and time needed to obtain the necessary environmental and other governmental permits; and
|
|
•
|
availability of funds to finance construction, development and environmental rehabilitation activities.
|
The remote location of many mining properties, permit requirements and delays in the issuance of the necessary permits, third-party legal challenges to individual mining projects and broader social or political opposition to mining may increase the cost, timing and complexity of mine development and construction. New mining operations could experience unexpected problems and delays during the development, construction, commissioning and commencement of production.
For example, AngloGold Ashanti may prove unable to successfully develop the La Colosa and Gramalote projects and the Nuevo Chaquiro deposit that is part of the Quebradona project in Colombia as well as other potential exploration sites due to difficulties that could arise in relation to, for example, social and community opposition, litigation and governmental regulatory or administrative proceedings, the classification of land covered by mining titles as an environmentally-protected area, ore body grades, definition of adequate Ore Reserve and Mineral Resource and the time taken to prove project feasibility that could result in the expiry of permits. See “-Mining companies are subject to extensive environmental laws and regulations” and “Item 8A: Legal Proceedings - Colombia”.
Accordingly, AngloGold Ashanti’s future development activities may not result in the expansion or replacement of current production, or one or more new production sites or facilities may be less profitable than anticipated or may be loss-making. The company’s operating results and financial condition are directly related to the success of its project developments. A failure in the company’s ability to develop and operate mining projects in accordance with, or in excess of, expectations could negatively impact its results of operations, as well as its financial condition and prospects.
Mining companies face uncertainty and risks in exploration, feasibility studies and other project evaluation activities.
AngloGold Ashanti must continually replace Ore Reserve depleted by mining and production to maintain or increase production levels in the long term. This is undertaken by exploration activities that are speculative in nature. The ability of the company to sustain or increase its present levels of gold production depends in part on the success of its projects and it may be unable to sustain or increase such levels.
Feasibility studies and other project evaluation activities necessary to determine the current or future viability of a mining operation are often unproductive. Such activities often require substantial expenditure on exploration drilling to establish the presence, extent and grade (metal content) of mineralised material. AngloGold Ashanti undertakes feasibility studies to estimate the technical and economic viability of mining projects and to determine appropriate mining methods and metallurgical recovery processes. These activities are undertaken to estimate the Ore Reserve.
26
Once mineralisation is discovered, it may take several years to determine whether an adequate Ore Reserve exists, during which time the economic feasibility of the project may change due to fluctuations in factors that affect both revenue and costs, including:
|
•
|
future prices of metals and other commodities;
|
|
•
|
future foreign currency exchange rates;
|
|
•
|
the required return on investment as based on the cost and availability of capital; and
|
|
•
|
applicable regulatory requirements, including those relating to environmental or health and safety matters.
|
Feasibility studies also include activities to estimate the anticipated:
|
•
|
tonnages, grades and metallurgical characteristics of the ore to be mined and processed;
|
|
•
|
recovery rates of gold, uranium and other metals from the ore; and
|
|
•
|
capital expenditure and cash operating costs.
|
These estimates depend on assumptions made based on available data. Ore Reserve estimates are not precise calculations and depend on the interpretation of limited information on the location, shape and continuity of the mineral occurrence and on available sampling results. For example, in February 2018, AngloGold Ashanti announced the maiden Ore Reserve for the Gramalote project, following the completion of an enhanced pre-feasibility study. No assurance can be given that Ore Reserve estimates or other estimates are accurate or that the indicated levels of gold, uranium or other mineral will be produced. Further exploration and feasibility studies can result in new data becoming available that may change previous Ore Reserve estimates and impact the technical and economic viability of production from the project. Changes in the forecast prices of commodities, exchange rates, production costs or recovery rates may change the economic status of Ore Reserves resulting in revisions to previous Ore Reserve estimates. These revisions could impact depreciation and amortisation rates, asset carrying amounts and/or provisions for closure, restoration and environmental rehabilitation costs.
AngloGold Ashanti undertakes annual revisions to its Ore Reserve estimates based upon asset sales and acquisitions, actual exploration and production results, depletion, new information on geology, model revisions and fluctuations in production, forecasts of commodity prices, economic assumptions and operating and other costs. These factors may result in reductions in Ore Reserve estimates, which could adversely affect life-of-mine plans and consequently the total value of the company’s mining asset base. Ore Reserve restatements could negatively affect the company’s results of operations, as well as its financial condition and prospects.
Due to a declining rate of discovery of new gold Ore Reserve in recent years, AngloGold Ashanti faces intense competition for the acquisition of attractive mining properties. From time to time, the company evaluates the acquisition of an Ore Reserve, development properties or operating mines, either as stand-alone assets or as part of existing companies. AngloGold Ashanti’s decision to acquire these properties has been based on a variety of factors, including historical operating results, estimates and assumptions regarding the extent of the Ore Reserve, cash and other operating costs, gold prices, projected economic returns and evaluations of existing or potential liabilities associated with the relevant property and its operations and how these factors may change in the future. Other than historical operating results, these factors are uncertain and could have an impact on revenue, cash and other operating costs, as well as the process used to estimate the Ore Reserve.
As a result of these uncertainties and declining grades, the company’s exploration and acquisitions may not result in the expansion or replacement of current production, the maintenance of its existing Ore Reserve net of production or yield an increase in Ore Reserve. AngloGold Ashanti’s results of operations and financial condition are directly related to the success of its exploration and acquisition efforts and the ability to replace or increase the existing Ore Reserve as it is depleted. If the company is not able to maintain or increase its Ore Reserve, its results of operations as well as its financial condition and prospects could be adversely affected.
Mining companies face many potential disruptions to their operations, which may adversely impact cash flows and overall profitability.
Gold mining is susceptible to events that may adversely impact a mining company’s ability to produce gold and meet production and cost targets. These events include, but are not limited to:
|
•
|
accidents or incidents, including due to human error, during exploration, production or transportation resulting in injury, loss of life or damage to equipment or infrastructure;
|
|
•
|
air, land and water pollution;
|
|
•
|
social or community disputes or interventions;
|
|
•
|
security incidents;
|
|
•
|
surface or underground fires or explosions;
|
|
•
|
electrocution;
|
|
•
|
falls from heights and accidents relating to mobile machinery, including shaft conveyances and elevators, drilling blasting and mining operations;
|
|
•
|
labour force disputes and disruptions;
|
|
•
|
loss of information integrity or data;
|
|
•
|
activities of illegal or artisanal miners;
|
|
•
|
shortages in material and equipment;
|
|
•
|
mechanical failure or breakdowns and ageing infrastructure;
|
|
•
|
failure of unproven or evolving technologies;
|
|
•
|
energy and electrical power supply interruptions or rationing;
|
27
|
•
|
unusual or unexpected geological formations, ground conditions, including lack of mineable face length and ore-pass blockages;
|
|
•
|
water ingress and flooding;
|
|
•
|
process water shortages;
|
|
•
|
metallurgical conditions and gold recovery;
|
|
•
|
unexpected decline of ore grade;
|
|
•
|
unanticipated increases in gold lock-up and inventory levels at heap-leach operations;
|
|
•
|
fall-of-ground accidents in underground operations;
|
|
•
|
cave-ins, sinkholes, subsidence, rock falls, rock bursts or landslides;
|
|
•
|
failure of mining pit slopes, heap-leach facilities, water or solution dams, waste stockpiles and tailings dam walls;
|
|
•
|
changes to legal and regulatory requirements;
|
|
•
|
safety-related stoppages;
|
|
•
|
gold bullion or concentrate theft;
|
|
•
|
corruption and fraud;
|
|
•
|
allegations of human rights abuses;
|
|
•
|
seismic activity; and
|
|
•
|
other natural phenomena, such as floods, droughts or weather conditions, potentially exacerbated by climate change.
|
Any of these events could, individually or in the aggregate, have a material adverse effect on the company’s results of operations and financial condition.
Older mines in the South African region have started to reach the end of their economic lives, several decades after production started. These mines face various systemic challenges, including near-depletion of Ore Reserve, increasing depth and distance from central infrastructure, declining production profiles, and cost escalation that has continued to outpace both inflation and a subdued gold price. The cost performance of certain operations, notably TauTona and Kopanang, has clearly demonstrated these challenges, with all-in sustaining costs for 2017 of $2,242/oz and $1,593/oz respectively. This compared with an average annual gold price over that period of $1,258/oz. Both mines also sustained significant operating losses through 2017. In 2017, TauTona was placed in orderly closure and the sale of Kopanang was announced, with the transaction concluding subsequent to year end.
Seismic activity is of particular concern in underground mining operations, particularly in South Africa due to the extent and extreme depth of mining, and also in Australia and Brazil due to the depth of mining and residual tectonic stresses. Despite modifications to mine layouts and support technology, as well as other technological improvements employed with a view to minimising the incidence and impact of seismic activity, seismic events have caused death and injury to employees and contractors as well as safety-related stoppages and may do so in the future.
Seismic activity may also cause a loss of mining equipment, damage to or destruction of mineral properties or production facilities, monetary losses, environmental pollution and potential legal liabilities. As a result, these events may have a material adverse effect on AngloGold Ashanti’s results of operations and financial condition. For example, three rock burst accidents occurred at Mponeng mine during the last quarter of 2017, resulting in four employee fatalities in addition to production losses due to stoppages. The total production loss associated with the three incidents is approximately 14,000m
2
(approximately 800 kg of gold with an approximate value of $36 million).
In the past, floods have also disrupted the operations of some of the company’s mines. For example, unprecedented heavy rains in February and March 2011 in Australia flooded the Sunrise Dam Gold Mine and forced a temporary shutdown of operations. The flood impacted underground production for approximately four months and open pit production for approximately six months. Despite the shutdown, full costs were incurred as the mining contractors worked on remedial activities to repair damage and rehabilitate flooded areas. The considerable remedial work required adversely impacted cash costs per ounce and the impact of the flood event and the pit wall failure together significantly reduced planned production at the plant.
Any seismic, flood or other similar events that occur in the future could have a material adverse effect on the company’s results of operations and financial condition.
Mining companies’ operations are vulnerable to infrastructure constraints.
Mining, processing, development and exploration activities depend on adequate infrastructure. Reliable rail, ports, roads, bridges, power sources, power transmission facilities and water supply are critical to the company’s business operations and affect capital and operating costs. These infrastructures and services are often provided by third parties whose operational activities are outside the control of the company.
Interferences in the maintenance or provision of infrastructure, including unusual weather phenomena, sabotage and social unrest could impede the company’s ability to deliver its products on time and adversely affect AngloGold Ashanti’s business, results of operations and financial condition.
Establishing infrastructure for the company’s development projects requires significant resources, identification of adequate sources of raw materials and supplies, and necessary cooperation from national and regional governments, none of which can be assured.
28
AngloGold Ashanti has operations or potential development projects in countries where government-provided infrastructure may be inadequate and regulatory regimes for access to infrastructure may be uncertain, which could adversely impact the efficient operation and expansion of its business. AngloGold Ashanti may not secure and maintain access to adequate infrastructure in the future, or it may not do so on reasonable terms.
Mining companies face strong competition.
The mining industry is competitive in all of its phases. AngloGold Ashanti competes with other mining companies and individuals for specialised equipment, components and supplies necessary for exploration and development, for mining claims and leases on exploration properties and for the acquisition of mining assets. These competitors may have greater financial resources, operational experience and technical capabilities than AngloGold Ashanti. Competition may increase AngloGold Ashanti’s cost of acquiring suitable claims, properties and assets, which could have a material adverse effect on its financial condition.
Mining companies are subject to extensive health and safety laws and regulations.
AngloGold Ashanti’s mining operations are subject to extensive health and safety laws and regulations in every jurisdiction in which it operates. These laws and regulations are, along with international and industry standards, designed to protect and improve the safety and health of employees and require the company to undertake and fund extensive compliance measures.
From time to time, new or updated health and safety laws, regulations and standards are introduced and may be more stringent than those to which AngloGold Ashanti is currently subject. Should compliance with these laws, regulations and standards require a material increase in expenditures or material changes or interruptions to operations or production, including as a result of any failure to comply with applicable regulations, the company’s results of operations and financial condition could be adversely affected. Furthermore, AngloGold Ashanti continues to implement its enhanced safety programme, which could result in additional costs for the company.
In some of the jurisdictions in which AngloGold Ashanti operates, the government enforces compulsory shutdowns of operations to enable investigations into the cause of accidents. Certain of the company’s operations have been temporarily suspended for safety reasons in the past. In South Africa, so-called “Section 54 safety stoppages” have become a significant issue as an enforcement mechanism used by the Department of Mineral Resources Mining Inspectorate whose inspectors routinely issue such notices. For example, in 2017, 80 notices were issued that had a material adverse impact on production at the company’s mines. Section 54 safety stoppages resulted in the estimated direct loss of 47,100, 78,887, 73,208 and 11,324 ounces of gold production from the South African region operations during 2014, 2015, 2016 and 2017 respectively.
AngloGold Ashanti’s reputation could be damaged by any significant governmental investigation or enforcement of health and safety laws, regulations or standards. Any of these factors could have a material adverse effect on the company’s results of operations and financial condition.
Mining companies are increasingly required to operate in a sustainable manner and to provide benefits to affected communities. Failure to comply with these requirements can result in legal suits, additional operational costs to address violations or liabilities, investor divestment and loss of “social licence to operate”, and could adversely impact AngloGold Ashanti's financial condition.
As a result of public concern about the perceived ill effects of economic globalisation, businesses in general and large multinational mining corporations in particular face increasing public scrutiny of their activities.
These businesses are under pressure to demonstrate that whilst they seek a satisfactory return on investment for shareholders, human rights are respected and other social partners, including employees, host communities and more broadly, the countries in which they operate, also benefit from their commercial activities. Such pressures tend to be particularly focused on companies whose activities are perceived to have, or have, a high impact on their social and physical environment. The enhanced usage and scale of social media and other web-based tools to publish, share and discuss user-generated content further increases the potential spread and force of public scrutiny. The potential consequences of these pressures and the adverse publicity in cases where companies are believed not to be creating sufficient social and economic benefit may result in additional operating costs to address actual or perceived shortcomings, reputational damage, active community opposition, allegations of human rights abuses, legal suits and investor withdrawal.
Existing and proposed mining operations are often located at or near existing towns and villages, natural water courses and other infrastructure. As the impacts of dust generation, waste storage, water pollution or water shortages may be immediate and directly adverse to those communities, poor environmental management practices, or, in particular, adverse changes in the supply or quality of water can result in community protest, regulatory sanctions or ultimately in the withdrawal of community and government support for company operations. For example, following the outcome of the plebiscite held on 26 March 2017 in the Colombian municipality of Cajamarca, which hosts the company’s La Colosa exploration site, AngloGold Ashanti’s management has taken the decision to pause much of the current fieldwork around the project pending a study of the community’s opposition to the project on AngloGold Ashanti’s planned future investment. In the meantime, AngloGold Ashanti will continue the necessary engagement with all stakeholders to build consensus around the creation of a modern, environmentally responsible gold-mining industry in Colombia.
29
In the town of Piedras in the Tolima province, AngloGold Ashanti is contesting a referendum attempting to ban all mining activities in the area. See “Item 8A: Legal Proceedings”. Similar votes or referenda may be conducted in the future in these or other locations in Colombia where we have mining licenses. These votes and referenda or future votes or referenda could have an adverse impact on AngloGold Ashanti’s reputation, its ability to develop its mining concessions in Colombia, and its results of operations and financial condition.
Mining operations must be designed to minimise their impact on such communities and the environment, either by changing mining plans to avoid such impact, by modifying operations or by relocating the affected people to an agreed location. Responsive measures may also include the full restoration of the livelihoods of those impacted. In addition, AngloGold Ashanti is obliged to comply with the terms and conditions of all the mining rights it holds. In this regard the Social and Labour plan provisions of its mining rights in South Africa must make provision for local economic development (LED) programmes. The LED programmes must take into account the key economic activities of the area in which AngloGold Ashanti operates its mines, the impact its mines will have on the local and labour-sending communities, various infrastructure and poverty eradication projects its mines may be supporting in connection with integrated development plans in the areas its mines operate and also must provide for measures that assist in addressing housing and living conditions of its employees.
In addition, as AngloGold Ashanti has a long history of mining operations in certain regions, issues may arise regarding historical, as well as potential future, environmental or health impacts in those areas. For example, certain parties, including non-governmental organisations, community groups and institutional investors, have raised concerns and, in the case of some individuals in Obuasi, threatened or commenced litigation, relating to air pollution or surface and groundwater quality, amongst other issues, in the area surrounding the company’s Obuasi and Iduapriem mines in Ghana, including potential impacts to local rivers and wells used for water from heavy metals, arsenic and cyanide as well as sediment and mine rock waste.
Disputes with surrounding communities may also affect mining operations, particularly where they result in restrictions of access to supplies and to mining operations. The miners’ access to land may be subject to the rights or asserted rights of various community stakeholders, including indigenous people. Access to land and land use is of critical importance to the company for exploration and mining, as well as for ancillary infrastructure. In some cases, AngloGold Ashanti has had difficulty gaining access to new land because of perceived poor community compensation practices. For example, compensation remains a significant area of concern in Siguiri in Guinea. In 2011, a violent community protest interrupted operations for three days, which contributed to the operation’s decline in production as compared to 2010, and protests demanding employment by the communities and youth occurred again in 2016. Delays in projects attributable to a lack of community support can translate directly into a decrease in the value of a project or into an inability to bring the project to production.
The cost of measures and other issues relating to the sustainable development of mining operations could place significant demands on personnel resources, could increase capital and operating costs and could have an adverse impact on AngloGold Ashanti’s reputation, results of operations and financial condition.
Mining companies are subject to extensive environmental laws and regulations.
AngloGold Ashanti’s operations are subject to extensive environmental laws and regulations in the various jurisdictions in which it operates, in addition to international standards. These regulations and standards establish limits and conditions on the company’s ability to conduct its operations and govern, amongst other things, extraction, use and conservation of water resources; air emissions (including dust control); water treatment and discharge; regulatory and community reporting; clean-up of contamination; land use and conservation of protected areas; community health; and the generation, transportation, storage and disposal of solid and hazardous wastes, such as reagents, radioactive materials and mine tailings.
The cost of compliance with environmental laws and regulations is expected to continue to be significant to AngloGold Ashanti. AngloGold Ashanti could incur fines, penalties and other sanctions, clean-up costs and third-party claims for personal injury or property damage, suffer reputational damage, or be required to install costly pollution control equipment or to modify or suspend operations, as a result of actual or alleged violations of environmental laws and regulations or the terms of AngloGold Ashanti’s permits.
Closure of a mine could trigger or accelerate obligations, including the conduct of environmental rehabilitation activities and/or to address historical impacts on environmental quality in the area surrounding the mine. Costs incurred by the company in excess of AngloGold Ashanti’s existing provisions for such matters, or on a more accelerated or compressed timeline than currently anticipated, and the timing thereof could have a material adverse impact on AngloGold Ashanti’s results of operations and financial condition.
Failure to comply with applicable environmental laws and regulations may also result in the suspension or revocation of operating permits. AngloGold Ashanti’s ability to obtain and maintain permits and to successfully operate in particular communities may be adversely impacted by real or perceived effects on the environment or human health and safety associated with AngloGold Ashanti’s or other mining companies’ activities.
30
For example, in Colombia, various plaintiffs, including the government and various associations that represent local communities, brought legal proceedings against AngloGold Ashanti Colombia S.A. (AGAC) alleging that AGAC violated applicable environmental laws in connection with the La Colosa project. In one such proceeding, AGAC filed an action against the Colombian Department of the Environment, Housing and Territorial Development (DoE) after the DoE issued a fine of $70,000 against the company. Following a series of appeals, in January 2017 the appellate court reinstated the fine against the company. Although the amount of the fine is not significant, the finding that the company breached environmental laws could be used as the basis for legal action by the government that could prohibit AGAC from doing business with the Colombian government for a period of five years. As a result, AGAC’s three core concession contracts relating to the La Colosa project may be cancelled. AGAC would be required to abandon the La Colosa project and all other existing mining concession contracts and pending proposals for new mining concession contracts of AGAC, though not those of other companies of the AngloGold Ashanti group operating in Colombia. AGAC is currently evaluating its options with respect to this matter. Separately, in October 2016, Tolima’s Administrative Court ordered that a technical study be prepared by April 2017 to determine whether the La Colosa project presents a “threat” to the environment during its exploration phase. In December 2017, Ibaque's Third Administrative Court ordered a similar technical study. AGAC is in the process of appealing these orders, but if such threat is determined to exist, certain activities at La Colosa may be suspended. See “Item 8A: Legal Proceedings”.
In addition, unknown environmental hazards may exist on the company's properties which may have been caused by previous owners or operators. An incident at AngloGold Ashanti's operations could lead to the imposition of legal obligations, including the remediation of environmental contamination and claims for property damage and personal injury from adjacent communities. Incidents at AngloGold Ashanti's operations, or other mining companies' operations, could result in the tightening of regulatory requirements and restrictions that are applicable to AngloGold Ashanti's mining operations. For example, brief gold processing stoppages after environmental incidents, such as pipeline failures or deficiencies in water management systems, have occurred at AngloGold Ashanti's Obuasi mine in Ghana.
Environmental laws and regulations are continually changing and are generally becoming more stringent. Changes to AngloGold Ashanti’s environmental compliance obligations or operating requirements could adversely affect the company’s rate of production and revenue. Variations in laws and regulations, assumptions made to estimate liabilities, standards or operating procedures, more stringent emission or pollution thresholds or controls, or the occurrence of unanticipated conditions, may require operations to be suspended or permanently closed, and could increase AngloGold Ashanti’s expenses and provisions. These expenses and provisions could adversely affect the company’s results of operations and financial condition.
For example, the use of hazardous materials in metallurgical processing remains under constant scrutiny. As there are few, if any, effective substitutes in extracting gold from the ore, any ban or material restrictions on the use of materials in mining operations in the jurisdictions where AngloGold Ashanti conducts its operations could adversely affect the company’s results of operations and financial condition. In addition, leaks or discharges of hazardous materials could result in liabilities for clean-up or personal injury that may not be covered by insurance.
AngloGold Ashanti’s operations are heavily dependent upon access to substantial volumes of water for use in the mining and extractive processes and typically are subject to water-use permits that govern usage and require, amongst other things, that mining operations maintain certain water quality upon discharge. Water quality and usage are areas of concern globally, such as with respect to the company’s mining operations in Ghana and South Africa and its exploration projects in Colombia, where there is significant potential environmental and social impact and a high level of stakeholder scrutiny. Any failure by the company to secure access to suitable water supplies, or achieve and maintain compliance with applicable requirements of the permits or licenses, could result in curtailment or halting of production at the affected operations. Incidents of water pollution or shortage can, in certain cases, lead to community protest and ultimately to the withdrawal of community and government support for AngloGold Ashanti’s operations. A failure by the company to comply with water contamination rehabilitation directives may result in further, more stringent, directives being issued against the company, which may, in some cases, result in a temporary or partial shutdown of some of the company’s operations.
Mining and mineral processing operations generate waste rock and tailings. The impact of dust generation, breach, leak, or failure of a waste rock or tailings storage facility, can be significant. An incident at AngloGold Ashanti’s operations could lead to, amongst others, obligations to remediate environmental contamination and claims for property damage and personal injury from adjacent communities. Incidents at other mining companies’ operations could result in governments tightening regulatory requirements and restricting mining activities.
Mining companies are required by law to close their operations at the end of the mine life and rehabilitate the impacted areas. Estimates of the total ultimate closure, reclamation and rehabilitation costs for gold mining operations are significant and based principally on life-of-mine profiles, changing inflation and discount rate assumptions, changing infrastructure and facilities design and current legal and regulatory requirements that may change materially. Environmental liabilities are accrued when they become known, are probable and can be reasonably estimated. Increasingly, regulators are seeking security in the form of cash collateral or bank guarantees in respect of environmental obligations. For example, in South Africa, regulations require mining companies to make financial provisions for rehabilitation for at least 10 years. The Department of Environmental Affairs (DEA) postponed the compliance deadline for the National Environmental Management Act (NEMA) Financial Provisioning Regulations to February 2019 and acknowledged challenges identified by the industry in collaboration with the Chamber of Mines. The costs required to comply with these obligations and any similar ones enacted in other jurisdictions may have an adverse impact on the company’s financial condition.
31
AngloGold Ashanti’s provisions for decommissioning and for restoration (excluding joint ventures) totalled $851 million in 2014, $683 million in 2015 (following the sale of CC&V), $705 million in 2016 and $695 million in 2017. Costs associated with rehabilitating land disturbed by mining processes and addressing environmental, health and community issues are estimated and financial provision made based upon current available information based on our commitments in terms of environmental legislation or agreements with government. Estimates notably relate to discount rates, which may vary due to changes in global economic assumptions, and mine plans, which may change in line with variations in cash flows, designs of tailings storage facilities and methodologies used to compute liabilities (including as a result of a request from environmental regulatory authorities). Estimates may, however, be insufficient and further costs may be identified at any stage that may exceed the provisions that AngloGold Ashanti has made. Any underestimated or unidentified rehabilitation costs would reduce earnings and could materially and adversely affect the company’s asset values, earnings and cash flows. Further, sudden changes in a life of mine plan or the accelerated closure of a mine may give rise to the recognition of additional liabilities that are not anticipated.
Compliance with emerging climate change regulations could result in significant costs and climate change may present physical risks to a mining company’s operations.
Greenhouse gases (GHGs) are emitted directly by AngloGold Ashanti’s operations, as well as by external utilities from which AngloGold Ashanti purchases electricity. A number of international and national measures to address or limit GHG emissions are in various phases of discussion or implementation in the countries in which the company operates. As a result of commitments made at the UN climate conference in Durban, South Africa in December 2011, certain members of the international community negotiated a treaty at the December 2015 Conference of Parties in Paris. The Paris Agreement, which requires developed countries to set targets for emissions reductions, came into force on 4 November 2016. Additional measures addressing GHG emissions may be implemented at the national or international levels. For example, in South Africa, National Treasury issued the second draft Carbon Tax Bill, on 14 December 2017. The implementation date of the carbon tax will be determined by the Minister of Finance, and is expected through an announcement in 2018, or at the Budget 2019, taking into account the state of the economy. The tax will be phased in with the first phase ending in 2022 and the impact in the first phase designed to be revenue-neutral in terms of its aggregated impact, given the complementary tax energy incentives and reduction or credit for the current electricity levy. In addition, South Africa ratified the Paris Agreement in November 2016 and endorsed its nationally-determined contribution, which requires that greenhouse gas emissions peak in 2020 to 2025, plateau from 2025 to 2035 and decline from 2036 onwards.
These, or future, measures could require AngloGold Ashanti to reduce its direct GHG emissions or energy use or to incur significant costs for GHG emissions permits or taxes or have these costs or taxes passed on by electricity utilities which supply the company’s operations. AngloGold Ashanti also could incur significant costs associated with capital equipment, GHG monitoring and reporting and other obligations to comply with applicable requirements.
Other countries, including Brazil, have passed or are considering GHG trading or tax schemes and/or other regulation of GHG emissions, although the precise impact on AngloGold Ashanti’s operations cannot yet be determined.
In addition, AngloGold Ashanti’s operations could be exposed to a number of physical risks from climate change, such as changes in rainfall rates, rising sea levels, reduced water availability, higher temperatures and extreme weather events. Events or conditions such as flooding or inadequate water supplies could disrupt mining and transport operations, mineral processing and rehabilitation efforts, create resource or energy shortages or damage the company’s property or equipment and increase health and safety risks on site. Such events or conditions could have other adverse effects on the company’s workforce and on the communities around its mines, such as an increased risk of food insecurity, water scarcity and prevalence of disease, all of which could have a material adverse effect on the company’s results of operations and financial condition.
Compliance with “conflict minerals” and “responsible gold” legislation and standards could result in significant costs.
Stringent standards relating to “conflict minerals” and “responsible” gold that include the U.S. Dodd-Frank Act, the European proposal for self-certification for importers of gold, the Organisation for Economic Cooperation and Development Due Diligence Guidelines for Responsible Supply Chains of Minerals from Conflict-Affected and High-Risk Areas, the World Gold Council Conflict Free Gold Standard and the London Bullion Market Association Responsible Gold Guidance have been introduced.
Any such legislation and standards may result in significant costs to ensure and demonstrate compliance (particularly where standards change rapidly or lack certainty due to court challenges), and may complicate the sale of gold emanating from certain areas. The complexities of the gold supply chain, especially as they relate to “scrap” or recycled gold, and the fragmented and often unregulated supply of artisanal and small-scale mined gold are such that there may be significant uncertainties at each stage in the chain as to the provenance of the gold. As a result of the uncertainties in the process, the costs of due diligence and audit, or the reputational risks of defining their product or a constituent part as containing a “conflict mineral” may be too burdensome for the company’s customers. Accordingly, manufacturers may decide to switch supply sources or to substitute gold with other minerals not covered by the initiatives. This could have a material negative impact on the gold industry, including on AngloGold Ashanti’s results of operations and financial condition.
32
Mining operations and projects are vulnerable to supply chain disruption such that operations and development projects could be adversely affected by shortages of, as well as the lead times to deliver, strategic spares, critical consumables, mining equipment or metallurgical plant.
AngloGold Ashanti’s operations and development projects could be adversely affected by both shortages and long lead times to deliver strategic spares, critical consumables, mining equipment and metallurgical plant, as well as transportation delays. Import restrictions, such as those imposed by the Argentinian government from 2011 to 2015, can also delay the delivery of parts and equipment. In the past, the company and other gold mining companies experienced shortages in critical consumables, particularly as production capacity in the global mining industry expanded in response to increased demand for commodities. AngloGold Ashanti has also experienced increased delivery times for these items. Shortages have resulted in unanticipated price increases and production delays and shortfalls, resulting in a rise in both operating costs and in the capital expenditure necessary to maintain and develop mining operations.
Individually, AngloGold Ashanti and other mining companies have limited influence over manufacturers and suppliers of these items. In certain cases there are a limited number of suppliers for certain strategic spares, critical consumables, mining equipment or metallurgical plant who command superior bargaining power relative to the company. The company could at times face limited supply or increased lead time in the delivery of such items. For example, during 2012, supply of caustic soda was delayed in the Continental Africa Region. In addition, the unreliability of oxygen and lime supply similarly affected production at the Vaal River and West Wits surface operations in South Africa throughout 2011 and poor availability of drill rigs, heavy machinery and fleet equipment hampered underground drilling and overall operational performance at the Serra Grande mine in Brazil, also in 2011.
The company’s procurement policy is to source mining and processing equipment and consumables from suppliers that meet its corporate values and ethical standards but risks remain around the management of ethical supply chains. In certain locations, where a limited number of suppliers meet these standards, additional strain is placed on the supply chain, thereby increasing the cost of supply and delivery times.
Furthermore, supply chains and rates can be impacted by natural disasters, such as earthquakes, extreme weather patterns and climate change, as well as other phenomena that include unrest, strikes, theft and fires. For example, a three-week transport strike in 2012 delayed the supply of consumables in South Africa. Although potential supply chain disruption in Mali, as a result of the coup d’état and the proliferation of armed combat in 2012 and 2013, were avoided by well-managed consumable stock holding, ongoing instability and armed conflict in the country, even following the peace accord struck in 2015, could present material supply chain difficulties. Moreover, although potential gold doré export disruptions at Geita, which were the result of an attempted gold heist, and in Mali, following the closure of Bamako International Airport, were minimised with the introduction of alternative transportation arrangements, such alternatives may not be available upon the occurrence of similar or more severe situations in the future. In February 2013, a fire destroyed the heavy mining equipment stock of spares and components at the Geita gold mine. If AngloGold Ashanti experiences shortages, or increased lead times in the delivery of strategic spares, critical consumables, mining equipment or processing plant, the company might have to suspend some of its operations and its results of operations and financial condition could be adversely impacted.
The Siguiri mine was impacted as a result of the Ebola virus outbreak of 2014 in Western Africa, where certain crisis management measures were implemented. See “-AngloGold Ashanti’s Ore Reserve, deposits and mining operations are located in countries that face instability and security risks that may adversely affect both the terms of its mining concessions, as well as its ability to conduct operations in certain countries.” AngloGold Ashanti cannot guarantee that its crisis management measures will be adequate, that the supply chain and operations will not be adversely affected by a future Ebola or other epidemic outbreak and that there will be no knock-on effects such as severe food shortages and social impact. Epidemic-related export restrictions could similarly adversely impact the company’s financial condition and results of operations.
Concerns about the integrity or reliability of the London Bullion Market Association (LBMA) Gold Price Benchmark could adversely affect investor interest in gold and confidence in the gold market.
Historically, the gold market relied on prices and trades made relative to a benchmark known as the London Gold Fix (Fix), set by a group of five fixing banks that matched buyers and sell orders. Following a series of allegations regarding the possible manipulation of the Fix by fixing banks, U.S., German and U. K. regulators undertook a review of the fixing process. While the U.S. Commodity Futures Trading Commission and the German BaFin dismissed allegations of manipulation in 2013 and 2015, respectively, in 2014 Deutsche Bank withdrew from the fixing panels and the UK Financial Conduct Authority (FCA) fined one of the fixing banks. The FCA identified systems and control failures and conflicts of interest in relation to gold fixing over the nine years to 2013 and one instance of gold price manipulation in 2012. Separately, several lawsuits have been filed against fixing banks alleging that they have colluded to manipulate the gold benchmark price, including class actions instituted in the United States in 2014 and Canada in 2015. Some of these class actions were settled in the United States in 2016.
In 2015, the London Gold Fix was replaced by the LBMA Gold Price Benchmark, which is run and managed by the Intercontinental Exchange (ICE). The ICE is independent of the gold market as it does not conduct any trading of gold.
33
Whilst AngloGold Ashanti had no role in the operation of the Fix during the period under review and has no responsibility for the conduct of the market makers in the gold market, the gold market could still be affected if the integrity of the Gold Price Benchmark is undermined as a result of ongoing lawsuits, resulting in reduced demand for the company’s gold, greater volatility in gold prices and less liquidity in the gold market. Since 2015, when AngloGold Ashanti joined the new oversight committee for the LBMA Gold Price Benchmark which is regulated by the FCA, the volumes being traded through the benchmarks have steadily increased, as have the number of direct participants. Due to some issues around the Silver Price Benchmark, ICE, under the auspices of the Gold Price Benchmark, was asked to assume the duties of managing the Silver Benchmark. As such, the LBMA Gold Price Oversight Committee has now become the LBMA Precious Metals Oversight Committee. If further allegations are made against the Gold Price Benchmark in the future, AngloGold Ashanti could be implicated more directly, which may have an adverse effect on its reputation.
Diversity in interpretation and application of accounting literature in the mining industry may impact reported financial results.
The mining industry has limited industry-specific accounting literature. As a result, there is diverse interpretation and application of accounting literature on mining-specific issues. AngloGold Ashanti, for example, capitalises drilling and costs related to defining and delineating a residual mineral deposit that has not been classified as a “Proven and Probable Ore Reserve” at a development project or production stage mine. Some companies may, however, expense such costs.
As and when this diverse interpretation and application is addressed, the company’s reported results could be adversely impacted should the adopted interpretation differ from the position it currently follows.
For example, International Financial Reporting Standard (IFRS) 16 Leases was issued in January 2016 and, in comparison to its predecessor International Accounting Standard (IAS) 17 makes significant changes to the accounting treatment for leasing transactions for lessees. IFRS 16 is applicable for all financial years commencing on or after 1 January 2019, with options for full or modified retrospective application.
The approach of IAS 17 was to distinguish between two types of leases. Leases which transfer substantially all the risks and rewards of ownership of an asset were classified as finance leases. All other leases were classified as operating leases. The lease classification set out in IAS 17 was subjective and allowed the preparers of lessee’s financial statements to conclude in certain instances that leases should be classified as operating rather than as finance leases.
Under IFRS 16, however, a lessee is required to recognise right of use assets and lease liabilities, including those of operating leases.The requirements of IFRS 16 may have significant impacts on key accounting ratios of the company. The greater recognition of leased assets and lease liabilities on the statement of financial position will reduce return on capital employed and increase gearing. Initial measures of profit are likely to be reduced, as in the early years of a lease the combination of depreciation of the right of use asset and the finance charge associated with the lease liability will exceed the lease rentals (which have historically been charged on a straight-line basis). This change could have an adverse impact on AngloGold Ashanti's borrowing capacity or credit ratings in the future.
Failure to comply with laws, regulations, standards and contractual obligations, breaches in governance processes or fraud, bribery and corruption may lead to regulatory penalties, loss of licences or permits, negative effects on AngloGold Ashanti’s reported financial results, and adversely affect its reputation.
AngloGold Ashanti’s operations must comply with the U.S. Foreign Corrupt Practices Act and similar anti-corruption and anti-bribery laws of the jurisdictions in which AngloGold Ashanti operates. There has been a substantial increase in the global enforcement of these laws and an increased focus on the actions of mining companies. Although AngloGold Ashanti has a compliance programme in place designed to reduce the likelihood of violations of such laws, any violation could result in significant criminal or civil sanctions. Conversely, in certain circumstances, strict compliance with anti-bribery laws may conflict with certain local customs and practices. Since the company operates globally in multiple jurisdictions, including those with less developed political and regulatory environments, and within numerous and complex frameworks, its governance and compliance processes may not prevent potential breaches of law, accounting principles or other governance or customary practices.
AngloGold Ashanti’s Code of Business Principles and Ethics and Policy on Anti-Bribery and Anti-Corruption, amongst other policies, standards and guidance, and training thereon may not prevent instances of unethical or unlawful behaviour, including bribery or corruption. They also may not guarantee compliance with legal and regulatory requirements and may fail to enable management to detect breaches thereof.
Sanctions for failure by the company or others acting on its behalf to comply with these laws, regulations, standards and contractual obligations could include fines, penalties, resignation or removal of officers, imprisonment of officers, litigation, and loss of operating licences or permits, suspensions of operations and negative effects on AngloGold Ashanti’s reported financial results and may damage its reputation. Such sanctions could have a material adverse impact on the company’s financial condition and results of operations.
34
Breaches in cybersecurity and violations of data protection laws may adversely impact AngloGold Ashanti’s business.
AngloGold Ashanti maintains global information technology and communication networks and applications to support its business activities. AngloGold Ashanti outsources several information technology functions and applications to third party vendors and these engagements may have an impact on the overall cybersecurity position of the company. The primary company systems managed by third party vendors include but are not limited to: cloud infrastructure, data centre management, server / personal computing support, enterprise resource programs, email and digital documents and the Cyber Security Operations Centre. AngloGold Ashanti has implemented an Information Security Management System (ISMS) to safeguard the company's IT environment. The ISMS is a framework for the policies, standards and procedures adopted to comply with ISO/IEC 27001:2005, and manages identified cybersecurity related risks.
The company must continuously monitor the solutions implemented to support its global information technology and communication networks and applications to maintain a suitable and well-managed environment. While the security of the company's technical platforms and information systems will be regularly reviewed as part of the compliance initiatives and will be measured against the appropriate security implementation standards and documented security controls, there can be no assurance that these efforts will be successful.
The sophistication and magnitude of cybersecurity incidents are increasing and include malicious software, attempts to gain unauthorised access to data and other electronic security and protected information breaches that could lead to production downtimes, operational delays, the compromising of confidential or otherwise protected information, destruction or corruption of data, other manipulation or improper use of AngloGold Ashanti’s systems and networks or financial losses from remedial actions. For example, in 2017, the business experienced a cybersecurity attack, that compromised a senior manager's email account over a period of approximately four months. While AngloGold Ashanti did not incur monetary loss or experience reputational damage due to this breach, the case has been reported to the Australian Police and is currently under investigation.
Information technology security processes may not prevent future malicious actions, denial-of-service attacks, or fraud, which could result in the corruption of operating systems, theft of commercially sensitive data, misappropriation of funds and business and operational disruption. AngloGold Ashanti's insurance program includes limited coverage for cyber-related crimes and incidents as part of the global insurance program and material system breaches and failures could result in significant interruptions that could adversely affect AngloGold Ashanti’s operating results and reputation.
The interpretation and application of consumer and data protection laws in South Africa, the United States and elsewhere are uncertain and evolving. It is possible that these laws may be interpreted and applied in a manner that is inconsistent with AngloGold Ashanti’s data practices. Complying with these various laws is difficult and could cause the company to incur substantial costs or require it to change its business practices in a manner adverse to its business.
For example, on 25 May 2018 the General Data Protection Regulation (GDPR) will come into force. The GDPR is an European Union (EU) wide framework for the protection of personal data of EU based individuals. The GDPR enhances existing legal requirements through several new rules, including stronger rights for data subjects and mandatory data breach notification requirements, and increases penalties for non-compliance. Failure to comply with the GDPR may lead to a fine of up to four percent of a company’s worldwide turnover or up to Euro 20 million.
Risks related to AngloGold Ashanti’s results of operations and financial condition as a result of factors specific to the company and its operations
AngloGold Ashanti’s Ore Reserve, deposits and mining operations are located in countries that face instability and security risks that may adversely affect both the terms of its mining concessions, as well as its ability to conduct operations in certain countries.
Some of AngloGold Ashanti’s mineral deposits and mining and exploration operations are located in countries that are experiencing political and economic instability and other uncertainty.
Certain of the countries in which AngloGold Ashanti has mineral deposits or mining or exploration operations, including the DRC, Mali, Guinea, Ghana, South Africa, Colombia and Brazil, have in the past experienced, and in certain cases continue to experience, a difficult security environment. In particular, various illegal groups active in regions in which the company is present may pose a credible threat of military repression, terrorism, civil unrest and disturbances, sabotage, extortion and kidnapping, which could have an adverse effect on its operations in these and other regions.
For example, Mali continues to experience a difficult security environment since the military coup in March 2012. The situation in Mali remains of heightened concern as a result of the instability in northern Mali, which also spread to Central Mali in 2016.
Eastern DRC also continues to experience tension consistent with the cycles of unrest experienced since the late 2000s. Fighting has caused instability in the area and could expand or intensify, particularly in response to certain political actions such as the postponement of elections in early 2017.
35
In 2012, AngloGold Ashanti Colombia’s (AGAC) assets and employees were the targets of direct hostile attacks around the La Colosa project’s area of influence. Although a peace agreement with the Revolutionary Armed Forces of Colombia-People’s Army (FARC) was brokered in 2016, the risk of rogue factions joining criminal gangs remains a threat and other similar attacks could adversely affect the company’s activities in Colombia in the future.
In March 2017, the bullion strong room and security employees at Mineração Serra Grande in Brazil were the target of an armed attack. There were no fatalities, serious injuries or loss of product. The risk of a future attack remains a threat and other similar attacks could adversely affect the company’s activities in Brazil.
From 2009 to 2015, the company recorded an almost four-fold increase in the instances of injury to security personnel, including members of AngloGold Ashanti’s internal security, private security companies and public security forces in certain jurisdictions. The injury rate increase was caused by a rise in the number and severity of security incidents resulting from increased illegal and artisanal mining due to a steady migration of people into the applicable areas and an increase in the level of organisation and funding of criminal activity around some of the company’s Continental African operations. Although this trend stabilised in 2016, intrusions onto the company’s tenement and operational areas, including illegal mining-related activities in particular, continue to be a challenge. The most significant security challenges remain in Tanzania, Guinea and Ghana, in areas where there is endemic poverty and high levels of unemployment. See “-Illegal and artisanal mining occurs on AngloGold Ashanti’s properties, which can disrupt the company’s business and expose the company to liability.” If the security environment surrounding the company’s operations that are most exposed to these challenges deteriorates, employee, third-party and community member injuries and fatalities could also increase. Any such increase could disrupt the company’s operations in certain mines and adversely affect its reputation, results of operations and financial condition.
In some instances, risk assessments categorise threats as serious enough to require resorting to public security forces, such as national police or military units on a near-permanent basis. For example, the company relies on the army for support at its mining operations in Ghana. Incursions occurred at the Obuasi mine following withdrawal of such state security protection in February 2016, and an AngloGold Ashanti employee was killed. Following these events, AngloGold Ashanti withdrew its employees performing non-essential functions from the Obuasi mine. In the event that continued operations in any of the company’s countries of operations compromise the company’s security or business principles, AngloGold Ashanti may withdraw from any such countries on a temporary or permanent basis. This could have a material adverse impact on AngloGold Ashanti’s results of operations and financial condition.
Furthermore, the company continues to experience strained relationships with certain of its host communities. AngloGold Ashanti operates in several regions where poverty, unemployment and the lack of access to alternative livelihoods mean that the creation and distribution of economic benefit from mining operations is a significant area of focus for community and government. For example, protests demanding employment by the communities and youth occurred at the company’s Siguiri mine in Guinea in 2016. AngloGold Ashanti has also been publicly accused of inadequate resettlement practices at its Siguiri operation by local and international non-governmental organisations, which poses reputational risk. For example, in April 2017, local community members in Siguiri filed a complaint with the Office of the Compliance Advisor Ombudsman (CAO) raising concerns regarding these resettlement practices and alleging that AngloGold Ashanti provided inadequate compensation post-resettlement and failed to take adequate measures to restore their livelihoods. The CAO is the independent accountability mechanism for the International Finance Corporation (IFC). IFC is a lender to Nedbank, one of the lenders under AngloGold Ashanti’s revolving credit facilities. The company has agreed to work with the complainants, the IFC and Nedbank to try to resolve these issues through a collaborative approach using CAO’s dispute-resolution process.
Additionally, AngloGold Ashanti has been involved in disputes with the Merafong City Local Municipality in South Africa over property valuations and water services surcharges. These matters have drawn public attention and have been discussed with the Minister of Mineral Resources.
In addition, infectious diseases are also a threat to the stability of some of the countries in which the company operates, where limited local health infrastructure weakens governments’ ability to manage and contain outbreaks effectively. For example, during August 2014, cases of Ebola virus disease (EVD) were reported in Siguiri, Guinea, which is located near AngloGold Ashanti’s Siguiri mine. The company implemented certain restrictions on travel to and from the Siguiri mine as a precaution. As EVD caused significant disruptions in the company’s exploration activities, particularly relating to field mapping and geophysics, AngloGold Ashanti also suspended its brownfields work programme and greenfields field work in the middle of 2014. Although this situation has normalised in Guinea, in the future the company may consider further safety measures which may negatively impact its operations or its exploration projects in neighbouring areas in countries that may be affected by infectious diseases.
AngloGold Ashanti’s mineral deposits, Ore Reserve, and mining operations are located in countries where political, tax and economic laws and policies may change rapidly and unpredictably and such changes and policies may adversely affect both the terms of its mining concessions, as well as its ability to conduct operations in certain countries.
Past experience demonstrates that political, tax and economic laws and policies in countries in which AngloGold Ashanti operates can change rapidly. Examples include the 2012 coup d’état and subsequent fighting in Mali, the foreign currency regulations that were imposed from 2011 to 2015 in Argentina and the ban on gold ore exports announced by the Tanzanian government in March 2017. As mining assets are fixed, the adverse impacts of such changes may be unavoidable and immediate.
36
Any existing and new mining, exploration operations and projects that the company carries out are subject to various national and local laws, policies and regulations governing the ownership, prospecting, development and mining of Ore Reserve, taxation and royalties, exchange controls, import and export duties and restrictions, investment approvals, employee and social community relations and other matters.
In many of the countries in which AngloGold Ashanti operates, there is an ongoing focus by governments seeking greater economic benefit and increased financial and social benefits from extractive industries and mining in particular. This entails the review of mining codes and stability agreements, which were in many cases designed under particular economic conditions, and the formulation or amendment of laws, policies and regulations relating to issues such as mineral rights and asset ownership, royalties, taxation and taxation disputes, “windfall” or “super” taxation, non-recovery of taxation refunds, import and export duties, currency transfers, restrictions on foreign currency holdings and repatriation of earnings. The laws, policies and regulations are increasingly uncertain, changing and generally require progressively higher payments to governments, notably in the form of increased royalties and taxes, mandated beneficiation, export levies and increasing or retaining state or national ownership of resources. In particular, changes to the fiscal terms governing AngloGold Ashanti’s operations may have a material adverse impact on the company’s results of operations or financial condition, threaten the viability of existing operations, and discourage future investments in certain jurisdictions. This may therefore have an adverse impact on the company’s ability to access new assets and potentially reduce future growth opportunities.
For example, in July 2017, the Government of Tanzania (GoT) enacted three pieces of new legislation which purport to make a number of changes to the operating environment for Tanzania’s extractive industries, including its mining sector. These changes include, among others: the right for the GoT to renegotiate existing mining development agreements at its discretion; the provision to the GoT of a non-dilutable, free-carried interest of no less than 16 percent in all mining projects; the right for the Got to acquire up to 50 percent of any mining asset commensurate with the value of tax benefits provided to the owner of that asset by the GoT; removal of the refund of input VAT incurred; an increase in the rate of revenue royalties from four percent to six percent; requirements for local beneficiation and procurement; and constraints on the operation of off-shore bank accounts. AngloGold Ashanti and other major mining companies are seeking a constructive dialogue with the GoT regarding this legislation and its impact on existing mining agreements. As a precautionary step to safeguard its interests, AngloGold Ashanti has commenced international arbitration proceedings against the GoT in connection with the enactment of this legislation, as first announced in July 2017. See “Item 8A: Legal Proceedings”. There can be no assurance that the company will be successful in safeguarding its interests in the arbitration action and these changes and any future amendments to the mining legislation could have further adverse effects on the company’s financial condition and profitability.
For example, on 9 September 2011, a new mining code for Guinea was enacted. The new mining code significantly increased the share of state ownership in the mining industry, extending a 15 percent share of future mining projects to the government, without financial compensation. The government also had the option to purchase up to an additional 20 percent of each project. However, the new mining code was suspended in October 2012 due to unfavourable reception. On 8 April 2013, the Guinean parliament voted to amend the 2011 Mining Code. The amendment was promulgated shortly thereafter by Presidential Decree on 17 April 2013. The new legislation provided that existing mining conventions would be amended through addenda which would contain various provisions, including provisions relating to taxation, state equity participation in mining companies and other matters. AngloGold Ashanti’s new convention came into effect in January 2017 and includes, among other terms, a five percent royalty on gold and a 15 percent free-carried, non-contributory interest in the mine for the Republic of Guinea. See “Item 4B: Business Overview-The Regulatory Environment Enabling AngloGold Ashanti to Mine”. Any future amendments to the mining code or attempts to renegotiate the convention could have further adverse effects on the company’s financial condition and profitability.
In 2012, the government of Ghana amended its fiscal mining regime, increasing its corporate taxation to 35 percent and royalty rates to five percent. Furthermore, the government of Ghana has constituted a review committee to review and re-negotiate stability agreements with mining companies. AngloGold Ashanti is waiting to be invited to participate in negotiations with the Ghanaian review committee. The outcome of these negotiations may have a material adverse effect on the company’s results of operations or financial condition.
On 1 July 2012, Australia’s Minerals Resource Rent Tax (MRRT) came into effect after the legislation was passed in March 2012. The MRRT, which was repealed in 2014, applied only to the bulk commodities of coal and iron ore, and replaced the previously proposed Resource Super Profits Tax (RSPT), which covered all minerals. The Australian federal government did not include gold and uranium in the final MRRT. However, should Australia consider reintroducing the RSPT, or if similar “super profit” taxes were to be introduced and implemented in any other country in which AngloGold Ashanti operates, the company’s results of operations and financial condition could be materially adversely affected.
In addition, some of AngloGold Ashanti’s mineral deposits and mining and exploration operations are located in countries that are experiencing social and political instability as well as economic uncertainty. In these countries, there is a risk that political influence may delay or hinder strategic imperatives for cost rationalisation especially in the areas of procurement and labour reductions. In addition, allegations of corruption in Brazil and Guinea against top political and industry leaders have increased political instability and distrust, and efforts at political and economic reform in Brazil may lead to increased instability. Additionally, the political rhetoric and incentives prior to national elections in Ghana late in 2016 may have influenced and slowed the national response to the illegal mining at Obuasi. The high levels of unemployment, poverty and inequality remain in each of these countries, further increasing the risk of social instability that will continue to negatively impact their economies, business and the mining industry.
37
The MPRDA Amendment Bill of 2013, passed by the National Assembly of Parliament of the Republic of South Africa on 12 March 2014 (and referred back to the National Assembly by the President on 16 January 2015), could, if ruled to be constitutional, impact AngloGold Ashanti’s business by empowering the Minister of Mineral Resources to set developmental pricing conditions for certain minerals for beneficiation purposes, impose export permits on designated minerals and give the State an open-ended free carried interest and State participation.
In June 2013, the Brazilian government proposed changes to the mining legislation that are still being discussed in congress. The proposals could make the rules governing access to mining titles more discretionary and could shorten the duration of exploitation rights. Following the November 2015 tailings dam collapse in Minas Gerais on the mining properties of companies not affiliated with AngloGold Ashanti, the Brazilian government has also considered including tougher requirements related to tailings dams (
e.g.
, mandatory insurance in case of environmental catastrophe).
Mining is a long-term activity and assets may be located in jurisdictions with elevated risk. Political instability and the resulting unstable business environment in such countries in which companies operate may discourage future investment in those jurisdictions, and may have an adverse impact on the company’s ability to access new assets, potentially reducing growth opportunities.
AngloGold Ashanti is subject to an uncertain tax environment. Increased taxes are expected in most countries of operation. Changes in tax laws could result in higher tax expense and payments and could materially impact AngloGold Ashanti’s tax receivables and liabilities as well as deferred tax assets and deferred tax liabilities. In addition, the uncertain tax environment in some regions could limit AngloGold Ashanti’s ability to enforce its rights. As a global company, AngloGold Ashanti conducts its business in countries subject to complex tax rules, which may be interpreted in different ways. Further interpretations or developments of tax regimes may affect the company’s tax liability, return on investments and business operations. AngloGold Ashanti is regularly examined by tax authorities in its various jurisdictions of operation.
For example, in July 2017, AngloGold Ashanti's subsidiaries in Tanzania received a demand for payment of inspection fees on all of their gold shipments and a demand for payment of alleged unpaid service levies. Without payment of the inspection fee, AngloGold Ashanti is not allowed to make any exports. In September 2017, the company received a letter from the Tanzania Revenue Authority (TRA) prohibiting it from claiming input tax credit with effect from July 2017 and AngloGold Ashanti estimates the impact of this change to input tax could result in an increase in annual costs of $50 million. AngloGold Ashanti has agreed to pay the inspection fees on a ‘without prejudice’ basis, has filed an objection with the TRA and is seeking to resolve all of these issues in the ongoing arbitration proceedings in Tanzania described above. There can be no assurance that these proceedings will be successful and the outcomes may have a material adverse impact on the company’s results of operations and financial condition.
In Guinea, Mali, DRC and Tanzania, AngloGold Ashanti is due refunds of input tax and fuel duties which have remained outstanding for periods longer than those provided for in the respective statutes. For example, AngloGold Ashanti calculates that overdue recoverable value added tax, fuel duties and appeal deposits of $132 million are owed to AngloGold Ashanti and held by the Tanzanian government and it is not certain when, if ever, AngloGold Ashanti will be refunded this amount. Similarly, it is not certain when or whether AngloGold Ashanti will be refunded all amounts due from any other government.
The countries in which the company operates may also introduce export restrictions, exchange controls, impose restrictions to source materials and services locally, or impose other similar restrictions that hinder foreign companies’ operations within such countries. For example, in March 2017, the Tanzanian government announced an immediate ban on gold, silver, copper and nickel ore exports, in an attempt to ensure that mineral value-addition activities would be carried out in-country. This regulatory change does not currently impact the Geita mine or Tanzanian operations as the company does not export unrefined or refractory ore out of Tanzania. Additionally, from 2011 to 2015, the Argentinian government introduced stricter exchange controls and related protracted approval processes which limited the company’s ability to repatriate dividends from its Argentinian subsidiaries. In October 2011, the Argentinian government decreed that mining, oil and energy companies must repatriate export earnings and additionally, the purchase of U.S. dollars required authorisation from the Argentinian central bank and the purpose for which the currency would be used had to be stated. In May 2012, the Argentine Mining Secretariat issued new regulations requiring mining companies in Argentina to boost their domestic purchases of equipment and services and mining companies were required to resort exclusively to locally established suppliers for their export-related shipping and logistics operations. While the new government, elected in November 2015, started a process to ease these controls and return to an open economy and free market, not all restrictions had been lifted as of March 2017.
If, in one or more of the countries in which it operates, AngloGold Ashanti were not able to obtain or maintain necessary permits, authorisations or agreements to implement planned projects or continue its operations under conditions or within timeframes that make such plans and operations economically viable, or if the applicable legal, ownership, fiscal (including all royalties and duties), exchange control, employment, environmental and social laws or regimes change materially, or if the governing political authorities change resulting in amendments to such laws and regimes, this could have a material adverse effect on AngloGold Ashanti’s operating results, financial condition, and, in extreme situations, on the viability of an operation. The risk is particularly acute in South Africa. See “-AngloGold Ashanti’s mining rights in the countries in which it operates could be altered, suspended or cancelled for a variety of reasons, including breaches in its obligations in respect of such mining rights” and “Item 4B: Business Overview-The Regulatory Environment Enabling AngloGold Ashanti to Mine”.
38
AngloGold Ashanti’s mining rights in the countries in which it operates could be altered, suspended or cancelled for a variety of reasons, including breaches in its obligations in respect of such mining rights.
AngloGold Ashanti’s right to own and exploit Ore Reserve and deposits is governed by the laws and regulations of the jurisdictions in which the mineral properties are located. See “Item 4B: Business Overview-The Regulatory Environment Enabling AngloGold Ashanti to Mine”. Currently, a significant portion of the company’s Ore Reserve and deposits are located in countries where mining rights could be suspended or cancelled should it breach its obligations in respect of the acquisition and exploitation of these rights.
In each of the countries in which AngloGold Ashanti operates, the formulation or implementation of government policies on certain issues may be unpredictable. This may include changes in laws relating to mineral rights, ownership of mining assets and the right to prospect and mine, and in extreme cases, nationalisation, expropriation or nullification of existing concessions, licenses, permits, agreements and contracts.
Any existing and new mining and exploration operations and projects are subject to various national and local laws, policies and regulations governing the ownership and the right to prospect or mine or develop proposed projects. For more details on the risks surrounding ownership of mining assets, see “-Title to AngloGold Ashanti’s properties may be uncertain and subject to challenge” and “-AngloGold Ashanti’s Mineral Reserve, deposits and mining operations are located in countries where political, tax and economic laws and policies may change rapidly or unpredictably and such changes and policies may adversely affect both the terms of its mining concessions, as well as its ability to conduct operations in certain countries”.
Project implementation delays could result in licences not being renewed and the loss of mining rights. Some of AngloGold Ashanti’s mining concessions, authorisations, licences and permits are subject to expiry, limitations on renewal and various other risks and uncertainties. For example, in early 2018 the DRC announced a new mining code that makes a number of changes to the operating environment for the DRC's extractive industries, including those in its mining and oil and gas sectors. This reform, which received the presidential assent needed for it to be passed into law on 10 March 2018, could have a material adverse impact on the protections enjoyed by AngloGold Ashanti’s projects in the DRC. Among others, the mining code increases AngloGold Ashanti’s tax burden by widening the basis for and increasing the rate of the mining royalties’ rates (the royalty rate applicable to gold increased from two and one-half percent to three and one-half percent). In addition, it increases the DRC government’s free carried interest from five percent to ten percent, with an additional five percent being granted to the DRC government upon each renewal of the exploitation permit, and a requirement that at least 10 percent of the share capital of mining companies be held by DRC individuals. AngloGold Ashanti and other major mining companies are seeking constructive conversation with a working group of the government of the DRC to negotiate transitional agreements, mining regulations, additional royalties and changes to other taxes regarding the mining code, but there can be no assurances that the company's efforts in these discussions will be successful.
In addition, any dispute with governments or other stakeholders, including labour unions, involving an AngloGold Ashanti operation, as a result of rationalisation efforts or otherwise, could negatively affect AngloGold Ashanti’s relationship with such government or stakeholders in respect of other operations within the same country, which could result in adverse consequences, including unfavourable regulatory action, claims and labour disputes. Such adverse consequences could be exacerbated due to the holding company structure of AngloGold Ashanti’s subsidiaries in some of the countries in which it operates.
Moreover, in South Africa, AngloGold Ashanti’s mining rights may be suspended or cancelled by the Minister of Mineral Resources, and the company may be unable to obtain new mining rights if it breaches its obligations under the Mineral and Petroleum Resources Development Act (MPRDA). In particular, South Africa’s changing Black Economic Empowerment (BEE) policies may adversely affect both the terms of AngloGold Ashanti’s mining concessions, as well as its ability to conduct operations. Mining rights are linked to compliance with various obligations, including the Revised Mining Charter. Compliance with the Revised Mining Charter is measured using a designated scorecard relating to equity ownership and management control of mining companies by historically disadvantaged South Africans (HDSAs). The deadline for compliance was originally set for the end of 2014, at which time HDSAs had to constitute 40 percent of all levels of management.
Whilst AngloGold Ashanti believes that it complied with ownership targets that had to be achieved by the end of 2014, it has not yet received its scorecard from the government assessing its compliance with applicable requirements and it may need to make further progress to achieve future targets, including further participation by HDSAs in senior and top management levels, the upgrade of housing and accommodation at the company’s mines, further human resource development, mine community development, sustainable development and growth as well as procurement and enterprise development.
The company will incur expenses in giving further effect to the Revised Mining Charter and the scorecard. AngloGold Ashanti may not meet all of the various requirements by the required dates. Additionally, the South African government may decide that the Revised Mining Charter has not gone far enough to achieve its underlying goals and therefore decide to expand the obligations of mining companies thereunder and the Minister of Mineral Resources may opt to disregard certain historical BEE transactions in connection with its review of new mining rights applications.
In March 2015, the Minister of Mineral Resources (the Minister) announced that the Department of Mineral Resources (DMR) and the Chamber of Mines of South Africa had jointly agreed to submit certain matters relating to the interpretation of the Revised Mining Charter, including the qualification of certain historical BEE transactions for meeting the HDSA ownership thresholds, to the courts in South Africa for determination and clarification. Papers were filed by the Chamber of Mines of South Africa and the DMR but the matter was not heard in court and was subsequently dismissed.
39
On 9 March 2016, AngloGold Ashanti received a notice from the DMR stating that the company was not compliant with the 26 percent HDSA ownership requirement. AngloGold Ashanti timely responded to the order and as the DMR has taken no further action, its original notice has lapsed. In June 2017, the Minister gazetted the BBBEE Charter for the South African Mining and Minerals Industry, 2017 (2017 Charter) which came into effect on the same day (Reviewed Mining Charter). The Reviewed Mining Charter seeks to align the Revised Mining Charter with the Broad-Based Black Economic Empowerment Act 53 of 2003, in order to ensure meaningful participation of black people and provide for policy and regulatory certainty to ease the investment in and the development of the mining industry. It has been challenged by the DMR and the Chamber of Mines and will not be implemented until the High Court of South Africa reaches a decision. On 1 March 2018, the newly appointed Minister indicated that he intends to finalise and publish the New Mining Charter by no later than June 2018. See “Item 4B: Business Overview - The Regulatory Environment Enabling AngloGold Ashanti to Mine”. Should AngloGold Ashanti be found in breach its obligations to comply with the MPRDA, Revised Mining Charter, the Reviewed Mining Charter (if implemented) or any future amendments to either the Revised Mining Charter or the Reviewed Mining Charter, it may be compelled to conduct additional BEE transactions or its mining rights in South Africa could be suspended or cancelled by the Minister and it may be unable to obtain any new mining rights. Any such suspension or cancellation could have a material adverse effect on AngloGold Ashanti’s results of operations and financial condition.
In addition, and as discussed in more detail in “Item 4B: Business Overview - The Regulatory Environment Enabling AngloGold Ashanti to Mine”, South Africa recently enacted the BBBEE Amendment Act, which amended the Broad-based Black Economic Empowerment Act 53 of 2003. There are several areas of potential conflict between the BBBEE Amendment Act and the Revised Mining Charter. The BBBEE Amendment Act became effective on 24 October 2016 and is understood to override any conflicting law, including the Revised Mining Charter. Although the Draft 2016 Mining Charter seeks to align the Revised Mining Charter with the BBBEE Amendment Act, similar regulatory conflicts and uncertainty may continue to prevail in the future.
In Colombia, a government agency grants exclusive concession contracts for exploration and exploitation. With the award of the mining concession or tenement contract, there are specified timelines for the completion of the various phases of a mining project, e.g. exploration, construction, exploitation. The company must comply with these timelines unless performance is excused, for example, due to force majeure or if extensions or modifications to the timelines are received. For example, force majeure was declared at the La Colosa project, stopping all activities, following the outcome of the plebiscite held on 26 March 2017 in the Colombian municipality of Cajamarca, which hosts the La Colosa exploration site. The grant of force majeure is for one year and will expire in June 2018, after which such declaration will need to be extended. While the Company plans to make a timely application for an extension, there can be no guarantee that the declaration will be extended. Loss of the force majeure status could have a material adverse effect on AngloGold Ashanti’s results of operations and financial condition.
If the company does not comply with the specified timelines for the completion of the various phases of a mining project, the mining authority may revoke the company's concession contracts or mining licenses. The company’s core mining concession contracts provide that the mining authority has the discretion to declare the underlying concession void if AGAC breaches applicable environmental laws or regulations. If the mining authority were to exercise such discretion against AGAC, AGAC would be required to abandon its projects and all of its other existing mining concession contracts. Pending proposals for new mining concession contracts would also be cancelled and AGAC would be banned from doing business with the Colombian government for a period of five years.
AGAC has applied for consolidation of its tenement contracts related to La Colosa, some of which are currently not in compliance with their specified timelines. The company is waiting for approval of its application for consolidation, which would remedy the non-compliance of each consolidated tenement, but can provide no assurance that its application will be approved.
AngloGold Ashanti’s insurance does not cover most losses caused by the risks described above; see “-The occurrence of events for which AngloGold Ashanti is not insured or for which its insurance is inadequate may adversely affect cash flows and overall profitability”.
If AngloGold Ashanti is not able to obtain or maintain necessary permits, authorisations or agreements to prospect or mine or to implement planned projects, or continue its operations, or comply with all laws, regulations or requirements, or do so within timeframes that make such plans and operations economically viable, or if the laws impacting the company’s ownership of its mineral rights or the right to prospect or mine change materially, or should governments increase their ownership in the mines or nationalise them, AngloGold Ashanti’s results of operations and financial condition could be adversely affected.
Title to AngloGold Ashanti’s properties may be uncertain and subject to challenge.
AngloGold Ashanti has operations in several countries where ownership of land is uncertain and where disputes may arise in relation to ownership. Certain of the company’s properties may be subject to the rights or the asserted rights of various community stakeholders, including indigenous people. The presence of those stakeholders may have an impact on AngloGold Ashanti’s ability to develop or operate its mining interests. For example, in Australia, the Native Title Act (1993) provides for the establishment and recognition of native title under certain circumstances. In South Africa, the Extension of Security of Tenure Act (1997) and the Restitution of Land Rights Act (1994) provide for various landholding rights. Such legislation is complex, difficult to predict and outside of the company’s control, and could negatively affect the business results of new or existing projects. In Ghana in February 2012, the company negotiated the relocation of the Sansu Community, which lies within its local mining concession; the cost of this relocation was approximately $30 million. Where consultation with stakeholders is statutorily or otherwise mandated, relations may not remain amicable and disputes may lead to reduced access to properties or delays in operations.
40
Title to the company’s properties, particularly undeveloped ones, may also be defective or subject to challenge. Title insurance generally is not available, and title review does not necessarily preclude third parties from contesting ownership. Where surveys have not been conducted, the precise area and location of the company’s claims may be in doubt and concessions granted under various titles in a single area may turn out not to be perfectly contiguous, leaving title to areas between concessions open to challenge. Accordingly, AngloGold Ashanti’s mineral properties may be subject to prior unregistered liens, agreements, transfers or claims, including native land claims, and title may be affected by, amongst other things, undetected defects.
AngloGold Ashanti may experience unforeseen difficulties, delays or costs in successfully implementing its business strategy and projects, including any cost-cutting initiatives, temporary or permanent shutdowns, divestments and other portfolio rationalisation initiatives and any such strategy or project may not result in the anticipated benefits.
The successful implementation of the company’s business strategy and projects depends upon many factors, including those outside its control. For example, the successful management of costs will depend on prevailing market prices for input costs. The ability to grow the business will depend on the successful implementation of the company’s existing and proposed project development initiatives and continued exploration success, as well as on the availability of attractive merger and acquisition opportunities, all of which are subject to the relevant mining and company specific risks as outlined in these risk factors.
Since 2013, AngloGold Ashanti has implemented initiatives relating to strategic alignment, portfolio review, restructuring and cost-cutting, temporary or permanent shutdowns, and divestments, including in connection with the consolidation of its business activities and assets. Any future contribution of these measures to profitability will be influenced by the actual savings achieved and by the company’s ability to sustain these ongoing efforts. Strategic alignment, restructuring and cost-cutting initiatives may involve various risks, including, for example, labour unrest, operating licence withdrawal, and potential knock-on effects to other company projects and jurisdictions. The risk is elevated in South Africa, given calls for withdrawal of mining licences for “mothballed shafts” and hostile reaction to proposed mining industry retrenchments.
For example, subsequent to the restructuring of the South African operations announcement on 28 June 2017 and based on unsolicited expressions of interest received from a number of parties, AngloGold Ashanti initiated a process to assess the sale of the Kopanang mine. On 28 February 2018, this process successfully concluded with the announcement that Heaven-Sent SA Sunshine Investment Company Limited (HSC), a Chinese capital management company headquartered in Hong Kong, acquired the Kopanang mine, the West Gold Plant and the related infrastructure. The Kopanang mine will continue to operate under the ownership of HSC.
On 19 October 2017, AngloGold Ashanti announced that it entered into a sale and purchase agreement (the SPA), to dispose of various assets situated in the Vaal River region of South Africa to Harmony Gold Mining Company Limited (Harmony) for a cash consideration of US$300 million (the Transaction). The assets and related interests sold included the Moab Khotsong mine (which incorporates the Great Noligwa mine) and related infrastructure (the Moab Mining Sale Assets), AngloGold Ashanti’s entire interest in Nuclear Fuels Corporation of South Africa Proprietary Limited (Nufcor), and AngloGold Ashanti’s entire interest in Margaret Water Company NPC (MWC). The transaction was completed on 28 February 2018, as all the conditions contained in the SPA were fulfilled and the ownership of the Moab Mining Sale Asset has been transferred to Harmony, in addition to all of AngloGold Ashanti’s obligations related to Nufcor and MWC, including in the case of MWC, all of AngloGold Ashanti’s obligations with regards to the pumping and efficient management of the underground water in the Vaal River region (the KOSH Water Directive).
The Transaction consideration received will be utilised by AngloGold Ashanti to further reduce debt and strengthen the company's balance sheet affording AngloGold Ashanti greater strategic flexibility to fund its growth initiatives including its development projects. All of AngloGold Ashanti’s obligations and liabilities (including all employee and health and safety obligations other than any claim related to occupational lung disease for the period prior to the Closing Date), as well as all environmental obligations related to the Moab Mining Sale Assets arising on, before or after the Closing Date were transferred to Harmony.
This risk is also significant in Ghana, where ongoing restructuring and repositioning of the Obuasi mine has resulted in halting of the mine’s existing operations and significant workforce redundancies. In 2014 alone, these redundancies resulted in the company incurring $210 million in retrenchment costs. In February 2018, AngloGold Ashanti signed regulatory and fiscal agreements with the government of Ghana that will provide the framework for the redevelopment of the Obuasi mine into a modern, productive mining operation. The government of Ghana and the company have put in place several agreements including a development agreement, tax concession agreement, security agreement and a reclamation security agreement. The tax concession agreement and the development agreement must now both be ratified by Ghana's parliament to be made effective. The process requires that the speaker or his deputy formally refer the agreements to the Select Committee of Mines & Energy and the Standing Finance Committee. The two committees will review the agreements and send a report to the main house, upon which parliament would decide on ratification.
The environment impact assessment process has been completed and the permits are pending. The redevelopment is expected to establish Obuasi as a mechanised underground mining operation and is a fundamental departure from how the mine was operated in the past. The redevelopment is expected to make use of automation and controls for improved operational efficiencies and consistency in performance. The project implementation be undertaken in two distinct phases and is expected to take roughly 18
41
months, with the first gold pour anticipated for the third quarter of 2019. Unforeseen difficulties, delays or costs may adversely affect the implementation of this project and the company may be unsuccessful in meeting this production, cost and return target.
Finally, this risk may also be high in the DRC, in light of the recently announced mining code reform. See “- AngloGold Ashanti’s mining rights in the countries in which it operates could be altered, suspended or cancelled for a variety of reasons, including breaches in its obligations in respect of such mining rights”.
In addition, these measures may not be implemented as planned, may turn out to be less effective than anticipated, may only become effective later than anticipated or may not be effective at all. Any of these outcomes, individually or in combination, may adversely impact the company’s business, results of operations and financial condition.
Expectations for and trends in the price of gold, combined with increased costs for project financing and exploration in certain regions, have led AngloGold Ashanti to increase its efforts to focus capital expenditure on its highest quality assets, whilst freeing up capital by curtailing capital expenditure or suspending operations at those projects that the company believes are of lower quality. AngloGold Ashanti may also consider finding partners or conducting asset sales relating to certain of its projects. With respect to dispositions, the company may not be able to obtain prices that it expects for the assets it seeks to dispose of or to divest some of its activities as planned or to obtain all of the required approvals, and the divestitures that are carried out could have a negative impact on AngloGold Ashanti’s business, results of operations, financial condition and reputation, including as a result of subsequent claims brought by acquirers in connection with divested assets.
AngloGold Ashanti may also prove unable to deliver on production targets, including in potentially critical areas, as well as on the timely, cost-effective and successful execution, including ramping-up, of key capital projects. For example, in South Africa, the company has been experiencing declining production rates (903,000 ounces in 2017, 967,000 ounces in 2016, compared with 1.00 million ounces of gold in 2015, 1.22 million ounces of gold in 2014, and 1.30 million ounces in 2013), principally due to continued safety and associated stoppages, mining flexibility constraints and overall falls in grades. In addition, Colombia is an untested jurisdiction, so permitting, licensing, stakeholder expectations and demands and other external factors could affect timelines and cause capital overruns. Unforeseen difficulties, delays or costs may adversely affect the successful implementation of the company’s business strategy and projects, and such strategy and projects may not result in the anticipated benefits, which could have a material adverse effect on its results of operations, financial condition and prospects.
Labour unrest, activism and disruptions (including protracted stoppages) could have a material adverse effect on AngloGold Ashanti’s results of operations and financial condition.
AngloGold Ashanti’s employees in South Africa, Ghana, Guinea, Mali, Brazil and Argentina are highly unionised and unions are active at some of the company's other operations. Trade unions, therefore, have a significant impact on the general labour relations environment, including labour relations at an operational level. The extent of the unions’ influence also impacts the socio-economic and socio-political operating environments, most notably in South Africa. Union involvement in wage negotiations and collective bargaining increases the risk of strike action. For example, in South Africa, the emergence and growth of the Association of Mining Construction Union (AMCU) challenging the dominance of the longstanding National Union of Mineworkers (NUM) lends itself to conflict, inter union rivalry and a risk of labour relations instability. Management expects that unions will continue to use their collective power and ability to withhold labour to advocate for improved conditions of employment, labour regulatory change, political and social goals in the future.
Under the prevailing unstable global economic climate in particular, unions could utilise disruptions, strikes and protest action to oppose restructuring and downscaling of the mining industry. In South Africa, a variety of legacy issues such as housing, migrant labour, education, poor service delivery and youth unemployment can lead to communities and unions working together to create instability in and around mining operations. As such, there is a risk to the safety of people and damage to company infrastructure and property.
The contagion effect of a wave of unprotected strike action and labour unrest which occurred in South Africa and particularly in the mining sector during 2012 led to a six-week unprotected strike at all of AngloGold Ashanti’s South African operations in September of that year. The strike action was fuelled by several issues, including the emergence of AMCU, expectations of higher wage increases, and general social and economic conditions. Similar disruptions in the future may have a material adverse effect on the company’s results of operations and financial condition.
In South Africa, a three-year wage agreement was reached in 2015 with unions representing the majority of the company’s employees. This agreement was extended to all employees irrespective of their union affiliation. However, AMCU did not sign the agreement and through the courts challenged the extension of the agreement’s terms to its members. Although the courts found in favour of the mining companies, the success of similar challenges could have an adverse impact on the company’s financial condition as a result of increases in labour costs. See “-Increased labour costs could have a material adverse effect on AngloGold Ashanti’s results of operations and financial condition”.
In South Africa, the broader labour relations climate remains fragile. Wage negotiations in other industries and other mining sectors may influence the stance unions adopt leading up to the 2018 gold negotiations. The labour relations climate is further exacerbated by a number of other issues such as (i) pressure building amongst all unions and employees regarding legislation reform affecting
42
pensions and provident funds; (ii) demonstrations by citizens and students about public services and free education; (iii) public outcry relating to racism; and (iv) the effect of confrontations between political parties in the lead-up to elections, all of which may have repercussions in the workplace.
In South Africa, AngloGold Ashanti's ability to undertake a restructuring of mining operations that could result in layoffs or redundancies is curtailed by governmental intervention. Going forward, management expects that the Department of Minerals and Resources will invoke its powers to intervene in any such restructuring process and will be able to place pressure on mining companies due to its control over the renewal and cancellation of mining rights.
In West Africa, union negotiations are increasingly impacted by a focus on broader social grievances. In Mali and Guinea, pro-labour and pro-union practices supported by government labour authorities may result in increased labour union activity and the breach of obligations contained in agreements with labour unions.
Any future labour unrest and disruptions could have a material adverse effect on AngloGold Ashanti’s results of operations and financial condition.
Increased labour costs could have a material adverse effect on AngloGold Ashanti’s results of operations and financial condition.
Labour costs represent a substantial proportion of the company’s total operating costs and at many operations in South Africa and the Americas, constitute approximately 40 to 50 percent of the operations’ operating costs. Absent any simultaneous increase in productivity, any change to the company’s wage agreements or other factors that could increase labour costs may have a material adverse effect on AngloGold Ashanti’s results of operations and financial condition.
AngloGold Ashanti’s results may be further impaired if the company incurs penalties for failing to meet standards set by labour laws regarding workers’ rights or incurs costs to comply with new labour laws, rules and regulations. For example, employment law in South Africa imposes monetary penalties for neglecting to report to government authorities on progress made towards achieving employment equity in the workplace. Ghanaian law also contains broad provisions requiring mining companies to recruit and train Ghanaian personnel and to use the services of Ghanaian companies. In Australia, the federal government put in place an industrial relations system that includes “good faith bargaining” obligations for employers, fewer restrictions on the content of collective agreements and an enhanced role for union officials as bargaining representatives, parties to agreements and participants in dispute resolution. Penalties and compliance costs, as well as increased costs due to laws and regulations less favourable to employers, could have a material adverse effect on the company’s results of operations and financial condition.
Illegal and artisanal mining occurs on AngloGold Ashanti’s properties, which can disrupt the company’s business and expose the company to liability.
Illegal and artisanal miners are active on, or adjacent to at least 11 of AngloGold Ashanti’s properties, which leads at times to interference with the company’s operations and results in conflict that presents a security threat to property and human life. Illegal artisanal and small-scale mining is associated with a number of negative impacts, including environmental degradation, flouting of land rights, poor working practices, erosion of civil society, human rights abuse and funding of conflict. The environmental, social, safety and health impacts of artisanal mining are frequently attributed to formal mining activity, and it is often assumed that artisanally-mined gold is channelled through large-scale mining operators, even though artisanal and large-scale miners have distinct supply chains. These misconceptions impact negatively on the reputation of the industry.
The activities of the illegal miners, which include theft and shrinkage, could cause damage to AngloGold Ashanti’s properties, including pollution, underground fires, or personal injury or death, for which AngloGold Ashanti could potentially be held responsible. Illegal mining could result in the depletion of mineral deposits, potentially making the future mining of such deposits uneconomical. The presence of illegal miners could lead to project delays and disputes regarding the development or operation of commercial gold deposits. Furthermore, in 2011 and 2012, the company recorded an increase in the number and severity of security incidents, due to a steady migration of people into the areas and an increase in the level of organisation and funding of criminal activity around some of the company’s Continental African operations, likely encouraged by an escalating gold price at that time. The most significant security challenges have occurred in Tanzania and Ghana in areas where there is endemic poverty and high levels of unemployment. For example, in February 2016, AngloGold Ashanti withdrew its employees performing non-essential functions from its idled Obuasi gold mine following the incursion of illegal miners inside the fenced areas of the site. An AngloGold Ashanti employee was killed in the incursions. More generally, illegal mining and theft could also result in lost gold Ore Reserve, mine stoppages, and have other material adverse effects on AngloGold Ashanti’s results of operations or financial condition.
AngloGold Ashanti competes with mining and other companies for key human resources with critical skills and its inability to retain key personnel could have an adverse effect on its business.
AngloGold Ashanti competes on a global basis with mining and other companies to attract and retain key human resources at all levels with the appropriate technical skills and operating and managerial experience necessary to operate and supervise its business. This is exacerbated by the global shortage of persons with critical mining skills, including geologists, mining engineers, metallurgists and skilled artisans. Furthermore, the often remote locations of mining operations may make the mining industry unattractive to
43
potential employees. Changes in taxation and the regulatory environment where AngloGold Ashanti operates may also impact the company’s ability to attract and retain key personnel, especially those from abroad.
The retention of staff is particularly challenging in South Africa, where, in addition to the impacts of global industry shortages of skilled labour, AngloGold Ashanti is required to achieve employment equity targets of participation by HDSAs in management and other positions. AngloGold Ashanti competes with all companies in South Africa to attract and retain a small but growing pool of HDSAs with the necessary skills and experience. AngloGold Ashanti has historically faced difficulty recruiting and retaining young graduates and qualified mid-level management in South Africa and may encounter greater difficulties in the future as the government attempts to impose increasingly stringent HDSA participation requirements. See “-AngloGold Ashanti’s mining rights in the countries in which it operates could be altered, suspended or cancelled for a variety of reasons, including breaches in its obligations in respect of such mining rights” and “Item 4B: Business Overview-The Regulatory Environment Enabling AngloGold Ashanti to Mine”. Recruitment of skilled personnel has also been challenging in Continental Africa due to university offerings that are often not well-suited to the specific needs of the mining industry, as well as other factors such as language barriers and low literacy skills.
The recruitment of skilled workers is also highly competitive in South America as a result of a shortage of skills and intense competition between mining companies.
Additionally, the company may incur significant costs to build talent, capacity and expertise across its global operations. Despite AngloGold Ashanti’s investments, the company may not be able to retain and attract sufficient skilled and experienced employees in all areas of the business. Should it fail to do so or lose any of its key personnel with critical skills, business and growth prospects may be harmed and this could have an adverse impact on AngloGold Ashanti’s results of operations and financial condition.
AngloGold Ashanti’s inability to retain its senior management may have an adverse effect on its business.
The company’s success depends largely upon the continued service of its senior management, including its chief executive officer, chief financial officer, the executive officers at each of its business divisions and the general managers at its mines.
The loss of one or more members of the senior management teams, coupled with the reduced attractiveness of the gold mining sector, could lead to other members of the management team leaving, disrupt the company’s operations, and have a material adverse impact on the company’s business, results of operations and financial condition.
The use of contractors at certain of the company’s operations may expose AngloGold Ashanti to delays or suspensions in mining activities and increases in mining costs.
AngloGold Ashanti uses contractors at certain of its operations to mine and deliver ore to processing plants as well as for other purposes. At mines employing mining contractors, contracting costs represent a significant proportion of the total operating costs of these operations. For example, increased contractor rates at the Sadiola mine in Mali contributed to a significant rise in total cash costs in the final quarter of 2011. Increased contractor costs at Sunrise Dam in Australia and Geita in Tanzania contributed to higher cash costs in the first quarter of 2012.
AngloGold Ashanti’s operations could be disrupted, resulting in additional costs and liabilities, if the mining contractors at affected mines have financial difficulties, or if a dispute arises in renegotiating a contract, or if there is a delay in replacing an existing contractor and its operating equipment to meet business needs at expected cost levels. Increases in contract mining rates, in the absence of associated productivity increases, will also have an adverse impact on the company’s results of operations and financial condition. For example, on 13 October 2012, AngloGold Ashanti terminated the underground development contract with a third-party contractor at the Obuasi mine in Ghana. The costs of the termination amounted to $17 million. On 10 February 2014 workers employed by a contractor at Sadiola and Yatela went on a five-day strike demanding improved redundancy payments. See “-Labour unrest, activism and disruptions could have a material adverse effect on AngloGold Ashanti’s results of operations and financial condition”. Furthermore disagreements over costs with contractors at Siguiri in Guinea and Iduapriem in Ghana resulted in a dispute in 2015.
Contractor disputes can also arise after the termination of the contractual relationship or the sale of the applicable mine. For example, the company is currently involved in arbitration proceedings with contractors in Ghana with regard to its Obuasi mine and in the United States with regard to its former Cripple Creek & Victor mine. See “Item 8A: Legal Proceedings”.
In addition, AngloGold Ashanti’s reduced control over those aspects of operations which are the responsibility of contractors, their failure to comply with applicable legal, human rights and regulatory requirements, or their inability to manage their workforce or provide high quality services or a high level of productivity could adversely affect AngloGold Ashanti’s reputation, results of operations and financial condition, and may result in the company’s incurrence of liability to third parties due to the actions of contractors.
The level of AngloGold Ashanti’s indebtedness could adversely impact its business.
As at 31 December 2017, AngloGold Ashanti had gross borrowings of $2.190 billion (2016: $2.101 billion), excluding all finance leases.
44
AngloGold Ashanti’s indebtedness could have a material adverse effect on its flexibility to conduct business. For example, the company may be required to use a large portion of its cash flow to pay the principal and interest on its debt, which will reduce funds available to finance existing operations and the development of new organic growth opportunities and further acquisitions. In addition, under the terms of the company’s borrowing facilities from its banks, AngloGold Ashanti is obliged to meet certain financial and other covenants. AngloGold Ashanti’s ability to continue to meet these covenants and to service its debt will depend on its future financial performance, which will be affected by its operating performance as well as by financial and other factors, including in particular the gold price, certain of which are beyond its control.
Should the cash flow from operations be insufficient, AngloGold Ashanti could breach its financial and other covenants. Covenant breaches, if interpreted as events of default under one or more debt agreements, could allow lenders to accelerate payment of such debt. Any such acceleration could result in the acceleration of indebtedness under other financial instruments. As a result, the company may be required to refinance all or part of the existing debt, use existing cash balances, issue additional equity or sell assets. However, the company may be unable to sell assets on reasonable or profitable terms as and when necessary. Additionally, AngloGold Ashanti cannot be sure that it will be able to refinance its debt on commercially reasonable terms, if at all. The company’s ability to access the bank, public debt or equity capital markets on an efficient basis may be constrained by dislocation in the credit markets or capital and liquidity constraints in the banking, debt or equity markets at the time of issuance.
Any downgrade of credit ratings assigned to AngloGold Ashanti’s debt securities could increase future interest costs and adversely affect the availability of new financing.
An actual, anticipated or unexpected negative development of AngloGold Ashanti’s results of operations or cash flows, country risk, financial metrics, or an increase in net debt position could result in a deterioration of the company’s credit ratings. AngloGold Ashanti’s ratings are influenced inter alia, by the location of its domicile and its operations.
On 24 November 2017, S&P Global downgraded South Africa’s credit rating to full sub-investment grade, while its counterpart Moody’s placed the country on review for downgrade. S&P’s announcement followed a similar announcement by Fitch, affirming South Africa’s rating at sub-investment grade on 23 November 2017. Moody’s decision to put South Africa on review, rather than downgrade it outright, means that South Africa can remain in key global bond indices such as the Citigroup World Bond Index (WGBI). Moody’s held South Africa local and foreign issued debt on the cusp of investment and sub-investment grade. Membership in the WGBI requires that at least Moody’s or S&P Global rates a country’s local currency rating as investment grade.
Moody's on 23 March 2018 affirmed South Africa's investment-grade credit rating at Baa3 and revised its credit outlook to stable from negative.
Any further downgrade by any rating agency could increase the company’s cost of capital, reduce its investor base and have a material adverse effect on AngloGold Ashanti’s business, results of operations and financial condition.
AngloGold Ashanti expects to have significant financing requirements.
AngloGold Ashanti’s existing board-approved development projects and exploration initiatives will require significant funding.
The company’s capital expenditure plans and requirements are subject to a number of risks, contingencies and other factors, some of which are beyond its control, including volatile or sustained lower gold prices, and therefore the actual future capital expenditure and investments may differ significantly from the current planned amounts.
As a result, new sources of capital may be needed to help meet the funding requirements of these developments, to fund ongoing business activities and to pay dividends. AngloGold Ashanti’s ability to further raise and service significant new sources of capital will be a function of macroeconomic conditions, the condition of the financial markets, future gold prices, the company’s operational performance and operating cash flow and debt position, amongst other factors. The company’s ability to raise further debt financing in the future and the cost of such financing will depend on, amongst other factors, its prevailing credit rating, which may be affected by the company’s ability to maintain its outstanding debt and financial ratios at levels acceptable to the credit ratings agencies, its business prospects, risks relating to the countries in which it operates or other factors. As a result, in the event of depressed gold prices, unanticipated operating or financial challenges, any dislocation in financial markets or new funding limitations, AngloGold Ashanti’s ability to pursue new business opportunities on reasonable terms, invest in existing and new projects, fund its ongoing business activities, exit projects and retire or service outstanding debt and pay dividends could be significantly constrained, all of which could adversely impact the company’s results of operations and financial condition.
Certain factors may affect AngloGold Ashanti’s ability to support the carrying amount of its property, plant and equipment, intangible assets and goodwill on the balance sheet. If the carrying amount of its assets is not recoverable, AngloGold Ashanti may be required to recognise an impairment charge, which could be significant.
AngloGold Ashanti reviews and tests the carrying amount of its assets when events or changes in circumstances suggest that the carrying amount may not be recoverable. The company values individual mining assets at the lowest level for which cash flows are identifiable and independent of cash flows of other mining assets and liabilities.
45
If there are indications that impairment may have occurred, AngloGold Ashanti prepares estimates of a recoverable amount for each group of assets. Expected future cash flows are inherently uncertain, and could materially change over time. Recoverable amounts are significantly affected by Ore Reserve and production estimates, together with economic factors such as spot and forward gold prices and currency exchange rates, as well as discount rates and estimates of costs to produce Ore Reserves and future capital expenditure. Estimated rehabilitation and closure costs could also materially affect the company’s financial performance and could result in the need to recognise an impairment charge.
If any of these uncertainties occur, either alone or in combination, management could be required to recognise an impairment, which could have a material adverse effect on the company’s results of operations and financial condition. For example, during 2017, AngloGold Ashanti reviewed the carrying value of its mining assets, goodwill and intangibles and due to a change in mine plans to restructure the South African operations, certain assets were impaired. In addition, in October 2017, AngloGold Ashanti announced the sale of various South African assets (including the Moab Khotsong mine) which were then written down to fair value less costs to sell. The company booked a charge of $297 million in relation to impairments and derecognition of its mining assets and goodwill. The impairment charge for the Moab Khotsong mine was $112 million.
AngloGold Ashanti is subject to the risk of litigation, the causes and costs of which are not always known.
AngloGold Ashanti is subject to litigation, arbitration and other legal proceedings arising in the normal course of business and may be involved in disputes that may result in litigation. The causes of potential future litigation cannot be known and may arise from, amongst other things, business activities, environmental and health and safety concerns, share price volatility or failure to comply with disclosure obligations. The results of litigation cannot be predicted with certainty but could include costly damage awards or settlements, fines, and the loss of licenses, concessions, or rights, amongst other things.
In the event of a dispute, AngloGold Ashanti may be subject to the exclusive jurisdiction of foreign courts or may not be successful in subjecting foreign persons to the jurisdiction of courts in South Africa. An adverse or arbitrary decision of a foreign court could have a material adverse impact on AngloGold Ashanti's financial performance, cash flow and results of operation.
AngloGold Ashanti is subject to numerous claims, including class actions or similar group claims relating to silicosis and other OLD, and could be subject to similar claims in the future. Settlement negotiations in the silicosis class action claims have reached an advanced stage and a provision for silicosis has been made. The carrying value of the silicosis provision at 31 December 2017 was $63m. Significant judgement was applied in estimating the costs that will be incurred to settle the silicosis class action claims and related expenditure and the final costs may differ from current cost estimates. Management believes the assumptions are appropriate, however changes in the assumptions may materially affect the provision and final costs of settlement. There can be no assurance that the ultimate resolution of this matter will not result in losses in excess of the recorded provision and the ultimate settlement may have a material adverse effect on AngloGold Ashanti’s financial position. For further information, see “Item 8A: Legal Proceedings - South Africa - Silicosis litigation”and "Item 18: Financial Statements - Note 1 - Accounting Policies - Provision for silicosis".
It is possible that additional class actions and/or individual claims relating to silicosis and/or other OLD will be filed against AngloGold Ashanti in the future. AngloGold Ashanti will defend all and any subsequent claims as filed on their merits. Should AngloGold Ashanti be unsuccessful in defending any such claims, or in otherwise favourably resolving perceived deficiencies in the national occupational disease compensation framework that were identified in the earlier decision by the Constitutional Court, such matters would have an adverse effect on its financial position, which could be material.
In Colombia, the company is also involved in class action lawsuits in relation to AGAC’s Santa Maria-Montecristo and La Colosa projects. One of these class action lawsuits led to a preliminary injunction suspending the mining concession contracts of the Santa Maria-Montecristo project in September 2011. Additionally, in Colombia, AGAC is involved in an action in the Administrative Superior Court of the Cundinamarca District against the Department of the Environment, Housing and Territorial Development (DoE) following its issuance of a fine against AGAC on the basis that AGAC was in breach of its mining terms of reference. The company’s core mining concession contracts provide that the mining authority has the discretion to declare the underlying concession void if AGAC breaches applicable environmental laws or regulations. If the mining authority were to exercise such discretion against AGAC, AGAC would be required to abandon its projects and all of its other existing mining concession contracts. Pending proposals for new mining concession contracts would also be cancelled and AGAC would be banned from doing business with the Colombian government for a period of five years. See “Item 8A: Legal Proceedings - Colombia”.
Should the company be unable to resolve disputes favourably or to enforce its rights, this may have a material adverse impact on the company’s financial performance, cash flow and results of operations.
AngloGold Ashanti does not have any gold hedging instruments which exposes it entirely to commodity price decreases.
AngloGold Ashanti removed the last of its gold hedging instruments in October 2010 to provide greater participation in a rising gold price environment. As a result, AngloGold Ashanti no longer has any protection against declines in the market price of gold. The sustained decline in the price of gold experienced from 2011 through 2015 has had an adverse impact on the company’s financial condition and further deterioration could have a material adverse impact on the company’s operating results and its financial condition.
46
Any acquisition or acquisitions that AngloGold Ashanti may complete may expose the company to new geographic, political, legal, social, operating, financial and geological risks.
AngloGold Ashanti may pursue the acquisition of producing, development and advanced stage exploration properties and companies. Any such acquisition may change the scale of the company’s business and operations and may expose it to new geographic, geological, political, social, operating, financial, legal, regulatory and contractual risks. For example, there may be a significant change in commodity prices after the company has committed to complete the transaction and established the purchase price or share exchange ratio; a material ore body may prove below expectations; AngloGold Ashanti may have difficulty integrating and assimilating the operations and personnel of any acquired companies, realising anticipated synergies and maximising the financial and strategic position of the combined enterprise, and maintaining uniform standards, policies and controls; the integration may disrupt the company’s ongoing business and its relationships with employees, suppliers and contractors; and the acquisition may divert management’s attention from AngloGold Ashanti’s day-to-day business. Furthermore, the company operates and acquires businesses in different countries, with different regulatory and operating cultures, which may exacerbate the risks described above. In addition, the acquired business may have undetected liabilities which may be significant.
In the event that the company chooses to raise debt capital to finance any acquisition, the company’s leverage will be increased. Should the company choose to use equity as consideration for an acquisition, existing shareholders may suffer dilution. Alternatively, the company may choose to finance any acquisition with its existing resources, which could decrease its ability to fund future capital expenditures.
The company may not be successful in overcoming these risks or any other problems encountered in connection with acquisitions. Failure by AngloGold Ashanti to implement its acquisition strategy or to integrate acquired businesses successfully could have material adverse effects on its growth, financial performance and results of operations.
Ageing infrastructure at some of AngloGold Ashanti’s operations could adversely impact its business.
Deep level gold mining shafts are usually designed with a lifespan of 25 to 30 years. Vertical shafts consist of large quantities of infrastructure steelwork for guiding conveyances and accommodating services such as high and low tension electric cables, air and water pipe columns. Rising temperatures in the deeper mining areas can also lead to increased cooling requirements in the form of upgraded and expanded ice plants. Maintaining this infrastructure requires skilled human resources, capital allocation, management and planned maintenance. Once a shaft has reached the end of its intended lifespan, increased maintenance and care is required. Incidents resulting in production delays, increased costs or industrial accidents may occur. Such incidents may have an adverse effect on the company’s results of operations and financial condition.
Asset integrity and reliability issues relating to ageing infrastructure are of concern at many of the company's operations, but are of particular concern in South Africa. Furthermore in Tanzania, cracks were discovered in the mill feed end in September 2008 and at the discharge end in February 2010 at the Geita gold mine. The Geita gold mine is one of the group’s principal assets and sources of cash flow. After initial repairs, the feed end was replaced during May and June 2011. Production throughput in 2011 was one million tonnes lower than planned, as a result of mill downtime that included feed end replacement. The Geita gold mine produced approximately 531,000 ounces in 2012, with production throughput approximately 100,000 tonnes short of budget. A decision was subsequently taken to replace the entire mill as a result of shell distortion. After new mill manufacture delays, installation was completed during March 2013. Ageing infrastructure may have an adverse effect on the company’s results of operations and financial condition in the future.
Some of AngloGold Ashanti’s technologies are unproven and the failure of such technologies could adversely impact costs and production.
AngloGold Ashanti has created a Technology Innovation Consortium (ATIC) and teamed up with various specialists to engineer new solutions to environmental management, mine design, mining technology and methods and underground logistics, amongst other matters. The company has invested in new technologies, including phyto-technologies to reduce seepage and address soil and groundwater contamination, and in-mine support technologies to minimise the impact of seismic activity. The company is also attempting to develop technologies to access the deeper reaches of its South African mines, including thermal spalling and an ultra-high strength backfill product and system.
Some aspects of these technologies are unproven and their eventual operational outcome or viability cannot be assessed with certainty. AngloGold Ashanti may be unable to successfully put into operation the technological step changes developed and proposed by ATIC. The costs, productivity and other benefits from these initiatives, and the consequent effects on AngloGold Ashanti’s future earnings and financial condition, may vary from expectations. The company’s failure to realise the anticipated benefits could result in increased costs, an inability to realise production or growth plans, or adversely affect its operational performance.
47
AngloGold Ashanti does not have full management control over some of its significant joint venture projects and other interests. If the operators of these projects do not manage these effectively and efficiently, the company’s investment in these projects could be adversely affected and its reputation could be harmed.
AngloGold Ashanti’s joint ventures at Morila in Mali and at Kibali in the DRC are managed by the company’s joint venture partner Randgold Resources Limited (Randgold). In addition, certain of AngloGold Ashanti’s exploration ventures are managed by the relevant joint venture partner.
Whilst AngloGold Ashanti provides strategic management and operational advice to its joint venture partners in respect of these projects, the company cannot ensure that these projects are operated in compliance with the standards that AngloGold Ashanti applies to its other operations. If these joint ventures are not operated effectively or efficiently, including as a result of weaknesses in the policies, procedures and controls implemented by the joint venture partners, the company’s investment in the relevant project could be adversely affected. In addition, negative publicity associated with operations that are ineffective or inefficiently operated, particularly relating to any resulting accidents or environmental incidents, could harm the company’s reputation and therefore its prospects and potentially its financial condition. Furthermore, any failure of joint venture partners to meet their obligations to AngloGold Ashanti or to third parties, or any disputes with respect to the parties’ respective rights and obligations, could have a material adverse impact on AngloGold Ashanti’s results of operations and financial condition. In particular, the company and Randgold retain equal representation, with neither party holding a deciding vote, on the board of the two companies that have overall management control of the Morila project in Mali and the Kibali project in the DRC, respectively, and all major management decisions for each of these two projects, including approval of the budget, require board approval. If a dispute arises between the company and Randgold with respect to the Kibali or Morila project and the parties are unable to amicably resolve such dispute, it may be difficult for the parties to make strategic decisions relating to the project affected by such dispute, the day-to-day operations and the development of such project may be adversely affected and the company may have to participate in proceedings to resolve the dispute, which could adversely affect the company’s results of operations and financial condition.
AngloGold Ashanti’s joint venture partners may have economic or business interests or goals that are not consistent with the company’s or may, as a result of financial or other difficulties, be unable or unwilling to fulfill their obligations under the joint venture or other agreements. Disputes between the company and its joint venture partners may lead to legal action, including litigation between AngloGold Ashanti and its joint venture partners. Such disputes could adversely affect the operation of the joint venture, may prevent the realisation of the joint ventures’ goals and could adversely affect AngloGold Ashanti's investment in the joint venture or harm the company's reputation. There is no assurance that the company’s joint venture partners will continue their relationship with the company in the future or that the company will be able to achieve its financial or strategic objectives relating to the joint ventures.
The prevalence of occupational health diseases and other diseases and the potential costs and liabilities related thereto may have an adverse effect on the business and results of operations of AngloGold Ashanti.
The primary areas of focus in respect of occupational health of employees within the company’s operations are noise-induced hearing loss and occupational lung diseases (OLD), which include pulmonary diseases such as tuberculosis from various causes and silicosis in individuals exposed to silica dust. These risks require active dust management strategies in underground operations, particularly in South Africa where a significant number of silicosis cases by current and former employees alleging past exposures are still reported each year to the board for statutory compensation. AngloGold Ashanti provides occupational health services to its employees at its occupational health centres and clinics and runs preventative occupational hygiene initiatives, such as implementing various dust control measures and supplying the company’s employees with respiratory protection equipment. If the costs associated with providing such occupational health services, implementing such dust control measures or supplying such equipment increase significantly beyond anticipated or budgeted amounts, this could have an adverse effect on AngloGold Ashanti’s results of operations and financial condition. Actual and alleged health and safety incidents or breaches of standards may also adversely impact the company’s reputation.
AngloGold Ashanti is currently subject to numerous claims, including class action litigation, with respect to alleged occupational lung diseases (see “-AngloGold Ashanti is subject to the risk of litigation, the causes and costs of which are not always known”). AngloGold Ashanti is working with other mining companies to engage with government (and other stakeholders) to seek an appropriate industry-wide solution. Settlement negotiations in the company’s silicosis class action claims have reached an advanced stage and a provision for silicosis has been made. An industry-wide solution may not be reached or the terms of any such solution may have a material adverse effect on AngloGold Ashanti’s financial condition. See “Item 8A: Legal Proceedings” and “Item 18: Note 33 - Contractual Commitments and Contingencies”.
In response to the effects of silicosis in labour-sending communities, a number of mining companies (under the auspices of the Chamber of Mines of South Africa) together with the NUM, which is the largest union in the mining sector in South Africa, and the national and regional departments of health, have embarked on a project to assist in delivering compensation and relief by mining companies under the Occupational Diseases in Mines and Works Act (ODMWA) to affected communities.
48
AngloGold Ashanti also faces certain risks in dealing with HIV/AIDS, particularly at its South African operations, and with tropical disease outbreaks such as malaria, and other diseases which may have an adverse effect on the company’s results of operations and financial condition. AIDS and associated diseases remain one of the major health care challenges faced by AngloGold Ashanti’s South African operations. Workforce prevalence studies indicate that HIV prevalence rates amongst AngloGold Ashanti’s South African workforce may be as high as 30 percent.
Malaria and other tropical diseases pose significant health risks at all of the company’s operations in central, west and east Africa where such diseases may assume epidemic proportions because of ineffective national control programmes. Malaria is a major cause of death in young children and pregnant women in these areas but also gives rise to fatalities and absenteeism in adult men. Other conditions such as heart disease, chronic diseases and obesity are of increasing incidence and concern.
Such diseases impair the health of workers and negatively affect productivity and profitability as a result of workers’ diminished focus or skill, absenteeism, treatment costs and allocated resources. Any current or future medical programme may not be successful in preventing or reducing the infection rate amongst AngloGold Ashanti’s employees or in affecting consequent illness or mortality rates. AngloGold Ashanti may incur significant costs in addressing these issues in the future, which could also adversely impact the company’s results of operations and financial condition.
The costs and impacts associated with the pumping of water inflows from closed mines adjacent to the company’s operations could have an adverse effect on its results of operations.
Certain of AngloGold Ashanti’s mining operations are located adjacent to the mining operations of other mining companies. The closure of a mining operation may have an impact upon continued operations at the adjacent mine if appropriate preventative steps are not taken, including the ingress of underground water when pumping operations at the adjacent closed mine are suspended. Such ingress could have an adverse effect on any one of the company’s mining operations as a result of property damage, disruption to operations, additional pollution liabilities and pumping costs and, consequently, could have an adverse impact on its results of operations and financial condition. For example, in the West Wits district, Blyvooruitzicht Gold Mining Company was placed in provisional liquidation in August 2013. AngloGold Ashanti secured a court order for access rights to Blyvoor 4 and 6 shafts to keep pumping going. AngloGold Ashanti also incorporated Covalent Water Company, which purchased rights of access and electricity to the 4 and 6 shafts as well as the relevant infrastructure, to continue pumping underground water. This has reduced the risk of flooding at the company’s West Wits Operations, but flooding in the future could pose an unpredicted “Force Majeure” type event, which could have an adverse impact on its results of operations and financial condition. Additional infrastructure is being installed at Covalent Water Company 4 Shaft in the B2 decline to mitigate risk and allow pumping closer to source.
The potential costs associated with the remediation and prevention of groundwater contamination from the company’s operations or due to flooding from closed mines adjacent to the company’s operations could have a material adverse effect on AngloGold Ashanti’s results of operations and financial condition.
AngloGold Ashanti has identified groundwater contamination plumes at certain of its operations that have occurred primarily as a result of seepage from surface operations and facilities, including tailings storage facilities and waste rock piles.
In addition, deep groundwater contamination is a significant issue in South Africa, where groundwater in some older mining regions has infiltrated mined-out workings. Potential contamination risk to shallow ground and surface water resources can occur when water is exposed to sulphide-bearing rock in such situations. AngloGold Ashanti has identified a flooding and future pollution risk posed by deep groundwater in the Far West Rand goldfields. AngloGold Ashanti’s West Wits operations are part of the Far West Rand goldfields. As a result of the interconnected nature of underground mining operations in South Africa, any proposed solution for deep groundwater contamination needs to be a combined one supported by all the companies owning mines located in these goldfields.
In view of the limitation of current information for the accurate estimation of liabilities, no reliable estimate can be made for these obligations. The potential costs of remediation and prevention of groundwater contamination at AngloGold Ashanti’s operations could be significant and may have a material adverse impact on AngloGold Ashanti’s results of operations and financial condition
.
The occurrence of events for which AngloGold Ashanti is not insured or for which its insurance is inadequate may adversely affect cash flows and overall profitability.
AngloGold Ashanti maintains insurance to protect against events which could have a significant adverse effect on its operations and profitability. This insurance is maintained in amounts that the company believes to be reasonable depending upon the circumstances surrounding each identified risk. However, damage and third-party claims arising from catastrophic events may exceed the limit of liability covered under these insurance policies. Furthermore, AngloGold Ashanti’s insurance does not cover all potential risks associated with its business and may exclude certain parts of its business. AngloGold Ashanti may elect not to insure certain risks due to the high premiums or for various other reasons, including an assessment that the risks are remote.
In order to mitigate the cost of its insurance program, AngloGold Ashanti may in some instances retain a portion of the financial loss associated with an insurable event. These financial losses could be significant and could have an adverse effect on its financial condition.
49
Insurance for certain risks in particular, such as loss of title to mineral property, political risks in certain jurisdictions, environmental pollution, or other hazards resulting from exploration and production, is not generally available to mining companies on acceptable terms. The availability and cost of insurance coverage can vary considerably from year to year as a result of events beyond the company’s control or as a result of previous claims. This can result in higher premiums and periodically being unable to maintain the levels or types of insurance the company typically carries.
The failure to obtain adequate insurance could impair the company’s ability to continue to operate in the normal course of its business. This could adversely impact its cash flows, results of operations and financial condition.
The implementation of an integrated Enterprise Resource Planning (ERP) system could have an adverse effect on AngloGold Ashanti’s results of operations and financial condition.
AngloGold Ashanti continues to implement a single, global ERP system to support all the operations that it manages. The oneERP project for Obuasi Mine in Ghana was approved in February 2018. This project will commence during March 2018 with a planned go-live date of 13 August 2018. The SAP payroll implementation will follow with go-live planned for September 2018. The only remaining site that is not included in the global oneERP system is Sadiola Mine in Mali.
The implementation and operationalisation of an ERP system on a global basis is an inherently high-risk initiative due to the potential for implementation cost and time overruns. In addition, if AngloGold Ashanti experiences difficulties with the implementation and operation of the system, the company’s ability to report and manage technical and financial information could be compromised, which could have an adverse effect on the company’s results of operations and financial condition.
Any similar future problems with the implementation, operation or maintenance of the ERP system could have an adverse effect on the company’s financial condition.
Sales of large quantities of AngloGold Ashanti’s ordinary shares and American Depository Shares (ADSs), and the perception that these sales may occur or other dilution of the company’s equity, could adversely affect the prevailing market price of the company’s securities.
The bulk of AngloGold Ashanti’s shares are held by a relatively small number of investors. According to information available to the company, AngloGold Ashanti’s five largest shareholders beneficially owned 28.68 percent and the top 10 largest beneficially owned 43.66 percent of AngloGold Ashanti’s ordinary shares as at 31 December 2017.
Poor returns, soaring costs, higher capital expenditure, ill-conceived corporate activity, rising geopolitical and labour risk, a material decrease in the price of gold and low dividend yields from 2011 through 2015 have resulted in a change in market sentiment towards gold equities. The market price of the company’s securities could fall if large quantities of ordinary shares or ADSs are sold in the public market, if there is divestment by certain types or groupings of investors, or if there is the perception in the marketplace that such sales could occur. Subject to applicable securities laws, holders of the company’s ordinary shares or ADSs may decide to sell them at any time.
The market price of the company’s ordinary shares or ADSs could also fall as a result of any future offerings AngloGold Ashanti makes of its ordinary shares, ADSs, or securities exchangeable or exercisable for the company’s ordinary shares or ADSs, or the perception in the marketplace that these offerings might occur. AngloGold Ashanti may make such offerings, including offerings of additional ADS rights, share rights or similar securities, at any time or from time to time in the future and such offerings could adversely affect the prevailing market price of the company's securities.
Fluctuations in the exchange rate of currencies may reduce the market value of AngloGold Ashanti’s securities, as well as the market value of any dividends or distributions paid by the company.
AngloGold Ashanti has historically declared all dividends in South African rands. As a result, exchange rate movements may have affected the Australian dollar, the British pound, the Ghanaian cedi and the U.S. dollar value of these dividends, as well as of any other distributions paid by the relevant depositary to holders of the company’s securities.
Furthermore, AngloGold Ashanti’s Memorandum of Incorporation allows for dividends and distributions to be declared in any currency at the discretion of the board of directors or the company’s shareholders at a general meeting. If, and to the extent that, AngloGold Ashanti opts to declare dividends and distributions in U.S. dollars, exchange rate movements will not affect the U.S. dollar value of any dividends or distributions. Nevertheless, the value of any dividend or distribution in Australian dollars, Ghanaian cedis or South African rands will continue to be affected. If and to the extent that dividends and distributions are declared in South African rands in the future, exchange rate movements will continue to affect the Australian dollar, Ghanaian cedi and U.S. dollar value of these dividends and distributions. This may reduce the value of the company’s securities to investors. Additionally, the market value of AngloGold Ashanti’s securities as expressed in Australian dollars, Ghanaian cedis, U.S. dollars and South African rands will continue to fluctuate in part as a result of foreign exchange fluctuations.
50
AngloGold Ashanti may not pay dividends or make similar payments to shareholders in the future.
AngloGold Ashanti pays cash dividends only if there are sufficient funds available for that purpose. Fund availability depends upon many factors, including the amount of cash available, taking into account AngloGold Ashanti’s capital expenditure on existing infrastructure and exploration and other projects. Additionally, under South African law, a company is entitled to pay a dividend or similar payment to its shareholders only if the company meets the solvency and liquidity tests set out in legislation and the company’s founding documents.
Given these factors, including the capital and investment needs of AngloGold Ashanti, and the board of directors’ discretion to declare a dividend (including the amount and timing thereof), cash dividends may not be paid in the future.
U.S. securities laws do not require AngloGold Ashanti to disclose as much information to investors as a U.S. issuer is required to disclose, and investors may receive less information about the company than they might otherwise receive from a comparable U.S. company.
AngloGold Ashanti is subject to the periodic reporting requirements of the SEC and the New York Stock Exchange that apply to “foreign private issuers”. The periodic disclosure required of foreign private issuers under applicable rules is more limited than the periodic disclosure required of U.S. issuers. For example, on 22 February 2016, AngloGold Ashanti announced that it would no longer voluntarily publish reviewed financial statements and analyses of operating and financial results for the quarters ended 31 March and 30 September each year. As a result of this transition to half-yearly reporting, investors will receive less information about AngloGold Ashanti than they have in previous years. They will also receive less timely financial reports than they otherwise might receive from a comparable U.S. company or from certain of the company’s peers in the industry. This may have an adverse impact on investors’ abilities to make decisions about their investment in AngloGold Ashanti.
AngloGold Ashanti’s inability to maintain an effective system of internal control over financial reporting may have an adverse effect on investors’ confidence in the reliability of its financial statements.
Internal control over financial reporting is a process designed to provide reasonable assurance regarding the reliability of financial reporting and the preparation of the company’s financial statements for external purposes in accordance with International Financial Reporting Standards as issued by the International Account Standards Board. Disclosure controls and procedures are designed to ensure that information required to be disclosed by a company in reports that it files or submits under the Securities Exchange Act of 1934, as amended (the Exchange Act) is recorded, processed, summarized and reported within the time periods specified in the rules and forms of the Securities and Exchange Commission. These disclosure controls and procedures include without limitation, controls and procedures designed to ensure that information required to be disclosed by the company in reports that it files or submits under the Exchange Act is accumulated and communicated to the company’s management, including its chief executive officer and chief financial officer, as appropriate to allow timely decisions regarding disclosure. AngloGold Ashanti has invested in resources to facilitate the documentation and analysation of its system of disclosure controls and its internal control over financial reporting. A control system, no matter how well designed and operated, can provide only reasonable, not absolute, assurance with respect to the reliability of financial reporting and financial statement preparation. If AngloGold Ashanti is unable to maintain an effective system of internal control over financial reporting, investors may lose confidence in the reliability of its financial statements and this may have an adverse impact on investors’ abilities to make decisions about their investment in AngloGold Ashanti. See “Item 15: Controls and Procedures”.
51
52
|
4A.
|
HISTORY AND DEVELOPMENT OF THE COMPANY
|
GROUP INFORMATION
AngloGold Limited was formed in June 1998 with the consolidation of the gold mining interests of Anglo American plc. AngloGold Ashanti Limited, as the company exists today, was formed on 26 April 2004 following the business combination between AngloGold and Ashanti Goldfields Company Limited.
CURRENT PROFILE
AngloGold Ashanti Limited is headquartered in Johannesburg, South Africa. The company (Registration number 1944/017354/06) was incorporated in the Republic of South Africa in 1944 under the name of Vaal Reefs Exploration and Mining Company Limited and operates under the South African Companies Act, No. 71 of 2008, as amended (the Companies Act).
Its registered office is at 76 Rahima Moosa Street, Newtown, Johannesburg, South Africa, 2001. Telephone: +27 11 637 6000.
While AngloGold Ashanti’s primary listing is on the Johannesburg Stock Exchange (JSE), the company is also listed on the New York Stock Exchange (NYSE), the Ghana Stock Exchange (GhSE) and the Australian Securities Exchange (ASX).
HISTORY AND SIGNIFICANT DEVELOPMENTS
Below are highlights of key corporate activities from 1998:
1998
|
•
|
Formation of AngloGold Limited through the consolidation of East Rand Gold and Uranium Company Limited; Eastvaal Gold Holdings Limited; Southvaal Holdings Limited; Free State Consolidated Gold Mines Limited; Elandsrand Gold Mining Company Limited; H.J. Joel Gold Mining Company Limited and Western Deep Levels Limited into a single, focused, independent gold mining company. Vaal Reefs Exploration and Mining Company Limited (Vaal Reefs), the vehicle for the consolidation, changed its name to AngloGold Limited and increased its authorised share capital, effective 30 March 1998.
|
1998-2004
|
•
|
Expansion of AngloGold Limited’s operations outside of South Africa.
|
2004
|
•
|
Conclusion of the business combination with Ashanti Goldfields Company Limited, at which time the company changed its name to AngloGold Ashanti Limited.
|
2007
|
•
|
Sale by Anglo American plc of 69,100,000 ordinary shares of AngloGold Ashanti, thereby reducing Anglo American’s shareholding in AngloGold Ashanti from 41.7 percent to 16.6 percent.
|
2009
|
•
|
Sale by Anglo American plc of its remaining shareholding in AngloGold Ashanti to Paulson & Co. Inc.
|
2010
|
•
|
Elimination of AngloGold Ashanti’s hedge book, thereby gaining full exposure to spot gold prices.
|
2012
|
•
|
Acquisition of the remaining 50 percent interest in Serra Grande in Brazil for $215 million.
|
|
•
|
Acquisition of 100 percent of First Uranium (Proprietary) Limited for $335 million.
|
2013
|
•
|
Commission of two new gold projects - Tropicana and Kibali - in the second half of 2013.
|
2015
|
•
|
Sale of the Cripple Creek & Victor gold mine in the USA for $819 million.
|
2017
|
•
|
South Africa region restructured - TauTona mine placed on orderly closure. Negotiations of the sales of Moab Khotsong and Kopanang mines during 2017 with the transactions concluding on 28 February 2018.
|
53
CAPITAL EXPENDITURE
For information concerning the company’s principal capital expenditures and divestitures currently in progress, including the distribution of these investments geographically and the method of financing, refer “Item 4B: Business Overview-AngloGold Ashanti Global Operations: 2017”, “Item 5A: Operating Results-Capital expenditure” and “Item 5B: Liquidity and Capital Resources”.
54
|
4B.
|
BUSINESS OVERVIEW
|
AngloGold Ashanti, a gold mining company with a globally diverse, world-class portfolio of operations and projects, is headquartered in Johannesburg, South Africa. AngloGold Ashanti is the third largest gold mining company in the world, measured by production.
Our business activities span the full spectrum of the mining value chain and take into account the impact of our activities on the varied and many communities and environments in which we operate.
PRODUCTS
AngloGold Ashanti’s main product is gold. Once mined, the gold ore is processed into doré (unrefined gold bars) on site and then dispatched to precious metals refineries for refining to a purity of at least 99.5%, in accordance with the standards of ‘good delivery’ as determined by the London Bullion Market Association (LBMA). This refined gold is then sold directly to bullion banks.
By-products of our gold mining operations, often a function of local geological characteristics, include silver in Argentina, sulphuric acid in Brazil and uranium in South Africa.
OPERATIONS
Our portfolio of 17 operations and three projects in ten countries, comprises long-life, relatively low-cost operating assets with differing ore body types, located in key gold-producing regions.
Our operations and projects are grouped regionally as follows:
|
•
|
South Africa (Vaal River, West Wits and Surface Operations)
|
|
•
|
Continental Africa (Democratic Republic of the Congo, Ghana, Guinea, Mali and Tanzania)
|
|
•
|
Americas (Argentina, Brazil and Colombia)
|
|
•
|
Australasia (Australia)
|
Given the current market environment and the scrutiny of financial capital allocation, we ensure responsible capital distribution, in line with business requirements. We do this while optimising internal expertise to identify and implement operational efficiencies, reducing overhead structures, improving capital discipline and pursuing other business improvement initiatives without compromising safety. We continue our focus on debt reduction to further strengthen our balance sheet and on improving the quality of our portfolio. This we aim to do by unlocking value from existing operations, brownfield opportunities, Obuasi and other long-term growth projects, including Colombia.
Our organisational and management structure aligns with global best practice in corporate governance. By using our human capital efficiently, group support functions cover planning and technical, strategy, sustainability, finance, human resources, legal and stakeholder relations. The planning and technical functions focus on identifying and managing opportunities, maintaining long-term optionality, and ensuring the optimal use of our intellectual capital through a range of activities that includes brownfields and greenfields exploration as well as innovative research focused on mining excellence.
EXPLORATION
Our exploration programme is aimed at providing an organic growth pipeline to enable us to generate significant value over time.
Greenfields and brownfields exploration takes place in both established and new gold-producing regions through managed and non-managed joint ventures, strategic alliances and wholly-owned ground holdings. AngloGold Ashanti’s discoveries include La Colosa, Gramalote and Quebradona (Nuevo Chaquiro) in Colombia.
GOLD MARKET
Investors added more gold to their portfolios during 2017 as market uncertainty increased and inflation expectations started to rise. Positive momentum held for much of the year, helping to offset the potentially negative impact of anticipated interest rate increases in the US, with the gold price averaging $1,258/oz over the 12 months compared with $1,249/oz in 2016. It touched a low of $1,158 in 2017 and reached a high of $1,348/oz for the year. The gold price closed the year at $1,306/oz. Continued gold investments into portfolios, with inflows into global gold-backed exchange-traded funds totalled $8.2bn or 6.72Moz, compared with 14.18Moz in 2016.
Speculators increased their gold net long position by 7.36Moz year-on-year on the Comex commodity exchange, further underpinning the positive sentiment in the gold market.
Stock markets globally ended the year at or near record highs. The MSCI All-Country World Index gained 22 percent or nine trillion, during 2017, a new high, as global growth accelerated and investors bet on continued improvements to corporate earnings. Additionally, the US Tax Cuts and Jobs Act and the US Federal Reserve’s gradual approach to normalising monetary policy further buoyed equity markets. These record valuations coincided with continued strength in most other asset classes in developed markets,
55
including property, bonds and alternatives like collectibles and cryptocurrencies, though some of the enthusiasm over the latter has waned in 2018.
Monetary policy tightening across the globe pushed up global short-term bond yields while long-term yields remained relatively flat. The US Federal Reserve increased interest rates three times during the year, while the Bank of England lifted its benchmark rate during November for the first time in a decade to 0.50 percent (from 0.25 percent). In March 2017, the European Central Bank (ECB) claimed victory over deflation and signalled that its monetary policy would become gradually less expansionary.
Bond markets remained stable, with increased investments in emerging market sovereign debt, as compared to government debt in developed countries, where yields were down in 2017. As a result, emerging market currencies strengthened and borrowing rates from these countries remain at or near multi-year lows.
In 2017, the global volatility index traded at historically low levels, despite the impact of various political events including geopolitical concerns about a US-led nuclear war with North Korea, political upheaval in Europe with the Catalan separatist movement in Spain, a continued swing to the right in several EU member states and an inconclusive German election.
The US dollar price of gold rose 13 percent from the first to the last trading day of the year, its biggest annual gain since 2010, outperforming most major asset classes (other than stocks). Aside from the tailwinds from geopolitical uncertainty, gold prices were supported by a weakening US dollar and elevated equity valuations, which created concern over a potential market correction. Debt investors were also likely concerned about a record bull market that was threatened by the increasing prospect of a normalisation in interest rates in the US. The geopolitical instability further heightened investor uncertainty and fuelled investments in gold, which remain a hedge against these risks.
Central banks were also very active in the gold market, with Russia increasing its holdings, particularly in the last two months of the year. The central banks remained an important source of demand for gold and net purchases by central banks recorded a gain of 48 percent for the whole of 2017, up 123t to 381t compared to 258t in 2016.
JEWELLERY DEMAND
Jewellery consumption for 2017 was up 13.2 percent compared to 2016, with all major physical consumer regions recording year-on-year gains. India’s jewellery consumption increased by 8 percent in the last quarter of the year, helped by a surge in sales during Dhanteras (the first day of Diwali) and lower prices toward year end. Jewellery fabrication also increased 5.5 percent in 2017 from 2016. Chinese demand slipped 2 percent year-on-year, with ongoing losses in the pure gold segment as consumer preferences continued to shift towards more fashionable pieces with lower gold content. It is worth adding that after posting double-digit percentage declines on average since its 2013 peak, China’s jewellery offtake appeared to have finally stabilised in 2017. Total physical demand increased on an annual basis, with physical demand up 10.6 percent from 3,555.9t in 2016 to 3,931.6t in 2017.
Gold supply was broadly unchanged and mine production rose fractionally to 3,268.7t in 2017 (2016: 3,236.0t), while there was net dehedging of 30.4t. Recycling levels declined by 10 percent year-on-year to 1,160t in 2017 as mine production was offset by reduced hedging activity, while scrap volumes remained flat year-on-year.
COMPETITION
As gold mining is a mature and regulated industry, and very significant volumes of gold and gold derivatives trade in the world markets independent of gold mine supply, AngloGold Ashanti does not consider that competition for sales plays any role in its operations as a gold producer. For more information on a geographical analysis of gold income by destination, refer “Item 18: Note 2 - Segmental Information”.
However, gold producers do compete against each other for acquisition of mining assets, exploration opportunities and human resources. See “Item 3D: Risk Factors”.
SEASONALITY
Subject to other factors and unforeseen circumstances, quarter one production is generally lower than production during the rest of the year as a result of the ramp-up of operations after annual holiday production declines.
RAW MATERIALS
AngloGold Ashanti uses chemicals, including cyanide and lime, in the production of gold. These chemicals are available from a large number of suppliers and do not represent a material portion of the company’s costs.
56
STRATEGY
AngloGold Ashanti’s core strategic focus is to generate sustainable cash flow improvements and returns by focusing on five key areas, namely: people, safety and sustainability; ensuring financial flexibility; actively managing all expenditures; improving the quality of our portfolio; and maintaining long-term optionality.
Strategic focus areas
AngloGold Ashanti’s five strategic focus areas are set out below:
|
•
|
Focus on people, safety and sustainability
. People are the foundation of our business. Our business must operate according to our values if it is to remain sustainable in the long term.
|
|
•
|
Promote financial flexibility
. We must ensure our balance sheet always remains able to meet our core funding needs.
|
|
•
|
Optimise overhead costs and capital expenditure
. All spending decisions must be thoroughly scrutinised to ensure they are optimally structured and necessary to fulfil our core business objective.
|
|
•
|
Improve portfolio quality
. We have a portfolio of assets that must be actively managed to improve the overall mix of our production base as we strive for a competitive valuation as a business.
|
|
•
|
Maintain long-term optionality
. While we are focused on ensuring the most efficient day-to-day operation of our business we must keep an eye on creating a competitive pipeline of long-term opportunities.
|
INTELLECTUAL PROPERTY
AngloGold Ashanti, as a group, is not dependent on intellectual property for the conduct of its business as a whole.
THE REGULATORY ENVIRONMENT ENABLING ANGLOGOLD ASHANTI TO MINE
AngloGold Ashanti’s rights to own and exploit Ore Reserve and deposits are governed by the laws and regulations of the jurisdictions in which these mineral properties lie.
AngloGold Ashanti is subject to a wide range of laws and regulations governing all aspects of its operations, including such areas as environmental protection, reclamation, exploration, development, production, taxes, immigration, labour standards and employment issues, occupational health, mine safety, toxic substances and wastes, securities and foreign corrupt practices. AngloGold Ashanti has made, and expects to make in the future, significant expenditures to comply with these laws and regulations. Non-compliance can result in violations and legal claims, as well as substantial fines, penalties, reputational damage and delays in day-to-day operations. Pending or proposed changes to existing laws and regulations, as well as any proposed or contemplated new laws or regulations could also have significant impacts on AngloGold Ashanti’s business and results of operations, the extent of which cannot always be predicted.
There are in some cases certain restrictions on AngloGold Ashanti’s ability to independently move assets out of certain countries in which it has operations, or transfer assets within the group, without the prior consent of the local government or minority shareholders involved. See “Item 10D: Exchange controls” for details.
For more information on the risks and uncertainties associated with AngloGold Ashanti’s mining rights, see “Item 3D: Risk factors”, in particular the risk factors entitled “AngloGold Ashanti’s mining rights in the countries in which it operates could be altered, suspended or cancelled for a variety of reasons, including breaches in its obligations in respect of such mining rights”, “Failure to comply with laws, regulations, standards and contractual obligations, breaches in governance processes or fraud, bribery and corruption may lead to regulatory penalties, loss of licences or permits, negative effects on AngloGold Ashanti’s reported financial results, and adversely affect its reputation”, “Title to AngloGold Ashanti’s properties may be uncertain and subject to challenge”, “AngloGold Ashanti’s mineral deposits, Ore Reserve, and mining operations are located in countries where political, tax and economic laws and policies may change rapidly and unpredictably and such changes and policies may adversely affect both the terms of its mining concessions, as well as its ability to conduct operations in certain countries” and “AngloGold Ashanti’s Ore Reserve, deposits and mining operations are located in countries that face instability and security risks that may adversely affect both the terms of its mining concessions, as well as its ability to conduct operations in certain countries”.
SOUTH AFRICA
The MPRDA
The Mineral and Petroleum Resources Development Act (MPRDA) came into effect on 1 May 2004. The objectives of the MPRDA are, amongst other things, to allow for state sovereignty over all mineral and petroleum resources in the country, to promote economic growth and the development of these resources and to expand opportunities for the historically disadvantaged. Another objective of the MPRDA is to ensure security of tenure for the respective operations concerning prospecting, exploration, mining and production. By virtue of the provisions of the MPRDA, the state ensures that holders of mining and prospecting rights contribute to the socioeconomic development of the areas in which they operate.
57
The Mineral and Petroleum Resources Development Amendment Act (MPRDAA) was passed by Parliament in 2008 and became effective on 7 June 2013. Its purpose is to amend the MPRDA in order to, amongst other things:
|
•
|
make the Minister of Mineral Resources (Minister) the responsible authority for implementing the requirements of the National Environmental Management Act of 1998 (NEMA) and specific environmental legislation as they relate to prospecting, mining, exploration, production and related activities incidental thereto on the prospecting, mining, exploration or production area;
|
|
•
|
align the MPRDA with the NEMA in order to provide for one environmental management system;
|
|
•
|
remove ambiguities in certain definitions;
|
|
•
|
add functions to the Regional Mining Development and Environmental Committee;
|
|
•
|
amend transitional arrangements so as to further afford statutory protection to certain existing old order rights; and
|
|
•
|
provide for matters connected therewith.
|
When the MPRDAA came into effect on 7 June 2013, only selected provisions became effective immediately. The MPRDAA contains the following provisions, amongst others:
|
•
|
Environmental authorisations
: Provides for a prohibition on any prospecting and mining, or conducting technical co-operation operations, reconnaissance operations or any incidental work without an environmental authorisation (since 7 December 2014), permit and at least 21 days’ written notice to the landowner or lawful occupier.
|
|
•
|
Historic residues
: Provides that the definitions of “residue stockpile” and “residue deposit” now include an old order right. This provision is intended to make old order dumps subject to the MPRDA so that old order dumps which are part of a mining area covered by a new order mining right could only be treated by the holder of the new order rights. Old order dumps not covered by a new order mining right would be considered a residue deposit to which the Minister would have discretion to grant rights.
|
|
•
|
Applications
: Provides that applicants for prospecting and mining rights must (since 7 December 2014) lodge an application for an environmental authorisation simultaneously with the application for rights. The Department of Mineral Resources should no longer accept more than one application in respect of the same area and mineral.
|
|
•
|
Environmental regulation
: Provides that the Minister is the responsible authority for implementing environmental provisions under NEMA as it relates to prospecting, mining, exploration, production or activities incidental thereto on a prospecting, mining, exploration or production area. An environmental authorisation issued by the Minister shall be a condition prior to the issuing of a permit or the granting of a right in terms of the MPRDA.
|
|
•
|
Closure certificates
: Provides that previous holders of old order rights or previous owners of works that have ceased to exist remain responsible for any environmental liability until the Minister issues a closure certificate.
|
On 27 December 2012, the Minister published the Draft Mineral and Petroleum Resources Development Bill, 2012 (2012 Bill) which sought to amend the MPRDA again and invited the mining industry and interested and affected parties to comment on it by 8 February 2013. On 21 June 2013, a revised version of the Bill (2013 Bill) was introduced to the National Assembly. The 2013 Bill underwent a public participation process and extensive comments were received from the general public. Following a consultative process with the Department of Mineral Resources (DMR), the State Law Advisors and the general public, the Portfolio Committee on Mineral Resources (Portfolio Committee) introduced an amended version of the 2013 Bill to the South African Parliament.
The 2013 Bill seeks to amend the MPRDA and MPRDAA, to, amongst other things:
|
•
|
remove ambiguities;
|
|
•
|
provide for regulation of associated minerals, partitioning of rights, and enhanced provisions on mineral beneficiation;
|
|
•
|
promote national energy security;
|
|
•
|
streamline administrative processes; and
|
|
•
|
enhance sanctions.
|
The 2013 Bill, as currently drafted, contains, amongst others, the following provisions:
|
•
|
Applications
: The 2013 Bill proposes revising the application system by replacing the "first come, first served" system with a tender and allocation system. This would dramatically affect the way applications are made.
|
|
•
|
Beneficiation
: The 2013 Bill extends the concept of beneficiation (which has been defined in the 2013 Bill as "transformation, value addition or downstream beneficiation of a mineral or mineral product (or a combination of minerals) to a higher value product, over baselines to be determined by the Minister, which can either be consumed locally or exported") and would allow the Minister to prescribe the quantities, qualities and timelines at which certain designated commodities must be supplied to local beneficiators at a mine gate price or an agreed price. The reference to the mine gate price appears to suggest companies can recover costs, capital expenditure and make a profit. It is not clear whether the "agreed price" will have general application or whether it will be determined on a case-by-case basis. Another proposed amendment provides that written consent would have to be obtained before exporting of "designated minerals" if the producer or associated company has not offered minerals to local beneficiators. The Minister would have discretion to decide which minerals are to be designated.
|
|
•
|
Residue stockpiles
: The MPRDAA's inclusion of residue deposits and residue stockpiles in the definition of land, creating a “statutory accession” of movable dumps back to the land, is discussed above. The 2013 Bill would extend this definition to include historic mines and dumps created before the implementation of the MPRDA. The 2013 Bill also seeks to make these historic dumps subject to the MPRDA by making the working of these dumps subject to a mining right issued under the MPRDA.
|
58
There is a transition period of two years to enable owners of these dumps to either apply for mining rights or incorporate them in existing mining rights.
|
•
|
Partitioning of rights and transfers of interests in companies
: Section 11 of the MPRDA currently requires that transfer of a controlling interest in an unlisted company be consented to by the Minister. The 2013 Bill proposes amending the MPRDA so that transfer of a controlling interest in listed companies and transfer of any interest in unlisted companies must be consented to by the Minister. The 2013 Bill further proposes amending the MPRDA to allow for an application for ministerial consent to be made to transfer a part of a right.
|
|
•
|
Mine closure
: The 2013 Bill provides for two major changes to mine closure under the MPRDA. Firstly, the MPRDA would be amended so that a mining company could still incur environmental liability even after obtaining a closure certificate relative to a mine. Secondly, any portion of the financial provision paid in terms of section 41 of the MPRDA may be retained by the Minister for latent and residual environmental impacts which may become known in the future for such time period as the Minister may determine, having regard to the circumstances relating to the relevant operation, which portion and time period must be determined in the prescribed manner.
|
|
•
|
Penalties
: The 2013 Bill also provides for revised penalties for violations of the MPRDA by making provision for both an administrative fine not exceeding 10 per cent of the person or holder’s annual turnover and exports during the preceding year, and imprisonment not exceeding four years.
|
|
•
|
Legislative force of the Charter and Codes
: The 2013 Bill proposes amending the definition of "this Act" in the MPRDA so that the MPRDA will include the Revised Mining Charter (defined below), the Code of Good Practice for the South African Mineral Industry (Code) and the Housing and Living Conditions Standard. This would give these documents the force of law.
|
The 2013 Bill was passed by the National Assembly on 12 March 2014 and passed by the National Council of Provinces (NCOP) on 27 March 2014. The 2013 Bill was sent to the President of the Republic of South Africa (President) for assent. On 16 January 2015, President Zuma referred the 2013 Bill back to the National Assembly to accommodate his reservations around the constitutionality of the 2013 Bill. The 2013 Bill was considered by the Portfolio Committee on Mineral Resources who tabled non-substantial revisions to the 2013 Bill, which revisions were passed by the National Assembly and referred to the NCOP on 1 November 2016. The 2013 Bill is currently being considered by the NCOP select committee on Land and Mineral Resources after undergoing a public participation process on this version of the 2013 Bill. If the NCOP makes no further changes to the 2013 Bill, and it is sent to the current President, Cyril Ramaphosa, for assent, it is not clear if the current President will view the earlier reservations around the constitutionality of the 2013 Bill to have been addressed and whether the 2013 Bill might be referred to the Constitutional Court of South Africa for a decision on its constitutionality. If the President does assent to the 2013 Bill, either after the NCOP makes substantial changes to the 2013 Bill or not, the 2013 Bill might still be subject to constitutional challenge. President Ramaphosa announced in his State of the Nation Address on 16 February 2018 that processing of the 2013 Bill through both houses of Parliament was at an advanced stage, with an indication by Parliament that the 2013 Bill is expected to be finalised during the first quarter of 2018.
The Mining Charter
The Mining Charter sprang from the MPRDA and also took effect on 1 May 2004. The Mining Charter committed all stakeholders in the mining industry to transfer ownership of 26 percent of their assets to black or historically disadvantaged South Africans (HDSAs) within 10 years. The Charter also sets targets for, amongst other things, the advancement of HDSAs into management positions, the employment of women, procurement of goods and services from HDSA-owned companies, training, community development and the upgrading of mine housing. Mining companies are required to devise plans to achieve these targets, must identify current levels of beneficiation and must indicate opportunities for growth.
The objectives of the Mining Charter are to:
|
•
|
promote equitable access to the nation’s Mineral Resources by all the people of South Africa;
|
|
•
|
substantially and meaningfully expand opportunities for HDSAs, including women, to enter the mining and minerals industry and to benefit from the exploitation of the nation’s Mineral Resources;
|
|
•
|
use the industry’s existing skills base for the empowerment of HDSAs;
|
|
•
|
expand the skills base of HDSAs in order to serve the community;
|
|
•
|
promote employment and advance the social and economic welfare of mining communities and the major labour-sending areas; and
|
|
•
|
promote beneficiation of South Africa’s mineral commodities.
|
The Mining Charter envisages measuring progress on transformation of ownership by:
|
•
|
taking into account, amongst other things, attributable units of production controlled by HDSAs;
|
|
•
|
allowing flexibility by credits or offsets, so that, for example, where HDSA participation exceeds any set target in a particular operation, the excess may be offset against shortfalls in another operation;
|
|
•
|
taking into account previous empowerment deals in determining credits and offsets; and
|
|
•
|
considering special incentives to encourage the retention by HDSAs of newly acquired equity for a reasonable period.
|
Under the Mining Charter, the mining industry as a whole agreed to assist HDSA companies in securing finance to fund participation in an amount of ZAR 100 billion over the first five years. Beyond the ZAR 100 billion commitment, HDSA participation was to be increased on a willing seller, willing buyer basis, at fair market value, where the mining companies are not at risk.
59
Following a review, the DMR amended the Mining Charter and the Revised Mining Charter was released on 13 September 2010. The requirement under the Mining Charter for mining entities to achieve a 26 percent HDSA ownership of mining assets by the year 2014 was retained. Amendments to the Mining Charter in the Revised Mining Charter require mining companies to:
|
•
|
facilitate local beneficiation of mineral commodities;
|
|
•
|
procure a minimum of 40 percent of capital goods, 70 percent of services and 50 percent of consumer goods from HDSA suppliers (i.e., suppliers in which a minimum of 25 percent + 1 vote of share capital is owned by HDSAs) by 2014, these targets being, however, exclusive of non-discretionary procurement expenditure;
|
|
•
|
ensure that multinational suppliers of capital goods put a minimum of 0.5 percent of their annual income generated from South African mining companies into a social development fund beginning in 2010, to contribute to the socioeconomic development of South African communities;
|
|
•
|
achieve a minimum of 40 percent HDSA demographic representation by 2014 at executive management (board) level, senior management (EXCO) as well as in those positions requiring core and critical skills, middle management level and junior management level;
|
|
•
|
invest up to five percent of annual payroll in essential skills development activities; and
|
|
•
|
implement measures to improve the standards of housing and living conditions for mineworkers by converting or upgrading mineworkers’ hostels into family units, attaining an occupancy rate of one person per room and facilitating home ownership options for all mineworkers in consultation with organised labour, all of which must be achieved by 30 April 2014.
|
In addition, mining companies are required to monitor and evaluate their compliance with the Revised Mining Charter, and must submit annual compliance reports to the DMR.
The government takes a “Scorecard” approach to the different facets of promoting the objectives of the Charter. It uses the Scorecard when considering applications for the conversion of existing old order rights into new order rights. The Scorecard sets out the requirements of the Charter in tabular form which allows the DMR to “tick off” areas where a mining company is in compliance. It covers the following areas:
|
•
|
human resource development;
|
|
•
|
employment equity;
|
|
•
|
migrant labour;
|
|
•
|
mine community and rural development;
|
|
•
|
housing and living conditions;
|
|
•
|
ownership and joint ventures;
|
|
•
|
beneficiation; and
|
|
•
|
reporting.
|
The Scorecard attached to the Revised Mining Charter made provision for a phased-in approach for compliance with the above targets over the five-year period ended on 30 April 2014. For measurement purposes, the Scorecard allocated various weightings to the different elements of the Revised Mining Charter.
Failure to comply with the provisions of the Revised Mining Charter will amount to a breach of the MPRDA, may result in the cancellation or suspension of AngloGold Ashanti’s existing mining rights and may prevent AngloGold Ashanti’s South African operations from obtaining any new mining rights. However, AngloGold Ashanti has not yet received its “Scorecard” from the government assessing its compliance with the requirements of the Charter.
In March 2015, the Minister announced that the DMR and the Chamber of Mines of South Africa had jointly agreed to submit certain matters relating to the interpretation of the Revised Mining Charter, including the qualification of certain historical BBBEE transactions (defined below) for meeting the HDSA ownership thresholds, to the courts in South Africa for determination and clarification. Papers were filed by the Chamber of Mines of South Africa and the DMR (the DMR/Chamber of Mines application), but the matter was not heard in court and was subsequently postponed.
Separately, the law firm Malan Scholes launched an application challenging the constitutionality of the Mining Charter and the Revised Mining Charter and requesting that these Charters be set aside. This application was dismissed.
On 9 March 2016, AngloGold Ashanti received a notice from the DMR stating that the company was not compliant with the 26 percent HDSA ownership requirement. The notice directed the company to remedy the non-compliance within 60 days. Failure to comply with the order could constitute an offence under the MPRDA and, as such, could negatively impact AGA’s “Scorecard” assessment. On 14 March 2016, AngloGold Ashanti timely responded to the non-compliance notice. The DMR provided no further response and, consequentially, the notice has lapsed.
On 15 June 2017, the Minister gazetted the Broad-Based Black Socio-Economic Empowerment Charter for the South African Mining and Minerals Industry, 2017 (2017 Charter), which came into effect on the same day (Reviewed Mining Charter). The Reviewed Mining Charter seeks to align the Revised Mining Charter with the Broad-Based Black Economic Empowerment Act, 53 of 2003, in order to ensure meaningful participation of black people and provide for policy and regulatory certainty to ease the investment
60
in and the development of the mining industry. The Chamber of Mines launched an urgent application to interdict the implementation of the Reviewed Mining Charter and set it aside. The DMR filed papers in court and the urgent application was due to be heard in court on 14 September 2017. However, the Minister and the Chamber of Mines reached an agreement on 13 September 2017 wherein the Minister undertook to suspend the 2017 Charter pending the outcome of DMR/Chamber of Mines application. The DMR/Chamber of Mines application was set to be heard in February 2018, but has now been postponed indefinitely on the basis that the Chamber of Mines has entered into a new round of negotiations with the DMR, facilitated by President Ramaphosa.
In the event that these negotiations are unsuccessful and the court upholds the Reviewed Mining Charter in its current form, existing and new holders of mining rights will need to comply with the requirements stipulated therein. Below are requirements introduced by the Reviewed Mining Charter:
|
•
|
The Reviewed Mining Charter introduces the new definition of “Black Person” which it defines as a generic term to mean Africans, Coloured and Indians who are citizens of South Africa by birth or decent; or who became citizens by naturalisation before 27 April 1994 or on or after 27 April 1994 and who would have been entitled to acquire citizenship by naturalisation prior to the date; and juristic persons managed and controlled by Black Persons who collectively or as a group own and control all issued share capital or members’ interest and are able to control the majority of the members’ vote.
|
|
•
|
South African mining companies who held prospecting rights and mining rights prior to the coming into effect of the Reviewed Mining Charter must top up their Black Person shareholding within 12 months of the coming into effect of the Reviewed Mining Charter by four percent in order to achieve 30 percent Black Person (or company) shareholding, to enable meaningful economic participation of black people in the industry.
|
|
•
|
New applicants for mining rights must meet the 30 percent ownership by Black Persons threshold whereby the empowerment partner holding 14 percent ownership, and the community trusts and employee ownership schemes holding 8 percent each.
|
|
•
|
New applicants for prospecting rights must be Black-owned entities (50 percent +1 vote Black person shareholding).
|
|
•
|
The 30 percent Black Person shareholding requirement may be offset by a maximum of 11 percent against its contribution and financial investment in beneficiation in South Africa, subject to certain requirements.
|
|
•
|
Mining companies must procure 70 percent of mining goods (which includes capital goods and consumer goods), 80 percent of services and 70 percent of consumables goods from South African Black-owned entities (50 percent + one vote Black Person shareholding).
|
|
•
|
Non-South African suppliers of capital goods must annually contribute one percent of their annual income generated from local mining companies towards the Mining Transformation and Development Agency (to be established).
|
|
•
|
Holders of mining rights must employ South African based companies to analyse all mineral samples across the mining value chain and may only use non-South African companies with consent from the Minister.
|
|
•
|
Mining companies must achieve a minimum representation of Black People in the following management positions: 50 percent on the Board of directors (25 percent of which must be Black women), 50 percent in executive (25 percent of which must be black women), 60 percent in senior management (30 percent of which must be black women); 75 percent in middle level (38 percent of which must be black women); 88 percent in junior level (44 percent of which must be black women) and 60 percent in core and critical skills. In addition; Black People with disabilities must constitute three percent of all employees.
|
|
•
|
The mining industry must continue to invest up to five percent of its leviable amount (meaning the amount an employer pays to an employee during any month to determine the employer’s liability for employee tax) in skills development activities. two percent of such investment must be paid towards the Mining Transformation and Development Agency.
|
|
•
|
One percent of the annual turnover of mining companies who apply for mining rights after the Reviewed Mining Charter comes into effect must be given the BEE shareholders over and above any distributions to the shareholders of that company. The transitional period in which mining companies must comply with the procurement related provisions Reviewed Mining Charter is three years, with the possibility of requesting a further two years from the DMR to achieve compliance.
|
The Reviewed Mining Charter states that requirements for ownership, mine community development and human resource development are ring-fenced and require 100 percent compliance at all times.
In addition, mining entities with permits / licences granted under the Precious Metals Act, 2005 and the Diamonds Act, 1986 must comply with following requirements/targets of the Reviewed Mining Charter:
|
•
|
exempted micro enterprises must comply with sustainable development and growth of the mining industry targets;
|
|
•
|
small enterprises must comply with employment equity, human resource development, procurement/supplier and sustainable development targets; and
|
|
•
|
medium and large entities must comply with ownership, employment equity, human resource development, procurement/ supplier and sustainable development targets.
|
The Code
Section 100(1)(b) of the MPRDA obliged the Minister to develop a code of good practice for the minerals industry. On 29 April 2009, the Minister published a Code pursuant to section 100(1)(b) of the MPRDA. The Code is a guiding document and its purpose is to set out administrative principles to enhance implementation of the Mining Charter and the MPRDA. The Code is to be read in combination with the Mining Charter and other legislation relating to measurement of socio-economic transformation in the South African mining industry. The Code does not replace the Charter nor any key legislation and laws relating to the minerals and the petroleum industry but serves as a statement of policy and principles that assists in the implementation of both the MPRDA and the Charter. The Reviewed Mining Charter proposes the repeal of paragraph 3 of the Code which provides for application of the Code of Good Practice for permits/licences granted under the Precious Metals Act, 2005, and the Diamonds Act, 1986.
61
Environmental laws relating to mining and prospecting
The MPRDAA repealed the sections in the MPRDA that dealt with environmental regulation of mining and prospecting operations. This was the first step in migrating the environmental regulation provisions from the MPRDA into NEMA. NEMA was then amended by the National Environmental Management Amendment Act
no. 62 of 2008 and then again by the National Environmental Management Laws Amendment Act 25 of 2014, and now includes provisions to deal with environmental regulation of mining and prospecting which provisions are administered by the Minister of Mineral Resources. In addition, The Regulations Pertaining to the Financial Provision for Prospecting, Exploration, Mining or Production Operations were published in the government gazette on 20 November 2015 under GNR 1147 Notice 39425 (Financial Provision Regulations, 2015), and now fall under NEMA.
The Financial Provision Regulations are similar to the previous provisions under the MPRDA, some of the significant changes are set forth below:
|
•
|
broadening the definition of “financial provision” to require making financial provision for the adverse impacts that might arise from operations rather than only those listed in the environmental management plan (EMP), as was previously the case;
|
|
•
|
requiring the holder to annually assess environmental liability and adjust the financial provision to the satisfaction of the Minister of Mineral Resources;
|
|
•
|
requiring the holder to submit an audit report to the Minister of Mineral Resources on the adequacy of the financial provision from an independent auditor. If the Minister of Mineral Resources is not satisfied with the assessment, he is entitled to appoint his own auditor;
|
|
•
|
requiring that a holder maintain and retain financial provision notwithstanding the issuance of a closure certificate. Furthermore, the Minister may retain such portion of the financial provision as may be required to rehabilitate the closed mining or prospecting operation in respect of latent, residual or any other environmental impacts, including the pumping of polluted or extraneous water, for a prescribed period. This is not only in respect of holders of rights, but also now in respect of holders of old order rights and holders of works;
|
|
•
|
before the coming in to effect of the Financial Provision Regulations, 2015 holders could make financial provision for annual rehabilitation, final rehabilitation and post-closure residual impacts and water pumping by adding up the total amount for these three types of rehabilitation and making financial provision in one go using one or a mix of four methods: depositing cash in to the DMR bank account, keeping the amount in a rehabilitation trust in accordance with the Income Tax Act, 1962, obtaining a financial guarantee or a bank guarantee in respect of the amount, or using a method determined by the Director-General (this was not common in practice). Under the Financial Provision Regulations, 2015 if the holder wishes to use a rehabilitation trust in accordance with the Income Tax Act, 1962, the amount in the trust can only relate to financial provision for post-closure residual impacts and water pumping. Holders can no longer make financial provision for annual and final closure through a trust fund;
|
|
•
|
a holder’s financial provision must be equal to the sum of actual costs of implementing all three broad classes of rehabilitation for at least 10 years; and
|
|
•
|
the financial provision liability associated with annual rehabilitation, final closure or latent or residual environmental impacts may not be deferred against assets at mine closure or mine infrastructure salvage value.
|
Failure to realign to the Financial Provision Regulations constitutes non-compliance with section 24P of NEMA, which would entitle the DMR to issue a directive and failure to comply with the directive is an offence under section 49A(g) of NEMA. A person convicted of an offence under section 49A(g) of NEMA is liable to a fine not exceeding ZAR10 million or to imprisonment for a period not exceeding 10 years, or to both.
The mining industry has raised concerns with the Financial Provision Regulations, 2015 including
|
•
|
confusion regarding the applicability of the Financial Provision Regulations, 2015 to applicants and to previous holders;
|
|
•
|
duplicate funding or double provisioning;
|
|
•
|
unclear methods and periods for determining financial provision;
|
|
•
|
legal barriers to use of trust funds;
|
|
•
|
burdensome public consultation and disclosure requirements;
|
|
•
|
transitional provisions and time frames:
|
|
•
|
requirements for an additional 3 (three) plans;
|
|
•
|
over-auditing - time and cost implications; and
|
|
•
|
inclusion of care and maintenance.
|
On 26 October 2016, proposed Amendments to the Financial Provision Regulations, 2015 were published for comment. The mining industry has been engaging the Department of Environmental Affairs regarding the New Financial Provision Regulations and the proposed Amendments. A revised version of the Financial Provision Regulations was published in November 2017, with a revised compliance deadline of February 2019.
Pursuant to section 24N(8) of NEMA, directors of a company are jointly and severally liable for any negative impact on the environment, whether advertently or inadvertently caused by the company they represent, including damage, degradation and pollution.
62
See also “Item 4B: Business Overview-Mine Site Rehabilitation and Closure” and “Item 4B: Business Overview-Environmental, Health and Safety Matters”.
AngloGold Ashanti’s rights and permits
A mining right will be granted to a successful applicant for a period not exceeding 30 years. Mining rights may be renewed for additional periods not exceeding 30 years at a time. A mining right can be cancelled if the mineral to which such mining right relates is not mined at an “optimal” rate.
AngloGold Ashanti holds seven mining rights in South Africa (three in West Wits and four in Vaal River) which have been successfully converted, executed and registered as new order mining rights at the Mineral and Petroleum Titles Registration Office (MPTRO).
A prospecting right will be granted to a successful applicant for a period not exceeding five years, and may only be renewed once for three years. The MPRDA also provides for a retention period of up to three years after prospecting, with one renewal up to two years, subject to certain conditions.
AngloGold Ashanti holds one prospecting right in Vaal River.
AngloGold Ashanti also holds a mining permit for the recovery of sand and clay in West Wits, which has been renewed until 22 March 2017. AngloGold Ashanti is in the process of renewing this permit.
AngloGold Ashanti holds a refining licence and an import and export permit from the South African Diamond and Precious Metals Regulator.
The BBBEE Amendment Act
The President of South Africa assented to the BBBEE Amendment Act on 23 January 2014. The BBBEE Amendment Act came into effect on 24 October 2014 with the object of amending the Broad-based Black Economic Empowerment Act 53 of 2003 (BBBEE Act) to provide a framework of principles, strategies and guidelines aimed at promoting the broad-based socio-economic empowerment of HDSAs across the South African economy and society in the form of ownership, management, employment equity, skills development, preferential procurement, enterprise development and socio-economic development. The BBBEE Amendment Act includes a number of changes to the framework under the BBBEE Act, including:
|
•
|
amending and clarifying the definition of the intended beneficiaries of such framework;
|
|
•
|
amending the definition of “Broad-Based Black Economic Empowerment”, or BBBEE, to introduce the concept of viable BBBEE and providing standards for that preferential procurement;
|
|
•
|
expanding the scope of the Codes of Good Practice (BBBEE Codes), and the related transformation charters, on BBBEE matters that the Minister of Trade and Industry can issue under the BBBEE Act for specific sectors of the South African economy and making it compulsory for public authorities, governmental agencies and other public entities to apply such codes (Sector Codes);
|
|
•
|
introducing into the BBBEE Act itself the definition of fronting BBBEE practices, which to date has been developed outside of the BBBEE Act and has now been expanded to capture the more sophisticated and unsuspecting fronting transactions, making fronting a criminal offense that is punishable with imprisonment and fines under certain circumstances, reasserting in the BBBEE Act the common law remedies for misrepresentation and more generally enhancing the enforcement mechanism against fronting;
|
|
•
|
establishing a BBBEE Commission responsible for overseeing, supervising and promoting compliance with the BBBEE Act, as well as receiving and investigating BBBEE-related complaints; and
|
|
•
|
providing that the Department of Trade and Industry (DTI) may impose special requirements for specific industries.
|
Before the BBBEE Amendment Act came into effect, the BBBEE Act provided that in the event of a conflict between the BBBEE Act and any other law in force immediately prior to the commencement of the BBBEE Act, the BBBEE Act would prevail if the conflict specifically relates to a matter addressed in the BBBEE Act. The BBBEE Amendment Act inserted a new provision in the BBBEE Act whereby the BBBEE Act trumps the provisions of any other law in South Africa with which it conflicts, provided such conflicting law was in force immediately prior to the effective date of the BBBEE Amendment Act. The provision became effective as from 24 October 2016.
On 27 October 2015, the Minister for Trade and Industry published Government Notice 1047 of Government Gazette 39350, which declared an exemption in favour of the DMR from applying the requirements contained in section 10(1) of the BBBEE Act for a period of 12 months. The exemption can be read as confirmation that the DTI sees the BBBEE Codes as “applicable” to the Mining Industry after the exemption is lifted on 27 October 2016.
Additionally, the revised BBBEE Codes of Good Practice (Revised BEE Codes) became effective on 01 May 2015. Both the BBBEE Amendment Act and the Revised BEE Codes expressly stipulate that where an economic sector in South Africa has a Sector Code in place for BEE purposes, companies in that sector must comply with the Sector Code. For purposes of the BBBEE Act, the Revised Mining Charter is not a Sector Code. It is not, at this stage, clear what the interplay between the Revised Mining Charter and the BBBEE Act and Revised BEE Codes is. The government may designate the Revised Mining Charter as a Sector Code in which case it would be under the auspices of the BBBEE Act, but has not chosen to do so in its government gazette notice of 17 February 2016. Until such determination is made, if at all, the Revised Mining Charter remains a stand-alone document under
63
the auspices of the MPRDA and may become subject to the trumping provision discussed above. This uncertainty might be resolved either by government clarification in this regard or by the matter receiving judicial attention.
The Royalty Act
The Mineral and Petroleum Resources Royalty Act, 2008, or the Royalty Act, was promulgated on 24 November 2008 and came into operation on 1 March 2010. The Royalty Act imposes a royalty on refined and unrefined minerals payable to the state.
The royalty in respect of refined minerals (which include gold and silver) is calculated by dividing earnings before interest and taxes, or EBIT, as calculated under IFRS, by the product of 12.5 times gross revenue calculated as a percentage, plus an additional 0.5 percent. EBIT refers to taxable mining income (with certain exceptions such as no deduction for interest payable and foreign exchange losses) before assessed losses but after capital expenditure. A maximum royalty of five percent of revenue has been introduced for refined minerals.
The royalty in respect of unrefined minerals (which include uranium) is calculated by dividing EBIT by the product of nine times gross revenue calculated as a percentage, plus an additional 0.5 percent. A maximum royalty of 7 percent of revenue was introduced for unrefined minerals. Where unrefined Mineral Resource (such as uranium) constitute less than 10 percent in value of the total composite Mineral Resource, the royalty rate in respect of refined Mineral Resource may be used for all gross sales and a separate calculation of EBIT for each class of Mineral Resource is not required. For AngloGold Ashanti, this means that currently the company will pay a royalty based on refined Mineral Resource (as the unrefined Mineral Resource (such as uranium) for AngloGold Ashanti for 2016 constituted less than 10 percent in value of the total composite Mineral Resource). The rate of royalty tax payable for 2016 was 0.50 percent of revenue of the company’s South African operations.
The President appointed the Davis Tax Committee (DTC) to review the current mining tax regime. In the Second and Final Report on Hard Rock Mining, a DTC report released in November 2017, the DTC recommended an update and refinement of the schedules in the Royalty, suggesting it should form part of regulations made by the Minister in the government gazette rather than forming part of the legislation itself. The DTC called upon the South African Revenue Service to issue a comprehensive interpretation notice on the Royalty Act to dispel industry uncertainty.
Some of the other preliminary recommendations of the committee have included the upfront capital expenditure write-off regime being discontinued and replaced with an accelerated capital expenditure depreciation regime, which is in parity with the write-off periods provided for in respect of the manufacturing (40/20/20/20) basis. Another recommendation has been to bring the taxation of newly established gold mines into line with the tax regime applicable to non-gold mining taxpayers (in so far as possible). The committee has recommended that the so called “gold formula” be retained for existing gold mines. Given the retention of the gold formula for existing gold mines, it will be necessary to retain ring fences in mines where the gold formula subsists. With regard to the additional capital allowances available to gold mines, the committee has recommended that such allowances should be phased out so as to bring the gold mining corporate income tax regime into parity with the tax system applicable to taxpayers as a whole.
Land Expropriation
On 27 February 2018, the National Assembly resolved to assign the Constitutional Review Committee (CRC) to review section 25 of the Constitution of the Republic of South Africa (Constitution) and other clauses where necessary to allow the state to expropriate land in the public interest without compensation. The CRC has been given until 30 August 2018 to report back to the National Assembly. This resolution follows the African National Congress’s (ANC) resolution at its elective conference in December 2017 to pursue expropriation of land without compensation in a manner that does not destabilise the agricultural sector, endanger food security or undermine economic growth and job creation. It is unclear at this stage what recommendations the CRC will make in its report or how the proposed expropriation of land without compensation will affect AngloGold Ashanti’s operations. The MPRDA entrenches a statutory right of access for the mining right holder to the mining area for the purposes of conducting mining operations and does not require the mining right holder to own the land on which it conducts operations. Once a mining right is granted, the landowner has no right to refuse the conducting of mining operations on the property in question and is not entitled to compensation from the mining right holder for the use of the land for mining operations conducted in terms of the MPRDA.
CONTINENTAL AFRICA
Democratic Republic of the Congo
The mining industry in the Democratic Republic of the Congo (DRC) is currently undergoing a reform as the Mining Code enacted in July 2002 and which, until recently, was the primary regulation in the mining sector, was amended by Law no 18/001, as adopted on 29 January 2018 and as enacted by the President of the Republic on 9 March 2018 (the Reformed Mining Code). The Reformed Mining Code calls for the adoption of regulatory texts, including the amendment and update of the Mining Regulations, originally promulgated in March 2003 to support the 2002 Mining Code. These regulatory texts are being drafted and negotiations between major mining companies and the DRC Government are ongoing in their respect. In its current form, the Reformed Mining Code increases the title holders’ tax burden by widening the basis for and increasing the rate of the mining royalties’ rates (the royalty rate applicable to gold increased from two and one-half percent to three and one-half percent). The Reformed Mining Code also
64
introduces a 50 percent windfall tax and increases customs and other entry and export duties, in addition to introducing a community contribution of 0.3 percent of total turnover. In addition, the Reformed Mining Code calls for an increase of the State’s free carried interest from five percent to ten percent, with an additional five percent being granted to the State upon each renewal of the exploitation permit, and a requirement that at least 10 percent of the share capital of mining companies be held by DRC individuals. Finally, the Reform Mining Code further restricts existing exchange control rules, by requiring that 60 percent of sale revenues be repatriated onshore during the investment amortization period, after which repatriation requirements apply to 100 percent of sales revenues. The Reformed Mining Code also clarifies that the Law n°2017-01 of 8 February 2017 on subcontracting in the private sector, which introduced a more stringent subcontracting regime, fully applies to the mining sector. Discussions are currently ongoing between the mining industry and the DRC authorities as to protection to be afforded to title holders benefiting from a 10-year stability provision under the 2002 Mining Code.
The Reformed Mining Code continues to vest the Minister of Mines with the authority to grant, refuse, suspend and terminate mineral rights, although such authority is to be exercised upon conditions set out in the Mining Code. Mineral rights may be granted in the form of exploration permits for an initial period of five years or in the form of mining permits which are granted for an initial period of 25 years. An exploration permit may, at any time before expiry, be transformed partially into a mining licence or a small-scale mining permit. Mining permits are granted upon successful completion of exploration and satisfaction of certain requirements, including approval of a feasibility study, an environmental impact study and an environmental management plan.
The holder of a mining permit is required to commence development and mine construction within three years of the award of such permit. Failure to do so may lead to forfeiture of the mining permit. A permit holder must comply with specific rules relating to, amongst others, protection of the environment, cultural heritage, health and safety, construction and infrastructure planning. Mining and exploration activities are required to be undertaken so as to affect as little as possible the interests of lawful occupants of land and surface rights holders, including their customary rights. The exercise of mineral rights by title holders which effectively deprives or interferes with the rights of occupants and surface rights holders requires payment of fair compensation by the mineral title holder.
To protect and enforce rights acquired under an exploration or mining permit, the Reformed Mining Code provides, depending on the nature of a dispute or threat, administrative, judicial and national or international arbitral recourses.
The Reformed Mining Code sets out taxes, charges, royalties and other fees payable to the treasury by a mining title holder in respect of its activities. It also provides for a level of fiscal stability, in that existing tax, customs and exchange control provisions applicable to the mining activities are guaranteed to remain unchanged, for a period of 5 years from the enactment of the Reformed Mining Code.
On 1 January 2012, a value added tax (VAT) replaced the previously applicable sales tax. The standard rate of VAT is 16 percent and is applicable to mining companies.
On 1 January 2013, a withholding tax of 14 percent became effective. The tax is applicable to service fees payable to a non-resident service provider by a resident of the DRC.
On 18 July 2012, the Convention between the Government of the Republic of South Africa and the Government of the Democratic Republic of the Congo for the avoidance of double taxation and the prevention of fiscal evasion with respect to taxes on income (Convention) came into effect, and is applicable to:
|
•
|
withholding taxes on amounts paid or credited on or after 1 January 2013; and
|
|
•
|
other income taxes, levied in respect of taxable periods beginning on or after 1 January 2013.
|
The Convention reduces the withholding tax on dividends paid by companies resident in the DRC to companies resident in South Africa from 20 percent to five percent and on interest paid by companies resident in the DRC to companies resident in South Africa from 20 percent to 10 percent. A South African company must own at least 25 percent of a relevant DRC entity’s outstanding shares in order to take advantage of the reduced rates.
AngloGold Ashanti holds a stake in the Kibali gold project located in north-eastern DRC. The project is operated by Randgold Resources and is owned by Randgold Resources (45 percent), AngloGold Ashanti (45 percent) and Société Minière de Kilo-Moto SA (SOKIMO) (10 percent), which latter share represents the interest of the DRC government in the Kibali gold project.
Kibali comprises 10 permits, 7 expiring in 2029 and 3 in 2030 and covering an area of 1,836 square kilometres in the Moto goldfields of the northeast DRC.
Ghana
The Constitution of Ghana as well as the Minerals and Mining Act, 2006 (Act 703) (GMM Act) provide that all minerals in Ghana in their natural state are the property of the State and title to them is vested in the President on behalf of and in trust for the people of Ghana, with rights of reconnaissance, prospecting, recovery and associated land usage being granted under licence or lease.
65
The grant of a mining lease by the Ghana Minister of Lands & Natural Resources (MOLNR) upon the advice of the Minerals Commission is subject to parliamentary ratification unless the mining lease falls into a class of transactions exempted by Parliament.
Control of mining companies
The Ghana MOLNR has the power to object to a person becoming or remaining a controller of a company which has been granted a mining lease if the Minister believes, on reasonable grounds, that the public interest would be prejudiced by the person concerned becoming or remaining such a controller.
Stability agreement
The GMM Act provides for stability agreements as a mechanism to guarantee certain terms and conditions, mainly fiscal, to which a company’s operations are subject for a period of 15 years. Stability agreements are subject to ratification by Parliament.
On 18 February 2004, AngloGold and the Government of Ghana agreed on the terms of a stability agreement (Ghana Stability Agreement) to govern certain aspects of the fiscal and regulatory framework under which AngloGold Ashanti would operate in Ghana following the implementation of the business combination. The Ghana Stability Agreement necessitated the amendment of the Obuasi mining lease which had been ratified by Parliament.
Under the Ghana Stability Agreement, the Government of Ghana agreed:
|
•
|
to extend the term of the mining lease relating to the Obuasi mine until 2054 on terms existing prior to the business combination;
|
|
•
|
to maintain, for a period of 15 years, the royalties payable by AngloGold Ashanti with respect to its mining operations in Ghana at a rate of 3 percent per annum of the total revenue from minerals obtained by AngloGold Ashanti from such mining operations;
|
|
•
|
to ensure the income tax rate would be 30 percent for a period of 15 years. The agreement was amended in December 2006 to make the tax rate equal to the prevailing corporate rate for listed companies if the rate was less than 30 percent; and
|
|
•
|
to permit AngloGold Ashanti and any or all of its subsidiaries in Ghana to retain up to 80 percent of export proceeds in foreign currencies offshore, or if such foreign currency is held in Ghana, to guarantee the availability of such foreign currency.
|
The Ghana Stability Agreement also stipulates that a sale of AngloGold Ashanti’s or any of its subsidiaries’ assets located in Ghana remains subject to the Government’s approval. Furthermore, the Government retains its special rights (Golden Share) under the provisions of the GMM Act pertaining to the control of a mining company, in respect of its assets and operations in Ghana.
The Government of Ghana agreed that AngloGold Ashanti’s Ghanaian operations will not be adversely affected by any new enactments or orders, or by changes to the level of payments of any customs or other duties relating to mining operations, taxes, fees and other fiscal imports or laws relating to exchange control, transfer of capital and dividend remittance until April 2019, which is 15 years after the completion of the business combination.
AngloGold Ashanti (Ghana) Limited has negotiated a new Development Agreement (DA) and Tax Concession Agreement (TCA) in relation to the Obuasi Mine with government. These agreements, which govern the redevelopment of the Obuasi Mine, have not yet received parliamentary approval. Once approved, the current Stability Agreement will cease to apply to the Obuasi Mine but will continue to apply to the Iduapriem Mine until it expires in April 2019.
Tax laws
In March 2012 the tax laws of Ghana were amended. Changes to the tax laws included:
|
•
|
An increase in the income tax rate applicable to mining businesses from 25 percent to 35 percent. AngloGold Ashanti is currently protected until 2019 from any increase of its income tax rate to greater than the rate provided for under the Ghana Stability Agreement.
|
|
•
|
Introduction of a new capital allowance regime for class 3 assets (which include mineral and petroleum exploration and production rights, buildings, structures and works of a permanent nature used in mineral and petroleum exploration and production and plant and machinery used in mining and petroleum operations) that provides for a 20 percent straight line rate for a period of five years. Pursuant to the Ghana Stability Agreement, this change will not affect AngloGold Ashanti until 2019.
|
|
•
|
Elimination of the five percent allowance on prior year additions. Prior to the 2012 amendment, the tax code granted an additional five percent of the value of assets acquired and qualified to be classified as class 3 assets for the purpose of granting capital allowances. Capital allowance is now 20 percent each year on the total value of the assets. Pursuant to the Ghana Stability Agreement, this change will not affect AngloGold Ashanti until 2019.
|
|
•
|
A ring fencing rule to prevent mining businesses from deducting or setting off costs from one mining area with another’s income. Pursuant to the Ghana Stability Agreement, this change will not affect AngloGold Ashanti until 2019.
|
66
Golden Share
Under the Stability Agreement, the Government of Ghana (Government) has confirmed and agreed that the Government’s rights with respect to the Golden Share apply only in respect of AngloGold Ashanti’s assets and operations in Ghana. The rights do not extend to any other assets or operations of AngloGold Ashanti outside Ghana, nor to any assets or operations of AngloGold Ashanti.
The Government has also agreed to waive any right it may have under Section 60(I) of the Minerals and Mining Law, 1986, as amended to acquire a special share in AngloGold Ashanti or any of its direct or indirect subsidiaries or joint ventures.
The Golden Share may only be held by or transferred to a Minister of the Government or any person acting on behalf of such Government and authorised in writing by such Minister.
The following matters require, and will not be effective without, the written consent of the holder of the Golden Share:
|
(i)
|
any amendment to or removal of the relevant provisions of the AngloGold Ashanti (Ghana) Limited Regulations setting out the rights and restrictions attaching to the Golden Share;
|
|
(ii)
|
the voluntary winding-up or voluntary liquidation of AngloGold Ashanti (Ghana) Limited;
|
|
(iii)
|
the redemption of or purchase by AngloGold Ashanti of the Golden Share;
|
|
(iv)
|
the disposal of any mining lease held by AngloGold Ashanti (Ghana) Limited or any subsidiary of AngloGold Ashanti (Ghana) Limited; and
|
|
(v)
|
any disposal by AngloGold Ashanti (Ghana) Limited (other than any disposal in the ordinary course of business of AngloGold Ashanti) which, alone or when aggregated with any disposal or disposals forming part of, or connected with, the same or a connected transaction, constitutes a disposal of the whole or a material part of the assets of the AngloGold Ashanti group taken as a whole. For this purpose, a part of the AngloGold Ashanti group’s assets will be considered material if either (a) its book value (calculated by reference to the then latest audited consolidated accounts), or the total consideration to be received on its disposal, is not less than 25 percent of the book value of the net assets of the AngloGold Ashanti group or (b) the average profits attributable to it represent at least 25 percent of the average profits of the AngloGold Ashanti group for the last three years for which audited accounts are available (before deducting all charges, except taxation and extraordinary items).
|
Upon a return of assets in a winding-up or liquidation of AngloGold Ashanti (Ghana) Limited, the holder of the Golden Share is entitled to the sum of 0.10 cedis in priority to any payment to other members, but the Golden Share confers no further right to participate in the profits or assets of AngloGold Ashanti. The Golden Share carries no right to any dividend or any right to participate in any offer of securities to existing shareholders or in any capitalisation issue.
The holder of the Golden Share may require AngloGold Ashanti (Ghana) Limited to redeem the Golden Share at any time in consideration of the payment to such holder of 0.10 cedis.
VAT
In December 2013, the Parliament of Ghana (Parliament) passed an amendment to the Internal Revenue Act, 2000 (Act 592) known as the Internal Revenue (Amendment) (No. 2) Act 2013, (Act 871). This, amongst other changes, increased the withholding tax for goods and services supplied by non-residents, payments to non-resident individuals and payment for management and technical services from 15 percent to 20 percent. A new Value Added Tax Act, (VAT) 2013 (Act 870) imposes a 15 percent VAT payable on goods and services. The National Health Insurance Act 2012 (Act 852) also imposes a two and one-half percent VAT payable on goods and services. The total VAT payable on goods and services is therefore 17.5 percent. The Value Added Tax 2013, (Act 870) extended the coverage of the tax to some business activities which were hitherto outside the tax net. These included the supply of financial services that are rendered for a fee, commission or a similar charge and the manufacture or supply of pharmaceuticals. The implementation of the charging of VAT in relation to these two services has however been suspended until further notice. These taxes do not have an adverse effect on the Company since they do not directly impact its operations.
The Value Added Tax (Amendment) Act, 2017, (Act 948) was passed to amend the Value Added Tax 2013, (Act 870). The Amendment, among other changes, classifies the supply of financial services and gives legal backing to a three percent VAT Flat Rate Scheme (FRS).
The FRS applies to all wholesalers and retailers including suppliers who import to resell on wholesale or retail. Prior to the introduction of the FRS, suppliers were allowed to charge 17.5 percent against the output tax charged on the value of their supplies. However, suppliers are currently prohibited to charge the 17.5 percent under the new scheme. Hence the 17.5 percent is rather inculcated into the price of goods/ products supplied, passing on the costs to the consumer. Thus, goods purchased by AngloGold Ashanti from its suppliers fall within this bracket and have turned out to be more expensive than previously.
The Value Added Tax (Amendment) (No. 2) Act, 2017, (Act 954) was enacted to amend the Value Added Tax 2013, (Act 870) to remove tax on stakes in the National Lotto, to provide for withholding from the payment of VAT to registered VAT traders.
67
Income taxes
In November 2015, Parliament passed the Income Tax Act, 2015 (Act 896) (ITA) which repealed the Internal Revenue Act, 2000, (Act 592), as amended. The ITA became effective from 1 January 2016 for the 2016 year of assessment. The ITA ring fences and taxes income derived from mining operations at the rate of 35 percent. For the purpose of ascertaining the income of a person for taxation, each separate mineral operation is treated as independent business and taxed accordingly. Pursuant to section 2.06 of the Stability Agreement, the ring fencing provision will not apply to AngloGold Ashanti until 2019 and until then the company’s tax exposure will not exceed 30 percent.
The ITA provides for the carrying forward of losses for up to five years. Losses carried forward can only be used in the order in which they were generated or incurred. The ITA further provides that capital allowances calculated or granted shall be taken in that year and shall not be deferred.
The ITA states that expenditure incurred in the course of reconnaissance or prospecting operations shall be placed in a single pool, and the balance in that pool is to be carried forward year to year until commencement of production. When production commences, the amount in the pool must be capitalised and the Commissioner-General of the Ghana Revenue Authority shall grant a capital allowance in respect thereof. The ITA also provides guidance on how costs incurred during the reconnaissance and exploration phase of a mine ought to be treated.
The ITA imposes a withholding tax on dividends paid by a person conducting mineral operations in Ghana at eight percent. This is regardless of the amount of shareholding a shareholder or shareholders may have in the entity paying the dividend. Under section 59 (3) of the ITA, an exemption from tax exists where the recipient of the dividend holds or controls directly or indirectly at least 25 percent of the voting power of the company paying the dividend.
The ITA also introduces some variation in the rates of withholding taxes. For example, payments for the supply of services (Payments with a Source in Ghana to Persons Other Than Individuals) has been increased from 5 percent to 15 percent; the withholding tax on resident Directors’ remuneration has been increased from 10 percent to 20 percent; and withholding taxes on natural resource payments and royalties have been increased from 10 percent to 15 percent. This may have an indirect impact on AngloGold Ashanti’s operations as this rate will have a material impact on the margins of suppliers and possibly their working capital. Suppliers may therefore seek to pass this on to AngloGold Ashanti by increasing their fees and charges.
The ITA also abolishes the flat 15 percent rate of tax on capital gains. Capital gains are now to be included in business or investment income and taxed at the applicable income tax rate which, for persons engaged in mineral operations, is 35 percent.
Various amendments were made to the ITA as follows:
|
•
|
Income Tax (Amendment) Act, 2015 (Act 902) provides new tax rates on the chargeable income of resident individuals for a year of assessment, introduces a 15 percent withholding tax rate applicable to service fees with a source in Ghana to resident individuals for services other than those expressly provided for under Act 902 and increases the monetary threshold for an individual to whom a presumptive tax applies. Presumptive tax payable on turnover is now three percent of the business where the turnover is more than GHS 20,000 but does not exceed GHS 200,000 (instead of the initial presumptive tax of three percent payable where the turnover was more than GHS 20,000 but did not exceed GHS 120,000); and
|
|
•
|
Income Tax (Amendment) Act 2016 (Act 907) exempts from tax, interest and dividends paid to an investor in an approved unit trust scheme or mutual fund, and also reduces withholding tax on service fees payable by a resident person, other than an individual, to another resident person from 15 percent to seven and one-half percent.
|
The Income Tax Regulations L.I. 2244 pursuant to the provisions of the ITA was also introduced to reduce the income tax imposed on the wages of casual and temporary workers from the previous rate of seven and one-half percent to 15 percent to a fixed rate of five percent. The rate of tax imposed on the chargeable income of a non-resident temporary worker is 20 percent. A resident temporary worker’s chargeable income is taxed as follows: the first GHS 2,592 is exempt from tax, the next GHS 1,296 is subject to five percent tax, the next GHS 1,812 is subject to 10 percent tax, the next GHS 33,180 is subject to 17.5 percent tax and any amount exceeding GHS 38,880 is subject to 25 percent tax.
Further amendments have been made to the ITA as follows:
|
•
|
The Income Tax (Amendment) Act, 2017 (Act 941) provides for the exemption from tax of the gains from the realisation of securities listed on the Ghana Stock Exchange.
|
|
•
|
The Income Tax (Amendment) (No.2), Act 2017, Act 956 provides for accelerated capital allowance for manufacturers and importers of stamping machines for the implementation of the excise tax stamp policy and also exempts from tax for five years, the income of an entrepreneur (who is not more than 35 years old) from the business of manufacturing, information and communications technology, agro processing, energy production, waste processing, tourism and creative arts, horticulture and medicinal plants.
|
68
Tax Amnesty Act, 2017 (Act 955) grants amnesty to persons who have failed to register with the Commissioner-General or file their tax returns or pay taxes as required by enactments administered by the Commissioner-General. Under Act 955, the Commissioner-General is prohibited from assessing or recovering taxes, penalties and interests in respect of previous years up to and including the 2017 year of assessment, where the defaulting party on or before September 30, 2018 registers with the Ghana Revenue Authority and files income tax returns for the 2014, 2015 and 2016 years of assessment.
Retention of foreign earnings
AngloGold Ashanti’s operations in Ghana are permitted to retain 80 percent of their foreign exchange earnings in an offshore foreign exchange account. In addition, the company has permission from the Bank of Ghana to retain and use US dollars, outside of Ghana, to fulfill payment obligations to the company’s hedge counterparties which cannot be met from the cash resources of its treasury company. On 4 February 2014, the Bank of Ghana issued new directives as part of measures to streamline the collection and repatriation of export proceeds to Ghana. These directives included an instruction to all banks and authorised dealers to, within five working days of receipt of export proceeds, convert the proceeds into Ghana cedis based on the average Interbank Foreign Exchange Rate prevailing on the day of conversion with a spread not exceeding 200 percentage in points (pips). Exporters with retention accounts were to continue to operate these accounts in accordance with their retention agreements. Retention proceeds which were sold to the banks were to be converted into Ghana cedis based on the average Interbank Foreign Exchange Rate prevailing on the day of conversion with a spread not exceeding 200 pips. It further advised that offshore foreign exchange transactions by resident companies, including exporters, were strictly prohibited and exporters were to ensure that all export proceeds are repatriated in full. Failure to comply with the provisions attracts penalties including pecuniary sanctions, jail terms, suspension and revocation of the operating licence as applicable.
Following engagement with relevant stakeholders, the Bank of Ghana issued another notice clarifying that the transfer of foreign exchange to meet external payment obligations remains permissible for transactions such as:
|
•
|
redemptions and coupon payments on Bonds held by non-residents;
|
|
•
|
investment income, technology and management transfer entitlements, expatriate emoluments, and other incentive packages and overseas commitments under provisions in various legislation and legislative instruments such as the GMM Act, and the Technology Transfer Regulations ( L.I.1547 ); and
|
|
•
|
other outward payments for imports of goods and services.
|
The notice also stated that all balances in Foreign Currency Accounts (FCAs) and Foreign Exchange Accounts (FEAs) will continue to be held in foreign currency, and will not be converted into Ghana Cedis. External transfers of up to $10,000 per annum without documentation from FEA and FCA are still permitted. Balances held in FEAs and FCAs continue to remain available for all legitimate external transactions.
The Bank of Ghana on 9 August 2014 further revised the rules on foreign exchange operations, effectively reversing the initial directives controlling transactions in foreign exchange. The details are as follows:
|
•
|
The limit of $1000.00 on over-the-counter foreign exchange cash withdrawal is removed.
|
|
•
|
Exporters shall continue to repatriate in full export proceeds in accordance with the terms agreed between the trading parties. Such proceeds shall be credited to their FEAs and converted on a need basis.
|
|
•
|
FEAs and FCAs will continue to be opened and operated as they were before the Notices of February 4, 2014.
|
|
•
|
Except for transfers from FEA to FCA which are still prohibited, all other transfers between accounts are permitted.
|
|
•
|
For the avoidance of doubt:
|
|
◦
|
FCAs shall be fed only with unrequited transfers such as transfers from abroad for investment or embassy transfers.
|
|
◦
|
FEAs shall be fed with foreign exchange generated from activities in Ghana such as proceeds from exports of goods and services.
|
|
•
|
The threshold for transfers abroad without initial documentation remains at $50,000.00. Where documentation in respect of a transfer remains outstanding, any subsequent import transaction by an importer, irrespective of value, shall only be made on prior provision of documentation required for the current import transaction.
|
|
•
|
Importers who use non-cash instruments (plastic cards) may continue to load up to $50,000 to meet their legitimate needs abroad subject to the necessary documentation requirements.
|
|
•
|
Foreign currency denominated loans may be granted by resident banks to their customers subject to their own internal procedures and processes and in compliance with the risk management guidelines of the Bank of Ghana.
|
|
•
|
Cheques and cheque books may be issued by banks to holders of FEAs and FCAs.
|
The Bank of Ghana reiterated that the Ghana cedi remains the sole legal tender in Ghana. Therefore, pricing, advertising, invoicing, receiving, and making payments for goods and services should be done in Ghana cedis, unless otherwise authorized by the Bank of Ghana.
Existing measures that were not amended by this Notice continue to remain in force.
AngloGold Ashanti maintains and operates its FCA, FEA and Retention Accounts in compliance with the directives.
69
Localisation policy
Mining companies must submit a detailed programme for the recruitment and training of Ghanaians with a view to achieving “localisation”, which is the replacement of expatriate personnel in a company’s Ghanaian operations by Ghanaian personnel. In addition, mining companies must give preference to Ghanaian products and personnel, to the maximum extent possible, consistent with safety, efficiency and economies. Recently passed Minerals and Mining (General) Regulations, 2012 (L.I. 2173) give further details on the localisation policy.
Except as otherwise provided in a specific mining lease, all immovable assets of the holder of the mining lease vest in the State upon termination, as does all moveable property that is fully depreciated for tax purposes. Moveable property that is not fully depreciated is to be offered to the state at the depreciated cost. The holder must exercise his rights subject to such limitations relating to surface rights as the Minister of Mines may prescribe.
Ground rent
In 2012, the Ghanaian Parliament passed the Fees and Charges Amendment Legislation 2012 (Ll 2191), which fixed mineral concession rent at Gh¢9,016 per square kilometre per annum as opposed to the previous rate of Gh¢0.50 per acre per annum. However, on 19 March 2014, the Office of the Administrator of Stool Lands informed the Ministry of Finance in writing that it has agreed with the Ghana Chamber of Mines to revise the fees to Gh¢15.0 per acre per annum. The Chamber has since 2 September 2014 instructed all mining companies to pay the agreed sum. The Fees and Charges (Amendment) Instrument 2015 (LI 2208), was passed by Parliament on December 23, 2015, which, among other things, fixes the payment of ground rent by mining companies at Gh¢15 per acre per annum. The company has since paid the agreed ground rent for its Binsere Leases but paid $36 per km
2
for the Obuasi lease as specifically provided for in the lease. The company also indicated to the Office of the Administrator of Stool Lands that by virtue of the Ghana Stability Agreement, the company is protected from the increase in the ground rent for the duration of the Stability Agreement, and that the company’s payment of same cannot be deemed as a waiver of its rights under the Stability Agreement.
National Fiscal Stabilisation (Amendment) Act, 2014 (Act 882)
The National Fiscal Stabilisation (Amendment) Act has extended the application of the National Fiscal Stabilisation Levy to net profits before tax up to and including the 2017 year of assessment. In the past, AngloGold Ashanti has sought protection under the Stability Agreement and this has been granted. AngloGold Ashanti will therefore continue seeking the protection.
Special Import Levy Act, 2014 (Act 884)
The Special Import Levy Act has extended the application of the National Fiscal Stabilisation Levy to profits before tax up to and including the 2017 year of assessment. The Special Import Levy (Amendment) Act, 2017 (Act 944) was passed to remove the levy payable on some petroleum products, fertilizer and certain types of machinery and equipment.
Customs and Excise (Petroleum Taxes and Petroleum Related Levies) (Amendment) Act, 2014 (Act 886)
The Customs and Excise (Petroleum Taxes and Petroleum Related Levies) (Amendment) Act reversed the excise tax on petroleum products (petroleum, gas oil, residual fuel oil, unified gasoline, kerosene, liquefied petroleum gas and local marine gas) from ad valorem to specific tax.
The Customs and Excise (Petroleum Taxes and Petroleum Related Levies) Repeal Act, 2017 (Act 943) was passed to repeal the Customs and Excise (Petroleum Taxes and Petroleum Related Levies) Act, 2005 (Act 685). Act 685 revised duties, taxes and levies on specified petroleum products.
Customs (Amendment) Act, 2015 (Act 905)
Following the passage of the Customs (Amendment) Act, 2015 (Act 905), by the Ghana Revenue Authority, the ECOWAS Regional Common External Tariff (CET) came into effect on 1 February 2016. It replaces the Harmonised Systems: Common External Tariff and Other Schedules. The CET is one of the instruments of harmonising ECOWAS Member States and strengthening its Common Market.
Directive from Commissioner of Customs
A Directive was issued from the Minister of Finance requiring persons who qualify for exemptions from import duties and taxes to make prior payment at the ports and subsequently apply for a refund.
Tax Stamp Policy
This was launched pursuant to the Excise Stamp Act, 2013 (Act 873). Act 873 requires the manufacturer or importer of goods for which Excise Tax Stamp is required to bear the cost of the stamp. The cost of the stamp may be subsidized as the Minister for
70
Finance may determine. The policy makes provision for the Government to bear the entire cost of the stamp for the first half of the year 2018 and to bear half the cost for the second half of the year. The Government will review its position on the cost burden after 2018.
Energy Sector Levies Act, 2015 (Act 899)
The Energy Sector Levies Act, which received assent on 24 December 2015, consolidates existing energy sector levies and imposes a new levy, the Price Stabilization and Recovery Levy. The Price Stabilization and Recovery Levy, which is to be collected by the National Petroleum Authority and paid into the Price Stabilisation and Recoveries Account, applies to petrol at a rate of 12 Ghana pesewas per litre, to diesel at a rate of 10 Ghana pesewas per litre, and to liquefied petroleum gas at a rate of 10 Ghana pesewas per kilogram.
The Energy Sector Levies (Amendment) 2017 (Act 899) amends Act 899 by a downward review of the National Electrification Scheme Levy from five percent to two percent and the Public Lighting Levy from five percent to three percent per price of kilowatts of electricity charged for all categories of consumers.
Minerals and Mining (Amendment) Act 2015 (Act 900)
A Minerals and Mining (Amendment) Act was passed by Parliament and assented to by the President on 16 December 2015. It replaces the existing royalty provisions introduced by the Minerals and Mining Amendment Act, 2010 (Act 794) pursuant to which the rate of royalties was fixed by an Act of Parliament. Under the new regime, the Minister will prescribe the rate payable and the manner of payment by passing a Legislative Instrument or other subsidiary legislation. The existing royalty rate of five percent however remains the same until such time as the rate is altered in the manner prescribed. The Minerals and Mining (Amendment) Act 2015 also makes provision for the confiscation of the equipment of illegal miners.
Notification of the Minerals Commission - Expatriate Visitors to Mine Sites
The Minerals Commission issued a directive to all mining companies and mine support service providers to notify the Commission of all expatriate visitors to mine sites pursuant to the Minerals and Mining (General) Regulations 2012 (LI 2173) and the Minerals and Mining (Support Services) Regulations 2012 (LI 2174).
Minerals Development Fund Act 2016 (Act 912)
Parliament has passed the Minerals Development Fund Act, 2016 (Act 912). The purpose of the law is to establish a Minerals Development Fund (MDF) to address the development challenges affecting mining communities by setting aside 20 percent of mineral royalties received by the government for development projects. The MDF is to provide financial resources for the direct benefit of communities within mining areas. The law introduces the Mining Community Development Scheme to directly sponsor socio-economic development in communities in which mining operations take place or which are affected by mining activities.
Local Governance Amendment Act, 2017 (Act 940)
The Local Governance Amendment Act, 2017 (Act 940) was introduced to restore the President’s discretionary power to revoke the appointment of government appointees to District Assemblies. The Act will also speed up the appointment processes to enable District Assemblies to perform effectively and forestall further delay of appointments to District Assemblies.
Mining & Environmental Guidelines
In June 2014, the Ghana Environmental Protection Agency and the Minerals Commission circulated draft Mining and Environmental Guidelines to all mining companies for comment. The guidelines concern environmental management, reclamation, closure requirements and the proposed Mining Community Development Scheme. The Mining Community Development Scheme has since been established pursuant to the Minerals Development Fund Act 2016 (Act 912), discussed above.
Rules regarding the export of gold and diamonds
The Bank of Ghana introduced new measures to regulate and monitor the export of gold and diamonds from Ghana. From 15 September 2015, all exports of gold and diamonds must be carried out through the Precious Minerals Marketing Company, except where the exporter is the holder of a licence that permits it to export directly, and the Ghana Revenue Authority (Customs Division) only permits gold to be exported by a licensed gold exporter who has a completed Form FEX A4 bearing Bank of Ghana’s embossment. The export measures do not apply to AngloGold Ashanti because the company holds a licence granted by the Minister for Lands and Natural Resources to sell and export its production.
The Bank of Ghana issued a notice (Notice No. BG/GOV/SEC/2016/02) which, among other things, now allows mining companies to sell the portion of foreign exchange receipts from export that was earmarked for surrender to the Bank of Ghana directly to the commercial banks.
71
In November 2016, the Ministry of Lands and Natural Resources issued a ministerial directive appointing the Precious Minerals Marketing Company Ltd (PMMC) as designated laboratory for assaying in Ghana. The directive requests all persons holding export licenses for gold to submit all gold to be exported to the PMMC for assay before export. Mining businesses, including AngloGold Ashanti, acting through the Ghana Chamber of Mines are opposed to this and the Chamber has initiated measures to get the directive reversed or modified due to its potential negative impact on mining companies in the region.
Office of the Special Prosecutor Act, 2017 (Act 959)
Act 959 was passed to establish the Office of the Special Prosecutor as a specialised agency to investigate specific cases of alleged or suspected corruption or corruption-related offences involving public officers and politically exposed persons in the performance of their functions as well as persons in the private sector involved in the commission of alleged or suspected corruption and corruption-related offences and to prosecute these offences on the authority of the Attorney General.
Special Petroleum Tax Act, 2014 (Act 879)
A Special Petroleum Tax of 17.5 percent was proposed as part of a rationalisation of the VAT regime and change in the petroleum pricing structure. The tax rate was reduced from 17.5 percent to 15 percent in 2017 pursuant to the Special Petroleum Tax (Amendment) Act, 2017 (Act 942).
Budget Statements
Paragraph 855 of the Budget Statement for 2018 indicates the Government of Ghana’s intention to adopt a policy to leverage Ghana’s gold deposits to attract additional funding for accelerated growth and development and to minimize exposure to the volatile price of gold. The government intends to accomplish this by using factoring (an up-front payment instrument).
The Multilateral Mining Integrated Project (MMIP)
The MMIP is a five-year project underway by the Government of Ghana to address illegal and unsustainable mining practices in Ghana. Commenced in mid-2017, the MMIP “combines a Legislation, Enforcement, Civil, Integrated and Technological Approach (LECITA) as a sustainable and structured yet regimented conjoint concept” to combat with illegal mining. The MMIP involves (i) reviewing and enforcing of the legal and regulatory regime of the small scale mining sector, (ii) reclaiming and rehabilitating degraded lands, (iii) dredging silted estuaries and waterways, (iv) implementing social interventions to facilitate livelihood creation in mining communities, (v) adapting technology to increase mining efficiency, processing, environmental and monitoring activities, and (vi) building the capacity of artisanal and small-scale miners and regulatory institutions.
Mining properties
The company is required to pay ground rent to the Government of Ghana and such other fees as are prescribed by legislation, including royalties on timber felled within the lease area.
Obuasi
The current mining lease for the Obuasi area was granted by the Government of Ghana on 5 March 1994. It grants mining concessions to land with an area of approximately 338 square kilometres in the Amansie East and Adansi West districts of the Ashanti region for a term of 30 years from the date of the agreement. In addition, a mining lease over an adjacent 140 square kilometres was also granted, resulting in the total area under the mining lease increasing to 474 square kilometres.
The Government of Ghana agreed to extend the term of the mining lease relating to the Obuasi mine until 2054. The mining lease was formally ratified by Parliament on 23 October 2008.
On 3 March 2016, the Minerals Commission approved AngloGold Ashanti Ghana’s application to surrender approximately 273.54 square kilometres of the area to the Government of Ghana, reducing the lease areas to 201.46 square kilometres. The remaining parcel of land that will be subject to the mining lease is situated within various villages and townships in the region, but excludes the municipality of Obuasi.
Iduapriem
Iduapriem has title to a 31 square kilometre mining lease granted on 19 April 1989 for a period of 30 years. In January 2009 Iduapriem obtained a new mining lease, the Ajopa Concession, for a period of 10 years. The concession covers an area of 48.34 square kilometres. In December 2011 the Minister of Lands and Natural Resources gave his consent for Teberebie’s title to a 25.83 square kilometre mining lease, granted in June 1992 for a period of 30 years, to be assigned to Iduapriem. While ownership of the lease has passed to Iduapriem, the registration of the transfer of the lease is still in process.
72
Guinea
In Guinea, all mineral substances are the property of the State. Mining activities are regulated by law L/2011/006/CNT dated 9 September 2011 as amended by law L/2013/053/CNT dated 8 April 2013 and promulgated by decree D/2013/075/PRG/SGG dated 17 April 2013 (together, the Mining Code).
The Mining Code is accompanied and implemented by various implementation decrees. To date, various decrees have been adopted, including decree D/2014/015/PRG/SGG adopting a model of mining convention, dated 17 January 2014, order A/2016/1584/MMG/SGG related to the administration’s capacities for the management of integrated mining projects (PARCA-GPI) and its steering committee, dated 6 June 2016, decree D/2016/163/PRG/SGG on the national agency for the development of mining infrastructures (ANAIM), dated 13 June 2016, and decree D/2016/215/PRG/SRG on the appointment of executives to the Ministry of Mines and Geology, dated 8 July 2016. In 2017, the modalities regarding the use of the mining companies’ financial contribution to the development of the local communities and the rules applying to the Local Development Fund (Fodel) created under the Mining Code have been enacted through the adoption of decree D/2017/285/PRG/SGG setting the conditions for the constitution and management of the Fodel, dated 31 October 2017 and the joint order A/2017/6326/MMG/MATD/SGG setting out the conditions for the use, management and control of the Fodel, dated 22 November 2017. Also, a joint order AC/2017/3228/MATD/MMG/SGG updating the act on the establishment, attribution and functioning of the coordination committees in mining communities (CCLMS), dated 21 July 2017 has been issued by the Ministry of Territorial Administration and Decentralisation and the Ministry of Mines and Geology. The main purpose of the CCLMs, in which all concerned mining companies are represented, being to prevent and settle disputes that may arise in mining communities.
The right to undertake mining operations can only be acquired by virtue of one of the following mining titles: surveying permit, small-scale mining licence, exploration licence, mining licence or mining concession.
The group’s Guinea subsidiary, Société AngloGold Ashanti de Guinée SA (SAG), has title to the Siguiri mine in the form of a mining concession, granted by virtue of Presidential Decree D/97/171/PRG/SGG dated 4 August 1997, for a period of 25 years (the Mining Concession). The Mining Concession was originally covered by a mining convention entered into with the Republic of Guinea on 11 November 1993 (the Convention de Base) and amended in 2005. The Convention de Base provided for an initial duration of 25 years and would have expired in 2018.
The Mining Code, which came into force after the conclusion of the Mining Convention, confirms the validity of mining titles previously issued. The Mining Code also provides that for holders of validly signed and ratified mining conventions, the application of the Mining Code will take place by way of amendments to the relevant mining convention (in the case of SAG, the Convention de Base), which amendments are to be negotiated between the mining convention holder and the State.
On 28 June 2016, SAG and the Government of Guinea concluded a revised and consolidated convention de base (the Revised Convention de Base) which encompasses a renewal of the term of the original Convention de Base and other amendment necessary to support an expansion project proposed to extend the life of the Siguiri mine (the Expansion).
In compliance with the provisions of the Mining Code, the Revised Convention de Base was ratified by the Guinean National Assembly (law L/2016/N°067/AN dated 30 December 2016, promulgated by decree D/2017/015/PRG/SGG dated 24 January 2017), submitted to the Guinean Supreme Court which rendered a favourable opinion (judgment N°AC 005 dated 16 January 2017), and ratified by the President of the Republic (decree D/2017/021/PRG/SGG dated 24 January 2017).
As a consequence, as and from 24 January 2017, the Revised Convention de Base has cancelled and replaced the original Convention de Base, and governs the operations at the Siguiri mine and under the Mining Concession.
Key elements of the Revised Convention de Base include the following:
|
•
|
a duration of 25 years, expiring 23 January 2042, subject to further renewal if mining operations continue at that time; and with the term of the Mining Concession being aligned with the term of the Revised Convention de Base such that the Mining Concession will be renewed as long as the Revised Convention de Base remains in force;
|
|
•
|
SAG’s operations remain governed by the 1995 Mining Code and are only subject to the provisions of the Mining Code to the extent they are expressly set out in the Revised Convention de Base;
|
|
•
|
the stability of the customs and tax regime is guaranteed for the entire initial term of the Revised Convention de Base, and subject to certain condition being met, any renewal period(s);
|
|
•
|
the Republic of Guinea holds a 15 percent free-carried/non-contributory interest;
|
|
•
|
the Republic of Guinea is entitled to a royalty on gold of five percent based on a spot gold price as per LBMA fixing (PM) up until the date of steady state commercial production of the first phase of the Expansion, after which the royalty rate applicable to gold will vary depending on threshold prices as per LBMA fixing (PM), namely: three percent if the gold price is USD 1,300 or less, five percent, if above USD 1,300 and up to USD 2,000 and seven percent if above USD 2,000;
|
|
•
|
SAG will enjoy a 5 year income tax holiday as and from the beginning of steady state commercial production of the first phase of the Expansion, after which the income tax rate is set at 30 percent;
|
|
•
|
a local development tax of 0.4 percent is payable on the sale price for gold and silver received by SAG up until 31 December 2027, after which it will be increased to 0.6 percent;
|
73
|
•
|
salaries of expatriate employees are subject to a 10 percent income tax;
|
|
•
|
goods imported into Guinea for purposes related to the construction and commissioning of the first phase of the Expansion are exempt from all customs taxes and duties; and
|
|
•
|
SAG is committed to adopting and progressively implementing a plan for the effective rehabilitation of the mining areas disturbed or affected by its operations.
|
The Mining Concession covers an area divided into four blocks and totalling 1,495 square kilometres. SAG has the exclusive right to explore and mine in any part of the concession area for the duration of the period of the Revised Convention de Base. The Revised Convention de Base also grants SAG with the option to secure certain land rights over additional areas currently covered by exploration permits, but to which SAG may need access for purposes of establishing roads or storage of tailings.
The Revised Convention de Base is subject to early termination if the parties formally and expressly agree to it, if the last of the mining title held by SAG expires or is relinquished without any renewal application having been filed, if all project activities are voluntarily suspended for a continuous period of twelve months or are permanently abandoned by SAG; or if SAG goes into voluntary liquidation or is placed into liquidation by a court of competent jurisdiction.
Mali
Mineral rights in Mali are governed by law n°2010-015 dated 27 February 2012 bearing Malian Mining Code (New Mining Code), replacing ordinance No. 99-32/P-RM of 19 August 1999 enacting the previous mining code, as amended by ordinance n°013/2000/P-RM of 10 February 2000 and ratified by law n°00-011 of 30 May 2000 (1999 Mining Code), and Decree No. 99-255/P-RM of 15 September 1999 implementing the Mining Code.
Due to stabilisation clauses in the agreement defining the mining rights and obligations of AngloGold Ashanti entities in Mali (further described below), the mining operations carried out by the AngloGold Ashanti entities in Mali are subject to the provisions of the previous mining codes of 1970 and 1991 but also, for residual matters, expressly subject to the provisions of the 1999 Mining Code (see “Applicable mining regime” below). As a consequence the New Mining Code does not apply to the relevant mining operations.
Applicable mining regime
Prospecting activities are carried out under prospecting authorisations (autorisation de prospection). The authorisations give an individual or corporate entity the exclusive right to carry out prospecting activities over a given area for a period of three years renewable without a reduction in the area covered by the authorisation. Exploration activities may be carried out under exploration permits (permis de recherche). The latter are granted to corporate entities only by order of the Minister of Mines. Exploration permits are granted for a period of three years, renewable twice for additional three-year periods. Each renewal requires the permit holder to relinquish 50 percent of the area covered by such permit. The entity applying for such a permit must provide proof of technical and financial capabilities.
An exploitation permit (permis d’exploitation) is required to mine a deposit located within the area of a prospecting authorisation or an exploration permit. The exploitation permit grants an exclusive right to prospect, explore and exploit the named substances for a maximum period of 30 years renewable three times for an additional 10 years. The exploitation permit is granted only to the holder of an exploration permit or of a prospecting authorisation and covers only the area governed by the exploration permit or the prospecting authorisation. An application must be submitted to the Minister of Mines and to the National Director of Mines.
As soon as the exploitation permit is granted, the permit holder must incorporate a company under the law of Mali. The permit holder will assign the permit for free to this company. The State will have a 10 percent free carried interest in the company. This interest will be converted into priority shares and the State’s participation will not be diluted in case of an increase in capital.
Applications for exploitation permits must contain various documents attesting to the financial and technical capacity of the applicant, a detailed environmental study in respect of the impact of the project on the environment, a feasibility study and a bank deposit. The permit is granted by decree of the Head of Government. Refusal to grant a permit may only be based on two grounds: insufficient evidence to support the exploitation of the deposit or the failure of the environmental study.
Applications for prospecting authorisations and exploration permits must contain various documents attesting to the financial and technical capacity of the applicant, a detailed works and costs programme, a map defining the area which is being requested and providing geographical coordinates, the exact details relating to the identity of the applicant and evidence of the authority of the signatory of the application. Such titles are granted by ministerial order. Any refusal to grant such titles shall be notified by letter from the Minister of Mines to the applicant.
All mining titles mentioned above require an establishment convention (convention d’établissement) to be signed by the State and the titleholder defining their rights and obligations. A standard form of such establishment convention has been approved by decree of the Head of Government.
74
AngloGold Ashanti has interests in Morila, Sadiola and Yatela, all of which are governed by establishment conventions covering exploration, mining, treatment and marketing in a comprehensive document. These documents include general provisions regarding exploration (work programme, fiscal and customs framework) and exploitation (formation of a local limited liability mining company, State interest, fiscal and customs framework governing construction and exploitation phases, exchange controls, marketing of the product, accounting regime, training programmes for local labour, protection of the environment, reclamation, safety, hygiene and dispute settlement).
AngloGold Ashanti has complied with all applicable requirements and the relevant permits have been issued (subject to the developments regarding the permit for Yatela, below). Morila, Sadiola and Yatela have 30-year permits which expire in 2029, 2024 and 2030, respectively. Morila’s Exploitation Permit covers approximately 200 square kilometres and was issued on 4 August 1999. Sadiola’s prospecting and exploitation agreement covers approximately 303 square kilometres and was originally entered into on 5 April 1990.
Yatela has begun the implementation of a closure plan in order to relinquish the property. In parallel, discussions have been ongoing for the Government of Mali to take over the residual operations as well as the implementation of the closure plan. In the course of these discussions, an administrative error occurred, leading to the cancellation of Yatela’s permit through decree 2017/0613/PM-RM dated 28 July 2017, notified to Yatela on 5 October 2017. Attempts have been made to correct this error, notably through decree 2017-00951/PM-RM dated 28 November 2017 which purports to abrogate the 28 July 2017 cancellation decree. This measure is considered to be insufficient and other legal options are being explored in collaboration with the Malian authorities to cure this administrative error and to fully restore the permit for Yatela.
Tanzania
Mineral rights
Mineral rights in the United Republic of Tanzania are principally governed by the Mining Act of 2010 (Tanzania Mining Act), as amended in 2017, and the Mining Regulations, 2010 (Tanzania Mining Regulations), as amended in 2018, which include: Mining (Mineral Rights) Regulations 2018; Mining (Environmental Protection For Small Scale Mining) Regulations 2010; Mining (Mineral Beneficiation) Regulations 2018; Mining (Minerals and Mineral Concentrates Trading) Regulations 2018; Mining (Safety, Occupational Health and Environmental Protection) Regulations 2010; Mining (Radioactive Minerals) Regulations 2018, Mining (Local Content) Regulations, 2018, the Mining (Geological Survey) Regulations, 2018, and the Mining (Audit and Inspection of Records) Regulations, 2018.
The Tanzania Mining Act and the Tanzania Mining Regulations came into force in November 2010 followed by amendments to the Mining Act of July 2017 and subsequent amendments to the Tanzania Mining Regulations in January 2018. Ownership of and control over minerals on, in or under the land vest in the President of the United Republic of Tanzania. No person is allowed to prospect for minerals or carry on mining operations except pursuant to the authority of a mineral right licence granted, or deemed to have been granted, under the Tanzania Mining Act or its predecessor acts.
To enable a company to prospect or mine, the Ministry of Minerals (MEM) initially grants an exclusive prospecting licence. Upon presentation of a feasibility study, together with certain other environmental, social and financial assurances, the MEM may then grant a form of licence for mining. Licensing decisions take into account the abilities of the company (including its mining, financial and technical capabilities), projected rehabilitation programmes, environmental compliance and the payment of royalties.
The following licences can be applied for under the Tanzania Mining Act:
Licences for Exploration:
|
•
|
prospecting licence; and
|
|
•
|
gemstone prospecting licence.
|
Licences for Mining:
|
•
|
special mining licence (if the proposed capital investment is equal to at least US$100 million);
|
|
•
|
mining licence (if the proposed capital investment is equal to between $100,000 and $100 million); and
|
|
•
|
primary mining licence (reserved for Tanzanian citizens).
|
Licences for Ancillary Activities:
|
•
|
processing licence;
|
|
•
|
smelting licence; and
|
|
•
|
refining licence.
|
For purposes of AngloGold Ashanti’s Geita Gold Mine, only prospecting, retention and special mining licences are relevant.
75
A prospecting licence grants the holder the exclusive right to prospect in the area covered by the licence for all minerals within the class of minerals applied for. The classes that can be applied for include (amongst others):
|
•
|
metallic minerals;
|
|
•
|
energy minerals;
|
|
•
|
gemstones other than kimberlitic diamonds; and
|
|
•
|
kimberlitic diamonds.
|
An application for a prospecting licence is made to the Mining Commission and the licence is valid for a period of four years. After the initial term, the licence is renewable for a further period, but there is no option to renew after the first renewal. Upon each renewal, 50 percent of the area covered by the licence must be relinquished. A company applying for a prospecting licence must, amongst other things, state the financial and technical resources available to it.
Holders of prospecting or retention licences over a tenement will not automatically have first right to any mining licence granted over that tenement. However, in practice, they will be best positioned to meet the requirements to be granted a form of licence for mining.
Mining is mainly carried out through either a mining licence or a special mining licence, both of which confer on their holder the exclusive right to conduct mining operations in or on the area covered by the licence. A special mining licence is granted for the shorter of either the estimated life of the ore body indicated in the feasibility study report or such period as the applicant may request. It is renewable for a further period not exceeding the estimated life of the remaining ore body.
Except in the case of a special mining licence, a mineral right may be freely transferred by its holder (in whole or in part) to another person or entity without requiring consent from the MEM. However, the Mining Commission must be notified of any transfer of a prospecting licence and will refuse to register the transfer unless the transferee proves that it meets the financial and technical capability criteria required to apply for such licences. The grant and assignment of a special mining licence generally requires the approval of the Cabinet after the Mining Commission has forwarded the application to the Minister for further approval. There are limited exceptions to the requirement for the licensing authority’s consent (such as transfers to an affiliate company of the licence holder or to a financial institution or bank as security for any loan or guarantee in respect of mining operations).
Special mining licences have certain fiscal and other advantages over mining licences, as the holder of a special mining licence may enter into a mining development agreement with the Government of Tanzania (GoT) to guarantee the fiscal stability of a long-term mining project and make special provision for the payment of royalties, taxes, fees and other fiscal imposts and a special mining licence holder may, in certain circumstances, unilaterally amend the programme of the mining operations agreed with the MEM.
AngloGold Ashanti has concluded a development agreement with the Ministry and was issued a special mining licence covering approximately 196 square kilometres for a period of 25 years, which expires on 26 August 2024.
On 9 October 2014 an addendum to the development agreement was entered into ratifying the following changes:
|
•
|
An increase in the royalty rate from three percent to four percent with effect from 1 May 2012;
|
|
•
|
With effect from the financial year 2015, the capital allowance applicable to the unredeemed qualifying capital expenditure (15 percent per annum) referred to in section 18(a) of the Income Tax Act No 33 of 1973 shall no longer apply; and
|
|
•
|
With effect from 1 July 2014, Geita Gold Mining Limited is liable to pay the Geita District Council Levy at a rate of 0.3 percent on turnover (no longer capped at US$200,000 per annum).
|
The Fiscal Regime
The Finance Act, 2015 which was assented to on 28 June 2015 and came into force on 1 July 2015 contains a provision for a 30 percent capital gains tax on the sale of shares by an off-shore parent company. This provision was introduced by the Finance Act, 2012 and in this legislation, additional changes were also made to the procedure for payment of capital gains tax by the seller of shares. Tax at the rate of 30 percent is payable by way of an initial instalment of 20 percent on the transfer, based on the notional gain that the seller would make after a further instalment of the remaining 10 percent is due.
The Value Added Tax Act, 2014 (the VAT Act) which came into force on 1 July 2015 restricts VAT relief on purchases made by mining companies. The VAT Act is specific in that it provides that no purchase by companies is exempt or zero rated unless specified by the law. Previously mining companies were entitled to 100 percent VAT relief.
Local Government Levies
As mentioned above, following the signature of the addendum to the development agreement Geita Gold Mine is required to pay local government a service levy of 0.3 percent of its gross annual turnover in line with the Local Government Finance Act No.9 of 1982.
76
New labour law requirements
On 15 September 2015, the Non-Citizens (Employment Regulation) Act (the Non-Citizens Act), 2015 came into force. The Non-Citizens Act vests powers concerning work permit with the Labour Commissioner. Therefore non-citizens wishing to be employed in the country are required to apply and be granted a work permit before applying for a residence permit. Moreover, the Commissioner General of Immigration is required to take into consideration conditions of the work permit issued by the Labour Commissioner when granting a residence permit.
Previously, the issuance of a residence permit was inclusive of a work permit. The resident permit covered working and living in Tanzania.
Further, the Non-Citizens Act introduced the Short-Term Permit (STP). The STP is granted to non-citizens who wish to work in the country for a period of not more than six months; foreigners intending to work in Tanzania for more than 3 months are required to apply for an STP. The application for STP is made to the Ministry of Labour and Employment.
Transparency and Accountability requirements
In 2015, the Tanzania Extractive Industries (Transparency and Accountability) Act, 2015 (the TEI Act) came into force.
The TEI Act establishes the Tanzania Extractive Industries (Transparency and Accountability) Committee (the Committee), which is an independent Government entity which is an oversight body for promoting and enhancing transparency and accountability in the extractive industry.
The Committee has powers under the TEI Act to impose obligations on specified extractive industries and statutory recipients to receive information on reconciliation on payments made and revenues received by the GoT. In addition, an extractive industry is required under the TEI Act to submit to the Committee annual reports containing information on local content and corporate social responsibility.
Amendment of the Tanzania Mining Act and the Mining Regulations
The Tanzania Mining Act (Mining Act) was amended in July 2017 followed by an amendment of the Mining Regulations in 2018, together with an Executive Order introducing the following:
|
•
|
Dissolution of the Tanzania Minerals Audit Agency (TMAA). All of TMAA’s functions and powers are now transferred to the Geological Survey of Tanzania (GST).
|
|
•
|
Dissolution of the Mining Advisory Board and introduction of the Mining Commissions. The functions and powers of the Mining Advisory Board have been taken over by the Mining Commissions including the functions of the Commissioner for Minerals. However, the Mining Commissions have been made responsible for matters related to auditing and monitoring of mineral production in Tanzania. The Mining Commissions have powers to audit quality and quantity of mineral produced and exported by mining entities, financial records of mining entities for the purposes of tax assessments, and environmental management expenditures of the mining entities for the purpose of assessment of compliance to the mine closure plan. Mineral rights holders were required to submit all geological information in their possession to the GST.
|
|
•
|
A local content requirement for procurement of goods and services: the Mining Act requires that mining companies must give: (i) first consideration to good and services provided or manufactured in Tanzania where they meet mining industry specifications (established by the Standards Authority / internationally acceptable standards), (ii) first consideration for employment to qualified Tanzanians and (iii) adequate provision for on-the-job training of Tanzanians. Specific minimum local content thresholds are specified in Schedule 1 to the Mining Regulations. These will be determined by the Commission alongside the work programme. The Minister may prescribe additional minimum local content thresholds.
|
|
•
|
Mining Licence: To qualify for holding a Mining Licence in Tanzania, five percent of a licensee’s equity must be held by Tanzanians, with 80 percent of its managerial positions held by Tanzanians and 100 percent of other positions held by Tanzanians), in addition to the shareholding of the GoT pursuant to Section 10 of the Mining Act (i.e. free carried interest). This amount is determined, and may be varied, by the Minister.
|
|
•
|
Establishment of the Local Content Committee (LC Committee) which will oversee the implementation of the Mining Regulations and which comprised of a member of the Commission, the Director of Labour and Employment, a member of the Tanzania Private Sector Foundation, the CEO of the Geological Survey of Tanzania, the head of legal services at the Ministry for Minerals and the Executive Secretary of the Commission. The LC Committee sets minimum standards for local content plans and reports to the Commission.
|
|
•
|
Cancellation of retention licences; right over these revert to the GoT.
|
The Mining (Minimum Shareholding and Public Offering) Regulations, 2016 came into force by Government Notice No. 286 published on 7 October 2016 and revised by amendment on 24 February 2017. On 10 January 2018, the GoT published its new Mining Regulations, 2018, which contain, amongst others, the implementation provisions of the amended Mining Act.
77
The regulations set out the requirement to sell shares to Tanzanian nationals, by way of a public offering and listing on the Dar es Salaam Stock Exchange, which will apply to companies that are carrying out large scale mining operations. The regulations also require all existing holders of a special mining licence to list a minimum of 30 percent of their shares on either the Main Investment Market or the Enterprise Growth Market Segment of the Dar es Salaam Stock Exchange within six months of the regulations coming into force, which was on 24 February 2017. However, we believe the listing requirement conflicts with the development agreement.
Along with other major mining companies, AngloGold Ashanti’s subsidiaries are seeking a constructive dialogue with the GoT to gain assurances that the Geita Gold Mine will not be affected by these legal and fiscal changes, given the Mine Development Agreements which guarantee fiscal and regulatory stability as well as agreement between all parties before material legal and regulatory changes are made. As a precautionary step to safeguard its interests, AngloGold Ashanti has commenced international arbitration proceedings against the GoT in connection with the enactment of this legislation, as first announced in July 2017.
The arbitration action against the GoT seeks declaratory relief in accordance with the terms of the Mine Development Agreements to preserve the companies’ and their shareholders’ rights and interests in the Geita Gold Mine, including confirmation from the GoT that the companies are exempt from the listing requirement. The arbitration proceedings also seek to confirm that AngloGold Ashanti does not, as a result of its existing mining agreements, fall within the scope of the new mining legislation, under which the GoT has the right to renegotiate existing mining agreements at its discretion, the right to receive free-carried interest of no less than 16 percent in all mining projects, the right to acquire up to 50 percent of any mining asset commensurate with the value of tax benefits provided by the owner of the asset and which includes an increase in the rate of revenue royalties from four to six percent. AngloGold Ashanti can provide no assurance that the new mining legislation, including the listing requirement, will not apply to its operations in Tanzania and the outcome of the arbitration action may have a material adverse impact on the company’s results of operations and financial condition.
Environmental Impact Assessment Regulations
The Environmental Management (Fees and Charges) (Amendment) Regulations, 2016 (the Regulations) which came into effect on 2 May 2016 introduced new fees in relation to the review of the Environmental Impact Assessment on projects by the National Environmental Management Council (NEMC). According to the Regulations, the fees involved are ‘
0.1% of the total project costs
’. However, the Regulations have not defined the phrase ‘project cost’ nor have they provided a detailed breakdown on the determination of the project cost.
Natural Resources Legislation in Tanzania
The government of Tanzania enacted two Natural Resources laws that came into force in July 2017. The two laws are The Natural Wealth and Resources Contracts (Review and Re-negotiation of Unconscionable Terms) Act, 2017 and The Natural Wealth and Resources (Permanent Sovereignty) Act, 2017 (together, the Natural Resources laws).
The Natural Resources laws require that all arrangements or agreements that relate to “natural wealth and resources” are subject to review by the National Assembly. In the review, all unconscionable terms as interpreted in accordance with the law are expunged from the agreement. The laws also require that new natural resources agreements to be reviewed by the Government.
In addition, under the laws, disputes over natural wealth and resources will not be subject to any proceedings in any foreign court or tribunal. Accordingly, companies are now required to adopt Tanzanian law and local dispute resolution in all mining agreements. Every undertaking must demonstrate “guaranteed returns into the economy” from all earnings accrued or derived from such extraction, exploitation or acquisition and use. In addition, to ensure that the Government and the people of Tanzania obtain equitable stake in the exploitation of mining resources, all project earnings must be retained in Tanzanian banks.
AUSTRALASIA
Australia
In Australia, with a few exceptions, all onshore minerals are owned by the Crown. The respective Minister for each state and territory is responsible for administering the relevant mining legislation enacted by the states and territories.
Native Title legislation applies to certain mining tenements within Australia. Australia recognises and protects a form of Native Title that reflects the entitlement of Aboriginal people to their traditional lands in accordance with their traditional custom and laws. Should Native Title claims or determinations exist, certain Native Title processes and procedures will apply under the Native Title Act 1993 (Cth) before the tenure is granted. Tenure may be granted subject to conditions relating to Native Title rights. In the mining context, Native Title matters are managed as part of the tenement grant process. If disputes arise in relation to the grant of a particular tenement, they can be referred to the National Native Title Tribunal, established under the Native Title Act, for resolution. Native title legislation also provides a framework for compensation to be paid for acts that affect native title rights and interests. Ordinarily, the relevant Commonwealth or State government is liable to pay compensation for acts attributable to it. However, under the Mining Act 1978 (WA) liability for compensation associated with native title can be passed back to the holder of a mining tenement at the time of a determination of native title compensation.
78
State and territory Aboriginal and non-Aboriginal heritage laws operate in parallel to the Native Title legislation. They exist predominantly for the purposes of managing the impact of developments on sites, objects and areas of heritage significance. Where an area of heritage significance is placed on the national or world heritage registers, federal approval processes may also apply. To date, there has not been any significant impact on any of AngloGold Ashanti’s tenure due to Native Title or heritage legislation.
AngloGold Ashanti’s operating properties are located in the state of Western Australia where tenure is issued under, and mining operations are governed by, the Mining Act 1978 (WA). The most common forms of tenure in Western Australia are exploration and prospecting licences, mining leases, miscellaneous licences and general purpose leases. In most Australian states, if the holder of an exploration licence establishes indications of an economic mineral deposit in the area covered by the exploration licence and complies with the conditions of the grant, the holder of the exploration licence has a priority right against all others to be granted a mining lease which gives the holder exclusive mining rights with respect to minerals on the property. In Western Australia, a general purpose lease may also be granted for one or more of a number of permitted purposes. These purposes include erecting, placing and operating machinery and plants in connection with mining operations, depositing or treating minerals or tailings and using the land for any other specified purpose directly connected with mining operations.
Mining tenements will be granted with endorsements and conditions relating to protection of the environment. Exploration and mining operations may also require separate approval from the state, territory or federal environment minister, which may require completion of an environmental impact assessment pursuant to applicable protection legislation prior to commencement. Further, an operating licence under the relevant environmental protection legislation in the state or territory may also be required for certain mine processing or mining-related operations. Depending on the jurisdiction, a further separate approval may be required for the removal of native vegetation within the tenement.
It is possible for an individual or entity to own an area of land for infrastructure purposes and for another individual or entity to be granted the right to explore for or mine any minerals located on or under the surface of the same area. The maximum initial term of a mining lease in Western Australia is 21 years and the holder has the right to renew the lease for an additional 21 years. Subsequent renewals are granted at the discretion of the respective state or territory’s minister responsible for mining rights. In Western Australia, mining leases can only be assigned with the prior written consent of the minister.
Government royalties are payable by the holder of mining tenure in respect of minerals obtained from the relevant area of land at the rates specified in the relevant legislation in each state or territory. The royalty on gold production in Western Australia is payable quarterly at a fixed rate of 2.5 percent of the royalty value of gold metal produced. The royalty value is calculated by multiplying the amount of gold produced during a given month by the average gold spot price for that month. In addition, the holder of a mining tenement is required to pay annual rent in respect of the tenement. In Western Australia there is a minimum annual expenditure requirement for prospecting and exploration licences and mining leases. Exemptions from the expenditure requirement can be obtained if certain conditions are satisfied.
AngloGold Ashanti has been granted 21-year term mining leases with rights of renewal to all of its mining areas in Australia, including its proportionate share of joint venture operations and accordingly it has, together with its joint venture partners where applicable, the exclusive right to mine in those areas. Both the group and its joint venture partners are fully authorised to conduct operations in accordance with relevant laws and regulations. The mining leases and rights of renewal cover the current life-of-mine at AngloGold Ashanti’s operations in Australia. At Sunrise Dam the deposit is now situated upon two mining leases covering approximately 7,808 hectares and another mining lease of 1,768 hectares contains related infrastructure. Both leases are currently in good standing, with expiry dates in 2038. At Tropicana, the deposit is situated upon a single mining lease covering approximately 27,228 hectares, which is currently in good standing, with an expiry date in 2036.
AMERICAS
Argentina
Land ownership & mining rights
The Argentinean Mining Code governs mining activity in the country. Special regimes exist for hydrocarbons and nuclear minerals. In the case of most minerals, the Argentinean Mining Code establishes that the owner of the land is not the owner of the mineral rights; these are held by the national or provincial governments (depending on the location of the minerals). The national or provincial government, as applicable, is required by the Argentinean Mining Code to grant whomever discovers a new mine title to the mining concession.
The Argentinean Mining Code regulates exploration permits and mining concessions. Exploration permits grant their holders exclusivity rights to any mineral discoveries, including those made by a third party within the exploration area covered by the permit. Exploration permits are limited in time and as to the extent of the exploration area, are subject to the payment of a single-time fee, and also require a minimum exploration work programme and schedule to keep the permit in force.
79
The Argentinean Mining Code also regulates mining concessions, or exploitation rights. Priority for receiving a mining concession is given to the registered discoverer of the mine, which holds the exploration permit. Once the application for a mine has been submitted, the applicant may commence works and must submit a legal survey of the units requested for the new mine. The application and the legal survey may be opposed by third parties following specific proceedings set forth in the Argentinean Mining Code. Approval and registration of the legal survey by the Provincial mining authority constitutes formal title to the mining concession.
Any mining company wishing to commence or modify any mining-related activity, as defined by the Argentinean Mining Code, including prospecting, exploration, exploitation, development, preparation, extraction, and storage of mineral substances, as well as property abandonment or mine closure activity, is required to prepare and submit to the competent Provincial environmental authority an Environmental Impact Assessment (EIA) prior to commencing the work. Each EIA is required to describe the nature of the proposed work, its potential risk to the environment, and the measures that will be taken to mitigate that risk. If accepted by the competent authority, the EIA is used as the basis to create a Declaration of Environmental Impact (DEI) to which the mining company is required to adhere during the mining-related activity at issue. The DEI is required to be updated at least on a biannual basis. Sanctions and penalties for non-compliance with the DEI are outlined in the Environmental Protection section of the Argentinean Mining Code, and may include warnings, fines, suspension of quality certifications, restoration of the environment, temporary or permanent closure of activities, and withdrawal of authorisation to conduct mining-related activities.
Holders of mining concessions must comply with three main conditions: payment of an annual fee, investment of a minimum amount of capital, and the carrying out of a reasonable level of exploitation. Failure to do so could lead to forfeiture of the mining concession, which would then revert back to the Province.
In the case of Cerro Vanguardia, AngloGold Ashanti’s operation in Argentina, the mining concession holder is AngloGold Ashanti’s partner, FomentoMinero de Santa Cruz S.A. (Fomicruz). On 27 December 1996, Fomicruz entered into a usufruct agreement whereby Cerro Vanguardia S.A. was granted an irrevocable right to exploit the Cerro Vanguardia deposit (encompassing an area of approximately 543 square kilometres) for a 40-year period, which expires on 26 December 2036. Cerro Vanguardia S.A. is an Argentinean company controlled by AngloGold Ashanti, with Fomicruz as minority shareholder.
In addition to the Argentinean Mining Code, between 1993 and 1995, Argentina implemented several federal laws to offer foreign companies attractive incentives for exploration and mining in Argentina, the Mining Investment Law (Law No. 24, 196, as amended, and related legal provisions) being the most important one. Such incentives include, amongst others, import duty exemptions, accelerated depreciation of fixed assets, a 3 percent cap on Provincial royalties set at pit-head value on the mineral extracted, value added tax refunds for exploration-related expenses incurred by companies registered under the Mining Investment Law, and, subject to the filing of a feasibility study for the relevant mining project, a 30-year stability as to the tax burden on the project and the customs and foreign exchange regimes and duties. Cerro Vanguardia S.A. obtained its tax, customs and foreign exchange stability certificate in 1996.
Past and potential regulatory changes
On 30 September 2010, the National Law on Minimum Requirements for the Protection of Glaciers was enacted in Argentina, banning new mining exploration and exploitation activities on glaciers and “peri-glacial” areas. The law also subjects on-going mining activities in those areas to an environmental audit. If such audit results in material impacts on glaciers and “peri-glacial” areas, the relevant authority is empowered to take action, including suspension or relocation of the activity. The law establishes a broad definition of “peri-glacial” areas that, together with glacial areas, must yet be surveyed by an existing national Government Agency specifically appointed to this end. The constitutionality of the law has been challenged by some mining companies along with the Province of San Juan (which hosts large mining projects). Injunctions granted by lower courts which had suspended the application of the law in that Province were lifted by the National Supreme Court of Justice of Argentina. Although the injunctions have been lifted, the language that the Court used in the decision implies that until an inventory of glaciers is completed as mandated by the Law, the case is moot. Therefore, the case has no practical implications for the operations of Cerro Vanguardia at this time.
On 26 October 2011, Decree 1722/2011 (Repatriation Decree) was issued, which imposes on oil, gas and mining companies operating in Argentina the obligation to repatriate all the proceeds of their exports from Argentina and to exchange such proceeds for Argentinean legal currency in the domestic banking system. All exporters, other than oil, gas and mining companies, have been operating under such regime since late 2001. Mining companies, on the other hand, were entitled to two exceptions: (i) a decree of 2003 applicable to mining companies with tax, customs and foreign exchange stability certificates obtained prior to the date on which such a decree was enacted (which is the case of Cerro Vanguardia); and (ii) a decree of 2004 applicable to mining companies with tax, customs and foreign exchange stability certificates obtained after the date on which such decree was enacted. Both exceptions have not been formally superseded by the Repatriation Decree, but appear to conflict with it, and such conflict may result, in some cases, in a violation of mining companies’ rights under the Mining Investment Law.
On 27 December 2011, the Argentinean National Congress passed Law 26,737 which implemented a set of rules restricting the ownership of rural land by foreigners (including foreign individuals or any kind of legal entity controlled by foreign individuals or legal entities). The main restrictions are as follows: (i) foreigners cannot own in the aggregate more than 15 percent of the entire rural land of Argentina, the same cap being applicable to each province and municipality; (ii) foreigners will not be allowed to purchase more than 1,000 hectares in the so-called “zona núcleo”, which comprises the main agricultural areas of central Argentina or an “equivalent” surface depending on the location of the land and its productive potential; and (iii) foreigners will not be allowed to buy
80
land that contains, or is adjacent to, relevant and permanent water bodies (such as rivers and lakes). Although exploration permits and mining concessions are not the subject matter of the restrictions placed by this law, certain rights granted to foreign mining companies under the Argentinean Mining Code may be restricted by this new law. For example, the right that holders of mining concessions currently have to force the surface owner to sell the land to the holder of the mining concession might be restricted if the concession holder is a foreign individual or a legal entity controlled by foreigners.
Ten provinces in whose territories the main mining projects of Argentina are located, signed a document with the Federal Government entitled Federal Mining Agreement (FMA). The purpose of the FMA is, amongst other things, to increase provincial revenues from the mining industry by creating legal entities owned by provincial governments that would work in association with private mining companies. This scheme is not new in Argentina and it has been used by some provincial governments, amongst them the Santa Cruz Province (through Fomicruz), in which the Cerro Vanguardia project is located. The FMA also contemplates other forms of revenues such as the formation of special trusts to be funded by mining companies in order to finance education, health and other programmes. Increase in royalty rates is not specifically contemplated in the FMA. The Provinces that signed the FMA had previously formed a special association of provinces, supported by the National Government. As the FMA has not yet been converted into law by the National Congress, its provisions are neither binding nor enforceable.
In Argentina, the current regulatory regime of royalty payments is expected to change and several different options and payment thresholds have been discussed. In December 2012, the Santa Cruz Province changed the mining royalty from one percent to three percent calculated at pit-head value of the mineral extracted thus bringing it to the cap of the Mining Investment Law.
Brazil
Land ownership and mining rights
General legal aspects
The Brazilian Constitution of 1934 states that, for purposes of exploration and exploitation, deposits and other Mineral Resources constitute property separate from the soil and belong to the Federal Union. Exploration and exploitation of such Mineral Resources may take place only with the Federal Union’s concession and in such a way as to protect the national interest. Federal law sets out penal and administrative sanctions for conduct and activities deemed harmful to the environment.
In Brazil, the National Mining Agency (ANM) is the state body within the Mines and Energy Ministry (MME) that is responsible for: (i) the registration of mining titles, (ii) the grant of authorisations and concessions, (iii) the supervision of mining activities and mining titleholders, and (iv) the issuance of supplementary rules in relation to mining activity.
Under the current Mining Code, there are two kinds of mines: (i) claimstake mines (Minas Manifestadas), for which rights were acquired before 1934 and exist independently of any mining licence or authorisation from the Federal Government and for which the Mineral Resources constitute property of the landowner and (ii) granted mines, which are those that rely on grants from the Federal Government for mineral exploration or exploitation (pursuant to the Constitution of 1988). AngloGold Ashanti’s operations in Brazil consist of both claimstake mines and granted mines.
At AGA Mineraçao, Cuiabá has a single concession covering a total area of 3,662 hectares, Lamego is covered by three geographically contiguous concessions totally 1,622 hectares and Córrego do Sítío is hosted by five geographically contiguous concessions covering a total area of 6,017 hectares. All of these are in good standing. At Serra Grande, the company has interests in or agreements over 61,500 hectares in Crixas Greentone belt, representing approximately 87 percent of the relevant tenements that correspond to all current exploration and mining activities. These have been held since 1987. Brazilian mining concessions remain valid up to the depletion of the Ore Reserve and Mineral Resource.
Mining activities in granted mines must be performed in two defined stages: (i) exploration, which entails defining and evaluating the deposit and determining the feasibility of exploitation, and (ii) exploitation, which involves coordinating operations aimed at the industrial exploitation of the mineral deposit, from the extraction of useful minerals to their processing. Exploration authorisations issued by ANM are valid for one to three years. Extensions can be obtained if necessary, as long as it is justified. In contrast, exploitation rights, once granted, are valid for the lifetime of the deposit, provided the mining titleholder complies with all legal requirements. Pursuant to these requirements, for example, titleholders must (i) start work on mineral exploitation within six months from the date of publication of the Exploitation Concession, (ii) continue their mining activities until the mineral deposit has been exhausted, in accordance with the Economic Exploitation Plan (Plano de Aproveitamento Econômico) approved by ANM and (iii) refrain from suspending mining activities without prior notice to ANM.
During the exploration period, the mining titleholder has to pay an Annual Rate per Hectare (TAH - Taxa Annual por Hectare), subject to a maximum value set by law. In the exploitation period, regardless of the legal regime governing the project (whether claimstake or granted mines), the mining titleholder has to pay the Financial Compensation for Exploiting Mineral Resources (CFEM - Compensação Financeirapela Exploração Mineral). The CFEM which is one and one-half percent for gold is currently calculated based on revenues.
81
At the end of 2011 and the beginning of 2012 the states of Minas Gerais, Pará, Amapá and Mato Grosso do Sul each created a new tax (duty) on research, extraction and exploration activities as well as on the use of Mineral Resource carried out in those states. This tax could range from BRL3.00 to BRL6.50 per ton. In the states of Minas Gerais and Goias, however, gold ore was exempted from the collection of this new duty.
Potential regulatory changes
Changes to the mining legislation were submitted in 2013 and 2017 to the National Congress for discussion and consideration. Its goals would be to (i) strengthen the role of the Federal Government in regulating the mining industry, (ii) attract more and better investments to the mineral sector, (iii) encourage maximal use of Ore Reserve, and (iv) encourage members of the industry to add value to mineral products.
The government’s proposals have institutional, legal and financial facets. Institutionally, the proposals would create a National Council of Mineral Policy to advise the Presidency of Brazil and the MME on, and develop guidelines and directives for, the mining sector.
Legally, the proposals would change the rules applied to mining titles access. While exploration authorisations would be effective for a longer period of four years, they would be renewable only once, as long as the company is able to justify the renewal to the authorities, who would make a discretionary decision as to whether to approve the request. Companies would also have to demonstrate that they are investing in exploration activities on a yearly basis. On the hypothesis that the access to the area is prevented by either landowners or the ability to obtain an environmental license through no fault of the company, the authority would extend the deadline as many times as necessary.
Exploitation rights would be limited to 35- or 40-year grants renewable at the discretion of authorities. The granting of rights would become a more discretionary process and would result in a Formal Adhesion Contract for Exploitation rather than in an open-ended concession.
In light of the November 2015 tailings dam collapse in Minas Gerais, there has been discussion of including tougher requirements related to tailings dams (e.g., mandatory insurance in case of environmental catastrophe).
As of the end of 2017, most of the changes in the legislation initially suggested were not approved, however, this legislation may be reintroduced in the same or similar form in the future.
Colombia
Land ownership and mining rights
The Colombian Constitution declares that the sub-soil and the non-renewable natural resources located within the Colombian territory are the property of the Colombian State. The underlying principle of Colombian mining legislation for the granting of mining concession contracts is first come, first served. Mining activities are regulated by the Mining Code, Act 685, 2001.
The filing of an exploration and exploitation proposal triggers a right of preference to obtain rights over the targeted area, provided it is available. Such area cannot exceed 10,000 hectares. Upon receipt of a proposal, the relevant government agency determines whether another proposal or contract already governs the area. If there are no pre-existing claims, the government agency grants the applicant a “free area”.
The concession contract
The government agency grants exclusive concession contracts for exploration and exploitation. Such concessions allow concessionaires to conduct the studies, works and facilities necessary to establish the existence of minerals and to organise their exploitation. Upon being awarded a mining concession, a company must take out an insurance policy to cover the costs associated with potential environmental damage as well as breaches of its mining obligations. It may then proceed with exploration activities. Once the exploration phase is complete, the concessionaire files a new plan regarding proposed works and facilities. With the award of the mining concession or tenement contract, there are specified timelines for the completion of the various phases of a mining project, e.g. exploration, construction, exploitation. The company must comply with these timelines unless performance is suspended, for example, due to force majeure or extensions/modifications to the timelines. Force majeure was declared at the La Colosa project, stopping all activities, following the outcome of the plebiscite held on 26 March 2017 in the Colombian municipality of Cajamarca, which hosts the La Colosa exploration site. The grant of force majeure is for one year and will expire in June 2018, after which such declaration will need to be extended.
If the company does not comply with the specified timelines for the completion of the various phases of a mining project, the mining authority may revoke the company's concession contracts or mining licenses. AngloGold Ashanti Colombia S.A. (AGAC) applied for consolidation of its concession contracts related to La Colosa, in respect of which AGAC was not in compliance with some of the specified timelines. The application for consolidation was approved in March 2017, which remedied the non-compliance of each consolidated concession and reset the specified timelines. La Colosa has a single concession which covers a total area of 9,210 hectares and expires on 28 February 2037.
82
In order to obtain an authorization from the National Environmental Licensing Authority of Colombia to carry out the Project, the Company must prepare an Environmental Impact Study for approval by this authority.
Environmental licenses are granted for the entire life of the project and cover all phases: construction, assembly, operation, maintenance, dismantling, final restoration, abandonment and / or termination.
The initial term of concessions is 30 years. To receive an extension, a concessionaire must file a request two years before the termination of the initial term, and must substantiate the application with economic, environmental and technical information. Because the extension is not automatic, the concessionaire must renegotiate the conditions of the contract. Any company holding a concession that wishes to obtain a renewal of the contract must be up to date in all its legal and contractual obligations and must present a new plan of works and facilities to be implemented after the contract is renewed. The term of a concession and all the contractual obligations that arise from it are deemed to take effect as of the date of registration of the contract at the National Mining Register.
AngloGold Ashanti’s core mining concession contracts provide that the mining authority has the discretion to declare the underlying concession void if AngloGold Ashanti Colombia S.A. (AGAC) breaches applicable environmental laws or regulations. If the mining authority were to exercise such discretion against AGAC, AGAC would be required to abandon its projects and all of its other existing mining concession contracts. Pending proposals for new mining concession contracts would also be cancelled and AGAC would be banned from doing business with the Colombian government for a period of five years. As a result, AGAC would be unable to conduct any mining exploration or development activities during such period. However, this would not affect other AngloGold Ashanti subsidiaries operating in Colombia, which hold singularly or in concert with joint venture partners the majority of the company’s concession contracts in Colombia.
There are some areas where mining activity is prohibited. These areas are:
|
•
|
National parks;
|
|
•
|
Regional parks;
|
|
•
|
Protected forest reserves;
|
|
•
|
Paramos (included in Act 1382, introduced in 2010); and
|
|
•
|
Wetlands, pursuant to the Ramsar Convention.
|
Some forest reserves are not “protected”, but are set aside for active forestry purposes. Such forest reserves must be “extracted” after initial prospection, meaning that the concessionaire must obtain a specific permit to partially and temporarily change the use of the soil before pursuing exploration activities. In addition, Resolution 187/2016, passed by the federal government in late 2016, identifies areas that the Ministry of the Environment has determined to be “paramos” areas, or paramos transition areas. In these areas there are limitations on industrial or commercial work being performed, including mining. The regulation also specifies a process to determine what work, if any, can be performed in a paramos-designated area. Certain areas designated as “paramos” are within the mining footprint currently envisioned for La Colosa. AGAC is evaluating the impact of the Resolution 187/2016, if any, to the current plan for La Colosa. Further, the company is working with the federal government to determine if the designations contained in Resolution 187/2016 are technically accurately and legally defensible, and what the process will be to determine what work, if any, can be performed in certain paramos areas.
Cannon fees and royalties
Cannon fees are due from the moment the moment the concession contract is registered with the Mining Register. Such fees change based on the number hectares held by the concessionaire, as follows:
|
•
|
0-2,000 hectares, one legal daily minimum wage (approximately $9.00) per hectare per year
|
|
•
|
2,001-5,000 hectares, two legal daily minimum wages (approximately $18.00) per hectare per year
|
|
•
|
5,001-10,000 hectares, three legal daily minimum wages (approximately $27.00) per hectare per year
|
Once exploration is complete and the mining infrastructure is in place, the concessionaire must begin paying royalties. Royalties paid to the Colombian government consist of a percentage of the primary product and sub-products being exploited. For gold, gross monthly income is multiplied by 0.8, to which a four percent royalty is applied.
PINES programme
In 2013 the Federal government instituted the PINES programme that will aid in promoting certain projects that are deemed to have a national interest. This designation provides for greater oversight from the national government. La Colosa, Gramalote and Nuevo Chaquiro projects are designated as PINES projects. All of our three advanced exploration projects are considered of national strategic interest.
83
United States of America
Nevada
Mineral and surface rights in the United States are owned by private parties, state governments, or the federal government. The majority of land utilised for precious metals exploration, development and mining in the western United States is owned by the federal government, and often the state government will have an ownership interest in minerals, regardless of whether the state is the surface owner. The right to mine on such federal land in western states is governed by the General Mining Law of 1872, as amended (General Mining Law). The General Mining Law allows mining claims on certain federal lands upon the discovery of a valuable mineral deposit and proper compliance with claim location and maintenance requirements.
In Nevada, AGA (U.S.A) Exploration, Inc. is advancing a joint venture property on federal lands through an Earn-in Option Agreement for 277 mining claims, covering an area of approximately 5,700 acres. On these lands, AngloGold Ashanti (U.S.A.) Exploration, Inc. is currently engaged in early-stage exploration activities that include, but are not limited to, geological and spectral mapping, surface geochemical sampling, and RC and/or diamond drilling.
Mineral exploration activities in Nevada are also generally subject to applicable federal, state, and local permitting requirements, but the specific regulatory authorizations required for the company’s activities are based on the nature and location of the exploratory work. AngloGold Ashanti (U.S.A.) Exploration, Inc.’s Nevada operations are currently conducted under what is generally referred to under federal law as a notice-level operation subject to 43 Code of Federal Regulations Section 3809.21. The federal Bureau of Land Management (BLM) issued a Notice of Decision approving these exploration operations on 1 November 2017. The BLM determined that the operations would not cause unnecessary or undue degradation as defined under 43 Code of Federal Regulations Section 3809.5. An amendment to the project was approved by a BLM Notice of Decision dated 31 January 2018. The Notice of Decision requires reclamation of the drill pads and roads, including the reseeding of disturbed lands. The Notice of Decision also set the financial guarantee amount for reclamation. The Notice of Decision includes a two-year term from the date of 1 November 2017.
Nevada’s Bureau of Mining Regulation and Reclamation (BMRR) also regulates mining within the state. Exploration projects of five acres or less, the scope of a notice-level operation under federal law, are exempt from BMRR regulation. AngloGold Ashanti’s current exploration program falls within this exemption.
Minnesota
In Minnesota, AngloGold Ashanti Minnesota, Inc. is undertaking early-stage reconnaissance exploration activities to determine the potential for gold mineralization in the northern counties of Minnesota. Minnesota uses a leasing system for state-owned minerals. Under this system, qualified applicants can obtain a nonferrous metallic mineral lease for a 50-year term that grants the company the right to explore, mine, and develop minerals, subject to applicable environmental review and permitting requirements. AngloGold Ashanti Minnesota, Inc. holds a total of 271 state mineral leases administered by the Minnesota Department of Natural Resources. These state mineral leases encompass an area of approximately 106,000 acres. The company’s exploration activities on these lands include regional geophysical surveying, surface geological mapping, rock chip and glacial till sampling, and roto-sonic drilling.
Mineral exploration activities in Minnesota are generally subject to applicable federal, state, and local permitting requirements, but the specific regulatory authorizations required for a company’s activities are based on the nature of the exploratory work. Before conducting mineral exploration activities on state lands, a company must hold a state mineral lease and obtain approval from the Minnesota Department of Natural Resources of an exploration plan of operations. AngloGold Ashanti Minnesota, Inc. currently holds state mineral leases for the state lands on which it is conducting its operations and has obtained agency approval for its current exploration program. In addition, AngloGold Ashanti Minnesota, Inc. must maintain its registration as an exploratory borer and provide the requisite advance notice of any drilling activities to the Minnesota Department of Health. For its currently approved exploration program, AngloGold Ashanti Minnesota, Inc. has no present obligation to complete environmental review, obtain environmental permits, or submit any financial assurance or bonds. The company must comply with the terms of its leases and the conditions of its approved exploration plan of operations, including reclamation of its drill sites. Any potential future exploration programs may, depending on their scope, be subject to additional environmental review and permitting requirements, but these requirements are generally less extensive than those required for mineral development. In the event the company decides to proceed with mineral development within the state of Minnesota, it will need to complete an Environmental Impact Statement and obtain a variety of federal, state, and local permits, including a Minnesota permit to mine and environmental permits relating to water quality, air quality, wetlands, and other permits typically associated with mining projects.
Potential regulatory changes
Over the years, the U.S. Congress has considered a number of proposed amendments to the General Mining Law and other federal statutes. Among the significant features contained in previously proposed legislation were a production royalty obligation, new and more stringent environmental standards and conditions, additional reclamation requirements, extensive new procedural steps which would likely result in extended permitting timelines, and granting counties the ability to petition the Secretary of the Interior to make certain areas unavailable for the location of unpatented mining claims. The U.S. Environmental Protection Agency has also proposed potential revisions to financial assurance requirements relating to mineral development activities.
84
In Minnesota, the state legislature and various state agencies have also considered potential changes in statutes and regulations governing mineral exploration and development activities. These potential changes include revisions to relating to species, cultural resources, and water quality protection.
AGA is currently unaware of any new Federal or state legislative or regulatory changes or rule-making that has been proposed or enacted that would adversely affect its current exploration programs. If any of the above-referenced provisions were adopted in the future, the company’s operations in Nevada and Minnesota could be adversely affected.
MINE SITE REHABILITATION AND CLOSURE
Closure, an integral part of operations
All mining operations eventually cease. An integral aspect of operating AngloGold Ashanti’s mines is ongoing planning for and, where feasible, implementation of concurrent rehabilitation, together with an estimate of associated liability costs and the placement of adequate financial provisions and assurances to cover these costs.
AngloGold Ashanti revised its group closure planning management standard in 2013 and all of its operations are required to comply with the standard, as well as applicable law and regulations as their closure plans are reviewed and updated.
Closure planning is an activity that starts at the exploration and mine design stage and continues throughout the life of mine:
|
•
|
New projects include a closure plan which takes into account future closure and associated rehabilitation and other costs.
|
|
•
|
The closure plan is reviewed annually and updated every three years (annually in the final three years of a mine’s life) or whenever significant changes are made, taking into account operational conditions, planning and regulatory requirements, international protocols, technological developments and advances in practice.
|
For many of the older mines, closure planning and the evaluation of environmental liabilities is a complex process. This is particularly so in Brazil, Ghana and South Africa, where many of the mining and other operations have taken place for more than fifty years. A particular challenge is concurrent rehabilitation, which is carried out while a mine is still operational. This practice serves to decrease the ultimate liability and reduces the final rehabilitation and closure work that must be undertaken, but has the potential to sterilise Ore Reserve, which the company might wish to exploit should conditions, such as the gold price, change.
The company’s closure standard stipulates that closure planning must be undertaken in consultation with the community. In the course of these consultations, different issues are raised which require site-specific solutions. Livelihood preservation and infrastructure are often key requirements. Communities also require information on the company’s rehabilitation of the landscape and on any lasting environmental impacts. Long-term remediation obligations, including decommissioning and restoration liabilities relating to past operations, are based on environmental management plans and compliance with current environmental and regulatory requirements.
Provisions for decommissioning and rehabilitation costs are made when there is a present obligation, it is probable that expenditure on decommissioning and rehabilitation work will be required and the cost can be estimated within a reasonable range of possible outcomes. These costs are based on currently available facts, technology expected to be available at the time of the clean-up, laws and regulations presently or virtually certain to be enacted and previous experience in the rehabilitation of mine sites.
Decommissioning costs and restoration costs are provided at the present value of the expenditures expected to settle the obligation, using estimated cash flows based on current prices. Estimates are discounted at a pre-tax rate that reflects current market assessments of the time value of money.
Provisions for decommissioning and for restoration (excluding joint ventures) increased from $705 million in 2016 to $724 million in 2017. This change mainly relates to changes in discount rates based on global economic assumptions and changes in mine plans, resulting in a change in cash flows and changes in design of tailings storage facilities and in methodology following requests from the environmental regulatory authorities. At 31 December 2017, the environmental rehabilitation provision was $695 million. The balance of the rehabilitation provision of $29 million was included under “Non-current liabilities held for sale” in the statement of financial position.
ENVIRONMENTAL, HEALTH AND SAFETY MATTERS
In addition to post-mining land rehabilitation and closure requirements, AngloGold Ashanti is subject to extensive environmental, health and safety (EHS) laws and regulations in the various jurisdictions in which the company operates. These requirements govern, among other things, extraction, use, conservation and discharge of water; air emissions (including dust control); regulatory and community reporting; clean-up of contamination; land use and conservation of protected areas; worker health and safety and community health; and the generation, transportation, storage and disposal of solid and hazardous wastes, such as reagents, radioactive materials, and mine tailings. In addition, environmental laws and regulations, including the requirements contained in
85
environmental permits, are generally becoming more restrictive. Significant EHS requirements, risks and trends affecting our mining and processing operations are described below.
Regulatory Compliance
Capital and operating costs to comply with EHS laws and regulations have been, and are expected to continue to be, significant to AngloGold Ashanti. In addition, AngloGold Ashanti could incur fines, penalties and other sanctions, environmental clean-up costs, and third-party claims for personal injury or property or natural resources damages; suffer reputational damage; and be required to install costly pollution control equipment or to modify or suspend operations, as a result of actual or alleged violations or liabilities under EHS laws and regulations. Failure to comply with applicable EHS laws and regulations may also result in the suspension or revocation of permits and, in some jurisdictions, our right to mine a given concession. AngloGold Ashanti’s ability to obtain and maintain permits and other approvals and to successfully operate in particular communities may be adversely impacted by real or perceived effects on the environment or human health and safety associated with AngloGold Ashanti’s or other mining companies’ activities. In addition, unknown environmental hazards may exist at the company’s properties which may have been caused by previous owners or operators.
Water Management
AngloGold Ashanti’s mining and processing operations are heavily dependent upon access to substantial volumes of water required for such operations. Typically, water-use permits or water rights in each country impose limits on the quantity of water that can be extracted from certain sources and require, among other things, that wastewater from mining operations meet certain water quality criteria upon discharge. Water supply, quality and usage are areas of concern globally, but are particularly significant for operations in Brazil, Ghana and South Africa, and for exploration projects in Colombia, where there is significant potential environmental and social impact and a high level of stakeholder scrutiny. Any failure to secure access to suitable water supplies, or achieve and maintain compliance with the requirements of the permits or licenses, could result in curtailment or suspension of production at the affected operation. Incidents of water pollution or shortage can, in extreme cases, lead to community protest and ultimately result in the withdrawal of community and government support for the company’s operations.
Where feasible, the company operates a “closed loop” system which recycles the water used in its operations without discharging it to the environment. In some areas, however, such as Ghana and Brazil, high levels of rainfall and surface water runoff mean that a closed loop system is not feasible and that discharges, after water treatment if necessary, must take place.
Waste Management
Mining and mineral processing operations generate waste rock and tailings.
During open-pit mining, large volumes of soil and/or rock (overburden) are generated to expose the ore body. Similarly, waste rock is generated during drilling and developing access to underground ore bodies. Overburden and waste rock typically contain sub-economic levels of gold and are deposited as large waste rock dumps. Mine tailings are the process waste generated once grinding and extraction of gold from the ore is completed in the milling process and are deposited as slurry in large storage facilities specifically designed for this purpose.
The impact of a breach, leak or other failure of a tailings storage facility can be significant, and the company therefore monitors such facilities closely in accordance with the company’s internal standards, independent review, national regulatory requirements and commitments made to local communities. The occasional well-publicised failure of a third-party tailings facility and the potential impact of such failure also mean that these facilities are generally tightly regulated. An incident at the company’s operations could result, among other things, in enforcement, obligations to remediate environmental contamination, and claims for property or natural resources damages and personal injury and negative press coverage. An incident at another company’s operations has potential to result in governments tightening regulatory requirements applicable to mining operations generally and restricting other mine operators in response.
Groundwater Impacts and Environmental Remediation
AngloGold Ashanti has identified groundwater contamination plumes at certain of its operations. Numerous scientific, technical and legal studies have been undertaken to assist in determining the magnitude of the impact and to find sustainable remediation solutions. Based on those studies as well as discussion with regulators, the company has taken steps, including monitored natural attenuation and phyto-technologies, to address soil and groundwater contamination. Subject to the completion of trials and the technology being a proven remediation technique, no reliable estimate can be made at this time for the obligation. Should these obligations be significant, this could have a material adverse impact upon AngloGold Ashanti’s results and its financial condition.
As AngloGold Ashanti or its predecessors have a long history of mining operations in certain regions, issues may arise regarding historical environmental impacts on those areas, for which AGA, as the current owner/operator, may be legally responsible.
86
In addition, AngloGold Ashanti identified a flooding and future pollution risk to deep groundwater in the Far West Rand goldfields in South Africa. AngloGold Ashanti’s operations are part of the Far West Rand goldfields. The premature closure of neighbouring mines owned by other mining companies in the area led to increased pumping obligations on AngloGold Ashanti to address water infiltration into AGA’s mines, including additional legal requirements associated with construction, litigation and permits, which increased costs for the group.
In the West Wits district, after Blyvooruitzicht Gold Mining Company was placed in provisional liquidation in August 2013, AngloGold Ashanti secured a court order for unfettered access rights to Blyvooruitzicht 4 and 6 shafts to continue the pumping of underground water. AngloGold Ashanti then purchased from Blyvooruitzicht the rights of access to the 4 and 6 shafts as well as the relevant infrastructure to continue pumping underground water and transferred the assets and rights to its newly incorporated subsidiary Covalent Water Company. In November 2014 the Department of Water and Sanitation issued a directive directing AngloGold Ashanti through Covalent to dewater 4 and 6 shafts and discharge the water. AGA continues to comply with the directive.
Climate Change and Greenhouse Gas Regulation
Greenhouse gases, or “GHGs”, are emitted directly by AngloGold Ashanti’s operations, as well as by external utilities from which AngloGold Ashanti purchases electricity. Currently, a number of international and national measures to address or limit GHG emissions are in various phases of discussion or implementation in the countries in which the company operates.
As a result of commitments made at the UN climate conference in Durban, South Africa in December 2011, certain members of the international community negotiated a treaty at the December 2015 Conference of the Parties in Paris (COP 21). The Paris Agreement came into force in November 2016. Additional measures addressing GHG emissions may be implemented at the national or international levels. The outcome of the climate change proposals may, in due time, have the effect of requiring AngloGold Ashanti to reduce its direct GHG emissions or energy use or to incur significant costs for GHG emissions allowances or taxes including through costs passed on by electricity utilities which supply the company. AngloGold Ashanti also could incur significant costs associated with capital equipment, GHG monitoring and reporting and other obligations to comply with applicable requirements. The most likely source of these obligations is through state-level implementation of new emissions or financial obligations pursuant to evolving climate change regulatory regimes.
For example, in South Africa, National Treasury issued the Second Draft Carbon Tax Bill on 14 December 2017. South Africa ratified the Paris Agreement in November 2016 and endorsed its nationally-determined contribution, which requires that greenhouse gas emissions peak in 2020 to 2025, plateau from 2025 to 2035 and decline from 2036 onwards. The implementation date of carbon tax will be determined by the Minister of Finance through an announcement in 2018, or at the Budget 2019, taking into account the state of the economy. The tax will be phased in with the first phase ending in 2022. The impact in the first phase is designed to be revenue-neutral in terms of its aggregated impact, given the complementary tax energy incentives and reduction or credit for the current electricity levy.
During June 2016, National Treasury published for public comment, proposed Regulations on carbon offsets which can be used to reduce the potential carbon tax liability. The Regulations allow an “offset” in respect of any “certified emission reduction” derived from an “approved project” (including an existing project) carried on after 1 January 2017 in South Africa that is not subject to the carbon tax. The rate is expected to be ZAR120/ton of carbon dioxide, increasing by cpi plus two percent up to 2022 and in line with inflation thereafter. A system of rebates is expected to have the effect that the actual rate will be between ZAR6/ton and ZAR48/ton.
The direct impact of such a tax on the Group is not estimated to be material.
In 2010, Brazil launched the National Climate Change Policy, which established a voluntary reduction target of 1.2 billion tonnes of CO
2
below the projected emissions in 2020. The policy required the development of sector-specific plans in order to meet the target. Amongst other plans, it is intended to reduce deforestation in the Cerrado biome, where AngloGold Ashanti operates, by 40 percent compared to the average deforestation in 1999-2008 and expand renewable energy production and energy efficiency programmes. The policy also provided for a Brazilian GHG trading scheme, which is yet to be designed. While Brazil is not yet requiring mandatory GHG emissions reporting at the national level, some state environmental agencies have requested companies to voluntarily submit GHG emissions management plans, however Goiás and Minas Gerais State (in which AngloGold Ashanti operates) do not currently require GHG emissions management plans for mining projects.
In Australia, the government introduced the carbon emissions Safeguard Mechanism, aimed at limiting future growth in Greenhouse Gas (GHG) emissions. After setting baseline emission thresholds, the Safeguard Mechanism requires that companies submit carbon credits or pay penalties for excess emissions. Sunrise Dam successfully applied using its baseline emissions in accordance with the regulatory scheme’s default mechanism. Tropicana has applied for a baseline emission level using an alternative calculated baseline method during 2017 to ensure that it is not penalised for its planned ramp up in production rate. Whilst the baseline emissions set for Sunrise Dam and Tropicana aim to mitigate the need for additional penalties or taxes to be levied, AngloGold Ashanti could incur significant costs associated with capital equipment, GHG monitoring and reporting and other obligations to comply with changing legal requirements.
87
In addition, potential physical risks to our operations as a result of climate change include changes in rainfall rates or reduced water availability, rising sea levels, higher temperatures and extreme weather events. Events or conditions such as flooding or inadequate water supplies could disrupt mining and transport operations, mineral processing and rehabilitation efforts, create resource shortages, damage the company’s property or equipment and increase health and safety risks on site. Such events or conditions could have other adverse effects on the company’s workforce and on the communities in the area around its mines, such as an increased risk of food insecurity, water scarcity and prevalence of disease.
Occupational and Community Safety and Health and Tropical Diseases
Safety is a significant sustainable development challenge facing AngloGold Ashanti. AngloGold Ashanti’s operations are subject to a variety of laws and regulations designed to protect and improve the safety and health of employees. In some of the jurisdictions in which AngloGold Ashanti operates, the government enforces compulsory shutdowns of operations to enable investigations into the cause of accidents at those operations. Certain of the company’s operations have been temporarily suspended for safety reasons in the past. In South Africa, in particular, so-called Section 54 safety stoppages can, individually and/or in aggregate, have a material impact on operations. During 2016 safety related stoppages commonly resulted in full mine stoppages, whereas in 2017 this largely changed to localised area or section stoppages.
AngloGold Ashanti is also enhancing safety programmes, and a revised Group Safety strategy have been introduced. Three-year work plans were developed for each strategic focus area, comprising objectives, activities, performance metrics, targets and accountabilities. The updated strategy was approved by the company executive and implementation workshops were held with South Africa and International Operations leadership teams. In South Africa in particular the work culminated in a revised “Safe Production Strategy” which forms the basis in improving our capability to respond to risk, our focus remained on embedding and integrating safety into the business.
In addition, AngloGold Ashanti is subject to health and safety regulations relating to occupational disease. The primary areas of focus in respect of occupational health of employees within the company’s operations are noise-induced hearing loss (NIHL) and occupational lung diseases (OLD). OLD includes occupational tuberculosis and silicosis in individuals exposed to silica dust. Silicosis has been particularly prevalent in South Africa and has also arisen at the company’s Continental Africa and Brazilian operations, albeit to a far lesser extent. AngloGold Ashanti provides occupational health services to its employees at its occupational health centers and clinics, and continues to improve preventative occupational hygiene initiatives, such as implementing various control measures to prevent hazardous exposures, and providing employees with Personal Protective Equipment. It is believed that the costs associated with activities to prevent disease would be substantially lower than those associated with managing the consequences of occupational disease. Actual and alleged health and safety incidents or breaches of standards may also adversely impact the company’s reputation.
The South African government, by way of a cabinet resolution in 1999, proposed a possible combination and alignment of benefits of the Occupational Diseases in Mines and Works Act (ODMWA) that provides for compensation to miners who have OLD, and the Compensation for Occupational Injuries and Diseases Act (COIDA), that provides for compensation in respect of job related injuries and compensation of non-miners who have OLD. Work on amending ODMWA is underway, although it remains unclear as to what progress will be made in the short- to medium term. COIDA provides for compensation payments to workers suffering permanent disabilities which are classified as pension liabilities if the permanent disability is above a certain threshold, or a lump sum compensation payment if the permanent disability is below a certain threshold. ODMWA provides for a lump sum compensation payment to workers suffering from OLD as well as the payment of medical expenses over the claimant’s lifetime. If the proposed amendments to ODMWA were to occur, this could further increase the amount of statutory compensation that miners employed by AngloGold Ashanti could claim, which consequently could have an adverse effect on AngloGold Ashanti’s financial condition.
AngloGold Ashanti is subject to numerous claims, including claims related to silicosis and other OLD, and could be subject to similar claims in the future. Please refer to “Item 8: Financial Information - Legal Proceedings - South Africa - Silicosis litigation.”
In addition to OLD, AIDS and associated diseases remain major health care challenges faced by AngloGold Ashanti’s South African operations. Workforce prevalence studies indicate that HIV prevalence rates among AngloGold Ashanti’s South African workforce may be as high as 30 percent. AngloGold Ashanti continues to implement programmes to help those infected with HIV and prevent new infections from spreading. Since 2001, the company has offered a voluntary counseling and HIV testing programme for employees in South Africa and, since 2003, has offered anti-retroviral therapy to HIV positive employees who meet the current medical criteria and who desire this treatment. Over the past 10 years, the incidence of new infections has declined.
Malaria and other tropical diseases also pose health risks at all of the company’s operations in Central, West and East Africa where such diseases may assume epidemic proportions because of ineffective national control programmes. Malaria is a major cause of death in young children and pregnant women but also gives rise to deaths and absenteeism in adult men. All affected company operations have malaria control programmes in place.
Other conditions such as heart disease, chronic diseases and obesity are of increasing incidence and concern. Such diseases impair the health of workers and negatively affect productivity and profitability as a result of workers’ diminished focus or skill, absenteeism, treatment costs and allocated resources.
88
AngloGold Ashanti cannot guarantee that any current or future medical programme will be successful in preventing or reducing the injury and illness rates amongst its employees or in affecting consequent morbidity or mortality rates. AngloGold Ashanti may incur significant costs in addressing this issue in the future, which could also adversely impact the company’s results of operations and financial condition.
89
ANGLOGOLD ASHANTI GLOBAL OPERATIONS: 2017
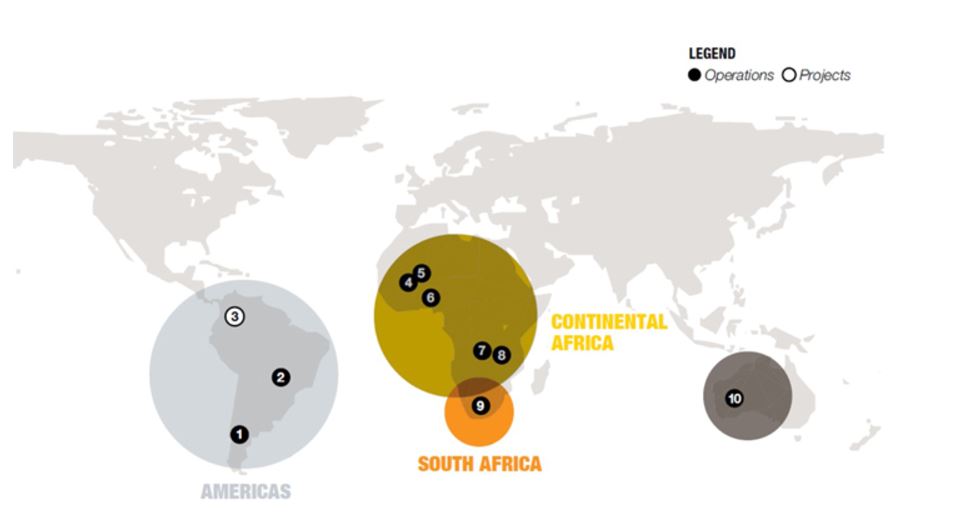
Operations and projects
|
AMERICAS
|
CONTINENTAL AFRICA
|
SOUTH AFRICA
|
||||||
|
1
|
|
Argentina
|
4
|
|
Guinea
|
9
|
|
South Africa
|
|
Cerro Vanguardia (92.5%)
|
Siguiri (85%)
|
Vaal River
|
||||||
|
2
|
|
Brazil
|
5
|
|
Mali
|
Kopanang
|
||
|
Serra Grande
|
Morila (40%)
(1)
|
Moab Khotsong
|
||||||
|
AGA Mineração
|
Sadiola (41%)
|
West Wits
|
||||||
|
3
|
|
Colombia
|
6
|
|
Ghana
|
Mponeng
|
||
|
Gramalote (51%)
|
Iduapriem
|
TauTona
|
||||||
|
La Colosa
|
Obuasi
(3)
|
Surface Operations
(2)
|
||||||
|
Quebradona (93.5%)
|
7
|
|
DRC
|
|||||
|
Kibali (45%)
(1)
|
||||||||
|
AUSTRALASIA
|
8
|
|
Tanzania
|
|||||
|
10
|
|
Australia
|
Geita
|
|||||
|
Sunrise Dam
|
||||||||
|
Tropicana (70%)
|
||||||||
Percentages indicate the ownership interest in AngloGold Ashanti, whether held directly or indirectly. All operations are 100%-owned unless otherwise indicated.
|
(1)
|
Both Morila and Kibali are managed and operated by Randgold Resources Limited.
|
|
(2)
|
Surface Operations includes First Uranium SA, which owns Mine Waste Solutions (MWS). MWS is managed and operated as a separate cash-generating unit.
|
|
(3)
|
Obuasi remained on care and maintenance in 2017. Prefeasibility study completed.
|
90
OPERATING PERFORMANCE
Group description
AngloGold Ashanti, a gold mining company with a globally diverse, world-class portfolio of operations and projects, is headquartered in Johannesburg, South Africa. AngloGold Ashanti is the third largest gold mining company in the world, measured by production.
Our portfolio of 17 operations and three projects in ten countries, comprises long-life, relatively low cost assets with differing ore body types located in key gold-producing regions.
Our operations and projects are grouped regionally as follows:
|
•
|
South Africa (Vaal River, West Wits and Surface Operations)
|
|
•
|
Continental Africa (Democratic Republic of the Congo, Ghana, Guinea, Mali and Tanzania)
|
|
•
|
Americas (Argentina, Brazil and Colombia)
|
|
•
|
Australasia (Australia)
|
These operating assets are supported by greenfield projects and a focused exploration programme.
In 2017, Obuasi remained on care and maintenance and the closure process at Yatela continued. On 19 October 2017, AngloGold Ashanti announced the sale of various assets in the Vaal River region of South Africa including the Moab Khotsong and Kopanang mines. Subsequent to year end all conditions precedent were fulfilled and the effective date of sale was 28 February 2018.
AngloGold Ashanti’s operations and joint ventures employed, on average, 51,480 people (including contractors) in 2017 (2016: 52,649).
Performance
In 2017, AngloGold Ashanti produced attributable 3.8 million ounces of gold (2016: 3.6 million ounces) as well as 753,000 pounds of uranium oxide, 6.2 million ounces of silver and 203 tonnes of sulphuric acid as by-products.
Production of 3.8 Moz was achieved at a cost of sales of $3.6 billion and an all-in sustaining cost of $ 1,050/oz for subsidiaries and $1,087/oz for equity accounted joint venture operations respectively, compared to 3.6Moz in 2016 at a cost of sales of $3.3 billion and all-in sustaining cost of $990/oz for subsidiaries and $955/oz for equity accounted joint venture operations, respectively.
The attributable Ore Reserve decreased from 50.0Moz in December 2016 to 49.6Moz in December 2017. This gross annual decrease of 0.4Moz includes depletion of 4.3Moz. The balance of 3.9Moz additions in Ore Reserve, results from exploration and modelling changes of 4.0Moz and other factors of 0.7Moz, whilst changes in economic assumptions resulted in a 0.8Moz reduction.
Capital expenditure, including equity accounted joint ventures, in 2017 amounted to $953 million (2016: $811 million).
Safety
Regrettably, there were seven fatalities across the group’s operations in 2017. The all injury frequency rate was 7.49 per million hours worked compared to 7.71 in 2016.
91
SOUTH AFRICA
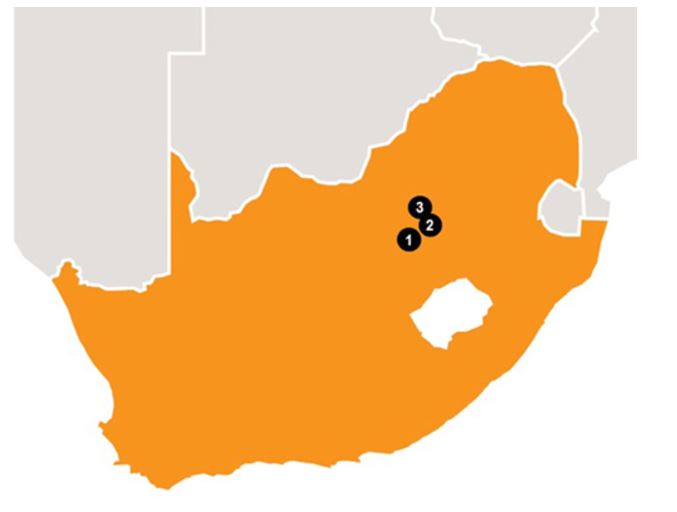
In 2017, AngloGold Ashanti’s South African operations comprised four deep-level mines and surface production facilities. They are:
|
•
|
The Vaal River operations - Kopanang and Moab Khotsong;
|
|
•
|
The West Wits operations - Mponeng and TauTona; and
|
|
•
|
Surface operations.
|
The South Africa region has undergone extensive restructuring to ensure its long term sustainability. Moab and Kopanang operations have been sold subsequent to year end and TauTona was placed on orderly closure during the year. Following the completion of the sale of various assets in the restructure of the group’s South Africa region, as of 1 March 2018, AngloGold Ashanti ceased to have underground operations in the Vaal River area.
|
Gold production
(000oz)
|
|
Average number of
employees
|
|
||
|
Operations
|
|||||
|
South Africa
|
|||||
|
1.
Vaal River
|
|||||
|
Kopanang
|
91
|
|
3,879
|
|
|
|
Moab Khotsong
|
294
|
|
6,143
|
|
|
|
2.
West Wits
|
|||||
|
Mponeng
|
224
|
|
5,962
|
|
|
|
TauTona
|
91
|
|
3,822
|
|
|
|
3.
Surface operations
(1)
|
192
|
|
3,161
|
|
|
|
(1)
|
Includes MWS for purposes of this report. It is operated and managed as a separate cash-generating unit.
|
92
South Africa Key Statistics
|
Unit
|
2017
|
|
2016
|
|
2015
|
|
||||
|
Operation
|
||||||||||
|
Tonnes treated/milled
|
Mt
|
38.9
|
|
39.6
|
|
36.8
|
|
|||
|
Pay limit
(1)
|
oz/t
|
0.43
|
|
0.37
|
|
0.39
|
|
|||
|
g/t
|
15.97
|
|
13.81
|
|
14.38
|
|
||||
|
Recovered grade
(1)
|
oz/t
|
0.202
|
|
0.219
|
|
0.225
|
|
|||
|
g/t
|
6.93
|
|
7.51
|
|
7.70
|
|
||||
|
Gold production
(2)
|
000oz
|
903
|
|
967
|
|
1,004
|
|
|||
|
Cost of sales
|
$m
|
1,114
|
|
1,041
|
|
1,083
|
|
|||
|
Total cash costs
(3)
|
$/oz
|
1,085
|
|
896
|
|
881
|
|
|||
|
All-in sustaining costs
(3)(4)
|
$/oz
|
1,245
|
|
1,081
|
|
1,088
|
|
|||
|
Capital expenditure
|
$m
|
150
|
|
182
|
|
206
|
|
|||
|
Safety
|
||||||||||
|
Number of fatalities
|
7
|
|
6
|
|
9
|
|
||||
|
AIFR
|
Per million hours worked
|
12.68
|
|
12.02
|
|
10.81
|
|
|||
|
People
|
||||||||||
|
Average no of employees: Total
|
26,245
|
|
28,507
|
|
28,325
|
|
||||
|
Permanent employees
|
22,738
|
|
25,205
|
|
25,274
|
|
||||
|
Contractors
|
|
3,507
|
|
3,302
|
|
3,051
|
|
|||
|
(1)
|
Refers to underground operations only.
|
|
(2)
|
Includes production ounces from the technology development programme.
|
|
(3)
|
Total cash costs and all-in sustaining costs are non-GAAP measures. For further information on these non-GAAP measures, see “Item 5A: Operating Results”.
|
|
(4)
|
Excludes stockpile impairments.
|
Performance in the South Africa Region in 2017
In June 2017, the company took a decision to restructure the South African assets, to focus on returning the South African business to profitability, while mitigating job losses. It was decided in the latter half of the year, to place TauTona into orderly closure. In addition, the decision was made to sell Kopanang, the nearby West Gold Plant and related infrastructure as well as to dispose of Moab Khotsong mine and related infrastructure. These transactions were subject to a number of conditions precedent, all of which were achieved and the sales transactions were concluded effective 28 February 2018. As of 1 March 2018, AngloGold Ashanti ceased to have underground mining operations in the Vaal River area.
Production and costs
The South African operations produced 903,000oz, a seven percent decrease year-on-year as tonnes mined were affected by a poor start up to the year at all operations. Underground yield dropped eight percent to 6.93g/t, a result of lower feed grades as well as higher dilution year-on-year. This was mainly due to an increase in waste tonnes at Moab Khotsong, moving away from higher grade areas at Mponeng, and the reclamation of the tailing storage facilities at the West Wits Surface Sources.
The decision to stop the loss-making operations in the third quarter further impacted full-year production.
At West Wits, production was lower than in the previous year at 315,000oz, mainly due to the slow start-up to the year following safety-related stoppages late the previous year. Production at Mponeng decreased year-on-year, mainly as a result of the planned mining of lower-grade areas, face-time constraints with mining occurring further away from shaft stations, as well as three separate seismicity-induced fatal accidents in the second half of the year. The mine’s performance improved towards the end of the second quarter through to the third quarter, due to improved efficiencies. Production highlights included a four percent increase in the mineable face length which allowed for more face-length flexibility. During the year, the average monthly face advance increased from less than 4.9m to more than 5.0m in June, which was maintained for the rest of the year. Mponeng’s yield improved in the last quarter of the year, to an average of 8.54g/t. Unfortunately, safety-related work stoppages following the fatal accidents in late October and early November contributed to a disappointing decline in production in the last quarter.
At TauTona, severe production challenges, in addition to depleted Ore Reserves and limited mining flexibility, compounded operational inefficiencies and low productivity, and led to the decision to place the mine into orderly closure.
At the Vaal River operations, production improved by four percent year-on-year to 385,000oz. The main contribution was from Moab Khotsong where efficiencies improved and there were fewer safety-related disruptions, despite dilution and a lower mine call factor.
93
At Kopanang, production remained flat year-on-year, impacted by safety-related interruptions following the fall-off-ground fatal incidents in the fourth quarter. However, volumes mined improved and implementation of the cycle mining strategy showed early signs of success.
Surface Operations’ production was up three percent at 192,000oz for the year. At Mine Waste Solutions, production was 18 percent higher at 109,000oz compared with the same period in 2016, given the improvement in feed grades from the Sulphur Paydam and East tailing storage facilities (TSF), coupled with improved recovery. The yield increase was as expected as the Sulphur Paydam is normally associated with higher reef values. Production was also boosted by higher volumes of floor cleaning material reclaimed. Gold recovery efforts improved in the last quarter of the year to around seven percent, aided by reagent suite optimisation and improved carbon management. Operations at the flotation and uranium circuit remain suspended as investigations into improved water reticulation continue.
Production from hard rock dumps was lower owing to a drop in tonnage throughput, and lower recoveries due to the increased amount of clean-up material which is refractory in nature. The sticky nature of the material processed through the Surface Operations’ plants negatively impacted metallurgical efficiencies. Surface Operations’ production was also affected by the suspension of the Kopanang marginal ore dumps and reduced availability of the mill at the Kopanang gold plant.
All-in sustaining costs were 15 percent higher than 2016. Total cash costs for the region increased to $1,085/oz compared with 2016, due to lower production volumes, inflationary pressures and a 10 percent stronger rand on average against the US dollar.
Capital expenditure
Total capital expenditure for the region decreased 18 percent year-on-year as a result of cost curtailments in line with the suspension of operations and restructuring of the South Africa asset base, and the delay in starting the Mponeng Phase 2 life of mine extension project.
Safety
Regrettably, seven fatalities occurred in the South Africa region in 2017. Two fatalities occurred following fall-of-ground related incidents at Kopanang and one fatality at Moab in a tramming incident. Four seismicity-related fall-of-ground incidents occurred at Mponeng.
Ore Reserve
As at 31 December 2017, the total Ore Reserve for the South African region was 23.5Moz (2016: 25.1Moz). This is equal to 47 percent of the Group’s Ore Reserve. AngloGold Ashanti announced on 19 October 2017 that it was selling various assets in the Vaal River region of its South African operations. As at 31 December 2017, the sales processes were still underway and therefore do not affect the stated Ore Reserve for 2017. However, with the conclusion of the sales at the end of February 2018, the following reductions in the Ore Reserve will take place:
Kopanang: Ore Reserve 0.36Moz, Moab Khotsong: Ore Reserve 4.87Moz, Surface Operations: Ore Reserve 0.87Moz.
Growth and improvement
Mponeng Phases 1 and 2 Project
Mponeng’s mine life extension is initially being executed through the Below 120 Level, Phase 1 project. Phase 1 aims to access deeper, higher-grade ore with the development of a decline access below the current secondary shaft. Phase 2, the next stage of the mine life extension, currently under evaluation, involves deepening the secondary shaft to further extend the life of mine.
Completion and full commissioning of Phase 1 is expected in the second quarter of 2018. An additional ventilation hole is being created from decline 3 to 116 level to create more ventilation capacity, along with an ore pass down to 126 level to ease ore handling logistics on 123 level. Completion of the water management infrastructure on 127 level was delayed during the last quarter of the year following flooding of the emergency pump station and pump station panels. The emergency pump station is still under construction at the bottom of the decline system, with full commissioning expected in the second half of 2018. Construction and commissioning of the ore handling infrastructure to 126 level is expected to be completed by the end of the first half of 2018. The ramp-up to steady state of ore reserve development is continuing. The revised geological resource model associated with the Ventersdorp Contact Reef is currently under review.
The Phase 2 feasibility study for the Mponeng life of mine project has resumed, having been interrupted at the end of May 2017 to allow the geotechnical study to be completed to determine the most appropriate location of the infrastructure relative to tolerable levels of rock stress. The feasibility study is now expected to be completed during 2018.
94
CONTINENTAL AFRICA
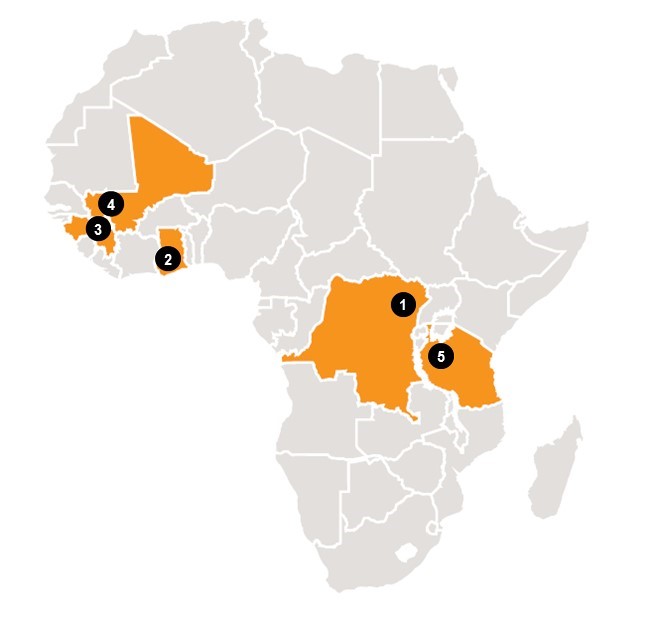
AngloGold Ashanti has seven mines in the region, six of which are currently in operation. AngloGold Ashanti manages four of the six operations. Obuasi is on care and maintenance and was not operational during 2017. Closure is underway at Yatela.
|
Attributable gold production
(000oz)
|
|
Average number of
employees
|
|
||
|
Subsidiary operations
|
|||||
|
2. Ghana
|
|||||
|
Iduapriem
|
228
|
|
1,598
|
|
|
|
Obuasi
|
3
|
|
1,066
|
|
|
|
3. Guinea
|
|||||
|
Siguiri 85%
|
323
|
|
3,353
|
|
|
|
5. Tanzania
|
|||||
|
Geita
|
539
|
|
4,251
|
|
|
|
Joint venture operations
|
|||||
|
1.
Democratic Republic of the Congo
|
|||||
|
Kibali 45%
|
268
|
|
2,428
|
|
|
|
4. Mali
|
|||||
|
Morila 40%
|
28
|
|
305
|
|
|
|
Sadiola 41%
|
63
|
|
592
|
|
|
95
Continental Africa - Key Statistics
|
Unit
|
2017
|
|
2016
|
|
2015
|
|
||||
|
Subsidiary operations
|
||||||||||
|
Tonnes treated/milled
|
Mt
|
20.3
|
|
20.8
|
|
20.8
|
|
|||
|
Pay limit
|
oz/t
|
0.038
|
|
0.034
|
|
0.039
|
|
|||
|
g/t
|
1.130
|
|
1.151
|
|
1.183
|
|
||||
|
Recovered grade
|
oz/t
|
0.054
|
|
0.046
|
|
0.049
|
|
|||
|
g/t
|
1.84
|
|
1.59
|
|
1.68
|
|
||||
|
Gold production (attributable)
|
000oz
|
1,094
|
|
955
|
|
1,028
|
|
|||
|
Cost of sales
|
$m
|
1,070
|
|
925
|
|
969
|
|
|||
|
Total cash costs
(1)
|
$/oz
|
686
|
|
674
|
|
687
|
|
|||
|
All-in sustaining costs
(1)(2)
|
$/oz
|
909
|
|
886
|
|
861
|
|
|||
|
Capital expenditure
|
$m
|
290
|
|
191
|
|
183
|
|
|||
|
Safety
|
||||||||||
|
Number of fatalities
|
0
|
|
0
|
|
1
|
|
||||
|
AIFR
|
Per million hours worked
|
0.48
|
|
0.31
|
|
0.29
|
|
|||
|
People
|
||||||||||
|
Average no of employees: Total
|
10,268
|
|
9,599
|
|
8,907
|
|
||||
|
Permanent employees
|
4,523
|
|
4,441
|
|
4,876
|
|
||||
|
Contractors
|
5,745
|
|
5,158
|
|
4,031
|
|
||||
|
(1)
|
Total cash costs and all-in sustaining costs are non-GAAP measures. For further information on these non-GAAP measures, see “Item 5A: Operating Results”.
|
|
(2)
|
Excludes stockpile impairments.
|
|
Unit
|
2017
|
|
2016
|
|
2015
|
|
||||
|
Joint venture operations
|
||||||||||
|
Tonnes treated/milled
|
Mt
|
7.7
|
|
6.8
|
|
6.4
|
|
|||
|
Pay limit
|
oz/t
|
0.045
|
|
0.038
|
|
0.041
|
|
|||
|
g/t
|
1.528
|
|
1.294
|
|
1.407
|
|
||||
|
Recovered grade
|
oz/t
|
0.047
|
|
0.052
|
|
0.064
|
|
|||
|
g/t
|
1.10
|
|
1.79
|
|
2.19
|
|
||||
|
Gold production (attributable)
|
000oz
|
359
|
|
356
|
|
407
|
|
|||
|
Cost of sales
|
$m
|
440
|
|
406
|
|
378
|
|
|||
|
Total cash costs
(1)
|
$/oz
|
822
|
|
809
|
|
656
|
|
|||
|
All-in sustaining costs
(1)(2)
|
$/oz
|
1,087
|
|
955
|
|
701
|
|
|||
|
Capital expenditure
|
$m
|
119
|
|
100
|
|
132
|
|
|||
|
Safety
|
||||||||||
|
Number of fatalities
|
0
|
|
0
|
|
0
|
|
||||
|
AIFR
|
Per million hours worked
|
2.08
|
|
1.95
|
|
3.64
|
|
|||
|
People
|
||||||||||
|
Average no of employees: Total
|
3,325
|
|
3,092
|
|
3,040
|
|
||||
|
Permanent employees
|
944
|
|
890
|
|
895
|
|
||||
|
Contractors
|
2,381
|
|
2,202
|
|
2,145
|
|
||||
Production and costs
The Continental Africa region delivered a 10 percent increase in production compared to the previous year. Exceptional production performances recorded at Siguiri, Iduapriem and Geita were offset by lower output from Sadiola as the remaining oxide ore mining sources are depleted.
96
Geita’s production increased by 10 percent compared to 2016, driven by a 10 percent increase in recovered grade, a result of the higher-grade ore mined at Nyankanga Cut 7 and Cut 8. Underground ore sources were in line with the mine plan while maiden underground operations were ramping up toward commercial volumes. Plant throughput achieved was above plan owing to the increase in the oxide feed and finer fragmentation resulting from the increased running time of the secondary and tertiary crusher circuits. The transition to underground operations continued with four areas being mined during the year, resulting in a 248 percent increase year-on-year to 493,000t in underground volumes treated.
Production at Siguiri increased by 25 percent year-on-year, following a solid performance with improved productivities and greater access to higher grade ore in the new Seguelen pit in Area 1. Production in 2017, the third highest in the mine’s history, was boosted by favourable grade variances and optimised treatment of full-grade ore laterite cap rock (duricrust) stockpiles. This improvement offset treatment of lower-grade stockpiles from other pits and the lower volumes treated. During the year, work began on the Siguiri combination plant project, with commissioning planned for late 2018.
At Iduapriem, production increased by seven percent year-on-year. Mining during the year focused on deeper, higher-grade areas, resulting in an eight percent increase in recovered grade. This was partly offset by a marginal drop in tonnes treated. Total tonnes mined increased 27 percent year-on-year, owing to greater mining-fleet productivity as the mine continued with its extensive waste stripping programme to access the ore sources in the Block 7 and 8 pit that will provide the foundation for sustainable production over the future life-of-mine.
At Kibali, tonnage throughput increased by four percent in 2017 to record levels. Gold production at 268,000oz in 2017 reflected the improved performance in the second half of the year. This was boosted by an increase in both open-pit and underground ore tonnes mined following the successful commissioning of the underground materials handling system and optimal use of the shaft, facilitating the increase in higher grade ore from underground. Improved plant availability and recovery rates also contributed to increased throughput and were boosted by additional ultra-fine grind and Pumpcell capacity. Using the Pumpcell amongst other things helped facilitate the treatment of 100 percent sulphide ore at the processing plant where it was processed solely for extended periods, achieving design recovery and above-design throughput. This resulted in higher volumes of ore being treated and a two percent increase in production. In the underground mine, operational challenges compounded by underutilisation of the ore pass system, continued during the year and resulted in the treatment of lower grade ore at the expense of the high-grade underground ore.
At Sadiola, production declined as the recovered grade decreased. This was a result of reduced mining flexibility as the remaining oxide ore mining sources being depleted. Plant operations were efficient and consistently achieved planned throughput. This helped to partly offset the lower feed grade and provided flexibility to maintain a steady production and revenue profile.
Morila resumed mining in the latter part of the year, accessing and treating higher grade ore from the Domba pit, contributing to a year-on-year increase in production. The increased tonnage throughput during the year was further boosted by consistent plant availability and treatment of softer ore, offsetting the decrease in recovered grade. The mine is expected to continue treatment of mineralised waste ore, augmented by higher grade ore from targeted mining areas, after which the mine will transition to full closure.
All-in sustaining costs for the subsidiary and joint venture operations in the region increased to $907/oz and $1,088 respectively mainly a result of increased sustaining capital expenditure that was partly offset by higher production. Total cash costs increased marginally year-on-year at Geita due to the negative impact of higher initial costs from underground mining and increased at Kibali due to increased operating costs. These increases were partially offset by higher production and recovered grades. Total cash costs at Siguiri and Iduapriem decreased year-on-year. At Siguiri, costs decreased by eight percent as a result of increased production. At Iduapriem, total cash costs decreased by nine percent because of higher production and lower costs due to operational efficiencies, cost management initiatives and higher recovered grades.
Capital expenditure
Capital expenditure for the region increased in line with company plans as we invested in growth projects at Siguiri and Kibali, and increased sustaining capital investment at Geita and Iduapriem. These projects are expected to realise future benefits as higher grade ore is accessed at Iduapriem and Ore Reserve development work in the underground operation at Geita continues to ramp up. The balance of sustaining capital expenditure was earmarked to improve asset reliability and consistent operations across the Continental Africa region.
All-in sustaining costs for Kibali increased year-on-year, a result of increased sustaining capital expenditure on waste stripping in the Pakaka and Kombokolo pits and increased underground capital expenditure.
Safety
The region reported a 24 percent year-on-year all injury rate frequency rate improvement compared to 2016. There were no fatalities during the year, and the region achieved a record 801 fatality-free days since the last fatality in October 2015.
97
Ore Reserve
The total attributable Continental Africa Region Ore Reserve was 16.9 million ounces (2016: 17.8 million ounces). This amounts to 34 percent of the group’s Ore Reserve.
Growth and improvement
Geita made good progress with the construction of the new 40MW power plant, which is expected to be commissioned in the first half of 2018. The plant will provide the required levels of reliable power to the mine and reduce the overall cost of power. The mine successfully transitioned to and expanded underground mining at Star & Comet while developing two new underground mines in the Nyankanga mining area. Open-pit mining is anticipated to continue at Nyankanga Cut 8 until the second half of 2019 while Geita Hill East Cut 1 is expected to finish in the second half of 2018. Exploration work is being conducted at Selous, 2.4km from Star & Comet, for a satellite pit to supplement underground operations.
Siguiri’s combination plant is well advanced and scheduled to be fully commissioned in the third quarter of 2018. The associated 30MW power plant will be commissioned in the second half of 2018. Construction of the combination plant began with the early works in the first half of the year carried out by a local contractor. The main civil construction commenced in the second half of the year with the first major concrete poured in December 2017. The mill shells arrived on site in September, and off-site fabrication and sourcing of electrical and instrumentation equipment and cabling, continued during the last quarter of the year. Major contractors have mobilised on site and a new mining contractor is scheduled to begin mining in the first half of 2018.
At Iduapriem, the deferred stripping carried out during the year at Teberebie Cut 3 was completed and waste stripping at the larger Cut 1 exceeded planned targets. The project delivered an additional 4.1Mt of marginal and waste material as a result of improved efficiencies in mining unit rates. This work will now provide access to the ore body to extend the mine life by about a decade. The plant recovery project was successfully completed and is expected to contribute to higher plant recoveries in 2018.
The main pit dewatering project at Sadiola was substantially completed at year end, with all equipment and materials delivered to site. Construction of the sulphide project awaits approval by the Government of Mali, though no agreement has yet been reached in this regard. Despite our efforts and the clear benefits the project would generate locally and to the Government of Mali, there has been no resolution around the terms critical to moving the project forward. AngloGold Ashanti and joint-venture partner IAMGOLD Corporation continue to evaluate the project which will add sulphide-ore processing capability to the plant. Although we remain committed to the project, if no agreement is reached, the operation will enter a restricted exploitation phase and then, when stockpiles are exhausted, it will enter a phase of suspended exploitation (care and maintenance).
At Kibali, capital expenditure of $110m for the year (attributable), was spent mostly on underground development, the vertical shaft and the second hydro-power plant. Underground paving at the central haulage level was completed, allowing haulage from the ore passes into the underground crushers. The materials handling system was also commissioned during the last quarter of the year, and 118kt of ore hoisted from the shaft, with total underground ore tonnes of 1,110kt mined for the year. Underground ore production from the declines totalled 505,000t in the last quarter of the year. Once the ramp up has been completed, a significant increase in production is expected. Ambarau, the second hydro power station was completed and commissioned during the first half of the year, taking Kibali’s total hydro generation capacity to 32MW. At the plant, the ultra-fine grind and Pumpcell capacity was increased at the start of the year, enabling the processing of substantially increased floatation concentrate volumes, improving grind and recovery as well as providing flexibility in ore treatment. Furthermore, waste stripping at both Kombokolo and Pakaka satellite pits was undertaken during the course of the year. The only major capital project remaining is the third hydropower station at Azambi, which is being constructed and is expected to be commissioned in the second half of 2018.
Update on Obuasi redevelopment
Obuasi, which was placed on care and maintenance in 2016, remained so throughout 2017. The cost of Obuasi’s care and maintenance programme was $62m in 2017 (2016: $70m).
The invasion of a part of the mine by illegal miners in 2016, has been resolved and the mine’s operational area has been cleared of illegal miners. Public security agencies provided security at the mine throughout 2017, and continue to do so.
AngloGold Ashanti was in discussions with the Government of Ghana throughout 2017 to secure the necessary agreements and permits for the possible redevelopment of the mine. The boards of AngloGold Ashanti (and its relevant subsidiaries) have approved the redevelopment of Obuasi, subject to ratification by Ghana’s parliament of the relevant fiscal, development and security agreements. These agreements have been signed by the Government of Ghana. The board therefore approved interim funding of $31m to cover the first six months to enable the project team to be established and to set-up the front-end engineering and design, so as not to delay the project.
The study into Obuasi’s redevelopment was completed with improvements in returns and payback period. This was achieved with an improved geological model, phased capital expenditure and the supportive agreements signed with the Government of Ghana.
98
The redevelopment will establish Obuasi as a long-life, modern, mechanised underground mining operation. This is a fundamental departure from the mine’s previous operating model. The redevelopment will deliver a mine that makes use of automation and controls for improved operational efficiencies and consistency in performance. It envisages a smaller, but more skilled workforce that can operate in the planned mechanized and automated environment.
The detailed feasibility study covers every aspect of the mine, including operating methods, systems and processes, environmental management and mine rehabilitation, organisational design, human resource strategy and social responsibility, among others.
99
AUSTRALASIA
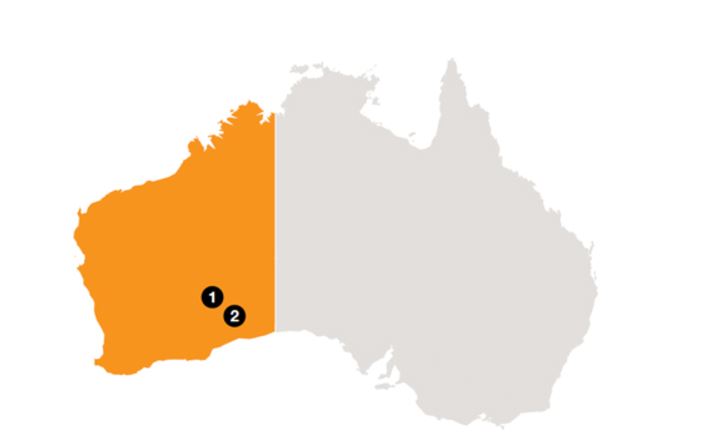
|
Attributable gold production
(000oz)
|
|
Average number of
employees
|
|
||
|
Operations
|
|||||
|
Australia
|
|||||
|
1. Sunrise Dam
|
238
|
|
489
|
|
|
|
2. Tropicana 70%
|
322
|
|
485
|
|
|
AngloGold Ashanti’s Australasian assets comprise the wholly owned Sunrise Dam and the 70 percent-owned Tropicana Gold mine, Australia’s newest gold mine.
100
Australasia - Key Statistics
|
Unit
|
2017
|
|
2016
|
|
2015
|
|
||||
|
Operation
|
||||||||||
|
Tonnes treated/milled
|
Mt
|
9.4
|
|
8.9
|
|
8.2
|
|
|||
|
Pay limit
|
oz/t
|
0.06
|
|
0.06
|
|
0.06
|
|
|||
|
g/t
|
1.84
|
|
1.86
|
|
1.85
|
|
||||
|
Recovered grade
|
oz/t
|
0.061
|
|
0.058
|
|
0.068
|
|
|||
|
g/t
|
1.89
|
|
1.82
|
|
2.12
|
|
||||
|
Gold production (attributable)
|
000oz
|
559
|
|
520
|
|
560
|
|
|||
|
Cost of sales
|
$m
|
550
|
|
540
|
|
525
|
|
|||
|
Total cash costs
(1)
|
$/oz
|
743
|
|
793
|
|
702
|
|
|||
|
All-in sustaining costs
(1)(2)
|
$/oz
|
1,062
|
|
1,067
|
|
875
|
|
|||
|
Capital expenditure
|
$m
|
153
|
|
109
|
|
78
|
|
|||
|
Safety
|
||||||||||
|
Number of fatalities
|
0
|
|
0
|
|
0
|
|
||||
|
AIFR
|
Per million hours worked
|
8.53
|
|
9.49
|
|
8.56
|
|
|||
|
People
|
||||||||||
|
Average no of employees: Total
|
974
|
|
925
|
|
836
|
|
||||
|
Permanent employees
|
226
|
|
211
|
|
195
|
|
||||
|
Contractors
|
|
748
|
|
714
|
|
641
|
|
|||
|
(1)
|
Total cash costs and all-in sustaining costs are non-GAAP measures. For further information on these non-GAAP measures, see “Item 5A – Operating Results”.
|
|
(2)
|
Excludes stockpile impairments.
|
Production and costs
The region delivered a strong performance in 2017, producing 559,000oz driven by higher mill throughput rates and feed grades and increased metallurgical recoveries.
Sunrise Dam celebrated its 20th anniversary in March 2017. A strategy to lift the mined grade while maintaining the underground ore production rate at 3.0 Mtpa was successfully implemented during the year, resulting in a five percent lift in yield to 1.83g/t. The mine’s production increased by four percent, compared with 2016. Underground ore is the primary source of mill feed and is blended with intermediate grade (1.26 g/t) stockpiled ore that was accumulated during open-pit mining to meet the processing plant capacity of approximately 3.6Mtpa. The higher-grade Cosmo and Vogue ore bodies were the focus of development in 2017, with Vogue targeted to be the key ore source in 2018.
At Tropicana, optimisation and expansion of the processing plant lifted processing capacity to 7.7 Mtpa (100 percent), resulting in a 10 percent increase in mill throughput, which delivered a 10 percent increase in attributable gold production. A fines pulping circuit was commissioned in November 2017, further improving efficiency by minimising downtime during maintenance shutdowns. This is expected to increase annual mill runtimes by approximately two percent to more than 98 percent.
Following the introduction of a 600t face shovel to the mining fleet, mining rates increased to more than 90Mtpa in 2017, enabling the resumption of grade streaming - the preferential treatment of higher grade ore while low-to-medium grade ore was stockpiled - during the second half of the year. Mining in 2017 focused on the Havana 3 and Tropicana 2 pits.
The all-in sustaining cost for the Australasia region decreased marginally (one percent) to $1,062/oz, due to planned increases in production at both Sunrise Dam and Tropicana, and decreased mining unit costs at Tropicana due to mining rates exceeding 90Mt. These favourable factors were partially offset by a stronger Australian dollar against the US dollar, and increased capital expenditure at Sunrise Dam. This included $20 million for the Recovery Enhancement Project (REP).
Capital expenditure
Capital expenditure at Tropicana related to Long Island will be primarily for the expansion of the accommodation camp, heavy vehicle workshop infrastructure and for a second ball mill. The installation of a second ball mill in the Tropicana processing plant grinding circuit was approved in 2017 with commissioning scheduled for the fourth quarter of 2018.
At Sunrise Dam, an EPC (engineering, procurement and construction) contract was awarded to GR Engineering Services to undertake the design and construction of a brownfields upgrade to processing facilities as part of the REP. The project also requires additional power generation capacity. To this end, it is planned that two 4MW gas generator sets will be added to the existing power station to increase capacity to 43MW.
Work commenced in 2017 on an expansion to the tailings storage facility at Sunrise Dam, which will add approximately eight years to the life of the facility. This work is expected to be completed by the fourth quarter of 2018.
101
Safety
The region’s safety performance remains strong. Again there were no fatalities during the year, while the AIFR was 8.53 per million hours worked an improvement of 10 percent compared to 2016.
Ore Reserve
At the end of 2017, the total attributable Ore Reserve for the Australasia Region was 4.0 million ounces (2016: 4.0 million ounces). This is approximately eight percent of the group’s total Ore Reserve.
Growth and improvement
At Tropicana, the focus for 2018 and beyond will be on implementation of the Long Island strategy, which is expected to extend the life of mine.
In December 2017, the Tropicana joint venture partners announced a commitment to the Long Island mining strategy and approval for an additional ball mill in the processing plant, to further lift plant throughput to 8.1Mtpa, which is expected to increase gold recovery.
The Long Island strategy has been driven by finding a more cost-efficient way to mine waste in pit cutbacks. It involves using a strip-mining approach that minimises waste haulage distances by using in-pit backfill, essentially optimising haulage distances over the life of mine. The approach comprises eight stages with three major decision points providing flexibility to tailor the approach at each decision point, depending on market and other prevailing conditions.
Phase one comprises mining of the Havana South pit and a cutback of the Boston Shaker pit, using the completed Tropicana pit as the first backfill location.
The Long Island development is expected to increase mining rates to between 95Mtpa and 107Mtpa over the next two years, to peak in 2019 and to continue at that rate for about four years. The project was enhanced by the decision to install a 6MW ball mill in the processing plant, enabling throughput to be lifted to 8.1Mtpa to match the increased mining rate. Through a reduction in grind size, baseline metallurgical gold recovery is expected to improve by up to three percent to approximately 92 percent.
This does not include potential underground production from mineralisation at the Boston Shaker ore body, which remains open at depth. A prefeasibility study incorporating infill drilling and underground mining options will be undertaken in 2018. The target is to delineate underground Ore Reserve at more than 3g/t to replace stockpiled mill feed after 2021.
The Long Island strategy was underpinned by an increase in the Ore Reserve at 66.59Mt, grading 1.91g/t gold, for a total of 4.08Moz. Including gold produced to date, Tropicana has delivered a 72 percent increase in Ore Reserve since the project was approved in November 2010.
In 2018, Sunrise Dam will continue to focus on embedding a more selective mining approach to target higher grade sections in the underground stopes, while maintaining the underground production rate at approximately 250,000t a month. This approach is designed to lift the grade of ore delivered to the mill and reduce cash operating costs. In line with this plan, work is focused on improving the productivity of the underground operation to lift sustainable ore production rates above 3Mtpa. Several capital projects, including ventilation upgrades and installation of an underground workshop, are aimed at improving the effective use of mining equipment and the reliability of the mine.
The Vogue ore body will be the key ore source in 2018 and remains open along strike and at depth. Two diamond drill rigs will continue to focus on drilling the Indicated and Inferred Mineral Resource at Vogue.
The performance of the 4Mtpa processing plant also set the standard globally within AngloGold Ashanti, ranking at number one for overall equipment efficiency, with the potential for further, incremental improvements expected in 2018.
The recovery enhancement project at Sunrise Dam is scheduled for commissioning in the second half of 2018 and is expected to lift the recovery rate, through the installation of flotation and ultrafine grinding circuits.
Work will continue in 2018 on the underground mine management system (UMMS), which will enable real-time analysis of the mobile fleet and services such as ventilation, power and dewatering. Over the longer term, overall equipment efficiency will be analysed to identify specific Operational Excellence projects that improve the effective time, mining rate and quality performance metrics of the mining equipment. The UMMS will be a critical tool to enable an improved production rate at the underground mine.
Encouraging results were reported during the year from drilling on the Butcher Well/Lake Carey exploration joint venture tenements where there is potential for the discovery of additional Ore Reserve for processing at Sunrise Dam, possibly replacing low-grade stockpiles currently being processed. Around 20,000m of diamond drilling was undertaken during 2017 within the Butcher Well/ Lake Carey exploration joint venture, along with aircore drilling to the north and metallurgical testing. A 30-person camp was established, together with a core processing facility.
102
THE AMERICAS
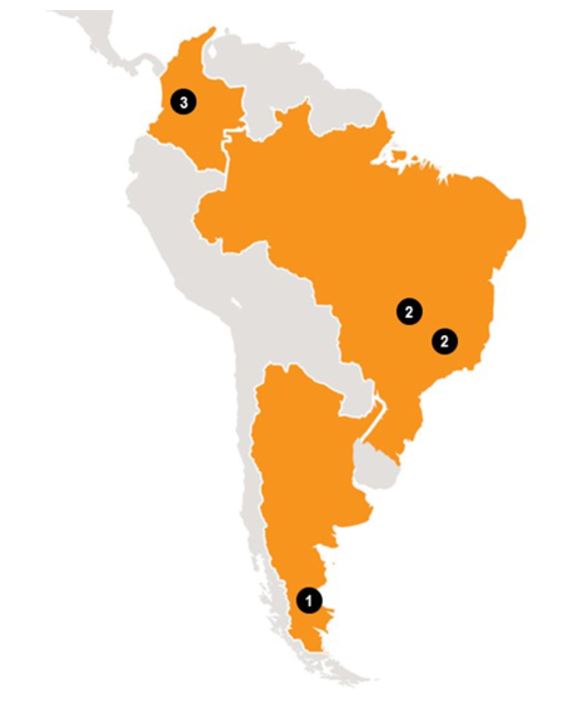
AngloGold Ashanti has three mining operations – both open pit and deep level mining – in the Americas region. In addition, there is an active greenfields exploration programme underway in Colombia.
|
Attributable gold production
(000oz)
|
|
Average number of
employees
|
|
||
|
Operations
|
|||||
|
1.
Argentina
|
|||||
|
Cerro Vanguardia 92.5%
|
283
|
|
2,001
|
|
|
|
2.
Brazil
|
|||||
|
AGA Mineração
|
424
|
|
4,932
|
|
|
|
Serra Grande
|
133
|
|
1,578
|
|
|
|
3.
Colombia – exploration programme
|
|||||
103
Americas - Key Statistics
(1)
|
Unit
|
2017
|
|
2016
|
|
2015
|
|
||||
|
Operation
|
||||||||||
|
Tonnes treated/milled
|
Mt
|
7.5
|
|
7.0
|
|
7.0
|
|
|||
|
Pay limit
|
oz/t
|
0.104
|
|
0.100
|
|
0.098
|
|
|||
|
g/t
|
3.576
|
|
3.421
|
|
3.351
|
|
||||
|
Recovered grade
|
oz/t
|
0.102
|
|
0.106
|
|
0.108
|
|
|||
|
g/t
|
3.49
|
|
3.64
|
|
3.71
|
|
||||
|
Gold production (Attributable)
|
000oz
|
840
|
|
820
|
|
831
|
|
|||
|
Silver (attributable)
|
Moz
|
5.8
|
|
4.9
|
|
4.4
|
|
|||
|
Cost of sales
|
$m
|
851
|
|
752
|
|
719
|
|
|||
|
Total cash costs
(2)
|
$/oz
|
638
|
|
578
|
|
576
|
|
|||
|
All-in sustaining costs
(2)(3)
|
$/oz
|
943
|
|
875
|
|
792
|
|
|||
|
Capital expenditure
(4)
|
$m
|
234
|
|
225
|
|
196
|
|
|||
|
Safety
|
||||||||||
|
Number of fatalities
|
0
|
|
1
|
|
1
|
|
||||
|
AIFR
|
Per million hours worked
|
3.29
|
|
3.96
|
|
5.61
|
|
|||
|
People
|
||||||||||
|
Average no of employees: Total
|
8,511
|
|
8,126
|
|
7,679
|
|
||||
|
Permanent employees
|
5,888
|
|
5,653
|
|
5,492
|
|
||||
|
Contractors
|
2,623
|
|
2,473
|
|
2,187
|
|
||||
|
(1)
|
Key statistics are for the continuing operations in the region and exclude CC&V which was sold effective 3 August 2015.
|
|
(2)
|
Total cash costs and all-in sustaining costs are non-GAAP measures. For further information on these non-GAAP measures, see “Item 5A: Operating Results”.
|
|
(3)
|
Excludes stockpile impairments.
|
|
(4)
|
100 percent, (not attributable) and includes Colombia.
|
Production and costs
Production from the Americas region increased by two percent to 840,000oz in 2017, reflecting higher output from the Brazilian and Argentinian operations driven by operational improvements and an increase in tonnes treated.
In Brazil, at AGA Mineração, production increased four percent year-on-year, boosted by Córrego do Sítio’s strong performance, a result of improved geological modelling that assisted the recovery from the geotechnical challenges faced at the start of the year at the Córrego do Sitio complex. After a challenging start to 2017, various initiatives were implemented at the Cuiabá complex to improve future performance. These initiatives included the appointment of a new management team and adoption of an integrated planning system. The operation saw a seven percent increase year-on-year in ore treated, an improvement which we believe to be sustainable. The challenges at Cuiabá were due to delays in development of infrastructure that hindered access to high-grade areas.
At Serra Grande, the production increase came despite lower feed grades and was driven by higher tonnes treated, supported by improved crushing and milling efficiencies and more efficient leaching, following implementation of the carbon-in-leach project. These efficiencies were a result of Operational Excellence initiatives which led to improved levels of ore mined, offsetting lower open-pit production.
In Argentina, at Cerro Vanguardia, production increased to 283,000oz compared to the previous year, the highest level of production in 18 years. This achievement was driven mainly by the increase in tonnes treated at the plant together with operational and metallurgical improvements. In addition, the grades were higher year-on-year, a result of variability in the mining model.
Despite the continued focus on cost management and production improvements, total cash costs for the Americas region were higher in 2017, due mainly to inflationary pressures, particularly salary adjustments, and also the stronger Brazilian real compared with the previous year. In Brazil, costs were impacted by the lower grade feed, inflation and the nine percent appreciation in the local currency versus the US dollar. However, the cash cost increase in the region was partially offset by the seven percent drop in total cash costs at Cerro Vanguardia, mainly due to record production, higher by-product contribution and favourable stockpile movements.
At Cerro Vanguardia, various cost savings initiatives focused on improved efficiencies and production from the underground mine expansion, increasing mill throughput and silver recovery, and capital savings, among others. These cost saving initiatives are expected to continue to offset the combination of higher mining costs and currency impacts. Costs were also assisted by improved fleet availability and cost management initiatives implemented during the year that resulted in price reductions being negotiated for key consumables such as fuel, ammonium nitrate, cyanide and crushing media. These positive factors were offset by inflationary
104
pressures, particularly salary increases in Argentina that were agreed in October, as well as the elimination of the Patagonia ports rebates at the end of 2016, ending a 10 percent reimbursement from which Cerro Vanguardia had benefitted previously.
Capital expenditure
Regional capital expenditure increased by four percent, mainly a result of the high level of sustaining capital investment in Brazil, owing to inflation and the stronger local currency. Most of the capital expenditure in Brazil was on Ore Reserve Development to improve mine flexibility and access to ore stopes. At Cerro Vanguardia, capital expenditure was lower compared to 2016, owing mainly to a depreciating Argentinian peso against the US dollar. A more aggressive capital management approach was implemented across the region with all discretionary capital items being under strict review.
Safety
No fatalities were recorded during 2017. The AIFR improved by 17 percent compared to 2016.
Ore Reserve
At the end of 2017, the total attributable Ore Reserve for the Americas Region, was 5.2 million ounces (2016: 3.1 million ounces). This is approximately ten percent of the group’s total Ore Reserve.
Growth and improvement
Application of the Operational Excellence principles to exploration, Ore Reserve development, mining and metallurgy is expected to yield improvements in productivity, with the region benefitting from ongoing asset optimisation work.
At AGA Mineração’s Cuiabá complex, a fourth working shift is to be introduced during 2018, which will assist in driving productivity gains. Plans are also underway to increase the annual tonnage of ore treated and to expand mill/plant throughput to 1.9Mt, followed by a further ramp-up towards 2.1Mtpa. An increased Ore Reserve conversion programme is expected to improve the mine plan’s reliability.
At Córrego do Sítio, work is underway to further improve development productivity levels. Conversion rates of Mineral Resource to Ore Reserve are increasing and work is underway to improve recovery rates. Drilling campaigns continue to confirm the Ore Reserve that will extend the life of mine, including work on a new open-pit (Córrego do Sítio III) and the new underground mines at Mina II and São Bento Deep.
At Serra Grande, the Ingá ore body began production during the year, while the potential of the ore bodies at Mangaba and Corpo IV remain under evaluation. The mine delivered an eight percent increase in ore treated year-on-year, a result of the plant’s CIL leaching conversion and continuous efficiency improvement initiatives. The Palmeiras South negotiations, aimed at reaching agreement on possible accelerated exploration to confirm the area’s potential, are at an advanced stage.
At Cerro Vanguardia, the mine plan was executed on schedule, following the initiative launched in 2015 to accelerate open-pit and underground operations to optimise economic performance over the remaining life of mine, and to potentially increase production. New projects and alternatives to extend life of mine will be assessed during 2018.
In Colombia, the greenfields exploration programmes were realigned and focused on minimising cost while maintaining future optionality. Force majeure was declared at the La Colosa project, stopping all activities, following the outcome of the plebiscite held on 26 March 2017 in the Colombian municipality of Cajamarca, which hosts the La Colosa exploration site. The grant of force majeure is for one year and will expire in June 2018, after which such declaration will need to be extended. At Quebradona, following completion of a conceptual study in 2016, the focus in 2017 as the first phase progressed was on evaluating the alternatives to be considered during the prefeasibility phase, which is expected to be concluded in 2018. The alternatives included mining methods, mine access and project layout.
The Gramalote project, a joint venture between AngloGold Ashanti (51 percent and manager) and B2Gold (49 percent), declared its maiden Ore Reserve of 63.7Mt @ 0.86 g/t gold, at an attributable contained metal content of 1.8Moz. Gramalote represents a long-term option for AngloGold Ashanti, and all avenues to realise value from this important asset remain open. Work will continue to optimise all aspects of the project during its feasibility phase, which is currently under way. The enhanced prefeasibility study was completed in September 2017. AngloGold Ashanti is currently in discussions with its joint venture partner, B2Gold on how to further progress the project.
The project lies on the eastern flank of the Cordillera Central, near the towns of Providencia and San Jose del Nus in the municipality of San Roque, in the northwest of the Antioquia Department. It is approximately 230km north-west of Bogota and 124km north-east of Medellin.
105
EXPLORATION REVIEW
Our exploration is focused on creating value by providing long-term optionality and improving the portfolio quality. The objectives are met by:
|
•
|
Greenfields exploration
, which aims to discover large, high-value Mineral Resource that will eventually lead to the development of new gold mines. Our greenfields exploration team was recognised by a leading industry research group, in 2015 as the industry’s most successful in Mineral Resource discovery. The team has a proven track record that includes the discovery of world-class ore bodies at La Colosa, Gramalote, Tropicana and Nuevo Chaquiro. These discoveries are attributed to our committed and professional team of geoscientists working on a portfolio of highly prospective and rigorously prioritised greenfields ground holdings.
|
|
•
|
Brownfields exploration
, which focuses on delivering value through incremental additions to our Ore Reserve in existing mines as well as new discoveries in defined areas around existing operations. Brownfields exploration actively drives the creation of value by growing our Mineral Resource and Ore Reserve, our major assets. The brownfields exploration programme is based on innovative geological modelling and mine planning and continual optimisation of our asset portfolio.
|
Greenfields exploration
Our greenfields holdings/tenements consist of over 9,000km
2
of highly-prospective ground in four countries: Australia, Colombia, Brazil and the United States and include ground positions in Argentina and Tanzania. Actual expenditure on greenfield exploration activities was $30.7m in 2017 and this included over 64km of diamond, reverse circulation and aircore drilling.
In
Australia
, in the Laverton district, exploration commenced as part of the Butcher Well and Lake Carey farm-in agreement with Saracen Mineral Holdings. The agreement gives AngloGold Ashanti earn-in rights to 340km2 of tenements on and along the western margin of Lake Carey in the Laverton district of Western Australia, including those hosting the historically-mined Butcher Well gold deposits. AngloGold Ashanti can earn up to 70 percent of the joint venture by spending A$15m within 48 months from start date to earn 51 percent and a further A$10m within 24 months thereafter to earn 70 percent. Work completed as part of the agreement in 2017 included 26.6km of reverse circulation and diamond drilling, 20.4km of aircore drilling and 3,897 ground gravity stations. The work focused on Butcher Well, where drilling returned several very encouraging intercepts. In addition, aircore drilling at the nearby Mt Minnie project returned several encouraging results over 3km of strike extent and follow up reverse circulation and diamond drilling confirmed these results.
In
Brazil
, exploration focused on the Tromai joint venture (AngloGold Ashanti earning into 70 percent equity from Trek Mining). The work focused on acquisition of regional airborne magnetic, radiometric and electromagnetic data in addition to reverse circulation and diamond drilling of known structures associated with artisanal mining and soil geochemistry. A total of 26,549-line km of magnetic/radiometric data were collected along with 4,560km of electromagnetic data. In addition, 4.7km of diamond drilling and 5.7km of reverse circualtion drilling were completed. Moderate results were received and further work is planned to test targets generated from airborne geophysical techniques.
In the
United States
, a reconnaissance rotosonic drill programme was completed at the Celina project in Minnesota (100 percent AngloGold Ashanti) with 29 holes drilled for 1,034m. A regional magnetic airborne survey was also completed over a total of 50,697km. In addition, we successfully bid for 238 additional mining claims covering 382km2 in Minnesota In Nevada, AngloGold Ashanti entered into an option agreement with Renaissance Gold for the Silicon Project whereby AngloGold Ashanti will make a series of payments over a three-year period to acquire 100 percent of the project area. Exploration activities conducted at Silicon included geological and spectral mapping, along with surface geochemical sampling in preparation for diamond drill testing of the low-sulphidation vein target in 2018.
In
Colombia
, at Nuevo Guintar (100 percent AngloGold Ashanti), activities focused on reaching a decision point. Soil sampling, ground magnetic and induced polarisation (IP) programmes were completed along with a 1,478m diamond drilling programme. The principle target was a 500m by 300m gold and multi-element soil geochemistry anomaly with an epithermal signature. No significant results were received from the diamond drilling.
In Tanzania and Argentina, early stage grassroots evaluation and reconnaissance programmes progressed.
Brownfields exploration
Brownfields exploration was carried out in 10 countries, in and around AngloGold Ashanti operations. A total of 594,794m of diamond and reverse circulation drilling was completed during the year.
South Africa
: Exploration in the South Africa region continued with a total of four holes drilled at Mponeng’s Western Ultra Deep Levels (WUDLs). All these holes target the Ventersdorp Contact Reef.
Surface drill holes UD60 and UD58A were completed and the sites rehabilitated. Piloting of surface drill hole UD63A and UD61 was completed. Site establishment is underway and the foundations have been completed.
106
Argentina
: At Cerro Vanguardia, drilling achieved 15,620m and focused firstly on testing ground magnetics anomalies around Laura, Sonia and extensions of Vanguardia 2 veins, and secondly on defining lateral and down-dip extensions of mineralisation in poorly-drilled areas of Ariadna, El Palo, Gesica, Patricia, Patty, Teresa, Vanguardia E and 3W, Verónica, Goyo, Portero, Zorro veins. The Claudia joint venture earn-in was concluded ahead of its first-year anniversary. A ground geophysics programme designed to search for shallow blind structures is ongoing and will continue in the first half of 2018.
Brazil
: In the Iron Quadrangle, at Cuiaba, exploration activities focused on underground drilling for ore body extension, Mineral Resource conversion and testing of targets. Deep drilling moved from L28-30 to L24 to reach the northern edge of the Cuiaba structure.
Regional mapping and sampling continued around Cuiaba at the Pompeu target, with 45 percent of the soil sampling programme executed and 582 samples collected. The programme, which is aimed at developing drill targets, is expected to be completed in the first half of 2018.
At Lamego, drilling was done at Cabeça de Pedra and at Carruagem. The drilling was predominantly focused on the Carraguem SW orebody where drilling is being undertaken from a hangingwall drive. The results are promising, especially on the normal limb where the Carraguem ore body shows continuity along with Carraguem SW. Mineral Resource modelling is in progress.
Exploration drilling at Córrego do Sítio (CdS) achieved 53,987m, with 78 percent (41,903m) of the drilling being done underground in the CdSI and CdSII mines. The purpose of these drilling programmes was for Mineral Resource conversion to support the production plan. Surface exploration drilling (12,084m) had three distinct purposes, targeting Mineral Resource addition (3,463m), Mineral Resource conversion (8,515m) and new targets (106m).
A total of 38,500m was drilled at Serra Grande. Exploration focused on extension and infill of known ore bodies, this included drilling at Orebody IV, Structure III, Inga, Pequizao, Palmeiras and Mangaba. Positive results were achieved from the Mangaba target that increased the ore body’s grade confidence, while continuity of the inferior zone was confirmed at Flamboyant. Significant intersections were returned from the down-plunge extension of Orebody VI, confirming both grade and thickness, as well as from structures below Orebody VI. At Structure III and on Orebody A, significant intersections were obtained confirming that theory that layers were repeated and the ore zones stacked as well as down-plunge projections.
Colombia
: A total of 3,724m were drilled at Gramalote before the decision was made to stop drilling in the first half of the year. Field-based exploration focused on rock chip sampling and soil sampling at the San Javier, Santa Barbara, and Encarnaciones targets to continue delineation of the quartz vein systems identified in those areas.
The La Colosa project was formally placed on care and maintenance in the first quarter and consequently all field activities came to an end in April 2017. As part of the site investigation, geotechnical and hydrology drilling programmes, 946m were drilled.
A total of 2,132m was drilled at Quebradona. In June, the decision was made halt the drilling programme owing to budget constraints. During the second half of the year, work focused on supporting the prefeasibility study with field activities, geological and geotechnical logging.
Tanzania
: Drilling programmes focused on both surface and underground operations. Surface drilling projects included Nyankanga Block 5 (Cut 9), Matandani BST, Geita Hill East, Star & Comet Cut 2 NW Extension, Geita Hill-Lone Cone Blocks 1 & 2 (underground potential), Nyankanga 3D Seismic Targets 1 & 5 and reconnaissance drilling at Selous Satellite target. Underground drilling programmes were carried out at Nyankanga Block 5 and Star & Comet Cuts 2 & 3 projects. A total of 347 drill holes (48,561m) were completed.
Surface geological mapping was carried out within the Nyamulilima Block on areas around Selous-Mabe-Xanadu, Roberts South, Star & Comet Cut 2 NW & South as well as on areas around Ridge 8 and in the Star & Comet Cut 3 - Ridge 8 Gap. The focus of the mapping exercise was to establish the surface geology of the prospective areas of Nyamulilima Block and define the potential targets for future exploration. Surface geological mapping was also carried out at Kalondwa Hill, Fikiri- Jumanne-Samena through to Prospect 30 targets, to support target generation and prioritisation of future exploration works.
Guinea
: At Siguiri, exploration activities included reconnaissance drilling on the John Deere, Kolenda South and Silakoro NE targets, as well as Mineral Resource definition drilling at Kami, Tubani, Silakoro, Seguelen, Sokunu and Foulata. A total of 48,198m was drilled during the year.
Preliminary interpretation of the airborne magnetic and a radiometric geophysical survey over portions of Block 1 and Block 2 and the Saraya West licence were completed. Seven targets were identified across the Seguelen West area, as well as an area northeast of the Foulata deposit and potential extensions of the Saraya mineralisation within the Saraya West licence.
Target generation and evaluation of the Corridor Blocks and tailings storage facilities exploration licences was carried out. This was followed by field mapping. Soil sampling programmes to cover an untested area in the northwest of Block 1 and on Saraya West PL were completed.
107
Ghana
: No exploration was conducted at Obuasi. At Iduapriem, 7,214m of drilling was completed at the Block 1W/Nueng. Drilling targeted a fold model which predicted the conglomerate reef package near surface. It intersected the conglomerate reef package at 153m to 168m and the later part of the drilling campaign continued to confirm a single, truncated A reef.
At Block 4S, a total of 1,708m was drilled to upgrade material to Indicated Mineral Resource, increasing confidence in the structural model and modelling of reef displacement along the main fault.
A mapping campaign at Block 5 Extension informed the drill plan to intersect the mapped reef packages perpendicularly. A total of 2,412m was drilled with the aim of resolving the full extent of the reef packages along strike and the influence of faults and intrusives on the conglomerates. Recent mapping at the northern extent of the pit reveals continuation of the reefs with a southeast dip direction as opposed to the eastern dip direction that exists within the main pit.
Democratic Republic of the Congo
: Drilling (22,364m) at Kibali focused around the Sessenge, Kombokolo, Aerodrome-Pamao, Pamao-Makoke-Megi, Rhino-Agbarabo and KZD areas. Regional exploration covered the Kalimva-Ikamva, Belengo, Aindi Watsa-Dilolo- Zambula, Ndala North and South KZ areas.
At the KCD pit, the results were received for the 1,491m deep diamond drilling to test the down-plunge projection of the Banded Ironstone Formation. Results confirmed the down-plunge extension of the 3000 lode, the 5000 lode and a new lode. A follow up programme from underground will test this further.
At Kalimva, the second phase (26 holes totalling 3,072m) of reverse circulation drilling was completed to test high-grade shoots within the 1.6km long shear system. Logging and assay results received to date support a model with five stacked, plunging shoots of >2g/t within the 1.6km strike. At Ikamva, a fence of seven reverse circulation holes were drilled to follow up on the pit optimisation done in the western part of Ikamva. The observed mineralised zone is thinner and deeper than expected and some of the holes ended in mineralisation. Another phase of close spaced drilling is planned.
Mali
: At Sadiola, a total of 14,260m of drilling was completed. Reverse circulation drilling for oxide potential was completed at Sadiola South, Tambali West, Dogofile South, Timbabougouni, Voyager West, Tabakoto West and Lakanfla. Drilling focused on the new oxide targets identified at a targeting workshop held in June with participants from SEMOS, IAMGOLD and AngloGold Ashanti.
Australia
: A total of 88,871m of exploration drilling was done at Sunrise Dam targeting the Vogue Deeps, the western area of Vogue 1800, 1600 and 1400 Blocks, Cosmo, northern and down dip extensions to Cosmo and Cosmo East, Dolly Porphyry, Carey Shear, Elle and Astro North orebodies.
The drilling results from Vogue continue to be encouraging with significant intercepts returned from all panels. Assay results from definition drilling in the southern panel of Cosmo and Cosmo East down dip were returned with one significant intercept returned from Cosmo East down dip, and three significant intercepts from an isolated area between the Dolly and Cosmo ore bodies. Further drilling from the southern panel will be completed during 2018.
Drilling of the Carey Shear continued from a drill platform in the COS1630. One significant intercept was returned for Carey Shear with two further significant intercepts returned from further up hole. Drilling of this target will continue in the first half in 2018.
Mineral Resource definition drilling of the Elle target continued and Mineral Resource creation drilling to the south commenced. Seven significant intercepts were returned for Elle, and nine significant intercepts related to the Midway shears in this area.
Blue sky tangible drilling of Astro North began and assay results are pending.
At Tropicana, a total of 93,428m of drilling was completed. During the first half of 2017, drilling targeted Sanpan, Zebra, New Zebra, Hat-Trick, Springbok, Southern Mining Lease (ML) conceptual targets, Angel Eyes, Beetlejuice, Crouching Tiger, Kamikaze and Little Wing targets.
Resource development drilling continued to complete extensional drilling at Boston Shaker to evaluate the underground potential down dip of the Long Island pit design. Following the scoping study which is currently underway, a prefeasibility study on underground mining will begin in 2018, in conjunction with infill drilling programmes.
108
|
4C.
|
ORGANISATIONAL STRUCTURE
|
GROUP STRUCTURE
AngloGold Ashanti’s operations are divided into the following regions:
|
•
|
South Africa – operations in Vaal River, West Wits and surface operations;
|
|
•
|
Continental Africa – operations in Ghana, Guinea and Tanzania and joint venture operations in the DRC and Mali;
|
|
•
|
Australasia – operations in Australia; and
|
|
•
|
Americas – operations in Argentina and Brazil.
|
The above four regions also correspond to AngloGold Ashanti’s four business segments.
Day-to-day management of the group is entrusted to AngloGold Ashanti’s executive management team, chaired by the Chief Executive Officer. See “Item 6: Directors, Senior Management and Employees”.
Support is provided to the executive management team in managing AngloGold Ashanti’s corporate activities at both the central and local levels.
SUBSIDIARIES
AngloGold Ashanti Limited has investments in principal subsidiaries and joint venture interests, see “Item 19: Exhibits – Exhibit 19.8 Principal subsidiaries and operating entities” for details.
109
|
4D.
|
PROPERTY, PLANTS AND EQUIPMENT
|
For more information about AngloGold Ashanti’s mines, including as to the company’s mining rights and licences refer “Item 4B: Business Overview—The regulatory environment enabling AngloGold Ashanti to mine”.
AngloGold Ashanti’s operating mines are all accessible by road.
SOUTH AFRICA
Description
The South Africa operations comprise a number of deep level underground mines as well as surface operation that are processing low grade stockpiles and re-treating Tailings Storage Facilities. For the year ended 31 December 2017, it was comprised of Vaal River operations (Moab Khotsong and Kopanang), surface operations and West Wits operations (Mponeng). The Vaal River operations were sold subsequent to year end.
Operations in South Africa are powered by electricity from Eskom Holdings Limited which supplies 95 percent of the electricity used in South Africa.
Geology
The Witwatersrand Basin comprises a six-kilometre thick sequence of inter-bedded argillaceous and arenaceous sediments that extend laterally for some 300 kilometres north-east/south-west and 100 kilometres north-west/south-east on the Kaapvaal Craton. The upper portion of the basin, which contains the orebodies, crops out at its northern extent near Johannesburg. Further west, south and east the basin is overlain by up to four kilometres of Archaean, Proterozoic and Mesozoic volcanic and sedimentary rocks. The Witwatersrand Basin is late Archaean in age and is considered to be in the order of 2.7 to 2.8 billion years old.
Gold occurs in laterally extensive quartz pebble conglomerate horizons or reefs, generally less than two metres thick, which are widely considered to represent laterally extensive braided fluvial deposits. Separate fan systems were developed at different entry points and these are preserved as distinct goldfields. The most fundamental control to the gold distribution in the Basin remains the sedimentary features, such as facies variations and channel directions. Gold generally occurs in native form often associated with pyrite and carbon, with quartz being the main gangue mineral.
|
•
|
Vaal River operations
|
Description
The Vaal River operations consist of Kopanang, Moab Khotsong as well as the surface operations.
AngloGold Ashanti holds a number of mining rights in the Vaal River operations which have been successfully converted, executed and registered as new order mining rights at the Mineral and Petroleum Resources Titles Office (MPRTO).
Geology
In order of importance, the reefs mined at the Vaal River operations are the Vaal Reef (VR) and the Crystalkop Reef (CR):
|
•
|
The VR contains approximately 98 percent of the Ore Reserve tonnage with mining grades between 5 - 10 g/t and comprises a series of oligomictic conglomerates and quartzite packages developed on successive unconformities. Several distinct facies have been identified, each with its unique gold distribution and grade characteristic.
|
|
•
|
The CR is a thin, small pebble conglomerate with a carbon-rich basal contact, located approximately 270 metres above the VR. It has less than two percent of the estimated Ore Reserve with grades similar to the VR, but is more erratic. The most significant structural features are the north-east striking normal faults which dip to the north-west and south-east, resulting in zones of fault loss.
|
Vaal River – Summary of metallurgical operations
|
West Gold
Plant
(1)
|
|
Noligwa Gold
Plant
(1)
|
|
Mispah Gold
Plant
(1)
|
|
Kopanang Gold
Plant
|
|
||||
|
Gold plants
|
|||||||||||
|
Capacity (000 tonnes/month)
|
180
|
|
260
|
|
140
|
|
315
|
|
|||
|
Uranium plants
|
|||||||||||
|
Capacity (000 tonnes/month)
|
—
|
|
260
|
|
—
|
|
—
|
|
|||
|
(1)
|
Sold effective28 February 2018
|
110
Vaal River - Kopanang
Description
Kopanang is an underground operation located in the Free State province, roughly 170 kilometres southwest of Johannesburg and approximately 10 kilometres southeast of the town of Orkney on a lease area of 35km
2
. The operation, which started in 1984, is west of neighbour Great Noligwa (now part of Moab Khotsong) and bound to the south by the Jersey Fault. Gold is the primary output, with uranium oxide as a by-product from a single underground shaft system to a depth of 2,600 metres.
Kopanang almost exclusively exploits the Vaal Reef, although minor amounts of gold are also extracted from the secondary CR. Given the geologically complex orebody, scattered mining is used.
Vaal River - Moab Khotsong
Description
Moab Khotsong is an underground mine that started operations in 2003 and is AngloGold Ashanti’s newest gold mine in South Africa. It is situated near Orkney, Klerksdorp and Viljoenskroon, about 180 kilometres southwest of Johannesburg. Given the geological complexity of the Vaal Reef, scattered mining is employed. Great Noligwa mine was merged with Moab Khotsong in 2014 and operations are now collectively referred to as Moab Khotsong. Great Noligwa commenced production in 1968.
|
•
|
Surface Operations
|
Surface Operations in South Africa produce gold by processing surface material such as low grade stockpiles and the re-treatment of Tailings Storage Facilities. Surface operations comprise Vaal River Surface, West Wits Surface and Mine Waste Solutions (MWS).
Low grade stockpiles
Description
The Vaal River and West Wits operations extract gold from various low grade stockpiles where there is spare metallurgical capacity. Uranium is produced as a by-product at Vaal River South Uranium Plant. In addition, backfill product is produced and used as support in the underground mining operations. The Hard Rock Surface Sources includes the rail transport infrastructure, the Vaal River and West Wits Laboratories and tailings management facilities.
Tailings Storage Facilities (TSF)
Description
The tailings dams consist of tailings material which originated from the processing of the underground ore from the Vaal River Operations (VR Surface), the West Wits Operations (WW Surface) and Buffels, Hartebeestfontein and Stilfontein Gold Mines (MWS).
The gold mines are deep-level gold mines, which predominantly extract the tabular, conglomeratic VR, Carbon Leader Reef (CLR) and Ventersdorp Contract Reef (VCR). The VR, CLR and VCR have been predominantly mined for gold in the past although the reef also contains uranium oxide. The material contained in the tailings dams is fine in nature. The footprints of the MWS tailings dams and Vaal River Surface Operations tailings dams cover an area of approximately 1,100ha.
MWS is a gold and uranium tailings recovery operation located in the western portion of the Witwatersrand Basin, some 160 kilometres from Johannesburg, approximately eight kilometres from the town of Klerksdorp near Stilfontein in the North West Province. It has been operational since 1964 and was previously owned by First Uranium Corp.
The MWS gold plants have the capacity to treat tailings of 2.26 million tonnes per month. The uranium plant has been decommissioned.
|
•
|
West Wits operations
|
Description
The West Wits operations, Mponeng and TauTona, are situated southwest of Johannesburg, on the border between Gauteng and North West Province. From 1 January 2013 the Savuka mine was incorporated into the TauTona mine to access Savuka’s remaining Ore Reserve via TauTona’s infrastructure and Savuka and TauTona operate as a single mine.
AngloGold Ashanti holds a number of mining rights in the West Wits area which have been successfully converted, executed and registered as new order mining rights at the Mineral and Petroleum Resources Titles Office (MPRTO).
Geology
Two reef horizons are exploited at the West Wits operations, the Ventersdrop Contact Reef (VCR) located at the top of the Central Rand Group and the CLR near the base. The separation between the two reefs increases from east to west from 400 to 900 metres, due to the VCR unconformity. TauTona exploits both reefs, whereas Mponeng only mines the VCR. Faults of greater than 70 metres are rare. The CLR consists of one or more conglomerate units and varies from several centimetres to more than two metres in
111
thickness. Regionally, the VCR dips at approximately 21 degrees but may vary between 5 degrees and 50 degrees, accompanied by changes in thickness of the conglomerate units. Where the conglomerate has the attitude of the regional dip, it tends to be thick, well-developed, up to three metres in thickness, and is accompanied by higher gold accumulations. Where the attitude departs significantly from the regional dip, the reef is at times only a few centimetres in thickness.
West Wits - Summary of metallurgical operations
|
Mponeng Gold Plant
|
|
Savuka Gold Plant
|
|
||
|
Capacity (000 tonnes/month)
|
160
|
|
280
|
|
|
West Wits - Mponeng
Description
Mponeng, in operation since 1986, is located between the towns of Carletonville and Fochville on the border between Gauteng and the North West Province, southwest of Johannesburg. The underground operation, the world’s deepest mine, currently extracts the VCR at depths between 3,160 metres and 3,740 metres BMD* through sequential-grid mining and is currently the deepest mine in the world with development at 3,841 metres BMD. Future mining is planned to deepen the shaft bottom to 4,227m BMD. In the future, the mining of the CLR from Mponeng will steadily increase. The Mponeng lease area is constrained to the east by Sibanye’s Driefontein mine and to the west by Harmony’s Kusasalethu mine. Mponeng comprises a twin-shaft system housing two surface shafts and two sub-shafts. Ore is treated and smelted at the mine’s gold plant. The plant has a monthly capacity of 160,000 tonnes. In 2017, TauTona mine located to the northeast of Mponeng was closed and the infrastructure and residual Mineral Resource and Ore Reserve transferred to Mponeng.
* BMD is 1,828.8m Above Mean Sea Level (AMSL)
CONTINENTAL AFRICA
GHANA - Summary of metallurgical operations
|
Obuasi
|
Iduapriem
|
|||||||
|
Sulphide
Treatment Plant
|
|
Alternate Ore
Treatment Plant
|
|
Iduapriem Plant
|
|
|||
|
Capacity (000 tonnes/month)
|
180
|
|
90
|
|
418
|
|
||
Ghana – Iduapriem
Description
Iduapriem, wholly owned by AngloGold Ashanti since September 2007, comprises the Iduapriem and Teberebie properties on a 105km
2
concession. The mine, which began operations in 1992, is situated in the western region of Ghana, some 85 kilometres north of the coastal city of Takoradi and eight kilometres southwest of Tarkwa.
Iduapriem is an open-pit mine and its processing facilities include a Carbon-in-pulp (CIP) plant.
Geology
The Iduapriem and Teberebie properties are located along the southern end of the Tarkwa basin. The mineralisation is contained in the Banket Series of quartz pebble conglomerates, breccia conglomerates and metasediments within the Tarkwaian System of Proterozoic age. The outcropping Banket Series of rocks in the mine area form prominent, arcuate ridges extending southwards from Tarkwa, westwards through Iduapriem and northwards towards Teberebie. The gold is hosted within the conglomerates.
Ghana - Obuasi
Description
Obuasi, wholly owned by AngloGold Ashanti since 2004 is currently in a care and maintenance phase and finalising a feasibility study to restart operations, it is located in the Ashanti Region of Ghana, some 320 kilometres north-west of the capital Accra and approximately 60 kilometres south of Kumasi. Mining operations are primarily underground, to a depth of 1.5 kilometres. Obuasi originally opened in 1897.
Power is supplied to the mines by the Volta River Authority and the transmission is done by the GridCo Company.
112
Geology
The gold deposits at Obuasi are part of a prominent gold belt of Proterozoic (Birimian) volcano-sedimentary and igneous formations which extend for a distance of approximately 300 kilometres in a north-east/south-west trend in south‑western Ghana. Obuasi mineralisation is shear-zone related and there are three main structural trends hosting gold mineralisation: the Obuasi trend, the Gyabunsu trend and the Binsere trend.
Two main ore types are mined:
|
•
|
quartz veins which consist mainly of quartz with free gold in association with lesser amounts of various metal sulphides such as iron, zinc, lead and copper. The gold particles are generally coarse-grained and occasionally visible to the naked eye. This ore type is generally non-refractory; and
|
|
•
|
sulphide ore which is characterised by the inclusion of gold in the crystal structure of a sulphide material. The gold in these ores is fine-grained and often locked in arsenopyrite. Higher gold grades tend to be associated with finer grained arsenopyrite crystals. Other prominent minerals include quartz, chlorite and sericite. Sulphide ore is generally refractory.
|
GUINEA
Description
Siguiri, a multiple open-pit gold mine which opened in 1997, is AngloGold Ashanti’s sole operation in the Republic of Guinea. It is located in the district of Siguiri. The mine is located approximately 520 kilometres north-northeast of Conakry, 25 kilometres northwest of the town of Siguiri and 190 kilometres southeast of the Malian capital Bamako, near the Mali boarder. Conventional mining activities are performed by contractors in multiple open pits using conventional techniques. On surface, Siguiri’s gold processing plant treats about 981,000 tonnes per month. Power to the mine is self-generated.
AngloGold Ashanti holds an 85 percent interest in Siguiri and the balance of 15 percent is held by the government of Guinea.
Geology
This concession is dominated by Proterozoic Birimian rocks which consist of turbidite facies sedimentary sequences. The two main types of gold deposits which occur in the Siguiri basin and are mined are:
|
•
|
laterite mineralisation (CAP) which occurs as surficial aprons of colluvium or as palaeo‑channels of alluvial lateritic gravel adjacent to, and immediately above in-situ deposits; and
|
|
•
|
in-situ quartz-vein related mineralisation hosted in meta-sediments with the better mineralisation associated with vein stockworks that occurs preferentially in the coarser, brittle siltstones and sandstones.
|
The mineralised rocks have been deeply weathered to below 100 metres in places to form saprolite mineralisation (oxide). With the percentage of available oxide ore decreasing, a feasibility study to consider the exploitation of the fresh rock material was completed in December 2015. The project will upgrade the current plant and enable processing of a combination of oxides and fresh rock material. The plant throughput will remain at 12Mtpa with a flexible design allowing up to 6Mtpa fresh rock to be processed. Targeted fresh rock pits include Kami, Bidini, Tubani, Sintroko, Seguelen and Sokuno. The feasibility study has been approved by AngloGold Ashanti, AGA has concluded successful negotiations with the Government of Guinea of the Convention de Base and access to the required areas has been received. The project is currently under construction and expected to commission towards the end of 2018.
MALI
AngloGold Ashanti has interests in three operations in Mali, namely, Sadiola, Yatela and Morila. It manages two of these operations, Sadiola and Yatela.
Mali - Summary of metallurgical operations
|
Morila
|
Sadiola
|
||
|
Capacity (000 tonnes/annum)
|
3.7Mt
|
4.9Mt
|
|
Mali – Morila
Description
AngloGold Ashanti has an effective 40 percent stake in Morila, as does Randgold Resources Limited (which manages the mine). The state of Mali owns the remaining 20 percent.
The Morila mine has operated since 2001 and is situated 280 kilometres southeast of Bamako, the capital of Mali. When mining concluded in 2009 with the depletion of the orebody, operations at Morila transitioned to stockpile and tailings retreatment. The
113
plant incorporates a conventional CIL process with an upfront gravity section to extract the free gold. Power is supplied by a subcontractor.
Geology
The Morila deposit is hosted in a flat lying fold structure which rises sharply to surface in the south and west. The deposit occurs within a sequence Birimian metal-arkoses of amphibolite metamorphic grade. Mineralisation is characterised by silica-feldspar alteration and sulphide mineralisation consists of arsenopyrite, pyrrhotite, pyrite and chalcopyrite.
Mali - Sadiola
Description
The Sadiola mine is situated in western Mali, 77 kilometres to the south of the regional capital of Kayes and about 440 kilometres north-west of the capital city of Bamako. The mine is a joint venture between AngloGold Ashanti (41 percent) and IAMGOLD (41 percent) and the government of Mali (18 percent). The Sadiola gold deposit has been mined by the Société d’Exploitation des Mines d’Or de Sadiola S.A. (SEMOS) since 1996. Mining reduced considerably to adapt to the 2014 gold price decrease but continued predominantly in various satellite pits. On-site surface infrastructure includes a CIP gold plant where the ore is eluted and smelted. Power to the Sadiola mine is self-generated.
From 1996 until 2010, oxide and transitional ore from the Sadiola Hill pit was the primary ore source for the mine while being increasingly supplemented from the outlying satellite pits during the latter years. From 2011 when the Sadiola Main pit was mined out, the satellite pits became the dominant source of oxide and transitional ore. A project is currently under consideration to mine the underlying sulphide ore and upgrade the processing plant to treat the hard sulphide ore. The Company is evaluating the possibility of supplying power to the project through the grid and is negotiating fiscal provisions with the government of Mali.
Geology
The Sadiola deposit occurs within an inlier of greenschist facies metamorphosed Birimian rocks known as the Kenieba Window. The specific rocks which host the mineralisation are marbles and greywackes which have been intensely weathered to a maximum depth of 200 metres. As a result of an east-west regional compression event, deformation occurs along a north-south striking marble-greywacke contact, increasing the porosity of this zone. North-east striking structures which intersect the north-south contact have introduced mineralisation, mainly with the marble where the porosity was greatest. The Sadiola Hill deposit generally consists of two zones, an upper oxidised cap and an underlying sulphide zone.
Mali – Yatela
Description
Yatela, operational since 2001, is 80 percent owned by the Sadiola Exploration Company Limited, a joint venture between AngloGold Ashanti and IAMGOLD, giving each a 40 percent stake in Yatela. The balance of 20 percent is owned by the state of Mali.
The Yatela mine, which was a heap leach operation, is situated in western Mali, some 25 kilometres north of Sadiola and approximately 50 kilometres south-southwest of the regional capital Kayes. Ore extraction ceased in September 2013 and processing of the stockpiles and heap leach pads ended in the fourth quarter of 2016. The main activity at Yatela is the implementation of the closure plan in order to relinquish the property. Power to the Yatela operation is self-generated.
Geology
Yatela mineralisation occurs as a keel-shaped body in Birimian metacarbonates. The ‘keel’ is centered on a fault which was the feeder for the original mesothermal mineralisation, with an associated weakly mineralised diorite intrusion. Mineralisation occurs as a layer along the sides and in the bottom of the ‘keel’. The ore dips almost vertically on the west limb and more gently towards the west on the east limb, with tight closure to the south.
TANZANIA
Tanzania - Geita
Description
The Geita gold mine is located in the Lake Victoria goldfields of the Mwanza region of Tanzania, about 120 kilometres west of Mwanza and four kilometres away from the town of Geita. It has been in operation since 1996.
The Geita gold mine is a multiple open pit operation with underground potential and is currently serviced by a 5.1 million tonnes per annum CIL processing plant. Power to the mine is self-generated. In 2015, underground mining commenced at Geita with the development of declines and the opening up of stopes below the Star and Comet pit, this was joined in 2017 by the Nyankanga underground. The mine is currently evaluating additional underground options to increase production and extend the mine’s life.
Geology
Geita is a multi- open pit operation with the dominant ore sources being from the Nyankanga and Geita Hill pits. Historically, other pits such as Star and Comet, Matandani and Kukuluma have also contributed to the ore feed. The terrain is Archaean in age and generally characterised by Greenschist metamorphism, although amphibolitic metamorphism occurs in places. Ore zones are usually
114
associated with Banded Iron Formation (BIF) or other iron rich rocks and typically when they are in contact with intrusive rocks such as diorites. These contacts have been deformed and act as fluid pathways for the mineralising fluids. Gold mineralisation is associated with alteration that includes sulphides such as pyrite and arsenopyrite, whilst other minerals such as hematite, magnetite, quartz, calcite, dolomite, biotite and chlorite also occur.
DEMOCRATIC REPUBLIC OF THE CONGO
Kibali
Description
The Kibali Gold Mine is a Joint venture between AngloGold Ashanti (45 percent), Randgold Resources Limited (45 percent) with Société Miniere de Kilo-Moto SA UNISARL (SOKIMO), a state-owned gold company owning the balance. Randgold Resources is the operator.
Kibali is located in the north-eastern part of the DRC near the international borders with Uganda and Sudan. The mine is located adjacent to the village of Doko, which is located in the west of the project area. Kibali is approximately 210 kilometres by road from Arua, on the Ugandan border and immediately north of the district capital of Watsa. The operations area falls within the administrative district of Haut Uélé in Orientale Province. Power to the mine is self-generated. Gold production began in the fourth quarter of 2013 from open pit operations and underground mining commenced in 2014. It has a processing operation capable of producing an average of 600koz of gold per annum by treating 7.2Mtpa throughput. The processing plant has a capability of processing both oxide and sulphide material.
The underground mine has both a ramp and shaft system, with the shaft reaching a depth of 751.2m and hoisting its first ore in 2017.
Geology
The Kibali Gold Mine is located within the Moto Greenstone Belt, which consists of Archean Kibalian volcano sedimentary rocks and ironstone-chert horizons that have been metamorphosed to greenschist facies.
The combined Karagba, Chauffeur and Durba (KCD) deposit is host to the majority of the currently defined Mineral Resource and Ore Reserve, as well as the current open pit and underground mining operations. KCD is hosted within a mineralised corridor that also hosts the Sessenge, Gorumbwa and Pakaka deposits and a number of exploration prospects.
The known deposits of the Kibali project are hosted along a reactivated thrust plane that creates plunging lodes of mineralisation as exemplified by the KCD deposit. The majority of gold mineralisation identified to date is disseminated style, hosted within a sequence of coarse volcaniclastic and sedimentary rocks. The mineralisation is generally stratigraphically bound and associated with carbonate-silica-albite alteration with minor sulphide.
AUSTRALASIA
AUSTRALIA
Description
Australia comprises two operational units, namely Tropicana and Sunrise Dam. They are both located in Western Australia.
Australia - Summary of metallurgical operations
|
Sunrise Dam
|
Tropicana
|
||
|
Nameplate capacity (000 tonnes/annum)
|
3.7Mt
|
4.9Mt
|
|
Australia - Sunrise Dam
Description
Sunrise Dam, which is wholly-owned, is located 220 kilometres northeast of Kalgoorlie and 55 kilometres south of Laverton in Western Australia. Underground mining, which is conducted by a contract mining company, is the primary source of ore, with supplementary mill feed provided by stockpiles. Ore is treated via conventional gravity float, fine grind and carbon-in-leach (CIL) processing plant, which is owner-managed.
Open pit production began in 1997 and has now been completed at a final depth of 500m below surface and mining of the Crown Pillar at the base of the 490m deep pit was completed in early 2014. Underground mining commenced in 2003 with a number of different mining methods being applied, depending on the style of mineralisation and grade of the geological domain.
115
Power at Sunrise Dam is self-generated and the mine uses natural gas supplied via an APA Operations (Pty) Limited pipeline.
Geology
Gold ore at Sunrise Dam is structurally and lithologically controlled within gently dipping high strain shear zones and steeply dipping brittle-ductile low strain shear zones. Host rocks include andesitic volcanic rocks, volcanogenic sediments and magnetic shales.
Australia - Tropicana
Description
Tropicana, a joint venture between AngloGold Ashanti (70 percent and manager) and Independence Group NL (30 percent), is located 200 kilometres east of Sunrise Dam and 330 kilometres east-northeast of Kalgoorlie. First gold was poured ahead of schedule and on budget in September 2013, following development approval in November 2010. The open pit operation features a large scale, modern processing plant which uses conventional carbon-in-leach technology and includes high-pressure grinding rolls for energy-efficient comminution. Mining is carried out by a contract mining company and the plant, is owner-managed.
The mine is a fly-in fly-out operation, with a mine site village and aviation services operated from Perth and Kalgoorlie. A 220 kilometres private road and the public road network provide access for the delivery of supplies to the operation.
The Tropicana JV includes approximately 3,487km
2
of tenure in the prospective Tropicana belt, with active exploration programmes seeking both satellite extensions to the Tropicana Gold Mine and discoveries with standalone potential. Long Island study work has been completed and currently Phase 1 has been approved for execution which will see the down dip extension of the pits mined using a strip mining principle. A concept study and drill program is currently underway on the Boston Shaker down dip extension assessing the potential to exploit this resource via underground mining. It is envisaged that a prefeasibility study will follow in 2018.
Plant
The plant continues to undergo an optimisation process to maximize the value for Tropicana.
Power is supplied to the mine by on site gas and diesel power stations, natural gas is supplied via an APA Operations (Pty) Limited pipeline.
Geology
Gold mineralisation at Tropicana occurs in high metamorphic grade gneissic rocks, which dip gently to the south east. Mineralisation is structurally controlled and occurs within a preferred host unit within the gneissic package. Post mineralisation faulting has separated the once continuous ore zone, with the open pits developed on each of the fault bounded blocks.
THE AMERICAS
ARGENTINA
Argentina - Cerro Vanguardia
Description
AngloGold Ashanti has a 92.5 percent interest in Cerro Vanguardia with Fomicruz owning the remaining 7.5 percent. Located to the northwest of Puerto San Julian in the province of Santa Cruz, Cerro Vanguardia consists of multiple small open pits and underground mines. Shallow underground mining began in 2010 to access high-grade material and accounts for about 30 percent of the mine’s production. The orebodies comprise a series of hydrothermal vein deposits containing gold and large quantities of silver, which is mined as a by-product. Ore is processed at either the metallurgical plant which has a capacity of 3,450 dry tonnes per day and includes a cyanide recovery facility or the heap leach operation which started in 2012 to process the low grade material. Power for the mine is self-generated but operated by an external contractor. The mine has been operated by AngloGold Ashanti since 1998.
Geology
The oldest rocks in this part of Patagonia are metamorphics of the Precambrian-Cambrian age. These are overlain by Permian and Triassic continental clastic rocks which have been faulted into a series of horsts and grabens and are associated with both limited basaltic sills and dykes and with calc-alkaline granite and granodiorite intrusions. Thick andesite flows of Lower Jurassic age occur above these sedimentary units. A large volume of rhyolitic ignimbrites was emplaced during the Middle and Upper Jurassic age over an area of approximately 100,000 square kilometres. These volcanic rocks include the Chon Aike formation ignimbrite units that host the gold bearing veins at Cerro Vanguardia. Post-mineral units include Cretaceous and Tertiary rocks of both marine and continental origin, the Quaternary La Avenida formation, the Patagonia gravel and the overlying La Angelita basalt flows. These flows do not cover the area of the Cerro Vanguardia veins.
Gold and silver mineralisation at Cerro Vanguardia occurs within a vertical range of about 150 metres to 200 metres in a series of narrow, banded quartz veins that occupy structures within the Chon Aike ignimbrites. These veins form a typical structural pattern related to major north-south (Concepcion) and east-west (Vanguardia) shears. Two sets of veins have formed in response to this
116
shearing. One set of veins strikes about N40W and generally dips 65 to 90 degrees to the east; while the other set strikes about N75W and the veins dip 60 degrees to 80 degrees to the south.
The veins are typical of epithermal, low-temperature, adularia-sericite character and consist primarily of quartz in several forms: as massive quartz, banded chalcedonic quartz, and quartz-cemented breccias. Dark bands in the quartz are due to finely disseminated pyrite, now oxidised to limonite. The veins show sharp contacts with the surrounding ignimbrite which hosts narrow stockwork zones that are weakly mineralised and appear to have been cut by a sequence of north-east-trending faults that have southerly movement with no appreciable lateral displacement.
BRAZIL
Brazil - AngloGold Ashanti Córrego do Sítío Mineração (AGA Mineração)
Description
AngloGold Ashanti Córrego do Sítío Mineração (AGA Mineração) comprises two operational units, namely the Cuiabá and the Córrego do Sítío complexes.
The Cuiabá complex includes the Cuiabá and Lamego mines and the Cuiabá and Queiroz plants. The Cuiabá and Lamego mines are located near Sabará, southeast and east respectively of the city of Belo Horizonte, the capital of Minas Gerais State, in the southeast of Brazil. The Cuiabá mine is a mix of cut-and-fill and long hole stoping accessed by ramp and shaft. Lamego is a new mine developed to mine an underground sulphide ore. The first stage of the processing of the ore from Cuiabá and Lamego mines is in the gold plant at the Cuiabá complex, where concentrate is produced. The material is then transported 15 kilometres by aerial ropeway to the Queiroz plant where milling, flotation, roasting, leaching, precipitation and refining occur. Total capacity of the complete circuit is 1.7 million tonnes per year and recoveries of 93 percent are achieved. Power for the mine is both self-generated and supplied by Cemig a state owned company. The Cuiabá mine became operational in 1988 and the Lamego mine in 2009. Some of the older mines which are now closed have been operating since 1834.
The Córrego do Sítío (CdS) is located in the Municipality of Santa Bárbara, 60 kilometres east of the city of Belo Horizonte, the capital of Minas Gerais state. The southern portion of this mining complex is referred to as CdS I while the northern portion (formerly known as São Bento) has been renamed CdS II. CdS comprises one surface (oxide) and two sub-level stoping underground (sulphide) mines, as well as a heap leach pad and sulphide plant, the latter originally acquired from Eldorado late in 2008 was refurbished and brought into operation in January 2012. There are two metallurgical plants in CdS: the heap-leach plant for the oxide ore and the sulphide plant. The sulphide process consists of crushing, grinding and gravity concentration, flotation, thickening, acidulation, pressure oxidation (POX autoclave), CCD (counter current decantation), CIL extraction, elution, neutralisation, electro winning and tailings disposal. The plant and POX circuit have a capacity as of 600ktpy. The heap-leaching process consists of crushing, agglomeration, stacking, leaching, adsorption, elution and electro winning. Power is supplied to CdS by Cemig a state owned company.
Brazil - Summary of metallurgical operations
|
Córrego do Sítío Oxide
|
|
Córrego do Sítío Sulphide
|
|
Cuiabá
|
|
Serra Grande
|
|
||||
|
Capacity
(000 tonnes/month)
|
50
|
|
58
|
|
150
|
|
115
|
|
|||
Geology
The area in which AGA Mineração is located is known as the Iron Quadrangle and is host to historic and current gold mining operations, as well as a number of open-pit limestone and iron ore operations. The geology of the Iron Quadrangle is composed of Proterozoic and Archaean volcano‑sedimentary sequences and Pre‑Cambrian granitic complexes. The host to the gold mineralisation is the volcano-sedimentary Nova Lima Group (NLG) that occurs at the base of the Rio das Velhas SuperGroup (RDVS). The upper sequence of the RDVS is the meta-sedimentary Maquiné Group. Cuiabá mine, located at Sabara Municipality, has gold mineralisation associated with sulphides and quartz veins in Banded Ironstone Formation (BIF) and volcanic sequences. At this mine, structural control and fluids flow ascension are the most important factors for gold mineralisation with a common association between large-scale shear zones and their associated structures. Where BIF is mineralised the ore appears strongly stratiform due to the selective sulphidation of the iron rich layers. Steeply plunging shear zones tend to control the ore shoots, which commonly plunge parallel to intersections between the shears and other structures.
117
The controlling mineralisation structures are the apparent intersection of thrust faults with tight isoclinal folds in a ductile environment. The host rocks at Brasil Mineração are BIF, Lapa Seca and mafic volcanics (principally basaltic). Mineralisation is due to the interaction of low salinity carbon dioxide rich fluids with the high-iron BIF, basalts and carbonaceous graphitic schists. Sulphide mineralisation consists of pyrrhotite and pyrite with subordinate pyrite and chalcopyrite; the latter tends to occur as a late-stage fracture fill and is not associated with gold mineralisation. Wallrock alteration is typically carbonate, potassic and silicic.
CdS is located in the eastern part of the lower to middle greenschist facies archean Rio das Velhas greenstone belt. The CdS I, II and III gold deposits and associated targets are located in a gold trend that extends for about 14km in a north-easterly direction, from Grota Funda (CdS I areas) in the south to Jambeiro (CdS III areas) in the north. CDSII Area is the north portion of the Corrego do Sítio gold trend. The main gold targets and deposits are distributed over three trends, namely the CdS trend, the Donana Trend and the Cristina Trend. At CdSI, the main orebodies are Rosalino, Cachorro Bravo, Laranjeiras and Carvoaria, which are currently under-production and are the most relevant mineralisations at Mine I. At CdSII, the main orebodies are São Bento, Pinta Bem (both BIF hosted) and Sangue de Boi (metapellitic hosted). At CdSIII, Anomalia I and II represent the orebodies with highest level of information and potential so far (For formal declaration purposes, CDSIII deposits are incorporated as CDSII). CdS mineralisation occurs in a greenstone belt geological environment, where the gold content is associated to quartz and sulphides (mainly very fine arsenopyrite acicular crystals) in a structurally controlled corridor of approximately 16 - 20km in strike length and about 500m vertical extent, developed under compressional tectonic settings.
Brazil - Serra Grande
Description
Serra Grande is located in central Brazil, in the state of Goiás, about five kilometers from the city of Crixás. Serra Grande comprises three mechanised underground mines: Mina III (which includes orebody IV), Mina Nova (which includes the Pequizão orebody) and Palmeiras - and an open pit in the outcrop of Mina III orebodies. A gold bearing quartz vein was identified just beneath Pequizão Orebody and a new decline is being developed from Mina III (orebody IV) to access and expose this new orebody named Ingá, which contains high grade ore. One dedicated metallurgical plant treats ore from these different sources. The annual capacity of the processing circuit, which has grinding, leaching, filtration, precipitation and smelting facilities, is 1.3 million tonnes. The power for the mine is supplied and purchased in the open market. The mine became operational in 1989 and has been operated by AngloGold Ashanti since 1999.
Geology
The gold ore deposits are located in the Rio Vermelho and Ribeirão das Antas Formations of the Archaean Pilar de Goia’s Group which account together for a large proportion of the Crixás Greenstone Belt in central Brazil.
The stratigraphy of the belt is dominated by basics and ultrabasics in the lower sequences with volcano sedimentary units forming the upper successions.
The gold deposits are hosted in a sequence of schists, meta volcanics and dolomites occurring in a typical greenstone belt structural setting. Gold mineralisation is associated with massive sulphides and vein quartz material associated with carbonaceous and sericitic schists and dolomites. The oreshoots plunge to the north-west with dipping between six and 35 degrees. The stratigraphy is overturned and thrusted towards the east, being recognized different shear thrust structures that are stacked and controls the mineralisation, behaving as frontal and lateral ramps and horses.
The greenstone belt lithologies are surrounded by Archaean tonalitic gneiss and granodiorites of TTG suite. The metamorphic sediments are primarily composed of quartz, chlorite, sericite, carbonaceous material and garnetiferous schists. The carbonates have been metamorphosed to ferroan dolomite marble with development of siderite and ankerite veining in the surrounding wallrock, usually associated with quartz veins. The basalts are relatively unaltered but do show pronounced stretching with elongation of pillow structures being evident.
The Crixás greenstone belt comprises a series of Archaean to Palaeoproterozoic metavulcanics, metasediments and basement granitoids stacked within a series of north to north-east transported thrust sheet. Thrusting (D1) was accompanied by significant F1 folding/foliation development and progressive alteration in a brittle-ductile regime. D1 thrusting was developed with irregular thrust ramp geometry, in part controlled by concealed early basin faults. The main Crixás orebodies are adjacent to a major north‑northwest structural corridor, and up the main fault ramp/corner, to become dispersed to the east and north in zones of foreland thrust flats. Fluid alteration also diminished to the west away from the main fault corner. A series of concealed east-west to northwest‑southeast basement block faults may have provided secondary fluid migration, and development of early anti‑formal warps in the thrust sheets; these structures probably define the quasi‑regular spacing of significant mineralisation within the belt. The D1 thrust stack was gently folded by non‑cylindrical folds. Gold mineralising fluids probably migrated during this event, with similar south‑south‑west to north‑north‑east migration, and focusing on bedding slip during folding. Gold mineralisation became minor and dispersed to the north and east along the formal thrust flat zone. Concentrations of gold along the case of quartz vein may be due to the damming of fluids migrating upward along layering.
118
COLOMBIA
Colombia - Gramalote
Description
The Gramalote Project is a Joint Venture between AGA (51 percent and manager) and B2Gold (49 percent). The property is located near the town of Providencia and San Jose del Nus within the municipality of San Roque, northwest of the Department of Antioquia, Colombia. It is approximately 230 km northwest of the Colombian capital of Bogota and 124 km northeast of Medellin which is the regional capital of Antioquia Department. The region encompassing Gramalote has a long history of artisanal gold mining. Gramalote itself has had small scale artisanal mining for several decades prior to exploration work and mineral discovery by AngloGold Ashanti. Drilling commenced in 2006. In 2010, AngloGold Ashanti became the operator with a 51 percent share. Sufficient work was completed to enable a Pre-Feasibility study to be completed in late 2013. This was then updated on the back of growth of the Mineral Resource, significant mineral processing opportunities identified by the project team and ongoing capital and operating cost optimisation. The enhanced Pre-Feasibility study was completed in September 2017 and approved by the board in November 2017.
Geology
The Gramalote deposit is located in the northern portion of the Central Cordillera of Colombia. The terrain is mainly composed of a metamorphic basement complex and the Antioquia Batholith. The terrane of the Cajamarca-Valdivia basement consists of metamorphic rocks, volcanic rocks, oceanic ophiolites and intrusive rocks. The Antioquia Batholith of Upper Cretaceous age covers an area of 7221 km2 and constitutes, the core of the Central Cordillera. About 92 percent of this intrusive corresponds to (normal phase) tonalite and granodiorite and eight percent to two subordinate types of rocks - granodiorite to quartz-monzonite and gabbro. From a structural point of view, the Antioquia Batholith has a history of uprising complex and lasting. Major lineaments affect the batholith, especially in its eastern sector where traces of trend WNW varying to NW, recorded rotation and shear sinistral movement. Westward dextral transpression dominates along the Romeral Fault System.
Gramalote is an intrusive-hosted structurally controlled stockwork gold and silver deposit. Mineralisation is controlled by north-east/south-west trending shear zones and north-northwest to south-southeast trending shear extensional zones affecting the tonalites and granodiorites of the Antioquia Batholith. Gold mineralisation is associated with three overprinting texture destructive alteration assemblages including potassic, quartz-sericite and sericite carbonate. Within these alteration zones, anomalous gold mineralisation is associated with three specific types of stockwork quartz veining. These include quartz veinlets with fine-grained pyrite, quartz-carbonate veinlets and quartz veinlets with granular pyrite.
119
ORE RESERVE
The combined Proven and Probable Ore Reserve of the group amounted to 49.6 million ounces as at 31 December 2017.
Ore Reserve estimates are reported in accordance with the requirements of the SEC’s Industry Guide 7. Accordingly, as of the date of reporting, all Ore Reserve is planned to be mined out under the life-of-mine plans within the period of AngloGold Ashanti’s existing rights to mine, or within the renewal periods of AngloGold Ashanti’s rights to mine. In addition, as of the date of reporting, all Ore Reserve is covered by required mining permits or there is a high probability that these approvals will be secured.
AngloGold Ashanti has standard procedures for the estimation of Ore Reserve. These standard procedures are performed by experienced technical personnel at the mining operations and reviewed by regional and corporate Competent Persons.
In the case of its underground mines, the procedure is as follows: Firstly, gold content and tonnage are estimated for in-situ mineralised material at a mining operation. This mineralised material is not necessarily economically viable over the full extent of the operation. Exclusions on the grounds of safety (for example, stability pillars and shaft pillars) are then also defined. Grade-tonnage curves specific for each of the deposits, in conjunction with parameters such as the cost structure, yield, mine call factor and gold price estimates are used to determine an optimal mining mix. This process facilitates the determination of the average grade to be mined by each operation. This grade is then applied to the grade-tonnage curves, which in turn facilitates the determination of the cut-off grade and Ore Reserve tonnage for the operation. A full mine design is carried out on the blocks of mineralised material, excluding any large mining areas that do not meet the cut-off grade criterion. This mining plan is reviewed to ensure that it satisfies the economic criteria and practical limitations of access and timing. If the review process is positive then the mineralised material (with dilution and discounts) included in the mining plan is declared and published as the Ore Reserve for that operation.
In the case of open-pit mines the procedure is as follows: revenue and costs are calculated for each mining block within a three-dimensional model of the ore body using estimated values for gold price, operating costs and metallurgical recoveries. An optimization process is then applied to determine the combination of blocks within the model that make a positive contribution under these estimations. Block selection is within a shell whose limits are defined by the planned slope angles of the pit. Within this process, a cut-off grade is applied which determines the ore blocks to be treated and included in the Ore Reserve. These blocks are scheduled with consideration being given to practical mining constraints and limitations. Scheduled ore blocks that are classified as Proven or Probable constitute the Ore Reserve.
The gold price used for determining the 2017 and 2016 Ore Reserve are outlined in the following table:
|
2017
|
|
2017
|
|
2016
|
|
Units
|
||||
|
(3 year
average)
|
|
(Ore
Reserve)
|
|
(3 year
average)
|
|
|||||
|
Ore Reserve Gold Price
|
1,222
|
|
1,100
|
|
1,225
|
|
US$ per ounce
|
|||
The Ore Reserve determined from the planning process was then tested for economic viability at the three-year historical average gold price shown in the above table for determining the SEC compliant Ore Reserve. The test indicates the vast majority of the SAMREC/JORC Ore Reserve is economically viable and meet the requirements of the SEC. Therefore the SEC and SAMREC/JORC Ore Reserve are all but identical except for Kopanang and AGA Mineração where the three year average exchange rate caused small changes. The resultant SEC compliant Proven and Probable Ore Reserve is shown in the following pages.
In Australia and South Africa, AngloGold Ashanti is legally required to publicly report Ore Reserve and Mineral Resource according to the Australasian Code for Reporting of Exploration Results, Mineral Resources and Ore Reserves (The JORC Code, 2012 edition) and the South African Code for Reporting of Exploration Results, Mineral Resources and Mineral Reserves (The SAMREC Code, 2016 edition). The SEC’s Industry Guide 7 does not recognize Mineral Resource. Accordingly, AngloGold Ashanti does not report estimates of Mineral Resource in this annual report on Form 20-F.
The AngloGold Ashanti Ore Reserve decreased from 50.0Moz in December 2016 to 49.6Moz in December 2017. This gross annual decrease of 0.4Moz includes depletion of 4.3Moz. The balance of 3.9Moz additions in Ore Reserve, results from exploration and modelling changes of 4.0Moz and other factors of 0.7Moz, whilst changes in economic assumptions resulted in a 0.8Moz reduction. The Ore Reserve has been estimated using a gold price of US$1,100/oz (2016: US$1,100/oz).
120
The principal changes in AngloGold Ashanti’s Ore Reserve as at 31 December 2017, compared with those published as at 31 December 2016, are as follows:
|
ORE RESERVE
|
Moz
|
|
|
|
Ore Reserve as at 31 December 2016
|
50.0
|
|
|
|
Depletions
|
-4.3
|
|
|
|
Sub Total
|
45.7
|
|
|
|
Additions
|
|
|
|
|
Gramalote
|
Positive Pre-Feasibility study complete and approved by Board.
|
1.8
|
|
|
AGA Mineração
|
Inclusion of transitional and sulphide material in the CDS Rosalina open pit as well as Mineral Resource conversions.
|
0.9
|
|
|
Tropicana
|
Model revisions for Havana South and new designs for Boston Shaker.
|
0.6
|
|
|
Obuasi
|
New mine plan based on new Mineral Resource models.
|
0.4
|
|
|
CVSA
|
Due to improved methodology.
|
0.3
|
|
|
Other
|
Additions less than 0.3Moz.
|
0.8
|
|
|
|
Sub Total
|
50.5
|
|
|
Reductions
|
|||
|
TauTona
|
Mine closed.
|
-0.6
|
|
|
Other
|
Reductions less than 0.3Moz.
|
-0.3
|
|
|
Ore Reserve as at 31 December 2017
|
49.6
|
|
|
AngloGold Ashanti strives to actively create value by growing its major asset - the Ore Reserve. This drive is based on a well-defined brownfields and greenfields exploration programme, innovation in both geological modeling and mine planning and optimization of its asset portfolio.
The Ore Reserve estimates in this document include the Ore Reserve below the current infrastructure of underground mines. These include mines in South Africa, Ghana and Brazil.
Sale of assets
AngloGold Ashanti announced on 19 October 2017 that it was selling various assets in the Vaal River area of its South African region. The sales processes as at 31st December 2017 were still underway and therefore do not affect the stated Ore Reserve for 2017. However, with the conclusion of the sales at the end of February 2018, the following reductions in Ore Reserve will take place:
|
•
|
Kopanang Ore Reserve 0.36Moz
|
|
•
|
Moab Khotsong Ore Reserve 4.87Moz
|
|
•
|
Surface Operations Ore Reserve 0.87Moz
|
By-products
Several by-products are recovered as a result of the exploitation of gold Ore Reserve. The by-products include 89.16 million pounds of uranium oxide from the South African operations, 0.41 million tons of sulfur from Brazil and 21.81 million ounces of silver from Argentina.
External reviews of Mineral Resource and Ore Reserve Statement
During the course of 2017, the following operations were subject to an external review in line with the policy that each operation/ project will be reviewed by an independent third party on average once every three years:
|
•
|
Mineral Resource and Ore Reserve at Mponeng
|
|
•
|
Mineral Resource at Obuasi
|
|
•
|
Ore Reserve at Obuasi
|
|
•
|
Mineral Resource and Ore Reserve at Tropicana
|
|
•
|
Mineral Resource and Ore Reserve at Gramalote
|
|
•
|
Mineral Resource and Ore Reserve at Kibali
|
The external reviews were conducted by AMEC, Aranz Geo, Snowden, Optiro, SRK and Optiro respectively. The company has been informed that the external reviews identified no material shortcomings in the process of evaluation of the grade models and estimation of the Ore Reserve.
121
Competent Persons
The information in this report relating to the Ore Reserve is based on information compiled by or under the supervision of the Competent Persons as defined in the JORC or SAMREC Codes. All Competent Persons are employed by AngloGold Ashanti, unless stated otherwise, and have sufficient experience relevant to the style of mineralization and type of deposit under consideration and to the activity which they are undertaking. The Competent Persons consent to the inclusion of Ore Reserve information in this report, in the form and context in which it appears. Details of the Competent Persons per operation are given in the Mineral Resource and Ore Reserve Report 2017, which is available on the corporate website. The legal tenure of each operation and project has been verified to the satisfaction of the accountable Competent Person and all Ore Reserve has been confirmed to be covered by the required mining permits or there is a high probability that these permits will be issued.
Over more than a decade, the company has developed and implemented a rigorous system of internal and external reviews aimed at providing assurance in respect of Ore Reserve estimates were completed by suitably qualified Competent Persons from within AngloGold Ashanti. A documented chain of responsibility exists from the Competent Persons at the operations to the company’s Mineral Resource and Ore Reserve Steering Committee. Accordingly, the Chairman of the Mineral Resource and Ore Reserve Steering Committee, VA Chamberlain, MSc (Mining Engineering), BSc (Hons) (Geology), MGSSA, FAusIMM, assumes responsibility for the Mineral Resource and Ore Reserve processes for AngloGold Ashanti and is satisfied that the Competent Persons have fulfilled their responsibilities.
A detailed breakdown of Mineral Resource and Ore Reserve and backup detail is provided on the AngloGold Ashanti website (
www.anglogoldashanti.com
) and
www.aga-reports.com
.
122
|
Ore Reserve: Imperial
|
At 31 December 2017
|
||||||||||||||||||||||||
|
Proven Ore Reserve
(1) (2)
|
Probable Ore Reserve
(1) (2)
|
Metallurgical
|
Cut-off
|
||||||||||||||||||||||
|
Tons
(5)
|
|
Grade
|
|
Gold
Content
|
|
Tons
(5)
|
|
Grade
|
|
Gold
Content
|
|
Recovery
Factor
|
Grade
|
(10)
|
|
||||||||||
|
(million)
|
|
(oz/ton)
|
|
(Moz)
|
|
(million)
|
|
(oz/ton)
|
|
(Moz)
|
|
percent
|
(oz/ton)
|
||||||||||||
|
South Africa
|
|||||||||||||||||||||||||
|
Vaal River
(6)
|
|||||||||||||||||||||||||
|
Kopanang
|
1.10
|
|
0.158
|
|
0.17
|
|
1.04
|
|
0.156
|
|
0.16
|
|
95.6-95.7
|
(4
|
)
|
0.278
|
|||||||||
|
Moab Khotsong
(2)
|
2.22
|
|
0.278
|
|
0.62
|
|
17.21
|
|
0.247
|
|
4.25
|
|
93.9-97.1
|
(4
|
)
|
0.126-0.181
|
(4)
|
|
|||||||
|
West Wits
|
|||||||||||||||||||||||||
|
Mponeng
(2)
|
1.66
|
|
0.253
|
|
0.42
|
|
41.01
|
|
0.286
|
|
11.74
|
|
96.5-98.1
|
(4
|
)
|
0.122-0.199
|
(4)
|
|
|||||||
|
TauTona
(12)
|
0.00
|
|
0.00
|
|
0.00
|
|
0.00
|
|
0.000
|
|
0.00
|
|
|||||||||||||
|
Surface
|
|||||||||||||||||||||||||
|
Surface sources
(6) (9)
|
139.60
|
|
0.006
|
|
0.87
|
|
671.80
|
|
0.008
|
|
5.24
|
|
42.0-88.0
|
(4
|
)
|
0.006-0.013
|
(4)
|
|
|||||||
|
Continental Africa
|
|||||||||||||||||||||||||
|
Democratic Republic of the Congo
|
|||||||||||||||||||||||||
|
Kibali (45 percent)
(3) (11)
|
9.42
|
|
0.119
|
|
1.12
|
|
23.35
|
|
0.119
|
|
2.79
|
|
84.5-88.9
|
(4
|
)
|
0.045-0.073
|
(4)
|
|
|||||||
|
Ghana
|
|||||||||||||||||||||||||
|
Iduapriem
|
3.25
|
|
0.023
|
|
0.07
|
|
42.23
|
|
0.042
|
|
1.78
|
|
92.0-95.6
|
(4
|
)
|
0.016-0.026
|
(4)
|
|
|||||||
|
Obuasi
(2)
|
—
|
|
—
|
|
—
|
|
22.35
|
|
0.262
|
|
5.86
|
|
87.0
|
0.120-0.152
|
(4)
|
|
|||||||||
|
Guinea
|
|||||||||||||||||||||||||
|
Siguiri (85 percent)
(3)
|
26.67
|
|
0.019
|
|
0.51
|
|
69.64
|
|
0.025
|
|
1.74
|
|
88.0-93.0
|
(4
|
)
|
0.016-0.022
|
(4)
|
|
|||||||
|
Mali
|
|||||||||||||||||||||||||
|
Morila (40 percent)
(3) (11)
|
—
|
|
—
|
|
—
|
|
4.68
|
|
0.016
|
|
0.08
|
|
57.0-91.0
|
(4
|
)
|
0.014
|
|||||||||
|
Sadiola (41 percent)
(3)
|
0.11
|
|
0.063
|
|
0.01
|
|
31.23
|
|
0.054
|
|
1.69
|
|
75.0-94.0
|
(4
|
)
|
0.015-0.025
|
(4)
|
|
|||||||
|
Tanzania
|
|||||||||||||||||||||||||
|
Geita
|
—
|
|
—
|
|
—
|
|
9.42
|
|
0.133
|
|
1.25
|
|
76.0-92.0
|
(4
|
)
|
0.41-0.088
|
(4)
|
|
|||||||
|
Australasia
|
|||||||||||||||||||||||||
|
Australia
|
|||||||||||||||||||||||||
|
Sunrise Dam
|
12.00
|
|
0.029
|
|
0.34
|
|
9.08
|
|
0.094
|
|
0.85
|
|
85.0-86.0
|
(4
|
)
|
0.022-0.079
|
(4)
|
|
|||||||
|
Tropicana (70 percent)
(3)
|
13.40
|
|
0.038
|
|
0.50
|
|
37.98
|
|
0.062
|
|
2.35
|
|
90.0
|
0.020
|
|||||||||||
|
Americas
|
|||||||||||||||||||||||||
|
Argentina
|
|||||||||||||||||||||||||
|
Cerro Vanguardia (92.5 percent)
(3) (7)
|
5.09
|
|
0.049
|
|
0.25
|
|
6.12
|
|
0.108
|
|
0.66
|
|
64.4-95.7
|
(4
|
)
|
0.013-0.146
|
(4)
|
|
|||||||
|
Brazil
|
|||||||||||||||||||||||||
|
AGA Mineraçáo
(2) (8)
|
3.34
|
|
0.132
|
|
0.44
|
|
13.24
|
|
0.131
|
|
1.73
|
|
67.8-93.8
|
(4
|
)
|
0.018-0.106
|
(4)
|
|
|||||||
|
Serra Grande
(2)
|
1.86
|
|
0.081
|
|
0.15
|
|
1.95
|
|
0.092
|
|
0.18
|
|
86.5-95.3
|
(4
|
)
|
0.019-0.053
|
(4)
|
|
|||||||
|
Colombia
|
|||||||||||||||||||||||||
|
Gramalote (51 percent)
(3)
|
—
|
|
—
|
|
—
|
|
70.23
|
|
0.025
|
|
1.76
|
|
83.9-95.0
|
(4
|
)
|
0.005-0.006
|
(4)
|
|
|||||||
|
Total
|
219.72
|
|
0.025
|
|
5.48
|
|
1,072.57
|
|
0.041
|
|
44.11
|
|
|||||||||||||
|
(1)
|
Ore Reserve includes marginally economic and diluting materials delivered for treatment and allow for losses that may occur during mining.
|
|
(2)
|
Proven and/or Probable Ore Reserve includes Ore Reserve below infrastructure. See table that follows.
|
|
(3)
|
Ore Reserve attributable to AngloGold Ashanti’s percentage interest shown.
|
|
(4)
|
Recovery factor and cut-off grade vary according to ore type.
|
|
(5)
|
Tons refers to a short ton, which is equivalent to 2000 pounds avoirdupois.
|
|
(6)
|
The Vaal Reef Ore Reserve includes 89.16 million pounds of Uranium oxide by-products; this cannot be accounted for by individual mine as Kopanang, Moab Khotsong and Surface sources in Vaal River feed to a combination of plants.
|
|
(7)
|
The Ore Reserve contains 21.81 million ounces of silver to be recovered as a by-product.
|
|
(8)
|
The Ore Reserve contains 0.41 million tons of sulphur to be recovered as a by-product.
|
|
(9)
|
Includes Mine Waste Solutions (MWS).
|
|
(10)
|
In-situ cut-off grade.
|
|
(11)
|
Ore Reserve is estimated by Competent Persons employed by Randgold Resources Limited.
|
|
(12)
|
No Ore Reserve is declared for 2017 - TauTona is reported under Mponeng.
|
Rounding may result in computational differences.
123
The 2017 Proven and Probable Ore Reserve includes Ore Reserve below infrastructure in the case of the following underground mines currently in production:
|
Mine
|
Tons (millions)
|
|
Grade (ounces/ton)
|
|
Gold Content
(million ounces)
|
|
||
|
Moab Khotsong
|
14.47
|
|
0.24
|
|
3.48
|
|
||
|
Mponeng
|
31.04
|
|
0.27
|
|
8.50
|
|
||
|
Obuasi
|
1.87
|
|
0.60
|
|
1.13
|
|
||
|
AGA Mineração
|
3.89
|
|
0.16
|
|
0.62
|
|
||
|
Serra Grande
|
1.33
|
|
0.10
|
|
0.14
|
|
||
|
Total
|
52.59
|
|
0.26
|
|
13.86
|
|
||
The Ore Reserve has been determined based on completed economic studies.
124
|
Ore Reserve: Imperial
|
At 31 December 2016
|
|||||||||||||||||||||||||
|
Proven Ore Reserve
(1) (2)
|
Probable Ore Reserve
(1) (2)
|
Metallurgical
|
Cut-off
|
|||||||||||||||||||||||
|
Tons
(5)
|
|
Grade
|
|
Gold
Content
|
|
Tons
(5)
|
|
Grade
|
|
Gold
Content
|
|
Recovery
Factor
|
Grade
|
(10)
|
|
|||||||||||
|
(million)
|
|
(oz/ton)
|
|
(Moz)
|
|
(million)
|
|
(oz/ton)
|
|
(Moz)
|
|
percent
|
(oz/ton)
|
|||||||||||||
|
South Africa
|
||||||||||||||||||||||||||
|
Vaal River
(6)
|
||||||||||||||||||||||||||
|
Kopanang
|
1.79
|
|
0.156
|
|
0.28
|
|
1.10
|
|
0.163
|
|
0.18
|
|
95.6-95.7
|
|
(4
|
)
|
0.278
|
|||||||||
|
Moab Khotsong
(2)
|
2.93
|
|
0.249
|
|
0.73
|
|
15.50
|
|
0.276
|
|
4.27
|
|
95.6-96.4
|
|
(4
|
)
|
0.119-0.170
|
(4)
|
|
|||||||
|
West Wits
|
||||||||||||||||||||||||||
|
Mponeng
(2)
|
1.34
|
|
0.278
|
|
0.37
|
|
41.47
|
|
0.292
|
|
12.11
|
|
97.4-98.0
|
|
(4
|
)
|
0.122-0.208
|
(4)
|
|
|||||||
|
TauTona
|
0.55
|
|
0.323
|
|
0.18
|
|
2.28
|
|
0.243
|
|
0.55
|
|
96.7-97.0
|
|
(4
|
)
|
0.219-0.239
|
(4)
|
|
|||||||
|
Surface
|
||||||||||||||||||||||||||
|
Surface sources
(6) (9)
|
146.21
|
|
0.006
|
|
0.92
|
|
698.63
|
|
0.008
|
|
5.48
|
|
42.0-92.0
|
|
(4
|
)
|
0.007-0.011
|
(4)
|
|
|||||||
|
Continental Africa
|
||||||||||||||||||||||||||
|
Democratic Republic of the Congo
|
||||||||||||||||||||||||||
|
Kibali (45 percent)
(3) (11)
|
2.13
|
|
0.055
|
|
0.12
|
|
32.98
|
|
0.122
|
|
4.01
|
|
84.5-88.9
|
|
(4
|
)
|
0.044-0.070
|
(4)
|
|
|||||||
|
Ghana
|
||||||||||||||||||||||||||
|
Iduapriem
|
3.21
|
|
0.022
|
|
0.07
|
|
46.69
|
|
0.038
|
|
1.77
|
|
92.0-96.0
|
|
(4
|
)
|
0.015-0.026
|
(4)
|
|
|||||||
|
Obuasi
(2)
|
—
|
|
—
|
|
—
|
|
23.49
|
|
0.234
|
|
5.49
|
|
89.0
|
0.128-0.152
|
(4)
|
|
||||||||||
|
Guinea
|
||||||||||||||||||||||||||
|
Siguiri (85 percent)
(3)
|
28.11
|
|
0.019
|
|
0.53
|
|
76.07
|
|
0.025
|
|
1.92
|
|
88.0-93.0
|
|
(4
|
)
|
0.015-0.022
|
(4)
|
|
|||||||
|
Mali
|
||||||||||||||||||||||||||
|
Morila (40 percent)
(3) (11)
|
—
|
|
—
|
|
—
|
|
6.81
|
|
0.016
|
|
0.11
|
|
57.0
|
0.014
|
||||||||||||
|
Sadiola (41 percent)
(3)
|
0.01
|
|
0.069
|
|
—
|
|
34.85
|
|
0.052
|
|
1.80
|
|
75.0-94.0
|
|
(4
|
)
|
0.013-0.023
|
(4)
|
|
|||||||
|
Tanzania
|
||||||||||||||||||||||||||
|
Geita
|
—
|
|
—
|
|
—
|
|
18.09
|
|
0.109
|
|
1.97
|
|
89.3-92.7
|
|
(4
|
)
|
0.028-0.131
|
(4)
|
|
|||||||
|
Australasia
|
||||||||||||||||||||||||||
|
Australia
|
||||||||||||||||||||||||||
|
Sunrise Dam
|
12.87
|
|
0.029
|
|
0.37
|
|
11.64
|
|
0.083
|
|
0.97
|
|
80.9-85.0
|
|
(4
|
)
|
0.018-0.036
|
(4)
|
|
|||||||
|
Tropicana (70 percent)
(3)
|
12.10
|
|
0.043
|
|
0.52
|
|
34.27
|
|
0.062
|
|
2.14
|
|
90.0
|
|
0.020
|
|||||||||||
|
Americas
|
||||||||||||||||||||||||||
|
Argentina
|
||||||||||||||||||||||||||
|
Cerro Vanguardia (92.5 percent)
(3) (7)
|
6.58
|
|
0.043
|
|
0.28
|
|
4.70
|
|
0.141
|
|
0.66
|
|
61.8-95.9
|
|
(4
|
)
|
0.013-0.146
|
(4)
|
|
|||||||
|
Brazil
|
||||||||||||||||||||||||||
|
AGA Mineraçáo
(2) (8)
|
3.88
|
|
0.140
|
|
0.55
|
|
7.68
|
|
0.152
|
|
1.16
|
|
70.0-93.3
|
|
(4
|
)
|
0.017-0.105
|
(4)
|
|
|||||||
|
Serra Grande
(2)
|
2.66
|
|
0.073
|
|
0.19
|
|
3.53
|
|
0.080
|
|
0.28
|
|
88.5-94.7
|
|
(4
|
)
|
0.071
|
|||||||||
|
Total
|
224.36
|
|
|
0.023
|
|
|
5.12
|
|
|
1,059.73
|
|
|
0.042
|
|
|
44.87
|
|
|||||||||
|
(1)
|
Ore Reserve includes marginally economic and diluting materials delivered for treatment and allow for losses that may occur during mining.
|
|
(2)
|
Proven and/or Probable Ore Reserve includes Ore Reserve below infrastructure. See table that follows.
|
|
(3)
|
Ore Reserve attributable to AngloGold Ashanti’s percentage interest shown.
|
|
(4)
|
Recovery factor and cut-off grade vary according to ore type.
|
|
(5)
|
Tons refers to a short ton, which is equivalent to 2000 pounds avoirdupois.
|
|
(6)
|
The Vaal Reef Ore Reserve includes 123.48 million pounds of Uranium oxide by-products; this cannot be accounted for by individual mine as Kopanang, Moab Khotsong and Surface sources in Vaal River feed to a combination of plants.
|
|
(7)
|
The Ore Reserve contains 18.24 million ounces of silver to be recovered as a by-product.
|
|
(8)
|
The Ore Reserve contains 0.46 million tons of sulphur to be recovered as a by-product.
|
|
(9)
|
Includes Mine Waste Solutions (MWS).
|
|
(10)
|
In-situ cut-off grade.
|
|
(11)
|
Ore Reserve is estimated by Competent Persons employed by Randgold Resources Limited.
|
Rounding may result in computational differences.
125
The 2016 Proven and Probable Ore Reserve includes Ore Reserve below infrastructure in the case of the following underground mines currently in production:
|
Mine
|
Tons (millions)
|
|
Grade (ounces/ton)
|
|
Gold Content
(million ounces)
|
|
||
|
Moab Khotsong
|
11.89
|
|
0.28
|
|
3.32
|
|
||
|
Mponeng
|
30.35
|
|
0.28
|
|
8.56
|
|
||
|
Obuasi
|
1.92
|
|
0.67
|
|
1.29
|
|
||
|
AGA Mineração
|
1.97
|
|
0.18
|
|
0.35
|
|
||
|
Serra Grande
|
1.18
|
|
0.09
|
|
0.10
|
|
||
|
Total
|
47.31
|
|
0.29
|
|
13.63
|
|
||
The Ore Reserve has been determined based on completed economic studies.
126
|
Ore Reserve: Metric
|
At 31 December 2017
|
|||||||||||||||||||||
|
Proven Ore Reserve
(1) (2)
|
Probable Ore Reserve
(1) (2)
|
Metallurgical
|
Cut-off
|
|||||||||||||||||||
|
Tonnes
(5)
|
|
Grade
|
|
Gold
Content
|
Tonnes
(5)
|
Grade
|
Gold
Content
|
|
Recovery
Factor
|
Grade
|
(10)
|
|
||||||||||
|
(million)
|
|
(g/t)
|
|
(tonnes)
|
(million)
|
(g/t)
|
tonnes
|
|
percent
|
(g/t)
|
||||||||||||
|
South Africa
|
||||||||||||||||||||||
|
Vaal River
(6)
|
||||||||||||||||||||||
|
Kopanang
|
1.00
|
|
5.420
|
|
5.40
|
0.94
|
5.37
|
5.04
|
|
95.6-95.7
|
(4
|
)
|
9.52
|
|||||||||
|
Moab Khotsong
(2)
|
2.02
|
|
9.550
|
|
19.26
|
15.62
|
8.47
|
132.31
|
|
93.9-97.1
|
(4
|
)
|
4.31-6.21
|
(4)
|
|
|||||||
|
West Wits
|
||||||||||||||||||||||
|
Mponeng
(2)
|
1.50
|
|
8.670
|
|
13.03
|
37.21
|
9.82
|
365.25
|
|
96.5-98.1
|
(4
|
)
|
4.17-6.82
|
(4)
|
|
|||||||
|
TauTona
(12)
|
—
|
|
0.00
|
|
0.00
|
0.00
|
0.00
|
0.00
|
|
|||||||||||||
|
Surface
|
||||||||||||||||||||||
|
Surface sources
(5) (9)
|
126.64
|
|
0.21
|
|
27.11
|
609.45
|
0.27
|
162.99
|
|
42.0-88.0
|
(4
|
)
|
0.20-0.43
|
(4)
|
|
|||||||
|
Continental Africa
|
||||||||||||||||||||||
|
Democratic Republic of the Congo
|
||||||||||||||||||||||
|
Kibali (45 percent)
(3) (11)
|
8.54
|
|
4.07
|
|
34.78
|
21.18
|
4.10
|
86.76
|
|
84.5-88.9
|
(4
|
)
|
1.53-2.50
|
(4)
|
|
|||||||
|
Ghana
|
||||||||||||||||||||||
|
Iduapriem
|
2.95
|
|
0.77
|
|
2.29
|
38.31
|
1.44
|
55.35
|
|
92.0-95.6
|
(4
|
)
|
0.55-0.90
|
(4)
|
|
|||||||
|
Obuasi
(2)
|
—
|
|
0.00
|
|
0.00
|
20.28
|
9.00
|
182.40
|
|
87.0
|
4.10-5.20
|
(4)
|
|
|||||||||
|
Guinea
|
||||||||||||||||||||||
|
Siguiri (85 percent)
(3)
|
24.19
|
|
0.65
|
|
15.78
|
63.18
|
0.85
|
53.97
|
|
88.0-93.0
|
(4
|
)
|
0.55-0.75
|
(4)
|
|
|||||||
|
Mali
|
||||||||||||||||||||||
|
Morila (40 percent)
(3) (11)
|
—
|
|
0.00
|
|
0.00
|
4.25
|
0.56
|
2.38
|
|
57.0-91.0
|
(4
|
)
|
0.49
|
|||||||||
|
Sadiola (41 percent)
(3)
|
0.10
|
|
2.14
|
|
0.22
|
28.33
|
1.86
|
52.59
|
|
75.0-94.0
|
(4
|
)
|
0.51-0.87
|
(4)
|
|
|||||||
|
Tanzania
|
||||||||||||||||||||||
|
Geita
|
—
|
|
0.00
|
|
0.00
|
8.54
|
4.55
|
38.86
|
|
76.0-92.0
|
(4
|
)
|
1.40-3.02
|
(4)
|
|
|||||||
|
Australasia
|
||||||||||||||||||||||
|
Australia
|
||||||||||||||||||||||
|
Sunrise Dam
|
10.88
|
|
0.98
|
|
10.64
|
8.24
|
3.22
|
26.50
|
|
85.0-86.0
|
(4
|
)
|
0.75-2.71
|
(4)
|
|
|||||||
|
Tropicana (70 percent)
(3)
|
12.16
|
|
1.29
|
|
15.70
|
34.46
|
2.12
|
73.10
|
|
90.0
|
0.70
|
|||||||||||
|
Americas
|
||||||||||||||||||||||
|
Argentina
|
||||||||||||||||||||||
|
Cerro Vanguardia (92.5 percent)
(3) (7)
|
4.62
|
|
1.69
|
|
7.81
|
5.55
|
3.69
|
20.50
|
|
64.4-95.7
|
(4
|
)
|
0.45-5.00
|
(4)
|
|
|||||||
|
Brazil
|
||||||||||||||||||||||
|
AGA Mineraçáo
(2) (8)
|
3.03
|
|
4.53
|
|
13.73
|
12.01
|
4.48
|
53.76
|
|
67.8-93.8
|
(4
|
)
|
0.61-3.63
|
(4)
|
|
|||||||
|
Serra Grande
(2)
|
1.69
|
|
2.77
|
|
4.68
|
1.77
|
3.16
|
5.60
|
|
86.5-95.3
|
(4
|
)
|
0.66-1.80
|
(4)
|
|
|||||||
|
Colombia
|
||||||||||||||||||||||
|
Gramalote (51 percent)
(3)
|
—
|
|
0.00
|
|
0.00
|
63.71
|
0.86
|
54.67
|
|
83.9-95.0
|
(4
|
)
|
0.16-0.22
|
(4)
|
|
|||||||
|
Total
|
199.32
|
|
0.86
|
|
170.43
|
973.02
|
1.41
|
1,372.04
|
|
|||||||||||||
|
(1)
|
Ore Reserve includes marginally economic and diluting materials delivered for treatment and allow for losses that may occur during mining.
|
|
(2)
|
Proven and/or Probable Ore Reserve includes Ore Reserve below infrastructure. See table that follows.
|
|
(3)
|
Ore Reserve attributable to AngloGold Ashanti’s percentage interest shown.
|
|
(4)
|
Recovery factor and cut-off grade vary according to ore type.
|
|
(5)
|
The Vaal Reef Ore Reserve includes 40.4 thousand tonnes of Uranium oxide by-products; this cannot be accounted for by individual mine as Great Noligwa, Kopanang, Moab Khotsong and Surface sources in Vaal River feed to a combination of plants.
|
|
(6)
|
Tonnes refers to a metric tonne which is equivalent to 1000 kilograms.
|
|
(7)
|
The Ore Reserve contains 678.44 tonnes of silver to be recovered as a by-product.
|
|
(8)
|
The Ore Reserve contains 0.37 million tonnes of sulphur to be recovered as a by-product.
|
|
(9)
|
Includes Mine Waste Solutions (MWS).
|
|
(10)
|
In-situ cut-off grade.
|
|
(11)
|
Ore Reserve is estimated by Competent Persons employed by Randgold Resources Limited.
|
|
(12)
|
No Ore Reserve is declared for 2017 - TauTona is reported under Mponeng.
|
Rounding may result in computational differences
127
The 2017 Proven and Probable Ore Reserve includes Ore Reserve below infrastructure in the case of the following underground mines currently in production:
|
Mine
|
Tonnes (millions)
|
|
Grade (grams/tonne)
|
|
Gold Content (tonnes)
|
|
||
|
Moab Khotsong
|
13.12
|
|
8.24
|
|
108.14
|
|
||
|
Mponeng
|
28.16
|
|
9.38
|
|
264.25
|
|
||
|
Obuasi
|
1.70
|
|
20.68
|
|
35.15
|
|
||
|
AGA Mineração
|
3.53
|
|
5.44
|
|
19.20
|
|
||
|
Serra Grande
|
1.20
|
|
3.52
|
|
4.24
|
|
||
|
Total
|
47.71
|
|
9.03
|
|
430.97
|
|
||
The Ore Reserve has been determined based on completed economic studies.
128
.
|
Ore Reserve: Metric
|
At 31 December 2016
|
|||||||||||||||||||||||||
|
Proven Ore Reserve
(1) (2)
|
Probable Ore Reserve
(1) (2)
|
Metallurgical
|
Cut-off
|
|||||||||||||||||||||||
|
Tonnes
(6)
|
|
Grade
|
|
Gold
Content
|
|
Tonnes
(6)
|
|
Grade
|
|
Gold
Content
|
|
Recovery
Factor
|
Grade
(10)
|
|||||||||||||
|
(million)
|
|
(g/t)
|
|
(tonnes)
|
|
(million)
|
|
(g/t)
|
|
(tonnes)
|
|
percent
|
(g/t)
|
|||||||||||||
|
South Africa
|
||||||||||||||||||||||||||
|
Vaal River
(5)
|
||||||||||||||||||||||||||
|
Kopanang
|
1.62
|
|
5.360
|
|
8.70
|
|
1.00
|
|
5.570
|
|
5.55
|
|
95.6-95.7
|
|
(4)
|
|
9.520
|
|||||||||
|
Moab Khotsong
(2)
|
2.66
|
|
8.550
|
|
22.73
|
|
14.06
|
|
9.450
|
|
132.81
|
|
95.6-96.4
|
|
(4)
|
|
4.07-5.83
|
(4)
|
|
|||||||
|
West Wits
|
||||||||||||||||||||||||||
|
Mponeng
(2)
|
1.21
|
|
9.540
|
|
11.57
|
|
37.62
|
|
10.010
|
|
376.64
|
|
97.4-98.0
|
|
(4)
|
|
4.17-7.14
|
(4)
|
|
|||||||
|
TauTona
|
0.50
|
|
11.070
|
|
5.57
|
|
2.06
|
|
8.320
|
|
17.17
|
|
96.7-97.0
|
|
(4)
|
|
7.50-8.18
|
(4)
|
|
|||||||
|
Surface
|
||||||||||||||||||||||||||
|
Surface sources
(5) (9)
|
132.64
|
|
0.220
|
|
28.58
|
|
633.79
|
|
0.270
|
|
170.42
|
|
42.0-92.0
|
|
(4)
|
|
0.24-0.38
|
(4)
|
|
|||||||
|
Continental Africa
|
||||||||||||||||||||||||||
|
Democratic Republic of the Congo
|
||||||||||||||||||||||||||
|
Kibali (45 percent)
(3) (11)
|
1.94
|
|
1.900
|
|
3.67
|
|
29.92
|
|
4.170
|
|
124.73
|
|
84.5-88.9
|
|
(4)
|
|
1.52-2.40
|
(4)
|
|
|||||||
|
Ghana
|
||||||||||||||||||||||||||
|
Iduapriem
|
2.91
|
|
0.760
|
|
2.20
|
|
42.34
|
|
1.300
|
|
55.11
|
|
92.0-96.0
|
|
(4)
|
|
0.50-0.90
|
(4)
|
|
|||||||
|
Obuasi
(2)
|
—
|
|
—
|
|
—
|
|
21.31
|
|
8.010
|
|
170.74
|
|
89.0
|
4.40-5.20
|
(4)
|
|
||||||||||
|
Guinea
|
||||||||||||||||||||||||||
|
Siguiri (85 percent)
(3)
|
25.50
|
|
0.640
|
|
16.42
|
|
69.01
|
|
0.860
|
|
59.57
|
|
88.0-93.0
|
|
(4)
|
|
0.53-0.75
|
(4)
|
|
|||||||
|
Mali
|
||||||||||||||||||||||||||
|
Morila (40 percent)
(3) (11)
|
—
|
|
—
|
|
—
|
|
6.81
|
|
0.550
|
|
3.37
|
|
57.0
|
0.470
|
||||||||||||
|
Sadiola (41 percent)
(3)
|
0.01
|
|
2.370
|
|
0.02
|
|
31.62
|
|
1.770
|
|
55.90
|
|
75.0-94.0
|
|
(4)
|
|
0.45-0.80
|
(4)
|
|
|||||||
|
Tanzania
|
||||||||||||||||||||||||||
|
Geita
|
—
|
|
—
|
|
—
|
|
16.41
|
|
3.730
|
|
61.17
|
|
89.3-92.7
|
|
(4)
|
|
0.95-4.50
|
(4)
|
|
|||||||
|
Australasia
|
||||||||||||||||||||||||||
|
Australia
|
||||||||||||||||||||||||||
|
Sunrise Dam
|
11.67
|
|
1.000
|
|
11.65
|
|
10.56
|
|
2.860
|
|
30.15
|
|
80.9-85.0
|
|
(4)
|
|
0.60-1.23
|
(4)
|
|
|||||||
|
Tropicana (70 percent) (3)
|
10.98
|
|
1.480
|
|
16.22
|
|
31.09
|
|
2.140
|
|
66.48
|
|
90.0
|
|
0.700
|
|||||||||||
|
Americas
|
||||||||||||||||||||||||||
|
Argentina
|
||||||||||||||||||||||||||
|
Cerro Vanguardia (92.5 percent)
(3) (7)
|
5.97
|
|
1.470
|
|
8.78
|
|
4.26
|
|
4.850
|
|
20.65
|
|
61.8-95.9
|
|
(4)
|
|
0.46-5.00
|
(4)
|
|
|||||||
|
Brazil
|
||||||||||||||||||||||||||
|
AGA Mineraçáo
(2) (8)
|
3.52
|
|
4.810
|
|
16.96
|
|
6.97
|
|
5.200
|
|
36.21
|
|
70.0-93.3
|
|
(4)
|
|
0.58-3.61
|
(4)
|
|
|||||||
|
Serra Grande
(2)
|
2.41
|
|
2.510
|
|
6.05
|
|
3.20
|
|
2.750
|
|
8.81
|
|
88.5-94.7
|
|
(4)
|
|
2.450
|
|||||||||
|
Total
|
203.54
|
|
0.78
|
|
159.11
|
|
961.37
|
|
1.45
|
|
1,395.49
|
|
||||||||||||||
|
(1)
|
Ore Reserve includes marginally economic and diluting materials delivered for treatment and allow for losses that may occur during mining.
|
|
(2)
|
Proven and/or Probable Ore Reserve includes Ore Reserve below infrastructure. See table that follows.
|
|
(3)
|
Ore Reserve attributable to AngloGold Ashanti’s percentage interest shown.
|
|
(4)
|
Recovery factor and cut-off grade vary according to ore type.
|
|
(5)
|
The Vaal Reef Ore Reserve includes 56.0 thousand tonnes of Uranium oxide by-products; this cannot be accounted for by individual mine as Great Noligwa, Kopanang, Moab Khotsong and Surface sources in Vaal River feed to a combination of plants.
|
|
(6)
|
Tonnes refers to a metric tonne which is equivalent to 1000 kilograms.
|
|
(7)
|
The Ore Reserve contains 567.38 tonnes of silver to be recovered as a by-product.
|
|
(8)
|
The Ore Reserve contains 0.42 million tonnes of sulphur to be recovered as a by-product.
|
|
(9)
|
Includes Mine Waste Solutions (MWS).
|
|
(10)
|
In-situ cut-off grade.
|
|
(11)
|
Ore Reserve is estimated by Competent Persons employed by Randgold Resources Limited.
|
Rounding may result in computational differences.
129
The 2016 Proven and Probable Ore Reserve includes Ore Reserve below infrastructure in the case of the following underground mines currently in production:
|
Mine
|
Tonnes (millions)
|
|
Grade (grams/tonne)
|
|
Gold Content (tonnes)
|
|
||
|
Moab Khotsong
|
10.79
|
|
9.59
|
|
103.41
|
|
||
|
Mponeng
|
27.53
|
|
9.67
|
|
266.21
|
|
||
|
Obuasi
|
1.74
|
|
23.11
|
|
40.26
|
|
||
|
AGA Mineração
|
1.79
|
|
6.03
|
|
10.79
|
|
||
|
Serra Grande
|
1.07
|
|
3.03
|
|
3.24
|
|
||
|
Total
|
42.92
|
|
9.88
|
|
423.90
|
|
||
The Ore Reserve has been determined based on completed economic studies.
130
Stockpiles: Imperial
Stockpiles are previously mined ore scheduled for future process plant feed. The Proven and Probable Ore Reserve includes the following stockpile material:
|
Stockpiles
|
At 31 December 2017
|
|||||||
|
Tons (million)
|
|
Grade (ounces/ton)
|
|
Gold content
(million ounces)
|
|
|||
|
South Africa
|
||||||||
|
Surface sources
(2)
|
811.40
|
|
0.008
|
|
6.11
|
|
||
|
Continental Africa
|
||||||||
|
Ghana
|
||||||||
|
Iduapriem
|
12.88
|
|
0.021
|
|
0.27
|
|
||
|
Guinea
|
||||||||
|
Siguiri (85 percent)
(1) (3)
|
61.89
|
|
0.017
|
|
1.06
|
|
||
|
Mali
|
||||||||
|
Morila (40 percent)
(1)
|
4.55
|
|
0.016
|
|
0.07
|
|
||
|
Sadiola (41 percent)
(1)
|
5.14
|
|
0.037
|
|
0.19
|
|
||
|
Tanzania
|
||||||||
|
Geita
|
2.79
|
|
0.041
|
|
0.12
|
|
||
|
Australasia
|
||||||||
|
Australia
|
||||||||
|
Sunrise Dam
|
12.00
|
|
0.029
|
|
0.34
|
|
||
|
Tropicana (70 percent)
(1)
|
8.19
|
|
0.027
|
|
0.22
|
|
||
|
Americas
|
||||||||
|
Argentina
|
||||||||
|
Cerro Vanguardia (92.5 percent)
(1)
|
7.05
|
|
0.019
|
|
0.13
|
|
||
|
Brazil
|
||||||||
|
Serra Grande
|
0.03
|
|
0.050
|
|
0.00
|
|
||
|
(1)
|
Ore Reserve attributable to AngloGold Ashanti’s percentage interest shown.
|
|
(2)
|
Centralised operations treating material on surface that was previously generated by several underground operations, includes tailings material.
|
|
(3)
|
Spent heap included in Ore Reserve.
|
Rounding may result in computational differences.
131
Stockpiles: Imperial
Stockpiles are previously mined ore scheduled for future process plant feed. The Proven and Probable Ore Reserve includes the following stockpile material:
|
Stockpiles
|
At 31 December 2016
|
|||||||
|
Tons (million)
|
|
Grade (ounces/ton)
|
|
Gold content
(million ounces)
|
|
|||
|
South Africa
|
||||||||
|
Surface sources
(2)
|
844.84
|
|
0.008
|
|
6.40
|
|
||
|
Continental Africa
|
||||||||
|
Ghana
|
||||||||
|
Iduapriem
|
12.83
|
|
0.021
|
|
0.27
|
|
||
|
Guinea
|
||||||||
|
Siguiri (85 percent)
(1) (3)
|
63.33
|
|
0.017
|
|
1.08
|
|
||
|
Mali
|
||||||||
|
Morila (40 percent)
(1)
|
6.81
|
|
0.016
|
|
0.11
|
|
||
|
Sadiola (41 percent)
(1)
|
5.80
|
|
0.033
|
|
0.19
|
|
||
|
Tanzania
|
||||||||
|
Geita
|
4.35
|
|
0.039
|
|
0.17
|
|
||
|
Australasia
|
||||||||
|
Australia
|
||||||||
|
Sunrise Dam
|
12.87
|
|
0.029
|
|
0.37
|
|
||
|
Tropicana (70 percent)
(1)
|
7.09
|
|
0.027
|
|
0.19
|
|
||
|
Americas
|
||||||||
|
Argentina
|
||||||||
|
Cerro Vanguardia (92.5 percent)
(1)
|
7.24
|
|
0.019
|
|
0.14
|
|
||
|
Brazil
|
||||||||
|
Serra Grande
|
0.07
|
|
0.058
|
|
0.00
|
|
||
|
(1)
|
Ore Reserve attributable to AngloGold Ashanti’s percentage interest shown.
|
|
(2)
|
Centralised operations treating material on surface that was previously generated by several underground operations, includes tailings material.
|
|
(3)
|
Spent heap included in Ore Reserve.
|
Rounding may result in computational differences.
132
Stockpiles: Metric
Stockpiles are previously mined ore scheduled for future process plant feed. The Proven and Probable Ore Reserve includes the following stockpile material:
|
Stockpiles
|
At 31 December 2017
|
|||||||
|
Tonnes (million)
|
|
Grade (grams/tonne)
|
|
Gold content
(tonnes)
|
|
|||
|
South Africa
|
||||||||
|
Surface sources
(2)
|
736.09
|
|
0.26
|
|
190.10
|
|
||
|
Continental Africa
|
||||||||
|
Ghana
|
||||||||
|
Iduapriem
|
11.68
|
|
0.72
|
|
8.46
|
|
||
|
Guinea
|
||||||||
|
Siguiri (85 percent)
(1) (3)
|
56.15
|
|
0.59
|
|
33.07
|
|
||
|
Mali
|
||||||||
|
Morila (40 percent)
(1)
|
4.13
|
|
0.54
|
|
2.22
|
|
||
|
Sadiola (41 percent)
(1)
|
4.66
|
|
1.27
|
|
5.93
|
|
||
|
Tanzania
|
||||||||
|
Geita
|
2.53
|
|
1.42
|
|
3.59
|
|
||
|
Australasia
|
||||||||
|
Australia
|
||||||||
|
Sunrise Dam
|
10.88
|
|
0.98
|
|
10.64
|
|
||
|
Tropicana (70 percent)
(1)
|
7.43
|
|
0.94
|
|
6.97
|
|
||
|
Americas
|
||||||||
|
Argentina
|
||||||||
|
Cerro Vanguardia (92.5 percent)
(1)
|
6.40
|
|
0.64
|
|
4.09
|
|
||
|
Brazil
|
||||||||
|
Serra Grande
|
0.02
|
|
1.70
|
|
0.04
|
|
||
|
(1)
|
Ore Reserve attributable to AngloGold Ashanti’s percentage interest shown.
|
|
(2)
|
Centralised operations treating material on surface that was previously generated by several underground operations, includes tailings material.
|
|
(3)
|
Spent heap included in Ore Reserve.
|
Rounding may result in computational differences.
133
Stockpiles: Metric
Stockpiles are previously mined ore scheduled for future process plant feed. The Proven and Probable Ore Reserve includes the following stockpile material:
|
Stockpiles
|
At 31 December 2016
|
|||||||
|
Tonnes (million)
|
|
Grade (grams/tonne)
|
|
Gold content
(tonnes)
|
|
|||
|
South Africa
|
||||||||
|
Surface sources
(2)
|
766.42
|
|
0.26
|
|
199.00
|
|
||
|
Continental Africa
|
||||||||
|
Ghana
|
||||||||
|
Iduapriem
|
11.64
|
|
0.72
|
|
8.37
|
|
||
|
Guinea
|
||||||||
|
Siguiri (85 percent)
(1) (3)
|
57.45
|
|
0.59
|
|
33.71
|
|
||
|
Mali
|
||||||||
|
Morila (40 percent)
(1)
|
6.18
|
|
0.55
|
|
3.37
|
|
||
|
Sadiola (41 percent)
(1)
|
5.26
|
|
1.13
|
|
5.94
|
|
||
|
Tanzania
|
||||||||
|
Geita
|
3.95
|
|
1.35
|
|
5.33
|
|
||
|
Australasia
|
||||||||
|
Australia
|
||||||||
|
Sunrise Dam
|
11.67
|
|
1.00
|
|
11.65
|
|
||
|
Tropicana (70 percent)
(1)
|
6.43
|
|
0.92
|
|
5.95
|
|
||
|
Americas
|
||||||||
|
Argentina
|
||||||||
|
Cerro Vanguardia (92.5 percent)
(1)
|
6.57
|
|
0.65
|
|
4.26
|
|
||
|
Brazil
|
||||||||
|
Serra Grande
|
0.06
|
|
2.00
|
|
0.12
|
|
||
|
(1)
|
Ore Reserve attributable to AngloGold Ashanti’s percentage interest shown.
|
|
(2)
|
Centralised operations treating material on surface that was previously generated by several underground operations, includes tailings material.
|
|
(3)
|
Spent heap included in Ore Reserv
e.
|
Rounding may result in computational differences.
134
Drill hole spacing: Imperial
In determining the Proven and Probable Ore Reserve, AngloGold Ashanti applied the following drill hole spacing:
|
Drill Hole Spacing
|
||
|
Proven Ore Reserve
|
Probable Ore Reserve
|
|
|
South Africa
|
||
|
Underground sources
|
Ore body opened up, developed and sampled on a 7 to 10 foot spacing on raise lines and on a 16 x 16 foot grid thereafter
|
From a 131 x 131 foot spacing up to
3281 x 3281 foot spacing
|
|
Surface sources
|
164 x 164 feet to 1050 x 820 feet auger drilling, variable sampling strategies: belt samplers, cross stream residue samplers and bulk sampling campaigns
|
328 x 328 feet to 984 x 1230 feet auger drilling, variable sampling strategies: belt samplers, cross stream residue samplers
|
|
Continental Africa
|
||
|
Democratic Republic of the Congo
|
||
|
Kibali
|
16 x 33 feet, 49 x 66 feet
|
131 x 131 feet
|
|
Ghana
|
||
|
Iduapriem
|
66 x 49 feet
|
164 x 164 feet, 164 x 246 feet, 164 x 328 feet,
|
|
Obuasi
|
66 x 66 feet
|
197 x 197 feet
|
|
Guinea
|
||
|
Siguiri
|
16 x 33 feet, 16 x 39 feet, 33 x 33 feet
|
66 x 131 feet, 82 x 82 feet, 164 x 82 feet
|
|
Mali
|
||
|
Morila
|
33 x 33 feet
|
33 x 16 feet, 164 x 328 feet
|
|
Sadiola
|
21 x 41 feet
|
82 x 82 feet, 164 x 82 feet
|
|
Tanzania
|
||
|
Geita
|
16 x 33 feet, 82 x 49 feet
|
33 x 33 feet, 66 x 66 feet, 82 x 49 feet,
82 x 82 feet, 131 x 66 feet, 131 x 131 feet
|
|
Australasia
|
||
|
Australia
|
||
|
Sunrise Dam
|
30 x 33 feet, 82 x 82 feet
|
131 x 66 feet, 131 x 131 feet
|
|
Tropicana
|
39 x 39 feet, 82 x 82 feet
|
164 x 164 feet
|
|
Americas
|
||
|
Argentina
|
||
|
Cerro Vanguardia
|
39 x 16 feet, 39 x 33 feet
|
131 x 131 feet
|
|
Brazil
|
||
|
AGA Mineraçáo
|
33 x 66 feet, 66 x 33 feet, 66 x 98 feet,
82 x 82 feet
|
66 x 131 feet, 82 x 131 feet, 98 x 82 feet,
131 x 197 feet, 164 x 98 feet, 164 x 164 feet,
197 x 131 feet
|
|
Serra Grande
|
33 x 33 feet, 33 x 66 feet
|
82 x 82 feet, 131 x 66 feet, 131 x 131 feet,
164 x 66 feet
|
|
Colombia
|
||
|
Gramalote
|
None
|
164 x 164 feet
|
135
Drill hole spacing: Metric
In determining the Proven and Probable Ore Reserve, AngloGold Ashanti applied the following table of drill hole spacing:
|
Drill Hole Spacing
|
||
|
Proven Ore Reserve
|
Probable Ore Reserve
|
|
|
South Africa
|
||
|
Underground sources
|
Ore body opened up, developed and sampled on a 2 to 3 metre spacing on raise lines and on a 5 x 5 metre grid thereafter
|
From a 40 x 40 metre spacing up to
1000 x 1000 metre spacing
|
|
Surface sources
|
50 x 50 metre to 320 x 250 metre auger drilling, variable sampling strategies: belt samplers, cross stream residue samplers and bulk sampling campaigns
|
100 x 100 metre to 300 x 375 metre auger drilling, variable sampling strategies: belt samplers, cross stream residue samplers
|
|
Continental Africa
|
||
|
Democratic Republic of the Congo
|
||
|
Kibali
|
5 x 10 metre, 15 x 20 metre
|
40 x 40 metre
|
|
Ghana
|
||
|
Iduapriem
|
20 x 15 metre
|
50 x 50 metre, 50 x 75 metre, 50 x 100 metre,
|
|
Obuasi
|
20 x 20 metre
|
60 x 60 metre
|
|
Guinea
|
||
|
Siguiri
|
5 x 10 metre, 5 x 12 metre,
10 x 10 metre
|
20 x 40 metre, 25 x 25 metre, 50 x 25 metre
|
|
Mali
|
||
|
Morila
|
10 x 10 metre
|
10 x 5 metre, 50 x 100 metre
|
|
Sadiola
|
6.25 x 12.5 metre
|
25 x 25 metre, 50 x 25 metre
|
|
Tanzania
|
||
|
Geita
|
5 x 10 metre, 25 x 15 metre
|
10 x 10 metre, 20 x 20 metre, 25 x 15 metre,
25 x 25 metre, 40 x 20 metre, 40 x 40 metre
|
|
Australasia
|
||
|
Australia
|
||
|
Sunrise Dam
|
9 x 10 metre, 25 x 25 metre
|
40 x 20 metre, 40 x 40 metre
|
|
Tropicana
|
12 x 12 metre, 25 x 25 metre
|
50 x 50 metre
|
|
Americas
|
||
|
Argentina
|
||
|
Cerro Vanguardia
|
12 x 5 metre, 12 x 10 metre
|
40 x 40 metre
|
|
Brazil
|
||
|
AGA Mineraçáo
|
10 x 20 metre, 20 x 10 metre,
25 x 25 metre, 20 x 30 metre,
|
20 x 40 metre, 25 x 40 metre, 30 x 25 metre,
40 x 60 metre, 50 x 30 metre, 50 x 50 metre,
60 x 40 metre
|
|
Serra Grande
|
10 x 10 metre, 10 x 20 metre
|
25 x 25 metre, 40 x 20 metre,
40 x 40 metre, 50 x 20 metre
|
|
Colombia
|
||
|
Gramalote
|
None
|
50 x 50 metre
|
136
|
ITEM 4A:
|
UNRESOLVED STAFF COMMENTS
|
Not applicable.
137
The following discussion provides information that management believes is relevant to an assessment and understanding of the consolidated financial condition and results of operations of AngloGold Ashanti Limited under IFRS for the three years ended and as at 31 December 2017, 2016 and 2015.
This item should be read in conjunction with the company’s consolidated financial statements and the notes thereto which are included under Item 18 of this annual report.
Overview
AngloGold Ashanti is a global gold mining company headquartered in Johannesburg, South Africa. AngloGold Ashanti’s main product is gold. As part of extracting gold the company also produces silver, uranium oxide and sulphuric acid as by-products. Revenue from the sale of by-products is recognised as a reduction of cost of sales in the consolidated statement of income. By-product revenue amounted to $154 million in 2017 (2016: $138 million; 2015: $127 million) out of total revenue of $4,543 million in 2017 (2016: $4,254 million; 2015: $4,174 million). See “Note 3 - Revenue” to the consolidated financial statements for additional information. The company sells its products on world markets.
AngloGold Ashanti conducts gold-mining operations in the following regions, which represent its business segments:
|
•
|
South Africa (comprising the Vaal River, West Wits and Surface Operations)
|
|
•
|
Continental Africa (comprising Ghana, Guinea, Mali, the DRC and Tanzania)
|
|
•
|
Australasia (comprising Australia)
|
|
•
|
Americas (comprising Argentina, Brazil and United States of America (sold August 2015))
|
In particular, AngloGold Ashanti has 15 mines and two surface operations in the four regions comprising open-pit and underground mines and surface metallurgical plants, which are supported by extensive, yet focused exploration activities. For more information on the company’s business and operations, see “Item 4B: Business Overview”.
As at 31 December 2017 the company reported, on an attributable basis, Proven and Probable Ore Reserve of approximately 42.1 million ounces in subsidiaries and 7.5 million ounces in equity accounted joint ventures. For the year ended 31 December 2017, AngloGold Ashanti reported an attributable gold production of approximately 3.4 million ounces from subsidiaries and 0.4 million ounces from equity accounted joint ventures.
AngloGold Ashanti’s costs and expenses consist primarily of total cash costs, amortisation, corporate administration, and other expenses and exploration and evaluation costs. Total cash costs include salaries and wages, stores and other consumables (which include explosives, timber and reagents amongst others), fuel, power and water, contractors’ costs and royalties. The company’s mining operations consist of deep-level underground mines as well as open-pit operations, both of which are labour intensive, therefore salaries and wages are a significant component of total cash costs.
Outlook
Gold production (including our attributable share of joint ventures) for 2018 is forecast to be between 3.325 million and 3.450 million ounces (includes three months of production from the Moab Khotsong and Kopanang mines at approximately 30,000 ounces per month). Capital expenditure (including our attributable share of joint ventures) is expected to be approximately between $800 million and $920 million in 2018, on the following assumptions: R12.79/$, $/A$0.78, BRL3.20/$ and ARS19.61/$; Brent crude at $62 per barrel.
AngloGold Ashanti’s results of operations, financial condition and prospects, as well as the company's ability to meet its targets, may be adversely affected by a number of factors, risks and uncertainties, some of which are beyond the company's control, including gold prices, exchange rate fluctuations, inflation, as well as political, mining and other risks. In particular, our production outlook is subject to, among other things, labour disruptions, unplanned stoppages and safety-related interventions, the stability and availability of power as well as other operational risks. Certain of these risks, uncertainties and other factors are described in “Item 3D: Risk factors”. See also “Note regarding forward-looking statements”. Furthermore, the forecast assumes no changes to the asset portfolio/operating mines.
138
|
5A:
|
OPERATING RESULTS
|
INTRODUCTION
Global stock markets ended 2017 on record highs, with the MSCI all-country world index gaining 22 percent or US$9 trillion on the year, reaching an all-time high, all due to a strong global economy. Additionally, the US Tax Cuts and Jobs Act and the US Federal Reserve’s gradual approach to easing financial support also contributed to the rising stock market.
Even the rival attractions of Bitcoin (up nearly 14 times over the year), concerns about a US lead nuclear war with North Korea, political upheaval in Europe following the Catalan separatist movement in Spain and an inconclusive German election in September 2017 failed to dampen sentiment. Surprisingly the global volatility index is trading at historically low levels.
Given the strength of the global stock markets in 2017, it is surprising that the US dollar price of gold was up 13 percent for the year, its biggest annual gain since 2010, outperforming all major asset classes other than stocks. Supporting the price of gold were, a weakening US dollar and elevated price/earnings ratios and valuations. In light of these circumstances, gold was likely seen as a means of managing these market risks. The geopolitical instability further heightened investor uncertainty and fuelled flows into gold.
International Monetary policy tightening was implemented across the globe pushing up global short-term bond yields while long-term yields remained relatively flat. The US Federal Reserve increased interest rates three times during the year by 25 basis points each, while the Bank of England lifted its benchmark rate during November for the first time in a decade to a half percent from a quarter percent prior. The European Central Bank (ECB) claimed victory over deflation in March 2017 and signalled that its monetary policy would become gradually less expansionary.
Central Banks were also very active in the gold market with Russia increasing its holdings in the final two months of the year. Net Central Bank purchases recorded a gain of 36 percent in aggregate during quarter four of 2017 adding 132 tonnes. For 2017, the official sector remained an important source of demand for gold and net purchases were up 123 tonnes (48 percent) to 381 tonnes compared to 2016 (258 tonnes).
Jewellery consumption for 2017 was up by 13 percent compared to 2016, with the major regions (including India and China) recording year-on-year gains. India’s jewellery consumption increased by eight percent in the final quarter, helped by a surge in sales during Dhanteras (1st day of Diwali) and lower prices toward year end. Jewellery fabrication also increased by five and a half percent in 2017 from 2016. Chinese demand slipped by two percent year-on-year, with ongoing losses in the pure gold segment as consumer preferences continued to shift towards more fashionable, but lower gold content pieces. After posting double-digit percentage declines on average since its 2013 peak, China’s jewellery offtake appears to have stabilised in 2017. On an annual basis, physical demand was up 11 percent from 3,556 tonnes in 2016 to 3,932 tonnes in 2017.
Supply was down four percent for 2017 compared to 2016. Although mine production increased slightly year-on-year, this was offset by recycling and hedging activity.
Investors continued to add gold to their portfolios, with inflows into global gold-backed exchange-traded funds totalling US$8 billion or 7 million ounces. Speculators increased their gold net long position by 7 million ounces year-on-year on the Commodity Exchange (Comex) underpinning the positive sentiment in the gold market in 2017.
December was the most volatile month where the price fell to as low as US$1,243 per ounce but also reached the high of the year of US$1,307 per ounce. The gold price at year end was US$1,302 per ounce. The gold price received averaged US$1,258 per ounce in 2017, US$9 higher than in 2016 (supporting AGA’s strategy to link revenue directly to the price of gold).
Assets held for sale
On 19 October 2017, AngloGold Ashanti announced the sale of the Kopanang Mine and related infrastructure to Heaven-Sent SA Sunshine Investment Company Limited (Heaven-Sent). Under the sale agreement, one of the conditions precedent was for the new owners to conclude an agreement with AngloGold Ashanti and the employees’ organised labour representatives to determine the number of existing employees who would continue to work at the operations after the change in ownership becomes effective. This agreement was concluded on 16 November 2017. Of the total workforce of 3,638 employees, 3,054 employees transferred to the new owner Heaven-Sent. AngloGold Ashanti is honoring its undertaking to pay accrued severance packages to all affected employees at Kopanang immediately following the conclusion of the sale transaction. The Kopanang sale transaction became unconditional on 28 February 2018.
Additionally, on 19 October 2017 the conclusion of the sale agreement for the disposal of the Moab Khotsong and Great Noligwa mines and related infrastructure to Harmony Gold Mining Company Limited (Harmony), was announced. This transaction was also subject to conditions precedent, all of which, including Section 11 and 102 approvals, Competition Commission and Tribunal approval, Harmony shareholder approval, as well as the release of AngloGold Ashanti from the management and rehabilitation liabilities of underground water in the KOSH basin, were achieved. Consequently, the Moab Khotsong and Great Noligwa sale transaction closed on 28 February 2018.
139
Following the completion of the above asset sale transactions, AngloGold Ashanti will have no underground mining operations in the Vaal River region in South Africa. AngloGold Ashanti will retain the long-life Mine Waste Solutions tailings retreatment operation, as well as the surface rock-dump reclamation operations that will continue to be treated through the Kopanang gold plant, which will also be retained by AngloGold Ashanti. These two operations in the Vaal River region, together with the long-life Mponeng mine in the West Wits region, will form AngloGold Ashanti’s operating base in South Africa and contribute 13 percent of the group’s production on a proforma basis.
See “Note 23 - Non-current assets and liabilities held for sale” to the consolidated financial statements for additional information.
Disposed assets
In August 2015, AngloGold Ashanti completed its disposal of Cripple Creek & Victor (CC&V), its sole operation in North America, to Newmont Mining Corporation for proceeds of $819.4 million. See “Item 18: Group Income Statement” for the operating results of the CC&V discontinued operation up to the date of disposal.
The financial results of CC&V have been presented as discontinued operations in the consolidated financial statements and the comparative statements of operations and the statement of cash flows have been presented as if CC&V had been discontinued from the start of the comparative periods. The discussion of financial results of AngloGold Ashanti in this Operating and Financial review and Prospects relates to continuing operations only unless the context indicates otherwise.
The proceeds from the sale of CC&V were primarily used to execute a partial tender offer for the company’s long-term debt under its 8.50 percent bonds due in 2020. See “Item 5B: Liquidity and Capital Resources”.
Key factors affecting results
Gold prices
AngloGold Ashanti’s operating results are directly related to the price of gold, which can fluctuate widely and is affected by numerous factors beyond its control, including investment, jewellery and industrial demand (particularly in China and India), expectations with respect to the rate of inflation, the strength of the US dollar (the currency in which the price of gold is generally quoted) and of other currencies, interest rates, actual or expected gold sales and purchases by central banks and the International Monetary Fund (IMF), global or regional political or economic events, and production and cost levels in major gold-producing regions.
The current demand for and supply of gold may affect gold prices, but not necessarily in the same manner as current supply and demand affects the prices of other commodities. The supply of gold consists of a combination of new production and fabricated gold held by governments, public and private financial institutions, industrial organisations and private individuals. As the global gold production in any single year constitutes a small portion of the total potential supply of gold, short term variations in current production do not necessarily have a significant impact on the supply of gold or on its price.
The market for gold bullion bar, the company’s primary product, is generally limited to the bullion banks. The number of these banks has declined over the last few years. Additionally, due to the diversity and depth of the total gold market, the bullion banks do not possess significant pricing power.
The price of gold is often subject to sharp, short-term changes. The shift in gold demand from physical demand to investment and speculative demand may exacerbate the volatility of gold prices.
Yearly average gold prices received have changed during the three years under review as follows:
|
•
|
2015 - $1,159 per ounce
|
|
•
|
2016 - $1,249 per ounce
|
|
•
|
2017 - $1,258 per ounce
|
The average of the spot gold price from 1 January 2018 to 19 March 2018 was $1,329 per ounce. On 19 March 2018, the afternoon price for gold on the London Bullion Market was $1,317 per ounce.
If income from gold sales falls for an extended period below the company’s total cash costs at its operations, AngloGold Ashanti could determine that it is not economically feasible to continue production at some or all of its operations. Declining gold prices may also force a reassessment of the feasibility of a particular exploration or development project or projects, and could lead to the curtailment or suspension of such projects. A sustained decrease in gold prices may force the company to change its dividend payment policies, reduce expenditures and undertake measures to address its cost base. In addition, the use of lower gold prices in Ore Reserve estimates and life-of-mine plans could result in material write-downs of the company’s investment in mining properties and increase amortisation, rehabilitation and closure charges.
140
Production levels
In addition to gold prices, AngloGold Ashanti’s gold income in any year is also influenced by its level of gold production. Production levels are in turn influenced by grades, tonnages mined and processed through the plant, and metallurgical recoveries. Attributable gold production (including joint ventures) increased from 3.63 million ounces in 2016 to 3.76 million ounces in 2017. The increase in production levels is due to a variety of factors, as follows:
|
•
|
South Africa: 64,000 ounces or seven percent decline in production in 2017 primarily due to the closure of TauTona, lower volumes and grades mined.
|
|
•
|
Continental Africa: 132,000 ounces or 10 percent increase in production primarily due to higher grades mined, as well as higher underground volumes.
|
|
•
|
Australasia: 39,000 ounces or eight percent increase in production primarily due to increased grades, improved metallurgical recoveries and improved mill throughput.
|
|
•
|
Americas: 20,000 ounces or two percent increase in production primarily due to higher tonnages mined, coupled with improved plant performance at AGA Mineração in Brazil.
|
Foreign exchange fluctuations
Total cash costs in all business segments are for local procurement largely incurred in local currency where the relevant operation is located. US dollar denominated total cash costs and net income tend to be adversely impacted by local currency strength and favourably impacted by local currency weakness, assuming there are no other offsetting factors. AngloGold Ashanti’s financial results can be influenced significantly by the fluctuations in the South African Rand, Brazilian Real, Australian Dollar, and, to a lesser extent, the Argentinian Peso, Ghanaian Cedi and other local currencies. As set out below, during the year ended 31 December 2017, the Argentinean Peso weakened and the South African Rand, Australian dollar and Brazilian Real strengthened, which had a favourable impact on AngloGold Ashanti’s US dollar denominated total cash costs.
|
Average annual exchange rates to the US dollar
|
2017
|
|
2016
|
|
2015
|
|
||
|
South African Rand
|
13.30
|
|
14.68
|
|
12.77
|
|
||
|
Brazilian Real
|
3.19
|
|
3.48
|
|
3.33
|
|
||
|
Australian Dollar
|
1.30
|
|
1.35
|
|
1.33
|
|
||
|
Argentinian Peso
|
16.57
|
|
14.78
|
|
9.26
|
|
||
In 2017, the company derived 67 percent (61 percent including joint ventures) of its revenues from South Africa, Brazil, Australia and Argentina, and incurred 71 percent (64 percent including joint ventures) of its total cash costs in South Africa, Brazil, Australia and Argentina. A one percent strengthening of these local currencies against the US dollar will result in an increase in total cash costs incurred of about $21 million or $6 per ounce.
Certain exchange controls were in force in emerging markets in which the company operates during the period under review, including, for example, South Africa and Argentina. In the case of South Africa, although the exchange rate of the rand is primarily market determined, its value at any time may not be considered a true reflection of the underlying value while exchange controls exist. The government has indicated its intention to relax exchange controls over time. As exchange controls are relaxed, rand exchange rates will be more closely tied to market forces. It is not possible to predict whether or when this will occur or the future value of the rand. For a detailed discussion of these exchange controls, see “Item 10D: Exchange controls”.
Total cash costs and effects of inflation
Total cash costs include salaries and wages, stores and other consumables (which include explosives, timber and reagents among others), fuel, power and water, contractors’ costs and royalties. The mining industry continues to experience price inflation for costs of inputs used in the production of gold, which leads to higher total cash costs reported by many gold producers.
AngloGold Ashanti is unable to control the prices at which it sells its gold. Accordingly, in the event of significant inflation in South Africa or, to a lesser extent, Brazil, Argentina or Australia, without a concurrent devaluation of the local currency or an increase in the price of gold, there could be a material adverse effect upon the company’s results and financial condition.
AngloGold Ashanti employs over 51,000 people globally, most of whom are members of trade unions, particularly in South Africa, Continental Africa and the Americas. Salaries and wages account for a significant component of local total cash costs and are impacted by annual wage increases.
Energy costs, comprising power, fuel and lubricants, are another material component of total cash costs. Due to the remote location of some of its mines in Continental Africa, AngloGold Ashanti uses fuel to generate power and uses fuel and lubricants at its mines to run its fleet and processing plants. The price of oil has fluctuated between $54 and $65 per barrel of Brent crude in 2017. AngloGold Ashanti estimates that for each $1 per barrel rise in the oil price, other factors remaining equal, the average total cash costs of all its operations increases by about $3 million or $0.8 per ounce, with the total cash costs of certain of the
141
company’s mines, particularly Geita, Siguiri, Sadiola and Kibali, which are more dependent on fuel, being more sensitive to changes in the price of oil. Energy costs, even in business segments which are supported by grid power, like South Africa, have increased considerably over the three year period, with price increases from Eskom (South Africa’s power utility) that exceeded average inflation. These increases have adversely impacted total cash costs.
AngloGold Ashanti has no influence over the cost of most consumables, many of which are linked to some degree to the price of oil and steel and in a number of cases have exceeded inflation. Furthermore, there has also been volatility recently in the price of steel, used in the manufacture of most forms of fixed and mobile mining equipment, which is a relatively large contributor to the operating costs and capital expenditure of a mine. Fluctuations in oil and steel prices have a significant impact on operating costs and capital expenditure.
Royalties (excluding joint ventures), which are generally calculated as a percentage of revenue, varied over the past three years from $100 million incurred in 2015 to $105 million incurred in 2016 and $116 million in 2017, primarily due to the variations in the gold prices received, production and royalty rate increases. At Geita in Tanzania, despite the dispute over the legal basis for the increased royalty rate, from four percent to six percent, and the imposition of one percent clearing fee for the export of gold. Our subsidiaries in Tanzania are paying the new levies under protest. As a result, the additional royalty of $11 million paid has been expensed and accounted for as a special item.
Royalties are likely to continue to vary in the coming years as in a number of jurisdictions host governments increasingly seek to obtain a higher share of revenue by increasing the royalty rates for gold mines.
Rehabilitation costs
Total provisions for decommissioning and for restoration (excluding joint ventures) totalled $705 million in 2016 and $695 million in 2017. The change in estimates is attributable to changes in discount rates due to changes in global economic assumptions and changes in mine plans resulting in a change in cash flows and changes in design of tailings storage facilities and in methodology following requests from the environmental regulatory authorities and royalty rate increases. During 2017 $23 million for restoration and decommissioning was transferred to assets held for sale.
Amortisation of tangible assets
Amortisation of tangible assets increased during the 2015 - 2017 period, from $737 million to $817 million, largely due to increased production at Geita, Siguiri and Cerro Vanguardia. The increase in amortisation was partly offset by the impairment of assets at Kopanang and Tau Tona and the reclassification of the assets and liabilities of Moab Khotsong and Kopanang, to non-current assets and liabilities held for sale during October 2017, at which stage, amortisation of these assets ceased.
Exploration and evaluation costs
The company has expensed exploration expenditure during the years ended 31 December 2015, 2016 and 2017 in order to replenish depleting Ore Reserve and bring new ore bodies into pre-feasibility or feasibility. The expensed exploration costs incurred over the last three fiscal years amounted to $132 million in 2015, $133 million in 2016 and $114 million in 2017. Exploration expenditure reduced during 2017, with a reduction in greenfields exploration as well as lower spend on prefeasibility studies.
Corporate administration, marketing and other expenses
The corporate administration, marketing and other expenses incurred amounted to $78 million in 2015, $61 million in 2016 and $64 million in 2017. The costs were higher in 2017 mainly due to the stronger rand.
Special items
AngloGold Ashanti reviews and tests the carrying value of its assets when events or changes in circumstances suggest that the carrying amount may not be recoverable. AngloGold Ashanti values individual mining assets at the lowest level for which cash flows are identifiable as independent of cash flows of other mining assets and liabilities.
If there are indications that impairment may have occurred, AngloGold Ashanti prepares estimates of expected future cash flows for each group of assets. Expected future cash flows are inherently uncertain, and could materially change over time. They are significantly affected by Ore Reserve and production estimates, together with economic factors, such as spot and forward gold prices, discount rates, currency exchange rates, estimates of costs to produce Ore Reserves and future capital expenditures. Alternatively, should any of these factors reverse, then AngloGold Ashanti may have to reverse previously recognised impairments.
When reviewing goodwill and other tangible assets for impairment, AngloGold Ashanti's assumption on gold price represents its best estimate of the future price of gold. In arriving at the estimated long-term real gold price, AngloGold Ashanti considers all available market information including current prices, historical averages, and forward pricing information and data. The long term real gold price of $1,240 per ounce in 2017 and $1,212 per ounce in 2016, were based on a range of economic and market conditions, which were, at that time, expected to exist over the remaining useful life of the assets.
142
AngloGold Ashanti considers the long-term fundamentals that provide support to the gold price assumption. These include, amongst other things, gold as a long-term store of value, hedge against inflation, safe haven status, strong physical demand from emerging markets, central bank purchases, quantitative easing and devaluation of paper currency, falling global mine production and rising costs of producing gold, all of which represent significant and enduring trends supportive of AngloGold Ashanti's gold price assumption.
The actual spot gold price averaged $1,257 per ounce in 2017 and $1,248 per ounce in 2016. The gold price in 2018 has been subject to volatile short term swings and has averaged $1,329 per ounce from 1 January 2018 to 19 March 2018 and closed at $1,317 per ounce on 19 March 2018.
AngloGold Ashanti will continue to monitor the underlying long-term factors driving the gold price and will review its gold price assumption, should it consider it appropriate to do so.
Furthermore, should the gold price fall and remain at such lower levels, management will consider, in addition to other mitigating factors, reviewing and amending the life of mine plans to reduce expenditures, optimise costs and increase cash flows in respect of its mining assets.
Taxation
Taxation decreased over the period 2015 - 2017 from an expense of $211 million in 2015 to an expense of $108 million in 2017. Reduction in taxation over the period 2015 - 2017 is largely due to a lower deferred taxation rate in South Africa in carry forward losses and in Brazil due to the effect of exchange rate movements as well as lower current and withholding taxes related to Tanzanian operations.
Taxation is likely to continue to be volatile in the coming years, as host governments in a number of jurisdictions increasingly seek to obtain a higher share of revenue by increasing rates of existing taxes and introducing new taxes on gold mines.
Production in 2017
For the year ended 31 December 2017, AngloGold Ashanti’s total attributable gold production of 3.76 million ounces was 130,000 ounces, or four percent, higher than the 2016 production of 3.63 million ounces.
In
South Africa
, gold production decreased by seven percent, or 64,000 ounces, in 2017 as compared to 2016. The decrease was mainly due to the downscaling of production activities as a result of the orderly closure of TauTona. Lower production at Mponeng was due to lower grades as a result of lower reef values and the planned move from higher grade areas. Lower production at Vaal River Surface Operations was due to low mill availability at the Kopanang Gold Plant and the suspension of the processing of Kopanang marginal ore dumps. The decrease in production was partially offset by higher production at Moab Khotsong due to improved production efficiencies and fewer safety stoppages. Higher production was also recorded at Mine Waste Solutions due to the increase in feed grades due to higher grades from the Sulphur pay and the East tailing storage facilities, coupled with improvements in recoveries.
Production increased by 10 percent, or 132,000 ounces, in 2017, as compared to 2016, in
Continental Africa
. The increase was mainly due to higher recovered grades at Iduapriem, higher grades mined at Siguiri, which included mining in the new Seguelen pit and the higher recovered grades at Geita due to the planned mining of higher grade areas as Geita continues mining in Nyankanga Cut 7 and 8.
Production increased by eight percent, or 39,000 ounces, in 2017, as compared to 2016, in
Australia
. Gold production increased at Sunrise Dam due to increased grades, increased mill throughput and improved metallurgical recoveries. Improved mill throughput resulted in higher production at Tropicana.
In the
Americas
region, production increased by two percent, or 20,000 ounces in 2017 as compared to 2016. The increase was mainly due to higher production from CDS Operation with higher tonnes from the Sulphide mine and grade from both the Oxide and Sulphide mines at AGA Mineração in Brazil.
Production in 2016
For the year ended 31 December 2016, AngloGold Ashanti’s total attributable gold production of 3.63 million ounces was 320,000 ounces, or eight percent, lower than the 2015 production of 3.95 million ounces which included discontinued operations.
In
South Africa
, gold production decreased by four percent, or 37,000 ounces, in 2016 as compared to 2015. The lower production was due to safety stoppages and lower grades at TauTona and Kopanang. The decrease in production was partially offset by higher production at Moab Khotsong and Mponeng due to less safety stoppages in 2016 and higher grades at Moab Khotsong and higher volumes treated at Mponeng.
143
Production decreased by eight percent, or 114,000 ounces, in 2016, as compared to 2015, in
Continental Africa
. The decrease was due to the cessation of tailings treatment at Obuasi, lower grades mined at Geita and Kibali, and Morila transitioning to end-of-life treating marginal and tailings grade. The decrease was partially offset by higher production at Iduapriem due to higher grades and an improvement in tonnage throughput in the plant.
Production decreased by seven percent, or 40,000 ounces, in 2016, as compared to 2015, in
Australia
mainly due to lower planned grades mined at Tropicana. The decrease was partially offset by higher production at Sunrise Dam due to higher tonnes treated.
In the
Americas
region, production decreased by one percent, or 11,000 ounces (excluding discontinued operations) in 2016 as compared to 2015. The decrease was mainly due to lower grades as a result of operational and geotechnical issues in Brazil at AGA Mineração. The decrease was partially offset by a slight increase in production at Cerro Vanguardia as a result of higher tonnes treated
Comparison of financial performance in 2017, 2016 and 2015
|
Financial performance of AngloGold Ashanti
|
Year ended 31 December
|
|||||||
|
(in millions)
|
2017
|
|
2016
|
|
2015
|
|
||
|
Gold income
|
4,356
|
|
4,085
|
|
4,015
|
|
||
|
Cost of sales
|
(3,582
|
)
|
(3,263
|
)
|
(3,294
|
)
|
||
|
Other expenses
|
(859
|
)
|
(564
|
)
|
(552
|
)
|
||
|
Share of associates and joint ventures’ profit
|
22
|
|
11
|
|
88
|
|
||
|
Taxation expense
|
(108
|
)
|
(189
|
)
|
(211
|
)
|
||
|
Net profit attributable to non-controlling interests
|
20
|
|
17
|
|
15
|
|
||
|
Net (loss) profit attributable to equity shareholders – Continuing operations
|
(191
|
)
|
63
|
|
31
|
|
||
|
Net (loss) profit attributable to equity shareholders – Discontinued operations
|
—
|
|
—
|
|
(116
|
)
|
||
Comparison of total cost of sales in 2017, 2016 and 2015
The following table presents cost of sales from continuing operations for the AngloGold Ashanti group for the three-year period ended 31 December 2017:
|
Cost of sales for AngloGold Ashanti
|
Year ended December 31
|
|||||||
|
2017
|
|
2016
|
|
2015
(1)
|
|
|||
|
Total cost of sales
|
3,582
|
|
3,263
|
|
3,294
|
|
||
|
Inventory change
|
(15
|
)
|
38
|
|
(23
|
)
|
||
|
Amortisation of tangible assets
|
(817
|
)
|
(789
|
)
|
(737
|
)
|
||
|
Amortisation of intangible assets
|
(6
|
)
|
(20
|
)
|
(40
|
)
|
||
|
Retrenchment costs
|
(6
|
)
|
(14
|
)
|
(11
|
)
|
||
|
Rehabilitation and other non-cash costs
|
(29
|
)
|
(43
|
)
|
10
|
|
||
|
Total cash costs
|
2,709
|
|
2,435
|
|
2,493
|
|
||
|
Royalties
|
(116
|
)
|
(105
|
)
|
(100
|
)
|
||
|
Other cash costs
|
(19
|
)
|
(24
|
)
|
(27
|
)
|
||
|
2,574
|
|
2,306
|
|
2,366
|
|
|||
|
By-products revenue
|
154
|
|
138
|
|
127
|
|
||
|
Cash operating costs
|
2,728
|
|
2,444
|
|
2,493
|
|
||
(1)
Excluding discontinued operations in 2015.
Comparison of financial performance in 2017 with 2016
Our gold income is materially impacted by price and volume variances. All of our costs are impacted by the consequences of average exchange rate movements.
Exchange fluctuations in and the average exchange rates for the South African Rand, Brazilian Real, Australian Dollar and the Argentinean Peso have effects on the various components that make up our costs based on the level of local procurement of each of these costs. For a discussion of the effect of foreign exchange fluctuations on our financial results, see “Item 5A-Foreign exchange fluctuations”.
144
Gold income
Gold income increased by $271 million, or seven percent, from $4,085 million in 2016 to $4,356 million in 2017, mainly as a result of the increase in gold sold of 179,000 ounces, which resulted in an income of $241 million. The gold price received increased by $9 per ounce, or one percent, from $1,249 per ounce during 2016 to $1,258 per ounce in 2017 which resulted in a further increase in gold income of $30 million.
Gold income from the South African operations in 2017 decreased by $72 million, or six percent, to $1,101 million from $1,173 million in 2016. The decrease was mainly as a result of the decrease in gold sold of 61,000 ounces, primarily as a result of the orderly closure of Tau Tona, which accounted for a $80 million decrease in gold income. The decrease was partially offset by the increase in the gold price received which resulted in an increase in gold income of $8 million.
Gold income from the Continental Africa operations increased by $212 million, or 17 percent, to $1,442 million in 2017 from $1,230 million in 2016, mainly as a result of the increase in gold sold of 149,000 ounces, which resulted in an increase of gold income of $203 million. The increase in production was mainly due to higher recovered grades at Iduapriem, Siguiri and Geita. The increase in the gold price received resulted in an increase in gold income of $9 million.
Gold income from Australia increased by $63 million, or 10 percent, from $646 million in 2016 to $709 million in 2017. The increase was due to the increase of 43,000 ounces in gold sold in 2017, which resulted in an increase in gold income of $59 million. Gold production increased at Sunrise Dam due to increased grades and improved metallurgical recoveries and improved mill throughput resulted in higher production at Tropicana. The increase in the gold price received resulted in an increase in gold income of $4 million.
Gold income from the Americas operations increased by $68 million, or seven percent, from $1,036 million in 2016 to $1,104 million in 2017. The increase was due to an increase of 47,000 ounces in gold sold in 2017, which resulted in an increase in gold income of $61 million. Gold production primarily increased at AGA Mineração in Brazil mainly due to higher underground tonnages mined, coupled with improved grades. The increase in the gold price received resulted in an increase in gold income of $7 million.
Cost of sales
Cost of sales increased from $3,263 million in 2016 to $3,582 million in 2017, which represents a $319 million or 10 percent increase. The increase was primarily due to $284 million, or 12 percent, increase in cash operating costs from $2,444 million in 2016 to $2,728 million in 2017. The increase in cash operating costs was due to the strengthening of local currencies against the US dollar and inflationary increases in labour costs, stores and consumable costs, fuel and power costs and contractor costs. The increase in royalties of $11 million is due to the increase in revenue from the higher gold price, production achieved and increased royalty rates in 2017 compared to 2016. The additional royalty paid at Geita of $11 million was accounted for as a special item (refer to explanation above under total cash costs and impacts of inflation). Total amortisation increased by $14 million from $809 million in 2016 to $823 million in 2017. There was a $53 million inventory change from negative $38 million to positive $15 million due to a decrease in gold on hand. The increase in costs was partially offset by a $16 million increase in by-product revenue due to higher silver volumes sold. Rehabilitation and other non-cash costs decreased by $14 million from $43 million in 2016 to $29 million in 2017. This decrease arose from the changes to cash flows, inflation rates and discount rates compared to 2016. Retrenchment costs decreased by $8 million from $14 million in 2016 to $6 million in 2017.
In South Africa cost of sales increased from $1,041 million in 2016 to $1,114 million in 2017, which represents a $73 million or seven percent increase. The increase was mainly due to the increase in labour costs, stores and consumable costs, fuel and power costs, service related costs and the strengthening of the local currency against the US dollar. The increase was partially offset by a decrease in amortisation of tangible assets and retrenchment costs.
In Continental Africa cost of sales increased from $925 million in 2016 to $1,070 million in 2017, which represents a $145 million or 16 percent increase. The increase was mainly due to an increase in contractor costs, labour costs, stores and consumable costs, fuel and power costs, amortisation of tangible assets and inventory change. The increase was partially offset by a decrease in service related costs and rehabilitation and other non-cash costs.
In Australasia cost of sales increased from $540 million in 2016 to $550 million in 2017, which represents a $10 million increase. The increase was mainly due to the strengthening of the local currency against the US dollar, amortisation of tangible assets and inventory change.
In the Americas cost of sales increased from $752 million in 2016 to $851 million in 2017, which represents a $99 million or 13 percent increase. The increase was mainly due an increase in labour costs, stores and consumable costs, fuel and power costs, contractor costs, total amortisation and inventory change. The increase was partially offset by a decrease in service related costs and an increase in by-product revenue from silver which was higher due to volumes sold.
145
Total cash costs
Total cash costs increased from $2,435 million in 2016 to $2,709 million in 2017, which represents a $274 million, or 11 percent, increase. The increase was primarily due to an increase in salaries and wages costs, stores and other consumables costs, fuel and power costs, contractor costs and royalties. The strengthening of local currencies contributed $119 million to the increase. The increase was partially offset by a decrease in service related costs and an increase in revenue from by-products.
Labour costs
increased from $859 million in 2016 to $946 million in 2017, which represents $87 million, or a 10 percent, increase.
In South Africa labour increased by $44 million, or 10 percent, from $428 million in 2016 to $472 million in 2017 mainly due to inflation and the strengthening of the local currency against the US dollar.
In Continental Africa labour increased by $14 million, or 11 percent, from $133 million in 2016 to $147 million in 2017 mainly due to inflation.
In Australia labour increased by $10 million, or 17 percent, from $59 million in 2016 to $69 million in 2017 mainly due to inflation and the strengthening of the local currency against the US dollar.
In the Americas labour increased by $18 million, or eight percent, from $237 million in 2016 to $255 million in 2017.
Consumable stores
increased from $534 million in 2016 to $618 million in 2017, which represents a $84 million, or 16 percent, increase. The increase was due mainly due to an increase in engineering material at Geita and Cerro Vanguardia due to higher spending on underground development.
Fuel, power and water costs
increased from $414 million in 2016 to $464 million in 2017, which represents a $50 million, or 12 percent, increase.
The increase was mainly due to the average $11 dollar per barrel, or 26 percent, increase in oil prices which resulted in fuel cost increasing across the group by $34 million, or 25 percent, from $136 million to $170 million.
Power cost increased by $14 million from $267 million in 2016 to $281 million in 2017. The increase was mainly due to the $13 million increase in South Africa. The increase was mainly due to inflation and the nine percent stronger South African rand partially offset by lower production.
Contractor costs
increased from $443 million in 2016 to $622 million in 2017, which represents $179 million, or a 40 percent increase. The increase was mainly due to an increase of $84 million at Geita due to the ramping up of underground mining and $35 million in Australia due to increase production.
Service and other charges
decreased from $193 million in 2016 to $78 million in 2017. This decrease was mainly due to lower ore stockpile adjustments and increased capital ore reserve development credits in 2017 compared to 2016.
Revenue from by-products
, included in total cash costs, increased from $138 million in 2016 to $154 million in 2017, which represents a $16 million, or 12 percent, increase. The increase was mainly due to an increase in revenue from silver sales from $99 million in 2016 to $122 million in 2017. Silver sold increased from 5.4 million ounces in 2016 to 6.6 million ounces in 2017. The increase was mainly at Cerro Vanguardia. The increase was partially offset by an $8 million decrease in uranium revenue in South Africa at Kopanang and Moab Khotsong.
Royalties
, which are generally calculated as a percentage of revenue, increased from $105 million in 2016 to $116 million in 2017, primarily due to an increase in the spot gold prices and an increase in production at Siguiri, Cerro Vanguardia, Tropicana and Geita.
Retrenchment costs
Retrenchment costs included in cost of sales decreased from $14 million in 2016 to $6 million in 2017, which represents an $8 million, or 57 percent, decrease. The decrease was mainly due to retrenchment costs in the South African region being included in special items. This decrease was partially offset by an increase in retrenchment costs from the South American region.
Rehabilitation costs
Rehabilitation costs decreased from $17 million in 2016 to $1 million in 2017, which represents a $16 million decrease. The change in estimates is attributable to changes in discount rates following changes in global economic assumptions and changes in mine plans. These changes have resulted in changes in cash flows, the design of tailings storage facilities and in methodology, following requests from the environmental regulatory authorities.
146
Amortisation of tangible and intangible assets
Amortisation of tangible and intangible assets expense increased from $809 million in 2016 to $823 million in 2017, which represents a $14 million or two percent increase. Amortisation of tangible assets increased by $28 million largely due to higher production at Siguiri and Córrego do Sitio. The increase was partially offset by a decrease in amortisation in South Africa. Amortisation of intangible assets is $14 million lower than 2016 mainly due to decreased amortisation of software and licenses at the South African and South American operations.
Other expenses
Other operating expenses decreased from $110 million in 2016 to $88 million in 2017, which represents a $22 million, or 20 percent decrease. The decrease was mainly due to a decrease in post retirement defined benefit provisions of $16 million and care and maintenance costs of $8 million partially offset by an increase in other provisions of $2 million. Corporate expenses increased by $3 million in 2017 compared to 2016 relating mainly to exchange variances. Exchange losses decreased by $77 million mainly as a result of the $60 million exchange loss on the foreign currency translation reserve release in the prior year.
Special items
Special items increased from $42 million in 2016 to $438 million in 2017, which represents a $396 million, or 943 percent, increase. This increase was mainly due to impairment and derecognition of mining assets in South Africa of $286 million and impairment of goodwill at First Uranium (South Africa) of $9 million; retrenchment costs, mainly in South Africa, of $88 million; a provision for the settlement of the silicosis class action of $63 million and the additional royalty at Geita of $11 million. The increase was partially offset by royalties received of $18 million, receipt of proceeds on the settlement of an arbitration of $6 million, OCI recycle on disposal of Mariana resources of $5 million and profit on sale of assets of $3 million.
Finance costs and unwinding of obligations
Finance costs decreased by $16 million, or 10 percent, to $142 million in 2017, compared to $158 million in 2016. The decrease of $16 million was mainly due to the reduction in interest arising on the settlement of the $1.25 billion bond during August 2016 and settlement of the R750 million bond during December 2016 partially offset by higher interest paid on the banking facilities in South Africa of $12 million. Unwinding of obligations expense of $27 million was recorded in 2017 compared with $22 million in 2016.
Share of associates and joint ventures' profit
Share of associates and joint ventures' profit increased to a profit of $22 million in 2017 compared to profit $11 million in 2016, mainly as a result of an increase in net impairment reversals from $6 million in 2016 to $15 million in 2017.
Taxation
A taxation expense of $108 million was recorded in 2017, compared to an expense of $189 million in 2016. Charges for current tax in 2017 amounted to $176 million, compared to $ 234 million in 2016. The decrease in tax is mainly due to lower earnings in Brazil and Tanzania, elimination of withholding tax on dividends in 2017 in Argentina and credits due to changes in tax legislation substantially enacted in North America in late December 2017. Charges for deferred tax in 2017 amounted to a net deferred tax benefit of $68 million compared to a net deferred tax benefit of $45 million in 2016. The increase in deferred taxation benefit is largely due to higher tax losses, deferred tax credits booked on impairments, retrenchment and silicosis provisions in South Africa, which were partially offset by the reversal of certain capital uplift allowances at First Uranium (in South Africa) relating to prior years.
Comparison of financial performance in 2016 with 2015
Our gold income is only materially impacted by price and volume variances. All of our costs are impacted by the consequences of average exchange rate movements.
When comparing the results of operations for 2016 compared to 2015 the investor is referred to “Item 5A - Foreign exchange fluctuations” where we report on exchange fluctuations and the average exchange rates in the South African Rand, Brazilian Real, Australian Dollar and the Argentinean Peso which will have effects on the various components that make up our costs based on the level of local procurement of each of these costs.
Gold income
Gold income increased by $70 million, or two percent, from $4,015 million in 2015 to $4,085 million in 2016. This increase was due to the increase in the gold price received of $91 per ounce, or eight percent, from $1,158 per ounce during 2015 to $1,249 per ounce in 2016. The increase in the price of gold resulted in an increase in gold income of $299 million. The increase was partially
147
offset by a 270,000 ounce decrease in gold sold from continuing operations, which resulted in a decrease in gold income of $229 million.
Gold income from the South African operations in 2016 increased by $41 million, or four percent, to $1,173 million from $1,132 million in 2015, mainly as a result of the increase in the gold price received, which resulted in an increase in gold income of $87 million. The increase was partially offset by a decrease in gold sold of 40,000 ounces, primarily as a result of safety stoppages and lower grades at Tau Tona and Kopanang, which accounted for $46 million of the decrease.
Gold income from the Continental Africa operations decreased by $20 million, or two percent, to $1,250 million in 2016 from $1,230 million in 2015, mainly as a result of the decrease in gold sold of 93,000 ounces, which resulted in a decrease of gold income of $110 million. The decrease in production was mainly due to the cessation of tailings treatment at Obuasi and lower grades mined at Geita. The decrease was partially offset by the increase in the gold price received which resulted in an increase in gold income of $90 million.
Gold income from Australia decreased by $20 million, or three percent, from $666 million in 2015 to $646 million in 2016. The decrease was due to the 56,000 ounces decrease in gold sold in 2016, which resulted in a decrease in gold income of $67 million. The decrease in production was mainly as a result of lower planned grades mined at Tropicana. The decrease was partially offset by the increase in the gold price received which resulted in an increase in gold income of $47 million.
Gold income from the Americas operations increased by $69 million, or seven percent, from $967 million in 2015 to $1,036 million in 2016, mainly as a result of the increase in the gold price received, which resulted in an increase in gold income of $75 million. The increase was partially offset by a decrease in gold sold of 21,000 ounces, primarily at AGA Mineração, as a result of lower grades due to operational and geotechnical issues which accounted for $6 million of the decrease in gold income.
Cost of sales
Cost of sales decreased from $3,294 million in 2015 to $3,263 million in 2016, which represents a $31 million or one percent decrease. The decrease was primarily due to the $61 million inventory change in 2016 as a result of an increase in related total cash costs and amortisation of tangible and intangible assets directly related to the production of inventory, being deferred into inventory at year end. This overall decrease in cost of sales was offset by an increase in total amortisation costs of $32 million from $777 million in 2015 to $809 million in 2016. The increase in royalties of $5 million is due to the increase in revenue due to the higher gold price achieved in 2016 than 2015. In addition, rehabilitation and other non-cash costs increased by $53 million from a credit of $10 million in 2015 to a cost of $43 million. This increase arose from the changes to cash flows, inflation rates and discount rates compared to 2015. The $49 million decrease in cash operating costs from $2,493 million to $2,444 million, was primarily due the weakness in local currencies and was partially offset by inflationary increases. By-product revenue increased due to higher volumes sold as well as higher average prices received for silver.
In South Africa cost of sales decreased from $1,083 million in 2015 to $1,041 million in 2016, which represents a $42 million or four percent decrease. The decrease was mainly due to the weakening of the rand, which was partially offset by an increase in production costs in the local currency.
In Continental Africa cost of sales decreased from $969 million in 2015 to $925 million in 2016, which represents a $44 million or five percent decrease. The decrease was mainly due to decreases in labour costs, fuel and power costs, and contractor costs, partially offset an increase in amortisation of tangible assets.
In Australasia cost of sales increased from $525 million in 2015 to $540 million in 2016, which represents a $15 million or three percent increase. The increase was mainly due to an increase in fuel and power which was partially offset by an increase in labour costs.
In the Americas cost of sales increased from $719 million in 2015 to $752 million in 2016, which represents a $33 million or five percent increase. The increase was mainly due to increases in services costs and amortisation of tangible assets which were partially offset by an increase in by-product revenue from silver which was due to higher volumes sold as well as a higher average silver price received in 2016.
Total cash costs
Total cash costs decreased from $2,493 million in 2015 to $2,435 million in 2016, which represents a $58 million, or two percent, decrease. The decrease was primarily due to a decrease in salaries and wages costs, fuel and power costs, contractor costs and service related costs. The decrease was partially offset by an increase in stores and other consumables costs, retrenchment costs and rehabilitation costs.
Labour costs
decreased from $869 million in 2015 to $859 million in 2016, which represents $10 million, or one percent, decrease.
In South Africa labour increased by $4 million, or one percent, from $424 million in 2015 to $428 million in 2016 mainly due to $7 million bonuses paid at Mponeng. The increase was partially offset by the weaker exchange rate.
148
In Continental Africa labour decreased by $8 million, or six percent, from $141 million in 2015 to $133 million in 2016 mainly due to Obuasi being transferred to care and maintenance and a decrease at Siguiri.
In Australia labour decreased by $5 million, or eight percent, from $64 million in 2015 to $59 million in 2016.
In the Americas labour remained unchanged at $237 million.
Consumable stores
increased from $519 million in 2015 to $534 million in 2016, which represents a $15 million, or three percent, increase. Other material increased by $17 million across the group. The increase was partially offset by weaker local currencies.
Fuel and power costs
decreased from $443 million in 2015 to $414 million in 2016, which represents a $29 million, or seven percent, decrease.
The decrease was mainly due to the average $9 dollar per barrel, or 17 percent, decrease in oil prices which resulted in fuel cost decreasing across the group by $34 million, or 27 percent, from $124 million to $90 million.
The decrease was partially offset by a $10 million increase in power costs. Power costs increased by $18 million in Australia mainly at Tropicana due to annual rate increases and the use of gas to generate power. In the Americas power increased by $6 million mainly at Serra Grande and AGA Córrego do Sítío Mineração. The increase was partially offset by a decrease in power costs due to lower production mainly in South Africa and Continental Africa.
Contractor costs
decreased from $460 million in 2015 to $443 million in 2016, which represents a $17 million, or four percent, decrease which largely due to a decrease in contractor costs in Australia due to deferred stripping costs capitalised in 2016 which were expensed in 2015 which was partially offset by increases in contractor costs in Continental Africa.
Service and other charges
decreased from $184 million in 2015 to $170 million in 2016. This decrease was mainly due to lower ore stockpile adjustments and write-off in the 2016 compared to 2015.
Revenue from by-products
, included in total cash costs, increased from $127 million in 2015 to $138 million in 2016. The increase was mainly due to an increase in revenue from silver sales that increased from $72 million in 2015 to $99 million in 2016. Silver sold increased from 4.3 million ounces in 2015, at an average price of $17 per ounce, to 5.3 million ounces in 2016, at an average price of $19 per ounce. The increase was mainly at Cerro Vanguardia. The increase was partially offset by a $16 million decrease in uranium revenue in South Africa at Kopanang and Moab Khotsong.
Royalties
, which are generally calculated as a percentage of revenue, increased from $100 million in 2015 to $105 million in 2016, primarily due to an increase in the spot gold prices offset by a decrease in production.
Retrenchment costs
Retrenchment costs included in cost of sales increased from $11 million in 2015 to $14 million in 2016, which represents a $3 million, or 27 percent, increase. Retrenchment costs recorded for the year ended 31 December 2016 resulted from the rationalisation of operations in the South African region partially offset by a decrease in the South American region.
Rehabilitation costs
Rehabilitation costs increased from a credit of $25 million in 2015 to a charge of $17 million in 2016, which represents a $42 million increase. The increase was due to changes to cash flows, inflation rates and discount rates compared to 2015.
Amortisation of tangible and intangible assets
Amortisation of tangible and intangible assets expense increased by $32 million, or four percent, to $809 million in 2016 from $777 million in 2015. Amortisation of tangible assets increased by $52 million largely due to higher deferred stripping amortisation at Geita due to higher tonnes mined resulting from a change in the mine plan, higher amortisation at Cerro Vanguardia and at Sunrise Dam due to higher production. The increase was partially offset by an allocation of amortisation costs to care and maintenance costs in 2016 due to the transitioning of Obuasi into care and maintenance. Amortisation of intangible assets is $20 million lower than 2015 mainly due to decreased amortisation of software and licenses at the South African operations.
Other expenses
Other operating expenses increased from $96 million in 2015 to $110 million in 2016, which represents a $14 million, or 15 percent increase. The increase was mainly due to an increase in pension and medical fund provisions of $7 million and government fiscal claims and tailing operations of $7 million. Corporate expenses decreased by $17 million in 2016 compared to 2015 as a result of ongoing cost-cutting measures implemented in the company. Exchange losses increased by $71 million as a result of changes in currencies in which the company transacts.
149
Special items
Special items decreased from $71 million in 2015 to $42 million in 2016, which represents a $29 million, or 41 percent, decrease. This decrease was mainly due to a decrease of repurchase premium and cost on settlement of bonds of $31 million and a decrease in impairments of $17 million not repeated in 2015, offset by a decrease in indirect tax recoveries of $18 million not repeated in 2015.
Finance costs and unwinding of obligations
Finance costs decreased by $65 million, or 29 percent, to $158 million in 2016, compared to $223 million in 2015. The decrease was mainly due to a reduction of $65 million of interest attributable to the redeemed $1.25 billion 8.5 percent bond issued in July 2013. Unwinding of obligations expense of $22 million was recorded in 2016 compared with $22 million in 2015.
Share of associates and joint ventures' profit
Share of associates and joint ventures' profit decreased to $11 million in 2016 compared to $88 million in 2015, mainly as a result of the decrease in operating profits due to an increase in operating costs and a decrease in revenue due to lower production partially offset by an increase in the gold price received. Net impairments reversals decreased to $6 million in 2016 from $24 million in 2015.
Taxation
A taxation expense of $189 million was recorded in 2016, compared to an expense of $211 million in 2015. Charges for current tax in 2016 amounted to $234 million, compared to $192 million in 2015. The increase in tax is mainly due to higher current tax in Argentina, Ghana and Guinea based on higher earnings. Charges for deferred tax in 2016 amounted to a net deferred tax benefit of $45 million compared to a net deferred tax expense of $19 million in 2015. The decrease in deferred taxation is largely due to foreign exchange effects on the translation of non-monetary items in Brazil and Argentina and adjustments on taxable items in North America and Australia, partly offset by an increase in deferred tax in South Africa.
Capital expenditure
The following table presents capital expenditure data for the AngloGold Ashanti group for the three-year period ended 31 December 2017:
|
Capital expenditure data for AngloGold Ashanti
|
Year ended December 31
|
||||||||
|
2017
|
|
2016
|
|
2015
|
|
||||
|
Capital expenditure (million US dollars)
|
953
|
|
811
|
|
857
|
|
|||
|
- Consolidated entities
|
830
|
|
711
|
|
726
|
|
|||
|
- Equity accounted joint ventures
|
123
|
|
100
|
|
131
|
|
|||
Total capital expenditure was $953 million in 2017 compared to $811 million in 2016. This represents a $142 million, or 18 percent, increase from 2016. This increase is due to increased capital expenditure on existing operations ($134 million) and on growth related projects ($8 million). Capital expenditure increased at Iduapriem by $43 million due to pre-stripping and the plant recovery improvement project. Capital expenditure increased at Geita by $38 million due to establishment of underground and ore reserve development partially offset by stripping due to pit depletion. Capital expenditure increased at Sunrise Dam, in Australia, by $30 million due to continued underground ore reserve development. Capital expenditure increased at Siguiri by $23 million due to the combination plant, infill drilling and overland land conveyor belt replacement. Capital expenditure increased at Kibali, in the DRC, by $18 million due to plant upgrade with four ultra-fine grind mills and Hydro power plant and increased stripping. Capital expenditure increased at Tropicana, in Australia, by $15 million due to an increase in deferred waste stripping. Capital expenditure increased by $14 million at Córrego do Sítío due to the raising of the tailings dam, an increase in stay in business spending and exploration. The strengthening of local currencies against the US dollar also resulted in an increase of capital expenditure. The increase in capital expenditure was partially offset by a decrease of $32 million in South Africa due to expenditure on Kopanang, Tau Tona, West gold plant, ATIC and directly associated services projects, expensed from July 2017 and capital rationing and postponement of Mponeng Mine Life Extension.
Total capital expenditure was $811 million in 2016 compared to $799 million (excluding discontinued operations) in 2015. This represents a $12 million, or two percent, increase from 2015. The increase in capital expenditure during 2016 is due to increased capital expenditure on existing operations ($65 million) partially offset by reduced expenditure on growth related projects ($53 million). Capital expenditure increased at Tropicana, in Australia, by $28 million due to an increase in deferred waste stripping of $18 million and more spend on sustaining capital of $10 million. Capital expenditure increased by $33 million at Córrego do Sítío due to the raising of the tailings dam, an increase in stay in business spending, an increase in primary development and exploration cost partially offset by the weakening of the local currency against the US dollar. Capital expenditure increased by $10 million at Serra Grande due to increased ore reserve development and the conversion of the leaching process, partially offset
150
by the weakening of the local currency against the US dollar. Capital expenditure increased by $30 million at Siguiri due to cost incurred relating to the combination plant project and sustainability project. The increase in capital expenditure was partially offset by a decrease of $24 million in South Africa due to a weaker exchange rate, a decrease of $17 million at Obuasi due to the mine transitioning to care and maintenance, a decrease of $32 million at Kibali due to decreased spending on growth projects partly offset by higher ore reserve development and a decrease of $8 million at Cerro Vanguardia mainly due to a weaker local exchange rate.
Comparison of financial performance on a segment basis for 2017, 2016 and 2015
The company produces gold as its primary product and does not have distinct divisional segments in terms of principal business activity, but manages its business on the basis of different geographic segments. Therefore, information regarding separate geographic segments is provided.
Gold income
|
(in millions)
|
Year ended 31 December
|
||||||||||||||||
|
2017
|
2016
|
2015
|
|||||||||||||||
|
$
|
|
percent
|
|
$
|
|
percent
|
|
$
|
|
percent
|
|
||||||
|
Geographical analysis of gold income by origin is as follows:
|
|||||||||||||||||
|
South Africa
|
1,101
|
|
25
|
|
1,173
|
|
29
|
|
1,132
|
|
27
|
|
|||||
|
Continental Africa
|
1,895
|
|
44
|
|
1,663
|
|
41
|
|
1,724
|
|
42
|
|
|||||
|
Australasia
|
709
|
|
16
|
|
646
|
|
16
|
|
666
|
|
16
|
|
|||||
|
Americas
|
1,104
|
|
25
|
|
1,036
|
|
25
|
|
967
|
|
23
|
|
|||||
|
4,809
|
|
4,518
|
|
4,489
|
|
||||||||||||
|
Less : Associates and equity accounted joint ventures included above
|
(453
|
)
|
(10
|
)
|
(433
|
)
|
(11
|
)
|
(474
|
)
|
(11
|
)
|
|||||
|
Continuing operations
|
4,356
|
|
4,085
|
|
4,015
|
|
|||||||||||
|
Discontinued operations
|
—
|
|
—
|
|
—
|
|
—
|
|
137
|
|
3
|
|
|||||
|
4,356
|
|
100
|
|
4,085
|
|
100
|
|
4,152
|
|
100
|
|
||||||
Assets
|
(in millions)
|
Year ended 31 December
|
|||||||||||||
|
2017
|
2016
|
2015
|
||||||||||||
|
$
|
|
percent
|
$
|
|
percent
|
$
|
|
percent
|
||||||
|
Geographical analysis of assets by origin is as follows:
|
||||||||||||||
|
South Africa
|
1,734
|
|
24
|
1,818
|
|
26
|
1,629
|
|
22
|
|||||
|
Continental Africa
|
3,153
|
|
44
|
3,090
|
|
43
|
3,121
|
|
43
|
|||||
|
Australasia
|
929
|
|
13
|
804
|
|
11
|
837
|
|
12
|
|||||
|
Americas
|
1,258
|
|
17
|
1,273
|
|
18
|
1,341
|
|
18
|
|||||
|
Other, including non-gold producing subsidiaries
|
145
|
|
2
|
168
|
|
2
|
356
|
|
5
|
|||||
|
Total assets
|
7,219
|
|
100
|
7,153
|
|
100
|
7,284
|
|
100
|
|||||
At 31 December 2017, 24 percent of AngloGold Ashanti’s total assets were located in South Africa compared with 26 percent at the end of 2016. The remaining operations collectively accounted for approximately 76 percent of AngloGold Ashanti’s total assets at 31 December 2017 compared to 74 percent at the end of the same period in 2016.
At 31 December 2016, 26 percent of AngloGold Ashanti’s total assets were located in South Africa compared with 22 percent at the end of 2015. The remaining operations collectively accounted for approximately 74 percent of AngloGold Ashanti’s total assets at 31 December 2016 compared to 78 percent at the end of the same period in 2015.
151
Non-GAAP analysis
Reconciliation of all-in sustaining costs and all-in costs to cost of sales per the financial statements
During June 2013, the World Gold Council (WGC), an industry body, published a Guidance Note on “all-in sustaining costs” and “all-in costs” metrics, which gold mining companies can use to supplement their overall non-GAAP disclosure. The WGC worked closely with its members (including AngloGold Ashanti) to develop these non-GAAP measures which are intended to provide further transparency into the full cost associated with producing gold. It is expected that these metrics, in particular, the “all-in sustaining cost” and “all-in cost” metrics which AngloGold Ashanti provides in this annual report on Form 20-F, will be helpful to investors, governments, local communities and other stakeholders in understanding the economics of gold mining. “All-in sustaining costs” is an extension of the existing “total cash cost” metric and incorporates all costs related to sustaining production and in particular, recognises the sustaining capital expenditures associated with developing and maintaining gold mines. In addition, this metric includes the cost associated with Corporate Office structures that support these operations, the community and rehabilitation costs attendant with responsible mining and any exploration and evaluation cost associated with sustaining current operations. “All-in sustaining costs per ounce” is arrived at by dividing the dollar value of the sum of these cost metrics, by the ounces of gold sold. “All-in cost” includes additional costs which reflect the varying costs of producing gold over the life-cycle of a mine including costs incurred at new operations and costs related to major projects at existing operations, which are expected to increase production. “All-in cost per ounce” is arrived at by dividing the dollar value of the sum of these cost metrics, by the ounces of gold sold.
Reconciliation of total cash costs to financial statements
Total cash costs are calculated in accordance with the guidelines of the Gold Institute industry standard and industry practice and are non-GAAP measures. The Gold Institute, which has been incorporated into the National Mining Association, is a non-profit international association of miners, refiners, bullion suppliers and manufacturers of gold products, which developed a uniform format for reporting total cash costs on a per ounce basis. The guidance was first adopted in 1996 and revised in November 1999.
Total cash costs as calculated and reported by AngloGold Ashanti include costs for all mining, processing, onsite administration costs, royalties and production taxes, as well as contributions from by-products, but exclusive of amortisation of tangible and intangible assets, rehabilitation costs and other non-cash costs, retrenchment costs, corporate administration, marketing and other costs, capital costs and exploration costs. Total cash costs per ounce are calculated by dividing attributable total cash costs by attributable ounces of gold produced.
All-in sustaining costs, all-in sustaining costs per ounce, all-in costs, all-in costs per ounce, total cash costs and total cash costs per ounce should not be considered by investors in isolation or as alternatives to cost of sales, profit/(loss) applicable to equity shareholders, profit/(loss) before taxation, cash flows from operating activities or any other measure of financial performance presented in accordance with IFRS or as an indicator of the company’s performance. While the WGC has published guidance on how to define all-in sustaining costs and all-in costs and the Gold Institute has provided definitions for the calculation of total cash costs, the calculation of these metrics may vary significantly among gold mining companies, and by themselves do not necessarily provide a basis for comparison with other gold mining companies.
However, AngloGold Ashanti believes that all-in sustaining costs, all-in costs and total cash costs in total by mine and per ounce by mine, are useful indicators to investors and management as they provide:
|
•
|
an indication of profitability, efficiency and cash flows;
|
|
•
|
the trend in costs as the mining operations mature over time on a consistent basis; and
|
|
•
|
an internal benchmark of performance to allow for comparison against other mines, both within the AngloGold Ashanti group and at other gold mining companies.
|
A reconciliation of both cost of sales and total cash costs as included in the company’s audited financial statements to all-in sustaining costs, all-in costs and total cash costs for each of the three years in the period ended 31 December 2017 is presented below. In addition, the company has provided below detail of the attributable ounces of gold produced and sold by mine for each of those periods.
152
The following table presents selected operating data for the AngloGold Ashanti group for the three-year period ended 31 December 2017:
|
Operating data for AngloGold Ashanti
|
Year ended December 31
|
|||||||
|
2017
|
|
2016
|
|
2015
|
|
|||
|
Total cash costs (million US dollars) – per financial statements
(1)
|
2,709
|
|
2,435
|
|
2,493
|
|
||
|
All-in sustaining costs ($/oz) - Subsidiaries
(2)
|
1,050
|
|
990
|
|
935
|
|
||
|
All-in sustaining costs ($/oz) - Joint Ventures
(2)
|
1,087
|
|
955
|
|
704
|
|
||
|
All-in costs ($/oz) - Subsidiaries
(2)
|
1,119
|
|
1,063
|
|
1,003
|
|
||
|
All-in costs ($/oz) - Joint Ventures
(2)
|
1,186
|
|
1,141
|
|
989
|
|
||
|
Total cash costs ($/oz) - Subsidiaries
(2)
|
789
|
|
737
|
|
719
|
|
||
|
Total cash costs ($/oz) - Joint Ventures
(2)
|
819
|
|
812
|
|
655
|
|
||
|
(1)
|
Excludes discontinued operations in 2015.
|
|
(2)
|
All-in sustaining costs, all-in costs and total cash costs are non-GAAP measures.
|
Total all-in sustaining costs, all-in costs and total cash costs
For a detailed reconciliation of all-in sustaining costs, all-in costs and total cash costs see “Operations” tables.
Comparison of all-in sustaining costs in 2017 with 2016
All-in sustaining costs per ounce (excluding stockpile impairments) in South Africa increased in 2017 by $164 per ounce, or 15 percent, to $1,245 per ounce from $1,081 per ounce in 2016. The increase was as a result of the strengthening of the rand, increase in cost of sales and the 61,000-ounce decrease in gold sold (excluding pre-production ounces).
In Continental Africa - Subsidiaries, all-in sustaining costs (excluding stockpile impairments) increased by $23 per ounce, or three percent, to $909 per ounce in 2017 from $886 per ounce in 2016. This increase was mainly due to an increase in cost of sales, an increase in sustaining capital expenditure due to increased spending at Iduapriem and Geita underground development. The increase in all-in sustaining costs was partially offset by a 149,000-ounce increase in gold sold (excluding pre-production ounces).
In Continental Africa - Joint Ventures, all-in sustaining costs (excluding stockpile impairments) increased by $132 per ounce, or 14 percent, to $1,087 per ounce in 2017 from $955 per ounce in 2016. This increase was mainly due to an increase in cost of sales, an increase in sustaining capital expenditure due to increased spending on Kibali as it moves underground. The increase in all-in sustaining costs was partially offset by a 15,000-ounce increase in gold sold.
In the Americas, all-in sustaining costs (excluding stockpile impairments) increased by $68 per ounce, or eight percent, to $943 per ounce in 2017 from $875 per ounce in 2016. This increase was mainly due to an increase in costs of sales partially offset by an increase of 47,000 ounces in gold sold in 2017 (excluding pre-production ounces).
In Australia, all-in sustaining costs decreased by $5 per ounce to $1,062 per ounce in 2017 from $1,067 per ounce in 2016. This decrease was mainly due to an increase of 43,000 ounces in gold sold in 2017 partially offset by an increase in sustaining capital expenditure.
Comparison of all-in costs in 2017 with 2016
All-in costs per ounce (excluding stockpile impairments) in South Africa increased by $156 per ounce, or 14 percent, to $1,278 per ounce in 2017 from $1,122 per ounce in 2016. The increase was as a result of the strengthening of the rand, an increase in all-in sustaining costs and the 61,000-ounce decrease in gold sold.
In Continental Africa - Subsidiaries, all-in costs (excluding stockpile impairments) increased by $30 per ounce, or three percent, to $1,019 per ounce in 2017 from $989 per ounce in 2016. This increase was mainly due to an increase in all-in sustaining costs and an increase in non-sustaining project capital expenditure, due to combination plant, infill drilling and overland land conveyor belt replacement at Siguiri. The increase in all-in costs was partially offset by a 149,000-ounce increase in gold sold (excluding pre-production ounces).
In Continental Africa - Joint Ventures, all-in costs (excluding stockpile impairments) increased by $45 per ounce, or four percent, to $1,186 per ounce in 2017 from $1,141 per ounce in 2016. This increase was mainly due to a $60 million increase in all-in sustaining costs. This increase was partially offset by a 15,000-ounce increase in gold sold and a decrease in major project spending at Kibali as projects were completed and commissioned.
In the Americas, all-in costs (excluding stockpile impairments) increased by $59 per ounce, or six percent, to $1,018 per ounce in 2017 from $959 per ounce in 2016. This increase was mainly due to an increase in all-in sustaining costs partially offset by a 47,000-ounce increase in gold sold (excluding pre-production ounces).
153
In Australia, all-in costs decreased by $1 per ounce to $1,080 per ounce in 2017 from $1,081 per ounce in 2016, mainly due to an increase of 43,000 ounces in gold sold partially offset by an increase in all-in sustaining costs.
Comparison of total cash costs in 2017 with 2016
The currencies of South Africa, Australia and Brazil were, on average, stronger against the US dollar during 2017 as compared to 2016 which negatively impacted total cash costs for 2017. The currency of Argentina was, on average, weaker against the US dollar during 2017 as compared to 2016 which positively impacted total cash costs for 2017.
In South Africa, total cash costs increased by $189 per ounce, or 21 percent, to $1,085 per ounce in 2017 from $896 per ounce in 2016. The increase was mainly due to a 65,000-ounce decrease in production (excluding pre-production ounces), an increase in salaries and wages costs, consumables store costs, fuel costs, service related costs, the strengthening of the rand and expensed capital expenditure on certain operations as they underwent orderly closure.
At Kopanang, total cash costs increased by $210 per ounce, or 16 percent, to $1,534 per ounce in 2017 from $1,324 per ounce in 2016. The increase was mainly due to the increase in salaries and wages costs, consumables store costs, fuel costs and service related costs, the strengthening of the rand, lower uranium sales and expensed capital. Subsequent to the announcement made 28 June 2017 to restructure its South African operations by placing certain mines into care and maintenance, to be followed by orderly closure, on 19 October 2017, the company announced the sale of Kopanang Mine and related infrastructure, subject to conditions precedent. The Section 189 process continued at Kopanang together with the pending disposal of the mine.
At TauTona total cash costs increased by $896 per ounce, or 78 percent, to $2,044 per ounce in 2017 from $1,148 per ounce in 2016. The increase was mainly due to 55,000-ounce decrease in production and the strengthening of the rand. A decision was made to stop operations at TauTona and final blast took place on 15 September 2017.
At Moab Khotsong, total cash costs increased by $50 per ounce, or seven percent, to $779 per ounce in 2017 from $729 per ounce in 2016. The increase was mainly due to the increase in salaries and wages costs and fuel costs and the strengthening of the rand. The increase was partially offset by a 14,000-ounce increase in production.
At Mponeng, total cash costs increased by $235 per ounce, or 30 percent, to $1,014 per ounce in 2017 from $779 per ounce in 2016. The increase was mainly due to a 30,000-ounce decrease in production, the increase in salaries and wages costs, consumables store costs, fuel costs and service related costs and the strengthening of the rand.
At the Surface Operations, total cash costs increased by $70 per ounce, or eight percent, to $969 per ounce in 2017 from $899 per ounce in 2016. The increase was mainly due to the increase in salaries and wages costs, consumables store costs, fuel costs and service related costs and the strengthening of the rand. The increase was partially offset by a 6,000-ounce increase in production.
In Continental Africa - Subsidiaries, total cash costs increased by $6 per ounce, to $688 per ounce in 2017 from $682 per ounce in 2016. The increase was mainly due to the increase in salaries and wages costs, consumables store costs, fuel costs and contractor costs. The increase was partially offset by a 139,000-ounce increase in production (excluding pre-production ounces).
Total cash costs at Geita, in Tanzania, increased by $78 per ounce, or 15 percent, to $608 per ounce in 2017 from $530 per ounce in 2016. The increase was mainly due the increase in consumables store costs, fuel costs and contractor costs partially offset by a 61,000-ounce increase in production (excluding pre-production ounces).
In Ghana, at Iduapriem total cash costs decreased by $85 per ounce, or nine percent, to $823 per ounce in 2017 compared to $908 per ounce in 2016 mainly due to a 14,000-ounce increase in production.
At Siguiri, in Guinea, total cash costs decreased by eight percent to $725 per ounce in 2017 from $784 per ounce in 2016 mainly due to a 63,000-ounce increase in production partially offset by an increase in salaries and wages costs, consumables store costs, fuel costs and service related cost.
In Continental Africa - Joint Ventures, total cash costs increased by $7 per ounce, or one percent, to $819 per ounce in 2017 from $812 per ounce in 2016. The increase was mainly due to the increase in salaries and wages costs, consumables store costs, fuel costs and contractor costs partially offset by a 4,000-ounce increase in production.
In Mali, at Morila, total cash costs decreased by $149 per ounce, or 13 percent, to $974 per ounce in 2017 from $1,123 per ounce in 2016. The decrease was mainly due to the 6,000-ounce increase in production. At Sadiola, total cash costs decreased by $91 per ounce, or nine percent, from $991 per ounce in 2016 to $900 per ounce in 2017. The decrease in cash costs per ounces, despite the 7,000-ounce decrease in production, was due to the additional of full grade ore stockpiles compared to stockpile utilisation in 2016.
154
In the DRC, at Kibali, total cash costs increased by $44 per ounce, or six percent, to $784 per ounce in 2017 from $740 per ounce in 2016 mainly due to the increase in salaries and wages and contractor cost partially offset by a 4,000-ounce increase in production.
In the Americas, total cash costs increased by $60 per ounce to $638 per ounce in 2017 from $578 per ounce in 2016. The increase was mainly due to an increase in salaries and wages costs, consumables store costs and contractor costs partially offset by a 19,000-ounce increase in production (excluding pre-production ounces) and an increase in silver revenue due to an increase in silver sold from 5.1 million ounces in 2016 to 6.3 million ounces in 2017.
In Brazil, at AngloGold Ashanti Córrego do Sítío Mineração, total cash costs increased by $109 per ounce, or 19 percent, to $671 per ounce in 2017 from $562 per ounce in 2016 primarily due to increases in salaries and wages costs, consumables store costs and contractor costs partially offset by a 16,000-ounce increase in production (excluding pre-production ounces). At Serra Grande, total cash costs increased by $130 per ounce, or 21 percent, to $764 per ounce in 2017 from $634 per ounce in 2016 primarily due to increases in salaries and wages, consumable stores and service related costs.
In Argentina at Cerro Vanguardia, total cash costs decreased by $41 per ounce, or seven percent, to $522 per ounce in 2017 from $563 per ounce in 2016 primarily due to a 2,000-ounce increase in production and an increase in silver revenue due to an increase in silver sold from 5.1 million ounces in 2016 to 6.3 million ounces in 2017.
In Australia, total cash costs decreased by $50 per ounce, or six percent, to $743 per ounce in 2017 from $793 per ounce in 2016 primarily due to a 39,000-ounce increase in production.
At Sunrise Dam, total cash costs decreased by $7 per ounce, or one percent, to $919 per ounce in 2017 compared to $926 per ounce in 2016, mainly due to a 10,000-ounce increase in production.
At Tropicana, total cash costs decreased by $66 per ounce, or ten percent, to $564 per ounce in 2017 compared to $630 per ounce in 2016, mainly due to a 30,000-ounce increase in production.
Overall the subsidiaries total cash costs increased by $52 per ounce, or seven percent, to $789 per ounce in 2017 compared to $737 per ounce in 2016. The increase was mainly due to increases in salaries and wages costs, consumables store costs, fuel costs and contractor costs partially offset by a 134,000-ounce increase in production and an increase in silver revenue.
Comparison of all-in sustaining costs in 2016 with 2015
All-in sustaining costs per ounce (excluding stockpile impairments) in South Africa decreased in 2016 by $7 per ounce, or one percent, to $1,081 per ounce from $1,088 per ounce in 2015. The decrease was a result of the weakening of the rand. The decrease was partially offset by a 40,000-ounce decrease in gold sold.
In Continental Africa - Subsidiaries, all-in sustaining costs (excluding stockpile impairments) increased by $27 per ounce, or three percent, to $886 per ounce in 2016 from $859 per ounce in 2015. This increase was mainly due to an increase in cost of sales and a 92,000-ounce decrease in gold sold (excluding pre-production ounces).
In Continental Africa - Joint Ventures, all-in sustaining costs (excluding stockpile impairments) increased by $251 per ounce, or 36 percent, to $955 per ounce in 2016 from $704 per ounce in 2015. This increase was mainly due to a 61,000-ounce decrease in gold sold, an increase in cost of sales and an increase in sustaining capital expenditure due to increased spending on Kibali.
In the Americas, all-in sustaining costs (excluding stockpile impairments) increased by $83 per ounce, or 10 percent, to $875 per ounce in 2016 from $792 per ounce in 2015. This increase was mainly due to an increase in cost of sales, sustaining capital expenditure and a decrease of 22,000-ounces in gold sold in 2016 (excluding pre-production ounces).
In Australia, all-in sustaining costs increased by $192 per ounce, or 22 percent, to $1,067 per ounce in 2016 from $875 per ounce in 2015. This increase was mainly due to an increase in costs of sales, sustaining capital expenditure and a decrease of 56,000 ounces in gold sold in 2016.
Comparison of all-in costs in 2016 with 2015
All-in costs per ounce (excluding stockpile impairments) in South Africa decreased by $9 per ounce, or one percent, to $1,122 per ounce in 2016 from $1,131 per ounce in 2015. The decrease was a result of the weakening of the rand. The decrease was partially offset by a 40,000-ounce decrease in gold sold.
In Continental Africa - Subsidiaries, all-in costs (excluding stockpile impairments) increased by $45 per ounce, or five percent, to $989 per ounce in 2016 from $944 per ounce in 2015. This increase was mainly due to an increase in care and maintenance costs at Obuasi and a 92,000-ounce decrease in gold sold (excluding pre-production ounces). The increase was partially offset by a decrease in all-in sustaining costs.
155
In Continental Africa - Joint Ventures, all-in costs (excluding stockpile impairments) increased by $152 per ounce, or 15 percent, to $1,141 per ounce in 2016 from $989 per ounce in 2015. This increase was mainly due to an increase in all-in sustaining costs and a 61,000-ounce decrease in gold sold. This increase was partially offset by a decrease in non-sustaining project capital expenditure, due to a decrease in major project spending at Kibali as projects were completed and commissioned.
In the Americas, all-in costs (excluding stockpile impairments) increased by $74 per ounce, or eight percent, to $959 per ounce in 2016 from $885 per ounce in 2015. This increase was mainly due to an increase in all-in sustaining costs and a 22,000-ounce decrease in gold sold (excluding pre-production ounces).
In Australia, all-in costs decreased by $195 per ounce, or 22 percent, to $1,081 per ounce in 2016 from $886 per ounce in 2015, mainly due to an increase in all-in sustaining costs and a 56,000-ounce decrease in gold sold in 2016.
Comparison of total cash costs in 2016 with 2015
The currencies of South Africa, Australia, Argentina and Brazil were, on average, weaker against the US dollar during 2016 as compared to 2015 which positively impacted total cash costs for 2016.
In South Africa, total cash costs increased by $15 per ounce, or two percent, to $896 per ounce in 2016 from $881 per ounce in 2015. The increase was mainly due to a 35,000-ounce decrease in production (excluding pre-production ounces) partially offset by the weakening of the rand.
At Kopanang, total cash costs increased by $310 per ounce, or 31 percent, to $1,324 per ounce in 2016 from $1,014 per ounce in 2015. The increase was mainly due to 26,000-ounce decrease in production partially offset by the weakening of the rand.
At TauTona total cash costs increased by $265 per ounce, or 30 percent, to $1,148 per ounce in 2016 from $883 per ounce in 2015. The increase was mainly due to 63,000-ounce decrease in production partially offset by the weakening of the rand.
At Moab Khotsong, total cash costs decreased by $69 per ounce, or nine percent, to $729 per ounce in 2016 from $798 per ounce in 2015. The decrease was mainly due to a 26,000-ounce increase in production.
At Mponeng, total cash costs decreased by $95 per ounce, or 11 percent, to $779 per ounce in 2016 from $874 per ounce in 2015. The decrease was mainly due to a 35,000-ounce increase in production and the weakening of the rand.
At the Surface Operations, total cash costs decreased by $13 per ounce, or one percent, to $899 per ounce in 2016 from $912 per ounce in 2015. The decrease was mainly due to the weakening of the rand, partially offset by a 7,000-ounce decrease in production.
In Continental Africa - Subsidiaries, total cash costs decreased by $5 per ounce, or one percent, to $682 per ounce in 2016 from $687 per ounce in 2015. The decrease was mainly due to the 73,000-ounce decrease in production of gold (excluding pre-production ounces) partially offset by a decrease in salaries and wages costs, fuel and power costs and service related costs.
In Ghana, at Obuasi, total cash costs decreased by 83 percent in 2016 to $167 per ounce compared to $966 per ounce in 2015 mainly due to the transition to care and maintenance. At Iduapriem, in Ghana, total cash costs decreased by $87 per ounce, or nine percent, to $908 per ounce in 2016 compared to $995 per ounce in 2015 mainly due to a 21,000-ounce increase in production. At Siguiri, in Guinea, total cash costs decreased by five percent to $784 per ounce in 2016 from $827 per ounce in 2015 mainly due to a 5,000-ounce increase in production a decrease in salaries and wages costs, fuel costs and service related costs.
Total cash costs at Geita, in Tanzania, increased by $50 per ounce, or 10 percent, to $530 per ounce in 2016 from $480 per ounce in 2015. The increase was mainly due the 49,000-ounce decrease in production (excluding pre-production ounces).
In Continental Africa - Joint Ventures, total cash costs increased by $157 per ounce, or 24 percent, to $812 per ounce in 2016 from $655 per ounce in 2015. The increase was mainly due to the 51,000-ounce decrease in production and increases in consumables store costs, contractor costs and service related costs.
In Mali, at Morila, total cash costs increased by $425 per ounce, or 61 percent, to $1,123 per ounce in 2016 from $698 per ounce in 2015. The increase was mainly due to the 27,000-ounce decrease in production partially offset by a decrease in stores and consumables costs, fuel costs, contractor costs and service related costs. At Sadiola, total cash costs increased by $173 per ounce, or 21 percent, from $818 per ounce in 2015 to $991 per ounce in 2016. This increase was primarily due to an increase in service related costs partially offset by a 1,000-ounce increase in production.
In the DRC, at Kibali, total cash costs increased by $131 per ounce, or 22 percent, to $740 per ounce in 2016 from $609 per ounce in 2015 mainly due to the decrease of 25,000 ounces in production and an increase in contractor and consumable store costs.
156
In the Americas, total cash costs increased by $2 per ounce to $578 per ounce in 2016 from $576 per ounce in 2015. The increase was mainly due to a 11,000 ounce decrease (excluding pre-production ounces) in production partially offset by an increase in silver revenue due to a higher average silver price in 2016 compared to 2015 and an increase in silver sold from 4.1 million ounces in 2015 to 5.1 million ounces in 2016.
In Brazil, at AngloGold Ashanti Córrego do Sítío Mineração, total cash costs increased by $44 per ounce, or eight percent, to $562 per ounce in 2016 from $518 per ounce in 2015 primarily due to a 14,000-ounce decrease in production and increases in salaries and wages costs, consumables store costs and fuel costs.
In Argentina at Cerro Vanguardia, total cash costs decreased to $563 per ounce in 2016 from $625 per ounce in 2015 primarily due to a 3,000 ounce increase in production and an increase in silver revenue due to a higher average silver price in 2016 compared to 2015 and an increase in silver sold from 4.1 million ounces in 2015 to 5.1 million ounces in 2016 and reimbursement by the Government in respect of exports channelled through Patagonian ports.
In Australia, total cash costs increased by $91 per ounce, or 13 percent, to $793 per ounce in 2016 from $702 per ounce in 2015 primarily due to a 40,000-ounce decrease in production and an increase in silver related costs.
At Sunrise Dam, total cash costs decreased by $44 per ounce, or five percent, to $926 per ounce in 2016 compared to $970 per ounce in 2015, mainly due to a 12,000-ounce increase in production.
At Tropicana, total cash costs increased by $138 per ounce, or 28 percent, to $630 per ounce in 2016 compared to $492 per ounce in 2015, mainly due to a 52,000-ounce decrease in production and increases and consumables store costs, fuel costs and service related costs.
Overall the subsidiaries total cash costs increased by $18 per ounce, or three percent, to $737 per ounce in 2016 compared to $719 per ounce in 2015. The increase was mainly due to a 161,000-ounce decrease in production.
157
For the year ended 31 December 2017
Operations in South Africa
(in $ millions, except as otherwise noted)
|
Kopanang
|
|
Moab Khotsong
|
|
Vaal River
Operations
|
|
Mponeng
|
|
Tau Tona
|
|
West Wits Operations
|
|
Surface Operations
|
|
South Africa other
|
|
Total South Africa (Operations)
|
|
Corporate
(4)
|
|
|||||||||||
|
All-in sustaining costs
|
||||||||||||||||||||||||||||||
|
Cost of sales per segmental information
(5)
|
147
|
|
275
|
|
421
|
|
283
|
|
207
|
|
490
|
|
203
|
|
—
|
|
1,114
|
|
(3
|
)
|
||||||||||
|
Amortisation of tangible and intangible assets
|
(9
|
)
|
(41
|
)
|
(50
|
)
|
(53
|
)
|
(14
|
)
|
(67
|
)
|
(14
|
)
|
(2
|
)
|
(133
|
)
|
(2
|
)
|
||||||||||
|
Adjusted for decommissioning amortisation
|
—
|
|
—
|
|
—
|
|
—
|
|
—
|
|
—
|
|
(2
|
)
|
2
|
|
—
|
|
(2
|
)
|
||||||||||
|
Corporate administration and marketing related to current operations
|
—
|
|
—
|
|
—
|
|
—
|
|
—
|
|
—
|
|
—
|
|
—
|
|
—
|
|
62
|
|
||||||||||
|
Inventory writedown to net realisable value and other stockpile adjustments
|
—
|
|
—
|
|
—
|
|
—
|
|
—
|
|
—
|
|
—
|
|
2
|
|
2
|
|
—
|
|
||||||||||
|
Sustaining exploration and study costs
|
—
|
|
—
|
|
—
|
|
—
|
|
—
|
|
—
|
|
—
|
|
—
|
|
—
|
|
1
|
|
||||||||||
|
Total sustaining capital expenditure
|
8
|
|
42
|
|
50
|
|
52
|
|
12
|
|
64
|
|
13
|
|
3
|
|
130
|
|
6
|
|
||||||||||
|
All-in sustaining costs
|
146
|
|
|
|
276
|
|
|
421
|
|
|
282
|
|
|
205
|
|
|
487
|
|
|
200
|
|
|
5
|
|
|
1,113
|
|
|
62
|
|
|
Adjusted for non-controlling interests and non-gold producing companies
(1)
|
—
|
|
—
|
|
—
|
|
—
|
|
—
|
|
—
|
|
—
|
|
—
|
|
—
|
|
4
|
|
||||||||||
|
All-in sustaining costs adjusted for non-controlling interests and non-gold producing companies
|
146
|
|
|
|
276
|
|
|
421
|
|
|
282
|
|
|
205
|
|
|
487
|
|
|
200
|
|
|
5
|
|
|
1,113
|
|
|
66
|
|
|
Adjusted for stockpile
write-offs
|
—
|
|
—
|
|
—
|
|
—
|
|
—
|
|
—
|
|
—
|
|
(2
|
)
|
(2
|
)
|
(1
|
)
|
||||||||||
|
All-in sustaining costs adjusted for non-controlling interests, non-gold producing companies and stockpile write-offs
|
146
|
|
276
|
|
421
|
|
282
|
|
205
|
|
487
|
|
200
|
|
3
|
|
1,111
|
|
65
|
|
||||||||||
|
All-in sustaining costs
|
146
|
|
276
|
|
421
|
|
282
|
|
205
|
|
487
|
|
200
|
|
5
|
|
1,113
|
|
62
|
|
||||||||||
|
Non-sustaining Project capex
|
—
|
|
—
|
|
—
|
|
20
|
|
—
|
|
20
|
|
—
|
|
—
|
|
20
|
|
—
|
|
||||||||||
|
Technology improvements
|
—
|
|
—
|
|
—
|
|
—
|
|
—
|
|
—
|
|
—
|
|
9
|
|
9
|
|
1
|
|
||||||||||
|
Non-sustaining exploration and study costs
|
—
|
|
—
|
|
—
|
|
—
|
|
—
|
|
—
|
|
—
|
|
—
|
|
—
|
|
1
|
|
||||||||||
|
Corporate and social responsibility costs not related to current operations
|
—
|
|
—
|
|
—
|
|
—
|
|
—
|
|
—
|
|
—
|
|
—
|
|
—
|
|
9
|
|
||||||||||
|
All-in costs
|
146
|
|
|
|
276
|
|
|
421
|
|
|
302
|
|
|
205
|
|
|
507
|
|
|
200
|
|
|
14
|
|
|
1,142
|
|
|
73
|
|
|
Adjusted for non-controlling interests and non-gold producing companies
(1)
|
—
|
|
—
|
|
—
|
|
—
|
|
—
|
|
—
|
|
—
|
|
—
|
|
—
|
|
—
|
|
5
|
|
||||||||
|
All-in costs adjusted for non-controlling interests and non-gold producing companies
|
146
|
|
276
|
|
421
|
|
302
|
|
205
|
|
507
|
|
200
|
|
14
|
|
1,142
|
|
78
|
|
||||||||||
|
Adjusted for stockpile
write-offs
|
—
|
|
—
|
|
—
|
|
—
|
|
—
|
|
—
|
|
—
|
|
(2
|
)
|
(2
|
)
|
(1
|
)
|
||||||||||
|
All-in costs adjusted for non-controlling interests, non-gold producing companies and stockpile write-offs
|
146
|
|
|
|
276
|
|
|
421
|
|
|
302
|
|
|
205
|
|
|
507
|
|
|
200
|
|
|
12
|
|
|
1,140
|
|
|
77
|
|
|
Gold sold - oz (000)
(2)
|
91
|
|
294
|
|
385
|
|
224
|
|
91
|
|
316
|
|
192
|
|
—
|
|
892
|
|
—
|
|
||||||||||
|
All-in sustaining cost (excluding stockpile write-offs) per unit - $/oz
(3)
|
1,593
|
|
938
|
|
1,094
|
|
1,259
|
|
2,242
|
|
1,544
|
|
1,045
|
|
—
|
|
1,245
|
|
—
|
|
||||||||||
|
All-in cost per unit (excluding stockpile write-offs) - $/oz
(3)
|
1,593
|
|
939
|
|
1,094
|
|
1,349
|
|
2,242
|
|
1,607
|
|
1,045
|
|
—
|
|
1,278
|
|
—
|
|
||||||||||
|
(1)
|
Adjusting for non-controlling interest of items included in calculation, to disclose the attributable portions only. Other consists of heap leach inventory.
|
|
(2)
|
Attributable portion (excluding pre-production ounces).
|
|
(3)
|
In addition to the operational performances of the mines, all-in sustaining cost per ounce, all-in cost per ounce and total cash costs per ounce are affected by fluctuations in the currency exchange rate. AngloGold Ashanti reports all-in sustaining cost per ounce and all-in cost per ounce calculated to the nearest US dollar amount and gold sold in ounces. AngloGold Ashanti reports total cash costs per ounce calculated to the nearest US dollar amount and gold produced in ounces.
|
|
(4)
|
Corporate includes non-gold producing subsidiaries.
|
|
(5)
|
Refer Item 18: Note 2 – Segmental Information.
|
Rounding of figures may result in computational differences.
158
For the year ended 31 December 2017
Operations in South Africa
(in $ millions, except as otherwise noted)
|
Kopanang
|
|
Moab Khotsong
|
|
Vaal River
Operations
|
|
Mponeng
|
|
Tau Tona
|
|
West Wits Operations
|
|
Surface Operations
|
|
South Africa other
|
|
Total South Africa (Operations)
|
|
Corporate
(4)
|
|
||||||||||
|
Total cash costs
|
|||||||||||||||||||||||||||||
|
Cost of sales per segmental information
(5)
|
147
|
|
275
|
|
421
|
|
283
|
|
207
|
|
490
|
|
203
|
|
—
|
|
1,114
|
|
(3
|
)
|
|||||||||
|
Inventory change
|
—
|
|
—
|
|
1
|
|
—
|
|
—
|
|
—
|
|
(2
|
)
|
(1
|
)
|
(2
|
)
|
—
|
|
|||||||||
|
Amortisation of intangible assets
|
—
|
|
(1
|
)
|
(1
|
)
|
(1
|
)
|
—
|
|
(1
|
)
|
—
|
|
—
|
|
(2
|
)
|
1
|
|
|||||||||
|
Amortisation of tangible assets
|
(9
|
)
|
(40
|
)
|
(49
|
)
|
(52
|
)
|
(14
|
)
|
(67
|
)
|
(14
|
)
|
—
|
|
(130
|
)
|
(3
|
)
|
|||||||||
|
Rehabilitation and other non-cash costs
|
3
|
|
(5
|
)
|
(3
|
)
|
(3
|
)
|
(6
|
)
|
(9
|
)
|
(1
|
)
|
1
|
|
(12
|
)
|
—
|
|
|||||||||
|
Retrenchment costs
|
—
|
|
—
|
|
—
|
|
—
|
|
—
|
|
—
|
|
—
|
|
—
|
|
—
|
|
(1
|
)
|
|||||||||
|
Total cash costs
|
140
|
|
229
|
|
369
|
|
227
|
|
186
|
|
413
|
|
186
|
|
—
|
|
968
|
|
(6
|
)
|
|||||||||
|
Adjusted for non-controlling interests, non-gold producing companies and other
(1)
|
—
|
|
—
|
|
—
|
|
—
|
|
—
|
|
—
|
|
—
|
|
—
|
|
—
|
|
4
|
|
|||||||||
|
Total cash costs adjusted for non-controlling interests and non-gold producing companies
|
140
|
|
229
|
|
369
|
|
227
|
|
186
|
|
413
|
|
186
|
|
—
|
|
968
|
|
(2
|
)
|
|||||||||
|
Gold produced – oz (000)
(2)
|
91
|
|
294
|
|
386
|
|
224
|
|
91
|
|
315
|
|
192
|
|
—
|
|
892
|
|
—
|
|
|||||||||
|
Total cash costs per unit –
$/oz
(3)
|
1,534
|
|
779
|
|
958
|
|
1,014
|
|
2,044
|
|
1,311
|
|
969
|
|
—
|
|
1,085
|
|
—
|
|
|||||||||
159
For the year ended 31 December 2017
Operations in DRC, Ghana, Guinea, Mali and Tanzania
(in $ millions, except as otherwise noted)
|
DRC
|
MALI
|
Joint
|
GHANA
|
GUINEA
|
TANZANIA
|
Continental Africa other
|
|
SUBSIDIARIES
|
|
||||||||||||||||||||
|
Kibali
|
|
Morila
|
|
Sadiola
|
|
Ventures
|
|
Iduapriem
|
|
Obuasi
|
|
Siguiri
|
|
Geita
|
|
||||||||||||||
|
All-in sustaining costs
|
|||||||||||||||||||||||||||||
|
Cost of sales per segmental information
(5)
|
339
|
|
34
|
|
67
|
|
440
|
|
210
|
|
(6
|
)
|
344
|
|
519
|
|
3
|
|
1,070
|
|
|||||||||
|
Amortisation of tangible and intangible assets
|
(120
|
)
|
(6
|
)
|
(10
|
)
|
(136
|
)
|
(28
|
)
|
—
|
|
(57
|
)
|
(197
|
)
|
(3
|
)
|
(285
|
)
|
|||||||||
|
Adjusted for decommissioning amortisation
|
—
|
|
3
|
|
—
|
|
3
|
|
1
|
|
—
|
|
1
|
|
2
|
|
—
|
|
4
|
|
|||||||||
|
Sustaining exploration and study costs
|
—
|
|
—
|
|
1
|
|
1
|
|
—
|
|
—
|
|
8
|
|
17
|
|
—
|
|
25
|
|
|||||||||
|
Total sustaining capital expenditure
|
77
|
|
2
|
|
6
|
|
85
|
|
51
|
|
—
|
|
15
|
|
156
|
|
1
|
|
223
|
|
|||||||||
|
All-in sustaining costs
|
296
|
|
33
|
|
64
|
|
393
|
|
234
|
|
(6
|
)
|
311
|
|
497
|
|
1
|
|
1,037
|
|
|||||||||
|
Adjusted for non-controlling interests and non -gold producing companies
(1)
|
—
|
|
—
|
|
—
|
|
—
|
|
—
|
|
—
|
|
(47
|
)
|
—
|
|
—
|
|
(47
|
)
|
|||||||||
|
All-in sustaining costs adjusted for non-controlling interests and non-gold producing companies
|
296
|
|
33
|
|
64
|
|
393
|
|
234
|
|
(6
|
)
|
264
|
|
497
|
|
1
|
|
990
|
|
|||||||||
|
All-in sustaining costs adjusted for non-controlling interests, non-gold producing companies and stockpile write-offs
|
296
|
|
33
|
|
64
|
|
393
|
|
234
|
|
(6
|
)
|
264
|
|
497
|
|
1
|
|
990
|
|
|||||||||
|
All-in sustaining costs
|
296
|
|
33
|
|
64
|
|
393
|
|
234
|
|
(6
|
)
|
311
|
|
497
|
|
1
|
|
1,037
|
|
|||||||||
|
Non-sustaining Project capex
|
34
|
|
—
|
|
1
|
|
35
|
|
—
|
|
—
|
|
67
|
|
—
|
|
—
|
|
67
|
|
|||||||||
|
Non-sustaining exploration and study costs
|
1
|
|
—
|
|
—
|
|
1
|
|
—
|
|
1
|
|
—
|
|
—
|
|
—
|
|
1
|
|
|||||||||
|
Care and maintenance costs
|
—
|
|
—
|
|
—
|
|
—
|
|
—
|
|
62
|
|
—
|
|
—
|
|
—
|
|
62
|
|
|||||||||
|
All-in costs
|
331
|
|
33
|
|
65
|
|
429
|
|
234
|
|
57
|
|
378
|
|
497
|
|
1
|
|
1,167
|
|
|||||||||
|
Adjusted for non-controlling interests and non-gold producing companies
(1)
|
—
|
|
—
|
|
—
|
|
—
|
|
—
|
|
—
|
|
(57
|
)
|
—
|
|
—
|
|
(57
|
)
|
|||||||||
|
All-in costs adjusted for non-controlling interests and non-gold producing companies
|
331
|
|
33
|
|
65
|
|
429
|
|
234
|
|
57
|
|
321
|
|
497
|
|
1
|
|
1,110
|
|
|||||||||
|
All-in costs adjusted for non-controlling interests, non-gold producing companies and stockpile write-offs
|
331
|
|
33
|
|
65
|
|
429
|
|
234
|
|
57
|
|
321
|
|
497
|
|
1
|
|
1,110
|
|
|||||||||
|
Gold sold – oz (000)
(2)
|
272
|
|
27
|
|
63
|
|
362
|
|
227
|
|
3
|
|
332
|
|
528
|
|
—
|
|
1,090
|
|
|||||||||
|
All-in sustaining cost (excluding stockpile write-offs) per unit – $/oz
(3)
|
1,090
|
|
1,218
|
|
1,019
|
|
1,087
|
|
1,033
|
|
—
|
|
796
|
|
941
|
|
—
|
|
909
|
|
|||||||||
|
All-in cost per unit (excluding stockpile write-offs) – $/oz
(3)
|
1,216
|
|
1,218
|
|
1,044
|
|
1,186
|
|
1,033
|
|
—
|
|
967
|
|
941
|
|
—
|
|
1,019
|
|
|||||||||
160
For the year ended 31 December 2017
Operations in DRC, Ghana, Guinea, Mali and Tanzania
(in $ millions, except as otherwise noted)
|
DRC
|
MALI
|
JOINT
|
GHANA
|
GUINEA
|
TANZANIA
|
Continental Africa other
|
|
TOTAL CONTINENTAL AFRICA
|
|
||||||||||||||||||||
|
Kibali
|
|
Morila
|
|
Sadiola
|
|
VENTURES
|
Iduapriem
|
|
Obuasi
|
|
Siguiri
|
|
Geita
|
|
|||||||||||||||
|
Total cash costs
|
|||||||||||||||||||||||||||||
|
Cost of sales per segmental information
(5)
|
339
|
|
34
|
|
67
|
|
440
|
|
210
|
|
(6
|
)
|
344
|
|
519
|
|
3
|
|
1,070
|
|
|||||||||
|
Inventory change
|
(4
|
)
|
—
|
|
1
|
|
(3
|
)
|
—
|
|
—
|
|
(7
|
)
|
13
|
|
—
|
|
6
|
|
|||||||||
|
Amortisation of intangible assets
|
—
|
|
—
|
|
—
|
|
—
|
|
(1
|
)
|
—
|
|
—
|
|
—
|
|
(2
|
)
|
(3
|
)
|
|||||||||
|
Amortisation of tangible assets
|
(120
|
)
|
(6
|
)
|
(10
|
)
|
(136
|
)
|
(28
|
)
|
—
|
|
(57
|
)
|
(197
|
)
|
—
|
|
(282
|
)
|
|||||||||
|
Rehabilitation and other non-cash costs
|
(5
|
)
|
(1
|
)
|
—
|
|
(6
|
)
|
7
|
|
7
|
|
(5
|
)
|
(7
|
)
|
—
|
|
2
|
|
|||||||||
|
Total cash costs
|
210
|
|
27
|
|
58
|
|
295
|
|
188
|
|
1
|
|
275
|
|
328
|
|
1
|
|
793
|
|
|||||||||
|
Adjusted for non-controlling interests, non-gold producing companies and other
(1)
|
—
|
|
—
|
|
—
|
|
—
|
|
—
|
|
—
|
|
(41
|
)
|
—
|
|
—
|
|
(41
|
)
|
|||||||||
|
Total cash costs adjusted for non-controlling interests and non-gold producing companies
|
210
|
|
27
|
|
58
|
|
295
|
|
188
|
|
1
|
|
234
|
|
328
|
|
1
|
|
752
|
|
|||||||||
|
Gold produced - oz (000)
(2)
|
268
|
|
28
|
|
63
|
|
360
|
|
228
|
|
3
|
|
323
|
|
539
|
|
—
|
|
1,094
|
|
|||||||||
|
Total cash costs per unit - $/oz
(3)
|
784
|
|
974
|
|
900
|
|
819
|
|
823
|
|
—
|
|
725
|
|
608
|
|
—
|
|
688
|
|
|||||||||
161
For the year ended 31 December 2017
Operations in Australia, Argentina and Brazil
(in $ millions, except as otherwise noted)
|
Australia
|
Total
Australia
|
|
ARGENTINA
|
Brazil
|
Americas other
|
|
TOTAL AMERICAS
|
|
||||||||||||||||||
|
Sunrise Dam
|
|
Tropicana
|
|
Australia other
|
|
Cerro Vanguardia
|
|
AngloGold Ashanti
Mineração
|
|
Serra Grande
|
|
|||||||||||||||
|
All-in sustaining costs
|
||||||||||||||||||||||||||
|
Cost of sales per segmental information
(5)
|
260
|
|
274
|
|
16
|
|
550
|
|
268
|
|
429
|
|
153
|
|
1
|
|
851
|
|
||||||||
|
Amortisation of tangible and intangible assets
|
(34
|
)
|
(89
|
)
|
(7
|
)
|
(130
|
)
|
(83
|
)
|
(140
|
)
|
(50
|
)
|
—
|
|
(273
|
)
|
||||||||
|
Adjusted for decommissioning amortisation
|
—
|
|
1
|
|
—
|
|
1
|
|
1
|
|
(1
|
)
|
—
|
|
—
|
|
—
|
|
||||||||
|
Corporate administration and marketing related to current operations
|
—
|
|
—
|
|
—
|
|
—
|
|
—
|
|
1
|
|
—
|
|
—
|
|
1
|
|
||||||||
|
Inventory writedown to net realisable value and other stockpile adjustments
|
—
|
|
—
|
|
1
|
|
1
|
|
—
|
|
—
|
|
—
|
|
—
|
|
—
|
|
||||||||
|
Sustaining exploration and study costs
|
2
|
|
7
|
|
5
|
|
14
|
|
3
|
|
8
|
|
6
|
|
7
|
|
24
|
|
||||||||
|
Total sustaining capital expenditure
|
62
|
|
91
|
|
—
|
|
153
|
|
56
|
|
134
|
|
38
|
|
4
|
|
232
|
|
||||||||
|
All-in sustaining costs
|
290
|
|
284
|
|
15
|
|
589
|
|
245
|
|
431
|
|
147
|
|
12
|
|
835
|
|
||||||||
|
Adjusted for non-controlling interests and non -gold producing companies
(1)
|
—
|
|
—
|
|
8
|
|
8
|
|
(18
|
)
|
—
|
|
—
|
|
(11
|
)
|
(29
|
)
|
||||||||
|
All-in sustaining costs adjusted for non-controlling interests and non-gold producing companies
|
290
|
|
284
|
|
23
|
|
597
|
|
227
|
|
431
|
|
147
|
|
1
|
|
806
|
|
||||||||
|
Adjusted for stockpile write-offs
|
—
|
|
—
|
|
—
|
|
—
|
|
—
|
|
—
|
|
—
|
|
—
|
|
—
|
|
||||||||
|
All-in sustaining costs adjusted for non-controlling interests, non-gold producing companies and stockpile write-offs
|
290
|
|
284
|
|
23
|
|
597
|
|
227
|
|
431
|
|
147
|
|
1
|
|
806
|
|
||||||||
|
All-in sustaining costs
|
290
|
|
284
|
|
15
|
|
589
|
|
245
|
|
431
|
|
147
|
|
12
|
|
835
|
|
||||||||
|
Non-sustaining Project capex
|
—
|
|
—
|
|
—
|
|
—
|
|
—
|
|
2
|
|
—
|
|
—
|
|
2
|
|
||||||||
|
Non-sustaining exploration and study costs
|
—
|
|
—
|
|
10
|
|
10
|
|
2
|
|
7
|
|
—
|
|
28
|
|
37
|
|
||||||||
|
Corporate and social responsibility costs not related to current operations
|
—
|
|
—
|
|
—
|
|
—
|
|
—
|
|
12
|
|
2
|
|
1
|
|
15
|
|
||||||||
|
All-in costs
|
290
|
|
284
|
|
25
|
|
599
|
|
247
|
|
452
|
|
149
|
|
41
|
|
889
|
|
||||||||
|
Adjusted for non-controlling interests and non -gold producing companies
(1)
|
—
|
|
—
|
|
8
|
|
8
|
|
(19
|
)
|
—
|
|
—
|
|
—
|
|
(19
|
)
|
||||||||
|
All-in costs adjusted for non-controlling interests and non-gold producing companies
|
290
|
|
284
|
|
33
|
|
607
|
|
228
|
|
452
|
|
149
|
|
41
|
|
870
|
|
||||||||
|
Adjusted for stockpile write-offs
|
—
|
|
—
|
|
—
|
|
—
|
|
—
|
|
—
|
|
—
|
|
—
|
|
—
|
|
||||||||
|
All-in costs adjusted for non-controlling interests, non-gold producing companies and stockpile write-offs
|
290
|
|
284
|
|
33
|
|
607
|
|
228
|
|
452
|
|
|
149
|
|
|
41
|
|
870
|
|
||||||
|
Gold sold – oz (000)
(2)
|
241
|
|
321
|
|
—
|
|
562
|
|
293
|
|
428
|
|
133
|
|
—
|
|
854
|
|
||||||||
|
All-in sustaining cost (excluding stockpile write-offs) per unit – $/oz
(3)
|
1,203
|
|
885
|
|
—
|
|
1,062
|
|
772
|
|
1,006
|
|
1,103
|
|
—
|
|
943
|
|
||||||||
|
All-in cost per unit (excluding stockpile write-offs) – $/oz
(3)
|
1,203
|
|
885
|
|
—
|
|
1,080
|
|
780
|
|
1,055
|
|
1,119
|
|
—
|
|
1,018
|
|
||||||||
162
For the year ended 31 December 2017
Operations in Australia, Argentina and Brazil
(in $ millions, except as otherwise noted)
|
Australia
|
Total
Australia
|
|
ARGENTINA
|
Brazil
|
Americas other
|
|
TOTAL AMERICAS
|
|
||||||||||||||||||
|
Sunrise Dam
|
|
Tropicana
|
|
Australia other
|
|
Cerro Vanguardia
|
|
AngloGold Ashanti
Mineração
|
|
Serra Grande
|
|
|||||||||||||||
|
Total cash costs
|
||||||||||||||||||||||||||
|
Cost of sales per segmental information
(5)
|
260
|
|
274
|
|
16
|
|
550
|
|
268
|
|
429
|
|
153
|
|
1
|
|
851
|
|
||||||||
|
Inventory change
|
(2
|
)
|
(2
|
)
|
—
|
|
(4
|
)
|
(12
|
)
|
(3
|
)
|
—
|
|
—
|
|
(15
|
)
|
||||||||
|
Amortisation of intangible assets
|
—
|
|
—
|
|
—
|
|
—
|
|
—
|
|
(1
|
)
|
—
|
|
—
|
|
(1
|
)
|
||||||||
|
Amortisation of tangible assets
|
(34
|
)
|
(89
|
)
|
(7
|
)
|
(130
|
)
|
(83
|
)
|
(139
|
)
|
(50
|
)
|
—
|
|
(272
|
)
|
||||||||
|
Rehabilitation and other non-cash costs
|
(5
|
)
|
(2
|
)
|
(2
|
)
|
(9
|
)
|
(11
|
)
|
—
|
|
—
|
|
—
|
|
(11
|
)
|
||||||||
|
Retrenchment costs
|
—
|
|
—
|
|
—
|
|
—
|
|
(2
|
)
|
(3
|
)
|
(1
|
)
|
1
|
|
(5
|
)
|
||||||||
|
Total cash costs
|
219
|
|
181
|
|
7
|
|
407
|
|
160
|
|
284
|
|
101
|
|
2
|
|
547
|
|
||||||||
|
Adjusted for non-controlling interests, non-gold producing companies and other
(1)
|
—
|
|
—
|
|
8
|
|
8
|
|
(12
|
)
|
—
|
|
—
|
|
—
|
|
(12
|
)
|
||||||||
|
Total cash costs adjusted for non-controlling interests and non-gold producing companies
|
219
|
|
181
|
|
15
|
|
415
|
|
148
|
|
284
|
|
101
|
|
2
|
|
535
|
|
||||||||
|
Gold produced – oz (000)
(2)
|
238
|
|
322
|
|
—
|
|
559
|
|
283
|
|
424
|
|
133
|
|
—
|
|
840
|
|
||||||||
|
Total cash costs per unit – $/oz
(3)
|
919
|
|
564
|
|
—
|
|
743
|
|
522
|
|
671
|
|
764
|
|
—
|
|
638
|
|
||||||||
163
For the year ended 31 December 2017
AngloGold Ashanti operations – Total
(in $ millions, except as otherwise noted)
|
JOINT VENTURES
|
|
SUBSIDIARIES
|
|
|
|
All-in sustaining costs
|
||||
|
Cost of sales per segmental information
|
440
|
|
3,582
|
|
|
Amortisation of tangible and intangible assets
|
(136
|
)
|
(823
|
)
|
|
Adjusted for decommissioning amortisation
|
3
|
|
3
|
|
|
Corporate administration and marketing related to current operations
|
—
|
|
63
|
|
|
Inventory write-down to net realisable value and other stockpile adjustments
|
—
|
|
3
|
|
|
Sustaining exploration and study costs
|
1
|
|
64
|
|
|
Total sustaining capital expenditure
|
85
|
|
744
|
|
|
All-in sustaining costs
|
393
|
|
3,636
|
|
|
Adjusted for non-controlling interests and non-gold producing companies
|
—
|
|
(64
|
)
|
|
All-in sustaining costs adjusted for non-controlling interests and non-gold producing companies
|
393
|
|
3,572
|
|
|
Adjusted for stockpile write-offs
|
—
|
|
(3
|
)
|
|
All-in sustaining costs adjusted for non-controlling interests, non-gold producing companies and stockpile write-offs
|
393
|
|
3,569
|
|
|
All-in sustaining costs
|
393
|
|
3,636
|
|
|
Non-sustaining Project capex
|
35
|
|
89
|
|
|
Technology improvements
|
—
|
|
10
|
|
|
Non-sustaining exploration and study costs
|
1
|
|
49
|
|
|
Care and maintenance costs
|
—
|
|
62
|
|
|
Corporate and social responsibility costs not related to current operations
|
—
|
|
24
|
|
|
All-in costs
|
429
|
|
3,870
|
|
|
Adjusted for non-controlling interests and non-gold producing companies
|
—
|
|
(63
|
)
|
|
All-in costs adjusted for non-controlling interests and non-gold producing companies
|
429
|
|
3,807
|
|
|
Adjusted for stockpile write-offs
|
—
|
|
(3
|
)
|
|
All-in costs adjusted for non-controlling interests, non-gold producing companies and stockpile write-offs
|
429
|
|
3,804
|
|
|
Gold sold – oz (000)
|
362
|
|
3,399
|
|
|
All-in sustaining cost (excluding stockpile write-offs) per unit – $/oz
|
1,087
|
|
1,050
|
|
|
All-in cost per unit (excluding stockpile write-offs) – $/oz
|
1,186
|
|
1,119
|
|
164
For the year ended 31 December 2017
AngloGold Ashanti operations – Total
(in $ millions, except as otherwise noted)
|
JOINT VENTURES
|
|
SUBSIDIARIES
|
|
|
|
Total cash costs
|
||||
|
Cost of sales per segmental information
|
440
|
|
3,582
|
|
|
Inventory change
|
(3
|
)
|
(15
|
)
|
|
Amortisation of intangible assets
|
—
|
|
(6
|
)
|
|
Amortisation of tangible assets
|
(136
|
)
|
(817
|
)
|
|
Rehabilitation and other non-cash costs
|
(6
|
)
|
(29
|
)
|
|
Retrenchment costs
|
—
|
|
(6
|
)
|
|
Total cash costs
|
295
|
|
2,709
|
|
|
Adjusted for non-controlling interests, non-gold producing companies and other
(1)
|
—
|
|
(41
|
)
|
|
Associates and equity accounted joint ventures' share of total cash costs
|
—
|
|
—
|
|
|
Total cash costs adjusted for non-controlling interests and non-gold producing companies
|
295
|
|
2,668
|
|
|
Gold produced – oz (000)
|
360
|
|
3,384
|
|
|
Total cash costs (adjusted) per unit – $/oz
|
819
|
|
789
|
|
165
For the year ended 31 December 2016
Operations in South Africa
(in $ millions, except as otherwise noted)
|
Kopanang
|
|
Moab Khotsong
|
|
Vaal River
Operations
|
|
Mponeng
|
|
Tau Tona
|
|
West Wits Operations
|
|
Surface Operations
|
|
South Africa other
|
|
Total South Africa (Operations)
|
|
Corporate
(4)
|
|
||||||||||
|
All-in sustaining costs
|
|||||||||||||||||||||||||||||
|
Cost of sales per segmental information
(5)
|
144
|
|
255
|
|
400
|
|
259
|
|
198
|
|
457
|
|
185
|
|
(1
|
)
|
1,041
|
|
5
|
|
|||||||||
|
Amortisation of tangible and intangible assets
|
(20
|
)
|
(49
|
)
|
(69
|
)
|
(55
|
)
|
(28
|
)
|
(83
|
)
|
(14
|
)
|
(1
|
)
|
(167
|
)
|
(5
|
)
|
|||||||||
|
Adjusted for decommissioning amortisation
|
—
|
|
—
|
|
(1
|
)
|
—
|
|
—
|
|
—
|
|
(2
|
)
|
3
|
|
—
|
|
—
|
|
|||||||||
|
Corporate administration and marketing related to current operations
|
—
|
|
—
|
|
—
|
|
—
|
|
—
|
|
—
|
|
—
|
|
—
|
|
—
|
|
59
|
|
|||||||||
|
Inventory writedown to net realisable value and other stockpile adjustments
|
—
|
|
—
|
|
—
|
|
—
|
|
—
|
|
—
|
|
—
|
|
5
|
|
5
|
|
—
|
|
|||||||||
|
Total sustaining capital expenditure
|
16
|
|
41
|
|
57
|
|
52
|
|
25
|
|
77
|
|
17
|
|
5
|
|
156
|
|
4
|
|
|||||||||
|
All-in sustaining costs
|
140
|
|
|
247
|
|
|
387
|
|
|
256
|
|
|
195
|
|
|
451
|
|
|
186
|
|
|
11
|
|
|
1,035
|
|
|
63
|
|
|
All-in sustaining costs adjusted for non-controlling interests and non-gold producing companies
|
140
|
|
247
|
|
387
|
|
256
|
|
195
|
|
451
|
|
186
|
|
11
|
|
1,035
|
|
63
|
|
|||||||||
|
Adjusted for stockpile write-offs
|
—
|
|
—
|
|
—
|
|
—
|
|
—
|
|
—
|
|
—
|
|
(5
|
)
|
(5
|
)
|
—
|
|
|||||||||
|
All-in sustaining costs adjusted for non-controlling interests, non-gold producing companies and stockpile write-offs
|
140
|
|
|
247
|
|
|
387
|
|
|
256
|
|
|
195
|
|
|
451
|
|
|
186
|
|
|
6
|
|
|
1,030
|
|
|
63
|
|
|
All-in sustaining costs
|
140
|
|
247
|
|
387
|
|
256
|
|
195
|
|
451
|
|
186
|
|
11
|
|
1,035
|
|
63
|
|
|||||||||
|
Non-sustaining Project capex
|
—
|
|
2
|
|
2
|
|
24
|
|
—
|
|
24
|
|
—
|
|
(1
|
)
|
25
|
|
—
|
|
|||||||||
|
Technology improvements
|
—
|
|
—
|
|
—
|
|
—
|
|
—
|
|
—
|
|
—
|
|
14
|
|
14
|
|
—
|
|
|||||||||
|
Non-sustaining exploration and study costs
|
—
|
|
—
|
|
—
|
|
—
|
|
—
|
|
—
|
|
—
|
|
—
|
|
—
|
|
1
|
|
|||||||||
|
Corporate and social responsibility costs not related to current operations
|
—
|
|
—
|
|
—
|
|
—
|
|
—
|
|
—
|
|
—
|
|
—
|
|
—
|
|
25
|
|
|||||||||
|
All-in costs
|
140
|
|
|
249
|
|
|
389
|
|
|
280
|
|
|
195
|
|
|
475
|
|
|
186
|
|
|
24
|
|
|
1,074
|
|
|
89
|
|
|
All-in costs adjusted for non-controlling interests and non-gold producing companies
|
140
|
|
249
|
|
389
|
|
280
|
|
195
|
|
475
|
|
186
|
|
24
|
|
1,074
|
|
89
|
|
|||||||||
|
Adjusted for stockpile write-offs
|
—
|
|
—
|
|
—
|
|
—
|
|
—
|
|
—
|
|
—
|
|
(5
|
)
|
(5
|
)
|
—
|
|
|||||||||
|
All-in costs adjusted for non-controlling interests, non-gold producing companies and stockpile write-offs
|
140
|
|
|
249
|
|
|
389
|
|
|
280
|
|
|
195
|
|
|
475
|
|
|
186
|
|
|
19
|
|
|
1,069
|
|
|
89
|
|
|
Gold sold - oz (000)
(2)
|
91
|
|
279
|
|
369
|
|
253
|
|
146
|
|
398
|
|
185
|
|
—
|
|
953
|
|
—
|
|
|||||||||
|
All-in sustaining cost (excluding stockpile write-offs) per unit - $/oz
(3)
|
1,555
|
|
884
|
|
1,049
|
|
1,011
|
|
1,345
|
|
1,133
|
|
1,004
|
|
—
|
|
1,081
|
|
—
|
|
|||||||||
|
All-in cost per unit (excluding stockpile write-offs) - $/oz
(3)
|
1,555
|
|
890
|
|
1,053
|
|
1,105
|
|
1,345
|
|
1,193
|
|
1,004
|
|
—
|
|
1,122
|
|
—
|
|
|||||||||
|
(1)
|
Adjusting for non-controlling interest of items included in calculation, to disclose the attributable portions only. Other consists of heap leach inventory.
|
|
(2)
|
Attributable portion.
|
|
(3)
|
In addition to the operational performances of the mines, all-in sustaining cost per ounce, all-in cost per ounce and total cash costs per ounce are affected by fluctuations in the currency exchange rate. AngloGold Ashanti reports all-in sustaining cost per ounce and all-in cost per ounce calculated to the nearest US dollar amount and gold sold in ounces. AngloGold Ashanti reports total cash costs per ounce calculated to the nearest US dollar amount and gold produced in ounces.
|
|
(4)
|
Corporate includes non-gold producing subsidiaries.
|
|
(5)
|
Refer Item 18: Note 2 – Segmental Information.
|
Rounding of figures may result in computational discrepancies.
166
For the year ended 31 December 2016
Operations in South Africa
(in $ millions, except as otherwise noted)
|
Kopanang
|
|
Moab Khotsong
|
|
Vaal River
Operations
|
|
Mponeng
|
|
Tau Tona
|
|
West Wits Operations
|
|
Surface Operations
|
|
South Africa other
|
|
Total South Africa (Operations)
|
|
Corporate
(4)
|
|
||||||||||
|
Total cash costs
|
|||||||||||||||||||||||||||||
|
Cost of sales per segmental information
|
144
|
|
255
|
|
400
|
|
259
|
|
198
|
|
457
|
|
185
|
|
(1
|
)
|
1,041
|
|
5
|
|
|||||||||
|
Inventory change
|
—
|
|
1
|
|
1
|
|
1
|
|
—
|
|
1
|
|
(1
|
)
|
—
|
|
1
|
|
—
|
|
|||||||||
|
Amortisation of intangible assets
|
—
|
|
(2
|
)
|
(2
|
)
|
(1
|
)
|
(1
|
)
|
(2
|
)
|
(1
|
)
|
(1
|
)
|
(6
|
)
|
(2
|
)
|
|||||||||
|
Amortisation of tangible assets
|
(19
|
)
|
(48
|
)
|
(67
|
)
|
(54
|
)
|
(27
|
)
|
(81
|
)
|
(13
|
)
|
—
|
|
(161
|
)
|
(3
|
)
|
|||||||||
|
Rehabilitation and other non-cash costs
|
(2
|
)
|
1
|
|
(2
|
)
|
(4
|
)
|
(1
|
)
|
(5
|
)
|
(3
|
)
|
3
|
|
(7
|
)
|
—
|
|
|||||||||
|
Retrenchment costs
|
(2
|
)
|
(3
|
)
|
(5
|
)
|
(3
|
)
|
(2
|
)
|
(5
|
)
|
—
|
|
(1
|
)
|
(11
|
)
|
—
|
|
|||||||||
|
Total cash costs
|
121
|
|
204
|
|
325
|
|
198
|
|
167
|
|
365
|
|
167
|
|
—
|
|
857
|
|
—
|
|
|||||||||
|
Adjusted for non-controlling interests, non-gold producing companies and other
(1)
|
—
|
|
—
|
|
—
|
|
—
|
|
—
|
|
—
|
|
—
|
|
—
|
|
—
|
|
—
|
|
|||||||||
|
Total cash costs adjusted for non-controlling interests and non-gold producing companies
|
121
|
|
204
|
|
325
|
|
198
|
|
167
|
|
365
|
|
167
|
|
—
|
|
857
|
|
—
|
|
|||||||||
|
Gold produced – oz (000)
(2)
|
91
|
|
280
|
|
371
|
|
254
|
|
146
|
|
399
|
|
186
|
|
—
|
|
957
|
|
—
|
|
|||||||||
|
Total cash costs per unit –
$/oz
(3)
|
1,324
|
|
729
|
|
875
|
|
779
|
|
1,148
|
|
914
|
|
899
|
|
—
|
|
896
|
|
—
|
|
|||||||||
167
For the year ended 31 December 2016
Operations in DRC, Ghana, Guinea, Mali and Tanzania
(in $ millions, except as otherwise noted)
|
DRC
|
MALI
|
JOINT
|
GHANA
|
GUINEA
|
TANZANIA
|
Continental Africa other
|
|
SUBSIDIARIES
|
|
|||||||||||||||||
|
Kibali
|
|
Morila
|
|
Sadiola
|
|
VENTURES
|
Iduapriem
|
|
Obuasi
|
|
Siguiri
|
|
Geita
|
|
||||||||||||
|
All-in sustaining costs
|
||||||||||||||||||||||||||
|
Cost of sales per segmental information
|
292
|
|
32
|
|
81
|
|
406
|
|
219
|
|
1
|
|
257
|
|
447
|
|
1
|
|
925
|
|
||||||
|
Amortisation of tangible and intangible assets
|
(96
|
)
|
(7
|
)
|
(11
|
)
|
(114
|
)
|
(23
|
)
|
—
|
|
(31
|
)
|
(195
|
)
|
(2
|
)
|
(251
|
)
|
||||||
|
Adjusted for decommissioning amortisation
|
—
|
|
2
|
|
—
|
|
2
|
|
—
|
|
—
|
|
1
|
|
3
|
|
1
|
|
5
|
|
||||||
|
Inventory writedown to net realisable value and other stockpile adjustments
|
—
|
|
1
|
|
—
|
|
1
|
|
—
|
|
—
|
|
—
|
|
—
|
|
—
|
|
—
|
|
||||||
|
Sustaining exploration and study costs
|
—
|
|
—
|
|
1
|
|
1
|
|
—
|
|
—
|
|
3
|
|
27
|
|
—
|
|
30
|
|
||||||
|
Total sustaining capital expenditure
|
32
|
|
1
|
|
3
|
|
36
|
|
8
|
|
—
|
|
38
|
|
119
|
|
—
|
|
165
|
|
||||||
|
All-in sustaining costs
|
228
|
|
29
|
|
74
|
|
332
|
|
204
|
|
1
|
|
268
|
|
401
|
|
—
|
|
874
|
|
||||||
|
Adjusted for non-controlling interests and non -gold producing companies
(1)
|
—
|
|
—
|
|
—
|
|
—
|
|
—
|
|
—
|
|
(40
|
)
|
—
|
|
—
|
|
(40
|
)
|
||||||
|
All-in sustaining costs adjusted for non-controlling interests and non-gold producing companies
|
228
|
|
29
|
|
74
|
|
332
|
|
204
|
|
1
|
|
228
|
|
401
|
|
—
|
|
834
|
|
||||||
|
Adjusted for stockpile write-offs
|
—
|
|
(1
|
)
|
—
|
|
(1
|
)
|
—
|
|
—
|
|
—
|
|
—
|
|
—
|
|
—
|
|
||||||
|
All-in sustaining costs adjusted for non-controlling interests, non-gold producing companies and stockpile write-offs
|
228
|
|
28
|
|
74
|
|
331
|
|
204
|
|
1
|
|
228
|
|
401
|
|
—
|
|
834
|
|
||||||
|
All-in sustaining costs
|
228
|
|
29
|
|
74
|
|
332
|
|
204
|
|
1
|
|
268
|
|
401
|
|
—
|
|
874
|
|
||||||
|
Non-sustaining Project capex
|
60
|
|
—
|
|
3
|
|
63
|
|
—
|
|
6
|
|
21
|
|
—
|
|
—
|
|
27
|
|
||||||
|
Non-sustaining exploration and study costs
|
2
|
|
—
|
|
—
|
|
2
|
|
—
|
|
4
|
|
—
|
|
—
|
|
(1
|
)
|
3
|
|
||||||
|
Care and maintenance costs
|
—
|
|
—
|
|
—
|
|
—
|
|
—
|
|
70
|
|
—
|
|
—
|
|
—
|
|
70
|
|
||||||
|
All-in costs
|
290
|
|
29
|
|
77
|
|
397
|
|
204
|
|
81
|
|
289
|
|
401
|
|
(1
|
)
|
974
|
|
||||||
|
Adjusted for non-controlling interests and non -gold producing companies
(1)
|
—
|
|
—
|
|
—
|
|
—
|
|
—
|
|
—
|
|
(43
|
)
|
—
|
|
—
|
|
(43
|
)
|
||||||
|
All-in costs adjusted for non-controlling interests and non-gold producing companies
|
290
|
|
29
|
|
77
|
|
397
|
|
204
|
|
81
|
|
246
|
|
401
|
|
(1
|
)
|
931
|
|
||||||
|
Adjusted for stockpile write-offs
|
—
|
|
(1
|
)
|
—
|
|
(1
|
)
|
—
|
|
—
|
|
—
|
|
—
|
|
—
|
|
—
|
|
||||||
|
All-in costs adjusted for non-controlling interests, non-gold producing companies and stockpile write-offs
|
290
|
|
28
|
|
77
|
|
396
|
|
204
|
|
81
|
|
246
|
|
401
|
|
(1
|
)
|
931
|
|
||||||
|
Gold sold – oz (000)
(2)
|
256
|
|
21
|
|
70
|
|
347
|
|
215
|
|
3
|
|
249
|
|
474
|
|
—
|
|
941
|
|
||||||
|
All-in sustaining cost (excluding stockpile write-offs) per unit –
$/oz
(3)
|
893
|
|
1,337
|
|
1,066
|
|
955
|
|
950
|
|
440
|
|
915
|
|
844
|
|
—
|
|
886
|
|
||||||
|
All-in cost per unit (excluding stockpile write-offs) – $/oz
(3)
|
1,132
|
|
1,337
|
|
1,116
|
|
1,141
|
|
950
|
|
29,420
|
|
985
|
|
844
|
|
—
|
|
989
|
|
||||||
168
For the year ended 31 December 2016
Operations in DRC, Ghana, Guinea, Mali and Tanzania
(in $ millions, except as otherwise noted)
|
DRC
|
MALI
|
JOINT
|
GHANA
|
GUINEA
|
TANZANIA
|
Continental Africa other
|
|
SUBSIDIARIES
|
|
||||||||||||||||||||
|
Kibali
|
|
Morila
|
|
Sadiola
|
|
VENTURES
|
Iduapriem
|
|
Obuasi
|
|
Siguiri
|
|
Geita
|
|
|||||||||||||||
|
Cash costs
|
|||||||||||||||||||||||||||||
|
Cost of sales per segmental information
|
292
|
|
32
|
|
81
|
|
406
|
|
219
|
|
1
|
|
257
|
|
447
|
|
1
|
|
925
|
|
|||||||||
|
Inventory change
|
5
|
|
—
|
|
—
|
|
5
|
|
—
|
|
—
|
|
14
|
|
7
|
|
1
|
|
22
|
|
|||||||||
|
Amortisation of intangible assets
|
—
|
|
—
|
|
—
|
|
—
|
|
—
|
|
—
|
|
—
|
|
—
|
|
(2
|
)
|
(2
|
)
|
|||||||||
|
Amortisation of tangible assets
|
(96
|
)
|
(7
|
)
|
(10
|
)
|
(114
|
)
|
(23
|
)
|
—
|
|
(31
|
)
|
(195
|
)
|
—
|
|
(249
|
)
|
|||||||||
|
Rehabilitation and other non-cash costs
|
(6
|
)
|
(1
|
)
|
(1
|
)
|
(9
|
)
|
(2
|
)
|
(1
|
)
|
(1
|
)
|
(5
|
)
|
1
|
|
(8
|
)
|
|||||||||
|
Total cash costs
|
195
|
|
24
|
|
70
|
|
288
|
|
194
|
|
1
|
|
239
|
|
253
|
|
1
|
|
688
|
|
|||||||||
|
Adjusted for non-controlling interests, non-gold producing companies and other
(1)
|
—
|
|
—
|
|
—
|
|
—
|
|
—
|
|
—
|
|
(36
|
)
|
—
|
|
—
|
|
(36
|
)
|
|||||||||
|
Total cash costs adjusted for non-controlling interests and non-gold producing companies
|
195
|
|
24
|
|
70
|
|
288
|
|
194
|
|
1
|
|
203
|
|
253
|
|
1
|
|
652
|
|
|||||||||
|
Gold produced - oz (000)
(2)
|
264
|
|
22
|
|
70
|
|
356
|
|
214
|
|
3
|
|
260
|
|
478
|
|
—
|
|
955
|
|
|||||||||
|
Total cash costs per unit - $/oz
(3)
|
740
|
|
1,123
|
|
991
|
|
812
|
|
908
|
|
167
|
|
784
|
|
530
|
|
—
|
|
682
|
|
|||||||||
169
For the year ended 31 December 2016
Operations in Australia, Argentina and Brazil
(in $ millions, except as otherwise noted)
|
Australia
|
Total
Australia
|
|
ARGENTINA
|
Brazil
|
Americas other
|
|
TOTAL AMERICAS
|
|
||||||||||||||||||
|
Sunrise Dam
|
|
Tropicana
|
|
Australia other
|
|
Cerro Vanguardia
|
|
AngloGold Ashanti
Mineração
|
|
Serra Grande
|
|
|||||||||||||||
|
All-in sustaining costs
|
||||||||||||||||||||||||||
|
Cost of sales per segmental information
|
242
|
|
277
|
|
21
|
|
540
|
|
250
|
|
364
|
|
134
|
|
4
|
|
752
|
|
||||||||
|
Amortisation of tangible and intangible assets
|
(32
|
)
|
(83
|
)
|
(11
|
)
|
(126
|
)
|
(77
|
)
|
(132
|
)
|
(51
|
)
|
—
|
|
(260
|
)
|
||||||||
|
Adjusted for decommissioning amortisation
|
1
|
|
2
|
|
—
|
|
3
|
|
1
|
|
1
|
|
—
|
|
—
|
|
2
|
|
||||||||
|
Corporate administration and marketing related to current operations
|
—
|
|
—
|
|
—
|
|
—
|
|
—
|
|
1
|
|
—
|
|
(1
|
)
|
—
|
|
||||||||
|
Inventory writedown to net realisable value and other stockpile adjustments
|
—
|
|
—
|
|
7
|
|
7
|
|
—
|
|
—
|
|
—
|
|
—
|
|
—
|
|
||||||||
|
Sustaining exploration and study costs
|
1
|
|
12
|
|
8
|
|
21
|
|
2
|
|
2
|
|
7
|
|
7
|
|
18
|
|
||||||||
|
Total sustaining capital expenditure
|
32
|
|
76
|
|
1
|
|
109
|
|
60
|
|
121
|
|
43
|
|
1
|
|
225
|
|
||||||||
|
All-in sustaining costs
|
244
|
|
284
|
|
26
|
|
554
|
|
236
|
|
357
|
|
133
|
|
11
|
|
737
|
|
||||||||
|
Adjusted for non-controlling interests and non -gold producing companies
(1)
|
—
|
|
—
|
|
8
|
|
8
|
|
(18
|
)
|
—
|
|
—
|
|
(8
|
)
|
(26
|
)
|
||||||||
|
All-in sustaining costs adjusted for non-controlling interests and non-gold producing companies
|
244
|
|
284
|
|
34
|
|
562
|
|
218
|
|
357
|
|
133
|
|
3
|
|
711
|
|
||||||||
|
Adjusted for stockpile write-offs
|
—
|
|
—
|
|
(8
|
)
|
(8
|
)
|
(4
|
)
|
—
|
|
(1
|
)
|
1
|
|
(4
|
)
|
||||||||
|
All-in sustaining costs adjusted for non-controlling interests, non-gold producing companies and stockpile write-offs
|
244
|
|
284
|
|
26
|
|
554
|
|
214
|
|
357
|
|
132
|
|
4
|
|
707
|
|
||||||||
|
All-in sustaining costs
|
244
|
|
284
|
|
26
|
|
554
|
|
236
|
|
357
|
|
133
|
|
11
|
|
737
|
|
||||||||
|
Non-sustaining Project capex
|
—
|
|
—
|
|
—
|
|
—
|
|
—
|
|
1
|
|
—
|
|
—
|
|
1
|
|
||||||||
|
Non-sustaining exploration and study costs
|
—
|
|
—
|
|
7
|
|
7
|
|
—
|
|
6
|
|
1
|
|
36
|
|
43
|
|
||||||||
|
Corporate and social responsibility costs not related to current operations
|
—
|
|
—
|
|
—
|
|
—
|
|
—
|
|
11
|
|
3
|
|
1
|
|
15
|
|
||||||||
|
All-in costs
|
244
|
|
284
|
|
33
|
|
561
|
|
236
|
|
375
|
|
137
|
|
48
|
|
796
|
|
||||||||
|
Adjusted for non-controlling interests and non -gold producing companies(1)
|
—
|
|
—
|
|
8
|
|
8
|
|
(17
|
)
|
—
|
|
—
|
|
(1
|
)
|
(18
|
)
|
||||||||
|
All-in costs adjusted for non-controlling interests and non-gold producing companies
|
244
|
|
284
|
|
41
|
|
569
|
|
219
|
|
375
|
|
137
|
|
47
|
|
778
|
|
||||||||
|
Adjusted for stockpile write-offs
|
—
|
|
—
|
|
(8
|
)
|
(8
|
)
|
(4
|
)
|
—
|
|
(1
|
)
|
1
|
|
(4
|
)
|
||||||||
|
All-in costs adjusted for non-controlling interests, non-gold producing companies and stockpile write-offs
|
244
|
|
284
|
|
33
|
|
561
|
|
215
|
|
375
|
|
|
136
|
|
|
48
|
|
774
|
|
||||||
|
Gold sold – oz (000)
(2)
|
226
|
|
293
|
|
—
|
|
519
|
|
277
|
|
400
|
|
130
|
|
—
|
|
807
|
|
||||||||
|
All-in sustaining cost (excluding stockpile write-offs) per unit – $/oz
(3)
|
1,080
|
|
970
|
|
—
|
|
1,067
|
|
773
|
|
893
|
|
1,020
|
|
—
|
|
875
|
|
||||||||
|
All-in cost per unit (excluding stockpile write-offs) – $/oz
(3)
|
1,080
|
|
970
|
|
—
|
|
1,081
|
|
774
|
|
938
|
|
1,044
|
|
—
|
|
959
|
|
||||||||
170
For the year ended 31 December 2016
Operations in Australia, Argentina and Brazil
(in $ millions, except as otherwise noted)
|
Australia
|
Total
Australia
|
|
ARGENTINA
|
Brazil
|
Americas other
|
|
TOTAL AMERICAS
|
|
||||||||||||||||||
|
Sunrise Dam
|
|
Tropicana
|
|
Australia other
|
|
Cerro Vanguardia
|
|
AngloGold Ashanti
Mineração
|
|
Serra Grande
|
|
|||||||||||||||
|
Cash costs
|
||||||||||||||||||||||||||
|
Cost of sales per segmental information
|
242
|
|
277
|
|
21
|
|
540
|
|
250
|
|
364
|
|
134
|
|
4
|
|
752
|
|
||||||||
|
Inventory change
|
—
|
|
—
|
|
1
|
|
1
|
|
7
|
|
5
|
|
1
|
|
—
|
|
13
|
|
||||||||
|
Amortisation of intangible assets
|
—
|
|
—
|
|
—
|
|
—
|
|
—
|
|
(7
|
)
|
(3
|
)
|
—
|
|
(10
|
)
|
||||||||
|
Amortisation of tangible assets
|
(32
|
)
|
(83
|
)
|
(11
|
)
|
(126
|
)
|
(77
|
)
|
(125
|
)
|
(48
|
)
|
—
|
|
(250
|
)
|
||||||||
|
Rehabilitation and other non-cash costs
|
1
|
|
(10
|
)
|
(2
|
)
|
(11
|
)
|
(8
|
)
|
(7
|
)
|
(1
|
)
|
—
|
|
(16
|
)
|
||||||||
|
Retrenchment costs
|
—
|
|
—
|
|
—
|
|
—
|
|
(1
|
)
|
(1
|
)
|
—
|
|
(1
|
)
|
(3
|
)
|
||||||||
|
Total cash costs
|
211
|
|
184
|
|
9
|
|
404
|
|
171
|
|
229
|
|
83
|
|
3
|
|
486
|
|
||||||||
|
Adjusted for non-controlling interests, non-gold producing companies and other
(1)
|
—
|
|
—
|
|
8
|
|
8
|
|
(13
|
)
|
—
|
|
—
|
|
—
|
|
(13
|
)
|
||||||||
|
Total cash costs adjusted for non-controlling interests and non-gold producing companies
|
211
|
|
184
|
|
17
|
|
412
|
|
158
|
|
229
|
|
83
|
|
3
|
|
473
|
|
||||||||
|
Gold produced – oz (000)
(2)
|
228
|
|
292
|
|
—
|
|
520
|
|
281
|
|
407
|
|
131
|
|
—
|
|
820
|
|
||||||||
|
Total cash costs per unit – $/oz
(3)
|
926
|
|
630
|
|
—
|
|
793
|
|
563
|
|
562
|
|
634
|
|
—
|
|
578
|
|
||||||||
171
For the year ended 31 December 2016
AngloGold Ashanti operations – Total
(in $ millions, except as otherwise noted)
|
JOINT VENTURES
|
|
SUBSIDIARIES
|
|
|
|
All-in sustaining costs
|
||||
|
Cost of sales per segmental information
|
406
|
|
3,263
|
|
|
Amortisation of tangible and intangible assets
|
(114
|
)
|
(809
|
)
|
|
Adjusted for decommissioning amortisation
|
2
|
|
10
|
|
|
Corporate administration and marketing related to current operations
|
—
|
|
59
|
|
|
Inventory writedown to net realisable value and other stockpile adjustments
|
1
|
|
12
|
|
|
Sustaining exploration and study costs
|
1
|
|
69
|
|
|
Total sustaining capital expenditure
|
36
|
|
659
|
|
|
All-in sustaining costs
|
332
|
|
3,263
|
|
|
Adjusted for non-controlling interests and non-gold producing companies
|
—
|
|
(58
|
)
|
|
All-in sustaining costs adjusted for non-controlling interests and non-gold producing companies
|
332
|
|
3,205
|
|
|
Adjusted for stockpile write-offs
|
(1
|
)
|
(17
|
)
|
|
All-in sustaining costs adjusted for non-controlling interests, non-gold producing companies and stockpile write-offs
|
331
|
|
3,188
|
|
|
All-in sustaining costs
|
332
|
|
3,263
|
|
|
Non-sustaining Project capex
|
63
|
|
53
|
|
|
Technology improvements
|
—
|
|
14
|
|
|
Non-sustaining exploration and study costs
|
2
|
|
54
|
|
|
Care and maintenance costs
|
—
|
|
70
|
|
|
Corporate and social responsibility costs not related to current operations
|
—
|
|
40
|
|
|
All-in costs
|
397
|
|
3,494
|
|
|
Adjusted for non-controlling interests and non-gold producing companies
|
—
|
|
(53
|
)
|
|
All-in costs adjusted for non-controlling interests and non-gold producing companies
|
397
|
|
3,441
|
|
|
Adjusted for stockpile write-offs
|
(1
|
)
|
(17
|
)
|
|
All-in costs adjusted for non-controlling interests, non-gold producing companies and stockpile write-offs
|
396
|
|
3,424
|
|
|
Gold sold – oz (000)
|
347
|
|
3,220
|
|
|
All-in sustaining cost (excluding stockpile write-offs) per unit – $/oz
|
955
|
|
990
|
|
|
All-in cost per unit (excluding stockpile write-offs) – $/oz
|
1,141
|
|
1,063
|
|
172
For the year ended 31 December 2016
AngloGold Ashanti operations – Total
(in $ millions, except as otherwise noted)
|
JOINT VENTURES
|
|
SUBSIDIARIES
|
|
|
|
Cash costs
|
||||
|
Cost of sales per segmental information
|
406
|
|
3,263
|
|
|
Inventory change
|
5
|
|
38
|
|
|
Amortisation of intangible assets
|
—
|
|
(20
|
)
|
|
Amortisation of tangible assets
|
(114
|
)
|
(789
|
)
|
|
Rehabilitation and other non-cash costs
|
(9
|
)
|
(43
|
)
|
|
Retrenchment costs
|
—
|
|
(14
|
)
|
|
Total cash costs
|
288
|
|
2,435
|
|
|
Adjusted for non-controlling interests, non-gold producing companies and other(1)
|
—
|
|
(41
|
)
|
|
Total cash costs adjusted for non-controlling interests and non-gold producing companies
|
288
|
|
2,394
|
|
|
Gold produced – oz (000)
|
356
|
|
3,250
|
|
|
Total cash costs (adjusted) per unit – $/oz
|
812
|
|
737
|
|
173
For the year ended 31 December 2015
Operations in South Africa
(in $ millions, except as otherwise noted)
|
Kopanang
|
|
Moab Khotsong
|
|
Vaal River
Operations
|
|
Mponeng
|
|
Tau Tona
|
|
West Wits Operations
|
|
Surface Operations
|
|
South Africa other
|
|
Total South Africa (Operations)
|
|
Corporate
(4)
|
|
||||||||||
|
All-in sustaining costs
|
|||||||||||||||||||||||||||||
|
Cost of sales per segmental information
(5)
|
148
|
|
260
|
|
408
|
|
251
|
|
230
|
|
481
|
|
194
|
|
—
|
|
1,083
|
|
(2
|
)
|
|||||||||
|
Amortisation of tangible and intangible assets
|
(24
|
)
|
(47
|
)
|
(71
|
)
|
(53
|
)
|
(40
|
)
|
(93
|
)
|
(17
|
)
|
(1
|
)
|
(182
|
)
|
(7
|
)
|
|||||||||
|
Corporate administration and marketing related to current operations
|
—
|
|
—
|
|
—
|
|
—
|
|
—
|
|
—
|
|
—
|
|
—
|
|
—
|
|
77
|
|
|||||||||
|
Inventory writedown to net realisable value and other stockpile adjustments
|
—
|
|
—
|
|
—
|
|
—
|
|
—
|
|
—
|
|
—
|
|
1
|
|
1
|
|
(1
|
)
|
|||||||||
|
Sustaining exploration and study costs
|
—
|
|
—
|
|
—
|
|
—
|
|
—
|
|
—
|
|
—
|
|
—
|
|
—
|
|
1
|
|
|||||||||
|
Total sustaining capital expenditure
|
20
|
|
45
|
|
65
|
|
59
|
|
28
|
|
87
|
|
17
|
|
9
|
|
178
|
|
3
|
|
|||||||||
|
All-in sustaining costs
|
144
|
|
|
258
|
|
|
402
|
|
|
257
|
|
|
218
|
|
|
475
|
|
|
194
|
|
|
9
|
|
|
1,080
|
|
|
71
|
|
|
Adjusted for non-controlling interests and non -gold producing companies
(1)
|
—
|
|
—
|
|
—
|
|
—
|
|
—
|
|
—
|
|
—
|
|
—
|
|
—
|
|
9
|
|
|||||||||
|
All-in sustaining costs adjusted for non-controlling interests and non-gold producing companies
|
144
|
|
|
258
|
|
|
402
|
|
|
257
|
|
|
218
|
|
|
475
|
|
|
194
|
|
|
9
|
|
|
1,080
|
|
|
80
|
|
|
Adjusted for stockpile write-offs
|
—
|
|
—
|
|
—
|
|
—
|
|
—
|
|
—
|
|
—
|
|
(1
|
)
|
(1
|
)
|
—
|
|
|||||||||
|
All-in sustaining costs adjusted for non-controlling interests, non-gold producing companies and stockpile write-offs
|
144
|
|
|
258
|
|
|
402
|
|
|
257
|
|
|
218
|
|
|
475
|
|
|
194
|
|
|
8
|
|
|
1,079
|
|
|
80
|
|
|
All-in sustaining costs
|
144
|
|
258
|
|
402
|
|
257
|
|
218
|
|
475
|
|
194
|
|
9
|
|
1,080
|
|
71
|
|
|||||||||
|
Non-sustaining Project capex
|
—
|
|
2
|
|
2
|
|
26
|
|
—
|
|
26
|
|
—
|
|
—
|
|
28
|
|
—
|
|
|||||||||
|
Technology improvements
|
—
|
|
—
|
|
—
|
|
—
|
|
—
|
|
—
|
|
—
|
|
16
|
|
16
|
|
(1
|
)
|
|||||||||
|
Non-sustaining exploration and study costs
|
—
|
|
—
|
|
—
|
|
—
|
|
—
|
|
—
|
|
—
|
|
—
|
|
—
|
|
1
|
|
|||||||||
|
Corporate and social responsibility costs not related to current operations
|
—
|
|
—
|
|
—
|
|
—
|
|
—
|
|
—
|
|
—
|
|
—
|
|
—
|
|
17
|
|
|||||||||
|
All-in costs
|
144
|
|
|
260
|
|
|
404
|
|
|
283
|
|
|
218
|
|
|
501
|
|
|
194
|
|
|
25
|
|
|
1,124
|
|
|
88
|
|
|
Adjusted for non-controlling interests and non -gold producing companies
(1)
|
—
|
|
—
|
|
—
|
|
—
|
|
—
|
|
—
|
|
—
|
|
—
|
|
—
|
|
8
|
|
|||||||||
|
All-in costs adjusted for non-controlling interests and non-gold producing companies
|
144
|
|
|
260
|
|
|
404
|
|
|
283
|
|
|
218
|
|
|
501
|
|
|
194
|
|
|
25
|
|
|
1,124
|
|
|
96
|
|
|
Adjusted for stockpile write-offs
|
—
|
|
—
|
|
—
|
|
—
|
|
—
|
|
—
|
|
—
|
|
(1
|
)
|
(1
|
)
|
—
|
|
|||||||||
|
All-in costs adjusted for non-controlling interests, non-gold producing companies and stockpile write-offs
|
144
|
|
|
260
|
|
|
404
|
|
|
283
|
|
|
218
|
|
|
501
|
|
|
194
|
|
|
24
|
|
|
1,123
|
|
|
96
|
|
|
Gold sold - oz (000)
(2)
|
118
|
|
254
|
|
371
|
|
219
|
|
209
|
|
428
|
|
193
|
|
—
|
|
993
|
|
—
|
|
|||||||||
|
All-in sustaining cost (excluding stockpile write-offs) per unit – $/oz
(3)
|
1,226
|
|
1,018
|
|
1,084
|
|
1,170
|
|
1,044
|
|
1,108
|
|
1,006
|
|
—
|
|
1,088
|
|
—
|
|
|||||||||
|
All-in cost per unit (excluding stockpile write-offs) – $/oz
(3)
|
1,226
|
|
1,024
|
|
1,088
|
|
1,290
|
|
1,044
|
|
1,170
|
|
1,006
|
|
—
|
|
1,131
|
|
—
|
|
|||||||||
|
(1)
|
Adjusting for non-controlling interest of items included in calculation, to disclose the attributable portions only. Other consists of heap leach inventory.
|
|
(2)
|
Attributable portion.
|
|
(3)
|
In addition to the operational performances of the mines, all-in sustaining cost per ounce, all-in cost per ounce, total cash costs per ounce per ounce are affected by fluctuations in the currency exchange rate. AngloGold Ashanti reports all-in sustaining cost per ounce and all-in cost per ounce calculated to the nearest US dollar amount and gold sold in ounces. AngloGold Ashanti reports total cash costs per ounce calculated to the nearest US dollar amount and gold produced in ounces.
|
|
(4)
|
Corporate includes non-gold producing subsidiaries.
|
|
(5)
|
Refer Item 18: Note 2 – Segmental Information.
|
Rounding of figures may result in computational discrepancies.
174
For the year ended 31 December 2015
Operations in South Africa
(in $ millions, except as otherwise noted)
|
Kopanang
|
|
Moab Khotsong
|
|
Vaal River
Operations
|
|
Mponeng
|
|
Tau Tona
|
|
West Wits Operations
|
|
Surface Operations
|
|
South Africa other
|
|
Total South Africa (Operations)
|
|
Corporate
(4)
|
|
||||||||||
|
Cash costs
|
|||||||||||||||||||||||||||||
|
Cost of sales per segmental information
|
148
|
|
260
|
|
408
|
|
251
|
|
230
|
|
481
|
|
194
|
|
—
|
|
1,083
|
|
(2
|
)
|
|||||||||
|
Inventory change
|
—
|
|
—
|
|
—
|
|
—
|
|
—
|
|
—
|
|
—
|
|
—
|
|
—
|
|
1
|
|
|||||||||
|
Amortisation of intangible assets
|
(2
|
)
|
(5
|
)
|
(7
|
)
|
(4
|
)
|
(4
|
)
|
(8
|
)
|
(2
|
)
|
(1
|
)
|
(18
|
)
|
(3
|
)
|
|||||||||
|
Amortisation of tangible assets
|
(22
|
)
|
(42
|
)
|
(64
|
)
|
(49
|
)
|
(35
|
)
|
(84
|
)
|
(15
|
)
|
(1
|
)
|
(164
|
)
|
(4
|
)
|
|||||||||
|
Rehabilitation and other non-cash costs
|
(3
|
)
|
(8
|
)
|
(11
|
)
|
(5
|
)
|
(4
|
)
|
(9
|
)
|
(1
|
)
|
1
|
|
(20
|
)
|
—
|
|
|||||||||
|
Retrenchment costs
|
(2
|
)
|
(3
|
)
|
(4
|
)
|
(2
|
)
|
(2
|
)
|
(4
|
)
|
—
|
|
1
|
|
(7
|
)
|
(1
|
)
|
|||||||||
|
Total cash costs
|
119
|
|
202
|
|
322
|
|
191
|
|
185
|
|
376
|
|
176
|
|
—
|
|
874
|
|
(9
|
)
|
|||||||||
|
Adjusted for non-controlling interests, non-gold producing companies and other
(1)
|
—
|
|
—
|
|
—
|
|
—
|
|
—
|
|
—
|
|
—
|
|
—
|
|
—
|
|
9
|
|
|||||||||
|
Total cash costs adjusted for non-controlling interests and non-gold producing companies
|
119
|
|
|
202
|
|
|
322
|
|
|
191
|
|
|
185
|
|
|
376
|
|
|
176
|
|
|
—
|
|
|
874
|
|
|
—
|
|
|
Gold produced - oz (000)
(2)
|
117
|
|
254
|
|
371
|
|
219
|
|
209
|
|
428
|
|
193
|
|
—
|
|
992
|
|
—
|
|
|||||||||
|
Total cash costs per unit –
$/oz
(3)
|
1,014
|
|
798
|
|
867
|
|
874
|
|
883
|
|
879
|
|
912
|
|
—
|
|
881
|
|
—
|
|
|||||||||
175
For the year ended 31 December 2015
Operations in DRC, Ghana, Guinea, Mali and Tanzania
(in $ millions, except as otherwise noted)
|
DRC
|
MALI
|
JOINT
|
GHANA
|
GUINEA
|
TANZANIA
|
Continental Africa other
|
|
SUBSIDIARIES
|
|
|||||||||||||||||||
|
Kibali
|
|
Morila
|
|
Sadiola
|
|
VENTURES
|
Iduapriem
|
|
Obuasi
|
|
Siguiri
|
|
Geita
|
|
||||||||||||||
|
All-in sustaining costs
|
||||||||||||||||||||||||||||
|
Cost of sales per segmental information
|
266
|
|
45
|
|
67
|
|
378
|
|
219
|
|
64
|
|
280
|
|
404
|
|
2
|
|
969
|
|
||||||||
|
Amortisation of tangible and intangible assets
|
(87
|
)
|
(12
|
)
|
(9
|
)
|
(108
|
)
|
(32
|
)
|
(22
|
)
|
(26
|
)
|
(148
|
)
|
(3
|
)
|
(231
|
)
|
||||||||
|
Adjusted for decommissioning amortisation
|
—
|
|
2
|
|
1
|
|
3
|
|
—
|
|
4
|
|
2
|
|
3
|
|
—
|
|
9
|
|
||||||||
|
Corporate administration and marketing related to current operations
|
—
|
|
—
|
|
(2
|
)
|
(2
|
)
|
—
|
|
—
|
|
—
|
|
—
|
|
—
|
|
—
|
|
||||||||
|
Inventory writedown to net realisable value and other stockpile adjustments
|
—
|
|
2
|
|
—
|
|
2
|
|
2
|
|
—
|
|
—
|
|
3
|
|
—
|
|
5
|
|
||||||||
|
Sustaining exploration and study costs
|
—
|
|
—
|
|
—
|
|
—
|
|
2
|
|
17
|
|
6
|
|
6
|
|
(1
|
)
|
30
|
|
||||||||
|
Total sustaining capital expenditure
|
7
|
|
5
|
|
4
|
|
16
|
|
15
|
|
3
|
|
29
|
|
116
|
|
1
|
|
164
|
|
||||||||
|
All-in sustaining costs
|
186
|
|
42
|
|
61
|
|
289
|
|
206
|
|
66
|
|
291
|
|
384
|
|
(1
|
)
|
946
|
|
||||||||
|
Adjusted for non-controlling interests and non -gold producing companies
(1)
|
—
|
|
—
|
|
—
|
|
—
|
|
—
|
|
—
|
|
(43
|
)
|
—
|
|
(1
|
)
|
(44
|
)
|
||||||||
|
All-in sustaining costs adjusted for non-controlling interests and non-gold producing companies
|
186
|
|
42
|
|
61
|
|
289
|
|
206
|
|
66
|
|
248
|
|
384
|
|
(2
|
)
|
902
|
|
||||||||
|
Adjusted for stockpile write-offs
|
—
|
|
(2
|
)
|
—
|
|
(2
|
)
|
(12
|
)
|
—
|
|
—
|
|
(3
|
)
|
—
|
|
(15
|
)
|
||||||||
|
All-in sustaining costs adjusted for non-controlling interests, non-gold producing companies and stockpile write-offs
|
186
|
|
40
|
|
61
|
|
287
|
|
194
|
|
66
|
|
248
|
|
381
|
|
(2
|
)
|
887
|
|
||||||||
|
All-in sustaining costs
|
186
|
|
42
|
|
61
|
|
289
|
|
206
|
|
66
|
|
291
|
|
384
|
|
(1
|
)
|
946
|
|
||||||||
|
Non-sustaining Project capex
|
117
|
|
—
|
|
(2
|
)
|
115
|
|
—
|
|
20
|
|
—
|
|
—
|
|
—
|
|
20
|
|
||||||||
|
Non-sustaining exploration and study costs
|
1
|
|
—
|
|
—
|
|
1
|
|
—
|
|
—
|
|
1
|
|
—
|
|
—
|
|
1
|
|
||||||||
|
Care and maintenance costs
|
—
|
|
—
|
|
—
|
|
—
|
|
—
|
|
67
|
|
—
|
|
—
|
|
—
|
|
67
|
|
||||||||
|
Corporate and social responsibility costs not related to current operations
|
—
|
|
—
|
|
—
|
|
—
|
|
—
|
|
1
|
|
—
|
|
—
|
|
—
|
|
1
|
|
||||||||
|
All-in costs
|
304
|
|
42
|
|
59
|
|
405
|
|
206
|
|
154
|
|
292
|
|
384
|
|
(1
|
)
|
1,035
|
|
||||||||
|
Adjusted for non-controlling interests and non -gold producing companies
(1)
|
—
|
|
—
|
|
—
|
|
—
|
|
—
|
|
—
|
|
(44
|
)
|
—
|
|
—
|
|
(44
|
)
|
||||||||
|
All-in costs adjusted for non-controlling interests and non-gold producing companies
|
304
|
|
42
|
|
59
|
|
405
|
|
206
|
|
154
|
|
248
|
|
384
|
|
(1
|
)
|
991
|
|
||||||||
|
Adjusted for stockpile write-offs
|
—
|
|
(2
|
)
|
—
|
|
(2
|
)
|
(12
|
)
|
—
|
|
—
|
|
(3
|
)
|
—
|
|
(15
|
)
|
||||||||
|
All-in costs adjusted for non-controlling interests, non-gold producing companies and stockpile write-offs
|
304
|
|
40
|
|
59
|
|
403
|
|
194
|
|
154
|
|
248
|
|
381
|
|
(1
|
)
|
976
|
|
||||||||
|
Gold sold - oz (000)
(2)
|
290
|
|
49
|
|
69
|
|
408
|
|
190
|
|
56
|
|
256
|
|
531
|
|
—
|
|
1,033
|
|
||||||||
|
All-in sustaining cost (excluding stockpile write-offs) per unit –
$/oz
(3)
|
642
|
|
815
|
|
886
|
|
704
|
|
1,020
|
|
1,185
|
|
965
|
|
717
|
|
—
|
|
859
|
|
||||||||
|
All-in cost per unit (excluding stockpile write-offs) – $/oz
(3)
|
1,051
|
|
815
|
|
852
|
|
989
|
|
1,020
|
|
2,750
|
|
969
|
|
717
|
|
—
|
|
944
|
|
||||||||
176
For the year ended 31 December 2015
Operations in DRC, Ghana, Guinea, Mali and Tanzania
(in $ millions, except as otherwise noted)
|
DRC
|
MALI
|
JOINT
|
GHANA
|
GUINEA
|
TANZANIA
|
Continental Africa other
|
|
SUBSIDIARIES
|
|
||||||||||||||||||||
|
Kibali
|
|
Morila
|
|
Sadiola
|
|
VENTURES
|
Iduapriem
|
|
Obuasi
|
|
Siguiri
|
|
Geita
|
|
|||||||||||||||
|
Cash costs
|
|||||||||||||||||||||||||||||
|
Cost of sales per segmental information
|
266
|
|
45
|
|
67
|
|
378
|
|
219
|
|
64
|
|
280
|
|
404
|
|
2
|
|
969
|
|
|||||||||
|
Inventory change
|
—
|
|
—
|
|
—
|
|
—
|
|
1
|
|
(3
|
)
|
(6
|
)
|
(6
|
)
|
—
|
|
(14
|
)
|
|||||||||
|
Amortisation of intangible assets
|
—
|
|
—
|
|
—
|
|
—
|
|
—
|
|
—
|
|
—
|
|
—
|
|
(2
|
)
|
(2
|
)
|
|||||||||
|
Amortisation of tangible assets
|
(87
|
)
|
(12
|
)
|
(8
|
)
|
(108
|
)
|
(32
|
)
|
(22
|
)
|
(26
|
)
|
(148
|
)
|
(1
|
)
|
(229
|
)
|
|||||||||
|
Rehabilitation and other non-cash costs
|
(3
|
)
|
—
|
|
(1
|
)
|
(4
|
)
|
4
|
|
12
|
|
1
|
|
3
|
|
(1
|
)
|
19
|
|
|||||||||
|
Retrenchment costs
|
—
|
|
1
|
|
—
|
|
1
|
|
—
|
|
—
|
|
—
|
|
—
|
|
—
|
|
—
|
|
|||||||||
|
Total cash costs
|
176
|
|
34
|
|
57
|
|
267
|
|
192
|
|
51
|
|
248
|
|
253
|
|
(1
|
)
|
743
|
|
|||||||||
|
Adjusted for non-controlling interests, non-gold producing companies and other
(1)
|
—
|
|
—
|
|
—
|
|
—
|
|
—
|
|
—
|
|
(37
|
)
|
—
|
|
—
|
|
(37
|
)
|
|||||||||
|
Associates and equity accounted joint ventures' share of total cash costs
(2)
|
—
|
|
—
|
|
—
|
|
—
|
|
—
|
|
—
|
|
—
|
|
—
|
|
—
|
|
—
|
|
|||||||||
|
Total cash costs adjusted for non-controlling interests and non-gold producing companies
|
176
|
|
34
|
|
57
|
|
267
|
|
192
|
|
51
|
|
211
|
|
253
|
|
(1
|
)
|
706
|
|
|||||||||
|
Gold produced - oz (000)
(2)
|
289
|
|
49
|
|
69
|
|
407
|
|
193
|
|
53
|
|
255
|
|
527
|
|
—
|
|
1,028
|
|
|||||||||
|
Total cash costs per unit - $/oz
(3)
|
609
|
|
698
|
|
818
|
|
655
|
|
995
|
|
966
|
|
827
|
|
480
|
|
—
|
|
687
|
|
|||||||||
177
For the year ended 31 December 2015
Operations in Australia, Argentina and Brazil
(in $ millions, except as otherwise noted)
|
Australia
|
TOTAL AUSTRALIA
|
|
ARGENTINA
|
Brazil
|
Americas other
|
|
TOTAL AMERICAS
|
|
||||||||||||||||||
|
Sunrise Dam
|
|
Tropicana
|
|
Australia other
|
|
Cerro Vanguardia
|
|
AngloGold Ashanti
Mineração
|
|
Serra Grande
|
|
|||||||||||||||
|
All-in sustaining costs
|
||||||||||||||||||||||||||
|
Cost of sales per segmental information
|
239
|
|
266
|
|
20
|
|
525
|
|
244
|
|
335
|
|
137
|
|
3
|
|
719
|
|
||||||||
|
Amortisation of tangible and intangible assets
|
(25
|
)
|
(88
|
)
|
(4
|
)
|
(117
|
)
|
(58
|
)
|
(125
|
)
|
(57
|
)
|
—
|
|
(240
|
)
|
||||||||
|
Adjusted for decommissioning amortisation
|
—
|
|
3
|
|
—
|
|
3
|
|
1
|
|
—
|
|
—
|
|
(1
|
)
|
—
|
|
||||||||
|
Corporate administration and marketing related to current operations
|
—
|
|
—
|
|
—
|
|
—
|
|
—
|
|
1
|
|
—
|
|
—
|
|
1
|
|
||||||||
|
Inventory writedown to net realisable value and other stockpile adjustments
|
—
|
|
—
|
|
—
|
|
—
|
|
—
|
|
1
|
|
4
|
|
—
|
|
5
|
|
||||||||
|
Sustaining exploration and study costs
|
2
|
|
8
|
|
5
|
|
15
|
|
3
|
|
2
|
|
2
|
|
9
|
|
16
|
|
||||||||
|
Total sustaining capital expenditure
|
29
|
|
49
|
|
—
|
|
78
|
|
67
|
|
89
|
|
33
|
|
1
|
|
190
|
|
||||||||
|
All-in sustaining costs
|
245
|
|
238
|
|
21
|
|
504
|
|
257
|
|
303
|
|
119
|
|
12
|
|
691
|
|
||||||||
|
Adjusted for non-controlling interests and non -gold producing companies(
1)
|
—
|
|
—
|
|
—
|
|
—
|
|
(19
|
)
|
—
|
|
—
|
|
(10
|
)
|
(29
|
)
|
||||||||
|
All-in sustaining costs adjusted for non-controlling interests and non-gold producing companies
|
245
|
|
|
238
|
|
|
21
|
|
|
504
|
|
|
238
|
|
|
303
|
|
|
119
|
|
|
2
|
|
|
662
|
|
|
Adjusted for stockpile write-offs
|
—
|
|
—
|
|
—
|
|
—
|
|
—
|
|
(1
|
)
|
(4
|
)
|
—
|
|
(5
|
)
|
||||||||
|
All-in sustaining costs adjusted for non-controlling interests, non-gold producing companies and stockpile write-offs
|
245
|
|
|
238
|
|
|
21
|
|
|
504
|
|
|
238
|
|
|
302
|
|
|
115
|
|
|
2
|
|
|
657
|
|
|
All-in sustaining costs
|
245
|
|
238
|
|
21
|
|
504
|
|
257
|
|
303
|
|
119
|
|
12
|
|
691
|
|
||||||||
|
Non-sustaining Project capex
|
—
|
|
—
|
|
—
|
|
—
|
|
—
|
|
—
|
|
—
|
|
6
|
|
6
|
|
||||||||
|
Non-sustaining exploration and study costs
|
—
|
|
—
|
|
6
|
|
6
|
|
—
|
|
2
|
|
—
|
|
51
|
|
53
|
|
||||||||
|
Corporate and social responsibility costs not related to current operations
|
—
|
|
—
|
|
—
|
|
—
|
|
—
|
|
7
|
|
—
|
|
1
|
|
8
|
|
||||||||
|
All-in costs
|
245
|
|
|
238
|
|
|
27
|
|
|
510
|
|
|
257
|
|
|
312
|
|
|
119
|
|
|
70
|
|
|
758
|
|
|
Adjusted for non-controlling interests and non -gold producing companies
(1)
|
—
|
|
—
|
|
—
|
|
—
|
|
(19
|
)
|
—
|
|
—
|
|
—
|
|
(19
|
)
|
||||||||
|
All-in costs adjusted for non-controlling interests and non-gold producing companies
|
245
|
|
|
238
|
|
|
27
|
|
|
510
|
|
|
238
|
|
|
312
|
|
|
119
|
|
|
70
|
|
|
739
|
|
|
Adjusted for stockpile write-offs
|
—
|
|
—
|
|
—
|
|
—
|
|
—
|
|
(1
|
)
|
(4
|
)
|
—
|
|
(5
|
)
|
||||||||
|
All-in costs adjusted for non-controlling interests, non-gold producing companies and stockpile write-offs
|
245
|
|
|
238
|
|
|
27
|
|
|
510
|
|
|
238
|
|
|
311
|
|
|
115
|
|
|
70
|
|
|
734
|
|
|
Gold sold - oz (000)
(2)
|
221
|
|
354
|
|
—
|
|
575
|
|
273
|
|
423
|
|
133
|
|
—
|
|
829
|
|
||||||||
|
All-in sustaining cost (excluding stockpile write-offs) per unit - $/oz
(3)
|
1,110
|
|
671
|
|
—
|
|
875
|
|
873
|
|
712
|
|
861
|
|
—
|
|
792
|
|
||||||||
|
All-in cost per unit (excluding stockpile write-offs) - $/oz
(3)
|
1,110
|
|
671
|
|
—
|
|
886
|
|
874
|
|
733
|
|
865
|
|
—
|
|
885
|
|
||||||||
178
For the year ended 31 December 2015
Operations in Australia, Argentina and Brazil
(in $ millions, except as otherwise noted)
|
Australia
|
TOTAL AUSTRALIA
|
|
ARGENTINA
|
Brazil
|
Americas other
|
|
TOTAL AMERICAS
|
|
||||||||||||||||||
|
Sunrise Dam
|
|
Tropicana
|
|
Australia other
|
|
Cerro Vanguardia
|
|
AngloGold Ashanti
Mineração
|
|
Serra Grande
|
|
|||||||||||||||
|
Cash costs
|
||||||||||||||||||||||||||
|
Cost of sales per segmental information
|
239
|
|
266
|
|
20
|
|
525
|
|
244
|
|
335
|
|
137
|
|
3
|
|
719
|
|
||||||||
|
Inventory change
|
(3
|
)
|
(6
|
)
|
(2
|
)
|
(11
|
)
|
4
|
|
—
|
|
(3
|
)
|
—
|
|
1
|
|
||||||||
|
Amortisation of intangible assets
|
—
|
|
—
|
|
—
|
|
—
|
|
—
|
|
(12
|
)
|
(5
|
)
|
—
|
|
(17
|
)
|
||||||||
|
Amortisation of tangible assets
|
(25
|
)
|
(88
|
)
|
(4
|
)
|
(117
|
)
|
(58
|
)
|
(113
|
)
|
(52
|
)
|
—
|
|
(223
|
)
|
||||||||
|
Rehabilitation and other non-cash costs
|
(1
|
)
|
(3
|
)
|
—
|
|
(4
|
)
|
(1
|
)
|
10
|
|
7
|
|
(1
|
)
|
15
|
|
||||||||
|
Retrenchment costs
|
—
|
|
—
|
|
—
|
|
—
|
|
(1
|
)
|
(2
|
)
|
—
|
|
—
|
|
(3
|
)
|
||||||||
|
Total cash costs
|
210
|
|
169
|
|
14
|
|
393
|
|
188
|
|
218
|
|
84
|
|
2
|
|
492
|
|
||||||||
|
Adjusted for non-controlling interests, non-gold producing companies and other
(1)
|
—
|
|
—
|
|
—
|
|
—
|
|
(14
|
)
|
—
|
|
—
|
|
—
|
|
(14
|
)
|
||||||||
|
Total cash costs adjusted for non-controlling interests and non-gold producing companies
|
210
|
|
169
|
|
14
|
|
393
|
|
174
|
|
218
|
|
84
|
|
2
|
|
478
|
|
||||||||
|
Gold produced - oz (000)
(2)
|
216
|
|
344
|
|
—
|
|
560
|
|
278
|
|
421
|
|
132
|
|
—
|
|
831
|
|
||||||||
|
Total cash costs per unit - $/oz
(3)
|
970
|
|
492
|
|
—
|
|
702
|
|
625
|
|
518
|
|
635
|
|
—
|
|
576
|
|
||||||||
179
For the year ended 31 December 2015
AngloGold Ashanti operations – Total
(in $ millions, except as otherwise noted)
|
JOINT VENTURES
|
|
SUBSIDIARIES
|
|
|
|
All-in sustaining costs
|
||||
|
Cost of sales per segmental information
|
378
|
|
3,294
|
|
|
Amortisation of tangible and intangible assets
|
(108
|
)
|
(777
|
)
|
|
Adjusted for decommissioning amortisation
|
3
|
|
12
|
|
|
Corporate administration and marketing related to current operations
|
(2
|
)
|
78
|
|
|
Inventory writedown to net realisable value and other stockpile adjustments
|
2
|
|
10
|
|
|
Sustaining exploration and study costs
|
—
|
|
62
|
|
|
Total sustaining capital expenditure
|
16
|
|
613
|
|
|
All-in sustaining costs
|
289
|
|
3,292
|
|
|
Adjusted for non-controlling interests and non-gold producing companies
|
—
|
|
(64
|
)
|
|
All-in sustaining costs adjusted for non-controlling interests and non-gold producing companies
|
289
|
|
3,228
|
|
|
Adjusted for stockpile write-offs
|
(2
|
)
|
(21
|
)
|
|
All-in sustaining costs adjusted for non-controlling interests, non-gold producing companies and stockpile write-offs
|
287
|
|
3,207
|
|
|
All-in sustaining costs
|
289
|
|
3,292
|
|
|
Non-sustaining Project capex
|
115
|
|
54
|
|
|
Technology improvements
|
—
|
|
16
|
|
|
Non-sustaining exploration and study costs
|
1
|
|
61
|
|
|
Care and maintenance costs
|
—
|
|
67
|
|
|
Care and maintenance costs, Corporate and social responsibility costs not related to current operations
|
—
|
|
26
|
|
|
All-in costs
|
405
|
|
3,516
|
|
|
Adjusted for non-controlling interests and non-gold producing companies
|
—
|
|
(55
|
)
|
|
All-in costs adjusted for non-controlling interests and non-gold producing companies
|
405
|
|
3,461
|
|
|
Adjusted for stockpile write-offs
|
(2
|
)
|
(21
|
)
|
|
All-in costs adjusted for non-controlling interests, non-gold producing companies and stockpile write-offs
|
403
|
|
3,440
|
|
|
Gold sold - oz (000)
|
408
|
|
3,430
|
|
|
All-in sustaining cost (excluding stockpile write-offs) per unit - $/oz
|
704
|
|
935
|
|
|
All-in cost per unit (excluding stockpile write-offs) - $/oz
|
989
|
|
1,003
|
|
180
For the year ended 31 December 2015
AngloGold Ashanti operations - Total
(in $ millions, except as otherwise noted)
|
JOINT VENTURES
|
|
SUBSIDIARIES
|
|
|
|
Cash costs
|
||||
|
Cost of sales per segmental information
|
378
|
|
3,294
|
|
|
Inventory change
|
—
|
|
(23
|
)
|
|
Amortisation of intangible assets
|
—
|
|
(40
|
)
|
|
Amortisation of tangible assets
|
(108
|
)
|
(737
|
)
|
|
Rehabilitation and other non-cash costs
|
(4
|
)
|
10
|
|
|
Retrenchment costs
|
1
|
|
(11
|
)
|
|
Total cash costs
|
267
|
|
2,493
|
|
|
Adjusted for non-controlling interests, non-gold producing companies and other
(1)
|
—
|
|
(42
|
)
|
|
Total cash costs adjusted for non-controlling interests and non-gold producing companies
|
267
|
|
2,451
|
|
|
Gold produced - oz (000)
|
407
|
|
3,411
|
|
|
Total cash costs per unit - $/oz
|
655
|
|
719
|
|
181
|
5B.
|
LIQUIDITY AND CAPITAL RESOURCES
|
In the board’s opinion, AngloGold Ashanti’s working capital is sufficient to meet the company’s present requirements.
Operating activities
2017
Cash flows from operating activities were $997 million in 2017, $189 million, or 16 percent, lower than the 2016 amount of $1,186 million. The decrease in cash flows generated by operations was mainly due to increased total cash costs partially offset by increased revenues from a higher gold price received and increased production.
Net cash outflow from operating working capital items amounted to $156 million in 2017, compared with an outflow of $76 million in 2016.
2016
Cash flows from operating activities were $1,186 million in 2016, $47 million, or four percent, higher than the 2015 amount of $1,139 million. The increase in cash flows provided by operations was mainly due to increased revenues from a higher gold price received partially offset by lower production.
Net cash outflow from operating working capital items amounted to $76 million in 2016, compared with an inflow of $89 million in 2015.
Financing activities
2017
Cash flows from financing activities in the year ended 31 December 2017 amounted to a net outflow of $148 million, which is a change of $615 million from an outflow of $763 million in the year ended 31 December 2016. Cash inflows from proceeds from borrowings in 2017 amounted to $815 million and included a $155 million drawdown on the $1.0 billion syndicated revolving credit facility, $42 million drawdown on the A$500 million syndicated revolving credit facility, $540 million in proceeds from the local borrowings facilities in South Africa and proceeds from other small loans amounting to $78 million.
Cash outflows from repayment of borrowings of $767 million during the year ended 31 December 2017 included the repayment of $170 million of the US$1.0 billion syndicated revolving credit facility, $428 million of the local borrowing facilities in South Africa, $65 million of the A$500 million syndicated revolving credit facility and $104 million relating to other loans.
During 2016, the company incurred a $30 million cost in respect of the repurchase premium and cost on redemption of the remaining $1.25 billion bonds 8.5% bonds due in 2020. This once-off cost did not recur in 2017. Finance costs paid decreased by $34 million in 2017 due to the redemption of remaining bonds in 2016.
Dividends paid to non-controlling interests increased from $15 million in 2016 to $19 million in 2017 and were all paid by non-wholly owned subsidiaries. During 2017, the company declared and paid a dividend of $39 million to shareholders, whereas in the prior period, no dividend was paid to shareholders.
2016
Cash flows from financing activities in the year ended 31 December 2016 amounted to a net outflow of $763 million, which is a change of $423 million from an outflow of $1,186 million in the year ended 31 December 2015. Cash inflows from proceeds from borrowings in 2016 amounted to $787 million and included a $330 million drawdown on the $1.0 billion syndicated revolving credit facility, $157 million drawdown on the A$500 million syndicated revolving credit facility, $256 million in proceeds from the local borrowing facilities in South Africa and proceeds from other small loans amounting to $44 million.
Cash outflows from repayment of borrowings of $1,333 million during the year ended 31 December 2016 included the repayment of $471 million of the $1.25 billion 8.500 percent bonds due 2020, $480 million of the US$1.0 billion syndicated revolving credit facility, $290 million of the local borrowing facilities, $89 million of the A$500 million syndicated revolving credit facility and $3 million in connection with other loans.
Bond settlement premium, RCF and bond transaction costs decreased from $61 million in the year ended 31 December 2015 to $30 million in the year ended 31 December 2016. The decrease was due to the remaining premium and fees on the redemption of the $1.25 billion bonds 8.500 percent bonds due 2020. Finance costs decreased by $79 million in 2016 due to the redemption of the bonds.
182
Dividends paid to non-controlling interests increased from $5 million in 2015 to $15 million in 2016 and were all paid from non-wholly owned subsidiaries.
Liquidity
AngloGold Ashanti’s revenues are derived primarily from the sale of gold produced at its mines. Cash flows from operating activities are therefore the function of gold produced that is sold at a specific price. The market price of gold can fluctuate widely, which impacts the profitability of the company’s operations and the cash flows generated by these operations.
AngloGold Ashanti’s cash and cash equivalents decreased to $205 million at 31 December 2017 compared with $215 million at 31 December 2016. In accordance with South African Reserve Bank regulations, cash generated by South African operations is held in rands and is therefore subject to exchange controls. At 31 December 2017 67 percent of the company’s cash and cash equivalents were held in US dollars, 11 percent were held in South African rands and 22 percent were held in other currencies.
During April 2010, the group issued two rated bonds fully and unconditionally guaranteed by AngloGold Ashanti Ltd. The issuance consisted of a 10 year ($700 million) bond with a semi-annual coupon of 5.375% per annum, and a 30-year ($300 million) bond with a semi-annual coupon of 6.50% per annum. Unless the company redeems the bonds earlier, the bonds will mature on 15 April 2020 and, 15 April 2040 respectively.
During July 2012, the group entered into a $750 million rated bond. Semi-annual coupons are paid at 5.125% per annum. The bonds are dollar based and unless the company redeems the bonds, earlier they are repayable on 1 August 2022. The notes are fully and unconditionally guaranteed by the group.
During July 2014, the group completed the following financing transactions:
|
•
|
A $1 billion five-year revolving credit facility with a syndicate of lenders. Amounts may be repaid and reborrowed under the facility during its five-year term and the facility bears interest at LIBOR plus 1.5%. The facility matures in July 2019. The interest margin will reduce should the group’s credit rating improve from its current BB+/Baa3 status and increase should its credit rating worsen.
|
|
•
|
A five-year unsecured syndicated revolving credit facility of A$500 million ($390 million) with a group of banks which is currently charged at 2% above BBSY. The interest margin will reduce should the group’s credit rating improve from its current BB+/Baa3 status and increase should its credit rating worsen. This facility will be used to fund the working capital and development costs associated with the group's mining operations within Australia without eroding the group's headroom under its other facilities and exposing the group to foreign exchange gains/losses. The facility matures in July 2019.
|
During July 2015, the group entered into a five-year unsecured syndicated revolving credit facility (ZAR RCF1.4 billion) of R1.4 billion ($113 million) with Nedbank and ABSA Bank. Amounts may be repaid and reborrowed under the facility during its five-year term and the facility bears interest at JIBAR plus 1.65% per annum. This facility, as well as the R1 billion and R2.5 billion ZAR RCF facilities, will be used to fund the working capital and development costs associated with the group’s mining operations within South Africa without eroding the group’s headroom under its other facilities and exposing the group to foreign exchange gains/losses. This facility matures in July 2020.
During August 2016, the group entered into three-year unsecured revolving credit facilities of $100 million. Interest is currently charged at a margin of between 6.2% and 8% above LIBOR. The facilities mature in August 2019.
During November 2017, the group entered into a three-year unsecured revolving credit facility (ZAR RCF 1 billion) of R1 billion ($81 million) with Standard Bank. Amounts may be repaid and reborrowed under the facility during its three-year term and the facility bears interest at JIBAR plus 1.3% per annum. The facility matures in November 2020, with the option on application to extend by a maximum of two years.
During December 2017, the group entered into a three-year unsecured syndicated revolving credit facility (ZAR RCF 2.5 billion) of R2.5 billion ($202 million) with Nedbank and ABSA Bank. Amounts may be repaid and reborrowed under the facility during its three-year term and the facility bears interest at JIBAR plus 1.8% per annum. The facility matures in December 2020, with the option on application to extend by a maximum of two years. This facility replaced the five-year unsecured syndicated revolving credit facility (ZAR RCF 1.5 billion) of R1.5 billion ($121 million) with Nedbank and ABSA Bank entered into during December 2013. The latter facility was settled on 12 December 2017.
Amounts are converted to US dollars at exchange rates as of 31 December 2017.
AngloGold Ashanti intends to finance its capital expenditure and debt repayment requirements in 2018 from cash on hand, cash flow from operations, existing credit facilities and, potentially, if deemed appropriate, long-term debt financing, the issuance of equity and equity linked instruments.
183
Current borrowings
AngloGold Ashanti’s current borrowings increased to $38 million at 31 December 2017 from $34 million at 31 December 2016. See “Item 18: Note 25-Borrowings”
Non-current borrowings
AngloGold Ashanti’s non-current borrowings increased to $2,230 million at 31 December 2017 compared to $2,144 million at 31 December 2016. See “Item 18: Note 25-Borrowings”
As at 31 December 2017, AngloGold Ashanti’s total non-current borrowings, including the short-term portion maturing within 2018, was made up as follows:
|
$ (million)
|
|
|
|
Unsecured borrowings
|
2,190
|
|
|
Secured finance leases
|
78
|
|
|
Total borrowings
|
2,268
|
|
|
Less: Short-term maturities
|
38
|
|
|
Total non-current borrowings
|
2,230
|
|
Amounts falling due are scheduled as follows:
|
$ (million)
|
|
|
|
Within one year
|
38
|
|
|
Between one and two years
|
219
|
|
|
Between two and five years
|
1,687
|
|
|
After five years
|
324
|
|
|
Total
|
2,268
|
|
At 31 December 2017 the currencies in which the borrowings were denominated were as follows:
|
$ (million)
|
|
|
|
United States dollars
|
1,807
|
|
|
Australian dollars
|
221
|
|
|
South African rand
|
237
|
|
|
Brazilian real
|
3
|
|
|
Total
|
2,268
|
|
At 31 December 2017, AngloGold Ashanti had the following undrawn amounts available under its borrowing facilities:
|
$ (million)
|
|
|
|
Syndicated revolving credit facility ($1.0 billion) - US dollar
|
965
|
|
|
Syndicated revolving credit facility (A$500 million) - Australian dollar
|
226
|
|
|
Syndicated revolving credit facility (R2.5 billion) - SA rand
|
146
|
|
|
Syndicated revolving credit facility (R1.4 billion) - SA rand
|
32
|
|
|
FirstRand Bank Limited (R750 millIon) - SA rand
|
61
|
|
|
Revolving credit facilities ($100 million) - US dollar
|
85
|
|
|
Total undrawn facilities
|
1,515
|
|
AngloGold Ashanti had no other committed lines of credit as of 31 December 2017.
As of 31 December 2017, the company was in compliance with all debt covenants and provisions related to potential defaults.
See “Item 18: Note 35-Capital Management” and “Item 10C: Material Contracts”.
AngloGold Ashanti, through its executive committee, reviews its short-, medium- and long-term funding, treasury and liquidity requirements and positions monthly. The Audit Committee also reviews these on a quarterly basis at its meetings.
184
Contractual commitments and contingencies
For a detailed discussion of commitments and contingencies, see note 33 to the consolidated financial statements “Contractual commitments and contingencies”.
As at 31 December 2017, capital commitments can be summarised over the periods shown below as follows:
|
Expiration per period
|
||||||||||||||
|
Commitment
|
Total
amount
|
|
Less than
1 year
|
|
1 – 3
years
|
|
4 – 5
years
|
|
Over 5
years
|
|
||||
|
(in millions)
|
$
|
|
$
|
|
$
|
|
$
|
|
$
|
|
||||
|
Capital expenditure (contracted and not yet contracted)
(1)
|
200
|
|
188
|
|
12
|
|
—
|
|
—
|
|
||||
|
Other commercial commitments
(2)
|
698
|
|
274
|
|
232
|
|
81
|
|
111
|
|
||||
|
Total
|
898
|
|
462
|
|
244
|
|
81
|
|
111
|
|
||||
|
(1)
|
Including commitments through contractual arrangements with equity accounted joint ventures of $21 million.
|
|
(2)
|
Excludes commitments through contractual arrangements with equity accounted joint ventures.
|
Recent developments
Recent developments disclosed in “Item 18: Note 36-Recent developments” include the following details:
On 20 February 2018, the directors of AngloGold Ashanti declared a gross cash dividend per ordinary share of 70 South African cents (assuming an exchange rate of ZAR11.66/$, the gross dividend payable per ADS is equivalent to 6 US cents).
On 28 February 2018, the conditions precedent were fulfilled on the sale of Moab Khotsong and Kopanang mines and the transactions were completed with ownership of the Moab Khotsong and Kopanang mines transferring to Harmony and Heaven-Sent, respectively.
Related party transactions
For a detailed discussion of related party transactions, see “Item 7B.: Related Party Transactions”.
Recently adopted accounting policies and pending adoption of new accounting standards
AngloGold Ashanti’s accounting policies are described in note 1 to the consolidated financial statements “Accounting policies”.
Critical accounting policies
AngloGold Ashanti’s accounting policies are described in note 1 to the consolidated financial statements “Accounting policies”. The preparation of the company’s financial statements requires management to make estimates and assumptions that affect the reported amounts of assets and liabilities and disclosures of contingent assets and liabilities at the date of the financial statements and the reported amounts of revenues and expenses during the year. The following are considered to be the accounting policies that are most critical to the company’s results of operations, financial condition and cash flows.
Use of estimates and making of assumptions
The more significant areas requiring the use of management estimates and assumptions relate to Ore Reserve that are the basis of future cash flow estimates and unit-of-production depreciation, depletion and amortisation calculations; environmental, reclamation and closure obligations; asset impairments/reversals (including impairments of goodwill); and write-downs of inventory to net realisable value. Other estimates include employee benefit liabilities and unrecognized tax positions.
On an ongoing basis, management evaluates its estimates and assumptions; however, actual amounts could differ significantly due to the ultimate conclusion of uncertainties.
Ore Reserve and life-of-mines
AngloGold Ashanti estimates on an annual basis its Ore Reserve at its mining operations. There are a number of uncertainties inherent in estimating quantities of Ore Reserve, including many factors beyond the company’s control. Estimates of Ore Reserve are based upon engineering evaluations of assay values derived from samplings of drill holes and other openings. Additionally, declines in the market price of gold may render certain Ore Reserve containing relatively lower grades of mineralisation uneconomic to mine. Further, availability of permits, changes in operating and capital costs, and other factors could materially and adversely affect the Ore Reserve. The company uses its estimates of Ore Reserve to determine the unit basis for mine depreciation and
185
closure rates, and to evaluate mine asset impairments. Changes in estimates of Ore Reserve could significantly affect these items. At least annually, the company reviews mining schedules, production levels and asset lives in the company’s life-of-mine planning for all of the company’s operating and development properties. Significant changes in the life-of-mine plans may occur as a result of mining experience, new ore discoveries, changes in mining methods and rates, process changes, investment in new equipment and technology and gold prices. Based on the life-of-mine analysis the company reviews its accounting estimates and adjusts depreciation, amortisation, reclamation costs and evaluation of each mine for impairment where necessary. Accordingly, this analysis and the estimates made therein have a significant impact on the company’s results of operations and financial condition.
Contingencies
Accounting for contingencies requires the recording of an estimated loss for a loss contingency when information available indicates that it is probable that an asset has been impaired or a liability has been incurred, and the amount of the loss can be reasonably estimated. Accounting for contingencies such as legal and income tax matters requires the use of judgements to determine the amount to be recorded in the financial statements. By their nature, contingencies will only be resolved when one or more future events occur or fail to occur, and typically, those events will occur a number of years into the future. The company assesses such contingent liabilities, which inherently involves the exercise of significant management judgement and estimates of the outcome of future events.
Provision
for environmental rehabilitation
AngloGold Ashanti’s mining and exploration activities are subject to various laws and regulations governing the protection of the environment. The company recognises management’s best estimate for asset retirement obligations in the period in which they are incurred. Actual costs incurred in future periods could differ materially from the estimates. Additionally, future changes to environmental laws and regulations, life of mine estimates and discount rates could affect the carrying amount of this provision. Changes in Ore Reserve could similarly affect the useful lives of assets depreciated on a straight-line-basis, where those lives are limited to the life of mine.
|
5C.
|
RESEARCH AND DEVELOPMENT, PATENTS AND LICENSES, ETC.
|
Research and development expenditure included in the income statement amounted to $11 million, $15 million and $18 million during 2017, 2016 and 2015, respectively.
|
5D.
|
TREND INFORMATION
|
For a discussion of trends affecting AngloGold Ashanti’s business and operations, see “Item 5A.: Operating Results – Key factors affecting results”.
|
5E.
|
OFF-BALANCE SHEET ARRANGEMENTS
|
AngloGold Ashanti does not engage in off-balance sheet financing activities, and does not have any off-balance sheet debt obligations, special purpose entities or unconsolidated associates. The most significant off-balance sheet item is the unaccrued future rehabilitation obligations.
See Item 5F: Tabular disclosure of contractual obligations.
186
|
5F.
|
TABULAR DISCLOSURE OF CONTRACTUAL OBLIGATIONS
|
As at 31 December 2017 AngloGold Ashanti had the following known contractual obligations:
|
Total
|
|
Less than
1 year
|
|
1 – 3
years
|
|
4 – 5
years
|
|
More than
5 years
|
|
|||||
|
(in millions)
|
$
|
|
$
|
|
$
|
|
$
|
|
$
|
|
||||
|
Long-term debt obligations including interest
(1)
|
3,090
|
|
138
|
|
1,367
|
|
890
|
|
695
|
|
||||
|
Capital lease obligations
|
119
|
|
14
|
|
27
|
|
24
|
|
54
|
|
||||
|
Operating lease obligations
|
90
|
|
45
|
|
38
|
|
7
|
|
—
|
|
||||
|
Purchase obligations
|
||||||||||||||
|
- Contracted capital expenditure
(2)
|
87
|
|
87
|
|
—
|
|
—
|
|
—
|
|
||||
|
- Other purchase obligations
(3)
|
698
|
|
274
|
|
232
|
|
81
|
|
111
|
|
||||
|
Environmental rehabilitation costs
(4)
|
991
|
|
74
|
|
95
|
|
67
|
|
755
|
|
||||
|
Pensions and other post-retirement medical obligations
(5)
|
123
|
|
11
|
|
22
|
|
24
|
|
66
|
|
||||
|
Total
|
5,198
|
|
643
|
|
1,781
|
|
1,093
|
|
1,681
|
|
||||
|
(1)
|
Interest calculations are at the rate existing at the year end. Actual rates are set at floating rates for some of the borrowings (Refer Note 25 of the consolidated financial statements).
|
|
(2)
|
Represents contracted capital expenditure for which contractual obligations exist. Amounts stated include commitments of equity accounted joint ventures.
|
|
(3)
|
Other purchase obligations represent contractual obligations for mining contract services, purchase of power, supplies, consumables, inventories, explosives and activated carbon.
|
|
(4)
|
Operations of gold mining companies are subject to extensive environmental regulations in the various jurisdictions in which they operate. These regulations establish certain conditions on the conduct of operations by AngloGold Ashanti. Pursuant to environmental regulations, AngloGold Ashanti is also obligated to close its operations and reclaim and rehabilitate the lands upon which it conducted its mining and gold recovery operations. The present estimated closure costs at existing operating mines and mines in various stages of closure are reflected in this table. They are calculated using undiscounted real cash flows, not nominal cash flows. The amount will change from year to year depending on rehabilitation work undertaken, changes in design and methodology and new occurrences. For more information of environmental rehabilitation obligations, see "Item 4B: Business Overview-Mine site rehabilitation and closure" and "Item 4B: Business Overview-Environmental, health and safety matters”. Amounts stated include a total estimated liability of $119 million in respect of equity accounted joint ventures
|
|
(5)
|
Represents payments for unfunded plans or plans with insufficient funding.
|
187
188
|
6A.
|
DIRECTORS AND SENIOR MANAGEMENT
|
Directors
As at 29 March 2018, AngloGold Ashanti has a unitary board comprising 11 directors - nine independent non-executive directors and two executive directors. Certain information with respect to AngloGold Ashanti’s directors is set forth below:
|
Name
|
Age
|
Position
|
Year first
appointed
(1)
|
|||
|
Srinivasan Venkatakrishnan
|
53
|
Executive director and chief executive officer
|
2005
|
|||
|
Christine Ramon
|
50
|
Executive director and chief financial officer
|
2014
|
|||
|
Sipho Pityana
(2)
|
58
|
Independent non-executive director and chairman
|
2007
|
|||
|
Nozipho January-Bardill
|
67
|
Independent non-executive director
|
2011
|
|||
|
Albert Garner
|
62
|
Independent non-executive director
|
2015
|
|||
|
Rhidwaan Gasant
|
58
|
Independent non-executive director
|
2010
|
|||
|
Dave Hodgson
|
70
|
Independent non-executive director
|
2014
|
|||
|
Michael J. Kirkwood
|
70
|
Independent non-executive director
|
2012
|
|||
|
Maria Richter
|
63
|
Independent non-executive director
|
2015
|
|||
|
Rodney J. Ruston
|
67
|
Independent non-executive director
|
2012
|
|||
|
Sindiswa Zilwa
|
50
|
Independent non-executive director
|
2017
|
|||
|
(1)
|
Directors serve for a period of three years unless re-elected. At each annual general meeting, directors appointed since the previous annual general meeting are required to retire, but are eligible for re-election. In addition, one-third of the directors (if their number is not a multiple of three, then the number nearest to but not less than one third), must retire according to seniority or by lot but may be re-elected.
|
|
(2)
|
Appointed as Chairman with effect from 17 February 2014.
|
|
Sipho Pityana (58)
|
||
|
BA (Hons), MSc, Dtech (Honoris)
|
||
|
Independent non-executive chairman
|
||
|
Appointed:
A director on 13 February 2007 and Chairman of the Board on 17 February 2014
|
||
|
Board committee memberships:
|
• Nominations Committee (Chairman)
|
|
|
• Remuneration and Human Resources Committee
|
||
|
• Social, Ethics and Sustainability Committee
|
||
Sipho Pityana has extensive business experience having served in both an executive and non-executive capacity on several JSE listed boards of companies as well as running his own company, Izingwe Capital which he chairs. He is chairman of the JSE-listed Onelogix Group, as well as the Council of the University of Cape Town. He has previously served as chair of Munich Reinsurance of Africa, he also served on the boards of Bytes Technology Group, Afrox, SPESCOM, Scaw Metals Group and the Old Mutual Leadership Group. He previously worked as an executive director of Nedcor Investment Bank and managing director of Nedbank. In addition to his private sector track record, Sipho has extensive public sector experience and international exposure. He was the first Director General of the Department of Labour in the former President Mandela’s Government. As the Foreign Affairs Director General he represented South Africa in various international fora including the United Nations, African Union, Commonwealth and the International Labour Organization. He was one of the founding members of the governing body of the Commission for Conciliation, Mediation and Arbitration and Convenor of the South African government delegation to the National Economic Development and Labour Council.
189
|
Srinivasan Venkatakrishnan (Venkat) (53)
|
||
|
BCom, ACA (ICAI)
|
||
|
Chief executive officer and executive director
|
||
|
Appointed:
1 August 2005 and as CEO on 8 May 2013
|
||
|
Board committee memberships:
|
• Social, Ethics and Sustainability Committee
|
|
Venkat was appointed CEO in 2013, after which he set a clear strategy to sustainably improve free cash flow and returns by emphasising strict capital discipline and the development of a strong pipeline of brownfields investment options. He has prioritised high-return, self-funded project options designed to improve production life and margins with optimal capital investment and payback periods. Venkat has built a strong, stable senior management team focused on consistently meeting challenging operating and financial targets that directly support AngloGold Ashanti’s strategy. In each of the five years of his tenure, all capital, cost and production targets have either been met or improved upon.
Venkat has overseen the successful development of two new mines, the reduction of overhead and operating costs by almost half and the internal generation of funds to invest in the portfolio and to reduce debt by more than a third, all without issuing any shares to shareholders. These operating and balance sheet improvements were undertaken despite a sharply lower gold price and whilst achieving a marked improvement in overall safety, environmental management and community engagement trends.
He was previously Chief Financial Officer at AngloGold Ashanti, a post he also held at Ashanti Goldfields before its merger with AngloGold in 2004. In these roles he oversaw funding for both companies, gaining detailed knowledge of the portfolio of mines and operating jurisdictions, as well as commodity and capital markets. During this time he also bore responsibility for eliminating AngloGold Ashanti’s 12Moz of legacy hedge positions. Prior to joining Ashanti Goldfields, Venkat was a director of corporate reorganisation services at Deloitte & Touche in London.
Venkat is also a Director of Business Leadership South Africa and the World Gold Council. He is a Council member of the South African Chamber of Mines and International Council on Mining and Metals, and a member of the Financial Reporting Investigation Panel of the JSE Limited.
|
Christine Ramon (50)
|
||
|
BCompt, BCompt (Hons), CA(SA), Senior Executive Programme (Harvard)
|
||
|
Chief financial officer and executive director
|
||
|
Appointed:
1 October 2014
|
||
|
Board committee memberships:
|
• Investment Committee
|
|
Christine has held senior financial management and executive positions in various companies, in particular as chief financial officer and executive director of Sasol Limited from 2006 to 2013. Prior to this, she was chief executive officer of Johnnic Holdings Limited, having previously served as its financial director. Christine has served on the boards of Transnet SOC Limited, Lafarge SA Limited, and Johnnic Communications Limited. She is currently a non-executive director on the board of MTN Group Limited.
Christine served previously as a member of the Standing Advisory Committee to the International Accounting Standards Board and currently serves as Deputy Chair of the Financial Reporting Standards Council of South Africa. Christine is also the chairperson of the CFO Forum of South Africa.
|
Albert Garner (62)
|
||
|
BSE, Aerospace and Mechanical Sciences
|
||
|
Independent non-executive director
|
||
|
Appointed:
1 January 2015
|
||
|
Board committee memberships:
|
• Audit and Risk Committee
• Investment Committee
|
|
Albert Garner has extensive experience in capital markets, corporate finance and mergers and acquisitions having worked with Lazard Frères & Co., LLC for 39 years in various leadership positions. He is one of the most senior bankers at Lazard, currently leading their special committee practice and chairing their fairness opinion committee. He formerly led Lazard’s corporate finance practice. Albert became a general partner in 1989 and is now Vice Chair -Investment Banking. Over the past 10 years he has advised and acted as lead adviser to more than 50 companies and their boards of directors on transformative transactions.
190
|
Rhidwaan Gasant (58)
|
||
|
BCompt (Hons), CA (SA), ACIMA, Executive Development Programme
|
||
|
Independent non-executive director
|
||
|
Appointed:
12 August 2010
|
||
|
Board committee memberships:
|
• Audit and Risk Committee (Chairman)
• Investment Committee
|
|
Rhidwaan Gasant was previously the Chief Executive Officer of Energy Africa Limited. He serves as a director and chairs the Audit and Risk Committees of international companies in the MTN Group. His other directorships include those in the Rapid African Energy Holdings Group, a start up oil and gas exploration business focused on Africa, and Edcon Limited.
|
Dave Hodgson (70)
|
||
|
BSc (Civil Engineering), BSc (Mining) (Hons), BComm, AMP(Harvard)
|
||
|
Independent non-executive director
|
||
|
Appointed:
25 April 2014
|
||
|
Board committee memberships:
|
• Investment Committee
• Social, Ethics and Sustainability Committee
|
|
Dave Hodgson formerly held a series of senior and executive positions over three decades with the Anglo American and De Beers group of companies, and also held the post of Chief Operating Officer of AngloGold Ashanti from November 2001 through to his retirement in April 2005. In addition, he has held non-executive directorships at Moto Gold Mines Limited, Uranium One Inc., Goliath Gold Mining Limited, Auryx Gold Corporation, Montero Mining and Exploration Limited, and Acacia Mining.
|
Nozipho January-Bardill (67)
|
||
|
BA, MA Applied Linguistics, Dipl Human Resources Development
|
||
|
Independent non-executive director
|
||
|
Appointed:
1 October 2011
|
||
|
Board committee memberships:
|
• Social, Ethics and Sustainability Committee (Chairman)
|
|
|
• Remuneration and Human Resources Committee
|
||
Ambassador Nozipho January-Bardill has extensive experience in both the local and international public and private sectors. Besides AngloGold Ashanti, she also serves as an Independent Non-Executive Director on the boards of Credit Suisse Securities, Mercedes Benz South Africa and the MTN Foundation.
She is chairperson of the Council of the Nelson Mandela University and the interim board of the newly formed UN Global Compact Local Network in South Africa. Prior to her appointment to the AGA board, Nozipho was the Executive Director of Corporate Services and Spokesperson of MTN Group and served on the boards of 5 MTN local operations in the MTN footprint including Cote d’Voire, Cameroon, Guinea Conakry, Guinea Bissau and Congo Brazzaville. Before then she was the South African Ambassador to Switzerland, Lichtenstein and the Holy See (Vatican) and the Deputy Director General of Human Capital Management and Head of the Foreign Service Institute in the South African Department of Foreign Affairs (now DIRCO). She has worked in leadership positions in the Parliament of South Africa and in a number of NGOs. In January 2016 she completed 12 years of service as an expert on the United Nations Committee on the Elimination of Racial Discrimination. She was also an interim Chief of Staff and Senior Strategic Adviser of UN Women. Sustainable development, ethical governance, human and women’s rights in business and social justice are of central interest to her work and life.
191
|
Michael J Kirkwood (70)
|
||
|
AB, Stanford, Economics & Industrial Engineering
|
||
|
Independent non-executive director
|
||
|
Appointed:
1 June 2012
|
||
|
Board committee memberships:
|
• Remuneration and Human Resources Committee (Chairman)
|
|
|
• Audit and Risk Committee
|
||
|
• Nominations Committee
|
||
Michael Kirkwood is a highly experienced and respected former international banker, having worked at the highest levels of Citigroup during his 30-year career with the bank. He is currently Chairman of Ondra Partners LLP, a non-executive director of London Scottish International Limited and has recently joined the board of Bushveld Minerals Ltd as Senior Independent Director. He formerly served as Chairman of Circle Holdings plc and on the boards of Kidde plc, UK Financial Investments Ltd, Eros International plc and as deputy chairman on PwC’s Advisory Board. During his career in finance, he held appointments as Chairman of British American Business Inc., as President and a Fellow of The Chartered Institute of Bankers and as Deputy Chairman of the British Bankers Association.
|
Maria Richter (63)
|
||
|
BA, Juris Doctor
|
||
|
Independent non-executive director
|
||
|
Appointed:
1 January 2015
|
||
|
Board committee memberships:
|
• Audit and Risk Committee
|
|
|
• Remuneration and Human Resources Committee
|
||
|
• Nominations Committee
|
||
Maria Richter is an experienced FTSE 100 non-executive director who has served on a diverse range of UK and International boards. She previously served on the board of National Grid plc in the UK from 2003 to July 2014 where she was the chairperson of the finance committee and member of the audit and nominations committees. She currently sits on the boards of Rexel Group, France, a global leader in the professional distribution of energy products and services, and Bessemer Trust, a US wealth management company, and is a member of the audit and compensation committees of Rexel and the remuneration committee of Bessemer Trust. As of 1 September 2017 she joined the divisional Board of Barclays International which in 2018 will become Barclays’ non ring fenced bank, responsible for oversight of the Corporate and Investment Bank and International Cards and Payments businesses. Maria’s professional career spanned 1980 to 2002 during which time she served in various positions at the former Dewey Ballantine, Prudential, Salomon Brothers Inc. and Morgan Stanley & Co.
|
Sindiswa Zilwa (50)
|
||||
|
CA(SA), BCompt (Hons), CTA, Advanced Taxation Certificate, Advanced Diploma in Financial Planning and Advanced Diploma in Banking
|
||||
|
Independent non-executive director
|
||||
|
Appointed:
1 April 2017
|
||||
|
Board committee memberships:
|
• Audit and Risk Committee
|
|||
|
• Remuneration and Human resources Committee
|
||||
|
• Investment Committee
|
||||
Sindi is well regarded in the areas of accounting, auditing and business management. She has extensive board and audit committee experience in the public and private sectors, and currently sits on the boards of Discovery Limited, Aspen Limited, Metrofile Limited and the following unlisted companies, Consol Glass Limited, Mercedes Benz South Africa Limited, Tourvest Group (Pty) Ltd and Gijima Group Limited. Sindi is a professional director following her retirement in October 2016 after her 23 year stint as Co-Founder and CEO of Nkonki Inc. As an author, Sindi has published two books, “Audit Committee Effectiveness Model” and “Creating Effective Boards and Committees”. Sindi is a Chartered Accountant (SA) and a Chartered Director (SA).
192
|
Rodney Ruston (67)
|
||
|
MBA Business, BE (Mining)
|
||
|
Independent non-executive director
|
||
|
Appointed:
1 January 2012
|
||
|
Board committee memberships:
|
• Investment Committee (Chairman)
|
|
|
• Audit and Risk Committee
|
||
Rodney Ruston holds a degree in mining engineering and an MBA and has over 35 years of business experience during which he has led private and publicly-listed companies in the resources, oil and gas and construction industries. His international experience as the chief executive of a heavy construction and mining contractor coupled with chief executive roles with operating resource companies provides the board with a broad based director, who can provide insight and advice on the full range of domestic and international activities in the AngloGold Ashanti business. Rodney is currently the chief executive of County Coal Limited, a start-up Australian listed company, which he joined in July 2012. He was previously chief executive officer and President of North American Energy Partners Inc., a large Canadian mining and construction contracting company, which he took public with a listing on the NYSE and the TSX. Prior to that he was managing director of Ticor Ltd, an Australian-based titanium producer with operations in Australia and South Africa.
Board movements during 2017 and subsequent to year end
The following changes to the board of directors took place during the period from 1 January 2017 to 31 December 2017 and subsequent to year-end:
|
•
|
the following directors retired at the Annual General Meeting on 16 May 2017 and being eligible for re-election were re-elected by the shareholders: Sipho Pityana, Rodney Ruston and Maria Richter.
|
|
•
|
Sindiswa Zilwa was appointed as an Independent Non-Executive Director with effect from 1 April 2017 and Professor Wiseman Nkuhlu retired as a Non-Executive Director from the board on 16 May 2017.
|
In terms of the company’s Memorandum of Incorporation, the following directors required to retire at the Annual General Meeting to be held on 16 May 2018: Albert Garner, Nozipho January-Bardill, Rhidwaan Gasant and Christine Ramon are eligible and have offered themselves for re-election.
EXECUTIVE COMMITTEE
AngloGold Ashanti’s executive management team (Executive Committee) comprises nine members of whom two are executive directors. This committee oversees the day-to-day management of the group’s activities and is supported by country and regional management teams as well as by group corporate functions.
In addition to Srinivasan Venkatakrishnan and Christine Ramon, the following people are members of the Executive Committee:
Chris Sheppard (59)
BSc (Min. Eng.)
Chief Operating Officer - South Africa
As the Chief Operations Officer - South Africa, Chris’ portfolio post the recently completed Asset sales and closures, includes AngloGold Ashanti’s remaining South African assets: the Mponeng underground gold mine, and two surface operations comprising the Mine Waste Solutions tailings dump-retreatment business and the rock dump reclamation and processing business. Together, these South African operating units account for about 13% of AngloGold Ashanti’s total annual production.
Chris, a mining engineer by profession, was most recently Managing Director of Murray & Roberts Cementation, one of Africa’s largest mining contractors and a division of South Africa’s largest publicly traded engineering & construction group.
Prior to that, Chris held positions as head of both mining and technical services at Lonmin Plc for four years, following six years at Anglo American Platinum Ltd., where he most recently held the post of Head Mining Technical Services. Chris is also an alumnus of Anglo American Plc’s Gold & Uranium Division and AngloGold Ltd., where he served latterly as general manager of deep gold mining operations in the Free State between 1997 and 2001. Chris holds a Bsc in Mining Engineering from the University of the Witwatersrand, and also completed an Advanced Management Programme at Harvard Business School.
193
Tirelo Sibisi (49)
BSSc, Advanced HR Executive Development Programme, MBA, Post Graduate Diploma in Business Management
Executive Vice President - Group Human Resources
In her role Executive Vice President - Group Human Resources, Tirelo is responsible for people and organisational development, which entails developing a highly engaged, transformed, diverse and productive workforce. She has more than 20 years’ experience in the field of human resources having been the group executive for human resources and corporate social investment at PPC Cement, where she played a key role in the acquisition of new mining licences for the company for their operations in throughout Africa. Tirelo’s experience includes 10 years in the information technology sector at IBM (South Africa and Paris) and at Telkom, making her a well-rounded human resources generalist with strengths in talent management, succession planning, union negotiations and remuneration.
Charles Carter (55)
BA (Hons), DPhil
Executive Vice President - Strategy and Business Development
Charles is responsible for group strategy, business development, corporate finance, investor relations and communications. He has worked in the mining industry in South Africa and the Americas for 25 years and has had responsibility for a range of additional portfolios that include human resources, risk management, business planning and executive responsibility for the company’s business in Colombia.
Graham Ehm (61)
BSc Hons, MAusIMM, MAICD
Executive Vice President - Group Planning and Technical
Graham, who has multi-commodity experience, has held senior leadership positions in AngloGold Ashanti in Tanzania and Australia. His current portfolio entails business planning and portfolio optimisation, capital investment optimisation, monitoring of projects, studies and exploration, and non-managed joint ventures. In 2014 he was also assigned accountability for the closure and redevelopment of the Obuasi Gold Mine.
David Noko (60)
Executive Vice President - Group Sustainable Development
David Noko is a member of the company’s Executive Committee. His portfolio as Executive Vice President: Group Sustainable Development, comprises the disciplines of Safety, Health, Environment, Social and Community Affairs, Human Rights and Global Security, and Government Relations.
David sets the company global Sustainable Development strategy and direction, guiding the company’s performance and positioning within the global business landscape. He ensures the enablement of the company’s strategy particularly on matters relating to the company’s involvement in host countries business activities and global institutions with respect to sustainable development.
Currently a non-executive director at African Rainbow Minerals Limited, David previously served in several executive roles and directorships of other leading mining and manufacturing companies in De Beers, Pepsi Cola, SAB, AstraPak, Harmony Gold and Royal Bafokeng Platinum and the Chamber of Mines in South Africa.
He holds a diploma in engineering, a diploma in company directorships, a business administration degree and an executive leadership certificate from reputable South African and global institutions.
Maria Sanz Perez (52)
BCom LLB, Higher Diploma in Tax, AMP (Harvard), Admitted Attorney
Executive Vice President - Legal, Commercial and Governance and Company Secretary
Maria partners with the company’s business leaders to ensure AngloGold Ashanti complies with legal requirements across the group. Other responsibilities are compliance, company secretarial functions and integrated reporting. She is also accountable for the legal and commercial aspects of global procurement. Maria has been with the group since 2011 and has worked in similar positions for leading South African companies in her career including Investec, Sappi and Afrox.
194
Ludwig Eybers (51)
BSc (Min. Eng), Post graduate qualifications with Darden Business School, USA
Chief Operating Officer - International
Ludwig has over 27 years international mining experience, he joined AngloGold Ashanti in 2011 as Senior Vice President Namibia and Mining Task Force, based in Perth Australia. In 2013, he relocated to AngloGold Ashanti in South Africa to take-up the position of Senior Vice President Continental Africa Region. Ludwig was subsequently promoted to Chief Operations Officer - International in 2017. He is currently accountable for overall strategic and operational responsibilities for production at the company’s mining operations across three continents and eight countries.
COMPETENT PERSONS
As part of its suite of annual reports, AngloGold Ashanti produces a Mineral Resource and Ore Reserve Statement and all the information in this report that relates to Exploration Results, Mineral Resource and Ore Reserve is based on information compiled by the Competent Persons.
During the past decade, the company has developed and implemented a system of internal and external reviews aimed at providing assurance in respect of Ore Reserve and Mineral Resource estimates. A documented chain of responsibility exists from the Competent Persons at the operations to the Company’s Mineral Resource and Ore Reserve Steering Committee. Accordingly, the Chairman of the AngloGold Ashanti Mineral Resource and Ore Reserve Steering Committee, Mr VA Chamberlain, assumes responsibility for the Mineral Resource and Ore Reserve processes for AngloGold Ashanti and is satisfied that the Competent Persons have fulfilled their responsibilities.
VA Chamberlain (55)
MSc (Mining Engineering), BSc (Hons) (Geology), FAusIMM
Vaughan holds a Bachelor of Science (Honours) degree in Geology from the University of Natal and a Master’s degree in Mining Engineering from the University of the Witwatersrand. He started his career with Anglo American Corporation in 1987 as a geologist at Western Deep Levels East Mine (now TauTona mine). He joined AngloGold in 1998 and currently holds the position of Senior Vice President: Strategic Technical Group and is Chairman of the AngloGold Ashanti Mineral Resource and Ore Reserve Steering Committee.
195
|
6B.
|
COMPENSATION
|
REMUNERATION AND HUMAN RESOURCES COMMITTEE
Remuneration and Human Resources Committee (Remco)
The Remco comprises of five non-executive directors and its purpose is to discharge the responsibilities of the board relating to all compensation, including all salary and equity compensation of the company’s executives. The committee establishes and administers the company’s executive remuneration and its broad objectives include; aligning executive remuneration with company performance and shareholder interests; setting remuneration standards aimed at attracting, motivating and retaining a competent executive team; linking individual pay with operational and company performance aligned to strategic objectives; and evaluating compensation of executives including approval of salary, equity and incentive based awards.
With respect to its mandate on human resources, the committee has oversight to all strategic aspects of people development and human resource issues. The committee also considers and makes recommendations to shareholders on non-executive director’s fees.
The performance of the executive team, including the executive directors, is considered relative to the prevailing business climate and market conditions, as well as to annual evaluations of the achievement of key performance objectives. Bonuses paid to the executives are a reflection of performance of each of the executives and the company as a whole.
The members of the committee during 2017 are reflected below:
Members
MJ Kirkwood (Chairperson)
SM Pityana
NP January-Bardill
M Richter
S Zilwa
The meetings of the committee are attended by the Chief Executive Officer, Chief Financial Officer and Executive Vice President: Group Human Resources, except when their own remuneration or benefits are being discussed.
Remuneration policy
The remuneration policy is designed to allow AngloGold Ashanti to compete in a global market where we strive to retain and remunerate our employees using fair, robust and appropriate remuneration and reward for their contributions. Cost management and shareholder value remain fundamental drivers of the policy delivery.
Linking pay and performance for our executives is important and by having a large portion of executive pay defined as at risk pay, the policy ensures that executive compensation is aligned with the overall performance of the company, the regions and the business units. The executives have an overriding focus on social sustainability including safety, and a large percentage of variable pay is directly linked to keeping our employees safe.
Total reward
When determining remuneration AngloGold Ashanti considers all elements of short- and long-term fixed and variable pay, and ensures that it is consistent with the overall strategic direction of the company and each employee’s individual performance.
For a description of share-based compensation and awards see “Item 6E: Share Ownership”.
Executive directors do not receive payment of directors fees or committee fees.
Benchmarking
Our executives and non-executives are benchmarked against a global group of competitors. AngloGold Ashanti’s size and complexity as well as each individual executive’s role are reviewed against the benchmark group from a base pay, benefits, guaranteed pay and variable pay perspective (which takes into consideration individual performance).
Our salary benchmarks are targeted at the market median of a global market; where there is a shortage of specialist and/or key technical skills higher than the benchmark median is paid.
196
Each executive’s role is individually sized to ensure the best match possible. The comparison is done on the same or similar roles irrespective of place of work (including a review of purchasing power parity between countries). Each component of remuneration (base salary, short-term incentives, long-term incentives, Co-investment plan and employee benefits and allowances) is analysed and compared with the benchmarks and the overall package is reviewed accordingly.
Retirement benefits/pension
Retirement benefits are granted to all executives. All new executives and employees receive retirement benefits under defined contribution plans. There are no longer any executives in the legacy defined benefit plans. Contributions vary based on the employee’s retirement plan.
EXECUTIVE DIRECTORS' AND EXECUTIVE MANAGEMENT REMUNERATION
See "Item18: Note 32 - Related Parties - Directors and other key management personnel - Executive Directors’ and Prescribed Officers renumeration"
NON-EXECUTIVE DIRECTORS' COMPENSATION
The fees of non-executive directors are fixed by shareholders at the annual general meeting and, other than the fees they receive for their participation on board committees and allowances for travelling internationally to attend board meetings, non-executive directors receive no further payments from the company and are precluded from participation in the company’s share incentive scheme.
NON-EXECUTIVE DIRECTORS’ REMUNERATION
See "Item18: Note 32 - Related Parties - Directors and other key management personnel - Non-Executive Director renumeration"
197
|
6C.
|
BOARD PRACTICES
|
The Board of Directors
The company is governed by a unitary board of directors, the composition of which promotes the balance of authority and precludes any one director from dominating decision-making. Our board membership at year-end comprised eleven directors, nine independent non-executive directors and two executive directors.
The board is supported by its committees and has delegated certain functions to these committees without abdicating any of its own responsibilities. This process of formal delegation involves approved and documented terms of reference, which are reviewed annually.
Refer Item 6A: “Directors and Senior Management” for information about the composition of the Board and directors’ term of office and year of appointment.
Appointment and rotation of directors
Several factors including the requirements of relevant legislation, best practice recommendations, qualifications and skills of a prospective board member and the requirements of the Director’s Fit and Proper Standards of the company, as well as regional demographics are considered in appointing board members. New directors are appointed pursuant to the recommendations of the Nominations Committee, which conducts a rigorous assessment of the credentials of each candidate. Newly appointed directors are elected at the next annual general meeting following their appointment and to stand for approval by shareholders.
In terms of the company’s Memorandum of Incorporation (MOI), one third of the directors are required to retire at each Annual General Meeting (AGM) and if they are eligible and available for re-election, will be put forward for re-election by the shareholders. The board has determined that the directors to stand for re-election at the AGM on 16 May 2018 are Albert Garner, Nozipho January-Bardill, Rhidwaan Gasant and Christine Ramon.
The company’s Memorandum of Incorporation does not set a mandatory retirement age for non-executive directors. However, in accordance with recommendations of King IV - any independent non-executive director serving more than nine years should be subjected to a rigorous review of his independence and performance by the board.
Service contracts
Non-Executive Directors
Non-executive directors receive fees for their services as directors which are approved by shareholders at annual general meetings. Non-executive directors do not participate in the company’s share incentive scheme.
Non-executive directors do not hold service contracts with the company.
Executive Committee
All members of the Executive Management team have permanent employment contracts which entitle them to standard group benefits as defined by their specific region and participation in the company’s Bonus Share Plan, and the Long-Term Incentive Plan. All recently updated executive contracts include details on participation in the Co-Investment Plan.
South African-based executives are paid a portion of their remuneration offshore, which is detailed under a separate contract. This reflects global roles and responsibilities and takes account of offshore business requirements.
The executive contracts are reviewed annually and include a change of control provision. The change of control is subject to the following triggers:
|
•
|
The acquisition of all or part of AngloGold Ashanti; or
|
|
•
|
A number of shareholders holding less than thirty-five percent of the company’s issued share capital consorting to gain a majority of the board and make management decisions; and
|
|
•
|
The contracts of Executive Committee members are either terminated or their role and employment conditions are curtailed.
|
In the event of a change of control becoming effective, the executive will in certain circumstances be subject to both the notice period and the change of control contract terms. The notice period applied per category of executive and the change of control periods as at 31 December 2017 were as follows:
|
Executive committee member
|
Notice period
|
Change of control
|
|
Chief Executive Officer
|
12 months
|
12 months
|
|
Chief Financial Officer
|
6 months
|
6 months
|
|
Other Executive Management team members
|
6 months
|
6 months
|
198
Key activities of the board and committees during 2017
The activities of the board and committees during 2017 were aimed at promoting the economic stability of the business. This entailed ensuring that its operations were conducted with due regard to the expectations and needs of stakeholders, the safety and health of employees and communities, and the development of systems to ensure proper access to and dissemination of credible information.
Board and committee meeting attendance
The composition of the board and committees at the date of this report and attendance at meetings during 2017 are disclosed in the table below:
|
Board
|
|
Audit and Risk
|
|
Investment
|
|
Remuneration
and Human
Resources
|
|
Social,
Ethics and
Sustainability
|
|
Nomination
|
|
||||||
|
No of Meetings in 2017
|
7
|
|
5
|
|
4
|
|
4
|
|
5
|
|
2
|
|
|||||
|
SM Pityana
|
7
|
|
n/a
|
|
n/a
|
|
4
|
|
5
|
|
2
|
|
|||||
|
LW Nkuhlu
(1)
|
2
|
|
3
|
|
1
|
|
2
|
|
n/a
|
|
1
|
|
|||||
|
R Gasant
|
7
|
|
5
|
|
4
|
|
n/a
|
|
n/a
|
|
n/a
|
|
|||||
|
DL Hodgson
|
7
|
|
n/a
|
|
4
|
|
n/a
|
|
5
|
|
n/a
|
|
|||||
|
NP January-Bardill
|
7
|
|
n/a
|
|
n/a
|
|
4
|
|
5
|
|
n/a
|
|
|||||
|
MJ Kirkwood
|
7
|
|
5
|
|
n/a
|
|
4
|
|
n/a
|
|
2
|
|
|||||
|
AH Garner
|
7
|
|
5
|
|
4
|
|
n/a
|
|
n/a
|
|
n/a
|
|
|||||
|
RJ Ruston
|
7
|
|
5
|
|
4
|
|
n/a
|
|
n/a
|
|
n/a
|
|
|||||
|
MDC Richter
(2)
|
7
|
|
5
|
|
n/a
|
|
4
|
|
n/a
|
|
1
|
|
|||||
|
SV Zilwa
(3)
|
5
|
|
2
|
|
3
|
|
3
|
|
n/a
|
|
n/a
|
|
|||||
|
S Venkatakrishnan
|
7
|
|
n/a
|
|
n/a
|
|
n/a
|
|
5
|
|
n/a
|
|
|||||
|
KC Ramon
|
7
|
|
n/a
|
|
4
|
|
n/a
|
|
n/a
|
|
n/a
|
|
|||||
|
(1)
|
LW Nkuhlu retired from the board with effect of 16 May 2017.
|
|
(2)
|
MDC Richter was appointed to the Nomination Committee with effect from May 2017.
|
|
(3)
|
SV Zilwa was appointed to the board with effect from 1 April 2017 and as a member of the Audit and Risk Committee from 16 May 2017.
|
Audit and Risk Committee
The Audit and Risk Committee comprises six independent Non-Executive Directors who collectively possess the skills and knowledge to oversee and assess the strategies and processes developed and implemented by management to manage the business within a continually evolving mining environment.
The Audit and Risk Committee’s duties as required by section 94(2) of the Companies Act, King IV and JSE Listing requirements are set out in its board-approved terms of reference which is reviewed and updated annually. These duties were discharged as follows:
|
•
|
reviewed the quarterly market updates and the half year results;
|
|
•
|
confirmed the integrity of the group’s Integrated Report, Annual Financial Statements and the Form 20-F;
|
|
•
|
reviewed the expertise, experience and performance of the finance function and Chief Financial Officer;
|
|
•
|
assessed the scope and effectiveness of the systems to identify, manage and monitor financial and non-financial risks;
|
|
•
|
reviewed the procedures for detecting, monitoring and managing the risk of fraud;
|
|
•
|
reviewed the scope, resources, results and effectiveness of the internal audit department;
|
|
•
|
approved the internal audit plan and subsequent changes to the approved plan;
|
|
•
|
ensured that a combined assurance model is applied to provide a co-ordinated approach to all assurance activities;
|
|
•
|
nominated the appointment of independent external auditors by the shareholders;
|
|
•
|
reviewed and approved the terms of engagement as contained in the engagement letter of the external auditors;
|
|
•
|
approved the remuneration of the external auditors;
|
|
•
|
pre-approved all non-audit services in line with a revised formal policy on non-audit services;
|
|
•
|
assessed the external auditors’ independence;
|
|
•
|
annually consider the suitability, after assessing the information provided by the audit firm in terms of section 22.15(h) of the JSE Listings Requirements, for appointment of the audit firm and the designated individual partner;
|
|
•
|
assessed the effectiveness of the group’s external audit function;
|
|
•
|
approved the appointment of the external auditors to provide independent limited assurance on certain sustainability indicators as included in the Sustainable Development Report;
|
|
•
|
reviewed developments in reporting standards, corporate governance and best practice;
|
|
•
|
monitored the governance of information technology (IT) and the effectiveness of the group’s information systems;
|
|
•
|
reviewed the adequacy and effectiveness of the group’s compliance function; and
|
|
•
|
evaluated the effectiveness of the committee through a self-assessment.
|
199
Proceedings and Performance Review
During 2017, the Audit and Risk Committee formally met five times.
The Chief Financial Officer, Senior Vice President: Finance, Group General Counsel and Company Secretary, Senior Vice President: Group Internal Audit; Vice President: Group Tax; Group Risk Manager; Chief Information Officer; Group Compliance Officer, the external auditors, as well as other assurance providers are invited to attend committee meetings in an ex officio capacity and provide responses to questions raised by committee members during meetings. The full Audit and Risk Committee meets separately during closed sessions with management (including the Chief Executive Officer), internal audit and external audit at every scheduled quarterly meeting.
The Audit and Risk Committee assessed its effectiveness through the completion of an independent external evaluation process, results were discussed, actions taken and processes put in place to address areas identified for refinement.
Remuneration and Human Resources Committee
The Remuneration and Human Resources Committee activities are governed by the Terms of Reference (these were reviewed and approved at the August 2017 Remuneration and Human Resources Committee meeting). The purpose of the Committee is to assist the Board in discharging its oversight responsibilities relating to all compensation, including annual base salary, annual incentive compensation, long-term incentive compensation, employment, severance pay and ongoing perquisites or special benefit items and equity compensation of the Company’s executives, including the Chief Executive Officer as well as retention strategies, design and application of material compensation programmes and share ownership guidelines.
With respect to its mandate on human resources, the Committee has strategic oversight of matters relating to the development of the Company’s human resources with the main objective of creating a competitive human resource for the Group.
The committee operates in an independent role, operating as an overseer with accountability to the board. This is accomplished by:
|
•
|
Reviewing and approving corporate goals and objectives relevant to the compensation of the executive management team;
|
|
•
|
Evaluating the performance of the executive management team in light of these goals and objectives annually and setting each executive’s compensation based on such evaluation;
|
|
•
|
Ensuring that the mix of fixed and variable pay, in base pay, shares and other elements of compensation meets the company’s requirements and strategic objectives;
|
|
•
|
Linking individual pay with operational and company performance in relation to strategic objectives;
|
|
•
|
Considering the sentiments and views of the company’s investors;
|
|
•
|
Overseeing and reviewing all aspects of any share option scheme operated by or to be established by the company;
|
|
•
|
Regularly reviewing incentive schemes to ensure continued contribution to shareholder value and ensure that these are administered in terms of the rules;
|
|
•
|
Regularly reviewing human resources strategy aimed at ensuring the supply and retention of sufficient skilled resources to achieve the company’s objectives;
|
|
•
|
Ensure that the remuneration policy and implementation report is put to a non-binding advisory vote at the general meeting of shareholders once every year; and
|
|
•
|
Review the outcome of the implementation of the remuneration policy to ensure that the set objectives are being achieved and fairness is addressed.
|
The current members of the Committee are:
|
Remuneration and Human
Resource Committee Members
|
MJ Kirkwood (Chairman and independent NED)
|
|
NP January-Bardill (Independent NED)
|
|
|
SM Pityana (Board Chairman)
|
|
|
M Richter (Independent NED)
|
|
|
S Zilwa (Independent (NED)
|
|
|
Number of meetings held from
January to December 2017
|
Four
|
|
Other individuals who regularly
attended meetings
|
S Venkatakrishnan (CEO)
|
|
T Sibisi (EVP: Group Human Resources)
|
|
|
M Hopkins representing PwC (Independent Advisor to the Committee)
|
|
|
SD Van Rensburg (VP: Group Remuneration and Benefits and Secretary to the Committee)
|
|
NED – Non-Executive Director
200
Remuneration Consultants
Where appropriate, the Committee obtains advice from independent remuneration consultants. The consultants are employed directly by the Committee and engage directly with them to ensure independence.
The Committee has appointed PwC to provide specialist, independent remuneration advice on all forms of executive and non-executive pay.
Mercer performs an independent bespoke executive survey and its advice is primarily around salary benchmarking for both executive and non-executive pay.
201
6D. EMPLOYEES
The average number of attributable employees (including contractors) in the AngloGold Ashanti group over the last three financial years was:
|
2017
|
|
2016
|
|
2015
|
|
|||
|
South Africa
|
26,245
|
|
28,507
|
|
28,325
|
|
||
|
Continental Africa
|
13,593
|
|
12,691
|
|
11,942
|
|
||
|
Australasia
|
974
|
|
925
|
|
836
|
|
||
|
Americas
(1)
|
8,511
|
|
8,126
|
|
8,432
|
|
||
|
Other, including corporate and non-gold producing subsidiaries
|
2,157
|
|
2,400
|
|
2,731
|
|
||
|
Total*
|
51,480
|
|
52,649
|
|
52,266
|
|
||
|
*
|
The number of contractors employed on average during 2017 was 15,408
|
|
(1)
|
Includes average number of employees at CC&V until the date of sale in August 2015.
|
Labour relations and collective bargaining
At AngloGold Ashanti, all employees have the right to freedom of association and collective bargaining, which we recognise and apply according to the applicable laws and regulations in each of the countries in which we operate. Only our Australasian operations do not have collective bargaining, as this is not recognised in Australia.
In the South Africa region, the Chief Operating Officer and the head of human resources brief all management employees regularly, and engage with the leadership of organised labour as necessary throughout the year. A forum is in place at which management and employees’ organised labour representatives meet regularly to discuss issues and act on employee-related matters, including the employee transition framework related to the restructuring in the South African operations in 2017. Using this forum, AngloGold Ashanti engaged with employees on the various restructuring processes undertaken during the year, including the sale of certain mines. The initial restructuring process took place in early 2017 when a section 189(3) notice was issued in terms of the Labour Relations Act, to terminate the employment of an estimated 849 employees. After extensive engagement with unions and regulators, all parties agreed to reduce the impact of job losses - by including voluntary severance packages and transfers. This resulted in only 21 employees being dismissed for operational requirements. Additionally, following a review of various options to safely turn around the performance of the loss-making operations, AngloGold Ashanti made the difficult decision to restructure certain South African business units. Consequently, further engagements were held with employees and their labour representatives - the unions and the DMR at national and regional level.
In Continental Africa - labour relations remained stable across the region and, despite labour disputes on salaries at our Malian operations and protracted wage negotiations at Siguiri, there were no production interruptions. The Company successfully completed annual wage negotiations for the period at all sites.
In Guinea, at Siguiri, annual wage negotiations led to the conclusion of a one-year wage agreement.
In Ghana, Iduapriem successfully concluded a two-year wage agreement with the Ghana Mineworkers Union in respect of 2016 and 2017. As part of the agreement, management and the union further committed to the development of a salary adjustment framework which would be a guide for future negotiations.
In Tanzania, at Geita, management and the majority union reached an agreement on a compressed working-week shift roster effective from December 2017 and a one-year wage agreement implemented effective January 2017.
In Mali, the mine labour relations climate was informed by the uncertainty relating to the Sadiola sulphide project and a potential decision that would place the mine in limited operations and care and maintenance phase. The annual wage negotiations were successfully concluded and implemented effective January 2017.
In the Americas region, annual wage negotiations in both Brazil and Argentina were successfully concluded and agreements signed in the latter part of 2017.
202
|
6E.
|
SHARE OWNERSHIP
|
DIRECTORS’ AND PRESCRIBED OFFICERS’ INTERESTS IN ORDINARY SHARES
The interests of directors and prescribed officers in the ordinary shares of the company at 31 December 2017 which individually did not exceed 1 percent of the company’s issued ordinary share capital are included in the annual financial statements, see "Item 18: Note 32 - Related Parties - Directors’ and Prescribed Officers’ interests in AngloGold Ashanti shares"
A register detailing Directors and Prescribed Officers’ interests in contracts is available for inspection at the company’s registered and corporate office.
CHANGE IN DIRECTOR’S AND PRESCRIBED OFFICER’S INTERESTS IN ANGLOGOLD ASHANTI SHARES SINCE 31 DECEMBER 2017
Refer "Item 18: Note 32 - Related Parties - Directors’ and Prescribed Officers’ interests in AngloGold Ashanti shares"
SHARE OWNERSHIP OF EXECUTIVE OFFICERS/EXECUTIVE MANAGEMENT
Under the Listings Requirements of the JSE, AngloGold Ashanti is not required to disclose, and it does not otherwise disclose or ascertain, share ownership of individual executive officers/executive management in the share capital of AngloGold Ashanti. However, to the best of its knowledge, AngloGold Ashanti believes that AngloGold Ashanti ordinary shares held by executive officers, in aggregate, do not exceed one percent of the company's issued ordinary share capital.
MINIMUM SHAREHOLDING REQUIREMENT FOR EXECUTIVES
With effect from March 2013, a minimum shareholding requirement (MSR) is applicable to all executives as indicated below:
Executive directors
|
•
|
Within three years of appointment (or for existing executives, from introduction of this rule) executive directors (CEO and CFO) are to accumulate a MSR of AngloGold Ashanti shares to the value of 100 percent of net annual base salary; and
|
|
•
|
At the end of six years, executive directors are to accumulate a MSR of AngloGold Ashanti shares to the value of 200 percent of net annual base salary (additional 100 percent MSR) which they will be required to hold on an on-going basis.
|
|
•
|
It is to be noted that the CFO’s MSR percentage was amended to be aligned with the executive committee members MSR being 75 percent for three years and 150 percent for six years within the years of appointment.
|
Executive Committee members
|
•
|
Within three years of appointment (or for existing executives, from the introduction of this rule), Executive Committee members are to accumulate a MSR of AngloGold Ashanti shares to the value of 75 percent of net annual base salary; and
|
|
•
|
At the end of six years, Executive Committee members are to accumulate a MSR of AngloGold Ashanti shares to the value of 150 percent of net annual base salary (additional 75 percent MSR) which they will be required to hold on an on-going basis.
|
The table below summarises each director and executive committee member’s accomplishment of the MSR:
|
Executive
|
Target
Achievement
Date
|
Three Year MSR Target Achievement Percentage
|
|
MSR holding as at
31 Dec 2017
as % of net base pay
|
|
Six-year
MSR Target
Achievement Percentage
|
|
||||
|
Executive Directors
|
|||||||||||
|
S Venkatakrishnan
|
March 2016
|
100
|
%
|
1,229
|
%
|
200
|
%
|
||||
|
KC Ramon
|
March 2018
|
75
|
%
|
188
|
%
|
150
|
%
|
||||
|
Prescribed Officers
|
|||||||||||
|
CE Carter
|
March 2016
|
75
|
%
|
239
|
%
|
150
|
%
|
||||
|
GJ Ehm
|
March 2016
|
75
|
%
|
387
|
%
|
150
|
%
|
||||
|
L Eybers
(1)
|
March 2020
|
75
|
%
|
58
|
%
|
150
|
%
|
||||
|
DC Noko
|
March 2016
|
75
|
%
|
519
|
%
|
150
|
%
|
||||
|
ME Sanz Perez
|
March 2016
|
75
|
%
|
405
|
%
|
150
|
%
|
||||
|
C Sheppard
(2)
|
March 2019
|
75
|
%
|
35
|
%
|
150
|
%
|
||||
|
TR Sibisi
(3)
|
March 2020
|
75
|
%
|
21
|
%
|
150
|
%
|
||||
|
(1)
|
Appointed prescribed officer with effect from 22 February 2017 and the 3 year MSR achievement is only due in March 2020.
|
|
(2)
|
The prescribed officer joined the company 1 June 2015 and the 3 year MSR achievement is only due in March 2019.
|
|
(3)
|
The prescribed officer joined the company 18 January 2016 and the 3 year MSR achievement is only due in March 2020.
|
203
Co-Investment Plan
To assist executives in meeting their MSR’s, with effect from February 2013, they were given the opportunity, on a voluntary basis, to participate in the Co-Investment Plan (CIP), and this has been adopted on the conditions below:
Executives will be allowed to take up to 50 percent of their after-tax cash bonus to participate in a further matching scheme by purchasing shares in AngloGold Ashanti, and the company will match their initial investment into the scheme at 150 percent, with vesting over a two-year period in two equal tranches. It is to be noted that due to implementation of the new incentive scheme, Deferred Share Plan in January 2018, the last CIP participation will be in 2018 in respect of the cash bonus for 2017 performance year.
AngloGold Ashanti Share Incentive Scheme
AngloGold Ashanti operates a share incentive scheme through which Executive Directors, members of the Executive Committee and other management groups of the company and its subsidiaries are given the opportunity to acquire shares in the company. The intention of the incentive scheme is to ensure that the medium to long term interests of the executive and shareholders are aligned, providing rewards to the executives and wealth creation opportunities to the shareholders when the strategic performance drivers are achieved.
Non-Executive Directors are not eligible to participate in the share incentive scheme.
Employees participate in the share incentive scheme to the extent that they are granted options or rights to acquire shares and accept them. All options or rights which have not been exercised within ten years from the date of grant, automatically expire.
The incentives offered by AngloGold Ashanti are reviewed periodically to ensure that they remain globally competitive, so as to attract, motivate and retain managers of the highest calibre. As a result, several types of incentives, each with their own issue and vesting criteria, have been granted to employees. These are collectively known as the “AngloGold Ashanti Share Incentive Scheme” or “Share Incentive Scheme”.
Although the Remuneration and Human Resources Committee has the discretion to incentivise employees through the issue of shares, only options or awards have so far been granted.
The type and vesting criteria of the options or awards granted are:
Bonus Share Plan (BSP)
The granting of awards in terms of the BSP was approved by shareholders at the Annual General Meeting held on 29 April 2005. The Scheme has undergone a number of changes, each approved by the shareholders. Currently, each award made in respect of the BSP entitles the holder to acquire one ordinary share at “nil” cost, provided that the participant remains in the employ of the company at the date of vesting unless an event, such as death, retirement or redundancy occurs, which may result in a pro-rata allocation of awards and an earlier vesting date.
The Executive Committee members receive an allocation of 150 percent of their cash bonus while all other participating employees receive a 120 percent matching. The vesting period runs over two years with 50 percent vesting 12 months after the date of issue and the remaining 50 percent vesting 24 months after the date of issue.
Due to the implementation of the new incentive scheme, Deferred Share Plan in January 2018, approved by shareholders at the May 2017 Annual General Meeting, there will be no further shares allocated under the BSP scheme to eligible participants. The last allocation will be in February 2018 in respect of the 2017 performance year.
Long Term Incentive Plan (LTIP)
The granting of awards in terms of the LTIP was approved by shareholders at the Annual General Meeting held on 29 April 2005. Executive directors and selected senior management are eligible for participation. Each award made in respect of the LTIP entitles the holder to acquire one ordinary share at “nil” cost. Awards granted vest in three years from the date of grant, to the extent that the set company performance targets, under which the awards were made, are met, and provided that the participant remains in the employ of the company at the date of vesting, unless an event, such as death, retirement or redundancy occurs, which may result in a pro-rata allocation of awards and an earlier vesting date.
Due to the implementation of the new incentive scheme, Deferred Share Plan in February 2018, approved by shareholders at the May 2017 Annual General Meeting, there will be no further shares allocated under the LTIP scheme.
204
PARTICIPATION BY EXECUTIVE DIRECTORS, EXECUTIVE MANAGEMENT AND OTHER MANAGERS IN THE ANGLOGOLD SHARE INCENTIVE SCHEME
For details of the options and rights to subscribe for ordinary shares in the company granted to, and exercised by, executive directors, executive management and other managers on an aggregate basis during the year to 31 December 2017 and subsequent to year end up to 16 March 2018, see "Item 18: Note 32 - Related Parties - Directors and other key management personnel - Number of options and awards granted"
NUMBER OF SHARE AWARDS GRANTED UNDER SHARE INCENTIVE SCHEMES DURING 2017 AND UP TO 28 FEBRUARY 2018
In accordance with the JSE Listings Requirements and the rules of the AngloGold Share Incentive Scheme, the changes in awards granted and the ordinary shares issued as a result of the exercise of awards during the period 1 January 2017 to 28 February 2018 are disclosed below:
|
Bonus Share Plan
(1)
|
|
Long-Term Incentive Plan
(1)(2)
|
|
|||
|
At 1 January 2017
|
4,198,285
|
|
4,435,368
|
|
||
|
Movement during the year
|
||||||
|
–
Granted
|
1,926,549
|
|
—
|
|
||
|
–
Exercised
|
(1,426,554
|
)
|
(404,301
|
)
|
||
|
–
Lapsed/forfeited
|
(218,601
|
)
|
(1,512,857
|
)
|
||
|
At 31 December 2017
|
4,479,679
|
|
2,518,210
|
|
||
|
Subsequent to year-end
|
||||||
|
–
Exercised
|
(64,165
|
)
|
(7,344
|
)
|
||
|
–
Lapsed/forfeited
|
(19,995
|
)
|
(5,593
|
)
|
||
|
At 28 February 2018
|
4,395,519
|
|
2,505,273
|
|
||
|
(1)
|
BSP and LTIP awards granted at nil cost to participants.
|
|
(2)
|
Includes Share Retention Bonus Scheme awards.
|
Due to the limited number of shares available as a result of a diminishing share pool there were insufficient shares available to do the LTIP allocation in 2017.
The table below reflects the total number of awards that are available for issue in terms of the share incentive scheme:
|
2017 Awards
|
|
||||
|
At 1 January
|
1,252,708
|
|
|||
|
Bonus Share Plan awards granted
|
(1,926,549
|
)
|
|||
|
Lapsed/Forfeited - Bonus Share Plan
|
218,601
|
|
|||
|
Lapsed/Forfeited - Long Term Incentive Plan
|
1,512,857
|
|
|||
|
At 31 December
|
|
1,057,617
|
|
||
205
Overview
Description of AngloGold Ashanti’s share capital
AngloGold Ashanti’s share capital consists of four classes of stock:
|
•
|
Ordinary shares, par value 25 South African cents each (the “ordinary shares”);
|
|
•
|
A redeemable preference shares, par value 50 South African cents each (the “A preference shares”);
|
|
•
|
B redeemable preference shares, par value 1 South African cent each (the “B preference shares”); and
|
|
•
|
C redeemable preference shares of no par value (the “C preference shares”).
|
The authorised and issued share capital of AngloGold at 31 December 2017 is set out below:
|
Title of class
|
Authorised
|
|
Issued
|
|
||
|
Ordinary shares
|
600,000,000
|
|
410,054,615
|
|
||
|
A preference shares
|
2,000,000
|
|
2,000,000
|
|
||
|
B preference shares
|
5,000,000
|
|
778,896
|
|
||
|
C preference shares
|
30,000,000
|
|
0
|
|
||
All the issued ordinary shares, A redeemable preference shares and B redeemable preference shares are fully paid and are not subject to further calls or assessment by AngloGold Ashanti. For a discussion of rights attaching to the ordinary shares, the A redeemable preference shares, the B redeemable preference shares and the C redeemable preference shares, see “Item 10B: Memorandum of Incorporation”.
The following are the movements in the ordinary issued share capital at 31 December:
Ordinary shares
|
Number of
Shares
|
|
Rand
|
|
Number of
Shares
|
|
Rand
|
|
Number of
Shares
|
|
Rand
|
|
|||||||
|
2017
|
2016
|
2015
|
||||||||||||||||
|
At 1 January
|
408,223,760
|
|
102,055,940
|
|
405,265,315
|
|
101,316,329
|
|
404,010,360
|
|
101,002,590
|
|
||||||
|
Issued during the year:
|
||||||||||||||||||
|
Exercise of options by participants in the AngloGold share Incentive Scheme
|
1,830,855
|
|
457,714
|
|
2,958,445
|
|
739,611
|
|
1,254,955
|
|
313,739
|
|
||||||
|
410,054,615
|
|
102,513,654
|
|
408,223,760
|
|
102,055,940
|
|
405,265,315
|
|
101,316,329
|
|
|||||||
During the period 1 January 2018 to and including 19 March 2018, 683,544 ordinary shares were issued at an average issue price of R178.70 per share, resulting in 410,738,159 ordinary shares being in issue at 19 March 2018.
Redeemable preference shares
The A and B redeemable preference shares, all of which are held by Eastvaal Gold Holdings Limited, a wholly owned subsidiary of AngloGold Ashanti, may not be transferred and are redeemable from the realisation of the assets relating to the Moab lease area after the cessation of mining operations in the area. The shares carry the right to receive dividends equivalent to the profits (net of royalty, ongoing capital expenditure and taxation) from operations in the area. No further A and B redeemable preference shares will be issued.
The C redeemable preference shares have no par value but have the same rights as the B preference shares save that the C preference shares rank after the B preference shares (but prior to the A preference shares) as regards the payment of dividends, redemption proceeds and payment on winding up of the company.
206
7A. MAJOR SHAREHOLDERS
According to information available to the directors, the following are the only shareholders or their associates holding, directly or indirectly, in excess of 5 percent of the ordinary issued share capital of the company:
|
Ordinary shares held at
|
31 December 2017
|
31 December 2016
|
31 December 2015
|
||||||||||||
|
Shareholder*
|
Number of
Shares
|
|
Percent
Voting
Rights
|
Number of
Shares
|
|
Percent
Voting
Rights
|
Number of
Shares
|
|
Percent
Voting
Rights
|
||||||
|
BlackRock Inc.
|
38,926,159
|
|
9.49
|
42,966,540
|
|
10.53
|
|||||||||
|
Public Investment Corp. of South Africa
|
25,808,607
|
|
6.29
|
25,580,542
|
|
6.27
|
25,936,314
|
|
6.40
|
||||||
|
Van Eck Global
|
24,485,374
|
|
6.00
|
26,941,752
|
|
6.65
|
|||||||||
|
Investec Asset Management (Pty) Limited (South Africa)
|
31,185,069
|
|
7.69
|
||||||||||||
|
Paulson & Co., Inc
|
25,027,300
|
|
6.18
|
||||||||||||
|
Dimensional Fund Advisors
|
20,901,571
|
|
5.16
|
||||||||||||
* Shares may not necessarily reflect the beneficial shareholder.
At 31 December 2017, a total of 159,347,405 shares (or 39 percent of issued ordinary share capital) were held by The Bank of New York Mellon, as Depositary for the company’s American Depositary Receipt programme. Each American Depositary Share (ADS) is equivalent to one ordinary share. At 31 December 2017, the number of persons who were registered holders of ADSs was reported at 2,423. AngloGold Ashanti is aware that many ADSs are held of record by brokers and other nominees, and accordingly the above numbers are not necessarily representative of the actual number of persons who are beneficial holders of ADSs or the number of ADSs beneficially held by these persons.
All shareholders have the same voting rights.
As at 31 December 2017, there were 11,925 holders on record of AngloGold Ashanti ordinary shares. Of these holders 447 had registered addresses in the United States and held a total of 56,677,316 ordinary shares, 13.82 percent of the total outstanding ordinary shares. In addition, certain accounts on record with registered addresses outside the United States, including The Bank of New York Mellon, hold AngloGold Ashanti ordinary shares, in whole or in part, beneficially for United States persons.
At 19 March 2018, a total of 164,571,109 ADSs or 40 percent of total issued ordinary share capital were issued and outstanding and held on record by 2,402 registered holders.
Insofar as is known to AngloGold Ashanti, there was no person who, directly or indirectly, jointly or severally, exercised or could exercise control over AngloGold Ashanti, nor is AngloGold Ashanti aware of any arrangements which might result in a change in control of AngloGold Ashanti.
207
7B. RELATED PARTY TRANSACTIONS
The Company had the following transactions with related parties during the year ended 31 December 2017:
|
At 31 December
|
2017
|
|
|
(in millions)
|
Purchases from
related party
|
|
|
$
|
||
|
Purchases of goods and services from related parties
|
||
|
Rand Refinery (Pty) Limited
|
11
|
|
|
Margaret Water Company
|
5
|
|
|
Société d’Exploitation des Mines d’Or de Sadiola S.A.
|
3
|
|
|
19
|
|
|
Amounts due by joint ventures and associates arising from purchases of goods and services are unsecured and non-interest bearing.
|
At 31 December
|
2017
|
|
|
(in millions)
|
Sales and
services
rendered to
related parties
|
|
|
$
|
|
|
|
Sales and services rendered to related parties
|
||
|
Société d’Exploitation des Mines d’Or de Sadiola S.A.
|
6
|
|
|
Société d’Exploitation des Mines d’Or de Yatela S.A.
|
2
|
|
|
Gramalote
|
4
|
|
|
12
|
|
|
As at 31 December 2017 the outstanding balances arising from the sale of goods and services due by related parties is $9m.
As at 31 December 2017 there are no outstanding balances arising from loans owed to related parties.
208
7C. INTERESTS OF EXPERTS AND COUNSEL
Not applicable.
209
210
8A. CONSOLIDATED FINANCIAL STATEMENTS AND OTHER INFORMATION
See “Item 18: Financial statements”.
211
LEGAL PROCEEDINGS
There is no material proceeding in which a director, officer or affiliate of AngloGold Ashanti is either a party adverse or has a material interest adverse to the company.
In addition to the proceedings described below, the company becomes involved, from time to time, in various claims, legal proceedings and complaints incidental to the ordinary course of its business.
TAX MATTERS
|
•
|
The State of Minas Gerais v. Mineração Serra Grande S.A. (MSG):
MSG received a tax assessment in October 2003 from the State of Minas Gerais related to VAT on gold bullion transfers. The tax administrators rejected the company’s appeal against the assessment. The company is now appealing the dismissal of the case to the State Court of Minas Gerais. The assessment is approximately $13.6 million. Any possible payment by MSG would be set off by an indemnity from Kinross Gold Corporation (Kinross) of $8.4 million.
|
|
•
|
Brazilian tax authorities v. AngloGold Ashanti Brazil Mineração (AABM):
AngloGold Ashanti’s subsidiaries in Brazil, including AABM, are involved in various disputes with tax authorities. These disputes date back to 2007 and involve federal tax assessments including income tax, royalties, social contributions, VAT and annual property tax. In December 2017, new VAT assessments (totalling $14 million) were received. Collectively, the total possible amount involved across all disputes is approximately $24 million.
|
|
•
|
Notice from the Colombian Tax Office (DIAN) to AngloGold Ashanti Colombia S.A. (AGAC):
In January 2013, AGAC received notice from the DIAN that it disagreed with the company’s tax treatment of certain items in the 2010 and 2011 income tax returns. On 23 October 2013, AGAC received the official assessments from the DIAN which established that an estimated additional tax of $21 million will be payable if the tax returns are amended. Penalties and interest for the additional taxes are expected to be $129 million. The company believes that the DIAN has applied the tax legislation incorrectly. AGAC subsequently challenged the DIAN’s ruling by filing lawsuits in March 2015 and April 2015, before the Administrative Tribunal of Cundinamarca (the trial court for tax litigation). Closing arguments on the 2010 and 2011 tax dispute were presented in February and June 2017, and judgement is pending. The Administrative Tribunal may take 12 months to deliver its decision and if an appeal from either party is sought, a final judgement could take several years.
|
|
•
|
Argentina Tax Authority (AFIP) and Cerro Vanguardia S.A. (CVSA)
:
On 12 July 2013, CVSA received a notification from the AFIP requesting corrections to the 2007, 2008 and 2009 income tax returns of about $6 million relating to the non-deduction of tax losses previously claimed on hedge contracts.
The AFIP is of the view that the financial derivatives could not be considered as hedge contracts, as hedge contract losses could only be offset against gains derived from the same kind of hedging contracts.
Penalties and interest on the disputed amounts are estimated at a further $21 million. CVSA and AFIP have corresponded on this issue over the past several years, and
the government continues to assert its position regarding the use of the financial derivatives. CVSA filed an appeal with the Tax Court on 19 June 2015, and the parties submitted their final reports in July 2017. The matter is pending with the Tax Court.
|
|
•
|
Ghanaian tax authorities v. AngloGold Ashanti (Ghana) Limited (AGAG)
: In Ghana, AGAG
received tax assessments of $28 million as of 31 December 2013 in respect of the 2006-2008 and 2009-2011 tax years, following an audit by the tax authorities related to withholding taxes on payments to non-resident persons. AGAG believes that the withholding taxes were not properly assessed and has lodged an objection to the assessment. In 2012, AGAG met with the Commissioner-General and provided its position in writing together with the relevant supporting documentation. AGAG has yet to receive a response from the Commissioner-General. Nonetheless, in 2015 the tax authorities again raised the issue of paying withholding taxes as part of their findings covering the 2012 - 2014 tax years. AGAG raised objections with the tax authorities.
|
SOUTH AFRICA
|
•
|
Silicosis litigation:
On 03 March 2011, in
Mankayi vs. AngloGold Ashanti
, the Constitutional Court of South Africa held that section 35(1) of the Compensation for Occupational Injuries and Diseases Act, 1993 does not cover an “employee” who qualifies for compensation in respect of “compensable diseases” under the Occupational Diseases in Mines and Works Act, 1973 (ODMWA). This judgement allows such qualifying employee to pursue a civil claim for damages against the employer. Following the Constitutional Court decision, AngloGold Ashanti has become subject to numerous claims relating to silicosis and other Occupational Lung Diseases (OLD), including class actions and individual claims.
|
In November 2014, Anglo American South Africa, AngloGold Ashanti, Gold Fields Limited, Harmony Gold Mining Company Limited and Sibanye Gold Limited formed an industry working group on OLD (OLD Working Group) to address issues relating to compensation and medical care for occupational lung disease in the gold mining industry in South Africa. The working group now also includes African Rainbow Minerals (ARM). The OLD Working Group remains of the view that achieving a comprehensive solution which is both fair to past, present and future employees, and sustainable for the sector, is preferable to protracted litigation.
212
AngloGold Ashanti, along with other mining companies including Anglo American South Africa, ARM, Gold Fields Limited, Harmony Gold Mining Company Limited, DRDGold Limited, Randgold and Exploration Company Limited, and Sibanye Gold Limited, were served with a consolidated class action application on 21 August 2013. On 13 May 2016, the South Gauteng High Court of South Africa ruled in favour of the applicants and found that there were sufficient common issues to certify two industry-wide classes: a Silicosis Class and a Tuberculosis Class. On 03 June 2016, AngloGold Ashanti, together with certain of the other mining companies, filed an application with the High Court for leave to appeal to the Supreme Court of Appeal (SCA). On 13 September 2016, the SCA granted the mining companies leave to appeal the entire High Court ruling to the SCA.
Settlement negotiations between the OLD Working Group and legal representatives of the Silicosis Class and the Tuberculosis Class have reached an advanced stage. On 10 January 2018, in response to a postponement request from all parties involved in the appeal due to the advanced stage of settlement negotiations, the Registrar of the SCA postponed the hearing date until further notice.
It is possible that additional class actions and/or individual claims relating to silicosis and/or other OLD will be filed against AngloGold Ashanti in the future. AngloGold Ashanti will defend all current and subsequently filed claims on their merits. Should AngloGold Ashanti be unsuccessful in defending any such claims, or in otherwise favourably resolving perceived deficiencies in the national occupational disease compensation framework that were identified in the earlier decision by the Constitutional Court, such matters would have an adverse effect on its financial position, which could be material.
COLOMBIA
|
•
|
La Colosa class action lawsuits
: Four (4) class action lawsuits are pending in relation to AngloGold Ashanti Colombia S.A.’s (AGAC) Santa Maria-Montecristo and La Colosa projects. Each lawsuit aims to stop exploration and mining in certain restricted areas affected by the projects due to environmental concerns or alleged breaches of environmental laws. In one of these lawsuits, the court granted the plaintiff a preliminary injunction in September 2011, suspending the mining concession contracts of the Santa Maria-Montecristo project. The injunction remains in place and has been challenged by AGAC; however, it is not a critical path item for the project. In another lawsuit, on 10 October 2016, Tolima’s Administrative Court ordered that a technical study be prepared by April 2017 by a panel of seven (7) experts (selected by the plaintiff, AGAC, universities, the government and an NGO) to determine whether the La Colosa Project presents a “threat” to the environment during its exploration phase. AGAC successfully appealed the order to prepare the technical study and the order has been temporarily suspended, pending resolution by the State Council (appellate court). In another of the lawsuits, on 4 December 2017, Ibague’s Third Administrative Court ordered that a technical study similar to the one described on the October 2016 order be prepared for the La Colosa Project. AGAC also intends to appeal this order. If the studies were to conclude that a “threat” exists, certain activities at La Colosa may be suspended.
|
While plaintiffs in all four cases have petitioned the courts to cancel concession contracts for the mining projects, the company believes that courts and judges in Colombia do not have the authority to order such cancellations. Such power, by law, vests solely in the mining authority, which has the discretion to declare concessions void if a contractor breaches applicable environmental laws or regulations. To date, the company is not aware of the Colombian government having ever declared a concession void for these reasons. AGAC continues to oppose, through a variety of integrated legal and political strategies, the class action lawsuits that have been filed against it. If plaintiffs prevail and AGAC’s core concession contracts are cancelled, the company would be required to abandon the La Colosa Project and all of AGAC’s other existing mining concession contracts and pending proposals for new mining concession contracts, would also be cancelled. Given the inherent legal and factual uncertainties with respect to the pending claims, no reliable estimate can be made for the obligation.
|
•
|
Cortolima’s injunction against AGAC
: On 11 March 2013, Cortolima, a regional environmental authority in Colombia, issued a regulatory injunction against AGAC alleging, among other things, that in relation to certain of AGAC’s La Colosa exploration activities, AGAC (1) did not provide timely notice to the government prior to performing certain exploration activities and (2) engaged in drilling and other activities that could have negative effects on the environment. On 22 March 2013, AGAC challenged the injunction, seeking an annulment of the action and the restoration of AGAC’s rights to continue exploration activities in the area. The request to annul the injunction was denied by the Director of Cortolima, and AGAC is continuing with its plans to challenge the injunction through a variety of legal actions. On 31 August 2013, AGAC presented before the State Council its claim for the annulment and rights re-establishment. This matter is pending. While the injunction remains in place, AGAC is not able to engage in certain of its activities related to the La Colosa Project.
|
|
•
|
Piedras and Cajamarca
: In 2013 the Council for the city of Piedras, near the La Colosa Project, issued a referendum attempting to ban all mining activities in Piedras. This referendum does not have an immediate impact on the La Colosa Project, however, AGAC believes this referendum is in violation of federal law. The referendum was subsequently validated by the local administrative court in Tolima (the Department in which Piedras is located). AGAC subsequently filed a request for annulment of the referendum with the Second Administrative Court of Ibaque and a tutela (a legal action alleging a violation of AGAC’s constitutional rights) with the State Council (Supreme Court for administrative purposes). On 21 August 2014, the State Council dismissed the tutela action for lack of standing, which AGEAC appealed to a different division of the State Council. On 11 December 2014, this State Council division affirmed the earlier dismissal on the grounds that AGAC did not have mining tenements in Piedras. However, in the same ruling the court recognised that Piedras did not follow the correct procedure when it issued the 2013 referendum. AGAC’s request for annulment of the referendum is pending.
|
213
On 26 March 2017, the residents of the municipality of Cajamarca voted to disapprove mining projects in the municipality, including La Colosa. However, the Mining Minister of Colombia subsequently publicly confirmed that Cajamarca’s vote does not apply retroactively, so it does not have an immediate impact on the La Colosa Project. On 27 April 2017, AGAC suspended all exploration activities at the La Colosa Project until there is certainty about mining activity in Colombia.
|
•
|
La Colosa Human Rights Litigation
: In November 2014, the Personero (Ombudsman) of Ibaque filed suit against the Colombian government in the Inter-American Court of Human Rights. This Court is an autonomous judicial institution whose purpose is the application and interpretation of the American Convention on Human Rights (Colombia, along with many other Central and South American countries, has ratified this Convention). The suit alleges that the Colombian government has failed to protect the interests of the people of Ibaque by issuing permits to AGAC for the La Colosa project and by failing to resolve the class actions that have been pending for an extended period of time. Although AGAC is not a party to the suit, its outcome is important to the development of the La Colosa project. The first step in the litigation process is for the Court to decide whether to accept the case. If the case is accepted, the Colombian government will have to defend itself against the lawsuit and will be bound by the findings of the Court. AGAC continues to regularly follow-up with the Colombian government for updates.
|
|
•
|
Paramo Delimitation
:
In November 2016, the Colombian government issued Resolution 1987, which delineates certain wetlands or moorlands as environmentally important and establishes protected areas and includes areas in and around the La Colosa Project. In these areas there are limitations, or in some instances outright bans, on mining and mining-related activities. These limitations and bans could potentially
adversely impact the design, operations and production of the mining project at the La Colosa Project. On 12 June 2017, AGAC filed suit against the Ministry of the Environment in the Administrative Tribunal of Cajamarca to challenge the paramo delimitation on technical and other grounds. The lawsuit is pending admission.
|
|
•
|
Zonte Metals
: A Canadian junior mining company, Zonte Metals, filed applications for title to certain corridors, or small slivers of land, overlaying sections of the Gramalote project. The Secretary of Mines in Antioquia denied the applications filed by Zonte Metals. However, Zonte Metals then filed a claim against the National Mining Agency and the Secretary of Mines before the Colombian State Council, by which it seeks to (i) revoke the resolution that denied its application and (ii) obtain the rights over the corridors requested in its application. The Council subsequently enjoined the Secretary of Mines and AGAC from moving forward on a pending application to integrate the corridors with our tenement. The Secretary of Mines has filed its response to the Zonte Metals claim, which includes arguments aligned with the interests and position of Gramalote. On 4 September 2017, the Council AGAC approved AGAC’s request to be made an interested party to the lawsuit.
|
GHANA
|
•
|
Pompora Treatment Plant Litigation:
On 02 April 2013, AGAG received a summons from Abdul Waliyu and 152 others in which the plaintiffs allege that they were or are residents of the Obuasi municipality or its suburbs and that their health has been adversely affected by emissions and/or other environmental impacts arising in connection with the current and/or historical operations of the Pompora Treatment Plant (PTP), which was decommissioned in 2000. The plaintiffs’ alleged injuries include respiratory infections, skin diseases and certain cancers. The plaintiffs subsequently did not timely file their application for directions but AGAG intends to allow some time to pass prior to applying to have the matter dismissed for want of prosecution. On 24 February 2014, executive members of the PTP Smoke Effect Association (PASEA) (Frank Adjei Danso and five others), sued AGAG by themselves and on behalf of their members (undisclosed number) on grounds similar to those discussed above, as well as economic hardships resulting from the failure of their crops. This matter has been adjourned indefinitely. AGAG intends to allow some time to pass prior to applying to have the matter struck out for want of prosecution.
|
|
•
|
Mining and Building Contractors Limited:
On 11 October 2011, AGAG terminated Mining and Building Contractors Limited’s (MBC) underground development agreement, construction on bulkheads agreement and diamond drilling agreement at Obuasi. The parties reached agreement on the terms of the separation and concluded a separation agreement on 08 November 2012. On 20
February 2014, AGAG was served with a writ issued by MBC claiming a total of $97 million. In December 2015, the proceedings were stayed in the High Court pending arbitration. In February 2016, MBC submitted the matter to arbitration. To date, MBC has not appointed an arbitrator.
|
|
•
|
Obuasi Arbitration
:
On 08 April 2016, AGAG filed a request for arbitration against the Government of Ghana (GoG). AGAG filed this request with the International Centre for Settlement of Investment Disputes (ICSID), an international arbitration institution headquartered in Washington, D.C., which facilitates dispute resolution between international investors and host states. AGAG is seeking relief from the GoG for breaching the mining lease relating to the Obuasi mine by withdrawing military personnel from the Obuasi mine and subsequently failing to restore law and order. In so doing, the GoG has allowed and facilitated illegal mining activity at Obuasi. These actions have prevented AGAG from peacefully enjoying the areas exclusively leased to it under the mining lease. The GoG may raise counterclaims against AGAG in response to AGAG’s request for arbitration. In October 2016, the tribunal at ICSID (the Tribunal) was formally constituted. On 17 February 2017, the Tribunal joined the GoG’s jurisdiction objections with proceedings on the merits. The parties subsequently stayed the arbitration through 31 December 2017. The arbitration remains suspended to date as discussions between the parties are ongoing.
|
214
GUINEA
|
•
|
Government of Guinea (National Claim Commission) v. Société AngloGold Ashanti Goldfields de Guinée SA (SAG)
: A national claim recovery commission established by the government of Guinea has demanded that SAG pay $43 million in dividends and penalties that would allegedly have been owed to the government of Guinea for the accounting years 2004 - 2007. SAG opposes the claim. The two parties had originally decided to submit their dispute to an independent audit firm to be appointed by a common accord; however, the independent audit firm was never appointed. In December 2010, the national claim recovery commission was disbanded and the matter was turned over to the Inspector General of the Ministry of Finance. This matter has been dormant since it was handed over to the Inspector General.
|
NORTH AMERICA
|
•
|
Designated Matters under the Stock Purchase Agreement between AngloGold Ashanti and Newmont Mining Corporation (Newmont):
On 19 October 2017, Newmont filed a lawsuit in New York federal court against AngloGold Ashanti and certain related parties, alleging that AngloGold Ashanti and such parties did not provide Newmont with certain material information related to a gold-ore processing mill located at AngloGold Ashanti’s Cripple Creek & Victor Gold Mining Company (CC&V) in 2015 during the negotiation and sale of CC&V to Newmont. AngloGold Ashanti believes the lawsuit is without merit and intends to vigorously defend against it. The matter is proceeding. Separately, in July 2017, CC&V succeeded in its Colorado arbitration claims against the mill design contractor, receiving an award of approximately $10.6 million, including costs.
|
TANZANIA
|
•
|
Geita Gold Mining Limited (GGM)
: In January 2007, Jackson Manyelo and other plaintiffs filed a suit against GGM in the Mwanza High Court alleging that they were affected by blasting activities in the Katoma area carried out by GGM and had suffered damages in the amount of Tshs9.6 billion (approximately $6 million). On 30 April 2015, the High Court issued a judgement in favour of GGM. In 2016, Plaintiffs appealed to the Court of Appeal, where the matter is pending.
|
|
•
|
GGM and Samax Resources Limited v. Government of Tanzania
: On 13 July 2017, GGM and Samax Resources Limited (the Companies) filed a notice of arbitration against the Government of Tanzania arising from the enactment by the government of certain legislation that purports to make a number of changes to the operating environment of Tanzania’s extractive industries, including mining. The notice of arbitration was submitted in accordance with Article 12 of the Agreement for the Development of a Gold Mine at Geita, Mwanza between the Government of Tanzania and the Companies (the MDA), and under the 1976 Arbitration Rules of the United Nations Commission on International Trade Law (UNCITRAL). The Tribunal has been duly constituted. The next step will be for the Tribunal to hold a first procedural hearing.
|
|
•
|
Arbitration under the United Kingdom-Tanzania Bilateral Investment Treaty (UK-Tanzania BIT)
:
Separate from the arbitration under the MDA described above, on 04 September 2017, the Companies (together with Cluff Oil Limited and Cluff Mineral Exploration Limited) wrote to the Government of Tanzania, setting out that the Government of Tanzania’s conduct amounted to a breach of its commitments under the UK-Tanzania BIT (the Notice). The Notice triggered a ‘cooling-off’ period under the UK-Tanzania BIT, pursuant to which the parties had six months to achieve an amicable resolution to their dispute (the Cooling Off Period). The Cooling Off Period expired 04 March 2018 and now the Companies, Cluff Oil Limited and Cluff Mineral Exploration Limited are entitled to submit their dispute with the Government of Tanzania to ICSID arbitration in accordance with the terms of the UK-Tanzania BIT.
|
215
DIVIDENDS
Dividends are proposed by and approved by the board of directors of AngloGold Ashanti, based on the company’s financial performance. Dividends are recognised when declared by the board of directors of AngloGold Ashanti. AngloGold Ashanti’s dividend policy allows the Board to declare an annual dividend to be based on 10 percent of the free cash flow generated by the business for that financial year, before taking into account growth capital expenditure. The Board may exercise its discretion on an annual basis, taking into consideration the prevailing market conditions, balance sheet flexibility and future capital commitments of the group.
Dividends may be declared in any currency at the discretion of the AngloGold Ashanti board or AngloGold Ashanti shareholders at a general meeting. Currently, dividends are declared in South African rands and paid in Australian dollars, South African rands and Ghanaian cedis. Dividends paid to registered holders of AngloGold Ashanti ADSs are paid in US dollars converted from South African rands by The Bank of New York Mellon, as depositary, in accordance with the deposit agreement. Exchange rate fluctuations may therefore affect the value of the dividends received by registered shareholders and distributions paid by the relevant depositary to investors holding AngloGold Ashanti securities. Moreover, fluctuations in the exchange rates of the US dollar may affect the US dollar price of the ADSs on the NYSE. For details on taxation and exchange controls applicable to holders of ordinary shares or ADSs, see “Item 10D: Exchange Controls”, “Item 10E: Taxation-South African Taxation-Taxation of dividends” and “Item 10E: Taxation-United States Taxation-Taxation of dividends”.
Dividends declared (in the ordinary course from trading and non-trading profits) to foreign shareholders are not subject to the approval by the South African Reserve Bank (SARB) in terms of South African foreign exchange control regulations. Dividends are freely transferable to foreign shareholders from both trading and non-trading profits earned in South Africa by publicly listed companies. Dividends in specie or special dividends may require SARB approval prior to declaration and payment to foreign shareholders.
Under South African law, the company may declare and pay dividends from any reserves included in total shareholder’s equity (including share capital and share premium) calculated in accordance with International Financial Reporting Standards (IFRS), subject to the solvency and liquidity test.
Withholding tax
South Africa currently imposes a Dividend Withholding Tax on Companies (dividends tax) at a rate of 20 percent on the net amount of the dividend declared by a resident company, other than a Headquarter Company. On 22 February 2017, the rate increased from 15 percent to 20 percent for any dividends paid after 1 March 2017.
The dividends tax is generally imposed on the beneficial owner. The dividends tax could be reduced to a lower rate under an applicable double tax treaty, if all requirements are met. In the case of dividends paid to a US holder with respect to shares, the Treaty would generally limit the dividends tax rate to five percent of the gross amount of the dividends if a corporate US holder holds directly at least 10 percent of the voting stock of AngloGold Ashanti. In all other cases, the maximum tax rate under the Treaty is 15 percent of the gross amount of the dividend. There are different rules to consider if the beneficial owner of the dividends is a US resident who carries on business in South Africa through a permanent establishment situated in South Africa, or performs in South Africa independent personal services from a fixed base situated in South Africa, and the dividends are attributable to such permanent establishment or fixed base. Moreover, if the dividends tax rate is reduced under the auspices of an applicable double tax treaty, there are certain South African compliance requirements that must be met in order to access the double tax treaty relief.
216
|
8B.
|
SIGNIFICANT CHANGES
|
Refer “Item 18: Note 36—Recent developments”.
217
218
|
9A.
|
OFFER AND LISTING DETAILS
|
The following table sets out, for the periods indicated, the reported high and low market quotations for AngloGold Ashanti’s ordinary shares on the JSE and for its sponsored ADSs on the NYSE:
|
JSE
|
NYSE
(1)
|
||||||||||
|
Year ended 31 December
|
High
|
|
Low
|
|
High
|
|
Low
|
|
|||
|
(South African cents per ordinary share)
|
(US dollars per ADS)
|
||||||||||
|
Annual information
|
|||||||||||
|
2013
|
27,048
|
|
11,401
|
|
31.88
|
|
11.14
|
|
|||
|
2014
|
20,952
|
|
8,836
|
|
19.53
|
|
7.45
|
|
|||
|
2015
|
14,999
|
|
7,159
|
|
13.12
|
|
5.64
|
|
|||
|
2016
|
31,775
|
|
10,700
|
|
22.91
|
|
7.09
|
|
|||
|
2017
|
18,711
|
|
11,499
|
|
13.68
|
|
8.86
|
|
|||
|
2016
|
|||||||||||
|
First quarter
|
22,360
|
|
10,700
|
|
14.31
|
|
7.09
|
|
|||
|
Second quarter
|
27,892
|
|
19,664
|
|
18.49
|
|
13.16
|
|
|||
|
Third quarter
|
31,775
|
|
20,792
|
|
22.91
|
|
15.00
|
|
|||
|
Fourth quarter
|
22,055
|
|
12,906
|
|
15.92
|
|
9.32
|
|
|||
|
2017
|
|||||||||||
|
First quarter
|
18,711
|
|
12,502
|
|
13.68
|
|
9.67
|
|
|||
|
Second quarter
|
17,950
|
|
12,600
|
|
13.31
|
|
9.64
|
|
|||
|
Third quarter
|
14,323
|
|
11,670
|
|
10.86
|
|
8.88
|
|
|||
|
Fourth quarter
|
14,579
|
|
11,499
|
|
10.63
|
|
8.86
|
|
|||
|
September 2017
|
14,323
|
|
12,126
|
|
10.86
|
|
9.10
|
|
|||
|
October 2017
|
13,828
|
|
12,315
|
|
9.87
|
|
9.17
|
|
|||
|
November 2017
|
14,579
|
|
12,884
|
|
10.63
|
|
9.08
|
|
|||
|
December 2017
|
14,360
|
|
11,499
|
|
10.59
|
|
8.86
|
|
|||
|
January 2018
|
14,140
|
|
12,000
|
|
12.00
|
|
10.34
|
|
|||
|
February 2018
|
13,400
|
|
10,720
|
|
11.34
|
|
9.16
|
|
|||
|
March 2018
(2)
|
11,560
|
|
10,635
|
|
9.94
|
|
8.88
|
|
|||
|
(1)
|
Each ADS represents one ordinary share.
|
|
(2)
|
Through 19 March 2017.
|
See “Item 7A: Major Shareholders” for the number of ADSs outstanding at 31 December 2017.
219
|
9B.
|
PLAN OF DISTRIBUTION
|
Not applicable.
220
|
9C.
|
MARKETS
|
NATURE OF TRADING MARKET
The principal trading markets for AngloGold Ashanti’s ordinary shares are the New York Stock Exchange, in the form of ADSs, under the symbol “AU” and the JSE Limited, in the form of ordinary shares, under the symbol “ANG”.
AngloGold Ashanti’s ordinary shares are also listed on the Ghana Stock Exchange under the symbol “AGA”, the Australian Securities Exchange, in the form of Chess Depositary Interests (each representing one-fifth of an ordinary share) under the symbol “AGG” and on the Ghana Stock Exchange, in the form of Ghanaian Depositary Shares or GhDSs (each representing one one-hundredth of an ordinary share) under the symbol “AADS”.
221
|
9D.
|
SELLING SHAREHOLDERS
|
Not applicable.
222
|
9E.
|
DILUTION
|
Not applicable.
223
|
9F.
|
EXPENSES OF THE ISSUE
|
Not applicable.
224
225
10A.
SHARE CAPITAL
For a discussion of options on AngloGold Ashanti’s ordinary shares available to executive officers from time to time, see “Item 6E: Share Ownership-Share Ownership of Executive Officers/Executive Management”.
Authorised and Issued Shares
AngloGold Ashanti’s authorised and issued share capital as of 31 December 2017 and 19 March 2018 (being the latest practicable date prior to the publication of this document) is set out below:
|
Title of Class
|
Authorised
|
|
Issued
|
|||
|
19 March 2018
|
|
31 December 2017
|
|
|||
|
Ordinary shares at par value of R0.25 each
|
600,000,000
|
|
410,738,159
|
|
410,054,615
|
|
|
A redeemable preference shares at par value of R0.50 each
|
2,000,000
|
|
2,000,000
|
|
2,000,000
|
|
|
B redeemable preference shares at par value of R0.01 each
|
5,000,000
|
|
778,896
|
|
778,896
|
|
|
C redeemable preference shares at no par value
|
30,000,000
|
|
0
|
|
0
|
|
All of the issued ordinary shares, A redeemable preference shares, B redeemable preference shares are fully paid and are not subject to further calls or assessment by AngloGold Ashanti.
The table below details changes in the issued ordinary share capital of AngloGold Ashanti since 31 December 2014 through 31 December 2017
|
Period to
|
Description
|
Number of
Shares
|
|
|
|
31 December 2014
|
404,010,360
|
|
||
|
Ordinary shares issued during
|
2014
|
AngloGold Share Incentive Scheme
|
1,254,955
|
|
|
31 December 2015
|
405,265,315
|
|
||
|
Ordinary shares issued during
|
2016
|
AngloGold Share Incentive Scheme
|
2,958,445
|
|
|
31 December 2016
|
408,223,760
|
|
||
|
Ordinary shares issued during
|
2017
|
AngloGold Share Incentive Scheme
|
1,830,855
|
|
|
31 December 2017
|
410,054,615
|
|
||
Shares held by AngloGold Ashanti or by its Subsidiaries
See “Item 18: Note 24 - Share capital and premium” for more information.
A and B Redeemable preference shares
All of the A redeemable preference shares and B redeemable preference shares are held by Eastvaal Gold Holdings Limited, one of AngloGold Ashanti’s wholly-owned subsidiary. AngloGold Ashanti’s Memorandum of Incorporation provide that the A redeemable preference shares and B redeemable preference shares are not transferable.
C preference shares
The terms of the C preference shares are the same as those of the existing B preference shares. However, the C preference shares rank after the B preference shares for purposes of dividends and payments upon redemption.
Unissued shares
In terms of a general authority from shareholders in annual general meeting, granted on 16 May 2017, the directors of the Company are authorised to allot and issue, for such purposes and on such terms as they may, in their discretion, determine, ordinary shares of 25 SA cents each (shares) in the authorised but unissued share capital of the Company up to a maximum of 5 percent of the number of shares in issue at the date of the ordinary resolution dated 16 May 2017. The directors annually seek renewal of such authority at the annual general meeting, and the next renewal will be requested at the annual general meeting to be held on 16 May 2018.
226
|
Authorised but unissued ordinary Shares under the control of the directors - amounting to 5 percent of
Issued shares on 22 March 2017
|
20,440,269
|
|
|
Authorised but unissued ordinary shares attributable to the share incentive scheme (balance of -
20,000,000 total scheme allocation pursuant to shares issued from 15 October 2008)
|
8,055,506
|
|
227
10B.
MEMORANDUM OF INCORPORATION
On 1 May 2011, the South African Companies Act 71 of 2008 (as amended) (the Companies Act) came into effect. In terms of the Companies Act, companies were granted a two-year period to amend their constitutional documents (previously referred to as the Memorandum and Articles of Association, but known under the Companies Act as a Memorandum of Incorporation (MoI)), in order to harmonise such constitutional documents with the Companies Act or adopt a new MoI. At a general meeting held on 27 March 2013, shareholders voted to adopt a new MoI for AngloGold Ashanti. The MoI was subsequently amended by special resolutions of shareholders passed at annual general meetings held on 14 May 2014, 6 May 2015, 4 May 2016 and 16 May 2017.
The 2017 amendments were to ensure compliance with the JSE Limited’s listings requirements and the Companies Act, and to align the MoI with company practice and good corporate governance.
At the annual general meeting to be held on 16 May 2018, AngloGold Ashanti will not seek approval from shareholders to make any changes to the MoI.
REGISTRATION
AngloGold Ashanti is incorporated under the laws of the Republic of South Africa and registered with the Companies and Intellectual Property Commission under registration number 1944/017354/06. The Companies Act has abolished the requirement for specific “object and purpose” provisions to be included in an MoI and although the new MoI is now silent on the matter, the company continues to carry on as its main business, gold exploration, the mining and production of gold, the manufacturing, marketing and selling of gold products and the development of markets for gold.
AngloGold Ashanti’s MoI is available for inspection as set out in “Item 10H: Documents on Display” and a summary of pertinent provisions, including rights of the holders of shares in AngloGold Ashanti, are set out below.
This summary does not contain all the information pertaining to the rights of holders of AngloGold Ashanti’s ordinary shares and is qualified in its entirety by reference to the laws of South Africa and AngloGold Ashanti’s governing corporate documents. As well as being governed by the provisions of the MoI, the rights of holders of AngloGold Ashanti’s ordinary shares are governed by the JSE Listings Requirements, the Companies Act and the Companies Regulations, 2011, promulgated under the Companies Act (Regulations), which include the Takeover Regulations. Further, the rights of holders of AngloGold Ashanti ADSs are governed by the Deposit Agreement between AngloGold Ashanti and The Bank of New York Mellon. See “Item 10C: Material Contracts-The Deposit Agreement”.
The Companies Act provides that shares will no longer have a par or nominal value and hence no new shares having a nominal or par value may be authorised. However, any shares which have a nominal or par value authorised prior to the effective date of the Companies Act continue to have that nominal or par value and can be issued as such for so long as there are par value shares in the company’s authorised share capital.
DIRECTORS
The management and control of any business of AngloGold Ashanti is vested in the board of directors (board). The authority of the board to manage and direct the business and affairs of the company is not limited, restricted or qualified by the MoI.
Appointment and Retirement of Directors
The shareholders of the company have the power to elect the directors, and shareholders are also entitled to elect one or more alternate directors, in accordance with the provisions of the MoI.
The board of directors may appoint any person who satisfies the requirements for election as a director to fill any vacancy and serve as a director on a temporary basis until the vacancy is filled by election by shareholders entitled to exercise voting rights in such an election.
The MoI authorises the chairman of the board, subject to the written approval of the majority of the directors, to appoint any person as a director provided that such appointment is approved by shareholders at the next shareholders’ meeting or annual general meeting.
At every annual general meeting one-third of the directors will retire by rotation, or if their number is not a multiple of three, then the number nearest to but not less than one third. The directors so to retire at every annual general meeting will be those who have been the longest in office since their last election. Directors retiring by rotation are eligible for re-election. Directors who voluntarily decide not to make themselves available for re-election may be counted towards the one-third of directors required to retire at the relevant annual general meeting.
The MoI contains no provision for directors to hold qualification shares. The MoI does not impose an age limit for the retirement of directors.
228
Remuneration
In accordance with the Companies Act, the MoI provides that the directors are entitled to such remuneration for their services as directors as AngloGold Ashanti’s shareholders may approve by special resolution in a general meeting or annual general meeting within the previous two years of the date of payment of such remuneration. If a director is employed in any other capacity, or holds an executive office or performs services that, in the opinion of the board, are outside the scope of the ordinary duties of a director, he may be paid such additional remuneration as a disinterested quorum of directors may reasonably determine.
Interests of Directors and Restriction on Voting
Although the interests of directors are not dealt with in the MoI, the provisions of the Companies Act in this regard are unalterable and will automatically apply, together with the applicable common law. Under the Companies Act, the procedures to deal with the personal financial interests of directors also apply to prescribed officers (i.e. persons who exercise general executive control over and management of the whole, or a significant portion, of the business and activities of the company or regularly participate to a material degree in the exercise of general executive control over and management of the whole, or a significant portion, of the business and activities of the company, irrespective of the office held or function performed by such persons) and any person who is a member of a committee of the board of the company, whether or not that person is also a member of the company’s board. The Companies Act provides that a director or such other person with a personal financial interest must disclose this to the board and cannot vote on or, after having made the disclosures to the meeting as prescribed by the Companies Act, remain present during the meeting when the matter in which he has interest is being discussed but will be counted as present for the purposes of a quorum.
Share Rights, Preferences and Restrictions
Allotment and Issue of Ordinary Shares
Subject to the JSE Listings Requirements, the Companies Act and/or with approval of shareholders in general meeting, unissued ordinary shares must be offered to existing ordinary shareholders, pro rata to their shareholdings, unless they are issued for the acquisition of assets. The shareholders in general meeting may authorise the AngloGold Ashanti board to issue any unissued ordinary shares.
Dividends, Rights and Distributions
The ordinary shares participate fully in all dividends, other distributions and entitlements as and when declared by AngloGold Ashanti in respect of fully paid ordinary shares. Under South African law, AngloGold Ashanti may declare and pay dividends, subject to the company satisfying the solvency and liquidity test as provided by the Companies Act and the board passing a resolution acknowledging that such test has been applied and has reasonably concluded that the company would satisfy such test immediately after completing the distribution. Dividends are payable to shareholders registered at a record date after the date of declaration of the dividend.
Although not stated in the MoI, dividends may be declared in any currency at the discretion of the board. In the past, dividends have been declared in and paid in South African rands, and also paid in Australian dollars, Ghanaian cedis or United Kingdom pounds. Registered holders of AngloGold Ashanti ADSs are paid dividends in US dollars by The Bank of New York Mellon as depositary, in accordance with the Deposit Agreement. See “Item 10C: Material Contracts - The Deposit Agreement”.
The holder of the B preference shares is entitled to an annual dividend amounting to the lesser of five percent of the issue price of the B preference shares, or an amount equivalent to the balance of the after-tax profits from income derived from mining the Moab Lease Area (which is part of the Vaal River operations in South Africa) as determined by the directors in each financial year. This annual dividend is a first charge on any profit available for distribution from the Moab Lease Area. The annual dividend is not payable from any of AngloGold Ashanti’s other profits.
The holder of the A preference shares is entitled to an annual dividend equivalent to the balance of the after-tax profits from income derived from mining the Moab Lease Area as determined by AngloGold Ashanti’s directors in each financial year, only once the annual dividend on the B preference shares has been paid in full.
Although not stated in the MoI, but subject to the JSE Listings Requirements, any dividend may be paid and satisfied, either wholly or in part, by the distribution of specific assets, or in paid-up securities of AngloGold Ashanti or of any other company, or in cash, or in any one or more of such ways as the directors may at the time of declaring the dividend determine and direct.
All dividends remaining unclaimed for a period of not less than three years from the date on which they became payable, may, by a resolution of the directors, become forfeited for the benefit of the company.
229
Voting Rights
Each ordinary share confers the right to vote at all general meetings. Each holder present in person or by proxy or, in the case of a corporate entity, represented, has one vote on a show of hands. If a poll is held, holders present or any duly appointed proxy will have one vote for each ordinary share held. A holder of ordinary shares is entitled to appoint a proxy to attend, speak and vote at any meeting on his or her behalf and the proxy need not be a shareholder. Holders of ADSs are not entitled to vote in person at meetings, but may vote by way of proxy through The Bank of New York Mellon as the ADS issuer. Holders of CDIs and GhDSs are not entitled to vote in person or by proxy at meetings, but may vote by instructing Chess Depository Nominees and NTHC Limited as depositary, respectively, how to vote their shares.
There are no limitations on the right of non-South African registered shareholders to hold or exercise voting rights attaching to any of the ordinary shares.
The A redeemable preference shares have similar voting rights to those of ordinary shares.
The B and C redeemable preference shares have voting rights only in the event that a dividend on this class of share has not been paid and remains unpaid for six months or more, or in connection with resolutions directly affecting these preference shares or in limited circumstances affecting AngloGold Ashanti as a whole, such as disposal of substantially all of the company’s assets, winding up AngloGold Ashanti or reducing the company’s share capital.
At any meeting of AngloGold Ashanti at which the holders of the ordinary shares, A redeemable preference shares, B redeemable preference shares and C redeemable preference shares are present and entitled to vote on a poll, each holder of the A redeemable preference shares shall be entitled to 50 votes for every A redeemable preference share held, each holder of the ordinary shares is entitled to 50 votes for every ordinary share held and each holder of the B redeemable preference shares and the C redeemable preference shares is entitled to one vote for every B redeemable preference share and C redeemable preference share held respectively.
The MoI specifies that the rights relating to any class of shares may be modified or abrogated with the sanction of a resolution passed as if it were a special resolution of the holders of shares in that class at a separate general meeting. The MoI also specifies that the holders of the A, B and C preference shares may provide written consents to the modification of their rights.
Increase and Reduction of Capital
The company is authorised to issue the shares specified in the MoI and all such shares are required to be issued as fully paid up in accordance with the applicable approval and/or other requirements of the JSE Listings Requirements.
The directors are authorised, subject to any requirements of the JSE Listings Requirements and the MoI, to increase or decrease the number of authorised shares of any class of shares, reclassify any shares that have been authorised but not issued, classify any unclassified shares that have been authorised but not issued, and determine the preferences, rights, limitations or other terms of any class of authorised shares or amend any preferences, rights, limitations or other terms as determined. However, such capital amendments require an amendment to the MoI and the JSE Listings Requirements currently does not allow the MoI to be amended to give effect to such capital amendments without the approval of ordinary shareholders by special resolution.
Rights Upon Liquidation
In the event of the winding up of AngloGold Ashanti:
|
•
|
The A preference shares shall confer the right, on a winding-up of the company, in priority to any payment in respect of the Ordinary Shares in the capital of the company then issued, but after any payment in respect of the B preference shares and the C preference shares in the capital of the company then issued, to receive only so much of the net proceeds from the disposal of the assets relating to the Moab Lease Area as is then available for distribution;
|
|
•
|
The B preference shares shall confer the right, on a winding-up of the company in priority to any payment in respect of the Ordinary Shares, the A preference shares and the C preference shares then in issue, to receive only so much of the net proceeds from the disposal of the assets relating to the Moab Lease Area as is available for distribution but not exceeding a return per B preference share of the capital paid-up thereon and any share premium paid on the issue of the B preference shares outstanding at that time;
|
|
•
|
The C preference shares shall confer the right, on a winding-up of the company, ranking after and following payment of the holders of the B preference shares, but in priority to any payment in respect of the Ordinary Shares and the A preference shares in the capital of the company then issued, to receive only so much of the net proceeds from the disposal of the assets relating to the Moab Lease Area as is available for distribution but not exceeding a return per C preference share of the capital paid-up on the issue of the C preference shares outstanding at that time;
|
|
•
|
The A, B and C preference shares shall not be entitled to any participation, on a winding-up, in any of the surplus funds of the company in any other manner arising; and
|
|
•
|
the ordinary shares confer the right to participate equally in any surplus arising from the liquidation of all other assets of AngloGold Ashanti.
|
230
Redemption Provisions
The A redeemable preference shares may be redeemed for their nominal value, plus a premium per share of an amount equal to the net proceeds available from the disposal of the assets relating to the Moab Lease Area, after redemption in full of the B preference shares and payment of the nominal value of the A preference shares, divided by 2,000,000.
The B redeemable preference shares may be redeemed for their nominal value, plus a premium of up to R249.99 per share, but limited to an amount equal to the net proceeds available from the disposal of the assets relating to the Moab Lease Area after payment of the nominal value of the B preference shares.
Shareholders’ meetings
The directors may convene meetings of AngloGold Ashanti shareholders. Subject to the provisions of the Companies Act, the shareholders may requisition for the convening of a meeting.
Notice of each AngloGold Ashanti annual general meeting and general meeting of AngloGold Ashanti shareholders must be delivered at least 15 business days before that shareholders’ meeting is to begin. In accordance with the Companies Act, business days are calculated by excluding the first day, including the last day and excluding Saturdays, Sundays and any public holiday in the Republic of South Africa. In terms of the MoI, all shareholders are entitled to attend shareholders’ meetings.
In the case of a class meeting of the A or B preference shares, the sole holder of such shares shall constitute a quorum. Save as aforesaid, the quorum of a shareholders’ meeting to begin is sufficient persons present, in person or by proxy, at the meeting to exercise, in aggregate, at least 25 percent of all of the voting rights that are entitled to be exercised in respect of at least one matter to be decided at the meeting and a quorum must remain present for the continuation of that shareholders meeting, provided that at least three shareholders must be present at the meeting. Such quorum requirement also applies for the consideration of any matter to be decided at the meeting. If the meeting is not quorate within 30 minutes after the appointed time for the meeting to begin (or such longer or shorter period as the chairperson may determine), it will be postponed, without motion, vote or further notice, for 1 week and the shareholders present, in person or by proxy, at the postponed meeting will constitute a quorum. For an ordinary resolution to be approved by shareholders, it must be supported by more than 50 percent of the voting rights exercised on the resolution. For a special resolution to be approved by shareholders, it must be supported by at least 75 percent of the voting rights exercised on the resolution.
Disclosure of Interest in Shares
Under South African law, a person must notify AngloGold Ashanti within three business days after that person acquires a beneficial interest in sufficient securities of a class issued by AngloGold Ashanti such that, as a result of the acquisition, the person holds a beneficial interest in securities amounting to five percent, 10 percent, 15 percent or any further whole multiple of five percent of the issued securities of that class or disposes of any beneficial interest in sufficient securities of a class issued by AngloGold Ashanti such that the result of the disposition the person no longer holds a beneficial interest in securities amounting to a particular multiple of five percent of issued securities of that class. When AngloGold Ashanti has received the notice referred to above it must file a copy with the Takeover Regulation Panel and report the information to holders of the relevant class of securities unless the notice concerned a disposition of less than one percent of the class of securities.
If the securities of AngloGold Ashanti are registered in the name of a person who is not the holder of the beneficial interest in all of the securities in AngloGold Ashanti held by that person, that registered holder of the securities must disclose the identity of the person on whose behalf that security is held and the identity of each person with a beneficial interest in securities so held, the number and the class of securities held for each such person with a beneficial interest and the extent of each such beneficial interest. This information must be disclosed in writing to the company within five business days after the end of every month during which a change has occurred in the information or more promptly or frequently to the extent so provided by the requirements of a Central Securities Depository. A company that knows or has reasonable cause to believe that any of its securities are held by one person for the beneficial interest of another may by notice in writing require either of those persons to confirm or deny that fact, provide particulars of the extent of the beneficial interest held during the three years preceding the date of the notice and disclose the identity of each person with a beneficial interest in the securities held by that person, which information must be provided within 10 business days of the receipt of the notice.
AngloGold Ashanti is obligated to establish and maintain a register of the disclosures described above and to publish in its annual financial statements a list of the persons who hold beneficial interests equal to or in excess of five percent of the total number of ordinary shares issued by AngloGold Ashanti together with the extent of those beneficial interests.
Rights of Minority Shareholders
Majority shareholders of South African companies have no fiduciary obligations under South African common law to minority shareholders. However, under the Companies Act, a shareholder or director may, under certain circumstances, seek relief from the court if he has been unfairly prejudiced by any act or omission of the company or a related person, by the conduct of the business
231
of the company or a related person in a particular manner, the exercise of the powers of the directors of the company or a related person in a particular manner. There may also be personal and derivative actions available to a shareholder of a company.
Pursuant to the Companies Act, a shareholder may petition a South African court for relief from the actions or omissions or, business conduct of the company or the actions of the company’s directors or officers that is oppressive or unfairly prejudicial to, or unfairly disregards the interest of the shareholder. In addition, a shareholder who voted against a resolution to amend the company’s MoI, or to approve a fundamental transaction, (and complied with other requirements set out in the Companies Act) may exercise its appraisal right to demand that the company pay to it the fair value for all the shares of the company held by that shareholder.
Description of ADSs
The Bank of New York Mellon issues AngloGold Ashanti’s American Depositary Shares, or ADSs. Please see “Item 10C: Material Contracts”.
232
10C.
MATERIAL CONTRACTS
Revolving Credit Facilities
General
On 17 July 2014, AngloGold Ashanti Holdings plc and AngloGold Ashanti USA Incorporated, as borrowers, entered into a credit agreement (the US$ Revolving Credit Agreement) with The Bank of Nova Scotia, as facility agent, and certain financial institutions party thereto as lenders. The US$ Revolving Credit Agreement provides for a $1.0 billion revolving credit facility (the US$ Revolving Credit Facility) available for drawing in US dollars. As of 19 March 2018, we have drawn $65 million under the US$ Revolving Credit Facility.
On 25 July 2014, AngloGold Ashanti Australia Limited entered into a credit agreement (the A$ Revolving Credit Agreement), as borrower with Commonwealth Bank of Australia, as facility agent, and certain financial institutions party thereto as lenders. The A$ Revolving Credit Agreement provides for a A$0.5 billion revolving credit facility (the A$ Revolving Credit Facility) available for drawing in Australian dollars. As of 19 March 2018, we have drawn A$195 million under the A$ Revolving Credit Facility.
On 7 July 2015, AngloGold Ashanti Limited entered into a credit agreement, as borrower with Nedbank Limited as facility agent, who in conjunction with ABSA Bank Limited constitute the lenders. The ZAR Revolving Credit Agreement provides for ZAR1.4 billion revolving credit facility available for drawing in South African Rands. As of 19 March 2018, ZAR400m was drawn under this ZAR Revolving Credit Facility.
On 3 November 2017, the group entered into a new three-year unsecured revolving credit facility of R1bn ($81m) with Standard Bank. The agreement includes an option, on application, to extend the facility by a maximum of two years. As of 19 March 2018, the ZAR Revolving Credit Facility is undrawn.
On 3 December 2017, the group entered into a three-year unsecured syndicated revolving credit facility of R2.5bn ($202m) with Nedbank and ABSA Bank, replacing an existing ZAR1.5bn revolving credit facility. The agreement includes an option, on application, to extend the facility by a maximum of two years. As of 19 March 2018, the ZAR Revolving Credit Facility is undrawn.
Guarantees
The US$ Revolving Credit Facility is guaranteed by AngloGold Ashanti Limited, AngloGold Ashanti Holdings plc and AngloGold Ashanti USA Incorporated. The obligations of AngloGold Ashanti USA Incorporated, in its capacity as a guarantor, are subject to certain limitations set forth in the US$ Revolving Credit Agreement in order to comply with applicable U.S. laws. The guarantees constitute unconditional obligations of the guarantors and rank at least
pari passu
with all other future unsecured obligations of the guarantors, except for obligations mandatorily preferred by law.
The A$ Revolving Credit Facility is guaranteed by AngloGold Ashanti Limited and AngloGold Ashanti Holdings plc. The guarantees constitute unconditional obligations of the guarantors and rank at least pari passu with all other future unsecured obligations of the guarantors, except for obligations mandatorily preferred by law.
Security
The obligations under all the Revolving Credit Agreements are unsecured.
Amount and repayment of borrowings
Loans under the US$ Revolving Credit Facility must be for a minimum of $10 million (or for the balance of the undrawn total commitments at the time of the drawing), and no more than 14 loans may be outstanding at any time. Each loan must be repaid on the last day of the loan’s interest period, which can be a period of one, two, three or six months or any other period agreed by AngloGold Ashanti Holdings plc, in its capacity as obligors’ agent, and the lenders. All loans must be repaid in full on the final maturity date. The final maturity date is17 July 2019.
Loans under the A$ Revolving Credit Facility must be for a minimum of A$10 million (or for the balance of the undrawn total commitments at the time of the drawing), and no more than 10 loans may be outstanding at any time. Each loan must be repaid on the last day of the loan’s interest period, which can be a period of one, two, three or six months or any other period agreed by AngloGold Ashanti Australia Limited. All loans must be repaid in full on the final maturity date. The final maturity date is 25 July 2019.
Loans under the ZAR Revolving Credit Facility must be for a minimum of ZAR 100 million (or for the balance of the undrawn total commitments at the time of the drawing), and no more than 14 loans may be outstanding at any time. Each loan must be repaid on the last day of the loan’s interest period, which can be a period of one, two, three or six months or any other period agreed by AngloGold Ashanti Limited. All loans must be repaid in full on the final maturity date.
Interest rates and fees
233
The annual interest rate on loans drawn under the US$ Revolving Credit Facility is calculated based on LIBOR, plus a margin that varies between 0.95 percent and 2.20 percent per annum depending on the long-term debt rating of AngloGold Ashanti Limited, and certain mandatory costs. Interest on loans is payable on the last day of the loan’s interest period and, if the interest period exceeds six months, on the dates falling at six month intervals after the day the loan was made.
The annual interest rate on loans drawn under the A$ Revolving Credit Facility is calculated based on BBSY, plus a margin that varies between 1.50 percent and 2.50 percent per annum depending on the long-term debt rating of AngloGold Ashanti Limited, and certain mandatory costs. Interest on loans is payable on the last day of the loan’s interest period and, if the interest period exceeds six months, on the dates falling at six month intervals after the day the loan was made.
The annual interest rates on loans drawn under the ZAR Revolving Credit Facilities are calculated based on JIBAR, plus margins ranging from 1.30 to 1.80 percent per annum and certain mandatory costs. Interest on loans is payable on the last day of the loan’s interest period and, if the interest period exceeds six months, on the dates falling at six month intervals after the day the loan was made.
The borrowers under the US$ Revolving Credit Facility are required to pay a commitment fee equal to 35 percent of the then applicable margin per annum on the undrawn and uncancelled amount of each lender’s commitment during the commitment period. The borrowers are also required to pay a utilisation fee of 0.15 percent per annum (if the aggregate outstanding loans are less than one third of the total commitments then in effect), 0.30 percent per annum (if the aggregate outstanding loans are equal to or greater than one third but less than two thirds of the total commitments then in effect) or 0.45 percent per annum (if the aggregate outstanding loans are equal to or greater than two thirds of the total commitments then in effect).
The borrower under the A$ Revolving Credit Facility is required to pay a commitment fee equal to 50 percent of the then applicable margin per annum on the undrawn and uncancelled amount of each lender’s commitment during the commitment period.
The borrower under the ZAR Revolving Credit Facilities is required to pay commitment fees of between 0.45 percent and 0.60 percent of the undrawn and uncancelled amount of each lender’s commitment during the commitment period under the respective facilities. The borrower is also required to pay a utilisation fee of between 0.15 percent and 0.20 percent per annum (if the aggregate outstanding loans are less than one third of the total commitments then in effect), between 0.30 percent and 0.40 percent per annum (if the aggregate outstanding loans are equal to or greater than one third but less than two thirds of the total commitments then in effect) or between 0.45 percent and 0.60 percent per annum (if the aggregate outstanding loans are equal to or greater than two thirds of the total commitments then in effect).
Financial covenant applicable to all Revolving Credit Facilities (RCF)
The Revolving Credit Agreements include a financial maintenance covenant which requires that the ratio of Total Net Financial Indebtedness to EBITDA (as such terms are defined in the Revolving Credit Agreements) does not at any time exceed 3.50 to 1.00, with the proviso that this ratio may exceed 3.50 to 1.00 once during the life of the Revolving Credit Agreement, for one six-month period subject to certain criteria. Refer Item 18: note 35 “Capital Management” for the formulae used in terms of the RCF’s to test compliance with the covenants.
Change of control
If a lender so requires, the commitment of such lender under a Revolving Credit Agreement will be cancelled and the participation of such lender in all outstanding loans, together with accrued interest and all other amounts accrued, will become immediately due and payable in case any person or group of persons acting in concert becomes (directly or indirectly) the beneficial owner of more than 50 percent of the issued share capital of AngloGold Ashanti Limited.
Undertakings applicable to all Revolving Credit Agreements
The Revolving Credit Agreements contain negative pledge covenants, including restrictions on the granting of security, a change of business of AngloGold Ashanti Limited and its subsidiaries, acquisitions or participations in joint ventures and mergers and disposals.
The Revolving Credit Agreements also contain, among others, the following affirmative covenants: mandatory periodic reporting of financial and other information, notice upon the occurrence of events of default and certain other events, compliance with environmental laws, and other obligations requiring each of AngloGold Ashanti Limited and its subsidiaries to maintain its corporate existence and qualifications to conduct its business as currently conducted in all applicable jurisdictions and to maintain insurance coverage.
The covenants are subject to exceptions and materiality thresholds.
Events of default applicable to all Revolving Credit Agreements
234
The Revolving Credit Agreements contain events of default including failure to make payment of amounts due, breach of obligations under the loan documents, defaults under other agreements evidencing indebtedness, certain bankruptcy events and a cessation of business, failure of any of the borrowers to be a wholly-owned subsidiary of AngloGold Ashanti Limited and the occurrence of a material adverse change in the business and financial condition of the borrowers and guarantors under the Revolving Credit Agreements, or AngloGold Ashanti and its subsidiaries as a whole, or in the ability of the borrowers and guarantors to perform their payment obligations under the loan documents. The occurrence of an event of default could result in the immediate and automatic cancellation of all commitments and the acceleration of all payment obligations under the Revolving Credit Agreements and the other loan documents.
The above description is only a summary of certain provisions of the Revolving Credit Agreements and is qualified in its entirety by reference to the provisions of the Revolving Credit Agreements, a copy of each is attached hereto as Exhibit 19.4.4 and is incorporated herein by reference.
Notes
2013 Notes
On 30 July 2013, AngloGold Ashanti Holdings plc (AGAH) issued $1,250 million 8.500 percent Notes due 2020 (the 2013 Notes). The interest on the 2013 Notes was payable semi annually on 15 January and 15 July of each year, commencing on 15 January 2014. The offering of the 2013 Notes was registered under the Securities Act and the 2013 Notes were listed on the New York Stock Exchange. On 24 August 2015, AGAH offered to buy back up to $810 million in aggregate principal amount of the outstanding 2013 Notes. The offer was partially accepted and $779 million was settled in September 2015. The balance of the 2013 Notes was redeemed on 1 August 2016.
2012 Notes
On 30 July, 2012, AGAH, issued $750 million 5.125 percent Notes due 2022 (the 2012 Notes). The interest on the 2012 Notes is payable semi-annually on 1 February and 1 August of each year, commencing on 1 February, 2013. AGAH may on any one or more occasions redeem all or part of the 2012 Notes, at a redemption price equal to the greater of (1) 100 percent of the principal amount of the 2012 Notes to be redeemed and (2) the sum of the present values of the remaining scheduled payments of principal and interest on the 2012 Notes (excluding any portion of such payments of interest accrued or unpaid as of the date of redemption) discounted to the redemption date on a semiannual basis (assuming a 360-day year consisting of twelve 30-day months) at the treasury rate, plus 50 basis points, plus accrued and unpaid interest, if any, to the date of redemption. AGAH has agreed to pay certain additional amounts in respect of any withholdings or deductions for certain types of taxes in certain jurisdictions on payments to holders of the 2012 Notes. The 2012 Notes are unsecured and unsubordinated and are fully and unconditionally guaranteed by AngloGold Ashanti Limited.
AGAH has agreed to observe certain covenants with respect to the 2012 Notes restricting, subject to certain limitations, the ability of AngloGold Ashanti Limited and AGAH to amalgamate, reconstruct, consolidate or merge with another company or other legal entity, and the ability of AngloGold Ashanti Limited and its restricted subsidiaries to pledge their assets to secure certain borrowings, create or incur liens on certain of their property or to engage in sale and leaseback transactions. In case of a change of control of the guarantor and a downgrade, within a specified period, of the 2012 Notes below an investment grade rating by two rating agencies, holders of the 2012 Notes have the right to require the issuer to repurchase all or any part of their 2012 Notes in cash for a value equal to 101 percent of the aggregate principal amount of 2012 Notes repurchased, plus accrued and unpaid interest, if any, on the 2012 Notes repurchased to the date of purchase.
The offering of the 2012 Notes was registered under the Securities Act. The 2012 Notes were listed on the New York Stock Exchange.
2010 Notes
On 28 April, 2010, AGAH, issued $700 million 5.375 percent Notes due 2020 and $300 million 6.500 percent Notes due 2040 (together, the 2010 Notes). The interest on the 2010 Notes is payable semi-annually on 15 April and 15 October of each year, commencing on 15 October, 2010. AGAH may on any one or more occasions redeem all or part of the 2010 Notes, at a redemption price equal to the greater of (1) 100 percent of the principal amount of the 2010 Notes to be redeemed and (2) the sum of the present values of the remaining scheduled payments of principal and interest on the 2010 Notes (excluding any portion of such payments of interest accrued or unpaid as of the date of redemption) discounted to the redemption date on a semiannual basis (assuming a 360-day year consisting of twelve 30-day months) at the treasury rate, plus 25 basis points with respect to the 2010 Notes maturing in 2020 and 30 basis points with respect to the 2010 Notes maturing in 2040, plus accrued and unpaid interest, if any, to the date of redemption. AGAH has agreed to pay certain additional amounts in respect of any withholdings or deductions for certain types of taxes in certain jurisdictions on payments to holders of the 2010 Notes. The 2010 Notes are unsecured and unsubordinated and are fully and unconditionally guaranteed by AngloGold Ashanti Limited.
AGAH has agreed to observe certain covenants with respect to the 2010 Notes restricting, subject to certain limitations, the ability of AngloGold Ashanti Limited and AGAH to amalgamate, reconstruct, consolidate or merge with another company or other legal
235
entity, and the ability of AngloGold Ashanti Limited and its restricted subsidiaries to pledge their assets to secure certain borrowings, create or incur liens on certain of their property or to engage in sale and leaseback transactions. In case of a change of control of the guarantor and a downgrade, within a specified period, of a series of 2010 Notes below an investment grade rating by two rating agencies, holders of the 2010 Notes have the right to require the issuer to repurchase all or any part of their 2010 Notes in cash for a value equal to 101 percent of the aggregate principal amount of 2010 Notes repurchased, plus accrued and unpaid interest, if any, on the 2010 Notes repurchased to the date of purchase.
The offering of the 2010 Notes was registered under the Securities Act. The 2010 Notes were listed on the New York Stock Exchange.
For further information, see “Note 25: Borrowings” to our Annual Financial Statements included in Item 18 of this Annual Report, “Item 5B.: Liquidity and Capital Resources” and “Item 19: Exhibits to Form 20-F”.
Description of AngloGold Ashanti ADSs
The Bank of New York Mellon issues AngloGold Ashanti’s American Depositary Shares, or ADSs. One ADS represents the ownership interest of one ordinary share of AngloGold Ashanti.
The Deposit Agreement
This section provides a summary description of AngloGold Ashanti’s ADSs.
AngloGold Ashanti has entered into an Amended and Restated Deposit Agreement dated 3 June 2008 with The Bank of New York Mellon as depositary and the owners and beneficial owners of American Depositary Receipts (Deposit Agreement).
The following is a summary of the material provisions of the Deposit Agreement. For more complete information, read the entire Deposit Agreement and the Form of American Depositary Receipt, which AngloGold Ashanti has filed with the SEC as an exhibit to AngloGold Ashanti’s registration statement on Form F‑6/A (File No. 333‑133049) on 27 May 2008. See “Item 10.H.: Documents On Display”. Copies of the Deposit Agreement are also available for inspection at the Corporate Trust Office of The Bank of New York Mellon currently located at 101 Barclay Street, New York, New York, 10286.
Description of the ADSs
The Bank of New York Mellon, as depositary, will register and deliver ADSs. Each ADS will represent one ordinary share (or a right to receive one share) deposited with The Standard Bank of South Africa Limited, Société Générale South Africa Limited, FirstRand Bank Limited, National Australia Bank Limited of Australia and New Zealand Banking Group Limited, each as a custodian for The Bank of New York Mellon, and all of which are referred to collectively as “the Custodian”. Each ADS will also represent any other securities, cash or other property which may be held by The Bank of New York Mellon. The Bank of New York Mellon’s Corporate Trust Office at which the ADSs will be administered is located at 101 Barclay Street, New York, New York 10286. The Bank of New York Mellon’s principal executive office is located at One Wall Street, New York, New York 10286.
ADSs may be held either (A) directly (i) by having an American Depositary Receipt, also referred to as an ADR, which is a certificate evidencing a specific number of ADSs, registered in the holder’s name, or (ii) by having ADSs registered in a holder’s name in the Direct Registration System, or (B) indirectly by holding a security entitlement in ADSs through a broker or other financial institution. If ADSs are held directly, such holders are ADS holders. This description applies to AngloGold Ashanti’s ADS holders. If ADSs are held indirectly, such holders must rely on the procedures of their broker or other financial institution to assert the rights of ADS registered holders described in this section. Such holders should consult with their broker or financial institution to find out what those procedures are.
The Direct Registration System, or DRS, is a system administered by DTC pursuant to which the depositary may register the ownership of uncertificated ADSs, which ownership will be evidenced by periodic statements sent by the depositary to the registered holders of uncertificated ADSs.
AngloGold Ashanti will not treat ADS holders as its shareholders and ADS holders do not have shareholder rights. South African law governs shareholder rights. The Bank of New York Mellon is the holder of the shares underlying the ADSs. Registered holders of ADSs have ADS holder rights. The Deposit Agreement sets out ADS holder rights as well as the rights and obligations of The Bank of New York Mellon. New York law governs the Deposit Agreement and the ADSs.
Dividends and Other Distributions
The Bank of New York Mellon has agreed to pay to holders of ADSs the cash dividends or other distributions it or a custodian receives on AngloGold Ashanti ordinary shares or other deposited securities after deducting any fees and expenses and any applicable withholding taxes. Holders of ADSs will receive these distributions in proportion to the number of AngloGold Ashanti’s ordinary shares that their ADSs represent.
Cash
236
The Bank of New York Mellon will convert any cash dividend or other cash distribution (in South African rands) that AngloGold Ashanti pays on ordinary shares into US dollars (unless AngloGold Ashanti pays such dividend or cash distribution in US dollars) and distribute to registered holders of ADSs. If that is no longer possible or if any approval from any government is needed and cannot be obtained, The Bank of New York Mellon may distribute non-US currency only to those ADS holders to whom it is possible to make this type of distribution.
The Bank of New York Mellon may hold the non-US currency it cannot convert for the account of holders of ADSs who for one reason or the other have not been paid. It will not invest the non-US currency, and it will not be liable for interest on such amounts. Before making a distribution, any withholding taxes that must be paid will be deducted. See “Payment of Taxes” below. The Bank of New York Mellon will distribute only whole US dollars and cents and will round fractional cents to the nearest whole cent. If the exchange rates fluctuate during a time when The Bank of New York Mellon cannot convert the non-US currency, holders of ADSs may lose some or all of the value of the distribution.
Ordinary Shares
The Bank of New York Mellon may distribute to holders of ADSs additional ADSs representing ordinary shares that AngloGold Ashanti distributes as a dividend or free distribution, if AngloGold Ashanti provides such distribution promptly with satisfactory evidence that it is legal to do so. If The Bank of New York Mellon does not distribute additional ADSs, the outstanding ADSs will also represent the newly distributed AngloGold Ashanti ordinary shares. The Bank of New York Mellon will only distribute whole ADSs. It will sell AngloGold Ashanti ordinary shares that would require it to deliver a fraction of an ADS and distribute the net proceeds in the same way as it distributes cash. The Bank of New York Mellon may sell a portion of the distributed shares sufficient to pay its fees and expenses in connection with that distribution.
Rights to Subscribe for Additional Ordinary Shares
If AngloGold Ashanti offers holders of its ordinary shares any rights to subscribe for additional AngloGold Ashanti ordinary shares or any other rights, The Bank of New York Mellon, after consultation with AngloGold Ashanti, may make these rights available to holders of ADSs or sell the rights and distribute the proceeds in the same way as it distributes cash. If The Bank of New York Mellon cannot do either of these things for any reason, it may allow these rights to lapse. In that case, holders of ADSs will receive no value for them.
If The Bank of New York Mellon makes these types of subscription rights available to holders of ADSs, upon instruction from holders of ADSs, it will exercise the rights and purchase AngloGold Ashanti’s ordinary shares on their behalf. The Bank of New York Mellon will then deposit the AngloGold Ashanti ordinary shares and deliver ADSs to the holders of ADSs. It will only exercise these rights if holders of ADSs pay it the exercise price and any other charges the rights require them to pay.
US securities laws may restrict the sale, deposit, cancellation and transfer of the ADSs issued after the exercise of rights. For example, holders of ADSs may not be able to trade the ADSs freely in the United States. In this case, The Bank of New York Mellon may deliver ADSs which are "restricted securities" within the meaning of Rule 144 which will have the same provisions as the ADSs described here, except for the changes needed to put the restrictions in place.
Other Distributions
The Bank of New York Mellon will send to holders of ADSs any other distributions that AngloGold Ashanti makes on deposited securities by any means it thinks is legal, fair and practical. If it cannot make the distribution in that way, The Bank of New York Mellon may decide to sell what AngloGold Ashanti distributes, and then distribute the net proceeds in the same way as it distributes cash, or it may decide to hold what AngloGold Ashanti distributes, in which case the outstanding ADSs will also represent the newly distributed property. However, The Bank of New York Mellon is not required to distribute any securities (other than ADSs) to ADS holders unless it receives satisfactory evidence from AngloGold Ashanti that it is legal to make that distribution. The Bank of New York Mellon may sell a portion of the distributed securities or property sufficient to pay its fees and expenses in connection with that distribution.
The Bank of New York Mellon is not responsible if, based on available information, it decides that it is unlawful or impractical to make a distribution available to any ADS holders. AngloGold Ashanti has no obligation to register ADSs, AngloGold Ashanti ordinary shares, rights or other securities under the US Securities Act of 1933. AngloGold Ashanti also has no obligation to take any other action to permit the distribution of ADSs, AngloGold Ashanti ordinary shares, or any other rights to ADS holders. This means that the holders of ADSs may not receive the distribution AngloGold Ashanti makes on its ordinary shares or any value for them if it is illegal or impractical for AngloGold Ashanti to make them available to the holders of ADSs.
Deposit, Withdrawal and Cancellation
237
The Bank of New York Mellon will deliver ADSs if a holder of AngloGold Ashanti’s ordinary shares or their broker deposits AngloGold Ashanti’s ordinary shares or evidence of rights to receive ordinary shares with the Custodian. Upon payment of its fees and expenses and of any taxes or charges, such as stamp taxes or stock transfer taxes or fees, The Bank of New York Mellon will register the appropriate number of ADSs in the names such holder of AngloGold Ashanti ordinary shares requests and will deliver the ADSs at its Corporate Trust office to the persons such holders request.
Holders of ADSs may turn in their ADSs at The Bank of New York Mellon’s Corporate Trust Office. Upon payment of its fees and expenses and of any taxes or charges, such as stamp taxes or stock transfer taxes or fees, The Bank of New York Mellon will deliver (1) the underlying ordinary shares to an account designated by the relevant holder of ADSs and (2) any other deposited securities underlying the ADSs at the office of the Custodian, or, at the request, risk and expense of ADS holders, The Bank of New York Mellon will deliver the deposited securities at its Corporate Trust Office.
Interchange Between Certificated ADSs and Uncertificated ADSs
ADS registered holders may surrender their ADS to The Bank of New York Mellon for the purpose of exchanging such ADS for uncertificated ADSs. The Bank of New York Mellon will cancel that ADS and will send to the ADS registered holder a statement confirming that the ADS registered holder is the registered holder of uncertificated ADSs. Alternatively, upon receipt by The Bank of New York Mellon of a proper instruction from a registered holder of uncertificated ADSs requesting the exchange of uncertificated ADSs for certificated ADSs, The Bank of New York Mellon will execute and deliver to the ADS registered holder an ADS evidencing those ADSs.
Voting Rights
ADS registered holders may instruct The Bank of New York Mellon to vote the number of deposited shares their ADSs represent. The Bank of New York Mellon will notify ADS registered holders of shareholders’ meetings and arrange to deliver AngloGold Ashanti’s voting materials to them if AngloGold Ashanti asks it to. Those materials will describe the matters to be voted on and explain how ADS registered holders may instruct The Bank of New York Mellon how to vote. For instructions to be valid, they must reach The Bank of New York Mellon by a date set by The Bank of New York Mellon.
Otherwise, ADS registered holders will not be able to exercise their right to vote unless they withdraw the shares. However, ADS registered holders may not know about the meeting sufficiently in advance to withdraw the shares.
The Bank of New York Mellon will try, as far as practical, to vote or to have its agents vote the ordinary shares or other deposited securities as holders of ADSs instruct, but this is subject to South African law, the provisions of AngloGold Ashanti’s MoI and of the deposited securities and any applicable rule of the JSE. The Bank of New York Mellon will only vote or attempt to vote as such holders of ADSs instruct.
AngloGold Ashanti cannot assure the holders of ADSs that they will receive the voting materials in time for them to instruct The Bank of New York Mellon to vote their ordinary shares. In addition, The Bank of New York Mellon and its agents are not responsible for failing to carry out voting instructions or for the manner of carrying out voting instructions. This means that holders of ADSs may not be able to exercise their right to vote and there may be nothing they can do if their ordinary shares are not voted as they requested.
238
Fees and expenses
|
ADS holders must pay:
|
For:
|
|
$5.00 (or less) per 100 ADSs
|
Each issuance of an ADS, including as a result of a distribution of AngloGold Ashanti ordinary shares or rights or other property
Each cancellation of an ADS, including if the Deposit Agreement terminates
|
|
$0.02 (or less) per ADS
|
Any cash payment
|
|
Registration or transfer fees
|
Transfer and registration of AngloGold Ashanti ordinary shares on the AngloGold Ashanti share register to or from the name of The Bank of New York Mellon or its agent when AngloGold Ashanti ordinary shares are deposited or withdrawn
|
|
$0.02 (or less) per ADS per year
|
Depositary services
|
|
Expenses of The Bank of New York Mellon
|
Conversion of non-US currency to US dollars
Cable, telex and facsimile transmission expenses
Servicing the deposited securities
|
|
Taxes and other governmental charges that The Bank of New York Mellon or any custodian has to pay on any ADS or AngloGold Ashanti ordinary share underlying an ADS, for example, stock transfer taxes, stamp duty or withholding taxes
|
As necessary
|
|
A fee equivalent to the fee that would have been payable if the securities distributed had been ordinary shares deposited for issuance of ADSs
|
Distribution of securities distributed to holders of deposited securities that are distributed by The Bank of New York Mellon to ADS holders
|
Payment of Taxes
Holders of ADSs will be responsible for any taxes or other governmental charges payable on their ADSs or on the deposited securities underlying their ADSs. The Bank of New York Mellon may refuse to transfer their ADSs or allow them to withdraw the deposited securities underlying their ADSs until such taxes or other charges are paid. It may apply payments owed to holders of ADSs or sell deposited securities underlying their ADSs to pay any taxes they owe, and they will remain liable for any deficiency. If the Bank of New York sells deposited securities, it will, if appropriate, reduce the number of ADSs to reflect the sale and pay to holders of ADSs any proceeds, or send to them any property remaining after it has paid the taxes.
Reclassifications
|
If AngloGold Ashanti:
|
Then:
|
||
|
Reclassifies, splits up or consolidates any of the deposited securities;
|
The cash, ordinary shares or other securities received by The Bank of New York Mellon will become deposited securities. Each ADS will automatically represent its equal share of the new deposited securities.
|
||
|
Distributes securities on the ordinary shares that are not distributed to holders of ADSs; or
Recapitalises, reorganises, merges, liquidates, sells all or substantially all of AngloGold Ashanti’s assets, or takes any similar action.
|
The Bank of New York Mellon may, and will if AngloGold Ashanti asks it to, distribute some or all of the cash, AngloGold Ashanti ordinary shares or other securities it receives. It may also issue new ADSs or ask holders of ADSs to surrender their outstanding ADSs in exchange for new ADSs identifying the new deposited securities.
|
||
Amendment and Termination
AngloGold Ashanti may, for any reason, agree with The Bank of New York Mellon to amend the Deposit Agreement and the ADSs without the consent of holders. If the amendment increases fees or charges (except for taxes and other governmental charges or registration fees, cable, telex or facsimile transmission costs, delivery costs or other such expenses) or if the amendment prejudices an important right of ADS holders, it will only become effective 30 days after The Bank of New York Mellon notifies holders of ADSs of the amendment. At the time an amendment becomes effective, holders of ADSs are considered, by continuing to hold their ADSs, to agree to the amendment and to be bound by the ADSs and the agreement as amended.
The Bank of New York Mellon may terminate the Deposit Agreement by mailing notice of termination to ADS holders at least 30 days prior to the date fixed in the notice if AngloGold Ashanti asks it to do so. The Bank of New York Mellon may also terminate the Deposit Agreement if The Bank of New York Mellon has told AngloGold Ashanti that it would like to resign and AngloGold Ashanti has not appointed a new depositary bank within 90 days. In both cases, The Bank of New York Mellon must notify holders of AngloGold Ashanti ADSs at least 30 days before termination.
239
After termination, The Bank of New York Mellon and its agents will be required to do only the following under the Deposit Agreement: collect distributions on the deposited securities, sell rights, and, upon surrender of ADSs, deliver AngloGold Ashanti ordinary shares and other deposited securities. Four months after the date of termination or later, The Bank of New York Mellon may sell any remaining deposited securities by public or private sale and will hold the proceeds of the sale, as well as any other cash it is holding under the Deposit Agreement, for the pro rata benefit of the ADS holders who have not surrendered their ADSs. It will not invest the money and will have no liability for interest. The Bank of New York Mellon’s only obligations will be to account for the proceeds of the sale and other cash. After termination, AngloGold Ashanti’s only obligations will be with respect to indemnification of, and payment of certain amounts to, The Bank of New York Mellon.
Limitations on Obligations and Liability to ADS Holders
The Deposit Agreement expressly limits AngloGold Ashanti’s obligations and the obligations of The Bank of New York Mellon, and limits AngloGold Ashanti’s liability and the liability of The Bank of New York Mellon. AngloGold Ashanti and The Bank of New York Mellon:
|
•
|
are only obligated to take the actions specifically set forth in the Deposit Agreement without negligence or bad faith;
|
|
•
|
are not liable if either of AngloGold Ashanti or The Bank of New York Mellon is prevented or delayed by law or circumstances beyond their control from performing their obligations under the Deposit Agreement;
|
|
•
|
are not liable if either of AngloGold Ashanti or The Bank of New York Mellon exercises discretion permitted under the Deposit Agreement;
|
|
•
|
are not liable for the inability of any holder of ADSs to benefit from any distribution on deposited securities that is not made available to holders of ADSs under the terms of the Deposit Agreement, or for any special, consequential or punitive damages for any breach of the terms of the Deposit Agreement;
|
|
•
|
have no obligation to become involved in a lawsuit or other proceeding related to the ADSs or the Deposit Agreement on behalf of the holders of ADSs or on behalf of any other party;
|
|
•
|
may rely on advice of or information from legal counsel, accountants, and any persons presenting AngloGold Ashanti’s ordinary shares for deposit, any registered holder or any other person believed by AngloGold Ashanti in good faith to be competent to give such advice or information; and
|
|
•
|
pursuant to the Deposit Agreement, AngloGold Ashanti and The Bank of New York Mellon agree to indemnify each other under certain circumstances.
|
Requirements for Depositary Action
Before The Bank of New York Mellon will issue, transfer or register the transfer of an ADS, make a distribution on an ADS, or allow withdrawal of AngloGold Ashanti ordinary shares, The Bank of New York Mellon may require:
|
•
|
payment of stock transfer or other taxes or other governmental charges and transfer or registration fees charged by third parties for the transfer of any ordinary shares or other deposited securities;
|
|
•
|
production of satisfactory proof of the identity and genuineness of any signature or other information it deems necessary; and
|
|
•
|
compliance with regulations it may establish, from time to time, consistent with the Deposit Agreement, including presentation of transfer documents.
|
The Bank of New York Mellon may refuse to deliver, transfer or register transfers of ADSs generally when the books of The Bank of New York Mellon or AngloGold Ashanti’s books are closed, or at any time if either AngloGold Ashanti or The Bank of New York Mellon thinks it advisable to do so.
Holders of ADSs have the right to cancel their ADSs and withdraw the underlying ordinary shares at any time except:
|
•
|
when temporary delays arise because: (1) either AngloGold Ashanti or The Bank of New York Mellon have closed AngloGold Ashanti’s transfer books; (2) the transfer of the ordinary shares is blocked in connection with voting at a general meeting of shareholders; or (3) AngloGold Ashanti is paying a dividend on the ordinary shares;
|
|
•
|
when ADS holders seeking to withdraw the ordinary shares are liable for unpaid fees, taxes and similar charges; or
|
|
•
|
when it is necessary to prohibit withdrawals in order to comply with any laws or governmental regulations that apply to ADSs or to the withdrawal of the ordinary shares or other deposited securities.
|
This right of withdrawal may not be limited by any other provision of the Deposit Agreement.
Pre-release of ADSs
In certain circumstances, subject to the provisions of the Deposit Agreement, The Bank of New York Mellon may deliver ADSs before deposit of the underlying ordinary shares. This is called a pre-release of the ADS.
The Bank of New York Mellon may also deliver AngloGold Ashanti ordinary shares upon cancellation of pre-released ADSs (even if the ADSs are cancelled before the pre-release transaction has been closed out). A pre-release is closed out as soon as the underlying AngloGold Ashanti ordinary shares are delivered to The Bank of New York Mellon. The Bank of New York Mellon may receive ADSs instead of ordinary shares to close out a pre-release.
240
The Bank of New York Mellon may pre-release ADSs only under the following conditions:
|
•
|
before or at the time of the pre-release, the person to whom the pre-release is being made must represent to The Bank of New York Mellon in writing that it or its customer: (a) owns the ordinary shares or ADSs to be remitted, (b) assigns all beneficial rights, title and interest in such ADSs or ordinary shares, as the case may be, to The Bank of New York Mellon in its capacity as the depositary and for the benefit of the ADS holders, and (c) will not take any action with respect to such ADSs or ordinary shares, as the case may be, that is consistent with the transfer of beneficial ownership (including, without the consent of The Bank of New York Mellon, disposing of such ADSs or ordinary shares, as the case may be) other than satisfaction of such pre-release;
|
|
•
|
the pre-release must be fully collateralized with cash, US government securities, or other collateral that The Bank of New York Mellon considers appropriate; and
|
|
•
|
the Bank of New York Mellon must be able to close out the pre-release on not more than five business days’ notice. Each pre-release will be subject to any further indemnities and credit regulations that The Bank of New York Mellon deems appropriate. The Bank of New York Mellon will normally limit the number of AngloGold Ashanti ordinary shares not deposited but represented by ADSs outstanding at any time as a result of pre-release so that they do not exceed 30 percent of the ordinary shares deposited, although The Bank of New York Mellon may disregard this limit from time to time, if it thinks it is appropriate to do so.
|
Direct Registration System
In the Deposit Agreement, all parties to the Deposit Agreement acknowledge that the DRS and Profile Modification System, or Profile, will apply to uncertificated ADSs upon acceptance thereof to DRS by The Depository Trust Company, also referred to as DTC. DRS is the system administered by DTC pursuant to which the depositary may register the ownership of uncertificated ADSs, which ownership will be evidenced by periodic statements sent by the depositary to the registered holders of uncertificated ADSs. Profile is a required feature of DRS which allows a DTC participant, claiming to act on behalf of a registered holder of ADSs, to direct the depositary to register a transfer of those ADSs to DTC or its nominee and to deliver those ADSs to the DTC account of that DTC participant without receipt by the depositary of prior authorization from the ADS registered holder to register that transfer.
In connection with and in accordance with the arrangements and procedures relating to DRS/Profile, the parties to the Deposit Agreement understand that The Bank of New York Mellon will not verify, determine or otherwise ascertain that the DTC participant which is claiming to be acting on behalf of an ADS holder in requesting registration of transfer and delivery described in the paragraph above has the actual authority to act on behalf of the ADS holder (notwithstanding any requirements under the Uniform Commercial Code). In the Deposit Agreement, the parties agree that The Bank of New York Mellon’s reliance on and compliance with instructions received by The Bank of New York Mellon through the DRS/Profile System and in accordance with the Deposit Agreement will not constitute negligence or bad faith on the part of The Bank of New York Mellon.
Shareholder Communications: Inspection of Register of Holders of ADSs
The Bank of New York Mellon will make available for inspection at its office all communications that it receives from AngloGold Ashanti as a holder of deposited securities that AngloGold Ashanti makes generally available to holders of deposited securities. The Bank of New York Mellon sends copies of those communications if requested by AngloGold Ashanti. ADS holders have a right to inspect the register of holders of ADSs, but not for the purpose of contacting those holders about a matter unrelated to AngloGold Ashanti’s business or the ADSs.
241
10D.
Exchange controls
Exchange controls and other limitations affecting security holders
The following is a general outline of South African exchange controls and such outline may not apply to former residents of South Africa. Investors should consult a professional advisor as to the exchange control implications of their particular investments.
South African law provides for exchange control regulations, which restrict the export of capital from the Common Monetary Area, which comprises South Africa, the Kingdoms of Lesotho and Swaziland and the Republic of Namibia. The exchange control regulations, which are administered by the Financial Surveillance Department of the South African Reserve Bank (SARB), are applied throughout the Common Monetary Area and regulate transactions (including capital flows into and out of the Common Monetary Area) involving South African residents, including natural persons and legal entities.
Government officials have from time to time stated their intentions to relax South Africa’s exchange control regulations when economic conditions permit such action. In his budget speech in March 1998, the then Minister of Finance first announced that restrictions relating to offshore investments by South African companies and individuals subject to South African exchange control would, to a limited extent, be lifted. Since then, the government has incrementally relaxed aspects of exchange control for South African companies and financial institutions as well as for South African individuals. However, it is impossible to predict with any certainty if and when the government will remove exchange controls in their entirety or how the controls may continue to change over time.
The comments below relate, in general, to exchange controls in place at the date of this annual report.
Investments in South African companies
A foreign investor may invest freely in ordinary shares in a South African company. Any foreign investor may also sell shares in a South African company and transfer the proceeds out of South Africa without restriction. Acquisitions of shares or assets of South African companies by non-South African purchasers are not generally subject to review and approval by the SARB when the consideration is in cash, but may require SARB review and approval in certain circumstances, including when the consideration is equity in a non-South African company or when the acquisition is financed by a loan from a South African lender.
Dividends
Dividends declared to foreign stockholders in public companies listed on the Johannesburg Stock Exchange (JSE) are not subject to the approval of the SARB. Dividends are freely transferable to foreign stockholders from both trading and non-trading profits earned in South Africa by public listed companies.
Voting rights
There are no limitations imposed by South African law, including South African exchange controls, or by the Memorandum of Incorporation of AngloGold Ashanti on the rights of non-South African shareholders to vote their ordinary shares.
Overseas financing, interest and investments
Interest on foreign loans, if paid from cash generated from operations in South Africa, may be remittable abroad, provided that the loans and the payment of the relevant interest in respect of such loans have received prior SARB approval.
AngloGold Ashanti and its South African subsidiaries require SARB approval to raise debt from and repay debt to non-residents of the Common Monetary Area, mainly in respect of the terms of repayment applicable to such loans, as well as any guarantees that may be provided in respect of such loans, by AngloGold Ashanti or its South African subsidiaries.
Debt raised outside the Common Monetary Area by AngloGold Ashanti’s non-South African subsidiaries is not restricted under South African exchange control regulations and can be used for investment outside the Common Monetary Area, subject to the relevant conditions imposed by the SARB in connection with such investment, the establishing of such a non-South African subsidiary or in raising the debt by such subsidiary. For example, AngloGold Ashanti and its South African subsidiaries would require SARB approval in order for AngloGold Ashanti and/or its South African subsidiaries to provide guarantees for the obligations of any of its non-South African subsidiaries. In addition, funds obtained from non-residents of the Common Monetary Area and debt raised outside the Common Monetary Area by AngloGold Ashanti’s non-South African subsidiaries must be repaid or serviced by AngloGold Ashanti’s foreign subsidiaries unless otherwise approved by the SARB.
A listing by a South African company on any stock exchange other than the JSE in connection with raising capital requires permission from the SARB.
Under current exchange control regulations, offshore investments by AngloGold Ashanti and its subsidiaries require the approval of the SARB. Subject to such prior approval of the SARB, there is no limit on the amount of capital that may be invested offshore.
242
10E.
Taxation
South African taxation
The following discussion summarises the South African tax consequences of the ownership and disposition of shares by South African residents or ADSs by a US holder (as defined below). This summary is based upon current South African tax law and South African Revenue Service (SARS) practice, the Convention Between the Government of the United States of America and the Republic of South Africa for the Avoidance of Double Taxation and the Prevention of Fiscal Evasion with Respect to Taxes on Income and Capital Gains, signed 17 February 1997 (Treaty), and in part upon representations of the depositary, and assumes that each obligation provided for in, or otherwise contemplated by, a Deposit Agreement and any related agreement will be performed in accordance with its respective terms.
The following summary of the South African tax considerations does not address the tax consequences to a US holder that is resident in South Africa for South African tax purposes, whose holding of shares or ADSs is effectively connected with a permanent establishment in South Africa through which such US holder carries on business activities or, in the case of an individual who performs independent personal services, with a fixed base situated therein, or who is otherwise not entitled to full benefits under the Treaty.
The statements of law set forth below are subject to any changes (which may be applied retroactively) in South African law or in the interpretation thereof by SARS, or in the Treaty, occurring after the date hereof. It should be expressly noted that South African tax law does not specifically address the treatment of ADSs. However, it is reasonable to assume (although no assurance can be made) that the tax treatment of US holders of shares is also applicable to US holders of ADSs.
Holders are strongly urged to consult their own tax advisors as to the consequences under South African, US federal, state and local, and other applicable laws, of the ownership and disposition of shares or ADSs.
Taxation of dividends
South Africa currently imposes a Dividend Withholding Tax on Companies (dividends tax) at a rate of 20 percent on the net amount of the dividend declared by a resident company, other than a Headquarter Company. This rate was increased to 20 percent on 22 February 2017 when the Minister of Finance announced the increase in the rate pertaining to the dividends paid by South African companies with effect from 1 March 2017.
The dividends tax is generally imposed on the beneficial owner. The dividends tax could be reduced to a lower rate under an applicable double tax treaty, if all requirements are met. In the case of dividends paid to a US holder with respect to shares, the Treaty would generally limit the dividends tax rate to five percent of the gross amount of the dividends if a corporate US holder holds directly at least 10 percent of the voting stock of AngloGold Ashanti. In all other cases, the maximum tax rate under the Treaty is 15 percent of the gross amount of the dividend. Even though the domestic rate is thus 20 percent, the maximum rate that is payable under the Treaty is 15 percent of the gross amount of the dividends. There are different rules to consider if the beneficial owner of the dividends is a US resident who carries on business in South Africa through a permanent establishment situated in South Africa, or performs in South Africa independent personal services from a fixed base situated in South Africa, and the dividends are attributable to such permanent establishment or fixed base. Moreover, if the dividends tax rate is reduced under the auspices of an applicable double tax treaty, there are certain South African compliance requirements that must be met in order to access the double tax treaty relief, amongst others the completion of a declaration and undertaking by the recipients in favour of the Company.
The definition of a dividend currently means any amount transferred or applied by a company that is a resident (including AngloGold Ashanti) for the benefit or on behalf of any person in respect of any share in that company, whether that amount is transferred or applied by way of a distribution made by the company, or as consideration for the acquisition of any share in that company. It specifically excludes any amount transferred or applied by the company that results in a reduction of so-called contributed tax capital (CTC), or constitutes shares in the company or constitutes an acquisition by the company of its own securities by way of a general repurchase of securities in terms of the JSE Listings Requirements. A distinction is thus made between a general repurchase of securities and a specific repurchase of securities. If the company embarks upon a general repurchase of securities, the proceeds are not deemed to be a dividend whereas, in the case of a specific repurchase of securities where the purchase price is not funded out of CTC, the proceeds are likely to constitute a dividend.
The concept of CTC effectively means the sum of the stated capital or share capital and share premium of a company that existed on 1 January 2011, excluding any transfers from reserves to the share premium account or stated capital account, plus proceeds from the issue of any new shares by a company. Any application of CTC is limited to the holders of a class of shares and specifically that a distribution of CTC attributable to a specific class must be made proportionately to the number of shares held by a shareholder in a specific class.
For dividends tax purposes a dividend is defined as any dividend as indicated above that is paid by a company that is a resident or paid by a foreign company if the share in respect of which that foreign dividend is paid is a listed share and to the extent that the foreign dividend does not constitute a distribution of an asset in kind.
243
Taxation of capital gains on sale or other disposition
South African residents are (subject to certain exemptions) taxed on their worldwide income, while non-residents are only taxed on South African sourced income (subject to the provisions of any relevant double taxation agreement).
Capital gains tax is not a separate tax to income tax; instead, a percentile of the taxpayer’s net capital gain (that is the taxable capital gain) is included in its taxable income on which it is taxed at the income tax rate.
Non-residents are only subject to the South African capital gains tax provisions in respect of the disposal of any immovable property (such as land or mining rights) or any interest or right of whatever nature to or in immovable property situated in South Africa, or any asset of a permanent establishment through which that non-resident is carrying on a trade in South Africa. In the instance of a shareholder holding shares in a South African company, the ‘interest in immovable property’ requirements are met if 80 percent or more of the market value of the shares is directly or indirectly attributable to South African immovable property held on capital account, and that shareholder (whether alone or together with any connected person in relation to that person), directly or indirectly, holds at least 20 percent of the equity shares of that South African company.
With effect from 1 October 2007, gains realized on the sale of ordinary shares are automatically deemed to be on capital account and therefore, subject to capital gains tax, if the ordinary shares have been held for a continuous period of at least three years by the holder thereof. This deeming provision is limited to ordinary shares and does not extend to preference shares or ADSs. The meaning of the word “resident” is different for individuals and corporations and is governed by the South African Income Tax Act, 1962 ( the Act) and by the Treaty. In the event of conflict, the Treaty, which contains a tie breaker clause or mechanism to determine residency if a holder is resident in both countries, will prevail. In terms of the Act and Treaty, a US resident holder of shares or ADSs will not be subject to capital gains tax on the disposal of securities held as capital assets unless the securities are linked to a permanent establishment conducted in South Africa. In contrast, gains on the disposal of securities which are not capital in nature are usually subject to income tax. However, even in the latter case, a US resident holder will not be subject to income tax unless the US resident holder carries on business in South Africa through a permanent establishment situated therein.
The effective marginal rate for South African residents is 36 percent for trusts, 18 percent for individuals and 22,4 percent for companies. The income tax rate applicable in each instance is 45 percent for trusts, 45 percent for individuals and 28 percent for companies.
Securities transfer tax (STT)
No securities transfer tax, or STT, is payable in South Africa with respect to the issue of a security, but STT is payable upon transfer or redemption thereof.
STT on transfers of securities is charged at a rate of 0,25 percent on the 'taxable amount' of the 'transfer' of every security issued by a company incorporated in South Africa, or a company incorporated outside South Africa but listed on an exchange in South Africa, subject to certain exemptions.
The word 'transfer' is broadly defined and includes the transfer, sale, assignment or cession or disposal in any other manner of a security which results in a change in beneficial ownership. The cancellation or redemption of a security is also regarded as a transfer unless the company is being liquidated. However, the transfer of a security that does not result in a change in beneficial ownership is not regarded as a 'transfer' for STT purposes. A security is also defined as a depositary receipt in a company. Accordingly, STT is payable on the transfer of a depositary receipt issued by a company, including specifically the ADSs issued by AngloGold Ashanti. Generally, the central securities depositary that has been accepted as a participant in terms of the Financial Markets Act, is liable for the payment of the STT, on the basis that it is recoverable from the person to whom it is transferred.
STT is levied on the 'taxable amount' of a security. The taxable amount of a listed security is the greater of the consideration for the security declared by the transferee or the closing price of that security as traded on the stock exchange concerned. In the case of a transfer of a listed security, either the member or the participant holding the security in custody, or where the listed security is not held in custody, the company that issued the listed security, is liable for the tax. The tax must be paid by the fourteenth day of the month following the transfer.
Withholding tax on interest
A withholding tax on interest at the rate of 15 percent has been introduced with effect from 1 March 2015. This withholding is reduced to zero percent in terms of the Treaty to the extent that the interest is derived and beneficially owned by a resident of the other Contracting State.
UNITED STATES TAXATION
The following is a general summary of certain material US federal income tax consequences of the ownership and disposition of shares or ADSs to a US holder (as defined below) that holds its shares or ADSs as a capital asset. This summary does not address any aspect of US federal gift or estate tax, or the state, local or non-US tax consequences to a US holder of shares or ADSs. This
244
summary is based on US tax laws including the Internal Revenue Code of 1986, as amended (the Code), Treasury regulations promulgated thereunder, rulings, judicial decisions, administrative pronouncements, and the Treaty, all as currently in effect as of the date of this annual report, and all of which are subject to change or changes in interpretation, possibly with retroactive effect. In addition, this summary is based in part upon the representations of the depositary and the assumption that each obligation in the Deposit Agreement relating to the ADSs and any related agreement will be performed in accordance with its terms.
This summary does not address all aspects of US federal income taxation that may apply to holders that are subject to special tax rules, including US expatriates, non-resident aliens present in the United States for at least 183 days during the calendar year, insurance companies, tax-exempt entities, banks, certain financial institutions, persons subject to the alternative minimum tax, regulated investment companies, securities broker-dealers, traders in securities who elect to apply a mark-to-market method of accounting, investors that own (directly, indirectly or by attribution) 10 percent or more of the outstanding share capital or voting stock of AngloGold Ashanti, partnerships or other entities treated as partnerships for US federal income tax purposes or persons holding shares or ADSs through such entities, persons holding their shares or ADSs as part of a straddle, hedging or conversion transaction, persons who acquired their shares or ADSs pursuant to the exercise of employee stock options or otherwise as compensation, accrual basis taxpayers, or persons whose functional currency is not the US dollar. Such holders may be subject to US federal income tax consequences different from those set forth below.
As used herein, the term “US holder” means a beneficial owner of shares or ADSs that is: (a) a citizen or individual resident of the United States for US federal income tax purposes; (b) a corporation (or other entity taxable as a corporation for US federal income tax purposes) created or organised in or under the laws of the United States or any state thereof (including the District of Columbia); (c) an estate the income of which is subject to US federal income taxation regardless of its source; or (d) a trust if (i) a court within the United States can exercise primary supervision over the administration of the trust and one or more US persons are authorised to control all substantial decisions of the trust or (ii) it has a valid election in effect under applicable Treasury regulations to be treated as a United States person. If a partnership (including for this purpose any entity treated as a partnership for US federal income tax purposes) holds shares or ADSs, the tax treatment of a partner generally will depend upon the status of the partner and the activities of the partnership. If a US holder is a partner in a partnership that holds shares or ADSs, the holder is urged to consult its own tax advisor regarding the specific tax consequences of the ownership and disposition of the shares or ADSs.
US holders should consult their own tax advisors regarding the specific South African and US federal, state and local tax consequences of owning and disposing of shares or ADSs in light of their particular circumstances as well as any consequences arising under the laws of any other taxing jurisdiction. In particular, US holders are urged to consult their own tax advisors regarding whether they are eligible for benefits under the Treaty.
For US federal income tax purposes, a US holder of ADSs should be treated as owning the underlying shares represented by those ADSs. Therefore, deposits or withdrawals by a US holder of shares for ADSs or of ADSs for shares will not be subject to US federal income tax. The following discussion (except where otherwise expressly noted) applies equally to US holders of shares and US holders of ADSs.
Taxation of dividends
The gross amount of any distribution (including the amount of any South African withholding tax thereon) paid to a US holder by AngloGold Ashanti generally will be taxable as dividend income to the US holder for US federal income tax purposes on the date the distribution is actually or constructively received by the US holder, in the case of shares, or by the depositary, in the case of ADSs. Corporate US holders will not be eligible for the dividends received deduction in respect of dividends paid by AngloGold Ashanti. For foreign tax credit limitation purposes, dividends paid by AngloGold Ashanti will be income from sources outside the United States.
As noted above in “-Taxation-South African Taxation-Taxation of dividends”, the South African government has enacted a dividend withholding tax. As a result, US holders who are eligible for benefits under the current Treaty will be subject to a maximum withholding tax of 15 percent on the gross amount of dividend distributions paid by AngloGold Ashanti.
The amount of any distribution paid in foreign currency (including the amount of any South African withholding tax thereon) generally will be includible in the gross income of a US holder of shares in an amount equal to the US dollar value of the foreign currency calculated by reference to the spot rate in effect on the date of receipt by the US holder, in the case of shares, or by the depositary, in the case of ADSs, regardless of whether the foreign currency is converted into US dollars on such date. If the foreign currency is converted into US dollars on the date of receipt, a US holder of shares generally should not be required to recognise foreign currency gain or loss in respect of the dividend. If the foreign currency received in the distribution is not converted into US dollars on the date of receipt, a US holder of shares generally will have a tax basis in the foreign currency equal to its US dollar value on the date of receipt. Any gain or loss recognised upon a subsequent conversion or other disposition of the foreign currency generally will be treated as US source ordinary income or loss. In the case of a US holder of ADSs, the amount of any distribution paid in a foreign currency generally will be converted into US dollars by the depositary upon its receipt. Accordingly, a US holder of ADSs generally will not be required to recognise foreign currency gain or loss in respect of the distribution. Special rules govern and specific elections are available to accrual method taxpayers to determine the US dollar amount includible in income in the case of taxes withheld in a foreign currency. Accrual basis taxpayers are therefore urged to consult their own tax advisors regarding the requirements and elections applicable in this regard.
245
Subject to certain limitations, South African withholding taxes will be treated as foreign taxes eligible for credit against a US holder’s US federal income tax liability. The limitation on foreign taxes eligible for credit is calculated separately with respect to specific classes of income. Dividend income generally will constitute ‘passive category’ income, or in the case of certain US holders, ‘general category’ income. The use of foreign tax credits is subject to complex conditions and limitations. In lieu of a credit, a US holder who itemises deductions may elect to deduct all of such holder’s foreign taxes in the taxable year. A deduction does not reduce US tax on a dollar-for-dollar basis like a tax credit, but the deduction for foreign taxes is not subject to all the same limitations applicable to foreign tax credits. US holders are urged to consult their own tax advisors regarding the availability of foreign tax credits.
Certain US holders (including individuals) are eligible for reduced rates of US federal income tax in respect of “qualified dividend income” received. For this purpose, qualified dividend income generally includes dividends paid by a non-US corporation if, among other things, the US holders meet a certain minimum holding period and other requirements and the non-US corporation satisfies certain requirements, including that either (i) the ordinary shares (or ADSs) with respect to which the dividend has been paid are readily tradable on an established securities market in the United States, or (ii) the non-US corporation is eligible for the benefits of a comprehensive US income tax treaty (such as the Treaty) which provides for the exchange of information. AngloGold Ashanti currently believes that dividends paid with respect to its shares and ADSs should constitute qualified dividend income for US federal income tax purposes. AngloGold Ashanti anticipates that its dividends will be reported as qualified dividends on Forms 1099-DIV delivered to US holders. Each individual US holder of AngloGold Ashanti shares or ADSs is urged to consult his own tax advisor regarding the availability to him of the reduced dividend tax rate in light of his own particular situation.
The US Treasury has expressed concern that parties to whom ADSs are pre-released may be taking actions that are inconsistent with the claiming of foreign tax credits for US holders of ADSs. Such actions would also be inconsistent with the claiming of the reduced rate of tax described above, applicable to dividends received by certain non-corporate holders. Accordingly, the analysis of the creditability of South African withholding taxes or the availability of qualified dividend treatment could be affected by future actions that may be taken by the US Treasury with respect to ADSs.
Taxation of dispositions
If a US holder is a resident of the United States for purposes of the Treaty, such holder will not be subject to South African tax on any capital gain if it sells or disposes of its shares or ADSs. Special rules apply to individuals who are residents of more than one country.
Subject to the passive foreign investment company considerations discussed below, upon a sale, exchange or other disposition of shares or ADSs, a US holder generally will recognise capital gain or loss for US federal income tax purposes in an amount equal to the difference between the US dollar value of the amount realised on the disposition and the holder's tax basis, determined in US dollars, in the shares or ADSs. Such gain or loss generally will be US source gain or loss, and will be treated as a long-term capital gain or loss if the holder’s holding period in the shares or ADSs exceeds one year at the time of disposition. If the US holder is an individual, any capital gain generally will be subject to US federal income tax at preferential rates if specified minimum holding periods are met. The deductibility of capital losses is subject to significant limitations.
A US holder’s tax basis in a share will generally be its US dollar cost. The US dollar cost of a share purchased with foreign currency will generally be the US dollar value of the purchase price on the date of purchase, or the settlement date for the purchase in the case of shares traded on an established securities market that are purchased by a cash basis US holder or an electing accrual basis US holder. The amount realised on a sale or other disposition of shares for an amount in foreign currency will be the US dollar value of this amount on the date of sale or disposition. On the settlement date, the US holder will recognise US source foreign currency gain or loss (taxable as ordinary income or loss) equal to the difference (if any) between the US dollar value of the amount received based on the exchange rates in effect on the date of sale or other disposition and the settlement date. However, in the case of shares traded on an established securities market that are sold by a cash basis US holder (or an accrual basis US holder that so elects), the amount realised will be based on the exchange rate in effect on the settlement date for the sale, and no exchange gain or loss will be recognised at that time. If an accrual basis US holder makes either of the elections described above, it must be applied consistently from year to year and cannot be revoked without the consent of the Internal Revenue Services (IRS).
Foreign currency received on the sale or other disposition of a share will have a tax basis equal to its US dollar value on the settlement date. Any gain or loss recognised on a sale or other disposition of foreign currency (including its use to purchase shares or upon exchange for US dollars) will be US source ordinary income or loss.
Passive foreign investment company considerations
A non-US corporation will be classified a Passive Foreign Investment Company (PFIC) for any taxable year if at least 75 percent of its gross income consists of passive income (such as dividends, interest, rents or royalties (other than rents or royalties derived in the active conduct of a trade or business and received from an unrelated person), or gains on the disposition of certain minority interests), or at least 50 percent of the average value of its assets consists of assets that produce, or are held for the production of, passive income. AngloGold Ashanti believes that it was not treated as a PFIC for the taxable year ended 31 December 2016 or any prior taxable years and does not expect to become a PFIC in the foreseeable future. If AngloGold Ashanti were characterised as a PFIC for any taxable year, a US holder would suffer adverse tax consequences with respect to that taxable year and all future years during which it holds AngloGold Ashanti ordinary shares (or ADSs).
246
These consequences may include having gains realised on the disposition of shares treated as ordinary income rather than capital gains and being subject to punitive interest charges on the receipt of certain dividends and on the proceeds of the sale or other disposition of the shares. Furthermore, dividends paid by AngloGold Ashanti would not be “qualified dividend income” and would be taxed at the higher rates applicable to other items of ordinary income. US holders should consult their own tax advisors regarding the potential application of the PFIC rules to their ownership of the shares.
US information reporting and backup withholding
In general, dividend payments made to a holder and proceeds paid from the sale, exchange, or other disposition of shares may be subject to information reporting to the IRS and backup withholding. US federal backup withholding generally is imposed at a current rate of 24 percent on specified payments including dividends and gross sale proceeds to persons who fail to furnish required information. Backup withholding will not apply to a holder who furnishes a correct taxpayer identification number or certificate of foreign status and makes any other required certification, or who is otherwise exempt from backup withholding. US persons who are required to establish their exempt status generally must provide IRS Form W-9 (Request for Taxpayer Identification Number and Certification). Non-US holders generally will not be subject to US information reporting or backup withholding. However, these holders may be required to provide certification of non-US status (generally on IRS Form W-8BEN or W-8BEN-E) in connection with payments received in the United States or through certain US-related financial intermediaries. Backup withholding is not an additional tax. Amounts withheld as backup withholding may be credited against a holder’s US federal income tax liability. A holder may obtain a refund of any excess amounts withheld under the backup withholding rules by filing the appropriate claim for refund with the IRS and furnishing any required information.
Information with respect to foreign financial assets
Individuals that own “specified foreign financial assets” with an aggregate value in excess of $50,000 are generally required to file information reports with respect to such assets with their U.S. federal income tax returns. Depending on the individual’s circumstances, higher threshold amounts may apply. “Specified foreign financial assets” include any financial accounts maintained by foreign financial institutions, as well as any of the following, but only if they are not held in accounts maintained by financial institutions: (i) stocks and securities issued by non-United States persons, (ii) financial instruments and contracts held for investment that have non-United States issuers or counterparties and (iii) interests in non-United States entities. The shares or ADSs may be treated as specified foreign financial assets. In such cases, certain US holders may be subject to this information reporting regime and be required to file IRS form 8938 listing these assets with their U.S. federal income tax returns. Failure to file information reports may subject a US holder to penalties. US holders are urged to consult their own tax advisors regarding their obligations to file information reports with respect to the shares and ADSs.
247
|
10F.
|
DIVIDENDS AND PAYING AGENTS
|
Not applicable.
248
|
10G.
|
STATEMENT BY EXPERTS
|
Not applicable.
249
10H.
Documents on display
AngloGold Ashanti files annual reports on Form 20-F and reports on Form 6-K with the SEC. You may read and copy this information at the SEC’s Public Reference Room at 100F Street, N.E., Room 1580, Washington D.C. 20549 or by accessing the SEC’s home page (
http://www.sec.gov
). You can also request copies of documents, upon payment of a duplicating fee, by writing to the Public Reference Section of the SEC. Please call the SEC at 1-800-SEC-0330 for further information on the operation of the Public Reference Room. In addition, AngloGold Ashanti’s reports and other information may be inspected at the offices of the New York Stock Exchange, 20 Broad Street, New York, New York 10005. Copies of the documents referred to herein may also be inspected at AngloGold Ashanti’s offices by contacting AngloGold Ashanti at 76 Rahima Moosa Street, Newtown, Johannesburg, 2001 (P.O. Box 62117, Marshalltown, 2107) South Africa, Attention: Company Secretary, telephone number:
+27 11 637 6000.
No material on the AngloGold Ashanti website forms any part of, or is incorporated by reference into, this annual report on Form 20-F. References herein to the company’s website shall not be deemed to cause such incorporation.
250
|
10I.
|
SUBSIDIARY INFORMATION
|
Not applicable.
251
TREASURY POLICY
Risk management activities within the group are the ultimate responsibility of the board of directors. The Chief Financial Officer is responsible to the board of directors for the design, implementation and monitoring of the risk management plan. The Audit and Risk Committee is responsible for overseeing risk management plans and systems, as well as financial risks which include a review of treasury activities and exposure to the group’s counterparties.
Under the treasury and risk management policy, hedges may be put in place using approved instruments over the group’s planned gold production and resultant gold sales currency exposures. The tenor of the hedges may extend out to ten years. The treasury and risk management policy sets limits on the extent to which the hedge position may change for the various levels of treasury management from dealer, through treasurer, executive management and board.
The financial risk management activities objectives of the group are as follows:
|
•
|
Safeguarding the group’s core earnings stream from its major assets through the effective control and management of gold and other commodity price risk, foreign exchange risk and interest rate risk;
|
|
•
|
Effective and efficient usage of credit facilities in both the short- and long-term through the adoption of reliable liquidity management planning and procedures;
|
|
•
|
Ensuring that investment and hedging transactions are undertaken with creditworthy counterparts; and
|
|
•
|
Ensuring that all contracts and agreements related to financial risk management activities are co-ordinated and consistent throughout the group and comply where necessary with all relevant regulatory and statutory requirements.
|
Under the treasury and risk management policy, treasury reports are produced at the following minimum intervals for review by management and the board of directors.
|
•
|
Daily
|
Treasurer
|
|
|
•
|
Monthly
|
Executive Committee
|
|
|
•
|
Quarterly
|
Audit and Risk Committee, Board of Directors and shareholder reports
|
|
The Treasury Risk Analyst is responsible for monitoring all reports for completeness and accuracy which are reviewed by the Treasurer.
At AngloGold Ashanti, all front office (dealing), middle office (risk reporting), back office (deal confirmations) and payment (treasury settlements) activities are segregated. All treasury transactions are captured on a third party developed treasury and risk management system that is widely used in corporate treasuries. The group internal audit function conducts regular and ad-hoc reviews of the activities of treasury and the group’s treasury system.
Gold price risk management activities
In the normal course of its operations, the group is exposed to gold and other commodity price, currency, interest rate, equity price, liquidity and non-performance risk, which includes credit risk. The group is also exposed to certain by-product commodity price risk. In order to manage these risks, the group may enter into transactions which make use of derivatives. The group has developed a risk management process to facilitate, control and monitor these risks.
Gold price risk arises from the risk of an adverse effect of current or future earnings resulting from fluctuations in the price of gold. The group eliminated its hedge book during 2010 and has since had full exposure to the spot price of gold.
IFRS guidance on derivatives and hedging requires that derivative instruments be accounted for as follows:
|
•
|
Contracts that meet the criteria for hedge accounting are designated as the hedging instruments hedging the variability of forecasted cash flows from the sale of production into the spot market and from capital expenditure denominated in a foreign currency and are classified as cash flow hedges. Cash flow hedge losses pertaining to capital expenditure of $2m as at 31 December 2017 (2016: $2m) are expected to be reclassified from accumulated other comprehensive income and recognised as an adjustment to depreciation expense over the life of the Serra Grande mine.
|
|
•
|
All other derivatives are measured at their estimated fair value, with the changes in estimated fair value at each reporting date reported as gains or losses on derivatives in earnings in the period in which they occur.
|
Cash flows related to these instruments designated as qualifying hedges are reflected in the consolidated statement of cash flows in the same category as the cash flow from the items being hedged. Accordingly, cash flows relating to the settlement of forward sale commodity derivatives contracts hedging the forecasted sale of production into the spot market will be reflected upon settlement as a component of operating cash flows.
252
Foreign exchange price risk protection agreements
The group, from time to time, may enter into currency forward exchange and currency option contracts to hedge certain anticipated transactions denominated in foreign currencies. The objective of the group’s foreign currency hedging activities is to protect the group from the risk that the eventual cash flows resulting from transactions denominated in US dollars will be adversely affected by changes in exchange rates.
As at 31 December 2017 and 2016, the group had no open forward exchange or currency option contracts in its currency hedge position.
Interest rate and liquidity risk
Fluctuations in interest rates impacts interest paid and received on the short-term cash investments and financing activities, giving rise to interest rate risk.
In the ordinary course of business, the group receives cash from the proceeds of its gold sales and is required to fund its working capital requirements. This cash is managed to ensure that surplus funds are invested in a manner to achieve market related returns while minimising risks.
The group is able to actively source financing at competitive rates. The counterparts are financial and banking institutions and their credit ratings are regularly monitored by the group.
Cash and loans advanced maturity profile
|
2017
|
2016
|
||||||||||||||||||
|
Maturity date
|
Currency
|
Fixed rate
investment
amount
(million)
|
|
Effective
rate %
|
Floating rate
investment
amount
(million)
|
|
Effective
rate %
|
Fixed rate
investment
amount
(million)
|
|
Effective
rate %
|
Floating rate
investment
amount
(million)
|
|
Effective
rate %
|
||||||
|
All less than one year
|
$
|
—
|
|
—
|
57
|
|
2.39
|
7
|
|
0.80
|
37
|
|
0.42
|
||||||
|
ZAR
|
123
|
|
6.46
|
157
|
|
5.78
|
625
|
|
6.69
|
127
|
|
5.49
|
|||||||
|
AUD
|
—
|
|
—
|
22
|
|
3.00
|
—
|
|
—
|
31
|
|
3.50
|
|||||||
|
BRL
|
—
|
|
—
|
28
|
|
8.60
|
—
|
|
—
|
5
|
|
14.08
|
|||||||
|
ARS
|
—
|
|
—
|
—
|
|
—
|
—
|
|
—
|
1
|
|
20.00
|
|||||||
Borrowings maturity profile
|
Within one year
|
Between
One and two years
|
Between Two
and five years
|
After five years
|
Total
|
|||||||||||||||
|
Currency
|
Borrowings
amount
(million)
|
|
Effective
rate
%
|
Borrowings
amount
(million)
|
|
Effective
rate
%
|
Borrowings
amount
(million)
|
|
Effective
rate
%
|
Borrowings
amount
(million)
|
|
Effective
rate
%
|
Borrowings amount (million)
|
|
|||||
|
$
|
28
|
|
5.4
|
48
|
|
4.9
|
1,441
|
|
5.2
|
291
|
|
6.5
|
1,808
|
|
|||||
|
ZAR
|
34
|
|
10.2
|
42
|
|
10.2
|
2,826
|
|
8.8
|
194
|
|
15.5
|
3,096
|
|
|||||
|
BRL
|
3
|
|
5.7
|
3
|
|
5.6
|
3
|
|
5.0
|
—
|
|
—
|
9
|
|
|||||
|
AUD
|
7
|
|
5.9
|
214
|
|
4.6
|
21
|
|
6.8
|
41
|
|
6.8
|
283
|
|
|||||
The table above is based on the borrowings as at 31 December 2017 including borrowing cost and accrued interest but excludes any fair value adjustments.
253
Interest rate risk
|
Fixed for less than one year
|
Fixed for between one and three years
|
Fixed for greater than three years
|
||||||||||||||||
|
Currency
|
Borrowings
amount
(million)
|
|
Effective
rate
%
|
Borrowings
amount
(million)
|
|
Effective
rate
%
|
Borrowings
amount
(million)
|
|
Effective
rate
%
|
Total
Borrowings
amount
(million)
|
|
|||||||
|
$
|
28
|
|
5.4
|
746
|
|
5.1
|
1,034
|
|
5.5
|
1,808
|
|
|||||||
|
ZAR
|
34
|
|
10.2
|
2,786
|
|
8.8
|
276
|
|
14.0
|
3,096
|
|
|||||||
|
BRL
|
3
|
|
5.7
|
3
|
|
5.2
|
3
|
|
5.3
|
9
|
|
|||||||
|
AUD
|
7
|
|
6.5
|
221
|
|
4.6
|
55
|
|
6.8
|
283
|
|
|||||||
The table above is based on the borrowings as at 31 December 2017 including borrowing cost and accrued interest but excludes any fair value adjustments.
Non-performance risk
Realisation of contracts is dependent upon counterparts’ performance. The group has not obtained collateral or other security to support the financial instruments subject to non-performance risk, but the credit standing of counterparts was monitored on a regular basis throughout the year. The group spreads its business over a number of financial and banking institutions to minimise the risk of potential non-performance risk. Furthermore, the approval process of counterparts and the limits applied to each counterpart were monitored by the board of directors. Where possible, ISDA netting agreements were put in place.
The combined maximum credit risk exposure at balance sheet date amounts to $361 million for financial assets (2016: $395 million) and nil million for financial guarantees (2016: nil million). Credit risk exposure netted by open derivative positions with counterparts was nil (2016: nil). No set-off is applied to balance sheet amounts due to the different maturity profiles of assets and liabilities.
Fair value of financial instruments
The estimated fair values of financial instruments are determined at discrete points in time based on relevant market information. The estimated fair values of the group’s financial instruments, as measured at 31 December are as follows (assets (liabilities)):
|
2017
|
2016
|
|||||||||||
|
Carrying
Amount
|
|
Fair
value
|
|
Carrying
Amount
|
|
Fair
value
|
|
|||||
|
(millions)
|
$
|
|
$
|
|
$
|
|
$
|
|
||||
|
Cash and cash equivalents
|
205
|
|
205
|
|
215
|
|
215
|
|
||||
|
Restricted cash
|
65
|
|
65
|
|
55
|
|
55
|
|
||||
|
Short-term borrowings
|
(38
|
)
|
(38
|
)
|
(34
|
)
|
(34
|
)
|
||||
|
Long-term borrowings
|
(2,230
|
)
|
(2,339
|
)
|
(2,144
|
)
|
(2,169
|
)
|
||||
|
Listed investments - available for sale
|
80
|
|
80
|
|
51
|
|
51
|
|
||||
|
Listed investments - held to maturity
|
4
|
|
6
|
|
6
|
|
8
|
|
||||
|
Unlisted investments - held to maturity
|
54
|
|
54
|
|
73
|
|
73
|
|
||||
The following methods and assumptions were used to estimate the fair value of each class of financial instrument:
Cash restricted for use, cash and cash equivalents
The carrying amounts approximate fair value.
Trade and other receivables and trade and other payables
The carrying amounts approximate fair value because of the short-term duration of these instruments.
Investments and other non-current assets
Listed equity investments classified as available-for-sale are carried at fair value while fixed income investments and other non-current assets are carried at amortised cost. The fair value of fixed income investments and other non-current assets has been calculated using market interest rates. The unlisted equity investments are carried at cost or fair value.
Borrowings
The interest rate on borrowings is reset on a short-term floating rate basis, and accordingly the carrying amount is considered to approximate fair value.
254
Derivatives
The fair values of volatility-based instruments (i.e. options) are estimated based on market prices, volatilities, credit risk and interest rates for the periods under review.
Gain (loss) on non-hedge derivatives and other commodity contracts recognised
|
Year ended 31 December
|
|||||
|
2017
|
|
2016
|
|
||
|
(millions)
|
$
|
$
|
|||
|
Unrealised
|
|||||
|
Gain (loss) on non-hedge derivatives and other commodity contracts
|
10
|
|
18
|
|
|
Other comprehensive income
|
Accumulated other
comprehensive income
|
|
Changes in fair
value recognised
|
|
Reclassification
adjustments
|
|
Accumulated other
comprehensive income
|
|
||||
|
as of 1 January 2017
|
|
in 2017
|
|
as of 31 December 2017
|
|
||||||
|
(millions)
|
$
|
$
|
$
|
$
|
|||||||
|
Derivatives designated as
|
|||||||||||
|
Capital expenditure
|
(2
|
)
|
—
|
|
—
|
|
(2
|
)
|
|||
|
Before tax totals
|
(2
|
)
|
—
|
|
—
|
|
(2
|
)
|
|||
|
After tax totals
|
(1
|
)
|
—
|
|
—
|
|
(1
|
)
|
|||
|
Accumulated other
comprehensive income
|
|
Changes in fair
value recognised
|
|
Reclassification
adjustments
|
|
Accumulated other
comprehensive income
|
|
||||
|
as of 1 January 2016
|
|
in 2016
|
|
as of 31 December 2016
|
|
||||||
|
(millions)
|
$
|
$
|
$
|
$
|
|||||||
|
Derivatives designated as
|
|||||||||||
|
Capital expenditure
|
(2
|
)
|
—
|
|
—
|
|
(2
|
)
|
|||
|
Before tax totals
|
(2
|
)
|
—
|
|
—
|
|
(2
|
)
|
|||
|
After tax totals
|
(1
|
)
|
—
|
|
—
|
|
(1
|
)
|
|||
Foreign exchange risk
Foreign exchange risk arises on financial instruments that are denominated in a foreign currency.
The following table discloses the approximate foreign exchange risk sensitivities of borrowings at 31 December 2017 (actual changes in the timing and amount of the following variables may differ from the assumed changes below)
|
2017
|
|||||
|
Change in
exchange rate
|
Change in
borrowings
Total
|
|
|||
|
$M
|
|
||||
|
Debt
|
|||||
|
ZAR denominated (R/$)
|
Spot (+R1.50)
|
(26
|
)
|
||
|
AUD denominated (AUD/$)
|
Spot (+AUD0.1)
|
(16
|
)
|
||
|
|
|||||
|
2017
|
|||||
|
Change in
exchange rate
|
Change in
borrowings
Total
|
|
|||
|
$M
|
|
||||
|
Debt
|
|||||
|
ZAR denominated (R/$)
|
Spot (-R1.50)
|
33
|
|
||
|
AUD denominated (AUD/$)
|
Spot (-AUD0.1)
|
19
|
|
||
255
256
|
12A.
|
DEBT SECURITIES
|
Not applicable
257
|
12B.
|
WARRANTS AND RIGHTS
|
Not applicable
258
|
12C.
|
OTHER SECURITIES
|
Not applicable
259
|
12D.
|
AMERICAN DEPOSITORY SHARES
|
260
|
12D.3.
|
DEPOSITARY FEES AND CHARGES
|
AngloGold Ashanti’s American Depositary Shares, or ADSs, each representing one of AngloGold Ashanti’s ordinary shares, are traded on the New York Stock Exchange under the symbol “AU.” The ADSs are evidenced by American Depositary Receipts, or ADRs, issued by The Bank of New York Mellon, as Depositary under the Amended and Restated Deposit Agreement dated as of 3 June 2008, among AngloGold Ashanti Limited, The Bank of New York Mellon and owners and beneficial owners of from time to time of ADRs. ADS holders may have to pay the following service fees to the Depositary:
|
Service
|
Fees (USD)
|
|
|
Issuance of ADSs
|
Up to 5 cents per ADS
|
(1)
|
|
Cancellation of ADSs
|
Up to 5 cents per ADS
|
(1)
|
|
Distribution of cash dividends or other cash distributions
|
Up to 2 cents per ADS
|
(2)
|
|
Distribution of securities pursuant to
|
||
|
(i) stock dividends, free stock distributions or
|
||
|
(ii) exercises of rights to purchase additional ADSs
|
Up to 5 cents per ADS
|
(2)
|
|
ADR Depositary Services fee
|
Up to 2 cents per year
|
(2)
|
|
(1)
|
These fees are typically paid to the Depositary by the brokers on behalf of their clients receiving the newly-issued ADSs from the Depositary and by the brokers on behalf of their clients delivering the ADSs to the Depositary for cancellation. The brokers in turn charge these transaction fees to their clients.
|
|
(2)
|
In practice, the Depositary has not collected these fees. If collected, such fees are offset against the related distribution made to the ADR holder.
|
In addition, ADS holders are responsible for certain fees and expenses incurred by the Depositary on their behalf including (1) taxes and other governmental charges, (2) such registration fees as may from time to time be in effect for the registration of transfers of ordinary shares generally on the share register and applicable to transfers of ordinary shares to the name of the Depositary or its nominee or the Custodian or its nominee on the making of deposits or withdrawals, and (3) such cable, telex and facsimile transmission expenses as are expressly incurred by the Depositary in the conversion of foreign currency.
Fees and other charges payable by the Depositary, any of the Depositary’s agents, including the Custodian, or the agents of the Depositary’s agents in connection with the servicing of Shares or other Deposited Securities, shall be collected at the sole discretion of the Depositary by billing such owners for such charge or by deducting such charge from one or more cash dividends or other cash distributions.
For further information, refer to “Item 10C: Material Contracts - The Deposit Agreement”.
261
|
12D.4.
|
DEPOSITARY PAYMENTS FOR 2017
|
For the year ended 31 December 2017, The Bank of New York Mellon, as Depositary, reimbursed AngloGold Ashanti an amount of $867,747 (2016: $1,185,580) mainly for investor relations related expenses.
262
|
ITEM 13:
|
DEFAULTS, DIVIDEND ARREARAGES AND DELINQUENCIES
|
None.
263
None.
264
|
(a)
|
Disclosure Controls and Procedures:
As of 31 December 2017 (the “Evaluation Date”), the company, under the supervision and with the participation of its management, including the chief executive officer and chief financial officer has evaluated the effectiveness of the company’s disclosure controls and procedures (as defined in Rules 13a - 15(e) and 15d - 15(e) under the Securities Exchange Act of 1934, as amended (“the Exchange Act”)). Based on such evaluation, the chief executive officer and chief financial officer have concluded that, as of the Evaluation Date, the company’s disclosure controls and procedures are effective, and are reasonably designed to ensure that information required to be disclosed by the company in reports that it files or submits under the Exchange Act is recorded, processed, summarized and reported within the time periods specified in the rules and forms of the Securities and Exchange Commission. These disclosure controls and procedures include without limitation, controls and procedures designed to ensure that information required to be disclosed by the company in reports that it files or submits under the Exchange Act is accumulated and communicated to the company’s management, including its chief executive officer and chief financial officer, as appropriate to allow timely decisions regarding disclosure.
|
|
(b)
|
Management’s Annual Report on Internal Control over Financial Reporting:
Management is responsible for establishing and maintaining adequate internal control over financial reporting for the company, as defined in the Exchange Act Rule 13a - 15(f) and 15d -15(f). The company’s internal control over financial reporting is a process designed to provide reasonable assurance regarding the reliability of financial reporting and the preparation of the company’s financial statements for external purposes in accordance with International Financial Reporting Standards as issued by the International Accounting Standards Board.
|
The company’s internal control over financial reporting includes those policies and procedures that:
|
•
|
Pertain to the maintenance of records that, in reasonable detail, accurately and fairly reflect transactions and dispositions of the assets of the company;
|
|
•
|
Provide reasonable assurance that the transactions are recorded as necessary to permit preparation of financial statements in accordance with generally accepted accounting principles, and that receipts and expenditures of the company are being made only in accordance with authorisations of management and the Directors of the company; and
|
|
•
|
Provide reasonable assurance regarding prevention or timely detection of unauthorised acquisition, use, or disposition of the company’s assets that could have a material effect on the financial statements.
|
Because of inherent limitations, internal control over financial reporting may not prevent or detect misstatements. Projections of any evaluation of effectiveness to future periods is subject to the risk that controls may become inadequate because of changes in conditions, or that the degree of compliance with policies and procedures may deteriorate.
The company’s management assessed the effectiveness of the company’s internal control over financial reporting as of the Evaluation Date. In making this assessment, management used the criteria set forth by the Committee of Sponsoring Organisations of the Treadway Commission (COSO) in Internal Control - Integrated Framework and related illustrative documents released on May 14, 2013. Based on this assessment, and using those criteria, management concluded that the company’s internal control over financial reporting was effective as of the Evaluation Date.
|
(c)
|
Changes in Internal Control over Financial Reporting:
The Company maintains a system of internal control over financial reporting that is designed to provide reasonable assurance that its books and records accurately reflect transactions and that established policies and procedures are followed. The Company started in 2013 with the implementation of an enterprise resource planning (“ERP”) system on a staggered basis and concluded with the implementation in quarter four of 2013 at all operations excluding its Continental Africa Region, for financial reasons. The ERP implementation will continue at Obuasi within the Continental Africa Region during quarter 3 of 2018. The continuous implementation will result in a change to the system of internal control over financial reporting at the implicated sites. The Company continues to implement the global ERP system to improve standardization and automation, and not in response to a deficiency in its internal control over financial reporting. The Company believes that the continuing implementation of the ERP system and related changes to internal controls will enhance its internal controls over financial reporting while providing the ability to scale its business in the future. The Company has taken the necessary steps to monitor and maintain appropriate internal control over financial reporting during this period of change and will continue to evaluate the operating effectiveness of related key controls during subsequent periods.
|
South Africa Region is currently going through a significant restructuring which includes a rationalization of jobs at various levels. The changes will have a direct impact on the internal control environment over financial reporting and management has implemented the necessary controls and safeguards to ensure that the transition does not negatively impact on the internal control environment.
There have been no further changes in the company’s internal control over financial reporting identified in connection with the evaluation required by paragraph (d) of Exchange Act Rule 13(a) - 15 during the year ended December 31, 2017 that have materially affected, or are reasonably likely to materially affect, the company’s internal control over financial reporting.
265
See Item 3D, Risk Factors, of this annual report on Form 20F for risk factors related to the implementation and integration of information technology systems and maintaining an effective system of internal control over financial reporting.
|
(d)
|
Attestation Report of the Registered Public Accounting Firm:
The Company’s independent registered accounting firm, Ernst & Young Inc., has issued an attestation report on the effectiveness of the company’s internal control over financial reporting. This report appears below.
|
/s/ KC Ramon
Kandimathie Christine Ramon
Chief Financial Officer
/s/ S Venkatakrishnan
Srinivasan Venkatakrishnan
Chief Executive Officer
266
REPORT OF INDEPENDENT REGISTERED PUBLIC ACCOUNTING FIRM
The Board of Directors and Shareholders of AngloGold Ashanti Limited
Opinion on internal Control over Financial Reporting
We have audited AngloGold Ashanti Limited’s internal control over financial reporting as of 31 December 2017, based on criteria established in Internal Control-Integrated Framework issued by the Committee of Sponsoring Organizations of the Treadway Commission (2013 COSO framework) (the COSO criteria). In our opinion, AngloGold Ashanti Limited (the Company) maintained, in all material respects, effective internal control over financial reporting as of 31 December 2017, based on the COSO criteria.
We also have audited, in accordance with the standards of the Public Company Accounting Oversight Board (United States)(PCAOB), the consolidated statement of financial position of AngloGold Ashanti Limited as of 31 December 2017, 2016 and 2015, the related consolidated statements of income, comprehensive income, cash flows and changes in equity for each of the three years in the period ended 31 December 2017, and the related notes and our report dated 29 March 2018 expressed an unqualified opinion thereon.
Basis for Opinion
The Company’s management is responsible for maintaining effective internal control over financial reporting, and for its assessment of the effectiveness of internal control over financial reporting included in the accompanying Management’s Annual Report on Internal Control over Financial Reporting. Our responsibility is to express an opinion on the Company’s internal control over financial reporting based on our audit. We are a public accounting firm registered with the PCAOB and are required to be independent with respect to the Company in accordance with the U.S. federal securities laws and the applicable rules and regulations of the Securities and Exchange Commission and the PCAOB.
We conducted our audit in accordance with the standards of the PCAOB. Those standards require that we plan and perform the audit to obtain reasonable assurance about whether effective internal control over financial reporting was maintained in all material respects.
Our audit included obtaining an understanding of internal control over financial reporting, assessing the risk that a material weakness exists, testing and evaluating the design and operating effectiveness of internal control based on the assessed risk, and performing such other procedures as we considered necessary in the circumstances. We believe that our audit provides a reasonable basis for our opinion.
Definition and Limitation of Internal Control over Financial Reporting
A company’s internal control over financial reporting is a process designed to provide reasonable assurance regarding the reliability of financial reporting and the preparation of financial statements for external purposes in accordance with generally accepted accounting principles. A company’s internal control over financial reporting includes those policies and procedures that (1) pertain to the maintenance of records that, in reasonable detail, accurately and fairly reflect the transactions and dispositions of the assets of the company; (2) provide reasonable assurance that transactions are recorded as necessary to permit preparation of financial statements in accordance with generally accepted accounting principles and that receipts and expenditures of the company are being made only in accordance with authorizations of management and directors of the company; and (3) provide reasonable assurance regarding prevention or timely detection of unauthorized acquisition, use or disposition of the company’s assets that could have a material effect on the financial statements.
Because of its inherent limitations, internal control over financial reporting may not prevent or detect misstatements. Also, projections of any evaluation of effectiveness to future periods are subject to the risk that controls may become inadequate because of changes in conditions, or that the degree of compliance with the policies or procedures may deteriorate.
/s/ Ernst & Young Inc.
Johannesburg, Republic of South Africa
29 March 2018
267
|
ITEM 16A:
|
AUDIT COMMITTEE FINANCIAL EXPERT
|
Membership of the Audit and Risk Committee, including its chairman, comprises only independent non-executive directors, in compliance with the Sarbanes-Oxley Act. This also fulfils the guidelines of King IV, which became effective 1 November 2016, and the requirements of the Companies Act of 2008, which became effective on 1 May 2011. The Sarbanes-Oxley Act requires the board to identify a financial expert from within its ranks. The board has resolved that Mr Rhidwaan Gasant is the Audit and Risk Committee's financial expert. Individually, the remaining members of the committee have considerable knowledge and experience in associated areas such as audit, risk and corporate governance to help oversee and guide the board and the company.
268
|
ITEM 16B:
|
CODE OF ETHICS AND WHISTLE-BLOWING POLICIES
|
In order to comply with the company's obligation in terms of the Sarbanes-Oxley Act and King IV, and in the interests of good governance, the company has systems and procedures to introduce, monitor and enforce its ethical codes and has adopted a code of business principles and ethics for employees and directors, a code of ethics for the Chief Executive Officer, Chief Financial Officer and Senior Financial Officers, and a whistle-blowing policy that encourages employees to report anonymously if they wish and without fear of retaliation acts of an unethical or illegal nature that affect the company's interests. The code of business principles and ethics expresses the company’s commitment to the conduct of its business in line with ethical standards and is designed to enable employees and directors to perform their roles and duties with integrity and responsibility.
The whistle-blowing policy provides channels for employees to report acts and practices that are in conflict with the company’s code of business principles and ethics or are unlawful, including financial malpractice or dangers to the public or the environment. Reports may be made to management or through several mediums including the intranet, internet, telephone, short messaging system (sms), fax and post. All reports not made to management are administered by a third party, Tip-Offs Anonymous, to ensure independence of the process. Reported cases are relayed to management through group compliance and group internal audit. A report is provided by group compliance and group internal audit to the Serious Concerns Committee on a quarterly basis and Audit and Risk Committee on a quarterly basis. Reporters have the option to request feedback on reported cases. The whistle-blowing policy encourages reports to be made in good faith in a responsible and ethical manner. Employees are encouraged to first seek resolution of alleged malpractices through discussion with their direct managers, if appropriate, or other management including legal, compliance, human resources or internal audit.
The code of business principles and ethics for employees and directors and the code of ethics for the Chief Executive Officer, Chief Financial Officer and Senior Financial Officers are available on the company’s website at
http://www.anglogoldashanti.com/en/About-Us/corporategovernance/Pages/default.aspx
269
|
ITEM 16C:
|
PRINCIPAL ACCOUNTANT FEES AND SERVICES
|
Ernst & Young Inc. has served as AngloGold Ashanti’s independent public accountants for each of the financial years in the three-year period ended 31 December 2017, for which audited financial statements appear in this annual report on Form 20-F.
The following table presents the aggregate fees for professional services and other services rendered by Ernst & Young Inc. to AngloGold Ashanti in 2017 and 2016.
|
2017
|
|
2016
|
|
||
|
(in millions)
|
$
|
|
$
|
|
|
|
Audit fees
(1)
|
6.14
|
|
5.20
|
|
|
|
Audit-related fees
(2)
|
0.73
|
|
0.69
|
|
|
|
Tax fees
(3)
|
0.16
|
|
0.21
|
|
|
|
All other fees
(4)
|
0.04
|
|
0.02
|
|
|
|
Total
|
7.07
|
|
6.12
|
|
|
Rounding may result in computational differences.
|
(1)
|
The Audit fees consist of fees billed for the annual audit services engagement and other audit services, which are those services that only the external auditor reasonably can provide, and include the Company audit; statutory audits; attest services; and assistance with and review of documents filed with the SEC.
|
|
(2)
|
Audit-related fees consist of fees billed for assurance and related services.
|
|
(3)
|
Tax fees include fees billed for tax advice and tax compliance services.
|
|
(4)
|
All other fees include non-audit services.
|
Audit and Risk Committee Pre-approval Policies and Procedures
It is the policy of AngloGold Ashanti to maintain compliance with the requirements of the various applicable legislation and good governance practices when appointing or assigning work to the Company’s external auditor. Non-audit services may not be undertaken without an employee of AngloGold Ashanti obtaining the pre-approval of the Audit and Risk Committee as is laid out in the procedures relating to the pre-approval process.
The Audit and Risk Committee has delegated the approval authority to the chairman of the committee, Rhidwaan Gasant or his designated official. The approval may take the form of a written or oral instruction, and in the case of an oral instruction this would be ratified at the next Audit and Risk Committee meeting. On a quarterly basis a summary of all approvals and work to date is tabled at the Audit and Risk Committee meeting.
All non-audit services provided to AngloGold Ashanti by the principal independent registered public accounting firm during 2017 were reviewed and approved according to the procedures above. None of the services provided during 2017 were approved under the
de minimis
exception allowed under the Exchange Act.
270
|
ITEM 16D:
|
EXEMPTIONS FROM THE LISTING STANDARDS FOR AUDIT COMMITTEES
|
Not applicable.
271
Neither the issuer nor any affiliate of the issuer purchased any of the company’s shares during 2017.
272
Not applicable.
273
|
ITEM 16G:
|
CORPORATE GOVERNANCE
|
AngloGold Ashanti’s corporate governance practices do not differ in any significant way from those followed by US domestic companies under the New York Stock Exchange’s corporate governance listing standards.
274
|
ITEM 16H:
|
MINE SAFETY DISCLOSURE
|
Not applicable.
275
|
ITEM 17:
|
FINANCIAL STATEMENTS
|
Not applicable.
276
|
ITEM 18:
|
FINANCIAL STATEMENTS
|
The consolidated financial statements for the year ended 31 December 2017 were authorised for issue by the Board of Directors on 29 March 2018 and were signed on its behalf by Srinivasan Venkatakrishnan, Chief Executive Officer, Kandimathie Christine Ramon, Chief Financial Officer, Sipho Pityana, Chairman of the Board of Directors, and Rhidwaan Gasant, Chairman of the Audit and Risk Committee.
277
Report of independent registered public accounting firm
To the shareholders and the board of directors of AngloGold Ashanti Limited
Opinion on the Financial Statements
We have audited the accompanying consolidated statement of financial position of AngloGold Ashanti Limited (“the Company”) as of 31 December 2017, 2016 and 2015, the related consolidated statements of income, comprehensive income, cash flows and changes in equity for each of the three years in the period ended 31 December 2017, and the related notes (collectively referred to as the “consolidated financial statements”). In our opinion, based on our audits and the report of other auditors, the consolidated financial statements present fairly, in all material respects, the financial position of the Company at 31 December 2017, 2016, and 2015, and the results of its operations and its cash flows for each of the years then ended, in conformity with International Financial Reporting Standards (“IFRS’) as Issued by the International Accounting Standards Board.
We did not audit the financial statements of Kibali (Jersey) Limited (“Kibali”), a corporation in which the Company has a 50% interest. In the consolidated financial statements, the Company’s investment in Kibali was stated at $1,423 million, $1,400 million and $1,406 million as of 31 December 2017, 2016 and 2015, respectively the Company’s equity in the net income of Kibali was stated at $9 million in 2017, $24 million in 2016 and $70 million in 2015. Those statements were audited by other auditors whose report has been furnished to us, and our opinion, insofar as it relates to the amounts included for Kibali, is based solely on the report of the other auditors.
We also have audited, in accordance with the standards of the Public Company Accounting Oversight Board (United States) (PCAOB), the Company’s internal control over financial reporting as of 31 December 2017, based on criteria established in Internal Control-Integrated Framework issued by the Committee of Sponsoring Organizations of the Treadway Commission (2013 framework) and our report dated 29 March 2018 expressed an unqualified opinion thereon.
Basis for Opinion
These financial statements are the responsibility of the Company's management. Our responsibility is to express an opinion on the Company’s financial statements based on our audits. We are a public accounting firm registered with the PCAOB and are required to be independent with respect to the Company in accordance with the U.S. federal securities laws and the applicable rules and regulations of the Securities and Exchange Commission and the PCAOB.
We conducted our audits in accordance with the standards of the PCAOB. Those standards require that we plan and perform the audit to obtain reasonable assurance about whether the financial statements are free of material misstatement, whether due to error or fraud. Our audits included performing procedures to assess the risks of material misstatement of the financial statements, whether due to error or fraud, and performing procedures that respond to those risks. Such procedures included examining, on a test basis, evidence regarding the amounts and disclosures in the financial statements. Our audits also included evaluating the accounting principles used and significant estimates made by management, as well as evaluating the overall presentation of the financial statements. We believe that our audits and the report of other auditors provide a reasonable basis for our opinion.
/s/ Ernst & Young Inc.
We have served as the Company’s auditor since 1944
Johannesburg, Republic of South Africa
29 March 2018
278
PAGE LEFT BLANK INTENTIONALLY
279
ANGLOGOLD ASHANTI LIMITED
Group – income statement
FOR THE YEARS ENDED
31 DECEMBER 2017
,
2016
and
2015
|
Figures in millions
|
Notes
|
2017
|
|
2016
|
|
2015
|
|
||
|
US Dollars
|
|||||||||
|
Revenue
|
3
|
4,543
|
|
|
4,254
|
|
|
4,174
|
|
|
Gold income
|
2,3
|
4,356
|
|
|
4,085
|
|
|
4,015
|
|
|
Cost of sales
|
4
|
(3,582
|
)
|
|
(3,263
|
)
|
|
(3,294
|
)
|
|
Gain (loss) on non-hedge derivatives and other commodity contracts
|
10
|
|
|
19
|
|
|
(7
|
)
|
|
|
Gross profit (loss)
|
2
|
784
|
|
841
|
|
714
|
|
||
|
Corporate administration, marketing and other expenses
|
(64
|
)
|
(61
|
)
|
(78
|
)
|
|||
|
Exploration and evaluation costs
|
(114
|
)
|
(133
|
)
|
(132
|
)
|
|||
|
Other operating expenses
|
5
|
(88
|
)
|
(110
|
)
|
(96
|
)
|
||
|
Special items
|
6
|
(438
|
)
|
(42
|
)
|
(71
|
)
|
||
|
Operating profit (loss)
|
80
|
|
495
|
|
337
|
|
|||
|
Interest received
|
3
|
15
|
|
22
|
|
28
|
|
||
|
Exchange gain (loss)
|
(11
|
)
|
(88
|
)
|
(17
|
)
|
|||
|
Finance costs and unwinding of obligations
|
7
|
(169
|
)
|
(180
|
)
|
(245
|
)
|
||
|
Fair value adjustment on issued bonds
|
—
|
|
9
|
|
66
|
|
|||
|
Share of associates and joint ventures’ profit (loss)
|
8
|
22
|
|
11
|
|
88
|
|
||
|
Profit (loss) before taxation
|
(63
|
)
|
269
|
|
257
|
|
|||
|
Taxation
|
11
|
(108
|
)
|
(189
|
)
|
(211
|
)
|
||
|
Profit (loss) after taxation from continuing operations
|
(171
|
)
|
80
|
|
46
|
|
|||
|
Discontinued operations
|
|||||||||
|
Profit (loss) from discontinued operations
|
—
|
|
—
|
|
(116
|
)
|
|||
|
Profit (loss) for the year
|
(171
|
)
|
80
|
|
(70
|
)
|
|||
|
Allocated as follows:
|
|||||||||
|
Equity shareholders
|
|||||||||
|
- Continuing operations
|
(191
|
)
|
63
|
|
31
|
|
|||
|
- Discontinued operations
|
—
|
|
—
|
|
(116
|
)
|
|||
|
Non-controlling interests
|
|||||||||
|
- Continuing operations
|
20
|
|
17
|
|
15
|
|
|||
|
(171
|
)
|
80
|
|
(70
|
)
|
||||
|
Basic earnings (loss) per ordinary share (cents)
|
12
|
||||||||
|
Earnings (loss) per ordinary share from continuing operations
|
(46
|
)
|
15
|
|
8
|
|
|||
|
Earnings (loss) per ordinary share from discontinued operations
|
—
|
|
—
|
|
(28
|
)
|
|||
|
Basic earnings (loss) per ordinary share
|
(46
|
)
|
15
|
|
(20
|
)
|
|||
|
Diluted earnings (loss) per ordinary share (cents)
|
12
|
||||||||
|
Earnings (loss) per ordinary share from continuing operations
|
(46
|
)
|
15
|
|
8
|
|
|||
|
Earnings (loss) earnings per ordinary share from discontinued operations
|
—
|
|
—
|
|
(28
|
)
|
|||
|
Diluted earnings (loss) per ordinary share
|
(46
|
)
|
15
|
|
(20
|
)
|
|||
F - 1
ANGLOGOLD ASHANTI LIMITED
Group – statement of comprehensive income
FOR THE YEARS ENDED
31 DECEMBER 2017
,
2016
and
2015
|
Figures in millions
|
2017
|
|
2016
|
|
2015
|
|
||||
|
US Dollars
|
||||||||||
|
Profit (loss) for the year
|
(171
|
)
|
80
|
|
(70
|
)
|
||||
|
Items that will be reclassified subsequently to profit or loss:
|
||||||||||
|
Exchange differences on translation of foreign operations
|
123
|
|
180
|
|
(371
|
)
|
||||
|
Share of associates and joint ventures’ other comprehensive income
|
—
|
|
—
|
|
1
|
|
||||
|
Net gain (loss) on available-for-sale financial assets
|
20
|
|
13
|
|
(14
|
)
|
||||
|
Release on impairment of available-for-sale financial assets
|
3
|
|
—
|
|
9
|
|
||||
|
Release on disposal of available-for-sale financial assets
|
(6
|
)
|
(2
|
)
|
(3
|
)
|
||||
|
Deferred taxation thereon
|
8
|
|
(2
|
)
|
1
|
|
||||
|
25
|
|
9
|
|
(7
|
)
|
|||||
|
Items that will not be reclassified subsequently to profit or loss:
|
||||||||||
|
Actuarial gain (loss) recognised
|
8
|
|
(2
|
)
|
17
|
|
||||
|
Deferred taxation thereon
|
(2
|
)
|
—
|
|
(3
|
)
|
||||
|
6
|
|
(2
|
)
|
14
|
|
|||||
|
Other comprehensive income (loss) for the year, net of tax
|
154
|
|
187
|
|
(363
|
)
|
||||
|
Total comprehensive income (loss) for the year, net of tax
|
(17
|
)
|
267
|
|
(433
|
)
|
||||
|
Allocated as follows:
|
||||||||||
|
Equity shareholders
|
||||||||||
|
- Continuing operations
|
(37
|
)
|
250
|
|
(332
|
)
|
||||
|
- Discontinued operations
|
—
|
|
—
|
|
(116
|
)
|
||||
|
Non-controlling interests
|
||||||||||
|
- Continuing operations
|
20
|
|
17
|
|
15
|
|
||||
|
(17
|
)
|
267
|
|
(433
|
)
|
|||||
F - 2
ANGLOGOLD ASHANTI LIMITED
Group – statement of financial position
AS AT
31 DECEMBER 2017
,
2016
and
2015
|
Figures in millions
|
Notes
|
2017
|
|
2016
|
|
2015
|
|
||
|
US Dollars
|
|||||||||
|
ASSETS
|
|||||||||
|
Non-current assets
|
|||||||||
|
Tangible assets
|
14
|
3,742
|
|
4,111
|
|
4,058
|
|
||
|
Intangible assets
|
15
|
138
|
|
145
|
|
161
|
|
||
|
Investments in associates and joint ventures
|
17
|
1,507
|
|
1,448
|
|
1,465
|
|
||
|
Other investments
|
18
|
131
|
|
125
|
|
91
|
|
||
|
Inventories
|
19
|
100
|
|
84
|
|
90
|
|
||
|
Trade, other receivables and other assets
|
20
|
67
|
|
34
|
|
13
|
|
||
|
Deferred taxation
|
28
|
4
|
|
4
|
|
1
|
|
||
|
Cash restricted for use
|
21
|
37
|
|
36
|
|
37
|
|
||
|
Other non-current assets
|
—
|
|
—
|
|
18
|
|
|||
|
5,726
|
|
5,987
|
|
5,934
|
|
||||
|
Current assets
|
|||||||||
|
Other investments
|
18
|
7
|
|
5
|
|
1
|
|
||
|
Inventories
|
19
|
683
|
|
672
|
|
646
|
|
||
|
Trade, other receivables and other assets
|
20
|
222
|
|
255
|
|
196
|
|
||
|
Cash restricted for use
|
21
|
28
|
|
19
|
|
23
|
|
||
|
Cash and cash equivalents
|
22
|
205
|
|
215
|
|
484
|
|
||
|
1,145
|
|
1,166
|
|
1,350
|
|
||||
|
Non-current assets held for sale
|
23
|
348
|
|
—
|
|
—
|
|
||
|
1,493
|
|
|
1,166
|
|
|
1,350
|
|
||
|
Total assets
|
7,219
|
|
|
7,153
|
|
|
7,284
|
|
|
|
EQUITY AND LIABILITIES
|
|||||||||
|
Share capital and premium
|
24
|
7,134
|
|
7,108
|
|
7,066
|
|
||
|
Accumulated losses and other reserves
|
(4,471
|
)
|
(4,393
|
)
|
(4,636
|
)
|
|||
|
Shareholders’ equity
|
2,663
|
|
2,715
|
|
2,430
|
|
|||
|
Non-controlling interests
|
41
|
|
39
|
|
37
|
|
|||
|
Total equity
|
2,704
|
|
2,754
|
|
2,467
|
|
|||
|
Non-current liabilities
|
|||||||||
|
Borrowings
|
25
|
2,230
|
|
2,144
|
|
2,637
|
|
||
|
Environmental rehabilitation and other provisions
|
26
|
942
|
|
877
|
|
847
|
|
||
|
Provision for pension and post-retirement benefits
|
27
|
122
|
|
118
|
|
107
|
|
||
|
Trade, other payables and deferred income
|
29
|
3
|
|
4
|
|
5
|
|
||
|
Deferred taxation
|
28
|
363
|
|
496
|
|
514
|
|
||
|
3,660
|
|
3,639
|
|
4,110
|
|
||||
|
Current liabilities
|
|||||||||
|
Borrowings
|
25
|
38
|
|
34
|
|
100
|
|
||
|
Trade, other payables and deferred income
|
29
|
638
|
|
615
|
|
516
|
|
||
|
Taxation
|
30
|
53
|
|
111
|
|
91
|
|
||
|
729
|
|
760
|
|
707
|
|
||||
|
Non-current liabilities held for sale
|
23
|
126
|
|
—
|
|
—
|
|
||
|
855
|
|
|
760
|
|
|
707
|
|
||
|
Total liabilities
|
4,515
|
|
4,399
|
|
4,817
|
|
|||
|
Total equity and liabilities
|
7,219
|
|
|
7,153
|
|
|
7,284
|
|
|
F - 3
ANGLOGOLD ASHANTI LIMITED
FOR THE YEARS ENDED
31 December 2017
,
2016
and
2015
|
Figures in millions
|
Notes
|
2017
|
|
2016
|
|
2015
|
|
||
|
US Dollars
|
|||||||||
|
Cash flows from operating activities
|
|||||||||
|
Receipts from customers
|
4,534
|
|
4,231
|
|
4,154
|
|
|||
|
Payments to suppliers and employees
|
(3,383
|
)
|
(2,929
|
)
|
(2,904
|
)
|
|||
|
Cash generated from operations
|
31
|
1,151
|
|
1,302
|
|
1,250
|
|
||
|
Dividends received from joint ventures
|
6
|
|
37
|
|
57
|
|
|||
|
Taxation refund
|
30
|
14
|
|
12
|
|
21
|
|
||
|
Taxation paid
|
30
|
(174
|
)
|
(165
|
)
|
(184
|
)
|
||
|
Net cash inflow (outflow) from operating activities from continuing operations
|
997
|
|
1,186
|
|
1,144
|
|
|||
|
Net cash inflow (outflow) from operating activities from discontinued operations
|
—
|
|
—
|
|
(5
|
)
|
|||
|
Net cash inflow (outflow) from operating activities
|
997
|
|
1,186
|
|
1,139
|
|
|||
|
Cash flows from investing activities
|
|||||||||
|
Capital expenditure
|
|||||||||
|
- project capital
|
(156
|
)
|
(93
|
)
|
(105
|
)
|
|||
|
- stay-in-business capital
|
(673
|
)
|
(613
|
)
|
(559
|
)
|
|||
|
Expenditure on intangible assets
|
(1
|
)
|
(5
|
)
|
(3
|
)
|
|||
|
Proceeds from disposal of tangible assets
|
7
|
|
4
|
|
6
|
|
|||
|
Other investments acquired
|
(91
|
)
|
(73
|
)
|
(86
|
)
|
|||
|
Proceeds from disposal of other investments
|
78
|
|
61
|
|
81
|
|
|||
|
Investments in associates and joint ventures
|
(27
|
)
|
(11
|
)
|
(11
|
)
|
|||
|
Proceeds from disposal of associates and joint ventures
|
—
|
|
10
|
|
1
|
|
|||
|
Loans advanced to associates and joint ventures
|
(6
|
)
|
(4
|
)
|
(5
|
)
|
|||
|
Loans repaid by associates and joint ventures
|
—
|
|
—
|
|
2
|
|
|||
|
Proceeds from disposal of business and subsidiary
|
—
|
|
—
|
|
819
|
|
|||
|
Costs on disposal of business
|
—
|
|
—
|
|
(7
|
)
|
|||
|
Cash balances in assets disposed
|
—
|
|
—
|
|
(2
|
)
|
|||
|
Decrease (increase) in cash restricted for use
|
(8
|
)
|
8
|
|
(17
|
)
|
|||
|
Interest received
|
15
|
|
14
|
|
25
|
|
|||
|
Net cash inflow (outflow) from investing activities from continuing operations
|
(862
|
)
|
(702
|
)
|
139
|
|
|||
|
Net cash inflow (outflow) from investing activities from discontinued operations
|
—
|
|
—
|
|
(59
|
)
|
|||
|
Net cash inflow (outflow) from investing activities
|
(862
|
)
|
(702
|
)
|
80
|
|
|||
|
Cash flows from financing activities
|
|||||||||
|
Proceeds from borrowings
|
815
|
|
787
|
|
421
|
|
|||
|
Repayment of borrowings
|
(767
|
)
|
(1,333
|
)
|
(1,288
|
)
|
|||
|
Finance costs paid
|
(138
|
)
|
(172
|
)
|
(251
|
)
|
|||
|
Bond settlement premium, RCF and bond transaction costs
|
—
|
|
(30
|
)
|
(61
|
)
|
|||
|
Dividends paid
|
(58
|
)
|
(15
|
)
|
(5
|
)
|
|||
|
Net cash inflow (outflow) from financing activities from continuing operations
|
(148
|
)
|
(763
|
)
|
(1,184
|
)
|
|||
|
Net cash inflow (outflow) from financing activities from discontinued operations
|
—
|
|
—
|
|
(2
|
)
|
|||
|
Net cash inflow (outflow) from financing activities
|
(148
|
)
|
(763
|
)
|
(1,186
|
)
|
|||
|
Net increase (decrease) in cash and cash equivalents
|
(13
|
)
|
(279
|
)
|
33
|
|
|||
|
Translation
|
3
|
|
10
|
|
(17
|
)
|
|||
|
Cash and cash equivalents at beginning of year
|
215
|
|
484
|
|
468
|
|
|||
|
Cash and cash equivalents at end of year
|
22
|
205
|
|
215
|
|
484
|
|
||
F - 4
ANGLOGOLD ASHANTI LIMITED
Group – statement of changes in equity
FOR THE YEARS ENDED
31 December 2017
,
2016
and
2015
|
Equity holders of the parent
|
||||||||||||||||||||
|
Figures in millions
|
Share capital
and premium
|
|
Other capital reserves
(1)
|
|
Retained earnings (Accumulated
losses)
(2)
|
|
Cash flow hedge reserve
(3)
|
|
Available-
for-sale
reserve
(4)
|
|
Actuarial
gains
(losses)
|
|
Foreign
currency
translation
reserve
|
|
Total
|
|
Non-
controlling
interests
|
|
Total
equity
|
|
|
US Dollars
|
||||||||||||||||||||
|
Balance at 31 December 2014
|
7,041
|
|
132
|
|
(3,109
|
)
|
(1
|
)
|
17
|
|
(40
|
)
|
(1,195
|
)
|
2,845
|
|
26
|
|
2,871
|
|
|
Profit (loss) for the year
|
|
|
(85
|
)
|
|
|
|
|
(85
|
)
|
15
|
|
(70
|
)
|
||||||
|
Other comprehensive income (loss)
|
|
1
|
|
|
|
(7
|
)
|
14
|
|
(371
|
)
|
(363
|
)
|
|
(363
|
)
|
||||
|
Total comprehensive income (loss)
|
—
|
|
1
|
|
(85
|
)
|
—
|
|
(7
|
)
|
14
|
|
(371
|
)
|
(448
|
)
|
15
|
|
(433
|
)
|
|
Shares issued
|
25
|
|
|
|
|
|
|
|
25
|
|
|
25
|
|
|||||||
|
Share-based payment for share awards net of exercised
|
|
8
|
|
|
|
|
|
|
8
|
|
|
8
|
|
|||||||
|
Dividends of subsidiaries
|
|
|
|
|
|
|
|
—
|
|
(4
|
)
|
(4
|
)
|
|||||||
|
Translation
|
|
(24
|
)
|
20
|
|
|
(3
|
)
|
7
|
|
|
—
|
|
|
—
|
|
||||
|
Balance at 31 December 2015
|
7,066
|
|
117
|
|
(3,174
|
)
|
(1
|
)
|
7
|
|
(19
|
)
|
(1,566
|
)
|
2,430
|
|
37
|
|
2,467
|
|
|
Profit (loss) for the year
|
|
|
63
|
|
|
|
|
|
63
|
|
17
|
|
80
|
|
||||||
|
Other comprehensive income (loss)
|
|
|
|
|
|
9
|
|
(2
|
)
|
180
|
|
187
|
|
|
187
|
|
||||
|
Total comprehensive income (loss)
|
—
|
|
—
|
|
63
|
|
—
|
|
9
|
|
(2
|
)
|
180
|
|
250
|
|
17
|
|
267
|
|
|
Shares issued
|
42
|
|
|
|
|
|
|
|
42
|
|
|
42
|
|
|||||||
|
Share-based payment for share awards net of exercised
|
|
(7
|
)
|
|
|
|
|
|
(7
|
)
|
|
(7
|
)
|
|||||||
|
Dividends of subsidiaries
|
|
|
|
|
|
|
|
—
|
|
(15
|
)
|
(15
|
)
|
|||||||
|
Transfer to reserves
|
|
|
|
(2
|
)
|
|
|
|
2
|
|
|
—
|
|
|
—
|
|
||||
|
Translation
|
|
7
|
|
(6
|
)
|
|
1
|
|
(2
|
)
|
|
—
|
|
|
—
|
|
||||
|
Balance at 31 December 2016
|
7,108
|
|
117
|
|
(3,119
|
)
|
(1
|
)
|
17
|
|
(21
|
)
|
(1,386
|
)
|
2,715
|
|
39
|
|
2,754
|
|
|
Profit (loss) for the year
|
|
|
(191
|
)
|
|
|
|
|
(191
|
)
|
20
|
|
(171
|
)
|
||||||
|
Other comprehensive income (loss)
|
|
|
|
|
25
|
|
6
|
|
123
|
|
154
|
|
|
154
|
|
|||||
|
Total comprehensive income (loss)
|
—
|
|
—
|
|
(191
|
)
|
—
|
|
25
|
|
6
|
|
123
|
|
(37
|
)
|
20
|
|
(17
|
)
|
|
Shares issued
|
26
|
|
|
|
|
|
|
|
26
|
|
|
26
|
|
|||||||
|
Share-based payment for share awards net of exercised
|
|
(1
|
)
|
|
|
|
|
|
(1
|
)
|
|
(1
|
)
|
|||||||
|
Dividends paid (note 13)
|
|
|
|
|
(39
|
)
|
|
|
|
|
|
|
|
|
(39
|
)
|
|
|
(39
|
)
|
|
Dividends of subsidiaries
|
|
|
|
|
|
|
|
—
|
|
(19
|
)
|
(19
|
)
|
|||||||
|
Translation
|
|
9
|
|
(10
|
)
|
|
1
|
|
(1
|
)
|
|
(1
|
)
|
1
|
|
—
|
|
|||
|
Balance at 31 December 2017
|
7,134
|
|
125
|
|
(3,359
|
)
|
(1
|
)
|
43
|
|
(16
|
)
|
(1,263
|
)
|
2,663
|
|
41
|
|
2,704
|
|
|
(1)
|
Other capital reserves include a surplus on disposal of company shares held by companies prior to the formation of AngloGold Ashanti Limited of
$11m
(
2016
:
$10m
;
2015
:
$9m
), surplus on equity transaction of joint venture of
$36m
(
2016
:
$36m
;
2015
:
$36m
), equity items for share-based payments of
$75m
(
2016
:
$68m
;
2015
:
$69m
) and other reserves.
|
|
(2)
|
Included in accumulated losses are retained earnings totalling
$287m
(
2016
:
$250m
;
2015
:
$210m
) arising at the equity accounted investments and certain subsidiaries which may not be remitted without third party consent.
|
|
(3)
|
Cash flow hedge reserve represents the effective portion of fair value gains or losses in respect of cash flow hedges that expired in prior periods. The cash flow hedge reserve shall remain in equity and will unwind over the life of Serra Grande mine.
|
|
(4)
|
Available-for-sale reserve represents fair value gains or losses on available-for-sale financial assets.
|
F - 5
ANGLOGOLD ASHANTI LIMITED
Notes to the consolidated financial statements
FOR THE YEARS ENDED 31 December, 2017,
2016
and
2015
F - 6
1
ACCOUNTING POLICIES
Statement of compliance
The consolidated and company financial statements are prepared in compliance with International Financial Reporting Standards (IFRS) and Interpretations of those standards, as issued by the International Accounting Standards Board (IASB) in the English language, the South African Institute of Chartered Accountants Financial Reporting Guides as issued by the Accounting Practices Committee, Financial Reporting Pronouncements as issued by Financial Reporting Standards Council, JSE Listings Requirements and in the manner required by the South African Companies Act, 2008.
New standards and interpretations issued
The financial statements have been drawn up on the basis of accounting standards, interpretations and amendments effective at the beginning of the accounting period on 1 January 2017. The adoption of the new standards, interpretations and amendments effective from 1 January 2017 had no material impact on the group.
AngloGold Ashanti assesses the significance of new standards, interpretations and amendments to standards in issue that are not yet adopted but are likely to affect the financial reporting in future years. We have identified that IFRS 15 “Revenue from Contracts with Customers” and IFRS 9 “Financial Instruments”, both of which have an effective date of 1 January 2018, are likely to affect future financial reporting.
IFRS 15 Revenue
Management has assessed the potential impact of IFRS 15 on the financial statements of the group and concluded that the group does not sell product based on multiple-element arrangements and it does not sell product on a provisional or variable pricing basis and as such the new standard does not have a significant impact on the timing or amount of the group’s revenue recognition. However, the adoption of IFRS 15 will result in the presentation of by-product revenue in Revenue from product sales where previously by-product revenue was included in cost of sales. Revenue from product sales includes gold income and by-product revenue. This change in classification results in a corresponding increase in costs of sales, and therefore will not have an impact on previously reported gross profit.
As currently reported:
|
U S Dollars
|
||||||||
|
Figures in millions
|
2017
|
|
2016
|
|
2015
|
|
||
|
Revenue
|
4,543
|
|
4,254
|
|
4,174
|
|
||
|
Gold income
|
4,356
|
|
4,085
|
|
4,015
|
|
||
|
Cost of sales
|
(3,582
|
)
|
(3,263
|
)
|
(3,294
|
)
|
||
|
Gain (loss) on non-hedge derivatives and other commodity contracts
|
10
|
|
19
|
|
(7
|
)
|
||
|
Gross profit
|
784
|
|
841
|
|
714
|
|
||
|
Gross profit %
|
18.00
|
%
|
20.59
|
%
|
17.78
|
%
|
||
By-products revenue for the years ended 2017, 2016 and 2015 (
$154m
,
$138m
and
$127m
respectively) is included in the Revenue line, but is offset and thus reduces cost of sales in the detailed income statement.
On adoption of IFRS 15, AngloGold Ashanti will disclose revenue from all product sales, including by-products sales in Revenue from product sales in the detailed income statement. Accordingly, the detailed income statement would be restated for the effects of adopting IFRS 15 as follows:
|
U S Dollars
|
||||||||
|
Figures in millions
|
2017
|
|
2016
|
|
2015
|
|
||
|
Revenue
|
4,543
|
|
4,254
|
|
4,174
|
|
||
|
Revenue from product sales
|
4,510
|
|
4,223
|
|
4,142
|
|
||
|
Cost of sales
|
(3,736
|
)
|
(3,401
|
)
|
(3,421
|
)
|
||
|
Gain (loss) on non-hedge derivatives and other commodity contracts
|
10
|
|
19
|
|
(7
|
)
|
||
|
Gross profit
|
784
|
|
841
|
|
714
|
|
||
|
Gross profit %
|
17.38
|
%
|
19.91
|
%
|
17.24
|
%
|
||
AngloGold Ashanti intends to apply IFRS 15 retrospectively to each prior reporting period presented in accordance with IAS 8
Accounting Policies, Changes in Accounting Estimates and Errors.
F - 7
IFRS 9
Financial Instruments
The group’s financial assets include debt instruments (held to maturity bonds and negotiable certificates of deposit), cash restricted for use and cash and cash equivalents which will be subject to IFRS 9 expected credit loss model as they are to be carried at amortised cost. The accounting policy for listed equity investments will depend on the nature of the listed investment. Listed equity investments which are held to meet rehabilitation liabilities in future will be classified as fair value through profit and loss. Listed equity investments held for other purposes will be classified as fair value through other comprehensive income. Financial liabilities are currently carried at amortised cost with no requirements to change their recognition or presentation under IFRS 9. We have evaluated the possible impact of the adoption of IFRS 9 including the expected credit loss model and we do not expect the adoption to have a significant impact on total assets, total liabilities or the results of the group.
IFRS 16
Leases
In addition, IFRS 16 “Leases”, with an effective date of 1 January 2019, is likely to affect future financial reporting and management is still in the process of assessing all of the potential consequences arising out of the adoption of this standard. With the removal of the operating lease classification, leases that are within the scope of IFRS 16 will result in an increase in assets and liabilities. We expect a likely increase in the depreciation expense and also an increase in cash flows from operating activities as the lease payments will be recorded as financing outflows in our cash flow statement. Management expects that the mining and drilling contracts which are not classified as finance leases under the current accounting standards (IAS 17 and IFRIC 4), will potentially have the most impact on the group’s results on adoption of IFRS 16.
F - 8
1.1 BASIS OF PREPARATION
The financial statements are prepared according to the historical cost convention, except for the revaluation of certain financial instruments to fair value. The group’s accounting policies as set out below are consistent in all material respects with those applied in the previous year.
The group financial statements are presented in US dollars.
Based on materiality, certain comparatives in the notes have been aggregated and comparatives have been restated to accord with current year disclosures.
The group financial statements incorporate the financial statements of the company, its subsidiaries and its interests in joint ventures and associates. The financial statements of all material subsidiaries, the Environmental Rehabilitation Trust Fund, joint ventures and associates, are prepared for the same reporting period as the holding company, using the same accounting policies.
Subsidiaries are all entities (including structured entities) over which the group has control. The group controls an entity when it is exposed to, or has rights to, variable returns from its involvement with the entity and has the ability to affect those returns through its power over the entity. Control would generally exist where the group owns more than 50% of the voting rights, unless the group and other investors collectively control the entity where they must act together to direct the relevant activities. In such cases, as no investor individually controls the entity the investment is accounted for as an equity method investment or a joint operation. Subsidiaries are fully consolidated from the date on which control is transferred to the group. They are de-consolidated from the date on which control ceases. The group re-assesses whether or not it controls an investee if facts and circumstances indicate that there are changes to one or more of the three elements of control.
Disclosures for non-controlling interests are assessed by reference to consolidated non-controlling interest.
Intra-group transactions, balances and unrealised gains and losses on transactions between group companies, including any resulting tax effect are eliminated. Unrealised losses are also eliminated unless the transaction provides evidence of an impairment of the asset transferred.
F - 9
1.2 SIGNIFICANT ACCOUNTING JUDGEMENTS AND ESTIMATES
Use of estimates
The preparation of the financial statements requires the group’s management to make estimates and assumptions that affect the reported amounts of assets and liabilities and disclosure of contingent assets and liabilities at the date of the financial statements, and the reported amounts of revenues and expenses during the reporting period. The determination of estimates requires the exercise of judgement based on various assumptions and other factors such as historical experience, current and expected economic conditions, and in some cases actuarial techniques. Actual results could differ from those estimates.
The more significant areas requiring the use of management estimates and assumptions relate to Ore Reserve that are the basis of future cash flow estimates and unit-of-production depreciation, depletion and amortisation calculations; environmental, reclamation and closure obligations; asset impairments/reversals (including impairments of goodwill); and write-downs of inventory to net realisable value. Other estimates include employee benefit liabilities and unrecognised tax positions.
Estimates and judgements are continually evaluated and are based on historical experience and other factors, including expectations of future events that are believed to be reasonable under the circumstances.
The judgements that management has applied in the application of accounting policies, and the estimates and assumptions that have a significant risk of causing a material adjustment to the carrying amounts of assets and liabilities within the next financial year, are discussed below.
Carrying value of tangible assets
The majority of mining assets are amortised using the units-of-production method where the mine operating plan calls for production from a well-defined proved and probable Ore Reserve.
For other tangible assets, the straight-line method is applied over the estimated useful life of the asset which does not exceed the estimated mine life based on proved and probable Ore Reserve as the useful lives of these assets are considered to be limited to the life of the relevant mine.
The calculation of the units-of-production rate of amortisation could be impacted to the extent that actual production in the future is different from current forecast production based on proved and probable Ore Reserve. This would generally arise when there are significant changes in any of the factors or assumptions used in estimating Ore Reserve.
These factors could include:
|
•
|
changes in proved and probable Ore Reserve;
|
|
•
|
the grade of Ore Reserve may vary significantly from time to time;
|
|
•
|
differences between actual commodity prices and commodity price assumptions;
|
|
•
|
unforeseen operational issues at mine sites; and
|
|
•
|
changes in capital, operating, mining, processing and reclamation costs, discount rates and foreign exchange rates.
|
Changes in proved and probable Ore Reserve could similarly impact the useful lives of assets amortised on the straight-line method, where those lives are limited to the life of the mine.
The group has a number of surface mining operations that are in the production phase for which production stripping costs are incurred. The benefits that accrue to the group as a result of incurring production stripping costs include (a) ore that can be used to produce inventory and (b) improved access to further quantities of material that will be mined in future periods.
The production stripping costs relating to improved access to further quantities of material in future periods are capitalised as a stripping activity asset, if and only if, all of the following are met:
|
•
|
It is probable that the future economic benefit (improved access to the orebody) associated with the stripping activity will flow to the group;
|
|
•
|
The group can identify the component of the orebody for which access has been improved; and
|
|
•
|
The costs relating to the stripping activity associated with that component or components can be measured reliably.
|
Components of the various orebodies at the operations of the group are determined based on the geological areas identified for each of the orebodies and are reflected in the Ore Reserve reporting of the group. In determining whether any production stripping costs should be capitalised as a stripping activity asset, the group uses three operational guidance measures; two of which relate to production measures, while the third relates to an average stripping ratio measure.
F - 10
Once determined that any portion of the production stripping costs should be capitalised, the group determines the amount of the production stripping costs that should be capitalised with reference to the average mine costs per tonne of the component and the actual waste tonnes that should be deferred. Stripping activity assets are amortised on the units-of-production method based on the Ore Reserve of the component or components of the orebody to which these assets relate.
This accounting treatment is consistent with that for stripping costs incurred during the development phase of a pit, before production commences, except that stripping costs incurred during the development phase of a pit, before production commences, are amortised on the units-of-production method based on the Ore Reserve of the pit.
Deferred stripping costs are included in ‘Mine development costs’, within tangible assets. These costs form part of the total investment in the relevant cash-generating unit, which is reviewed for impairment if events or a change in circumstances indicate that the carrying value may not be recoverable. Amortisation of stripping activity assets is included in operating costs.
The group reviews and tests the carrying value of tangible assets when events or changes in circumstances indicate that the carrying amount may not be recoverable. Assets are grouped at the lowest level for which identifiable cash flows are largely independent of cash flows of other assets, which is generally at the individual mine level. If there are indications that impairment may have occurred, estimates are prepared of expected future cash flows for each group of assets. Expected future cash flows used to determine the value in use of goodwill and tangible assets are inherently uncertain and could materially change over time and impact the recoverable amounts. The cash flows and value in use are significantly affected by a number of factors including published reserves, resources, exploration potential and production estimates, together with economic factors such as spot and future metal prices, discount rates, foreign currency exchange rates, estimates of costs to produce reserves and future capital expenditure. At the reporting date the group assesses whether any of the indicators which gave rise to previously recognised impairments have changed such that the impairment loss no longer exists or may have decreased. The impairment loss is then assessed on the original factors for reversal and if indicated, such reversal is recognised.
The recoverable amount is estimated based on the positive indicators. If an impairment loss has decreased, the carrying amount is recorded at the recoverable amount as limited in terms of IAS 36.
The carrying value of tangible assets at 31 December 2017 was
$3,742m
(2016:
$4,111m
; 2015:
$4,058m
). The impairment and derecognition of tangible assets recognised in the consolidated financial statements for the year ended 31 December 2017 was
$288m
(2016:
$3m
; 2015:
$5m
).
Carrying value of goodwill and intangible assets
Where an investment in a subsidiary, joint venture or an associate is made, any excess of the consideration transferred over the fair value of the attributable Mineral Resource including value beyond proved and probable Ore Reserve, exploration properties and net assets is recognised as goodwill.
Intangible assets that have an indefinite useful life and separately recognised goodwill are not subject to amortisation and are tested annually for impairment and whenever events or changes in circumstance indicate that the carrying amount may not be recoverable. Assets that are subject to amortisation are tested for impairment whenever events or changes in circumstance indicate that the carrying amount may not be recoverable.
An impairment loss is recognised for the amount by which the asset’s carrying amount exceeds its recoverable amount. The recoverable amount is the higher of an asset’s fair value less costs to sell and value in use. For the purposes of assessing impairment, assets are grouped at the lowest levels for which there are separately identifiable cash flows (cash-generating units).
An individual operating mine is not a typical going-concern business because of the finite life of its reserves. The allocation of goodwill to an individual mine will result in an eventual goodwill impairment due to the wasting nature of the mine reporting unit. In accordance with the provisions of IAS 36 “Impairment of Assets”, the group performs its annual impairment review of assigned goodwill during the fourth quarter of each year.
The carrying value of goodwill in the consolidated financial statements at 31 December 2017 was
$127m
(2016:
$126m
; 2015:
$126m
). The impairment of goodwill recognised in the consolidated financial statements for the year ended 31 December 2017 was
$9m
(2016:
nil
; 2015:
nil
).
Income taxes
The group is subject to income taxes in numerous jurisdictions. Significant judgement is required in determining the worldwide provision for income taxes due to the complexity of legislation. There are many transactions and calculations for which the ultimate tax determination is uncertain during the ordinary course of business. The group recognises liabilities for anticipated tax audit issues based on estimates of whether additional taxes will be due. Where the final tax outcome of these matters is different from the amounts that were initially recorded, such differences will impact the income tax and deferred tax provisions in the period in which such determination is made.
F - 11
The group recognises the net future tax benefit related to deferred income tax assets to the extent that it is probable that the deductible temporary differences will reverse in the foreseeable future. Assessing the recoverability of deferred income tax assets requires the group to make significant estimates related to expectations of future taxable income. Estimates of future taxable income are based on forecast cash flows from operations and the application of existing tax laws in each jurisdiction. To the extent that future cash flows and taxable income differ significantly from estimates, the ability of the group to realise the net deferred tax assets recorded at the reporting date could be impacted.
Additionally, future changes in tax laws in the jurisdictions in which the group operates could limit the ability of the group to obtain tax deductions in future periods
Carrying values of the group at 31 December 2017:
|
•
|
deferred tax asset:
$4m
(2016:
$4m
; 2015:
$1m
);
|
|
•
|
deferred tax liability:
$363m
(2016:
$496m
; 2015:
$514m
);
|
|
•
|
taxation liability:
$53m
(2016:
$111m
; 2015:
$91m
); and
|
|
•
|
taxation asset:
$3m
(2016:
$14m
; 2015:
$27m
).
|
Unrecognised value of deferred tax assets:
$470m
(2016:
$477m
; 2015:
$452m
).
Provision for environmental rehabilitation obligations
The group’s mining and exploration activities are subject to various laws and regulations governing the protection of the environment. The group recognises management’s best estimate for decommissioning and restoration obligations in the period in which they are incurred. Future changes to environmental laws and regulations, life of mine estimates, inflation rates, foreign currency exchange rates and discount rates could affect the carrying amount of this provision.
The carrying amount of the rehabilitation obligations for the group at 31 December 2017 was
$724m
(2016:
$705m
; 2015:
$683m
).
Stockpiles and metals in process
Costs that are incurred in or benefit the production process are accumulated in stockpiles and metals in process values. Net realisable value tests are performed at least annually and represent the estimated future sales price of the product, based on prevailing and long term metals prices, less estimated costs to complete production and bring the product to sale.
Surface and underground stockpiles and metals in process are measured by estimating the number of tonnes added and removed from the stockpile, the number of contained ounces based on assay data, and the estimated recovery percentage based on the expected processing method. Stockpile ore tonnages are verified by periodic surveys.
Although the quantities of recoverable metal are reconciled by comparing the grades of ore to the quantities of metals actually recovered (metallurgical balancing), the nature of the process inherently limits the ability to precisely monitor recoverability levels. As a result, the metallurgical balancing process is constantly monitored and engineering estimates are refined based on actual results over time.
Variations between actual and estimated quantities resulting from changes in assumptions and estimates that do not result in write-downs to net realisable value are accounted for on a prospective basis.
The carrying value of inventories (excluding finished goods and mine operating supplies) for the group at 31 December 2017 was
$424m
(2016:
$397m
; 2015:
$393m
).
Recoverable tax, rebates, levies and duties
In a number of countries, particularly in Continental Africa, AngloGold Ashanti is due refunds of indirect tax which remain outstanding for periods longer than those provided for in the respective statutes.
In addition, AngloGold Ashanti has unresolved tax disputes in a number of countries, particularly in Continental Africa and in Brazil. If the outstanding input taxes are not received and the tax disputes are not resolved in a manner favourable to AngloGold Ashanti, it could have a material adverse effect upon the carrying value of these assets.
The net carrying value of recoverable tax, rebates, levies and duties for the group at 31 December 2017 was
$174m
(2016:
$135m
; 2015:
$94m
).
F - 12
Post-retirement obligations
The determination of AngloGold Ashanti’s obligation and expense post-retirement liabilities, depends on the selection of certain assumptions used by actuaries to calculate amounts. These assumptions include, among others, the discount rate, the expected long-term rate of return of plan assets, health care inflation costs, rates of increase in compensation costs and the number of employees who reach retirement age before the mine reaches the end of its life. While AngloGold Ashanti believes that these assumptions are appropriate, significant changes in the assumptions may materially affect post-retirement obligations as well as future expenses, which may result in an impact on earnings in the periods that the changes in these assumptions occur.
The carrying value of the post-retirement plans at 31 December 2017 was
$122m
(2016:
$118m
; 2015:
$89m
).
Ore Reserve estimates
An Ore Reserve estimate is an estimate of the amount of product that can be economically and legally extracted from the group’s properties. In order to calculate the Ore Reserve, estimates and assumptions are required about a range of geological, technical and economic factors, including quantities, grades, production techniques, recovery rates, production costs, transport costs, commodity demand, commodity prices and exchange rates.
Estimating the quantity and/or grade of the Ore Reserve requires the size, shape and depth of orebodies to be determined by analysing geological data such as the logging and assaying of drill samples. This process may require complex and difficult geological judgements and calculations to interpret the data.
The group is required to determine and report its Ore Reserve in accordance with the South African Code for the reporting of Exploration Results, Mineral Resources and Mineral Reserves (The SAMREC Code) 2016 Edition.
Because the economic assumptions used to estimate changes in the Ore Reserve from period to period, and because additional geological data is generated during the course of operations, estimates of the Ore Reserve may change from period to period. Changes in the reported Ore Reserve may affect the group’s financial results and financial position in a number of ways, including the following:
|
•
|
asset carrying values may be affected due to changes in estimated future cash flows;
|
|
•
|
depreciation, depletion and amortisation charged in the income statement may change where such charges are determined by the units-of-production method, or where the useful economic lives of assets change;
|
|
•
|
overburden removal costs, including production stripping activities, recorded on the statement of financial position or charged in the income statement may change due to changes in stripping ratios or the units-of-production method of depreciation;
|
|
•
|
decommissioning site restoration and environmental provisions may change where changes in the estimated Ore Reserve affect expectations about the timing or cost of these activities; and
|
|
•
|
the carrying value of deferred tax assets may change due to changes in estimates of the likely recovery of the tax benefits.
|
Development expenditure
Development activities commence after project sanctioning by the appropriate level of management. Judgement is applied by management in determining when a project has reached a stage at which economically recoverable reserves exist such that development may be sanctioned. In exercising this judgement, management is required to make certain estimates and assumptions similar to those described in the accounting policy for exploration and evaluation assets. Any such estimates and assumptions may change as new information becomes available. If, after having started the development activity, a judgement is made that a development asset is impaired, the appropriate amount will be written off to the income statement.
Provision for silicosis
Significant judgement is applied in estimating the costs that will be incurred to settle the silicosis class action claims and related expenditure.The final costs may differ from current cost estimates. The provision is based on actuarial assumptions including:
|
•
|
silicosis prevalence rates;
|
|
•
|
estimated settlement per claimant;
|
|
•
|
benefit take-up rates;
|
|
•
|
disease progression rates;
|
|
•
|
timing of cashflows; and
|
|
•
|
discount rate.
|
Management believes the assumptions are appropriate, however changes in the assumptions may materially affect the provision and final costs of settlement. In prior years, a silicosis provision was not raised as a reliable estimate could not be determined.
The carrying value of the silicosis provision at 31 December 2017 was
$63m
(2016:
nil
; 2015:
nil
).
F - 13
Contingencies
By their nature, contingencies will only be resolved when one or more future events occur or fail to occur. The assessment of such contingencies inherently involves the exercise of significant judgement and estimates of the outcome of future events. Such contingencies include, but are not limited to environmental obligations, litigation, regulatory proceedings, tax matters and losses resulting from other events and developments.
Firstly, when a loss is considered probable and reasonably estimable, a liability is recorded in the amount of the best estimate for the ultimate loss. The likelihood of a loss with respect to a contingency can be difficult to predict and determining a meaningful estimate of the loss or a range of loss may not always be practicable based on the information available at the time and the potential effect of future events and decisions by third parties that will determine the ultimate resolution of the contingency. It is not uncommon for such matters to be resolved over many years, during which time relevant developments and new information is continuously evaluated to determine both the likelihood of any potential loss and whether it is possible to reasonably estimate a range of possible losses. When a loss is probable but a reasonable estimate cannot be made, disclosure is provided.
In determining the threshold for disclosure on a qualitative and quantitative basis, management considers the potential for a disruptive effect on the normal functioning of the group and/or whether the contingency could impact investment decisions. Such qualitative matters considered are reputational risks, regulatory compliance issues and reasonable investor considerations. For quantitative purposes an amount of $18m, has been considered.
As a global company, the group is exposed to numerous legal risks. The outcome of currently pending and future proceedings cannot be predicted with certainty. Litigation and other judicial proceedings as a rule raise difficult and complex legal issues and are subject to uncertainties and complexities including, but not limited to, the facts and circumstances of each particular case, issues regarding the jurisdiction in which each suit is brought and differences in applicable law. Upon resolution of any pending legal matter, the group may be forced to incur charges in excess of the presently established provisions and related insurance coverage. It is possible that the financial position, results of operations or cash flows of the group could be materially affected by the unfavourable outcome of litigation.
F - 14
1.3 SUMMARY OF SIGNIFICANT ACCOUNTING POLICIES
Equity-accounted investments
Joint ventures
A joint venture is an entity in which the group holds a long term interest and which the group and one or more other ventures jointly control under a contractual arrangement, that provides for strategic, financial and operating policy decisions relating to the activities requiring unanimous consent of the parties sharing control. The group’s interests in joint arrangements classified as joint ventures are accounted for using the equity method.
Profits and losses realised in connection with transactions between the group and joint ventures are eliminated in proportion to share ownership. Such profits and losses are deducted from the group’s equity and related statement of financial position amount and released in the group accounts when the assets are effectively realised outside the group. Dividends received from joint ventures are included in operating activities in the cash flow statement.
Associates
The equity method of accounting is used for an investment over which the group exercises significant influence and normally owns between 20% and 50% of the voting equity. Associates are equity-accounted from the effective date of acquisition to the effective date of disposal.
Profits and losses realised in connection with transactions between the group and associated companies are eliminated in proportion to share ownership. Such profits and losses are deducted from the group’s equity and related statement of financial position amount and released in the group accounts when the assets are effectively realised outside the group. Dividends received from associates are included in investing activities in the cash flow statement.
Joint ventures and associates
If necessary, impairment losses on loans and equity are reported under share of joint ventures and associates profit and loss.
Any losses of equity-accounted investments are brought to account in the consolidated financial statements until the investment in such investments is written down to zero. Thereafter, losses are accounted for only insofar as the group is committed to providing financial support to such investees.
The carrying value of equity-accounted investments represents the cost of each investment, including goodwill, balance outstanding on loans advanced if the loan forms part of the net investment in the investee, any impairment losses recognised, the share of post-acquisition retained earnings and losses, and any other movements in reserves. The carrying value of equity-accounted investments is reviewed when indicators arise and if any impairment in value has occurred; it is recognised in the period in which the impairment arose.
In determining materiality for the disclosure requirements of IFRS 12 “Disclosure of Interest in Other Entities”, management has assessed that amounts representing the carrying value of at least 90% of the investments in associates and joint ventures balances, reported in the statement of financial position, constitute quantitative materiality.
Unincorporated joint ventures – joint operations
A joint operation is a joint arrangement whereby the parties that have joint control of the arrangement have rights to the use of assets and obligations for the liabilities of the arrangement. The group accounts for activities under joint operations by recognising in relation to the joint operation, the assets it controls and the liabilities it incurs, the expenses it incurs and the revenue from the sale or use of its share of the joint operations output.
Foreign currency translation
Functional currency
Items included in the financial statements of each of the group’s entities are measured using the currency of the primary economic environment in which the entity operates (the ‘functional currency’). The functional currency of the parent company is South African Rands.
F - 15
Transactions and balances
Foreign currency transactions are translated into the functional currency using the approximate exchange rates prevailing at the dates of the transactions. Foreign exchange gains and losses resulting from the settlement of foreign currency transactions and from the translation at the reporting period exchange rate of monetary assets and liabilities denominated in foreign currencies are recognised in the income statement.
Group companies
The results and financial position of all group entities (none of which has the currency of a hyperinflationary economy) that have a functional currency different from the presentation currency are translated into the presentation currency as follows:
|
•
|
share capital and premium are translated at historical rates of exchange at the reporting date;
|
|
•
|
retained earnings are converted at historical average exchange rates;
|
|
•
|
assets and liabilities for each statement of financial position presented are translated at the closing rate at the date of that statement of financial position;
|
|
•
|
income and expenses for each income statement presented are translated at monthly average exchange rates (unless this average is not a reasonable approximation of the cumulative effect of the rates prevailing on the transaction dates, in which case income and expenses are translated at the rates prevailing at the date of the transaction); and
|
|
•
|
all resulting exchange differences are recognised in other comprehensive income and presented as a separate component of equity (foreign currency translation);
|
Exchange differences arising from the translation of the net investment in foreign operations, and of borrowings and other currency instruments designated as hedges of such investments, are taken to other comprehensive income on consolidation. On repayment or realisation, permanent loans and investments are recycled from FCTR to the income statement. For the company, the exchange differences on such monetary items are reported in the company income statement.
Segment reporting
An operating segment is a business activity whose results are regularly reviewed by the chief operating decision maker in order to make decisions about resources to be allocated to it and to assess its performance and for which discrete financial information is available. The chief operating decision maker has been determined to be the Executive Committee.
Tangible assets
Tangible assets are recorded at cost less accumulated amortisation and impairments/reversals. Cost includes pre-production expenditure incurred during the development of a mine and the present value of related future decommissioning costs.
Interest on borrowings relating to the financing of major capital projects under construction is capitalised during the construction phase as part of the cost of the project. Such borrowing costs are capitalised over the period during which the asset is being acquired or constructed and borrowings have been incurred. Capitalisation ceases when construction is interrupted for an extended period or when the asset is substantially complete. Other borrowing costs are expensed as incurred.
If there is an indication that the recoverable amount of any of the tangible assets is less than the carrying value, the recoverable amount is estimated and an allowance is made for the impairment.
Subsequent costs are included in the asset’s carrying amount only when it is probable that future economic benefits associated with the asset will flow to the group, and the cost of the addition can be measured reliably. All other repairs and maintenance are charged to the income statement during the financial period in which they are incurred.
To the extent a legal or constructive obligation to a third party exists, the acquisition cost includes estimated costs of dismantling and removing the asset and restoring the site. A change in estimated expenditures for dismantling, removal and restoration is added to or deducted from the carrying value of the related asset. To the extent that the change would result in a negative carrying amount, this effect is recognised as income. The change in depreciation charge is recognised prospectively.
For assets amortised on the units-of-production method, amortisation is calculated to allocate the cost of each asset to its residual value over its estimated useful life.
For those assets not amortised on the units-of-production method, amortisation is calculated over their estimated useful life as follows:
|
•
|
buildings up to life of mine;
|
|
•
|
plant and machinery up to life of mine;
|
|
•
|
equipment and motor vehicles up to
five years
;
|
|
•
|
computer equipment up to
three years
; and
|
|
•
|
leased assets over the shorter of the period of the lease and the useful life of the leased asset.
|
F - 16
Major renovations are depreciated over the remaining useful life of the related asset or to the date of the next major renovation, whichever is sooner.
Assets are amortised to residual values. Residual values and useful lives are reviewed, and adjusted if appropriate, at the beginning of each financial year.
Gains and losses on disposals are determined by comparing net sale proceeds with the carrying amount at the date of sale. These are included in the income statement.
Mine development costs
Capitalised mine development costs include expenditure incurred to develop new orebodies, to define further mineralisation in existing orebodies and, to expand the capacity of a mine. Mine development costs include acquired proved and probable Ore Reserve at cost at the acquisition date. These costs are amortised from the date on which commercial production begins.
Depreciation, depletion and amortisation of mine development costs are computed by the units-of-production method based on estimated proved and probable Ore Reserve. The proved and probable Ore Reserve reflects estimated quantities of reserves which can be recovered economically in the future from known mineral deposits.
Capitalised mine development costs also include stripping activity assets relating to production stripping activities incurred in the production phase of open-pit operations of the group. Once determined that any portion of the production stripping costs should be capitalised, the group determines the average mine costs per tonne of the component and the waste tonnes to which the production stripping costs relate to determine the amount of the production stripping costs that should be capitalised. Stripping activity assets are amortised on a units-of-production method based on the Ore Reserve of the component of the orebody to which these assets relate.
The average mine cost per tonne of the component is calculated as the total expected costs to be incurred to mine the relevant component of the orebody, divided by the number of tonnes expected to be mined from the component. The average mine cost per tonne of the component to which the stripping activity asset relates are recalculated annually in the light of additional knowledge and changes in estimates.
Mine infrastructure
Mine plant facilities, including decommissioning assets, are amortised using the lesser of their useful life or units-of-production method based on estimated proved and probable Ore Reserve.
Land and assets under construction
Land and assets under construction are not depreciated and are measured at historical cost less impairments.
Mineral rights and dumps
Mineral rights are amortised using the units-of-production method based on the estimated proved and probable Ore Reserve. Dumps are amortised over the period of treatment.
Exploration and evaluation assets
All pre-license and exploration costs, including geological and geographical costs, labour, Mineral Resource and exploratory drilling cost, are expensed as incurred, until it is concluded that a future economic benefit will more likely than not be realised. In evaluating if expenditures meet this criterion to be capitalised, several different sources of information are used depending on the level of exploration. While the criterion for concluding that expenditure should be capitalised is always probable, the information used to make that determination depends on the level of exploration:
|
•
|
Costs on greenfields sites, being those where the group does not have any mineral deposits which are already being mined or developed under the planned method of extraction, are expensed as incurred until the group is able to demonstrate that future economic benefits are probable, which generally will be the establishment of proved and probable Ore Reserve at this location;
|
|
•
|
Costs on brownfields sites, being those adjacent to mineral deposits which are already being mined or developed under the planned method of extraction, are expensed as incurred until the group is able to demonstrate that future economic benefits are probable, which generally will be the establishment of increased inclusive proved and probable Ore Reserve after which the expenditure is capitalised as a mine development cost; and
|
|
•
|
Costs relating to extensions of mineral deposits, which are already being mined or developed, including expenditure on the definition of mineralisation of such mineral deposits, are capitalised as a mine development cost.
|
Costs relating to property acquisitions are capitalised within mine development costs.
F - 17
Leased assets
Assets subject to finance leases are capitalised at the lower of their fair value or the present value of minimum lease payments measured at inception of the lease with the related lease obligation recognised at the same amount. Capitalised leased assets are depreciated over the shorter of their estimated useful lives and the lease term. Finance lease payments are allocated using the rate implicit in the lease, which is included in finance costs, and the capital repayment, which reduces the liability to the lessor.
Operating lease rentals are charged against operating profits in a systematic manner related to the period the assets concerned will be used.
Non-current assets held for sale
Non-current assets and disposal groups are classified as held for sale if their carrying amount will be recovered principally through a sale transaction rather than through continuing use. This condition is regarded as having been met only when the sale is highly probable and the asset (or disposal group) is available for immediate sale in its present condition. Management must be committed to the sale, which should be expected to qualify for recognition as a completed sale within one year from the date of classification.
Non-current assets (and disposal groups) classified as held for sale are measured at the lower of their previous carrying amount and fair value less costs to sell.
Inventories
Inventories are valued at the lower of cost and net realisable value after appropriate allowances for redundant and obsolete items. Cost is determined on the following bases:
|
•
|
metals in process are valued at the average total production cost at the relevant stage of production;
|
|
•
|
gold doré/bullion is valued on an average total production cost method;
|
|
•
|
ore stockpiles are valued at the average moving cost of mining and stockpiling the ore. Stockpiles are classified as a non-current asset where the stockpile exceeds current processing capacity;
|
|
•
|
by-products, which include uranium oxide, silver and sulphuric acid, are valued using an average total production cost method;
|
|
•
|
mine operating supplies are valued at average cost; and
|
|
•
|
heap leach pad materials are measured on an average total production cost basis.
|
A portion of the related depreciation, depletion and amortisation charge is included in the cost of inventory. Impairments resulting from a decrease in prices are disclosed in special items, all other impairments are included in cost of sales.
Provisions
Provisions are recognised when the group has a present obligation, whether legal or constructive, because of a past event for which it is probable that an outflow of resources embodying economic benefits will be required to settle the obligation and a reliable estimate can be made of the amount of the obligation. Where some or all of the expenditure required to settle a provision is expected to be reimbursed by another party, the reimbursement is recognised only when the reimbursement is virtually certain. The amount to be reimbursed is recognised as a separate asset. Where the group has a joint and several liability with one or more other parties, no provision is recognised to the extent that those other parties are expected to settle part or all of the obligation.
Provisions are measured at the present value of management’s best estimate of the expenditure required to settle the obligation at the reporting date. The discount rate used to determine the present value reflects current market assessments of the time value of money and the risks specific to the liability.
Litigation and administrative proceedings are evaluated on a case-by-case basis considering the information available, including that of legal counsel, to assess potential outcomes. Where it is considered probable that an obligation will result in an outflow of resources, a provision is recorded for the present value of the expected cash outflows if these are reasonably measurable. These provisions cover the estimated payments to plaintiffs, court fees and the cost of potential settlements.
AngloGold Ashanti does not recognise a contingent liability on its statement of financial position except in a business combination where the contingent liability represents a possible obligation.
Employee benefits
Other post-employment benefit obligations
Some group companies provide post-retirement health care benefits to their retirees. The entitlement to these benefits is usually conditional on the employee remaining in service up to retirement age and completion of a minimum service period. The expected costs of these benefits are accrued over the period of employment using an accounting methodology on the same basis as that used for defined benefit pension plans. Actuarial gains and losses arising from experience adjustments and changes in actuarial assumptions are recorded in other comprehensive income immediately. These obligations are valued annually by independent qualified actuaries.
F - 18
Termination benefits
Termination benefits are payable when employment is terminated before the normal retirement date, or when an employee accepts voluntary redundancy in exchange for these benefits. The group recognises a liability and expense for termination benefits at the earlier of the following dates: (a) when the entity can no longer withdraw the offer of those benefits; and (b) when the entity recognises costs for a restructuring that is within the scope of IAS 37 “Provisions, Contingent Liabilities and Contingent Assets” and involves the payment of termination benefits. The group recognises termination benefits when it is demonstrably committed to either terminating the employment of current employees according to a detailed formal plan without possibility of withdrawal; or providing termination benefits as a result of an offer made to encourage voluntary redundancy based on the number of employees expected to accept the offer. Benefits falling due more than 12 months after reporting date are discounted to present value.
Share-based payments
The group’s management awards certain employee bonuses in the form of equity-settled share-based payments on a discretionary basis.
The fair value of the equity instruments granted is calculated at grant date. For transactions with employees, fair value is based on market prices of the equity instruments granted, if available, taking into account the terms and conditions upon which those equity instruments were granted. If market prices of the equity instruments granted are not available, the fair value of the equity instruments granted is estimated using an appropriate valuation model. Vesting conditions, other than market conditions, are not taken into account when estimating the fair value of shares or share options at measurement date.
Over the vesting period, the fair value at measurement date is recognised as an employee benefit expense with a corresponding increase in other capital reserves based on the group’s estimate of the number of instruments that will eventually vest. The income statement charge or credit for a period represents the movement in cumulative expense recognised as at the beginning and end of that period. Vesting assumptions for non-market conditions are reviewed at each reporting date to ensure they reflect current expectations.
When options are exercised or share awards vest, the proceeds received, net of any directly attributable transaction costs, are credited to share capital (nominal value) and share premium.
Where the terms of an equity settled award are modified, as a minimum, an expense is recognised as if the terms had not been modified. In addition, an expense is recognised for any modification which increases the total fair value of the share-based payment arrangement, or is otherwise beneficial to the employee, as measured at the date of the modification.
In addition, the group's management awards certain employee bonuses in the form of a cash settled scheme, whereby awards granted are linked to the performance of the company's share price. A liability is recognised based upon the grant date fair value and is subsequently remeasured to the closing share price at each reporting date up to the date of vesting. Remeasurements to fair value are recognised in the income statement.
In the company financial statements, share-based payment arrangements with employees of other group entities are recognised by charging that entity its share of the expense and a corresponding increase in other capital reserves. When options are exercised or share awards vest, the proceeds received, net of any directly attributable transaction costs, are credited to share capital (nominal value) and share premium.
Environmental expenditure
The group has long-term remediation obligations comprising decommissioning and restoration liabilities relating to its past operations which are based on the group’s environmental management plans, in compliance with current environmental and regulatory requirements. Provisions for non-recurring remediation costs are made when there is a present obligation, it is probable that expenditure on remediation work will be required and the cost can be estimated within a reasonable range of possible outcomes. The costs are based on currently available facts, technology expected to be available at the time of the clean-up, laws and regulations presently or virtually certain to be enacted and prior experience in remediation of contaminated sites.
Contributions for the South African operations are made to Environmental Rehabilitation Trust Funds, created in accordance with local statutory requirements where applicable, to solely fund the estimated cost of rehabilitation during and at the end of the life of a mine. The amounts contributed to the trust funds are accounted for as non-current assets in the company. Interest earned on monies paid to rehabilitation trust funds is accrued on a time proportion basis and is recorded as interest income. These funds may only be utilised for purposes of settling decommissioning and environmental liabilities relating to existing mining operations. All income earned on these funds is reinvested or spent to meet these obligations. For group purposes, the trusts are consolidated.
F - 19
Decommissioning costs
The provision for decommissioning represents the cost that will arise from rectifying damage caused before production commences. Accordingly, a provision and a decommissioning asset is recognised and included within mine infrastructure.
Decommissioning costs are provided at the present value of the expenditures expected to settle the obligation, using estimated cash flows based on current prices. The unwinding of the decommissioning obligation is included in the income statement. Estimated future costs of decommissioning obligations are reviewed regularly and adjusted as appropriate for new circumstances or changes in law or technology. Changes in estimates are capitalised or reversed against the relevant asset. Estimates are discounted at a pre-tax rate that reflects current market assessments of the time value of money.
Gains or losses from the expected disposal of assets are not taken into account when determining the provision.
Restoration costs
The provision for restoration represents the cost of restoring site damage after the start of production. Changes in the provision are recorded in the income statement as a cost of production.
Restoration costs are estimated at the present value of the expenditures expected to settle the obligation, using estimated cash flows based on current prices and adjusted for risks specific to the liability. The estimates are discounted at a pre-tax rate that reflects current market assessments of the time value of money.
Revenue recognition
Revenue is recognised at the fair value of the consideration received or receivable to the extent that it is probable that economic benefits will flow to the group and revenue and costs can be reliably measured. The following criteria must also be present:
|
•
|
the sale of mining products is recognised when the significant risks and rewards of ownership of the products are transferred to the buyer;
|
|
•
|
dividends and royalties are recognised when the right to receive payment is established;
|
|
•
|
interest is recognised on a time proportion basis, taking account of the principal outstanding and the effective rate over the period to maturity, when it is determined that such income will accrue to the group; and
|
|
•
|
where a by-product is not regarded as significant, revenue is credited against cost of sales, when the significant risks and rewards of ownership of the products are transferred to the buyer.
|
Taxation
Deferred taxation is provided on all qualifying temporary differences at the reporting date between the tax bases of assets and liabilities and their carrying amounts for financial reporting purposes.
Deferred tax assets are only recognised to the extent that it is probable that the deductible temporary differences will reverse in the foreseeable future and future taxable profit will be available against which the temporary difference can be utilised.
The carrying amount of deferred tax assets is reviewed at each reporting date.
Deferred tax assets and liabilities are measured at future anticipated tax rates, which have been enacted or substantively enacted at the reporting date.
Current and deferred tax is recognised as income or expense and included in profit or loss for the period, except to the extent that the tax arises from a transaction or event which is recognised, in the same or a different period in other comprehensive income or directly in equity, or a business combination that is an acquisition.
Current tax is measured on taxable income at the applicable statutory rate enacted or substantively enacted at the reporting date. Interest and penalties, if any, are recognised in the income statement as part of taxation expense.
Special items
Items of income and expense that require separate disclosure, in accordance with IAS 1.97, are classified as special items on the face of the income statement.
Financial instruments
Financial instruments are initially measured at fair value when the group becomes a party to their contractual arrangements. Transaction costs are included in the initial measurement of financial instruments, except financial instruments classified as at fair value through profit or loss. The subsequent measurement of financial instruments is dealt with below.
F - 20
A financial asset is derecognised when the right to receive cash flows from the asset has expired or the group has transferred its rights to receive cash and either (a) has transferred substantially all the risks and rewards of the asset, or (b) has neither transferred nor retained substantially all the risks and rewards of the asset, but has transferred control of the asset.
A financial liability is derecognised when the obligation under the liability is discharged, cancelled or expires.
On derecognition of a financial asset, the difference between the proceeds received or receivable and the carrying amount of the asset is included in profit or loss.
On derecognition of a financial liability, the difference between the carrying amount of the liability extinguished or transferred to another party and the amount paid is included in profit or loss.
Regular way purchases and sales of all financial assets and liabilities are accounted for at settlement date.
Other investments
Listed equity investments and unlisted equity investments, other than investments in subsidiaries, joint ventures and associates, are classified as available-for-sale financial assets and subsequently measured at fair value. Listed investments’ fair values are calculated by reference to the quoted selling price at the close of business on the reporting date. Fair values for unlisted equity investments are estimated using methods reflecting the economic circumstances of the investee. Equity investments for which fair value cannot be measured reliably are recognised at cost less impairment. Changes in fair value are recognised in other comprehensive income in the period in which they arise. These amounts are removed from other comprehensive income and reported in income when the asset is derecognised or when there is objective evidence that the asset is impaired based on a significant or prolonged decrease in the fair value of the equity instrument below its cost.
Investments which management has the intention and ability to hold to maturity are classified as held-to-maturity financial assets and are subsequently measured at amortised cost using the effective interest rate method. If there is evidence that held-to-maturity financial assets are impaired, the carrying amount of the assets is reduced and the loss recognised in the income statement.
Other non-current assets
Loans and receivables are subsequently measured at amortised cost using the effective interest rate method. If there is evidence that loans and receivables are impaired, the carrying amount of the assets is reduced and the loss recognised in the income statement.
Trade and other receivables
Trade receivables are recognised initially at fair value and subsequently measured at amortised cost using the effective interest method, less accumulated impairment. Impairment of trade and other receivables is established when there is objective evidence as a result of a loss event that the group will not be able to collect all amounts due according to the original terms of the receivables. Objective evidence includes failure by the counterparty to perform in terms of contractual arrangements and agreed terms. The amount of the impairment is the difference between the asset’s carrying amount and the present value of estimated future cash flows, discounted at the original effective interest rate. Impairments relate to specific accounts whereby the carrying amount is directly reduced. The impairment is recognised in the income statement.
Cash and cash equivalents
Cash and cash equivalents are defined as cash on hand, demand deposits and short-term, highly liquid investments which are readily convertible to known amounts of cash and subject to insignificant risk of changes in value. They are measured at amortised cost which is deemed to be fair value as they have a short-term maturity.
Cash restricted for use
Cash which is subject to legal or contractual restrictions on use is classified separately as cash restricted for use.
Financial liabilities
Financial liabilities, other than derivatives and liabilities classified as at fair value through profit or loss, are subsequently measured at amortised cost, using the effective interest rate method.
Financial liabilities permitted to be designated on initial recognition as being at fair value through profit or loss are recognised at fair value, with transaction costs being recognised in profit or loss, and are subsequently measured at fair value. Gains and losses on financial liabilities that are designated as at fair value through profit or loss are recognised in profit or loss as they arise. Fair
F - 21
value of a financial liability that is quoted in an active market is the current offer price times the number of units of the instrument held or issued.
Financial guarantee contracts are accounted for as financial instruments and measured initially at estimated fair value. They are subsequently measured at the higher of the amount determined in accordance with IAS 37 “Provisions, Contingent Liabilities and Contingent Assets”, and the amount initially recognised less (when appropriate) cumulative amortisation recognised in accordance with IAS 18 “Revenue”.
Fair value measurements
The group measures financial instruments at fair value at each reporting date where relevant. Fair value is the price that would be received to sell an asset or paid to transfer a liability in an orderly transaction between market participants at the measurement date. The fair value of an asset or a liability is measured using the assumptions that market participants would use when pricing the asset or liability, assuming that market participants act in their economic best interest.
For the purpose of fair value disclosures, the group has determined classes of assets and liabilities on the basis of the nature, characteristics and risks of the asset or liability and the level of the fair value hierarchy. The group uses valuation techniques that are appropriate in the circumstances and for which sufficient data are available to measure fair value, maximising the use of relevant observable inputs and minimising the use of unobservable inputs.
F - 22
2 SEGMENTAL INFORMATION
AngloGold Ashanti Limited’s operating segments are being reported based on the financial information provided to the Chief Executive Officer and the Executive Committee, collectively identified as the Chief Operating Decision Maker (CODM). The group produces gold as its primary product and does not have distinct divisional segments in terms of principal business activity, but manages its business on the basis of different geographic segments (including equity accounted investments). Individual members of the Executive Committee are responsible for geographic regions of the business.
Group analysis by origin is as follows:
|
Figures in millions
|
Total assets
(1)(2)(3)
|
Net operating assets
(2)(3)
|
|||||||||||||||
|
US Dollars
|
2017
|
|
2016
|
|
2015
|
|
2017
|
|
2016
|
|
2015
|
|
|||||
|
South Africa
|
1,734
|
|
1,818
|
|
1,629
|
|
1,388
|
|
1,520
|
|
1,352
|
|
|||||
|
Continental Africa
|
3,153
|
|
3,090
|
|
3,121
|
|
1,296
|
|
1,278
|
|
1,349
|
|
|||||
|
Australasia
|
929
|
|
804
|
|
837
|
|
664
|
|
581
|
|
625
|
|
|||||
|
Americas
|
1,258
|
|
1,273
|
|
1,341
|
|
909
|
|
923
|
|
963
|
|
|||||
|
Other, including non-gold producing subsidiaries
|
145
|
|
168
|
|
356
|
|
24
|
|
26
|
|
11
|
|
|||||
|
7,219
|
|
|
7,153
|
|
|
7,284
|
|
|
4,281
|
|
|
4,328
|
|
|
4,300
|
|
|
|
Non-current assets considered material, by country are:
|
|||||||||||||||||
|
South Africa
(5)
|
1,295
|
|
1,678
|
|
1,463
|
|
|||||||||||
|
Foreign entities
(5)
|
4,259
|
|
4,144
|
|
4,324
|
|
|||||||||||
|
DRC
(5)
|
1,423
|
|
1,400
|
|
1,406
|
|
|||||||||||
|
Ghana
(5)
|
533
|
|
520
|
|
543
|
|
|||||||||||
|
Tanzania
(5)
|
422
|
|
437
|
|
517
|
|
|||||||||||
|
Australia
(5)
|
764
|
|
673
|
|
703
|
|
|||||||||||
|
Brazil
(5)
|
632
|
|
645
|
|
657
|
|
|||||||||||
|
Figures in millions
|
Amortisation
|
|||||||
|
US Dollars
|
2017
|
|
2016
|
|
2015
|
|
||
|
South Africa
|
133
|
|
167
|
|
182
|
|
||
|
Continental Africa
(1)
|
421
|
|
365
|
|
339
|
|
||
|
Australasia
|
130
|
|
126
|
|
117
|
|
||
|
Americas
(1)
|
273
|
|
260
|
|
240
|
|
||
|
Other, including non-gold producing subsidiaries
|
2
|
|
5
|
|
7
|
|
||
|
959
|
|
|
923
|
|
|
885
|
|
|
|
Equity-accounted investments included above
|
(136
|
)
|
(114
|
)
|
(108
|
)
|
||
|
Continuing operations
|
823
|
|
|
809
|
|
|
777
|
|
|
Discontinued operations
|
—
|
|
—
|
|
6
|
|
||
|
823
|
|
|
809
|
|
|
783
|
|
|
|
(1)
|
Includes equity-accounted investments.
|
|
(2)
|
Total assets includes allocated goodwill of
nil
(
2016
:
$8m
;
2015
:
$7m
) for South Africa,
$119m
(
2016
:
$110m
;
2015
:
$111m
) for Australasia and
$8m
(
2016
:
$8m
;
2015
:
$8m
) for Americas (note 15). The South African segment includes assets held for sale of
$348m
(refer note 23).
|
|
(3)
|
In 2017, pre-tax impairments and derecognition of assets of
$294m
were accounted for in South Africa (
2016
:
$3m
;
2015
:
$5m
).
|
|
(4)
|
The group's segmental profit measure is gross profit (loss), which excludes the results of associates and joint ventures. For the reconciliation of gross profit (loss) to profit before taxation, refer to the group income statement.
|
|
(5)
|
Non-current assets exclude financial instruments and deferred tax assets.
|
F - 23
NOTES TO THE CONSOLIDATED FINANCIAL STATEMENTS
(continued)
2 Segmental Information
(continued)
|
Figures in millions
|
Capital expenditure
|
|||||||
|
US Dollars
|
2017
|
|
2016
|
|
2015
|
|
||
|
South Africa
|
150
|
|
182
|
|
206
|
|
||
|
Continental Africa
(1)
|
409
|
|
291
|
|
315
|
|
||
|
Australasia
|
153
|
|
109
|
|
78
|
|
||
|
Americas
(1)
|
234
|
|
225
|
|
196
|
|
||
|
Other, including non-gold producing subsidiaries
|
7
|
|
4
|
|
4
|
|
||
|
953
|
|
|
811
|
|
|
799
|
|
|
|
Discontinued operations
|
—
|
|
—
|
|
58
|
|
||
|
953
|
|
|
811
|
|
|
857
|
|
|
|
Equity-accounted investments included above
|
(123
|
)
|
(100
|
)
|
(131
|
)
|
||
|
830
|
|
|
711
|
|
|
726
|
|
|
|
Gold production (attributable)
(000oz)
|
||||||||
|
2017
|
|
2016
|
|
2015
|
|
|||
|
South Africa
|
903
|
|
967
|
|
1,004
|
|
||
|
Continental Africa
|
1,453
|
|
1,321
|
|
1,435
|
|
||
|
Australasia
|
559
|
|
520
|
|
560
|
|
||
|
Americas
|
840
|
|
820
|
|
831
|
|
||
|
Continuing operations
|
3,755
|
|
|
3,628
|
|
|
3,830
|
|
|
Discontinued operations
|
—
|
|
—
|
|
117
|
|
||
|
3,755
|
|
|
3,628
|
|
|
3,947
|
|
|
F - 24
NOTES TO THE CONSOLIDATED FINANCIAL STATEMENTS
(continued)
2 Segmental Information
(continued)
|
Figures in millions
|
Gold income
|
|||||||
|
US Dollars
|
2017
|
|
2016
|
|
2015
|
|
||
|
Geographical analysis of gold income by origin is as follows:
|
||||||||
|
South Africa
|
1,101
|
|
1,173
|
|
1,132
|
|
||
|
Continental Africa
(1)
|
1,895
|
|
1,663
|
|
1,724
|
|
||
|
Australasia
|
709
|
|
646
|
|
666
|
|
||
|
Americas
|
1,104
|
|
1,036
|
|
967
|
|
||
|
4,809
|
|
|
4,518
|
|
|
4,489
|
|
|
|
Equity-accounted investments included above
|
(453
|
)
|
(433
|
)
|
(474
|
)
|
||
|
Continuing operations (note 3)
|
4,356
|
|
|
4,085
|
|
|
4,015
|
|
|
Discontinued operations
|
—
|
|
—
|
|
137
|
|
||
|
4,356
|
|
|
4,085
|
|
|
4,152
|
|
|
|
Foreign countries included in the above and considered material are:
|
||||||||
|
Brazil
|
705
|
|
659
|
|
641
|
|
||
|
Guinea
|
489
|
|
|
|
|
|
||
|
Tanzania
|
664
|
|
591
|
|
615
|
|
||
|
Geographical analysis of gold income by destination is as follows:
|
||||||||
|
South Africa
|
1,659
|
|
1,719
|
|
2,499
|
|
||
|
North America
|
456
|
|
893
|
|
658
|
|
||
|
Australia
|
709
|
|
645
|
|
666
|
|
||
|
Asia
|
—
|
|
—
|
|
195
|
|
||
|
Europe
|
399
|
|
377
|
|
332
|
|
||
|
United Kingdom
|
1,586
|
|
884
|
|
139
|
|
||
|
4,809
|
|
|
4,518
|
|
|
4,489
|
|
|
|
Equity-accounted investments included above
|
(453
|
)
|
(433
|
)
|
(474
|
)
|
||
|
Continuing operations (note 3)
|
4,356
|
|
|
4,085
|
|
|
4,015
|
|
|
Discontinued operations
|
—
|
|
—
|
|
137
|
|
||
|
Continuing and discontinued operations
|
4,356
|
|
|
4,085
|
|
|
4,152
|
|
|
Figures in millions
|
By product revenue
|
|||||||
|
US Dollars
|
2017
|
|
|
2016
|
|
|
2015
|
|
|
South Africa
|
15
|
|
|
23
|
|
|
38
|
|
|
Continental Africa
(1)
|
3
|
|
|
4
|
|
|
3
|
|
|
Australasia
|
2
|
|
|
2
|
|
|
2
|
|
|
Americas
|
135
|
|
|
110
|
|
|
84
|
|
|
|
155
|
|
|
139
|
|
|
127
|
|
|
Equity-accounted investments included above
|
(1
|
)
|
(1
|
)
|
—
|
|
||
|
Continuing operations
|
154
|
|
|
138
|
|
|
127
|
|
|
Discontinued operations
|
—
|
|
—
|
|
1
|
|
||
|
|
154
|
|
|
138
|
|
|
128
|
|
F - 25
NOTES TO THE CONSOLIDATED FINANCIAL STATEMENTS
(continued)
2 Segmental Information
(continued)
|
Figures in millions
|
Total cash costs
|
|||||||
|
US Dollars
|
2017
|
|
2016
|
|
2015
|
|
||
|
South Africa
|
968
|
|
857
|
|
874
|
|
||
|
Continental Africa
(1)
|
1,088
|
|
976
|
|
1,010
|
|
||
|
Australasia
|
407
|
|
404
|
|
393
|
|
||
|
Americas
|
547
|
|
486
|
|
492
|
|
||
|
Corporate and other
|
(6
|
)
|
—
|
|
(9
|
)
|
||
|
3,004
|
|
|
2,723
|
|
|
2,760
|
|
|
|
Equity-accounted investments included above
|
(295
|
)
|
(288
|
)
|
(267
|
)
|
||
|
Continuing operations
|
2,709
|
|
|
2,435
|
|
|
2,493
|
|
|
Discontinued operations
|
—
|
|
—
|
|
125
|
|
||
|
2,709
|
|
|
2,435
|
|
|
2,618
|
|
|
|
Figures in millions
|
Cost of sales
|
|||||||
|
US Dollars
|
2017
|
|
|
2016
|
|
|
2015
|
|
|
South Africa
|
1,114
|
|
|
1,041
|
|
|
1,083
|
|
|
Continental Africa
(1)
|
1,510
|
|
|
1,331
|
|
|
1,347
|
|
|
Australasia
|
550
|
|
|
540
|
|
|
525
|
|
|
Americas
(1)
|
851
|
|
|
752
|
|
|
719
|
|
|
Corporate and other
(1)
|
(3
|
)
|
|
5
|
|
|
(2
|
)
|
|
4,022
|
|
|
3,669
|
|
|
3,672
|
|
|
|
Equity-accounted investments included above
|
(440
|
)
|
(406
|
)
|
(378
|
)
|
||
|
Continuing operations
|
3,582
|
|
|
3,263
|
|
|
3,294
|
|
|
Discontinued operations
|
—
|
|
—
|
|
118
|
|
||
|
3,582
|
|
|
3,263
|
|
|
3,412
|
|
|
|
Figures in millions
|
Gross profit (loss)
(4)
|
|||||||
|
US Dollars
|
2017
|
|
2016
|
|
2015
|
|
||
|
South Africa
|
(3
|
)
|
149
|
|
42
|
|
||
|
Continental Africa
(1)
|
386
|
|
334
|
|
377
|
|
||
|
Australasia
|
159
|
|
106
|
|
142
|
|
||
|
Americas
(1)
|
253
|
|
283
|
|
247
|
|
||
|
Corporate and other
(1)
|
2
|
|
(4
|
)
|
2
|
|
||
|
797
|
|
|
868
|
|
|
810
|
|
|
|
Equity-accounted investments included above
|
(13
|
)
|
(27
|
)
|
(96
|
)
|
||
|
Continuing operations
|
784
|
|
|
841
|
|
|
714
|
|
|
Discontinued operations
|
—
|
|
—
|
|
19
|
|
||
|
784
|
|
|
841
|
|
|
733
|
|
|
3
REVENUE
|
US Dollars
|
||||||||
|
Figures in millions
|
2017
|
|
2016
|
|
2015
|
|
||
|
Revenue consists of the following principal categories:
|
||||||||
|
Gold income (note 2)
|
4,356
|
|
4,085
|
|
4,015
|
|
||
|
By-products (note 2 and 4)
|
154
|
|
|
138
|
|
|
127
|
|
|
Royalties received (note 6)
|
18
|
|
9
|
|
4
|
|
||
|
Interest received (notes 31 and 35)
|
15
|
|
22
|
|
28
|
|
||
|
4,543
|
|
4,254
|
|
4,174
|
|
|||
F - 26
4
COST OF SALES
|
US Dollars
|
||||||||
|
Figures in millions
|
2017
|
|
2016
|
|
2015
|
|
||
|
Cash operating costs
|
2,728
|
|
2,444
|
|
2,493
|
|
||
|
By-products revenue (note 3)
|
(154
|
)
|
(138
|
)
|
(127
|
)
|
||
|
2,574
|
|
2,306
|
|
2,366
|
|
|||
|
Royalties
|
116
|
|
105
|
|
100
|
|
||
|
Other cash costs
|
19
|
|
24
|
|
27
|
|
||
|
Total cash costs
|
2,709
|
|
2,435
|
|
2,493
|
|
||
|
Retrenchment costs
|
6
|
|
14
|
|
11
|
|
||
|
Rehabilitation and other non-cash costs
|
29
|
|
43
|
|
(10
|
)
|
||
|
Amortisation of tangible assets (note 31 and note 35)
|
817
|
|
789
|
|
737
|
|
||
|
Amortisation of intangible assets (note 31 and note 35)
|
6
|
|
20
|
|
40
|
|
||
|
Inventory change
|
15
|
|
(38
|
)
|
23
|
|
||
|
3,582
|
|
3,263
|
|
3,294
|
|
|||
5
OTHER OPERATING EXPENSES
|
US Dollars
|
||||||||
|
Figures in millions
|
2017
|
|
2016
|
|
2015
|
|
||
|
Care and maintenance costs (note 35)
|
62
|
|
70
|
|
67
|
|
||
|
Pension and medical defined benefit provisions
|
9
|
|
25
|
|
18
|
|
||
|
Governmental fiscal claims and care and maintenance of old tailings operations
|
14
|
|
14
|
|
7
|
|
||
|
Other
|
3
|
|
1
|
|
4
|
|
||
|
88
|
|
|
110
|
|
|
96
|
|
|
6
SPECIAL ITEMS
|
|
US Dollars
|
|||||||
|
Figures in millions
|
2017
|
|
|
2016
|
|
|
2015
|
|
|
Impairment and derecognition of assets
(1)
|
297
|
|
3
|
|
20
|
|
||
|
Impairment of other investments
|
3
|
|
—
|
|
—
|
|
||
|
Retrenchment and related costs
(2)
|
88
|
|
1
|
|
4
|
|
||
|
Legal fees (recoveries) and other costs related to contract terminations and settlement costs
(3)
|
71
|
|
11
|
|
(1
|
)
|
||
|
Write-down of inventories
|
3
|
|
12
|
|
11
|
|
||
|
Net (profit) loss on disposal of assets
|
(8
|
)
|
(4
|
)
|
(1
|
)
|
||
|
Royalties received (note 3)
|
(18
|
)
|
(9
|
)
|
(4
|
)
|
||
|
Indirect tax expense (recoveries)
|
2
|
|
(2
|
)
|
(20
|
)
|
||
|
Repurchase premium and cost on settlement of debt facilities
|
—
|
|
30
|
|
61
|
|
||
|
Other
|
—
|
|
—
|
|
1
|
|
||
|
438
|
|
42
|
|
71
|
|
|||
(1)
Impairments and derecognitions include tangible assets
$253m
, intangible assets
$9m
and held for sale assets
$35m
.
(2)
Includes retrenchment costs incurred on the restructuring of South African operations which was announced during June 2017.
(3)
Includes provision for silicosis class action settlement. For details refer note 26.
F - 27
7
FINANCE COSTS AND UNWINDING OF OBLIGATIONS
|
US Dollars
|
||||||||
|
Figures in millions
|
2017
|
|
2016
|
|
2015
|
|
||
|
Finance costs
|
||||||||
|
Finance costs on bonds, corporate notes, bank loans and other
|
132
|
|
148
|
|
215
|
|
||
|
Amortisation of fees
|
4
|
|
4
|
|
5
|
|
||
|
Finance lease charges
|
6
|
|
6
|
|
3
|
|
||
|
142
|
|
|
158
|
|
|
223
|
|
|
|
Unwinding of obligations
|
27
|
|
22
|
|
22
|
|
||
|
Total finance costs, unwinding of obligations and other discounts
(note 31 and 35)
|
169
|
|
|
180
|
|
|
245
|
|
8
SHARE OF ASSOCIATES AND JOINT VENTURES' PROFIT (LOSS)
|
US Dollars
|
||||||||
|
Figures in millions
|
2017
|
|
2016
|
|
2015
|
|
||
|
Revenue
|
453
|
|
441
|
|
489
|
|
||
|
Operating costs, special items and other expenses
|
(470
|
)
|
(446
|
)
|
(415
|
)
|
||
|
Net interest received
|
1
|
|
3
|
|
7
|
|
||
|
Profit (loss) before taxation
|
(16
|
)
|
|
(2
|
)
|
|
81
|
|
|
Taxation
|
23
|
|
7
|
|
(17
|
)
|
||
|
Profit (loss) after taxation
|
7
|
|
|
5
|
|
|
64
|
|
|
(Impairment) impairment reversal of investments in associates
|
13
|
|
(5
|
)
|
12
|
|
||
|
Impairment reversal of investments in joint ventures (note 17)
|
2
|
|
11
|
|
12
|
|
||
|
Share of associates and joint ventures’ profit (loss) (note 31)
|
22
|
|
|
11
|
|
|
88
|
|
9
EMPLOYEE BENEFITS
|
US Dollars
|
||||||||
|
Figures in millions
|
2017
|
|
2016
|
|
2015
|
|
||
|
Employee benefits including Executive Directors’ and Prescribed Officers’ salaries and other benefits
|
1,024
|
|
918
|
|
971
|
|
||
|
Health care and medical scheme costs
|
||||||||
|
- current medical expenses
|
58
|
|
51
|
|
54
|
|
||
|
- defined benefit post-retirement medical expenses
|
10
|
|
10
|
|
10
|
|
||
|
Pension and provident plan costs
|
||||||||
|
- defined contribution
|
53
|
|
48
|
|
49
|
|
||
|
- defined benefit pension plans
|
—
|
|
15
|
|
14
|
|
||
|
Retrenchment costs
|
92
|
|
16
|
|
15
|
|
||
|
Share-based payment expense (note 10)
|
33
|
|
37
|
|
33
|
|
||
|
Included in cost of sales, other operating expenses, special items and corporate administration, marketing and other expenses
|
1,270
|
|
|
1,095
|
|
|
1,146
|
|
F - 28
NOTES TO THE CONSOLIDATED FINANCIAL STATEMENTS
(continued)
10 Share-based payments
|
US Dollars
|
||||||||
|
Figures in millions
|
2017
|
|
2016
|
|
2015
|
|
||
|
Equity-settled share incentive schemes
|
||||||||
|
Bonus Share Plan (BSP)
|
26
|
|
26
|
|
22
|
|
||
|
Long Term Incentive Plan (LTIP)
|
(1
|
)
|
7
|
|
11
|
|
||
|
Other
|
1
|
|
1
|
|
—
|
|
||
|
26
|
|
|
34
|
|
|
33
|
|
|
|
Cash-settled share incentive scheme
|
||||||||
|
Cash-settled Long Term Incentive Plan (CSLTIP)
|
7
|
|
3
|
|
—
|
|
||
|
Total share-based payment expense (note 9)
|
33
|
|
|
37
|
|
|
33
|
|
F - 29
NOTES TO THE CONSOLIDATED FINANCIAL STATEMENTS
(continued)
10 Share-based payments
(continued)
Equity-settled incentive schemes
Equity schemes include the Bonus Share Plan (BSP), Long Term Incentive Plan (LTIP), Share Retention Bonus Scheme (RB) and the Co-Investment Plan (CIP). There were no additional schemes introduced during 2017 and no changes to rules or practices in the existing schemes.
Bonus Share Plan (BSP)
|
Award date (unvested awards and awards vested during the year)
|
2017
|
|
2016
|
|
2015
|
|
|||||
|
Calculated fair value
|
R
|
152.87
|
|
R
|
229.22
|
|
R
|
130.87
|
|
||
|
Vesting date 50%
|
1 Mar 2018
|
|
1 Mar 2017
|
|
3 Mar 2016
|
|
|||||
|
Vesting date 50%
|
1Mar 2019
|
|
1 Mar 2018
|
|
3 Mar 2017
|
|
|||||
|
Expiry date
|
1 Mar 2027
|
|
1 Mar 2026
|
|
3 Mar 2025
|
|
|||||
|
Number of shares
|
||||||||
|
2017
|
|
2016
|
|
2015
|
|
|||
|
Awards outstanding at beginning of year
|
4,198,285
|
|
4,708,799
|
|
3,305,515
|
|
||
|
Awards granted during the year
|
1,926,549
|
|
2,103,767
|
|
2,562,313
|
|
||
|
Awards lapsed during the year
|
(218,601
|
)
|
(204,374
|
)
|
(165,006
|
)
|
||
|
Awards exercised during the year
|
(1,426,554
|
)
|
(2,409,907
|
)
|
(994,023
|
)
|
||
|
Awards outstanding at end of year
|
4,479,679
|
|
4,198,285
|
|
4,708,799
|
|
||
|
Awards exercisable at end of year
|
1,904,021
|
|
1,170,849
|
|
1,687,096
|
|
||
Long Term Incentive Plan (LTIP)
|
Award date (unvested awards and awards vested during the year)
|
2015
|
|
|||||
|
Calculated fair value
|
|
|
R
|
129.94
|
|
||
|
Vesting date
|
3 Mar 2018
|
|
|||||
|
Expiry date
|
3 Mar 2025
|
|
|||||
|
Number of shares
|
||||||||
|
2017
|
|
2016
|
|
2015
|
|
|||
|
Awards outstanding at beginning of year
|
4,363,330
|
|
6,028,193
|
|
3,964,362
|
|
||
|
Awards granted during the year
|
—
|
|
—
|
|
3,120,555
|
|
||
|
Awards lapsed during the year
|
(1,512,857
|
)
|
(1,160,023
|
)
|
(830,356
|
)
|
||
|
Awards exercised during the year
|
(384,116
|
)
|
(504,840
|
)
|
(226,368
|
)
|
||
|
Awards outstanding at end of year
|
2,466,357
|
|
4,363,330
|
|
6,028,193
|
|
||
|
Awards exercisable at end of year
|
455,914
|
|
320,169
|
|
445,781
|
|
||
F - 30
NOTES TO THE CONSOLIDATED FINANCIAL STATEMENTS
(continued)
10 Share-based payments
(continued)
Equity-settled incentive schemes (continued)
Share Retention Bonus Scheme (RB)
|
Award date (unvested awards and awards vested during the year)
|
2013
|
|
|
|
Calculated fair value
|
R
|
226.46
|
|
|
Vesting date
|
Aug 2014
|
|
|
|
Expiry date
|
Aug 2017
|
|
|
Awards outstanding at 31 December
2017
amounted to
51,853
shares (
2016
:
72,038
and
2015
:
115,736
shares) and an amount of
20,185
shares (
2016
:
43,698
and
2015
:
34,564
shares) were exercised during the year.
Co-Investment Plan (CIP)
|
Number of shares
|
||||||||
|
2017
|
|
2016
|
|
2015
|
|
|||
|
Awards outstanding at beginning of year
|
97,651
|
|
145,040
|
|
56,703
|
|
||
|
Awards granted during the year
|
112,105
|
|
47,590
|
|
125,050
|
|
||
|
Awards lapsed during the year
|
(62,775
|
)
|
(18,570
|
)
|
(6,426
|
)
|
||
|
Awards exercised during the year
|
(51,603
|
)
|
(76,409
|
)
|
(30,287
|
)
|
||
|
Awards outstanding at end of year
|
95,378
|
|
97,651
|
|
145,040
|
|
||
F - 31
NOTES TO THE CONSOLIDATED FINANCIAL STATEMENTS
(continued)
10 Share-based payments
(continued)
Cash-Settled Long Term Incentive Plan (CSLTIP)
There were no changes to rules or practices within the CSLTIP scheme.
|
Award date (unvested awards and awards vested during the year)
|
|||||||
|
2017
|
|
2016
|
|
||||
|
Closing share price at 30 December:
|
R
|
128.62
|
|
R
|
152.58
|
|
|
|
Vesting date
|
1 March 2020
|
|
1 March 2019
|
|
|||
|
Number of units
|
||||
|
2017
|
|
2016
|
|
|
|
Share units outstanding at beginning of year
(1)
|
2,464,630
|
|
30,163
|
|
|
Share units granted during the year
|
2,572,437
|
|
2,537,000
|
|
|
Share units lapsed during the year
|
(507,597
|
)
|
(100,490
|
)
|
|
Share units exercised during the year
|
(59,852
|
)
|
(2,043
|
)
|
|
Share units outstanding at end of year
|
4,469,618
|
|
2,464,630
|
|
(1)
Amounts include Long Term share units awarded to
two
employees during 2015 and 2017.
F - 32
11
TAXATION
|
Figures in millions
|
US Dollars
|
|||||||
|
2017
|
|
2016
|
|
2015
|
|
|||
|
South African taxation
|
||||||||
|
Non-mining tax
|
1
|
|
1
|
|
1
|
|
||
|
Prior year (over) under provision
|
—
|
|
(3
|
)
|
(14
|
)
|
||
|
Deferred taxation
|
||||||||
|
Impairment and disposal of tangible assets
|
(72
|
)
|
—
|
|
(1
|
)
|
||
|
Other temporary differences
|
(62
|
)
|
12
|
|
(43
|
)
|
||
|
Prior year under provision
|
15
|
|
25
|
|
—
|
|
||
|
Change in estimated deferred tax rate
|
31
|
|
—
|
|
(15
|
)
|
||
|
(87
|
)
|
|
35
|
|
|
(72
|
)
|
|
|
Foreign taxation
|
||||||||
|
Normal taxation
|
201
|
|
246
|
|
214
|
|
||
|
Prior year over provision
|
(26
|
)
|
(10
|
)
|
(9
|
)
|
||
|
Deferred taxation
|
||||||||
|
Temporary differences
|
20
|
|
(65
|
)
|
73
|
|
||
|
Prior year (over) under provision
|
2
|
|
(17
|
)
|
5
|
|
||
|
Change in statutory tax rate
|
(2
|
)
|
—
|
|
—
|
|
||
|
195
|
|
|
154
|
|
|
283
|
|
|
|
108
|
|
|
189
|
|
|
211
|
|
|
|
Tax rate reconciliation
|
||||||||
|
A reconciliation of the effective tax rate in the income statement to the prevailing estimated South African corporate tax rate is set out in the following table:
|
||||||||
|
%
|
|
%
|
|
%
|
|
|||
|
Effective tax rate
|
(172
|
)
|
70
|
|
82
|
|
||
|
Disallowable items
|
||||||||
|
Derivative and other commodity contracts losses and fair value gains
|
—
|
|
1
|
|
7
|
|
||
|
Exploration, corporate and other disallowable expenses
|
44
|
|
(12
|
)
|
(23
|
)
|
||
|
Share of associates and joint ventures’ profit (loss)
|
(10
|
)
|
1
|
|
10
|
|
||
|
Foreign income tax allowances and rate differentials
|
47
|
|
(18
|
)
|
(16
|
)
|
||
|
Exchange variation and translation adjustments
|
10
|
|
8
|
|
(24
|
)
|
||
|
Non-tax effective income (loss)
|
69
|
|
(26
|
)
|
(25
|
)
|
||
|
Effect of temporary differences not recognised for deferred tax assets
|
26
|
|
—
|
|
—
|
|
||
|
Capital allowances
|
—
|
|
2
|
|
4
|
|
||
|
Change in estimated deferred tax rate
|
31
|
|
—
|
|
6
|
|
||
|
Change in statutory tax rate
|
(4
|
)
|
—
|
|
—
|
|
||
|
Prior year over provision
|
(13
|
)
|
2
|
|
7
|
|
||
|
Estimated corporate tax rate
|
28
|
|
|
28
|
|
|
28
|
|
F - 33
NOTES TO THE CONSOLIDATED FINANCIAL STATEMENTS
(continued)
11 Taxation
(continued)
Tax rates
|
2017
|
|
2016
|
|
2015
|
|
|||
|
South Africa
|
|
|
|
|
|
|||
|
Mining tax rate – maximum statutory rate
(1)
|
34
|
%
|
|
34
|
%
|
34
|
%
|
|
|
Non-mining tax
|
28
|
%
|
|
28
|
%
|
28
|
%
|
|
|
Foreign operations include:
|
||||||||
|
Argentina
|
30
|
%
|
|
30
|
%
|
30
|
%
|
|
|
Australia
|
30
|
%
|
|
30
|
%
|
30
|
%
|
|
|
Brazil
|
34
|
%
|
|
34
|
%
|
34
|
%
|
|
|
Ghana
|
30
|
%
|
30
|
%
|
30
|
%
|
||
|
Guinea
|
30
|
%
|
|
30
|
%
|
30
|
%
|
|
|
Tanzania
|
30
|
%
|
|
30
|
%
|
30
|
%
|
|
|
(1)
|
The formula for determining the South African mining tax rate is:
|
Y = 34 - 170/X
where Y is the percentage rate of tax payable and X is the ratio of mining profit net of any redeemable capital expenditure to mining revenue expressed as a percentage.
|
Figures in millions
|
US Dollars
|
|||||||
|
|
2017
|
|
|
2016
|
|
|
2015
|
|
|
Analysis of unrecognised deferred tax assets
|
|
|
|
|
|
|||
|
Available to be utilised against future profits
|
|
|
|
|
|
|||
|
- utilisation required between one and two years
|
48
|
|
—
|
|
—
|
|
||
|
- utilisation required between two and five years
|
333
|
|
|
321
|
|
237
|
|
|
|
- utilisation required between five and twenty years
|
1,210
|
|
1,185
|
|
1,184
|
|
||
|
- utilisation in excess of twenty years
|
1
|
|
1
|
|
—
|
|
||
|
|
1,592
|
|
|
1,507
|
|
|
1,421
|
|
At the statutory tax rates the unrecognised value of deferred tax assets are:
$470m
(
2016
:
$477m
;
2015
:
$452m
), mainly relating to tax losses incurred in North America, Ghana and Colombia.
F - 34
12
EARNINGS (LOSS) PER ORDINARY SHARE
|
2017
|
|
2016
|
|
2015
|
|
|||
|
US cents per share
|
||||||||
|
Basic earnings (loss) per ordinary share
|
(46
|
)
|
15
|
|
(20
|
)
|
||
|
- Continuing operations
|
(46
|
)
|
15
|
|
8
|
|
||
|
The calculation of basic earnings (loss) per ordinary share is based on profits (losses) attributable to equity shareholders of ($191m) (2016: $63m; 2015: $31m) and 415,440,077 (2016: 412,585,042; 2015: 409,606,858) shares being the weighted average number of ordinary shares in issue during the financial year.
|
||||||||
|
- Discontinued operations
|
—
|
|
—
|
|
(28
|
)
|
||
|
The calculation of basic earnings (loss) per ordinary share is based on profits (losses) attributable to equity shareholders of nil (2016: nil; 2015: ($116m)) and 415,440,077 (2016: 412,585,042; 2015: 409,606,858) shares being the weighted average number of ordinary shares in issue during the financial year.
|
||||||||
|
Diluted earnings (loss) per ordinary share
|
(46
|
)
|
15
|
|
(20
|
)
|
||
|
- Continuing operations
|
(46
|
)
|
15
|
|
8
|
|
||
|
The calculation of diluted earnings (loss) per ordinary share is based on profits (losses) attributable to equity shareholders of ($191m) (2016: $63m; 2015: $31m) and 415,440,077 (2016: 414,706,400; 2015: 411,371,341) shares being the diluted number of ordinary shares.
|
||||||||
|
- Discontinued operations
|
—
|
|
—
|
|
(28
|
)
|
||
|
The calculation of diluted earnings (loss) per ordinary share is based on profits (losses) attributable to equity shareholders of nil (2016: nil; 2015: $(116m)) and 415,440,077 (2016: 414,706,400; 2015: 409,606,858) shares being the diluted number of ordinary shares.
|
||||||||
In calculating the basic and diluted number of ordinary shares outstanding for the year, the following were taken into consideration:
|
Number of shares
|
||||||||
|
2017
|
|
2016
|
|
2015
|
|
|||
|
Ordinary shares
|
409,265,471
|
|
407,519,542
|
|
404,747,625
|
|
||
|
Fully vested options and currently exercisable
(1)
|
6,174,606
|
|
5,065,500
|
|
4,859,233
|
|
||
|
Weighted average number of shares
|
415,440,077
|
|
412,585,042
|
|
409,606,858
|
|
||
|
Dilutive potential of share options
|
—
|
|
2,121,358
|
|
—
|
|
||
|
Fully diluted number of ordinary shares
|
415,440,077
|
|
414,706,400
|
|
409,606,858
|
|
||
|
Figures in millions
|
US Dollars
|
|||||||
|
In calculating the diluted earnings (loss) attributable to equity shareholders, the following were taken into consideration:
|
||||||||
|
Profit (loss) attributable to equity shareholders
|
(191
|
)
|
63
|
|
(85
|
)
|
||
|
(1)
|
Employee compensation awards are included in basic earnings per share from the date that all necessary conditions have been satisfied and it is virtually certain that shares will be issued as a result of employees exercising their options.
|
F - 35
NOTES TO THE CONSOLIDATED FINANCIAL STATEMENTS
(continued)
12. Earnings (loss) per ordinary share
(continued)
|
US Dollars
|
||||||||
|
Figures in millions
|
2017
|
|
2016
|
|
2015
|
|
||
|
Headline earnings (loss)
|
||||||||
|
The profit (loss) attributable to equity shareholders was adjusted by the following to arrive at headline earnings (loss):
|
||||||||
|
Profit (loss) attributable to equity shareholders from continuing and discontinued operations
|
(191
|
)
|
63
|
|
(85
|
)
|
||
|
Net impairment (impairment reversal) and derecognition of assets
|
298
|
|
(16
|
)
|
2
|
|
||
|
Net (profit) loss on disposal of assets
|
(8
|
)
|
4
|
|
9
|
|
||
|
Special items of associates and joint ventures
|
—
|
|
—
|
|
3
|
|
||
|
Exchange loss on foreign currency translation reserve release
|
—
|
|
60
|
|
—
|
|
||
|
Taxation on items above
|
(72
|
)
|
—
|
|
(2
|
)
|
||
|
27
|
|
111
|
|
(73
|
)
|
|||
|
US Cents
|
||||||||
|
Basic headline earnings (loss) per share
|
||||||||
|
The calculation of basic headline earnings (loss) per ordinary share is based on basic headline earnings (losses) of $27m (2016: $111m; 2015: ($73m)) and 415,440,077 (2016: 412,585,042; 2015: 409,606,858) shares being the weighted average number of ordinary shares in issue during the year.
|
6
|
|
27
|
|
(18
|
)
|
||
|
Diluted headline earnings (loss) per share
|
||||||||
|
The calculation of diluted headline earnings (loss) per ordinary share is based on diluted headline earnings (losses) of $27m (2016: $111m; 2015: ($73m)) and 415,440,077 (2016: 414,706,400; 2015: 409,606,858) shares being the weighted average number of ordinary shares in issue during the year.
|
6
|
|
27
|
|
(18
|
)
|
||
F - 36
13
. DIVIDENDS
|
US Dollars
|
|||||||||
|
Figures in million
|
2017
|
|
2016
|
|
2015
|
|
|||
|
Ordinary shares
|
|||||||||
|
Dividend number 118 of 130 SA cents per share was declared on 21 February 2017 and paid on 7 April 2017. (10 US cents per share)
|
39
|
|
—
|
|
—
|
|
|||
|
39
|
|
—
|
|
—
|
|
||||
F - 37
14
TANGIBLE ASSETS
|
Figures in millions
|
Mine
development
costs
|
|
Mine
infra-
structure
(2)
|
|
Mineral
rights
and
dumps
|
|
Exploration
and
evaluation
assets
|
|
Assets
under
construction
|
|
Land and
buildings
(3)(4)
|
|
Total
|
|
||||||
|
US Dollars
|
||||||||||||||||||||
|
Cost
|
||||||||||||||||||||
|
Balance at 1 January 2015
|
7,238
|
|
5,369
|
|
958
|
|
35
|
|
757
|
|
88
|
|
14,445
|
|
||||||
|
Additions
|
|
|||||||||||||||||||
|
- project capital
|
19
|
|
1
|
|
—
|
|
—
|
|
102
|
|
6
|
|
128
|
|
||||||
|
- stay-in-business capital
|
345
|
|
57
|
|
—
|
|
—
|
|
158
|
|
1
|
|
561
|
|
||||||
|
- capitalised leased assets
|
—
|
|
62
|
|
—
|
|
—
|
|
—
|
|
—
|
|
62
|
|
||||||
|
Disposals
|
(113
|
)
|
(772
|
)
|
(25
|
)
|
(29
|
)
|
(291
|
)
|
(7
|
)
|
(1,237
|
)
|
||||||
|
Transfers and other movements
(1)
|
(497
|
)
|
(4
|
)
|
—
|
|
(1
|
)
|
(298
|
)
|
(1
|
)
|
(801
|
)
|
||||||
|
Translation
|
(710
|
)
|
(281
|
)
|
(19
|
)
|
—
|
|
(72
|
)
|
(9
|
)
|
(1,091
|
)
|
||||||
|
Balance at 31 December 2015
|
6,282
|
|
|
4,432
|
|
|
914
|
|
|
5
|
|
|
356
|
|
|
78
|
|
|
12,067
|
|
|
Accumulated amortisation and impairments
|
||||||||||||||||||||
|
Balance at 1 January 2015
|
5,045
|
|
3,515
|
|
893
|
|
32
|
|
79
|
|
18
|
|
9,582
|
|
||||||
|
Amortisation for the year
|
475
|
|
257
|
|
6
|
|
1
|
|
—
|
|
1
|
|
740
|
|
||||||
|
Impairment and derecognition of assets
|
4
|
|
1
|
|
—
|
|
—
|
|
—
|
|
—
|
|
5
|
|
||||||
|
Disposals
|
(113
|
)
|
(727
|
)
|
(25
|
)
|
(29
|
)
|
(49
|
)
|
(6
|
)
|
(949
|
)
|
||||||
|
Transfers and other movements
(1)
|
(458
|
)
|
(346
|
)
|
—
|
|
(1
|
)
|
(1
|
)
|
—
|
|
(806
|
)
|
||||||
|
Translation
|
(465
|
)
|
(82
|
)
|
(12
|
)
|
(1
|
)
|
—
|
|
(3
|
)
|
(563
|
)
|
||||||
|
Balance at 31 December 2015
|
4,488
|
|
|
2,618
|
|
|
862
|
|
|
2
|
|
|
29
|
|
|
10
|
|
|
8,009
|
|
|
Net book value at 31 December 2015
|
1,794
|
|
|
1,814
|
|
|
52
|
|
|
3
|
|
|
327
|
|
|
68
|
|
|
4,058
|
|
|
Cost
|
||||||||||||||||||||
|
Balance at 1 January 2016
|
6,282
|
|
4,432
|
|
914
|
|
5
|
|
356
|
|
78
|
|
12,067
|
|
||||||
|
Additions
|
|
|||||||||||||||||||
|
- project capital
|
25
|
|
4
|
|
—
|
|
—
|
|
64
|
|
—
|
|
93
|
|
||||||
|
- stay-in-business capital
|
363
|
|
54
|
|
1
|
|
—
|
|
192
|
|
1
|
|
611
|
|
||||||
|
- capitalised leased assets
|
—
|
|
2
|
|
—
|
|
—
|
|
—
|
|
—
|
|
2
|
|
||||||
|
Disposals
|
(45
|
)
|
(46
|
)
|
—
|
|
—
|
|
—
|
|
—
|
|
(91
|
)
|
||||||
|
Transfers and other movements
(1)
|
(884
|
)
|
25
|
|
—
|
|
—
|
|
(190
|
)
|
—
|
|
(1,049
|
)
|
||||||
|
Translation
|
202
|
|
105
|
|
4
|
|
—
|
|
28
|
|
3
|
|
342
|
|
||||||
|
Balance at 31 December 2016
|
5,943
|
|
|
4,576
|
|
|
919
|
|
|
5
|
|
|
450
|
|
|
82
|
|
|
11,975
|
|
|
Accumulated amortisation and impairments
|
||||||||||||||||||||
|
Balance at 1 January 2016
|
4,488
|
|
2,618
|
|
862
|
|
2
|
|
29
|
|
10
|
|
8,009
|
|
||||||
|
Amortisation for the year
|
546
|
|
254
|
|
4
|
|
1
|
|
—
|
|
1
|
|
806
|
|
||||||
|
Impairment and derecognition of assets
|
1
|
|
2
|
|
—
|
|
—
|
|
—
|
|
—
|
|
3
|
|
||||||
|
Disposals
|
(43
|
)
|
(43
|
)
|
—
|
|
—
|
|
—
|
|
—
|
|
(86
|
)
|
||||||
|
Transfers and other movements
(1)
|
(964
|
)
|
(70
|
)
|
—
|
|
—
|
|
(3
|
)
|
—
|
|
(1,037
|
)
|
||||||
|
Translation
|
135
|
|
31
|
|
2
|
|
—
|
|
—
|
|
1
|
|
169
|
|
||||||
|
Balance at 31 December 2016
|
4,163
|
|
|
2,792
|
|
|
868
|
|
|
3
|
|
|
26
|
|
|
12
|
|
|
7,864
|
|
|
Net book value at 31 December 2016
|
1,780
|
|
|
1,784
|
|
|
51
|
|
|
2
|
|
|
424
|
|
|
70
|
|
|
4,111
|
|
F - 38
NOTES TO THE CONSOLIDATED FINANCIAL STATEMENTS
(continued)
14. Tangible assets
(continued)
|
Figures in millions
|
Mine
development
costs
|
|
Mine
infra-
structure
(2)
|
|
Mineral
rights
and
dumps
|
|
Exploration
and
evaluation
assets
|
|
Assets
under
construction
|
|
Land and
buildings
(3)(4)
|
|
Total
|
|
||||||
|
Cost
|
||||||||||||||||||||
|
Balance at 1 January 2017
|
5,943
|
|
4,576
|
|
919
|
|
5
|
|
450
|
|
82
|
|
11,975
|
|
||||||
|
Additions
|
|
|||||||||||||||||||
|
- project capital
|
28
|
|
3
|
|
—
|
|
—
|
|
125
|
|
—
|
|
156
|
|
||||||
|
- stay-in-business capital
|
371
|
|
37
|
|
—
|
|
—
|
|
257
|
|
—
|
|
665
|
|
||||||
|
Disposals
|
(1
|
)
|
(20
|
)
|
—
|
|
—
|
|
—
|
|
—
|
|
(21
|
)
|
||||||
|
Transfers and other movements
(1)
|
(168
|
)
|
(21
|
)
|
(27
|
)
|
—
|
|
(291
|
)
|
1
|
|
(506
|
)
|
||||||
|
Transfer to non-current assets and liabilities held for sale
|
(785
|
)
|
(281
|
)
|
(7
|
)
|
—
|
|
(72
|
)
|
(3
|
)
|
(1,148
|
)
|
||||||
|
Translation
|
174
|
|
88
|
|
7
|
|
—
|
|
21
|
|
3
|
|
293
|
|
||||||
|
Balance at 31 December 2017
|
5,562
|
|
|
4,382
|
|
|
892
|
|
|
5
|
|
|
490
|
|
|
83
|
|
|
11,414
|
|
|
Accumulated amortisation and impairments
|
||||||||||||||||||||
|
Balance at 1 January 2017
|
4,163
|
|
2,792
|
|
868
|
|
3
|
|
26
|
|
12
|
|
7,864
|
|
||||||
|
Amortisation for the year
|
553
|
|
272
|
|
3
|
|
—
|
|
—
|
|
1
|
|
829
|
|
||||||
|
Impairment and derecognition of assets
(5)
|
182
|
|
62
|
|
8
|
|
—
|
|
1
|
|
—
|
|
253
|
|
||||||
|
Disposals
|
(1
|
)
|
(20
|
)
|
—
|
|
—
|
|
—
|
|
—
|
|
(21
|
)
|
||||||
|
Transfers and other movements
(1)
|
(326
|
)
|
(163
|
)
|
(27
|
)
|
—
|
|
—
|
|
—
|
|
(516
|
)
|
||||||
|
Transfer to non-current assets and liabilities held for sale
|
(685
|
)
|
(169
|
)
|
(4
|
)
|
—
|
|
(1
|
)
|
—
|
|
(859
|
)
|
||||||
|
Translation
|
93
|
|
22
|
|
5
|
|
—
|
|
—
|
|
2
|
|
122
|
|
||||||
|
Balance at 31 December 2017
|
3,979
|
|
|
2,796
|
|
|
853
|
|
|
3
|
|
|
26
|
|
|
15
|
|
|
7,672
|
|
|
Net book value at 31 December 2017
|
1,583
|
|
|
1,586
|
|
|
39
|
|
|
2
|
|
|
464
|
|
|
68
|
|
|
3,742
|
|
|
(1)
|
Transfers and other movements include amounts from deferred stripping, change in estimates of decommissioning assets, asset reclassifications and derecognition of assets with a carrying value of nil.
|
|
(2)
|
Included in the amounts for mine infrastructure are assets held under finance leases with a net book value of
$56
m (
2016
:
$58
m;
2015
:
$61m
).
|
|
(3)
|
Included in the amounts for land and buildings are assets held under finance leases with a net book value of
$6
m (
2016
:
$7
m;
2015
:
$7
m).
|
|
(4)
|
Assets of
$11
m (
2016
:
$12
m;
2015
:
$8m
) have been pledged as security.
|
|
(5)
|
I
mpairment and derecognition of assets include the following:
|
Impairment calculation assumptions as at 31 December 2017 - goodwill, tangible and intangible assets
Management assumptions for the value in use of tangible assets and goodwill include:
|
•
|
the gold price assumption represents management’s best estimate of the future price of gold. A long-term real gold price of
$1,240
/oz (2016:
$1,212
/oz) is based on a range of economic and market conditions that will exist over the remaining useful life of the assets.
|
Annual life of mine plans take into account the following:
|
•
|
proved and probable Ore Reserve;
|
|
•
|
value beyond proved and probable reserves (including exploration potential) determined using the gold price assumption referred to above;
|
|
•
|
in determining the impairment for each cash generating unit, the real pre-tax rate was derived from the weighted average cost of capital (WACC) using the Capital Asset Pricing Model ("CAPM") to determine the required return on equity with risk factors consistent with the basis used in 2016. At 31 December 2017, the derived group WACC was
7.50%
(real post-tax) which is 20 basis points higher than in 2016 of
7.30%
, and is based on the industry average capital structure of the major gold companies considered to be appropriate peers. In determining the WACC for each cash generating unit, sovereign and mining risk factors are considered to determine country specific risks. In certain instances, a specific risk premium was added to large projects being undertaken or the turnaround nature of a specific mine to address uncertainties in the forecast of the cash flows;
|
|
•
|
foreign currency cash flows translated at estimated forward exchange rates and then discounted using appropriate discount rates for that currency;
|
|
•
|
cash flows used in impairment calculations are based on life of mine plans which range from
2 years
to
42 years
; and
|
|
•
|
variable operating cash flows are increased at local Consumer Price Index rates.
|
F - 39
NOTES TO THE CONSOLIDATED FINANCIAL STATEMENTS
(continued)
14. Tangible assets
(continued)
Impairments and derecognitions of tangible assets
For the
year ended 31 December 2017, the following impairments and derecognitions of tangible assets were recognised:
|
Figures in millions
|
US Dollars
|
|
|
TauTona
|
79
|
|
|
Kopanang
|
35
|
|
|
Surface Operations
|
9
|
|
|
Moab Khotsong
|
112
|
|
|
Mponeng
|
2
|
|
|
First Uranium
|
13
|
|
|
Other
|
3
|
|
|
253
|
|
|
Impairment of cash generating units
The group reviews and tests the carrying value of its mining assets when events or changes in circumstances suggest that the carrying amount may not be recoverable.
During June 2017, due to a change in mine plans to restructure the South African operations, Kopanang mine, TauTona mine including Savuka section and the West Gold Plant section of the Surface operations in South Africa were fully impaired as they were not expected to generate future economic benefits.
On 19 October 2017, AngloGold Ashanti announced the sale of various assets in the Vaal River Region including the Moab Khotsong Mine and related assets (Moab) to Harmony Gold Mining Company Limited for a cash consideration of US
$300m
. Moab was accordingly transferred to held for sale and written down to the fair value less cost to sell. Refer note 23 - Non-current assets and liabilities held for sale.
In a separate announcement on 19 October 2017, AngloGold Ashanti announced the sale of its Kopanang Mine, the West Gold Plant and related infrastructure to Heaven-Sent SA Sunshine Investment Company Limited for a cash consideration of R
100m
. Kopanang Mine was accordingly transferred to held for sale and written down to the fair value less cost to sell. Refer note 23 - Non-current assets and liabilities held for sale.
F - 40
15
INTANGIBLE ASSETS
|
Figures in millions
|
Goodwill
|
|
Software and
licences
|
|
Royalty
tax rate
concession
and other
|
|
Total
|
|
|||
|
US Dollars
|
|||||||||||
|
Cost
|
|||||||||||
|
Balance at 1 January 2015
|
400
|
|
152
|
|
60
|
|
612
|
|
|||
|
Additions
|
—
|
|
3
|
|
—
|
|
3
|
|
|||
|
Disposals
|
—
|
|
(9
|
)
|
—
|
|
(9
|
)
|
|||
|
Transfers and other movements
(1)
|
—
|
|
(10
|
)
|
—
|
|
(10
|
)
|
|||
|
Translation
|
(20
|
)
|
(18
|
)
|
—
|
|
(38
|
)
|
|||
|
Balance at 31 December 2015
|
380
|
|
|
118
|
|
|
60
|
|
|
558
|
|
|
Accumulated amortisation and impairments
|
|||||||||||
|
Balance at 1 January 2015
|
258
|
|
82
|
|
47
|
|
387
|
|
|||
|
Amortisation for the year
|
|
|
37
|
|
3
|
|
40
|
|
|||
|
Disposals
|
—
|
|
(7
|
)
|
—
|
|
(7
|
)
|
|||
|
Transfers and other movements
(1)
|
—
|
|
(7
|
)
|
—
|
|
(7
|
)
|
|||
|
Translation
|
(4
|
)
|
(12
|
)
|
—
|
|
(16
|
)
|
|||
|
Balance at 31 December 2015
|
254
|
|
|
93
|
|
|
50
|
|
|
397
|
|
|
Net book value at 31 December 2015
|
126
|
|
|
25
|
|
|
10
|
|
|
161
|
|
|
Cost
|
|||||||||||
|
Balance at 1 January 2016
|
380
|
|
118
|
|
60
|
|
558
|
|
|||
|
Additions
|
—
|
|
5
|
|
—
|
|
5
|
|
|||
|
Transfers and other movements
(1)
|
—
|
|
(4
|
)
|
—
|
|
(4
|
)
|
|||
|
Translation
|
(1
|
)
|
6
|
|
—
|
|
5
|
|
|||
|
Balance at 31 December 2016
|
379
|
|
|
125
|
|
|
60
|
|
|
564
|
|
|
Accumulated amortisation and impairments
|
|||||||||||
|
Balance at 1 January 2016
|
254
|
|
93
|
|
50
|
|
397
|
|
|||
|
Amortisation for the year
|
|
|
16
|
|
4
|
|
20
|
|
|||
|
Transfers and other movements
(1)
|
—
|
|
(3
|
)
|
—
|
|
(3
|
)
|
|||
|
Translation
|
(1
|
)
|
6
|
|
—
|
|
5
|
|
|||
|
Balance at 31 December 2016
|
253
|
|
|
112
|
|
|
54
|
|
|
419
|
|
|
Net book value at 31 December 2016
|
126
|
|
|
13
|
|
|
6
|
|
|
145
|
|
|
Cost
|
|||||||||||
|
Balance at 1 January 2017
|
379
|
|
125
|
|
60
|
|
564
|
|
|||
|
Additions
|
—
|
|
1
|
|
—
|
|
1
|
|
|||
|
Transfer to non-current assets and liabilities held for sale
|
—
|
|
(17
|
)
|
—
|
|
(17
|
)
|
|||
|
Transfers and other movements
(1)
|
(263
|
)
|
(1
|
)
|
—
|
|
(264
|
)
|
|||
|
Translation
|
11
|
|
4
|
|
—
|
|
15
|
|
|||
|
Balance at 31 December 2017
|
127
|
|
|
112
|
|
|
60
|
|
|
299
|
|
|
Accumulated amortisation and impairments
|
|||||||||||
|
Balance at 1 January 2017
|
253
|
|
112
|
|
54
|
|
419
|
|
|||
|
Amortisation for the year
|
|
|
3
|
|
3
|
|
6
|
|
|||
|
Impairment
|
9
|
|
—
|
|
—
|
|
9
|
|
|||
|
Transfer to non-current assets and liabilities held for sale
|
—
|
|
(15
|
)
|
—
|
|
(15
|
)
|
|||
|
Transfers and other movements
(1)
|
(263
|
)
|
(1
|
)
|
—
|
|
(264
|
)
|
|||
|
Translation
|
1
|
|
5
|
|
—
|
|
6
|
|
|||
|
Balance at 31 December 2017
|
—
|
|
|
104
|
|
|
57
|
|
|
161
|
|
|
Net book value at 31 December 2017
|
127
|
|
|
8
|
|
|
3
|
|
|
138
|
|
|
(1)
|
Transfers and other movements include amounts from asset reclassifications and amounts written off.
|
F - 41
NOTES TO THE CONSOLIDATED FINANCIAL STATEMENTS
(continued)
15 Intangible assets
(continued)
Impairment calculation assumptions for goodwill
Based on an analysis carried out by the group in 2017, the carrying value and value in use of cash generating units (CGUs) with goodwill that were most sensitive is:
|
2017
|
|||||
|
US Dollars
|
|||||
|
Figures in millions
|
Carrying
Value
|
Value in
use
|
|||
|
AngloGold Ashanti Australia Limited - Sunrise Dam
|
233
|
|
402
|
|
|
As at 31 December 2017, the recoverable amount of AngloGold Ashanti Australia Limited - Sunrise Dam exceeded its carrying amount by
$169
m. The AngloGold Ashanti Australia Limited Sunrise Dam CGU had
$119
m goodwill at that date.
It is estimated that a decrease of the long term real gold price of
$1,240
/oz by
7%
, would cause the recoverable amount of this CGU to equal its carrying amount. The sensitivity analysis has been provided on the basis that the key assumption changes without a change in the other assumptions. However, for a change in each of the assumptions used, it is impracticable to disclose the consequential effect of changes on the other variables used to measure the recoverable amount because these assumptions and others used in impairment testing of goodwill are inextricably linked.
Therefore it is possible that outcomes within the next financial year that are different from the assumptions used in the impairment testing process for goodwill could require a material adjustment to the carrying amounts in future periods.
Net book value of goodwill allocated to each of the CGUs:
|
US Dollars
|
||||||||
|
Figures in millions
|
2017
|
|
2016
|
|
2015
|
|
||
|
- Sunrise Dam
|
119
|
|
110
|
|
111
|
|
||
|
- First Uranium (Pty) Limited
(1)
|
—
|
|
8
|
|
7
|
|
||
|
- Serra Grande
|
8
|
|
8
|
|
8
|
|
||
|
(note 2)
|
127
|
|
126
|
|
126
|
|
||
|
Real pre-tax discount rates applied in impairment calculations on CGUs for which the carrying amount of goodwill is significant are as follows:
|
||||||||
|
- Sunrise Dam
(2)
|
8.3
|
%
|
8.8
|
%
|
7.9
|
%
|
||
|
(1)
|
Goodwill has been allocated to its respective CGU's where it is tested for impairment as part of the CGU . The group reviews and tests the carrying value of goodwill on an annual basis for impairment. Following the impairment review, goodwill to the value of
$9m
at First Uranium (Pty) Ltd was impaired utilising a real pre-tax discount rate of
9.23%
during 2017. The discount rates for 2017 were determined on a basis consistent with the 2016 and 2015 discount rates. The value in use recoverable amount of First Uranium (Pty) Ltd is
$317m
(2016:
$336m
; 2015:
$304m
).
|
|
(2)
|
The value in use of the CGU is
$402
m in 2017 (2016:
$487
m; 2015:
$504
m).
|
F - 42
NOTES TO THE CONSOLIDATED FINANCIAL STATEMENTS
16 Material partly-owned subsidiaries
|
Name
|
Non-controlling interest holding
|
Country of incorporation and operation
|
||||||||
|
2017
|
|
2016
|
|
2015
|
|
|||||
|
Cerro Vanguardia S.A. (CVSA)
|
7.5
|
%
|
7.5
|
%
|
7.5
|
%
|
Argentina
|
|||
|
Société AngloGold Ashanti de Guinée S.A. (Siguiri)
|
15
|
%
|
15
|
%
|
15
|
%
|
Republic of Guinea
|
|||
Financial information of subsidiaries that have material non-controlling interests are provided below:
|
US Dollars
|
||||||||
|
Figures in millions
|
2017
|
|
2016
|
|
2015
|
|
||
|
Profit allocated to material non-controlling interest
|
||||||||
|
CVSA
|
7
|
|
6
|
|
4
|
|
||
|
Siguiri
|
13
|
|
11
|
|
8
|
|
||
|
Accumulated balances of material non-controlling interests
|
||||||||
|
CVSA
|
13
|
|
15
|
|
15
|
|
||
|
Siguiri
|
32
|
|
28
|
|
26
|
|
||
Summarised financial information of subsidiaries is as follows. The information is based on amounts including inter-company balances.
|
US Dollars
|
|||||
|
Figures in millions
|
CVSA
|
|
Siguiri
|
|
|
|
Statement of profit or loss for 2017
|
|||||
|
Revenue
|
517
|
|
489
|
|
|
|
Profit (loss) for the year
|
96
|
|
88
|
|
|
|
Total comprehensive income (loss) for the year, net of tax
|
96
|
|
88
|
|
|
|
Attributable to non-controlling interests
|
7
|
|
13
|
|
|
|
Dividends paid to non-controlling interests
|
(9
|
)
|
(10
|
)
|
|
|
Statement of profit or loss for 2016
|
|||||
|
Revenue
|
472
|
|
367
|
|
|
|
Profit (loss) for the year
|
81
|
|
74
|
|
|
|
Total comprehensive income (loss) for the year, net of tax
|
81
|
|
74
|
|
|
|
Attributable to non-controlling interests
|
6
|
|
11
|
|
|
|
Dividends paid to non-controlling interests
|
(6
|
)
|
(9
|
)
|
|
|
Statement of profit or loss for 2015
|
|||||
|
Revenue
|
399
|
|
350
|
|
|
|
Profit (loss) for the year
|
57
|
|
50
|
|
|
|
Total comprehensive income (loss) for the year, net of tax
|
57
|
|
50
|
|
|
|
Attributable to non-controlling interests
|
4
|
|
8
|
|
|
|
Dividends paid to non-controlling interests
|
—
|
|
(4
|
)
|
|
F - 43
NOTES TO THE CONSOLIDATED FINANCIAL STATEMENTS
(continued)
16
Material partly-owned subsidiaries
(continued)
Summarised financial information of subsidiaries is as follows. The information is based on amounts before inter-company eliminations.
|
US Dollars
|
|||||
|
Figures in millions
|
CVSA
|
Siguiri
|
|||
|
Statement of financial position as at 31 December 2017
|
|||||
|
Non-current assets
|
193
|
|
206
|
|
|
|
Current assets
|
171
|
|
189
|
|
|
|
Non-current liabilities
|
(103
|
)
|
(101
|
)
|
|
|
Current liabilities
|
(84
|
)
|
(82
|
)
|
|
|
Total equity
|
177
|
|
|
212
|
|
|
Statement of financial position as at 31 December 2016
|
|||||
|
Non-current assets
|
241
|
|
174
|
|
|
|
Current assets
|
177
|
|
178
|
|
|
|
Non-current liabilities
|
(108
|
)
|
(79
|
)
|
|
|
Current liabilities
|
(107
|
)
|
(85
|
)
|
|
|
Total equity
|
203
|
|
188
|
|
|
|
Statement of financial position as at 31 December 2015
|
|||||
|
Non-current assets
|
245
|
|
151
|
|
|
|
Current assets
|
182
|
|
158
|
|
|
|
Non-current liabilities
|
(114
|
)
|
(79
|
)
|
|
|
Current liabilities
|
(109
|
)
|
(55
|
)
|
|
|
Total equity
|
204
|
|
175
|
|
|
|
Statement of cash flows for the year ended 31 December 2017
|
|||||
|
Cash inflow (outflow) from operating activities
|
189
|
|
152
|
|
|
|
Cash inflow (outflow) from investing activities
|
(55
|
)
|
(82
|
)
|
|
|
Cash inflow (outflow) from financing activities
|
(118
|
)
|
(58
|
)
|
|
|
Net increase (decrease) in cash and cash equivalents
|
16
|
|
12
|
|
|
|
Statement of cash flows for the year ended 31 December 2016
|
|||||
|
Cash inflow (outflow) from operating activities
|
110
|
|
120
|
|
|
|
Cash inflow (outflow) from investing activities
|
(57
|
)
|
(59
|
)
|
|
|
Cash inflow (outflow) from financing activities
|
(97
|
)
|
(53
|
)
|
|
|
Net increase (decrease) in cash and cash equivalents
|
(44
|
)
|
8
|
|
|
|
Statement of cash flows for the year ended 31 December 2015
|
|||||
|
Cash inflow (outflow) from operating activities
|
98
|
|
76
|
|
|
|
Cash inflow (outflow) from investing activities
|
(60
|
)
|
(29
|
)
|
|
|
Cash inflow (outflow) from financing activities
|
3
|
|
(36
|
)
|
|
|
Net increase (decrease) in cash and cash equivalents
|
41
|
|
11
|
|
|
F - 44
17
INVESTMENTS IN ASSOCIATES AND JOINT VENTURES
|
US Dollars
|
||||||||
|
Figures in millions
|
2017
|
|
2016
|
|
2015
|
|
||
|
Carrying value
|
||||||||
|
Investments in associates
|
36
|
|
20
|
|
34
|
|
||
|
Investments in joint ventures
|
1,471
|
|
1,428
|
|
1,431
|
|
||
|
1,507
|
|
|
1,448
|
|
|
1,465
|
|
|
Detailed disclosures are provided for the years in which investments in associates and joint ventures are considered to be material.
Summarised financial information of immaterial associates is as follows:
|
US Dollars
|
||||||||
|
Figures in millions
|
2017
|
|
2016
|
|
2015
|
|
||
|
Aggregate statement of profit or loss for associates (attributable)
|
||||||||
|
Revenue
|
21
|
|
30
|
|
53
|
|
||
|
Operating costs and expenses
|
(11
|
)
|
(38
|
)
|
(45
|
)
|
||
|
Taxation
|
2
|
|
(1
|
)
|
4
|
|
||
|
Profit (loss) for the year
|
12
|
|
|
(9
|
)
|
|
12
|
|
|
Total comprehensive profit (loss) for the year, net of tax
|
12
|
|
|
(9
|
)
|
|
12
|
|
Investments in material joint ventures comprise:
|
Name
|
Effective %
|
Description
|
Country of incorporation and operation
|
||||||
|
2017
|
2016
|
2015
|
|||||||
|
Kibali Goldmines S.A..
(1)
|
45
|
45
|
45
|
Exploration and mine
development
|
The Democratic Republic of the Congo
|
||||
|
(1)
|
AngloGold Ashanti Limited has a
50%
interest in Kibali (Jersey) Limited (Kibali) which holds our effective
45%
interest in Kibali Goldmines S.A.
|
|
US Dollars
|
||||||||
|
Figures in millions
|
2017
|
|
2016
|
|
2015
|
|
||
|
Carrying value of joint ventures
|
||||||||
|
Kibali
|
1,423
|
|
1,400
|
|
1,406
|
|
||
|
Immaterial joint ventures
|
48
|
|
28
|
|
25
|
|
||
|
1,471
|
|
1,428
|
|
1,431
|
|
|||
|
Reversal (impairment) of investments in joint ventures
|
||||||||
|
Sadiola (note 8)
|
2
|
|
11
|
|
12
|
|
||
|
US Dollars
|
||||||||
|
Figures in millions
|
2017
|
|
2016
|
|
2015
|
|
||
|
The cumulative unrecognised share of losses of the joint ventures:
|
||||||||
|
Sadiola
|
—
|
|
—
|
|
10
|
|
||
|
Morila
|
7
|
|
9
|
|
—
|
|
||
|
Yatela
|
2
|
|
3
|
|
—
|
|
||
F - 45
NOTES TO THE CONSOLIDATED FINANCIAL STATEMENTS
(continued)
17 Investments in associates and joint ventures
(continued)
Summarised financial information of joint ventures is as follows (not attributable):
|
US Dollars
|
||||||||
|
|
Kibali
|
|||||||
|
Figures in millions
|
2017
|
|
2016
|
|
2015
|
|
||
|
Statement of profit or loss
|
||||||||
|
Revenue
|
755
|
|
709
|
|
747
|
|
||
|
Other operating costs and expenses
|
(530
|
)
|
(471
|
)
|
(398
|
)
|
||
|
Amortisation of tangible and intangible assets
|
(264
|
)
|
(211
|
)
|
(193
|
)
|
||
|
Finance costs and unwinding of obligations
|
(5
|
)
|
(5
|
)
|
(5
|
)
|
||
|
Interest received
|
4
|
|
5
|
|
5
|
|
||
|
Taxation
|
54
|
|
23
|
|
(18
|
)
|
||
|
Profit for the year
|
14
|
|
50
|
|
138
|
|
||
|
Other comprehensive income for the year, net of tax
|
—
|
|
—
|
|
3
|
|
||
|
Total comprehensive income for the year, net of tax
|
14
|
|
50
|
|
141
|
|
||
|
Dividends received from joint venture (attributable)
|
—
|
|
30
|
|
35
|
|
||
|
US Dollars
|
||||||||
|
Kibali
|
||||||||
|
Figures in millions
|
2017
|
|
2016
|
|
2015
|
|
||
|
Statement of financial position
|
||||||||
|
Non-current assets
|
2,834
|
|
2,805
|
|
2,754
|
|
||
|
Current assets
|
166
|
|
179
|
|
259
|
|
||
|
Cash and cash equivalents
|
3
|
|
19
|
|
22
|
|
||
|
Total assets
|
3,003
|
|
3,003
|
|
3,035
|
|
||
|
Non-current financial liabilities
|
41
|
|
47
|
|
52
|
|
||
|
Other non-current liabilities
|
23
|
|
32
|
|
57
|
|
||
|
Current financial liabilities
|
7
|
|
10
|
|
10
|
|
||
|
Other current liabilities
|
107
|
|
133
|
|
125
|
|
||
|
Total liabilities
|
178
|
|
|
222
|
|
|
244
|
|
|
Net assets
|
2,825
|
|
|
2,781
|
|
|
2,791
|
|
|
Group’s share of net assets
|
1,413
|
|
1,391
|
|
1,396
|
|
||
|
Other
|
10
|
|
9
|
|
10
|
|
||
|
Carrying amount of interest in joint venture
|
1,423
|
|
|
1,400
|
|
|
1,406
|
|
|
US Dollars
|
||||||||
|
Figures in millions
|
2017
|
|
2016
|
|
2015
|
|
||
|
Aggregate statement of profit (loss) for immaterial joint ventures (attributable)
|
||||||||
|
Revenue
|
113
|
|
114
|
|
138
|
|
||
|
Other operating costs and expenses
|
(94
|
)
|
(95
|
)
|
(102
|
)
|
||
|
Amortisation of tangible and intangible assets
|
(16
|
)
|
(18
|
)
|
(21
|
)
|
||
|
Taxation
|
(2
|
)
|
(3
|
)
|
(7
|
)
|
||
|
Profit (loss) for the year
|
1
|
|
(2
|
)
|
8
|
|
||
|
Total comprehensive income (loss) for the year, net of tax
|
1
|
|
(2
|
)
|
8
|
|
||
F - 46
18
OTHER INVESTMENTS
|
US Dollars
|
||||||||
|
Figures in millions
|
2017
|
|
2016
|
|
2015
|
|
||
|
Non-current investments
|
||||||||
|
Listed investments
(1)
|
||||||||
|
Available-for-sale
|
||||||||
|
Balance at beginning of year
|
46
|
|
29
|
|
47
|
|
||
|
Additions
|
9
|
|
8
|
|
8
|
|
||
|
Disposals
|
(1
|
)
|
(1
|
)
|
(3
|
)
|
||
|
Fair value adjustments
|
19
|
|
7
|
|
(7
|
)
|
||
|
Impairments
|
(3
|
)
|
—
|
|
(9
|
)
|
||
|
Translation
|
3
|
|
3
|
|
(7
|
)
|
||
|
Balance at end of year
|
73
|
|
|
46
|
|
|
29
|
|
|
The available-for-sale non-current investments consist of ordinary shares and collective investment schemes and primarily comprise:
|
||||||||
|
International Tower Hill Mines Limited (ITH)
|
7
|
|
9
|
|
2
|
|
||
|
Corvus Gold Corporation
|
25
|
|
7
|
|
4
|
|
||
|
Various listed investments held by Environmental Rehabilitation Trust Fund
|
22
|
|
18
|
|
17
|
|
||
|
Pure Gold Mining
|
11
|
|
8
|
|
1
|
|
||
|
Orinoco Gold Limited
|
4
|
|
—
|
|
—
|
|
||
|
Other
|
4
|
|
4
|
|
5
|
|
||
|
73
|
|
|
46
|
|
|
29
|
|
|
(1) The group’s listed available-for-sale equity investments are susceptible to market price risk arising from uncertainties about the future values of the investments.
At the reporting date, the majority of equity investments were listed on the Toronto Stock Exchange and the JSE.
F - 47
NOTES TO THE CONSOLIDATED FINANCIAL STATEMENTS
(continued)
18 Other investments
(continued)
|
US Dollars
|
||||||||
|
Figures in millions
|
2017
|
|
2016
|
|
2015
|
|
||
|
Non-current investments (continued)
|
||||||||
|
Listed investments (continued)
|
||||||||
|
Held-to-maturity
|
4
|
|
6
|
|
5
|
|
||
|
The held-to-maturity investment consists of government bonds held by the Environmental Rehabilitation Trust Fund administered by Ashburton Investments.
|
||||||||
|
The fair value of bonds held-to-maturity is $6m (2016: $8m; 2015: $6m) and has a sensitivity of less than $1m (2016: less than $1m; 2015: less than $1m) for a 1% change in interest rates.
|
||||||||
|
Current investments
|
||||||||
|
Listed investments - available for sale
|
7
|
|
5
|
|
1
|
|
||
|
Book value of listed investments
|
84
|
|
57
|
|
35
|
|
||
|
Non-current assets
|
||||||||
|
Unlisted investments
|
||||||||
|
Balance at beginning of year
|
73
|
|
57
|
|
72
|
|
||
|
Additions
|
81
|
|
66
|
|
77
|
|
||
|
Maturities
|
(73
|
)
|
(58
|
)
|
(74
|
)
|
||
|
Transfer to non-current assets and liabilities held for sale
|
(32
|
)
|
—
|
|
—
|
|
||
|
Accrued interest
|
—
|
|
1
|
|
—
|
|
||
|
Translation
|
5
|
|
7
|
|
(18
|
)
|
||
|
Balance at end of year
|
54
|
|
73
|
|
57
|
|
||
|
The unlisted investments include:
|
||||||||
|
Negotiable Certificates of Deposit - Environmental Rehabilitation Trust Fund administered by Ashburton Investments
|
53
|
|
69
|
|
55
|
|
||
|
Other
|
1
|
|
4
|
|
2
|
|
||
|
54
|
|
73
|
|
57
|
|
|||
|
Book value of unlisted investments
|
54
|
|
73
|
|
57
|
|
||
|
Total book value of other investments (note 34)
|
138
|
|
|
130
|
|
|
92
|
|
The group’s listed available-for-sale equity investments are susceptible to market price risk arising from uncertainties about the future values of the investments.
At the reporting date, the majority of equity investments were listed on either the Toronto Stock Exchange or the JSE.
F - 48
19
INVENTORIES
|
US Dollars
|
||||||||
|
Figures in millions
|
2017
|
|
2016
|
|
2015
|
|
||
|
Non-current
|
||||||||
|
Raw materials - ore stockpiles
|
100
|
|
84
|
|
90
|
|
||
|
|
|
|
|
|
|
|||
|
Current
|
||||||||
|
Raw materials
|
||||||||
|
- ore stockpiles
|
261
|
|
233
|
|
232
|
|
||
|
- heap-leach inventory
|
5
|
|
3
|
|
6
|
|
||
|
Work in progress
|
||||||||
|
- metals in process
|
58
|
|
77
|
|
65
|
|
||
|
Finished goods
|
||||||||
|
- gold doré/bullion
|
59
|
|
60
|
|
28
|
|
||
|
- by-products
|
5
|
|
4
|
|
5
|
|
||
|
Total metal inventories
|
388
|
|
|
377
|
|
|
336
|
|
|
Mine operating supplies
|
295
|
|
295
|
|
310
|
|
||
|
683
|
|
|
672
|
|
|
646
|
|
|
|
Total inventories
(1)
|
783
|
|
|
756
|
|
|
736
|
|
|
(1)
|
The amount of the write-down of ore stockpiles, metals in process, by-products and mine operating supplies to net realisable value, and recognised as an expense during the year in special items or cost of sales is
$17m
(
2016
:
$30m
;
2015
:
$30m
).
|
20
TRADE, OTHER RECEIVABLES AND OTHER ASSETS
|
US Dollars
|
||||||||
|
Figures in millions
|
2017
|
|
2016
|
|
2015
|
|
||
|
Non-current
|
||||||||
|
Prepayments
|
17
|
|
9
|
|
9
|
|
||
|
Recoverable tax, rebates, levies and duties
|
50
|
|
25
|
|
4
|
|
||
|
67
|
|
|
34
|
|
|
13
|
|
|
|
Current
|
||||||||
|
Trade and loan receivables
|
27
|
|
35
|
|
34
|
|
||
|
Prepayments
|
62
|
|
85
|
|
37
|
|
||
|
Recoverable tax, rebates, levies and duties
|
127
|
|
124
|
|
117
|
|
||
|
Other receivables
|
6
|
|
11
|
|
8
|
|
||
|
222
|
|
|
255
|
|
|
196
|
|
|
|
Total trade, other receivables and other assets
|
289
|
|
|
289
|
|
|
209
|
|
|
Current trade and loan receivables are generally on terms less than 90 days.
|
||||||||
|
At 31 December 2017 trade receivables of $2m have been pledged as security.
|
||||||||
|
There is a concentration of risk in respect of amounts due from Revenue Authorities for recoverable tax, rebates, levies and duties from subsidiaries in the Continental Africa segment. These values are summarised as follows:
|
||||||||
|
Recoverable value added tax
|
106
|
|
61
|
|
66
|
|
||
|
Recoverable fuel duties
|
38
|
|
39
|
|
28
|
|
||
|
Appeal deposits
|
10
|
|
8
|
|
1
|
|
||
F - 49
21
CASH RESTRICTED FOR USE
|
US Dollars
|
||||||||
|
Figures in millions
|
2017
|
|
2016
|
|
2015
|
|
||
|
Non-current
|
||||||||
|
Cash balances held by Environmental Rehabilitation Trust Funds and other
|
37
|
|
36
|
|
37
|
|
||
|
|
|
|
|
|
|
|||
|
Current
|
||||||||
|
Cash restricted by prudential solvency requirements and other
|
18
|
|
16
|
|
19
|
|
||
|
Cash balances held by the Tropicana joint venture
|
10
|
|
3
|
|
4
|
|
||
|
28
|
|
19
|
|
23
|
|
|||
|
Total cash restricted for use (note 34)
|
65
|
|
55
|
|
60
|
|
||
22
CASH AND CASH EQUIVALENTS
|
US Dollars
|
||||||||
|
Figures in millions
|
2017
|
|
2016
|
|
2015
|
|
||
|
Cash and deposits on call
|
170
|
|
167
|
|
344
|
|
||
|
Money market instruments
|
35
|
|
48
|
|
140
|
|
||
|
Total cash and cash equivalents (note 34 and note 35)
|
205
|
|
215
|
|
484
|
|
||
F - 50
23
NON-CURRENT ASSETS AND LIABILITIES HELD FOR SALE
|
Kopanang gold mine, West Gold Plant and related infrastructure (Kopanang Sale Assets)
|
||||||||
|
The Kopanang gold mine is situated approximately 170 kilometres southwest of Johannesburg. It is included in the South Africa reporting segment. Kopanang gold mine was previously recognised as a combination of tangible assets, current assets, current and long term liabilities. On 19 October 2017, AngloGold Ashanti Limited announced that it has entered into an agreement to dispose of the Kopanang Sale Assets to Heaven‐Sent SA Sunshine Investment Company Limited (HSC), a Chinese capital management company headquartered in Hong Kong. The purchase consideration will be settled on the Closing Date by a payment of R100 million in cash and the transfer of certain gold bearing rock dumps from a subsidiary of HSC, namely Village Main Reef Limited to AngloGold Ashanti. Kopanang mine is a single shaft system, which produces gold as its primary output. In 2017, Kopanang mine produced 91,000 ounces of gold (2016: 91,000 ounces).
|
||||||||
|
Moab Khotsong gold mine and related infrastructure, Nufcor and Margaret Water Company (Moab Sale Assets)
|
||||||||
|
The Moab Khotsong gold mine is situated about 180 kilometres southwest of Johannesburg. It is included in the South Africa reporting segment. Moab Khotsong gold mine was previously recognised as a combination of tangible assets, current assets, current and long term liabilities. On 19 October 2017, AngloGold Ashanti Limited announced that it has entered into a sale and purchase agreement, to dispose of various assets (Moab Sale Assets) situated in the Vaal River area of South Africa to Harmony Gold Mining Company Limited for a cash consideration of US$300 million.
|
||||||||
|
The assets and related interests to be sold include the following:
|
||||||||
|
· The Moab Khotsong mine (which incorporates the Great Noligwa mine) and related infrastructure;
|
||||||||
|
· AngloGold Ashanti’s entire interest in Nuclear Fuels Corporation of South Africa Proprietary Limited; and
|
||||||||
|
· AngloGold Ashanti’s entire interest in Margaret Water Company NPC.
|
||||||||
|
Moab Khotsong is an underground mine which produced 294,000 ounces in 2017 (2016: 280,000 ounces).
|
||||||||
|
Subsequent to year end the conditions precedent were fulfilled. Refer note 36.
|
||||||||
|
The carrying amount of major classes of assets and liabilities includes:
|
||||||||
|
US Dollars
|
||||||||
|
2017
|
||||||||
|
Figures in millions
|
Moab Sale
Assets
|
|
Kopanang Sale
Assets
|
|
Total
|
|
||
|
Tangible assets
(1)
|
277
|
|
12
|
|
289
|
|
||
|
Intangible assets
|
2
|
|
—
|
|
2
|
|
||
|
Inventories
|
16
|
|
5
|
|
21
|
|
||
|
Other investments
|
31
|
|
5
|
|
36
|
|
||
|
Non-current assets held for sale (note 2)
|
326
|
|
|
22
|
|
|
348
|
|
|
Environmental and rehabilitation provisions
|
20
|
|
9
|
|
29
|
|
||
|
Provision for pension and post-retirement benefits
|
1
|
|
—
|
|
1
|
|
||
|
Trade, other payables and deferred income
|
10
|
|
5
|
|
15
|
|
||
|
Deferred taxation
|
81
|
|
—
|
|
81
|
|
||
|
Non-current liabilities held for sale
|
112
|
|
|
14
|
|
|
126
|
|
|
|
|
|||||||
|
Net non-current assets held for sale
|
214
|
|
|
8
|
|
|
222
|
|
(1)
Includes impairments of
$35m
subsequent to being transferred to held for sale.
F - 51
24
SHARE CAPITAL AND PREMIUM
|
US Dollars
|
||||||||
|
Figures in millions
|
2017
|
|
2016
|
|
2015
|
|
||
|
Share capital
|
||||||||
|
Authorised
|
||||||||
|
600,000,000 ordinary shares of 25 SA cents each
|
23
|
|
23
|
|
23
|
|
||
|
2,000,000 A redeemable preference shares of 50 SA cents each
|
—
|
|
—
|
|
—
|
|
||
|
5,000,000 B redeemable preference shares of 1 SA cent each
|
—
|
|
—
|
|
—
|
|
||
|
30,000,000 C redeemable preference shares of no par value
|
—
|
|
—
|
|
—
|
|
||
|
23
|
|
23
|
|
23
|
|
|||
|
Issued and fully paid
|
||||||||
|
410,054,615 (2016: 408,223,760; 2015: 405,265,315) ordinary shares of 25 SA cents each
|
16
|
|
16
|
|
16
|
|
||
|
2,000,000 A redeemable preference shares of 50 SA cents each
|
—
|
|
—
|
|
—
|
|
||
|
778,896 B redeemable preference shares of 1 SA cent each
|
—
|
|
—
|
|
—
|
|
||
|
16
|
|
16
|
|
16
|
|
|||
|
Treasury shares held within the group:
|
||||||||
|
2,778,896 A and B redeemable preference shares
|
—
|
|
—
|
|
—
|
|
||
|
16
|
|
16
|
|
16
|
|
|||
|
Share premium
|
||||||||
|
Balance at beginning of year
|
7,145
|
|
7,103
|
|
7,078
|
|
||
|
Ordinary shares issued
|
26
|
|
42
|
|
25
|
|
||
|
7,171
|
|
7,145
|
|
7,103
|
|
|||
|
Less: held within the group
|
||||||||
|
Redeemable preference shares
|
(53
|
)
|
(53
|
)
|
(53
|
)
|
||
|
Balance at end of year
|
7,118
|
|
7,092
|
|
7,050
|
|
||
|
Share capital and premium
|
7,134
|
|
7,108
|
|
7,066
|
|
||
The rights and restrictions applicable to the A and B redeemable preference shares were unchanged during 2017. The C redeemable preference shares have no par value but have the same rights as the B preference shares except that the C preference shares rank after the B preference shares (but prior to the A preference shares) as regards the payment of dividends, redemption proceeds and payment on winding up of the company.
F - 52
25
BORROWINGS
|
US Dollars
|
||||||||
|
Figures in millions
|
2017
|
|
2016
|
|
2015
|
|
||
|
Non-current
|
||||||||
|
Unsecured
|
||||||||
|
Debt carried at fair value
|
||||||||
|
$1.25bn bonds - issued July 2013
|
—
|
|
—
|
|
498
|
|
||
|
On 1 August 2016, the remaining portion of the bonds were settled.
|
||||||||
|
Debt carried at amortised cost
|
||||||||
|
Rated bonds - issued July 2012
|
759
|
|
758
|
|
756
|
|
||
|
Semi-annual coupons are paid at 5.125% per annum. The bonds were issued on 30 July 2012, are repayable on 1 August 2022 and are US dollar-based.
|
||||||||
|
Rated bonds - issued April 2010
|
1,001
|
|
1,000
|
|
999
|
|
||
|
Semi-annual coupons are paid at 5.375% per annum on $700m 10-year bonds and at 6.5% per annum on $300m 30-year bonds. The $700m bonds are repayable in April 2020 and the $300m bonds are repayable in April 2040. The bonds are US dollar-based.
|
||||||||
|
Syndicated revolving credit facility ($1bn)
|
32
|
|
45
|
|
194
|
|
||
|
Semi-annual interest paid at LIBOR plus 1.5% per annum. The applicable margin is subject to a ratings grid. The facility was issued on 17 July 2014 and is available until 17 July 2019. The facility is US dollar-based.
|
||||||||
|
Syndicated revolving credit facility (A$500m)
|
163
|
|
168
|
|
96
|
|
||
|
Interest charged at BBSY plus 2% per annum. The applicable margin is subject to a ratings grid. The loan is repayable in July 2019 and is Australian dollar-based.
|
||||||||
|
Syndicated loan facility (R1.5bn)
|
—
|
|
88
|
|
65
|
|
||
|
The facility was issued on 3 December 2013 and was settled on 12 December 2017.
|
||||||||
|
Syndicated revolving credit facility (R2.5bn)
|
56
|
|
—
|
|
—
|
|
||
|
Quarterly interest paid at JIBAR plus 1.8% per annum. The facility was issued on 12 December 2017 and is available until 12 December 2020, with the option on application to extend by two years. The loan is SA rand-based.
|
||||||||
|
Syndicated loan facility (R1.4bn)
|
81
|
|
—
|
|
—
|
|
||
|
Quarterly interest paid at JIBAR plus 1.65% per annum. The facility was issued on 7 July 2015 and is available until 7 July 2020. The loan is SA rand-based.
|
||||||||
|
Syndicated loan facility (R1bn)
|
81
|
|
—
|
|
—
|
|
||
|
Quarterly interest paid at JIBAR plus 1.3% per annum. The facility was issued on 3 November 2017 and is available until 3 November 2020, with the option on application to extend by two years. The loan is SA rand-based.
|
||||||||
|
Revolving Credit Facilities - $100m
|
16
|
|
41
|
|
—
|
|
||
|
Various loans with interest rates ranging from 6.2% to 8% above LIBOR. The facilities were issued on 23 August 2016 and are available until 23 August 2019 and are US dollar-based.
|
||||||||
|
Other
|
1
|
|
1
|
|
1
|
|
||
|
Interest charged at various rates from 2.5% plus delta exchange rate on individual instalments per annum to 4.5% per annum. Repayments terminate in June 2023. All loans are Brazilian real-based.
|
||||||||
|
The loans are subject to debt covenant arrangements for which no default event occurred.
|
||||||||
F - 53
NOTES TO THE CONSOLIDATED FINANCIAL STATEMENTS
(continued)
25 Borrowings
(continued)
|
US Dollars
|
||||||||
|
Figures in millions
|
2017
|
|
2016
|
|
2015
|
|
||
|
Non-current (continued)
|
||||||||
|
Secured
|
||||||||
|
Finance leases
|
||||||||
|
Turbine Square Two (Pty) Limited
|
15
|
|
|
15
|
|
|
15
|
|
|
The leases are capitalised at an implied interest rate of 9.8% per annum. Lease payments are due in monthly instalments terminating in March 2022 and are SA rand-based. The buildings financed are used as security for these loans (note 35).
|
||||||||
|
Australian Gas Pipeline
|
58
|
|
57
|
|
62
|
|
||
|
The contract with the supplier of gas contains embedded leases which have been determined to bear interest at an average of 6.75% per annum. The embedded leases commenced in November and December 2015 and are for a 10 and 12 year duration, respectively. The leases are repayable in monthly instalments and are Australian dollar-based. The equipment related to the embedded leases is used as security for these loans.
|
||||||||
|
Other
|
5
|
|
5
|
|
2
|
|
||
|
Various loans with interest rates ranging from 2.5% to 15.5% per annum. These loans are repayable from 2016 to 2041. Some of these loans are secured by the financed assets.
|
||||||||
|
Total non-current borrowings including current portion
|
2,268
|
|
|
2,178
|
|
|
2,688
|
|
|
Current portion of non-current borrowings included in current liabilities
|
(38
|
)
|
(34
|
)
|
(51
|
)
|
||
|
Total non-current borrowings
|
2,230
|
|
|
2,144
|
|
|
2,637
|
|
|
Current
|
||||||||
|
Current portion of non-current borrowings included above
|
38
|
|
34
|
|
51
|
|
||
|
Unsecured
|
||||||||
|
R750m Bonds - issued December 2013
|
—
|
|
—
|
|
49
|
|
||
|
Total current borrowings
|
38
|
|
|
34
|
|
|
100
|
|
|
Total borrowings (notes 34 and 35)
|
2,268
|
|
|
2,178
|
|
|
2,737
|
|
|
Amounts falling due
|
||||||||
|
Within one year
|
38
|
|
34
|
|
100
|
|
||
|
Between one and two years
|
219
|
|
170
|
|
64
|
|
||
|
Between two and five years
|
1,687
|
|
902
|
|
1,495
|
|
||
|
After five years
|
324
|
|
1,072
|
|
1,078
|
|
||
|
(notes 34 and 35)
|
2,268
|
|
|
2,178
|
|
|
2,737
|
|
F - 54
NOTES TO THE CONSOLIDATED FINANCIAL STATEMENTS
(continued)
25 Borrowings
(continued)
|
US Dollars
|
||||||||
|
Figures in millions
|
2017
|
|
2016
|
|
2015
|
|
||
|
Currency
|
||||||||
|
The currencies in which the borrowings are denominated are as follows:
|
||||||||
|
US dollar
|
1,807
|
|
1,844
|
|
2,447
|
|
||
|
Australian dollar
|
221
|
|
225
|
|
158
|
|
||
|
SA rand
|
237
|
|
106
|
|
130
|
|
||
|
Brazilian real
|
3
|
|
3
|
|
2
|
|
||
|
(notes 34 and 35)
|
2,268
|
|
|
2,178
|
|
|
2,737
|
|
|
Undrawn facilities
|
||||||||
|
Undrawn borrowing facilities as at 31 December are as follows:
|
||||||||
|
Syndicated revolving credit facility ($1bn) - US dollar
|
965
|
|
950
|
|
800
|
|
||
|
Syndicated revolving credit facility (A$500m) - Australian dollar
|
226
|
|
191
|
|
266
|
|
||
|
Syndicated revolving credit facility (R1.5bn) - SA rand
|
—
|
|
21
|
|
33
|
|
||
|
Syndicated revolving credit facility (R2.5bn) - SA rand
|
146
|
|
—
|
|
—
|
|
||
|
Syndicated revolving credit facility (R1.4bn) - SA rand
|
32
|
|
102
|
|
91
|
|
||
|
FirstRand Bank Limited (R750m) - SA rand
|
61
|
|
37
|
|
32
|
|
||
|
Revolving credit facilities ($100m) - US dollar
|
85
|
|
60
|
|
—
|
|
||
|
1,515
|
|
|
1,361
|
|
|
1,222
|
|
|
|
Changes in liabilities arising from financing activities:
|
||||||||
|
Reconciliation of total borrowings:
|
||||||||
|
A reconciliation of total borrowings included in the statement of financial position is set out in the following table:
|
||||||||
|
Opening balance
|
2,178
|
|
2,737
|
|
3,721
|
|
||
|
Acquisitions and disposals - other
|
—
|
|
—
|
|
47
|
|
||
|
Proceeds from borrowings
|
815
|
|
787
|
|
421
|
|
||
|
Repayment of borrowings
|
(767
|
)
|
(1,333
|
)
|
(1,288
|
)
|
||
|
Finance costs paid on borrowings
|
(125
|
)
|
(159
|
)
|
(239
|
)
|
||
|
Interest charged to the income statement
|
130
|
|
145
|
|
213
|
|
||
|
Fair value adjustments on issued bonds
|
—
|
|
(9
|
)
|
(66
|
)
|
||
|
Translation
|
37
|
|
10
|
|
(72
|
)
|
||
|
Closing balance
|
2,268
|
|
2,178
|
|
2,737
|
|
||
|
Reconciliation of finance costs paid:
|
||||||||
|
A reconciliation of finance costs paid included in the statement of cash flows is set out in the following table:
|
||||||||
|
Finance costs paid on borrowings
|
125
|
|
159
|
|
239
|
|
||
|
Commitment fees, environmental guarantee fees and other borrowing costs
|
13
|
|
13
|
|
12
|
|
||
|
Total finance costs paid
|
138
|
|
172
|
|
251
|
|
||
F - 55
26
ENVIRONMENTAL REHABILITATION AND OTHER PROVISIONS
|
US Dollars
|
||||||||
|
Figures in millions
|
2017
|
|
2016
|
|
2015
|
|
||
|
Environmental rehabilitation obligations
|
||||||||
|
Provision for decommissioning
|
||||||||
|
Balance at beginning of year
|
279
|
|
272
|
|
296
|
|
||
|
Charge to income statement
|
2
|
|
—
|
|
—
|
|
||
|
Change in estimates
(1)
|
4
|
|
(12
|
)
|
5
|
|
||
|
Unwinding of decommissioning obligation
|
12
|
|
12
|
|
11
|
|
||
|
Transfer to non-current assets and liabilities held for sale
|
(20
|
)
|
—
|
|
(11
|
)
|
||
|
Utilised during the year
|
(2
|
)
|
(2
|
)
|
(3
|
)
|
||
|
Translation
|
11
|
|
9
|
|
(26
|
)
|
||
|
Balance at end of year
|
286
|
|
279
|
|
272
|
|
||
|
Provision for restoration
|
||||||||
|
Balance at beginning of year
|
426
|
|
411
|
|
555
|
|
||
|
Charge to income statement
|
8
|
|
10
|
|
6
|
|
||
|
Change in estimates
(1)
|
(17
|
)
|
(2
|
)
|
(40
|
)
|
||
|
Unwinding of restoration obligation
|
10
|
|
8
|
|
10
|
|
||
|
Transfer to non-current assets and liabilities held for sale
|
(3
|
)
|
—
|
|
(110
|
)
|
||
|
Transfer to current portion
|
(17
|
)
|
—
|
|
—
|
|
||
|
Utilised during the year
|
(4
|
)
|
(3
|
)
|
(2
|
)
|
||
|
Translation
|
6
|
|
2
|
|
(8
|
)
|
||
|
Balance at end of year
|
409
|
|
426
|
|
411
|
|
||
|
Other provisions
(2)(3)
|
||||||||
|
Balance at beginning of year
|
172
|
|
164
|
|
201
|
|
||
|
Charge to income statement
|
17
|
|
11
|
|
11
|
|
||
|
Change in estimates
|
15
|
|
5
|
|
24
|
|
||
|
Additions
|
64
|
|
—
|
|
—
|
|
||
|
Transfer (to) from trade and other payables
|
(6
|
)
|
(2
|
)
|
3
|
|
||
|
Unwinding of other provisions
|
1
|
|
1
|
|
1
|
|
||
|
Utilised during the year
|
(35
|
)
|
(30
|
)
|
(25
|
)
|
||
|
Translation
|
19
|
|
23
|
|
(51
|
)
|
||
|
Balance at end of year
|
247
|
|
172
|
|
164
|
|
||
|
Total environmental rehabilitation and other provisions
|
942
|
|
|
877
|
|
|
847
|
|
|
(1)
|
The change in estimates is attributable to changes in discount rates due to changes in global economic assumptions and changes in mine plans resulting in a change in cash flows and changes in design of tailings storage facilities and in methodology following requests from the environmental regulatory authorities. These provisions are expected to unwind beyond the end of the life of mine.
|
|
(2)
|
Other provisions include the following significant item: Chemwes (Pty) Limited, a subsidiary of First Uranium (Pty) Limited acquired by AngloGold Ashanti Limited during 2012, agreed to sell
25%
of its production, capped at
312,500
oz from 1 January 2012, to Franco-Nevada (Barbados) Corporation. Franco Nevada is required to pay
$400
/oz which inflates at
1%
compounded annually from 2013. These factors were considered in determining the commodity contract obligation. The provision is calculated as the present value of the portion which is deemed onerous in light of the current market conditions using a gold forward for the duration of the contract of
$1,303
/oz (
2016
:
$1,152
/oz;
2015
:
$1,061
/oz). As at 31 December 2017, the remaining production due to Franco Nevada is
170,435
oz (
2016
:
197,528
oz;
2015
:
220,447
oz).
|
|
(3)
|
Other provisions include the provision for the silicosis class action litigation of
$63m
.
|
The undiscounted rehabilitation provision based on real cash flows is
$991m
(2016:
$867m
; 2015:
$831m
).
Provision for silicosis settlement
AngloGold Ashanti Limited together with other mining companies, are named in a class action for silicosis and tuberculosis which was certified by the Johannesburg High Court in May 2016. The companies requested leave to appeal to the Supreme Court of Appeal (SCA), which was granted on 13 September 2016 and was scheduled to be heard from 19 to 23 March 2018. On 10 January 2018, in response to a request from all parties involved in the appeal to the SCA in respect of the silicosis and tuberculosis class action litigation, the Registrar of the SCA postponed the hearing date of the appeal until further notice.
A gold mining industry working group consisting of African Rainbow Minerals Limited, Anglo American South Africa Limited, AngloGold Ashanti Limited, Gold Fields Limited, Sibanye Stilllwater Limited and Harmony Gold Mining Company Limited (collectively the working group) was formed in November 2014 to address issues relating to the compensation and medical care for occupational lung diseases in the gold mining industry in South Africa. Essentially, the working group is seeking a comprehensive and sustainable solution which deals with both legacy compensation issues and future legal frameworks which, while being fair to employees, also ensures the future sustainability of companies in the industry. The working group has engaged all stakeholders on these matters, including government, organised labour, other mining companies and legal representatives of claimants who have filed legal suits
F - 56
26
ENVIRONMENTAL REHABILITATION AND OTHER PROVISIONS
(continued)
against the companies. The working group believes that achieving a comprehensive settlement which is fair to past, present and future employees and sustainable for the sector is preferable to protracted litigation.
The facts of the matter have previously been disclosed as a contingent liability as an amount could not be reliably determined. As a result of the progress made by the working group and the status of negotiations with affected stakeholders, management is now in a position to reasonably estimate AngloGold Ashanti's share of a possible settlement of the class action claims and related costs within an acceptable range.
A pre-tax charge of US
$63 million
has been recognised in special items for the year ended 31 December 2017. Going forward, annual charges in the provision are expected to consist of the time value of money (recognised as a finance cost) and changes in estimates in special items. The expected contributions (cash flows) to the vehicle that will manage the settlement process have been discounted over the expected period of contributions. The contributions are expected to be settled by cash flows from the group's South African operations and will occur over a number of years.
The assumptions that were made in the determination of the provision amount include: silicosis prevalence rates; estimated settlement per claimant; benefit take-up rates and disease progression rates.
A discount rate of
8%
was used, based on government bonds with similar terms to the obligation.
F - 57
NOTES TO THE CONSOLIDATED FINANCIAL STATEMENTS
(continued)
27 Provision for pension and post-retirement benefits
|
US Dollars
|
||||||||
|
Figures in millions
|
2017
|
|
2016
|
|
2015
|
|
||
|
Defined benefit plans
|
||||||||
|
The group has made provision for pension, provident and medical schemes covering substantially all employees. The retirement schemes consist of the following:
|
||||||||
|
AngloGold Ashanti Limited Pension Fund
|
—
|
|
—
|
|
(18
|
)
|
||
|
Post-retirement medical scheme for AngloGold Ashanti Limited South African employees
|
114
|
|
109
|
|
97
|
|
||
|
Other defined benefit plans
|
8
|
|
9
|
|
10
|
|
||
|
Sub-total
|
122
|
|
118
|
|
89
|
|
||
|
Transferred to other non-current assets
|
||||||||
|
- AngloGold Ashanti Limited Pension Fund
|
—
|
|
—
|
|
18
|
|
||
|
122
|
|
|
118
|
|
|
107
|
|
|
|
Other defined benefit plans include the following:
|
||||||||
|
-Obuasi Mines Staff Pension Scheme
|
6
|
|
6
|
|
7
|
|
||
|
- Retiree Medical Plan for North American employees
|
1
|
|
2
|
|
2
|
|
||
|
- Supplemental Employee Retirement Plan (SERP) for North America (USA) Inc. employees
|
1
|
|
1
|
|
1
|
|
||
|
8
|
|
|
9
|
|
|
10
|
|
|
F - 58
NOTES TO THE CONSOLIDATED FINANCIAL STATEMENTS
(continued)
27 Provision for pension and post-retirement benefits
|
Figures in millions
|
2017
|
|
2016
|
|
2015
|
|
||
|
US Dollars
|
||||||||
|
Post-retirement medical scheme for AngloGold Ashanti Limited South African employees
|
||||||||
|
The provision for post-retirement medical funding represents the provision for health care benefits for employees and retired employees and their registered dependants.
|
||||||||
|
The post-retirement benefit costs are assessed in accordance with the advice of independent professionally qualified actuaries. The actuarial method used is the projected unit credit funding method. This scheme is unfunded. The last valuation was performed as at 31 December 2017.
|
||||||||
|
Information with respect to the defined benefit liability is as follows:
|
||||||||
|
Benefit obligation
|
||||||||
|
Balance at beginning of year
|
109
|
|
97
|
|
135
|
|
||
|
Interest cost
|
10
|
|
10
|
|
10
|
|
||
|
Benefits paid
|
(9
|
)
|
(8
|
)
|
(9
|
)
|
||
|
Actuarial (gain) loss
|
(8
|
)
|
(2
|
)
|
(7
|
)
|
||
|
Translation
|
13
|
|
12
|
|
(32
|
)
|
||
|
Balance at end of year
|
115
|
|
|
109
|
|
|
97
|
|
|
Less: transfer to non-current assets and liabilities held for sale
|
(1
|
)
|
—
|
|
—
|
|
||
|
Net amount recognised
(1)
|
114
|
|
|
109
|
|
|
97
|
|
|
(1)
The obligation for post-retirement medical is unfunded.
|
||||||||
|
Components of net periodic benefit cost
|
||||||||
|
Interest cost
|
10
|
|
10
|
|
10
|
|
||
|
Net periodic benefit cost
|
10
|
|
|
10
|
|
|
10
|
|
|
Assumptions
|
||||||||
|
Assumptions used to determine benefit obligations at the end of the year are as follows:
|
||||||||
|
Discount rate
|
9.29
|
%
|
9.31
|
%
|
10.10
|
%
|
||
|
Expected increase in health care costs
|
7.75
|
%
|
8.30
|
%
|
9.10
|
%
|
||
|
Assumed health care cost trend rates at 31 December:
|
||||||||
|
Health care cost trend assumed for next year
|
7.75
|
%
|
8.30
|
%
|
9.10
|
%
|
||
|
Rate to which the cost trend is assumed to decline (the ultimate trend rate)
|
7.75
|
%
|
8.30
|
%
|
9.10
|
%
|
||
|
Assumed health care cost trend rates have a significant effect on the amounts reported for health care plans. A 1% point change in assumed health care cost trend rates would have the following effect:
|
||||||||
|
Effect on total service and interest cost – 1% point increase
|
1
|
|
1
|
|
1
|
|
||
|
Effect on post-retirement benefit obligation – 1% point increase
|
10
|
|
10
|
|
9
|
|
||
|
Effect on total service and interest cost – 1% point decrease
|
(1
|
)
|
(1
|
)
|
(1
|
)
|
||
|
Effect on post-retirement benefit obligation – 1% point decrease
|
(8
|
)
|
(9
|
)
|
(8
|
)
|
||
|
Cash flows
|
||||||||
|
Contributions
|
||||||||
|
AngloGold Ashanti Limited expects to contribute $10m to the post-retirement medical plan in 2018.
|
||||||||
|
Estimated future benefit payments
|
||||||||
|
The following medical benefit payments, which reflect the expected future service, as appropriate, are expected to be paid:
|
||||||||
|
2018
|
10
|
|
||||||
|
2019
|
10
|
|
||||||
|
2020
|
10
|
|
||||||
|
2021
|
11
|
|
||||||
|
2022
|
11
|
|
||||||
|
Thereafter
|
62
|
|
||||||
F - 59
28
DEFERRED TAXATION
|
US Dollars
|
||||||||
|
Figures in millions
|
2017
|
|
|
2016
|
|
|
2015
|
|
|
Deferred taxation relating to temporary differences is made up as follows:
|
|
|
|
|
|
|||
|
Liabilities
|
|
|
|
|
|
|||
|
Tangible assets
|
604
|
|
730
|
|
743
|
|
||
|
Inventories
|
33
|
|
31
|
|
35
|
|
||
|
Other
|
15
|
|
10
|
|
14
|
|
||
|
|
652
|
|
771
|
|
|
792
|
|
|
|
Assets
|
|
|
|
|
|
|||
|
Provisions
|
229
|
|
245
|
|
242
|
|
||
|
Tax losses
|
60
|
|
31
|
|
34
|
|
||
|
Other
|
4
|
|
3
|
|
3
|
|
||
|
|
293
|
|
|
279
|
|
|
279
|
|
|
Net deferred taxation liability
|
359
|
|
|
492
|
|
|
513
|
|
|
Included in the statement of financial position as follows:
|
|
|
|
|
|
|||
|
Deferred tax assets
|
4
|
|
4
|
|
1
|
|
||
|
Deferred tax liabilities
|
363
|
|
496
|
|
514
|
|
||
|
Net deferred taxation liability
|
359
|
|
|
492
|
|
|
513
|
|
|
The movement on the deferred tax balance is as follows:
|
|
|
|
|
|
|||
|
Balance at beginning of year
|
492
|
|
513
|
|
440
|
|
||
|
Taxation of items included in income statement
|
(68
|
)
|
(45
|
)
|
140
|
|
||
|
Taxation on items included in other comprehensive income
|
(6
|
)
|
2
|
|
2
|
|
||
|
Transfer to non-current assets and liabilities held for sale
|
(73
|
)
|
|
—
|
|
|
—
|
|
|
Translation
|
14
|
|
22
|
|
(69
|
)
|
||
|
Balance at end of year
|
359
|
|
|
492
|
|
|
513
|
|
Provision has been made for South African income tax or foreign taxes that may result from future remittances of undistributed earnings of foreign subsidiaries or foreign corporate joint ventures, where the group is able to assert that the undistributed earnings are not permanently reinvested. In all other cases, the foreign subsidiaries reinvest the undistributed earnings into future capital expansion projects, maintenance capital and ongoing working capital funding requirements. Unrecognised taxable temporary differences pertaining to undistributed earnings totalled
$384m
(
2016
:
$366m
;
2015
:
$357m
).
F - 60
29
TRADE, OTHER PAYABLES AND DEFERRED INCOME
|
US Dollars
|
||||||||
|
Figures in millions
|
2017
|
|
2016
|
|
2015
|
|
||
|
Non-current
|
3
|
|
4
|
|
5
|
|
||
|
Current
|
||||||||
|
Trade payables
|
358
|
|
381
|
|
306
|
|
||
|
Accruals and deferred income
|
193
|
|
206
|
|
187
|
|
||
|
Short-term provisions
|
22
|
|
—
|
|
—
|
|
||
|
Accruals for retrenchment costs
|
35
|
|
—
|
|
—
|
|
||
|
Other payables
|
30
|
|
28
|
|
23
|
|
||
|
638
|
|
|
615
|
|
|
516
|
|
|
|
Total trade, other payables and deferred income
|
641
|
|
|
619
|
|
|
521
|
|
|
Current trade and other payables are non-interest bearing and are normally settled within 60 days.
|
||||||||
30
TAXATION
|
US Dollars
|
||||||||
|
Figures in millions
|
2017
|
|
2016
|
|
2015
|
|
||
|
Balance at beginning of year
|
97
|
|
64
|
|
41
|
|
||
|
Refunds during the year
|
14
|
|
12
|
|
21
|
|
||
|
Payments during the year
|
(174
|
)
|
(165
|
)
|
(184
|
)
|
||
|
Taxation of items included in the income statement
|
190
|
|
234
|
|
192
|
|
||
|
Offset of VAT and other taxes
|
(78
|
)
|
(47
|
)
|
—
|
|
||
|
Translation
|
1
|
|
(1
|
)
|
(6
|
)
|
||
|
Balance at end of year
|
50
|
|
97
|
|
64
|
|
||
|
Included in the statement of financial position as follows:
|
||||||||
|
Taxation asset included in trade and other receivables
|
(3
|
)
|
(14
|
)
|
(27
|
)
|
||
|
Taxation liability
|
53
|
|
111
|
|
91
|
|
||
|
50
|
|
|
97
|
|
|
64
|
|
|
F - 61
31
CASH GENERATED FROM OPERATIONS
|
US Dollars
|
||||||||
|
Figures in millions
|
2017
|
|
2016
|
|
2015
|
|
||
|
Profit (loss) before taxation
|
(63
|
)
|
269
|
|
257
|
|
||
|
Adjusted for:
|
||||||||
|
Movement on non-hedge derivatives and other commodity contracts
|
(10
|
)
|
(19
|
)
|
7
|
|
||
|
Amortisation of tangible assets (note 4)
|
817
|
|
789
|
|
737
|
|
||
|
Finance costs and unwinding of obligations (note 7)
|
169
|
|
180
|
|
245
|
|
||
|
Environmental, rehabilitation and other expenditure
|
(30
|
)
|
(13
|
)
|
(56
|
)
|
||
|
Special items
|
394
|
|
44
|
|
60
|
|
||
|
Amortisation of intangible assets (notes 4 and 15)
|
6
|
|
20
|
|
40
|
|
||
|
Fair value adjustment on issued bonds
|
—
|
|
(9
|
)
|
(66
|
)
|
||
|
Interest received (note 3)
|
(15
|
)
|
(22
|
)
|
(28
|
)
|
||
|
Share of associates and joint ventures’ (profit) loss (note 8)
|
(22
|
)
|
(11
|
)
|
(88
|
)
|
||
|
Exchange loss on foreign currency reserve release
|
—
|
|
60
|
|
—
|
|
||
|
Other non-cash movements
|
61
|
|
90
|
|
53
|
|
||
|
Movements in working capital
|
(156
|
)
|
(76
|
)
|
89
|
|
||
|
1,151
|
|
1,302
|
|
1,250
|
|
|||
|
Movements in working capital:
|
||||||||
|
(Increase) decrease in inventories
|
(67
|
)
|
(48
|
)
|
99
|
|
||
|
(Increase) decrease in trade, other receivables and other assets
|
(86
|
)
|
(131
|
)
|
108
|
|
||
|
Increase (decrease) in trade, other payables and deferred income
|
(3
|
)
|
103
|
|
(118
|
)
|
||
|
(156
|
)
|
(76
|
)
|
89
|
|
|||
F - 62
32
RELATED PARTIES
|
US Dollars
|
||||||||
|
Figures in millions
|
2017
|
|
2016
|
|
2015
|
|
||
|
Material related party transactions were as follows (not attributable):
|
||||||||
|
Sales and services rendered to related parties
|
||||||||
|
Joint ventures
|
12
|
|
16
|
|
6
|
|
||
|
Purchases and services acquired from related parties
|
||||||||
|
Associates
|
16
|
|
15
|
|
8
|
|
||
|
Joint ventures
|
3
|
|
6
|
|
—
|
|
||
|
Outstanding balances arising from sale of goods and services due by related parties
|
||||||||
|
Associates
|
7
|
|
—
|
|
—
|
|
||
|
Joint ventures
|
2
|
|
8
|
|
—
|
|
||
|
Amounts owed to/due by related parties above are unsecured and non-interest bearing.
|
||||||||
|
Loans advanced to joint ventures and associates
|
||||||||
|
Rand Refinery (Pty) Limited
|
||||||||
|
During the year the loan was converted to preference shares. There are no fixed repayment terms. The loan had accrued interest at JIBAR plus 3.5%
|
—
|
|
20
|
|
27
|
|
||
|
Loans advanced to associates and joint ventures are included in the carrying value of investments in associates and joint ventures (note 17)
|
||||||||
Executive contracts
All members of the Executive Committee have permanent employment contracts which entitle them to standard group benefits as defined by their specific region and participation in the company’s short-term incentive scheme, the Bonus Share Plan (BSP) and the Long Term Incentive Plan (LTIP). All recently updated Executive Committee contracts include details on participation in the Co-Investment Plan (CIP).
South African executives have an off-shore retainer which is detailed under a separate contract. This reflects the percentage of their time focused on offshore business requirements. The offshore pay has been increased to a maximum cap of
40%
of base pay due to a review of the amount of time spent outside South Africa on the offshore responsibilities of each executive team member. Where practical the offshore portion is now pensionable.
The executive contracts are reviewed annually and currently continue to include a change of control provision. The change of control is subject to the following triggers:
|
•
|
The acquisition of all or part of AngloGold Ashanti; or
|
|
•
|
A number of shareholders holding less than 35% of the company’s issued share capital consorting to gain a majority of the board and make management decisions; and
|
|
•
|
The contracts of Executive Committee members are either terminated or their role and employment conditions are curtailed.
|
In the event of a change of control becoming effective, the executive will in certain circumstances be subject to both the notice period and the change of control contract terms. The notice period applied per category of executive and the change of control periods as at 31 December 2017 were as follows:
|
Executive Committee member
|
Notice Period
|
Change of control
|
|
|
CEO
|
12 months
|
12 months
|
|
|
CFO
|
6 months
|
6 months
|
|
|
EXCO
|
6 months
|
6 months
|
|
F - 63
NOTES TO THE CONSOLIDATED FINANCIAL STATEMENTS
(continued)
32. Related parties
(continued)
Directors and other key management personnel
Executive Directors’ and Prescribed Officers’ remuneration
|
Salary
(1)
|
|
Performance
related
payments
(2)
|
|
Pension
scheme
benefits
|
|
Other benefits
and
encashed
leave
(3)
|
|
Subtotal
|
|
Pre-tax
gain
on
share
options
|
|
Total
|
Total
|
Total
|
Total
|
||||||||||
|
SA Rands
|
US Dollars
(4)
|
US Dollars
(4)
|
US Dollars
(4)
|
||||||||||||||||||||||
|
Figures in thousands
|
2017
|
2016
|
2015
|
||||||||||||||||||||||
|
Executive Directors
|
|||||||||||||||||||||||||
|
S Venkatakrishnan
|
13,318
|
|
8,382
|
|
3,296
|
|
3,388
|
|
28,384
|
|
—
|
|
28,384
|
|
2,134
|
|
1,832
|
|
1,905
|
|
|||||
|
KC Ramon
|
8,423
|
|
4,607
|
|
727
|
|
1,627
|
|
15,384
|
|
—
|
|
15,384
|
|
1,157
|
|
947
|
|
1,024
|
|
|||||
|
21,741
|
|
12,989
|
|
4,023
|
|
5,015
|
|
43,768
|
|
—
|
|
43,768
|
|
3,291
|
|
2,779
|
|
2,929
|
|
||||||
|
Prescribed Officers
|
|||||||||||||||||||||||||
|
CE Carter
(5)
|
9,408
|
|
4,411
|
|
1,330
|
|
1,717
|
|
16,866
|
|
8,238
|
|
25,104
|
|
1,887
|
|
1,535
|
|
1,906
|
|
|||||
|
GJ Ehm
|
8,778
|
|
4,116
|
|
306
|
|
1,489
|
|
14,689
|
|
4,588
|
|
19,277
|
|
1,449
|
|
1,693
|
|
1,404
|
|
|||||
|
L Eybers
(6)
|
7,400
|
|
3,691
|
|
327
|
|
2,570
|
|
13,988
|
|
—
|
|
13,988
|
|
1,051
|
|
—
|
|
—
|
|
|||||
|
DC Noko
|
6,767
|
|
3,173
|
|
644
|
|
1,888
|
|
12,472
|
|
—
|
|
12,472
|
|
938
|
|
961
|
|
976
|
|
|||||
|
ME Sanz Perez
|
6,737
|
|
3,159
|
|
795
|
|
1,078
|
|
11,769
|
|
—
|
|
11,769
|
|
885
|
|
1,640
|
|
823
|
|
|||||
|
CB Sheppard
|
7,154
|
|
3,354
|
|
681
|
|
272
|
|
11,461
|
|
—
|
|
11,461
|
|
862
|
|
721
|
|
511
|
|
|||||
|
TR Sibisi
|
5,786
|
|
2,886
|
|
703
|
|
77
|
|
9,452
|
|
—
|
|
9,452
|
|
711
|
|
541
|
|
—
|
|
|||||
|
Retired prescribed officers
|
8,189
|
|
—
|
|
2,887
|
|
22,601
|
|
33,677
|
|
29,281
|
|
62,958
|
|
4,733
|
|
5,978
|
|
4,719
|
|
|||||
|
60,219
|
|
24,790
|
|
7,673
|
|
31,692
|
|
124,374
|
|
42,107
|
|
166,481
|
|
12,516
|
|
13,069
|
|
10,339
|
|
||||||
|
Total Executive Directors’ and Prescribed Officers’ remuneration ZAR
|
81,960
|
|
37,779
|
|
11,696
|
|
36,707
|
|
168,142
|
|
42,107
|
|
210,249
|
|
|||||||||||
|
Total Executive Directors’ and Prescribed Officers’ remuneration USD
|
6,162
|
|
2,840
|
|
879
|
|
2,760
|
|
12,641
|
|
3,166
|
|
15,807
|
|
15,848
|
|
13,268
|
|
|||||||
|
(1)
|
Salaries are disclosed only for the period from or to which office is held, and include car allowances where applicable.
|
|
(2)
|
The performance related payments are calculated on the year’s financial results.
|
|
(3)
|
Includes health care, pension allowance, cash in lieu of dividends, vested CIP match awards, group personal accident, disability and funeral cover. Surplus leave days accrued are automatically encashed unless work requirements allow for carry over.
|
|
(4)
|
Values have been converted using the average annual exchange rate for
2017
: R
13.3014
:$1 (
2016
: R
14.6812
:$1;
2015
: R
12.7719
: $1).
|
|
(5)
|
Benefits for 2017 for CE Carter include a dependent’s scholarship award of
$2,500
.
|
|
(6)
|
L Eybers was appointed prescribed officer with effect from 22 February 2017.
|
F - 64
NOTES TO THE CONSOLIDATED FINANCIAL STATEMENTS
(continued)
32 Related parties
(continued)
Directors and other key management personnel
(continued)
Number of options and awards granted
|
Balance at
1 January 2017
|
|
Granted
during 2017
|
|
Exercised
during 2017
|
|
Lapsed
during
2017
|
|
Balance as at
31 December
2017
|
(1)
|
|
Vested
balance at
31 December
2017
|
|
|||||||
|
Executive Directors
|
|||||||||||||||||||
|
S Venkatakrishnan
|
689,087
|
|
72,118
|
|
—
|
|
89,553
|
|
671,652
|
343,678
|
|
||||||||
|
KC Ramon
|
211,785
|
|
42,878
|
|
—
|
|
37,099
|
|
217,564
|
44,887
|
|
||||||||
|
Total Executive Directors
|
900,872
|
|
114,996
|
|
—
|
|
126,652
|
|
889,216
|
388,565
|
|
||||||||
|
Prescribed Officers
|
|||||||||||||||||||
|
CE Carter
|
250,386
|
|
38,600
|
|
58,260
|
|
51,426
|
|
179,300
|
—
|
|
||||||||
|
GJ Ehm
|
331,354
|
|
33,580
|
|
31,172
|
|
59,637
|
|
274,125
|
105,508
|
|
||||||||
|
L Eybers
|
58,563
|
|
18,101
|
|
—
|
|
11,179
|
|
65,485
|
17,280
|
|
||||||||
|
DC Noko
|
244,592
|
|
27,626
|
|
—
|
|
40,299
|
|
231,919
|
100,410
|
|
||||||||
|
ME Sanz Perez
|
205,213
|
|
29,398
|
|
—
|
|
42,538
|
|
192,073
|
59,244
|
|
||||||||
|
CB Sheppard
|
27,552
|
|
29,205
|
|
—
|
|
—
|
|
56,757
|
5,076
|
|
||||||||
|
TR Sibisi
|
—
|
|
23,621
|
|
—
|
|
—
|
|
23,621
|
—
|
|
||||||||
|
Retired prescribed officer
|
475,616
|
|
—
|
|
214,256
|
|
261,360
|
|
—
|
—
|
|
||||||||
|
Total Prescribed Officers
|
1,593,276
|
|
|
200,131
|
|
|
303,688
|
|
|
466,439
|
|
1,023,280
|
287,518
|
|
|||||
|
Other
|
6,139,505
|
|
|
1,611,422
|
|
|
1,527,167
|
|
|
1,138,367
|
|
—
|
|
5,085,393
|
1,735,705
|
|
|||
|
Total share incentive scheme
|
8,633,653
|
|
1,926,549
|
|
|
1,830,855
|
|
1,731,458
|
|
6,997,889
|
2,411,788
|
|
|||||||
|
(1)
|
The latest expiry date of all options/awards granted and outstanding at 31 December 2017 is 1 March 2027 (2016: 1 March 2026; 2015: 3 March 2025).
|
Subsequent to year end and up to 16 March 2018, options/awards exercised by Executive Directors and Prescribed Officers, are for Charles Carter who exercised
87,852
awards for a pre-tax gain of
$723,854
and Graham Ehm who exercised
46,316
awards for a pre-tax gain of
$392,431
.
Awards granted since 2005 have been granted at no cost to participants.
Non-Executive Directors are not eligible to participate in the share incentive scheme.
Number of CSLTIP awards granted:
|
Balance at
1 January 2017
|
|
Granted
during 2017
|
|
Exercised
during 2017
|
|
Lapsed
during
2017
|
|
Balance as at
31 December
2017
|
|
|||||
|
Executive Directors
|
||||||||||||||
|
S Venkatakrishnan
|
120,000
|
|
174,872
|
|
—
|
|
—
|
|
294,872
|
|
||||
|
KC Ramon
|
120,000
|
|
110,595
|
|
—
|
|
—
|
|
230,595
|
|
||||
|
Total Executive Directors
|
240,000
|
|
285,467
|
|
—
|
|
—
|
|
525,467
|
|
||||
|
Prescribed Officers
|
||||||||||||||
|
CE Carter
|
120,000
|
|
110,595
|
|
—
|
|
—
|
|
230,595
|
|
||||
|
GJ Ehm
|
120,000
|
|
110,595
|
|
—
|
|
—
|
|
230,595
|
|
||||
|
L Eybers
|
20,000
|
|
97,535
|
|
—
|
|
—
|
|
117,535
|
|
||||
|
DC Noko
|
120,000
|
|
88,850
|
|
—
|
|
—
|
|
208,850
|
|
||||
|
ME Sanz Perez
|
120,000
|
|
88,463
|
|
—
|
|
—
|
|
208,463
|
|
||||
|
CB Sheppard
|
120,000
|
|
93,928
|
|
—
|
|
—
|
|
213,928
|
|
||||
|
TR Sibisi
|
120,000
|
|
75,971
|
|
—
|
|
—
|
|
195,971
|
|
||||
|
Retired prescribed officer
|
120,000
|
|
—
|
|
17,497
|
|
102,503
|
|
—
|
|
||||
|
Total Prescribed Officers
|
860,000
|
|
665,937
|
|
17,497
|
|
102,503
|
|
1,405,937
|
|
||||
|
Other
|
1,364,630
|
|
1,621,033
|
|
42,355
|
|
405,094
|
|
|
2,538,214
|
|
|||
|
Total share incentive scheme
|
2,464,630
|
|
2,572,437
|
|
59,852
|
|
507,597
|
|
4,469,618
|
|
||||
F - 65
NOTES TO THE CONSOLIDATED FINANCIAL STATEMENTS
(continued)
32 Related parties
(continued)
Directors and other key management personnel
(continued)
Awards granted in respect of the previous year’s financial results:
|
Total
(1)
|
Total
|
||||
|
2017
|
2016
|
||||
|
Executive Directors
|
|||||
|
S Venkatakrishnan
|
72,118
|
|
49,962
|
|
|
|
KC Ramon
|
42,878
|
|
30,323
|
|
|
|
114,996
|
|
80,285
|
|
||
|
Prescribed Officers
|
|||||
|
CE Carter
|
38,600
|
|
36,666
|
|
|
|
GJ Ehm
|
33,580
|
|
31,602
|
|
|
|
L Eybers
|
18,101
|
|
—
|
|
|
|
DC Noko
|
27,626
|
|
20,080
|
|
|
|
ME Sanz Perez
|
29,398
|
|
19,992
|
|
|
|
CB Sheppard
|
29,205
|
|
10,152
|
|
|
|
TR Sibisi
|
23,621
|
|
—
|
|
|
|
Retired prescribed officer
|
—
|
|
63,828
|
|
|
|
200,131
|
|
182,320
|
|
||
|
Total awards to executive management
|
315,127
|
|
262,605
|
|
|
|
(1)
|
Relates to the BSP 17 awards that were issued prior to the Annual General Meeting on 16 May 2017.
|
Non-Executive Director remuneration
The table below details the fees and allowances paid to Non-Executive Directors:
Non-Executive Directors’ fees and allowances
|
Figures in
thousands
(1)
|
|
Figures in
thousands
(1)
|
|
||||||||||||||
|
Director
fees
|
|
Committee
fees
|
|
Travel
allowance
|
|
Total
|
|
Total
|
|
Total
|
|
||||||
|
US Dollars
(1)
|
2017
|
2016
|
|
2015
|
|
||||||||||||
|
SM Pityana (Chairman)
|
312,500
|
|
59,750
|
|
—
|
|
372,250
|
|
378
|
|
411
|
|
|||||
|
AH Garner
|
123,500
|
|
43,500
|
|
33,750
|
|
200,750
|
|
200
|
|
204
|
|
|||||
|
MJ Kirkwood
|
123,500
|
|
68,500
|
|
38,750
|
|
230,750
|
|
249
|
|
242
|
|
|||||
|
NP January-Bardill
|
123,500
|
|
56,000
|
|
—
|
|
179,500
|
|
189
|
|
189
|
|
|||||
|
R Gasant
|
123,500
|
|
58,500
|
|
—
|
|
182,000
|
|
193
|
|
195
|
|
|||||
|
RJ Ruston
|
123,500
|
|
56,000
|
|
32,500
|
|
212,000
|
|
231
|
|
226
|
|
|||||
|
MDC Richter
|
123,500
|
|
48,500
|
|
31,250
|
|
203,250
|
|
200
|
|
205
|
|
|||||
|
DL Hodgson
|
123,500
|
|
43,500
|
|
—
|
|
167,000
|
|
176
|
|
180
|
|
|||||
|
SV Zilwa
(2)
|
90,000
|
|
45,000
|
|
—
|
|
135,000
|
|
—
|
|
—
|
|
|||||
|
Retired non-executive officer
(3)
|
43,500
|
|
33,500
|
|
—
|
|
77,000
|
|
256
|
|
260
|
|
|||||
|
Total
|
1,310,500
|
|
512,750
|
|
136,250
|
|
1,959,500
|
|
2,072
|
|
2,112
|
|
|||||
|
(1)
|
Directors’ compensation is disclosed in US dollars.
|
|
(2)
|
Director joined in April 2017.
|
|
(3)
|
Director retired in May 2017.
|
Non-Executive Directors do not hold service contracts with the company. Executive Directors do not receive payment of directors' fees or commitment fees.
F - 66
NOTES TO THE CONSOLIDATED FINANCIAL STATEMENTS
(continued)
32 Related parties
(continued)
Directors’ and Prescribed Officers’ interests in AngloGold Ashanti shares
(continued)
The interests of directors, prescribed officers and their associates in the ordinary shares of the company at 31 December, which individually did not exceed 1% of the company’s issued ordinary share capital, were:
|
31 December 2017
|
31 December 2016
|
31 December 2015
|
|||||||||||||||
|
Beneficial holding
|
Beneficial holding
|
Beneficial holding
|
|||||||||||||||
|
Direct
|
Indirect
|
Direct
|
Indirect
|
Direct
|
Indirect
|
||||||||||||
|
Non-Executive Directors
|
|||||||||||||||||
|
SM Pityana
|
2,990
|
|
—
|
|
2,990
|
|
—
|
|
2,000
|
|
—
|
|
|||||
|
MDC Richter
(1)
|
7,300
|
|
—
|
|
7,300
|
|
—
|
|
7,300
|
|
—
|
|
|||||
|
DL Hodgson
|
1,500
|
|
—
|
|
1,500
|
|
—
|
|
1,500
|
|
—
|
|
|||||
|
MJ Kirkwood
(1)
|
15,000
|
|
—
|
|
15,000
|
|
—
|
|
15,000
|
|
—
|
|
|||||
|
RJ Ruston
(2)
|
—
|
|
1,000
|
|
—
|
|
1,000
|
|
—
|
|
1,000
|
|
|||||
|
AH Garner
(1)
|
7,500
|
|
—
|
|
—
|
|
—
|
|
—
|
|
—
|
|
|||||
|
Retired director
|
—
|
|
—
|
|
3,000
|
|
—
|
|
3,000
|
|
—
|
|
|||||
|
Total
|
34,290
|
|
|
1,000
|
|
|
29,790
|
|
|
1,000
|
|
|
28,800
|
|
|
1,000
|
|
|
Executive Directors
|
|||||||||||||||||
|
S Venkatakrishnan
|
236,468
|
|
—
|
|
213,423
|
|
—
|
|
205,939
|
|
—
|
|
|||||
|
KC Ramon
|
28,265
|
|
—
|
|
12,334
|
|
—
|
|
3,104
|
|
—
|
|
|||||
|
Total
|
264,733
|
|
—
|
|
225,757
|
|
—
|
|
209,043
|
|
—
|
|
|||||
|
Company Secretary
|
|||||||||||||||||
|
ME Sanz Perez
|
13,994
|
|
16,368
|
|
7,921
|
|
12,747
|
|
10,471
|
|
8,860
|
|
|||||
|
Total
|
13,994
|
|
16,368
|
|
7,921
|
|
12,747
|
|
10,471
|
|
8,860
|
|
|||||
|
Prescribed Officers
|
|||||||||||||||||
|
CE Carter
|
50,800
|
|
—
|
|
43,229
|
|
—
|
|
39,560
|
|
—
|
|
|||||
|
GJ Ehm
(2)
|
30,319
|
|
16,213
|
|
33,782
|
|
—
|
|
22,532
|
|
—
|
|
|||||
|
L Eybers
|
4,812
|
|
—
|
|
—
|
|
—
|
|
—
|
|
—
|
|
|||||
|
DC Noko
|
41,244
|
|
—
|
|
28,015
|
|
—
|
|
17,086
|
|
—
|
|
|||||
|
CB Sheppard
|
5,344
|
|
—
|
|
—
|
|
—
|
|
—
|
|
—
|
|
|||||
|
TR Sibisi
|
4,085
|
|
—
|
|
—
|
|
—
|
|
—
|
|
—
|
|
|||||
|
Retired prescribed officers
|
—
|
|
—
|
|
44,470
|
|
—
|
|
34,298
|
|
13,204
|
|
|||||
|
Total
|
136,604
|
|
16,213
|
|
149,496
|
|
—
|
|
113,476
|
|
13,204
|
|
|||||
|
Grand total
|
449,621
|
|
33,581
|
|
412,964
|
|
13,747
|
|
361,790
|
|
23,064
|
|
|||||
|
(1)
|
Held on the New York stock exchange as American Depositary Shares (ADSs) (
1
ADS is equivalent to 1 ordinary share)
|
|
(2)
|
Held on the Australian stock exchange as CHESS Depositary Receipts (
5
CDIs are equivalent to 1 ordinary share)
|
A register detailing Directors and Prescribed Officers’ interests in contracts is available for inspection at the company’s registered and corporate office.
F - 67
NOTES TO THE CONSOLIDATED FINANCIAL STATEMENTS
(continued)
32 Related parties
(continued)
Directors’ and Prescribed Officers’ interests in AngloGold Ashanti shares
(continued)
Changes in Directors’ and Prescribed Officers’ interests in AngloGold Ashanti shares, excluding options and awards granted in terms of the group’s BSP and LTIP schemes, after 31 December 2017 and up to 16 March 2018 include:
|
Date of
transaction
|
Type of transaction
|
Number
of shares
|
Direct/Indirect
beneficial
holdings
|
|||||
|
Executive Directors
|
||||||||
|
S Venkatakrishnan
|
6 March 2018
|
On-market purchase of ordinary shares pursuant to the AngloGold Ashanti Co-Investment Plan
|
11,632
|
|
Direct
|
|||
|
On-market sale of ordinary shares to settle tax costs
|
5,293
|
|
Direct
|
|||||
|
KC Ramon
|
26 February 2018
|
On-market purchase of ordinary shares pursuant to the AngloGold Ashanti Co-Investment Plan
|
5,177
|
|
Direct
|
|||
|
27 February 2018
|
On-market purchase of ordinary shares pursuant to the AngloGold Ashanti Co-Investment Plan
|
6,320
|
|
Direct
|
||||
|
On-market purchase of ordinary shares pursuant to the AngloGold Ashanti Co-Investment Plan
|
11,300
|
|
Direct
|
|||||
|
Company Secretary
|
||||||||
|
ME Sanz Perez
|
27 February 2018
|
On-market purchase of ordinary shares pursuant to the AngloGold Ashanti Co-Investment Plan
|
7,656
|
|
Direct
|
|||
|
28 February 2018
|
On-market purchase of ordinary shares pursuant to the AngloGold Ashanti Co-Investment Plan
|
4,554
|
|
Direct
|
||||
|
Prescribed Officers
|
||||||||
|
CE Carter
|
7 March 2018
|
On-market purchase of ordinary shares pursuant to the AngloGold Ashanti Co-Investment Plan
|
948
|
|
Direct
|
|||
|
GJ Ehm
|
5 March 2018
|
On-market purchase of ordinary shares pursuant to the AngloGold Ashanti Co-Investment Plan
|
4,500
|
|
Direct
|
|||
|
6 March 2018
|
On-market purchase of ordinary shares pursuant to the AngloGold Ashanti Co-Investment Plan
|
8,000
|
|
Direct
|
||||
|
L Eybers
|
9 March 2018
|
On-market purchase of ordinary shares pursuant to the AngloGold Ashanti Co-Investment Plan
|
8,786
|
|
Direct
|
|||
|
16 March 2018
|
On-market purchase of ordinary shares pursuant to the AngloGold Ashanti Co-Investment Plan
|
3,609
|
|
Direct
|
||||
|
D Noko
|
27 February 2018
|
On-market purchase of ordinary shares pursuant to the AngloGold Ashanti Co-Investment Plan
|
7,071
|
|
Direct
|
|||
|
9 March 2018
|
On-market purchase of ordinary shares pursuant to the AngloGold Ashanti Co-Investment Plan
|
8,165
|
|
Direct
|
||||
|
On-market sale of ordinary shares to settle tax costs
|
3,716
|
|
Direct
|
|||||
|
CB Sheppard
|
1 March 2018
|
On-market purchase of ordinary shares pursuant to the AngloGold Ashanti Co-Investment Plan
|
6,900
|
|
Direct
|
|||
|
15 March 2018
|
On-market purchase of ordinary shares pursuant to the AngloGold Ashanti Co-Investment Plan
|
4,008
|
|
Direct
|
||||
|
On-market sale of ordinary shares to settle tax costs
|
1,824
|
|
Direct
|
|||||
|
TR Sibisi
|
28 February 2018
|
On-market purchase of ordinary shares pursuant to the AngloGold Ashanti Co-Investment Plan
|
3,063
|
|
Direct
|
|||
|
On-market sale of ordinary shares to settle tax costs
|
1,394
|
|
Direct
|
|||||
|
1 March 2018
|
On-market purchase of ordinary shares pursuant to the AngloGold Ashanti Co-Investment Plan
|
4,160
|
|
Direct
|
||||
F - 68
33
CONTRACTUAL COMMITMENTS AND CONTINGENCIES
Operating Leases
|
US Dollars
|
||||||||
|
Figures in millions
|
2017
|
|
2016
|
|
2015
|
|
||
|
Operating leases
|
||||||||
|
At 31 December 2017, the group was committed to making the following payments in respect of operating leases for, amongst others, the hire of plant and equipment and land and buildings. Certain contracts contain renewal options and escalation clauses for various periods of time.
|
||||||||
|
Expiry:
|
||||||||
|
- less than one year
|
45
|
|
47
|
|
34
|
|
||
|
- between one and three years
|
38
|
|
36
|
|
69
|
|
||
|
- between three and five years
|
7
|
|
5
|
|
10
|
|
||
|
90
|
|
88
|
|
113
|
|
|||
Operating lease charges included in profit before taxation amounts to
$247m
(
2016
:
$198m
;
2015
:
$149m
).
Finance leases
The group has finance leases for plant and equipment and buildings. The leases for plant and equipment and buildings have terms of renewal but no purchase options. Future minimum lease payments under finance lease contracts together with the present value of the net minimum lease payments are as follows:
|
Minimum
payments
|
|
Present
value of
payments
|
|
Minimum
payments
|
|
Present
value of
payments
|
|
Minimum
payments
|
|
Present
value of
payments
|
|
|||||||
|
US Dollars million
|
2017
|
2016
|
2015
|
|||||||||||||||
|
Less than one year
|
14
|
|
8
|
|
12
|
|
6
|
|
11
|
|
5
|
|
||||||
|
Between one and three years
|
27
|
|
18
|
|
25
|
|
15
|
|
22
|
|
12
|
|
||||||
|
Between three and five years
|
24
|
|
17
|
|
26
|
|
18
|
|
24
|
|
15
|
|
||||||
|
More than five years
|
54
|
|
35
|
|
63
|
|
38
|
|
76
|
|
49
|
|
||||||
|
Total minimum lease payments
|
119
|
|
78
|
|
126
|
|
77
|
|
133
|
|
81
|
|
||||||
|
Amounts representing finance charges
|
(41
|
)
|
—
|
|
(49
|
)
|
—
|
|
(52
|
)
|
—
|
|
||||||
|
Present value of minimum lease payments
|
78
|
|
78
|
|
77
|
|
77
|
|
81
|
|
81
|
|
||||||
|
US Dollars
|
||||||||||||||||||
|
Figures in millions
|
2017
|
|
2016
|
|
2015
|
|
||||||||||||
|
Capital commitments
|
||||||||||||||||||
|
Acquisition of tangible assets
|
||||||||||||||||||
|
Contracted for
|
87
|
|
58
|
|
61
|
|
||||||||||||
|
Not contracted for
|
113
|
|
587
|
|
856
|
|
||||||||||||
|
Authorised by the directors
|
200
|
|
645
|
|
917
|
|
||||||||||||
|
Allocated to:
|
||||||||||||||||||
|
Project capital
|
||||||||||||||||||
|
- within one year
|
104
|
|
252
|
|
134
|
|
||||||||||||
|
- thereafter
|
—
|
|
255
|
|
402
|
|
||||||||||||
|
104
|
|
507
|
|
536
|
|
|||||||||||||
|
Stay-in-business capital
|
||||||||||||||||||
|
- within one year
|
84
|
|
135
|
|
249
|
|
||||||||||||
|
- thereafter
|
12
|
|
3
|
|
132
|
|
||||||||||||
|
96
|
|
138
|
|
381
|
|
|||||||||||||
|
Share of underlying capital commitments of joint ventures included above
|
21
|
|
138
|
|
27
|
|
||||||||||||
|
Purchase obligations
|
||||||||||||||||||
|
Contracted for
|
||||||||||||||||||
|
- within one year
|
274
|
|
605
|
|
529
|
|
||||||||||||
|
- thereafter
|
424
|
|
269
|
|
88
|
|
||||||||||||
|
698
|
|
874
|
|
617
|
|
|||||||||||||
F - 69
NOTES TO THE CONSOLIDATED FINANCIAL STATEMENTS
(continued)
33 Contractual commitments and contingencies (
continued
)
Purchase obligations
Purchase obligations represent contractual obligations for the purchase of mining contract services, power, supplies, consumables, inventories, explosives and activated carbon.
To service these capital commitments, purchase obligations and other operational requirements, the group is dependent on existing cash resources, cash generated from operations and borrowing facilities.
Cash generated from operations is subject to operational, market and other risks. Distributions from operations may be subject to foreign investment, exchange control laws and regulations, and the quantity of foreign exchange available in offshore countries. In addition, distributions from joint ventures are subject to the relevant board approval.
The credit facilities and other finance arrangements contain financial covenants and other similar undertakings. To the extent that external borrowings are required, the group’s covenant performance indicates that existing financing facilities will be available to meet the commitments detailed above. To the extent that any of the financing facilities mature in the near future, the group believes that sufficient measures are in place to ensure that these facilities can be refinanced.
Contingencies
|
US Dollars
|
||||||||
|
Figures in millions
|
2017
|
|
2016
|
|
2015
|
|
||
|
Contingent liabilities
|
||||||||
|
Litigation - Ghana
(1)(2)
|
97
|
|
97
|
|
97
|
|
||
|
Litigation - North America
(3)
|
—
|
|
—
|
|
—
|
|
||
|
Tax disputes - Brazil
(4)
|
24
|
|
15
|
|
11
|
|
||
|
Tax dispute - AngloGold Ashanti Colombia S.A.
(5)
|
150
|
|
141
|
|
128
|
|
||
|
Tax dispute - Cerro Vanguardia S.A.
(6)
|
27
|
|
29
|
|
32
|
|
||
|
Groundwater pollution
(7)
|
—
|
|
—
|
|
—
|
|
||
|
Deep groundwater pollution - Africa
(8)
|
—
|
|
—
|
|
—
|
|
||
|
298
|
|
282
|
|
268
|
|
|||
F - 70
NOTES TO THE CONSOLIDATED FINANCIAL STATEMENTS
(continued)
33 Contractual commitments and contingencies (
continued
)
Contingent liabilities
Litigation claims
|
(1)
|
Litigation - On 11 October 2011, AngloGold Ashanti (Ghana) Limited (AGAG) terminated Mining and Building Contractors Limited’s (MBC) underground development agreement, construction on bulkheads agreement and diamond drilling agreement at Obuasi mine. The parties reached agreement on the terms of the separation and concluded a separation agreement on 8 November 2012. On 20 February 2014, AGAG was served with a demand issued by MBC claiming a total of
$97m
. In December 2015, the proceedings were stayed in the High Court pending arbitration. In February 2016, MBC submitted the matter to arbitration.
|
|
(2)
|
Litigation - AGAG received a summons on 2 April 2013 from Abdul Waliyu and 152 others in which the plaintiffs allege that they were or are residents of the Obuasi municipality or its suburbs and that their health has been adversely affected by emission and/or other environmental impacts arising in connection with the current and/or historical operations of the Pompora Treatment Plant (PTP), which was decommissioned in 2000. The plaintiffs’ alleged injuries include respiratory infections, skin diseases and certain cancers. The plaintiffs subsequently did not timely file their application for directions, but AGAG intends to allow some time to pass prior to applying to have the matter struck out for want of prosecution. On 24 February 2014, executive members of the PTP (AGAG) Smoke Effect Association (PASEA), sued AGAG by themselves and on behalf of their members (undisclosed number) on grounds similar to those discussed above, as well as economic hardships as a result of constant failure of their crops. This matter has been adjourned indefinitely. AGAG intends to allow some time to pass prior to applying to have the matter struck out for want of prosecution. In view of the limitation of current information for the accurate estimation of a liability, no reliable estimate can be made for AGAG’s obligation in either matter.
|
|
(3)
|
Litigation - On 19 October 2017, Newmont Mining Co. filed a lawsuit in the United States District Court for the Southern District of New York against AngloGold Ashanti and certain related parties, alleging that AngloGold Ashanti and such parties did not provide Newmont with certain information relevant to its purchase of the Cripple Creek & Victor Gold Mining Company in 2015 during the negotiation- and-sale process. AngloGold Ashanti believes the lawsuit is without merit and intends to vigorously defend against it. The matter is proceeding. In view of the limitation of current information for the accurate estimation of a liability, no reliable estimate can be made for the obligation.
|
Tax claims
|
(4)
|
Tax disputes - AngloGold Ashanti Limited’s subsidiaries in Brazil are involved in various disputes with tax authorities. These disputes involve federal tax assessments including income tax, royalties, social contributions, VAT and annual property tax. In December 2017, new VAT assessments of
$14m
were received.
Collectively, the possible amount involved is approximately
$24m
(2016:
$15m
, 2015:
$11m
). Management is of the opinion that these taxes are not payable.
|
|
(5)
|
Tax dispute - In January 2013, AngloGold Ashanti Colombia S.A. (AGAC) received notice from the Colombian Tax Office (DIAN) that it disagreed with the company’s tax treatment of certain items in the 2010 and 2011 income tax returns. On 23 October 2013, AGAC received the official assessments from the DIAN which established that an estimated additional tax of
$21m
(2016:
$21m
, 2015:
$20m
) will be payable if the tax returns are amended. Penalties and interest for the additional taxes are expected to be
$129m
(2016:
$120m
, 2015:
$108m
).
The Company believes that the DIAN has applied the tax legislation incorrectly. AGAC subsequently challenged the DIAN’s ruling by filing lawsuits in March 2015 and April 2015 before the Administrative Tribunal of Cundinamarca (the trial court for tax litigation). Closing arguments on the tax disputes were presented in February and June 2017 and judgement is pending.
|
|
(6)
|
Tax dispute - On 12 July 2013, Cerro Vanguardia S.A. (CVSA) received a notification from the Argentina Tax Authority (AFIP) requesting corrections to the 2007, 2008 and 2009 income tax returns of about
$6m
(2016:
$7m
, 2015:
$8m
) relating to the non-deduction of tax losses previously claimed on hedge contracts. The AFIP is of the view that the financial derivatives could not be considered as hedge contracts, as hedge contract losses could only be offset against gains derived from the same kind of hedging contracts. Penalties and interest on the disputed amounts are estimated at a further
$21m
(2016:
$22m
, 2015:
$24m
). CVSA and AFIP have corresponded on this issue over the past several years and while management is of the opinion that the taxes are not payable, the government continues to assert its position regarding the use of the financial derivatives. CVSA filed an appeal with the Tax Court on 19 June 2015,
and the parties submitted their final reports in July 2017. The matter is pending with the Tax Court.
|
F - 71
NOTES TO THE CONSOLIDATED FINANCIAL STATEMENTS
(continued)
33 Contractual commitments and contingencies (
continued
)
Contingent liabilities
(continued)
Other
|
(7)
|
Groundwater pollution - AngloGold Ashanti has identified groundwater contamination plumes at certain of its operations, which have occurred primarily as a result of seepage from mine residue stockpiles. Numerous scientific, technical and legal studies have been undertaken to assist in determining the magnitude of the contamination and to find sustainable remediation solutions. The group has instituted processes to reduce future potential seepage and it has been demonstrated that Monitored Natural Attenuation (MNA) by the existing environment will contribute to improvements in some instances. Furthermore, literature reviews, field trials and base line modelling techniques suggest, but have not yet proven, that the use of phyto-technologies can address the soil and groundwater contamination. Subject to the completion of trials and the technology being a proven remediation technique, no reliable estimate can be made for the obligation.
|
|
(8)
|
Deep groundwater pollution - The group has identified potential water ingress and future pollution risk posed by deep groundwater in certain underground mines in Africa. Various studies have been undertaken by AngloGold Ashanti since 1999 to understand this potential risk. In South Africa, due to the interconnected nature of mining operations, any proposed solution needs to be a combined one supported by all the mines located in these gold fields. As a result, the Mineral and Petroleum Resources Development Act (MPRDA) requires that the affected mining companies develop a Regional Mine Closure Strategy to be approved by the Department of Mineral Resources. In view of the limitation of current information for the accurate estimation of a liability, no reliable estimate can be made for the obligation.
|
F - 72
34
FINANCIAL RISK MANAGEMENT ACTIVITIES
In the normal course of its operations, the group is exposed to gold price, other commodity price, foreign exchange, interest rate, liquidity, equity price (deemed to be immaterial) and credit risks. In order to manage these risks, the group may enter into transactions which make use of both on- and off-balance sheet derivatives. The group does not acquire, hold or issue derivatives for speculative purposes. The group has developed a comprehensive risk management process to facilitate, control and monitor these risks. The board has approved and monitors this risk management process, inclusive of documented treasury policies, counterparty limits and controlling and reporting structures.
Managing risk in the group
Risk management activities within the group are the ultimate responsibility of the board of directors. The Chief Financial Officer is responsible to the board of directors for the design, implementation and monitoring of the risk management plan. The Audit and Risk Committee is responsible for overseeing risk management plans and systems, as well as financial risks which include a review of treasury activities and the group’s counterparties.
The financial risk management objectives of the group are defined as follows:
|
•
|
safeguarding the group’s core earnings stream from its major assets through the effective control and management of gold price risk, other commodity risk, foreign exchange risk and interest rate risk;
|
|
•
|
effective and efficient usage of credit facilities in both the short and long-term through the adoption of reliable liquidity management planning and procedures;
|
|
•
|
ensuring that investment and hedging transactions are undertaken with creditworthy counterparties; and
|
|
•
|
ensuring that all contracts and agreements related to risk management activities are co-ordinated, consistent throughout the group and that they comply where necessary with all relevant regulatory and statutory requirements.
|
Gold price and foreign exchange risk
Gold price risk arises from the risk of an adverse effect on current or future earnings resulting from fluctuations in the price of gold. The group has transactional foreign exchange exposures, which arise from sales or purchases by an operating unit in currencies other than the unit’s functional currency. The gold market is predominately priced in US dollars which exposes the group to the risk that fluctuations in the SA rand/US dollar, Brazilian real/US dollar, Argentinean peso/US dollar and Australian dollar/US dollar exchange rates may also have an adverse effect on current or future earnings. The group is also exposed to certain by-product commodity price risk.
Net open hedge position as at 31 December
The group had no outstanding commitments against future production potentially settled in cash.
Interest rate and liquidity risk
The group manages liquidity risk by ensuring that there is sufficient committed borrowing and banking facilities after taking into consideration the actual and forecast cash flows, in order to meet the group's short, medium and long term funding and liquidity management requirements.
In the ordinary course of business, the group receives cash from the proceeds of its gold sales and is required to fund its working capital and capital expenditure requirements. This cash is managed to ensure surplus funds are invested in a manner to achieve market-related returns whilst minimising risks. The group is able to actively source financing at competitive rates. The counterparties are financial and banking institutions and their credit ratings are regularly monitored.
The group has sufficient undrawn borrowing facilities available to fund its working capital and capital requirements (notes 25 and 35).
F - 73
NOTES TO THE CONSOLIDATED FINANCIAL STATEMENTS
(continued)
34 Financial risk management activities (
continued
)
The following are the contractual maturities of financial liabilities, including interest payments:
Financial liabilities
|
Within one year
|
Between
one and two
years
|
Between
two and five years
|
After five years
|
Total
|
|||||||||||||||||||
|
2017
|
$ millions
|
|
Effective
rate %
|
$ millions
|
|
Effective
rate %
|
$ millions
|
|
Effective
rate %
|
$ millions
|
|
Effective
rate %
|
$ millions
|
|
|||||||||
|
Trade and other payables
|
615
|
|
—
|
|
—
|
|
—
|
|
615
|
|
|||||||||||||
|
Borrowings
|
137
|
|
343
|
|
1,912
|
|
695
|
|
3,087
|
|
|||||||||||||
|
- In USD
|
98
|
|
5.4
|
145
|
|
5.4
|
1,643
|
|
5.5
|
641
|
|
6.5
|
2,527
|
|
|||||||||
|
- AUD in USD equivalent
|
16
|
|
5.1
|
174
|
|
5.1
|
25
|
|
6.8
|
38
|
|
6.8
|
253
|
|
|||||||||
|
- ZAR in USD equivalent
|
23
|
|
8.9
|
24
|
|
8.9
|
244
|
|
9.1
|
16
|
|
15.5
|
307
|
|
|||||||||
|
2016
|
|
||||||||||||||||||||||
|
Trade and other payables
|
596
|
|
—
|
|
—
|
|
—
|
|
596
|
|
|||||||||||||
|
Borrowings
|
127
|
|
287
|
|
1,155
|
|
1,513
|
|
3,082
|
|
|||||||||||||
|
- In USD
|
100
|
|
5.4
|
100
|
|
5.4
|
1,023
|
|
5.5
|
1,449
|
|
5.5
|
2,672
|
|
|||||||||
|
- AUD in USD equivalent
|
16
|
|
5.4
|
89
|
|
5.3
|
119
|
|
6.0
|
43
|
|
6.8
|
267
|
|
|||||||||
|
- ZAR in USD equivalent
|
11
|
|
8.9
|
98
|
|
8.9
|
13
|
|
11.2
|
21
|
|
14.0
|
143
|
|
|||||||||
|
2015
|
|
||||||||||||||||||||||
|
Trade and other payables
|
503
|
|
—
|
|
—
|
|
—
|
|
503
|
|
|||||||||||||
|
Borrowings
|
211
|
|
216
|
|
1,912
|
|
1,581
|
|
3,920
|
|
|||||||||||||
|
- In USD
|
140
|
|
5.8
|
140
|
|
5.8
|
1,767
|
|
5.9
|
1,507
|
|
5.5
|
3,554
|
|
|||||||||
|
- AUD in USD equivalent
|
11
|
|
5.2
|
68
|
|
5.2
|
66
|
|
6.2
|
51
|
|
6.8
|
196
|
|
|||||||||
|
- ZAR in USD equivalent
|
60
|
|
8.2
|
8
|
|
8.1
|
79
|
|
8.7
|
23
|
|
11.8
|
170
|
|
|||||||||
Credit risk
Credit risk arises from the risk that a counterparty may default or not meet its obligations timeously. The group minimises credit risk by ensuring that credit risk is spread over a number of counterparties. These counterparties are financial and banking institutions. Counterparty credit limits and exposures are reviewed by the Audit and Risk Committee. Where possible, management ensures that netting agreements are in place. No set-off is applied to the statement of financial position due to the different maturity profiles of assets and liabilities.
The combined maximum credit risk exposure of the group is as follows:
|
US Dollars
|
|||||||||
|
Figures in millions
|
2017
|
|
2016
|
|
2015
|
|
|||
|
Other investments
|
58
|
|
79
|
|
61
|
|
|||
|
Trade and other receivables
|
33
|
|
46
|
|
42
|
|
|||
|
Cash restricted for use (note 21)
|
65
|
|
55
|
|
60
|
|
|||
|
Cash and cash equivalents (note 22)
|
205
|
|
215
|
|
484
|
|
|||
|
Total financial assets
|
361
|
|
395
|
|
647
|
|
|||
Trade and other receivables, that are past due but not impaired totalled
$20m
(
2016
:
$9m
;
2015
:
$7m
). Other receivables that are impaired totalled
nil
(
2016
:
nil
;
2015
:
$6m
) and other investments that are impaired totalled
$3m
(
2016
:
nil
;
2015
:
nil
).
Trade receivables mainly comprise banking institutions purchasing gold bullion. Normal market settlement terms are two working days.
The group does not generally obtain collateral or other security to support financial instruments subject to credit risk, but monitors the credit standing of counterparties.
F - 74
NOTES TO THE CONSOLIDATED FINANCIAL STATEMENTS
(continued)
34 Financial risk management activities (
continued
)
Fair value of financial instruments
The estimated fair values of financial instruments are determined at discrete points in time based on relevant market information.
The estimated fair value of the group’s other investments and borrowings as at 31 December are as follows:
Type of instrument
|
Carrying
amount
|
|
Fair
value
|
|
Carrying
amount
|
|
Fair
value
|
|
Carrying
amount
|
|
Fair
value
|
|
|||||||
|
US Dollar millions
|
2017
|
2016
|
2015
|
|||||||||||||||
|
Financial assets
|
||||||||||||||||||
|
Other investments (note 18)
|
138
|
|
140
|
|
130
|
|
132
|
|
92
|
|
93
|
|
||||||
|
Financial liabilities
|
||||||||||||||||||
|
Borrowings (note 25)
|
2,268
|
|
2,377
|
|
2,178
|
|
2,203
|
|
2,737
|
|
2,425
|
|
||||||
The following methods and assumptions were used to estimate the fair value of each class of financial instrument:
Cash restricted for use, cash and cash equivalents, trade and other receivables and trade and other payables
The carrying amounts approximate fair value due to their short term nature.
Investments and other non-current assets
Listed equity investments classified as available-for-sale are carried at fair value in level 1 of the fair value hierarchy while fixed income investments and other non-current assets are carried at amortised cost. The fair value of fixed income investments has been calculated using market interest rates at the hierarchy level 2. The unlisted equity investments are carried at cost or fair value.
Borrowings
The rated bonds are carried at amortised cost and their fair values are their closing market values at the reporting date (fair value hierarchy - level 1). The interest rate on the remaining borrowings is reset on a short-term floating rate basis, and accordingly the carrying amount is considered to approximate fair value.
Fair value hierarchy
The group uses the following hierarchy for determining and disclosing the fair value of financial instruments:
|
Level 1:
|
quoted prices (unadjusted) in active markets for identical assets or liabilities;
|
|
Level 2:
|
inputs other than quoted prices included in level 1 that are observable for the asset or liability, either directly (as prices) or indirectly (derived from prices); and
|
|
Level 3:
|
inputs for the asset or liability that are not based on observable market data (unobservable inputs).
|
The following table sets out the group’s financial assets measured at fair value by level within the fair value hierarchy as at 31 December:
Type of instrument
Assets measured at fair value on a recurring basis
|
US Dollar millions
|
Level 1
|
Level 2
|
Level 3
|
Total
|
||||||||
|
2017
|
||||||||||||
|
Available-for-sale financial assets
|
||||||||||||
|
Equity securities
|
80
|
|
—
|
|
—
|
|
80
|
|
||||
|
Available-for-sale financial assets
|
2016
|
|||||||||||
|
Equity securities
|
51
|
|
—
|
|
—
|
|
51
|
|
||||
|
2015
|
||||||||||||
|
Available-for-sale financial assets
|
||||||||||||
|
Equity securities
|
30
|
|
—
|
|
—
|
|
30
|
|
||||
F - 75
NOTES TO THE CONSOLIDATED FINANCIAL STATEMENTS
(continued)
34 Financial risk management activities (
continued
)
Environmental obligations
Pursuant to environmental regulations in the countries in which we operate, we are obligated to close our operations and rehabilitate the lands which we mine in accordance with these regulations. As a consequence, AngloGold Ashanti is required in some circumstances to provide either reclamations bonds issued by third party entities, establish independent trust funds or provide guarantees issued by the operation, to the respective environmental protection agency or such other government department with responsibility for environmental oversight in the respective country to cover the potential environmental rehabilitation obligation in specified amounts.
In most cases, the environmental obligations will expire on completion of the rehabilitation although in some cases we are required to potentially post bonds for events unknown that may arise after the rehabilitation has been completed.
In South Africa, AngloGold Ashanti has established a trust fund which has assets of ZAR
1.39b
n and guarantees of ZAR
1.52b
n issued by various banks, for a current carrying value of the liability of ZAR
1.15b
n. In Australia, since 2014, the group has paid an amount of AUD
$4m
into a Mine Rehabilitation Fund for a current carrying value of the liability of AUD
$113.2m
. At Iduapriem the group has provided a bond comprising of a cash component of
$9.8m
with a further bond guarantee amounting to
$35.9m
issued by Ecobank Ghana Limited and Barclays Ghana Limited for a current carrying value of the liability of
$44.3m
. At Obuasi the group has provided a bond comprising of a cash component of
$20.3m
with a further bank guarantee amounting to
$30m
issued by Nedbank Limited for a current carrying value of the liability of
$211m
. In some circumstances, the group may be required to post further bonds in future years which will have a consequential income statement charge for the fees charged by the providers of the reclamation bonds.
F - 76
NOTES TO THE CONSOLIDATED FINANCIAL STATEMENTS
(continued)
34 Financial risk management activities (
continued
)
Sensitivity analysis
Interest rate risk on other financial assets and liabilities (excluding derivatives)
The group also monitors interest rate risk on other financial assets and liabilities.
The following table shows the approximate interest rate sensitivities of other financial assets and liabilities at 31 December (actual changes in the timing and amount of the following variables may differ from the assumed changes below). As the sensitivity is the same (linear) for both increases and decreases in interest rates only absolute numbers are presented.
|
Change in interest
rate
basis points
|
|
Change in interest
amount
in currency
millions
|
|
Change in interest
amount
US dollar
millions
|
|
||||
|
2017
|
|||||||||
|
Financial assets
|
|||||||||
|
USD denominated
|
100
|
|
1
|
|
1
|
|
|||
|
ZAR denominated
(1)
|
150
|
|
2
|
|
—
|
|
|||
|
Financial liabilities
|
|||||||||
|
ZAR denominated
(1)
|
150
|
|
41
|
|
3
|
|
|||
|
AUD denominated
|
100
|
|
3
|
|
2
|
|
|||
|
Change in interest
rate
basis points
|
|
Change in interest
amount
in currency
millions
|
|
Change in interest
amount
US dollar
millions
|
|
||||
|
2016
|
|||||||||
|
Financial liabilities
|
|||||||||
|
ZAR denominated
(1)
|
150
|
|
18
|
|
1
|
|
|||
|
AUD denominated
|
100
|
|
2
|
|
1
|
|
|||
|
USD denominated
|
100
|
|
1
|
|
1
|
|
|||
A change of 100 basis points in financial assets results in less than a
$1m
change in the interest amount.
|
Change in interest
rate
basis points
|
|
Change in interest
amount
in currency
millions
|
|
Change in interest
amount
US dollar
millions
|
|
||||
|
2015
|
|||||||||
|
Financial assets
|
|||||||||
|
USD denominated
|
100
|
|
2
|
|
2
|
|
|||
|
ZAR denominated
(1)
|
150
|
|
5
|
|
—
|
|
|||
|
BRL denominated
|
250
|
|
2
|
|
1
|
|
|||
|
Financial liabilities
|
|||||||||
|
ZAR denominated
(1)
|
150
|
|
26
|
|
2
|
|
|||
|
AUD denominated
|
100
|
|
1
|
|
1
|
|
|||
|
USD denominated
|
100
|
|
2
|
|
2
|
|
|||
(1)
This is the only interest rate risk for the company.
F - 77
NOTES TO THE CONSOLIDATED FINANCIAL STATEMENTS
(continued)
34 Financial risk management activities (
continued
)
Sensitivity analysis
(continued)
Foreign exchange risk
Foreign exchange risk arises on financial instruments that are denominated in a foreign currency.
The following table discloses the approximate foreign exchange risk sensitivities of borrowings at 31 December (actual changes in the timing and amount of the following variables may differ from the assumed changes below).
|
Change in
exchange rate |
Change in
borrowings total |
|
Change in
exchange rate |
Change in
borrowings total |
|
Change in
exchange rate |
Change in
borrowings total |
|
|||||||
|
US$ Million
|
|
US$ Million
|
|
US$ Million
|
|
||||||||||
|
2017
|
2016
|
2015
|
|||||||||||||
|
Borrowings
|
|||||||||||||||
|
ZAR denominated (R/$)
|
Spot (+R1.50)
|
(26
|
)
|
Spot (+R1.50)
|
(10
|
)
|
Spot (+R1.50)
|
(12
|
)
|
||||||
|
AUD denominated (AUD/$)
|
Spot (+AUD0.1)
|
(16
|
)
|
Spot (+AUD0.1)
|
(15
|
)
|
Spot (+AUD0.1)
|
(11
|
)
|
||||||
|
ZAR denominated (R/$)
|
Spot (-R1.50)
|
33
|
|
Spot (-R1.50)
|
13
|
|
Spot (-R1.50)
|
14
|
|
||||||
|
AUD denominated (AUD/$)
|
Spot (-AUD0.1)
|
19
|
|
Spot (-AUD0.1)
|
18
|
|
Spot (-AUD0.1)
|
12
|
|
||||||
The borrowings total in the denominated currency will not be influenced by a movement in its exchange rate.
F - 78
35
CAPITAL MANAGEMENT
The primary objective of managing the group's capital is to ensure that there is sufficient capital available to support the funding requirements of the group, including capital expenditure, in a way that optimises the cost of capital, maximises shareholders' returns and ensures that the group remains in a sound financial position.
The capital structure of the group consists of net debt (borrowings as detailed in note 25, offset by cash and bank balances detailed in note 22) and equity of the group (comprising share capital and premium and accumulated reserves and non-controlling interests).
The group manages and makes adjustments to the capital structure as opportunities arise in the market place, as and when borrowings mature, or as and when funding is required. This may take the form of raising equity, market or bank debt or hybrids thereof.
The group manages capital using various financial metrics including the ratio of net debt to Adjusted EBITDA (gearing). Both the calculation of net debt and Adjusted EBITDA are based on the formula included in the Revolving Credit Agreements. The loan covenant ratio of net debt to Adjusted EBITDA should not exceed
3.5
times. The facility also makes provision for the ability of the group to have a leverage ratio of greater than
3.5
times but less than
4.5
times, subject to certain conditions, for one measurement period not exceeding six months, during the tenor of the facility.
The group had no major issuance of equity during the year.
AngloGold Ashanti Limited registered a R
10b
n Domestic Medium Term Note Programme (DMTNP) with the JSE in April 2011. The DMTNP permits the group to access the South African debt capital market for funding required. The group has not utilised the commercial paper under its R
10b
n DMTNP during the current year, instead it made use of its other facilities, to provide for funding requirements of the South Africa region.
During November 2017, the group entered into a new
three
-year unsecured revolving credit facility of R
1b
n (
$81m
) with Standard Bank which is currently charged at a margin of
1.3%
above JIBAR. This facility has the option, on application, to extend the facility by a maximum of
two years
.
During December 2017, the group entered into a
three
-year unsecured syndicated revolving credit facility of R
2.5b
n (
$202m
) with Nedbank and ABSA Bank which is currently charged at a margin of
1.8%
above JIBAR. This facility has the option, on application, to extend the facility by a maximum of
two years
.
A full analysis of the borrowings as presented on the statement of financial position in included in note 25. In addition, the following details are also relevant to the borrowings at 31 December 2017:
|
•
|
The
$750m
,
$700m
and
$300m
rated bonds are fully and unconditionally guaranteed by the group;
|
|
•
|
The interest margin on the
five
-year unsecured syndicated revolving credit facility of A
$500m
(
$390m
) with a group of banks will reduce should the group’s credit rating improve from its current BB+/Baa3 status and should increase if its credit rating worsens. This facility will be used to fund the working capital and development costs associated with the group's mining operations within Australia without eroding the group's headroom under its other facilities and exposing the group to foreign exchange gains/losses each quarter.
|
|
•
|
The R
1b
n, R
1.4b
n and R
2.5b
n unsecured syndicated revolving credit facilities will be used to fund the working capital and development costs associated with the group's mining operations within South Africa without eroding the group's headroom under its other facilities and exposing the group to foreign exchange gains/losses each quarter.
|
Amounts are converted to US dollars at year end exchange rates.
F - 79
NOTES TO THE CONSOLIDATED FINANCIAL STATEMENTS
(continued)
35 Capital Management (
continued
)
Gearing ratio (Net debt to Adjusted EBITDA)
|
US Dollars
|
||||||||
|
Figures in millions
|
2017
|
|
2016
|
|
2015
|
|
||
|
Borrowings (note 25)
|
2,268
|
|
2,178
|
|
2,737
|
|
||
|
Corporate office lease (note 25)
|
(15
|
)
|
(15
|
)
|
(15
|
)
|
||
|
Unamortised portion of the convertible and rated bonds
|
18
|
|
23
|
|
21
|
|
||
|
Cumulative fair value adjustment on $1.25bn bonds
|
—
|
|
—
|
|
(9
|
)
|
||
|
Cash restricted for use (note 21)
|
(65
|
)
|
(55
|
)
|
(60
|
)
|
||
|
Cash and cash equivalents (note 22)
|
(205
|
)
|
(215
|
)
|
(484
|
)
|
||
|
Net debt
|
2,001
|
|
1,916
|
|
2,190
|
|
||
|
The Adjusted EBITDA calculation included in this note is based on the formula included in the Revolving Credit Facility Agreements for compliance with the debt covenant formula.
|
||||||||
|
Adjusted EBITDA
|
||||||||
|
Profit (loss) before taxation
|
(63
|
)
|
269
|
|
257
|
|
||
|
Add back:
|
|
|
|
|||||
|
Finance costs and unwinding of obligations (note 7)
|
169
|
|
180
|
|
245
|
|
||
|
Interest received (note 3)
|
(15
|
)
|
(22
|
)
|
(28
|
)
|
||
|
Amortisation of tangible and intangible assets (note 4)
|
823
|
|
809
|
|
777
|
|
||
|
Adjustments:
|
|
|
|
|||||
|
Exchange loss
|
11
|
|
88
|
|
17
|
|
||
|
Fair value adjustment on issued bonds
|
—
|
|
(9
|
)
|
(66
|
)
|
||
|
Impairment and derecognition of assets
|
297
|
|
3
|
|
14
|
|
||
|
Impairment of other investments
|
3
|
|
—
|
|
—
|
|
||
|
Write-down of inventories
|
3
|
|
12
|
|
10
|
|
||
|
Retrenchments costs
|
90
|
|
14
|
|
14
|
|
||
|
Care and maintenance costs (note 5)
|
62
|
|
70
|
|
67
|
|
||
|
Net profit on disposal of assets
|
(8
|
)
|
(4
|
)
|
(1
|
)
|
||
|
(Gain) loss on unrealised non-hedge derivatives and other commodity contracts
|
(10
|
)
|
(18
|
)
|
7
|
|
||
|
Repurchase premium and cost on settlement of issued bonds
|
—
|
|
30
|
|
61
|
|
||
|
Associates and joint ventures’ special items
|
(2
|
)
|
(11
|
)
|
(9
|
)
|
||
|
Associates and joint ventures’ – adjustments for amortisation, interest, taxation and other
|
116
|
|
137
|
|
107
|
|
||
|
Other amortisation
|
7
|
|
—
|
|
—
|
|
||
|
Adjusted EBITDA (as defined in the Revolving Credit Facility Agreements)
|
1,483
|
|
1,548
|
|
1,472
|
|
||
|
Gearing ratio (Net debt to Adjusted EBITDA)
|
1.35:1
|
|
1.24:1
|
|
1.49:1
|
|
||
|
Maximum debt covenant ratio allowed per agreement
|
3.5:1
|
|
3.5:1
|
|
3.5:1
|
|
||
F - 80
36
RECENT DEVELOPMENTS
|
•
|
On 20 February 2018, the directors of AngloGold Ashanti declared a gross cash dividend per ordinary share of
70
South African cents (assuming an exchange rate of ZAR
11.66
/$, the gross dividend payable per ADS is equivalent to
6
US cents).
|
|
•
|
On 28 February 2018, the conditions precedent were fulfilled on the sale of Moab Khotsong and Kopanang Mines and the transactions were completed, with ownership of Moab Khotsong and Kopanang Mines transferring to Harmony and Heaven-Sent, respectively.
|
F - 81
37
SUPPLEMENTAL CONDENSED CONSOLIDATING FINANCIAL INFORMATION
AngloGold Ashanti Holdings plc (“IOMco”), a
100
percent wholly-owned subsidiary of AngloGold Ashanti, has issued debt securities which are fully and unconditionally guaranteed by AngloGold Ashanti Limited (being the “Guarantor”). See Note 25 and Note 33. IOMco is an Isle of Man registered company that holds certain of AngloGold Ashanti’s operations and assets located outside South Africa (excluding certain operations and assets in the United States of America). The following is condensed consolidating financial information for the Company as of 31 December 2017, 2016 and 2015 and for the years ended 31 December 2017, 2016 and 2015, with a separate column for each of AngloGold Ashanti Limited as Guarantor, IOMco as Issuer and the other subsidiaries of the Company combined (the “Non-Guarantor Subsidiaries”). For the purposes of the condensed consolidating financial information, the Company carries its investments under the equity method. The following supplemental condensed consolidating financial information should be read in conjunction with the Company’s condensed consolidated financial statements.
|
Figures in millions (US dollars)
|
2017
|
|
2017
|
|
2017
|
|
2017
|
|
2017
|
|
||||
|
Condensed consolidating income statement
|
AngloGold Ashanti
(the “Guarantor”)
|
|
IOMco
(the “Issuer”)
|
|
Other subsidiaries
(the “Non-Guarantor
Subsidiaries”)
|
|
Consolidation
adjustments
|
|
Total
|
|
||||
|
Revenue
|
1,005
|
|
3
|
|
3,535
|
|
—
|
|
4,543
|
|
||||
|
Gold income
|
987
|
|
—
|
|
3,399
|
|
(30
|
)
|
4,356
|
|
||||
|
Cost of sales
|
(1,016
|
)
|
—
|
|
(2,567
|
)
|
1
|
|
(3,582
|
)
|
||||
|
Gain (loss) on non-hedge derivatives and other commodity contracts
|
—
|
|
—
|
|
11
|
|
(1
|
)
|
10
|
|
||||
|
Gross profit (loss)
|
(29
|
)
|
—
|
|
843
|
|
(30
|
)
|
784
|
|
||||
|
Corporate administration, marketing and other income (expenses)
|
(7
|
)
|
(7
|
)
|
(2
|
)
|
(48
|
)
|
(64
|
)
|
||||
|
Exploration and evaluation costs
|
(10
|
)
|
—
|
|
(104
|
)
|
—
|
|
(114
|
)
|
||||
|
Other operating income (expenses)
|
(9
|
)
|
—
|
|
(79
|
)
|
—
|
|
(88
|
)
|
||||
|
Special items
|
(414
|
)
|
(6
|
)
|
(27
|
)
|
9
|
|
(438
|
)
|
||||
|
Operating profit (loss)
|
(469
|
)
|
(13
|
)
|
631
|
|
(69
|
)
|
|
80
|
|
|||
|
Interest received
|
1
|
|
3
|
|
11
|
|
—
|
|
15
|
|
||||
|
Exchange gain (loss)
|
—
|
|
1
|
|
(12
|
)
|
—
|
|
(11
|
)
|
||||
|
Finance costs and unwinding of obligations
|
(22
|
)
|
(107
|
)
|
(40
|
)
|
—
|
|
(169
|
)
|
||||
|
Share of associates and joint ventures’ profit (loss)
|
13
|
|
—
|
|
9
|
|
—
|
|
22
|
|
||||
|
Equity gain (loss) in subsidiaries
|
212
|
|
447
|
|
—
|
|
(659
|
)
|
—
|
|
||||
|
Profit (loss) before taxation
|
(265
|
)
|
331
|
|
599
|
|
(728
|
)
|
|
(63
|
)
|
|||
|
Taxation
|
104
|
|
—
|
|
(212
|
)
|
—
|
|
(108
|
)
|
||||
|
Profit (loss) after taxation from continuing operations
|
(161
|
)
|
331
|
|
387
|
|
(728
|
)
|
|
(171
|
)
|
|||
|
Preferred stock dividends
|
(30
|
)
|
—
|
|
—
|
|
30
|
|
—
|
|
||||
|
Profit (loss) for the period
|
(191
|
)
|
331
|
|
387
|
|
(698
|
)
|
|
(171
|
)
|
|||
|
Allocated as follows:
|
||||||||||||||
|
Equity shareholders
|
||||||||||||||
|
- Continuing operations
|
(191
|
)
|
331
|
|
367
|
|
(698
|
)
|
(191
|
)
|
||||
|
Non-controlling interests
|
||||||||||||||
|
- Continuing operations
|
—
|
|
—
|
|
20
|
|
—
|
|
20
|
|
||||
|
(191
|
)
|
331
|
|
387
|
|
(698
|
)
|
|
(171
|
)
|
||||
|
Comprehensive income (loss)
|
(37
|
)
|
365
|
|
422
|
|
(767
|
)
|
(17
|
)
|
||||
|
Comprehensive income (loss) attributable to non-controlling interests
|
—
|
|
—
|
|
(20
|
)
|
—
|
|
(20
|
)
|
||||
|
Comprehensive income (loss) attributable to AngloGold Ashanti
|
(37
|
)
|
365
|
|
402
|
|
(767
|
)
|
(37
|
)
|
||||
F - 82
NOTES TO THE CONSOLIDATED FINANCIAL STATEMENTS
(continued)
37 Supplemental condensed consolidating financial information
(continued)
|
Figures in millions (US dollars)
|
2016
|
|
2016
|
|
2016
|
|
2016
|
|
2016
|
|
||||
|
Condensed consolidating income statement
|
AngloGold Ashanti
(the “Guarantor”)
|
|
IOMco
(the “Issuer”)
|
|
Other subsidiaries
(the “Non-Guarantor
Subsidiaries”)
|
|
Consolidation
adjustments
|
|
Total
|
|
||||
|
Revenue
|
1,110
|
|
3
|
|
3,141
|
|
—
|
|
4,254
|
|
||||
|
Gold income
|
1,108
|
|
—
|
|
3,035
|
|
(58
|
)
|
4,085
|
|
||||
|
Cost of sales
|
(958
|
)
|
—
|
|
(2,305
|
)
|
—
|
|
(3,263
|
)
|
||||
|
Gain (loss) on non-hedge derivatives and other commodity contracts
|
—
|
|
—
|
|
18
|
|
1
|
|
19
|
|
||||
|
Gross profit (loss)
|
150
|
|
—
|
|
748
|
|
(57
|
)
|
|
841
|
|
|||
|
Corporate administration, marketing and other income (expenses)
|
17
|
|
(6
|
)
|
(3
|
)
|
(69
|
)
|
(61
|
)
|
||||
|
Exploration and evaluation costs
|
(14
|
)
|
—
|
|
(119
|
)
|
—
|
|
(133
|
)
|
||||
|
Other operating income (expenses)
|
(26
|
)
|
2
|
|
(86
|
)
|
—
|
|
(110
|
)
|
||||
|
Special items
|
54
|
|
(35
|
)
|
29
|
|
(90
|
)
|
(42
|
)
|
||||
|
Operating profit (loss)
|
181
|
|
(39
|
)
|
569
|
|
(216
|
)
|
|
495
|
|
|||
|
Interest received
|
6
|
|
3
|
|
13
|
|
—
|
|
22
|
|
||||
|
Exchange gain (loss)
|
1
|
|
(1
|
)
|
(28
|
)
|
(60
|
)
|
(88
|
)
|
||||
|
Finance costs and unwinding of obligations
|
(18
|
)
|
(131
|
)
|
(31
|
)
|
—
|
|
(180
|
)
|
||||
|
Fair value adjustment on $1.25bn bonds
|
—
|
|
9
|
|
—
|
|
—
|
|
9
|
|
||||
|
Share of associates and joint ventures’ profit (loss)
|
(13
|
)
|
2
|
|
30
|
|
(8
|
)
|
11
|
|
||||
|
Equity gain (loss) in subsidiaries
|
(61
|
)
|
389
|
|
—
|
|
(328
|
)
|
—
|
|
||||
|
Profit (loss) before taxation
|
96
|
|
232
|
|
553
|
|
(612
|
)
|
|
269
|
|
|||
|
Taxation
|
(4
|
)
|
—
|
|
(184
|
)
|
(1
|
)
|
(189
|
)
|
||||
|
Profit (loss) after taxation from continuing operations
|
92
|
|
232
|
|
369
|
|
(613
|
)
|
|
80
|
|
|||
|
Preferred stock dividends
|
(29
|
)
|
—
|
|
(29
|
)
|
58
|
|
—
|
|
||||
|
Profit (loss) for the period
|
63
|
|
232
|
|
340
|
|
(555
|
)
|
|
80
|
|
|||
|
Allocated as follows:
|
||||||||||||||
|
Equity shareholders
|
||||||||||||||
|
- Continuing operations
|
63
|
|
232
|
|
323
|
|
(555
|
)
|
63
|
|
||||
|
Non-controlling interests
|
|
|||||||||||||
|
- Continuing operations
|
—
|
|
—
|
|
17
|
|
—
|
|
17
|
|
||||
|
63
|
|
232
|
|
340
|
|
(555
|
)
|
|
80
|
|
||||
|
Comprehensive income (loss)
|
250
|
|
234
|
|
388
|
|
(605
|
)
|
267
|
|
||||
|
Comprehensive income (loss) attributable to non-controlling interests
|
—
|
|
—
|
|
(17
|
)
|
—
|
|
(17
|
)
|
||||
|
Comprehensive income (loss) attributable to AngloGold Ashanti
|
250
|
|
234
|
|
371
|
|
(605
|
)
|
250
|
|
||||
F - 83
NOTES TO THE CONSOLIDATED FINANCIAL STATEMENTS
(continued)
37 Supplemental condensed consolidating financial information
(continued)
|
Figures in millions (US dollars)
|
2015
|
|
2015
|
|
2015
|
|
2015
|
|
2015
|
|
|||||
|
Condensed consolidating income statement
|
AngloGold Ashanti
(the “Guarantor”)
|
|
IOMco
(the “Issuer”)
|
|
Other subsidiaries
(the “Non-Guarantor
Subsidiaries”)
|
|
Consolidation
adjustments
|
|
Total
|
|
|||||
|
Revenue
|
1,091
|
|
2
|
|
3,081
|
|
—
|
|
4,174
|
|
|||||
|
Gold income
|
1,063
|
|
—
|
|
2,991
|
|
(39
|
)
|
4,015
|
|
|||||
|
Cost of sales
|
(995
|
)
|
—
|
|
(2,299
|
)
|
—
|
|
(3,294
|
)
|
|||||
|
Gain (loss) on non-hedge derivatives and other commodity contracts
|
—
|
|
—
|
|
(7
|
)
|
—
|
|
(7
|
)
|
|||||
|
Gross profit (loss)
|
68
|
|
—
|
|
685
|
|
(39
|
)
|
|
714
|
|
||||
|
Corporate administration, marketing and other income (expenses)
|
3
|
|
(15
|
)
|
(15
|
)
|
(51
|
)
|
(78
|
)
|
|||||
|
Exploration and evaluation costs
|
(16
|
)
|
—
|
|
(116
|
)
|
—
|
|
(132
|
)
|
|||||
|
Other operating income (expenses)
|
(17
|
)
|
—
|
|
(79
|
)
|
—
|
|
(96
|
)
|
|||||
|
Special items
|
(132
|
)
|
(436
|
)
|
65
|
|
432
|
|
(71
|
)
|
|||||
|
Operating profit (loss)
|
(94
|
)
|
(451
|
)
|
540
|
|
342
|
|
|
337
|
|
||||
|
Interest received
|
6
|
|
2
|
|
20
|
|
—
|
|
28
|
|
|||||
|
Exchange gain (loss)
|
(1
|
)
|
(1
|
)
|
(15
|
)
|
—
|
|
(17
|
)
|
|||||
|
Finance costs and unwinding of obligations
|
(21
|
)
|
(196
|
)
|
(28
|
)
|
—
|
|
(245
|
)
|
|||||
|
Fair value adjustment on $1.25bn bonds
|
—
|
|
66
|
|
—
|
|
—
|
|
66
|
|
|||||
|
Share of associates and joint ventures’ profit (loss)
|
11
|
|
1
|
|
77
|
|
—
|
|
(1
|
)
|
88
|
|
|||
|
Equity gain (loss) in subsidiaries
|
(26
|
)
|
140
|
|
—
|
|
(114
|
)
|
—
|
|
|||||
|
Profit (loss) before taxation
|
(125
|
)
|
(439
|
)
|
594
|
|
227
|
|
|
257
|
|
||||
|
Taxation
|
59
|
|
(1
|
)
|
(269
|
)
|
—
|
|
(211
|
)
|
|||||
|
Profit (loss) after taxation from continuing operations
|
(66
|
)
|
(440
|
)
|
325
|
|
227
|
|
|
46
|
|
||||
|
Discontinued operations
|
|
||||||||||||||
|
Profit (loss) from discontinued operations
|
—
|
|
—
|
|
(116
|
)
|
—
|
|
(116
|
)
|
|||||
|
Profit (loss) after discontinued operations
|
(66
|
)
|
(440
|
)
|
209
|
|
227
|
|
|
(70
|
)
|
||||
|
Preferred stock dividends
|
(19
|
)
|
—
|
|
(20
|
)
|
39
|
|
—
|
|
|||||
|
Profit (loss) for the period
|
(85
|
)
|
(440
|
)
|
189
|
|
266
|
|
|
(70
|
)
|
||||
|
Allocated as follows:
|
|||||||||||||||
|
Equity shareholders
|
|||||||||||||||
|
- Continuing operations
|
(85
|
)
|
(440
|
)
|
290
|
|
266
|
|
31
|
|
|||||
|
- Discontinued operations
|
—
|
|
—
|
|
(116
|
)
|
—
|
|
(116
|
)
|
|||||
|
Non-controlling interests
|
|
||||||||||||||
|
- Continuing operations
|
—
|
|
—
|
|
15
|
|
—
|
|
15
|
|
|||||
|
(85
|
)
|
(440
|
)
|
189
|
|
266
|
|
|
(70
|
)
|
|||||
|
Comprehensive income (loss)
|
(448
|
)
|
(477
|
)
|
142
|
|
350
|
|
(433
|
)
|
|||||
|
Comprehensive income (loss) attributable to non-controlling interests
|
—
|
|
—
|
|
(15
|
)
|
—
|
|
(15
|
)
|
|||||
|
Comprehensive income (loss) attributable to AngloGold Ashanti
|
(448
|
)
|
|
(477
|
)
|
|
127
|
|
|
|
350
|
|
|
(448
|
)
|
F - 84
NOTES TO THE CONSOLIDATED FINANCIAL STATEMENTS
(continued)
37 Supplemental condensed consolidating financial information
(continued)
|
Figures in millions (US dollars)
|
2017
|
|
2017
|
|
2017
|
|
2017
|
|
2017
|
|
||||
|
Condensed consolidating statement of financial position
|
AngloGold Ashanti
(the “Guarantor”)
|
|
IOMco
(the “Issuer”)
|
|
Other subsidiaries
(the
“Non-Guarantor
Subsidiaries”)
|
|
Consolidation
adjustments
|
|
Total
|
|
||||
|
ASSETS
|
||||||||||||||
|
Non-current assets
|
||||||||||||||
|
Tangible assets
|
739
|
|
—
|
|
3,003
|
|
—
|
|
3,742
|
|
||||
|
Intangible assets
|
1
|
|
—
|
|
139
|
|
(2
|
)
|
138
|
|
||||
|
Investments in associates and joint ventures
|
2,371
|
|
4,376
|
|
1,371
|
|
(6,611
|
)
|
1,507
|
|
||||
|
Other investments
|
2
|
|
6
|
|
125
|
|
(2
|
)
|
131
|
|
||||
|
Inventories
|
—
|
|
—
|
|
100
|
|
—
|
|
100
|
|
||||
|
Trade and other receivables
|
—
|
|
—
|
|
67
|
|
—
|
|
67
|
|
||||
|
Deferred taxation
|
—
|
|
—
|
|
4
|
|
—
|
|
4
|
|
||||
|
Cash restricted for use
|
—
|
|
—
|
|
37
|
|
—
|
|
37
|
|
||||
|
3,113
|
|
4,382
|
|
4,846
|
|
(6,615
|
)
|
|
5,726
|
|
||||
|
Current assets
|
|
|||||||||||||
|
Other investments
|
—
|
|
6
|
|
1
|
|
—
|
|
7
|
|
||||
|
Inventories, trade and other receivables, intergroup balances and other current assets
|
471
|
|
250
|
|
1,166
|
|
(982
|
)
|
905
|
|
||||
|
Cash restricted for use
|
—
|
|
1
|
|
27
|
|
—
|
|
28
|
|
||||
|
Cash and cash equivalents
|
11
|
|
21
|
|
173
|
|
—
|
|
205
|
|
||||
|
482
|
|
278
|
|
1,367
|
|
(982
|
)
|
|
1,145
|
|
||||
|
Non-current assets held for sale
|
310
|
|
—
|
|
38
|
|
—
|
|
348
|
|
||||
|
792
|
|
278
|
|
1,405
|
|
(982
|
)
|
1,493
|
|
|||||
|
Total assets
|
3,905
|
|
4,660
|
|
6,251
|
|
(7,597
|
)
|
|
7,219
|
|
|||
|
EQUITY AND LIABILITIES
|
|
|||||||||||||
|
Share capital and premium
|
7,134
|
|
6,172
|
|
824
|
|
(6,996
|
)
|
7,134
|
|
||||
|
Retained earnings (accumulated losses) and other reserves
|
(4,471
|
)
|
(3,491
|
)
|
1,619
|
|
1,872
|
|
(4,471
|
)
|
||||
|
Shareholders’ equity
|
2,663
|
|
2,681
|
|
2,443
|
|
(5,124
|
)
|
|
2,663
|
|
|||
|
Non-controlling interests
|
—
|
|
—
|
|
41
|
|
—
|
|
41
|
|
||||
|
Total equity
|
2,663
|
|
2,681
|
|
2,484
|
|
(5,124
|
)
|
|
2,704
|
|
|||
|
Non-current liabilities
|
527
|
|
1,764
|
|
1,369
|
|
—
|
|
3,660
|
|
||||
|
Current liabilities including intergroup balances
|
591
|
|
215
|
|
2,396
|
|
(2,473
|
)
|
729
|
|
||||
|
Non-current liabilities held for sale
|
124
|
|
—
|
|
2
|
|
—
|
|
126
|
|
||||
|
Total liabilities
|
1,242
|
|
|
1,979
|
|
|
3,767
|
|
|
(2,473
|
)
|
|
4,515
|
|
|
Total equity and liabilities
|
3,905
|
|
|
4,660
|
|
|
6,251
|
|
|
(7,597
|
)
|
|
7,219
|
|
F - 85
NOTES TO THE CONSOLIDATED FINANCIAL STATEMENTS
(continued)
37 Supplemental condensed consolidating financial information
(continued)
|
Figures in millions (US dollars)
|
2016
|
|
2016
|
|
2016
|
|
2016
|
|
2016
|
|
||||
|
Condensed consolidating statement of financial position
|
AngloGold Ashanti
(the “Guarantor”)
|
|
IOMco
(the “Issuer”)
|
|
Other subsidiaries
(the
“Non-Guarantor
Subsidiaries”)
|
|
Consolidation
adjustments
|
|
Total
|
|
||||
|
ASSETS
|
||||||||||||||
|
Non-current assets
|
||||||||||||||
|
Tangible assets
|
1,160
|
|
—
|
|
2,951
|
|
—
|
|
4,111
|
|
||||
|
Intangible assets
|
4
|
|
—
|
|
143
|
|
(2
|
)
|
145
|
|
||||
|
Investments in associates and joint ventures
|
2,109
|
|
3,478
|
|
1,338
|
|
(5,477
|
)
|
1,448
|
|
||||
|
Other investments
|
2
|
|
3
|
|
122
|
|
(2
|
)
|
125
|
|
||||
|
Inventories
|
—
|
|
—
|
|
84
|
|
—
|
|
84
|
|
||||
|
Trade and other receivables
|
—
|
|
—
|
|
34
|
|
—
|
|
34
|
|
||||
|
Deferred taxation
|
—
|
|
—
|
|
4
|
|
—
|
|
4
|
|
||||
|
Cash restricted for use
|
—
|
|
—
|
|
36
|
|
—
|
|
36
|
|
||||
|
Other non-current assets
|
—
|
|
—
|
|
—
|
|
—
|
|
—
|
|
||||
|
3,275
|
|
3,481
|
|
4,712
|
|
(5,481
|
)
|
|
5,987
|
|
||||
|
Current assets
|
|
|||||||||||||
|
Other investments
|
—
|
|
5
|
|
—
|
|
—
|
|
5
|
|
||||
|
Inventories, trade and other receivables, intergroup balances and other current assets
|
429
|
|
912
|
|
1,153
|
|
(1,567
|
)
|
927
|
|
||||
|
Cash restricted for use
|
—
|
|
1
|
|
18
|
|
—
|
|
19
|
|
||||
|
Cash and cash equivalents
|
44
|
|
32
|
|
139
|
|
—
|
|
215
|
|
||||
|
473
|
|
950
|
|
1,310
|
|
(1,567
|
)
|
|
1,166
|
|
||||
|
Total assets
|
3,748
|
|
4,431
|
|
6,022
|
|
(7,048
|
)
|
|
7,153
|
|
|||
|
EQUITY AND LIABILITIES
|
|
|||||||||||||
|
Share capital and premium
|
7,108
|
|
6,215
|
|
824
|
|
(7,039
|
)
|
7,108
|
|
||||
|
Retained earnings (accumulated losses) and other reserves
|
(4,393
|
)
|
(3,765
|
)
|
702
|
|
3,063
|
|
(4,393
|
)
|
||||
|
Shareholders’ equity
|
2,715
|
|
2,450
|
|
1,526
|
|
(3,976
|
)
|
|
2,715
|
|
|||
|
Non-controlling interests
|
—
|
|
—
|
|
39
|
|
—
|
|
39
|
|
||||
|
Total equity
|
2,715
|
|
2,450
|
|
1,565
|
|
(3,976
|
)
|
|
2,754
|
|
|||
|
Non-current liabilities
|
496
|
|
1,799
|
|
1,344
|
|
—
|
|
3,639
|
|
||||
|
Current liabilities including intergroup balances
|
537
|
|
182
|
|
3,113
|
|
(3,072
|
)
|
760
|
|
||||
|
Total liabilities
|
1,033
|
|
|
1,981
|
|
|
4,457
|
|
|
(3,072
|
)
|
|
4,399
|
|
|
Total equity and liabilities
|
3,748
|
|
|
4,431
|
|
|
6,022
|
|
|
(7,048
|
)
|
|
7,153
|
|
F - 86
NOTES TO THE CONSOLIDATED FINANCIAL STATEMENTS
(continued)
37 Supplemental condensed consolidating financial information
(continued)
|
Figures in millions (US dollars)
|
2015
|
|
2015
|
|
2015
|
|
2015
|
|
2015
|
|
||||
|
Condensed consolidating statement of financial position
|
AngloGold Ashanti
(the “Guarantor”)
|
|
IOMco
(the “Issuer”)
|
|
Other subsidiaries
(the
“Non-Guarantor
Subsidiaries”)
|
|
Consolidation
adjustments
|
|
Total
|
|
||||
|
ASSETS
|
||||||||||||||
|
Non-current assets
|
||||||||||||||
|
Tangible assets
|
1,030
|
|
—
|
|
3,028
|
|
—
|
|
4,058
|
|
||||
|
Intangible assets
|
8
|
|
—
|
|
155
|
|
(2
|
)
|
161
|
|
||||
|
Investments in associates and joint ventures
|
2,002
|
|
3,627
|
|
1,338
|
|
(5,502
|
)
|
1,465
|
|
||||
|
Other investments
|
1
|
|
3
|
|
89
|
|
(2
|
)
|
91
|
|
||||
|
Inventories
|
—
|
|
—
|
|
90
|
|
—
|
|
90
|
|
||||
|
Trade and other receivables
|
—
|
|
—
|
|
13
|
|
—
|
|
13
|
|
||||
|
Deferred taxation
|
—
|
|
—
|
|
1
|
|
—
|
|
1
|
|
||||
|
Cash restricted for use
|
—
|
|
—
|
|
37
|
|
—
|
|
37
|
|
||||
|
Other non-current assets
|
18
|
|
—
|
|
—
|
|
—
|
|
18
|
|
||||
|
3,059
|
|
3,630
|
|
4,751
|
|
(5,506
|
)
|
|
5,934
|
|
||||
|
Current assets
|
|
|||||||||||||
|
Other investments
|
—
|
|
1
|
|
—
|
|
—
|
|
1
|
|
||||
|
Inventories, trade and other receivables, intergroup balances and other current assets
|
401
|
|
921
|
|
1,076
|
|
(1,556
|
)
|
842
|
|
||||
|
Cash restricted for use
|
1
|
|
2
|
|
20
|
|
—
|
|
23
|
|
||||
|
Cash and cash equivalents
|
19
|
|
222
|
|
243
|
|
—
|
|
484
|
|
||||
|
421
|
|
1,146
|
|
1,339
|
|
(1,556
|
)
|
|
1,350
|
|
||||
|
Total assets
|
3,480
|
|
4,776
|
|
6,090
|
|
(7,062
|
)
|
|
7,284
|
|
|||
|
EQUITY AND LIABILITIES
|
|
|||||||||||||
|
Share capital and premium
|
7,066
|
|
6,108
|
|
824
|
|
(6,932
|
)
|
7,066
|
|
||||
|
Retained earnings (accumulated losses) and other reserves
|
(4,636
|
)
|
(3,903
|
)
|
895
|
|
3,008
|
|
(4,636
|
)
|
||||
|
Shareholders’ equity
|
2,430
|
|
2,205
|
|
1,719
|
|
(3,924
|
)
|
|
2,430
|
|
|||
|
Non-controlling interests
|
—
|
|
—
|
|
37
|
|
—
|
|
37
|
|
||||
|
Total equity
|
2,430
|
|
2,205
|
|
1,756
|
|
(3,924
|
)
|
|
2,467
|
|
|||
|
Non-current liabilities
|
428
|
|
2,427
|
|
1,255
|
|
—
|
|
4,110
|
|
||||
|
Current liabilities including intergroup balances
|
622
|
|
144
|
|
3,079
|
|
(3,138
|
)
|
707
|
|
||||
|
Total liabilities
|
1,050
|
|
|
2,571
|
|
|
4,334
|
|
|
(3,138
|
)
|
|
4,817
|
|
|
Total equity and liabilities
|
3,480
|
|
|
4,776
|
|
|
6,090
|
|
|
(7,062
|
)
|
|
7,284
|
|
F - 87
NOTES TO THE CONSOLIDATED FINANCIAL STATEMENTS
(continued)
37 Supplemental condensed consolidating financial information
(continued)
|
Figures in millions (US dollars)
|
2017
|
|
2017
|
|
2017
|
|
2017
|
|
2017
|
|
||||
|
Condensed consolidating statement of cash flow
|
AngloGold Ashanti
(the “Guarantor”)
|
|
IOMco
(the “Issuer”)
|
|
Other subsidiaries
(the
“Non-Guarantor
Subsidiaries”)
|
|
Consolidation
adjustments
|
|
Total
|
|
||||
|
Cash flows from operating activities
|
||||||||||||||
|
Cash generated from (used by) operations
|
(5
|
)
|
(15
|
)
|
1,168
|
|
3
|
|
1,151
|
|
||||
|
Net movement in intergroup receivables and payables
|
10
|
|
(102
|
)
|
123
|
|
(31
|
)
|
—
|
|
||||
|
Dividends received from joint ventures
|
—
|
|
6
|
|
—
|
|
—
|
|
6
|
|
||||
|
Taxation refund
|
3
|
|
—
|
|
11
|
|
—
|
|
14
|
|
||||
|
Taxation paid
|
—
|
|
—
|
|
(174
|
)
|
—
|
|
(174
|
)
|
||||
|
Net cash inflow (outflow) from operating activities
|
8
|
|
(111
|
)
|
1,128
|
|
(28
|
)
|
|
997
|
|
|||
|
Cash flows from investing activities
|
|
|||||||||||||
|
Capital expenditure
|
(143
|
)
|
—
|
|
(686
|
)
|
—
|
|
(829
|
)
|
||||
|
Expenditure on intangible assets
|
(1
|
)
|
—
|
|
—
|
|
—
|
|
(1
|
)
|
||||
|
Proceeds from disposal of tangible assets
|
3
|
|
—
|
|
4
|
|
—
|
|
7
|
|
||||
|
Other investments acquired
|
—
|
|
(5
|
)
|
(86
|
)
|
—
|
|
(91
|
)
|
||||
|
Proceeds from disposal of other investments
|
—
|
|
—
|
|
75
|
|
3
|
|
78
|
|
||||
|
Investments in associates and joint ventures
|
—
|
|
(15
|
)
|
(14
|
)
|
2
|
|
(27
|
)
|
||||
|
Net loans repaid by (advanced to) associates and joint ventures
|
—
|
|
(6
|
)
|
2
|
|
(2
|
)
|
(6
|
)
|
||||
|
Reduction in investment in subsidiary
|
42
|
|
—
|
|
—
|
|
(42
|
)
|
—
|
|
||||
|
Disposal (acquisition) of subsidiaries
|
—
|
|
(2
|
)
|
2
|
|
—
|
|
—
|
|
||||
|
Decrease (increase) in cash restricted for use
|
—
|
|
—
|
|
(8
|
)
|
—
|
|
(8
|
)
|
||||
|
Interest received
|
1
|
|
3
|
|
11
|
|
—
|
|
15
|
|
||||
|
Net cash inflow (outflow) from investing activities
|
(98
|
)
|
(25
|
)
|
(700
|
)
|
(39
|
)
|
|
(862
|
)
|
|||
|
Cash flows from financing activities
|
|
|||||||||||||
|
Reduction in share capital
|
—
|
|
(43
|
)
|
—
|
|
43
|
|
—
|
|
||||
|
Proceeds from borrowings
|
539
|
|
155
|
|
121
|
|
—
|
|
815
|
|
||||
|
Repayment of borrowings
|
(428
|
)
|
(170
|
)
|
(169
|
)
|
—
|
|
(767
|
)
|
||||
|
Finance costs paid
|
(15
|
)
|
(103
|
)
|
(20
|
)
|
—
|
|
(138
|
)
|
||||
|
Dividends paid
|
(39
|
)
|
—
|
|
(19
|
)
|
—
|
|
(58
|
)
|
||||
|
Intergroup dividends received (paid)
|
—
|
|
286
|
|
(286
|
)
|
—
|
|
—
|
|
||||
|
Net cash inflow (outflow) from financing activities
|
57
|
|
125
|
|
(373
|
)
|
43
|
|
|
(148
|
)
|
|||
|
Net increase (decrease) in cash and cash equivalents
|
(33
|
)
|
(11
|
)
|
55
|
|
(24
|
)
|
(13
|
)
|
||||
|
Translation
|
—
|
|
—
|
|
(21
|
)
|
24
|
|
3
|
|
||||
|
Cash and cash equivalents at beginning of year
|
44
|
|
32
|
|
139
|
|
—
|
|
215
|
|
||||
|
Cash and cash equivalents at end of year
|
11
|
|
|
21
|
|
|
173
|
|
|
—
|
|
|
205
|
|
F - 88
NOTES TO THE CONSOLIDATED FINANCIAL STATEMENTS
(continued)
37 Supplemental condensed consolidating financial information
(continued)
|
Figures in millions (US dollars)
|
2016
|
|
2016
|
|
2016
|
|
2016
|
|
2016
|
|
||||
|
Condensed consolidating statement of cash flow
|
AngloGold Ashanti
(the “Guarantor”)
|
|
IOMco
(the “Issuer”)
|
|
Other subsidiaries
(the
“Non-Guarantor
Subsidiaries”)
|
|
Consolidation
adjustments
|
|
Total
|
|
||||
|
Cash flows from operating activities
|
||||||||||||||
|
Cash generated from (used by) operations
|
245
|
|
(11
|
)
|
1,106
|
|
(38
|
)
|
1,302
|
|
||||
|
Net movement in intergroup receivables and payables
|
(8
|
)
|
169
|
|
(163
|
)
|
2
|
|
—
|
|
||||
|
Dividends received from joint ventures
|
—
|
|
37
|
|
—
|
|
—
|
|
37
|
|
||||
|
Taxation refund
|
3
|
|
—
|
|
9
|
|
—
|
|
12
|
|
||||
|
Taxation paid
|
(4
|
)
|
—
|
|
(161
|
)
|
—
|
|
(165
|
)
|
||||
|
Net cash inflow (outflow) from operating activities
|
236
|
|
195
|
|
791
|
|
(36
|
)
|
|
1,186
|
|
|||
|
Cash flows from investing activities
|
|
|||||||||||||
|
Capital expenditure
|
(171
|
)
|
—
|
|
(535
|
)
|
—
|
|
(706
|
)
|
||||
|
Expenditure on intangible assets
|
(2
|
)
|
—
|
|
(3
|
)
|
—
|
|
(5
|
)
|
||||
|
Proceeds from disposal of tangible assets
|
—
|
|
—
|
|
4
|
|
—
|
|
4
|
|
||||
|
Other investments acquired
|
—
|
|
—
|
|
(73
|
)
|
—
|
|
(73
|
)
|
||||
|
Proceeds from disposal of other investments
|
—
|
|
—
|
|
61
|
|
—
|
|
61
|
|
||||
|
Investments in associates and joint ventures
|
—
|
|
—
|
|
(11
|
)
|
—
|
|
(11
|
)
|
||||
|
Proceeds from disposal of associates and joint ventures
|
—
|
|
10
|
|
—
|
|
—
|
|
10
|
|
||||
|
Net loans repaid by (advanced to) associates and joint ventures
|
—
|
|
(2
|
)
|
(2
|
)
|
—
|
|
(4
|
)
|
||||
|
Disposal (acquisition) of subsidiaries
|
(6
|
)
|
(2
|
)
|
2
|
|
6
|
|
—
|
|
||||
|
Decrease (increase) in cash restricted for use
|
1
|
|
—
|
|
7
|
|
—
|
|
8
|
|
||||
|
Interest received
|
2
|
|
—
|
|
12
|
|
—
|
|
14
|
|
||||
|
Net cash inflow (outflow) from investing activities
|
(176
|
)
|
6
|
|
(538
|
)
|
6
|
|
|
(702
|
)
|
|||
|
Cash flows from financing activities
|
|
|||||||||||||
|
Proceeds from issue of share capital
|
—
|
|
6
|
|
—
|
|
(6
|
)
|
—
|
|
||||
|
Proceeds from borrowings
|
256
|
|
330
|
|
201
|
|
—
|
|
787
|
|
||||
|
Repayment of borrowings
|
(291
|
)
|
(951
|
)
|
(91
|
)
|
—
|
|
(1,333
|
)
|
||||
|
Finance costs paid
|
(11
|
)
|
(145
|
)
|
(16
|
)
|
—
|
|
(172
|
)
|
||||
|
Bond settlement premium, RCF and bond transaction costs
|
—
|
|
(30
|
)
|
—
|
|
—
|
|
(30
|
)
|
||||
|
Dividends paid
|
—
|
|
—
|
|
(15
|
)
|
—
|
|
(15
|
)
|
||||
|
Intergroup dividends received (paid)
|
7
|
|
399
|
|
(406
|
)
|
—
|
|
—
|
|
||||
|
Net cash inflow (outflow) from financing activities
|
(39
|
)
|
(391
|
)
|
(327
|
)
|
(6
|
)
|
(763
|
)
|
||||
|
Net increase (decrease) in cash and cash equivalents
|
21
|
|
(190
|
)
|
(74
|
)
|
(36
|
)
|
(279
|
)
|
||||
|
Translation
|
4
|
|
—
|
|
(30
|
)
|
36
|
|
10
|
|
||||
|
Cash and cash equivalents at beginning of year
|
19
|
|
222
|
|
243
|
|
—
|
|
484
|
|
||||
|
Cash and cash equivalents at end of year
|
44
|
|
|
32
|
|
|
139
|
|
|
—
|
|
|
215
|
|
F - 89
NOTES TO THE CONSOLIDATED FINANCIAL STATEMENTS
(continued)
37 Supplemental condensed consolidating financial information
(continued)
|
Figures in millions (US dollars)
|
2015
|
|
2015
|
|
2015
|
|
2015
|
|
2015
|
|
||||
|
Condensed consolidating statement of cash flow
|
AngloGold Ashanti
(the “Guarantor”)
|
|
IOMco
(the “Issuer”)
|
|
Other subsidiaries
(the
“Non-Guarantor
Subsidiaries”)
|
|
Consolidation
adjustments
|
|
Total
|
|
||||
|
Cash flows from operating activities
|
||||||||||||||
|
Cash generated from (used by) operations
|
44
|
|
(364
|
)
|
1,115
|
|
455
|
|
1,250
|
|
||||
|
Net movement in intergroup receivables and payables
|
131
|
|
1,036
|
|
(833
|
)
|
(334
|
)
|
—
|
|
||||
|
Dividends received from joint ventures
|
—
|
|
57
|
|
—
|
|
—
|
|
57
|
|
||||
|
Taxation refund
|
12
|
|
—
|
|
9
|
|
—
|
|
21
|
|
||||
|
Taxation paid
|
(5
|
)
|
(1
|
)
|
(178
|
)
|
—
|
|
(184
|
)
|
||||
|
Net cash inflow (outflow) from operating activities from continuing operations
|
182
|
|
728
|
|
113
|
|
121
|
|
|
1,144
|
|
|||
|
Net cash inflow (outflow) from operating activities from discontinued operations
|
—
|
|
—
|
|
(5
|
)
|
—
|
|
(5
|
)
|
||||
|
Net cash inflow (outflow) from operating activities
|
182
|
|
728
|
|
108
|
|
121
|
|
|
1,139
|
|
|||
|
Cash flows from investing activities
|
|
|||||||||||||
|
Capital expenditure
|
(194
|
)
|
—
|
|
(470
|
)
|
—
|
|
(664
|
)
|
||||
|
Expenditure on intangible assets
|
(2
|
)
|
—
|
|
(1
|
)
|
—
|
|
(3
|
)
|
||||
|
Proceeds from disposal of tangible assets
|
—
|
|
—
|
|
6
|
|
—
|
|
6
|
|
||||
|
Other investments acquired
|
—
|
|
—
|
|
(86
|
)
|
—
|
|
(86
|
)
|
||||
|
Proceeds from disposal of other investments
|
1
|
|
—
|
|
80
|
|
—
|
|
81
|
|
||||
|
Investments in associates and joint ventures
|
—
|
|
—
|
|
(11
|
)
|
—
|
|
(11
|
)
|
||||
|
Proceeds from disposal of associates and joint ventures
|
1
|
|
|
—
|
|
|
—
|
|
|
—
|
|
1
|
|
|
|
Net loans repaid by (advanced to) associates and joint ventures
|
2
|
|
(5
|
)
|
—
|
|
—
|
|
(3
|
)
|
||||
|
Net proceeds from disposal of subsidiaries and investments
|
—
|
|
—
|
|
812
|
|
—
|
|
812
|
|
||||
|
Cash in subsidiary disposed and transfers to held for sale
|
—
|
|
—
|
|
(2
|
)
|
—
|
|
(2
|
)
|
||||
|
Disposal (acquisition) of subsidiaries
|
—
|
|
(1
|
)
|
1
|
|
—
|
|
—
|
|
||||
|
Decrease (increase) in cash restricted for use
|
—
|
|
(2
|
)
|
(15
|
)
|
—
|
|
(17
|
)
|
||||
|
Interest received
|
6
|
|
3
|
|
16
|
|
—
|
|
25
|
|
||||
|
Net cash inflow (outflow) from investing activities from continuing operations
|
(186
|
)
|
(5
|
)
|
330
|
|
—
|
|
|
139
|
|
|||
|
Net cash inflow (outflow) from investing activities from discontinued operations
|
—
|
|
—
|
|
(59
|
)
|
—
|
|
(59
|
)
|
||||
|
Net cash inflow (outflow) from investing activities
|
(186
|
)
|
(5
|
)
|
271
|
|
—
|
|
|
80
|
|
|||
|
Cash flows from financing activities
|
|
|||||||||||||
|
Proceeds from borrowings
|
120
|
|
300
|
|
1
|
|
—
|
|
421
|
|
||||
|
Repayment of borrowings
|
(127
|
)
|
(1,024
|
)
|
(137
|
)
|
—
|
|
(1,288
|
)
|
||||
|
Finance costs paid
|
(14
|
)
|
(223
|
)
|
(14
|
)
|
—
|
|
(251
|
)
|
||||
|
Bond settlement premium, RCF and bond transaction costs
|
—
|
|
(61
|
)
|
—
|
|
—
|
|
(61
|
)
|
||||
|
Dividends paid
|
—
|
|
—
|
|
(5
|
)
|
—
|
|
(5
|
)
|
||||
|
Intergroup dividends received (paid)
|
—
|
|
247
|
|
(247
|
)
|
—
|
|
—
|
|
||||
|
Net cash inflow (outflow) from financing activities from continuing operations
|
(21
|
)
|
(761
|
)
|
(402
|
)
|
—
|
|
|
(1,184
|
)
|
|||
|
Net cash inflow (outflow) from financing activities from discontinued operations
|
—
|
|
—
|
|
(2
|
)
|
—
|
|
(2
|
)
|
||||
|
Net cash (outflow) inflow from financing activities
|
(21
|
)
|
|
(761
|
)
|
|
(404
|
)
|
|
—
|
|
|
(1,186
|
)
|
|
Net increase (decrease) in cash and cash equivalents
|
(25
|
)
|
(38
|
)
|
(25
|
)
|
121
|
|
33
|
|
||||
|
Translation
|
(8
|
)
|
—
|
|
112
|
|
(121
|
)
|
(17
|
)
|
||||
|
Cash and cash equivalents at beginning of year
|
52
|
|
260
|
|
156
|
|
—
|
|
468
|
|
||||
|
Cash and cash equivalents at end of year
|
19
|
|
|
222
|
|
|
243
|
|
|
—
|
|
|
484
|
|
F - 90
KIBALI (JERSEY) LIMITED
Consolidated Financial Statements for the Three Years Ended
31 December 2017
F - 91
STATEMENT OF RESPONSIBILITY BY THE BOARD OF DIRECTORS
For the year ended 31 December 2017
The directors of the Company are required by the Companies (Jersey) Law 1991 to prepare financial statements for each financial period presented, which present fairly, in all material respects, the state of affairs of Kibali (Jersey) Limited (“the Company”) and its subsidiaries (“the Group”) as at the end of each financial period and of the profit or loss for that period. In preparing these financial statements, the directors are required to:
|
•
|
Select suitable accounting policies and then apply them consistently;
|
|
•
|
Make judgements and estimates that are reasonable and prudent;
|
|
•
|
State whether applicable accounting standards have been followed, subject to any material departures disclosed and explained in the financial statements; and
|
|
•
|
Prepare the financial statements on the going concern basis unless it is inappropriate to presume that the company will continue in business.
|
The Directors are responsible for keeping proper accounting records which disclose with reasonable accuracy at any time the financial position of the Company and the Group to enable them to ensure that the financial statements comply with the Companies (Jersey) Law 1991. They are also responsible for safeguarding the assets of the Company and the Group and hence for taking reasonable steps for the prevention and detection of fraud, error and non-compliance with law and regulations.
The directors have elected to prepare the financial statements for the Group in accordance with International Financial Reporting Standards (IFRS) as issued by the International Accounting Standards Board (IASB) and include amounts based on judgements and estimates made by management.
The directors acknowledge that they are ultimately responsible for the system of internal financial control established by the Group and place considerable importance on maintaining a strong control environment. These are designed to provide reasonable, but not absolute, assurance as to the reliability of the financial statements of the Group. Nothing has come to the attention of the directors to indicate that any material breakdown in the functioning of these controls, procedures and systems has occurred during the year under review.
The going concern basis has been adopted in preparing the financial statements for the Group. The directors have no reason to believe that the Group will not be a going concern in the foreseeable future based on forecasts and available cash resources. These financial statements support the viability of the Group.
Auditors
The current directors have taken all reasonable steps to make themselves aware of any information needed by the Group's auditors for the purposes of their audit and to establish that the auditors are aware of that information. The directors are not aware of any relevant audit information of which the auditors are unaware.
These financial statements for the Group were approved by the Board of Directors on 14 March 2018 and are signed on its behalf by:
/s/ Graham Shuttleworth
Director
F - 92
REPORT OF INDEPENDENT REGISTERED PUBLIC ACCOUNTING FIRM
Shareholders and Board of Directors
Kibali (Jersey) Limited,
Jersey, Channel Islands
Opinion on the Consolidated Financial Statements
We have audited the accompanying consolidated statements of financial position of Kibali (Jersey) Limited (the “Company”) and subsidiaries as of 31 December 2017, 2016 and 2015, the related consolidated statements of comprehensive income, changes in equity, and cash flows for each of the three years in the period ended 31 December 2017, and the related notes (collectively referred to as the “consolidated financial statements”). In our opinion, the consolidated financial statements present fairly, in all material respects, the financial position of the Company and subsidiaries at 31 December 2017, 2016 and 2015, and the results of their operations and their cash flows for each of the three years in the period ended 31 December 2017
,
in conformity with International Financial Reporting Standards as Issued by the International Accounting Standards Board.
Basis for Opinion
These consolidated financial statements are the responsibility of the Company’s management. Our responsibility is to express an opinion on the Company’s consolidated financial statements based on our audits. We are a public accounting firm registered with the Public Company Accounting Oversight Board (United States) (“PCAOB”) and are required to be independent with respect to the Company in accordance with the U.S. federal securities laws and the applicable rules and regulations of the Securities and Exchange Commission and the PCAOB.
We conducted our audits in accordance with the standards of the PCAOB. Those standards require that we plan and perform the audit to obtain reasonable assurance about whether the consolidated financial statements are free of material misstatement, whether due to error or fraud. The Company is not required to have, nor were we engaged to perform, an audit of its internal control over financial reporting. As part of our audits we are required to obtain an understanding of internal control over financial reporting but not for the purpose of expressing an opinion on the effectiveness of the Company’s internal control over financial reporting. Accordingly, we express no such opinion.
Our audits included performing procedures to assess the risks of material misstatement of the consolidated financial statements, whether due to error or fraud, and performing procedures that respond to those risks. Such procedures included examining, on a test basis, evidence regarding the amounts and disclosures in the consolidated financial statements. Our audits also included evaluating the accounting principles used and significant estimates made by management, as well as evaluating the overall presentation of the consolidated financial statements. We believe that our audits provide a reasonable basis for our opinion.
/s/ BDO LLP
BDO LLP
We have served as the Company's auditor since 2013.
London, United Kingdom
14 March 2018
F - 93
CONSOLIDATED STATEMENTS OF COMPREHENSIVE INCOME
FOR THE YEARS ENDED
31 DECEMBER 2017
,
2016
and
2015
|
2017
|
|
2016
|
|
2015
|
|
||||
|
Note
|
$’000
|
|
$’000
|
|
$’000
|
|
|||
|
REVENUE
|
|||||||||
|
Gold sales
|
754 852
|
|
709,372
|
|
747,272
|
|
|||
|
Other income
|
3
|
146
|
|
136
|
|
1,657
|
|
||
|
TOTAL INCOME
|
754 998
|
|
709,508
|
|
748,929
|
|
|||
|
COSTS AND EXPENSES
|
|||||||||
|
Mining and processing costs
|
4
|
698 980
|
|
594,722
|
|
550,712
|
|
||
|
Royalties
|
31 913
|
|
32,976
|
|
30,196
|
|
|||
|
Exploration and corporate expenditure
|
5
|
8 205
|
|
6,398
|
|
8,248
|
|
||
|
Other expenses
|
3
|
55 031
|
|
48,250
|
|
3,658
|
|
||
|
TOTAL COSTS
|
794 129
|
|
682,346
|
|
592,814
|
|
|||
|
Finance income
|
6
|
4 147
|
|
4,735
|
|
4,818
|
|
||
|
Finance costs
|
6
|
(5 478)
|
|
(5,298
|
)
|
(5,376
|
)
|
||
|
Finance costs - net
|
(1 331)
|
|
(563
|
)
|
(558
|
)
|
|||
|
Share of profits of equity accounted joint venture
|
25
|
113
|
|
129
|
|
268
|
|
||
|
(LOSS) / PROFIT BEFORE INCOME TAX
|
(40 349)
|
|
26,728
|
|
155,825
|
|
|||
|
Income tax benefit / (expense)
|
7
|
54 333
|
|
22,962
|
|
(17,840
|
)
|
||
|
PROFIT FOR THE YEAR
|
13 984
|
|
49,690
|
|
137,985
|
|
|||
|
OTHER COMPREHENSIVE INCOME/(EXPENSE)
|
|||||||||
|
(Loss) / gain on available for sale financial asset
|
(33
|
)
|
13
|
|
(29
|
)
|
|||
|
Recycling of permanent losses on available-for-sale asset
|
—
|
|
—
|
|
3,173
|
|
|||
|
TOTAL COMPREHENSIVE INCOME
|
13 951
|
|
49,703
|
|
141,129
|
|
|||
|
PROFIT FOR THE YEAR
|
|||||||||
|
Attributable to:
|
|||||||||
|
Owners of the parent
|
26 341
|
|
57,537
|
|
135,883
|
|
|||
|
Non-controlling interest
|
(12 357)
|
|
(7,847
|
)
|
2,102
|
|
|||
|
13 984
|
|
49,690
|
|
137,985
|
|
||||
|
TOTAL COMPREHENSIVE INCOME
|
|||||||||
|
Attributable to:
|
|||||||||
|
Owners of the parent
|
26 308
|
|
57,550
|
|
139,027
|
|
|||
|
Non-controlling interest
|
(12 357)
|
|
(7,847
|
)
|
2,102
|
|
|||
|
13 951
|
|
49,703
|
|
141,129
|
|
||||
The accompanying notes form part of these consolidated financial statements
F - 94
CONSOLIDATED STATEMENTS OF FINANCIAL POSITION
AS AT
31 DECEMBER 2017
,
2016
and
2015
|
2017
|
|
2016
|
|
2015
|
|
||||
|
Note
|
$’000
|
|
$’000
|
|
$’000
|
|
|||
|
NON-CURRENT ASSETS
|
|||||||||
|
Property, plant and equipment
|
8
|
2 107 718
|
|
2,068,306
|
|
2,012,303
|
|
||
|
Mineral properties
|
9
|
519 117
|
|
576,536
|
|
634,394
|
|
||
|
Long term ore stockpiles
|
12
|
12 779
|
|
43,771
|
|
43,162
|
|
||
|
Investment in equity accounted joint venture
|
25
|
255
|
|
142
|
|
289
|
|
||
|
Other investments in joint venture
|
25
|
25 577
|
|
28,830
|
|
31,086
|
|
||
|
Total investment in joint venture
|
25
|
25 832
|
|
28,972
|
|
31,375
|
|
||
|
Trade and other receivables
|
11
|
125 294
|
|
87,435
|
|
32,788
|
|
||
|
Deferred tax asset
|
10
|
43,237
|
|
—
|
|
—
|
|
||
|
TOTAL NON-CURRENT ASSETS
|
2,833,977
|
|
2,805,020
|
|
2,754,022
|
|
|||
|
CURRENT ASSETS
|
|||||||||
|
Inventories and ore stockpiles
|
12
|
73 231
|
|
72,505
|
|
78,598
|
|
||
|
Trade and other receivables
|
11
|
92 991
|
|
107,025
|
|
180,724
|
|
||
|
Available-for-sale financial asset
|
13
|
26
|
|
58
|
|
45
|
|
||
|
Cash and cash equivalents
|
3 288
|
|
18,865
|
|
21,373
|
|
|||
|
TOTAL CURRENT ASSETS
|
169 536
|
|
198,453
|
|
280,740
|
|
|||
|
TOTAL ASSETS
|
3 003 513
|
|
3,003,473
|
|
3,034,762
|
|
|||
|
EQUITY AND LIABILITIES
|
|||||||||
|
EQUITY
|
|||||||||
|
Share capital
|
14
|
5
|
|
5
|
|
5
|
|
||
|
Share premium
|
2 523 612
|
|
2,493,612
|
|
2,493,612
|
|
|||
|
Retained earnings
|
293 821
|
|
267,480
|
|
269,943
|
|
|||
|
Other reserve
|
(20
|
)
|
13
|
|
—
|
|
|||
|
Equity attributable to owners of the parent
|
2 817 418
|
|
2,761,110
|
|
2,763,560
|
|
|||
|
Non-controlling interest
|
15
|
7 420
|
|
19,777
|
|
27,624
|
|
||
|
TOTAL EQUITY
|
2 824 838
|
|
2,780,887
|
|
2,791,184
|
|
|||
|
NON-CURRENT LIABILITIES
|
|||||||||
|
Loans and borrowings
|
16
|
41 210
|
|
46,929
|
|
51,747
|
|
||
|
Deferred tax liabilities
|
10
|
—
|
|
11,096
|
|
41,926
|
|
||
|
Provision for rehabilitation
|
17
|
23 244
|
|
21,163
|
|
15,533
|
|
||
|
TOTAL NON-CURRENT LIABILITIES
|
64 454
|
|
79,188
|
|
109,206
|
|
|||
|
CURRENT LIABILITIES
|
|||||||||
|
Loans and borrowings
|
16
|
7 596
|
|
10,285
|
|
9,808
|
|
||
|
Trade and other payables
|
18
|
104 633
|
|
131,859
|
|
117,083
|
|
||
|
Current tax payable
|
1 992
|
|
1,254
|
|
7,481
|
|
|||
|
TOTAL CURRENT LIABILITIES
|
114 221
|
|
143,398
|
|
134,372
|
|
|||
|
TOTAL EQUITY AND LIABILITIES
|
3 003 513
|
|
3,003,473
|
|
3,034,762
|
|
|||
The accompanying notes form part of these consolidated financial statements.
F - 95
CONSOLIDATED STATEMENTS OF CHANGES IN EQUITY
AS AT
31 DECEMBER 2017
,
2016
and
2015
|
$’000
|
Share
Capital
|
|
Share
Premium
|
|
Retained
earnings
|
|
Other
Reserves
|
|
Total equity
attributable
to owners of
the parent
|
|
Non-
Controlling
Interest
|
|
Total
Equity
|
|
||||||
|
Balance at 1 January 2015
|
5
|
|
2,493,612
|
|
204,060
|
|
(3,144
|
)
|
2,694,533
|
|
25,522
|
|
2,720,055
|
|
||||||
|
Fair value movement on available-for-sale financial asset
|
—
|
|
—
|
|
—
|
|
(29
|
)
|
(29
|
)
|
—
|
|
(29
|
)
|
||||||
|
Recycling of permanent losses on available-for-sale asset
|
—
|
|
—
|
|
—
|
|
3,173
|
|
3,173
|
|
—
|
|
3,173
|
|
||||||
|
Total other comprehensive expense
|
—
|
|
—
|
|
—
|
|
3,144
|
|
3,144
|
|
—
|
|
3,144
|
|
||||||
|
Net profit for the year
|
—
|
|
—
|
|
135,883
|
|
—
|
|
135,883
|
|
2,102
|
|
137,985
|
|
||||||
|
Total comprehensive income
|
—
|
|
—
|
|
135,883
|
|
3,144
|
|
139,027
|
|
2,102
|
|
141,129
|
|
||||||
|
Diivdends
|
—
|
|
—
|
|
(70,000
|
)
|
—
|
|
(70,000
|
)
|
—
|
|
(70,000
|
)
|
||||||
|
Balance at 31 December 2015
|
5
|
|
2,493,612
|
|
269,943
|
|
—
|
|
2,763,560
|
|
27,624
|
|
2,791,184
|
|
||||||
|
Balance at 1 January 2016
|
5
|
|
2,493,612
|
|
269,943
|
|
—
|
|
2,763,560
|
|
27,624
|
|
2,791,184
|
|
||||||
|
Fair value movement on available-for-sale financial asset
|
—
|
|
—
|
|
—
|
|
13
|
|
13
|
|
—
|
|
13
|
|
||||||
|
Total other comprehensive income
|
—
|
|
—
|
|
—
|
|
13
|
|
13
|
|
—
|
|
13
|
|
||||||
|
Net profit/(loss) for the year
|
—
|
|
—
|
|
57,537
|
|
—
|
|
57,537
|
|
(7,847
|
)
|
49,690
|
|
||||||
|
Total comprehensive income/(expense)
|
—
|
|
—
|
|
57,537
|
|
13
|
|
57,550
|
|
(7,847
|
)
|
49,703
|
|
||||||
|
Dividends
|
—
|
|
—
|
|
(60,000
|
)
|
—
|
|
(60,000
|
)
|
—
|
|
(60,000
|
)
|
||||||
|
Balance at 31 December 2016
|
5
|
|
2,493,612
|
|
267,480
|
|
13
|
|
2,761,110
|
|
19,777
|
|
2,780,887
|
|
||||||
|
Balance at 1 January 2017
|
5
|
|
2,493,612
|
|
267,480
|
|
13
|
|
2,761,110
|
|
19,777
|
|
2,780,887
|
|
||||||
|
Fair value movement on available-for-sale financial asset
|
—
|
|
—
|
|
—
|
|
(33
|
)
|
(33
|
)
|
—
|
|
(33
|
)
|
||||||
|
Total other comprehensive expense
|
—
|
|
—
|
|
—
|
|
(33
|
)
|
(33
|
)
|
—
|
|
(33
|
)
|
||||||
|
Net profit/(loss) for the year
|
—
|
|
—
|
|
26,341
|
|
—
|
|
26,341
|
|
(12,357
|
)
|
13,984
|
|
||||||
|
Total comprehensive income/(expense)
|
—
|
|
—
|
|
26,341
|
|
(33
|
)
|
26,308
|
|
(12,357
|
)
|
13,951
|
|
||||||
|
Shares issued (note 14)
|
—
|
|
30,000
|
|
—
|
|
—
|
|
30,000
|
|
—
|
|
30,000
|
|
||||||
|
Balance at 31 December 2017
|
5
|
|
2,523,612
|
|
293,821
|
|
(20
|
)
|
2,817,418
|
|
7,420
|
|
2,824,838
|
|
||||||
SHARE CAPITAL
The share capital comprises the issued ordinary shares of the company at par.
SHARE PREMIUM
The share premium comprises the excess value recognised from the issue of ordinary shares at par.
RETAINED EARNINGS
Retained earnings comprises the Group’s cumulative accounting profits and losses since inception less dividends.
OTHER RESERVES
Other reserves comprises the Group’s cumulative fair value movement on the available-for sale financial asset since inception in Kilo Goldmines Limited less amounts reclassified to profit and loss.
NON-CONTROLLING INTEREST
The non-controlling interest represents the total carrying value of the 10% interest Société Minière de Kilo-Moto (“SOKIMO”) has in Kibali Goldmines SA (Kibali), which is a subsidiary of Kibali (Jersey) Limited.
The accompanying notes form part of these consolidated financial statements.
F - 96
CONSOLIDATED STATEMENTS OF CASH FLOWS
FOR THE YEARS ENDED
31 DECEMBER 2017
,
2016
and
2015
|
2017
|
|
2016
|
|
2015
|
|
||||
|
Note
|
$’000
|
|
$’000
|
|
$’000
|
|
|||
|
CASH FLOWS FROM OPERATING ACTIVITIES
|
|||||||||
|
Cash generated by operations
|
23
|
225 429
|
|
272,950
|
|
369,658
|
|
||
|
Interest received
|
2 701
|
|
3,400
|
|
3,591
|
|
|||
|
Finance cost paid
|
(4 856)
|
|
(4,637
|
)
|
(4,198
|
)
|
|||
|
Dividends received from equity accounted joint venture
|
25
|
—
|
|
276
|
|
—
|
|
||
|
Income tax paid
|
(1 796)
|
|
(8,973
|
)
|
(13,148
|
)
|
|||
|
Net cash flows generated by operating activities
|
221 478
|
|
263,016
|
|
355,903
|
|
|||
|
CASH FLOWS RELATED TO INVESTING ACTIVITIES
|
|||||||||
|
Additions of property, plant and equipment
|
(256 208)
|
|
(213,570
|
)
|
(286,905
|
)
|
|||
|
Repayment of loan from equity accounted joint venture
|
3 170
|
|
2,555
|
|
423
|
|
|||
|
Net cash outflows used in investing activities
|
(253 038)
|
|
(211,015
|
)
|
(286,482
|
)
|
|||
|
CASH FLOWS RELATING TO FINANCING ACTIVITIES
|
|||||||||
|
Proceeds from issue of ordinary shares
|
30 000
|
|
—
|
|
—
|
|
|||
|
Distribution of dividends
|
(8 000)
|
|
(52,000
|
)
|
(70,000
|
)
|
|||
|
Decrease in loans and borrowings
|
(7 228)
|
|
(6,714
|
)
|
(6,302
|
)
|
|||
|
Net cash inflows/(outflows) provided by financing activities
|
14 772
|
|
(58,714
|
)
|
(76,302
|
)
|
|||
|
Net decrease in cash and cash equivalents
|
(16 788)
|
|
(6,713
|
)
|
(6,881
|
)
|
|||
|
Cash and cash equivalents at the beginning of the year
|
7 314
|
|
14,027
|
|
20,908
|
|
|||
|
Cash and cash equivalents at the end of the year
|
(9 474)
|
|
7,314
|
|
14,027
|
|
|||
|
Cash and cash equivalents include the following for the purpose of the consolidated statement of cash flow:
|
|||||||||
|
Cash and cash equivalents
|
3 288
|
|
18,865
|
|
21,373
|
|
|||
|
Bank overdrafts
|
18
|
(12 762)
|
|
(11,551
|
)
|
(7,346
|
)
|
||
|
Cash and cash equivalents
|
(9 474)
|
|
7,314
|
|
14,027
|
|
|||
Bank overdrafts are classified as cash and cash equivalents as they form an integral part of cash management and fluctuate from positive to overdrawn.
The accompanying notes form part of these consolidated financial statements.
F - 97
1. SIGNIFICANT ACCOUNTING POLICIES
The principal accounting policies applied in the preparation of these consolidated financial statements are set out below. These policies have been consistently applied to all the years presented, unless otherwise stated.
BASIS OF PREPARATION
The consolidated financial statements of Kibali (Jersey) Limited and its subsidiaries and joint venture have been prepared in accordance with International Financial Reporting Standards and Interpretations (collectively (IFRS)) issued by the International Accounting Standards Board (IASB).
The consolidated financial statements have been prepared under the historical cost convention, as modified by the revaluation of available-for-sale financial assets. The preparation of financial statements in conformity with IFRS requires the use of certain critical accounting estimates. It also requires management to exercise its judgement in the process of applying the Group’s accounting policies. The areas involving a high degree of judgement or complexity, or areas where assumptions and estimates are significant to the consolidated financial statements are disclosed in note 2.
After reviewing the Group’s budget for the next financial year, and other longer term plans, the directors are satisfied, at the time of approving the financial statements, it is appropriate to adopt the going concern basis in preparing the financial statements. The directors have no reason to believe that the Group will not be a going concern for at least the next 12 months based on forecasts and available cash resources and available facilities.
NEW STANDARDS AND INTERPRETATIONS APPLIED
The IASB has issued the following new standards, amendments to published standards and interpretations to existing standards with effective dates on or prior to 1 January 2017 which have been adopted by the Group for the first time this year. These have not had a material impact.
|
Effective period commencing on or after
|
||||
|
IFRS 12
|
Amendments - Recognition of deferred tax assets for unrealised losses
|
January 1, 2017
|
||
|
IAS 7
|
Amendments - Disclosure initiative
|
January 1, 2017
|
||
|
Annual improvements to IFRSs (2014 – 2016 cycle)
|
January 1, 2017
|
|||
STANDARDS EFFECTIVE IN FUTURE PERIOD
Certain new standards, amendments and interpretations to existing standards have been published that are relevant to the Group’s activities and are mandatory for the Group’s accounting periods beginning after 1 January 2018 or later periods and which the Group has decided not to adopt early. These include:
|
Effective period commencing on or after
|
||||
|
IFRS 9
|
Financial instruments
|
January 1, 2018
|
||
|
IFRS 15
|
Revenue from contracts with customers
|
January 1, 2018
|
||
|
IFRS 16
|
Leases
|
January 1, 2019
|
||
|
Clarifications to IFRS 15 revenue from Contracts with Customers
|
January 1, 2018
|
|||
|
IFRIC 22
|
Foreign Currency Transactions and Advance Consideration
|
January 1, 2018
|
||
|
IFRIC 23
|
Uncertainty over Income Tax Treatments
|
January 1, 2019
|
||
|
IAS 28
|
Amendments - Long-term interests in Associates and Joint Ventures
|
January 1, 2019
|
||
|
Annual improvements to IFRSs (2015 – 2017 cycle)
|
January 1, 2019
|
|||
IFRS 15 is intended to introduce a single framework for revenue recognition and clarify principles of revenue recognition. This standard modifies the determination of when to recognise revenue and how much revenue to recognise. The core principle is that an entity recognises revenue to depict the transfer of promised goods and services to the customer of an amount that reflects the consideration to which the entity expects to be entitled in exchange for those goods or services. Management have completed an assessment of the existing gold sale contract and, based on the analysis performed, do not anticipate any material impact to the recognition of revenue upon adoption of this standard based on the existing arrangements at their operations.
F - 98
IFRS 16 introduces a single lease accounting model. This standard requires lessees to account for all leases under a single on-balance sheet model. Under the new standard, a lessee is required to recognise all lease assets and liabilities on the balance sheet; recognise amortisation of leased assets and interest on lease liabilities over the lease term; and separately present the principal amount of cash paid and interest in the cash flow statement. The requirements of IFRS 16 extend to certain service contracts, such as mining contractors in which the contractor provides services and the use of assets, which may impact the group. Accordingly, the group have initiated a review of relevant contracts to complete an impact assessment in 2018.
IFRS 9 “Financial instruments” addresses the classification and measurement of financial assets and financial liabilities. The complete version of IFRS 9 was issued in July 2014. It replaces the guidance in IAS 39 that relates to the classification and measurement of financial instruments. IFRS 9 retains but simplifies the mixed measurement model and establishes three primary measurement categories for financial assets: amortised cost, fair value through other comprehensive income (OCI) and fair value through profit or loss. The basis of classification depends on the entity’s business model and the contractual cash flow characteristics of the financial asset. Investments in equity instruments are required to be measured at fair value through profit or loss with the irrevocable option at inception to present changes in fair value in OCI. There is now a new expected credit loss model that replaces the incurred loss impairment model used in IAS 39 and will apply to loans to joint ventures although the impact is not expected to be material. It is noted that value added tax (TVA) receivables are outside the scope of this standard. For financial liabilities there were no significant changes to classification and measurement except for the recognition of changes in credit risk in other comprehensive income, for liabilities designated at fair value through profit or loss. Contemporaneous documentation is still required but is different to that currently prepared under IAS 39.
CONSOLIDATION
The consolidated financial information includes the financial statements of the Company, its subsidiaries and the Company’s equity accounted joint ventures using uniform accounting policies for similar transactions and other events in similar circumstances.
SUBSIDIARIES
Subsidiaries are entities over which the Group has power, exposure, or rights, to variable returns from its involvement and the ability to use its power over the investee to affect the amount of the Group's returns; generally accompanying an interest of more than one-half of the voting rights.
Subsidiaries are fully consolidated from the date on which control is transferred to the Group. They are deconsolidated from the date that control ceases. The purchase method of accounting is used to account for the acquisition of subsidiaries by the Group. The cost of an acquisition is measured at the fair value of the assets given, equity instruments issued and liabilities incurred or assumed at the date of exchange. Acquisition costs are expensed. Identifiable assets acquired (including mineral property interests or other identifiable intangible assets) and liabilities and contingent liabilities assumed in a business combination are measured initially at their fair values at the acquisition date, irrespective of the extent of any non-controlling interest. The excess of the cost of acquisition over the fair value of the Group’s share of the identifiable net assets acquired is recorded as goodwill. If the cost of acquisition is less than the fair value of the net assets of the subsidiary acquired, the difference is recognised directly in the statement of comprehensive income.
Intercompany transactions, balances and unrealised gains on transactions between group companies are eliminated. Unrealised losses are also eliminated unless the transaction provides evidence of an impairment of the asset transferred. Accounting policies of subsidiaries have been changed where necessary to ensure consistency with the policies adopted by the Group.
JOINT VENTURES
The Group holds interests in one joint venture. In a joint venture the parties that have joint control of the arrangement (the joint venturer) have a right to the net assets of the arrangement. This right is accounted for in the consolidated financial statements using the equity method. Joint control is considered to exist when there is contractual joint control; control being the power to govern the financial and operating policies of an entity so as to obtain benefits from the activities and the ability to use its power over the investee to affect the amounts of the Group’s returns by the joint venturers.
Acquisitions
Except for initial recognition under IFRS 11 transition rules, further investments in additional joint ventures are initially recognised at cost. The cost of an acquisition is measured at the fair value of the assets given, equity instruments issued or liabilities incurred or assumed at the date of exchange, plus costs directly attributable to the acquisition. Goodwill on associated companies and joint ventures represents the excess of the cost of acquisition of the associate or joint venture over the Group’s share of the fair value of the identifiable net assets of the associate or joint venture and is included in the carrying amount of the investment.
F - 99
Joint ventures are accounted for using the equity method of accounting. In applying the equity method of accounting, the Group’s share of its joint ventures’ post-acquisition profits or losses are recognised in profit or loss and its share of post-acquisition other comprehensive income is recognised in other comprehensive income. These post-acquisition movements and distributions received from the joint venture companies are adjusted against the carrying amount of the investments. When the Group’s share of losses in a joint venture Company equals or exceeds its interest in the joint venture Company, including any other unsecured non-current receivables, the Group does not recognise further losses, unless it has obligations to make or has made payments on behalf of the joint venture Company. Unrealised gains on transactions between the Group and its joint venture companies are eliminated to the extent of the Group’s interest in the joint venture companies. Unrealised losses are also eliminated unless the transaction provides evidence of an impairment of the asset transferred. Trading receivables and payables with joint ventures are classified within trade and other receivables and payables. The accounting policies of joint venture companies have been changed where necessary to ensure consistency with the accounting policies adopted by the Group.
Dividends received are classified as operating cash flows in the consolidated cash flow statement.
The carrying value of the investment in joint venture is compared to the recoverable amounts whenever circumstances indicate that the net book value may not be recoverable. An impairment is recognised in the profit or loss to the extent that the carrying value exceeds the recoverable amount.
SEGMENTAL REPORTING
An operating segment is a group of assets and operations engaged in performing mining or advanced exploration that are subject to risks and returns that are different from those of other segments. Other parts of the business are aggregated and treated as part of a ‘corporate and exploration’ segment. The Group provides segmental information using the same categories of information which the Group’s chief operating decision maker utilises. The Group’s chief operating decision maker is considered by management to be the board of directors.
The Group has only one business segment, being that of gold mining. Segment analysis is based on the mining operations and exploration projects that have a significant amount of capitalised expenditure or other fixed assets.
FOREIGN CURRENCY TRANSLATION
Functional and presentation currency
Items included in the financial statements of each of the Group’s entities are measured using the currency of the primary economic environment in which the entity operates (the functional currency). The consolidated financial statements are presented in US dollars, which is also the functional currency of the Company and its significant subsidiaries and joint ventures.
Transactions and balances
Foreign currency transactions are translated into the relevant functional currency using the exchange rates prevailing at the date of the transactions. Foreign exchange gains and losses resulting from the settlement of such transactions and from the translation at year end exchange rates of monetary assets and liabilities denominated in foreign currencies are recognised in the statement of comprehensive income in other income and other expenses.
INTANGIBLE ASSETS
Mineral properties
Mineral properties acquired are recognised at fair value at the acquisition date. Mineral properties are recognised at fair value if acquired as part of a business combination, whereas they are recognised at cost if acquired as an asset. Mineral properties are tested annually for impairment on the same basis that property, plant and equipment are when there is an indication of impairment. Mineral properties are amortised on units of production basis from the point at which the mine commences production (refer to ‘depreciation and amortisation’ policy below).
PROPERTY, PLANT AND EQUIPMENT
Long-lived assets and mine development costs
Long-lived assets including development costs and mine plant facilities (such as metallurgical plant, tailings and raw water dams, power plant and mine infrastructure) are initially recorded at cost. Development of ore bodies includes the development cost of shaft systems and waste rock removal that allows access to reserves that are economically recoverable in the future. Cost associated with underground development are capitalised when the works provide access to the ore body, whereas costs associated with ore extraction from operating ore body sections are treated as operating costs. Where relevant the estimated cost of dismantling the asset and remediating the site is included in the cost of property, plant and equipment, subsequently they are measured at cost less accumulated amortisation and impairment.
Development costs consist primarily of direct expenditure incurred to establish or expand productive capacity.
F - 100
Costs are capitalised during the construction of a new mine until commercial levels of production are achieved (refer to ‛commercial production’ below), after which the relevant costs are amortised. Costs are capitalised provided that the project is considered to be commercially, technically and economically viable. Such viability is deemed to be achieved when the Group is confident that the project will provide a satisfactory return relative to its perceived risks and is sufficiently certain of economic production. Costs which are necessarily incurred while commissioning new assets, in the period before they are capable of operating in the manner intended by management, are capitalised under ‘Long-lived assets and mine development costs’.
Development costs incurred after the commencement of production are capitalised to the extent they are expected to give rise to a future economic benefit.
Commercial production
When a mine construction project is substantially complete and ready for its intended use the asset moves into the production stage, the capitalisation of certain mine construction costs ceases and subsequent costs are either regarded as inventory or expensed, except for capitalisable costs related to subsequent mining asset additions or improvements, underground mine development or ore reserve development.
The commissioning of an underground mine typically occurs in phases, with sections brought into production whilst deeper levels remain under construction. The shared infrastructures, such as declines of shafts, are assessed to determine whether they contribute to the production areas. Where they contribute to production, the attributable costs are transferred to production assets and start to be depreciated. The costs transferred comprise costs directly attributable to producing zones or, where applicable, estimates of the portion of shared infrastructure that are attributed to the producing zones.
Development expenditure approval
Development activities commence after project sanctioning by the appropriate level of management. Judgement is applied by management in determining when a project has reached a stage at which economically recoverable reserves exists such that development may be sanctioned. In exercising this judgement, management is required to make certain estimates and assumptions similar to those described below for capitalised exploration and evaluation expenditure. Any such estimates and assumptions may change as new information becomes available.
Stripping costs
In surface mining operations, the Group may find it necessary to remove waste materials to gain access to mineral ore deposits prior to and after production commences. This waste removal activity is known as ‘stripping’. Prior to production commencing from a pit, stripping costs are measured internally and capitalised until the point where the overburden has been removed and access to the ore commences. Subsequent to production, waste stripping continues, either as part of ore extraction as a run of mine activity or due to
strategic decisions such as pit push-back campaigns. There are two benefits accruing to the Group from stripping activity during the production phase: usable ore that can be used to produce inventory and improved access to further quantities of material that will be mined in future periods. Economic ore extracted during this period and subsequently is accounted for as inventory. The production stripping costs relating to improved access to further quantities in future periods are capitalised as a stripping activity asset, if and only if, all of the following are met:
|
•
|
it is probable that the future economic benefit (improved access to the ore body) associated with the stripping activity will flow to the Group;
|
|
•
|
the Group can identify the component of the ore body for which access has been improved; and
|
|
•
|
the costs relating to the stripping activity associated with that component or components can be measured reliably.
|
In determining the relevant component of the ore body for which access is improved, the Group componentises its mine into geographically distinct ore body sections or phases to which the stripping activities being undertaken within that component are allocated. Such phases are determined based on assessment of factors such as geology and mine planning.
Once determined that any portion of the production stripping costs should be capitalised, the Group typically uses the average stripping ratio of the component or phase of the mine to which the production stripping cost related to determine the amount of the production stripping costs that should be capitalised, unless the direct costs of stripping activity can be separately identified in which case such costs are capitalised.
The Group depreciates the deferred costs capitalised as stripping assets on a unit of production method, with reference to the ex-pit ore production from the relevant ore body component or phase.
Short-lived assets
Short-lived assets including non-mining assets are shown at cost less accumulated depreciation and impairment.
Depreciation and amortisation
Long-lived assets include mining properties, such as metallurgical plant, tailings and raw water dams, power plant and mine infrastructure, as well as mine development costs and are depreciated on a unit of production basis.
F - 101
Depreciation and amortisation are charged over the life of the mine (or over the remaining useful life of the asset, if shorter) based on estimated ore tonnes contained in proven and probable reserves to be extracted using the relevant asset, to reduce the cost to estimated residual values. No future capital expenditure is included in the depreciable value. Proven and probable ore reserves reflect estimated quantities of economically recoverable reserves, which can be recovered in the future from known mineral deposits. Only proven and probable reserves are used in the tonnes milled units of production depreciation calculation. Any changes to the expected life of the mine (or asset) are applied prospectively in calculating depreciation and amortisation charges.
Depreciation of construction and development costs commences when commercial production is achieved, as detailed above. Underground development costs that are attributable to the commissioned sections of an underground mine are depreciated from the date the development provides access to operational areas and ore extraction begins from those areas. Other assets under construction, such as plant improvement projects, are depreciated from the date they are commissioned, based on assessment by the Group’s engineers.
Short-lived assets which include motor vehicles, office equipment and computer equipment are depreciated over estimated useful lives of between two to five years but limited to the remaining mine life. Residual values and useful lives are reviewed, and adjusted if appropriate, at each statement of financial position date. Changes to the estimated residual values or useful lives are accounted for prospectively. Depreciation starts when the assets are ready and available for use.
Impairment
The carrying amount of the property, plant and equipment of the Group is compared to the recoverable amount of the assets whenever events or changes in circumstances indicate that the net book value may not be recoverable. The recoverable amount is the higher of value in use and the fair value less cost to sell. In assessing the value in use, the expected future cash flows from the assets is determined by applying a discount rate to the anticipated risk adjusted future cash flows. The discount rate used
is derived from the Group’s weighted average cost of capital adjusted for asset specific factors as applicable. An impairment is recognised in the profit or loss to the extent that the carrying amount exceeds the assets’ recoverable amount. Only proven and probable reserves are used in the calculations and the models use the approved mine plan and exclude capital expenditure which enhance the assets or extractable ore tonnes outside of such approved mine plan. The revised carrying amounts are depreciated in line with Group accounting policies.
A previously recognised impairment loss is reversed if the recoverable amount increases as a result of a reversal of the conditions that originally resulted in the impairment. This reversal is recognised in the profit or loss and is limited to the carrying amount that would have been determined, net of depreciation, had no impairment loss been recognised in prior years.
Assets are grouped at the lowest levels for which there are separately identifiable cash flows (cash-generating units) for purposes of assessing impairment. The estimates of future discounted cash flows are subject to risks and uncertainties including the future gold price. It is therefore reasonably possible that changes could occur which may affect the recoverability of property, plant and equipment.
INVENTORIES
Inventories include ore stockpiles, gold in process and doré, and supplies and spares and are stated at the lower of cost or net realisable value. The cost of ore stockpiles and gold produced is determined principally by the weighted average cost method using related production costs.
Costs of stockpiles include costs incurred up to the point of stockpiling, such as mining and grade control costs, but exclude future costs of production. Ore extracted is allocated to separate stockpiles based on estimated grade, with grades below defined cut-off levels treated as waste and expensed. While held in physically separate stockpiles, the Group blends the ore from each stockpile when feeding the processing plant to achieve the resultant gold content. In such circumstances, lower and higher grade ore stockpiles each represent a raw material, used in conjunction with each other, to deliver overall gold production, as supported by the relevant feed plan. Kibali’s high and medium grade ore stockpile is above 1.53g/t with a marginal ore cut-off grade of 0.99g/t.
The processing of ore in stockpiles occurs in accordance with the Life of Mine (LOM) processing plan that has been optimised based on the known mineral reserves, current plant capacity and mine design. Ore tonnes contained in the stockpile which are to be milled as per the mine plan over the period beyond the next twelve months, are classified as non-current in the statement of financial position.
Net realisable value of ore stockpiles is determined with reference to estimated contained gold and market gold prices applicable. Ore stockpiles which are blended together or with future ore mined when fed to the plant are assessed as an input to the gold production process to ensure the combined stockpiles are carried at the lower of cost and net realisable value. Ore stockpiles which are not planned to be blended in production are assessed separately to ensure they are carried at the lower of cost and net realisable value, although no such stockpiles are currently held.
F - 102
Costs of gold inventories include all costs incurred up until production of an ounce of gold such as milling costs, mining costs and directly attributable mine general and administration costs but exclude transport costs, refining costs and royalties. Net realisable value is determined with reference to estimated contained gold and market gold prices.
Stores and materials consist of consumable stores and are valued at weighted average cost after appropriate impairment of redundant and slow moving items. Consumable stock for which the Group has substantially all the risks and rewards of ownership are brought onto the statement of financial position as current assets.
INTEREST/BORROWING COSTS
Interest is recognised on a time proportion basis, taking into account the principal outstanding and the effective rate over the period to maturity. Borrowing cost is expensed as incurred except to the extent that it relates directly to the construction of property, plant and equipment during the time that is required to complete and prepare the asset for its intended use, when it is capitalised as part of property, plant and equipment. Borrowing costs are capitalised as part of the cost of the asset where it is probable that the asset will result in economic benefit and where the borrowing cost can be measured reliably. No interest or borrowing costs have been capitalised during the year or during the prior year.
ROYALTIES
Royalty arrangements based on mineral production are in place at each operating mine. The primary type of royalty is a net smelter return royalty. Under this type of royalty the Group pays the holder an amount calculated as the royalty percentage multiplied by the value of gold production at market gold prices less selling costs. A royalty expense is recorded when revenue from the sale of gold is recognised.
FINANCIAL INSTRUMENTS
Financial instruments are measured as set out below. Financial instruments carried on the statement of financial position include cash and cash equivalents, trade and other receivables, trade and other payables, available for sale financial assets, loans to joint ventures and loans to minorities.
Cash and cash equivalents
Cash and cash equivalents are carried in the statement of financial position at cost. For the purpose of the cash flow statement, cash and cash equivalents comprise cash on hand, deposits held at call with banks, other short term highly liquid investments with a maturity of three months or less at the date of purchase and bank overdrafts. In the statement of financial position, bank overdrafts are included in borrowings in current liabilities.
Trade and other receivables
Trade and other receivables are recognised initially at fair value. There is a rebuttable presumption that the transaction price is fair value unless this could be refuted by reference to market indicators. Subsequently, trade and other receivables are measured at amortised cost using the effective interest method, less provision for impairment. A provision for impairment of trade receivables is established when there is objective evidence that the Company will not be able to collect all amounts due according to the original terms of receivables.
Significant financial difficulties of the debtor, probability that the debtor will enter bankruptcy or financial reorganisation, and default or delinquency in payments are considered indicators that the trade receivable may be impaired. The amount of the provision is the difference between the asset’s carrying amount and the present value of estimated future cash flows, discounted at the effective interest rate.
Value added tax (TVA)
TVA receivables are recognised initially at cost. Subsequently, TVA receivables are measured at amortised cost using the effective interest method, less provision for impairment.
The Group assesses at each reporting period whether there is an indication that these receivables may be impaired taking into account the risk of non-collectability and timing of receipt.
Available-for-sale financial assets
Available-for-sale financial assets are non-derivatives that are either designated in this category or not classified in any of the other categories. Available-for-sale financial assets are designated on acquisition. They are normally included in current assets and are carried at fair value. Where a decline in the fair value of an available-for-sale financial asset constitutes objective evidence of impairment, the amount of the loss is recognised in the statement of comprehensive income within other expenses, other movements in fair value are recognised in other reserves within other comprehensive income.
F - 103
Loans and borrowings (including bank borrowings when applicable, loans from joint venture partners and related companies and finance leases)
Borrowings are recognised initially at fair value, net of transaction costs incurred. Borrowings are subsequently stated at amortised cost; any difference between the proceeds (net of transaction costs) and the redemption value is recognised in the statement of comprehensive income over the period of the borrowings using the effective interest method. Borrowings are classified as current liabilities unless the Company has an unconditional right to defer settlement of the liability for at least 12 months after the statement of financial position date.
Trade and other payables
Accounts payable and other short term monetary liabilities, are initially recognised at fair value, which equates to the transaction price, and subsequently carried
at amortised cost using the effective interest method.
REHABILITATION COSTS
The net present value of estimated future rehabilitation costs is provided for in the financial statements and capitalized within property, plant and equipment on initial recognition. Rehabilitation will generally occur on closure or after closure of a mine. Initial recognition is at the time of the construction or disturbance occurring and thereafter as and when additional construction or disturbances take place. The estimates are reviewed annually to take into account the effects of inflation and changes in estimated risk adjusted rehabilitation works cost and are discounted using rates that reflect the time value of money.
Annual increases in the provision due to the unwinding of the discount are recognized in the statement of comprehensive income as a finance cost. The present value of additional disturbances and changes in the estimate of the rehabilitation liability are recorded to mining assets against an increase/decrease in the rehabilitation provision. The rehabilitation asset is amortized as noted previously. Rehabilitation projects undertaken, included in the estimates, are charged to the provision as incurred. Environmental liabilities, other than rehabilitation costs, which relate to liabilities arising from specific events, are expensed when they are known, probable and may be reasonably estimated.
PROVISIONS
Provisions are recognised when the Company has a present legal or constructive obligation as a result of past events where it is probable that an outflow of resources embodying economic benefits will be required to settle the obligation, and a reliable estimate of the amount of the obligation can be made.
CURRENT TAX
Current tax is the tax expected to be payable on the taxable income for the year calculated using rates (and laws) that have been enacted or substantively enacted by the reporting date. It includes adjustments for tax expected to be payable or recoverable in respect of previous periods.
DEFERRED TAXATION
Deferred tax is provided in full, using the liability method, on temporary differences arising between the tax bases of assets and liabilities and their carrying amounts in the consolidated financial statements. However, if the temporary difference arises from initial recognition of an asset or liability in a transaction other than a business combination that at the time of the transaction affects neither accounting nor taxable profit nor loss, it is not recognised. Deferred tax is determined using tax rates (and laws) that have been enacted or substantively enacted by the statement of financial position date and are expected to apply when the temporary differences reverses. Deferred tax assets are recognised to the extent that it is probable that future taxable profit will be available against which the temporary differences can be utilised. Deferred tax is provided on temporary differences arising on investments in subsidiaries and joint ventures, except where the timing of the reversal of the temporary difference is controlled by the Group and it is probable that the temporary difference will not reverse in the foreseeable future.
SHARE CAPITAL
Ordinary shares are classified as equity. Incremental costs directly attributable to the issue of new shares or options are shown in equity as a deduction from the proceeds.
CONTINGENT LIABILITIES
The Group discloses contingent liabilities when possible obligations exist as a result of past events, unless the possible outflows of economic benefits are considered remote. By their nature, contingencies will often only be resolved when one or more future events occur or fail to occur. The assessment of such contingencies inherently involves the exercise of significant judgement and estimates of the outcome of future events. In certain circumstances, to provide transparency, the Group voluntarily elects to disclose information regarding claims for which any outflow of economic benefit is considered remote.
F - 104
LEASES
As lessee
Determining whether an arrangement is, or contains, a lease is based on the substance of the arrangement and requires an assessment of whether fulfillment of the arrangement is dependent on the use of a specific asset or assets and whether the arrangement conveys a right to use the asset. Leases of plant and equipment where the Company assumes a significant portion of risks and rewards of ownership are classified as a finance lease. Finance leases are capitalised at the estimated present value of the underlying lease payments. Each lease payment is allocated between the liability and the finance charges to achieve a constant rate on the finance balance outstanding. The interest portion of the finance payment is charged to the statement of comprehensive income over the lease period. The plant and equipment acquired under the finance lease are depreciated over the useful lives of the assets, or over the lease term if shorter. Leases in which a significant portion of the risks and rewards of ownership are retained by the lessor are classified as operating leases.
Payments made under operating leases are charged to the statement of comprehensive income on a straight-line basis over the period of the lease.
As lessor
Leases in which a significant portion of the risks and rewards of ownership are retained by the lessor are classified as operating leases. Lease income under operating leases is recognised to the statement of comprehensive income on a straight-line basis over the period of the lease.
Where a significant portion of the risks and rewards of ownership are transferred the Group is required to account as though it were acting as a lessor in a finance lease. Hire purchase loans disclosed under receivables represent outstanding amounts due under finance lease arrangements less finance charges allocated to future periods.
REVENUE RECOGNITION
The Group enters into contracts for the sale of gold. Revenue arising from gold sales under these contracts is recognised when the price is determinable, the product has been delivered in accordance with the terms of the contract, the significant risks and rewards of ownership have been transferred to the customer and collection of the sales price is reasonably assured. These criteria are met when the gold leaves the mines smelt house.
As sales from gold contracts are subject to customer survey adjustment, sales are initially recorded on a provisional basis using the Group’s best estimate of the contained metal. Subsequent adjustments are recorded in revenue to take into account final assay and weight certificates from the refinery, if different from the initial certificates. The differences between the estimated and actual contained gold have historically not been significant.
EXPLORATION AND EVALUATION COSTS
The Group expense all exploration and evaluation expenditures until the directors conclude that a future economic benefit is more likely than not of being realised, i.e. ‘probable’. While the criteria for concluding that expenditure should be capitalised is always probable, the information that the directors use to make that determination depends on the level of exploration.
Exploration and evaluation expenditure on brownfield sites, being those adjacent to mineral deposits which are already being mined or developed, is expensed as incurred until the directors are able to demonstrate that future economic benefits are probable through the completion of a prefeasibility study, after which the expenditure is capitalised as a mine development cost. A ‘prefeasibility study’ consists of a comprehensive study of the viability of a mineral project that has advanced to a stage where the mining method, in the case of underground mining, or the pit configuration, in the case of an open pit, has been established, and which, if an effective method of mineral processing has been determined, includes a financial analysis based on reasonable assumptions of technical, engineering, operating economic factors and the evaluation of other relevant factors. The prefeasibility study, when combined with existing knowledge of the mineral property that is adjacent to mineral deposits that are already being mined or developed, allow the directors to conclude that it is more likely than not that the Group will obtain future economic benefit from the expenditures.
Exploration and evaluation expenditure on greenfield sites, being those where the Group does not have any mineral deposits which are already being mined or developed, is expensed until such time as the directors have sufficient information to determine that future economic benefits are probable, after which the
expenditure is capitalised as a mine development cost. The information required by directors is typically a final feasibility study however a prefeasibility study may be deemed to be sufficient where the additional work required to prepare a final feasibility study is not significant or the work done at prefeasibility level clearly demonstrates an economic asset. Exploration and evaluation expenditure relating to extensions of mineral deposits which are already being mined or developed, including expenditure on the definition of mineralisation of such mineral deposits, is capitalised as a mine development cost following the completion of an economic evaluation equivalent to a prefeasibility study. This economic evaluation is distinguished from a prefeasibility study in that some of the information that would normally be determined in a prefeasibility study is instead obtained from the existing mine or development. This information when combined with existing knowledge of the mineral
F - 105
property already being mined or developed allow the directors to conclude that more likely than not the Company will obtain future economic benefit from the expenditures. Costs relating to property acquisitions are
capitalised within development costs.
DIVIDEND DISTRIBUTION
Dividend distribution to the Company’s shareholders is recognised as a liability in the Group’s financial statements in the period in which the dividends are approved by the board of directors and declared to shareholders.
|
2.
|
KEY ACCOUNTING ESTIMATES AND JUDGEMENTS
|
Some of the accounting policies require the application of significant judgement by management in selecting the appropriate assumptions for calculating financial estimates or determining the appropriate accounting treatment for a transaction.
By their nature, these judgements are subject to an inherent degree of uncertainty and are based on historical experience, terms of existing contracts, management’s view on trends in the gold mining industry and information from outside sources.
The estimates and assumptions that have a significant risk of causing a material adjustment to the carrying amounts of assets and liabilities are discussed below:
VALUE ADDED TAX (TVA)
Included in trade and other receivables (refer to note 11) is a recoverable TVA balance (including recoverable TVA on fuel duty and after discounting provisions) of US$134.5 million (2016: US$131.2 million) (2015: US$137.4 million) owing by the fiscal authorities in the Democratic Republic of Congo (DRC).
The Group continues to seek recovery of TVA in the DRC, in line with the mining code and the carrying value of the receivable has been assessed considering factors such as the level of receipts in the period and to date, relationships and communications with government officials and the tax authority and the limited quantum of disputed submissions. Judgements exist in assessing recovery of these receivables. Whilst the TVA balance is considered collectible uncertainty exists regarding the timing of receipt. Accordingly the receivable has been discounted by US$17.9 million (2016: US$7.8 million) (2015: Nil) which required estimates as to the timing of future receipts based on historical trends and the applicable discount rate thereon. A discount rate of 10% has been applied to the expected cash receipts and 2% applied to the amounts forecasted to be recovered through offsetting. Management have assumed a recoverable period of 48 months with a reduced level of receipts in the next 12 months. The increase in provision reflects an increase in the discount rate to reflect assessed risk and an extension in the recovery period from 18 months to 48 months. A 1% change in the discount rate would increase the provision by US$1.1 million. A 1 year delay to recovery would increase the provision by US$7.8 million.
CARRYING VALUES OF PROPERTY, PLANT AND EQUIPMENT
The Group assesses at each reporting period whether there is any indication that these assets may be impaired (refer to note 8 and 9). If such indication exists, the Group estimates the recoverable amount of the asset. The recoverable amount is assessed by reference to the higher of ‘value in use’ (being the net present value of expected future cash flows of the relevant cash generating unit) and ‘fair value less cost to sell’. The estimates used for impairment reviews are based on detailed mine and operating plans. Future cash flows are based on estimates of:
|
•
|
the quantities of the proven and probable reserves being reserves for which there is a high degree of confidence in economic extraction;
|
|
•
|
future production levels;
|
|
•
|
future commodity prices; including oil forecast at US$70bbl (2016: US$60bbl) (2015: US$60bbl);
|
|
•
|
future cash cost of production and capital expenditure associated with extraction of the proven and probable reserves in the approved mine plan;
|
|
•
|
future gold prices - a gold price curve was used for the impairment calculations starting at a US$1 250/oz gold price (2016: US$1 200oz) (2015: US$1 150/oz) and increasing at an average of 2.5% per annum (2016: 2.0%) (2015: 1.5%). The gold price curve was determined after consideration of a range of forecast techniques and data sources;
|
|
•
|
a discount rate equivalent to 8.2% pre-tax (2016: 7.8%) (2015: 7.9%); and
|
|
•
|
an inflation rate of 2.5% (2016: 2%) (2015: 1.5%).
|
A reduction in forward gold prices in excess of 17.0% or an increase in the discount rate to 18.7% is required to give rise to impairment at the mine. However, having considered such scenarios, the directors remain satisfied that no impairment is appropriate. The model is considered suitably conservative with proven and probable reserves based on a US$1 000/oz gold price (2016: US$1 000/oz) (2015: US$1 000/oz).
F - 106
OPEN CAST MINE STRIPPING
The Group capitalises costs, associated with stripping activity, to expose the orebody, within mining assets. Judgement is required in determining the relevant section or phase of the orebody to which stripping activity relates, based on assessment of factors such as mine planning, geology of the open cast pits and strategic board decisions such as the pushback campaigns which requires judgement over the eligible costs. The Group capitalised US$19.2 million (2016: US$15.2 million) (2015: Nil million) to stripping assets with a net book value of US$12.3 million (2016: US$9.6 million). The capitalised stripping costs relate to two open cast satellite pits, Pakaka and Kombokolo. The Group subsequently depreciates relevant stripping assets as that section of the orebody is mined which requires judgement as to the relevant section of the orebody for depreciation.
CAPITALISATION AND DEPRECIATION
There are several methods that could be adopted for calculating depreciation, i.e. the straight line method, the production method using ounces produced and the production method using tonnes milled. The directors believe that the tonnes milled method is the best indication of plant and infrastructure usage. Refer to note 1 for the depreciation policy. Estimates are required regarding the allocation of assets to relevant proven and probable reserves in the units of production calculations, with assessments involving the Group’s mining, capital and geology departments. Proven and probable reserves are used in each depreciation calculation, which is considered to be a suitably conservative measure of the future ore extractable using existing assets. Expenditure incurred to date in underground infrastructure development considered to have been commissioned, is depreciated over the remaining proven and probable reserves of the underground mine, as the infrastructure provides access to the future mining areas.
The Group applies judgement in allocating costs between operating and capital items in respect of underground mining and in determining the date depreciation commences. Costs are capitalised when the activity provides access to future ore bodies and are expensed as operating costs when the works involve extraction of ore from operational sections of the ore body. The nature of activity is assessed based on information provided by contractors, together with inspections by the Group’s mining teams. Direct labour, materials and other costs are specifically allocated based on the activity performed. Indirect costs that attributable to underground works are allocated between capital and operating expenses based on factors such as development versus operating metres.
Judgement is required in determining the point at which assets under construction at Kibali began commercial production and should be depreciated. Depreciation start dates are determined considering the factors detailed in Note 1 and during 2015 Kibali underground mine assets attributable to production started to be depreciated. The commissioning of the underground happens in phases and as the sections are brought into production the attributable costs are transferred and depreciated. Judgement was applied in identifying the costs considered attributable to this production. Additionally, given ongoing mine construction and development, judgement was required in allocating costs between operating costs, ore stockpiles and ongoing capital works. Costs have been allocated based on the underlying activity and economic benefits.
GOLD PRICE ASSUMPTIONS
The following gold prices were used in the mineral reserves optimisation calculation:
Kibali
2017
2016
2015
US$/oz 1 000 1 000 1 000
Changes in the gold price used could result in changes in the mineral reserve optimisation calculations. Mine modelling is a complex process and hence it is not feasible to perform sensitivities on gold price assumptions in respect of ore reserves.
DETERMINATION OF ORE RESERVES
The Group estimates its ore reserves and mineral resources based on information compiled by Competent Persons as defined in accordance with the Australasian Code for Reporting of Exploration Results, Mineral Resources and Ore Reserves of December 2012 (the 2012 JORC code). Reserves determined in this way are used in the calculation of depreciation, amortisation and impairment charges, as well as the assessment of the carrying value of mining assets. There are numerous uncertainties inherent in estimating ore reserves and assumptions that are valid at the time of estimation may change significantly when new information becomes available. Changes in the forecast prices of commodities, exchange rates, production costs or recovery rates may change the economic status of reserves and may, ultimately, result in the reserves being restated.
FUTURE REHABILITATION OBLIGATIONS
The net present value of current rehabilitation estimates have been discounted to their present value at 2.5% per annum (2016: 2.5%) (2015: 2.25%) being the prevailing risk free interest rates. The majority of expenditure is expected to be incurred at the end of the mine life. The Group undertakes regular assessments by external experts of its mine closure plans, together with assessments by internal staff in the intervening periods, to determine the required rehabilitation works, cost of works and timing of such works. Judgment is required in determining the appropriate costs, timing of costs, discount rates and inflation. For further information,
F - 107
including the carrying amounts of the liabilities, refer to Note 17. A 1% change in the discount rate on the Group’s rehabilitation estimates would result in an impact of US$3.2 million (2016: US$3.2 million) (2015: US$1.8 million) on the provision for environmental rehabilitation, and an impact of US$0.2 million (2016: US$0.2 million) (2015: US$0.05 million) on the statement of comprehensive income.
STOCKPILES, GOLD IN PROCESS AND PRODUCT INVENTORIES
Costs that are incurred in or benefit the productive process are accumulated as stockpiles, gold in process and product inventories. Net realisable value tests are performed at least annually and represent the estimated future sales price of the product based on contained gold and metals prices, less estimated costs to complete production and bring the product to sale. Judgment is required in assessing whether stockpiles of different grades should be tested individually, or tested as inputs to the gold production process, as detailed in the Group’s accounting policy. In the current year, the stockpiles were tested reflecting the planned blended feed of such stockpiles to the mill on the basis that they are blended together and with future ore mined.
Stockpile quantities are measured by estimating the number of tonnes added and removed from the stockpile, the number of contained gold ounces based on assay data, and the estimated recovery percentage based on the expected processing method. Stockpile tonnages are verified by periodic surveys. The forecast gold prices and cost escalators were those used in the impairment test detailed above.
EXPLORATION AND EVALUATION EXPENDITURE
The Group has to apply judgement in determining whether exploration and evaluation expenditure should be capitalised or expensed. Management exercises this judgement based on the results of economic evaluations, prefeasibility or feasibility studies. Costs are capitalised where those studies conclude that more likely than not the Group will obtain future economic benefit from the expenditures.
RECOVERY OF DEFERRED TAX ASSETS
Management have recognised a deferred tax asset of US$43.2 million (2016: US$11.1 million deferred tax liability) (2015: US$41.9 million deferred tax liability). The Group has to apply judgement in determining the recoverable amount of deferred tax assets. Deferred tax assets are recognised to the extent that their utilisation is probable, being based upon whether it is more likely than not that sufficient and suitable taxable profits will be available in the future, against which the reversal of temporary differences can be deducted. The recoverability of the asset has been assessed considering factors such as the underlying assumptions in the life of mine plan, the operating performance of the mine and any restrictions under the DRC tax code.
The Group considers the deferred tax assets to be recoverable owing to the latest life of mine plan which estimates the asset being fully utilised within 3 years. The gold price would have to fall below US$1 040/oz before the tax losses are not utilised
3. OTHER INCOME
|
31 Dec 2017
|
|
31 Dec 2016
|
|
31 Dec 2015
|
|
|||
|
$’000
|
|
$’000
|
|
$’000
|
|
|||
|
Other income from operating activities comprise:
|
||||||||
|
Other income
|
146
|
|
136
|
|
—
|
|
||
|
Net foreign exchange gains
|
—
|
|
—
|
|
1,657
|
|
||
|
146
|
|
|
136
|
|
|
1,657
|
|
|
The total other income is not considered to be part of the main revenue generating activities and as such the group presents this income separately from revenue.
|
31 Dec 2017
|
|
31 Dec 2016
|
|
31 Dec 2015
|
|
|||
|
$’000
|
|
$’000
|
|
$’000
|
|
|||
|
Other expenses
|
||||||||
|
Management Fee
|
4,385
|
|
4,296
|
|
3,658
|
|
||
|
Net foreign exchange loss
|
38,469
|
|
36,134
|
|
—
|
|
||
|
Discounting provision
|
12,177
|
|
7,820
|
|
—
|
|
||
|
55,031
|
|
|
48,250
|
|
|
3,658
|
|
|
The net foreign exchange loss primarily refers to the retranslation of TVA receivables (note 11) denominated in Congolese Francs which is translated into the US dollar functional currency of the subsidiary. The discounting provision movement relates to TVA receivables (refer to note 2).
F - 108
4. MINING AND PROCESSING COSTS
|
31 Dec 2017
|
|
31 Dec 2016
|
|
31 Dec 2015
|
|
|||
|
$’000
|
|
$’000
|
|
$’000
|
|
|||
|
Mining and processing costs comprise:
|
||||||||
|
Mine production costs
|
232,209
|
|
202,323
|
|
177,467
|
|
||
|
Movement in production inventory and ore stockpiles
|
28,933
|
|
(7,389
|
)
|
8,234
|
|
||
|
Depreciation and amortisation
|
264,415
|
|
210,925
|
|
192,509
|
|
||
|
Other mining and processing costs
|
173,423
|
|
188,863
|
|
172,502
|
|
||
|
698,980
|
|
|
594,722
|
|
|
550,712
|
|
|
5. EXPLORATION AND CORPORATE EXPENDITURE
|
31 Dec 2017
|
|
31 Dec 2016
|
|
31 Dec 2015
|
|
|||
|
$’000
|
|
$’000
|
|
$’000
|
|
|||
|
Exploration and corporate expenditure comprise:
|
||||||||
|
Exploration expenditure
|
2,760
|
|
2,748
|
|
3,132
|
|
||
|
Corporate expenditure
|
5,445
|
|
3,650
|
|
1,943
|
|
||
|
Recycling of permanent losses on available-for-sale asset
|
—
|
|
—
|
|
3,173
|
|
||
|
8,205
|
|
|
6,398
|
|
|
8,248
|
|
|
6. FINANCE INCOME AND COSTS
|
31 Dec 2017
|
|
31 Dec 2016
|
|
31 Dec 2015
|
|
|||
|
$’000
|
|
$’000
|
|
$’000
|
|
|||
|
Finance income comprise:
|
||||||||
|
Bank Interest
|
20
|
|
15
|
|
19
|
|
||
|
Interest received – loans and receivables
|
4,127
|
|
4,720
|
|
4,799
|
|
||
|
Total finance income
|
4,147
|
|
|
4,735
|
|
|
4,818
|
|
|
Finance costs comprise:
|
||||||||
|
Interest expense on finance lease
|
(3,931
|
)
|
(4,482
|
)
|
(4,800
|
)
|
||
|
Interest expense on bank borrowings
|
(1,018
|
)
|
(467
|
)
|
(192
|
)
|
||
|
Unwinding of discount on provisions for rehabilitation
|
(529
|
)
|
(349
|
)
|
(384
|
)
|
||
|
Total finance costs
|
(5,478
|
)
|
|
(5,298
|
)
|
|
(5,376
|
)
|
|
Net finance costs
|
(1,331
|
)
|
|
(563
|
)
|
|
(558
|
)
|
7. INCOME TAXES
|
31 Dec 2017
|
|
31 Dec 2016
|
|
31 Dec 2015
|
|
||||
|
$’000
|
|
$’000
|
|
$’000
|
|
||||
|
Current taxation
|
—
|
|
7,868
|
|
8,377
|
|
|||
|
Deferred taxation
|
10
|
(54,333
|
)
|
(30,830
|
)
|
9,463
|
|
||
|
(54,333
|
)
|
|
(22,962
|
)
|
|
17,840
|
|
||
The tax on the group’s profit before tax differs from the theoretical amount that would arise using the statutory tax rate applicable to the Group’s operations.
F - 109
|
31 Dec 2017
|
|
31 Dec 2016
|
|
31 Dec 2015
|
|
|||
|
$’000
|
|
$’000
|
|
$’000
|
|
|||
|
(Loss) Profit before tax
|
(40,349
|
)
|
26,728
|
|
155,825
|
|
||
|
Tax calculated at the DRC effective tax rate of 30%
|
(12,105
|
)
|
8,018
|
|
46,748
|
|
||
|
Reconciling items:
|
||||||||
|
Exempt income
|
(40,948
|
)
|
(38,922
|
)
|
(34,218
|
)
|
||
|
Net capital allowances not deductible
|
—
|
|
—
|
|
(157
|
)
|
||
|
Other permanent differences
|
(1,280
|
)
|
74
|
|
(2,910
|
)
|
||
|
Corporate tax at 1/100 from revenue
|
—
|
|
7,868
|
|
8,377
|
|
||
|
Taxation (credit) / charges
|
(54,333
|
)
|
|
(22,962
|
)
|
|
17,840
|
|
Kibali (Jersey) Limited is subject to an income tax rate in Jersey at 0%. In the DRC, Kibali is subject to corporation tax at 30%. The mine has historically been required to pay a minimum of 1/100 of the Company’s revenue as tax. Whilst the mine paid these amounts it has always disputed that the tax should be applied to mining companies. During 2017, the mine received confirmation from the tax authority that no minimum tax applies and therefore no minimum tax has been recorded in 2017 (2016: US$7.9 million) (2015: US$8.4 million). The Group is seeking recovery of past taxes of US$13.3 million but no asset has been recognised as there is currently insufficient certainty of recovery due to an ongoing dispute. Kibali have capital allowances for deduction against future mining income. Kibali (Jersey) Limited’s estimated tax losses carried forward at 31 December 2017 amounted to US$520.5 million (2016: US$359.4 million) (2015: US$293.0 million) at the tax rate of 30%.
8. PROPERTY, PLANT AND EQUIPMENT
|
31 Dec 2017
|
|
31 Dec 2016
|
|
31 Dec 2015
|
|
|||
|
$’000
|
|
$’000
|
|
$’000
|
|
|||
|
Mine properties, mine development costs and mine plant facilities and equipment cost
|
||||||||
|
Cost
|
||||||||
|
Balance at the beginning of the year
|
2,475,924
|
|
2,266,854
|
|
1,989,757
|
|
||
|
Additions
|
246,406
|
|
209,070
|
|
277,097
|
|
||
|
Balance at the end of the year
|
2,722,330
|
|
2,475,924
|
|
2,266,854
|
|
||
|
Accumulated depreciation
|
||||||||
|
Balance at the beginning of the year
|
(407,617
|
)
|
(254,551
|
)
|
(121,620
|
)
|
||
|
Depreciation charged for the year
|
(206,995
|
)
|
(153,067
|
)
|
(132,931
|
)
|
||
|
Balance at the end of the year
|
(614,612
|
)
|
(407,618
|
)
|
(254,551
|
)
|
||
|
Net book value
|
2,107,718
|
|
2,068,306
|
|
2,012,303
|
|
||
Long-lived assets and development costs
Included in plant and equipment are long-lived assets and development costs which are amortised on a units of production basis as detailed in note 2 and include mining properties, such as processing plants, tailings facilities, raw water dams and power stations, as well as mine development costs. The net book value of these assets was US$2 023 million at 31 December 2017 (2016: US$1 997 million) (2015: US$1 939.6 million). The value of assets under construction included in plant and equipment that are not depreciated is US$229.9 million (2016: US$507.0 million) (2015: US$454.3 million). Refer to note 2 for judgements applied in regards to stripping assets.
Short-lived assets
Included in property, plant and equipment are short-lived assets which are depreciated over a short life which reflects their likely useful economic life and are comprised of motor vehicles, computer equipment, aircrafts and fixtures and fittings. The net book value of these assets was US$51.6 million at 31 December 2017 (2016: US$7.9 million) (2015: US$5.8 million). The movement in the period occurred as a result of the reclassification of the net book value of certain assets from long-lived to short-lived assets based on a reassessment of their remaining useful economic life.
Rehabilitation asset
A rehabilitation asset has been recognised relating to the rehabilitation liability to the value of US$17.2 million (2016: US$17.1 million) (2015: US$13.0 million) (refer to note 17). Depreciation of the rehabilitation asset began on 1 October 2013 when the Group commenced commercial production. The asset is depreciated over the life of the mine on a unit of production basis.
F - 110
Leased assets
The net carrying amount of property, plant and equipment includes the following amount in respect of assets held under finance lease (refer to note 19):
|
31 Dec 2017
|
|
31 Dec 2016
|
|
31 Dec 2015
|
|
|||
|
$’000
|
|
$’000
|
|
$’000
|
|
|||
|
Finance Lease Mining Assets
|
16,627
|
|
46,153
|
|
53,908
|
|
||
KAS 1 Limited (KAS) is an asset leasing joint venture in which the Group has a 50.1% interest. Together with Bougues Traveux Publics (BYTP), the Group provides funding to KAS to buy the assets and in return leases the assets under a finance lease to Kibali, a subsidiary of the Group. During the period Management have reassessed the remaining useful economic life of certain KAS assets which resulted in an accelerated depreciation charge. Refer to notes 19, 25 and 26.
F - 111
9. MINERAL PROPERTIES
|
31 Dec 2017
|
|
31 Dec 2016
|
|
31 Dec 2015
|
|
|||
|
$’000
|
|
$’000
|
|
$’000
|
|
|||
|
Cost
|
||||||||
|
At the beginning and end of the year
|
745,092
|
|
745,092
|
|
745,092
|
|
||
|
Amortisation
|
||||||||
|
At the beginning of the year
|
(168,556
|
)
|
(110,698
|
)
|
(51,120
|
)
|
||
|
Charge for the year
|
(57,419
|
)
|
(57,858
|
)
|
(59,578
|
)
|
||
|
At the end of the year
|
(225,975
|
)
|
(168,556
|
)
|
(110,698
|
)
|
||
|
Net book value
|
519,117
|
|
|
576,536
|
|
|
634,394
|
|
Mineral properties represent the amounts attributable to licence interest on the purchase of Moto Goldmines Limited (“Moto”) in 2009. The balance has been amortised over the life of mine on a unit of production basis since the Group commenced commercial production on 1 October 2013.
10. DEFERRED TAXATION
|
31 Dec 2017
|
|
31 Dec 2016
|
|
31 Dec 2015
|
|
|||||
|
$’000
|
|
$’000
|
|
$’000
|
|
|||||
|
Deferred taxation is calculated on temporary differences under the liability method using a tax rate of 30% in respect of the DRC operations.
|
||||||||||
|
The movement on deferred taxation is as follows:
|
||||||||||
|
At the beginning of the year
|
(11,096
|
)
|
(41,926
|
)
|
(32,463
|
)
|
||||
|
Statement of comprehensive income charge
|
54,333
|
|
30,830
|
|
(9,463
|
)
|
||||
|
At the end of the year
|
43,237
|
|
|
|
(11,096
|
)
|
|
|
(41,926
|
)
|
|
Deferred taxation comprise the following:
|
||||||||||
|
Tax losses carried forward attributable to accelerated capital allowances
|
520,526
|
|
359,449
|
|
292,981
|
|
||||
|
Accelerated capital allowances
|
(477,289
|
)
|
(370,545
|
)
|
(334,907
|
)
|
||||
|
Net deferred taxation (liability)/asset
|
43,237
|
|
—
|
|
(11,096
|
)
|
—
|
|
(41,926
|
)
|
11. TRADE AND OTHER RECEIVABLES
|
31 Dec 2017
|
|
31 Dec 2016
|
|
31 Dec 2015
|
|
|||
|
$’000
|
|
$’000
|
|
$’000
|
|
|||
|
Advances to contractors
|
2,280
|
|
6,070
|
|
5,238
|
|
||
|
Trade receivables
|
28,295
|
|
1,497
|
|
850
|
|
||
|
Prepayments and other receivables
|
21,544
|
|
24,239
|
|
37,501
|
|
||
|
Loan to SOKIMO (refer note 26)
|
18,827
|
|
17,381
|
|
16,046
|
|
||
|
Other loans
|
8,360
|
|
3,081
|
|
5,231
|
|
||
|
TVA receivables
|
134,514
|
|
131,214
|
|
137,369
|
|
||
|
Hire purchase loans
|
4,465
|
|
10,978
|
|
11,277
|
|
||
|
218,285
|
|
|
194,460
|
|
|
213,512
|
|
|
|
Less: Non-current portion
|
||||||||
|
Loan to SOKIMO
|
18,827
|
|
17,381
|
|
16,046
|
|
||
|
Other loans and receivables (including TVA receivables)
|
105,768
|
|
65,616
|
|
10,445
|
|
||
|
Hire purchase loans
|
699
|
|
4,438
|
|
6,297
|
|
||
|
125,294
|
|
|
87,435
|
|
|
32,788
|
|
|
|
Current portion
|
92,991
|
|
|
107,025
|
|
|
180,724
|
|
F - 112
|
31 Dec 2017
|
|
31 Dec 2016
|
|
31 Dec 2015
|
|
|||
|
$’000
|
|
$’000
|
|
$’000
|
|
|||
|
Gross hire purchase loans – minimum lease payments:
|
||||||||
|
No later than 1 year
|
3,766
|
|
6,540
|
|
4,980
|
|
||
|
Later than 1 year and no later than 5 years
|
699
|
|
4,438
|
|
6,297
|
|
||
|
Later than 5 years
|
—
|
|
—
|
|
—
|
|
||
|
Gross investment on hire purchase loans
|
4,465
|
|
|
10,978
|
|
|
11,277
|
|
The fair values of trade and other receivables classified as loans and receivables are approximate to the carrying value.
The classes within trade and other receivables do not contain impaired assets however TVA receivables and TVA and duties on fuel balances have been discounted with a provision of US$17.9 million (2016: US$7.8 million) (2015: Nil) recognised. The credit quality of receivables that are not past due or impaired remains very high. The maximum exposure to credit risk at the reporting date is the fair value of each class of receivable mentioned above. The Company does not hold any collateral as security. Refer to note 21 for further information on the concentration of credit risk.
The terms of payment of trade receivables is less than seven days, advances to contractors 30 days and TVA is recoverable under the mining code once submissions are approved. The Group continues to seek recovery of TVA in line with the mining code. Judgement exists in assessing recovery of this amount. See note 2 for further detail.
The loan to SOKIMO bears interest at 8% and the loan and interest will be repaid through future dividends.
The hire purchase loans, receivable from a contractor, bear interest at the aggregate of 10% and the Federal Reserve Rate of 0.75%. The hire purchase loans are repayable over 3 years.
The balance of “other loans” includes loans to related parties of US$0.9 million (2016: US$ 1.1 million) (2015: Nil), these loans have no terms of repayment. Refer to note 26 for further details. All non-current receivables are due after 12 months.
12. INVENTORIES AND ORE STOCKPILES
|
31 Dec 2017
|
|
31 Dec 2016
|
|
31 Dec 2015
|
|
|||
|
$’000
|
|
$’000
|
|
$’000
|
|
|||
|
Gold on hand
|
8,970
|
|
16,041
|
|
5,385
|
|
||
|
Consumables stores
|
43,728
|
|
43,363
|
|
39,782
|
|
||
|
Ore stockpiles
|
29,869
|
|
52,332
|
|
70,874
|
|
||
|
Gold in process
|
3,443
|
|
4,540
|
|
5,719
|
|
||
|
86,010
|
|
|
116,276
|
|
|
121,760
|
|
|
|
Less: Non-current portion
|
||||||||
|
Ore stockpiles
|
12,779
|
|
43,771
|
|
43,162
|
|
||
|
Current portion
|
73,231
|
|
|
72,505
|
|
|
78,598
|
|
All inventory and ore stockpiles are stated at the lower of cost or net realisable value.
Non-current ore stockpiles reflect ore tonnes not planned to be processed within the next 12 months.
13. AVAILABLE-FOR-SALE FINANCIAL ASSET
|
31 Dec 2017
|
|
31 Dec 2016
|
|
31 Dec 2015
|
|
|||
|
$’000
|
|
$’000
|
|
$’000
|
|
|||
|
Balance at the beginning of the year
|
58
|
|
45
|
|
74
|
|
||
|
Fair value movement recognised in other comprehensive income
|
(34
|
)
|
12
|
|
(20
|
)
|
||
|
Exchange gain/(loss)
|
2
|
|
1
|
|
(9
|
)
|
||
|
Balance at the end of the year
|
26
|
|
|
58
|
|
|
45
|
|
F - 113
14. SHARE CAPITAL AND PREMIUM
The total authorised number of ordinary shares is 10,000 (2016: 10,000) (2015: 10,000) for the total value of US$10 000 (2015: US$10 000) (2014: US$10 000). All issued shares are fully paid. The total number of issued shares at 31 December 2017 was 4 648 shares (2016: 4 620) (2015: 4 620).
Randgold Resources Limited (Randgold) and AngloGold Ashanti Limited (AngloGold Ashanti) are joint venture partners and shareholders of Kibali (Jersey) Limited, having acquired all 4 648 outstanding ordinary shares. In the financial year Randgold and AngloGold Ashanti each purchased 14 ordinary shares to the value of US$15 million (Total value of US$30 million). These shares were acquired at a price of US$1 071 428.57 per share in May 2017.
Refer to the Consolidated Statements of Changes in Equity on page 6 for more detail on the annual movement of share capital and share premium. No movement in share capital for the shares issued above is shown due to rounding.
|
31 Dec 2017
|
|
31 Dec 2016
|
|
31 Dec 2015
|
|
|||
|
$’000
|
|
$’000
|
|
$’000
|
|
|||
|
Movement in the number of ordinary shares outstanding:
|
||||||||
|
Balance at the beginning of the year
|
5
|
|
5
|
|
5
|
|
||
|
Shares issued
|
—
|
|
—
|
|
—
|
|
||
|
Balance at the end of the year
|
5
|
|
|
5
|
|
|
5
|
|
15. NON-CONTROLLING INTEREST
|
31 Dec 2017
|
|
31 Dec 2016
|
|
31 Dec 2015
|
|
|||
|
$’000
|
|
$’000
|
|
$’000
|
|
|||
|
Balance at the beginning of the year
|
19,777
|
|
27,624
|
|
25,522
|
|
||
|
Non-controlling interest in results of Kibali Goldmines SA
|
(12,357
|
)
|
(7,847
|
)
|
2,102
|
|
||
|
Balance at the end of the year
|
7,420
|
|
|
19,777
|
|
|
27,624
|
|
The non-controlling interest represents the 10% interest SOKIMO has in Kibali Goldmines SA which is a subsidiary of Kibali (Jersey) Limited.
16. LOANS AND BORROWINGS
|
31 Dec 2017
|
|
31 Dec 2016
|
|
31 Dec 2015
|
|
|||
|
$’000
|
|
$’000
|
|
$’000
|
|
|||
|
Non-current
|
||||||||
|
Finance lease liability (refer to note 19)
|
40,350
|
|
46,707
|
|
51,530
|
|
||
|
Loan – Randgold (refer to note 26)
|
860
|
|
222
|
|
217
|
|
||
|
41,210
|
|
|
46,929
|
|
|
51,747
|
|
|
|
Current
|
||||||||
|
Finance lease liability (refer to note 19)
|
7,596
|
|
8,310
|
|
8,223
|
|
||
|
Loan – Randgold (refer to note 26)
|
—
|
|
1,975
|
|
1,585
|
|
||
|
7,596
|
|
|
10,285
|
|
|
9,808
|
|
|
|
Total loans and borrowings
|
48,806
|
|
|
57,214
|
|
|
61,555
|
|
Finance lease liability
The finance lease liability is due to KAS in respect of the equipment which has been transferred to the Group under an instalment sale agreement. The finance lease liability is interest bearing at 8% and is to be reduced by rental payments monthly as agreed in the instalment sale agreement. The finance lease is secured by the leased assets. Refer to note 8 for finance lease asset disclosures.
Loan – Randgold
Randgold, a joint venture partner and operator of the Kibali gold mine, incurs management fees and other expenses as part of its role as operator of the mine on behalf of the Group. The loan bears no interest and is repayable on a monthly basis. The non-current portion bears no interest but the effect of discounting is non-significant.
F - 114
17. PROVISION FOR REHABILITATION
|
31 Dec 2017
|
|
31 Dec 2016
|
|
31 Dec 2015
|
|
|||
|
$’000
|
|
$’000
|
|
$’000
|
|
|||
|
Balance at the beginning of the year
|
21,163
|
|
15,533
|
|
15,341
|
|
||
|
Unwinding of discount
|
529
|
|
349
|
|
384
|
|
||
|
Change in estimates
|
1,552
|
|
5,281
|
|
(192
|
)
|
||
|
Balance at the end of the year
|
23,244
|
|
|
21,163
|
|
|
15,533
|
|
The provisions for rehabilitation costs include estimates for the effect of inflation and changes in estimates and have been discounted to their present value at 2.5% (2016: 2.5%) (2015: 2.25%) per annum, being an estimate equivalent to the risk free rate determined with reference to US government bonds with maturity dates comparable to the estimated rehabilitation of the mines.
The estimated cash costs of rehabilitation are risk adjusted. Management have based the provision for environmental rehabilitation on standards set by the World Bank, which require an environmental management plan, an annual environmental report, a closure plan, an up-to-date register of plans of the facility, preservation of public safety on closure, carrying out rehabilitation works and ensuring sufficient funds exist for the closure works. However, it is reasonably possible that the estimate of its ultimate rehabilitation liability could change as a result of changes in regulations or cost estimates. The Group is committed to rehabilitation of its property. It makes use of independent environmental consultants for advice and it also uses past experience in similar situations to ensure that the provision for rehabilitation is adequate. The current Life of Mine (LOM) plan envisages the majority of the expected outflow to occur at the end of the LOM which, at the date of these accounts, is 2032 for the Kibali gold mine.
18. TRADE AND OTHER PAYABLES
|
31 Dec 2017
|
|
31 Dec 2016
|
|
31 Dec 2015
|
|
|||
|
$’000
|
|
$’000
|
|
$’000
|
|
|||
|
Trade payables
|
46,060
|
|
57,590
|
|
61,193
|
|
||
|
Payroll and other compensations
|
1,908
|
|
1,813
|
|
2,240
|
|
||
|
Bank account in overdraft
|
12,762
|
|
11,551
|
|
7,346
|
|
||
|
Accruals and other payables
|
43,903
|
|
60,905
|
|
46,304
|
|
||
|
104,633
|
|
|
131,859
|
|
|
117,083
|
|
|
Accruals and other payables include retention, in respect of contracts with suppliers, of US$8.3 million (2016: US$17.9 million) (2015: US$16.0 million). Accruals and other payables include Nil (2016: US$8.0 million) (2015: Nil) in respect of dividends declared but unpaid.
Trade and other payables are all due within a 120 days maximum.
19. LEASES
The finance lease liability recognised is in respect of mining vehicles which have been used in excavation and hauling of waste rock and ore under an instalment sale agreement.
The lease liability is effectively secured as the rights to the leased asset revert to the lessor in the event of default.
F - 115
|
31 Dec 2017
|
|
31 Dec 2016
|
|
31 Dec 2015
|
|
|||
|
$’000
|
|
$’000
|
|
$’000
|
|
|||
|
Gross finance lease liabilities – minimum lease payments:
|
||||||||
|
No later than 1 year
|
11,042
|
|
12,979
|
|
12,100
|
|
||
|
Later than 1 year and no later than 5 years
|
39,872
|
|
42,239
|
|
52,968
|
|
||
|
Later than 5 years
|
6,694
|
|
13,344
|
|
13,381
|
|
||
|
Future finance charges
|
(9,662
|
)
|
(13,545
|
)
|
(18,696
|
)
|
||
|
Present value of the finance lease liability
|
47,946
|
|
|
55,017
|
|
|
59,753
|
|
|
No later than 1 year
|
7,596
|
|
8,310
|
|
8,223
|
|
||
|
Later than 1 year and no later than 5 years
|
32,618
|
|
32,853
|
|
38,858
|
|
||
|
Later than 5 years
|
7,732
|
|
13,854
|
|
12,672
|
|
||
|
47,946
|
|
|
55,017
|
|
|
59,753
|
|
|
20. SEGMENTAL INFORMATION
Operating segments have been identified on the basis of internal reports about components of the Group that are regularly reviewed by the Group’s chief operating decision maker. The operating segments included in the internal reports are determined on the basis of their significance to the Group. In particular, the operating mine is reported as a separate segment. KAS is included within the corporate segment. The Group’s chief operating decision maker is considered by management to be the board of directors. An analysis of the Group’s business segments, excluding intergroup transactions, is set out below. Major customers are not identifiable because all gold is sold through an agent.
F - 116
|
Country of operation
|
DRC
|
Jersey
|
|||||||||
|
$’000
|
Kibali
|
Corporate
|
Intercompany
eliminations
and
consolidation
entries
|
Total
|
|||||||
|
Year ended 31 December 2017
|
|||||||||||
|
Profit and loss
|
|||||||||||
|
Total revenue
|
754,852
|
|
—
|
|
—
|
|
754,852
|
|
|||
|
Mining and processing costs excluding depreciation
|
(436,054
|
)
|
—
|
|
1,489
|
|
(434,565
|
)
|
|||
|
Depreciation and amortisation
|
(240,346
|
)
|
(2,494
|
)
|
(21,575
|
)
|
(264,415
|
)
|
|||
|
Mining and processing costs
|
(676,400
|
)
|
|
(2,494
|
)
|
|
(20,086
|
)
|
|
(698,980
|
)
|
|
Royalties
|
(31,913
|
)
|
—
|
|
—
|
|
(31,913
|
)
|
|||
|
Exploration and corporate expenditure
|
(7,089
|
)
|
(1,116
|
)
|
—
|
|
(8,205
|
)
|
|||
|
Other (expenses)/income and JV profit
|
(54,041
|
)
|
758
|
|
(1,489
|
)
|
(54,772
|
)
|
|||
|
Finance costs
|
(163,730
|
)
|
—
|
|
158,252
|
|
(5,478
|
)
|
|||
|
Finance income
|
1,464
|
|
13,861
|
|
(11,178
|
)
|
4,147
|
|
|||
|
(Loss)/profit before income tax
|
(176,857
|
)
|
|
11,009
|
|
|
125,499
|
|
|
(40,349
|
)
|
|
Income tax expense
|
54,333
|
|
—
|
|
—
|
|
54,333
|
|
|||
|
Net (loss) / profit for the year
|
(122,524
|
)
|
|
11,009
|
|
|
125,499
|
|
|
13,984
|
|
|
Capital expenditure
|
246,406
|
|
—
|
|
—
|
|
246,406
|
|
|||
|
Total assets
|
2,969,999
|
|
9,514,687
|
|
(9,481,173
|
)
|
3,003,513
|
|
|||
|
Total liabilities
|
(3,093,485
|
)
|
(5,778,281
|
)
|
8,693,091
|
|
(178,675
|
)
|
|||
|
Year ended 31 December 2016
|
|||||||||||
|
Profit and loss
|
|||||||||||
|
Total revenue
|
709,372
|
|
—
|
|
—
|
|
709,372
|
|
|||
|
Mining and processing costs excluding depreciation
|
(385,295
|
)
|
—
|
|
1,498
|
|
(383,797
|
)
|
|||
|
Depreciation and amortisation
|
(186,124
|
)
|
(2,165
|
)
|
(22,636
|
)
|
(210,925
|
)
|
|||
|
Mining and processing costs
|
(571,419
|
)
|
|
(2,165
|
)
|
|
(21,138
|
)
|
|
(594,722
|
)
|
|
Royalties
|
(32,976
|
)
|
—
|
|
—
|
|
(32,976
|
)
|
|||
|
Exploration and corporate expenditure
|
(6,270
|
)
|
(128
|
)
|
—
|
|
(6,398
|
)
|
|||
|
Other (expenses)/income and JV profit
|
(47,200
|
)
|
(713
|
)
|
(72
|
)
|
(47,985
|
)
|
|||
|
Finance costs
|
(154,288
|
)
|
—
|
|
148,990
|
|
(5,298
|
)
|
|||
|
Finance income
|
1,345
|
|
14,599
|
|
(11,209
|
)
|
4,735
|
|
|||
|
(Loss) /profit before income tax
|
(101,436
|
)
|
|
11,593
|
|
|
116,571
|
|
|
26,728
|
|
|
Income tax expense
|
22,962
|
|
—
|
|
—
|
|
22,962
|
|
|||
|
Net (loss)/profit for the year
|
(78,474
|
)
|
|
11,593
|
|
|
116,571
|
|
|
49,690
|
|
|
Capital expenditure
|
208,708
|
|
362
|
|
—
|
|
209,070
|
|
|||
|
Total assets
|
2,790,160
|
|
6,852,741
|
|
(6,639,428
|
)
|
3,003,473
|
|
|||
|
Total liabilities
|
(2,515,598
|
)
|
(3,339,052
|
)
|
6,077,236
|
|
(222,586
|
)
|
|||
|
Year ended 31 December 2015
|
|||||||||||
|
Profit and loss
|
|||||||||||
|
Total revenue
|
747,272
|
|
—
|
|
—
|
|
747,272
|
|
|||
|
Mining and processing costs excluding depreciation
|
(358,872
|
)
|
—
|
|
669
|
|
(358,203
|
)
|
|||
|
Depreciation and amortisation
|
(160,900
|
)
|
(2,055
|
)
|
(29,554
|
)
|
(192,509
|
)
|
|||
|
Mining and processing costs
|
(519,772
|
)
|
|
(2,055
|
)
|
|
(28,885
|
)
|
|
(550,712
|
)
|
|
Royalties
|
(30,196
|
)
|
—
|
|
—
|
|
(30,196
|
)
|
|||
|
Exploration and corporate expenditure
|
(4,211
|
)
|
(4,037
|
)
|
—
|
|
(8,248
|
)
|
|||
|
Other (expenses)/income and JV profit
|
(2,861
|
)
|
161
|
|
967
|
|
(1,733
|
)
|
|||
|
Finance costs
|
(149,710
|
)
|
—
|
|
144,334
|
|
(5,376
|
)
|
|||
|
Finance income
|
1,245
|
|
14,750
|
|
(11,177
|
)
|
4,818
|
|
|||
|
Profit before income tax
|
41,767
|
|
|
8,819
|
|
|
105,239
|
|
|
155,825
|
|
|
Income tax expense
|
(20,750
|
)
|
—
|
|
2,910
|
|
(17 840
|
|
|||
|
Net profit for the year
|
21,017
|
|
|
8,819
|
|
|
108,149
|
|
|
137,985
|
|
|
Capital expenditure
|
274,952
|
|
2,145
|
|
—
|
|
277,097
|
|
|||
|
Total assets
|
2,713,792
|
|
6,572,090
|
|
(6,251,120
|
)
|
3,034,762
|
|
|||
|
Total liabilities
|
(2,654,254
|
)
|
(3,197,100
|
)
|
5,607,776
|
|
(243,578
|
)
|
|||
F - 117
21. FINANCIAL RISK MANAGEMENT
In the normal course of its operations, the Group is exposed to gold price, currency, interest rate, credit and liquidity risks. In order to manage these risks, the Group may enter into transactions which make use of on-balance sheet derivatives, but none were entered into in the current year. The Group does not acquire, hold or issue derivatives for trading purposes. The Group has developed a risk management process to facilitate, control and monitor these risks.
Foreign exchange and commodity price risk
In the normal course of business, the Group enters into transactions denominated in foreign currencies (primarily Euro, British Pound, South African Rand, Congolese Franc and Australian Dollar). As a result, the Group is subject to exposure from fluctuations in foreign currency exchange rates. In general, the Group does not enter into derivatives to manage these currency risks and none existed in 2017, 2016 or 2015. Generally, the Group does not hedge its exposure to gold price fluctuation risk and gold was sold at market spot prices in 2017, 2016 and 2015. Gold sales are made in US dollars and do not expose the Group to any currency fluctuation risk. The Group is also exposed to fluctuations in the price of consumables, such as fuel, steel, rubber, cyanide and lime, mainly due to changes in the price of oil, as well as fluctuations in exchange rates.
|
31 Dec 2017
|
|
31 Dec 2016
|
|
31 Dec 2015
|
|
|||
|
$’000
|
|
$’000
|
|
$’000
|
|
|||
|
Level of exposure of foreign currency risk carrying value of foreign currency balances.
Cash and cash equivalents includes balances denominated in:
|
||||||||
|
•
Congolese Franc (CDF)
|
28
|
|
249
|
|
71
|
|
||
|
• Euro (EUR)
|
297
|
|
17
|
|
47
|
|
||
|
• South African rand (ZAR)
|
65
|
|
758
|
|
17
|
|
||
|
• British pound (GBP)
|
3
|
|
55
|
|
4
|
|
||
|
• Australian Dollar (AUD)
|
402
|
|
369
|
|
363
|
|
||
|
Trade and other receivables includes balances denominated in:
|
||||||||
|
• Congolese Franc (CDF)
|
4
|
|
5
|
|
—
|
|
||
|
• Euro (EUR)
|
—
|
|
—
|
|
306
|
|
||
|
• South African rand (ZAR)
|
—
|
|
—
|
|
298
|
|
||
|
• British pound (GBP)
|
—
|
|
—
|
|
1
|
|
||
|
• Australian Dollar (AUD)
|
—
|
|
—
|
|
—
|
|
||
|
Trade and other payables includes balances denominated in:
|
||||||||
|
• Euro (EUR)
|
(284
|
)
|
(825
|
)
|
(772
|
)
|
||
|
• South African rand (ZAR)
|
(1,003
|
)
|
(671
|
)
|
(2,567
|
)
|
||
|
• British pound (GBP)
|
(2
|
)
|
—
|
|
(3
|
)
|
||
|
• Australian Dollar (AUD)
|
(87
|
)
|
(193
|
)
|
(191
|
)
|
||
The Group’s exposure to foreign currency arises where a Company holds monetary assets and liabilities denominated in a currency different to the functional currency of the holder of the instrument which is the US dollar. The following table shows the impact of a 10% change in the US dollar on profit and equity arising as a result of the revaluation of the Group’s foreign currency financial instruments. The TVA balance is denominated in CDF and while not a financial instrument under IFRS 7 a movement of 10% in the year end rate would have an effect of US$12.2 million on the receivable.
F - 118
|
Closing
exchange rate
|
|
Effect of 10%
strengthening of US$’000
on net earnings and equity
|
|
||
|
At 31 December 2017
|
|||||
|
•
Euro (EUR)
|
0.83382
|
|
(28
|
)
|
|
|
•
South African rand (ZAR)
|
12.34503
|
|
(100
|
)
|
|
|
At 31 December 2016
|
|||||
|
• Euro (EUR)
|
0.94868
|
|
(83
|
)
|
|
|
• South African rand (ZAR)
|
13.71502
|
|
(67
|
)
|
|
|
At 31 December 2015
|
|||||
|
• Euro (EUR)
|
0.91525
|
|
(47
|
)
|
|
|
• South African rand (ZAR)
|
15.45369
|
|
(204
|
)
|
|
The sensitivities are based on financial assets and liabilities held at 31 December 2017 where balances were not denominated in the functional currency of the Group. The sensitivities do not take into account the Group’s income and costs and the results of the sensitivities could change due to other factors such as changes in the value of financial assets and liabilities as a result of non-foreign exchange influenced factors.
Interest rate and liquidity risk
Fluctuations in interest rates impact on the value of short term cash investments, interest receivable on hire purchase loans and interest payable on financing activities, giving rise to interest rate risk. The Group funds working capital and capital expenditure requirements with operating cash flows. The drawdowns of any funds are subject to the approval of the Annual budget and Business plan by the board of directors.
The Group has in the past been able to actively source financing through shareholder loans. The finance lease entered into bears a fixed rate of interest.
The directors believe that the working capital resources, by way of internal sources and banking facilities, are sufficient to the Group’s currently foreseeable future business requirements.
|
Amount
$’000
|
|
Effective rate
for year%
|
|
|
Cash and cash equivalents:
|
|||
|
All less than 90 days
|
3,288
|
|
0.08
|
Concentration of credit risk
The Group’s cash balances do not give rise to a concentration of credit risk because it deals with a variety of major financial institutions. Its receivables are regularly monitored and assessed. Receivables are impaired when it is probable that amounts outstanding are not recoverable as set out in the accounting policy note for receivables. Gold doré, the Group’s principal product, is produced in the DRC. The gold doré is refined and sold through the largest accredited gold refinery in the world. Credit risk is further managed by regularly reviewing the financial statements of the refinery. The Group is further not exposed to significant credit risk on gold sales, as cash is received within a few days of the sale taking place. While not a financial asset for IFRS 7, included in receivables is a TVA balance (including recoverable TVA on fuel duty and after discounting provisions) of US$134.5 million (2016: US$131.0 million; 2015: US$137.0 million) (refer to note 11) that was past due. Refer to note 2. This could result in credit risk for the Group.
Capital risk management
The Group’s objectives when managing capital are to safeguard its ability to continue as a going concern in order to provide future returns for shareholders and benefits for other stakeholders and to maintain an optimal capital structure to reduce the cost of capital. In order to maintain or adjust the capital structure, the Group issue new shares (by way of funding from the joint venture partners) or will make use of intercompany loans. The Group monitors capital on the basis of the gearing ratio. This ratio is calculated as net borrowings and trade and other payables (less cash) divided by total capital. Total capital is calculated as equity, as shown in the statement of financial position, plus net borrowings and trade and other payables (less cash). This measure may differ to other companies.
F - 119
|
31 Dec 2017
|
|
31 Dec 2016
|
|
31 Dec 2015
|
|
|||
|
$’000
|
|
$’000
|
|
$’000
|
|
|||
|
Capital risk management
|
||||||||
|
Borrowings and trade and other payables
|
153,439
|
|
189,073
|
|
178,638
|
|
||
|
Less: cash and cash equivalents
|
(3,288
|
)
|
(18,865
|
)
|
(21,373
|
)
|
||
|
Net debt
|
150,151
|
|
170,208
|
|
157,265
|
|
||
|
Total equity
|
2,824,838
|
|
2,780,887
|
|
2,791,184
|
|
||
|
Total capital
|
2,974,988
|
|
2,915,095
|
|
2,948,449
|
|
||
|
Gearing ratio
|
5
|
%
|
6
|
%
|
5
|
%
|
||
Maturity analysis
The following table analyses the Group’s financial liabilities into the relevant maturity groupings based on the remaining period from the Statement of Financial Position to the contractual maturity date.
|
Trade and
other
payables
|
|
Borrowings
|
|
Expected
future
interest
payments
|
|
|||
|
At 31 December 2017
|
||||||||
|
Financial liabilities
|
||||||||
|
Within 1 year in demand
|
104,633
|
|
7,596
|
|
3,345
|
|
||
|
Later than 1 year and no later than 5 years
|
—
|
|
41,210
|
|
6,820
|
|
||
|
After 5 years
|
—
|
|
—
|
|
305
|
|
||
|
Total
|
104,633
|
|
48,806
|
|
10,470
|
|
||
|
At 31 December 2016
|
||||||||
|
Financial liabilities
|
||||||||
|
Within 1 year in demand
|
131,859
|
|
10,285
|
|
3,974
|
|
||
|
Later than 1 year and no later than 5 years
|
—
|
|
46,929
|
|
8,693
|
|
||
|
After 5 years
|
—
|
|
—
|
|
878
|
|
||
|
Total
|
131,859
|
|
57,214
|
|
13,545
|
|
||
|
At 31 December 2015
|
||||||||
|
Financial liabilities
|
||||||||
|
Within 1 year in demand
|
117,083
|
|
9,808
|
|
2,461
|
|
||
|
Later than 1 year and no later than 5 years
|
—
|
|
39,075
|
|
12,430
|
|
||
|
After 5 years
|
—
|
|
12,672
|
|
3,805
|
|
||
|
Total
|
117,083
|
|
61,555
|
|
18,696
|
|
||
22. FAIR VALUE OF FINANCIAL INSTRUMENTS
The following table shows the carrying amounts and the fair values of the Group’s available-for-sale financial instruments outstanding at 31 December 2017, 2016 and 2015. The fair value of a financial instrument is defined as the amount at which the instrument could be exchanged in a current transaction between willing parties, other than in a forced or liquidation sale.
|
Carrying
amount
|
|
Fair value
|
|
||||
|
As at 31 December 2017
|
|||||||
|
Categorised as level 1¹
|
|||||||
|
Available-for-sale financial asset
|
Available for sale
|
26
|
|
26
|
|
||
|
As at 31 December 2016
|
|||||||
|
Categorised as level 1¹
|
|||||||
|
Available-for-sale financial asset
|
Available for sale
|
58
|
|
58
|
|
||
|
As at 31 December 2015
|
|||||||
|
Categorised as level 1¹
|
|||||||
|
Available-for-sale financial asset
|
Available for sale
|
45
|
|
45
|
|
||
No derivative financial instruments currently exist.
¹Level 1: fair values are derived from quoted market prices for identical assets from an active market for which an entity has immediate access.
F - 120
Estimation of fair values
Trade and other receivables, trade and other payables, cash and cash equivalents, bank overdrafts, loans to and from related parties
The carrying amounts are a reasonable estimate of the fair values because of the short maturity of such instruments or their interest bearing nature.
Long term and short term borrowings
The carrying amount is a reasonable estimate of the fair value because of the short maturity of such instruments, interest bearing nature and other terms of the agreement.
23. CASH FLOW FROM OPERATING ACTIVITIES AND NON-CASH ITEMS
|
31 Dec 2016
|
|
31 Dec 2015
|
|
31 Dec 2014
|
|
|||
|
$’000
|
|
$’000
|
|
$’000
|
|
|||
|
(Loss) / profit before income taxation
|
(40,349
|
)
|
26,728
|
|
155,825
|
|
||
|
Adjustments for:
|
||||||||
|
Interest received (note 6)
|
(4,147
|
)
|
(4,735
|
)
|
(4,818
|
)
|
||
|
Finance cost (note 6)
|
4,949
|
|
4,949
|
|
4,992
|
|
||
|
Share of profits of equity accounted joint venture
|
(113
|
)
|
(129
|
)
|
(268
|
)
|
||
|
Depreciation and amortisation
|
264,415
|
|
210,925
|
|
192,509
|
|
||
|
Foreign exchange loss
|
38,469
|
|
36,134
|
|
—
|
|
||
|
Movement in discounting provision on TVA (note 3)
|
12,177
|
|
7,820
|
|
—
|
|
||
|
Recycling of permanent losses on available-for-sale asset
|
—
|
|
—
|
|
3,144
|
|
||
|
Unwinding of rehabilitation provision
|
529
|
|
349
|
|
384
|
|
||
|
275,930
|
|
282,041
|
|
351,768
|
|
|||
|
- Effects of changes in operating working capital items
|
||||||||
|
- Receivables
|
(69,741
|
)
|
(29,287
|
)
|
(7,122
|
)
|
||
|
- Inventories
|
30,266
|
|
5,484
|
|
12,565
|
|
||
|
- Trade and other payables
|
(11,026
|
)
|
14,712
|
|
12,447
|
|
||
|
Cash generated from operations
|
225,429
|
|
272,950
|
|
369,658
|
|
||
Other non-cash items include a finance lease liability movement of US$4.1 million (2016: US$4.7 million) (2015: US$1.2 million), finance lease assets movement of US$29.7 million (2016: US$6.6 million) (2015: US$4.3 million), changes in rehabilitation provision estimates of US$2.1 million (2016: US$5.2 million) (2015: US$0 million) and dividends payable of Nil (2016: US$8.0 million) (2015: Nil).
Cash flows relating to loans and borrowings within financing activities comprises the following movements in finance lease liabilities:
|
Non-current loans and Borrowings
|
|
Current loans and Borrowings
|
|
Total
|
|
|||
|
$’000
|
|
$’000
|
|
$’000
|
|
|||
|
At 1 January 2017
|
46,707
|
|
8,310
|
|
55,017
|
|
||
|
Lease repayments
|
—
|
|
(7,228
|
)
|
(7,228
|
)
|
||
|
Non cash flows:
|
||||||||
|
Loans and borrowings classified as non current at 31 December 2016
|
(6,357
|
)
|
6,357
|
|
—
|
|
||
|
Interest and capital accrued
|
—
|
|
157
|
|
157
|
|
||
|
At 31 December 2017
(1)
|
40,350
|
|
7,596
|
|
47,946
|
|
||
|
(1)
|
Refer to note 19 and the consolidated cash flow statement.
|
24. COMMITMENTS AND CONTINGENT LIABILITIES
|
31 Dec 2017
|
|
31 Dec 2016
|
|
31 Dec 2015
|
|
|||
|
$’000
|
|
$’000
|
|
$’000
|
|
|||
|
Capital expenditure contracted for at statement of financial position date but not yet incurred is:
|
||||||||
|
Property, plant and equipment
|
19,108
|
|
21,456
|
|
27,385
|
|
||
F - 121
25. INVESTMENT IN JOINT VENTURE
Set out below is the summarised financial information for KAS which is accounted for using the equity method (amounts stated at 100% before intercompany eliminations).
|
31 Dec 2017
|
|
31 Dec 2016
|
|
31 Dec 2015
|
|
|||
|
$’000
|
|
$’000
|
|
$’000
|
|
|||
|
Summarised statement of financial position
|
||||||||
|
Current assets
|
||||||||
|
Cash and cash equivalents
|
2,039
|
|
1,167
|
|
1,222
|
|
||
|
Other current assets (excluding cash)
|
1,649
|
|
10,061
|
|
10,584
|
|
||
|
Total current assets
|
3,688
|
|
11,228
|
|
11,806
|
|
||
|
Other current liabilities (including trade payables)
|
(1,505
|
)
|
(1,457
|
)
|
(1,653
|
)
|
||
|
Total current liabilities
|
(1,505
|
)
|
(1,457
|
)
|
(1,653
|
)
|
||
|
Non-current
|
||||||||
|
Assets
|
48,065
|
|
46,707
|
|
51,718
|
|
||
|
Financial liabilities
|
(49,739
|
)
|
(56,195
|
)
|
(61,295
|
)
|
||
|
509
|
|
|
283
|
|
|
576
|
|
|
|
Summarised statement of comprehensive income
|
||||||||
|
Operating (loss)/profit
|
(39
|
)
|
(21
|
)
|
234
|
|
||
|
Interest income
|
3,959
|
|
4,489
|
|
4,802
|
|
||
|
Interest expense
|
(3,695
|
)
|
(4,210
|
)
|
(4,500
|
)
|
||
|
Profit and total comprehensive income for the period
|
225
|
|
|
258
|
|
|
536
|
|
|
Dividends received from joint venture
|
—
|
|
550
|
|
—
|
|
||
|
Reconciliation of the summarised financial information presented to the carrying amount of the group’s interest in KAS
|
||||||||
|
Opening net assets 1 January
|
284
|
|
576
|
|
40
|
|
||
|
Profit for the period
|
225
|
|
258
|
|
536
|
|
||
|
Dividends received
|
—
|
|
(550
|
)
|
—
|
|
||
|
Closing Net assets
|
509
|
|
|
284
|
|
|
576
|
|
|
Interest in joint venture at 50.1%
|
255
|
|
142
|
|
289
|
|
||
|
Funding classified as long term debt by joint venture recorded in ‘other investments in joint ventures’
|
25,577
|
|
28,830
|
|
31,086
|
|
||
|
Carrying value
|
25,832
|
|
|
28,972
|
|
|
31,375
|
|
The loan to KAS bears interest at 8% and has no fixed repayment terms. Joint control is provided through a joint venture agreement.
26. RELATED PARTIES AND RELATED PARTY TRANSACTIONS
|
Related parties
|
Nature of relationship
|
|
|
Randgold
|
Ultimate Joint Venture partner
|
|
|
AngloGold Ashanti
|
Ultimate Joint Venture partner
|
|
|
AngloGold Ashanti Holdings plc
|
Joint Venture partner
|
|
|
Randgold Resources (Kibali) Limited
|
Joint Venture partner
|
|
|
Randgold Resources Congo SPRL
|
Entity under common control (subsidiary of Randgold)
|
|
|
Société des Mines de Loulo SA
|
Entity under common control (subsidiary of Randgold)
|
|
|
Société des Mines de Tongon SA
|
Entity under common control (subsidiary of Randgold)
|
|
|
Société des Mines de Gounkoto SA
|
Entity under common control (subsidiary of Randgold)
|
|
|
Rand Refinery (Pty) Limited
|
Associate of AngloGold Ashanti
|
|
|
SOKIMO
|
Government interest in Kibali
|
|
|
KAS
|
Joint Venture
|
|
|
Isiro (Jersey) Limited
|
Joint Venture of Randgold
|
|
|
KGL Isiro SARL
|
Subsidiary of Isiro (Jersey) Limited
|
|
F - 122
|
31 Dec 2017
|
|
31 Dec 2016
|
|
31 Dec 2015
|
|
|||
|
$’000
|
|
$’000
|
|
$’000
|
|
|||
|
Related party transactions
|
||||||||
|
Management fee paid to Randgold
|
4,385
|
|
4,296
|
|
4,265
|
|
||
|
Refining fees to Rand Refinery (Pty) Limited
|
3,632
|
|
3,062
|
|
3,564
|
|
||
|
Interest received from SOKIMO
|
1,097
|
|
1,335
|
|
1,232
|
|
||
|
Shareholders interest received from KAS
|
1,846
|
|
2,105
|
|
2,254
|
|
||
|
Interest incurred to KAS on the finance lease liability
|
3,753
|
|
4,482
|
|
4,800
|
|
||
|
Amounts included in trade and other receivables owing by related parties
|
||||||||
|
Rand Refinery (Pty) Limited
|
30,457
|
|
1,497
|
|
850
|
|
||
|
Loan to SOKIMO
|
18,827
|
|
17,381
|
|
16,046
|
|
||
|
Loan to Randgold Resources Congo SPRL
|
182
|
|
45
|
|
—
|
|
||
|
Loan to Randgold
|
—
|
|
942
|
|
—
|
|
||
|
Loan to KGL Isiro SARL
|
64
|
|
1
|
|
21
|
|
||
|
Loan to Société des Mines de Loulo SA
|
4
|
|
—
|
|
3
|
|
||
|
Loan to Société des Mines de Tongon SA
|
41
|
|
76
|
|
3
|
|
||
|
Loan to Société des Mines de Gounkoto SA
|
—
|
|
32
|
|
32
|
|
||
|
Amounts included in other investment in joint venture owing by related parties
|
||||||||
|
Loan to KAS
|
25,660
|
|
28,830
|
|
31,086
|
|
||
|
Amounts included in loans and borrowings owed to related parties
|
||||||||
|
Loan from Randgold
|
(860
|
)
|
(2,197
|
)
|
(1,802
|
)
|
||
|
Finance lease liability with KAS
|
(47,946
|
)
|
(55,017
|
)
|
(59,753
|
)
|
||
SOKIMO has a 10% interest in Kibali Goldmines SA, a subsidiary of the group.
Rand Refinery (Pty) Limited (‘’Rand Refinery’’) is an associate of AngloGold Ashanti. Kibali Goldmines SA have incurred refining costs of US$3.6 million in the year (2016: US$3.1 million) (2015: US$3.6 million). US$755m (2016: US$709 million) (2015: US$747 million) of gold and silver was sold by Rand Refinery under the contract with Kibali Goldmines SA in which Rand Refinery is the stated agent.
It is the obligation of the joint venture parties, Randgold and AngloGold Ashanti, (joint venture partners) to fund the Group for operating costs, capital costs and other costs in proportion to their respective percentage interests in Kibali (Jersey) Limited. These costs are in accordance with the Kibali Joint Venture Agreement.
The finance lease liability due to KAS is in respect of the equipment which has been transferred to the Group under an instalment sale agreement. Kibali (Jersey) Limited has a 50.1% shareholding in KAS.
Refer to notes 11 and 16 for the details of loans to and from related parties.
27. SUBSIDIARIES AND TRANSACTIONS WITH NON-CONTROLLING INTERESTS
The consolidated financial statements include the accounts of the Company and all of its subsidiaries and jointly controlled entities at 31 December 2017. The parent Company, the principal subsidiaries and their interests are:
|
% of interest
|
|
Country of
incorporation and
residence
|
|||
|
Company
|
Kibali (Jersey) Ltd
|
Jersey
|
|||
|
Subsidiary
|
Border Energy East Africa (Pty) Ltd
|
100
|
%
|
Uganda
|
|
|
Subsidiary
|
Moto (Jersey) 1 Ltd
|
100
|
%
|
Jersey
|
|
|
Subsidiary
|
Kibali 2 (Jersey) Ltd
|
100
|
%
|
Jersey
|
|
|
Subsidiary
|
0858065 B.C. Limited
|
100
|
%
|
Jersey
|
|
|
Subsidiary
|
Moto Goldmines Australia Pty Ltd
|
100
|
%
|
Australia
|
|
|
Subsidiary
|
Kibali Goldmines SA
|
90
|
%
|
DRC
|
|
|
Jointly controlled entity
|
KAS 1 Limited
|
50.1
|
%
|
Jersey
|
|
28. SUBSEQUENT EVENTS
F - 123
No significant subsequent events requiring disclosure or adjustment occurred.
29. OTHER INFORMATION
The company is a private company limited by shares, incorporated in Jersey with a registered office, 3rd Floor, Unity Chambers, 28 Halkett Street, St Helier, Jersey, JE2 4WJ, Channel Islands. The company’s principal activity is the operation of the Kibali gold mine in the DRC,within Kibali.
F - 124
SIGNATURES
The registrant hereby certifies that it meets all of the requirements for filing on Form 20-F and that it has duly caused and authorised the undersigned to sign this annual report on its behalf.
ANGLOGOLD ASHANTI LIMITED
/s/ Kandimathie Christine Ramon
|
Name
|
:
|
Kandimathie Christine Ramon
|
||
|
Title
|
:
|
Chief Financial Officer
|
||
|
Date
|
:
|
March 29, 2018
|
||
E -
1
Exhibits to Form 20-F
|
Exhibit Number
|
Description
|
Remarks
|
||
|
Exhibit 19.1
|
Incorporated by reference to AngloGold Ashanti Limited’s report on Form 6-K (No. 001-14846) furnished to the Securities and Exchange Commission on 10 May 2016
|
|||
|
Exhibit 19.2.1
|
Incorporated by reference to Exhibit 4.2 to AngloGold Ashanti Limited and AngloGold Ashanti Holdings plc’s Registration Statement on Form F-3 (Nos. 333-182712 and 333-182712-02) filed with the Securities and Exchange Commission17 July 2012
|
|||
|
Exhibit 19.2.2
|
Incorporated by reference to Exhibit 99(C) to AngloGold Ashanti Limited and AngloGold Ashanti Holdings plc’s Registration Statement on Form 8-A (Nos. 001-14846 and 001-34725) filed with the Securities and Exchange Commission on 28 April 2010
|
|||
|
Exhibit 19.2.3
|
Incorporated by reference to Exhibit 99(C) to AngloGold Ashanti Limited and AngloGold Ashanti Holdings plc’s Registration Statement on Form 8-A (Nos. 001-14846 and 001-34725) filed with the Securities and Exchange Commission on 28 April 2010
|
|||
|
Exhibit 19.2.4
|
Incorporated by reference to Exhibit 4.1 to AngloGold Ashanti Limited’s report on Form 6-K (No. 001-14846) furnished to the Securities and Exchange Commission on 30 July 2012
|
|||
|
Exhibit 19.4.1.1
|
Incorporated by reference to AngloGold Ashanti Limited’s report on Form 6-K (No. 001-14846) furnished to the Securities and Exchange Commission on 10 April 2013
|
|||
|
Exhibit 19.4.1.2
|
Incorporated by reference to AngloGold Ashanti Limited’s report on Form 6-K (No. 001-14846) furnished to the Securities and Exchange Commission on 10 April 2013
|
|||
|
Exhibit 19.4.1.3
|
|
Incorporated by reference to AngloGold Ashanti Limited’s report on Form 6-K (No. 001-14846) furnished to the Securities and Exchange Commission on 18 May 2017
|
||
|
Exhibit 19.4.4
|
Incorporated by reference to AngloGold Ashanti Limited’s report on Form 6-K (No. 001-14846) furnished to the Securities and Exchange Commission on 25 August 2014
|
|||
|
Exhibit 19.4.4.1
|
Incorporated by reference to AngloGold Ashanti Limited’s report on Form 6-K (No. 001-14846) furnished to the Securities and Exchange Commission on 10 September 2014
|
|||
E -
2
|
Exhibit Number
|
Description
|
Remarks
|
||
|
Exhibit 19.4.4.2
|
Incorporated by reference to AngloGold Ashanti Limited’s report on Form 6-K (No. 001-14846) furnished to the Securities and Exchange Commission on 9 March 2015
|
|||
|
Exhibit 19.4.4.3
|
Incorporated by reference to AngloGold Ashanti Limited’s report on Form 6-K (No. 001-14846) furnished to the Securities and Exchange Commission on 29 March 2016
|
|||
|
Exhibit 19.4.4.4
|
|
Incorporated by reference to AngloGold Ashanti Limited’s report on Form 6-K (No. 001-14846) furnished to the Securities and Exchange Commission on 13 March 2018
|
||
|
Exhibit 19.4.4.5
|
|
Incorporated by reference to AngloGold Ashanti Limited’s report on Form 6-K (No. 001-14846) furnished to the Securities and Exchange Commission on 15 March 2018
|
||
|
Exhibit 19.4.5
|
Incorporated by reference to AngloGold Ashanti Limited’s report on Form 6-K (No. 001-14846) furnished to the Securities and Exchange Commission on 7 June 2013
|
|||
|
Exhibit 19.4.5.1
|
Incorporated by reference to AngloGold Ashanti Limited’s report on Form 6-K (No. 001-14846) furnished to the Securities and Exchange Commission on 8 October 2014
|
|||
|
Exhibit 19.4.6
|
Incorporated by reference to AngloGold Ashanti Limited’s report on Form 6-K (No.001-14846) furnished to the Securities and Exchange Commission on 19 February 2016
|
|||
|
Exhibit 19.6
|
See note 12 to the consolidated financial statements
|
|||
|
Exhibit 19.8
|
||||
|
Exhibit 19.12.1
|
||||
|
Exhibit 19.12.2
|
||||
|
Exhibit 19.13
|
||||
|
Exhibit 19.15.1
|
||||
|
Exhibit 19.15.2
|
||||
E -
3
EXHIBIT 19.8
PRINCIPAL SUBSIDIARIES AND OPERATING ENTITIES AT 31 DECEMBER 2017
|
Shares held
|
Holding
|
Percentage held
|
||||
|
2017
|
2016
|
2017
|
2016
|
|||
|
Principal subsidiaries and controlled operating entities
(1)
|
||||||
|
AngloGold Ashanti Australia Limited
(2)
|
2
|
257,462,077
|
257,462,077
|
I
|
100
|
100
|
|
AngloGold Ashanti Holdings plc
|
6
|
5,326,550,917
|
5,326,550,917
|
D
|
100
|
100
|
|
AngloGold Ashanti USA Incorporated
|
10
|
237
|
237
|
D
|
100
|
100
|
|
Operating entities
|
||||||
|
AngloGold Ashanti Córrego do Sítío Mineração S.A.
|
3
|
4,167,084,999
|
4,167,084,999
|
I
|
100
|
100
|
|
AngloGold Ashanti (Ghana) Limited(3)
|
4
|
132,419,584
|
132,419,584
|
I
|
100
|
100
|
|
AngloGold Ashanti (Iduapriem) Limited
|
4
|
66,270
|
66,270
|
I
|
100
|
100
|
|
Cerro Vanguardia S.A.
|
1
|
13,875,000
|
13,875,000
|
I
|
92.50
|
92.50
|
|
Geita Gold Mining Limited
|
9
|
123,382,772
|
123,382,772
|
I
|
100
|
100
|
|
Mineração Serra Grande S.A.
|
3
|
1,999,999
|
1,999,999
|
I
|
100
|
100
|
|
Societé AngloGold Ashanti de Guinée S.A.
|
5
|
3,486,134
|
3,486,134
|
I
|
85
|
85
|
|
Joint venture operating entities
|
||||||
|
Kibali (Jersey) Limited(4)
|
7
|
2,324
|
2,310
|
I
|
50
|
50
|
|
Société des Mines de Morila S.A.
|
8
|
400
|
400
|
I
|
40
|
40
|
|
Société d'Exploitation des Mines d'Or de Sadiola S.A.
|
8
|
41,000
|
41,000
|
I
|
41
|
41
|
|
Unincorporated joint venture
|
||||||
|
Tropicana joint venture
|
2
|
n/a
|
n/a
|
I
|
70
|
70
|
D - Direct Holding
I - Indirect Holding
|
(1)
|
All the operations in South Africa, namely, Mine Waste Solutions, Kopanang, Moab Khotsong, Mponeng and TauTona are held by the parent company, AngloGold Ashanti Limited.
|
|
(2)
|
Owner of the Sunrise Dam operation and the Tropicana joint venture in Australia.
|
|
(3)
|
Operates the Obuasi mine in Ghana.
|
|
(4)
|
Owner of Kibali Goldmines S.A. which operates the Kibali mine in the Democratic Republic of the Congo.
|
|
1
|
Argentina
|
6
|
Isle of Man
|
|
|
2
|
Australia
|
7
|
Jersey
|
|
|
3
|
Brazil
|
8
|
Mali
|
|
|
4
|
Ghana
|
9
|
Tanzania
|
|
|
5
|
Republic of Guinea
|
10
|
United States of America
|
|
E -
4
EXHIBIT 19.12.1
CERTIFICATION
I, Srinivasan Venkatakrishnan, certify that:
|
1.
|
I have reviewed this annual report on Form 20-F of AngloGold Ashanti Limited;
|
|
2.
|
Based on my knowledge, this report does not contain any untrue statement of a material fact or omit to state a material fact necessary to make the statements made, in light of the circumstances under which such statements were made, not misleading with respect to the period covered by this report;
|
|
3.
|
Based on my knowledge, the financial statements, and other financial information included in this report, fairly present in all material respects the financial condition, results of operations and cash flows of the company as of, and for, the periods presented in this report;
|
|
4.
|
The company’s other certifying officer and I are responsible for establishing and maintaining disclosure controls and procedures (as defined in Exchange Act Rules 13a-15(e) and 15d-15(e)) and internal control over financial reporting (as defined in Exchange Act Rules 13a-15(f) and 15d-15(f)) for the company and have:
|
|
a.
|
Designed such disclosure controls and procedures, or caused such disclosure controls and procedures to be designed under our supervision, to ensure that material information relating to the company, including its consolidated subsidiaries, is made known to us by others within those entities, particularly during the period in which this report is being prepared;
|
|
b.
|
Designed such internal control over financial reporting, or caused such internal control over financial reporting to be designed under our supervision, to provide reasonable assurance regarding the reliability of financial reporting and the preparation of financial statements for external purposes in accordance with IFRS as issued by the IASB;
|
|
c.
|
Evaluated the effectiveness of the company’s disclosure controls and procedures and presented in this report our conclusions about the effectiveness of the disclosure controls and procedures, as of the end of the period covered by this report based on such evaluation; and
|
|
d.
|
Disclosed in this report any change in the company’s internal control over financial reporting that occurred during the period covered by the annual report that has materially affected, or is reasonably likely to materially affect, the company’s internal control over financial reporting; and
|
|
5.
|
The company’s other certifying officer and I have disclosed, based on our most recent evaluation of internal control over financial reporting, to the company’s auditors and the audit committee of company’s board of directors (or persons performing the equivalent functions):
|
|
a.
|
All significant deficiencies and material weaknesses in the design or operation of internal control over financial reporting which are reasonably likely to adversely affect the company’s ability to record, process, summarize and report financial information; and
|
|
b.
|
Any fraud, whether or not material, that involves management or other employees who have a significant role in the company’s internal control over financial reporting.
|
Date: 29 March 2018
/s/ Srinivasan Venkatakrishnan
Srinivasan Venkatakrishnan
Chief Executive Officer
E -
5
EXHIBIT 19.12.2
CERTIFICATION
I, Christine Ramon, certify that:
|
1.
|
I have reviewed this annual report on Form 20-F of AngloGold Ashanti Limited;
|
|
2.
|
Based on my knowledge, this report does not contain any untrue statement of a material fact or omit to state a material fact necessary to make the statements made, in light of the circumstances under which such statements were made, not misleading with respect to the period covered by this report;
|
|
3.
|
Based on my knowledge, the financial statements, and other financial information included in this report, fairly present in all material respects the financial condition, results of operations and cash flows of the company as of, and for, the periods presented in this report;
|
|
4.
|
The company’s other certifying officer and I are responsible for establishing and maintaining disclosure controls and procedures (as defined in Exchange Act Rules 13a-15(e) and 15d-15(e)) and internal control over financial reporting (as defined in Exchange Act Rules 13a-15(f) and 15d-15(f)) for the company and have:
|
|
a.
|
Designed such disclosure controls and procedures, or caused such disclosure controls and procedures to be designed under our supervision, to ensure that material information relating to the company, including its consolidated subsidiaries, is made known to us by others within those entities, particularly during the period in which this report is being prepared;
|
|
b.
|
Designed such internal control over financial reporting, or caused such internal control over financial reporting to be designed under our supervision, to provide reasonable assurance regarding the reliability of financial reporting and the preparation of financial statements for external purposes in accordance with IFRS as issued by the IASB;
|
|
c.
|
Evaluated the effectiveness of the company’s disclosure controls and procedures and presented in this report our conclusions about the effectiveness of the disclosure controls and procedures, as of the end of the period covered by this report based on such evaluation; and
|
|
d.
|
Disclosed in this report any change in the company’s internal control over financial reporting that occurred during the period covered by the annual report that has materially affected, or is reasonably likely to materially affect, the company’s internal control over financial reporting; and
|
|
5.
|
The company’s other certifying officer and I have disclosed, based on our most recent evaluation of internal control over financial reporting, to the company’s auditors and the audit committee of company’s board of directors (or persons performing the equivalent functions):
|
|
a.
|
All significant deficiencies and material weaknesses in the design or operation of internal control over financial reporting which are reasonably likely to adversely affect the company’s ability to record, process, summarize and report financial information; and
|
|
b.
|
Any fraud, whether or not material, that involves management or other employees who have a significant role in the company’s internal control over financial reporting.
|
Date: 29 March 2018
/s/ Kandimathie Christine Ramon
Kandimathie Christine Ramon
Chief Financial Officer
E -
6
EXHIBIT 19.13
CERTIFICATION PURSUANT TO
18 U.S.C. SECTION 1350,
AS ADOPTED PURSUANT TO
SECTION 906 OF THE SARBANES-OXLEY ACT OF 2002
In connection with the Annual Report of AngloGold Ashanti Limited (the “Company”) on Form 20-F for the period ending 31 December 2017, as filed with the Securities and Exchange Commission on the date hereof (the “Report”), the undersigned hereby certify that to the best of our knowledge:
|
1.
|
The Report fully complies with the requirements of Section 13(a) of the Securities Exchange Act of 1934; and
|
|
2.
|
The information contained in the Report fairly presents, in all material respects, the financial condition and results of operations of the Company.
|
Date: 29 March 2018
/s/ Srinivasan Venkatakrishnan
Name: Srinivasan Venkatakrishnan
Title: Chief Executive Officer
Date: 29 March 2018
/s/ Kandimathie Christine Ramon
Name: Kandimathie Christine Ramon
Title: Chief Financial Officer
E -
7
Exhibit 19.15.1
CONSENT OF INDEPENDENT REGISTERED PUBLIC ACCOUNTING FIRM
We consent to the incorporation by reference in the Registration Statement on Form S-8 (No. 333-113789) and the Registration Statement on Form F-3 (No. 333-210564) of AngloGold Ashanti Limited of our reports dated 29 March 2018, with respect to the consolidated financial statements of AngloGold Ashanti Limited and the effectiveness of internal control over financial reporting of AngloGold Ashanti Limited included in this Annual Report (Form 20-F) for the year ended 31 December 2017.
/s/ Ernst & Young Inc.
Ernst & Young Inc.
Johannesburg, Republic of South Africa
29 March 2018
E -
8
Exhibit 19.15.2
CONSENT OF INDEPENDENT REGISTERED PUBLIC ACCOUNTING FIRM
We hereby consent to the incorporation by reference in the Registration Statement on Forms S-8 (No. 333-113789) and F-3 (No. 333-210564) of AngloGold Ashanti Limited of our report dated 14 March 2018, relating to the consolidated financial statements of Kibali (Jersey) Limited included in AngloGold Ashanti Limited’s Annual Report on Form 20-F for the year ended 31 December 2017.
/s/ BDO LLP
BDO LLP
London
United Kingdom
29 March 2018
E -
9
TABLE OF CONTENTS
Part IItem 1: Identity Of Directors, Senior Management and AdvisorsItem 2: Offer Statistics and Expected TimetableItem 3: Key InformationItem 4: Information on The CompanyItem 4a:unresolved Staff CommentsItem 5: Operating and Financial Review and ProspectsItem 6: Directors, Senior Management and EmployeesItem 7: Major Shareholders and Related Party TransactionsItem 8: Financial InformationItem 9: The Offer and ListingItem 10: Additional InformationItem 11: Quantitative and Qualitative Disclosures About Market RiskItem 12: Description Of Securities Other Than Equity SecuritiesPart IIItem 13:defaults, Dividend Arrearages and DelinquenciesItem 14: Material Modifications To The Rights Of Security Holders and Use Of ProceedsItem 15: Controls and ProceduresItem 16a:audit Committee Financial ExpertItem 16b:code Of Ethics and Whistle-blowing PoliciesItem 16c:principal Accountant Fees and ServicesItem 16d:exemptions From The Listing Standards For Audit CommitteesItem 16E: Purchases Of Equity Securities By The Issuer and Affiliated PurchasersItem 16F: Change in Registrant S Certifying AccountantItem 16g:corporate GovernanceItem 16h:mine Safety DisclosurePart IIIItem 17:financial StatementsItem 18:financial Statements