AVISTA CORP
10-Ks and 10-Qs
|
|
|
|
|
|
|
|
|
|
|
|
|
|
|
|
|
|
|
|
|
|
|
|
|
|
|
|
|
|
|
|
|
|
|
|
|
|
|
|
|
|
|
|
|
|
|
|
|
|
|
|
|
|
|
|
UNITED STATES
SECURITIES AND EXCHANGE COMMISSION
Washington, D.C. 20549
__________________________________________________________________________________________
Form 10-K
(Mark One)
|
x
|
ANNUAL REPORT PURSUANT TO SECTION 13 OR 15(d) OF THE SECURITIES EXCHANGE ACT OF 1934
|
FOR THE FISCAL YEAR ENDED
December 31, 2016
OR
|
o
|
TRANSITION REPORT PURSUANT TO SECTION 13 OR 15(d) OF THE SECURITIES EXCHANGE ACT OF 1934
|
FOR THE TRANSITION PERIOD FROM TO
Commission file number
1-3701
__________________________________________________________________________________________
AVISTA CORPORATION
(Exact name of Registrant as specified in its charter)
|
Washington
|
|
91-0462470
|
|
(State or other jurisdiction of
incorporation or organization)
|
|
(I.R.S. Employer
Identification No.)
|
|
1411 East Mission Avenue, Spokane, Washington
|
|
99202-2600
|
|
(Address of principal executive offices)
|
|
(Zip Code)
|
Registrant’s telephone number, including area code:
509-489-0500
Web site: http://www.avistacorp.com
Securities registered pursuant to Section 12(b) of the Act:
|
Title of Class
|
|
Name of Each Exchange on Which Registered
|
|
Common Stock, no par value
|
|
New York Stock Exchange
|
Securities registered pursuant to Section 12(g) of the Act:
Title of Class
Preferred Stock, Cumulative, Without Par Value
__________________________________________________________________________________________
Indicate by check mark if the registrant is a well-known seasoned issuer, as defined in Rule 405 of the Securities Act. Yes
x
No
o
Indicate by check mark if the registrant is not required to file reports pursuant to Section 13 or 15(d) of the Act. Yes
o
No
x
Indicate by check mark whether the registrant (1) has filed all reports required to be filed by Section 13 or 15(d) of the Securities Exchange Act of 1934 during the preceding 12 months (or for such shorter period that the Registrant was required to file such reports), and (2) has been subject to such filing requirements for the past 90 days: Yes
x
No
o
Indicate by check mark whether the registrant has submitted electronically and posted on its corporate Web site, if any, every Interactive Data File required to be submitted and posted pursuant to Rule 405 of Regulation S-T (§232.405 of this chapter) during the preceding 12 months (or for such shorter period that the registrant was required to submit and post such files). Yes
x
No
o
Indicate by check mark if disclosure of delinquent filers pursuant to Item 405 of Regulation S-K (§ 229.405 of this chapter) is not contained herein, and will not be contained, to the best of Registrant’s knowledge, in definitive proxy or information statements incorporated by reference in Part III of this Form 10-K or any amendment to this Form 10-K.
o
Indicate by check mark whether the registrant is a large accelerated filer, an accelerated filer, a non-accelerated filer, or a smaller reporting company. See the definitions of “large accelerated filer,” “accelerated filer” and “smaller reporting company” in Rule 12b-2 of the Exchange Act. (Check one):
|
Large accelerated filer
|
x
|
Accelerated filer
|
o
|
|
Non-accelerated filer
|
o
(Do not check if a smaller reporting company)
|
Smaller reporting company
|
o
|
Indicate by check mark whether the Registrant is a shell company (as defined in Rule 12b-2 of the Exchange Act): Yes
o
No
x
The aggregate market value of the Registrant’s outstanding Common Stock, no par value (the only class of voting stock), held by non-affiliates is
$2,853,952,416
based on the last reported sale price thereof on the consolidated tape on June 30,
2016
.
As of January 31,
2017
,
64,311,891
shares of Registrant’s Common Stock, no par value (the only class of common stock), were outstanding.
__________________________________________________________________________________________
Documents Incorporated By Reference
|
Document
|
|
Part of Form 10-K into Which
Document is Incorporated
|
|
Proxy Statement to be filed in connection with the annual meeting of shareholders to be held on May 11, 2017.
Prior to such filing, the Proxy Statement filed in connection with the annual meeting of shareholders held on May 12, 2016.
|
|
Part III, Items 10, 11,
12, 13 and 14
|
INDEX
|
Item
No.
|
|
Page
No.
|
||
|
Part I
|
||||
|
1
|
||||
|
1A.
|
||||
|
1B.
|
||||
|
2
|
||||
|
3
|
||||
|
4
|
*
|
|||
|
Part II
|
||||
|
5
|
||||
|
6
|
||||
|
7
|
||||
i
|
7A.
|
||||
|
8.
|
||||
|
9.
|
*
|
|||
|
9A.
|
||||
|
9B.
|
||||
|
Part III
|
||||
|
10.
|
||||
|
11.
|
||||
|
12.
|
||||
|
13.
|
||||
|
14.
|
||||
|
Part IV
|
||||
|
15.
|
||||
* = not an applicable item in the
2016
calendar year for Avista Corp.
ii
ACRONYMS AND TERMS
(The following acronyms and terms are found in multiple locations within the document)
|
Acronym/Term
|
Meaning
|
|
|
aMW
|
-
|
Average Megawatt - a measure of the average rate at which a particular generating source produces energy over a period of time
|
|
AEL&P
|
-
|
Alaska Electric Light and Power Company, the primary operating subsidiary of AERC, which provides electric services in Juneau, Alaska
|
|
AERC
|
-
|
Alaska Energy and Resources Company, the Company's wholly-owned subsidiary based in Juneau, Alaska
|
|
AFUDC
|
-
|
Allowance for Funds Used During Construction; represents the cost of both the debt and equity funds used to finance utility plant additions during the construction period
|
|
AM&D
|
-
|
Advanced Manufacturing and Development, does business as METALfx
|
|
ASC
|
-
|
Accounting Standards Codification
|
|
ASU
|
-
|
Accounting Standards Update
|
|
Avista Capital
|
-
|
Parent company to the Company’s non-utility businesses
|
|
Avista Corp.
|
-
|
Avista Corporation, the Company
|
|
Avista Energy
|
-
|
Avista Energy, Inc., an inactive electricity and natural gas marketing, trading and resource management business, subsidiary of Avista Capital
|
|
Avista Utilities
|
-
|
Operating division of Avista Corp. (not a subsidiary) comprising the regulated utility operations in the Pacific Northwest
|
|
BPA
|
-
|
Bonneville Power Administration
|
|
Capacity
|
-
|
The rate at which a particular generating source is capable of producing energy, measured in KW or MW
|
|
Cabinet Gorge
|
-
|
The Cabinet Gorge Hydroelectric Generating Project, located on the Clark Fork River in Idaho
|
|
CIAC
|
-
|
Contribution in aid of construction
|
|
Colstrip
|
-
|
The coal-fired Colstrip Generating Plant in southeastern Montana
|
|
Coyote Springs 2
|
-
|
The natural gas-fired combined-cycle Coyote Springs 2 Generating Plant located near Boardman, Oregon
|
|
CT
|
-
|
Combustion turbine
|
|
Deadband or ERM deadband
|
-
|
The first $4.0 million in annual power supply costs above or below the amount included in base retail rates in Washington under the ERM in the state of Washington
|
|
Dekatherm
|
-
|
Unit of measurement for natural gas; a dekatherm is equal to approximately one thousand cubic feet (volume) or 1,000,000 BTUs (energy)
|
|
Ecology
|
-
|
The state of Washington’s Department of Ecology
|
|
Ecova
|
-
|
Ecova, Inc., a provider of facility information and cost management services for multi-site customers and energy efficiency program management for commercial enterprises and utilities throughout North America, subsidiary of Avista Capital. Ecova was sold on June 30, 2014.
|
|
EIM
|
-
|
Energy Imbalance Market
|
|
Energy
|
-
|
The amount of electricity produced or consumed over a period of time, measured in KWh or MWh. Also, refers to natural gas consumed and is measured in dekatherms.
|
|
EPA
|
-
|
Environmental Protection Agency
|
|
ERM
|
-
|
The Energy Recovery Mechanism, a mechanism for accounting and rate recovery of certain power supply costs accepted by the utility commission in the state of Washington
|
|
FASB
|
-
|
Financial Accounting Standards Board
|
|
FCA
|
-
|
Fixed Cost Adjustment, the electric and natural gas decoupling mechanism in Idaho.
|
|
FERC
|
-
|
Federal Energy Regulatory Commission
|
|
GAAP
|
-
|
Generally Accepted Accounting Principles
|
|
GHG
|
-
|
Greenhouse gas
|
|
GS
|
-
|
Generating station
|
iii
|
IPUC
|
-
|
Idaho Public Utilities Commission
|
|
IRP
|
-
|
Integrated Resource Plan
|
|
Jackson Prairie
|
-
|
Jackson Prairie Natural Gas Storage Project, an underground natural gas storage field located near Chehalis, Washington
|
|
Juneau
|
-
|
The City and Borough of Juneau, Alaska
|
|
kV
|
-
|
Kilovolt (1000 volts): a measure of capacity on transmission lines
|
|
KW, KWh
|
-
|
Kilowatt (1000 watts): a measure of generating output or capability. Kilowatt-hour (1000 watt hours): a measure of energy produced
|
|
Lancaster Plant
|
-
|
A natural gas-fired combined cycle combustion turbine plant located in Idaho
|
|
LNG
|
-
|
Liquefied Natural Gas
|
|
MPSC
|
-
|
Public Service Commission of the State of Montana
|
|
MW, MWh
|
-
|
Megawatt: 1000 KW. Megawatt-hour: 1000 KWh
|
|
NERC
|
-
|
North American Electricity Reliability Corporation
|
|
Noxon Rapids
|
-
|
The Noxon Rapids Hydroelectric Generating Project, located on the Clark Fork River in Montana
|
|
OPUC
|
-
|
The Public Utility Commission of Oregon
|
|
PCA
|
-
|
The Power Cost Adjustment mechanism, a procedure for accounting and rate recovery of certain power supply costs accepted by the utility commission in the state of Idaho
|
|
PGA
|
-
|
Purchased Gas Adjustment
|
|
PPA
|
-
|
Power Purchase Agreement
|
|
PUD
|
-
|
Public Utility District
|
|
PURPA
|
-
|
The Public Utility Regulatory Policies Act of 1978, as amended
|
|
RCA
|
-
|
The Regulatory Commission of Alaska
|
|
REC
|
-
|
Renewable energy credit
|
|
Salix
|
-
|
Salix, Inc., a subsidiary of Avista Capital, launched in 2014 to explore markets that could be served with LNG, primarily in western North America.
|
|
Spokane Energy
|
-
|
Spokane Energy, LLC (dissolved in the third quarter of 2015), a special purpose limited liability company and all of its membership capital was owned by Avista Corp.
|
|
Therm
|
-
|
Unit of measurement for natural gas; a therm is equal to approximately one hundred cubic feet (volume) or 100,000 BTUs (energy)
|
|
UTC
|
-
|
Washington Utilities and Transportation Commission
|
|
Watt
|
-
|
Unit of measurement for electricity; a watt is equal to the rate of work represented by a current of one ampere under a pressure of one volt
|
iv
Forward-Looking Statements
From time-to-time, we make forward-looking statements such as statements regarding projected or future:
|
•
|
financial performance;
|
|
•
|
cash flows;
|
|
•
|
capital expenditures;
|
|
•
|
dividends;
|
|
•
|
capital structure;
|
|
•
|
other financial items;
|
|
•
|
strategic goals and objectives;
|
|
•
|
business environment; and
|
|
•
|
plans for operations.
|
These statements are based upon underlying assumptions (many of which are based, in turn, upon further assumptions). Such statements are made both in our reports filed under the Securities Exchange Act of 1934, as amended (including this Annual Report on Form 10-K), and elsewhere. Forward-looking statements are all statements except those of historical fact including, without limitation, those that are identified by the use of words that include “will,” “may,” “could,” “should,” “intends,” “plans,” “seeks,” “anticipates,” “estimates,” “expects,” “forecasts,” “projects,” “predicts,” and similar expressions.
Forward-looking statements (including those made in this Annual Report on Form 10-K) are subject to a variety of risks and uncertainties and other factors. Most of these factors are beyond our control and may have a significant effect on our operations, results of operations, financial condition or cash flows, which could cause actual results to differ materially from those anticipated in our statements. Such risks, uncertainties and other factors include, among others:
Financial Risk
|
•
|
weather conditions (temperatures, precipitation levels and wind patterns), including those from long-term climate change, which affect both energy demand and electric generating capability, including the effect of precipitation and temperature on hydroelectric resources, the effect of wind patterns on wind-generated power, weather-sensitive customer demand, and similar effects on supply and demand in the wholesale energy markets;
|
|
•
|
our ability to obtain financing through the issuance of debt and/or equity securities, which can be affected by various factors including our credit ratings, interest rates and other capital market conditions and the global economy;
|
|
•
|
changes in interest rates that affect borrowing costs, our ability to effectively hedge interest rates for anticipated debt issuances, variable interest rate borrowing and the extent to which we recover interest costs through retail rates collected from customers;
|
|
•
|
changes in actuarial assumptions, interest rates and the actual return on plan assets for our pension and other postretirement benefit plans, which can affect future funding obligations, pension and other postretirement benefit expense and the related liabilities;
|
|
•
|
deterioration in the creditworthiness of our customers;
|
|
•
|
the outcome of legal proceedings and other contingencies;
|
|
•
|
economic conditions in our service areas, including the economy's effects on customer demand for utility services;
|
|
•
|
declining energy demand related to customer energy efficiency and/or conservation measures;
|
Utility Regulatory Risk
|
•
|
state and federal regulatory decisions or related judicial decisions that affect our ability to recover costs and earn a reasonable return including, but not limited to, disallowance or delay in the recovery of capital investments, operating costs, financing costs and commodity costs and regulatory discretion over authorized return on investment;
|
|
•
|
possibility that our integrated resource plans for electric and natural gas will not be acknowledged by the state commissions;
|
|
•
|
the effect on any or all of the foregoing, resulting from changes in general economic or political factors;
|
1
Energy Commodity Risk
|
•
|
volatility and illiquidity in wholesale energy markets, including the availability of willing buyers and sellers, changes in wholesale energy prices that can affect operating income, cash requirements to purchase electricity and natural gas, value received for wholesale sales, collateral required of us by counterparties in wholesale energy transactions and credit risk to us from such transactions, and the market value of derivative assets and liabilities;
|
|
•
|
default or nonperformance on the part of any parties from whom we purchase and/or sell capacity or energy;
|
|
•
|
potential environmental regulations affecting our ability to utilize or resulting in the obsolescence of our power supply resources;
|
Operational Risk
|
•
|
severe weather or natural disasters, including, but not limited to, avalanches, wind storms, wildfires, earthquakes, snow and ice storms, that can disrupt energy generation, transmission and distribution, as well as the availability and costs of materials, equipment, supplies and support services;
|
|
•
|
explosions, fires, accidents, mechanical breakdowns or other incidents that may impair assets and may disrupt operations of any of our generation facilities, transmission, and electric and natural gas distribution systems or other operations and may require us to purchase replacement power;
|
|
•
|
wildfires, including those caused by our transmission or electric distribution systems that may result in public injuries or property damage;
|
|
•
|
public injuries or damage arising from or allegedly arising from our operations;
|
|
•
|
blackouts or disruptions of interconnected transmission systems (the regional power grid);
|
|
•
|
terrorist attacks, cyber attacks or other malicious acts that may disrupt or cause damage to our utility assets or to the national or regional economy in general, including any effects of terrorism, cyber attacks or vandalism that damage or disrupt information technology systems;
|
|
•
|
work force issues, including changes in collective bargaining unit agreements, strikes, work stoppages, the loss of key executives, availability of workers in a variety of skill areas, and our ability to recruit and retain employees;
|
|
•
|
increasing costs of insurance, more restrictive coverage terms and our ability to obtain insurance;
|
|
•
|
delays or changes in construction costs, and/or our ability to obtain required permits and materials for present or prospective facilities;
|
|
•
|
increasing health care costs and cost of health insurance provided to our employees and retirees;
|
|
•
|
third party construction of buildings, billboard signs, towers or other structures within our rights of way, or placement of fuel receptacles within close proximity to our transformers or other equipment, including overbuild atop natural gas distribution lines;
|
|
•
|
the loss of key suppliers for materials or services or disruptions to the supply chain;
|
|
•
|
adverse impacts to our Alaska operations that could result from an extended outage of its hydroelectric generating resources or their inability to deliver energy, due to their lack of interconnectivity to any other electrical grids and the extensive cost of replacement power (diesel);
|
|
•
|
changing river regulation at hydroelectric facilities not owned by us, which could impact our hydroelectric facilities downstream;
|
Compliance Risk
|
•
|
compliance with extensive federal, state and local legislation and regulation, including numerous environmental, health, safety, infrastructure protection, reliability and other laws and regulations that affect our operations and costs;
|
|
•
|
the ability to comply with the terms of the licenses and permits for our hydroelectric or thermal generating facilities at cost-effective levels;
|
Technology Risk
|
•
|
cyber attacks on us or our vendors or other potential lapses that result in unauthorized disclosure of private information, which could result in liabilities against us, costs to investigate, remediate and defend, and damage to our reputation;
|
2
|
•
|
disruption to or breakdowns of information systems, automated controls and other technologies that we rely on for our operations, communications and customer service;
|
|
•
|
changes in costs that impede our ability to effectively implement new information technology systems or to operate and maintain our current production technology;
|
|
•
|
changes in technologies, possibly making some of the current technology we utilize obsolete or the introduction of new technology that may create new cyber security risk;
|
|
•
|
insufficient technology skills, which could lead to the inability to develop, modify or maintain our information systems;
|
Strategic Risk
|
•
|
growth or decline of our customer base and the extent to which new uses for our services may materialize or existing uses may decline, including, but not limited to, the effect of the trend toward distributed generation at customer sites;
|
|
•
|
potential difficulties in integrating acquired operations and in realizing expected opportunities, diversions of management resources, loss of key employees, challenges with respect to operating new businesses and other unanticipated risks and liabilities;
|
|
•
|
the potential effects of negative publicity regarding business practices, whether true or not, which could result in litigation or a decline in our common stock price;
|
|
•
|
changes in our strategic business plans, which may be affected by any or all of the foregoing, including the entry into new businesses and/or the exit from existing businesses and the extent of our business development efforts where potential future business is uncertain;
|
|
•
|
non-regulated activities may increase earnings volatility;
|
External Mandates Risk
|
•
|
changes in environmental laws, regulations, decisions and policies, including present and potential environmental remediation costs and our compliance with these matters;
|
|
•
|
the potential effects of legislation or administrative rulemaking at the federal, state or local levels, including possible effects on our generating resources of restrictions on greenhouse gas emissions to mitigate concerns over global climate changes;
|
|
•
|
political pressures or regulatory practices that could constrain or place additional cost burdens on our distribution systems through accelerated adoption of distributed generation or electric-powered transportation or on our energy supply sources, such as campaigns to halt coal-fired power generation and opposition to other thermal generation, wind turbines or hydroelectric facilities;
|
|
•
|
wholesale and retail competition including alternative energy sources, growth in customer-owned power resource technologies that displace utility-supplied energy or that may be sold back to the utility, and alternative energy suppliers and delivery arrangements;
|
|
•
|
failure to identify changes in legislation, taxation and regulatory issues which are detrimental or beneficial to our overall business;
|
|
•
|
policy and/or legislative changes resulting from the new presidential administration in various regulated areas, including, but not limited to, potential tax reform, environmental regulation and healthcare regulations; and
|
|
•
|
the risk of municipalization in any of our service territories.
|
Our expectations, beliefs and projections are expressed in good faith. We believe they are reasonably based on, without limitation, an examination of historical operating trends, our records and other information available from third parties. However, there can be no assurance that our expectations, beliefs or projections will be achieved or accomplished. Furthermore, any forward-looking statement speaks only as of the date on which such statement is made. We undertake no obligation to update any forward-looking statement or statements to reflect events or circumstances that occur after the date on which such statement is made or to reflect the occurrence of unanticipated events. New risks, uncertainties and other factors emerge from time-to-time, and it is not possible for us to predict all such factors, nor can we assess the effect of each such factor on our business or the extent that any such factor or combination of factors may cause actual results to differ materially from those contained in any forward-looking statement.
3
Available Information
Our website address is www.avistacorp.com. We make annual, quarterly and current reports available on our website as soon as practicable after electronically filing these reports with the U.S. Securities and Exchange Commission (SEC). Information contained on our website is not part of this report.
COMPANY OVERVIEW
Avista Corp., incorporated in the territory of Washington in 1889, is primarily an electric and natural gas utility with certain other business ventures. As of
December 31, 2016
, we employed
1,742
people in our Pacific Northwest utility operations (Avista Utilities) and
240
people in our subsidiary businesses (including our Juneau, Alaska utility operations). Our corporate headquarters are in Spokane, Washington, the second-largest city in Washington. Spokane serves as the business, transportation, medical, industrial and cultural hub of the Inland Northwest region (eastern Washington and northern Idaho). Regional services include government and higher education, medical services, retail trade and finance. Through our subsidiary AEL&P, we also provide electric utility services in Juneau, Alaska.
As of
December 31, 2016
, we have two reportable business segments as follows:
|
•
|
Avista Utilities
– an operating division of Avista Corp. (not a subsidiary) that comprises our regulated utility operations in the Pacific Northwest. Avista Utilities generates, transmits and distributes electricity and distributes natural gas, serving electric and natural gas customers in eastern Washington and northern Idaho and natural gas customers in parts of Oregon. We also supply electricity to a small number of customers in Montana, most of whom are our employees who operate our Noxon Rapids generating facility. Avista Utilities also engages in wholesale purchases and sales of electricity and natural gas as an integral part of energy resource management and our load-serving obligation.
|
|
•
|
AEL&P
- a utility providing electric services in Juneau, Alaska that is a wholly-owned subsidiary and the primary operating subsidiary of AERC. We acquired AERC on July 1, 2014, and as of that date, AERC became a wholly-owned subsidiary of Avista Corp. See "Note 4 of the Notes to Consolidated Financial Statements" for further discussion regarding this acquisition.
|
We have other businesses, including sheet metal fabrication, venture fund investments, real estate investments, a company that explores markets that could be served with LNG, as well as certain other investments of Avista Capital, which is a direct, wholly owned subsidiary of Avista Corp. These activities do not represent a reportable business segment and are conducted by various direct and indirect subsidiaries of Avista Corp., including AM&D, doing business as METALfx.
Total Avista Corp. shareholders’ equity was
$1,648.7 million
as of
December 31, 2016
, of which
$60.7 million
represented our investment in Avista Capital and
$101.1 million
represented our investment in AERC.
See “Item 6. Selected Financial Data” and “Note 21 of the Notes to Consolidated Financial Statements” for information with respect to the operating performance of each business segment (and other subsidiaries).
AVISTA UTILITIES
General
At the end of
2016
, Avista Utilities supplied retail electric service to
377,000
customers and retail natural gas service to
340,000
customers across its service territory. Avista Utilities' service territory covers
30,000
square miles with a population of
1.6 million
. See “Item 2. Properties” for further information on our utility assets. See “Item 7. Management’s Discussion and Analysis of Financial Condition and Results of Operations – Economic Conditions and Utility Load Growth” for information on economic conditions in our service territory.
Electric Operations
General
Avista Utilities generates, transmits and distributes electricity, serving electric customers in eastern Washington, northern Idaho and a small number of customers in Montana.
Avista Utilities generates electricity from facilities that we own and purchases capacity, energy and fuel for generation under long-term and short-term contracts to meet customer load obligations. We also sell electric capacity and energy, as well as surplus fuel in the wholesale market in connection with our resource optimization activities as described below.
4
As part of Avista Utilities' resource procurement and management operations in the electric business, we engage in an ongoing process of resource optimization, which involves the economic selection of energy resources from those available to serve our load obligations and the capture of additional economic value through market transactions. We engage in transactions in the wholesale markets by selling and purchasing electric capacity and energy, fuel for electric generation, and derivative instruments related to capacity, energy, fuel and fuel transportation. Such transactions are part of the process of matching available resources with load obligations and hedging the related financial risks. These transactions range from terms of intra-hour up to multiple years. We make continuing projections of:
|
•
|
electric loads at various points in time (ranging from intra-hour to multiple years) based on, among other things, estimates of customer usage and weather, historical data and contract terms, and
|
|
•
|
resource availability at these points in time based on, among other things, fuel choices and fuel markets, estimates of streamflows, availability of generating units, historic and forward market information, contract terms and experience.
|
On the basis of these projections, we make purchases and sales of electric capacity and energy, fuel for electric generation, and related derivative instruments to match expected resources to expected electric load requirements and reduce our exposure to electricity (or fuel) market price changes. Resource optimization involves scheduling and dispatching available resources as well as the following:
|
•
|
purchasing fuel for generation,
|
|
•
|
when economical, selling fuel and substituting wholesale electric purchases, and
|
|
•
|
other wholesale transactions to capture the value of generating resources, transmission contract rights and fuel delivery (transport) capacity contracts.
|
This optimization process includes entering into hedging transactions to manage risks. Transactions include both physical energy contracts and related derivative instruments.
Avista Utilities' generation assets are interconnected through the regional transmission system and are operated on a coordinated basis to enhance load-serving capability and reliability. Avista acquires both long-term and short-term transmission capacity to facilitate all of our energy and capacity transactions. We provide transmission and ancillary services in eastern Washington, northern Idaho and western Montana.
Electric Requirements
Avista Utilities' peak electric native load requirement for
2016
was
1,655
MW, which occurred on
December 17, 2016
. In
2015
, our peak electric native load was
1,638
MW, which occurred during the summer, and in
2014
, it was
1,715
MW, which occurred during the winter.
Electric Resources
Avista Utilities has a diverse electric resource mix of Company-owned and contracted hydroelectric, thermal and wind generation facilities, and other contracts for power purchases and exchanges.
At the end of
2016
, our Company-owned facilities had a total net capability of
1,862
MW, of which
55 percent
was hydroelectric and
45 percent
was thermal. See “Item 2. Properties” for detailed information on generating facilities.
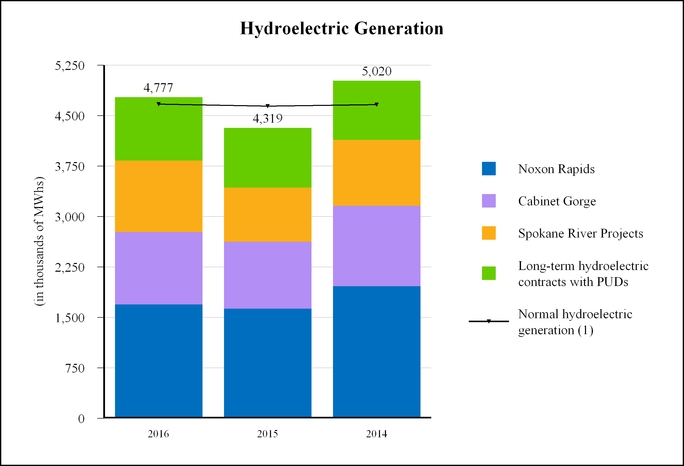
Hydroelectric Resources
Avista Utilities owns and operates six hydroelectric projects on the Spokane River and two hydroelectric projects on the Clark Fork River. Hydroelectric generation is typically our lowest cost source per MWh of electric energy and the availability of hydroelectric generation has a significant effect on total power supply costs. Under normal streamflow and operating conditions, we estimate that we would be able to meet approximately one-half of our total average electric requirements (both retail and long-term wholesale) with the combination of our hydroelectric generation and long-term hydroelectric purchase contracts with certain PUDs in the state of Washington. Our estimate of normal annual hydroelectric generation for
2017
(including resources purchased under long-term hydroelectric contracts with certain PUDs) is 538 aMW (or 4.7 million MWhs).
5
The following graph shows Avista Utilities' hydroelectric generation (in thousands of MWhs) during the year ended December 31:
|
(1)
|
Normal hydroelectric generation is determined by applying an upstream dam regulation calculation to median natural water flow information. Natural water flow is the flow of the rivers without the influence of dams, whereas regulated water flow takes into account any water flow changes from upstream dams due to releasing or holding back water. The calculation of normal varies annually due to the timing of upstream dam regulation throughout the year.
|
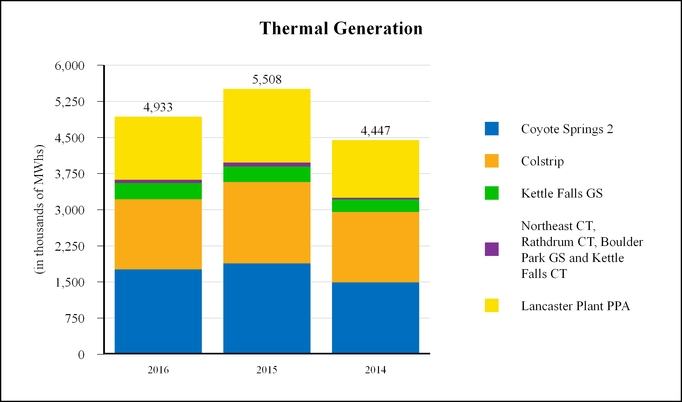
Thermal Resources
Avista Utilities owns the following thermal generating resources:
|
•
|
the combined cycle CT natural gas-fired Coyote Springs 2 located near Boardman, Oregon,
|
|
•
|
a 15 percent interest in a twin-unit, coal-fired boiler generating facility, Colstrip 3 & 4, located in southeastern Montana,
|
|
•
|
a wood waste-fired boiler generating facility known as the Kettle Falls Generating Station (Kettle Falls GS) in northeastern Washington,
|
|
•
|
a two-unit natural gas-fired CT generating facility, located in northeastern Spokane (Northeast CT),
|
|
•
|
a two-unit natural gas-fired CT generating facility in northern Idaho (Rathdrum CT), and
|
|
•
|
two small natural gas-fired generating facilities (Boulder Park GS and Kettle Falls CT).
|
Coyote Springs 2, which is operated by Portland General Electric Company, is supplied with natural gas under a combination of term contracts and spot market purchases, including transportation agreements with bilateral renewal rights.
Colstrip, which is operated by Talen Energy LLC, is supplied with fuel from adjacent coal reserves under coal supply and transportation agreements in effect through 2019. During 2016, Talen Energy LLC provided notice to the Colstrip owners that it no longer plans to operate units 3 & 4 after May 2018. The Colstrip owners are searching for a replacement operator for units 3 & 4. In addition, see “Item 7. Management's Discussion and Analysis, Environmental Issues and Contingencies" for further discussion regarding environmental issues surrounding Colstrip.
6
The primary fuel for the Kettle Falls GS is wood waste generated as a by-product and delivered by trucks from forest industry operations within 100 miles of the plant. A combination of long-term contracts and spot purchases has provided, and is expected to meet, fuel requirements for the Kettle Falls GS.
The Northeast CT, Rathdrum CT, Boulder Park GS and Kettle Falls CT generating units are primarily used to meet peaking electric requirements. We also operate these facilities when marginal costs are below prevailing wholesale electric prices. These generating facilities have access to natural gas supplies that are adequate to meet their respective operating needs.
See "Item 2. Properties - Avista Utilities - Generation Properties" for the nameplate rating and present generating capabilities of the above thermal resources.
We have the exclusive rights to all the capacity of the Lancaster Plant, a 270 MW natural gas-fired combined cycle combustion turbine plant located in northern Idaho, owned by an unrelated third-party. All of the output from the Lancaster Plant is contracted to us through 2026 under a PPA. Under the terms of the PPA, we make the dispatch decisions, provide all natural gas fuel and receive all of the electric energy output from the Lancaster Plant; therefore, we consider this plant in our baseload resources. See "Note 3 of the Notes to Consolidated Financial Statements" for further discussion of this PPA.
The following graph shows Avista Utilities' thermal generation (in thousands of MWhs) during the year ended December 31:
Wind Resources
We have exclusive rights to all the capacity of Palouse Wind, a wind generation project developed, owned and managed by an unrelated third-party and located in Whitman County, Washington. We have a PPA that expires in 2042 and allows us to acquire all of the power and renewable attributes produced by the project at a fixed price per MWh with a fixed escalation of the price over the term of the agreement. The project has a nameplate capacity of 105 MW. Generation from Palouse Wind was
349,771
MWhs in
2016
,
293,563
MWhs in
2015
and
335,291
MWhs in
2014
. We have an annual option to purchase the wind project beginning in December 2022. The purchase price per the PPA is a fixed price per KW of in-service capacity with a fixed decline in the price per KW over the remaining 20-year term of the agreement. Under the terms of the PPA, we do not have any input into the day-to-day operation of the project, including maintenance decisions. All such rights are held by the owner.
Other Purchases, Exchanges and Sales
In addition to the resources described above, we purchase and sell power under various long-term contracts, and we also enter into short-term purchases and sales. Further, pursuant to PURPA, as amended, we are required to purchase generation from qualifying facilities. This includes, among other resources, hydroelectric projects, cogeneration projects and wind generation projects at rates approved by the UTC and the IPUC.
7
See “Avista Utilities Electric Operating Statistics – Electric Operations” for annual quantities of purchased power, wholesale power sales and power from exchanges in
2016
,
2015
and
2014
. See “Electric Operations” above for additional information with respect to the use of wholesale purchases and sales as part of our resource optimization process and also see "Future Resource Needs" below for the magnitude of these power purchase and sales contracts in future periods.
Hydroelectric Licenses
Avista Corp. is a licensee under the Federal Power Act (FPA) as administered by the FERC, which includes regulation of hydroelectric generation resources. Excluding the Little Falls Hydroelectric Generating Project (Little Falls), our other seven hydroelectric plants are regulated by the FERC through two project licenses. The licensed projects are subject to the provisions of Part I of the FPA. These provisions include payment for headwater benefits, condemnation of licensed projects upon payment of just compensation, and take-over by the federal government of such projects after the expiration of the license upon payment of the lesser of “net investment” or “fair value” of the project, in either case, plus severance damages. In the unlikely event that a take-over occurs, it could lead to either the decommissioning of the hydroelectric project or offering the project to another party (likely through sale and transfer of the license).
Cabinet Gorge and Noxon Rapids are under one 45-year FERC license issued in March 2001. See “Cabinet Gorge Total Dissolved Gas Abatement Plan” in “Note 19 of the Notes to Consolidated Financial Statements” for discussion of dissolved atmospheric gas levels that exceed state of Idaho and federal numeric water quality standards downstream of Cabinet Gorge during periods when we must divert excess river flows over the spillway, as well as our mitigation plans and efforts.
Five of our six hydroelectric projects on the Spokane River (Long Lake, Nine Mile, Upper Falls, Monroe Street and Post Falls) are under one 50-year FERC license issued in June 2009 and are referred to collectively as the Spokane River Project. The sixth, Little Falls, is operated under separate Congressional authority and is not licensed by the FERC.
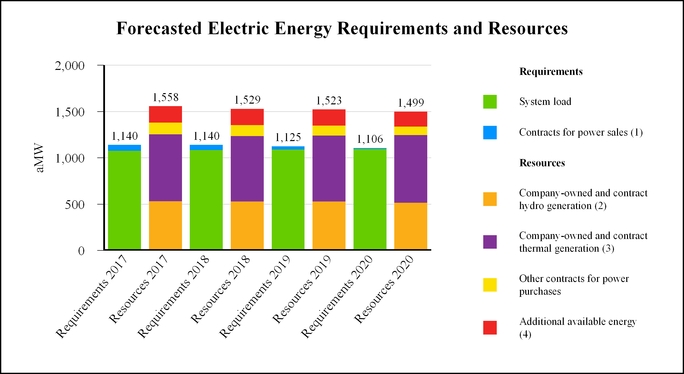
Future Resource Needs
Avista Utilities has operational strategies to provide sufficient resources to meet our energy requirements under a range of operating conditions. These operational strategies consider the amount of energy needed, which varies widely because of the factors that influence demand over intra-hour, hourly, daily, monthly and annual durations. Our average hourly load was
1,033
aMW in
2016
,
1,047
aMW in
2015
and
1,062
aMW in
2014
.
The following graph shows our forecast of our average annual energy requirements and our available resources for
2017
through
2020
:
8
|
(1)
|
The contracts for power sales decrease due to certain contracts expiring in each of these years. We are evaluating the future plan for the additional resources made available due to the expiration of these contracts.
|
|
(2)
|
The forecast assumes near normal hydroelectric generation.
|
|
(3)
|
Includes the Lancaster Plant PPA. Excludes Boulder Park GS, Kettle Falls CT, Northeast CT and Rathdrum CT, as these are considered peaking facilities and are generally not used to meet our base load requirements.
|
|
(4)
|
The combined maximum capacity of Boulder Park GS, Kettle Falls CT, Northeast CT and Rathdrum CT is 278 MW, with estimated available energy production as indicated for each year.
|
In August 2015, we filed our 2015 Electric IRP with the UTC and the IPUC. The UTC and IPUC review the IRPs and give the public the opportunity to comment. The UTC and IPUC do not approve or disapprove of the content in the IRPs; rather they acknowledge that the IRPs were prepared in accordance with applicable standards if that is the case. The IRP details projected growth in demand for energy and the new resources needed to serve customers over the next 20 years. We regard the IRP as a tool for resource evaluation, rather than an acquisition plan for a particular project.
Highlights of the 2015 IRP include the following expectations and projections:
|
•
|
We will have adequate resources between our owned and contractually controlled generation, combined with conservation and market purchases, to meet customer needs through 2020.
|
|
•
|
565 MW of additional generation capacity is required for the period 2020 through 2034.
|
|
•
|
We will meet or exceed the renewable energy requirements of the Washington state Energy Independence Act through the 20-year IRP time frame with a combination of qualifying hydroelectric upgrades, the 30-year PPA with Palouse Wind, the Kettle Falls GS and selective REC purchases.
|
|
•
|
Load growth will be approximately 0.6 percent, a decline from the growth of 1.0 percent forecasted in 2013. This delays the need for a new natural gas-fired resource by one year. The decrease in expected load growth is primarily due to energy efficiency programs (using less energy to perform activities) employed by our customers over the next 20 years and the load impacts of increased prices. See "Item 7. Management Discussion and Analysis – Economic Conditions and Utility Load Growth" for further discussion regarding utility customer growth, load growth, and the general economic conditions in our service territory. The estimates of future load growth in the IRP and at "Item 7. Management Discussion and Analysis – Economic Conditions and Utility Load Growth" differ slightly due to the timing of when the two estimates were prepared and due to the time period that each estimate is focused on.
|
|
•
|
Colstrip will remain a cost effective and reliable source of power to meet future customer needs.
|
|
•
|
Energy efficiency will offset more than half of projected load growth through the 20-year IRP time frame.
|
Demand response (temporarily reducing the demand for energy) was eliminated from the Preferred Resource Strategy due to higher estimated costs.
We are required to file an IRP every two years, with the next IRP expected to be filed during the third quarter of 2017. Our resource strategy may change from the 2015 IRP based on market, legislative and regulatory developments.
We are subject to the Washington state Energy Independence Act, which requires us to obtain a portion of our electricity from qualifying renewable resources or through purchase of RECs and acquiring all cost effective conservation measures. Future generation resource decisions will be impacted by legislation for restrictions on GHG emissions and renewable energy requirements.
See “Item 7. Management’s Discussion and Analysis of Financial Condition – Environmental Issues and Contingencies” for information related to existing laws, as well as potential legislation that could influence our future electric resource mix.
Natural Gas Operations
General
Avista Utilities provides natural gas distribution services to retail customers in parts of eastern Washington, northern Idaho, and northeastern and southwestern Oregon.
Market prices for natural gas, like other commodities, can be volatile. Our natural gas procurement strategy is to provide a reliable supply to our customers with some level of price certainty. We procure natural gas from various supply basins and over varying time periods. The resulting portfolio is a diversified mix of forward fixed price purchases, index and spot market purchases, utilizing physical and financial derivative instruments. We also use natural gas storage to support high demand periods and to procure natural gas when prices may be lower. Securing prices throughout the year and even into subsequent years provides a level of price certainty and can mitigate price volatility to customers between years.
9
Weather is a key component of our natural gas customer load. This load is highly variable and daily natural gas loads can differ significantly from the monthly forecasted load projections. We make continuing projections of our natural gas loads and assess available natural gas resources. On the basis of these projections, we plan and execute a series of transactions to hedge a portion of our customers' projected natural gas requirements through forward market transactions and derivative instruments. These transactions may extend for multiple years into the future. We also leave a portion of our natural gas supply requirements unhedged for purchase in the short-term spot markets.
Our purchase of natural gas supply is governed by our procurement plan and is reviewed and approved annually by the Risk Management Committee (RMC), which is comprised of certain officers and other management personnel. Once approval is received, the plan is implemented and monitored by our gas supply and risk management groups.
The plan’s progress is also presented to the UTC and IPUC staff in semi-annual meetings, and updates are given to the OPUC staff quarterly. Other stakeholders, such as the Public Counsel Unit of the Office of the Attorney General or the Citizen Utility Board, are invited to participate. The RMC is provided with an update on plan results and changes in their monthly meetings. These activities provide transparency for the natural gas supply procurement plan. Any material changes to the plan are documented and communicated to RMC members.
As part of the process of balancing natural gas retail load requirements with resources, we engage in the wholesale purchase and sale of natural gas. We plan for sufficient natural gas delivery capacity to serve our retail customers for a theoretical peak day event. As such, we generally have more pipeline and storage capacity than what is needed during periods other than a peak day. We optimize our natural gas resources by using market opportunities to generate economic value that helps mitigate fixed costs. Wholesale sales are delivered through wholesale market facilities outside of our natural gas distribution system. Natural gas resource optimization activities include, but are not limited to:
|
•
|
wholesale market sales of surplus natural gas supplies,
|
|
•
|
purchases and sales of natural gas to optimize use of pipeline and storage capacity, and
|
|
•
|
participation in the transportation capacity release market.
|
We also provide distribution transportation service to qualified, large commercial and industrial natural gas customers who purchase natural gas through third-party marketers. For these customers, we receive their purchased natural gas from such third-party marketers into our distribution system and deliver it to the customers’ premise.
Optimization transactions that we engage in throughout the year are included in our annual purchased gas cost adjustment filings with the various commissions and they are subject to review for prudence during this process.
Natural Gas Supply
Avista Utilities purchases all of its natural gas in wholesale markets. We are connected to multiple supply basins in the western United States and Canada through firm capacity transportation rights on six different pipeline networks. Access to this diverse portfolio of natural gas resources allows us to make natural gas procurement decisions that benefit our natural gas customers. These interstate pipeline transportation rights provide the capacity to serve approximately 25 percent of peak natural gas customer demands from domestic sources and 75 percent from Canadian sourced supply. Natural gas prices in the Pacific Northwest are affected by global energy markets, as well as supply and demand factors in other regions of the United States and Canada. Future prices and delivery constraints may cause our resource mix to vary.
Natural Gas Storage
Avista Utilities owns a one-third interest in Jackson Prairie, an underground aquifer natural gas storage field located near Chehalis, Washington. Jackson Prairie has a total peak day deliverability of
12 million
therms, with a total working natural gas capacity of
256 million
therms. As an owner, our share is one-third of the peak day deliverability and total working capacity. We also contract for additional storage capacity and delivery at Jackson Prairie from Northwest Pipeline for a portion of their one-third share of the storage project.
We optimize our natural gas storage capacity throughout the year by executing transactions that capture favorable market price spreads. Natural gas buyers identify opportunities to purchase lower cost natural gas in the immediate term to inject into storage, and then sell the gas in a forward market to be withdrawn at a later time. The reverse of this type of transaction also occurs. These transactions lock in incremental value for customers. Jackson Prairie is also used as a variable peaking resource, and to protect from extreme daily price volatility during cold weather or other events affecting the market.
Future Resource Needs
In August 2016, we filed our 2016 Natural Gas IRP with the UTC, IPUC and the OPUC. The natural gas IRPs are similar in nature to the electric IRPs and the process for preparation and review by the state commissions of both the electric and natural gas IRPs is similar. The IRP details projected growth in demand for energy and the new resources
10
needed to serve customers over the next 20 years. We regard the IRP as a tool for resource evaluation, rather than an acquisition plan for a particular project.
Highlights of the 2016 natural gas IRP include the following expectations and projections:
|
•
|
We will have sufficient natural gas transportation resources well into the future with resource needs not occurring during the 20-year planning horizon in Washington, Idaho, or Oregon.
|
|
•
|
Natural gas commodity prices will continue to be relatively stable due to robust North American supplies led by shale gas development.
|
|
•
|
Future customer growth in our service territory will increase slightly compared to the 2014 IRP. There will be increasing interest from customers to utilize natural gas due to its abundant supply and subsequent low cost. We anticipate that increased demand in the region will primarily come from power generation as natural gas is increasingly being used to back up solar and wind technology, as well as replace retired coal plants. There is also potential for increased usage in other markets, such as transportation and as an industrial feedstock.
|
|
•
|
The availability of natural gas in North America will continue to change global LNG dynamics. Existing and new LNG facilities will look to export low cost North American natural gas to the higher priced Asian and European markets. This could alter the price of natural gas and/or transportation, constrain existing pipeline networks, stimulate development of new pipeline resources, and change flows of natural gas across North America.
|
Since forecasted demand is relatively flat, we will monitor actual demand for signs of increased growth which could accelerate resource needs.
Our resource strategy in our 2018 IRP may change from the 2016 IRP based on market, legislative and regulatory developments.
Regulatory Issues
General
As a public utility, Avista Corp. is subject to regulation by state utility commissions for prices, accounting, the issuance of securities and other matters. The retail electric and natural gas operations are subject to the jurisdiction of the UTC, IPUC, OPUC and MPSC. Approval of the issuance of securities is not required from the MPSC. We are also subject to the jurisdiction of the FERC for licensing of hydroelectric generation resources, and for electric transmission services and wholesale sales.
Since Avista Corp. is a “holding company” (in addition to being itself an operating utility), we are also subject to the jurisdiction of the FERC under the Public Utility Holding Company Act of 2005, which imposes certain reporting and other requirements. We, and all of our subsidiaries (whether or not engaged in any energy related business), are required to maintain books, accounts and other records in accordance with the FERC regulations and to make them available to the FERC and the state utility commissions. In addition, upon the request of any jurisdictional state utility commission, or of Avista Corp., the FERC would have the authority to review assignment of costs of non-power goods and administrative services among us and our subsidiaries. The FERC has the authority generally to require that rates subject to its jurisdiction be just and reasonable and in this context would continue to be able to, among other things, review transactions of any affiliated company.
Our rates for retail electric and natural gas services (other than specially negotiated retail rates for industrial or large commercial customers, which are subject to regulatory review and approval) are generally determined on a “cost of service” basis.
Rates are designed to provide an opportunity for us to recover allowable operating expenses and earn a return of and a reasonable return on “rate base.” Rate base is generally determined by reference to the original cost (net of accumulated depreciation) of utility plant in service, subject to various adjustments for deferred income taxes and other items. Over time, rate base is increased by additions to utility plant in service and reduced by depreciation and retirement of utility plant and write-offs as authorized by the utility commissions. Our operating expenses and rate base are allocated or directly assigned to five regulatory jurisdictions: electric in Washington and Idaho, and natural gas in Washington, Idaho and Oregon. In general, requests for new retail rates are made on the basis of revenues, operating expenses and net investment for a test year that ended prior to the date of the request, subject to possible adjustments, which differ among the various jurisdictions, designed to reflect the expected revenues, operating expenses and net investment during the period new retail rates will be in effect. The retail rates approved by the state commissions in a rate proceeding may not provide sufficient revenues to provide recovery of costs and a reasonable return on investment for a number of reasons, including, but not limited to, unexpected changes in revenues, expenses and investment following the time new retail rates are requested in the rate proceeding, the denial by the commission
11
of recovery, or timely recovery, of certain expenses or investment and the limitation by the commission of the authorized return on investment.
Our rates for wholesale electric and natural gas transmission services are based on either “cost of service” principles or market-based rates as set forth by the FERC. See “Notes 1 and 20 of the Notes to Consolidated Financial Statements” for additional information about regulation, depreciation and deferred income taxes.
General Rate Cases
Avista Utilities regularly reviews the need for electric and natural gas rate changes in each state in which we provide service. See “Item 7. Management’s Discussion and Analysis – Regulatory Matters – General Rate Cases” for information on general rate case activity.
Power Cost Deferrals
Avista Utilities defers the recognition in the income statement of certain power supply costs that vary from the level currently recovered from our retail customers as authorized by the UTC and the IPUC. See “Item 7. Management’s Discussion and Analysis – Regulatory Matters – Power Cost Deferrals and Recovery Mechanisms” and “Note 20 of the Notes to Consolidated Financial Statements” for information on power cost deferrals and recovery mechanisms in Washington and Idaho.
Purchased Gas Adjustment (PGA)
Under established regulatory practices in each state, Avista Utilities defers the recognition in the income statement of the natural gas costs that vary from the level currently recovered from our retail customers as authorized by each of our jurisdictions. See “Item 7. Management’s Discussion and Analysis – Regulatory Matters – Purchased Gas Adjustments” and “Note 20 of the Notes to Consolidated Financial Statements” for information on natural gas cost deferrals and recovery mechanisms in Washington, Idaho and Oregon.
Decoupling and Earnings Sharing Mechanisms
Decoupling is a mechanism designed to sever the link between a utility's revenues and consumers' energy usage. In each of Avista Utilities' jurisdictions, each month Avista Utilities' electric and natural gas revenues are adjusted so as to reflect revenues based on the number of customers in certain customer rate classes, rather than kilowatt hour and therm sales. The difference between revenues based on the number of customers and revenues based on actual usage is deferred, and either surcharged or rebated to customers beginning in the following year. In conjunction with the decoupling mechanisms, Washington includes an after-the-fact earnings test. At the end of each calendar year, earnings calculations are made for the prior calendar year and a portion of any earnings above a certain threshold are deferred and later returned to customers. Oregon also has an annual earnings review, not directly associated with the decoupling mechanism, where earnings above a certain threshold are deferred and later returned to customers. See “Item 7. Management’s Discussion and Analysis – Regulatory Matters – Decoupling and Earnings Sharing Mechanisms” for further discussion of these mechanisms.
Federal Laws Related to Wholesale Competition
Federal law promotes practices that foster competition in the electric wholesale energy market. The FERC requires electric utilities to transmit power and energy to or for wholesale purchasers and sellers, and requires electric utilities to enhance or construct transmission facilities to create additional transmission capacity for the purpose of providing these services. Public utilities (through subsidiaries or affiliates) and other entities may participate in the development of independent electric generating plants for sales to wholesale customers.
Public utilities operating under the FPA are required to provide open and non-discriminatory access to their transmission systems to third parties and establish an Open Access Same-Time Information System to provide an electronic means by which transmission customers can obtain information about available transmission capacity and purchase transmission access. The FERC also requires each public utility subject to the rules to operate its transmission and wholesale power merchant operating functions separately and to comply with standards of conduct designed to ensure that all wholesale users, including the public utility’s power merchant operations, have equal access to the public utility’s transmission system. Our compliance with these standards has not had any substantive impact on the operation, maintenance and marketing of our transmission system or our ability to provide service to customers.
See “Item 7. Management’s Discussion and Analysis – Competition” for further information.
Regional Transmission Organizations
Beginning with FERC Order No. 888 and continuing with subsequent rulemakings and policies, the FERC has encouraged better coordination and operational consistency aimed to capture efficiencies that might otherwise be gained through the formation of a Regional Transmission Organization or an independent system operator (ISO).
12
Regional Transmission Planning
Avista Utilities meets its FERC requirements to coordinate transmission planning activities with other regional entities through ColumbiaGrid. ColumbiaGrid is a Washington nonprofit membership corporation with an independent board formed to improve the operational efficiency, reliability, and planned expansion of the transmission grid in the Pacific Northwest. We became a member of ColumbiaGrid in 2006 during its formation. ColumbiaGrid is not an ISO, but performs those functions that its members request from time to time. Currently, ColumbiaGrid fills the role of facilitating our regional transmission planning as required in FERC Order No. 1000 and other clarifying FERC Orders. ColumbiaGrid and its members also work with other western organizations to address transmission planning, including WestConnect and the Northern Tier Transmission Group (NTTG). In 2011, we became a registered Planning Participant of the NTTG. We will continue to assess the benefits of entering into other functional agreements with ColumbiaGrid and/or participating in other forums to attain operational efficiencies and to meet FERC policy objectives.
Regional Energy Markets
The California Independent System Operator (CAISO) recently implemented an EIM in the western United States. Most investor-owned utilities in the Pacific Northwest are either participants in the CAISO EIM or plan to integrate into the market in the near future, which could reduce bilateral market liquidity and opportunities for wholesale transactions in the Pacific Northwest. Avista Utilities will continue to monitor the CAISO EIM expansion and the associated impacts. As market fundamentals and our business needs evolve, we will weigh the advantages and disadvantages of joining the CAISO EIM or other organized energy markets in the future.
Reliability Standards
Among its other provisions, the U.S. Energy Policy Act provides for the implementation of mandatory reliability standards and authorizes the FERC to assess penalties for non-compliance with these standards and other FERC regulations.
The FERC certified the NERC as the single Electric Reliability Organization authorized to establish and enforce reliability standards and delegate authority to regional entities for the purpose of establishing and enforcing reliability standards. The FERC approved the NERC Reliability Standards, including western region standards, making up the set of legally enforceable standards for the United States bulk electric system. The first of these reliability standards became effective in 2007. We are required to self-certify our compliance with these standards on an annual basis and undergo regularly scheduled periodic reviews by the NERC and its regional entity, the Western Electricity Coordinating Council (WECC). Our failure to comply with these standards could result in financial penalties of up to $1 million per day per violation. Annual self-certification and audit processes to date have demonstrated our substantial compliance with these standards. Requirements relating to cyber security are continually evolving. Our compliance with version 5 of the NERC's Critical Infrastructure Protection standard continues to drive several physical security initiatives at our generating stations and substations. We do not expect the costs of these physical security initiatives to have a material impact on our financial results.
13
AVISTA UTILITIES ELECTRIC OPERATING STATISTICS
|
|
Years Ended December 31,
|
||||||||||
|
|
2016
|
2015
|
2014
|
||||||||
|
ELECTRIC OPERATIONS
|
|||||||||||
|
OPERATING REVENUES (Dollars in Thousands):
|
|||||||||||
|
Residential
|
$
|
339,210
|
|
$
|
335,552
|
|
$
|
338,697
|
|
||
|
Commercial
|
305,613
|
|
308,210
|
|
300,109
|
|
|||||
|
Industrial
|
107,296
|
|
111,770
|
|
110,775
|
|
|||||
|
Public street and highway lighting
|
7,662
|
|
7,277
|
|
7,549
|
|
|||||
|
Total retail
|
759,781
|
|
762,809
|
|
757,130
|
|
|||||
|
Wholesale
|
112,071
|
|
127,253
|
|
138,162
|
|
|||||
|
Sales of fuel
|
78,334
|
|
82,853
|
|
83,732
|
|
|||||
|
Other
|
28,492
|
|
25,839
|
|
27,467
|
|
|||||
|
Decoupling
|
17,349
|
|
4,740
|
|
—
|
|
|||||
|
Provision for earnings sharing
|
932
|
|
(5,621
|
)
|
(7,503
|
)
|
|||||
|
Total electric operating revenues
|
$
|
996,959
|
|
$
|
997,873
|
|
$
|
998,988
|
|
||
|
ENERGY SALES (Thousands of MWhs):
|
|||||||||||
|
Residential
|
3,528
|
|
3,571
|
|
3,694
|
|
|||||
|
Commercial
|
3,183
|
|
3,197
|
|
3,189
|
|
|||||
|
Industrial
|
1,763
|
|
1,812
|
|
1,868
|
|
|||||
|
Public street and highway lighting
|
23
|
|
23
|
|
25
|
|
|||||
|
Total retail
|
8,497
|
|
8,603
|
|
8,776
|
|
|||||
|
Wholesale
|
2,998
|
|
3,145
|
|
3,686
|
|
|||||
|
Total electric energy sales
|
11,495
|
|
11,748
|
|
12,462
|
|
|||||
|
ENERGY RESOURCES (Thousands of MWhs):
|
|||||||||||
|
Hydro generation (from Company facilities)
|
3,836
|
|
3,434
|
|
4,143
|
|
|||||
|
Thermal generation (from Company facilities)
|
3,626
|
|
3,983
|
|
3,252
|
|
|||||
|
Purchased power
|
4,597
|
|
4,899
|
|
5,615
|
|
|||||
|
Power exchanges
|
(6
|
)
|
(2
|
)
|
(25
|
)
|
|||||
|
Total power resources
|
12,053
|
|
12,314
|
|
12,985
|
|
|||||
|
Energy losses and Company use
|
(558
|
)
|
(566
|
)
|
(523
|
)
|
|||||
|
Total energy resources (net of losses)
|
11,495
|
|
11,748
|
|
12,462
|
|
|||||
|
NUMBER OF RETAIL CUSTOMERS (Average for Period):
|
|||||||||||
|
Residential
|
330,699
|
|
327,057
|
|
324,188
|
|
|||||
|
Commercial
|
41,785
|
|
41,296
|
|
40,988
|
|
|||||
|
Industrial
|
1,342
|
|
1,353
|
|
1,385
|
|
|||||
|
Public street and highway lighting
|
558
|
|
529
|
|
531
|
|
|||||
|
Total electric retail customers
|
374,384
|
|
370,235
|
|
367,092
|
|
|||||
|
RESIDENTIAL SERVICE AVERAGES:
|
|||||||||||
|
Annual use per customer (KWh) (1)
|
10,667
|
|
10,827
|
|
11,394
|
|
|||||
|
Revenue per KWh (in cents)
|
9.62
|
|
9.40
|
|
9.17
|
|
|||||
|
Annual revenue per customer
|
$
|
1,025.74
|
|
$
|
1,017.21
|
|
$
|
1,044.76
|
|
||
|
AVERAGE HOURLY LOAD (aMW)
|
1,033
|
|
1,047
|
|
1,062
|
|
|||||
14
AVISTA UTILITIES ELECTRIC OPERATING STATISTICS
|
|
Years Ended December 31,
|
|||||||
|
|
2016
|
2015
|
2014
|
|||||
|
RETAIL NATIVE LOAD at time of system peak (MW):
|
||||||||
|
Winter
|
1,655
|
|
1,529
|
|
1,715
|
|
||
|
Summer
|
1,587
|
|
1,638
|
|
1,606
|
|
||
|
COOLING DEGREE DAYS: (2)
|
||||||||
|
Spokane, WA
|
||||||||
|
Actual
|
474
|
|
805
|
|
631
|
|
||
|
Historical average
|
367
|
|
334
|
|
394
|
|
||
|
% of average
|
129
|
%
|
241
|
%
|
160
|
%
|
||
|
HEATING DEGREE DAYS: (3)
|
||||||||
|
Spokane, WA
|
||||||||
|
Actual
|
5,790
|
|
5,614
|
|
6,215
|
|
||
|
Historical average
|
6,482
|
|
6,491
|
|
6,820
|
|
||
|
% of average
|
89
|
%
|
86
|
%
|
91
|
%
|
||
|
(1)
|
There has been a trending decline in use per customer during the three-year period primarily due to weather fluctuations but also due in part to energy efficiency measures adopted by customers.
|
|
(2)
|
Cooling degree days are the measure of the warmness of weather experienced, based on the extent to which the average of high and low temperatures for a day exceeds 65 degrees Fahrenheit (annual degree days above historic indicate warmer than average temperatures). In 2015, we switched to a rolling 20-year average for calculating cooling degree days, whereas in prior years we used a 30-year rolling average.
|
|
(3)
|
Heating degree days are the measure of the coldness of weather experienced, based on the extent to which the average of high and low temperatures for a day falls below 65 degrees Fahrenheit (annual degree days below historic indicate warmer than average temperatures). In 2015, we switched to a rolling 20-year average for calculating heating degree days, whereas in prior years we used a 30-year rolling average.
|
15
AVISTA UTILITIES NATURAL GAS OPERATING STATISTICS
|
|
Years Ended December 31,
|
||||||||||
|
|
2016
|
2015
|
2014
|
||||||||
|
NATURAL GAS OPERATIONS
|
|||||||||||
|
OPERATING REVENUES (Dollars in Thousands):
|
|||||||||||
|
Residential
|
$
|
195,275
|
|
$
|
193,825
|
|
$
|
203,373
|
|
||
|
Commercial
|
92,978
|
|
96,751
|
|
103,179
|
|
|||||
|
Interruptible
|
2,179
|
|
2,782
|
|
2,792
|
|
|||||
|
Industrial
|
3,348
|
|
3,792
|
|
4,158
|
|
|||||
|
Total retail
|
293,780
|
|
297,150
|
|
313,502
|
|
|||||
|
Wholesale
|
153,446
|
|
204,289
|
|
228,187
|
|
|||||
|
Transportation
|
8,339
|
|
7,988
|
|
7,735
|
|
|||||
|
Other
|
5,787
|
|
5,578
|
|
7,461
|
|
|||||
|
Decoupling
|
12,309
|
|
6,004
|
|
—
|
|
|||||
|
Provision for earnings sharing
|
(2,767
|
)
|
—
|
|
(221
|
)
|
|||||
|
Total natural gas operating revenues
|
$
|
470,894
|
|
$
|
521,009
|
|
$
|
556,664
|
|
||
|
THERMS DELIVERED (Thousands of Therms):
|
|||||||||||
|
Residential
|
186,565
|
|
176,613
|
|
190,171
|
|
|||||
|
Commercial
|
112,686
|
|
107,894
|
|
116,748
|
|
|||||
|
Interruptible
|
5,700
|
|
4,708
|
|
5,033
|
|
|||||
|
Industrial
|
5,234
|
|
5,070
|
|
5,648
|
|
|||||
|
Total retail
|
310,185
|
|
294,285
|
|
317,600
|
|
|||||
|
Wholesale
|
684,317
|
|
809,132
|
|
545,620
|
|
|||||
|
Transportation
|
178,377
|
|
164,679
|
|
162,311
|
|
|||||
|
Interdepartmental and Company use
|
378
|
|
335
|
|
411
|
|
|||||
|
Total therms delivered
|
1,173,257
|
|
1,268,431
|
|
1,025,942
|
|
|||||
|
NUMBER OF RETAIL CUSTOMERS (Average for Period):
|
|||||||||||
|
Residential
|
300,883
|
|
296,005
|
|
291,928
|
|
|||||
|
Commercial
|
34,868
|
|
34,229
|
|
34,047
|
|
|||||
|
Interruptible
|
37
|
|
35
|
|
37
|
|
|||||
|
Industrial
|
255
|
|
261
|
|
264
|
|
|||||
|
Total natural gas retail customers
|
336,043
|
|
330,530
|
|
326,276
|
|
|||||
|
RESIDENTIAL SERVICE AVERAGES:
|
|||||||||||
|
Annual use per customer (therms)
|
620
|
|
593
|
|
651
|
|
|||||
|
Revenue per therm (in dollars)
|
$
|
1.05
|
|
$
|
1.10
|
|
$
|
1.07
|
|
||
|
Annual revenue per customer
|
$
|
649.01
|
|
$
|
650.83
|
|
$
|
696.66
|
|
||
|
HEATING DEGREE DAYS: (1)
|
|||||||||||
|
Spokane, WA
|
|||||||||||
|
Actual
|
5,790
|
|
5,614
|
|
6,215
|
|
|||||
|
Historical average (2)
|
6,482
|
|
6,491
|
|
6,820
|
|
|||||
|
% of average
|
89
|
%
|
86
|
%
|
91
|
%
|
|||||
|
Medford, OR
|
|||||||||||
|
Actual
|
3,637
|
|
3,534
|
|
3,382
|
|
|||||
|
Historical average (2)
|
4,129
|
|
4,150
|
|
4,539
|
|
|||||
|
% of average
|
88
|
%
|
85
|
%
|
75
|
%
|
|||||
|
(1)
|
Heating degree days are the measure of the coldness of weather experienced, based on the extent to which the average of high and low temperatures for a day falls below 65 degrees Fahrenheit (annual degree days below historic indicate warmer than average temperatures).
|
|
(2)
|
In 2015, we switched to a rolling 20-year average for calculating heating degree days, whereas in prior years we used a 30-year rolling average.
|
16
ALASKA ELECTRIC LIGHT AND POWER COMPANY
AEL&P is the primary operating subsidiary of AERC. AEL&P is the sole utility providing electrical energy in Juneau, Alaska. Juneau is a geographically isolated community with no electric interconnections with the transmission facilities of other utilities and no pipeline access to natural gas or other fuels. Juneau’s economy is primarily driven by government activities, tourism, commercial fishing, and mining, as well as activities as the commercial hub of southeast Alaska.
AEL&P owns and operates electric generation, transmission and distribution facilities located in Juneau. AEL&P operates five hydroelectric generation facilities with
102.7
MW of hydroelectric generation capacity as of
December 31, 2016
. AEL&P owns four of these generation facilities (totaling
24.5
MW of capacity) and has a PPA for the output of the Snettisham hydroelectric project (totaling
78.2
MW of capacity).
The Snettisham hydroelectric project is owned by the Alaska Industrial Development and Export Authority (AIDEA), a public corporation of the State of Alaska. AEL&P has a PPA and operating and maintenance agreement with the AIDEA to operate and maintain the facility. This PPA is a take-or-pay obligation expiring in December 2038, to purchase all of the output of the project.
For accounting purposes, this PPA is treated as a capital lease and as of
December 31, 2016
, the capital lease obligation was
$62.2 million
. Snettisham Electric Company, a non-operating subsidiary of AERC, has the option to purchase the Snettisham project at any time for a price equal to the principal amount of the bonds outstanding at that time. See "Note 14 of the Notes to Consolidated Financial Statements" for further discussion of the Snettisham capital lease obligation.
As of
December 31, 2016
, AEL&P also had
107.5
MW of diesel generating capacity from four facilities to provide back-up service to firm customers when necessary.
The following graph shows AEL&P's hydroelectric generation (in thousands of MWhs) during the time periods indicated below:
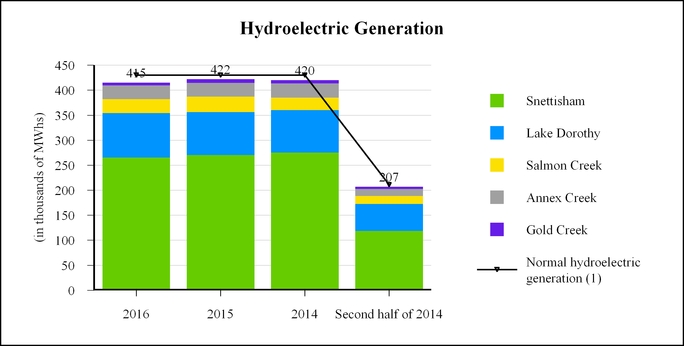
|
(1)
|
Normal hydroelectric generation is defined as the energy output of the plant during a year with average inflows to the reservoir.
|
Only the hydroelectric generation for the second half of 2014 in the graph above was included in Avista Corp.'s overall results for 2014. The full 12 months of 2014 in the graph above is presented for information purposes only.
As of
December 31, 2016
, AEL&P served approximately
17,000
customers. Its primary customers include city, state and federal governmental entities located in Juneau, as well as a mine located in the Juneau area. Most of AEL&P’s customers are
17
served on a firm basis while certain of its customers, including its largest customer, are served on an interruptible sales basis. AEL&P maintains separate rate tariffs for each of its customer classes, as well as seasonal rates.
AEL&P’s operations are subject to regulation by the RCA with respect to rates, standard of service, facilities, accounting and certain other matters, but not with respect to the issuance of securities. Rate adjustments for AEL&P’s customers require approval by the RCA pursuant to RCA regulations. AEL&P filed an electric general rate case during 2016. See "Item 7. Management's Discussion and Analysis – Regulatory Matters" for further discussion of this general rate case filing, including the proposed capital structure.
AEL&P is also subject to the jurisdiction of the FERC concerning the permits and licenses necessary to operate certain of its hydroelectric facilities. One of these licenses (for the Salmon Creek and Annex Creek hydroelectric projects) expires in 2018, but AEL&P plans to extend this license. Since AEL&P has no electric interconnection with other utilities and makes no wholesale sales, it is not subject to general FERC jurisdiction, other than the reporting and other requirements of the Public Utility Holding Company Act of 2005 as an Avista Corp. subsidiary.
The Snettisham hydroelectric project is subject to regulation by the State of Alaska with respect to dam safety and certain aspects of its operations. In addition, AEL&P is subject to regulation with respect to air and water quality, land use and other environmental matters under both federal and state laws.
AEL&P ELECTRIC OPERATING STATISTICS
|
|
Years Ended December 31,
|
Second half of
|
|||||||||
|
|
2016
|
2015
|
2014
|
||||||||
|
ELECTRIC OPERATIONS
|
|||||||||||
|
OPERATING REVENUES (Dollars in Thousands):
|
|||||||||||
|
Residential
|
$
|
18,207
|
|
$
|
18,017
|
|
$
|
8,283
|
|
||
|
Commercial and government
|
27,322
|
|
26,049
|
|
12,948
|
|
|||||
|
Public street and highway lighting
|
266
|
|
215
|
|
150
|
|
|||||
|
Total retail
|
45,795
|
|
44,281
|
|
21,381
|
|
|||||
|
Other
|
481
|
|
497
|
|
263
|
|
|||||
|
Total electric operating revenues
|
$
|
46,276
|
|
$
|
44,778
|
|
$
|
21,644
|
|
||
|
ENERGY SALES (Thousands of MWhs):
|
|||||||||||
|
Residential
|
139
|
|
139
|
|
63
|
|
|||||
|
Commercial and government
|
253
|
|
258
|
|
125
|
|
|||||
|
Public street and highway lighting
|
1
|
|
1
|
|
1
|
|
|||||
|
Total electric energy sales
|
393
|
|
398
|
|
189
|
|
|||||
|
NUMBER OF RETAIL CUSTOMERS (Average for Period):
|
|||||||||||
|
Residential
|
14,448
|
|
14,285
|
|
14,121
|
|
|||||
|
Commercial and government
|
2,181
|
|
2,179
|
|
2,148
|
|
|||||
|
Public street and highway lighting
|
211
|
|
210
|
|
213
|
|
|||||
|
Total electric retail customers
|
16,840
|
|
16,674
|
|
16,482
|
|
|||||
|
RESIDENTIAL SERVICE AVERAGES:
|
|||||||||||
|
Annual use per customer (KWh)
|
9,621
|
|
9,730
|
|
4,461
|
|
|||||
|
Revenue per KWh (in cents)
|
13.10
|
|
12.96
|
|
13.15
|
|
|||||
|
Annual revenue per customer
|
$
|
1,260.17
|
|
$
|
1,261.25
|
|
$
|
586.57
|
|
||
|
HEATING DEGREE DAYS: (1)
|
|||||||||||
|
Juneau, AK
|
|||||||||||
|
Actual
|
7,301
|
|
7,395
|
|
3,381
|
|
|||||
|
Historical average
|
8,351
|
|
8,351
|
|
3,721
|
|
|||||
|
% of average
|
87
|
%
|
89
|
%
|
91
|
%
|
|||||
|
(1)
|
Heating degree days are the measure of the coldness of weather experienced, based on the extent to which the average of high and low temperatures for a day falls below 65 degrees Fahrenheit (annual heating degree days below historical average indicate warmer than average temperatures).
|
18
OTHER BUSINESSES
The following table shows our assets related to our other businesses, excluding intracompany amounts as of
December 31
,
2016
and
2015
(dollars in thousands):
|
Entity and Asset Type
|
2016
|
2015
|
||||||
|
Avista Capital
|
||||||||
|
Salix - wholly owned subsidiary
|
$
|
3,842
|
|
$
|
2,500
|
|
||
|
Equity investments
|
3,000
|
|
3,039
|
|
||||
|
Other assets
|
123
|
|
28
|
|
||||
|
Avista Development
|
||||||||
|
Equity investments
|
11,530
|
|
5,107
|
|
||||
|
Real estate
|
11,359
|
|
6,718
|
|
||||
|
Notes receivable and other assets
|
5,444
|
|
951
|
|
||||
|
METALfx - wholly owned subsidiary
|
11,568
|
|
12,779
|
|
||||
|
Alaska companies (AERC and AJT Mining)
|
8,390
|
|
8,084
|
|
||||
|
Total
|
$
|
55,256
|
|
$
|
39,206
|
|
||
Avista Capital
|
•
|
Salix is a wholly-owned subsidiary of Avista Capital that explores markets that could be served with LNG.
|
|
•
|
Equity investments are primarily in an emerging technology venture capital fund.
|
Avista Development
|
•
|
Equity investments are primarily in emerging technology venture capital funds and companies, including an investment in a technology company that delivers scalable smart grid solutions to global partners and customers, and a predictive data science company.
|
|
•
|
Real estate consists primarily of mixed use commercial and retail office space.
|
|
•
|
Notes receivable and other assets are primarily long-term notes receivable made to a company focused on spurring economic development throughout Washington State.
|
|
•
|
AM&D doing business as METALfx performs custom sheet metal fabrication of electronic enclosures, parts and systems for the computer, construction, telecom, renewable energy and medical industries. The asset balance above excludes an intercompany loan from METALfx to Avista Corp. The loan balance was $4.0 million as of December 31, 2016 and $1.0 million as of December 31, 2015.
|
Alaska companies
|
•
|
Includes AERC and AJT Mining, which is a wholly-owned subsidiary of AERC and is an inactive mining company holding certain properties.
|
Over time as opportunities arise, we dispose of investments and phase out operations that do not fit with our overall corporate strategy. However, we may invest incremental funds to protect our existing investments and invest in new businesses that we believe fit with our overall corporate strategy.
Juneau Local Distribution Company (LDC) Project
We continue to evaluate opportunities to grow our presence in Alaska beyond our current AEL&P operations. We have been focused on exploring the viability of building a natural gas LDC in Juneau to bring this energy option to residents. The opportunity has been challenged by difficult economic conditions in Alaska (which are largely caused by low oil prices), relatively low heating oil prices and customer equipment conversion costs. At this time, due to a combination of unfavorable factors, we have suspended our work on this project for the foreseeable future. If conditions change favorably in the future, we may proceed with the regulatory process to request authority to build and operate a gas utility in Juneau.
19
Salix LNG Project
In early 2016, Salix was selected as the preferred respondent to a request for proposal (RFP) issued by AIDEA that sought a qualified candidate to develop a new LNG facility to serve the Fairbanks, Alaska area as part of the Interior Energy Project (IEP). Commercial discussions in late 2016 led Salix and AIDEA to enter into an agreement that concluded Salix’s involvement in the IEP.
RISK FACTORS
The following factors could have a significant impact on our operations, results of operations, financial condition or cash flows. These factors could cause future results or outcomes to differ materially from those discussed in our reports filed with the SEC (including this Annual Report on Form 10-K), and elsewhere. Please also see “Forward-Looking Statements” for additional factors which could have a significant impact on our operations, results of operations, financial condition or cash flows and could cause actual results to differ materially from those anticipated in such statements.
Financial Risk Factors
Weather (temperatures, precipitation levels, wind patterns and storms) has a significant effect on our results of operations, financial condition and cash flows.
Weather impacts are described in the following subtopics:
|
•
|
certain retail electricity and natural gas sales,
|
|
•
|
the cost of natural gas supply, and
|
|
•
|
the cost of power supply.
|
Certain retail electricity and natural gas
sales volumes vary directly with changes in temperatures. We normally have our highest retail (electric and natural gas) energy sales during the winter heating season in the first and fourth quarters of the year. We also have high electricity demand for air conditioning during the summer (third quarter) in the Pacific Northwest. In general, warmer weather in the heating season and cooler weather in the cooling season will reduce our customers’ energy demand and retail operating revenues. The revenue and earnings impact of weather fluctuations is somewhat mitigated by our decoupling mechanisms; however, we could experience liquidity constraints during the period between when decoupling revenue is earned and when it is subsequently collected from customers through retail rates.
The cost of natural gas supply
tends to increase with higher demand during periods of cold weather. Increased costs adversely affect cash flows when we purchase natural gas for retail supply at prices above the amount then allowed for recovery in retail rates. We defer differences between actual natural gas supply costs and the amount currently recovered in retail rates and we are generally allowed to recover substantially all of these differences after regulatory review. However, these deferred costs require cash outflows from the time of natural gas purchases until the costs are later recovered through retail sales. Inter-regional natural gas pipelines and competition for supply can allow demand-driven price volatility in other regions of North America to affect prices in our region, even though there may be less extreme weather conditions in our area.
The cost of power supply
can be significantly affected by weather. Precipitation (consisting of snowpack, its water content and melting pattern plus rainfall) and other streamflow conditions (such as regional water storage operations) significantly affect hydroelectric generation capability. Variations in hydroelectric generation inversely affect our reliance on market purchases and thermal generation. To the extent that hydroelectric generation is less than normal, significantly more costly power supply resources must be acquired and the ability to realize net benefits from surplus hydroelectric wholesale sales is reduced. Wholesale prices also vary based on wind patterns as wind generation capacity is material in our region but its contribution to supply is inconsistent.
The price of power in the wholesale energy markets tends to be higher during periods of high regional demand, such as occurs with temperature extremes. We may need to purchase power in the wholesale market during peak price periods. The price of natural gas as fuel for natural gas-fired electric generation also tends to increase during periods of high demand which are often related to temperature extremes. We may need to purchase natural gas fuel in these periods of high prices to meet electric demands. The cost of power supply during peak usage periods may be higher than the retail sales price or the amount allowed in retail rates by our regulators. To the extent that power supply costs are above the amount allowed currently in retail rates, the difference is partially absorbed by the Company in current expense and it is partially deferred or shared with customers through regulatory mechanisms.
20
The price of power tends to be lower during periods with excess supply, such as the spring when hydroelectric conditions are usually at their maximum and various facilities are required to operate to meet environmental mandates. Oversupply can be exacerbated when intermittent resources such as wind generation are producing output that may be supported by price subsidies. In extreme situations, we may be required to sell excess energy at negative prices.
As a result of these combined factors, our net cost of power supply – the difference between our costs of generation and market purchases, reduced by our revenue from wholesale sales – varies significantly because of weather.
We rely on regular access to financial markets but we cannot assure favorable or reasonable financing terms will be available when we need them.
Access to capital markets is critical to our operations and our capital structure.
We have significant capital requirements that we expect to fund, in part, by accessing capital markets. As such, the state of financial markets and credit availability in the global, United States and regional economies impacts our financial condition. We could experience increased borrowing costs or limited access to capital on reasonable terms.
We access long-term capital markets to finance capital expenditures, repay maturing long-term debt and obtain additional working capital from time-to-time. Our ability to access capital on reasonable terms is subject to numerous factors and market conditions, many of which are beyond our control. If we are unable to obtain capital on reasonable terms, it may limit or prohibit our ability to finance capital expenditures and repay maturing long-term debt. Our liquidity needs could exceed our short-term credit availability and lead to defaults on various financing arrangements. We would also likely be prohibited from paying dividends on our common stock.
Performance of the financial markets could also result in significant declines in the market values of assets held by our pension plan and/or a significant increase in the pension liability (which impacts the funded status of the plan) and could increase future funding obligations and pension expense.
We rely on credit from financial institutions for short-term borrowings.
We need adequate levels of credit with financial institutions for short-term liquidity. We have a
$400.0 million
committed line of credit that expires in
April 2021
. Our subsidiary AEL&P has a
$25.0 million
committed line of credit that expires in
November 2019
. There is no assurance that we will have access to credit beyond these expiration dates. The committed line of credit agreements contain customary covenants and default provisions.
Any default on the lines of credit or other financing arrangements of Avista Corp. or any of our “significant subsidiaries,” if any, could result in cross-defaults to other agreements of such entity, and/or to the line of credit or other financing arrangements of any other of such entities. Any defaults could also induce vendors and other counterparties to demand collateral. In the event of any such default, it would be difficult for us to obtain financing on reasonable terms to pay creditors or fund operations. We would also likely be prohibited from paying dividends on our common stock.
We hedge a portion of our interest rate risk with financial derivative instruments, which may include interest rate swap derivatives and U.S. Treasury lock agreements.
If market interest rates decrease below the interest rates we have locked in, this will result in a liability related to our interest rate swap derivatives, which can be significant. As of
December 31, 2016
, we had a net interest rate swap derivative liability of
$60.9 million
, reflecting a decline in interest rates since the time we entered into the agreements. We did not have any U.S. Treasury lock agreements outstanding as of
December 31, 2016
. We may be required to post cash or letters of credit as collateral depending on fluctuations in the fair value of the derivative instruments. Settlement of interest rate swap derivative instruments in a liability position could require a significant amount of cash, which could negatively impact our liquidity and short-term credit availability and increase interest expense over the term of the associated debt.
Downgrades in our credit ratings could impede our ability to obtain financing, adversely affect the terms of financing and impact our ability to transact for or hedge energy resources.
If we do not maintain our investment grade credit rating with the major credit rating agencies, we could expect increased debt service costs, limitations on our ability to access capital markets or obtain other financing on reasonable terms, and requirements to provide collateral (in the form of cash or letters of credit) to lenders and counterparties. In addition, credit rating downgrades could reduce the number of counterparties willing to do business with us or result in the termination of outstanding regulatory authorizations for certain financing activities.
21
Credit risk may be affected by industry concentration and geographic concentration.
We have concentrations of suppliers and customers in the electric and natural gas industries including:
|
•
|
electric and natural gas utilities,
|
|
•
|
electric generators and transmission providers,
|
|
•
|
oil and natural gas producers and pipelines,
|
|
•
|
financial institutions including commodity clearing exchanges and related parties, and
|
|
•
|
energy marketing and trading companies.
|
We have concentrations of credit risk related to our geographic location in the western United States and western Canada energy markets. These concentrations of counterparties and concentrations of geographic location may affect our overall exposure to credit risk because the counterparties may be similarly affected by changes in conditions.
Utility Regulatory Risk Factors
Regulators may not grant rates that provide timely or sufficient recovery of our costs or allow a reasonable rate of return for our shareholders.
Avista Utilities' annual operating expenses and the costs associated with incremental investments in utility assets continue to grow at a faster rate than revenue growth. Our ability to recover these expenses and capital costs depends on the amount and timeliness of retail rate changes allowed by regulatory agencies. We expect to periodically file for rate increases with regulatory agencies to recover our expenses and capital costs and provide an opportunity to earn a reasonable rate of return for shareholders. If regulators do not grant rate increases or grant substantially lower rate increases than our requests in the future or if recovery of deferred expenses is disallowed, it could have a negative effect on our operating revenues, net income and cash flows. During December 2016, the UTC denied our most recent electric and natural gas general rate requests and granted zero rate relief. Pending before the UTC is our petition for reconsideration and alternately for rehearing (Petition) of our 2016 general rate cases to arrive at new electric and natural gas rates. The UTC has provided notice that it expects to rule on the Petition on or before March 16, 2017. If our efforts to obtain rates that are fair, just, reasonable and sufficient are not successful, our 2017 earnings are expected to decrease by $0.20 to $0.30 per diluted share as compared to 2016 actual results. See further discussion in "Item 7. Management's Discussion and Analysis – Regulatory Matters."
In the future, we may no longer meet the criteria for continued application of regulatory accounting practices for all or a portion of our regulated operations.
If we could no longer apply regulatory accounting, we could be:
|
•
|
required to write off our regulatory assets, and
|
|
•
|
precluded from the future deferral of costs or decoupled revenues not recovered through rates at the time such amounts are incurred, even if we are expected to recover these amounts from customers in the future.
|
See further discussion at "Note 1 of the Notes to Consolidated Financial Statements – Regulatory Deferred Charges and Credits."
Energy Commodity Risk Factors
Energy commodity price changes affect our cash flows and results of operations.
Energy commodity prices
can be volatile.
We rely on energy markets and other counterparties for energy supply, surplus and optimization transactions and commodity price hedging. A combination of factors exposes our operations to commodity price risks, including:
|
•
|
our obligation to serve our retail customers at rates set through the regulatory process - we cannot change retail rates to reflect current energy prices unless and until we receive regulatory approval,
|
|
•
|
customer demand, which is beyond our control because of weather, customer choices, prevailing economic conditions and other factors,
|
|
•
|
some of our energy supply cost is fixed by the nature of the energy-producing assets or through contractual arrangements (however, a significant portion of our energy resource costs are not fixed), and
|
22
|
•
|
the potential non-performance by commodity counterparties, which could lead to replacement of the scheduled energy or natural gas at higher prices.
|
Because we must supply the amount of energy demanded by our customers and we must sell it at fixed rates and only a portion of our energy supply costs are fixed, we are subject to the risk of buying energy at higher prices in wholesale energy markets (and the risk of selling energy at lower prices if we are in a surplus position). Electricity and natural gas in wholesale markets are commodities with historically high price volatility. Changes in wholesale energy prices affect, among other things, the cash requirements to purchase electricity and natural gas for retail customers or wholesale obligations and the market value of derivative assets and liabilities.
When we enter into fixed price energy commodity transactions for future delivery, we are subject to credit terms that may require us to provide collateral to wholesale counterparties related to the difference between current prices and the agreed upon fixed prices. These collateral requirements can place significant demands on our cash flows or borrowing arrangements. Price volatility can cause collateral requirements to change quickly and significantly.
Cash flow deferrals related to energy commodities can be significant.
We are permitted to collect from customers only amounts approved by regulatory commissions. However, our costs to provide energy service can be much higher or lower than the amounts currently billed to customers. We are permitted to defer income statement recognition and recovery from customers for some of these differences, which are recorded as deferred charges with the opportunity for future recovery through retail rates. These deferred costs are subject to review for prudence and potential disallowance by regulators, who have discretion as to the extent and timing of future recovery or refund to customers.
Power and natural gas costs higher than those recovered in retail rates reduce cash flows. Amounts that are not allowed for deferral or which are not approved to become part of customer rates affect our results of operations.
Even if our regulators ultimately allow us to recover deferred power and natural gas costs, our operating cash flows can be negatively affected until these costs are recovered from customers.
Fluctuating energy commodity prices and volumes in relation to our energy risk management process can cause volatility in our cash flows and results of operations.
We engage in active hedging and resource optimization practices to reduce energy cost volatility and economic exposure related to commodity price fluctuations. We routinely enter into contracts to hedge a portion of our purchase and sale commitments for electricity and natural gas, as well as forecasted excess or deficit energy positions and inventories of natural gas. We use physical energy contracts and derivative instruments, such as forwards, futures, swaps and options traded in the over-the-counter markets or on exchanges. We do not attempt to fully hedge our energy resource assets or our forecasted net positions for various time horizons. To the extent we have positions that are not hedged, or if hedging positions do not fully match the corresponding purchase or sale, fluctuating commodity prices could have a material effect on our operating revenues, resource costs, derivative assets and liabilities, and operating cash flows. In addition, actual loads and resources typically vary from forecasts, sometimes to a significant degree, which require additional transactions or dispatch decisions that impact cash flows.
The hedges we enter into are reviewed for prudence by our various regulators and any deferred costs (including those as a result of our hedging transactions) are subject to review for prudence and potential disallowance by regulators.
Generation plants may become obsolete.
We rely on a variety of generation and energy commodity market sources to fulfill our obligation to serve customers and meet the demands of our counterparty agreements. There is the potential that some of our generation sources, such as coal, may become obsolete. This could result in higher commodity costs to replace the lost generation, as well as higher costs to retire the generation source before the end of its expected life.
Operational Risk Factors
We are subject to various operational and event risks.
Our operations are subject to operational and event risks that include:
|
•
|
severe weather or natural disasters, including, but not limited to, avalanches, wind storms, wildfires, earthquakes, snow and ice storms, which can disrupt energy generation, transmission and distribution, as well as the availability and costs of materials, equipment, supplies support services and general business operations,
|
|
•
|
blackouts or disruptions of interconnected transmission systems (the regional power grid),
|
|
•
|
unplanned outages at generating plants,
|
23
|
•
|
fuel cost and availability, including delivery constraints,
|
|
•
|
explosions, fires, accidents, or mechanical breakdowns that may occur while operating and maintaining our generation, transmission and distribution systems,
|
|
•
|
damage or injuries to third parties caused by our generation, transmission and distribution systems,
|
|
•
|
natural disasters that can disrupt energy generation, transmission and distribution, and general business operations, and
|
|
•
|
terrorist attacks or other malicious acts that may disrupt or cause damage to our utility assets or the vendors we utilize.
|
Disasters may affect the general economy, financial and capital markets, specific industries, or our ability to conduct business. As protection against operational and event risks, we maintain business continuity and disaster recovery plans, maintain insurance coverage against some, but not all, potential losses and we seek to negotiate indemnification arrangements with contractors for certain event risks. However, insurance or indemnification agreements may not be adequate to protect us against liability, extra expenses and operating disruptions from all of the operational and event risks described above. In addition, we are subject to the risk that insurers and/or other parties will dispute or be unable to perform on their obligations to us.
Damage to facilities
may be caused by severe weather, such as snow, ice, wind storms or avalanches. The cost to implement rapid or any repair to such facilities can be significant. Overhead electric lines are most susceptible to damage caused by severe weather.
Adverse impacts may occur at our Alaska operations that could result from an extended outage of their hydroelectric generating resources or its inability to deliver energy, due to their lack of interconnectivity to any other electrical grids and the extensive cost of replacement power (diesel).
AEL&P operates several hydroelectric power generation facilities and has diesel generating capacity from multiple facilities to provide backup service to firm customers when necessary; however, a single hydroelectric power generation facility, the Snettisham hydroelectric project, provides approximately two-thirds of AEL&P’s hydroelectric power generation. Any issues that negatively affect AEL&P's ability to generate or transmit power or any decrease in the demand for the power generated by AEL&P could negatively affect our results of operations, financial condition and cash flows.
Compliance Risk Factors
There have been numerous changes in legislation, related administrative rulemakings, and Executive Orders, including periodic audits of compliance with such rules, which may adversely affect our operational and financial performance.
We expect to continue to be affected by legislation at the national, state and local level, as well as by administrative rules and requirements published by government agencies, including but not limited to the FERC, the EPA and state regulators. We are also subject to NERC and WECC reliability standards. The FERC, the NERC and the WECC perform periodic audits of the Company. Failure to comply with the FERC, the NERC, or the WECC requirements can result in financial penalties of up to $1 million per day per violation.
Future legislation or administrative rules could have a material adverse effect on our operations, results of operations, financial condition and cash flows.
Actions or limitations to address concerns over the long-term global and our utilities' service area climate changes may affect our operations and financial performance.
Legislative, regulatory and advocacy efforts at the state, national and international levels concerning climate change and other environmental issues could have significant impacts on our operations. The electric and natural gas utility industries are frequently affected by proposals to curb greenhouse gas and other air emissions. Various regulatory and legislative proposals have been made to limit or further restrict byproducts of combustion, including that resulting from the use of natural gas by our customers. Such proposals, if adopted, could restrict the operation and raise the costs of our power generation resources as well as the distribution of natural gas to our customers.
We expect continuing activity in the future and we are evaluating the extent to which potential changes to environmental laws and regulations may:
|
•
|
increase the operating costs of generating plants,
|
|
•
|
increase the lead time and capital costs for the construction of new generating plants,
|
|
•
|
require modification of our existing generating plants,
|
24
|
•
|
require existing generating plant operations to be curtailed or shut down,
|
|
•
|
reduce the amount of energy available from our generating plants,
|
|
•
|
restrict the types of generating plants that can be built or contracted with,
|
|
•
|
require construction of specific types of generation plants at higher cost, and
|
|
•
|
increase the cost of distributing natural gas to customers.
|
We have contingent liabilities, including certain matters related to potential environmental liabilities, and cannot predict the outcome of these matters.
In the normal course of our business, we have matters that are the subject of ongoing litigation, mediation, investigation and/or negotiation. We cannot predict the ultimate outcome or potential impact of any particular issue, including the extent, if any, of insurance coverage or that amounts payable by us may be recoverable through the ratemaking process. We are subject to environmental regulation by federal, state and local authorities related to our past, present and future operations. See “Note 19 of the Notes to Consolidated Financial Statements” for further details of these matters.
Technology Risk Factors
Cyber attacks, terrorism or other malicious acts could disrupt our businesses and have a negative impact on our results of operations and cash flows.
In the course of our operations, we rely on interconnected technology systems for operation of our generating plants, electric transmission and distribution systems, natural gas distribution systems, customer billing and customer service, accounting and other administrative processes and compliance with various regulations. In addition, in the ordinary course of business, we collect and retain sensitive information including personal information about our customers and employees.
There are various risks associated with technology systems such as hardware or software failure, communications failure, data distortion or destruction, unauthorized access to data, misuse of proprietary or confidential data, unauthorized control through electronic means, programming mistakes and other deliberate or inadvertent human errors. In particular, cyber attacks, terrorism or other malicious acts could damage, destroy or disrupt these systems. Additionally, the facilities and systems of clients, suppliers and third party service providers could be vulnerable to these same risks and, to the extent of interconnection to our technology, may impact us. Any failure, unexpected, or unauthorized use of technology systems could result in the unavailability of such systems, and could result in a loss of operating revenues, an increase in operating expenses and costs to repair or replace damaged assets. Any of the above could also result in the loss or release of confidential customer and/or employee information or other proprietary data that could adversely affect our reputation and competitiveness, could result in costly litigation and negatively impact our results of operations. As these potential cyber attacks become more common and sophisticated, we could be required to incur costs to strengthen our systems and respond to emerging concerns.
Terrorist attacks could also be directed at physical electric and natural gas facilities, as well as technology systems.
We may be adversely affected by our inability to successfully implement certain technology projects.
We are currently planning to replace all of our electric meter infrastructure in Washington state with two-way communication advanced metering infrastructure (AMI). There is the risk that regulators will not allow the full recovery of new AMI. In addition, there are inherent risks associated with replacing and changing these types of systems, such as incorrect or nonfunctioning metering and/or delayed or inaccurate customer bills or unplanned outages, which could have a material adverse effect on our results of operations, financial condition and cash flows. Finally, there is the risk that we ultimately do not complete the project and will incur contract cancellation or other costs, which could be significant.
Strategic Risk Factors
Our strategic business plans, which may be affected by any or all of the foregoing, may change, including the entry into new businesses and/or the exit from existing businesses and the extent of our business development efforts where potential future business is uncertain.
Our strategic business plans could be affected by or result in any of the following:
|
•
|
disruptive innovations in the marketplace may outpace our ability to compete or manage our risk,
|
|
•
|
potential difficulties in integrating acquired operations and in realizing expected opportunities, diversions of management resources and losses of key employees, challenges with respect to operating new businesses and other unanticipated risks and liabilities,
|
25
|
•
|
market or other conditions may adversely affect our operations or require changes to our business strategy, which could result in a non-cash goodwill impairment charge that would reduce assets and reduce our net income, and
|
|
•
|
potential reputational risk arising from repeated general rate case filings, degradation in the quality of service, or from failed strategic investments and opportunities, which could erode shareholder, customer and community satisfaction with our Company.
|
External Mandates Risk Factors
External mandate risk involves forces outside the Company, which may include significant changes in customer expectations, disruptive technologies that result in obsolescence of our business model and government action that could impact our Company. See "Item 7. Management's Discussion and Analysis – Environmental Issues and Contingencies" and "Forward-Looking Statements" for discussion of or reference to external mandates which could have a material adverse effect on our results of operations, financial condition and cash flows.
As of the filing date of this Annual Report on Form 10-K, we have no unresolved comments from the staff of the SEC.
26
AVISTA UTILITIES
Substantially all of Avista Utilities' properties are subject to the lien of Avista Corp.'s mortgage indenture.
Our utility electric properties, located in the states of Washington, Idaho, Montana and Oregon, include the following:
Generation Properties
|
No. of
Units
|
Nameplate
Rating
(MW) (1)
|
Present
Capability
(MW) (2)
|
|||||
|
Hydroelectric Generating Stations (River)
|
|||||||
|
Washington:
|
|||||||
|
Long Lake (Spokane)
|
4
|
70.0
|
|
88.0
|
|
||
|
Little Falls (Spokane)
|
4
|
32.0
|
|
35.6
|
|
||
|
Nine Mile (Spokane) (3)
|
4
|
36.8
|
|
29.0
|
|
||
|
Upper Falls (Spokane)
|
1
|
10.0
|
|
10.2
|
|
||
|
Monroe Street (Spokane)
|
1
|
14.8
|
|
15.0
|
|
||
|
Idaho:
|
|||||||
|
Cabinet Gorge (Clark Fork) (4)
|
4
|
265.0
|
|
273.0
|
|
||
|
Post Falls (Spokane)
|
6
|
14.8
|
|
15.4
|
|
||
|
Montana:
|
|||||||
|
Noxon Rapids (Clark Fork)
|
5
|
487.8
|
|
562.4
|
|
||
|
Total Hydroelectric
|
931.2
|
|
1,028.6
|
|
|||
|
Thermal Generating Stations (cycle, fuel source)
|
|||||||
|
Washington:
|
|||||||
|
Kettle Falls GS (combined-cycle, wood waste) (5)
|
1
|
50.7
|
|
53.5
|
|
||
|
Kettle Falls CT (combined-cycle, natural gas) (5)
|
1
|
7.2
|
|
6.9
|
|
||
|
Northeast CT (simple-cycle, natural gas)
|
2
|
61.8
|
|
64.8
|
|
||
|
Boulder Park GS (simple-cycle, natural gas)
|
6
|
24.6
|
|
24.6
|
|
||
|
Idaho:
|
|||||||
|
Rathdrum CT (simple-cycle, natural gas)
|
2
|
166.5
|
|
166.5
|
|
||
|
Montana:
|
|||||||
|
Colstrip Units 3 & 4 (simple-cycle, coal) (6)
|
2
|
233.4
|
|
222.0
|
|
||
|
Oregon:
|
|||||||
|
Coyote Springs 2 (combined-cycle, natural gas)
|
1
|
295.0
|
|
295.0
|
|
||
|
Total Thermal
|
839.2
|
|
833.3
|
|
|||
|
Total Generation Properties
|
1,770.4
|
|
1,861.9
|
|
|||
|
(1)
|
Nameplate rating, also referred to as “installed capacity,” is the manufacturer’s assigned power capability under specified conditions.
|
|
(2)
|
Present capability is the maximum capacity of the plant under standard test conditions without exceeding specified limits of temperature, stress and environmental conditions. Information is provided as of
December 31, 2016
.
|
|
(3)
|
The project to replace Units 1 and 2 was completed during 2016. The present capability shown is the maximum plant generation we have seen given the water we have had available, because we have not yet had peak water conditions since Units 1 and 2 went into service. As conditions change, we will test plant capability and revise this number accordingly.
|
|
(4)
|
For Cabinet Gorge, we have water rights permitting generation up to
265
MW. However, if natural stream flows will allow for generation above our water rights, we are able to generate above our water rights. If natural stream flows only allow for generation at or below 265 MW, we are limited to generation of 265 MW. The present capability disclosed above represents the capability based on maximum stream flow conditions when we are allowed to generate above our water rights.
|
27
|
(5)
|
These generating stations can operate as separate single-cycle plants or combined-cycle with the natural gas plant providing exhaust heat to the wood boiler to increase efficiency.
|
|
(6)
|
Jointly owned; data refers to our 15 percent interest.
|
Electric Distribution and Transmission Plant
Avista Utilities owns and operates approximately
19,000
miles of primary and secondary electric distribution lines providing service to retail customers. We have an electric transmission system of
685
miles of 230 kV line and
1,565
miles of 115 kV line. We also own an 11 percent interest in approximately 500 miles of a 500 kV line between Colstrip, Montana and Townsend, Montana. Our transmission and distribution systems also include numerous substations with transformers, switches, monitoring and metering devices, and other equipment.
The 230 kV lines are the backbone of our transmission grid and are used to transmit power from generation resources, including Noxon Rapids, Cabinet Gorge and the Mid-Columbia hydroelectric projects, to the major load centers in our service area, as well as to transfer power between points of interconnection with adjoining electric transmission systems. These lines interconnect at various locations with the BPA, Grant County PUD, PacifiCorp, NorthWestern Energy and Idaho Power Company and serve as points of delivery for power from generating facilities outside of our service area, including Colstrip, Coyote Springs 2 and the Lancaster Plant.
These lines also provide a means for us to optimize resources by entering into short-term purchases and sales of power with entities within and outside of the Pacific Northwest.
The 115 kV lines provide for transmission of energy and the integration of smaller generation facilities with our service-area load centers, including the Spokane River hydroelectric projects, the Kettle Falls projects, Rathdrum CT, Boulder Park GS and the Northeast CT. These lines interconnect with the BPA, Chelan County PUD, the Grand Coulee Project Hydroelectric Authority, Grant County PUD, NorthWestern Energy, PacifiCorp and Pend Oreille County PUD. Both the 115 kV and 230 kV interconnections with the BPA are used to transfer energy to facilitate service to each other’s customers that are connected through the other’s transmission system. We hold a long-term transmission agreement with the BPA that allows us to serve our native load customers that are connected through the BPA’s transmission system.
Natural Gas Plant
Avista Utilities has natural gas distribution mains of approximately
3,400
miles in Washington,
2,000
miles in Idaho and
2,300
miles in Oregon. We have natural gas transmission mains of approximately
75
miles in Washington and
50
miles in Oregon. Our natural gas system includes numerous regulator stations, service distribution lines, monitoring and metering devices, and other equipment.
We own a one-third interest in Jackson Prairie, an underground natural gas storage field located near Chehalis, Washington. See "Part 1 – Item 1. Business – Avista Utilities – Natural Gas Operations" for further discussion of Jackson Prairie.
28
ALASKA ELECTRIC LIGHT AND POWER COMPANY
Substantially all of AEL&P's utility properties are subject to the lien of the AEL&P mortgage indenture.
AEL&P's utility electric properties, located in Alaska include the following:
Generation Properties and Transmission and Distribution Lines
|
No. of
Units
|
Nameplate
Rating
(MW) (1)
|
Present
Capability
(MW) (2)
|
|||||
|
Hydroelectric Generating Stations
|
|||||||
|
Snettisham (3)
|
3
|
78.2
|
|
78.2
|
|
||
|
Lake Dorothy
|
1
|
14.3
|
|
14.3
|
|
||
|
Salmon Creek
|
1
|
8.4
|
|
5.0
|
|
||
|
Annex Creek
|
2
|
4.1
|
|
3.6
|
|
||
|
Gold Creek
|
3
|
1.6
|
|
1.6
|
|
||
|
Total Hydroelectric
|
106.6
|
|
102.7
|
|
|||
|
Diesel Generating Stations
|
|||||||
|
Lemon Creek
|
11
|
61.4
|
|
51.8
|
|
||
|
Auke Bay
|
3
|
28.4
|
|
25.2
|
|
||
|
Gold Creek
|
5
|
8.2
|
|
7
|
|
||
|
Industrial Blvd. Plant
|
1
|
23.5
|
|
23.5
|
|
||
|
Total Diesel
|
121.5
|
|
107.5
|
|
|||
|
Total Generation Properties
|
228.1
|
|
210.2
|
|
|||
|
(1)
|
Nameplate rating, also referred to as “installed capacity,” is the manufacturer’s assigned power capability under specified conditions.
|
|
(2)
|
Present capability is the maximum capacity of the plant under standard test conditions without exceeding specified limits of temperature, stress and environmental conditions. Information is provided as of
December 31, 2016
.
|
|
(3)
|
AEL&P does not own this generating facility but has a PPA under which it has the right to purchase, and the obligation to pay for (whether or not energy is received), all of the capacity and energy of this facility. See further information at "Part 1. Item 1. Business – Alaska Electric Light and Power Company."
|
In addition to the generation properties above, AEL&P owns approximately 61 miles of transmission lines, which are primarily comprised of 69 kV line, and approximately 184 miles of distribution lines.
See “Note 19 of Notes to Consolidated Financial Statements” for information with respect to legal proceedings.
Not applicable.
Avista Corp. Market Information and Dividend Policy
Avista Corp.'s common stock is listed on the New York Stock Exchange under the ticker symbol “AVA.” As of
January 31, 2017
, there were
8,410
registered shareholders of our common stock.
Avista Corp.'s Board of Directors considers the level of dividends on our common stock on a regular basis, taking into account numerous factors including, without limitation:
|
•
|
our results of operations, cash flows and financial condition,
|
|
•
|
the success of our business strategies, and
|
|
•
|
general economic and competitive conditions.
|
29
Avista Corp.'s net income available for dividends is generally derived from our regulated utility operations (Avista Utilities and AEL&P).
The payment of dividends on common stock could be limited by:
|
•
|
certain covenants applicable to the Company's outstanding long-term debt and committed line of credit agreements (see "Item 7. Management's Discussion and Analysis - Capital Resources" for compliance with these covenants),
|
|
•
|
the hydroelectric licensing requirements of section 10(d) of the FPA (see “Note 1 of Notes to Consolidated Financial Statements”),
|
|
•
|
certain requirements under the OPUC approval of the AERC acquisition in 2014. The OPUC's AERC acquisition order requires Avista Utilities to maintain a capital structure of no less than
40 percent
common equity (inclusive of short-term debt). This limitation may be revised upon request by the Company with approval from the OPUC, and
|
|
•
|
certain covenants applicable to preferred stock (when outstanding) contained in the Company’s Restated Articles of Incorporation, as amended (currently there are no preferred shares outstanding).
|
On
February 3, 2017
, Avista Corp.’s Board of Directors declared a quarterly dividend of
$0.3575
per share on the Company’s common stock. This was an increase of
$0.0150
per share, or
4.4 percent
from the previous quarterly dividend of
$0.3425
per share.
For additional information, see “Notes 1, 17 and 18 of Notes to Consolidated Financial Statements.”
The following table presents quarterly high and low stock prices as reported on the consolidated reporting system, as well as dividend information:
|
|
Three Months Ended
|
||||||||||||||
|
March
31
|
June
30
|
September
30
|
December
31
|
||||||||||||
|
2016
|
|||||||||||||||
|
Dividends paid per common share
|
$
|
0.3425
|
|
$
|
0.3425
|
|
$
|
0.3425
|
|
$
|
0.3425
|
|
|||
|
Trading price range per common share:
|
|||||||||||||||
|
High
|
$
|
41.12
|
|
$
|
44.80
|
|
$
|
44.97
|
|
$
|
42.63
|
|
|||
|
Low
|
$
|
34.67
|
|
$
|
38.70
|
|
$
|
40.43
|
|
$
|
39.11
|
|
|||
|
2015
|
|||||||||||||||
|
Dividends paid per common share
|
$
|
0.33
|
|
$
|
0.33
|
|
$
|
0.33
|
|
$
|
0.33
|
|
|||
|
Trading price range per common share:
|
|||||||||||||||
|
High
|
$
|
38.30
|
|
$
|
34.25
|
|
$
|
33.99
|
|
$
|
36.06
|
|
|||
|
Low
|
$
|
32.22
|
|
$
|
30.41
|
|
$
|
29.93
|
|
$
|
32.86
|
|
|||
For information with respect to securities authorized for issuance under equity compensation plans, see “Item 12. Security Ownership of Certain Beneficial Owners and Management and Related Stockholder Matters.”
30
|
(in thousands, except per share data and ratios)
|
Years Ended December 31,
|
||||||||||||||||||
|
|
2016
|
2015
|
2014
|
2013
|
2012
|
||||||||||||||
|
Operating Revenues:
|
|||||||||||||||||||
|
Avista Utilities
|
$
|
1,372,638
|
|
$
|
1,411,863
|
|
$
|
1,413,499
|
|
$
|
1,403,995
|
|
$
|
1,354,185
|
|
||||
|
AEL&P
|
46,276
|
|
44,778
|
|
21,644
|
|
—
|
|
—
|
|
|||||||||
|
Other
|
23,569
|
|
28,685
|
|
39,219
|
|
39,549
|
|
38,953
|
|
|||||||||
|
Intersegment eliminations
|
—
|
|
(550
|
)
|
(1,800
|
)
|
(1,800
|
)
|
(1,800
|
)
|
|||||||||
|
Total
|
$
|
1,442,483
|
|
$
|
1,484,776
|
|
$
|
1,472,562
|
|
$
|
1,441,744
|
|
$
|
1,391,338
|
|
||||
|
Income (Loss) from Operations (pre-tax):
|
|||||||||||||||||||
|
Avista Utilities
|
$
|
277,070
|
|
$
|
241,228
|
|
$
|
239,976
|
|
$
|
232,572
|
|
$
|
188,778
|
|
||||
|
AEL&P
|
15,434
|
|
14,072
|
|
6,221
|
|
—
|
|
—
|
|
|||||||||
|
Other
|
(2,701
|
)
|
(2,086
|
)
|
6,391
|
|
(1,483
|
)
|
(1,680
|
)
|
|||||||||
|
Total
|
$
|
289,803
|
|
$
|
253,214
|
|
$
|
252,588
|
|
$
|
231,089
|
|
$
|
187,098
|
|
||||
|
Net income from continuing operations
|
$
|
137,316
|
|
$
|
118,170
|
|
$
|
119,866
|
|
$
|
104,333
|
|
$
|
76,803
|
|
||||
|
Net income from discontinued operations
|
—
|
|
5,147
|
|
72,411
|
|
7,961
|
|
1,997
|
|
|||||||||
|
Net income
|
$
|
137,316
|
|
$
|
123,317
|
|
$
|
192,277
|
|
$
|
112,294
|
|
$
|
78,800
|
|
||||
|
Net income attributable to noncontrolling interests
|
$
|
(88
|
)
|
$
|
(90
|
)
|
$
|
(236
|
)
|
$
|
(1,217
|
)
|
$
|
(590
|
)
|
||||
|
Net Income (Loss) attributable to Avista Corporation shareholders:
|
|||||||||||||||||||
|
Avista Utilities
|
$
|
132,490
|
|
$
|
113,360
|
|
$
|
113,263
|
|
$
|
108,598
|
|
$
|
81,704
|
|
||||
|
AEL&P
|
7,968
|
|
6,641
|
|
3,152
|
|
—
|
|
—
|
|
|||||||||
|
Ecova - Discontinued operations
|
—
|
|
5,147
|
|
72,390
|
|
7,129
|
|
1,825
|
|
|||||||||
|
Other
|
(3,230
|
)
|
(1,921
|
)
|
3,236
|
|
(4,650
|
)
|
(5,319
|
)
|
|||||||||
|
Net income attributable to Avista Corp. shareholders
|
$
|
137,228
|
|
$
|
123,227
|
|
$
|
192,041
|
|
$
|
111,077
|
|
$
|
78,210
|
|
||||
|
Average common shares outstanding, basic
|
63,508
|
|
62,301
|
|
61,632
|
|
59,960
|
|
59,028
|
|
|||||||||
|
Average common shares outstanding, diluted
|
63,920
|
|
62,708
|
|
61,887
|
|
59,997
|
|
59,201
|
|
|||||||||
|
Common shares outstanding at year-end
|
64,188
|
|
62,313
|
|
62,243
|
|
60,077
|
|
59,813
|
|
|||||||||
|
Earnings per common share attributable to Avista Corp. shareholders, basic:
|
|||||||||||||||||||
|
Earnings per common share from continuing operations
|
$
|
2.16
|
|
$
|
1.90
|
|
$
|
1.94
|
|
$
|
1.74
|
|
$
|
1.30
|
|
||||
|
Earnings per common share from discontinued operations
|
—
|
|
0.08
|
|
1.18
|
|
0.11
|
|
0.02
|
|
|||||||||
|
Total earnings per common share attributable to Avista Corp. shareholders, basic
|
$
|
2.16
|
|
$
|
1.98
|
|
$
|
3.12
|
|
$
|
1.85
|
|
$
|
1.32
|
|
||||
|
Earnings per common share attributable to Avista Corp. shareholders, diluted:
|
|||||||||||||||||||
|
Earnings per common share from continuing operations
|
$
|
2.15
|
|
$
|
1.89
|
|
$
|
1.93
|
|
$
|
1.74
|
|
$
|
1.30
|
|
||||
|
Earnings per common share from discontinued operations
|
—
|
|
0.08
|
|
1.17
|
|
0.11
|
|
0.02
|
|
|||||||||
|
Total earnings per common share attributable to Avista Corp. shareholders, diluted
|
$
|
2.15
|
|
$
|
1.97
|
|
$
|
3.10
|
|
$
|
1.85
|
|
$
|
1.32
|
|
||||
31
|
(in thousands, except per share data and ratios)
|
Years Ended December 31,
|
||||||||||||||||||
|
|
2016
|
2015
|
2014
|
2013
|
2012
|
||||||||||||||
|
Dividends declared per common share
|
$
|
1.37
|
|
$
|
1.32
|
|
$
|
1.27
|
|
$
|
1.22
|
|
$
|
1.16
|
|
||||
|
Book value per common share
|
$
|
25.69
|
|
$
|
24.53
|
|
$
|
23.84
|
|
$
|
21.61
|
|
$
|
21.06
|
|
||||
|
Total Assets at Year-End:
|
|||||||||||||||||||
|
Avista Utilities
|
$
|
4,975,555
|
|
$
|
4,601,708
|
|
$
|
4,357,760
|
|
$
|
3,930,251
|
|
$
|
3,883,602
|
|
||||
|
AEL&P
|
273,770
|
|
265,735
|
|
263,070
|
|
—
|
|
—
|
|
|||||||||
|
Other
|
60,430
|
|
39,206
|
|
80,141
|
|
81,282
|
|
95,638
|
|
|||||||||
|
Total (1)
|
$
|
5,309,755
|
|
$
|
4,906,649
|
|
$
|
4,700,971
|
|
$
|
4,011,533
|
|
$
|
3,979,240
|
|
||||
|
Long-Term Debt and Capital Leases (including current portion)
|
$
|
1,682,004
|
|
$
|
1,573,278
|
|
$
|
1,487,126
|
|
$
|
1,262,036
|
|
$
|
1,217,520
|
|
||||
|
Nonrecourse Long-Term Debt of Spokane Energy (including current portion)
|
$
|
—
|
|
$
|
—
|
|
$
|
1,431
|
|
$
|
17,838
|
|
$
|
32,803
|
|
||||
|
Long-Term Debt to Affiliated Trusts
|
$
|
51,547
|
|
$
|
51,547
|
|
$
|
51,547
|
|
$
|
51,547
|
|
$
|
51,547
|
|
||||
|
Total Avista Corp. Shareholders’ Equity
|
$
|
1,648,727
|
|
$
|
1,528,626
|
|
$
|
1,483,671
|
|
$
|
1,298,266
|
|
$
|
1,259,477
|
|
||||
|
Ratio of Earnings to Fixed Charges (2)
|
3.32
|
|
3.13
|
|
3.39
|
|
3.02
|
|
2.48
|
|
|||||||||
|
(1)
|
The total assets at year-end for the years 2013 and 2012 exclude the total assets associated with Ecova of $339.6 million and $322.7 million, respectively.
|
|
(2)
|
See Exhibit 12 for computations.
|
Business Segments
As of
December 31, 2016
, we have two reportable business segments, Avista Utilities and AEL&P. We also have other businesses which do not represent a reportable business segment and are conducted by various direct and indirect subsidiaries of Avista Corp. See "Part I, Item 1. Business – Company Overview" for further discussion of our business segments.
The following table presents net income (loss) attributable to Avista Corp. shareholders for each of our business segments (and the other businesses) for the
year ended December 31
(dollars in thousands):
|
2016
|
2015
|
2014
|
|||||||||
|
Avista Utilities
|
$
|
132,490
|
|
$
|
113,360
|
|
$
|
113,263
|
|
||
|
AEL&P
|
7,968
|
|
6,641
|
|
3,152
|
|
|||||
|
Ecova - Discontinued operations (1)
|
—
|
|
5,147
|
|
72,390
|
|
|||||
|
Other
|
(3,230
|
)
|
(1,921
|
)
|
3,236
|
|
|||||
|
Net income attributable to Avista Corporation shareholders
|
$
|
137,228
|
|
$
|
123,227
|
|
$
|
192,041
|
|
||
|
(1)
|
The results for the year ended December 31, 2014 include the net gain on sale of Ecova of
$69.7 million
.
|
Executive Level Summary
Overall Results
Net income attributable to Avista Corp. shareholders was
$137.2 million
for
2016
, an increase from
$123.2 million
for
2015
. Avista Utilities' earnings increased primarily due to an increase in electric and natural gas gross margin as a result of general rate increases and the implementation of decoupling mechanisms in Idaho and Oregon. See "Results of Operations – Avista Utilities – Non-GAAP Financial Measures" for further discussion of gross margin. Also, there was a reduction in the electric provision for earnings sharing (which is an offset to revenue). Retail electric loads decreased as compared to prior year and retail natural gas loads increased as compared to prior year, but the impact of changes in load as compared to normal for electric and natural gas was mostly offset by decoupling mechanisms.
In addition to the fluctuations in gross margin, there were increases in other operating expenses, depreciation, and interest expense. There was also an increase in earnings at AEL&P offset by an increase in the net loss at the other businesses.
More detailed explanations of the fluctuations are provided in the results of operations and business segment discussions (Avista Utilities, AEL&P, and the other businesses) that follow this section.
32
2016 Washington General Rate Cases
In December 2016, the UTC issued an order related to our Washington electric and natural gas general rate cases that were originally filed with the UTC in February 2016. The UTC order denied the Company's proposed electric and natural gas rate increase requests totaling $43.0 million. Accordingly, our current electric and natural gas retail rates will remain unchanged in Washington State.
In December 2016, we filed a Petition for Reconsideration or, in the alternative, Rehearing (Petition) with the UTC. The UTC provided notice inviting parties to respond to our Petition, stating that it expects to rule on the Petition on or before March 16, 2017. If our efforts to obtain rates that are fair, just, reasonable and sufficient are not successful, our 2017 earnings will suffer a significant adverse impact. We believe the UTC order will not allow us to earn a reasonable return on investments that we have already made in our infrastructure. In addition, the order will provide no opportunity for us to earn the return on equity authorized by the UTC or a fair return for shareholders. In the order, the UTC did not specifically disallow any of our capital projects, and we continue to believe these investments are necessary and will be recoverable in rates in the future.
In 2017, we expect our operating costs to continue to grow along the same trend we have been experiencing recently; however, if our current Washington rates remain in effect, we expect to earn below our currently authorized return on equity (ROE). The order will result in regulatory lag, and, accordingly, we expect to experience earnings contraction in 2017 of $0.20 to $0.30 per diluted share as compared to 2016 actual results.
See "Item 7. Management's Discussion and Analysis – Regulatory Matters" for additional discussion surrounding this general rate case and all of our other outstanding general rate cases.
Alaska Energy and Resources Company Acquisition
On July 1, 2014, we acquired AERC, based in Juneau, Alaska. The completion of this transaction limits the comparability of the financial results for 2016 and 2015 to those for 2014 since the first half of 2014 does not contain any financial results from AERC. This transaction resulted in the recording of
$52.4 million
in goodwill. For additional information regarding the AERC transaction, including pro forma financial comparisons, see “Note 4 of the Notes to Consolidated Financial Statements.”
Ecova Disposition
On June 30, 2014, Avista Capital completed the sale of its interest in Ecova for a sales price of
$335.0 million
in cash, less the payment of debt and other customary closing adjustments. The sale of Ecova provided total cash proceeds to Avista Corp., net of debt, payment to option and minority holders, income taxes and transaction expenses, of
$143.7 million
and resulted in a net gain of
$74.8 million
. Most of the net gain was recognized in 2014 with some minor true-ups during 2015.
The completion of this transaction limits the comparability of the financial results for 2016 and 2015 to those for 2014 since the first half of 2014 contains the financial results of Ecova (in discontinued operations) and 2015 and 2016 do not have any material results from Ecova. For additional information regarding the Ecova disposition, see “Note 5 of the Notes to Consolidated Financial Statements.”
Regulatory Matters
General Rate Cases
We regularly review the need for electric and natural gas rate changes in each state in which we provide service. We will continue to file for rate adjustments to:
|
•
|
seek recovery of operating costs and capital investments, and
|
|
•
|
seek the opportunity to earn reasonable returns as allowed by regulators.
|
With regards to the timing and plans for future filings, the assessment of our need for rate relief and the development of rate case plans takes into consideration short-term and long-term needs, as well as specific factors that can affect the timing of rate filings. Such factors include, but are not limited to, in-service dates of major capital investments and the timing of changes in major revenue and expense items.
Avista Utilities
Washington General Rate Cases
2014 General Rate Cases
In November 2014, the UTC approved an all-party settlement agreement related to our electric and natural gas general rate cases filed in February 2014 and new rates became effective on January 1, 2015. The settlement was designed to increase annual electric base revenues by
$12.3 million
, or
2.5 percent
. The settlement was designed to increase annual natural gas base
33
revenues by
$8.5 million
, or
5.6 percent
. The settlement agreement also included the implementation of decoupling mechanisms for electric and natural gas and a related after-the-fact earnings test. See "Decoupling and Earnings Sharing Mechanisms" below for further discussion of these mechanisms.
Specific capital structure ratios and the cost of capital components were not agreed to in the settlement agreement. The revenue increases in the settlement were not tied to the
7.32 percent
rate of return on rate base (ROR) used in conjunction with the after-the fact earnings test discussed under "Decoupling and Earnings Sharing Mechanisms" below. The electric and natural gas revenue increases were negotiated numbers, with each party using its own set of assumptions underlying its agreement to the revenue increases. The parties agreed that the
7.32 percent
ROR will be used to calculate the AFUDC and will be used for other purposes.
2015 General Rate Cases
In January 2016, we received an order (Order 05) that concluded our electric and natural gas general rate cases that were originally filed with the UTC in February 2015. New electric and natural gas rates were effective on January 11, 2016.
The UTC-approved rates are designed to provide a
1.6 percent
, or
$8.1 million
decrease in electric base revenue, and a
7.4 percent
, or
$10.8 million
increase in natural gas base revenue. The UTC also approved an ROR of
7.29 percent
, with a common equity ratio of
48.5 percent
and a
9.5 percent
ROE.
UTC Order Denying Industrial Customers of Northwest Utilities / Public Counsel Joint Motion for Clarification, UTC Staff Motion to Reconsider and UTC Staff Motion to Reopen Record
On January 19, 2016, the Industrial Customers of Northwest Utilities (ICNU) and the Public Counsel Unit of the Washington State Office of the Attorney General (PC) filed a Joint Motion for Clarification with the UTC. In the Motion for Clarification, ICNU and PC requested that the UTC clarify the calculation of the electric attrition adjustment and the end-result revenue decrease of $8.1 million. ICNU and PC provided their own calculations in their Motion, and suggested that the revenue decrease should have been $19.8 million based on their reading of the UTC’s Order.
On January 19, 2016, the UTC Staff, which is a separate party in the general rate case proceedings from the UTC Advisory Staff, filed a Motion to Reconsider with the UTC. In its Motion to Reconsider, the Staff provided calculations and explanations that suggested that the electric revenue decrease should have been a revenue decrease of $27.4 million instead of $8.1 million, based on its reading of the UTC's Order. Further, on February 4, 2016, the UTC Staff filed a Motion to Reopen Record for the Limited Purpose of Receiving into Evidence Instruction on Use and Application of Staff’s Attrition Model, and sought to supplement the record “to incorporate all aspects of the Company’ Power Cost Update.” Within this Motion, UTC Staff updated its suggested electric revenue decrease to $19.6 million.
None of the parties in their Motions raised issues with the UTC’s decision on the natural gas revenue increase of $10.8 million.
On February 19, 2016, the UTC issued an order (Order 06) denying the Motions summarized above and affirmed Order 05 including an $8.1 million decrease in electric base revenue.
PC Petition for Judicial Review
On March 18, 2016, PC filed in Thurston County Superior Court a Petition for Judicial Review of the UTC's Order 05 and Order 06 described above that concluded our 2015 electric and natural gas general rate cases. In its Petition for Judicial Review, PC seeks judicial review of five aspects of Order 05 and Order 06, alleging, among other things, that (1) the UTC exceeded its statutory authority by setting rates for our natural gas and electric services based on amounts for utility plant and facilities that are not "used and useful" in providing utility service to customers; (2) the UTC acted arbitrarily and capriciously in granting an attrition adjustment for our electric operations after finding that the we did not meet the newly articulated standard regarding attrition adjustments; (3) the UTC erred in applying the "end results test" to set rates for our electric operations that are not supported by the record; (4) the UTC did not correct its calculation of our electric rates after significant errors were brought to its attention; and (5) the UTC's calculation of our electric rates lacks substantial evidence.
PC is requesting that the Court (1) vacate or set aside portions of the UTC’s orders; (2) identify the errors contained in the UTC’s orders; (3) find that the rates approved in Order 05 and reaffirmed in Order 06 are unlawful and not fair, just and reasonable; (4) remand the matter to the UTC for further proceedings consistent with these rulings, including a determination of our revenue requirement for electric and natural gas services; and (5) find the customers are entitled to a refund.
34
On April 18, 2016, PC filed an application with the Thurston County Superior Court to certify this matter for review directly by the Court of Appeals, an intermediate appellate court in the State of Washington. After briefing and argument, the matter was certified on April 29, 2016 and accepted by the Court of Appeals on July 29, 2016. The parties are providing briefs to the Court, after which the Court will set the matter for argument. A decision from the Court is not expected until late 2017, at the earliest.
The new rates established by Order 05 will continue in effect while the Petition for Judicial Review is being considered. We believe the UTC's Order 05 and Order 06 finalizing the electric and natural gas general rate cases provide a reasonable end result for all parties. If the outcome of the judicial review were to result in an electric rate reduction greater than the decrease ordered by the UTC, it may not provide us with a reasonable opportunity to earn the rate of return authorized by the UTC.
2016 General Rate Cases
On December 15, 2016, the UTC issued an order related to our Washington electric and natural gas general rate cases that were originally filed with the UTC in February 2016. The UTC order denied the Company's proposed electric and natural gas rate increase requests of $38.6 million and $4.4 million, respectively. Accordingly, our current electric and natural gas retail rates will remain unchanged in Washington State.
Our original requests were based on a proposed ROR of 7.64 percent with a common equity ratio of 48.5 percent and a 9.9 percent ROE.
On December 23, 2016 we filed a Petition for Reconsideration or, in the alternative, Rehearing (Petition) with the UTC related to our 2016 general rate cases.
The UTC’s Order and Avista Corp.’s Response
The primary reason given by the UTC in reaching its conclusion is that, in our request, we did not follow an “appropriate methodology” to show the existence of attrition, as between historical data and current and projected data. Further, the order states that, among other things, we did not demonstrate, as a necessary condition to being allowed an attrition adjustment, that we have suffered from chronic under-earning caused by circumstances beyond our ability to control. We disagree with the UTC as to various questions of fact and law.
In support of its decision, the UTC stated that we did not demonstrate that our current revenue is insufficient for covering costs and providing the opportunity to earn a reasonable return during the 2017 rate period. The UTC also stated that we did not demonstrate that our capital expenditures and increased operating costs are both necessary and immediate.
Our Petition responding to the UTC's order points to evidence in the case that demonstrates, contrary to the UTC’s findings, the following:
|
•
|
Current retail rates are not sufficient for the 2017 rate period, and therefore a revenue increase is necessary. In previously filed testimony, UTC Staff agreed that current rates were not sufficient.
|
|
•
|
The costs associated with the growth in rate base and operating expenses are growing at a faster pace than revenue from retail sales, and therefore a revenue adjustment is necessary to close this gap. The revenue adjustment to close this gap is sometimes called an attrition adjustment. In previously filed testimony, UTC Staff agreed that a revenue adjustment is necessary to close this gap.
|
|
•
|
All of the capital projects and operating expenses we included in the case are necessary in the time frame proposed in order for us to continue to provide safe, reliable service to customers. No party in the case identified a single capital project that should not be completed in the time frame we proposed (other than Public Counsel’s general opposition to AMI).
|
|
•
|
We presented all of the studies and analyses in this case, consistent with our previous filings with the UTC, and the UTC Staff acknowledged in previously filed testimony, that we provided such studies.
|
|
•
|
We earned close to our allowed return on equity during each of the years 2013 through 2015, and into 2016. This opportunity was possible only with the revenue increases related to attrition adjustments, and an attrition adjustment is also necessary for 2017.
|
In previously filed testimony, the UTC Staff supported electric and natural gas revenue increases totaling $28.4 million. Commissioner Jones dissented and did not support the decision. In his dissent, Commissioner Jones supported an electric revenue increase of $26.0 million, and a natural gas increase of $2.4 million, based on UTC Staff's analysis.
35
In response to our Petition, on December 27, 2016 the UTC issued a “Notice of Opportunity to File Answers to Petition for Reconsideration or Rehearing.” In its Notice the UTC requested parties to the case to file written answers to our Petition and all interested parties filed written answers to the Petition in January 2017. The UTC's notice indicated that it expects to enter an order resolving the Petition no later than March 16, 2017.
In UTC Staff’s Answer to our Petition, UTC Staff essentially abandoned its previous recommendations to the UTC, and supported no electric and natural gas revenue increases. In our Motion to Respond, and Response Comments, to the Answers of the parties, filed January 20, 2017, we noted the inappropriateness of UTC Staff’s changed position, which was without any basis in new or changed facts or circumstances. The other parties generally supported the UTC decision in their Answers to our Petition.
Future General Rate Case Filings
We plan to file new electric and natural gas general rate cases in Washington in the second quarter of 2017. We will address the issues raised by the UTC in the most recent rate order, including, but not limited to, multi-year rate plans to address the concerns over frequency of filings, the necessity of an attrition adjustment for the opportunity to earn our allowed return in a period when growth rates in investment in plant and operating expenses outpace growth in energy sales, and whether our current spending levels are both necessary and immediate to provide safe and reliable service to our customers.
We may also seek an order from the UTC allowing for the deferral for later recovery of ongoing costs associated with AMI.
Accounting Order to Defer Existing Washington Electric Meters
In March 2016, the UTC granted our Petition for an Accounting Order to defer and include in a regulatory asset the undepreciated value of our existing Washington electric meters for the opportunity for later recovery. This accounting treatment is related to our plans to replace approximately 253,000 of our existing electric meters with new two-way digital meters and the related software and support services through our AMI project in Washington State. Replacement of the meters is expected to begin in the second half of 2017.
The prudence of the overall AMI project and ultimate recovery of the regulatory assets and the costs of the new meters will be addressed in a future regulatory proceeding. The undepreciated value estimated for the existing meters is approximately
$19.1 million
. For ratemaking purposes, the existing electric meters won't be recorded as regulatory assets until they are physically removed from service, but for GAAP purposes, they are regulatory assets upon the commitment by management to retire the meters.
Idaho General Rate Cases
2015 General Rate Cases
In December 2015, the IPUC approved a settlement agreement between Avista Utilities and all interested parties related to our electric and natural gas general rate cases, which were originally filed with the IPUC on June 1, 2015. New rates were effective on January 1, 2016.
The settlement agreement is designed to increase annual electric base revenues by
$1.7 million
or
0.7 percent
and annual natural gas base revenues by
$2.5 million
or
3.5 percent
. The settlement is based on an ROR of
7.42 percent
with a common equity ratio of
50 percent
and a
9.5 percent
ROE.
The settlement agreement also reflects the following:
|
•
|
the discontinuation of the after-the-fact earnings test (provision for earnings sharing) that was originally agreed to as part of the settlement of our 2012 electric and natural gas general rate cases, and
|
|
•
|
the implementation of electric and natural gas Fixed Cost Adjustment mechanisms, as discussed below.
|
2016 General Rate Cases
In December 2016, the IPUC approved a settlement agreement between us and other parties in our electric general rate case, concluding our Idaho electric general rate case originally filed in May 2016. New rates took effect on January 1, 2017 under the settlement agreement. We did not file a natural gas general rate case in 2016.
The settlement agreement increases annual electric base rates by 2.6 percent (designed to increase annual electric revenues by $6.3 million). The settlement revenue increase is based on a ROR of 7.58 percent with a common equity ratio of 50 percent and a 9.5 percent ROE.
36
In addition to the agreed upon increase in electric revenues to recover costs primarily driven by our increased capital investments in infrastructure to serve customers, the settlement agreement includes the continued recovery of approximately $4.1 million in costs related to the Palouse Wind Project through the PCA mechanism rather than through base rates.
In our original request we requested an overall increase in base electric rates of 6.3 percent (designed to increase annual electric revenues by $15.4 million), effective January 1, 2017.
Our original request was based on a proposed ROR of 7.78 percent with a common equity ratio of 50 percent and a 9.9 percent ROE.
Oregon General Rate Cases
2013 General Rate Case
In January 2014, the OPUC approved a settlement agreement in our natural gas general rate case (originally filed in August 2013). As agreed to in the settlement, new rates were implemented in two phases: February 1, 2014 and November 1, 2014. Effective February 1, 2014, rates increased for Oregon natural gas customers on a billed basis by an overall
4.4 percent
(designed to increase annual revenues by
$3.8 million
). Effective November 1, 2014, rates for Oregon natural gas customers were to increase on a billed basis by an overall
1.6 percent
(designed to increase annual revenues by
$1.4 million
).
The billed rate increase on November 1, 2014 was dependent upon the completion of Project Compass and the actual costs incurred through September 30, 2014, and the actual costs incurred through June 30, 2014 related to the Company's Aldyl A distribution pipeline replacement program. Project Compass was completed in February 2015. The November 1, 2014 rate increase was reduced from
$1.4 million
to
$0.3 million
due to the delay of Project Compass.
The approved settlement agreement provided an authorized ROR of
7.47 percent
, with a common equity ratio of
48 percent
and a
9.65 percent
ROE.
2014 General Rate Case
In March 2015, we filed an all-party settlement agreement with the OPUC related to our natural gas general rate case, which was originally filed in September 2014. The settlement agreement was designed to increase base natural gas revenues by
$5.3 million
. Included in this base rate increase is
$0.3 million
in base revenues that we were already receiving from customers through a separate rate adjustment. Therefore, the net increase in base revenues was
$5.0 million
, or
4.9 percent
on a billed basis. The parties requested that new retail rates become effective on April 16, 2015. On April 9, 2015, the OPUC issued an Order approving the settlement agreement as filed.
This settlement agreement provided for an overall authorized ROR of
7.516 percent
with a common equity ratio of
51 percent
and a
9.5 percent
ROE.
2015 General Rate Case
On February 29, 2016, the OPUC issued a preliminary order (and a final order on March 15, 2016) concluding our natural gas general rate case, which was originally filed with OPUC in May 2015. The OPUC order approved rates designed to increase overall billed natural gas rates by 4.9 percent (designed to increase annual natural gas revenues by $4.5 million). New rates went into effect on March 1, 2016. The final OPUC order incorporated two partial settlement agreements which were entered into during November 2015 and January 2016.
The OPUC order provided an authorized ROR of 7.46 percent with a common equity ratio of 50 percent and a 9.4 percent ROE.
The November 2015 partial settlement agreement, approved by the OPUC, included a provision for the implementation of a decoupling mechanism, similar to the Washington and Idaho mechanisms described below. See further description and a summary of the balances recorded under this mechanism below.
2016 General Rate Case
On November 30, 2016 we filed a natural gas general rate case with the OPUC. We have requested an overall increase in base natural gas rates of 14.5 percent (designed to increase annual natural gas revenues by $8.5 million). Our request is based on a proposed ROR of 7.83 percent with a common equity ratio of 50 percent and a 9.9 percent ROE. The OPUC has up to 10 months to review our request and issue a decision.
Alaska Electric Light and Power Company
Alaska General Rate Case
In September 2016, AEL&P filed an electric general rate case with the RCA. AEL&P was granted a refundable interim base rate increase of 3.86 percent (designed to increase electric revenues by $1.3 million), that took effect in November 2016.
37
AEL&P has also requested a permanent base rate increase of an additional 4.24 percent (designed to increase electric revenues by $1.5 million), which, if approved, could take effect in February 2018. This represents a combined total rate increase of 8.1 percent (designed to increase electric revenues by $2.8 million).
Included in the general rate case are additional annual revenues of $2.9 million from the Greens Creek Mine, which offsets a portion of the rate increase to retail customers that would otherwise occur.
The RCA must rule on permanent rate increase requests within 450 days (approximately 15 months) from the date of filing, unless otherwise extended by consent of the parties. The statutory timeline for the AEL&P GRC, with the consent of the parties, has been extended to February 8, 2018.
The rate request is based largely on the addition of a new backup generation plant (Industrial Blvd. Plant) to rate base.
Avista Utilities
Purchased Gas Adjustments
PGAs are designed to pass through changes in natural gas costs to Avista Utilities' customers with no change in gross margin (operating revenues less resource costs) or net income. In Oregon, we absorb (cost or benefit) 10 percent of the difference between actual and projected natural gas costs included in retail rates for supply that is not hedged. Total net deferred natural gas costs among all jurisdictions were a liability of
$30.8 million
as of
December 31, 2016
and a liability of
$17.9 million
as of
December 31, 2015
, and these deferred natural gas costs balances represent amounts due to customers.
The following PGAs went into effect in our various jurisdictions during
2014
,
2015
and
2016
:
|
Jurisdiction
|
PGA Effective Date
|
Percentage Increase / (Decrease) in Billed Rates
|
||
|
Washington
|
November 1, 2014
|
1.2%
|
||
|
November 1, 2015
|
(15.0)%
|
|||
|
November 1, 2016
|
(8.0)%
|
|||
|
Idaho
|
November 1, 2014
|
(2.1)%
|
||
|
November 1, 2015
|
(14.5)%
|
|||
|
November 1, 2016
|
(7.8)%
|
|||
|
Oregon
|
November 1, 2014
|
8.3%
|
||
|
November 1, 2015
|
(14.1)%
|
|||
|
November 1, 2016
|
(6.0)%
|
|||
Power Cost Deferrals and Recovery Mechanisms
The ERM is an accounting method used to track certain differences between Avista Utilities' actual power supply costs, net of wholesale sales and sales of fuel, and the amount included in base retail rates for our Washington customers. Total net deferred power costs under the ERM were a liability of
$21.3 million
as of
December 31, 2016
compared to a liability
$18.0 million
as of
December 31, 2015
, and these deferred power cost balances represent amounts due to customers.
The difference in net power supply costs under the ERM primarily results from changes in:
|
•
|
short-term wholesale market prices and sales and purchase volumes,
|
|
•
|
the level and availability of hydroelectric generation,
|
|
•
|
the level and availability of thermal generation (including changes in fuel prices), and
|
|
•
|
retail loads.
|
Under the ERM, Avista Utilities absorbs the cost or receives the benefit from the initial amount of power supply costs in excess of or below the level in retail rates, which is referred to as the deadband. The annual (calendar year) deadband amount is $4.0 million.
38
The following is a summary of the ERM:
|
Annual Power Supply Cost Variability
|
Deferred for Future
Surcharge or Rebate
to Customers
|
Expense or Benefit
to the Company
|
||
|
within +/- $0 to $4 million (deadband)
|
0%
|
100%
|
||
|
higher by $4 million to $10 million
|
50%
|
50%
|
||
|
lower by $4 million to $10 million
|
75%
|
25%
|
||
|
higher or lower by over $10 million
|
90%
|
10%
|
||
Under the ERM, Avista Utilities makes an annual filing on or before April 1 of each year to provide the opportunity for the UTC staff and other interested parties to review the prudence of and audit the ERM deferred power cost transactions for the prior calendar year. We made our annual filing on March 31, 2016. The ERM provides for a 90-day review period for the filing; however, the period may be extended by agreement of the parties or by UTC order. The 2015 ERM deferred power costs transactions were approved by an order from the UTC.
Avista Utilities has a PCA mechanism in Idaho that allows us to modify electric rates on October 1 of each year with IPUC approval. Under the PCA mechanism, we defer 90 percent of the difference between certain actual net power supply expenses and the amount included in base retail rates for our Idaho customers. The October 1 rate adjustments recover or rebate power supply costs deferred during the preceding July-June twelve-month period. Total net power supply costs deferred under the PCA mechanism were a liability of
$2.2 million
as of
December 31, 2016
compared to an asset of
$0.2 million
as of
December 31, 2015
.
Decoupling and Earnings Sharing Mechanisms
Decoupling is a mechanism designed to sever the link between a utility's revenues and consumers' energy usage. In each of Avista Utilities' jurisdictions, each month Avista Utilities' electric and natural gas revenues are adjusted so as to be based on the number of customers in certain customer rate classes, rather than kilowatt hour and therm sales. The difference between revenues based on the number of customers and revenues based on actual usage is deferred and either surcharged or rebated to customers beginning in the following year.
Washington Decoupling and Earnings Sharing
In Washington, the UTC approved our decoupling mechanisms for electric and natural gas for a five-year period beginning January 1, 2015. Electric and natural gas decoupling surcharge rate adjustments to customers are limited to
3 percent
on an annual basis, with any remaining surcharge balance carried forward for recovery in a future period. There is no limit on the level of rebate rate adjustments.
The decoupling mechanisms each include an after-the-fact earnings test. At the end of each calendar year, separate electric and natural gas earnings calculations are made for the prior calendar year. These earnings tests reflect actual decoupled revenues, normalized power supply costs and other normalizing adjustments.
|
•
|
If we have a decoupling rebate balance for the prior year and earn in excess of the authorized ROR (
7.32 percent
for 2015 and 7.29 percent for 2016), the rebate to customers would be increased by
50 percent
of the earnings in excess of the authorized ROR.
|
|
•
|
If we have a decoupling rebate balance for the prior year and our earnings are equal to or less than the authorized ROR, only the base amount of the rebate to customers would be made.
|
|
•
|
If we have a decoupling surcharge balance for the prior year and earn in excess of the authorized ROR, the surcharge to customers would be reduced by
50 percent
of the earnings in excess of the authorized ROR (or eliminated). If 50 percent of the earnings in excess of the authorized ROR exceeds the decoupling surcharge balance, the dollar amount that exceeds the surcharge balance would create a rebate balance for customers.
|
|
•
|
If we have a decoupling surcharge balance for the prior year and our earnings are equal to or less than the authorized ROR, the base amount of the surcharge to customers would be made.
|
See below for a summary of cumulative balances under the decoupling and earnings sharing mechanisms.
Idaho FCA and Earnings Sharing Mechanisms
In Idaho, the IPUC approved the implementation of FCAs for electric and natural gas (similar in operation and effect to the Washington decoupling mechanisms) for an initial term of three years, beginning January 1, 2016.
39
For the period 2013 through 2015, we had an after-the-fact earnings test, such that if Avista Corp., on a consolidated basis for electric and natural gas operations in Idaho, earned more than a
9.8 percent
ROE, we were required to share with customers 50 percent of any earnings above the
9.8 percent
. There was no provision for a surcharge to customers if our ROE was less than
9.8 percent
. This after-the-fact earnings test was discontinued as part of the settlement of our 2015 Idaho electric and natural gas general rates cases (discussed in further detail above).
See below for a summary of cumulative balances under the decoupling and earnings sharing mechanisms.
Oregon Decoupling Mechanism
In February 2016, the OPUC approved the implementation of a decoupling mechanism for natural gas, similar to the Washington and Idaho mechanisms described above. The decoupling mechanism became effective on March 1, 2016. There will be an opportunity for interested parties to review the mechanism and recommend changes, if any, by September 2019. An earnings review is conducted on an annual basis, which is filed by us with the OPUC on or before June 1 of each year for the prior calendar year. In the annual earnings review, if we earn more than 100 basis points above our allowed return on equity, one-third of the earnings above the 100 basis points would be deferred and later returned to customers. See below for a summary of cumulative balances under the decoupling and earnings sharing mechanisms.
Cumulative Decoupling and Earnings Sharing Mechanism Balances
As of
December 31, 2016
and
December 31, 2015
, we had the following cumulative balances outstanding related to decoupling and earnings sharing mechanisms in our various jurisdictions (dollars in thousands):
|
December 31,
|
December 31,
|
||||||
|
|
2016
|
2015
|
|||||
|
Washington
|
|||||||
|
Decoupling surcharge
|
$
|
30,408
|
|
$
|
10,933
|
|
|
|
Provision for earnings sharing rebate
|
(5,113
|
)
|
(3,422
|
)
|
|||
|
Idaho
|
|||||||
|
Decoupling surcharge
|
$
|
8,292
|
|
n/a
|
|
||
|
Provision for earnings sharing rebate
|
(5,184
|
)
|
(8,814
|
)
|
|||
|
Oregon
|
|||||||
|
Decoupling surcharge
|
$
|
2,021
|
|
n/a
|
|
||
|
Provision for earnings sharing rebate
|
—
|
|
—
|
|
|||
(n/a) This mechanism did not exist during this time period.
See "Results of Operations - Avista Utilities" for further discussion of the amounts recorded to operating revenues in 2015 and 2016 related to the decoupling and earnings sharing mechanisms.
Results of Operations - Overall
The following provides an overview of changes in our Consolidated Statements of Income. More detailed explanations are provided, particularly for operating revenues and operating expenses, in the business segment discussions (Avista Utilities, AEL&P, Ecova - Discontinued Operations and the other businesses) that follow this section.
As discussed in "Executive Level Summary," Ecova was disposed of as of June 30, 2014. As a result, in accordance with GAAP, all of Ecova's operating results were removed from each line item on the Consolidated Statements of Income and reclassified into discontinued operations for all periods presented. The discussion of continuing operations below does not include any Ecova amounts. For our discussion of discontinued operations and Ecova, see "Ecova - Discontinued Operations."
The balances included below for utility operations reconcile to the Consolidated Statements of Income. Beginning on July 1, 2014, AEL&P is included in the overall utility results.
40
2016
compared to
2015
The following graph shows the total change in net income from continuing operations for the year ended December 31, 2015 to the year ended December 31, 2016, as well as the various factors that caused such change (dollars in millions):
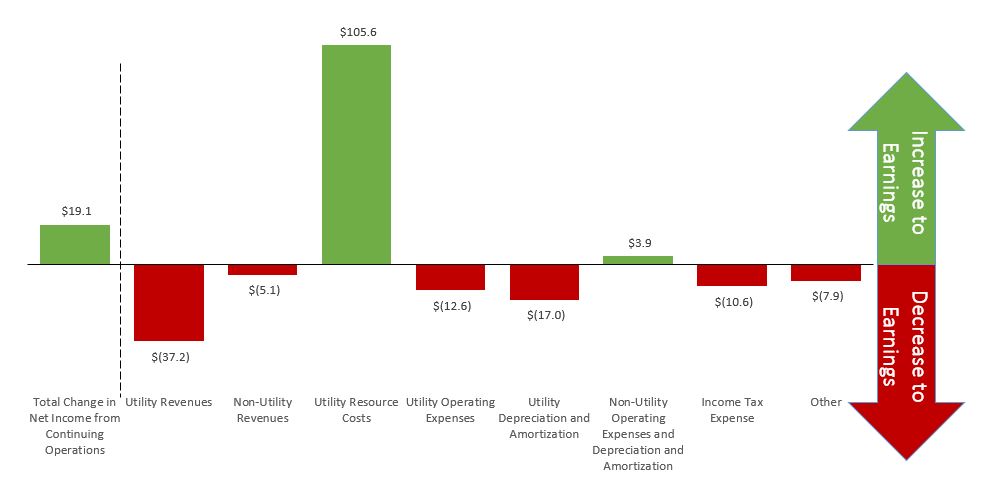
Utility revenues decreased due to a decrease at Avista Utilities, partially offset by a slight increase in AEL&P's revenues. Avista Utilities' electric revenues decreased primarily due to lower retail electric loads caused by weather fluctuations throughout the period, a general rate decrease in Washington and lower wholesale revenues resulting from lower volumes and lower wholesale prices. These revenue decreases were partially offset by a general rate increase in Idaho, the expiration of the ERM rebate to customers in Washington, increased decoupling revenues and a lower provision for earnings sharing. Natural gas revenues decreased primarily due to a decrease in wholesale activity (both a decrease in volumes and prices) and lower retail revenues due to lower prices, partially offset by higher natural gas heating volumes. The decreases in natural gas revenues were partially offset by general rate increases and higher decoupling revenues.
Non-utility revenues decreased due to the long-term fixed rate electric capacity contract that was previously held by Spokane Energy being transferred to Avista Corp. during the second quarter of 2015. The capacity revenue from this contract was included in non-utility revenues when it was held by Spokane Energy during the first quarter of 2015. After the transfer, the revenue is included in Avista Utilities' revenues. The contract expired during December 2016.
Utility resource costs decreased due to a decrease at Avista Utilities. Avista Utilities' electric resource costs decreased primarily due to a decrease in purchased power (from lower volumes purchased and lower wholesale prices) and a decrease in fuel for generation (due in part to increased hydroelectric generation). Natural gas resource costs decreased due to a decrease in natural gas purchased resulting from lower volumes and lower prices.
Utility operating expenses increased due to an increase at Avista Utilities and a slight increase at AEL&P. Avista Utilities' portion of other operating expenses increased due to an increase in medical costs of $3.0 million, electric generation operating and maintenance expenses of $6.8 million, natural gas distribution expenses of $2.2 million and other postretirement benefit expenses of $2.0 million.
Utility depreciation and amortization increased
$17.0 million
driven by additions to utility plant.
Income tax expense increased primarily due to an increase in income before income taxes, partially offset by excess tax benefits of
$1.6 million
during 2016 relating to the settlement of share-based payment awards. See "Note 2 of the Notes to Consolidated Financial Statements" for further discussion of the excess tax benefits. Our effective tax rate was
36.3 percent
for both
2016
and
2015
.
Other was primarily related to an increase in interest expense, due to additional debt being outstanding during 2016 as compared to 2015 and partially due to an increase in the overall interest rate. Also, there were losses on investments at our subsidiaries, mainly due to initial organization costs and management fees associated with a new investment.
41
2015 compared to 2014
The following graph shows the total change in net income from continuing operations for the year ended December 31, 2014 to the year ended December 31, 2015, as well as the various factors that caused such change (dollars in millions):
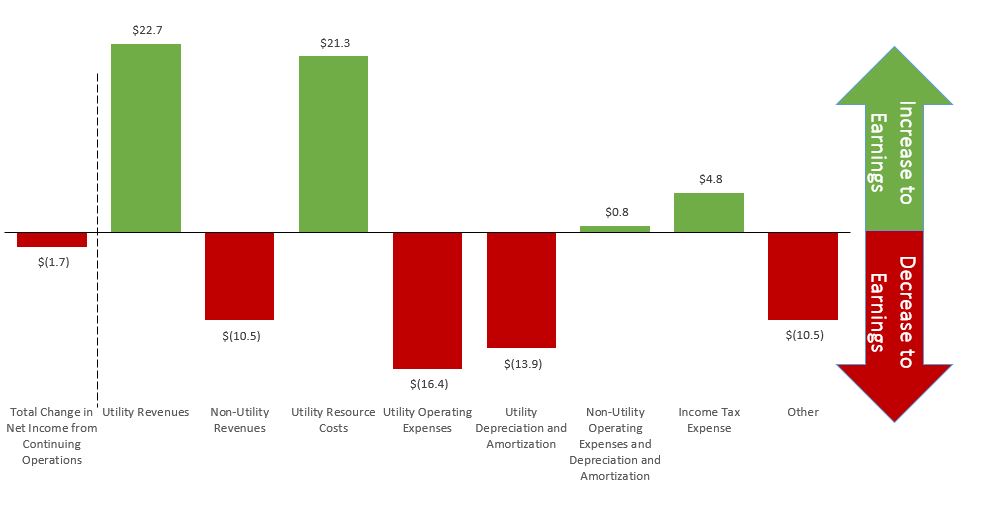
Utility revenues increased due to an increase at AEL&P, partially offset by a decrease at Avista Utilities. AEL&P's revenues increased $23.1 million due to a full year of AEL&P results in 2015 as compared to six months in 2014. Avista Utilities' electric revenues decreased due to lower loads from warmer weather, which were partially offset by the decoupling mechanism in Washington, a general rate increase in Washington and a decrease in the provision for earnings sharing (which is an offset to revenue). Avista Utilities' natural gas revenues decreased due to lower heating loads from significantly warmer weather that was partially offset by the decoupling mechanism in Washington and general rate increases.
Other non-utility revenues decreased primarily due to the long-term fixed rate electric capacity contract that was previously held by Spokane Energy being transferred to Avista Corp. during the second quarter of 2015. The capacity revenue from this contract was included in non-utility revenues when it was held by Spokane Energy. After the transfer, the revenue is included in Avista Utilities' revenues.
Utility resource costs decreased due to a decrease at Avista Utilities, partially offset by an increase at AEL&P. AEL&P's resource costs increased $6.1 million due to a full year of AEL&P results in 2015 as compared to six months in 2014. Avista Utilities' electric resource costs decreased primarily due to a decrease in purchased power (from lower volumes purchased, partially offset by higher wholesale prices) and a decrease in other fuel costs. Natural gas resource costs decreased due to a decrease in natural gas purchased resulting from lower prices, partially offset by higher volumes.
Utility operating expenses increased due to an increase at Avista Utilities and at AEL&P. Avista Utilities' portion of other operating expenses increased $11.1 million and AEL&P's other operating expenses increased $5.3 million due to a full year of AEL&P results in 2015 as compared to six months in 2014. Avista Utilities incurred increased generation, transmission and distribution operating expenses of $5.7 million, increased administrative and general wages of $9.8 million and increased pension and other post-retirement benefit expenses of $10.0 million. In addition, Avista Utilities incurred incremental storm restoration costs associated with the November 2015 wind storm of approximately $2.9 million. These increases were partially offset by decreases in outside services and generation maintenance of $7.8 million.
Utility depreciation and amortization increased due to additions to utility plant and the inclusion of a full year of AEL&P depreciation as compared to only six months of AEL&P in 2014.
Income tax expense decreased and our effective tax rate was 36.3 percent for 2015 compared to 37.6 percent for 2014. The decrease in expense was primarily due to a decrease in income before income taxes.
Other was primarily related to an increase in interest expense, due to additional debt being outstanding during 2015 as compared to 2014. Also, there were losses on investments at our subsidiaries.
42
Non-GAAP Financial Measures
The following discussion for Avista Utilities includes two financial measures that are considered “non-GAAP financial measures,” electric gross margin and natural gas gross margin. In the AEL&P section, we include a discussion of electric gross margin, which is also a non-GAAP financial measure.
Generally, a non-GAAP financial measure is a numerical measure of a company's financial performance, financial position or cash flows that excludes (or includes) amounts that are included (excluded) in the most directly comparable measure calculated and presented in accordance with GAAP. The presentation of electric gross margin and natural gas gross margin is intended to supplement an understanding of operating performance. We use these measures to determine whether the appropriate amount of revenue is being collected from our customers to allow for the recovery of energy resource costs and operating costs, as well as to analyze how changes in loads (due to weather, economic or other conditions), rates, supply costs and other factors impact our results of operations. In addition, we present electric and natural gas gross margin separately below for Avista Utilities since each business has different cost sources, cost recovery mechanisms and jurisdictions, such that separate analysis is beneficial. These measures are not intended to replace income from operations as determined in accordance with GAAP as an indicator of operating performance. The calculations of electric and natural gas gross margins are presented below.
Results of Operations - Avista Utilities
2016
compared to
2015
The following table presents Avista Utilities' operating revenues, resource costs and resulting gross margin for the years ended December 31 (dollars in millions):
|
|
Electric
|
Natural Gas
|
Intracompany
|
Total
|
|||||||||||||||||||||||||||
|
|
2016
|
2015
|
2016
|
2015
|
2016
|
2015
|
2016
|
2015
|
|||||||||||||||||||||||
|
Operating revenues
|
$
|
996,959
|
|
$
|
997,873
|
|
$
|
470,894
|
|
$
|
521,010
|
|
$
|
(95,215
|
)
|
$
|
(107,020
|
)
|
$
|
1,372,638
|
|
$
|
1,411,863
|
|
|||||||
|
Resource costs
|
360,591
|
|
400,910
|
|
273,976
|
|
351,101
|
|
(95,215
|
)
|
(107,020
|
)
|
539,352
|
|
644,991
|
|
|||||||||||||||
|
Gross margin
|
$
|
636,368
|
|
$
|
596,963
|
|
$
|
196,918
|
|
$
|
169,909
|
|
$
|
—
|
|
$
|
—
|
|
$
|
833,286
|
|
$
|
766,872
|
|
|||||||
The gross margin on electric sales increased
$39.4 million
and the gross margin on natural gas sales increased
$27.0 million
. The increase in electric gross margin was primarily due to general rate increases, lower resource costs, the implementation of decoupling in Idaho and a
$6.6 million
decrease in the provision for earnings sharing (which is an offset to revenue), partially offset by lower electric loads. The weather was warmer than the prior year in April and May (which decreased electric heating loads) and cooler than the prior year June through August (which decreased electric cooling loads). This was partially offset by the effect of weather that was cooler than the prior year in the first and fourth quarters (which increased electric heating loads). Overall, weather was warmer than normal for most of the year. Retail electric loads decreased as compared to prior year and the impact as compared to normal was mostly offset by decoupling mechanisms. See the table below for a comparison of the amounts recorded for decoupling by jurisdiction. For
2016
, we recognized a pre-tax benefit of
$5.1 million
under the ERM in Washington compared to a benefit of
$6.3 million
for
2015
.
The increase in natural gas gross margin was primarily due to general rate increases in each of our jurisdictions, lower natural gas resources costs, the implementation of decoupling mechanisms in Idaho and Oregon, and higher natural gas retail loads. Weather was cooler in the first quarter (which increased natural gas heating loads), warmer in April and May (which reduced natural gas heating loads) and cooler in the fourth quarter (which increased natural gas heating loads) as compared to the prior year. The period June through September typically does not have significant natural gas retail loads. Overall, retail natural gas loads increased as compared to prior year and the impact as compared to normal (lower loads) was mostly offset by decoupling mechanisms. See the table below for a comparison of the amounts recorded for decoupling by jurisdiction.
Intracompany revenues and resource costs represent purchases and sales of natural gas between our natural gas distribution operations and our electric generation operations (as fuel for our generation plants). These transactions are eliminated in the presentation of total results for Avista Utilities and in the condensed consolidated financial statements but are included in the separate results for electric and natural gas presented below.
43
The following graphs present Avista Utilities' electric operating revenues and megawatt-hour (MWh) sales for the years ended December 31 (dollars in millions and MWhs in thousands):
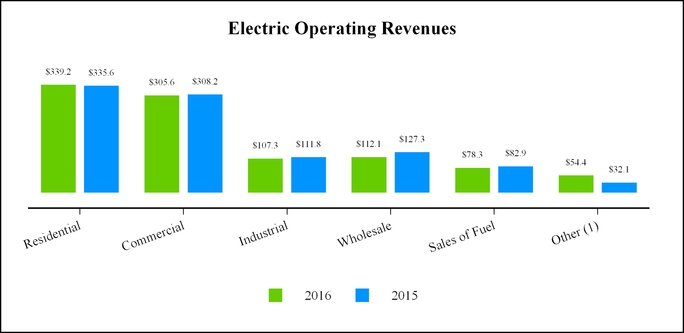
|
(1)
|
Other electric revenues in the graph above includes public street and highway lighting, which is considered part of retail electric revenues.
|
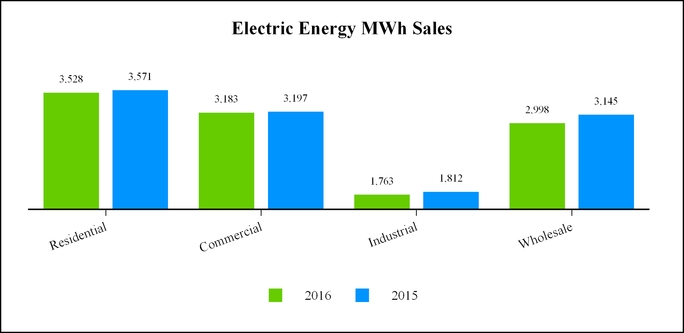
44
The following table presents Avista Utilities' decoupling and customer earnings sharing mechanisms by jurisdiction that are included in utility electric operating revenues for the years ended December 31 (dollars in thousands):
|
|
Electric Operating
Revenues |
||||||
|
|
2016
|
2015
|
|||||
|
Washington
|
|||||||
|
Decoupling surcharge
|
$
|
11,324
|
|
$
|
4,740
|
|
|
|
Provision for earnings sharing (1)
|
221
|
|
(3,423
|
)
|
|||
|
Idaho
|
|||||||
|
Decoupling surcharge
|
$
|
6,025
|
|
n/a
|
|
||
|
Provision for earnings sharing (2)
|
711
|
|
(2,198
|
)
|
|||
|
(1)
|
The provision for earnings sharing in Washington in
2016
resulted from a $2.5 million reduction in the 2015 provision for earnings sharing (which increased 2016 revenues) offset by a $2.3 million provision for earnings sharing for 2016 electric operations.
|
|
(2)
|
The provision for earnings sharing in Idaho in
2016
resulted from a reduction in the 2015 provision for earnings sharing (which increased 2016 revenues). Beginning in 2016 there is no longer an earnings sharing mechanism in Idaho.
|
|
(n/a)
|
This mechanism did not exist during this time period.
|
Total electric revenues decreased
$0.9 million
for
2016
as compared to
2015
, affected by the following:
|
•
|
a
$3.0 million
decrease in retail electric revenues due to a decrease in total MWhs sold (decreased revenues
$9.5 million
), partially offset by an increase in revenue per MWh (increased revenues
$6.5 million
).
|
|
◦
|
The increase in revenue per MWh was primarily due to a general rate increase in Idaho and the expiration of the ERM rebate to customers in Washington, partially offset by a general rate decrease in Washington.
|
|
◦
|
The decrease in total retail MWhs sold was the result of weather that was cooler in the first quarter (higher electric heating loads), warmer in April and May (lower electric heating loads), cooler June through August (lower electric cooling loads) and cooler in the fourth quarter (higher electric heating loads) as compared to the prior year (which overall decreased electric loads). Compared to
2015
, residential electric use per customer decreased
1 percent
and commercial use per customer decreased
1 percent
. Heating degree days in Spokane were
11 percent
below normal and
3 percent
above
2015
. The impact from increased heating loads was offset by decreased cooling loads in the summer.
2016
cooling degree days were
29 percent
above normal (mostly in June). However, cooling degree days were
41 percent
below the prior year. The overall decrease in use per customer was partially offset by growth in the number of customers.
|
|
◦
|
There has been a decline in residential use per customer during the last three years and is primarily due to weather fluctuations but also due in part to energy efficiency measures adopted by customers. See "Item 1. Business – Avista Utilities Operating Statistics" for the three-year summary of residential use per customer.
|
|
•
|
a
$15.2 million
decrease in wholesale electric revenues due to a decrease in sales volumes (decreased revenues
$5.5 million
) and a decrease in sales prices (decreased revenues
$9.7 million
). The fluctuation in volumes and prices was primarily the result of our optimization activities.
|
|
•
|
a
$4.6 million
decrease in sales of fuel due to a decrease in sales of natural gas fuel as part of thermal generation resource optimization activities. For
2016
,
$44.0 million
of these sales were made to our natural gas operations and are included as intracompany revenues and resource costs. For
2015
,
$50.0 million
of these sales were made to our natural gas operations.
|
|
•
|
a
$12.6 million
increase in electric revenue due to decoupling, which reflected the implementation of a decoupling mechanism in Idaho effective January 1, 2016 and lower retail revenues in 2016 as compared to 2015.
|
|
•
|
a
$6.6 million
decrease in the electric provision for earnings sharing (which increases revenues) due to a $2.5 million reduction in the 2015 provision for earnings sharing in Washington and a $0.7 million reduction in the 2015 provision for earnings sharing in Idaho recorded in 2016. For 2016 electric operations, we recorded a $2.3 million provision for earnings sharing.
|
45
The following graphs present Avista Utilities' natural gas operating revenues and therms delivered for the years ended December 31 (dollars in millions and therms in thousands):
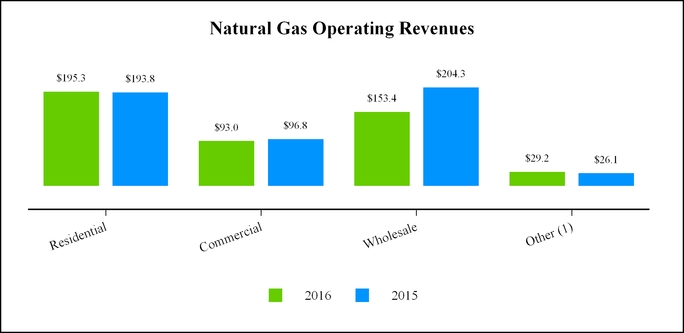
|
(1)
|
Other natural gas revenues in the graph above includes interruptible and industrial revenues, which are considered part of retail natural gas revenues.
|
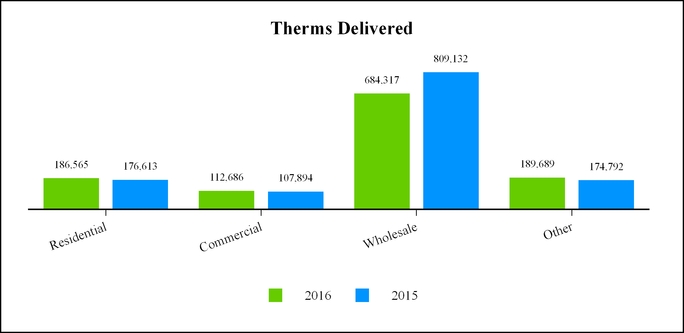
46
The following table presents Avista Utilities' decoupling and customer earnings sharing mechanisms by jurisdiction that are included in utility natural gas operating revenues for the years ended December 31 (dollars in thousands):
|
|
Natural Gas
Operating Revenues
|
||||||
|
|
2016
|
2015
|
|||||
|
Washington
|
|||||||
|
Decoupling surcharge
|
$
|
8,191
|
|
$
|
6,004
|
|
|
|
Provision for earnings sharing
|
(2,767
|
)
|
—
|
|
|||
|
Idaho
|
|||||||
|
Decoupling surcharge
|
$
|
2,206
|
|
n/a
|
|
||
|
Provision for earnings sharing
|
n/a
|
|
—
|
|
|||
|
Oregon
|
|||||||
|
Decoupling surcharge
|
1,912
|
|
n/a
|
|
|||
|
Provision for earnings sharing
|
—
|
|
—
|
|
|||
|
(n/a)
|
This mechanism did not exist during this time period.
|
Total natural gas revenues decreased
$50.1 million
for
2016
as compared to
2015
due to the following:
|
•
|
a
$3.4 million
decrease in retail natural gas revenues due to lower retail rates (decreased revenues
$18.4 million
), partially offset by an increase in volumes (increased revenues
$15.0 million
).
|
|
◦
|
Lower retail rates were due to PGAs, which passed through lower costs of natural gas, partially offset by general rate increases.
|
|
◦
|
We sold more retail natural gas in
2016
as compared to
2015
primarily due to cooler weather in the first and fourth quarters, as well as customer growth. Compared to
2015
, residential use per customer increased
5 percent
and commercial use per customer increased
3 percent
. Heating degree days in Spokane were
11 percent
below historical average for
2016
, and
3 percent
above
2015
. Heating degree days in Medford were
12 percent
below historical average for
2016
, and
3 percent
above
2015
.
|
|
•
|
a
$50.8 million
decrease in wholesale natural gas revenues due to a decrease in prices (decreased revenues
$22.8 million
) and a decrease in volumes (decreased revenues
$28.0 million
). In
2016
,
$51.2 million
of these sales were made to our electric generation operations and are included as intracompany revenues and resource costs. In
2015
,
$57.0 million
of these sales were made to our electric generation operations. Differences between revenues and costs from sales of resources in excess of retail load requirements and from resource optimization are accounted for through the PGA mechanisms.
|
|
•
|
a
$6.3 million
increase for natural gas decoupling revenues due primarily to the implementation of decoupling mechanisms in Idaho and Oregon, as well as an increase in the decoupling surcharge in Washington.
|
|
•
|
a
$2.8 million
increase in the provision for earnings sharing (which decreases revenues) representing the 2016 provision for Washington natural gas operations.
|
The following table presents Avista Utilities' average number of electric and natural gas retail customers for the years ended December 31:
|
|
Electric
Customers
|
Natural Gas
Customers
|
|||||||||
|
|
2016
|
2015
|
2016
|
2015
|
|||||||
|
Residential
|
330,699
|
|
327,057
|
|
300,883
|
|
296,005
|
|
|||
|
Commercial
|
41,785
|
|
41,296
|
|
34,868
|
|
34,229
|
|
|||
|
Interruptible
|
—
|
|
—
|
|
37
|
|
35
|
|
|||
|
Industrial
|
1,342
|
|
1,353
|
|
255
|
|
261
|
|
|||
|
Public street and highway lighting
|
558
|
|
529
|
|
—
|
|
—
|
|
|||
|
Total retail customers
|
374,384
|
|
370,235
|
|
336,043
|
|
330,530
|
|
|||
47
The following graphs present Avista Utilities' resource costs for the years ended December 31 (dollars in millions):
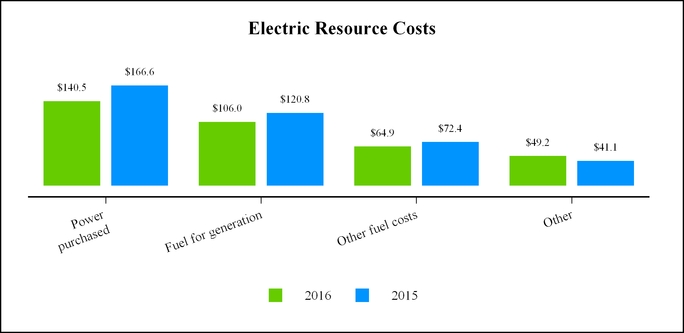
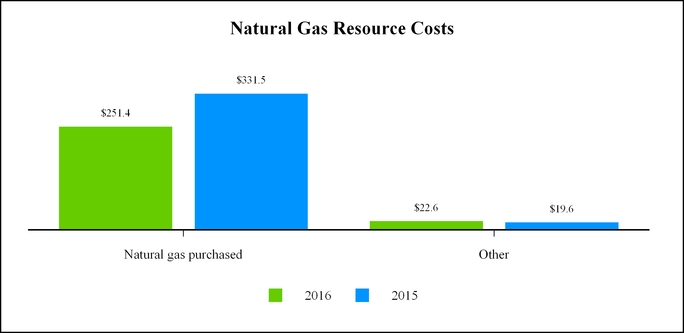
Total resource costs in the graphs above include intracompany resource costs of
$95.2 million
and
$107.0 million
for
2016
and
2015
, respectively.
Total electric resource costs decreased
$40.3 million
for
2016
as compared to
2015
due to the following:
|
•
|
a
$26.1 million
decrease in power purchased due to a decrease in the volume of power purchases (decreased costs
$9.3 million
) and a decrease in wholesale prices (decreased costs
$16.8 million
). The fluctuation in volumes and prices was primarily the result of our optimization activities.
|
|
•
|
a
$14.8 million
decrease in fuel for generation primarily due to a decrease in thermal generation (due in part to increased hydroelectric generation) and a decrease in natural gas fuel prices.
|
|
•
|
a
$7.5 million
decrease in other fuel costs.
|
|
•
|
a
$3.0 million
decrease from amortizations and deferrals of power costs.
|
|
•
|
a
$5.6 million
increase in other electric resource costs primarily due to a benefit that was recorded during 2015 related
|
48
to a capacity contract of Spokane Energy. This benefit was mostly deferred for probable future benefit to customers through the ERM and PCA.
|
•
|
a
$5.4 million
increase in other regulatory amortizations.
|
Total natural gas resource costs decreased
$77.1 million
for
2016
as compared to
2015
due to following:
|
•
|
an
$80.1 million
decrease in natural gas purchased due to a decrease in the price of natural gas (decreased costs
$52.6 million
) and a decrease in total therms purchased (decreased costs
$27.5 million
). Total therms purchased decreased due to a decrease in wholesale sales, partially offset by an increase in retail sales.
|
|
•
|
a
$1.6 million
decrease from amortizations and deferrals of natural gas costs. This reflects lower natural gas prices and the deferral of lower costs for future rebate to customers, as well as current rebates to customers through PGAs.
|
|
•
|
a
$4.6 million
increase in other regulatory amortizations.
|
2015 compared to 2014
The following graphs presents Avista Utilities' operating revenues, resource costs and resulting gross margin for the years ended December 31 (dollars in millions):
|
|
Electric
|
Natural Gas
|
Intracompany
|
Total
|
|||||||||||||||||||||||||||
|
|
2015
|
2014
|
2015
|
2014
|
2015
|
2014
|
2015
|
2014
|
|||||||||||||||||||||||
|
Operating revenues
|
$
|
997,873
|
|
$
|
998,988
|
|
$
|
521,010
|
|
$
|
556,664
|
|
$
|
(107,020
|
)
|
$
|
(142,153
|
)
|
$
|
1,411,863
|
|
$
|
1,413,499
|
|
|||||||
|
Resource costs
|
400,910
|
|
418,541
|
|
351,101
|
|
395,956
|
|
(107,020
|
)
|
(142,153
|
)
|
644,991
|
|
672,344
|
|
|||||||||||||||
|
Gross margin
|
$
|
596,963
|
|
$
|
580,447
|
|
$
|
169,909
|
|
$
|
160,708
|
|
$
|
—
|
|
$
|
—
|
|
$
|
766,872
|
|
$
|
741,155
|
|
|||||||
The gross margin on electric sales increased $16.5 million and the gross margin on natural gas sales increased $9.2 million. The increase in electric gross margin was primarily due to a general rate increase in Washington, lower net power supply costs and a $1.9 million decrease in the provision for earnings sharing (which is an offset to revenue). We experienced weather that was significantly warmer than normal and warmer than the prior year, which decreased heating loads in the first quarter and increased cooling loads in the second quarter. Loads in the third quarter were slightly higher than the prior year. Loads for the fourth quarter were lower than the prior year, particularly for residential and industrial customers. For 2015, the decoupling mechanism in Washington had a positive effect on each of electric revenues and gross margin as did the decrease in the overall provision for earnings sharing (see the details by jurisdiction in the table below). For 2015, we recognized a pre-tax benefit of $6.3 million under the ERM in Washington compared to a benefit of $5.4 million for 2014. This change represents a decrease in net power supply costs primarily due to lower natural gas fuel and purchased power prices in 2015, partially offset by lower hydroelectric generation (due to warm and dry conditions in the second and third quarters).
The increase in natural gas gross margin was primarily due to a decrease in natural gas resource costs and a decrease in the provision for earnings sharing, partially offset by a decrease in natural gas revenues. The decrease in natural gas revenues resulted from lower heating loads primarily from significantly warmer weather that was partially offset by general rate increases. The earnings impact of the decrease in heating loads was partially offset by the decoupling mechanism in Washington, which had a positive effect on natural gas revenues and gross margin (see the details by jurisdiction in the table below).
Intracompany revenues and resource costs represent purchases and sales of natural gas between our natural gas distribution operations and our electric generation operations (as fuel for our generation plants). These transactions are eliminated in the presentation of total results for Avista Utilities and in the consolidated financial statements but are reflected in the presentation of the separate results for electric and natural gas below.
49
The following graphs present Avista Utilities' electric operating revenues and megawatt-hour (MWh) sales for the years ended December 31 (dollars in millions and MWhs in thousands):
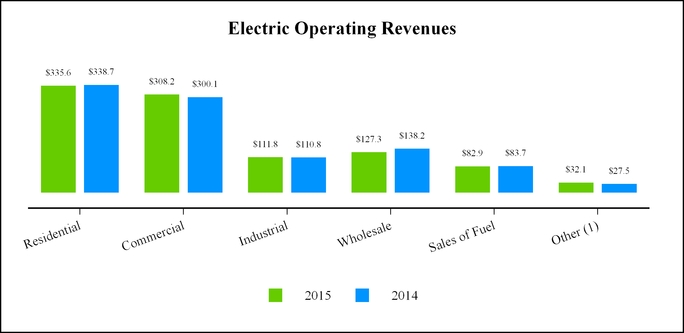
|
(1)
|
Other electric revenues in the graph above includes public street and highway lighting, which is considered part of retail electric revenues.
|
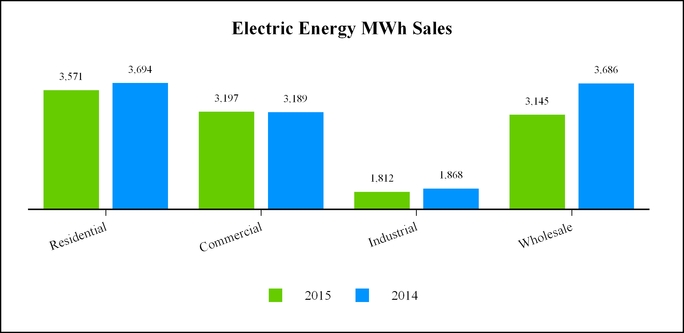
50
The following table presents Avista Utilities' decoupling and customer earnings sharing mechanisms by jurisdiction that are included in utility electric operating revenues for the years ended December 31 (dollars in thousands):
|
|
Electric Operating
Revenues |
|||||
|
|
2015
|
2014
|
||||
|
Washington
|
||||||
|
Decoupling
|
$
|
4,740
|
|
n/a
|
|
|
|
Provision for earnings sharing
|
(3,423
|
)
|
n/a
|
|
||
|
Idaho
|
||||||
|
Decoupling
|
n/a
|
|
n/a
|
|
||
|
Provision for earnings sharing
|
(2,198
|
)
|
(7,503
|
)
|
||
|
(n/a)
|
This mechanism did not exist during this time period.
|
Total electric revenues decreased $1.1 million for 2015 as compared to 2014, affected by the following:
|
•
|
a $5.7 million increase in retail electric revenues due to an increase in revenue per MWh (increased revenues $21.0 million), partially offset by a decrease in total MWhs sold (decreased revenues $15.3 million). The increase in revenue per MWh was primarily due to a general rate increase in Washington. The decrease in total MWhs sold was primarily the result of weather that was significantly warmer than normal and warmer than the prior year, which decreased the electric heating load in the first quarter. Compared to 2014, residential electric use per customer decreased 5 percent and commercial use per customer decreased 2 percent. Heating degree days in Spokane were 14 percent below normal and 10 percent below 2014. The impact from reduced heating loads was partially offset by increased cooling loads in the summer. Year-to-date cooling degree days were 141 percent above normal and 28 percent above the prior year.
|
|
•
|
a $10.9 million decrease in wholesale electric revenues due to a decrease in sales volumes (decreased revenues $21.9 million), partially offset by an increase in sales prices (increased revenues $11.0 million). The fluctuation in volumes and prices was primarily the result of our optimization activities.
|
|
•
|
a $0.9 million decrease in sales of fuel due to a decrease in sales of natural gas fuel as part of thermal generation resource optimization activities. For 2015, $50.0 million of these sales were made to our natural gas operations and are included as intracompany revenues and resource costs. For 2014, $67.4 million of these sales were made to our natural gas operations.
|
|
•
|
a $4.7 million increase in electric revenue due to decoupling, which reflected decreased heating loads in the first and fourth quarters, partially offset by increased cooling loads in the second and third quarters.
|
|
•
|
a $1.9 million decrease in the provision for earnings sharing, primarily due to a decrease of $5.3 million for our Idaho electric operations, partially offset by an increase of $3.4 million for our Washington electric operations. In 2014, we recorded a provision for earnings sharing of $7.5 million for Idaho electric customers with $5.6 million representing our estimate for 2014 and $1.9 million representing an adjustment to our 2013 estimate.
|
51
The following graphs present Avista Utilities' natural gas operating revenues and therms delivered for the years ended December 31 (dollars in millions and therms in thousands):
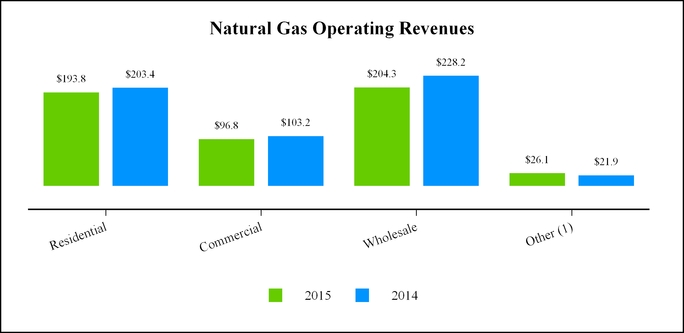
|
(1)
|
Other natural gas revenues in the graph above includes interruptible and industrial revenues, which are considered part of retail natural gas revenues.
|
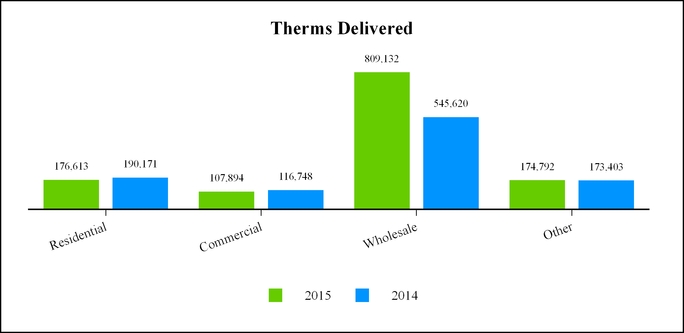
52
The following table presents Avista Utilities' decoupling and customer earnings sharing mechanisms by jurisdiction that are included in utility natural gas operating revenues for the years ended December 31 (dollars in thousands):
|
|
Natural Gas
Operating Revenues
|
|||||
|
|
2015
|
2014
|
||||
|
Washington
|
||||||
|
Decoupling
|
$
|
6,004
|
|
n/a
|
|
|
|
Provision for earnings sharing
|
—
|
|
n/a
|
|
||
|
Idaho
|
||||||
|
Decoupling
|
—
|
|
n/a
|
|
||
|
Provision for earnings sharing
|
—
|
|
(221
|
)
|
||
|
(n/a)
|
This mechanism did not exist during this time period.
|
Total natural gas revenues decreased $35.7 million for 2015 as compared to 2014 due to the following:
|
•
|
a $16.4 million decrease in retail natural gas revenues due to a decrease in volumes (decreased revenues $23.6 million), partially offset by higher retail rates (increased revenues $7.2 million). Higher retail rates were due to PGAs implemented in November 2014, which passed through higher costs of natural gas, and general rate cases. This was partially offset by PGA rate decreases implemented in November 2015, which passed through lower costs. We sold less retail natural gas in 2015 as compared to 2014 primarily due to weather that was warmer than normal and warmer than the prior year. Compared to 2014, residential use per customer decreased 9 percent and commercial use per customer decreased 9 percent. Heating degree days in Spokane were 14 percent below historical average for 2015, and 10 percent below 2014. Heating degree days in Medford were 15 percent below historical average for 2015, and 4 percent above 2014.
|
|
•
|
a $23.9 million decrease in wholesale natural gas revenues due to a decrease in prices (decreased revenues $90.4 million), partially offset by an increase in volumes (increased revenues $66.5 million). In 2015, $57.0 million of these sales were made to our electric generation operations and are included as intracompany revenues and resource costs. In 2014, $74.7 million of these sales were made to our electric generation operations. Differences between revenues and costs from sales of resources in excess of retail load requirements and from resource optimization are accounted for through the PGA mechanisms.
|
|
•
|
a $6.0 million increase for natural gas decoupling revenues due primarily to significantly warmer than normal weather and the impact on heating loads.
|
The following table presents Avista Utilities' average number of electric and natural gas retail customers for the years ended December 31:
|
|
Electric
Customers
|
Natural Gas
Customers
|
|||||||||
|
|
2015
|
2014
|
2015
|
2014
|
|||||||
|
Residential
|
327,057
|
|
324,188
|
|
296,005
|
|
291,928
|
|
|||
|
Commercial
|
41,296
|
|
40,988
|
|
34,229
|
|
34,047
|
|
|||
|
Interruptible
|
—
|
|
—
|
|
35
|
|
37
|
|
|||
|
Industrial
|
1,353
|
|
1,385
|
|
261
|
|
264
|
|
|||
|
Public street and highway lighting
|
529
|
|
531
|
|
—
|
|
—
|
|
|||
|
Total retail customers
|
370,235
|
|
367,092
|
|
330,530
|
|
326,276
|
|
|||
53
The following graphs present Avista Utilities' resource costs for the years ended December 31 (dollars in millions):
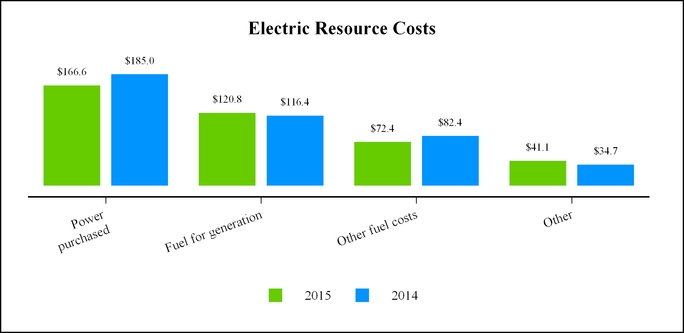
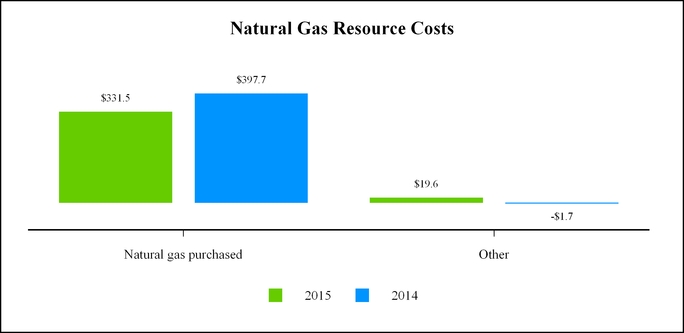
Total resource costs in the graphs above include intracompany resource costs of $107.0 million and $142.2 million for 2015 and 2014, respectively.
Total electric resource costs decreased $17.6 million for 2015 as compared to 2014 due to the following:
|
•
|
an $18.3 million decrease in power purchased due to a decrease in the volume of power purchases (decreased costs $23.6 million), partially offset by an increase in wholesale prices (increased costs $5.3 million). The fluctuation in volumes and prices was primarily the result of our overall optimization activities.
|
|
•
|
a $4.4 million increase in fuel for generation primarily due to an increase in thermal generation (due in part to decreased hydroelectric generation), partially offset by a decrease in natural gas fuel prices.
|
|
•
|
a $10.0 million decrease in other fuel costs.
|
|
•
|
a $14.2 million increase from amortizations and deferrals of power costs.
|
|
•
|
a $7.7 million decrease in other electric resource costs primarily due to the benefit from a capacity contract of Spokane
|
54
Energy, which was mostly deferred for probable future benefit to customers through the ERM and PCA.
Total natural gas resource costs decreased $44.9 million for 2015 as compared to 2014 due to the following:
|
•
|
a $66.1 million decrease in natural gas purchased due to a decrease in the price of natural gas (decreased costs $138.3 million), partially offset by an increase in total therms purchased (increased costs $72.2 million). Total therms purchased increased due to an increase in wholesale sales, partially offset by a decrease in retail sales.
|
|
•
|
a
$21.8 million
increase from amortizations and deferrals of natural gas costs. This reflects lower natural gas prices and the deferral of lower costs for future rebate to customers.
|
Results of Operations - Alaska Electric Light and Power Company
AEL&P was acquired on July 1, 2014 and only the results for the second half of 2014 are included in the actual overall results of Avista Corp. The discussion below is only for AEL&P's earnings that were included in Avista Corp.'s overall earnings.
2016
compared to
2015
Net income for AEL&P was
$8.0 million
for the year ended
December 31, 2016
, compared to
$6.6 million
for
2015
. The increase in earnings for 2016 was primarily due to an increase in gross margin and an increase in equity-related AFUDC (increased earnings) due to the construction of an additional back-up generation plant which was completed during the fourth quarter of 2016.
The increase in gross margin was primarily related to a decrease in costs associated with the Snettisham hydroelectric project (due to a refinancing transaction during the second half of 2015 which lowered interest costs under the take-or-pay power purchase agreement), as well as an interim rate increase effective in November 2016. These were partially offset by a slight decrease in sales volumes to commercial and government customers and an increase in other resource costs.
AEL&P has a relatively stable load profile as it does not have a large population of customers in its service territory with electric heating and cooling requirements; therefore, its revenues are not as sensitive to weather fluctuations as Avista Utilities. However, AEL&P does have higher winter rates for its customers during the peak period of November through May of each year, which drives higher revenues during those periods.
2015 compared to 2014
Net income for AEL&P was $6.6 million for the year ended December 31, 2015, compared to $3.2 million for the second half of 2014. Since AEL&P was acquired on July 1, 2014, the results for 2015 are not comparable to 2014 as 2014 only includes results for the second half of the year.
Results of Operations - Ecova - Discontinued Operations
Ecova was disposed of as of June 30, 2014. As a result, in accordance with GAAP, all of Ecova's operating results were removed from each line item on the Consolidated Statements of Income and reclassified into discontinued operations for all periods presented. In addition, since Ecova was a subsidiary of Avista Capital, the net gain recognized on the sale of Ecova was attributable to our other businesses. However, in accordance with GAAP, this gain is included in discontinued operations; therefore, we included the analysis of the gain in the Ecova discontinued operations section rather than in the other businesses section.
2016 compared to 2015 and 2014
There was zero net income or loss for 2016. Ecova's net income was $5.1 million for 2015, compared to net income of $72.4 million for 2014. The net income for 2015 was primarily related to a tax benefit during 2015 that resulted from the reversal of a valuation allowance against net operating losses at Ecova because the net operating losses were deemed realizable under the current tax code. Additionally, there were some minor true-ups to the gain recognized on the sale due to the settlement of the working capital and indemnification escrow accounts during 2015. The results for 2014 included $69.7 million of the net gain recognized on the sale of Ecova.
Results of Operations - Other Businesses
2016
compared to
2015
The net loss from these operations was
$3.2 million
for
2016
compared to a net loss of
$1.9 million
for
2015
. Net losses for
2016
were primarily related an increase in losses on investments due to initial organization costs and management fees associated with a new investment, as well as an impairment recorded on a building we own. This was partially offset by a slight decrease in corporate costs (including costs associated with exploring strategic opportunities) and a slight increase in net income at METALfx for the year-to-date.
55
2015 compared to 2014
The net loss from these operations was $1.9 million for 2015 compared to net income of $3.2 million for 2014. The decrease in net income compared to 2014 was primarily due to the settlement of the California power markets litigation in 2014, where Avista Energy received settlement proceeds from a litigation with various California parties related to the prices paid for power in the California spot markets during the years 2000 and 2001. This settlement resulted in an increase in pre-tax earnings of approximately $15.0 million. This was partially offset by a pre-tax contribution of $6.4 million of the proceeds to the Avista Foundation.
In addition, the decrease in earnings for 2015 related to an increase in net losses on investments, partially offset by an increase in net income at METALfx and a slight decrease in corporate costs, including costs associated with exploring strategic opportunities.
Accounting Standards to be Adopted in
2017
At this time, we are not expecting the adoption of accounting standards to have a material impact on our financial condition, results of operations and cash flows in
2017
. However, we will be adopting ASU No. 2014-09 "Revenue from Contracts with Customers (Topic 606)" in 2018 upon its effective date. This is a significant new accounting standard that requires an extensive amount of time and effort to implement. We currently expect to use a modified retrospective method of adoption, which would require a cumulative adjustment to opening retained earnings, as opposed to a full retrospective application. The Company is not far enough along in the adoption process to determine the amount, if any, of cumulative adjustment necessary.
Since the vast majority of Avista Corp.’s revenue is from rate regulated sales of electricity and natural gas to retail customers and revenue is recognized as energy is delivered to these customers, we do not expect a significant change in operating revenues or net income due to adopting this standard.
The Company is in the process of reviewing and analyzing certain contracts with customers (most of which are related to wholesale sales of power and natural gas) but has not yet identified any significant differences in revenue recognition between current GAAP and the new revenue recognition standard.
There are unresolved issues associated with implementing this standard, including the presentation of CIACs, the presentation of utility taxes on a gross basis and determining collectibility of sales to low income customers. We are monitoring utility industry implementation guidance as it relates to unresolved issues to determine if there will be an industry consensus regarding accounting and presentation of these items.
For information on accounting standards adopted in
2016
and accounting standards expected to be adopted in future periods, see “Note 2 of the Notes to Consolidated Financial Statements.”
Critical Accounting Policies and Estimates
The preparation of our consolidated financial statements in conformity with GAAP requires us to make estimates and assumptions that affect amounts reported in the consolidated financial statements. Changes in these estimates and assumptions are considered reasonably possible and may have a material effect on our consolidated financial statements and thus actual results could differ from the amounts reported and disclosed herein. The following accounting policies represent those that our management believes are particularly important to the consolidated financial statements and require the use of estimates and assumptions:
|
•
|
Regulatory accounting
, which requires that
certain costs and/or obligations be reflected as deferred charges on our Consolidated Balance Sheets and are not reflected in our Consolidated Statements of Income until the period during which matching revenues are recognized. We also have decoupling revenue deferrals. As opposed to cost deferrals which are not recognized in the Consolidated Statements of Income until they are included in rates, decoupling revenue is recognized in the Consolidated Statements of Income during the period in which it occurs (i.e. during the period of revenue shortfall or excess due to fluctuations in customer usage), subject to certain limitations, and a regulatory asset/liability is established which will be surcharged or rebated to customers in future periods. GAAP requires that for any alternative regulatory revenue program, like decoupling, the revenue must be expected to be collected from customers within 24 months of the deferral to qualify for recognition in the current period Consolidated Statement of Income. Any amounts included in the Company's decoupling program that are not expected to be collected from customers within 24 months are not recorded in the financial statements until the period in which revenue recognition criteria are met. This could ultimately result in more decoupling revenue being collected from customers over the life of the decoupling program than what is deferred and recognized in the current period financial statements. We make estimates regarding the amount of revenue that will be collected within 24 months of deferral. We also make the assumption that there are regulatory precedents for many of our regulatory items and that we will be
|
56
allowed recovery of these costs via retail rates in future periods. If we were no longer allowed to apply regulatory accounting or no longer allowed recovery of these costs, we could be required to recognize significant write-offs of regulatory assets and liabilities in the Consolidated Statements of Income. See "Notes 1 and 20 of the Notes to Consolidated Financial Statements" for further discussion of our regulatory accounting policy.
|
•
|
Utility energy commodity derivative asset and liability accounting
, where we estimate the fair value of outstanding commodity derivatives and we offset energy commodity derivative assets or liabilities with a regulatory asset or liability. This accounting treatment is intended to defer the recognition of mark-to-market gains and losses on energy commodity transactions until the period of delivery. This accounting treatment is supported by accounting orders issued by the UTC and IPUC. If we were no longer allowed to apply regulatory accounting or no longer allowed recovery of these costs, we could be required to recognize significant changes in fair value of these energy commodity derivatives on a regular basis in the Consolidated Statements of Income, which could lead to significant fluctuations in net income. See "Notes 1 and 6 of the Notes to Consolidated Financial Statements" for further discussion of our energy derivative accounting policy.
|
|
•
|
Interest rate swap derivative asset and liability accounting,
where we estimate the fair value of outstanding interest rate swap derivatives, and U.S. Treasury lock agreements and offset the derivative asset or liability with a regulatory asset or liability. This is similar to the treatment of energy commodity derivatives described above. Upon settlement of interest rate swap derivatives, the regulatory asset or liability is amortized as a component of interest expense over the term of the associated debt. If we no longer applied regulatory accounting or were no longer allowed recovery of these costs, we could be required to recognize significant changes in fair value of these interest rate swap derivatives on a regular basis in the Consolidated Statements of Income, which could lead to significant fluctuations in net income.
|
|
•
|
Pension Plans and Other Postretirement Benefit Plans
, discussed in further detail below.
|
|
•
|
Contingencies,
related to unresolved regulatory, legal and tax issues for which there is inherent uncertainty for the ultimate outcome of the respective matter. We accrue a loss contingency if it is probable that an asset is impaired or a liability has been incurred and the amount of the loss or impairment can be reasonably estimated. We also disclose losses that do not meet these conditions for accrual, if there is a reasonable possibility that a potential loss may be incurred. For all material contingencies, we have made a judgment as to the probability of a loss occurring and as to whether or not the amount of the loss can be reasonably estimated. If the loss recognition criteria are met, liabilities are accrued or assets are reduced. However, no assurance can be given to the ultimate outcome of any particular contingency. See "Notes 1 and 19 of the Notes to Consolidated Financial Statements" for further discussion of our commitments and contingencies.
|
Pension Plans and Other Postretirement Benefit Plans - Avista Utilities
We have a defined benefit pension plan covering substantially all regular full-time employees at Avista Utilities that were hired prior to January 1, 2014. For substantially all regular non-union full-time employees at Avista Utilities who were hired on or after January 1, 2014, a defined contribution 401(k) plan replaced the defined benefit pension plan.
The Finance Committee of the Board of Directors approves investment policies, objectives and strategies that seek an appropriate return for the pension plan and it reviews and approves changes to the investment and funding policies.
We have contracted with an independent investment consultant who is responsible for managing/monitoring the individual investment managers. The investment managers’ performance and related individual fund performance is reviewed at least quarterly by an internal benefits committee and by the Finance Committee to monitor compliance with our established investment policy objectives and strategies.
Our pension plan assets are invested in debt securities and mutual funds, trusts and partnerships that hold marketable debt and equity securities, real estate and absolute return funds. In seeking to obtain the desired return to fund the pension plan, the investment consultant recommends allocation percentages by asset classes. These recommendations are reviewed by the internal benefits committee, which then recommends their adoption by the Finance Committee. The Finance Committee has established target investment allocation percentages by asset classes and also investment ranges for each asset class. The target investment allocation percentages are typically the midpoint of the established range. During 2016, we revised the target investment allocation percentages. See “Note 10 of the Notes to Consolidated Financial Statements” for the target investment allocation percentages and further discussion of the revision.
57
We also have a Supplemental Executive Retirement Plan (SERP) that provides additional pension benefits to our executive officers and others whose benefits under the pension plan are reduced due to the application of Section 415 of the Internal Revenue Code of 1986 and the deferral of salary under deferred compensation plans.
Pension costs (including the SERP) were
$26.8 million
for
2016
,
$27.1 million
for
2015
and
$14.6 million
for
2014
. Of our pension costs, approximately 60 percent are expensed and 40 percent are capitalized consistent with labor charges. The costs related to the SERP are expensed. Our costs for the pension plan are determined in part by actuarial formulas that are dependent upon numerous factors resulting from actual plan experience and assumptions of future experience.
Pension costs are affected by among other things:
|
•
|
employee demographics (including age, compensation and length of service by employees),
|
|
•
|
the amount of cash contributions we make to the pension plan,
|
|
•
|
the actual return on pension plan assets,
|
|
•
|
expected return on pension plan assets,
|
|
•
|
discount rate used in determining the projected benefit obligation and pension costs,
|
|
•
|
assumed rate of increase in employee compensation,
|
|
•
|
life expectancy of participants and other beneficiaries, and
|
|
•
|
expected method of payment (lump sum or annuity) of pension benefits.
|
Any changes in pension plan obligations associated with these factors may not be immediately recognized as pension costs in our Consolidated Statement of Income, but we generally recognize the change in future years over the remaining average service period of pension plan participants. As such, our costs recorded in any period may not reflect the actual level of cash benefits provided to pension plan participants.
We revise the key assumption of the discount rate each year. In selecting a discount rate, we consider yield rates at the end of the year for highly rated corporate bond portfolios with cash flows from interest and maturities similar to that of the expected payout of pension benefits. In
2016
, the pension plan discount rate (exclusive of the SERP) was
4.26 percent
compared to
4.58 percent
in
2015
and
4.21 percent
in
2014
. These changes in the discount rate increased the projected benefit obligation (exclusive of the SERP) by approximately
$27.7 million
in
2016
and decreased the obligation by
$31.0 million
in
2015
.
The expected long-term rate of return on plan assets is reset or confirmed annually based on past performance and economic forecasts for the types of investments held by our plan. We used an expected long-term rate of return of
5.40 percent
in
2016
,
5.30 percent
in
2015
and
6.60 percent
in
2014
. This change decreased pension costs by approximately
$0.5 million
in
2016
. The actual return on plan assets, net of fees, was a gain of
$43.2 million
(or
8.1 percent
) for
2016
, a loss of
$4.3 million
(or
0.8 percent
) for
2015
and a gain of
$56.0 million
(or
11.6 percent
) for
2014
.
The following chart reflects the sensitivities associated with a change in certain actuarial assumptions by the indicated percentage (dollars in thousands):
|
Actuarial Assumption
|
Change in
Assumption
|
Effect on Projected
Benefit Obligation
|
|
Effect on
Pension Cost
|
||||||
|
Expected long-term return on plan assets
|
(0.5
|
)%
|
$
|
—
|
|
*
|
$
|
2,551
|
|
|
|
Expected long-term return on plan assets
|
0.5
|
%
|
—
|
|
*
|
(2,551
|
)
|
|||
|
Discount rate
|
(0.5
|
)%
|
47,738
|
|
|
3,842
|
|
|||
|
Discount rate
|
0.5
|
%
|
(42,462
|
)
|
(3,441
|
)
|
||||
|
*
|
Changes in the expected return on plan assets would not affect our projected benefit obligation.
|
We provide certain health care and life insurance benefits for substantially all of our retired employees. We accrue the estimated cost of postretirement benefit obligations during the years that employees provide service. Assumed health care cost trend rates have a significant effect on the amounts reported for our postretirement plans. A one-percentage-point increase in the assumed health care cost trend rate for each year would increase our accumulated postretirement benefit obligation as of
December 31, 2016
by
$8.6 million
and the service and interest cost by
$1.0 million
. A one-percentage-point decrease in the assumed health
58
care cost trend rate for each year would decrease our accumulated postretirement benefit obligation as of
December 31, 2016
by
$6.7 million
and the service and interest cost by
$0.7 million
.
Liquidity and Capital Resources
Overall Liquidity
Avista Corp.'s consolidated operating cash flows are primarily derived from the operations of Avista Utilities. The primary source of operating cash flows for Avista Utilities is revenues from sales of electricity and natural gas. Significant uses of cash flows from Avista Utilities include the purchase of power, fuel and natural gas, and payment of other operating expenses, taxes and interest, with any excess being available for other corporate uses such as capital expenditures and dividends.
We design operating and capital budgets to control operating costs and to direct capital expenditures to choices that support immediate and long-term strategies, particularly for our regulated utility operations. In addition to operating expenses, we have continuing commitments for capital expenditures for construction and improvement of utility facilities.
Our annual net cash flows from operating activities usually do not fully support the amount required for annual utility capital expenditures. As such, from time-to-time, we need to access long-term capital markets in order to fund these needs as well as fund maturing debt. See further discussion at “Capital Resources.”
We periodically file for rate adjustments for recovery of operating costs and capital investments and to seek the opportunity to earn reasonable returns as allowed by regulators. In December 2016, the UTC issued an order related to our Washington electric and natural gas general rate cases that were originally filed with the UTC in February 2016. The UTC order denied the Company's proposed electric and natural gas rate increase requests totaling $43.0 million. If this order is not changed as a result of reconsideration, rehearing or judicial review, we expect it will have a negative impact on our net income in 2017. See further details in the section “Regulatory Matters.”
For Avista Utilities, when power and natural gas costs exceed the levels currently recovered from retail customers, net cash flows are negatively affected. Factors that could cause purchased power and natural gas costs to exceed the levels currently recovered from our customers include, but are not limited to, higher prices in wholesale markets when we buy energy or an increased need to purchase power in the wholesale markets, and a lack of regulatory approval for higher authorized net power supply costs through general rate case decisions. Factors beyond our control that could result in an increased need to purchase power in the wholesale markets include, but are not limited to:
|
•
|
increases in demand (due to either weather or customer growth),
|
|
•
|
low availability of streamflows for hydroelectric generation,
|
|
•
|
unplanned outages at generating facilities, and
|
|
•
|
failure of third parties to deliver on energy or capacity contracts.
|
Avista Utilities has regulatory mechanisms in place that provide for the deferral and recovery of the majority of power and natural gas supply costs. However, if prices rise above the level currently allowed in retail rates in periods when we are buying energy, deferral balances would increase, negatively affecting our cash flow and liquidity until such time as these costs, with interest, are recovered from customers.
In addition to the above, Avista Utilities enters into derivative instruments to hedge our exposure to certain risks, including fluctuations in commodity market prices, foreign exchange rates and interest rates (for purposes of issuing long-term debt in the future). These derivative instruments often require collateral (in the form of cash or letters of credit) or other credit enhancements, or reductions or terminations of a portion of the contract through cash settlement, in the event of a downgrade in the Company's credit ratings or changes in market prices. In periods of price volatility, the level of exposure can change significantly. As a result, sudden and significant demands may be made against the Company's credit facilities and cash. See “Enterprise Risk Management – Demands for Collateral” below.
We monitor the potential liquidity impacts of changes to energy commodity prices and other increased operating costs for our utility operations. We believe that we have adequate liquidity to meet such potential needs through our committed lines of credit.
As of
December 31, 2016
, we had
$245.6 million
of available liquidity under the Avista Corp. committed line of credit and
$25.0 million
under the AEL&P committed line of credit. With our
$400.0 million
credit facility that expires in
April 2021
and AEL&P's
$25.0 million
credit facility that expires in
November 2019
, we believe that we have adequate liquidity to meet our needs for the next 12 months.
59
Overall
During
2016
, cash flows from operating activities were
$358.3 million
, proceeds from the issuance of long-term debt were
$245.0 million
(including a $70.0 million bridge loan that was repaid in December 2016), net proceeds from our committed line of credit were
$15.0 million
and we received
$67.0 million
from the issuance of common stock. Cash requirements included utility capital expenditures of
$406.6 million
, the payment of long-term debt of
$163.2 million
(including the $70.0 million bridge loan), dividends of
$87.2 million
and cash paid for the settlement of interest rate swap derivatives of
$54.0 million
.
2016
compared to
2015
Consolidated Operating Activities
Net cash provided by operating activities was
$358.3 million
for
2016
compared to
$375.6 million
for
2015
. The decrease in net cash provided by operating activities was primarily related to the cash settlement of interest rate swap derivatives in the third quarter of 2016 totaling
$54.0 million
. The interest rate swap derivatives were settled in connection with the pricing of first mortgage bonds that were issued in December 2016. In addition, our accounts receivable balances increased during 2016 (which reduces operating cash flow), due to higher sales during the fourth quarter of 2016 due to colder weather as compared to the fourth quarter of 2015 and due to the timing of collections.
The cash flow decreases were partially offset by higher net income after non-cash adjustments of
$446.4 million
in
2016
, compared to
$392.3 million
in
2015
.
There was also a decrease in collateral posted for derivative instruments in 2016 (primarily due to an increase in the fair value of outstanding energy commodity derivatives, which required less collateral) as compared to an increase in collateral posted during
2015
.
Pension contributions were
$12.0 million
for both 2016 and 2015.
Net cash received from income tax refunds increased to
$13.5 million
for
2016
compared to
$10.0 million
for
2015
. In addition, the income tax receivable increased
$33.9 million
in 2016. We are in a refund position with regards to income taxes because the Company generated a net operating loss for tax purposes in 2016 primarily due to bonus depreciation on utility plant placed in service during the year and the settlement of interest rate swaps. The Company intends to carryback the net operating loss against prior year tax returns and expects the net operating loss to be fully utilized through the carryback. Additionally, the Company generated $19.4 million of federal investment income tax credits in 2016; $9.6 million will be carried back against a prior tax return with the remaining $9.8 million to be carried forward to future federal tax periods.
The provision for deferred income taxes was
$124.5 million
for
2016
, compared to
$51.8 million
for
2015
. The change in the provision for deferred income taxes was primarily related to deferred taxes on property, plant and equipment, investment tax credits associated with our capital projects, deferred taxes on the decoupling regulatory assets and deferred taxes on interest rate swap derivatives.
Consolidated Investing Activities
Net cash used in investing activities was
$432.5 million
for
2016
, an increase compared to
$387.8 million
for
2015
. During
2016
, we paid
$406.6 million
for utility capital expenditures, compared to
$393.4 million
for
2015
. In addition, during
2016
, our subsidiaries disbursed
$10.1 million
for notes receivable to third parties and received
$5.0 million
in repayments on these notes receivable. Our subsidiaries also made $7.8 million in investments and purchased buildings and other property as investments for $5.3 million.
During 2015, we received cash proceeds (related to the settlement of the escrow accounts) of
$13.9 million
from the sale of Ecova.
Consolidated Financing Activities
Net cash provided by financing activities was
$72.2 million
for
2016
compared to net cash provided of
$0.5 million
for
2015
. In 2016 we had the following significant transactions:
|
•
|
borrowing of
$70.0 million
pursuant to a term loan agreement in August, which was used to repay a portion of the
$90.0 million
in first mortgage bonds that matured in August 2016,
|
60
|
•
|
issuance and sale of
$175.0 million
of Avista Corp. first mortgage bonds in December 2016, the proceeds of which were used to repay the
$70.0 million
term loan, with the remainder being used to pay down a portion of our committed line of credit,
|
|
•
|
payment of
$163.2 million
for the redemption and maturity of long-term debt (including the
$70.0 million
term loan),
|
|
•
|
increase in cash dividends paid to
$87.2 million
(or
$1.37
per share) for
2016
from
$82.4 million
(or
$1.32
per share) for
2015
,
|
|
•
|
$15.0 million
net increase in the balance of our committed line of credit, and
|
|
•
|
issuance of
$67.0 million
of common stock (net of issuance costs).
|
See below for a list of significant financing transactions occurring in 2015.
2015 compared to 2014
Consolidated Operating Activities
Net cash provided by operating activities was $375.6 million for 2015 compared to $267.3 million for 2014. The increase in cash provided by operating activities was due to higher net income after non-cash adjustments of
$392.3 million
in 2015, compared to
$348.2 million
in 2014. The gross gain on the sale of Ecova of $0.8 million for 2015 is deducted in reconciling net income to net cash provided by operating activities. The cash proceeds from the sale (which includes the gross gain) is included in investing activities. This is compared to the gross gain recognized in 2014 of $160.6 million.
Net cash used by certain current assets and liabilities was $4.1 million for 2015, compared to net cash used of $50.0 million for 2014. The net cash used during 2015 primarily reflects cash outflows from changes in accounts payable, collateral posted for derivative instruments and accounts receivable. This was partially offset by inflows from changes in natural gas stored and income taxes receivable.
The provision for deferred income taxes was $51.8 million for 2015 compared to $144.3 million for 2014. The decrease in 2015 was primarily due to the combination of implementation by the Company of updated federal tax tangible property regulations and increased deductions related to bonus depreciation in 2014.
Contributions to our defined benefit pension plan were $12.0 million for 2015 compared to $32.0 million in 2014.
Net cash received for income taxes was $10.0 million for 2015 compared to net cash paid of $45.4 million for 2014.
Consolidated Investing Activities
Net cash used in investing activities was $387.8 million for 2015, an increase compared to $103.7 million for 2014. During 2015, we received cash proceeds (related to the settlement of the escrow accounts) of $13.9 million for the sale of Ecova. We received the majority of the proceeds ($229.9 million) from the sale of Ecova during 2014. The proceeds received in 2014 were used to pay off the balance of Ecova's long-term borrowings and make payments to option holders and noncontrolling interests (included in financing activities). We also used a portion of these proceeds to pay our $74.8 million tax liability associated with the gain on sale and to fund common stock repurchases. Utility property capital expenditures increased by $67.9 million for 2015 as compared to 2014. During 2014, we received $15.0 million in cash (net of cash paid) related to the acquisition of AERC.
Consolidated Financing Activities
Net cash provided by financing activities was $0.5 million for 2015 compared to net cash used of $224.0 million for 2014. In 2015 we had the following significant transactions:
|
•
|
issuance and sale of $100.0 million of Avista Corp. first mortgage bonds in December 2015,
|
|
•
|
payment of $2.9 million for the redemption and maturity of long-term debt,
|
|
•
|
cash dividends paid increased to $82.4 million (or $1.32 per share) for 2015 from $78.3 million (or $1.27 per share) for 2014,
|
|
•
|
issuance of $1.6 million of common stock (net of issuance costs), and
|
|
•
|
repurchase of $2.9 million of our common stock.
|
In 2014, we had the following significant transactions:
61
|
•
|
issuance of $150.0 million of long-term debt ($60.0 million of Avista Corp. first mortgage bonds, $75.0 million of AEL&P first mortgage bonds and a $15.0 million AERC unsecured note representing a term loan),
|
|
•
|
a decrease of $66.0 million in short-term borrowings on Avista Corp.’s committed line of credit,
|
|
•
|
a decrease of $46.0 million on Ecova's committed line of credit with $6.0 million in payments throughout the year and $40.0 million related to the close of the Ecova sale,
|
|
•
|
payment of $40.0 million for the redemption and maturity of long-term debt (primarily related to AEL&P paying off its existing debt),
|
|
•
|
cash payments of $54.2 million to noncontrolling interests and $20.9 million to stock option holders and redeemable noncontrolling interests of Ecova related to the Ecova sale in 2014,
|
|
•
|
issuance of $4.1 million of common stock (net of issuance costs) excluding issuances related to the acquisition of AERC. We issued $150.1 million of common stock to AERC shareholders, and this is reflected as a non-cash financing activity,
|
|
•
|
repurchase of $79.9 million of our common stock during 2014 using the proceeds from our sale of Ecova, and
|
|
•
|
a $16.2 million increase in cash related to the fluctuation in the balance of customer fund obligations at Ecova.
|
Capital Resources
Our consolidated capital structure, including the current portion of long-term debt and short-term borrowings, and excluding noncontrolling interests, consisted of the following as of
December 31, 2016
and
2015
(dollars in thousands):
|
|
December 31, 2016
|
December 31, 2015
|
|||||||||||
|
|
Amount
|
Percent
of total
|
Amount
|
Percent
of total
|
|||||||||
|
Current portion of long-term debt and capital leases
|
$
|
3,287
|
|
0.1
|
%
|
$
|
93,167
|
|
2.9
|
%
|
|||
|
Short-term borrowings
|
120,000
|
|
3.4
|
%
|
105,000
|
|
3.2
|
%
|
|||||
|
Long-term debt to affiliated trusts
|
51,547
|
|
1.5
|
%
|
51,547
|
|
1.6
|
%
|
|||||
|
Long-term debt and capital leases
|
1,678,717
|
|
47.9
|
%
|
1,480,111
|
|
45.4
|
%
|
|||||
|
Total debt
|
1,853,551
|
|
52.9
|
%
|
1,729,825
|
|
53.1
|
%
|
|||||
|
Total Avista Corporation shareholders’ equity
|
1,648,727
|
|
47.1
|
%
|
1,528,626
|
|
46.9
|
%
|
|||||
|
Total
|
$
|
3,502,278
|
|
100.0
|
%
|
$
|
3,258,451
|
|
100.0
|
%
|
|||
Our shareholders’ equity increased
$120.1 million
during
2016
primarily due to net income, the issuance of common stock and stock compensation net of minimum tax withholdings, partially offset by dividends.
We need to finance capital expenditures and acquire additional funds for operations from time to time. The cash requirements needed to service our indebtedness, both short-term and long-term, reduce the amount of cash flow available to fund capital expenditures, purchased power, fuel and natural gas costs, dividends and other requirements.
Committed Lines of Credit
Avista Corp. has a committed line of credit with various financial institutions in the total amount of
$400.0 million
. We exercised a two-year option in May 2016 to extend the maturity of the credit facility agreement to
April 2021
. As of
December 31, 2016
, we had
$245.6 million
of available liquidity under this line of credit.
The Avista Corp. credit facility contains customary covenants and default provisions, including a covenant which does not permit our ratio of “consolidated total debt” to “consolidated total capitalization” to be greater than 65 percent at any time. As of
December 31, 2016
, we were in compliance with this covenant with a ratio of
52.9 percent
.
AEL&P has a
$25.0 million
committed line of credit that expires in
November 2019
. As of
December 31, 2016
, there were no borrowings or letters of credit outstanding under this credit facility.
The AEL&P credit facility contains customary covenants and default provisions including a covenant which does not permit the ratio of “consolidated total debt at AEL&P” to “consolidated total capitalization at AEL&P,” (including the impact of the Snettisham obligation) to be greater than 67.5 percent at any time. As of
December 31, 2016
, AEL&P was in compliance with this covenant with a ratio of
55.6 percent
.
62
Balances outstanding and interest rates of borrowings (excluding letters of credit) under Avista Corp.'s committed line of credit were as follows as of and for the
year ended December 31
(dollars in thousands):
|
2016
|
2015
|
2014
|
|||||||||
|
Balance outstanding at end of year
|
$
|
120,000
|
|
$
|
105,000
|
|
$
|
105,000
|
|
||
|
Letters of credit outstanding at end of year
|
$
|
34,353
|
|
$
|
44,595
|
|
$
|
32,579
|
|
||
|
Maximum balance outstanding during the year
|
$
|
280,000
|
|
$
|
180,000
|
|
$
|
171,000
|
|
||
|
Average balance outstanding during the year
|
$
|
171,090
|
|
$
|
95,573
|
|
$
|
62,088
|
|
||
|
Average interest rate during the year
|
1.26
|
%
|
0.98
|
%
|
1.01
|
%
|
|||||
|
Average interest rate at end of year
|
1.50
|
%
|
1.18
|
%
|
0.93
|
%
|
|||||
As of
December 31, 2016
, Avista Corp. and its subsidiaries were in compliance with all of the covenants of their financing agreements, and none of Avista Corp.'s subsidiaries constituted a “significant subsidiary” as defined in Avista Corp.'s committed line of credit.
In August 2016, we entered into a term loan agreement with a commercial bank in the amount of $70.0 million with a maturity date of December 30, 2016. We borrowed the entire $70.0 million available under this agreement, which was used to repay a portion of the $90.0 million of first mortgage bonds that matured in August 2016. We repaid this term loan in its entirety in December using the proceeds from first mortgage bonds that were issued in December 2016.
In December 2016, we issued and sold $175.0 million of 3.54 percent first mortgage bonds due in 2051 pursuant to a bond purchase agreement with institutional investors in the private placement market. In connection with the pricing of the first mortgage bonds in August 2016, the Company cash-settled seven interest rate swap derivatives (notional aggregate amount of $125.0 million) and paid a total of $54.0 million, which will be amortized as a component of interest expense over the life of the debt. The effective interest rate of the first mortgage bonds is 5.6 percent, including the effects of the settled interest rate swap derivatives and estimated issuance costs.
The total net proceeds from the sale of the new bonds was used to repay the $70.0 million term loan and to repay a portion of the borrowings outstanding under our $400.0 million committed line of credit.
Equity Transactions
Stock Repurchase Programs
During 2014 and 2015, Avista Corp.'s Board of Directors approved programs to repurchase shares of our outstanding common stock. The number of shares repurchased and the total cost of repurchases are disclosed in the Consolidated Statements of Equity and Redeemable Noncontrolling Interests. The average repurchase price was
$31.57
in 2014 and
$32.66
in 2015. All repurchased shares reverted to the status of authorized but unissued shares.
We did not repurchase any of our outstanding common stock during 2016.
Equity Issuances
In March 2016, we entered into four separate sales agency agreements under which Avista Corp.’s sales agents may offer and sell up to 3.8 million new shares of Avista Corp.'s common stock, no par value, from time to time. The sales agency agreements expire on February 29, 2020. In
2016
,
1.6 million
shares were issued under these agreements resulting in total net proceeds of
$65.3 million
, leaving
2.2 million
shares remaining to be issued.
In
2016
, we also issued
$1.7 million
(net of issuance costs) of common stock under the employee plans.
2017 Liquidity Expectations
In the second half of 2017, we expect to issue approximately
$110.0 million
of long-term debt and up to
$70.0 million
of common stock in order to fund planned capital expenditures and maintain an appropriate capital structure.
After considering the expected issuances of long-term debt and common stock during
2017
, we expect net cash flows from operating activities, together with cash available under our committed line of credit agreements, to provide adequate resources to fund capital expenditures, dividends, and other contractual commitments.
63
Limitations on Issuances of Preferred Stock and First Mortgage Bonds
We are restricted under our Restated Articles of Incorporation, as amended, as to the additional preferred stock we can issue. As of
December 31, 2016
, we could issue
$1.5 billion
of additional preferred stock at an assumed dividend rate of
6.3 percent
. We are not planning to issue preferred stock.
Under the Avista Corp. and the AEL&P Mortgages and Deeds of Trust securing Avista Corp.'s and AEL&P's first mortgage bonds (including Secured Medium-Term Notes), respectively, each entity may issue additional first mortgage bonds in an aggregate principal amount equal to the sum of:
|
•
|
66-2/3 percent of the cost or fair value (whichever is lower) of property additions of that entity which have not previously been made the basis of any application under that entity's Mortgage, or
|
|
•
|
an equal principal amount of retired first mortgage bonds of that entity which have not previously been made the basis of any application under that entity's Mortgage, or
|
|
•
|
deposit of cash.
|
However, Avista Corp. and AEL&P may not individually issue any additional first mortgage bonds (with certain exceptions in the case of bonds issued on the basis of retired bonds) unless the particular entity issuing the bonds has “net earnings” (as defined in the respective Mortgages) for any period of 12 consecutive calendar months out of the preceding 18 calendar months that were at least twice the annual interest requirements on that entity's mortgage securities at the time outstanding, including the first mortgage bonds to be issued, and on all indebtedness of prior rank. As of
December 31, 2016
, property additions and retired bonds would have allowed, and the net earnings test would not have prohibited, the issuance of
$1.2 billion
in aggregate principal amount of additional first mortgage bonds at Avista Corp. and
$20.8 million
at AEL&P. We believe that we have adequate capacity to issue first mortgage bonds to meet our financing needs over the next several years.
Capital Expenditures
We are making capital investments in generation, transmission and distribution systems to preserve and enhance service reliability for our customers and replace aging infrastructure. The following table summarizes our actual and expected capital expenditures as of and for the year ended
December 31, 2016
(in thousands):
|
Avista Utilities
|
AEL&P
|
||||
|
2016 Actual capital expenditures
|
|||||
|
Capital expenditures (per the Consolidated Statement of Cash Flows) (1)
|
390,690
|
|
15,954
|
|
|
|
Expected total annual capital expenditures (by year)
|
|||||
|
2017
|
405,000
|
|
6,900
|
|
|
|
2018
|
405,000
|
|
6,700
|
|
|
|
2019
|
405,000
|
|
12,900
|
|
|
|
(1)
|
Actual annual capital expenditures per the Consolidated Statement of Cash Flows may differ from our expected annual accrual-basis capital expenditures due to the timing of cash payments, the capital expenditure amounts accrued in accounts payable at the end of each period and the inclusion of AFUDC in our expected amounts, but excluded from the cash flow amounts.
|
Most of the capital expenditures at Avista Utilities are for upgrading our existing facilities and technology, and not for construction of new facilities.
64
The following graph shows the Avista Utilities' capital budget for 2017:
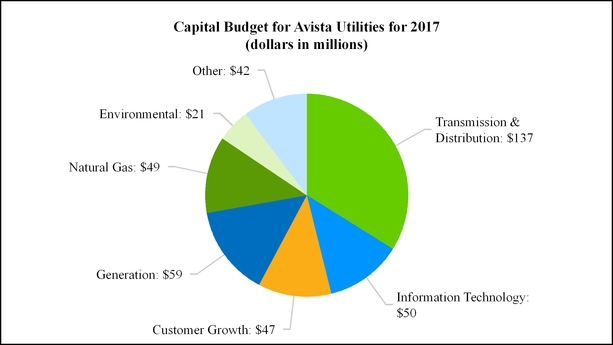
These estimates of capital expenditures are subject to continuing review and adjustment. Actual capital expenditures may vary from our estimates due to factors such as changes in business conditions, construction schedules and environmental requirements.
Off-Balance Sheet Arrangements
As of
December 31, 2016
, we had
$34.4 million
in letters of credit outstanding under our
$400.0 million
committed line of credit, compared to
$44.6 million
as of
December 31, 2015
.
Pension Plan
We contributed
$12.0 million
to the pension plan in
2016
. We expect to contribute a total of
$110.0 million
to the pension plan in the period
2017
through
2021
, with an annual contribution of
$22.0 million
over that period.
The final determination of pension plan contributions for future periods is subject to multiple variables, most of which are beyond our control, including changes to the fair value of pension plan assets, changes in actuarial assumptions (in particular the discount rate used in determining the benefit obligation), or changes in federal legislation. We may change our pension plan contributions in the future depending on changes to any variables, including those listed above.
See "Note 10 of the Notes to Consolidated Financial Statements" for additional information regarding the pension plan.
Credit Ratings
Our access to capital markets and our cost of capital are directly affected by our credit ratings. In addition, many of our contracts for the purchase and sale of energy commodities contain terms dependent upon our credit ratings. See “Enterprise Risk Management – Credit Risk Liquidity Considerations” and “Note 6 of the Notes to Consolidated Financial Statements.” The following table summarizes our credit ratings as of
February 21, 2017
:
|
|
Standard & Poor’s (1)
|
Moody’s (2)
|
|
|
Corporate/Issuer rating
|
BBB
|
Baa1
|
|
|
Senior secured debt
|
A-
|
A2
|
|
|
Senior unsecured debt
|
BBB
|
Baa1
|
|
|
(1)
|
Standard & Poor’s lowest “investment grade” credit rating is BBB-.
|
|
(2)
|
Moody’s lowest “investment grade” credit rating is Baa3.
|
65
A security rating is not a recommendation to buy, sell or hold securities. Each security rating is subject to revision or withdrawal at any time by the assigning rating organization. Each security rating agency has its own methodology for assigning ratings, and, accordingly, each rating should be considered in the context of the applicable methodology, independent of all other ratings. The rating agencies provide ratings at the request of Avista Corp. and charge fees for their services.
Dividends
On
February 3, 2017
, Avista Corp.’s Board of Directors declared a quarterly dividend of
$0.3575
per share on the Company’s common stock. This was an increase of
$0.015
per share, or
4.4 percent
from the previous quarterly dividend of
$0.3425
per share.
See "Item 5. Market for Registrant’s Common Equity, Related Stockholder Matters and Issuer Purchases of Equity Securities" for a detailed discussion of our dividend policy and the factors which could limit the payment of dividends.
Contractual Obligations
The following table provides a summary of our future contractual obligations as of
December 31, 2016
(dollars in millions):
|
2017
|
2018
|
2019
|
2020
|
2021
|
Thereafter
|
||||||||||||||||||
|
Avista Utilities:
|
|||||||||||||||||||||||
|
Long-term debt maturities
|
$
|
—
|
|
$
|
273
|
|
$
|
90
|
|
$
|
52
|
|
$
|
—
|
|
$
|
1,124
|
|
|||||
|
Long-term debt to affiliated trusts
|
—
|
|
—
|
|
—
|
|
—
|
|
—
|
|
52
|
|
|||||||||||
|
Interest payments on long-term debt (1)
|
80
|
|
70
|
|
63
|
|
58
|
|
56
|
|
836
|
|
|||||||||||
|
Short-term borrowings
|
120
|
|
—
|
|
—
|
|
—
|
|
—
|
|
—
|
|
|||||||||||
|
Energy purchase contracts (2)
|
298
|
|
252
|
|
228
|
|
151
|
|
126
|
|
1,125
|
|
|||||||||||
|
Operating lease obligations (3)
|
1
|
|
1
|
|
—
|
|
—
|
|
—
|
|
2
|
|
|||||||||||
|
Other obligations (4)
|
34
|
|
29
|
|
33
|
|
32
|
|
27
|
|
189
|
|
|||||||||||
|
Information technology contracts (5)
|
2
|
|
1
|
|
—
|
|
—
|
|
—
|
|
—
|
|
|||||||||||
|
Pension plan funding (6)
|
22
|
|
22
|
|
22
|
|
22
|
|
22
|
|
—
|
|
|||||||||||
|
Unsettled interest rate swap derivatives (7)
|
12
|
|
54
|
|
(3
|
)
|
(2
|
)
|
—
|
|
(1
|
)
|
|||||||||||
|
AERC (consolidated) total contractual commitments (8)
|
16
|
|
16
|
|
31
|
|
15
|
|
15
|
|
295
|
|
|||||||||||
|
Avista Capital (consolidated) total contractual commitments (9)
|
8
|
|
8
|
|
7
|
|
4
|
|
1
|
|
4
|
|
|||||||||||
|
Total contractual obligations
|
$
|
593
|
|
$
|
726
|
|
$
|
471
|
|
$
|
332
|
|
$
|
247
|
|
$
|
3,626
|
|
|||||
|
(1)
|
Represents our estimate of interest payments on long-term debt, which is calculated based on the assumption that all debt is outstanding until maturity. Interest on variable rate debt is calculated using the rate in effect at
December 31, 2016
.
|
|
(2)
|
Energy purchase contracts were entered into as part of the obligation to serve our retail electric and natural gas customers’ energy requirements. As a result, costs are generally recovered either through base retail rates or adjustments to retail rates as part of the power and natural gas cost adjustment mechanisms.
|
|
(3)
|
Includes the interest component of the lease obligation.
|
|
(4)
|
Represents operational agreements, settlements and other contractual obligations for our generation, transmission and distribution facilities. These costs are generally recovered through base retail rates.
|
|
(5)
|
Includes information service contracts which are recorded to other operating expenses in the Consolidated Statements of Income.
|
|
(6)
|
Represents our estimated cash contributions to pension plans and other postretirement benefit plans through
2021
. We cannot reasonably estimate pension plan contributions beyond
2021
at this time and have excluded them from the table above.
|
|
(7)
|
Represents the net mark-to-market fair value of outstanding unsettled interest rate swap derivatives as of December 31, 2016. Negative values in the table above represent contractual amounts that are owed to Avista Corp. by the counterparties. The values in the table above will change each period depending on fluctuations in market interest rates and could become either assets or liabilities. Also, the amounts in the table above are not reflective of cash collateral of
$34.9 million
and letters of credit of
$3.6 million
that are already posted with counterparties against the outstanding interest rate swap derivatives.
|
66
|
(8)
|
Primarily relates to long-term debt and capital lease maturities and the related interest. AERC contractual commitments also include contractually required capital project funding and operating and maintenance costs associated with the Snettisham hydroelectric project. These costs are generally recovered through base retail rates.
|
|
(9)
|
Primarily relates to operating lease commitments and a commitment to fund a limited liability company in exchange for equity ownership, made by a subsidiary of Avista Capital.
|
The above contractual obligations do not include income tax payments. Also, asset retirement obligations are not included above and payments associated with these have historically been less than $1 million per year. There are approximately
$15.5 million
remaining asset retirement obligations as of
December 31, 2016
.
In addition to the contractual obligations disclosed above, we will incur additional operating costs and capital expenditures in future periods for which we are not contractually obligated as part of our normal business operations.
Competition
Our utility electric and natural gas distribution business has historically been recognized as a natural monopoly. In each regulatory jurisdiction, our rates for retail electric and natural gas services (other than specially negotiated retail rates for industrial or large commercial customers, which are subject to regulatory review and approval) are generally determined on a “cost of service” basis. Rates are designed to provide, after recovery of allowable operating expenses and capital investments, an opportunity for us to earn a reasonable return on investment as allowed by our regulators.
In retail markets, we compete with various rural electric cooperatives and public utility districts in and adjacent to our service territories in the provision of service to new electric customers. Alternative energy technologies, including customer-sited solar, wind or geothermal generation, may also compete with us for sales to existing customers. While the risk is currently small in our service territory given the small numbers of customers utilizing these technologies, advances in power generation, energy efficiency, energy storage and other alternative energy technologies could lead to more wide-spread usage of these technologies, thereby reducing customer demand for the energy supplied by us. This reduction in usage and demand would reduce our revenue and negatively impact our financial condition including possibly leading to our inability to fully recover our investments in generation, transmission and distribution assets. Similarly, our natural gas distribution operations compete with other energy sources including heating oil, propane and other fuels.
Certain natural gas customers could bypass our natural gas system, reducing both revenues and recovery of fixed costs. To reduce the potential for such bypass, we price natural gas services, including transportation contracts, competitively and have varying degrees of flexibility to price transportation and delivery rates by means of individual contracts. These individual contracts are subject to state regulatory review and approval. We have long-term transportation contracts with several of our largest industrial customers under which the customer acquires its own commodity while using our infrastructure for delivery. Such contracts reduce the risk of these customers bypassing our system in the foreseeable future and minimizes the impact on our earnings.
Also, non-utility businesses are developing new technologies and services to help energy consumers manage energy in new ways that may improve productivity and could alter demand for the energy we sell.
In wholesale markets, competition for available electric supply is influenced by the:
|
•
|
localized and system-wide demand for energy,
|
|
•
|
type, capacity, location and availability of generation resources, and
|
|
•
|
variety and circumstances of market participants.
|
These wholesale markets are regulated by the FERC, which requires electric utilities to:
|
•
|
transmit power and energy to or for wholesale purchasers and sellers,
|
|
•
|
enlarge or construct additional transmission capacity for the purpose of providing these services, and
|
|
•
|
transparently price and offer transmission services without favor to any party, including the merchant functions of the utility.
|
Participants in the wholesale energy markets include:
|
•
|
other utilities,
|
|
•
|
federal power marketing agencies,
|
|
•
|
energy marketing and trading companies,
|
67
|
•
|
independent power producers,
|
|
•
|
financial institutions, and
|
|
•
|
commodity brokers.
|
Economic Conditions and Utility Load Growth
The general economic data, on both national and local levels, contained in this section is based, in part, on independent government and industry publications, reports by market research firms or other independent sources. While we believe that these publications and other sources are reliable, we have not independently verified such data and can make no representation as to its accuracy.
Avista Utilities
We track multiple economic indicators affecting the three largest metropolitan statistical areas in our Avista Utilities service area: Spokane, Washington, Coeur d'Alene, Idaho, and Medford, Oregon. Several key indicators are employment change, unemployment rates and foreclosure rates. On a year-over-year basis, December 2016 showed positive job growth and lower unemployment rates in all three metropolitan areas. However, the unemployment rates in Spokane and Medford are still above the national average. Except for Medford, foreclosure rates are in line with or below the U.S rate in all areas, and key leading indicators, initial unemployment claims and residential building permits signal continued growth over the next 12 months. Therefore, in 2017, we expect economic growth in our service area to be somewhat stronger than the U.S. as a whole.
Nonfarm employment (seasonally adjusted) in our eastern Washington, northern Idaho, and southwestern Oregon metropolitan service areas exhibited moderate growth between December 2015 and December 2016. In Spokane, Washington employment growth was 3.6 percent with gains in all major sectors except manufacturing and leisure and hospitality. Employment increased by 2.5 percent in Coeur d'Alene, Idaho, reflecting gains in all major sectors except mining and logging and professional and business services. In Medford, Oregon, employment growth was 3.8 percent, with gains in all major sectors except mining and logging. U.S. nonfarm sector jobs grew by 1.5 percent in the same 12-month period.
Seasonally adjusted unemployment rates went down in December 2016 from the year earlier in Spokane, Coeur d'Alene, and Medford. In Spokane the rate was 6.5 percent in December 2015 and declined to 6.3 percent in December 2016; in Coeur d'Alene the rate went from 4.9 percent to 4.5 percent; and in Medford the rate declined from 6.7 percent to 5.3 percent. The U.S. rate declined from 5.0 percent to 4.7 percent in the same period.
Except for the Medford area, the housing market in our Avista Utilities service area continues to experience foreclosure rates in line with the national average. The December 2016 national rate was 0.07 percent, compared to 0.07 percent in Spokane County, Washington; 0.02 percent in Kootenai County (Coeur d'Alene), Idaho; and 0.13 percent in Jackson County (Medford), Oregon.
Alaska Electric Light and Power Company
Our AEL&P service area is centered in Juneau. Although Juneau is Alaska’s state capital, it is not a metropolitan statistical area. This means breadth and frequency of economic data is more limited. Therefore, the dates of Juneau's economic data may significantly lag the period of this filing.
The Quarterly Census of Employment and Wages for Juneau shows employment declined 1.2 percent between second quarter 2015 and second quarter 2016. The employment decline was centered in government; construction; manufacturing; financial activities; and professional and business services. Government (including active duty military personnel) accounts for approximately 37 percent of total employment. Employment declines also occurred in natural resources and mining; education and health services; and other services. Between December 2015 and December 2016 the non-seasonally adjusted unemployment rate decreased from 4.7 percent to 4.5 percent.
The Juneau foreclosure rate is below the U.S. rate. The December 2016 rate was 0.02 percent compared to 0.07 percent for the U.S.
Forecasted Customer and Load Growth
Based on our forecast for 2017 through 2020 for Avista Utilities' service area, we expect annual electric customer growth to average 1.1 percent, within a forecast range of 0.7 percent to 1.5 percent. We expect annual natural gas customer growth to average 1.3 percent, within a forecast range of 0.8 percent to 1.8 percent. We anticipate retail electric load growth to average 0.6 percent, within a forecast range of 0.3 percent and 0.9 percent. We expect natural gas load growth to average 1.2 percent, within a forecast range of 0.7 percent and 1.7 percent. The forecast ranges reflect (1) the inherent uncertainty associated with the economic assumptions on which forecasts are based and (2) the historic variability of natural gas customer and load growth.
68
In AEL&P's service area, we expect residential customer growth near 0 percent (no residential customer growth) for 2017 through 2020. We also expect no significant growth in commercial and government customers over the same period. We anticipate average annual total load growth will be in a narrow range around 0.3 percent, with residential load growth averaging 0.6 percent, commercial growth near 0 percent (no load growth); and government growth near 0 percent.
The forward-looking statements set forth above regarding retail load growth are based, in part, upon purchased economic forecasts and publicly available population and demographic studies. The expectations regarding retail load growth are also based upon various assumptions, including:
|
•
|
assumptions relating to weather and economic and competitive conditions,
|
|
•
|
internal analysis of company-specific data, such as energy consumption patterns,
|
|
•
|
internal business plans,
|
|
•
|
an assumption that we will incur no material loss of retail customers due to self-generation or retail wheeling, and
|
|
•
|
an assumption that demand for electricity and natural gas as a fuel for mobility will for now be immaterial.
|
Changes in actual experience can vary significantly from our projections.
See also "Competition" above for a discussion of competitive factors that could affect our results of operations in the future.
Environmental Issues and Contingencies
We are subject to environmental regulation by federal, state and local authorities. The generation, transmission, distribution, service and storage facilities in which we have ownership interests are designed and operated in compliance with applicable environmental laws. Furthermore, we conduct periodic reviews and audits of pertinent facilities and operations to ensure compliance and to respond to or anticipate emerging environmental issues. The Company's Board of Directors has established a committee to oversee environmental issues.
We monitor legislative and regulatory developments at all levels of government for environmental issues, particularly those with the potential to impact the operation and productivity of our generating plants and other assets.
Environmental laws and regulations may:
|
•
|
increase the operating costs of generating plants;
|
|
•
|
increase the lead time and capital costs for the construction of new generating plants;
|
|
•
|
require modification of our existing generating plants;
|
|
•
|
require existing generating plant operations to be curtailed or shut down;
|
|
•
|
reduce the amount of energy available from our generating plants;
|
|
•
|
restrict the types of generating plants that can be built or contracted with;
|
|
•
|
require construction of specific types of generation plants at higher cost; and
|
|
•
|
increase costs of distributing natural gas.
|
Compliance with environmental laws and regulations could result in increases to capital expenditures and operating expenses. We intend to seek recovery of any such costs through the ratemaking process.
Clean Air Act (CAA)
We must comply with the requirements under the CAA in operating our thermal generating plants. The CAA currently requires a Title V operating permit for Colstrip (expires in 2017), Coyote Springs 2 (expires in 2018), the Kettle Falls GS (application has been made for a new permit), and the Rathdrum CT (application has been made for a new permit). Boulder Park GS, Northeast CT, and other activities only require minor source operating or registration permits based on their limited operation and emissions. The Title V operating permits are renewed every five years and updated to include newly applicable CAA requirements. We actively monitor legislative, regulatory and program developments within the CAA that may impact our facilities.
On March 6, 2013, the Sierra Club and Montana Environmental Information Center, filed a Complaint (Complaint) in the United States District Court for the District of Montana, Billings Division, against the owners of Colstrip. The Complaint alleged certain violations of the Clean Air Act. On July 12, 2016, all of the parties to this action filed a Consent Decree with the
69
Court settling all claims contained in the Complaint. See “Sierra Club and Montana Environmental Information Center Litigation” in “Note 19 of the Notes to Consolidated Financial Statements” for further information on this matter.
Hazardous Air Pollutants (HAPs)
The EPA regulates hazardous air pollutants from a published list of industrial sources referred to as "source categories" which must meet control technology requirements if they emit one or more of the pollutants in significant quantities. In 2012, the EPA finalized the Mercury Air Toxic Standards (MATS) for the coal and oil-fired source category. At the time of issuance in 2012, we examined the existing emission control systems of Colstrip Units 3 & 4, the only units in which we are a minority owner, and concluded that the existing emission control systems should be sufficient to meet mercury limits. For the remaining portion of the rule that utilized Particulate Matter as a surrogate for air toxics (including metals and acid gases), the Colstrip owners reviewed recent stack testing data and expected that no additional emission control systems would be needed for Units 3 & 4 MATS compliance.
Regional Haze Program
The EPA set a national goal of eliminating man-made visibility degradation in Class I areas by the year 2064. States are expected to take actions to make “reasonable progress” through 10-year plans, including application of Best Available Retrofit Technology (BART) requirements. BART is a retrofit program applied to large emission sources, including electric generating units built between 1962 and 1977. In the case where a State opts out of implementing the Regional Haze program, the EPA may act directly. On September 18, 2012, the EPA finalized the Regional Haze federal implementation plan (FIP) for Montana. The FIP includes both emission limitations and pollution controls for Colstrip Units 1 & 2. Colstrip Units 3 & 4, the only units of which we are a minority owner, are not currently affected, but will be evaluated for Reasonable Progress at the next review period. We do not anticipate any material impacts on Units 3 & 4 at this time.
Coal Ash Management/Disposal
On April 17, 2015, the EPA published a final rule regarding coal combustion residuals (CCRs), also termed coal combustion byproducts or coal ash in the Federal Register, and this rule became effective on October 15, 2015. Colstrip, of which we are a 15 percent owner of Units 3 & 4, produces this byproduct. The rule establishes technical requirements for CCR landfills and surface impoundments under Subtitle D of the Resource Conservation and Recovery Act, the nation's primary law for regulating solid waste. We, in conjunction with the other owners, are developing a multi-year compliance plan to strategically address the new CCR requirements and existing state obligations while maintaining operational stability. During 2015, the operator of Colstrip provided an initial cost estimate of the expected retirement costs associated with complying with the new CCR rule and based on the initial assessments, Avista Corp. recorded an increase to its asset retirement obligations of
$12.5 million
with a corresponding increase in the cost basis of the utility plant. During 2016, due to additional information and updated estimates, we increased the asset retirement obligation (ARO) to
$13.6 million
(including accretion of
$0.7 million
). See "Note 9 of the Notes to Consolidated Financial Statements" for additional information regarding AROs.
In addition to an increase to our ARO, it is expected that there will be significant compliance costs at Colstrip in the future, both operating and capital costs, due to a series of incremental infrastructure improvements which are separate from the ARO. Due to the preliminary nature of available data, we cannot reasonably estimate the future compliance costs; however, we will update our ARO and compliance cost estimates when data becomes available.
The actual asset retirement costs and future compliance costs related to the CCR Rule requirements may vary substantially from the estimates used to record the increased ARO due to uncertainty about the compliance strategies that will be used and the preliminary nature of available data used to estimate costs, such as the quantity of coal ash present at certain sites and the volume of fill that will be needed to cap and cover certain impoundments. We will coordinate with the plant operators and continue to gather additional data in future periods to make decisions about compliance strategies and the timing of closure activities. As additional information becomes available, we will update the ARO and future nonretirement compliance costs for these changes in estimates, which could be material. We expect to seek recovery of any increased costs related to complying with the new rule through customer rates.
Climate Change
Concerns about long-term global climate changes could have a significant effect on our business. Our operations could also be affected by changes in laws and regulations intended to mitigate the risk of, or alter global climate changes, including restrictions on the operation of our power generation resources and obligations imposed on the sale of natural gas. Changing temperatures and precipitation, including snowpack conditions, affect the availability and timing of streamflows, which impact hydroelectric generation. Extreme weather events could increase service interruptions, outages and maintenance costs. Changing temperatures could also increase or decrease customer demand.
70
Our Climate Policy Council (an interdisciplinary team of management and other employees):
|
•
|
facilitates internal and external communications regarding climate change issues,
|
|
•
|
analyzes policy effects, anticipates opportunities and evaluates strategies for Avista Corp., and
|
|
•
|
develops recommendations on climate related policy positions and action plans.
|
Climate Change - Federal Regulatory Actions
The EPA released the final rules for the Clean Power Plan (Final CPP) and the Carbon Pollution Standards (Final CPS) on August 3, 2015. The Final CPP and the Final CPS are both intended to reduce the carbon dioxide (CO2) emissions from certain coal-fired and natural gas electric generating units (EGUs). These rules were published in the Federal Register on October 23, 2015 and were immediately challenged via lawsuits by other parties.
The Final CPP was promulgated pursuant to Section 111(d) of the CAA and applies to CO2 emissions from existing EGUs. The Final CPP is intended to reduce national CO2 emissions by approximately 32 percent below 2005 levels by 2030. The Final CPS rule was issued pursuant to Section 111(b) of the CAA and applies to the emissions of new, modified and reconstructed EGUs. The two rules are the first rules ever adopted by the U.S. federal government to comprehensively control and reduce CO2 emissions from the power sector. The EPA also issued a proposed Federal Implementation Plan (Proposed FIP) for the Final CPP. The Final FIP that the EPA adopts could be imposed on states by the EPA, should a state decide not to develop its own plan.
The Final CPP establishes individual state emission reduction goals based upon the assumed potential for (1) heat rate improvements at coal-fired units, (2) increased utilization of natural gas-fired combined cycle plants, and (3) increased utilization of low or zero carbon emitting generation resources. As expressed in the final rule, states had until September 2016 to submit state compliance plans, with a potential for two-year extensions. A stay granted by the U.S. Supreme Court, and described below, pushed this date out pending the results of the case. Avista Corp. owns two EGUs that are subject to the Final CPP: its portion (15 percent of Units 3 & 4) of Colstrip in Montana and Coyote Springs 2 in Oregon. States may adopt rate-based or mass-based plans, and may choose to focus compliance on specific EGUs or adopt broader measures to reduce carbon emissions from this sector. The states in which Avista Utilities generates or delivers electricity, Washington, Idaho, Montana and Oregon, are at differing stages of evaluating options for developing state plans, which will define compliance approaches and obligations. Alaska was exempted in the Final CPP. The EPA may consider rulemaking for Alaska and Hawaii, both states which lack regional grid connections in the future.
In a separate but related rulemaking, the EPA finalized CO2 new source performance standards (NSPS) for new, modified and reconstructed fossil fuel-fired EGUs under CAA section 111(b). These EGUs fall into the same two categories of sources regulated by the Final CPP: steam generating units (also known as “utility boilers and IGCC units”), which primarily burn coal, and stationary combustion turbines, which primarily burn natural gas.
GHG emission standards could result in significant compliance costs. Such standards could also preclude us from developing, operating or contracting with certain types of generating plants. Additionally, the Climate Action Plan requirements related to preparing the U.S. for the impacts of climate change could affect us and others in the industry as transmission system modifications to improve resiliency may be needed in order to meet those requirements.
The promulgated and proposed GHG rulemakings mentioned above have been legally challenged in multiple venues. On February 9, 2016, the U.S. Supreme Court granted a request for stay, halting implementation of the CPP. Given this development and related ongoing legal challenges, we cannot fully predict the outcome or estimate the extent to which our facilities may be impacted by these regulations at this time. We intend to seek recovery of any costs related to compliance with these requirements through the ratemaking process.
Climate Change - State Legislation and State Regulatory Activities
The states of Washington and Oregon have adopted non-binding targets to reduce GHG emissions. Both states enacted their targets with an expectation of reaching the targets through a combination of renewable energy standards, and assorted “complementary policies,” but no specific reductions are mandated.
Washington and Oregon apply a GHG emissions performance standard (EPS) to electric generation facilities used to serve retail loads in their jurisdictions. The EPS prevents utilities from constructing or purchasing generation facilities, or entering into power purchase agreements of five years or longer duration to purchase energy produced by plants, that in any case, have emission levels higher than 1,100 pounds of GHG per MWh. The Washington State Department of Commerce (Commerce) initiated a process to adopt a lower emissions performance standard in 2012; any new standard will be applicable until at least 2017. Commerce published a supplemental notice of proposed rulemaking on January 16,
71
2013 with a new EPS of 970 pounds of GHG per MWh. We will engage in the next process to revise the EPS, which should occur in 2017.
Washington
Energy Independence Act (EIA)
The EIA in Washington requires electric utilities with over 25,000 customers to acquire qualified renewable energy resources and/or renewable energy credits equal to 15 percent of the utility's total retail load in Washington in 2020. I-937 also requires these utilities to meet biennial energy conservation targets beginning in 2012. The renewable energy standard increased from three percent in 2012 to nine percent in 2016. Failure to comply with renewable energy and efficiency standards could result in penalties of $50 per MWh or greater assessed against a utility for each MWh it is deficient in meeting a standard. We have met, and will continue to meet, the requirements of EIA through a variety of renewable energy generating means, including, but not limited to, some combination of hydro upgrades, wind, biomass and renewable energy credits. In 2012, EIA was amended in such a way that our Kettle Falls GS and certain other biomass energy facilities, which commenced operation before March 31, 1999, are considered resources that may be used to meet the renewable energy standards.
Clean Air Rule
In September 2016, the Washington State Department of Ecology (Ecology) adopted the Clean Air Rule (CAR) to cap and reduce GHG emissions across the State of Washington in pursuit of the State’s GHG goals, which were enacted in 2008 by the Washington State Legislature (Legislature). The CAR applies to sources of annual GHG emissions in excess of 100,000 tons for the first compliance period of 2017 through 2019; this threshold incrementally decreases to 70,000 metric tons beginning in 2035. The rule affects stationary sources and transportation fuel suppliers, as well as natural gas distribution companies. Ecology has identified approximately 30 entities that would be regulated under the CAR. Parties covered by the regulation must reduce emissions by 1.7 percent annually until 2035. Compliance can be demonstrated by achieving emission reductions and/or surrendering Emission Reduction Units (ERU), which are generated by parties that achieve reductions greater than required by the rule. ERUs can also take the form of renewable energy credits from renewable resources located in Washington, carbon emission offsets, and allowances acquired from an organized cap and trade market, such as that operating in California. In addition to the CAR's applicability to our burning of fuel as an electric utility, the CAR applies to us as a natural gas distribution company, for the emissions associated with the use of the natural gas we provide our customers who are not already covered under the regulation.
In September 2016, Avista Corp., Cascade Natural Gas Corp., NW Natural and Puget Sound Energy (PSE) (collectively, Petitioners) jointly filed an action in the U.S. District Court for the Eastern District of Washington challenging Ecology’s recently promulgated CAR. The four companies also filed litigation in Thurston County Superior Court.
Petitioners believe that the reduction of GHG emissions is a matter that needs to be addressed, but the CAR is not the solution. Each utility represented in this case provided feedback and public comment to improve the rule, but ideas put forward were not incorporated in the final rule. They are asking the U.S District Court and the Thurston County Superior Court to find that the CAR is invalid.
In their State claim, Petitioners assert that:
|
•
|
Ecology lacks statutory authority to regulate natural gas utilities because the CAR holds them responsible for the indirect emissions of their customers;
|
|
•
|
Ecology does not have the authority to create an emission reduction trading program (ERUs);
|
|
•
|
Ecology failed to comply with the requirements of the State Environmental Policy Act; and
|
|
•
|
the CAR is arbitrary and capricious.
|
Petitioners' Federal claim asserts that the CAR violates the dormant Commerce Clause of the U.S. Constitution by discriminating against interstate commerce, regulating extraterritorially and unduly burdening interstate commerce by restricting the use of ERU’s (allowances) generated from outside Washington State for compliance purposes. The case in U.S. District Court has been tolled while the state court case proceeds, with oral arguments scheduled for the spring of 2017.
Initiative I-732
An Initiative to the Legislature (I-732) to impose a carbon tax on fossil-fueled generation and natural gas distribution, as well as on transportation fuels, was submitted to the Legislature in January 2016. The Legislature failed to act upon the
72
measure and I-732 was referred to the November 2016 General Election ballot, where it failed to gain enough votes for enactment.
Colstrip 3 & 4 Considerations
On February 6, 2014, the UTC issued a letter finding that PSE’s 2013 Electric Integrated Resource Plan meets the requirements of the Revised Code of Washington and the Washington Administrative Code. In its letter, however, the UTC expressed concern regarding the continued operation of the Colstrip plant as a resource to serve retail customers. Although the UTC recognized that the results of the analyses presented by PSE “differed significantly between [Colstrip] Units 1 & 2 and Units 3 & 4,” the UTC did not limit its concerns solely to Colstrip Units 1 & 2. The UTC recommended that PSE “consult with UTC staff to consider a Colstrip Proceeding to determine the prudency of any new investment in Colstrip before it is made or, alternatively, a closure or partial-closure plan.” As part of the Sierra Club litigation that was settled in 2016, Units 1 & 2 are scheduled to close by July 2022. See "Note 19 of the Notes to Consolidated Financial Statements" for further discussion of the Sierra Club litigation. As a 15 percent owner of Colstrip Units 3 & 4, we cannot estimate the effect of such proceeding, should it occur, on the future ownership, operation and operating costs of our share of Colstrip Units 3 & 4. Our remaining investment in Colstrip Units 3 & 4 as of
December 31, 2016
was
$131.0 million
.
In Oregon, legislation was enacted in 2016 which requires Portland General Electric and PacifiCorp to remove coal-fired generation from their Oregon rate base by 2030. This legislation does not directly relate to Avista Corp. because Avista Corp. is not an electric utility in Oregon. However, because these two utilities, along with Avista Corp., hold minority interests in Colstrip, the legislation could indirectly impact Avista Corp., though specific impacts cannot be identified at this time. While the legislation requires Portland General Electric and PacifiCorp to eliminate Colstrip from their rates, they would be permitted to sell the output of their shares of Colstrip into the wholesale market or, as is the case with PacifiCorp, reallocate the plant to other states. We cannot predict the eventual outcome of actions arising from this legislation at this time or estimate the effect thereof on Avista Corp.; however, we will continue to seek recovery, through the ratemaking process, of all operating and capitalized costs related to our generation assets.
Threatened and Endangered Species and Wildlife
A number of species of fish in the Northwest are listed as threatened or endangered under the Federal Endangered Species Act (ESA). Efforts to protect these and other species have not significantly impacted generation levels at any of our hydroelectric facilities, nor operations of our thermal plants or electrical distribution and transmission system. We are implementing fish protection measures at our hydroelectric project on the Clark Fork River under a 45-year FERC operating license for Cabinet Gorge and Noxon Rapids (issued March 2001) that incorporates a comprehensive settlement agreement. The restoration of native salmonid fish, including bull trout, is a key part of the agreement. The result is a collaborative native salmonid restoration program with the U.S. Fish and Wildlife Service, Native American tribes and the states of Idaho and Montana on the lower Clark Fork River, consistent with requirements of the FERC license. The U.S. Fish & Wildlife Service issued an updated Critical Habitat Designation for bull trout in 2010 that includes the lower Clark Fork River, as well as portions of the Coeur d'Alene basin within our Spokane River Project area, and issued a final Bull Trout Recovery Plan under the ESA. Issues related to these activities are expected to be resolved through the ongoing collaborative effort of our Clark Fork and Spokane River FERC licenses. See “Fish Passage at Cabinet Gorge and Noxon Rapids” in “Note 19 of the Notes to Consolidated Financial Statements” for further information.
Various statutory authorities, including the Migratory Bird Treaty Act, have established penalties for the unauthorized take of migratory birds. Because we operate facilities that can pose risks to a variety of such birds, we have developed and follow an avian protection plan.
We are also aware of other threatened and endangered species and issues related to them that could be impacted by our operations and we make every effort to comply with all laws and regulations relating to these threatened and endangered species. We expect all costs associated with these compliance efforts to be recovered through the future ratemaking process.
Other
For other environmental issues and other contingencies see “Note 19 of the Notes to Consolidated Financial Statements.”
Enterprise Risk Management
The material risks to our businesses are discussed in "Item 1A. Risk Factors," "Forward-Looking Statements," as well as "Environmental Issues and Contingencies." The following discussion focuses on our mitigation processes and procedures to address these risks.
73
We consider the management of these risks an integral part of managing our core businesses and a key element of our approach to corporate governance.
Risk management includes identifying and measuring various forms of risk that may affect the Company. We have an enterprise risk management process for managing risks throughout our organization. Our Board of Directors and its Committees take an active role in the oversight of risk affecting the Company. Our risk management department facilitates the collection of risk information across the Company, providing senior management with a consolidated view of the Company’s major risks and risk mitigation measures. Each area identifies risks and implements the related mitigation measures. The enterprise risk process supports management in identifying, assessing, quantifying, managing and mitigating the risks. Despite all risk mitigation measures, however, risks are not eliminated.
Our primary identified categories of risk exposure are:
|
• Financial
|
• Compliance
|
|
• Utility regulatory
|
• Technology
|
|
• Energy commodity
|
• Strategic
|
|
• Operational
|
• External Mandates
|
Financial Risk
Financial risk is any risk that could have a direct material impact on the financial performance or financial viability of the Company. Broadly, financial risks involve variation of earnings and liquidity. Underlying risks include, but are not limited to, those described in "Item 1A. Risk Factors."
We mitigate financial risk in a variety of ways including through oversight from the Finance Committee of our Board of Directors and from senior management. Our Regulatory department is also critical in risk mitigation as they have regular communications with state commission regulators and staff and they monitor and develop rate strategies for the Company. Rate strategies, such as decoupling, help mitigate the impacts of revenue fluctuations due to weather, conservation or the economy. We also have a Treasury department that monitors our daily cash position and future cash flow needs, as well as monitoring market conditions to determine the appropriate course of action for capital financing and/or hedging strategies.
Weather Risk
To partially mitigate the risk of financial underperformance due to weather-related factors, we developed decoupling rate mechanisms that were approved by the Washington, Idaho and Oregon commissions. Decoupling mechanisms are designed to break the link between a utility's revenues and consumers' energy usage and instead provide revenue based on the number of customers, thus mitigating a large portion of the risk associated with lower customer loads. See "Regulatory Matters" for further discussion of our decoupling mechanisms.
Access to Capital Markets
Our capital requirements rely to a significant degree on regular access to capital markets. We actively engage with rating agencies, banks, investors and state public utility commissions to understand and address the factors that support access to capital markets on reasonable terms. We manage our capital structure to maintain a financial risk profile that we believe these parties will deem prudent. We forecast cash requirements to determine liquidity needs, including sources and variability of cash flows that may arise from our spending plans or from external forces, such as changes in energy prices or interest rates. Our financial and operating forecasts consider various metrics that affect credit ratings. Our regulatory strategies include working with state public utility commissions and filing for rate changes as appropriate to meet financial performance expectations.
Interest Rate Risk
Uncertainty about future interest rates causes risk related to a portion of our existing debt, our future borrowing requirements, and our pension and other post-retirement benefit obligations. We manage debt interest rate exposure by limiting our variable rate debt to a percentage of total capitalization of the Company. We hedge a portion of our interest rate risk on forecasted debt issuances with financial derivative instruments, which may include interest rate swaps and U.S. Treasury lock agreements. The Finance Committee of our Board of Directors periodically reviews and discusses interest rate risk management processes and the steps management has undertaken to control interest rate risk. Our RMC also reviews our interest rate risk management plan. Additionally, interest rate risk is managed by monitoring market conditions when timing the issuance of long-term debt and optional debt redemptions and establishing fixed rate long-term debt with varying maturities.
Our interest rate swap derivatives are considered economic hedges against the future forecasted interest rate payments of our long-term debt. Interest rates on our long-term debt are generally set based on underlying U.S. Treasury rates plus credit
74
spreads, which are based on our credit ratings and prevailing market prices for debt. The interest rate swap derivatives hedge against changes in the U.S. Treasury rates but do not hedge the credit spread.
Even though we work to manage our exposure to interest rate risk by locking in certain long-term interest rates through interest rate swap derivatives, if market interest rates decrease below the interest rates we have locked in, this will result in a liability related to our interest rate swap derivatives, which can be significant. However, through our regulatory accounting practices similar to our energy commodity derivatives, any interim mark-to-market gains or losses are offset by regulatory assets and liabilities. Upon settlement of interest rate swap derivatives, the regulatory asset or liability is amortized as a component of interest expense over the term of the associated debt.
The following table summarizes our interest rate swap derivatives outstanding as of
December 31, 2016
and
December 31, 2015
(dollars in thousands):
|
December 31,
|
December 31,
|
||||||
|
2016
|
2015
|
||||||
|
Number of agreements
|
33
|
|
23
|
|
|||
|
Notional amount
|
$
|
500,000
|
|
$
|
455,000
|
|
|
|
Mandatory cash settlement dates
|
2017 to 2022
|
|
2016 to 2022
|
|
|||
|
Short-term derivative assets (1)
|
$
|
3,393
|
|
$
|
—
|
|
|
|
Long-term derivative assets (1)
|
5,357
|
|
23
|
|
|||
|
Short-term derivative liability (1) (2)
|
(6,025
|
)
|
(19,264
|
)
|
|||
|
Long-term derivative liability (1) (2)
|
(28,705
|
)
|
(30,679
|
)
|
|||
|
(1)
|
There are offsetting regulatory assets and liabilities for these items on the Consolidated Balance Sheets in accordance with regulatory accounting practices.
|
|
(2)
|
The balance as of
December 31, 2016
and
December 31, 2015
reflects the offsetting of
$34.9 million
and
$34.0 million
, respectively, of cash collateral against the net derivative positions where a legal right of offset exists.
|
We estimate that a 10-basis-point increase in forward LIBOR interest rates as of
December 31, 2016
would decrease the interest rate swap derivative net
liability
by
$10.4 million
, while a 10-basis-point decrease would increase the interest rate swap derivative net
liability
by
$10.7 million
.
We estimated that a 10-basis-point increase in forward LIBOR interest rates as of
December 31, 2015
would have decreased the interest rate swap derivative net liability by
$9.8 million
, while a 10-basis-point decrease would increase the interest rate swap derivative net liability by
$10.1 million
.
The interest rate on
$51.5 million
of long-term debt to affiliated trusts is adjusted quarterly, reflecting current market rates. Amounts borrowed under our committed line of credit agreements have variable interest rates.
The following table shows our long-term debt (including current portion) and related weighted-average interest rates, by expected maturity dates as of
December 31, 2016
(dollars in thousands):
|
2017
|
2018
|
2019
|
2020
|
2021
|
Thereafter
|
Total
|
Fair Value
|
||||||||||||||||||||||||
|
Fixed rate long-term debt (1)
|
$
|
—
|
|
$
|
272,500
|
|
$
|
105,000
|
|
$
|
52,000
|
|
$
|
—
|
|
$
|
1,198,500
|
|
$
|
1,628,000
|
|
$
|
1,723,912
|
|
|||||||
|
Weighted-average interest rate
|
—
|
|
6.07
|
%
|
5.22
|
%
|
3.89
|
%
|
—
|
|
4.91
|
%
|
5.09
|
%
|
|||||||||||||||||
|
Variable rate long-term debt to affiliated trusts
|
—
|
|
—
|
|
—
|
|
—
|
|
—
|
|
$
|
51,547
|
|
$
|
51,547
|
|
$
|
38,660
|
|
||||||||||||
|
Weighted-average interest rate
|
—
|
|
—
|
|
—
|
|
—
|
|
—
|
|
1.81
|
%
|
1.81
|
%
|
|||||||||||||||||
|
(1)
|
These balances include the fixed rate long-term debt of Avista Corp., AEL&P and AERC.
|
Our pension plan is exposed to interest rate risk because the value of pension obligations and other post-retirement obligations vary directly with changes in the discount rates, which are derived from end-of-year market interest rates. In addition, the value of pension investments and potential income on pension investments is partially affected by interest rates because a portion of pension investments are in fixed income securities. The Finance Committee of the Board of Directors approves investment
75
policies, objectives and strategies that seek an appropriate return for the pension plan and it reviews and approves changes to the investment and funding policies. We manage interest rate risk associated with our pension and other post-retirement benefit plans by investing a targeted amount of pension plan assets in fixed income investments that have maturities with similar profiles to future projected benefit obligations. See "Note 10 of the Notes to Consolidated Financial Statements" for further discussion of our investment policy associated with the pension assets.
Credit Risk
Counterparty Non-Performance Risk
Counterparty non-performance risk relates to potential losses that we would incur as a result of non-performance of contractual obligations by counterparties to deliver energy or make financial settlements.
Changes in market prices may dramatically alter the size of credit risk with counterparties, even when we establish conservative credit limits. Should a counterparty fail to perform, we may be required to honor the underlying commitment or to replace existing contracts with contracts at then-current market prices.
We enter into bilateral transactions with various counterparties. We also trade energy and related derivative instruments through clearinghouse exchanges.
We seek to mitigate credit risk by:
|
•
|
transacting through clearinghouse exchanges,
|
|
•
|
entering into bilateral contracts that specify credit terms and protections against default,
|
|
•
|
applying credit limits and duration criteria to existing and prospective counterparties,
|
|
•
|
actively monitoring current credit exposures,
|
|
•
|
asserting our collateral rights with counterparties, and
|
|
•
|
carrying out transaction settlements timely and effectively.
|
The extent of transactions conducted through exchanges has increased as many market participants have shown a preference toward exchange trading and have reduced bilateral transactions. We actively monitor the collateral required by such exchanges to effectively manage our capital requirements.
Counterparties’ credit exposure to us is dynamic in normal markets and may change significantly in more volatile markets. The amount of potential default risk to us from each counterparty depends on the extent of forward contracts, unsettled transactions, interest rates and market prices. There is a risk that we do not obtain sufficient additional collateral from counterparties that are unable or unwilling to provide it.
Credit Risk Liquidity Considerations
To address the impact on our operations of energy market price volatility, our hedging practices for electricity (including fuel for generation) and natural gas extend beyond the current operating year. Executing this extended hedging program may increase credit risk and demands for collateral. Our credit risk management process is designed to mitigate such credit risks through limit setting, contract protections and counterparty diversification, among other practices.
Credit risk affects demands on our capital. We are subject to limits and credit terms that counterparties may assert to allow us to enter into transactions with them and maintain acceptable credit exposures. Many of our counterparties allow unsecured credit at limits prescribed by agreements or their discretion. Capital requirements for certain transaction types involve a combination of initial margin and market value margins without any unsecured credit threshold. Counterparties may seek assurances of performance from us in the form of letters of credit, prepayment or cash deposits.
Credit exposure can change significantly in periods of commodity price and interest rate volatility. As a result, sudden and significant demands may be made against our credit facilities and cash. We actively monitor the exposure to possible collateral calls and take steps to minimize capital requirements.
As of
December 31, 2016
, we had cash deposited as collateral of
$17.1 million
and letters of credit of
$24.4 million
outstanding related to our energy derivative contracts. Price movements and/or a downgrade in our credit ratings could impact further the amount of collateral required. See “Credit Ratings” for further information. For example, in addition to limiting our ability to conduct transactions, if our credit ratings were lowered to below “investment grade” based on our positions outstanding at
December 31, 2016
, we would potentially be required to post additional collateral of up to
$6.0 million
. This amount is
76
different from the amount disclosed in “Note 6 of the Notes to Consolidated Financial Statements” because, while this analysis includes contracts that are not considered derivatives in addition to the contracts considered in Note 6, this analysis also takes into account contractual threshold limits that are not considered in Note 6. Without contractual threshold limits, we would potentially be required to post additional collateral of
$8.2 million
.
Under the terms of interest rate swap derivatives that we enter into periodically, we may be required to post cash or letters of credit as collateral depending on fluctuations in the fair value of the instrument. As of
December 31, 2016
, we had interest rate swap agreements outstanding with a notional amount totaling
$500.0 million
and we had deposited cash in the amount of
$34.9 million
and letters of credit of
$3.6 million
as collateral for these interest rate swap derivatives. If our credit ratings were lowered to below “investment grade” based on our interest rate swap derivatives outstanding at
December 31, 2016
, we would have to post
$21.1 million
of additional collateral.
Foreign Currency Risk
A significant portion of our utility natural gas supply (including fuel for electric generation) is obtained from Canadian sources. Most of those transactions are executed in U.S. dollars, which avoids foreign currency risk. A portion of our short-term natural gas transactions and long-term Canadian transportation contracts are committed based on Canadian currency prices. The short-term natural gas transactions are typically settled within sixty days with U.S. dollars. We economically hedge a portion of the foreign currency risk by purchasing Canadian currency exchange contracts when such commodity transactions are initiated. This risk has not had a material effect on our financial condition, results of operations or cash flows and these differences in cost related to currency fluctuations are included with natural gas supply costs for ratemaking.
Further information for derivatives and fair values is disclosed at “Note 6 of the Notes to Consolidated Financial Statements” and “Note 16 of the Notes to Consolidated Financial Statements.”
Utility Regulatory Risk
Because we are primarily a regulated utility, we face the risk that regulators may not grant rates that provide timely or sufficient recovery of our costs or allow a reasonable rate of return for our shareholders. This includes costs associated with our investment in rate base, as well as commodity costs and other operating and financing expenses. During December 2016, the UTC denied our most recent electric and natural gas general rate requests and granted zero rate relief. We are currently in the process of pursuing remedies toward a reasonable end result. If our efforts to obtain rates that are fair, just, reasonable and sufficient are not successful, we expect our 2017 earnings will be adversely impacted. See further discussion at "Item 7. Management's Discussion and Analysis of Financial Condition and Results of Operations – Regulatory Matters."
We mitigate regulatory risk through oversight from our Board of Directors and from senior management. We have a separate regulatory group which communicates with commission regulators and staff regarding the Company’s business plans and concerns. The regulatory group also considers the regulator’s priorities and rate policies and makes recommendations to senior management on regulatory strategy for the Company. See “Regulatory Matters” for further discussion of regulatory matters affecting our Company.
Energy Commodity Risk
Energy commodity risks are associated with fulfilling our obligation to serve customers, managing variability of energy facilities, rights and obligations and fulfilling the terms of our energy commodity agreements with counterparties. These risks include, among other things, those described in "Item 1A. Risk Factors."
We mitigate energy commodity risk primarily through our energy resources risk policy, which includes oversight from the RMC and oversight from the Audit Committee and the Environmental, Technology and Operations Committee of our Board of Directors. In conjunction with the oversight committees, our management team develops hedging strategies, detailed resource procurement plans, resource optimization strategies and long-term integrated resource planning to mitigate some of the risk associated with energy commodities. The various plans and strategies are monitored daily and developed with quantitative methods.
Our energy resources risk policy includes our wholesale energy markets credit policy and control procedures to manage energy commodity price and credit risks. Nonetheless, adverse changes in commodity prices, generating capacity, customer loads, regulation and other factors may result in losses of earnings, cash flows and/or fair values.
We measure the volume of monthly, quarterly and annual energy imbalances between projected power loads and resources. The measurement process is based on expected loads at fixed prices (including those subject to retail rates) and expected resources to the extent that costs are essentially fixed by virtue of known fuel supply costs or projected hydroelectric conditions. To the extent that expected costs are not fixed, either because of volume mismatches between loads and resources or because fuel cost is not locked in through fixed price contracts or derivative instruments, our risk policy guides the process to manage this open
77
forward position over a period of time. Normal operations result in seasonal mismatches between power loads and available resources. We are able to vary the operation of generating resources to match parts of intra-hour, hourly, daily and weekly load fluctuations. We use the wholesale power markets, including the natural gas market as it relates to power generation fuel, to sell projected resource surpluses and obtain resources when deficits are projected. We buy and sell fuel for thermal generation facilities based on comparative power market prices and marginal costs of fueling and operating available generating facilities and the relative economics of substitute market purchases for generating plant operation.
To address the impact on our operations of energy market price volatility, our hedging practices for electricity (including fuel for generation) and natural gas extend beyond the current operating year. Executing this extended hedging program may increase our credit risks. Our credit risk management process is designed to mitigate such credit risks through limit setting, contract protections and counterparty diversification, among other practices.
Our projected retail natural gas loads and resources are regularly reviewed by operating management and the RMC. To manage the impacts of volatile natural gas prices, we seek to procure natural gas through a diversified mix of spot market purchases and forward fixed price purchases from various supply basins and time periods. We have an active hedging program that extends into future years with the goal of reducing price volatility in our natural gas supply costs. We use natural gas storage capacity to support high demand periods and to procure natural gas when price spreads are favorable. Securing prices throughout the year and even into subsequent years mitigates potential adverse impacts of significant purchase requirements in a volatile price environment.
The following table presents energy commodity derivative fair values as a net asset or (liability) as of
December 31, 2016
that are expected to settle in each respective year (dollars in thousands):
|
|
Purchases
|
Sales
|
|||||||||||||||||||||||||||||
|
|
Electric Derivatives
|
Gas Derivatives
|
Electric Derivatives
|
Gas Derivatives
|
|||||||||||||||||||||||||||
|
Year
|
Physical (1)
|
Financial (1)
|
Physical (1)
|
Financial (1)
|
Physical (1)
|
Financial (1)
|
Physical (1)
|
Financial (1)
|
|||||||||||||||||||||||
|
2017
|
$
|
(4,274
|
)
|
$
|
1,939
|
|
$
|
97
|
|
$
|
(4,005
|
)
|
$
|
(225
|
)
|
$
|
576
|
|
$
|
(2,036
|
)
|
$
|
(3,440
|
)
|
|||||||
|
2018
|
(5,598
|
)
|
—
|
|
—
|
|
(2,170
|
)
|
(33
|
)
|
854
|
|
(910
|
)
|
709
|
|
|||||||||||||||
|
2019
|
(3,123
|
)
|
—
|
|
(235
|
)
|
(3,732
|
)
|
(40
|
)
|
975
|
|
(927
|
)
|
103
|
|
|||||||||||||||
|
2020
|
—
|
|
—
|
|
(266
|
)
|
(370
|
)
|
—
|
|
—
|
|
(1,288
|
)
|
—
|
|
|||||||||||||||
|
2021
|
—
|
|
—
|
|
—
|
|
—
|
|
—
|
|
—
|
|
(869
|
)
|
—
|
|
|||||||||||||||
|
Thereafter
|
—
|
|
—
|
|
—
|
|
—
|
|
—
|
|
—
|
|
—
|
|
—
|
|
|||||||||||||||
The following table presents energy commodity derivative fair values as a net asset or (liability) as of
December 31, 2015
that were expected to settle in each respective year (dollars in thousands):
|
|
Purchases
|
Sales
|
|||||||||||||||||||||||||||||
|
|
Electric Derivatives
|
Gas Derivatives
|
Electric Derivatives
|
Gas Derivatives
|
|||||||||||||||||||||||||||
|
Year
|
Physical (1)
|
Financial (1)
|
Physical (1)
|
Financial (1)
|
Physical (1)
|
Financial (1)
|
Physical (1)
|
Financial (1)
|
|||||||||||||||||||||||
|
2016
|
$
|
(6,928
|
)
|
$
|
(14,988
|
)
|
$
|
(5,895
|
)
|
$
|
(41,006
|
)
|
$
|
82
|
|
$
|
28,857
|
|
$
|
173
|
|
$
|
22,445
|
|
|||||||
|
2017
|
(6,403
|
)
|
36
|
|
(1,050
|
)
|
(9,473
|
)
|
(23
|
)
|
3,971
|
|
(1,125
|
)
|
313
|
|
|||||||||||||||
|
2018
|
(5,614
|
)
|
—
|
|
—
|
|
(3,554
|
)
|
(50
|
)
|
—
|
|
(1,172
|
)
|
(162
|
)
|
|||||||||||||||
|
2019
|
(3,072
|
)
|
—
|
|
(22
|
)
|
(1,964
|
)
|
(44
|
)
|
—
|
|
(1,220
|
)
|
—
|
|
|||||||||||||||
|
2020
|
—
|
|
—
|
|
35
|
|
(18
|
)
|
—
|
|
—
|
|
(1,130
|
)
|
—
|
|
|||||||||||||||
|
Thereafter
|
—
|
|
—
|
|
—
|
|
—
|
|
—
|
|
—
|
|
(679
|
)
|
—
|
|
|||||||||||||||
|
(1)
|
Physical transactions represent commodity transactions where we will take delivery of either electricity or natural gas and financial transactions represent derivative instruments with no physical delivery, such as futures, swaps, options, or forward contracts.
|
The above electric and natural gas derivative contracts will be included in either power supply costs or natural gas supply costs during the period they are delivered and will be included in the various recovery mechanisms (ERM, PCA, and PGAs), or in the general rate case process, and are expected to eventually be collected through retail rates from customers.
See "Item 1. Business – Electric Operations," "Item 1. Business – Natural Gas Operations," and "Item 1A. Risk Factors" for additional discussion of the risks associated with Energy Commodities.
78
Operational Risk
Operational risk involves potential disruption, losses, or excess costs arising from external events or inadequate or failed internal processes, people and systems. Our operations are subject to operational and event risks that include, but are not limited to, those described in "Item 1A. Risk Factors."
To manage operational and event risks, we maintain emergency operating plans, business continuity and disaster recovery plans, maintain insurance coverage against some, but not all, potential losses and seek to negotiate indemnification arrangements with contractors for certain event risks. In addition, we design and follow detailed vegetation management and asset management inspection plans, which help mitigate wildfire and storm event risks, as well as identify utility assets which may be failing and in need of repair or replacement. We also have an Emergency Operating Center, which is a team of employees that plan for and train to deal with potential emergencies or unplanned outages at our facilities, resulting from natural disasters or other events. To prevent unauthorized access to our facilities, we have both physical and cyber security in place.
To address the risk related to fuel cost, availability and delivery restraints, we have an energy resources risk policy, which includes our wholesale energy markets credit policy and control procedures to manage energy commodity price and credit risks. Development of the energy resources risk policy includes planning for sufficient capacity to meet our customer and wholesale energy delivery obligations. See further discussion of the energy resources risk policy above.
Oversight of the operational risk management process is performed by the Environmental, Technology and Operations Committee of our Board of Directors and from senior management with input from each operating department.
Compliance Risk
Compliance risk is the potential consequences of legal or regulatory sanctions or penalties arising from the failure of the Company to comply with requirements of applicable laws, rules and regulations. We have extensive compliance obligations. Our primary compliance risks and obligations include, among others, those described in "Item 1A. Risk Factors."
We mitigate compliance risk through oversight from the Environmental, Technology and Operations Committee and the Audit Committee of our Board of Directors and from senior management. We also have separate Regulatory and Environmental Compliance departments that monitor legislation, regulatory orders and actions to determine the overall potential impact to our Company and develop strategies for complying with the various rules and regulations. We also engage outside attorneys, and consultants, when necessary, to help ensure compliance with laws and regulations.
See "Item 1. Business, Regulatory Issues" through "Item 1. Business, Reliability Standards" and “Environmental Issues and Contingencies” for further discussion of compliance issues that impact our Company.
Technology Risk
Our primary technology risks are described in "Item 1A. Risk Factors."
We mitigate technology risk through trainings and exercises at all levels of the Company. The Environmental, Technology and Operations Committee of our Board of Directors along with senior management are regularly briefed on security policy, programs and incidents. Annual cyber and physical training and testing of employees are included in our enterprise security program as are business continuity testing and data breach response exercises.
Technology governance is led by senior management, which includes new technology strategy, risk planning and major project planning and approval. The technology project management office and enterprise capital planning group provide project cost, timeline and schedule oversight. In addition, there are independent third party audits of our critical infrastructure security program and our business risk security controls.
We have a Technology department dedicated to securing, maintaining, evaluating and developing our information technology systems. There are regular training sessions for the technology and security team. This group also evaluates the Company's technology for obsolescence and makes recommendations for upgrading or replacing systems as necessary. Additionally, this group monitors for intrusion and security events that may include a data breach.
Strategic Risk
Strategic risk relates to the potential impacts resulting from incorrect assumptions about external and internal factors, inappropriate business plans, ineffective business strategy execution, or the failure to respond in a timely manner to changes in the regulatory, macroeconomic or competitive environments. Our primary strategic risks include, among others, those described in "Item 1A. Risk Factors."
79
We mitigate strategic risk through detailed oversight from the Board of Directors and from senior management. We also have a Chief Strategy Officer that leads strategic initiatives, to search for and evaluate opportunities for the Company and makes recommendations to senior management. We not only focus on whether opportunities are financially viable, but also consider whether these opportunities fall within our core policies and our core business strategies. We mitigate our reputational risk primarily through a focus on adherence to our core policies, including our Code of Conduct, maintaining an appropriate Company culture and tone at the top, and through communication and engagement of our external stakeholders.
External Mandates Risk
External mandate risk involves forces outside the Company, which may include significant changes in customer expectations, disruptive technologies that result in obsolescence of our business model and government action that could impact the Company. See "Environmental Issues and Contingencies" and "Forward-Looking Statements" for a discussion of or reference to our external mandates risks.
We mitigate external mandate risk through detailed oversight from the Environmental, Technology and Operations Committee of our Board of Directors and from senior management. We have a Climate Council which meets internally to assess the potential impacts of climate policy to our business and to identify strategies to plan for change. We also have employees dedicated to actively engage and monitor federal, state and local government positions and legislative actions that may affect us or our customers.
To prevent the threat of municipalization, we work to build strong relationships with the communities we serve through, among other things:
|
•
|
communication and involvement with local business leaders and community organizations,
|
|
•
|
providing customers with a multitude of limited income initiatives, including energy fairs, senior outreach and low income workshops, mobile outreach strategy and a Low Income Rate Assistance Plan,
|
|
•
|
tailoring our internal company initiatives to focus on choices for our customers, to increase their overall satisfaction with the Company, and
|
|
•
|
engaging in the legislative process in a manner that fosters the interests of our customers and the communities we serve.
|
The information required by this item is set forth in the Enterprise Risk Management section of "Item 7. Management’s Discussion and Analysis" and is incorporated herein by reference.
The Report of Independent Registered Public Accounting Firm and Financial Statements begin on the next page.
80
REPORT OF INDEPENDENT REGISTERED PUBLIC ACCOUNTING FIRM
To the Board of Directors and Shareholders of
Avista Corporation
Spokane, Washington
We have audited the accompanying consolidated balance sheets of Avista Corporation and subsidiaries (the “Company”) as of December 31, 2016 and 2015, and the related consolidated statements of income, comprehensive income, equity and redeemable noncontrolling interests, and cash flows for each of the three years in the period ended December 31, 2016. These financial statements are the responsibility of the Company’s management. Our responsibility is to express an opinion on these financial statements based on our audits.
We conducted our audits in accordance with the standards of the Public Company Accounting Oversight Board (United States). Those standards require that we plan and perform the audit to obtain reasonable assurance about whether the financial statements are free of material misstatement. An audit includes examining, on a test basis, evidence supporting the amounts and disclosures in the financial statements. An audit also includes assessing the accounting principles used and significant estimates made by management, as well as evaluating the overall financial statement presentation. We believe that our audits provide a reasonable basis for our opinion.
In our opinion, such consolidated financial statements present fairly, in all material respects, the financial position of Avista Corporation and subsidiaries at December 31, 2016 and 2015, and the results of their operations and their cash flows for each of the three years in the period ended December 31, 2016, in conformity with accounting principles generally accepted in the United States of America.
We have also audited, in accordance with the standards of the Public Company Accounting Oversight Board (United States), the Company’s internal control over financial reporting as of December 31, 2016, based on the criteria established in
Internal Control - Integrated Framework (2013)
issued by the Committee of Sponsoring Organizations of the Treadway Commission, and our report, dated February 21, 2017 expressed an unqualified opinion on the Company’s internal control over financial reporting.
/s/ Deloitte & Touche LLP
Seattle, Washington
February 21, 2017
81
CONSOLIDATED STATEMENTS OF INCOME
|
Avista Corporation
|
For the Years Ended December 31
Dollars in thousands, except per share amounts
|
2016
|
2015
|
2014
|
|||||||||
|
Operating Revenues:
|
|||||||||||
|
Utility revenues
|
$
|
1,418,914
|
|
$
|
1,456,091
|
|
$
|
1,433,343
|
|
||
|
Non-utility revenues
|
23,569
|
|
28,685
|
|
39,219
|
|
|||||
|
Total operating revenues
|
1,442,483
|
|
1,484,776
|
|
1,472,562
|
|
|||||
|
Operating Expenses:
|
|||||||||||
|
Utility operating expenses:
|
|||||||||||
|
Resource costs
|
551,366
|
|
656,964
|
|
678,244
|
|
|||||
|
Other operating expenses
|
315,795
|
|
303,221
|
|
286,832
|
|
|||||
|
Depreciation and amortization
|
160,514
|
|
143,499
|
|
129,570
|
|
|||||
|
Taxes other than income taxes
|
98,735
|
|
97,657
|
|
94,300
|
|
|||||
|
Non-utility operating expenses:
|
|||||||||||
|
Other operating expenses
|
25,501
|
|
29,526
|
|
30,418
|
|
|||||
|
Depreciation and amortization
|
769
|
|
695
|
|
610
|
|
|||||
|
Total operating expenses
|
1,152,680
|
|
1,231,562
|
|
1,219,974
|
|
|||||
|
Income from operations
|
289,803
|
|
253,214
|
|
252,588
|
|
|||||
|
Interest expense
|
86,496
|
|
79,968
|
|
75,302
|
|
|||||
|
Interest expense to affiliated trusts
|
634
|
|
473
|
|
450
|
|
|||||
|
Capitalized interest
|
(2,651
|
)
|
(3,546
|
)
|
(3,924
|
)
|
|||||
|
Other income-net
|
(10,078
|
)
|
(9,300
|
)
|
(11,346
|
)
|
|||||
|
Income from continuing operations before income taxes
|
215,402
|
|
185,619
|
|
192,106
|
|
|||||
|
Income tax expense
|
78,086
|
|
67,449
|
|
72,240
|
|
|||||
|
Net income from continuing operations
|
137,316
|
|
118,170
|
|
119,866
|
|
|||||
|
Net income from discontinued operations (Note 5)
|
—
|
|
5,147
|
|
72,411
|
|
|||||
|
Net income
|
137,316
|
|
123,317
|
|
192,277
|
|
|||||
|
Net income attributable to noncontrolling interests
|
(88
|
)
|
(90
|
)
|
(236
|
)
|
|||||
|
Net income attributable to Avista Corp. shareholders
|
$
|
137,228
|
|
$
|
123,227
|
|
$
|
192,041
|
|
||
The Accompanying Notes are an Integral Part of These Statements.
82
CONSOLIDATED STATEMENTS OF INCOME (continued)
|
Avista Corporation
|
For the Years Ended December 31
Dollars in thousands, except per share amounts
|
2016
|
2015
|
2014
|
|||||||||
|
Amounts attributable to Avista Corp. shareholders:
|
|||||||||||
|
Net income from continuing operations
|
$
|
137,228
|
|
$
|
118,080
|
|
$
|
119,817
|
|
||
|
Net income from discontinued operations
|
—
|
|
5,147
|
|
72,224
|
|
|||||
|
Net income attributable to Avista Corp. shareholders
|
$
|
137,228
|
|
$
|
123,227
|
|
$
|
192,041
|
|
||
|
Weighted-average common shares outstanding (thousands), basic
|
63,508
|
|
62,301
|
|
61,632
|
|
|||||
|
Weighted-average common shares outstanding (thousands), diluted
|
63,920
|
|
62,708
|
|
61,887
|
|
|||||
|
Earnings per common share attributable to Avista Corp. shareholders, basic:
|
|||||||||||
|
Earnings per common share from continuing operations
|
$
|
2.16
|
|
$
|
1.90
|
|
$
|
1.94
|
|
||
|
Earnings per common share from discontinued operations
|
—
|
|
0.08
|
|
1.18
|
|
|||||
|
Total earnings per common share attributable to Avista Corp. shareholders, basic
|
$
|
2.16
|
|
$
|
1.98
|
|
$
|
3.12
|
|
||
|
Earnings per common share attributable to Avista Corp. shareholders, diluted:
|
|||||||||||
|
Earnings per common share from continuing operations
|
$
|
2.15
|
|
$
|
1.89
|
|
$
|
1.93
|
|
||
|
Earnings per common share from discontinued operations
|
—
|
|
0.08
|
|
1.17
|
|
|||||
|
Total earnings per common share attributable to Avista Corp. shareholders, diluted
|
$
|
2.15
|
|
$
|
1.97
|
|
$
|
3.10
|
|
||
|
Dividends declared per common share
|
$
|
1.37
|
|
$
|
1.32
|
|
$
|
1.27
|
|
||
The Accompanying Notes are an Integral Part of These Statements.
83
CONSOLIDATED STATEMENTS OF COMPREHENSIVE INCOME
|
Avista Corporation
|
For the Years Ended December 31
Dollars in thousands
|
2016
|
2015
|
2014
|
|||||||||
|
Net income
|
$
|
137,316
|
|
$
|
123,317
|
|
$
|
192,277
|
|
||
|
Other Comprehensive Income (Loss):
|
|||||||||||
|
Unrealized investment gains - net of taxes of $0, $0 and $664, respectively
|
—
|
|
—
|
|
1,126
|
|
|||||
|
Reclassification adjustment for realized gains on investment securities included in net income - net of taxes of $0, $0 and $(1), respectively
|
—
|
|
—
|
|
(2
|
)
|
|||||
|
Reclassification adjustment for realized losses on investment securities included in net income from discontinued operations - net of taxes of $0, $0 and $273, respectively
|
—
|
|
—
|
|
462
|
|
|||||
|
Change in unfunded benefit obligation for pension and other postretirement benefit plans - net of taxes of $(495), $667 and $(1,967), respectively
|
(918
|
)
|
1,238
|
|
(3,655
|
)
|
|||||
|
Total other comprehensive income (loss)
|
(918
|
)
|
1,238
|
|
(2,069
|
)
|
|||||
|
Comprehensive income
|
136,398
|
|
124,555
|
|
190,208
|
|
|||||
|
Comprehensive income attributable to noncontrolling interests
|
(88
|
)
|
(90
|
)
|
(236
|
)
|
|||||
|
Comprehensive income attributable to Avista Corporation shareholders
|
$
|
136,310
|
|
$
|
124,465
|
|
$
|
189,972
|
|
||
The Accompanying Notes are an Integral Part of These Statements.
84
CONSOLIDATED BALANCE SHEETS
|
Avista Corporation
|
As of December 31
Dollars in thousands
|
2016
|
2015
|
||||||
|
Assets:
|
|||||||
|
Current Assets:
|
|||||||
|
Cash and cash equivalents
|
$
|
8,507
|
|
$
|
10,484
|
|
|
|
Accounts and notes receivable-less allowances of $5,026 and $4,530, respectively
|
180,265
|
|
169,413
|
|
|||
|
Regulatory asset for energy commodity derivatives
|
11,365
|
|
17,260
|
|
|||
|
Materials and supplies, fuel stock and stored natural gas
|
53,314
|
|
54,148
|
|
|||
|
Income taxes receivable
|
48,265
|
|
24,121
|
|
|||
|
Other current assets
|
49,625
|
|
30,620
|
|
|||
|
Total current assets
|
351,341
|
|
306,046
|
|
|||
|
Net Utility Property:
|
|||||||
|
Utility plant in service
|
5,506,499
|
|
5,129,192
|
|
|||
|
Construction work in progress
|
150,474
|
|
202,683
|
|
|||
|
Total
|
5,656,973
|
|
5,331,875
|
|
|||
|
Less: Accumulated depreciation and amortization
|
1,509,473
|
|
1,433,286
|
|
|||
|
Total net utility property
|
4,147,500
|
|
3,898,589
|
|
|||
|
Other Non-current Assets:
|
|||||||
|
Investment in affiliated trusts
|
11,547
|
|
11,547
|
|
|||
|
Goodwill
|
57,672
|
|
57,672
|
|
|||
|
Long-term energy contract receivable
|
—
|
|
14,694
|
|
|||
|
Other property and investments-net and other non-current assets
|
72,224
|
|
59,733
|
|
|||
|
Total other non-current assets
|
141,443
|
|
143,646
|
|
|||
|
Deferred Charges:
|
|||||||
|
Regulatory assets for deferred income tax
|
109,853
|
|
101,240
|
|
|||
|
Regulatory assets for pensions and other postretirement benefits
|
240,114
|
|
235,009
|
|
|||
|
Other regulatory assets
|
135,751
|
|
99,798
|
|
|||
|
Regulatory asset for interest rate swaps
|
161,508
|
|
83,973
|
|
|||
|
Non-current regulatory asset for energy commodity derivatives
|
16,919
|
|
32,420
|
|
|||
|
Other deferred charges
|
5,326
|
|
5,928
|
|
|||
|
Total deferred charges
|
669,471
|
|
558,368
|
|
|||
|
Total assets
|
$
|
5,309,755
|
|
$
|
4,906,649
|
|
|
The Accompanying Notes are an Integral Part of These Statements.
85
CONSOLIDATED BALANCE SHEETS (continued)
|
Avista Corporation
|
As of December 31
Dollars in thousands
|
2016
|
2015
|
||||||
|
Liabilities and Equity:
|
|||||||
|
Current Liabilities:
|
|||||||
|
Accounts payable
|
$
|
115,545
|
|
$
|
114,349
|
|
|
|
Current portion of long-term debt and capital leases
|
3,287
|
|
93,167
|
|
|||
|
Short-term borrowings
|
120,000
|
|
105,000
|
|
|||
|
Energy commodity derivative liabilities
|
7,035
|
|
14,268
|
|
|||
|
Accrued interest
|
15,869
|
|
15,378
|
|
|||
|
Accrued taxes other than income taxes
|
33,374
|
|
30,978
|
|
|||
|
Deferred natural gas costs
|
30,820
|
|
17,880
|
|
|||
|
Current portion of pensions and other postretirement benefits
|
10,994
|
|
10,233
|
|
|||
|
Other current liabilities
|
70,604
|
|
73,427
|
|
|||
|
Total current liabilities
|
407,528
|
|
474,680
|
|
|||
|
Long-term debt and capital leases
|
1,678,717
|
|
1,480,111
|
|
|||
|
Long-term debt to affiliated trusts
|
51,547
|
|
51,547
|
|
|||
|
Regulatory liability for utility plant retirement costs
|
273,983
|
|
261,594
|
|
|||
|
Pensions and other postretirement benefits
|
226,552
|
|
201,453
|
|
|||
|
Deferred income taxes
|
840,928
|
|
747,477
|
|
|||
|
Non-current interest rate swap derivative liabilities
|
28,705
|
|
30,679
|
|
|||
|
Other non-current liabilities, regulatory liabilities and deferred credits
|
153,319
|
|
130,821
|
|
|||
|
Total liabilities
|
3,661,279
|
|
3,378,362
|
|
|||
|
Commitments and Contingencies (See Notes to Consolidated Financial Statements)
|
|
|
|||||
|
Equity:
|
|||||||
|
Avista Corporation Shareholders’ Equity:
|
|||||||
|
Common stock, no par value; 200,000,000 shares authorized; 64,187,934 and 62,312,651 shares issued and outstanding as of December 31, 2016 and December 31, 2015, respectively
|
1,075,281
|
|
1,004,336
|
|
|||
|
Accumulated other comprehensive loss
|
(7,568
|
)
|
(6,650
|
)
|
|||
|
Retained earnings
|
581,014
|
|
530,940
|
|
|||
|
Total Avista Corporation shareholders’ equity
|
1,648,727
|
|
1,528,626
|
|
|||
|
Noncontrolling Interests
|
(251
|
)
|
(339
|
)
|
|||
|
Total equity
|
1,648,476
|
|
1,528,287
|
|
|||
|
Total liabilities and equity
|
$
|
5,309,755
|
|
$
|
4,906,649
|
|
|
The Accompanying Notes are an Integral Part of These Statements.
86
CONSOLIDATED STATEMENTS OF CASH FLOWS
|
Avista Corporation
|
For the Years Ended December 31
Dollars in thousands
|
2016
|
2015
|
2014
|
|||||||||
|
Operating Activities:
|
|||||||||||
|
Net income
|
$
|
137,316
|
|
$
|
123,317
|
|
$
|
192,277
|
|
||
|
Non-cash items included in net income:
|
|||||||||||
|
Depreciation and amortization
|
164,925
|
|
147,835
|
|
138,337
|
|
|||||
|
Provision for deferred income taxes
|
124,543
|
|
51,801
|
|
144,269
|
|
|||||
|
Power and natural gas cost amortizations (deferrals), net
|
16,835
|
|
21,358
|
|
(14,821
|
)
|
|||||
|
Amortization of debt expense
|
3,477
|
|
3,526
|
|
3,692
|
|
|||||
|
Amortization of investment in exchange power
|
2,450
|
|
2,450
|
|
2,450
|
|
|||||
|
Stock-based compensation expense
|
7,891
|
|
6,914
|
|
8,114
|
|
|||||
|
Equity-related AFUDC
|
(8,475
|
)
|
(8,331
|
)
|
(8,808
|
)
|
|||||
|
Pension and other postretirement benefit expense
|
38,786
|
|
37,050
|
|
22,943
|
|
|||||
|
Amortization of Spokane Energy contract
|
14,694
|
|
13,508
|
|
12,417
|
|
|||||
|
Gain on sale of Ecova
|
—
|
|
(777
|
)
|
(160,612
|
)
|
|||||
|
Other regulatory assets and liabilities and deferred debits and credits
|
(26,245
|
)
|
4,569
|
|
7,906
|
|
|||||
|
Change in decoupling regulatory deferral
|
(29,789
|
)
|
(10,933
|
)
|
—
|
|
|||||
|
Other
|
5,557
|
|
(517
|
)
|
1,103
|
|
|||||
|
Contributions to defined benefit pension plan
|
(12,000
|
)
|
(12,000
|
)
|
(32,000
|
)
|
|||||
|
Cash paid for settlement of interest rate swap derivatives
|
(53,966
|
)
|
—
|
|
—
|
|
|||||
|
Changes in certain current assets and liabilities:
|
|||||||||||
|
Accounts and notes receivable
|
(17,170
|
)
|
(10,538
|
)
|
16,425
|
|
|||||
|
Materials and supplies, fuel stock and stored natural gas
|
834
|
|
12,208
|
|
(19,394
|
)
|
|||||
|
Collateral posted for derivative instruments
|
10,712
|
|
(13,301
|
)
|
(23,301
|
)
|
|||||
|
Income taxes receivable
|
(33,923
|
)
|
19,772
|
|
(36,110
|
)
|
|||||
|
Other current assets
|
(3,907
|
)
|
2,338
|
|
(7,117
|
)
|
|||||
|
Accounts payable
|
5,176
|
|
(8,138
|
)
|
(12,562
|
)
|
|||||
|
Other current liabilities
|
10,546
|
|
(6,471
|
)
|
32,060
|
|
|||||
|
Net cash provided by operating activities
|
358,267
|
|
375,640
|
|
267,268
|
|
|||||
|
Investing Activities:
|
|||||||||||
|
Utility property capital expenditures (excluding equity-related AFUDC)
|
(406,644
|
)
|
(393,425
|
)
|
(325,516
|
)
|
|||||
|
Other capital expenditures
|
(353
|
)
|
(885
|
)
|
(6,427
|
)
|
|||||
|
Cash received (paid) in acquisition, net
|
—
|
|
(95
|
)
|
15,007
|
|
|||||
|
Issuance of notes receivable at subsidiaries
|
(10,094
|
)
|
(2,307
|
)
|
(1,200
|
)
|
|||||
|
Repayments from notes receivable at subsidiaries
|
5,000
|
|
—
|
|
—
|
|
|||||
|
Investments made by subsidiaries
|
(13,097
|
)
|
(1,944
|
)
|
(1,072
|
)
|
|||||
|
Increase in funds held for clients
|
—
|
|
—
|
|
(18,931
|
)
|
|||||
|
Purchase of securities available for sale
|
—
|
|
—
|
|
(12,267
|
)
|
|||||
|
Sale and maturity of securities available for sale
|
—
|
|
—
|
|
14,612
|
|
|||||
|
Proceeds from sale of Ecova, net of cash sold
|
—
|
|
13,856
|
|
229,903
|
|
|||||
|
Other
|
(7,278
|
)
|
(3,027
|
)
|
2,155
|
|
|||||
|
Net cash used in investing activities
|
$
|
(432,466
|
)
|
$
|
(387,827
|
)
|
$
|
(103,736
|
)
|
||
The Accompanying Notes are an Integral Part of These Statements.
87
CONSOLIDATED STATEMENTS OF CASH FLOWS (continued)
|
Avista Corporation
|
For the Years Ended December 31
Dollars in thousands
|
2016
|
2015
|
2014
|
|||||||||
|
Financing Activities:
|
|||||||||||
|
Net increase (decrease) in borrowings from committed line of credit
|
$
|
15,000
|
|
$
|
—
|
|
$
|
(66,000
|
)
|
||
|
Repayment of borrowings from Ecova line of credit
|
—
|
|
—
|
|
(46,000
|
)
|
|||||
|
Proceeds from issuance of long-term debt
|
245,000
|
|
100,000
|
|
150,000
|
|
|||||
|
Redemption and maturity of long-term debt and capital leases
|
(163,167
|
)
|
(2,905
|
)
|
(39,971
|
)
|
|||||
|
Maturity of nonrecourse long-term debt of Spokane Energy
|
—
|
|
(1,431
|
)
|
(16,407
|
)
|
|||||
|
Issuance of common stock, net of issuance costs
|
66,953
|
|
1,560
|
|
4,060
|
|
|||||
|
Repurchase of common stock
|
—
|
|
(2,920
|
)
|
(79,856
|
)
|
|||||
|
Cash dividends paid
|
(87,154
|
)
|
(82,397
|
)
|
(78,314
|
)
|
|||||
|
Increase in client fund obligations
|
—
|
|
—
|
|
16,216
|
|
|||||
|
Payment to noncontrolling interests for sale of Ecova
|
—
|
|
—
|
|
(54,179
|
)
|
|||||
|
Payment to option holders and redeemable noncontrolling interests for sale of Ecova
|
—
|
|
—
|
|
(20,871
|
)
|
|||||
|
Other
|
(4,410
|
)
|
(11,379
|
)
|
7,359
|
|
|||||
|
Net cash provided by (used in) financing activities
|
72,222
|
|
528
|
|
(223,963
|
)
|
|||||
|
Net decrease in cash and cash equivalents
|
(1,977
|
)
|
(11,659
|
)
|
(60,431
|
)
|
|||||
|
Cash and cash equivalents at beginning of year
|
10,484
|
|
22,143
|
|
82,574
|
|
|||||
|
Cash and cash equivalents at end of year
|
$
|
8,507
|
|
$
|
10,484
|
|
$
|
22,143
|
|
||
|
Supplemental Cash Flow Information:
|
|||||||||||
|
Cash paid (received) during the year:
|
|||||||||||
|
Interest
|
$
|
86,319
|
|
$
|
79,673
|
|
$
|
73,526
|
|
||
|
Income taxes (net of total refunds of $18,861, $37,200 and $35,573, respectively)
|
(13,458
|
)
|
(9,961
|
)
|
45,416
|
|
|||||
|
Non-cash financing and investing activities:
|
|||||||||||
|
Accounts payable for capital expenditures
|
30,252
|
|
35,248
|
|
26,959
|
|
|||||
|
Valuation adjustment for redeemable noncontrolling interests
|
—
|
|
—
|
|
(15,873
|
)
|
|||||
|
Receivable for escrow amounts associated with the sale of Ecova
|
—
|
|
—
|
|
13,079
|
|
|||||
|
Non-cash stock issuance for acquisition of AERC
|
—
|
|
—
|
|
150,119
|
|
|||||
The Accompanying Notes are an Integral Part of These Statements.
88
CONSOLIDATED STATEMENTS OF EQUITY AND REDEEMABLE NONCONTROLLING INTERESTS
|
Avista Corporation
|
For the Years Ended December 31
Dollars in thousands
|
2016
|
2015
|
2014
|
|||||||||
|
Common Stock, Shares:
|
|||||||||||
|
Shares outstanding at beginning of year
|
62,312,651
|
|
62,243,374
|
|
60,076,752
|
|
|||||
|
Shares issued through equity compensation plans
|
203,727
|
|
125,620
|
|
51,127
|
|
|||||
|
Shares issued through Employee Investment Plan (401-K)
|
26,556
|
|
33,057
|
|
33,168
|
|
|||||
|
Shares issued through Dividend Reinvestment Plan
|
—
|
|
—
|
|
110,501
|
|
|||||
|
Shares issued through sales agency agreements
|
1,645,000
|
|
—
|
|
—
|
|
|||||
|
Shares issued for acquisition
|
—
|
|
—
|
|
4,501,441
|
|
|||||
|
Shares repurchased
|
—
|
|
(89,400
|
)
|
(2,529,615
|
)
|
|||||
|
Shares outstanding at end of year
|
64,187,934
|
|
62,312,651
|
|
62,243,374
|
|
|||||
|
Common Stock, Amount:
|
|||||||||||
|
Balance at beginning of year
|
$
|
1,004,336
|
|
$
|
999,960
|
|
$
|
896,993
|
|
||
|
Equity compensation expense
|
7,065
|
|
6,035
|
|
7,676
|
|
|||||
|
Issuance of common stock through equity compensation plans
|
624
|
|
462
|
|
108
|
|
|||||
|
Issuance of common stock through Employee Investment Plan (401-K)
|
1,061
|
|
1,099
|
|
1,005
|
|
|||||
|
Issuance of common stock through Dividend Reinvestment Plan
|
—
|
|
—
|
|
3,441
|
|
|||||
|
Issuance of common stock through sales agency agreements, net of issuance costs
|
65,267
|
|
—
|
|
—
|
|
|||||
|
Issuance of common stock for acquisition, net of issuance costs
|
—
|
|
—
|
|
149,625
|
|
|||||
|
Payment of minimum tax withholdings for share-based payment awards
|
(3,072
|
)
|
(1,832
|
)
|
—
|
|
|||||
|
Repurchase of common stock
|
—
|
|
(1,431
|
)
|
(40,486
|
)
|
|||||
|
Equity transactions of consolidated subsidiaries
|
—
|
|
—
|
|
(1,062
|
)
|
|||||
|
Payment to option holders and redeemable noncontrolling interests for sale of Ecova
|
—
|
|
—
|
|
(20,871
|
)
|
|||||
|
Excess tax benefits
|
—
|
|
43
|
|
3,531
|
|
|||||
|
Balance at end of year
|
1,075,281
|
|
1,004,336
|
|
999,960
|
|
|||||
|
Accumulated Other Comprehensive Loss:
|
|||||||||||
|
Balance at beginning of year
|
(6,650
|
)
|
(7,888
|
)
|
(5,819
|
)
|
|||||
|
Other comprehensive income (loss)
|
(918
|
)
|
1,238
|
|
(2,069
|
)
|
|||||
|
Balance at end of year
|
(7,568
|
)
|
(6,650
|
)
|
(7,888
|
)
|
|||||
|
Retained Earnings:
|
|||||||||||
|
Balance at beginning of year
|
530,940
|
|
491,599
|
|
407,092
|
|
|||||
|
Net income attributable to Avista Corporation shareholders
|
137,228
|
|
123,227
|
|
192,041
|
|
|||||
|
Cash dividends paid (common stock)
|
(87,154
|
)
|
(82,397
|
)
|
(78,314
|
)
|
|||||
|
Repurchase of common stock
|
—
|
|
(1,489
|
)
|
(39,370
|
)
|
|||||
|
Valuation adjustments and other noncontrolling interests activity
|
—
|
|
—
|
|
10,150
|
|
|||||
|
Balance at end of year
|
581,014
|
|
530,940
|
|
491,599
|
|
|||||
|
Total Avista Corporation shareholders’ equity
|
$
|
1,648,727
|
|
$
|
1,528,626
|
|
$
|
1,483,671
|
|
||
The Accompanying Notes are an Integral Part of These Statements.
89
CONSOLIDATED STATEMENTS OF EQUITY AND REDEEMABLE NONCONTROLLING INTERESTS (continued)
|
Avista Corporation
|
For the Years Ended December 31
Dollars in thousands
|
2016
|
2015
|
2014
|
|||||||||
|
Noncontrolling Interests:
|
|||||||||||
|
Balance at beginning of year
|
$
|
(339
|
)
|
$
|
(429
|
)
|
$
|
20,001
|
|
||
|
Net income attributable to noncontrolling interests
|
88
|
|
90
|
|
240
|
|
|||||
|
Deconsolidation of noncontrolling interests related to sale of Ecova
|
—
|
|
—
|
|
(23,612
|
)
|
|||||
|
Other
|
—
|
|
—
|
|
2,942
|
|
|||||
|
Balance at end of year
|
(251
|
)
|
(339
|
)
|
(429
|
)
|
|||||
|
Total equity
|
$
|
1,648,476
|
|
$
|
1,528,287
|
|
$
|
1,483,242
|
|
||
|
Redeemable Noncontrolling Interests:
|
|||||||||||
|
Balance at beginning of year
|
$
|
—
|
|
$
|
—
|
|
$
|
15,889
|
|
||
|
Net income attributable to noncontrolling interests
|
—
|
|
—
|
|
(4
|
)
|
|||||
|
Purchase of subsidiary noncontrolling interests
|
—
|
|
—
|
|
(12
|
)
|
|||||
|
Valuation adjustments and other noncontrolling interests activity
|
—
|
|
—
|
|
(15,873
|
)
|
|||||
|
Balance at end of year
|
$
|
—
|
|
$
|
—
|
|
$
|
—
|
|
||
The Accompanying Notes are an Integral Part of These Statements.
90
|
NOTES TO CONSOLIDATED FINANCIAL STATEMENTS
|
Nature of Business
Avista Corp. is primarily an electric and natural gas utility with certain other business ventures. Avista Utilities is an operating division of Avista Corp., comprising the regulated utility operations in the Pacific Northwest. Avista Utilities provides electric distribution and transmission, and natural gas distribution services in parts of eastern Washington and northern Idaho. Avista Utilities also provides natural gas distribution service in parts of northeastern and southwestern Oregon. Avista Utilities has electric generating facilities in Washington, Idaho, Oregon and Montana. Avista Utilities also supplies electricity to a small number of customers in Montana, most of whom are employees who operate Avista Utilities' Noxon Rapids generating facility.
AERC is a wholly-owned subsidiary of Avista Corp. The primary subsidiary of AERC is AEL&P, which comprises Avista Corp.'s regulated utility operations in Alaska. AERC was acquired by Avista Corp. on July 1, 2014 and there are no AERC earnings included in the overall results of Avista Corp. prior to that date. See Note 4 for information regarding the acquisition of AERC.
Avista Capital, a wholly owned non-regulated subsidiary of Avista Corp., is the parent company of all of the subsidiary companies in the non-utility businesses, with the exception of AJT Mining Properties, which is a subsidiary of AERC. During the first half of 2014 and prior, Avista Capital’s subsidiaries included Ecova, which was an
80.2 percent
owned subsidiary prior to its disposition on June 30, 2014. See Note 5 for information regarding the disposition of Ecova and Note 21 for business segment information.
Basis of Reporting
The consolidated financial statements include the assets, liabilities, revenues and expenses of the Company and its subsidiaries and other majority owned subsidiaries and variable interest entities for which the Company or its subsidiaries are the primary beneficiaries. Ecova's revenues and expenses are included in the Consolidated Statements of Income in discontinued operations; however, as of June 30, 2014 and for all subsequent reporting periods there are no balance sheet amounts included for Ecova. All tables throughout the Notes to Consolidated Financial Statements that present information related to the Consolidated Statements of Income were revised to include only the amounts from continuing operations. Intercompany balances were eliminated in consolidation. The accompanying consolidated financial statements include the Company’s proportionate share of utility plant and related operations resulting from its interests in jointly owned plants (see Note 7).
Use of Estimates
The preparation of the consolidated financial statements in conformity with GAAP requires management to make estimates and assumptions that affect the amounts reported for assets and liabilities and the disclosure of contingent assets and liabilities at the date of the financial statements and the reported amounts of revenues and expenses during the reporting period. Significant estimates include:
|
•
|
determining the market value of energy commodity derivative assets and liabilities,
|
|
•
|
pension and other postretirement benefit plan obligations,
|
|
•
|
contingent liabilities,
|
|
•
|
goodwill impairment testing,
|
|
•
|
recoverability of regulatory assets, and
|
|
•
|
unbilled revenues.
|
Changes in these estimates and assumptions are considered reasonably possible and may have a material effect on the consolidated financial statements and thus actual results could differ from the amounts reported and disclosed herein.
System of Accounts
The accounting records of the Company’s utility operations are maintained in accordance with the uniform system of accounts prescribed by the FERC and adopted by the state regulatory commissions in Washington, Idaho, Montana, Oregon and Alaska.
91
Regulation
The Company is subject to state regulation in Washington, Idaho, Montana, Oregon and Alaska. The Company is also subject to federal regulation primarily by the FERC, as well as various other federal agencies with regulatory oversight of particular aspects of its operations.
Utility Revenues
Utility revenues related to the sale of energy are recorded when service is rendered or energy is delivered to customers. Revenues and resource costs from Avista Utilities’ settled energy contracts that are “booked out” (not physically delivered) are reported on a net basis as part of utility revenues. AEL&P does not have booked out transactions. The determination of the energy sales to individual customers is based on the reading of their meters, which occurs on a systematic basis throughout the month. At the end of each calendar month, the amount of energy delivered to customers since the date of the last meter reading is estimated and the corresponding unbilled revenue is estimated and recorded. Our estimate of unbilled revenue is based on:
|
•
|
the number of customers,
|
|
•
|
current rates,
|
|
•
|
meter reading dates,
|
|
•
|
actual native load for electricity,
|
|
•
|
actual throughput for natural gas, and
|
|
•
|
electric line losses and natural gas system losses.
|
Any difference between actual and estimated revenue is automatically corrected in the following month when the actual meter reading and customer billing occurs.
Accounts receivable includes unbilled energy revenues of the following amounts as of
December 31
(dollars in thousands):
|
2016
|
2015
|
||||||
|
Unbilled accounts receivable
|
$
|
72,377
|
|
$
|
62,003
|
|
|
Other Non-Utility Revenues
Revenues from the other businesses are primarily derived from the operations of AM&D, doing business as METALfx, and are recognized when the risk of loss transfers to the customer, which occurs when products are shipped. In addition, prior to Spokane Energy's dissolution in 2015, there were revenues at Spokane Energy related to a long-term fixed rate electric capacity contract. This contract was transferred to Avista Corp. during the second quarter of 2015 and the revenues from this contract subsequent to the transfer are included in utility revenues.
Depreciation
For utility operations, depreciation expense is estimated by a method of depreciation accounting utilizing composite rates for utility plant. Such rates are designed to provide for retirements of properties at the expiration of their service lives. For utility operations, the ratio of depreciation provisions to average depreciable property was as follows for the years ended
December 31
:
|
2016
|
2015
|
2014
|
||||||
|
Avista Utilities
|
||||||||
|
Ratio of depreciation to average depreciable property
|
3.11
|
%
|
3.09
|
%
|
2.97
|
%
|
||
|
Alaska Electric Light and Power Company
|
||||||||
|
Ratio of depreciation to average depreciable property
|
2.39
|
%
|
2.42
|
%
|
2.43
|
%
|
||
92
The average service lives for the following broad categories of utility plant in service are (in years):
|
Avista Utilities
|
Alaska Electric Light and Power Company
|
||
|
Electric thermal/other production
|
41
|
41
|
|
|
Hydroelectric production
|
78
|
42
|
|
|
Electric transmission
|
57
|
41
|
|
|
Electric distribution
|
35
|
40
|
|
|
Natural gas distribution property
|
45
|
N/A
|
|
|
Other shorter-lived general plant
|
9
|
15
|
|
Taxes Other Than Income Taxes
Taxes other than income taxes include state excise taxes, city occupational and franchise taxes, real and personal property taxes and certain other taxes not based on income. These taxes are generally based on revenues or the value of property. Utility related taxes collected from customers (primarily state excise taxes and city utility taxes) are recorded as operating revenue and expense. Taxes other than income taxes consisted of the following items for the years ended
December 31
(dollars in thousands):
|
2016
|
2015
|
2014
|
|||||||||
|
Utility related taxes
|
$
|
57,745
|
|
$
|
59,173
|
|
$
|
58,250
|
|
||
|
Property taxes
|
38,505
|
|
35,948
|
|
33,932
|
|
|||||
|
Other taxes
|
2,485
|
|
2,536
|
|
2,118
|
|
|||||
|
Total
|
$
|
98,735
|
|
$
|
97,657
|
|
$
|
94,300
|
|
||
Allowance for Funds Used During Construction
AFUDC represents the cost of both the debt and equity funds used to finance utility plant additions during the construction period. As prescribed by regulatory authorities, AFUDC is capitalized as a part of the cost of utility plant. The debt component of AFUDC is credited against total interest expense in the Consolidated Statements of Income in the line item “capitalized interest.” The equity component of AFUDC is included in the Consolidated Statement of Income in the line item “other income-net.” The Company is permitted, under established regulatory rate practices, to recover the capitalized AFUDC, and a reasonable return thereon, through its inclusion in rate base and the provision for depreciation after the related utility plant is placed in service. Cash inflow related to AFUDC does not occur until the related utility plant is placed in service and included in rate base. The effective AFUDC rate was the following for the years ended
December 31
:
|
2016
|
2015
|
2014
|
||||||
|
Avista Utilities
|
||||||||
|
Effective AFUDC rate
|
7.29
|
%
|
7.32
|
%
|
7.64
|
%
|
||
|
Alaska Electric Light and Power Company
|
||||||||
|
Effective AFUDC rate
|
9.40
|
%
|
9.31
|
%
|
10.37
|
%
|
||
Income Taxes
Deferred income tax assets represent future income tax deductions the Company expects to utilize in future tax returns to reduce taxable income. Deferred income tax liabilities represent future taxable income the Company expects to recognize in future tax returns. Deferred tax assets and liabilities arise when there are temporary differences resulting from differing treatment of items for tax and accounting purposes (such as depreciation). A deferred income tax asset or liability is determined based on the enacted tax rates that will be in effect when the temporary differences between the financial statement carrying amounts and tax basis of existing assets and liabilities are expected to be reported in the Company’s consolidated income tax returns. The deferred income tax expense for the period is equal to the net change in the deferred income tax asset and liability accounts from the beginning to the end of the period. The effect on deferred income taxes from a change in tax rates is recognized in income in the period that includes the enactment date unless a regulatory order specifies deferral of the effect of the change in tax rates over a longer period of time. The Company establishes a valuation allowance when it is more likely than not that all, or a portion, of a deferred tax asset will not be realized. Deferred income tax liabilities and regulatory assets are established for income tax benefits flowed through to customers. The Company did not incur any penalties on income tax
93
positions in
2016
,
2015
or
2014
. The Company would recognize interest accrued related to income tax positions as interest expense and any penalties incurred as other operating expense.
Stock-Based Compensation
The Company currently issues three types of stock-based compensation awards - restricted shares, market-based awards and performance-based awards. Historically, these stock compensation awards have not been material to the Company's overall financial results. Compensation cost relating to share-based payment transactions is recognized in the Company’s financial statements based on the fair value of the equity or liability instruments issued and recorded over the requisite service period.
The Company recorded stock-based compensation expense (included in other operating expenses) and income tax benefits in the Consolidated Statements of Income of the following amounts for the
years ended December 31
(dollars in thousands):
|
2016
|
2015
|
2014
|
|||||||||
|
Stock-based compensation expense
|
$
|
7,891
|
|
$
|
6,914
|
|
$
|
6,007
|
|
||
|
Income tax benefits (1)
|
4,359
|
|
2,420
|
|
2,102
|
|
|||||
|
(1)
|
Income tax benefits for 2016 include
$1.6 million
associated with excess tax benefits on settled share-based employee payments. The excess tax benefits were recognized in the Statement of Income for 2016 due to the adoption of ASU 2016-09, effective January 1, 2016. See Note 2 for further discussion.
|
Restricted share awards vest in equal thirds each year over a
three
-year period and are payable in Avista Corp. common stock at the end of each year if the service condition is met. In addition to the service condition, the Company must meet a return on equity target in order for the Chief Executive Officer's restricted shares to vest. Restricted stock is valued at the close of market of the Company’s common stock on the grant date.
Total Shareholder Return (TSR) awards are market-based awards and Cumulative Earnings Per Share (CEPS) awards are performance awards. CEPS awards were first granted in 2014. Both types of awards vest after a period of
three
years and are payable in cash or Avista Corp. common stock at the end of the three-year period. The method of settlement is at the discretion of the Company and historically the Company has settled these awards through issuance of Avista Corp. common stock and intends to continue this practice. Both types of awards entitle the recipients to dividend equivalent rights, are subject to forfeiture under certain circumstances, and are subject to meeting specific market or performance conditions. Based on the level of attainment of the market or performance conditions, the amount of cash paid or common stock issued will range from
0
to
200 percent
of the initial awards granted. Dividend equivalent rights are accumulated and paid out only on shares that eventually vest and have met the market and performance conditions.
For both the TSR awards and the CEPS awards, the Company accounts for them as equity awards and compensation cost for these awards is recognized over the requisite service period, provided that the requisite service period is rendered. For TSR awards, if the market condition is not met at the end of the three-year service period, there will be no change in the cumulative amount of compensation cost recognized, since the awards are still considered vested even though the market metric was not met. For CEPS awards, at the end of the three-year service period, if the internal performance metric of cumulative earnings per share is not met, all compensation cost for these awards is reversed as these awards are not considered vested.
The fair value of each TSR award is estimated on the date of grant using a statistical model that incorporates the probability of meeting the market targets based on historical returns relative to a peer group. The estimated fair value of the equity component of CEPS awards was estimated on the date of grant as the share price of Avista Corp. common stock on the date of grant, less the net present value of the estimated dividends over the three-year period.
94
The following table summarizes the number of grants, vested and unvested shares, earned shares (based on market metrics), and other pertinent information related to the Company's stock compensation awards for the years ended December 31:
|
2016
|
2015
|
2014
|
|||||||||
|
Restricted Shares
|
|||||||||||
|
Shares granted during the year
|
58,610
|
|
58,302
|
|
62,075
|
|
|||||
|
Shares vested during the year
|
(52,385
|
)
|
(60,379
|
)
|
(52,899
|
)
|
|||||
|
Unvested shares at end of year
|
109,806
|
|
106,091
|
|
112,042
|
|
|||||
|
Unrecognized compensation expense at end of year (in thousands)
|
$
|
1,853
|
|
$
|
1,705
|
|
$
|
1,349
|
|
||
|
TSR Awards
|
|||||||||||
|
TSR shares granted during the year
|
116,435
|
|
116,435
|
|
117,550
|
|
|||||
|
TSR shares vested during the year
|
(111,665
|
)
|
(171,334
|
)
|
(167,584
|
)
|
|||||
|
TSR shares earned based on market metrics
|
132,887
|
|
222,734
|
|
97,199
|
|
|||||
|
Unvested TSR shares at end of year
|
222,228
|
|
223,697
|
|
287,834
|
|
|||||
|
Unrecognized compensation expense (in thousands)
|
$
|
3,409
|
|
$
|
3,219
|
|
$
|
2,833
|
|
||
|
CEPS Awards
|
|||||||||||
|
CEPS shares granted during the year
|
57,521
|
|
58,259
|
|
59,025
|
|
|||||
|
CEPS shares vested during the year
|
(55,835
|
)
|
—
|
|
—
|
|
|||||
|
CEPS shares earned based on market metrics
|
90,460
|
|
—
|
|
—
|
|
|||||
|
Unvested CEPS shares at end of year
|
110,452
|
|
111,887
|
|
58,017
|
|
|||||
|
Unrecognized compensation expense (in thousands)
|
$
|
1,671
|
|
$
|
1,840
|
|
$
|
1,577
|
|
||
Outstanding TSR and CEPS share awards include a dividend component that is paid in cash. This component of the share grants is accounted for as a liability award. These liability awards are revalued on a quarterly basis taking into account the number of awards outstanding, historical dividend rate, the change in the value of the Company’s common stock relative to an external benchmark (TSR awards only) and the amount of CEPS earned to date compared to estimated CEPS over the performance period (CEPS awards only). Over the life of these awards, the cumulative amount of compensation expense recognized will match the actual cash paid. As of
December 31, 2016
and
2015
, the Company had recognized cumulative compensation expense and a liability of
$1.5 million
, respectively, related to the dividend component on the outstanding and unvested share grants.
Other Income - Net
Other Income - net consisted of the following items for the years ended December 31 (dollars in thousands):
|
2016
|
2015
|
2014
|
|||||||||
|
Interest income
|
$
|
1,823
|
|
$
|
653
|
|
$
|
987
|
|
||
|
Interest on regulatory deferrals
|
1,308
|
|
48
|
|
220
|
|
|||||
|
Equity-related AFUDC
|
8,475
|
|
8,331
|
|
8,808
|
|
|||||
|
Net gain (loss) on investments
|
(2,152
|
)
|
(637
|
)
|
276
|
|
|||||
|
Other income
|
624
|
|
905
|
|
1,055
|
|
|||||
|
Total
|
$
|
10,078
|
|
$
|
9,300
|
|
$
|
11,346
|
|
||
Earnings per Common Share Attributable to Avista Corporation Shareholders
Basic earnings per common share attributable to Avista Corp. shareholders is computed by dividing net income attributable to Avista Corp. shareholders by the weighted-average number of common shares outstanding for the period. Diluted earnings per common share attributable to Avista Corp. shareholders is calculated by dividing net income attributable to Avista Corp. shareholders (adjusted for the effect of potentially dilutive securities issued to noncontrolling interests by the Company's subsidiaries) by diluted weighted-average common shares outstanding during the period, including common stock equivalent shares outstanding using the treasury stock method, unless such shares are anti-dilutive. Common stock equivalent shares include shares issuable upon exercise of stock options and contingent stock awards. See Note 18 for earnings per common share calculations.
95
Cash and Cash Equivalents
For the purposes of the Consolidated Statements of Cash Flows, the Company considers all temporary investments with a maturity of three months or less when purchased to be cash equivalents.
Allowance for Doubtful Accounts
The Company maintains an allowance for doubtful accounts to provide for estimated and potential losses on accounts receivable. The Company determines the allowance for utility and other customer accounts receivable based on historical write-offs as compared to accounts receivable and operating revenues. Additionally, the Company establishes specific allowances for certain individual accounts. The following table presents the activity in the allowance for doubtful accounts during the years ended
December 31
(dollars in thousands):
|
2016
|
2015
|
2014
|
|||||||||
|
Allowance as of the beginning of the year
|
$
|
4,530
|
|
$
|
4,888
|
|
$
|
44,309
|
|
||
|
Additions expensed during the year
|
6,053
|
|
5,802
|
|
5,296
|
|
|||||
|
Net deductions (1)
|
(5,557
|
)
|
(6,160
|
)
|
(44,717
|
)
|
|||||
|
Allowance as of the end of the year
|
$
|
5,026
|
|
$
|
4,530
|
|
$
|
4,888
|
|
||
|
(1)
|
During 2014, the Company received
$15.0 million
in gross proceeds related to the settlement of its California wholesale power markets litigation. The gross proceeds effectively settled all outstanding receivables and payables at Avista Energy (which had been fully reserved against since 2001). As a result of the settlement, the Company reversed
$15.0 million
of the allowance, which was recorded as a reduction to non-utility other operating expenses on the Consolidated Statements of Income, and the remainder of the receivables, payables and allowance of
$24.5 million
were removed from the Consolidated Balance Sheets (and had no effect on net income).
|
Materials and Supplies, Fuel Stock and Stored Natural Gas
Inventories of materials and supplies, fuel stock and stored natural gas are recorded at average cost for our regulated operations and the lower of cost or market for our non-regulated operations and consisted of the following as of
December 31
(dollars in thousands):
|
2016
|
2015
|
||||||
|
Materials and supplies
|
$
|
40,700
|
|
$
|
37,101
|
|
|
|
Fuel stock
|
4,585
|
|
4,273
|
|
|||
|
Stored natural gas
|
8,029
|
|
12,774
|
|
|||
|
Total
|
$
|
53,314
|
|
$
|
54,148
|
|
|
Utility Plant in Service
The cost of additions to utility plant in service, including an allowance for funds used during construction and replacements of units of property and improvements, is capitalized. The cost of depreciable units of property retired plus the cost of removal less salvage is charged to accumulated depreciation.
Asset Retirement Obligations
The Company records the fair value of a liability for an ARO in the period in which it is incurred. When the liability is initially recorded, the associated costs of the ARO are capitalized as part of the carrying amount of the related long-lived asset. The liability is accreted to its present value each period and the related capitalized costs are depreciated over the useful life of the related asset. In addition, if there are changes in the estimated timing or estimated costs of the AROs, adjustments are recorded during the period new information becomes available as an increase or decrease to the liability, with the offset recorded to the related long-lived asset. Upon retirement of the asset, the Company either settles the ARO for its recorded amount or incurs a gain or loss. The Company records regulatory assets and liabilities for the difference between asset retirement costs currently recovered in rates and AROs recorded since asset retirement costs are recovered through rates charged to customers (see Note 9 for further discussion of the Company's asset retirement obligations).
96
The Company recovers certain asset retirement costs through rates charged to customers as a portion of its depreciation expense for which the Company has not recorded asset retirement obligations. The Company has recorded the amount of estimated retirement costs collected from customers (that do not represent legal or contractual obligations) and included them as a regulatory liability on the Consolidated Balance Sheets in the following amounts as of
December 31
(dollars in thousands):
|
2016
|
2015
|
||||||
|
Regulatory liability for utility plant retirement costs
|
$
|
273,983
|
|
$
|
261,594
|
|
|
Goodwill
Goodwill arising from acquisitions represents the future economic benefit arising from other assets acquired in a business combination that are not individually identified and separately recognized. The Company evaluates goodwill for impairment using a qualitative analysis (Step 0) for AEL&P and a combination of discounted cash flow models and a market approach for the other subsidiaries on at least an annual basis or more frequently if impairment indicators arise. The Company completed its annual evaluation of goodwill for potential impairment as of November 30,
2016
and determined that goodwill was not impaired at that time.
The changes in the carrying amount of goodwill are as follows (dollars in thousands):
|
AEL&P
|
Other
|
Accumulated
Impairment
Losses
|
Total
|
||||||||||||
|
Balance as of January 1, 2015
|
$
|
52,730
|
|
$
|
12,979
|
|
$
|
(7,733
|
)
|
$
|
57,976
|
|
|||
|
Adjustments
|
(304
|
)
|
—
|
|
—
|
|
(304
|
)
|
|||||||
|
Balance as of the December 31, 2015
|
52,426
|
|
12,979
|
|
(7,733
|
)
|
57,672
|
|
|||||||
|
Balance as of the December 31, 2016
|
$
|
52,426
|
|
$
|
12,979
|
|
$
|
(7,733
|
)
|
$
|
57,672
|
|
|||
Accumulated impairment losses are attributable to the other businesses. The goodwill adjustments recorded during 2015 relate to the final true-up of income taxes associated with the acquisition of AERC, which occurred on July 1, 2014. See Note 4 for information regarding this business acquisition and Note 21 regarding the Company's reportable segments.
Derivative Assets and Liabilities
Derivatives are recorded as either assets or liabilities on the Consolidated Balance Sheets measured at estimated fair value.
The UTC and the IPUC issued accounting orders authorizing Avista Corp. to offset energy commodity derivative assets or liabilities with a regulatory asset or liability. This accounting treatment is intended to defer the recognition of mark-to-market gains and losses on energy commodity transactions until the period of delivery. Realized benefits and costs result in adjustments to retail rates through PGAs, the ERM in Washington, the PCA mechanism in Idaho, and periodic general rates cases. The resulting regulatory assets have been concluded to be probable of recovery through future rates.
Substantially all forward contracts to purchase or sell power and natural gas are recorded as derivative assets or liabilities at estimated fair value with an offsetting regulatory asset or liability. Contracts that are not considered derivatives are accounted for on the accrual basis until they are settled or realized unless there is a decline in the fair value of the contract that is determined to be other-than-temporary.
For interest rate swap derivatives, Avista Corp. records all mark-to-market gains and losses in each accounting period as assets and liabilities, as well as offsetting regulatory assets and liabilities, such that there is no income statement impact. The interest rate swap derivatives are risk management tools similar to energy commodity derivatives. Upon settlement of interest rate swap derivatives, the regulatory asset or liability is amortized as a component of interest expense over the term of the associated debt. The Company records an offset of interest rate swap derivative assets and liabilities with regulatory assets and liabilities, based on the prior practice of the commissions to provide recovery through the ratemaking process.
As of
December 31, 2016
, the Company has multiple master netting agreements with a variety of entities that allow for cross-commodity netting of derivative agreements with the same counterparty (i.e. power derivatives can be netted with natural gas derivatives). In addition, some master netting agreements allow for the netting of commodity derivatives and interest rate swap derivatives for the same counterparty. The Company does not have any agreements which allow for cross-affiliate netting among multiple affiliated legal entities. The Company nets all derivative instruments when allowed by the agreement for presentation in the Consolidated Balance Sheets.
97
Fair Value Measurements
Fair value represents the price that would be received when selling an asset or paid to transfer a liability (an exit price) in an orderly transaction between market participants at the measurement date. Energy commodity derivative assets and liabilities, deferred compensation assets, as well as derivatives related to interest rate swap derivatives and foreign currency exchange derivatives, are reported at estimated fair value on the Consolidated Balance Sheets. See Note 16 for the Company’s fair value disclosures.
Regulatory Deferred Charges and Credits
The Company prepares its consolidated financial statements in accordance with regulatory accounting practices because:
|
•
|
rates for regulated services are established by or subject to approval by independent third-party regulators,
|
|
•
|
the regulated rates are designed to recover the cost of providing the regulated services, and
|
|
•
|
in view of demand for the regulated services and the level of competition, it is reasonable to assume that rates can be charged to and collected from customers at levels that will recover costs.
|
Regulatory accounting practices require that certain costs and/or obligations (such as incurred power and natural gas costs not currently included in rates, but expected to be recovered or refunded in the future), are reflected as deferred charges or credits on the Consolidated Balance Sheets. These costs and/or obligations are not reflected in the Consolidated Statements of Income until the period during which matching revenues are recognized. The Company also has decoupling revenue deferrals. Decoupling revenue deferrals are recognized in the Consolidated Statements of Income during the period they occur (i.e. during the period of revenue shortfall or excess due to fluctuations in customer usage), subject to certain limitations, and a regulatory asset/liability is established which will be surcharged or rebated to customers in future periods. GAAP requires that for any alternative regulatory revenue program, like decoupling, the revenue must be expected to be collected from customers within 24 months of the deferral to qualify for recognition in the current period Consolidated Statement of Income. Any amounts included in the Company's decoupling program that are not expected to be collected from customers within 24 months are not recorded in the financial statements until the period in which revenue recognition criteria are met. This could ultimately result in decoupling revenue being recognized in a future period.
If at some point in the future the Company determines that it no longer meets the criteria for continued application of regulatory accounting practices for all or a portion of its regulated operations, the Company could be:
|
•
|
required to write off its regulatory assets, and
|
|
•
|
precluded from the future deferral of costs or decoupled revenues not recovered through rates at the time such amounts are incurred, even if the Company expected to recover these amounts from customers in the future.
|
See Note 20 for further details of regulatory assets and liabilities.
Unamortized Debt Expense
Unamortized debt expense includes debt issuance costs that are amortized over the life of the related debt. These costs are recorded as an offset to Long-Term Debt and Capital Leases on the Consolidated Balance Sheets.
Unamortized Debt Repurchase Costs
For the Company’s Washington regulatory jurisdiction and for any debt repurchases beginning in 2007 in all jurisdictions, premiums paid to repurchase debt are amortized over the remaining life of the original debt that was repurchased or, if new debt is issued in connection with the repurchase, these costs are amortized over the life of the new debt. In the Company’s other regulatory jurisdictions, premiums paid to repurchase debt prior to 2007 are being amortized over the average remaining maturity of outstanding debt when no new debt was issued in connection with the debt repurchase. These costs are recovered through retail rates as a component of interest expense.
Accumulated Other Comprehensive Loss
Accumulated other comprehensive loss, net of tax, consisted of the following as of
December 31
(dollars in thousands):
|
2016
|
2015
|
||||||
|
Unfunded benefit obligation for pensions and other postretirement benefit plans - net of taxes of $4,075 and $3,580, respectively
|
$
|
7,568
|
|
$
|
6,650
|
|
|
98
The following table details the reclassifications out of accumulated other comprehensive loss by component for the years ended
December 31
(dollars in thousands):
|
Amounts Reclassified from Accumulated Other Comprehensive Loss
|
||||||||||||||
|
Details about Accumulated Other Comprehensive Loss Components
|
2016
|
2015
|
2014
|
Affected Line Item in Statement of Income
|
||||||||||
|
Realized gains on investment securities
|
$
|
—
|
|
$
|
—
|
|
$
|
(3
|
)
|
(a)
|
||||
|
Realized losses on investment securities
|
—
|
|
—
|
|
735
|
|
(a)
|
|||||||
|
—
|
|
—
|
|
732
|
|
Total before tax
|
||||||||
|
—
|
|
—
|
|
(272
|
)
|
Tax expense (a)
|
||||||||
|
$
|
—
|
|
$
|
—
|
|
$
|
460
|
|
Net of tax
|
|||||
|
Amortization of defined benefit pension items
|
||||||||||||||
|
Amortization of net prior service cost
|
$
|
(1,171
|
)
|
$
|
31
|
|
$
|
(1,094
|
)
|
(b)
|
||||
|
Amortization of net loss
|
(7,602
|
)
|
2,623
|
|
(83,301
|
)
|
(b)
|
|||||||
|
Adjustment due to effects of regulation
|
7,360
|
|
(749
|
)
|
78,773
|
|
(b)
|
|||||||
|
(1,413
|
)
|
1,905
|
|
(5,622
|
)
|
Total before tax
|
||||||||
|
495
|
|
(667
|
)
|
1,967
|
|
Tax benefit (expense)
|
||||||||
|
$
|
(918
|
)
|
$
|
1,238
|
|
$
|
(3,655
|
)
|
Net of tax
|
|||||
|
(a)
|
These amounts were included as part of net income from discontinued operations for all periods presented (see Note 5 for additional details).
|
|
(b)
|
These accumulated other comprehensive loss components are included in the computation of net periodic pension cost (see Note 10 for additional details).
|
Appropriated Retained Earnings
In accordance with the hydroelectric licensing requirements of section 10(d) of the Federal Power Act (FPA), the Company maintains an appropriated retained earnings account for any earnings in excess of the specified rate of return on the Company's investment in the licenses for its various hydroelectric projects. Per section 10(d) of the FPA, the Company must maintain these excess earnings in an appropriated retained earnings account until the termination of the licensing agreements or apply them to reduce the net investment in the licenses of the hydroelectric projects at the discretion of the FERC. The Company typically calculates the earnings in excess of the specified rate of return on an annual basis, usually during the second quarter.
In addition to the hydroelectric project licenses identified above for Avista Utilities, the requirements of section 10(d) of the FPA also apply to the AEL&P licenses for Lake Dorothy and Annex Creek/Salmon Creek (combined).
The appropriated retained earnings amounts included in retained earnings were as follows as of
December 31
(dollars in thousands):
|
2016
|
2015
|
||||||
|
Appropriated retained earnings
|
$
|
25,564
|
|
$
|
21,030
|
|
|
Operating Leases
The Company has multiple lease arrangements involving various assets, with minimum terms ranging from 1 to 45 years. Future minimum lease payments required under operating leases having initial or remaining noncancelable lease terms in excess of one year were not material as of
December 31, 2016
.
Capital Leases
The Company has two capital leases, one at Avista Corp. and one at AEL&P. The capital lease at Avista Corp. expires in 2018 and is not material to the financial statements as of
December 31, 2016
. The capital lease at AEL&P is a PPA (treated as a lease for accounting purposes) related to the Snettisham Hydroelectric Project that expires in 2034. While the two leases are treated as capital leases for accounting purposes, for ratemaking purposes these agreements are treated as operating leases with a constant level of annual rental expense (straight line expense). Because of this regulatory treatment, any difference between the operating lease expense for ratemaking purposes and the expenses recognized under capital lease treatment (interest and depreciation of the capital lease asset) is recorded as a regulatory asset and amortized during the later years of the lease when
99
the capital lease expense is less than the operating lease expense included in base rates. See Note 14 for further discussion of the Snettisham capital lease.
Contingencies
The Company has unresolved regulatory, legal and tax issues which have inherently uncertain outcomes. The Company accrues a loss contingency if it is probable that a liability has been incurred and the amount of the loss or impairment can be reasonably estimated. The Company also discloses losses that do not meet these conditions for accrual, if there is a reasonable possibility that a material loss may be incurred. As of
December 31, 2016
, the Company has not recorded any significant amounts related to unresolved contingencies. See Note 19 for further discussion of the Company's commitments and contingencies.
ASU No. 2014-09, "Revenue from Contracts with Customers (Topic 606)"
In May 2014, the FASB issued ASU No. 2014-09, which outlines a single comprehensive model for entities to use in accounting for revenue arising from contracts with customers and supersedes most current revenue recognition guidance, including industry-specific guidance. The core principle of the revenue model is that an entity should identify the various performance obligations in a contract, allocate the transaction price among the performance obligations and recognize revenue when (or as) the entity satisfies each performance obligation. This ASU was originally effective for periods beginning after December 15, 2016 and early adoption was not permitted. In August 2015, the FASB issued ASU No. 2015-14, "Revenue from Contracts with Customers (Topic 606): Deferral of the Effective Date," which deferred the effective date of ASU No. 2014-09 for one year, with adoption as of the original date permitted.
The Company has formed a revenue recognition standard implementation team that is working through several implementation issues described below. The Company has evaluated this standard and is planning to adopt this standard in 2018 upon its effective date. The Company is currently expecting to use a modified retrospective method of adoption, which would require a cumulative adjustment to opening retained earnings, as opposed to a full retrospective application. The Company is not far enough along in the adoption process to determine the amount, if any, of cumulative adjustment necessary.
Since the vast majority of Avista Corp.’s revenue is from rate-regulated sales of electricity and natural gas to retail customers and revenue is recognized as energy is delivered to these customers, the Company does not expect a significant change in operating revenues or net income. The Company is in the process of reviewing and analyzing certain contracts with customers (most of which are related to wholesale sales of power and natural gas), but has not yet identified any significant differences in revenue recognition between current GAAP and ASU 2014-09.
During the implementation process, the Company has identified several unresolved issues, the most significant of which are as follows based on our current assessment:
Contributions in Aid of Construction
– There is the potential that CIACs could be recognized as revenue upon the adoption of ASU 2014-09. Under current GAAP, CIACs are accounted for as an offset to the cost of utility plant in service.
Utility Related Taxes Collected from Customers
– There are questions on the presentation of utility related taxes collected from customers (primarily state excise taxes and city utility taxes) on a gross basis. Under current GAAP, the Company is allowed to record these utility related taxes on a gross basis in revenue when billed to customers with an offset included in taxes other than income taxes in operating expenses. The Company is evaluating whether this presentation is appropriate under ASU 2014-09 or whether they should be presented on a net basis. To qualify for gross presentation under the new guidance, the Company must perform an analysis to determine if it is the principal or the agent in regards to utility related taxes.
Collectibility
- There are questions regarding the requirement that collection of a sale be probable and how, or if, utilities should consider bad debt collection mechanisms (riders, base rate adjustments, etc.) in assessing probability of collection on sales to low income customers. Within the utility industry, there is support for and against considering these recovery mechanisms when assessing collectibility of a sale. If the bad debt recovery mechanisms cannot be considered, there is the potential that certain sales to low income customers cannot be recognized as revenue until payment is received from the customers, which could result in revenues being recognized in periods other than when the energy was delivered to customers or not recognized at all.
The Company is monitoring utility industry implementation guidance as it relates to unresolved issues to determine if there will be an industry consensus regarding accounting and presentation of these items.
100
ASU No. 2015-02, "Consolidation (Topic 810): Amendments to the Consolidation Analysis"
In February 2015, the FASB issued ASU No. 2015-02. This ASU changes the consolidation analysis required under GAAP, including the identification of variable interest entities (VIE). The ASU also removes the deferral of the VIE analysis related to investments in certain investment funds, which results in a different consolidation evaluation for these types of investments. The Company adopted this standard effective January 1, 2016. The adoption of this standard resulted in the identification of several Avista Corp. investments in limited partnerships (or a functional equivalent) that are now considered VIEs under the new standard. Consolidation of these VIEs by Avista Corp. is not required because the Company does not have majority ownership in any of the entities, it does not have the power to direct any activities of the entities and it does not have the power to appoint executive leadership (including the board of directors). Avista Corp.'s total investment in these entities is not material and it does not have any additional commitments to these VIEs beyond the initial investment. See Note 3 for additional discussion of VIEs.
ASU No. 2016-02 “Leases (Topic 842).”
In February 2016, the FASB issued ASU No. 2016-02. This ASU introduces a new lessee model that requires most leases to be capitalized and shown on the balance sheet with corresponding lease assets and liabilities. The standard also aligns certain of the underlying principles of the new lessor model with those in Topic 606, the FASB’s new revenue recognition standard. Furthermore, this ASU addresses other issues that arise under the current lease model; for example, eliminating the required use of bright-line tests in current GAAP for determining lease classification (operating leases versus capital leases). This ASU also includes enhanced disclosures surrounding leases. This ASU is effective for periods beginning on or after December 15, 2018; however, early adoption is permitted. Upon adoption, this ASU must be applied using a modified retrospective approach to the earliest period presented, which will likely require restatements of previously issued financial statements. The modified retrospective approach includes a number of optional practical expedients that entities may elect to apply. The Company evaluated this standard and determined that it will most likely not early adopt this standard before its effective date in 2019. The Company has formed a lease standard implementation team that is working through the implementation process. The most significant implementation challenge identified thus far relates to identifying a complete population of leases and potential leases under the new lease standard. Also, the Company is monitoring utility industry implementation guidance as it relates to several unresolved issues to determine if there will be an industry consensus, including whether right-of-ways are considered leases. The Company cannot, at this time, estimate the potential impact on its future financial condition, results of operations and cash flows.
ASU No. 2016-09 "Compensation—Stock Compensation (Topic 718): Improvements to Employee Share-Based Payment Accounting."
In March 2016, the FASB issued ASU No. 2016-09. This ASU simplifies several aspects of the accounting for employee share-based payment transactions including:
|
•
|
allowing excess tax benefits or tax deficiencies to be recognized as income tax benefits or expenses in the Consolidated Statements of Income rather than in Additional Paid in Capital (APIC),
|
|
•
|
excess tax benefits no longer represent a financing cash inflow on the Consolidated Statements of Cash Flows and instead will be included as an operating activity,
|
|
•
|
excess tax benefits and tax deficiencies will be excluded from the calculation of diluted earnings per share, whereas under current accounting guidance, these amounts must be estimated and included in the calculation,
|
|
•
|
allowing forfeitures to be accounted for as they occur, instead of estimating forfeitures, and
|
|
•
|
changing the statutory tax withholding requirements for share-based payments.
|
This ASU is effective for periods beginning after December 15, 2016 and early adoption is permitted. The Company early adopted this standard during the second quarter of 2016, with a retrospective effective date of January 1, 2016. The adoption of this standard resulted in a recognized income tax benefit of
$1.6 million
in 2016 associated with excess tax benefits on settled share-based employee payments. In addition, the Consolidated Statement of Cash Flows for 2016 included the excess tax benefits as an operating activity rather than as a financing activity. Periods prior to 2016 were not restated for the adoption of this accounting standard as the Company has adopted this standard on a prospective basis beginning January 1, 2016.
101
Lancaster Power Purchase Agreement
The Company has a PPA for the purchase of all the output of the Lancaster Plant, a
270
MW natural gas-fired combined cycle combustion turbine plant located in Kootenai County, Idaho, owned by an unrelated third-party (Rathdrum Power LLC), through 2026.
Avista Corp. has a variable interest in the PPA. Accordingly, Avista Corp. made an evaluation of which interest holders have the power to direct the activities that most significantly impact the economic performance of the entity and which interest holders have the obligation to absorb losses or receive benefits that could be significant to the entity. Avista Corp. pays a fixed capacity and operations and maintenance payment and certain monthly variable costs under the PPA. Under the terms of the PPA, Avista Corp. makes the dispatch decisions, provides all natural gas fuel and receives all of the electric energy output from the Lancaster Plant. However, Rathdrum Power LLC (the owner) controls the daily operation of the Lancaster Plant and makes operating and maintenance decisions. Rathdrum Power LLC controls all of the rights and obligations of the Lancaster Plant after the expiration of the PPA in 2026 and Avista Corp. does not have any further obligations after the expiration. It is estimated that the plant will have
15
to
25
years of useful life after that time. Rathdrum Power LLC bears the maintenance risk of the plant and will receive the residual value of the Lancaster Plant. Avista Corp. has no debt or equity investments in the Lancaster Plant and does not provide financial support through liquidity arrangements or other commitments (other than the PPA). Based on its analysis, Avista Corp. does not consider itself to be the primary beneficiary of the Lancaster Plant. Accordingly, neither the Lancaster Plant nor Rathdrum Power LLC is included in Avista Corp.’s consolidated financial statements. The Company has a future contractual obligation of approximately
$283.6 million
under the PPA (representing the fixed capacity and operations and maintenance payments through 2026) and believes this would be its maximum exposure to loss. However, the Company believes that such costs will be recovered through retail rates.
Limited Partnerships and Similar Entities
The Company adopted ASU No. 2015-02 effective January 1, 2016. As a result of the adoption of this ASU, the Company evaluated all of its existing investments to determine if any entities would be considered VIEs under the new guidance and whether consolidation would be required. Under the ASU, a limited partnership or similar legal entity that is the functional equivalent of a limited partnership would be considered a VIE regardless of whether it otherwise qualifies as a voting interest entity unless a simple majority or lower threshold of the “unrelated” limited partners (i.e., parties other than the general partner, entities under common control with the general partner, and other parties acting on behalf of the general partner) have substantive kick-out rights (including liquidation rights) or participating rights.
The Company has six investments in limited partnerships (or the functional equivalent) where Avista Corp. is a limited partner investor in an investment fund where the general partner makes all of the investment and operating decisions with regards to the partnership and fund. To remove the general partner from any of the funds, approval from greater than a simple majority of the limited partners is required. As such, the limited partners do not have substantive kick-out rights and these investments are considered VIEs. Consolidation of these VIEs by Avista Corp. is not required because the Company does not have majority ownership in any of the funds, it does not have the power to direct any activities of the funds, and it does not have the power to appoint executive leadership, including the board of directors.
Avista Corp. participates in profits and losses of the investment funds based on its ownership percentage and its losses are capped at its total initial investment in the funds. For five of the six VIEs, Avista Corp. does not have any additional commitments beyond its initial investment. For the sixth VIE, Avista Corp. has up to a
$25.0 million
total commitment, and as of December 31, 2016, has invested
$2.1 million
, leaving
$22.9 million
remaining to be invested. In addition, the Company is not allowed to withdraw any capital contributions from the investment funds until after the funds' expiration dates and all liabilities of the funds are settled. The expiration dates range from
2017
to
2032
, with one investment having no termination date (as it is perpetual). As of
December 31, 2016
, the Company has a total carrying amount in these investment funds of
$7.0 million
.
Alaska Energy and Resources Company
On July 1, 2014, the Company acquired AERC, based in Juneau, Alaska, and as of that date, AERC became a wholly-owned subsidiary of Avista Corp.
The primary subsidiary of AERC is AEL&P, a regulated utility which provides electric services to approximately
17,000
customers in Juneau, Alaska. In addition to the regulated utility, AERC owns AJT Mining, which is an inactive mining company holding certain properties.
102
The purpose of the acquisition was to expand and diversify Avista Corp.'s energy assets and deliver long-term value to its customers, communities and investors.
In connection with the closing, Avista Corp. issued
4,501,441
new shares of common stock to the shareholders of AERC based on a contractual formula that resulted in a price of
$32.46
per share, reflecting a purchase price of
$170.0 million
, plus acquired cash, less outstanding debt and other closing adjustments. Avista Corp. also paid
$4.8 million
in cash. The total fair value of all consideration transferred was
$154.9 million
and resulted in goodwill of
$52.4 million
, which is not deductible for tax purposes.
The fair value of assets acquired and liabilities assumed as of July 1, 2014 (after consideration of a working capital adjustment and income tax true-ups during the second quarter of 2015) were as follows (in thousands):
|
July 1, 2014
|
|||
|
Assets acquired:
|
|||
|
Current Assets:
|
|||
|
Cash
|
$
|
19,704
|
|
|
Accounts receivable - gross totals $3,928
|
3,851
|
|
|
|
Materials and supplies
|
2,017
|
|
|
|
Other current assets
|
999
|
|
|
|
Total current assets
|
26,571
|
|
|
|
Utility Property:
|
|||
|
Utility plant in service
|
113,964
|
|
|
|
Utility property under long-term capital lease
|
71,007
|
|
|
|
Construction work in progress
|
3,440
|
|
|
|
Total utility property
|
188,411
|
|
|
|
Other Non-current Assets:
|
|||
|
Non-utility property
|
6,660
|
|
|
|
Electric plant held for future use
|
3,711
|
|
|
|
Goodwill (1)
|
52,426
|
|
|
|
Other deferred charges and non-current assets
|
5,368
|
|
|
|
Total other non-current assets
|
68,165
|
|
|
|
Total assets
|
$
|
283,147
|
|
|
Liabilities Assumed:
|
|||
|
Current Liabilities:
|
|||
|
Accounts payable
|
$
|
700
|
|
|
Current portion of long-term debt and capital lease obligations
|
3,773
|
|
|
|
Other current liabilities (1)
|
2,807
|
|
|
|
Total current liabilities
|
7,280
|
|
|
|
Long-term debt
|
37,227
|
|
|
|
Capital lease obligations
|
68,840
|
|
|
|
Other non-current liabilities and deferred credits (1)
|
14,889
|
|
|
|
Total liabilities
|
$
|
128,236
|
|
|
Total net assets acquired
|
$
|
154,911
|
|
|
(1)
|
During the second quarter of 2015, the Company recorded a reduction to goodwill of approximately
$0.3 million
due to income tax related adjustments.
|
The majority of AERC’s operations are subject to the rate-setting authority of the RCA and are accounted for pursuant to GAAP, including the accounting guidance for regulated operations. The rate-setting and cost recovery provisions currently in place for AERC’s regulated operations provide revenues derived from costs, including a return on investment, of assets and
103
liabilities included in rate base. Due to this regulation, the fair values of AERC’s assets and liabilities subject to these rate-setting provisions were assumed to approximate their carrying values. There were not any identifiable intangible assets associated with this acquisition. The excess of the purchase consideration over the estimated fair values of the assets acquired and liabilities assumed was recognized as goodwill at the acquisition date. The goodwill reflects the value paid for the expected continued growth of a rate-regulated business located in a defined service area with a constructive regulatory environment, the attractiveness of stable, growing cash flows, as well as providing a platform for potential future growth outside of the rate-regulated electric utility in Alaska and potential additional utility investment.
The following table summarizes the supplemental pro forma information for the years ended
December 31
related to the acquisition of AERC as if the acquisition had occurred on January 1, 2013 (dollars in thousands - unaudited):
|
2016
|
2015
|
2014
|
|||||||||
|
Actual Avista Corp. revenues from continuing operations (excluding AERC)
|
$
|
1,395,989
|
|
$
|
1,439,807
|
|
$
|
1,450,918
|
|
||
|
Supplemental pro forma AERC revenues (1)
|
46,494
|
|
44,969
|
|
46,467
|
|
|||||
|
Total pro forma revenues
|
1,442,483
|
|
1,484,776
|
|
1,497,385
|
|
|||||
|
Actual AERC revenues included in Avista Corp. revenues (1)
|
46,494
|
|
44,969
|
|
21,644
|
|
|||||
|
Actual Avista Corp. net income from continuing operations attributable to Avista Corp. shareholders (excluding AERC)
|
129,505
|
|
111,772
|
|
116,665
|
|
|||||
|
Actual Avista Corp. net income from discontinued operations attributable to Avista Corp. shareholders
|
—
|
|
5,147
|
|
72,224
|
|
|||||
|
Adjustment to Avista Corp.'s net income for acquisition costs (net of tax) (2)
|
—
|
|
22
|
|
870
|
|
|||||
|
Supplemental pro forma AERC net income (1)
|
7,723
|
|
6,308
|
|
8,806
|
|
|||||
|
Total pro forma net income
|
137,228
|
|
123,249
|
|
198,565
|
|
|||||
|
Actual AERC net income included in Avista Corp. net income (1)
|
$
|
7,723
|
|
$
|
6,308
|
|
$
|
3,152
|
|
||
|
(1)
|
AERC was acquired on July 1, 2014; therefore, all the revenues and net income for the second half of 2014 through 2016 are actual amounts that are included in Avista Corp.'s overall results. All revenue and net income amounts prior to July 1, 2014 are supplemental pro forma amounts and are excluded from Avista Corp.'s overall results.
|
|
(2)
|
This adjustment is to treat all transaction costs as if they occurred on January 1, 2013 and to remove them from the periods in which they actually occurred. The transaction costs were expensed and presented in the Consolidated Statements of Income in other operating expenses within utility operating expenses. Since the start of the transaction through
December 31, 2016
, Avista Corp. has expensed
$3.0 million
(pre-tax) in total transaction fees. In addition to the amounts expensed, through
December 31, 2016
, Avista Corp. has included
$0.4 million
in fees associated with the issuance of common stock for the transaction as a reduction to common stock. These fees do not impact the supplemental pro forma information above.
|
On June 30, 2014, Avista Capital, completed the sale of its interest in Ecova to Cofely USA Inc., an unrelated party to Avista Corp. The sales price was
$335.0 million
in cash, less the payment of debt and other customary closing adjustments. At the closing of the transaction on June 30, 2014, Ecova became a wholly-owned subsidiary of Cofely USA Inc. and the Company has not had and will not have any further involvement with Ecova after such date.
The purchase price of
$335.0 million
, as adjusted, was divided among all the security holders of Ecova pro rata based on ownership. After consideration of all escrow amounts received, the sales transaction provided cash proceeds to Avista Corp., net of debt, payment to option and minority holders, income taxes and transaction expenses, of
$143.7 million
, and resulted in a net gain of
$74.8 million
. Almost all of the net gain was recognized in 2014 with some true-ups during 2015.
104
Prior to the completion of the sales transaction, Ecova was a reportable business segment. The following table presents amounts that were included in discontinued operations for the years ended
December 31
,
2015
and
2014
(dollars in thousands):
|
2015
|
2014
|
||||||
|
Revenues
|
$
|
—
|
|
$
|
87,534
|
|
|
|
Gain on sale of Ecova (1)
|
777
|
|
160,612
|
|
|||
|
Transaction expenses and accelerated employee benefits (2)
|
71
|
|
9,062
|
|
|||
|
Gain on sale of Ecova, net of transaction expenses
|
706
|
|
151,550
|
|
|||
|
Income before income taxes
|
706
|
|
156,025
|
|
|||
|
Income tax expense (benefit) (3)
|
(4,441
|
)
|
83,614
|
|
|||
|
Net income from discontinued operations
|
5,147
|
|
72,411
|
|
|||
|
Net income attributable to noncontrolling interests
|
—
|
|
(187
|
)
|
|||
|
Net income from discontinued operations attributable to Avista Corp. shareholders
|
$
|
5,147
|
|
$
|
72,224
|
|
|
|
(1)
|
This represents the gross gain recorded to discontinued operations. The total gain net of taxes and transactions expenses was
$74.8 million
, of which
$69.7 million
was recognized during 2014.
|
|
(2)
|
Avista Corp.'s portion of the total transaction expenses was
$9.1 million
(including amounts which were withheld from the transaction net proceeds). All transaction expenses paid on the Ecova sale (including Avista Corp.'s portion and the portion attributable to the minority interest holders of Ecova) were
$11.1 million
, of which
$5.5 million
was withheld from the net proceeds and the remainder was paid during 2014. The transaction expenses were for legal, accounting and other consulting fees, and the accelerated employee benefits related to employee stock options which were settled in accordance with the Ecova equity plan.
|
|
(3)
|
The tax benefit during 2015 primarily resulted from the reversal of a valuation allowance against net operating losses at Ecova because the net operating losses were deemed realizable after further evaluation.
|
Energy Commodity Derivatives
Avista Utilities is exposed to market risks relating to changes in electricity and natural gas commodity prices and certain other fuel prices. Market risk is, in general, the risk of fluctuation in the market price of the commodity being traded and is influenced primarily by supply and demand. Market risk includes the fluctuation in the market price of associated derivative commodity instruments. Avista Utilities utilizes derivative instruments, such as forwards, futures, swaps and options in order to manage the various risks relating to these commodity price exposures. The Company has an energy resources risk policy and control procedures to manage these risks.
As part of the Company's resource procurement and management operations in the electric business, the Company engages in an ongoing process of resource optimization, which involves the economic selection from available energy resources to serve the Company's load obligations and the use of these resources to capture available economic value. The Company transacts in wholesale markets by selling and purchasing electric capacity and energy, fuel for electric generation, and derivative contracts related to capacity, energy and fuel. Such transactions are part of the process of matching resources with load obligations and hedging the related financial risks. These transactions range from terms of intra-hour up to multiple years.
As part of its resource procurement and management of its natural gas business, the Company makes continuing projections of its natural gas loads and assesses available natural gas resources including natural gas storage availability. Natural gas resource planning typically includes peak requirements, low and average monthly requirements and delivery constraints from natural gas supply locations to the Company's distribution system. However, daily variations in natural gas demand can be significantly different than monthly demand projections. On the basis of these projections, the Company plans and executes a series of transactions to hedge a portion of its projected natural gas requirements through forward market transactions and derivative instruments. These transactions may extend as much as four natural gas operating years (November through October) into the future. Avista Corp. also leaves a significant portion of its natural gas supply requirements unhedged for purchase in short-term and spot markets.
The Company is required to plan for sufficient natural gas delivery capacity to serve its retail customers for a theoretical peak day event. The Company generally has more pipeline and storage capacity than what is needed during periods other than a peak
105
day. The Company optimizes its natural gas resources by using market opportunities to generate economic value that helps mitigate fixed costs. Avista Utilities also optimizes its natural gas storage capacity by purchasing and storing natural gas when prices are traditionally lower, typically in the summer, and withdrawing during higher priced months, typically during the winter. However, if market conditions and prices indicate that the Company should buy or sell natural gas during other times in the year, the Company engages in optimization transactions to capture value in the marketplace. Natural gas optimization activities include, but are not limited to, wholesale market sales of surplus natural gas supplies, purchases and sales of natural gas to optimize use of pipeline and storage capacity, and participation in the transportation capacity release market.
The following table presents the underlying energy commodity derivative volumes as of
December 31, 2016
that are expected to be settled in each respective year (in thousands of MWhs and mmBTUs):
|
|
Purchases
|
Sales
|
|||||||||||||||||||||
|
|
Electric Derivatives
|
Gas Derivatives
|
Electric Derivatives
|
Gas Derivatives
|
|||||||||||||||||||
|
Year
|
Physical (1)
MWh
|
Financial (1)
MWh
|
Physical (1)
mmBTUs
|
Financial (1)
mmBTUs
|
Physical (1)
MWh |
Financial (1)
MWh |
Physical (1)
mmBTUs |
Financial (1)
mmBTUs |
|||||||||||||||
|
2017
|
510
|
|
907
|
|
15,475
|
|
110,380
|
|
316
|
|
1,552
|
|
4,165
|
|
73,110
|
|
|||||||
|
2018
|
397
|
|
—
|
|
—
|
|
52,755
|
|
286
|
|
1,244
|
|
1,360
|
|
15,113
|
|
|||||||
|
2019
|
235
|
|
—
|
|
610
|
|
29,475
|
|
158
|
|
982
|
|
1,345
|
|
4,020
|
|
|||||||
|
2020
|
—
|
|
—
|
|
910
|
|
2,725
|
|
—
|
|
—
|
|
1,430
|
|
—
|
|
|||||||
|
2021
|
—
|
|
—
|
|
—
|
|
—
|
|
—
|
|
—
|
|
1,060
|
|
—
|
|
|||||||
|
Thereafter
|
—
|
|
—
|
|
—
|
|
—
|
|
—
|
|
—
|
|
—
|
|
—
|
|
|||||||
The following table presents the underlying energy commodity derivative volumes as of
December 31, 2015
that were expected to be settled in each respective year (in thousands of MWhs and mmBTUs):
|
|
Purchases
|
Sales
|
|||||||||||||||||||||
|
|
Electric Derivatives
|
Gas Derivatives
|
Electric Derivatives
|
Gas Derivatives
|
|||||||||||||||||||
|
Year
|
Physical (1)
MWh
|
Financial (1)
MWh
|
Physical (1)
mmBTUs
|
Financial (1)
mmBTUs
|
Physical (1)
MWh |
Financial (1)
MWh |
Physical (1)
mmBTUs |
Financial (1)
mmBTUs |
|||||||||||||||
|
2016
|
407
|
|
1,954
|
|
17,252
|
|
142,693
|
|
280
|
|
2,656
|
|
3,182
|
|
112,233
|
|
|||||||
|
2017
|
397
|
|
97
|
|
675
|
|
49,200
|
|
255
|
|
483
|
|
1,360
|
|
26,965
|
|
|||||||
|
2018
|
397
|
|
—
|
|
—
|
|
15,118
|
|
286
|
|
—
|
|
1,360
|
|
2,738
|
|
|||||||
|
2019
|
235
|
|
—
|
|
305
|
|
6,935
|
|
158
|
|
—
|
|
1,345
|
|
—
|
|
|||||||
|
2020
|
—
|
|
—
|
|
455
|
|
905
|
|
—
|
|
—
|
|
1,430
|
|
—
|
|
|||||||
|
Thereafter
|
—
|
|
—
|
|
—
|
|
—
|
|
—
|
|
—
|
|
1,060
|
|
—
|
|
|||||||
|
(1)
|
Physical transactions represent commodity transactions in which Avista Utilities will take or make delivery of either electricity or natural gas; financial transactions represent derivative instruments with delivery of cash in the amount of benefit or cost but with no physical delivery of the commodity, such as futures, swaps, options, or forward contracts.
|
The electric and natural gas derivative contracts above will be included in either power supply costs or natural gas supply costs during the period they are settled and will be included in the various recovery mechanisms (ERM, PCA, and PGAs), or in the general rate case process, and are expected to be collected through retail rates from customers. Any transactions that result in gains will be used to reduce retail rates charged to customers in the future.
Foreign Currency Exchange Derivatives
A significant portion of Avista Utilities’ natural gas supply (including fuel for power generation) is obtained from Canadian sources. Most of those transactions are executed in U.S. dollars, which avoids foreign currency risk. A portion of Avista Utilities’ short-term natural gas transactions and long-term Canadian transportation contracts are committed based on Canadian currency prices and settled within
60 days
with U.S. dollars. Avista Utilities hedges a portion of the foreign currency risk by purchasing Canadian currency exchange derivatives when such commodity transactions are initiated. The foreign currency exchange derivatives and the unhedged foreign currency risk have not had a material effect on the Company’s financial condition, results of operations or cash flows and these differences in cost related to currency fluctuations are included with natural gas supply costs for ratemaking.
106
The following table summarizes the foreign currency hedges that the Company has entered into as of
December 31
(dollars in thousands):
|
2016
|
2015
|
||||||
|
Number of contracts
|
21
|
|
24
|
|
|||
|
Notional amount (in United States dollars)
|
$
|
2,819
|
|
$
|
1,463
|
|
|
|
Notional amount (in Canadian dollars)
|
3,754
|
|
2,002
|
|
|||
Interest Rate Swap Derivatives
Avista Corp. is affected by fluctuating interest rates related to a portion of its existing debt, and future borrowing requirements. The Company hedges a portion of its interest rate risk with financial derivative instruments, which may include interest rate swap derivatives and U.S. Treasury lock agreements. These interest rate swap derivatives and U.S. Treasury lock agreements are considered economic hedges against fluctuations in future cash flows associated with anticipated debt issuances.
The following table summarizes the unsettled interest rate swap derivatives that the Company has outstanding as of the balance sheet date indicated below (dollars in thousands):
|
Balance Sheet Date
|
Number of Contracts
|
Notional Amount
|
Mandatory Cash Settlement Date
|
||||
|
December 31, 2016
|
6
|
75,000
|
|
2017
|
|||
|
14
|
275,000
|
|
2018
|
||||
|
6
|
70,000
|
|
2019
|
||||
|
2
|
20,000
|
|
2020
|
||||
|
5
|
60,000
|
|
2022
|
||||
|
December 31, 2015
|
6
|
115,000
|
|
2016
|
|||
|
3
|
45,000
|
|
2017
|
||||
|
11
|
245,000
|
|
2018
|
||||
|
2
|
30,000
|
|
2019
|
||||
|
1
|
20,000
|
|
2022
|
||||
During the third quarter 2016, in connection with the execution of a purchase agreement for bonds that the Company issued in December 2016, the Company cash-settled
seven
interest rate swap derivatives (notional aggregate amount of
$125.0 million
) and paid a total of
$54.0 million
. The interest rate swap derivatives were settled in connection with the pricing of
$175.0 million
of Avista Corp. first mortgage bonds that were issued in December 2016 (see Note 14). Upon settlement of interest rate swap derivatives, the cash payments made or received are recorded as a regulatory asset or liability and are subsequently amortized as a component of interest expense over the life of the associated debt. The settled interest rate swap derivatives are also included as a part of the Company's cost of debt calculation for ratemaking purposes.
The fair value of outstanding interest rate swap derivatives can vary significantly from period to period depending on the total notional amount of swaps outstanding and fluctuations in market interest rates compared to the interest rates fixed by the swaps. The Company would be required to make cash payments to settle the interest rate swap derivatives if the fixed rates are higher than prevailing market rates at the date of settlement. Conversely, the Company receives cash to settle its interest rate swap derivatives when prevailing market rates at the time of settlement exceed the fixed swap rates.
Summary of Outstanding Derivative Instruments
The amounts recorded on the Consolidated Balance Sheet as of
December 31, 2016
and
December 31, 2015
reflect the offsetting of derivative assets and liabilities where a legal right of offset exists.
107
The following table presents the fair values and locations of derivative instruments recorded on the Consolidated Balance Sheet as of
December 31, 2016
(in thousands):
|
|
Fair Value
|
||||||||||||||
|
Derivative and Balance Sheet Location
|
Gross
Asset |
Gross
Liability |
Collateral
Netting |
Net Asset
(Liability) in Balance Sheet |
|||||||||||
|
Foreign currency exchange derivatives
|
|||||||||||||||
|
Other current liabilities
|
$
|
5
|
|
$
|
(28
|
)
|
$
|
—
|
|
$
|
(23
|
)
|
|||
|
Interest rate swap derivatives
|
|||||||||||||||
|
Other current assets
|
3,393
|
|
—
|
|
—
|
|
3,393
|
|
|||||||
|
Other property and investments-net and other non-current assets
|
5,754
|
|
(397
|
)
|
—
|
|
5,357
|
|
|||||||
|
Other current liabilities
|
—
|
|
(15,756
|
)
|
9,731
|
|
(6,025
|
)
|
|||||||
|
Non-current interest rate swap derivative liabilities
|
3,951
|
|
(57,825
|
)
|
25,169
|
|
(28,705
|
)
|
|||||||
|
Energy commodity derivatives
|
|||||||||||||||
|
Other current assets
|
18,682
|
|
(16,787
|
)
|
—
|
|
1,895
|
|
|||||||
|
Current energy commodity derivative liabilities
|
16,335
|
|
(29,598
|
)
|
6,228
|
|
(7,035
|
)
|
|||||||
|
Other non-current liabilities, regulatory liabilities and deferred credits
|
13,071
|
|
(29,990
|
)
|
3,630
|
|
(13,289
|
)
|
|||||||
|
Total derivative instruments recorded on the balance sheet
|
$
|
61,191
|
|
$
|
(150,381
|
)
|
$
|
44,758
|
|
$
|
(44,432
|
)
|
|||
The following table presents the fair values and locations of derivative instruments recorded on the Consolidated Balance Sheet as of
December 31, 2015
(in thousands):
|
|
Fair Value
|
||||||||||||||
|
Derivative and Balance Sheet Location
|
Gross
Asset |
Gross
Liability |
Collateral
Netting |
Net Asset
(Liability) in Balance Sheet |
|||||||||||
|
Foreign currency exchange derivatives
|
|||||||||||||||
|
Other current liabilities
|
$
|
2
|
|
$
|
(19
|
)
|
$
|
—
|
|
$
|
(17
|
)
|
|||
|
Interest rate swap derivatives
|
|||||||||||||||
|
Other property and investments-net and other non-current assets
|
23
|
|
—
|
|
—
|
|
23
|
|
|||||||
|
Other current liabilities
|
118
|
|
(23,262
|
)
|
3,880
|
|
(19,264
|
)
|
|||||||
|
Non-current interest rate swap derivative liabilities
|
1,407
|
|
(62,236
|
)
|
30,150
|
|
(30,679
|
)
|
|||||||
|
Energy commodity derivatives
|
|||||||||||||||
|
Other current assets
|
1,236
|
|
(553
|
)
|
—
|
|
683
|
|
|||||||
|
Current energy commodity derivative liabilities
|
67,466
|
|
(85,409
|
)
|
3,675
|
|
(14,268
|
)
|
|||||||
|
Other non-current liabilities, regulatory liabilities and deferred credits
|
6,613
|
|
(39,033
|
)
|
10,851
|
|
(21,569
|
)
|
|||||||
|
Total derivative instruments recorded on the balance sheet
|
$
|
76,865
|
|
$
|
(210,512
|
)
|
$
|
48,556
|
|
$
|
(85,091
|
)
|
|||
Exposure to Demands for Collateral
The Company's derivative contracts often require collateral (in the form of cash or letters of credit) or other credit enhancements, or reductions or terminations of a portion of the contract through cash settlement, in the event of a downgrade in the Company's credit ratings or changes in market prices. In periods of price volatility, the level of exposure can change significantly. As a result, sudden and significant demands may be made against the Company's credit facilities and cash. The Company actively monitors the exposure to possible collateral calls and takes steps to mitigate capital requirements.
108
The following table presents the Company's collateral outstanding related to its derivative instruments as of as of
December 31
(in thousands):
|
2016
|
2015
|
||||||
|
Energy commodity derivatives
|
|||||||
|
Cash collateral posted
|
$
|
17,134
|
|
$
|
28,716
|
|
|
|
Letters of credit outstanding
|
24,400
|
|
28,200
|
|
|||
|
Balance sheet offsetting (cash collateral against net derivative positions)
|
9,858
|
|
14,526
|
|
|||
|
Interest rate swap derivatives
|
|||||||
|
Cash collateral posted
|
34,900
|
|
34,030
|
|
|||
|
Letters of credit outstanding
|
3,600
|
|
9,600
|
|
|||
|
Balance sheet offsetting (cash collateral against net derivative positions)
|
34,900
|
|
34,030
|
|
|||
Certain of the Company’s derivative instruments contain provisions that require the Company to maintain an "investment grade" credit rating from the major credit rating agencies. If the Company’s credit ratings were to fall below “investment grade,” it would be in violation of these provisions, and the counterparties to the derivative instruments could request immediate payment or demand immediate and ongoing collateralization on derivative instruments in net liability positions.
The following table presents the aggregate fair value of all derivative instruments with credit-risk-related contingent features that are in a liability position and the amount of additional collateral the Company could be required to post as of
December 31
(in thousands):
|
2016
|
2015
|
||||||
|
Energy commodity derivatives
|
|||||||
|
Liabilities with credit-risk-related contingent features
|
$
|
1,124
|
|
$
|
7,090
|
|
|
|
Additional collateral to post
|
1,046
|
|
6,980
|
|
|||
|
Interest rate swap derivatives
|
|||||||
|
Liabilities with credit-risk-related contingent features
|
73,978
|
|
85,498
|
|
|||
|
Additional collateral to post
|
21,100
|
|
18,750
|
|
|||
The Company has a
15 percent
ownership interest in a twin-unit coal-fired generating facility, Colstrip, located in southeastern Montana, and provides financing for its ownership interest in the project. The Company’s share of related fuel costs as well as operating expenses for plant in service are included in the corresponding accounts in the Consolidated Statements of Income. The Company’s share of utility plant in service for Colstrip and accumulated depreciation (inclusive of the ARO assets and accumulated amortization) were as follows as of
December 31
(dollars in thousands):
|
2016
|
2015
|
||||||
|
Utility plant in service
|
$
|
380,406
|
|
$
|
362,199
|
|
|
|
Accumulated depreciation
|
(249,359
|
)
|
(243,363
|
)
|
|||
See Note 9 for further discussion of AROs.
109
The balances of the major classifications of property, plant and equipment are detailed in the following table as of
December 31
(dollars in thousands):
|
2016
|
2015
|
||||||
|
Avista Utilities:
|
|||||||
|
Electric production
|
$
|
1,346,332
|
|
$
|
1,217,179
|
|
|
|
Electric transmission
|
682,529
|
|
640,586
|
|
|||
|
Electric distribution
|
1,525,175
|
|
1,468,157
|
|
|||
|
Electric construction work-in-progress (CWIP) and other
|
296,912
|
|
358,846
|
|
|||
|
Electric total
|
3,850,948
|
|
3,684,768
|
|
|||
|
Natural gas underground storage
|
44,672
|
|
43,080
|
|
|||
|
Natural gas distribution
|
954,298
|
|
878,982
|
|
|||
|
Natural gas CWIP and other
|
57,601
|
|
62,024
|
|
|||
|
Natural gas total
|
1,056,571
|
|
984,086
|
|
|||
|
Common plant (including CWIP)
|
527,458
|
|
456,796
|
|
|||
|
Total Avista Utilities
|
5,434,977
|
|
5,125,650
|
|
|||
|
AEL&P:
|
|||||||
|
Electric production
|
94,839
|
|
72,292
|
|
|||
|
Electric transmission
|
20,252
|
|
18,817
|
|
|||
|
Electric distribution
|
20,057
|
|
19,005
|
|
|||
|
Electric production held under long-term capital lease
|
71,007
|
|
71,007
|
|
|||
|
Electric CWIP and other
|
7,190
|
|
16,971
|
|
|||
|
Electric total
|
213,345
|
|
198,092
|
|
|||
|
Common plant
|
8,651
|
|
8,133
|
|
|||
|
Total AEL&P
|
221,996
|
|
206,225
|
|
|||
|
Other
(1)
|
30,764
|
|
25,709
|
|
|||
|
Total
|
$
|
5,687,737
|
|
$
|
5,357,584
|
|
|
|
(1)
|
Included in other property and investments-net and other non-current assets on the Consolidated Balance Sheets. Accumulated depreciation was
$11.2 million
as of
December 31, 2016
and
$10.6 million
as of
December 31, 2015
for the other businesses.
|
The Company has recorded liabilities for future AROs to:
|
•
|
restore coal ash containment ponds at Colstrip,
|
|
•
|
cap a landfill at the Kettle Falls Plant,
|
|
•
|
remove plant and restore the land at the Coyote Springs 2 site at the termination of the land lease, and
|
|
•
|
dispose of PCBs in certain transformers.
|
Due to an inability to estimate a range of settlement dates, the Company cannot estimate a liability for the:
|
•
|
removal and disposal of certain transmission and distribution assets, and
|
|
•
|
abandonment and decommissioning of certain hydroelectric generation and natural gas storage facilities.
|
On April 17, 2015, the EPA published a final rule regarding coal combustion residuals (CCR), also termed coal combustion byproducts or coal ash, in the Federal Register, and this rule became effective on October 15, 2015. Colstrip, of which Avista Corp. is a 15 percent owner of units 3 & 4, produces this byproduct. The rule established technical requirements for CCR landfills and surface impoundments under Subtitle D of the Resource Conservation and Recovery Act, the nation's primary law for regulating solid waste. The Company, in conjunction with the other Colstrip owners, developed a multi-year compliance plan to strategically address the CCR requirements and existing state obligations while maintaining operational stability. During 2015, the operator of Colstrip provided an initial cost estimate of the expected retirement costs associated with complying with
110
the new CCR rule. Based on the initial assessments, Avista Corp. recorded an increase to its ARO of
$12.5 million
during 2015 with a corresponding increase in the cost basis of the utility plant. During 2016, due to additional information and updated estimates, the ARO increased to
$13.6 million
(including accretion of
$0.7 million
).
The actual asset retirement costs related to the CCR rule requirements may vary substantially from the estimates used to record the increased ARO due to uncertainty about the compliance strategies that will be used and the preliminary nature of available data used to estimate costs, such as the quantity of coal ash present at certain sites and the volume of fill that will be needed to cap and cover certain impoundments. Avista Corp. will coordinate with the plant operator and continue to gather additional data in future periods to make decisions about compliance strategies and the timing of closure activities. As additional information becomes available, Avista Corp. will update the ARO for these changes in estimates, which could be material. The Company expects to seek recovery of any increased costs related to complying with the new rule through customer rates.
The following table documents the changes in the Company’s asset retirement obligation during the years ended
December 31
(dollars in thousands):
|
2016
|
2015
|
2014
|
|||||||||
|
Asset retirement obligation at beginning of year
|
$
|
15,997
|
|
$
|
3,028
|
|
$
|
2,859
|
|
||
|
Liabilities incurred
|
430
|
|
12,539
|
|
—
|
|
|||||
|
Liabilities settled
|
(1,529
|
)
|
(29
|
)
|
(41
|
)
|
|||||
|
Accretion expense
|
617
|
|
459
|
|
210
|
|
|||||
|
Asset retirement obligation at end of year
|
$
|
15,515
|
|
$
|
15,997
|
|
$
|
3,028
|
|
||
The pension and other postretirement benefit plans described below only relate to Avista Utilities. AEL&P (not discussed below) participates in a defined contribution multiemployer plan for its union workers and a defined contribution money purchase pension plan for its nonunion workers. METALfx (not discussed below) has a defined contribution 401(k) savings plan. None of the subsidiary retirement plans, individually or in the aggregate, are significant to Avista Corp.
Avista Utilities
The Company has a defined benefit pension plan covering the majority of all regular full-time employees at Avista Utilities that were hired prior to January 1, 2014. Individual benefits under this plan are based upon the employee’s years of service, date of hire and average compensation as specified in the plan. Non-union employees hired on or after January 1, 2014 participate in a defined contribution 401(k) plan in lieu of a defined benefit pension plan. The Company’s funding policy is to contribute at least the minimum amounts that are required to be funded under the Employee Retirement Income Security Act, but not more than the maximum amounts that are currently deductible for income tax purposes. The Company contributed
$12.0 million
in cash to the pension plan in
2016
,
$12.0 million
in
2015
and
$32.0 million
in
2014
. The Company expects to contribute
$22.0 million
in cash to the pension plan in
2017
.
The Company also has a SERP that provides additional pension benefits to executive officers and certain key employees of the Company. The SERP is intended to provide benefits to individuals whose benefits under the defined benefit pension plan are reduced due to the application of Section 415 of the Internal Revenue Code of 1986 and the deferral of salary under deferred compensation plans. The liability and expense for this plan are included as pension benefits in the tables included in this Note.
The Company expects that benefit payments under the pension plan and the SERP will total (dollars in thousands):
|
2017
|
2018
|
2019
|
2020
|
2021
|
Total 2022-2026
|
||||||||||||||||||
|
Expected benefit payments
|
$
|
30,971
|
|
$
|
32,014
|
|
$
|
33,047
|
|
$
|
34,545
|
|
$
|
35,892
|
|
$
|
196,322
|
|
|||||
The expected long-term rate of return on plan assets is based on past performance and economic forecasts for the types of investments held by the plan. In selecting a discount rate, the Company considers yield rates for highly rated corporate bond portfolios with maturities similar to that of the expected term of pension benefits.
The Company provides certain health care and life insurance benefits for eligible retired employees that were hired prior to January 1, 2014. The Company accrues the estimated cost of postretirement benefit obligations during the years that employees provide services. The liability and expense of this plan are included as other postretirement benefits. Non-union employees hired on or after January 1, 2014, will have access to the retiree medical plan upon retirement; however, Avista Corp. will no longer provide a contribution toward their medical premium.
111
The Company has a Health Reimbursement Arrangement (HRA) to provide employees with tax-advantaged funds to pay for allowable medical expenses upon retirement. The amount earned by the employee is fixed on the retirement date based on the employee’s years of service and the ending salary. The liability and expense of the HRA are included as other postretirement benefits.
The Company provides death benefits to beneficiaries of executive officers who die during their term of office or after retirement. Under the plan, an executive officer’s designated beneficiary will receive a payment equal to twice the executive officer’s annual base salary at the time of death (or if death occurs after retirement, a payment equal to twice the executive officer’s total annual pension benefit). The liability and expense for this plan are included as other postretirement benefits.
The Company expects that benefit payments under other postretirement benefit plans will total (dollars in thousands):
|
2017
|
2018
|
2019
|
2020
|
2021
|
Total 2022-2026
|
||||||||||||||||||
|
Expected benefit payments
|
$
|
6,991
|
|
$
|
7,302
|
|
$
|
7,580
|
|
$
|
6,479
|
|
$
|
6,675
|
|
$
|
34,704
|
|
|||||
The Company expects to contribute
$7.0 million
to other postretirement benefit plans in
2017
, representing expected benefit payments to be paid during the year excluding the Medicare Part D subsidy. The Company uses a December 31 measurement date for its pension and other postretirement benefit plans.
The following table sets forth the pension and other postretirement benefit plan disclosures as of
December 31, 2016
and
2015
and the components of net periodic benefit costs for the years ended
December 31, 2016
,
2015
and
2014
(dollars in thousands):
|
|
Pension Benefits
|
Other Post-
retirement Benefits
|
|||||||||||||
|
|
2016
|
2015
|
2016
|
2015
|
|||||||||||
|
Change in benefit obligation:
|
|||||||||||||||
|
Benefit obligation as of beginning of year
|
$
|
613,503
|
|
$
|
634,674
|
|
$
|
138,795
|
|
$
|
127,989
|
|
|||
|
Service cost
|
18,302
|
|
19,791
|
|
3,205
|
|
2,925
|
|
|||||||
|
Interest cost
|
27,544
|
|
26,117
|
|
6,110
|
|
5,158
|
|
|||||||
|
Actuarial (gain)/loss
|
39,997
|
|
(35,790
|
)
|
(3,648
|
)
|
12,668
|
|
|||||||
|
Plan change
|
—
|
|
(228
|
)
|
—
|
|
(1,000
|
)
|
|||||||
|
Cumulative adjustment to reclassify liability
|
—
|
|
—
|
|
(1,042
|
)
|
(1,521
|
)
|
|||||||
|
Benefits paid
|
(32,874
|
)
|
(31,061
|
)
|
(6,967
|
)
|
(7,424
|
)
|
|||||||
|
Benefit obligation as of end of year
|
$
|
666,472
|
|
$
|
613,503
|
|
$
|
136,453
|
|
$
|
138,795
|
|
|||
|
Change in plan assets:
|
|||||||||||||||
|
Fair value of plan assets as of beginning of year
|
$
|
517,234
|
|
$
|
539,311
|
|
$
|
30,868
|
|
$
|
31,312
|
|
|||
|
Actual return on plan assets
|
43,212
|
|
(4,305
|
)
|
2,497
|
|
(444
|
)
|
|||||||
|
Employer contributions
|
12,000
|
|
12,000
|
|
—
|
|
—
|
|
|||||||
|
Benefits paid
|
(31,532
|
)
|
(29,772
|
)
|
—
|
|
—
|
|
|||||||
|
Fair value of plan assets as of end of year
|
$
|
540,914
|
|
$
|
517,234
|
|
$
|
33,365
|
|
$
|
30,868
|
|
|||
|
Funded status
|
$
|
(125,558
|
)
|
$
|
(96,269
|
)
|
$
|
(103,088
|
)
|
$
|
(107,927
|
)
|
|||
|
Unrecognized net actuarial loss
|
178,783
|
|
162,961
|
|
81,979
|
|
92,433
|
|
|||||||
|
Unrecognized prior service cost
|
23
|
|
25
|
|
(8,981
|
)
|
(10,180
|
)
|
|||||||
|
Prepaid (accrued) benefit cost
|
53,248
|
|
66,717
|
|
(30,090
|
)
|
(25,674
|
)
|
|||||||
|
Additional liability
|
(178,806
|
)
|
(162,986
|
)
|
(72,998
|
)
|
(82,253
|
)
|
|||||||
|
Accrued benefit liability
|
$
|
(125,558
|
)
|
$
|
(96,269
|
)
|
$
|
(103,088
|
)
|
$
|
(107,927
|
)
|
|||
|
Accumulated pension benefit obligation
|
$
|
583,498
|
|
$
|
542,209
|
|
—
|
|
—
|
|
|||||
|
Accumulated postretirement benefit obligation:
|
|||||||||||||||
|
For retirees
|
$
|
60,670
|
|
$
|
65,652
|
|
|||||||||
|
For fully eligible employees
|
$
|
34,429
|
|
$
|
34,498
|
|
|||||||||
|
For other participants
|
$
|
41,354
|
|
$
|
38,645
|
|
|||||||||
112
|
|
Pension Benefits
|
Other Post-
retirement Benefits
|
|||||||||||||
|
|
2016
|
2015
|
2016
|
2015
|
|||||||||||
|
Included in accumulated other comprehensive loss (income) (net of tax):
|
|||||||||||||||
|
Unrecognized prior service cost
|
$
|
15
|
|
$
|
16
|
|
$
|
(5,854
|
)
|
$
|
(6,617
|
)
|
|||
|
Unrecognized net actuarial loss
|
116,209
|
|
105,925
|
|
53,303
|
|
60,081
|
|
|||||||
|
Total
|
116,224
|
|
105,941
|
|
47,449
|
|
53,464
|
|
|||||||
|
Less regulatory asset
|
(108,903
|
)
|
(99,414
|
)
|
(47,202
|
)
|
(53,341
|
)
|
|||||||
|
Accumulated other comprehensive loss for unfunded benefit obligation for pensions and other postretirement benefit plans
|
$
|
7,321
|
|
$
|
6,527
|
|
$
|
247
|
|
$
|
123
|
|
|||
|
|
Pension Benefits
|
Other Post-
retirement Benefits
|
|||||||||
|
|
2016
|
2015
|
2016
|
2015
|
|||||||
|
Weighted-average assumptions as of December 31:
|
|||||||||||
|
Discount rate for benefit obligation
|
4.26
|
%
|
4.57
|
%
|
4.23
|
%
|
4.57
|
%
|
|||
|
Discount rate for annual expense
|
4.57
|
%
|
4.21
|
%
|
4.57
|
%
|
4.16
|
%
|
|||
|
Expected long-term return on plan assets
|
5.40
|
%
|
5.30
|
%
|
6.03
|
%
|
6.36
|
%
|
|||
|
Rate of compensation increase
|
4.78
|
%
|
4.87
|
%
|
|||||||
|
Medical cost trend pre-age 65 – initial
|
7.00
|
%
|
7.00
|
%
|
|||||||
|
Medical cost trend pre-age 65 – ultimate
|
5.00
|
%
|
5.00
|
%
|
|||||||
|
Ultimate medical cost trend year pre-age 65
|
2023
|
|
2022
|
|
|||||||
|
Medical cost trend post-age 65 – initial
|
7.00
|
%
|
7.00
|
%
|
|||||||
|
Medical cost trend post-age 65 – ultimate
|
5.00
|
%
|
5.00
|
%
|
|||||||
|
Ultimate medical cost trend year post-age 65
|
2024
|
|
2023
|
|
|||||||
|
Pension Benefits
|
Other Post-retirement Benefits
|
||||||||||||||||||||||
|
2016
|
2015
|
2014
|
2016
|
2015
|
2014
|
||||||||||||||||||
|
Components of net periodic benefit cost:
|
|||||||||||||||||||||||
|
Service cost
|
$
|
18,302
|
|
$
|
19,791
|
|
$
|
15,757
|
|
$
|
3,205
|
|
$
|
2,925
|
|
$
|
1,844
|
|
|||||
|
Interest cost
|
27,544
|
|
26,117
|
|
26,224
|
|
6,110
|
|
5,158
|
|
5,226
|
|
|||||||||||
|
Expected return on plan assets
|
(27,547
|
)
|
(28,299
|
)
|
(32,131
|
)
|
(1,861
|
)
|
(1,991
|
)
|
(1,903
|
)
|
|||||||||||
|
Amortization of prior service cost
|
2
|
|
2
|
|
22
|
|
(1,208
|
)
|
(1,199
|
)
|
(1,116
|
)
|
|||||||||||
|
Net loss recognition
|
8,511
|
|
9,451
|
|
4,731
|
|
5,728
|
|
5,095
|
|
4,289
|
|
|||||||||||
|
Net periodic benefit cost
|
$
|
26,812
|
|
$
|
27,062
|
|
$
|
14,603
|
|
$
|
11,974
|
|
$
|
9,988
|
|
$
|
8,340
|
|
|||||
Plan Assets
The Finance Committee of the Company’s Board of Directors approves investment policies, objectives and strategies that seek an appropriate return for the pension plan and other postretirement benefit plans and reviews and approves changes to the investment and funding policies.
The Company has contracted with investment consultants who are responsible for managing/monitoring the individual investment managers. The investment managers’ performance and related individual fund performance is periodically reviewed by an internal benefits committee and by the Finance Committee to monitor compliance with investment policy objectives and strategies.
Pension plan assets are invested in mutual funds, trusts and partnerships that hold marketable debt and equity securities, real estate, absolute return and commodity funds. In seeking to obtain the desired return to fund the pension plan, the investment consultant recommends allocation percentages by asset classes. These recommendations are reviewed by the internal benefits committee, which then recommends their adoption by the Finance Committee. The Finance Committee has established target
113
investment allocation percentages by asset classes and also investment ranges for each asset class. The target investment allocation percentages are typically the midpoint of the established range. The target investment allocation percentages by asset classes are indicated in the table below:
|
2016
|
2015
|
||||
|
Equity securities
|
37
|
%
|
27
|
%
|
|
|
Debt securities
|
45
|
%
|
58
|
%
|
|
|
Real estate
|
8
|
%
|
6
|
%
|
|
|
Absolute return
|
10
|
%
|
9
|
%
|
|
The 2016 target investment allocation percentages were revised in the fourth quarter of 2016 and the pension plan assets were subsequently reinvested during the fourth quarter of 2016 and first quarter of 2017 to move toward the new target investment allocation percentages. The target asset allocation percentages were modified to better align the asset allocations with the funded status of the pension plan. Future contributions to the plan will also be increased to improve the funded status of the plan.
The fair value of pension plan assets invested in debt and equity securities was based primarily on fair value (market prices). The fair value of investment securities traded on a national securities exchange is determined based on the reported last sales price; securities traded in the over-the-counter market are valued at the last reported bid price. Investment securities for which market prices are not readily available or for which market prices do not represent the value at the time of pricing, the investment manager estimates fair value based upon other inputs (including valuations of securities that are comparable in coupon, rating, maturity and industry). Investments in common/collective trust funds are presented at estimated fair value, which is determined based on the unit value of the fund. Unit value is determined by an independent trustee, which sponsors the fund, by dividing the fund’s net assets by its units outstanding at the valuation date. The Company's investments in common/collective trusts have redemption limitations that permit quarterly redemptions following notice requirements of
45
to
60 days
. The fair values of the closely held investments and partnership interests are based upon the allocated share of the fair value of the underlying assets as well as the allocated share of the undistributed profits and losses, including realized and unrealized gains and losses. Most of the Company's investments in closely held investments and partnership interests have redemption limitations that range from bi-monthly to semi-annually following redemption notice requirements of
60
to
90 days
. One investment in a partnership has a lock-up for redemption currently expiring in 2022 and is subject to extension.
The fair value of pension plan assets invested in real estate was determined by the investment manager based on three basic approaches:
|
•
|
properties are externally appraised on an annual basis by independent appraisers, additional appraisals may be performed as warranted by specific asset or market conditions,
|
|
•
|
property valuations are reviewed quarterly and adjusted as necessary, and
|
|
•
|
loans are reflected at fair value.
|
The fair value of pension plan assets was determined as of
December 31, 2016
and
2015
.
Pension plan other postretirement plan assets whose fair values are measured using net asset value (NAV) are excluded from the fair value hierarchy and are included as reconciling items in the tables below.
114
The following table discloses by level within the fair value hierarchy (see Note 16 for a description of the fair value hierarchy) of the pension plan’s assets measured and reported as of
December 31, 2016
at fair value (dollars in thousands):
|
Level 1
|
Level 2
|
Level 3
|
Total
|
||||||||||||
|
Cash equivalents
|
$
|
—
|
|
$
|
10,179
|
|
$
|
—
|
|
$
|
10,179
|
|
|||
|
Fixed income securities:
|
|||||||||||||||
|
U.S. government issues
|
—
|
|
30,919
|
|
—
|
|
30,919
|
|
|||||||
|
Corporate issues
|
—
|
|
193,563
|
|
—
|
|
193,563
|
|
|||||||
|
International issues
|
—
|
|
34,145
|
|
—
|
|
34,145
|
|
|||||||
|
Municipal issues
|
—
|
|
18,888
|
|
—
|
|
18,888
|
|
|||||||
|
Mutual funds:
|
|||||||||||||||
|
U.S. equity securities
|
120,856
|
|
—
|
|
—
|
|
120,856
|
|
|||||||
|
International equity securities
|
30,025
|
|
—
|
|
—
|
|
30,025
|
|
|||||||
|
Absolute return (1)
|
6,622
|
|
—
|
|
—
|
|
6,622
|
|
|||||||
|
Plan assets measured at NAV (not subject to hierarchy disclosure)
|
|||||||||||||||
|
Common/collective trusts:
|
|||||||||||||||
|
Real estate
|
—
|
|
—
|
|
—
|
|
19,779
|
|
|||||||
|
International equity securities
|
—
|
|
—
|
|
—
|
|
29,140
|
|
|||||||
|
Partnership/closely held investments:
|
|||||||||||||||
|
Absolute return (1)
|
—
|
|
—
|
|
—
|
|
39,077
|
|
|||||||
|
Private equity funds (2)
|
—
|
|
—
|
|
—
|
|
72
|
|
|||||||
|
Real estate
|
—
|
|
—
|
|
—
|
|
7,649
|
|
|||||||
|
Total
|
$
|
157,503
|
|
$
|
287,694
|
|
$
|
—
|
|
$
|
540,914
|
|
|||
The following table discloses by level within the fair value hierarchy (see Note 16 for a description of the fair value hierarchy) of the pension plan’s assets measured and reported as of
December 31, 2015
at fair value (dollars in thousands):
|
Level 1
|
Level 2
|
Level 3
|
Total
|
||||||||||||
|
Cash equivalents
|
$
|
86
|
|
$
|
10,641
|
|
$
|
—
|
|
$
|
10,727
|
|
|||
|
Fixed income securities:
|
|||||||||||||||
|
U.S. government issues
|
—
|
|
47,845
|
|
—
|
|
47,845
|
|
|||||||
|
Corporate issues
|
—
|
|
187,308
|
|
—
|
|
187,308
|
|
|||||||
|
International issues
|
—
|
|
34,458
|
|
—
|
|
34,458
|
|
|||||||
|
Municipal issues
|
—
|
|
22,416
|
|
—
|
|
22,416
|
|
|||||||
|
Mutual funds:
|
|||||||||||||||
|
U.S. equity securities
|
87,678
|
|
—
|
|
—
|
|
87,678
|
|
|||||||
|
International equity securities
|
40,343
|
|
—
|
|
—
|
|
40,343
|
|
|||||||
|
Absolute return (1)
|
13,996
|
|
—
|
|
—
|
|
13,996
|
|
|||||||
|
Plan assets measured at NAV (not subject to hierarchy disclosure)
|
|||||||||||||||
|
Common/collective trusts:
|
|||||||||||||||
|
Real estate
|
—
|
|
—
|
|
—
|
|
24,147
|
|
|||||||
|
Partnership/closely held investments:
|
|||||||||||||||
|
Absolute return (1)
|
—
|
|
—
|
|
—
|
|
38,302
|
|
|||||||
|
Private equity funds (2)
|
—
|
|
—
|
|
—
|
|
73
|
|
|||||||
|
Real estate
|
—
|
|
—
|
|
—
|
|
9,941
|
|
|||||||
|
Total
|
$
|
142,103
|
|
$
|
302,668
|
|
$
|
—
|
|
$
|
517,234
|
|
|||
|
(1)
|
This category invests in multiple strategies to diversify risk and reduce volatility. The strategies include: (a) event driven, relative value, convertible, and fixed income arbitrage, (b) distressed investments, (c) long/short equity and fixed income, and (d) market neutral strategies.
|
|
(2)
|
This category includes private equity funds that invest primarily in U.S. companies.
|
115
The fair value of other postretirement plan assets invested in debt and equity securities was based primarily on market prices. The fair value of investment securities traded on a national securities exchange is determined based on the last reported sales price; securities traded in the over-the-counter market are valued at the last reported bid price. Investment securities for which market prices are not readily available are fair-valued by the investment manager based upon other inputs (including valuations of securities that are comparable in coupon, rating, maturity and industry). The target asset allocation was
60 percent
equity securities and
40 percent
debt securities in both
2016
and
2015
.
The fair value of other postretirement plan assets was determined as of
December 31, 2016
and
2015
.
The following table discloses by level within the fair value hierarchy (see Note 16 for a description of the fair value hierarchy) of other postretirement plan assets measured and reported as of
December 31, 2016
at fair value (dollars in thousands):
|
Level 1
|
Level 2
|
Level 3
|
Total
|
||||||||||||
|
Cash equivalents
|
$
|
—
|
|
$
|
6
|
|
$
|
—
|
|
$
|
6
|
|
|||
|
Mutual funds:
|
|||||||||||||||
|
Balanced index fund (1)
|
33,359
|
|
—
|
|
—
|
|
33,359
|
|
|||||||
|
Total
|
$
|
33,359
|
|
$
|
6
|
|
$
|
—
|
|
$
|
33,365
|
|
|||
|
(1)
|
The balanced index fund is a single mutual fund that includes a percentage of U.S. equity securities, fixed income securities and International securities.
|
The following table discloses by level within the fair value hierarchy (see Note 16 for a description of the fair value hierarchy) of other postretirement plan assets measured and reported as of
December 31, 2015
at fair value (dollars in thousands):
|
Level 1
|
Level 2
|
Level 3
|
Total
|
||||||||||||
|
Cash equivalents
|
$
|
—
|
|
$
|
9
|
|
$
|
—
|
|
$
|
9
|
|
|||
|
Mutual funds:
|
|||||||||||||||
|
Fixed income securities
|
12,000
|
|
—
|
|
—
|
|
12,000
|
|
|||||||
|
U.S. equity securities
|
13,224
|
|
—
|
|
—
|
|
13,224
|
|
|||||||
|
International equity securities
|
5,635
|
|
—
|
|
—
|
|
5,635
|
|
|||||||
|
Total
|
$
|
30,859
|
|
$
|
9
|
|
$
|
—
|
|
$
|
30,868
|
|
|||
Assumed health care cost trend rates have a significant effect on the amounts reported for the health care plans. A one-percentage-point increase in the assumed health care cost trend rate for each year would increase the accumulated postretirement benefit obligation as of
December 31, 2016
by
$8.6 million
and the service and interest cost by
$1.0 million
. A one-percentage-point decrease in the assumed health care cost trend rate for each year would decrease the accumulated postretirement benefit obligation as of
December 31, 2016
by
$6.7 million
and the service and interest cost by
$0.7 million
.
401(k) Plans and Executive Deferral Plan
Avista Utilities and METALfx have salary deferral 401(k) plans that are defined contribution plans and cover substantially all employees. Employees can make contributions to their respective accounts in the plans on a pre-tax basis up to the maximum amount permitted by law. The respective company matches a portion of the salary deferred by each participant according to the schedule in the respective plan.
Employer matching contributions were as follows for the years ended
December 31
(dollars in thousands):
|
2016
|
2015
|
2014
|
|||||||||
|
Employer 401(k) matching contributions
|
$
|
8,710
|
|
$
|
8,011
|
|
$
|
6,862
|
|
||
The Company has an Executive Deferral Plan. This plan allows executive officers and other key employees the opportunity to defer until the earlier of their retirement, termination, disability or death, up to
75 percent
of their base salary and/or up to
100 percent
of their incentive payments. Deferred compensation funds are held by the Company in a Rabbi Trust.
116
There were deferred compensation assets included in other property and investments-net and corresponding deferred compensation liabilities included in other non-current liabilities and deferred credits on the Consolidated Balance Sheets of the following amounts as of
December 31
(dollars in thousands):
|
2016
|
2015
|
||||||
|
Deferred compensation assets and liabilities
|
$
|
7,679
|
|
$
|
8,093
|
|
|
Income tax expense consisted of the following for the years ended
December 31
(dollars in thousands):
|
2016
|
2015
|
2014
|
|||||||||
|
Current income tax expense (benefit)
|
$
|
(46,457
|
)
|
$
|
12,212
|
|
$
|
(67,059
|
)
|
||
|
Deferred income tax expense
|
124,543
|
|
55,237
|
|
139,299
|
|
|||||
|
Total income tax expense
|
$
|
78,086
|
|
$
|
67,449
|
|
$
|
72,240
|
|
||
State income taxes do not represent a significant portion of total income tax expense on the Consolidated Statements of Income for any periods presented.
A reconciliation of federal income taxes derived from statutory federal tax rates (
35 percent
in
2016
,
2015
and
2014
) applied to income before income taxes as set forth in the accompanying Consolidated Statements of Income is as follows for the
years ended December 31
(dollars in thousands):
|
2016
|
2015
|
2014
|
|||||||||||||||
|
Federal income taxes at statutory rates
|
$
|
75,391
|
|
35.0
|
%
|
$
|
64,967
|
|
35.0
|
%
|
$
|
67,237
|
|
35.0
|
%
|
||
|
Increase (decrease) in tax resulting from:
|
|||||||||||||||||
|
Tax effect of regulatory treatment of utility plant differences
|
3,297
|
|
1.5
|
|
4,358
|
|
2.3
|
|
4,008
|
|
2.1
|
|
|||||
|
State income tax expense
|
1,316
|
|
0.6
|
|
1,012
|
|
0.5
|
|
506
|
|
0.2
|
|
|||||
|
Settlement of prior year tax returns and adjustment of tax reserves
|
13
|
|
—
|
|
(992
|
)
|
(0.5
|
)
|
1,104
|
|
0.6
|
|
|||||
|
Manufacturing deduction
|
—
|
|
—
|
|
(1,198
|
)
|
(0.6
|
)
|
(169
|
)
|
(0.1
|
)
|
|||||
|
Settlement of equity awards
|
(1,597
|
)
|
(0.7
|
)
|
—
|
|
—
|
|
—
|
|
—
|
|
|||||
|
Other
|
(334
|
)
|
(0.1
|
)
|
(698
|
)
|
(0.4
|
)
|
(446
|
)
|
(0.2
|
)
|
|||||
|
Total income tax expense
|
$
|
78,086
|
|
36.3
|
%
|
$
|
67,449
|
|
36.3
|
%
|
$
|
72,240
|
|
37.6
|
%
|
||
117
Deferred income taxes reflect the net tax effects of temporary differences between the carrying amounts of assets and liabilities for financial reporting purposes and the amounts used for income tax purposes and tax credit carryforwards. The total net deferred income tax liability consisted of the following as of
December 31
(dollars in thousands):
|
2016
|
2015
|
||||||
|
Deferred income tax assets:
|
|||||||
|
Unfunded benefit obligation
|
$
|
80,230
|
|
$
|
75,716
|
|
|
|
Derivatives
|
31,872
|
|
47,009
|
|
|||
|
Regulatory deferred tax credits
|
15,192
|
|
—
|
|
|||
|
Tax credits
|
27,931
|
|
15,011
|
|
|||
|
Power and natural gas deferrals
|
19,415
|
|
12,866
|
|
|||
|
Deferred compensation
|
11,141
|
|
10,354
|
|
|||
|
Other
|
29,512
|
|
29,471
|
|
|||
|
Total gross deferred income tax assets
|
215,293
|
|
190,427
|
|
|||
|
Valuation allowances for deferred tax assets
|
(7,946
|
)
|
(2,862
|
)
|
|||
|
Total deferred income tax assets after valuation allowances
|
207,347
|
|
187,565
|
|
|||
|
Deferred income tax liabilities:
|
|||||||
|
Differences between book and tax basis of utility plant
|
812,916
|
|
723,661
|
|
|||
|
Regulatory asset on utility, property plant and equipment
|
37,301
|
|
36,917
|
|
|||
|
Regulatory asset for pensions and other postretirement benefits
|
84,040
|
|
82,253
|
|
|||
|
Utility energy commodity derivatives
|
31,871
|
|
47,010
|
|
|||
|
Long-term debt and borrowing costs
|
31,955
|
|
14,027
|
|
|||
|
Settlement with Coeur d’Alene Tribe
|
11,711
|
|
12,084
|
|
|||
|
Other regulatory assets
|
30,183
|
|
11,691
|
|
|||
|
Other
|
8,298
|
|
7,399
|
|
|||
|
Total deferred income tax liabilities
|
1,048,275
|
|
935,042
|
|
|||
|
Net long-term deferred income tax liability
|
$
|
840,928
|
|
$
|
747,477
|
|
|
The realization of deferred income tax assets is dependent upon the ability to generate taxable income in future periods. The Company evaluated available evidence supporting the realization of its deferred income tax assets and determined it is more likely than not that deferred income tax assets will be realized.
As of
December 31, 2016
, the Company had
$17.1 million
of state tax credit carryforwards of which it is expected
$7.9 million
may expire unused; the Company has reflected the net amount of
$9.2 million
as an asset at
December 31, 2016
. State tax credits expire from
2019
to
2028
.
The Company and its eligible subsidiaries file consolidated federal income tax returns. The Company also files state income tax returns in certain jurisdictions, including Idaho, Oregon and Montana. Subsidiaries are charged or credited with the tax effects of their operations on a stand-alone basis. The Internal Revenue Service (IRS) has completed its examination of all tax years through
2011
and all issues were resolved related to these years. The statute of limitations for the IRS to review the 2012 tax year has expired, leaving the 2013 through 2015 tax years still open for review. The Company believes that any open tax years for federal or state income taxes will not result in adjustments that would be significant to the consolidated financial statements.
The Company had net regulatory assets related to the probable recovery of certain deferred income tax liabilities from customers through future rates as of
December 31
(dollars in thousands):
|
2016
|
2015
|
||||||
|
Regulatory assets for deferred income taxes
|
$
|
109,853
|
|
$
|
101,240
|
|
|
|
Regulatory liabilities for deferred income taxes
|
28,966
|
|
17,609
|
|
|||
The below discussion only relates to Avista Utilities. The sole energy purchase contract at AEL&P is a PPA for the Snettisham hydroelectric project and it is accounted for as a capital lease. AEL&P does not have any other significant operating agreements or contractual obligations. See Note 14 for further discussion of the Snettisham PPA.
Avista Utilities has contracts for the purchase of fuel for thermal generation, natural gas for resale and various agreements for the purchase or exchange of electric energy with other entities. The remaining term of the contracts range from one month to twenty-five years.
118
Total expenses for power purchased, natural gas purchased, fuel for generation and other fuel costs, which are included in utility resource costs in the Consolidated Statements of Income, were as follows for the years ended
December 31
(dollars in thousands):
|
2016
|
2015
|
2014
|
|||||||||
|
Utility power resources
|
$
|
402,575
|
|
$
|
511,937
|
|
$
|
556,915
|
|
||
The following table details Avista Utilities’ future contractual commitments for power resources (including transmission contracts) and natural gas resources (including transportation contracts) (dollars in thousands):
|
2017
|
2018
|
2019
|
2020
|
2021
|
Thereafter
|
Total
|
|||||||||||||||||||||
|
Power resources
|
$
|
202,494
|
|
$
|
187,080
|
|
$
|
174,285
|
|
$
|
109,878
|
|
$
|
96,485
|
|
$
|
775,548
|
|
$
|
1,545,770
|
|
||||||
|
Natural gas resources
|
95,549
|
|
65,230
|
|
53,860
|
|
41,340
|
|
29,306
|
|
349,468
|
|
634,753
|
|
|||||||||||||
|
Total
|
$
|
298,043
|
|
$
|
252,310
|
|
$
|
228,145
|
|
$
|
151,218
|
|
$
|
125,791
|
|
$
|
1,125,016
|
|
$
|
2,180,523
|
|
||||||
These energy purchase contracts were entered into as part of Avista Utilities’ obligation to serve its retail electric and natural gas customers’ energy requirements, including contracts entered into for resource optimization. As a result, these costs are recovered either through base retail rates or adjustments to retail rates as part of the power and natural gas cost deferral and recovery mechanisms.
The above future contractual commitments for power resources include fixed contractual amounts related to the Company's contracts with certain PUDs to purchase portions of the output of certain generating facilities. Although Avista Utilities has no investment in the PUD generating facilities, the fixed contracts obligate Avista Utilities to pay certain minimum amounts whether or not the facilities are operating. The cost of power obtained under the contracts, including payments made when a facility is not operating, is included in utility resource costs in the Consolidated Statements of Income. The contractual amounts included above consist of Avista Utilities’ share of existing debt service cost and its proportionate share of the variable operating expenses of these projects. The minimum amounts payable under these contracts are based in part on the proportionate share of the debt service requirements of the PUD's revenue bonds for which the Company is indirectly responsible. The Company's total future debt service obligation associated with the revenue bonds outstanding at
December 31, 2016
(principal and interest) was
$65.2 million
.
In addition, Avista Utilities has operating agreements, settlements and other contractual obligations related to its generating facilities and transmission and distribution services. The expenses associated with these agreements are reflected as other operating expenses in the Consolidated Statements of Income. The following table details future contractual commitments under these agreements (dollars in thousands):
|
2017
|
2018
|
2019
|
2020
|
2021
|
Thereafter
|
Total
|
|||||||||||||||||||||
|
Contractual obligations
|
$
|
33,922
|
|
$
|
28,783
|
|
$
|
32,549
|
|
$
|
32,160
|
|
$
|
27,019
|
|
$
|
189,000
|
|
$
|
343,433
|
|
||||||
Avista Corp.
Avista Corp. has a committed line of credit with various financial institutions in the total amount of
$400.0 million
. A two-year option was exercised by the Company in 2016 to extend the maturity of the facility agreement to
April 2021
.
The committed line of credit agreement contains customary covenants and default provisions. The credit agreement has a covenant which does not permit the ratio of “consolidated total debt” to “consolidated total capitalization” of Avista Corp. to be greater than
65 percent
at any time. As of
December 31, 2016
, the Company was in compliance with this covenant.
Balances outstanding and interest rates of borrowings (excluding letters of credit) under the Company’s revolving committed lines of credit were as follows as of
December 31
(dollars in thousands):
|
2016
|
2015
|
||||||
|
Balance outstanding at end of period
|
$
|
120,000
|
|
$
|
105,000
|
|
|
|
Letters of credit outstanding at end of period
|
$
|
34,353
|
|
$
|
44,595
|
|
|
|
Average interest rate at end of period
|
1.50
|
%
|
1.18
|
%
|
|||
As of
December 31, 2016
and
2015
, the borrowings outstanding under Avista Corp.'s committed line of credit were classified as short-term borrowings on the Consolidated Balance Sheet.
119
AEL&P
AEL&P has a committed line of credit in the amount of
$25.0 million
that expires in
November 2019
. As of
December 31, 2016
and
2015
, there were no borrowings or letters of credit outstanding under this committed line of credit.
The committed line of credit agreement contains customary covenants and default provisions. The credit agreement has a covenant which does not permit the ratio of “consolidated total debt at AEL&P” to “consolidated total capitalization at AEL&P,” including the impact of the Snettisham bonds to be greater than
67.5 percent
at any time. As of
December 31, 2016
, AEL&P was in compliance with this covenant.
120
The following details long-term debt outstanding as of
December 31
(dollars in thousands):
|
Maturity
Year
|
Description
|
Interest
Rate
|
2016
|
2015
|
||||||||
|
Avista Corp. Secured Long-Term Debt
|
||||||||||||
|
2016
|
First Mortgage Bonds (1)
|
0.84%
|
$
|
—
|
|
$
|
90,000
|
|
||||
|
2018
|
First Mortgage Bonds
|
5.95%
|
250,000
|
|
250,000
|
|
||||||
|
2018
|
Secured Medium-Term Notes
|
7.39%-7.45%
|
22,500
|
|
22,500
|
|
||||||
|
2019
|
First Mortgage Bonds
|
5.45%
|
90,000
|
|
90,000
|
|
||||||
|
2020
|
First Mortgage Bonds
|
3.89%
|
52,000
|
|
52,000
|
|
||||||
|
2022
|
First Mortgage Bonds
|
5.13%
|
250,000
|
|
250,000
|
|
||||||
|
2023
|
Secured Medium-Term Notes
|
7.18%-7.54%
|
13,500
|
|
13,500
|
|
||||||
|
2028
|
Secured Medium-Term Notes
|
6.37%
|
25,000
|
|
25,000
|
|
||||||
|
2032
|
Secured Pollution Control Bonds (2)
|
(2)
|
66,700
|
|
66,700
|
|
||||||
|
2034
|
Secured Pollution Control Bonds (2)
|
(2)
|
17,000
|
|
17,000
|
|
||||||
|
2035
|
First Mortgage Bonds
|
6.25%
|
150,000
|
|
150,000
|
|
||||||
|
2037
|
First Mortgage Bonds
|
5.70%
|
150,000
|
|
150,000
|
|
||||||
|
2040
|
First Mortgage Bonds
|
5.55%
|
35,000
|
|
35,000
|
|
||||||
|
2041
|
First Mortgage Bonds
|
4.45%
|
85,000
|
|
85,000
|
|
||||||
|
2044
|
First Mortgage Bonds
|
4.11%
|
60,000
|
|
60,000
|
|
||||||
|
2045
|
First Mortgage Bonds
|
4.37%
|
100,000
|
|
100,000
|
|
||||||
|
2047
|
First Mortgage Bonds
|
4.23%
|
80,000
|
|
80,000
|
|
||||||
|
2051
|
First Mortgage Bonds (3)
|
3.54%
|
175,000
|
|
—
|
|
||||||
|
Total Avista Corp. secured long-term debt
|
1,621,700
|
|
1,536,700
|
|
||||||||
|
Alaska Electric Light and Power Company Secured Long-Term Debt
|
||||||||||||
|
2044
|
First Mortgage Bonds
|
4.54%
|
75,000
|
|
75,000
|
|
||||||
|
Total secured long-term debt
|
1,696,700
|
|
1,611,700
|
|
||||||||
|
Alaska Energy and Resources Company Unsecured Long-Term Debt
|
||||||||||||
|
2019
|
Unsecured Term Loan
|
3.85%
|
15,000
|
|
15,000
|
|
||||||
|
Total secured and unsecured long-term debt
|
1,711,700
|
|
1,626,700
|
|
||||||||
|
Other Long-Term Debt Components
|
||||||||||||
|
Capital lease obligations
|
65,435
|
|
68,601
|
|
||||||||
|
Settled interest rate swap derivatives (4)
|
—
|
|
(26,515
|
)
|
||||||||
|
Unamortized debt discount
|
(792
|
)
|
(956
|
)
|
||||||||
|
Unamortized long-term debt issuance costs
|
(10,639
|
)
|
(10,852
|
)
|
||||||||
|
Total
|
1,765,704
|
|
1,656,978
|
|
||||||||
|
Secured Pollution Control Bonds held by Avista Corporation (2)
|
(83,700
|
)
|
(83,700
|
)
|
||||||||
|
Current portion of long-term debt and capital leases
|
(3,287
|
)
|
(93,167
|
)
|
||||||||
|
Total long-term debt and capital leases
|
$
|
1,678,717
|
|
$
|
1,480,111
|
|
||||||
|
(1)
|
In August 2016, Avista Corp. entered into a term loan agreement with a commercial bank in the amount of
$70.0 million
with a maturity date of December 30, 2016. Loans under this agreement were unsecured and had a variable annual interest rate. The Company borrowed the entire
$70.0 million
available under this agreement, which was used to repay a portion of the
$90.0 million
in first mortgage bonds that matured in August 2016. This term loan was subsequently repaid in full in December using the proceeds from the first mortgage bonds issued in December 2016 (discussed below).
|
121
|
(2)
|
In December 2010,
$66.7 million
and
$17.0 million
of the City of Forsyth, Montana Pollution Control Revenue Refunding Bonds (Avista Corporation Colstrip Project) due in
2032
and
2034
, respectively, which had been held by Avista Corp. since 2008 and 2009, respectively, were refunded by new bond issues (Series 2010A and Series 2010B). The new bonds were not offered to the public and were purchased by Avista Corp. due to market conditions. The Company expects that at a later date, subject to market conditions, these bonds may be remarketed to unaffiliated investors. So long as Avista Corp. is the holder of these bonds, the bonds will not be reflected as an asset or a liability on Avista Corp.'s Consolidated Balance Sheets.
|
|
(3)
|
In December 2016, Avista Corp. issued and sold
$175.0 million
of
3.54 percent
first mortgage bonds due in
2051
pursuant to a bond purchase agreement with institutional investors in the private placement market. The total net proceeds from the sale of the bonds were used to repay the $70.0 million term loan discussed above and to repay a portion of the borrowings outstanding under the Company’s
$400.0 million
committed line of credit. In connection with the execution of the bond purchase agreement, the Company cash-settled
seven
interest rate swap derivatives (notional aggregate amount of
$125.0 million
) and paid a total of
$54.0 million
.
|
|
(4)
|
Prior to December 31, 2016, settled interest rate swap derivatives were included as part of long-term debt on the Consolidated Balance Sheets because they were considered similar to a debt discount or premium. During 2016, the Company reevaluated the presentation of settled interest rate swap derivatives and determined that since they are regulatory assets and liabilities that are being recovered through the ratemaking process, the more appropriate classification is as regulatory assets and liabilities rather than as a component of long-term debt. As such, as of December 31, 2016, the Company has included unamortized settled interest rate swap derivatives of
$91.9 million
in regulatory assets and
$12.4 million
in regulatory liabilities. The Company did not reclassify any amounts as of December 31, 2015 and prior because the amounts are not material to the financial statements. The increase in settled interest rate swap derivatives during 2016 is due to the cash settlement of interest rate swap derivatives discussed in detail above. There is no impact to the Consolidated Statements of Income and the Consolidated Statements of Cash Flows for any periods as a result of the balance sheet reclassification.
|
The following table details future long-term debt maturities including long-term debt to affiliated trusts (see Note 15) (dollars in thousands):
|
2017
|
2018
|
2019
|
2020
|
2021
|
Thereafter
|
Total
|
|||||||||||||||||||||
|
Debt maturities
|
$
|
—
|
|
$
|
272,500
|
|
$
|
105,000
|
|
$
|
52,000
|
|
$
|
—
|
|
$
|
1,250,047
|
|
$
|
1,679,547
|
|
||||||
Substantially all of Avista Utilities' and AEL&P's owned properties are subject to the lien of their respective mortgage indentures. Under the Mortgages and Deeds of Trust (Mortgages) securing their first mortgage bonds (including secured medium-term notes), Avista Utilities and AEL&P may each issue additional first mortgage bonds under their specific mortgage in an aggregate principal amount equal to the sum of:
|
•
|
66-2/3 percent
of the cost or fair value (whichever is lower) of property additions of that entity which have not previously been made the basis of any application under that entity's Mortgage, or
|
|
•
|
an equal principal amount of retired first mortgage bonds of that entity which have not previously been made the basis of any application under that entity's Mortgage, or
|
|
•
|
deposit of cash.
|
However, Avista Utilities and AEL&P may not individually issue any additional first mortgage bonds (with certain exceptions in the case of bonds issued on the basis of retired bonds) unless the particular entity issuing the bonds has “net earnings” (as defined in that entity's Mortgage) for any period of 12 consecutive calendar months out of the preceding 18 calendar months that were at least twice the annual interest requirements on all mortgage securities at the time outstanding, including the first mortgage bonds to be issued, and on all indebtedness of prior rank. As of
December 31, 2016
, property additions and retired bonds would have allowed, and the net earnings test would not have prohibited, the issuance of
$1.2 billion
in aggregate principal amount of additional first mortgage bonds at Avista Utilities and
$20.8 million
at AEL&P.
Snettisham Capital Lease Obligation
Included in long-term capital leases above is a power purchase agreement between AEL&P and AIDEA, an agency of the State of Alaska, under which AEL&P has a take-or-pay obligation, expiring in December 2038, to purchase all the output of the
78
MW Snettisham Hydroelectric Project. For accounting purposes, this power purchase agreement is treated as a capital lease.
122
The balances related to the Snettisham capital lease obligation as of
December 31
were as follows (dollars in thousands):
|
2016
|
2015
|
|||||||
|
Capital lease obligation (1)
|
$
|
62,160
|
|
$
|
64,455
|
|
||
|
Capital lease asset (2)
|
71,007
|
|
71,007
|
|
||||
|
Accumulated amortization of capital lease asset (2)
|
9,104
|
|
5,462
|
|
||||
|
(1)
|
The capital lease obligation amount is equal to the amount of AIDEA's revenue bonds outstanding.
|
|
(2)
|
These amounts are included in utility plant in service on the Consolidated Balance Sheets.
|
Interest on the capital lease obligation and amortization of the capital lease asset are included in utility resource costs in the Consolidated Statements of Income and totaled the following amounts for the years ended
December 31
(dollars in thousands):
|
2016
|
2015
|
||||||
|
Interest on capital lease obligation
|
$
|
3,157
|
|
$
|
3,587
|
|
|
|
Amortization of capital lease asset
|
3,642
|
|
3,641
|
|
|||
AIDEA issued
$100.0 million
of revenue bonds in 1998 to finance its acquisition of the project and the payments by AEL&P were designed to be sufficient to enable the AIDEA to pay the principal of and interest on its revenue bonds, which bore interest at rates ranging from
4.9 percent
to
6.0 percent
and were set to mature in January 2034.
In August 2015, AIDEA issued
$65.7 million
of new revenue bonds for the purpose of refunding all of the remaining outstanding revenue bonds for the Snettisham Hydroelectric Project. The new revenue bonds have interest rates ranging from
4.0 percent
to
5.0 percent
and mature in January 2034. The capital lease obligation on Avista Corp.'s Consolidated Balance Sheet at any given time is equal to the amount of revenue bonds outstanding at that time. AEL&P is scheduled to make its last capital lease payment to AIDEA in December 2033. The payments by AEL&P under the PPA between AEL&P and AIDEA are unconditional, notwithstanding any suspension, reduction or curtailment of the operation of the project. The bonds are payable solely out of AIDEA's receipts under the power purchase agreement. AEL&P is also obligated to operate, maintain and insure the project. The PPA did not change as a result of the refunding, other than lower capital lease payments, and the lower capital lease payments that resulted from the refunding will be passed through to AEL&P's customers. AEL&P's payments for power under the agreement are between
$10.0 million
and
$10.5 million
per year, including the capital lease principal and interest of approximately
$5.5 million
per year.
Snettisham Electric Company, a non-operating subsidiary of AERC, has the option to purchase the Snettisham project with certain conditions at any time for the principal amount of the bonds outstanding at that time.
While the power purchase agreement is treated as a capital lease for accounting purposes, for ratemaking purposes this agreement is treated as an operating lease with a constant level of annual rental expense (straight line expense). Because of this regulatory treatment, any difference between the operating lease expense for ratemaking purposes and the expenses recognized under capital lease treatment (interest and depreciation of the capital lease asset) is recorded as a regulatory asset and amortized during the later years of the lease when the capital lease expense is less than the operating lease expense included in base rates.
The Company evaluated this agreement to determine if it has a variable interest which must be consolidated. Based on this evaluation, AIDEA will not be consolidated under ASC 810 "Consolidation" because AIDEA is a government agency and ASC 810 has a specific scope exception which does not allow for the consolidation of government organizations.
The following table details future capital lease obligations, including interest, under the Snettisham PPA (dollars in thousands):
|
2017
|
2018
|
2019
|
2020
|
2021
|
Thereafter
|
Total
|
|||||||||||||||||||||
|
Principal
|
$
|
2,415
|
|
$
|
2,535
|
|
$
|
2,660
|
|
$
|
2,800
|
|
$
|
2,935
|
|
$
|
48,815
|
|
$
|
62,160
|
|
||||||
|
Interest
|
3,042
|
|
2,921
|
|
2,795
|
|
2,662
|
|
2,522
|
|
16,674
|
|
30,616
|
|
|||||||||||||
|
Total
|
$
|
5,457
|
|
$
|
5,456
|
|
$
|
5,455
|
|
$
|
5,462
|
|
$
|
5,457
|
|
$
|
65,489
|
|
$
|
92,776
|
|
||||||
In 1997, the Company issued Floating Rate Junior Subordinated Deferrable Interest Debentures, Series B, with a principal amount of
$51.5 million
to Avista Capital II, an affiliated business trust formed by the Company. Avista Capital II issued
$50.0 million
of Preferred Trust Securities with a floating distribution rate of
LIBOR
plus
0.875 percent
, calculated and reset quarterly.
123
The distribution rates paid were as follows during the years ended
December 31
:
|
2016
|
2015
|
2014
|
||||||
|
Low distribution rate
|
1.29
|
%
|
1.11
|
%
|
1.10
|
%
|
||
|
High distribution rate
|
1.81
|
%
|
1.29
|
%
|
1.11
|
%
|
||
|
Distribution rate at the end of the year
|
1.81
|
%
|
1.29
|
%
|
1.11
|
%
|
||
Concurrent with the issuance of the Preferred Trust Securities, Avista Capital II issued
$1.5 million
of Common Trust Securities to the Company. These debt securities may be redeemed at the option of Avista Capital II at any time and mature on June 1, 2037. In December 2000, the Company purchased
$10.0 million
of these Preferred Trust Securities.
The Company owns
100 percent
of Avista Capital II and has solely and unconditionally guaranteed the payment of distributions on, and redemption price and liquidation amount for, the Preferred Trust Securities to the extent that Avista Capital II has funds available for such payments from the respective debt securities. Upon maturity or prior redemption of such debt securities, the Preferred Trust Securities will be mandatorily redeemed. The Company does not include these capital trusts in its consolidated financial statements as Avista Corp. is not the primary beneficiary. As such, the sole assets of the capital trusts are
$51.5 million
of junior subordinated deferrable interest debentures of Avista Corp., which are reflected on the Consolidated Balance Sheets. Interest expense to affiliated trusts in the Consolidated Statements of Income represents interest expense on these debentures.
The carrying values of cash and cash equivalents, accounts and notes receivable, accounts payable and short-term borrowings are reasonable estimates of their fair values. Long-term debt (including current portion and material capital leases) and long-term debt to affiliated trusts are reported at carrying value on the Consolidated Balance Sheets.
The fair value hierarchy prioritizes the inputs used to measure fair value. The hierarchy gives the highest priority to unadjusted quoted prices in active markets for identical assets or liabilities (Level 1 measurements) and the lowest priority to fair values derived from unobservable inputs (Level 3 measurements).
The three levels of the fair value hierarchy are defined as follows:
Level 1 – Quoted prices are available in active markets for identical assets or liabilities. Active markets are those in which transactions for the asset or liability occur with sufficient frequency and volume to provide pricing information on an ongoing basis.
Level 2 – Pricing inputs are other than quoted prices in active markets included in Level 1, but which are either directly or indirectly observable as of the reporting date. Level 2 includes those financial instruments that are valued using models or other valuation methodologies. These models are primarily industry-standard models that consider various assumptions, including quoted forward prices for commodities, time value, volatility factors, and current market and contractual prices for the underlying instruments, as well as other relevant economic measures. Substantially all of these assumptions are observable in the marketplace throughout the full term of the instrument, can be derived from observable data or are supported by observable levels at which transactions are executed in the marketplace.
Level 3 – Pricing inputs include significant inputs that are generally unobservable from objective sources. These inputs may be used with internally developed methodologies that result in management’s best estimate of fair value.
Financial assets and liabilities are classified in their entirety based on the lowest level of input that is significant to the fair value measurement. The Company’s assessment of the significance of a particular input to the fair value measurement requires judgment, and may affect the valuation of fair value assets and liabilities and their placement within the fair value hierarchy levels. The determination of the fair values incorporates various factors that not only include the credit standing of the counterparties involved and the impact of credit enhancements (such as cash deposits and letters of credit), but also the impact of Avista Corp.’s nonperformance risk on its liabilities.
124
The following table sets forth the carrying value and estimated fair value of the Company’s financial instruments not reported at estimated fair value on the Consolidated Balance Sheets as of
December 31
(dollars in thousands):
|
|
2016
|
2015
|
|||||||||||||
|
|
Carrying
Value
|
Estimated
Fair Value
|
Carrying
Value
|
Estimated
Fair Value
|
|||||||||||
|
Long-term debt (Level 2)
|
$
|
951,000
|
|
$
|
1,048,661
|
|
$
|
951,000
|
|
$
|
1,055,797
|
|
|||
|
Long-term debt (Level 3)
|
677,000
|
|
675,251
|
|
592,000
|
|
595,018
|
|
|||||||
|
Snettisham capital lease obligation (Level 3)
|
62,160
|
|
62,800
|
|
64,455
|
|
63,150
|
|
|||||||
|
Long-term debt to affiliated trusts (Level 3)
|
51,547
|
|
38,660
|
|
51,547
|
|
36,083
|
|
|||||||
These estimates of fair value of long-term debt and long-term debt to affiliated trusts were primarily based on available market information, which generally consists of estimated market prices from third party brokers for debt with similar risk and terms. The price ranges obtained from the third party brokers consisted of par values of
75.00
to
122.59
, where a par value of
100.00
represents the carrying value recorded on the Consolidated Balance Sheets. Level 2 long-term debt represents publicly issued bonds with quoted market prices; however, due to their limited trading activity, they are classified as Level 2 because brokers must generate quotes and make estimates using comparable debt with similar risk and terms if there is no trading activity near a period end. Level 3 long-term debt consists of private placement bonds and debt to affiliated trusts, which typically have no secondary trading activity. Fair values in Level 3 are estimated based on market prices from third party brokers using secondary market quotes for debt with similar risk and terms to generate quotes for Avista Corp. bonds. Due to the unique nature of the Snettisham capital lease obligation, the estimated fair value of these items was determined based on a discounted cash flow model using available market information. Prior to December 31, 2016, the Snettisham capital lease obligation was discounted to present value using the Moody's Aaa Corporate discount rate as published by the Federal Reserve. This rate was discontinued during the fourth quarter of 2016, as such going forward, the Company is using the Morgan Markets A Ex-Fin discount rate, which is the closest approximation to the rate previously used.
The following table discloses by level within the fair value hierarchy the Company’s assets and liabilities measured and reported on the Consolidated Balance Sheets as of
December 31, 2016
and
2015
at fair value on a recurring basis (dollars in thousands):
|
Level 1
|
Level 2
|
Level 3
|
Counterparty
and Cash Collateral Netting (1) |
Total
|
|||||||||||||||
|
December 31, 2016
|
|||||||||||||||||||
|
Assets:
|
|||||||||||||||||||
|
Energy commodity derivatives
|
$
|
—
|
|
$
|
47,994
|
|
$
|
—
|
|
$
|
(46,099
|
)
|
$
|
1,895
|
|
||||
|
Level 3 energy commodity derivatives:
|
|||||||||||||||||||
|
Natural gas exchange agreements
|
—
|
|
—
|
|
69
|
|
(69
|
)
|
—
|
|
|||||||||
|
Power exchange agreement
|
—
|
|
—
|
|
25
|
|
(25
|
)
|
—
|
|
|||||||||
|
Foreign currency exchange derivatives
|
—
|
|
5
|
|
—
|
|
(5
|
)
|
—
|
|
|||||||||
|
Interest rate swap derivatives
|
—
|
|
13,098
|
|
—
|
|
(4,348
|
)
|
8,750
|
|
|||||||||
|
Deferred compensation assets:
|
|||||||||||||||||||
|
Fixed income securities (2)
|
1,789
|
|
—
|
|
—
|
|
—
|
|
1,789
|
|
|||||||||
|
Equity securities (2)
|
5,481
|
|
—
|
|
—
|
|
—
|
|
5,481
|
|
|||||||||
|
Total
|
$
|
7,270
|
|
$
|
61,097
|
|
$
|
94
|
|
$
|
(50,546
|
)
|
$
|
17,915
|
|
||||
|
Liabilities:
|
|||||||||||||||||||
|
Energy commodity derivatives
|
$
|
—
|
|
$
|
56,871
|
|
$
|
—
|
|
$
|
(55,957
|
)
|
$
|
914
|
|
||||
|
Level 3 energy commodity derivatives:
|
|||||||||||||||||||
|
Natural gas exchange agreement
|
—
|
|
—
|
|
5,954
|
|
(69
|
)
|
5,885
|
|
|||||||||
|
Power exchange agreement
|
—
|
|
—
|
|
13,474
|
|
(25
|
)
|
13,449
|
|
|||||||||
|
Power option agreement
|
—
|
|
—
|
|
76
|
|
—
|
|
76
|
|
|||||||||
|
Interest rate swap derivatives
|
—
|
|
73,978
|
|
—
|
|
(39,248
|
)
|
34,730
|
|
|||||||||
|
Foreign currency exchange derivatives
|
—
|
|
28
|
|
—
|
|
(5
|
)
|
23
|
|
|||||||||
|
Total
|
$
|
—
|
|
$
|
130,877
|
|
$
|
19,504
|
|
$
|
(95,304
|
)
|
$
|
55,077
|
|
||||
125
|
Level 1
|
Level 2
|
Level 3
|
Counterparty
and Cash Collateral Netting (1) |
Total
|
|||||||||||||||
|
December 31, 2015
|
|||||||||||||||||||
|
Assets:
|
|||||||||||||||||||
|
Energy commodity derivatives
|
$
|
—
|
|
$
|
74,637
|
|
$
|
—
|
|
$
|
(73,954
|
)
|
$
|
683
|
|
||||
|
Level 3 energy commodity derivatives:
|
|||||||||||||||||||
|
Natural gas exchange agreement
|
—
|
|
—
|
|
678
|
|
(678
|
)
|
—
|
|
|||||||||
|
Foreign currency exchange derivatives
|
—
|
|
2
|
|
—
|
|
(2
|
)
|
—
|
|
|||||||||
|
Interest rate swap derivatives
|
—
|
|
1,548
|
|
—
|
|
—
|
|
1,548
|
|
|||||||||
|
Deferred compensation assets:
|
|||||||||||||||||||
|
Fixed income securities (2)
|
1,727
|
|
—
|
|
—
|
|
—
|
|
1,727
|
|
|||||||||
|
Equity securities (2)
|
5,761
|
|
—
|
|
—
|
|
—
|
|
5,761
|
|
|||||||||
|
Total
|
$
|
7,488
|
|
$
|
76,187
|
|
$
|
678
|
|
$
|
(74,634
|
)
|
$
|
9,719
|
|
||||
|
Liabilities:
|
|||||||||||||||||||
|
Energy commodity derivatives
|
$
|
—
|
|
$
|
97,193
|
|
$
|
—
|
|
$
|
(88,480
|
)
|
$
|
8,713
|
|
||||
|
Level 3 energy commodity derivatives:
|
|||||||||||||||||||
|
Natural gas exchange agreement
|
—
|
|
—
|
|
5,717
|
|
(678
|
)
|
5,039
|
|
|||||||||
|
Power exchange agreement
|
—
|
|
—
|
|
21,961
|
|
—
|
|
21,961
|
|
|||||||||
|
Power option agreement
|
—
|
|
—
|
|
124
|
|
—
|
|
124
|
|
|||||||||
|
Foreign currency exchange derivatives
|
—
|
|
19
|
|
—
|
|
(2
|
)
|
17
|
|
|||||||||
|
Interest rate swap derivatives
|
—
|
|
85,498
|
|
—
|
|
—
|
|
85,498
|
|
|||||||||
|
Total
|
$
|
—
|
|
$
|
182,710
|
|
$
|
27,802
|
|
$
|
(89,160
|
)
|
$
|
121,352
|
|
||||
|
(1)
|
The Company is permitted to net derivative assets and derivative liabilities with the same counterparty when a legally enforceable master netting agreement exists. In addition, the Company nets derivative assets and derivative liabilities against any payables and receivables for cash collateral held or placed with these same counterparties.
|
|
(2)
|
These assets are trading securities and are included in other property and investments-net and other non-current assets on the Consolidated Balance Sheets.
|
The difference between the amount of derivative assets and liabilities disclosed in respective levels in the table above and the amount of derivative assets and liabilities disclosed on the Consolidated Balance Sheets is due to netting arrangements with certain counterparties. See Note 6 for additional discussion of derivative netting.
To establish fair value for energy commodity derivatives, the Company uses quoted market prices and forward price curves to estimate the fair value of utility derivative commodity instruments included in Level 2. In particular, electric derivative valuations are performed using market quotes, adjusted for periods in between quotable periods. Natural gas derivative valuations are estimated using New York Mercantile Exchange (NYMEX) pricing for similar instruments, adjusted for basin differences, using market quotes. Where observable inputs are available for substantially the full term of the contract, the derivative asset or liability is included in Level 2.
To establish fair values for interest rate swap derivatives, the Company uses forward market curves for interest rates for the term of the swaps and discounts the cash flows back to present value using an appropriate discount rate. The discount rate is calculated by third party brokers according to the terms of the swap derivatives and evaluated by the Company for reasonableness, with consideration given to the potential non-performance risk by the Company. Future cash flows of the interest rate swap derivatives are equal to the fixed interest rate in the swap compared to the floating market interest rate multiplied by the notional amount for each period.
To establish fair value for foreign currency derivatives, the Company uses forward market curves for Canadian dollars against the US dollar and multiplies the difference between the locked-in price and the market price by the notional amount of the derivative. Forward foreign currency market curves are provided by third party brokers. The Company's credit spread is factored into the locked-in price of the foreign exchange contracts.
Deferred compensation assets and liabilities represent funds held by the Company in a Rabbi Trust for an executive deferral plan. These funds consist of actively traded equity and bond funds with quoted prices in active markets. The balance disclosed
126
in the table above excludes cash and cash equivalents of
$0.4 million
as of
December 31, 2016
and
$0.6 million
as of
December 31, 2015
.
Level 3 Fair Value
Under the power exchange agreement the Company purchases power at a price that is based on the average operating and maintenance (O&M) charges from three surrogate nuclear power plants around the country. To estimate the fair value of this agreement the Company estimates the difference between the purchase price based on the future O&M charges and forward prices for energy. The Company compares the Level 2 brokered quotes and forward price curves described above to an internally developed forward price which is based on the average O&M charges from the three surrogate nuclear power plants for the current year. Because the nuclear power plant O&M charges are only known for one year, all forward years are estimated assuming an annual escalation. In addition to the forward price being estimated using unobservable inputs, the Company also estimates the volumes of the transactions that will take place in the future based on historical average transaction volumes per delivery year (November to April). Significant increases or decreases in any of these inputs in isolation would result in a significantly higher or lower fair value measurement. Generally, a change in the current year O&M charges for the surrogate plants is accompanied by a directionally similar change in O&M charges in future years. There is generally not a correlation between external market prices and the O&M charges used to develop the internal forward price.
For the power commodity option agreement, the Company uses the Black-Scholes-Merton valuation model to estimate the fair value, and this model includes significant inputs not observable or corroborated in the market. These inputs include: 1) the strike price (which is an internally derived price based on a combination of generation plant heat rate factors, natural gas market pricing, delivery and other O&M charges), 2) estimated delivery volumes, and 3) volatility rates. Significant increases or decreases in any of these inputs in isolation would result in a significantly higher or lower fair value measurement. Generally, changes in overall commodity market prices and volatility rates are accompanied by directionally similar changes in the strike price and volatility assumptions used in the calculation.
For the natural gas commodity exchange agreement, the Company uses the same Level 2 brokered quotes described above; however, the Company also estimates the purchase and sales volumes (within contractual limits) as well as the timing of those transactions. Changing the timing of volume estimates changes the timing of purchases and sales, impacting which brokered quote is used. Because the brokered quotes can vary significantly from period to period, the unobservable estimates of the timing and volume of transactions can have a significant impact on the calculated fair value. The Company currently estimates volumes and timing of transactions based on a most likely scenario using historical data. Historically, the timing and volume of transactions have not been highly correlated with market prices and market volatility.
The following table presents the quantitative information which was used to estimate the fair values of the Level 3 assets and liabilities above as of
December 31, 2016
(dollars in thousands):
|
Fair Value (Net) at
|
||||||||||
|
December 31, 2016
|
Valuation Technique
|
Unobservable Input
|
Range
|
|||||||
|
Power exchange agreement
|
$
|
(13,449
|
)
|
Surrogate facility
pricing
|
O&M charges
|
$33.59-$49.15/MWh (1)
|
||||
|
Escalation factor
|
3% - 2017 to 2019
|
|||||||||
|
Transaction volumes
|
241,558 - 396,984 MWhs
|
|||||||||
|
Power option agreement
|
(76
|
)
|
Black-Scholes-
Merton
|
Strike price
|
$37.83/MWh - 2019
|
|||||
|
$54.40/MWh - 2018
|
||||||||||
|
Delivery volumes
|
157,517 - 285,979 MWhs
|
|||||||||
|
Volatility rates
|
0.20 (2)
|
|||||||||
|
Natural gas exchange
agreement
|
(5,885
|
)
|
Internally derived
weighted-average cost of gas |
Forward purchase
prices
|
$1.83 - $3.06/mmBTU
|
|||||
|
Forward sales prices
|
$1.90 - $5.14/mmBTU
|
|||||||||
|
Purchase volumes
|
115,000 - 310,000 mmBTUs
|
|||||||||
|
Sales volumes
|
60,000 - 310,000 mmBTUs
|
|||||||||
(1) The average O&M charges for the delivery year beginning in November 2016 were
$39.22
per MWh. For ratemaking purposes the average O&M charges to be included for recovery in retail rates vary slightly between regulatory jurisdictions. The average O&M charges for the delivery year beginning in 2016 were
$44.33
for Washington and
$39.22
for Idaho.
(2) The estimated volatility rate of
0.20
is compared to actual quoted volatility rates of
0.35
for
2017
to
0.26
in
December
2018
.
127
The valuation methods, significant inputs and resulting fair values described above were developed by the Company's management and are reviewed on at least a quarterly basis to ensure they provide a reasonable estimate of fair value each reporting period.
The following table presents activity for energy commodity derivative assets (liabilities) measured at fair value using significant unobservable inputs (Level 3) for the
years ended December 31
(dollars in thousands):
|
|
Natural Gas Exchange Agreement
|
Power Exchange Agreement
|
Power Option Agreement
|
Total
|
|||||||||||
|
Year ended December 31, 2016:
|
|||||||||||||||
|
Balance as of January 1, 2016
|
$
|
(5,039
|
)
|
$
|
(21,961
|
)
|
$
|
(124
|
)
|
$
|
(27,124
|
)
|
|||
|
Total gains or (losses) (realized/unrealized):
|
|||||||||||||||
|
Included in regulatory assets/liabilities (1)
|
259
|
|
400
|
|
48
|
|
707
|
|
|||||||
|
Settlements
|
(1,105
|
)
|
8,112
|
|
—
|
|
7,007
|
|
|||||||
|
Ending balance as of December 31, 2016 (2)
|
$
|
(5,885
|
)
|
$
|
(13,449
|
)
|
$
|
(76
|
)
|
$
|
(19,410
|
)
|
|||
|
Year ended December 31, 2015:
|
|||||||||||||||
|
Balance as of January 1, 2015
|
$
|
(35
|
)
|
$
|
(23,299
|
)
|
$
|
(424
|
)
|
$
|
(23,758
|
)
|
|||
|
Total gains or (losses) (realized/unrealized):
|
|||||||||||||||
|
Included in regulatory assets/liabilities (1)
|
(6,008
|
)
|
(6,198
|
)
|
300
|
|
(11,906
|
)
|
|||||||
|
Settlements
|
1,004
|
|
7,536
|
|
—
|
|
8,540
|
|
|||||||
|
Ending balance as of December 31, 2015 (2)
|
$
|
(5,039
|
)
|
$
|
(21,961
|
)
|
$
|
(124
|
)
|
$
|
(27,124
|
)
|
|||
|
Year ended December 31, 2014:
|
|||||||||||||||
|
Balance as of January 1, 2014
|
$
|
(1,219
|
)
|
$
|
(14,441
|
)
|
$
|
(775
|
)
|
$
|
(16,435
|
)
|
|||
|
Total gains or (losses) (realized/unrealized):
|
|||||||||||||||
|
Included in regulatory assets/liabilities (1)
|
3,873
|
|
(10,002
|
)
|
351
|
|
(5,778
|
)
|
|||||||
|
Settlements
|
(2,689
|
)
|
1,144
|
|
—
|
|
(1,545
|
)
|
|||||||
|
Ending balance as of December 31, 2014 (2)
|
$
|
(35
|
)
|
$
|
(23,299
|
)
|
$
|
(424
|
)
|
$
|
(23,758
|
)
|
|||
|
(1)
|
All gains and losses are included in other regulatory assets and liabilities. There were no gains and losses included in either net income or other comprehensive income during any of the periods presented in the table above.
|
|
(2)
|
There were no purchases, issuances or transfers from other categories of any derivatives instruments during the periods presented in the table above.
|
The payment of dividends on common stock could be limited by:
|
•
|
certain covenants applicable to preferred stock (when outstanding) contained in the Company’s Restated Articles of Incorporation, as amended (currently there are no preferred shares outstanding),
|
|
•
|
certain covenants applicable to the Company's outstanding long-term debt and committed line of credit agreements,
|
|
•
|
the hydroelectric licensing requirements of section 10(d) of the FPA (see Note 1), and
|
|
•
|
certain requirements under the OPUC approval of the AERC acquisition in 2014. The OPUC's AERC acquisition order requires Avista Utilities to maintain a capital structure of no less than
40 percent
common equity (inclusive of short-term debt). This limitation may be revised upon request by the Company with approval from the OPUC.
|
The Company declared the following dividends for the
year ended December 31
:
|
2016
|
2015
|
2014
|
|||||||||
|
Dividends paid per common share
|
$
|
1.37
|
|
$
|
1.32
|
|
$
|
1.27
|
|
||
128
Under the most restrictive of the dividend limitations discussed above, which are the requirements of the OPUC approval of the AERC acquisition, the amount available for dividends at
December 31, 2016
was limited to
$263.4 million
.
The Company has
10 million
authorized shares of preferred stock. The Company did not have any preferred stock outstanding as of
December 31, 2016
and
2015
.
Stock Repurchase Programs
During 2014 and 2015, Avista Corp.'s Board of Directors approved programs to repurchase shares of the Company's outstanding common stock. The number of shares repurchased and the total cost of repurchases are disclosed in the Consolidated Statements of Equity and Redeemable Noncontrolling Interests. The average repurchase price was
$31.57
in 2014 and
$32.66
in 2015. All repurchased shares reverted to the status of authorized but unissued shares.
Equity Issuances
In March 2016, the Company entered into four separate sales agency agreements under which Avista Corp.’s sales agents may offer and sell up to 3.8 million new shares of Avista Corp.'s common stock, no par value, from time to time. The sales agency agreements expire on February 29, 2020. In
2016
,
1.6 million
shares were issued under these agreements resulting in total net proceeds of
$65.3 million
, leaving
2.2 million
shares remaining to be issued.
In
2016
, the Company also issued
$1.7 million
(net of issuance costs) of common stock under the employee plans.
The following table presents the computation of basic and diluted earnings per common share attributable to Avista Corp. shareholders for the
years ended December 31
(in thousands, except per share amounts):
|
2016
|
2015
|
2014
|
|||||||||
|
Numerator:
|
|||||||||||
|
Net income from continuing operations attributable to Avista Corp. shareholders
|
$
|
137,228
|
|
$
|
118,080
|
|
$
|
119,817
|
|
||
|
Net income from discontinued operations attributable to Avista Corp. shareholders
|
—
|
|
5,147
|
|
72,224
|
|
|||||
|
Subsidiary earnings adjustment for dilutive securities (discontinued operations)
|
—
|
|
—
|
|
5
|
|
|||||
|
Adjusted net income from discontinued operations attributable to Avista Corp. shareholders for computation of diluted earnings per common share
|
$
|
—
|
|
$
|
5,147
|
|
$
|
72,229
|
|
||
|
Denominator:
|
|||||||||||
|
Weighted-average number of common shares outstanding-basic
|
63,508
|
|
62,301
|
|
61,632
|
|
|||||
|
Effect of dilutive securities:
|
|||||||||||
|
Performance and restricted stock awards
|
412
|
|
407
|
|
255
|
|
|||||
|
Weighted-average number of common shares outstanding-diluted
|
63,920
|
|
62,708
|
|
61,887
|
|
|||||
|
Earnings per common share attributable to Avista Corp. shareholders, basic:
|
|||||||||||
|
Earnings per common share from continuing operations
|
$
|
2.16
|
|
$
|
1.90
|
|
$
|
1.94
|
|
||
|
Earnings per common share from discontinued operations
|
$
|
—
|
|
$
|
0.08
|
|
$
|
1.18
|
|
||
|
Total earnings per common share attributable to Avista Corp. shareholders, basic
|
$
|
2.16
|
|
$
|
1.98
|
|
$
|
3.12
|
|
||
|
Earnings per common share attributable to Avista Corp. shareholders, diluted:
|
|||||||||||
|
Earnings per common share from continuing operations
|
$
|
2.15
|
|
$
|
1.89
|
|
$
|
1.93
|
|
||
|
Earnings per common share from discontinued operations
|
$
|
—
|
|
$
|
0.08
|
|
$
|
1.17
|
|
||
|
Total earnings per common share attributable to Avista Corp. shareholders, diluted
|
$
|
2.15
|
|
$
|
1.97
|
|
$
|
3.10
|
|
||
There were no shares excluded from the calculation because they were antidilutive.
129
In the course of its business, the Company becomes involved in various claims, controversies, disputes and other contingent matters, including the items described in this Note. Some of these claims, controversies, disputes and other contingent matters involve litigation or other contested proceedings. For all such matters, the Company intends to vigorously protect and defend its interests and pursue its rights. However, no assurance can be given as to the ultimate outcome of any particular matter because litigation and other contested proceedings are inherently subject to numerous uncertainties. For matters that affect Avista Utilities’ or AEL&P's operations, the Company intends to seek, to the extent appropriate, recovery of incurred costs through the ratemaking process.
California Refund Proceeding
In February 2016, APX, a market maker in the California Refund Proceedings in whose markets Avista Energy participated in the summer of 2000, asserted that Avista Energy and its other customer/participants may be responsible for a share of the disgorgement penalty APX may be found to owe to Pacific Gas & Electric (PG&E), Southern California Edison, San Diego Gas & Electric, the California Attorney General (AG), the California Department of Water Resources (CERS), and the California Public Utilities Commission (together, the “California Parties”). The penalty arises as a result of the FERC's finding that APX committed violations in the California market in the summer of 2000. APX is making these assertions despite Avista Energy having been dismissed in FERC Opinion No. 536 from the on-going administrative proceeding at the FERC regarding potential wrongdoing in the California markets in the summer of 2000. APX has identified Avista Energy’s share of APX’s exposure to be as much as
$16.0 million
even though no wrongdoing allegations are specifically attributable to Avista Energy. Avista Energy believes its settlement with the California Parties in 2014 insulates it from any such liability and that as a dismissed party it cannot be drawn back into the litigation. Avista Energy intends to vigorously dispute APX’s assertions of indirect liability, but cannot at this time predict the eventual outcome.
Pacific Northwest Refund Proceeding
In July 2001, the FERC initiated a preliminary evidentiary hearing to develop a factual record as to whether prices for spot market sales of wholesale energy in the Pacific Northwest between December 25, 2000 and June 20, 2001 were just and reasonable. In June 2003, the FERC terminated the Pacific Northwest refund proceedings, after finding that the equities do not justify the imposition of refunds. In August 2007, the Ninth Circuit found that the FERC had failed to take into account new evidence of market manipulation and that such failure was arbitrary and capricious and, accordingly, remanded the case to the FERC, stating that the FERC's findings must be reevaluated in light of the new evidence. The Ninth Circuit expressly declined to direct the FERC to grant refunds. On October 3, 2011, the FERC issued an Order on Remand and on April 5, 2013 expanded the temporal scope of the proceeding to permit parties to submit evidence on transactions during the period from January 1, 2000 through and including June 20, 2001.
On July 11, 2012 and March 28, 2013, Avista Energy and Avista Corp. filed settlements of all issues in this docket with regard to the claims made by the City of Tacoma and the California AG (on behalf of the California Department of Water Resources). The FERC approved the settlements and they are final.
The remaining direct claimant against Avista Corp. and Avista Energy in this proceeding was the City of Seattle, Washington (Seattle). An evidentiary, trial type hearing before an Administrative Law Judge (ALJ) to permit parties to present evidence of unlawful market activity was conducted in 2013.
With regard to the Seattle claims, on March 28, 2014, the Presiding ALJ issued an Initial Decision finding that: 1) Seattle failed to demonstrate that either Avista Corp. or Avista Energy engaged in unlawful market activity and also failed to identify any specific contracts at issue; 2) Seattle failed to demonstrate that contracts with either Avista Corp. or Avista Energy imposed an excessive burden on consumers or seriously harmed the public interest; and that 3) Seattle failed to demonstrate that either Avista Corp. or Avista Energy engaged in any specific violations of substantive provisions of the FPA or any filed tariffs or rate schedules. Accordingly, the ALJ denied all of Seattle’s claims under both section 206 and section 309 of the FPA. On May 22, 2015, the FERC issued its Order on Initial Decision in which it upheld the ALJ’s Initial Decision denying all of Seattle’s claims against Avista Corp. and Avista Energy. Seattle filed a Request for Rehearing of the FERC’s Order on Initial Decision which was denied on December 31, 2015. Seattle appealed the FERC’s decision to the Ninth Circuit. In October 2016, Seattle settled all of the matters with the remaining parties and withdrew its appeal at the Ninth Circuit. All the remaining parties signed the settlement agreement and a petition to dismiss the case was filed with the Ninth Circuit on October 27, 2016
.
There are no remaining claims outstanding under this proceeding. The settlement did not have a material adverse effect on the Company's financial condition, results of operations or cash flows.
130
Sierra Club and Montana Environmental Information Center Litigation
In 2013, the Sierra Club and Montana Environmental Information Center (MEIC) (collectively "Plaintiffs"), filed a Complaint in the United States District Court for the District of Montana, Billings Division, against the Owners of the Colstrip Generating Project ("Colstrip"); Avista Corp. owns a 15 percent interest in Units 3 & 4 of Colstrip. The other Colstrip co-Owners are Talen Montana, LLC (formerly PPL Montana, LLC, an indirect subsidiary of Talen Energy Corporation), Puget Sound Energy, Portland General Electric Company, NorthWestern Energy and PacifiCorp. The Complaint alleged certain violations of the Clean Air Act, including the New Source Review, Title V and opacity requirements with respect to post-January 1, 2001 Colstrip projects. The Plaintiffs requested that the Court grant injunctive and declaratory relief, order remediation of alleged environmental damages, impose civil penalties, require a beneficial environmental project in the areas affected by the alleged air pollution and require payment of Plaintiffs’ costs of litigation and attorney fees.
The liability trial was scheduled to start on May 31, 2016. The parties engaged in settlement discussions with the Plaintiffs to resolve the claims raised in the litigation. On July 12, 2016, the parties filed a proposed Consent Decree with the court which contained the terms of the settlement of the matter with respect to all four units at Colstrip. The settlement does not include any monetary payments by any party, dismisses all claims against all four units, and provides for the shut-down of units 1 & 2 (which are owned solely by Talen Montana, LLC and Puget Sound Energy) no later than July, 2022. The Consent Decree was entered on September 6, 2016. The parties have petitioned the Court for costs and attorneys’ fees. The Court denied the defendant's claim for fees and reduced the plaintiff's claimed fees from approximately $3.0 million to $1.6 million. On February 15, 2017 the Court issued an Order adopting this resolution in full and closing the case.
The Company does not expect that this matter will have a material adverse effect on its financial condition, results of operations or cash flows.
Cabinet Gorge Total Dissolved Gas Abatement Plan
Dissolved atmospheric gas levels (referred to as "Total Dissolved Gas" or "TDG") in the Clark Fork River exceed state of Idaho and federal water quality numeric standards downstream of Cabinet Gorge particularly during periods when excess river flows must be diverted over the spillway. Under the terms of the Clark Fork Settlement Agreement (CFSA) as incorporated in Avista Corp.’s FERC license for the Clark Fork Project, Avista Corp. has worked in consultation with agencies, tribes and other stakeholders to address this issue. Under the terms of a gas supersaturation mitigation plan, Avista is reducing TDG by constructing spill crest modifications on spill gates at the dam, and the Company expects to continue spill crest modifications over the next several years, in ongoing consultation with key stakeholders. Avista Corp. cannot at this time predict the outcome or estimate a range of costs associated with this contingency; however, the Company will continue to seek recovery, through the ratemaking process, of all operating and capitalized costs related to this issue.
Fish Passage at Cabinet Gorge and Noxon Rapids
In 1999, the United States Fish and Wildlife Service (USFWS) listed bull trout as threatened under the Endangered Species Act. In 2010, the USFWS issued a revised designation of critical habitat for bull trout, which includes the lower Clark Fork River. The USFWS issued a final recovery plan in October 2015.
The CFSA describes programs intended to help restore bull trout populations in the project area. Using the concept of adaptive management and working closely with the USFWS, the Company evaluated the feasibility of fish passage at Cabinet Gorge and Noxon Rapids. The results of these studies led, in part, to the decision to move forward with development of permanent facilities, among other bull trout enhancement efforts. Parties to the CFSA are working to resolve several issues. The Company believes its ongoing efforts through the CFSA continue to effectively address issues related to bull trout. Avista Corp. cannot at this time predict the outcome or estimate a range of costs associated with this contingency; however, the Company will continue to seek recovery, through the ratemaking process, of all operating and capitalized costs related to fish passage at Cabinet Gorge and Noxon Rapids.
Collective Bargaining Agreements
The Company’s collective bargaining agreements with the IBEW represent approximately
45 percent
of all of Avista Utilities’ employees. A new three-year agreement with the local union in Washington and Idaho representing the majority (approximately
90 percent
) of the Avista Utilities' bargaining unit employees was approved in March 2016 and expires in March 2019.
A three-year agreement in Oregon, which covers approximately
50
employees was set to expire in March 2017. A new three-year agreement has been approved by the IBEW membership that will expire in March 2020. It is still awaiting approval from the National IBEW.
131
A collective bargaining agreement with the local union of the IBEW in Alaska expires in March 2017. The collective bargaining agreement with the IBEW in Alaska represents approximately
50 percent
of all AERC employees. The remainder of AERC's employees are non-union.
There is a risk that if collective bargaining agreements expire and new agreements are not reached in each of our jurisdictions, employees could strike. Given the magnitude of employees that are covered by collective bargaining agreements, this could result in disruptions of our operations. However, the Company believes that the possibility of this occurring is remote.
Other Contingencies
In the normal course of business, the Company has various other legal claims and contingent matters outstanding. The Company believes that any ultimate liability arising from these actions will not have a material impact on its financial condition, results of operations or cash flows. It is possible that a change could occur in the Company’s estimates of the probability or amount of a liability being incurred. Such a change, should it occur, could be significant.
The Company routinely assesses, based on studies, expert analyses and legal reviews, its contingencies, obligations and commitments for remediation of contaminated sites, including assessments of ranges and probabilities of recoveries from other responsible parties who either have or have not agreed to a settlement as well as recoveries from insurance carriers. The Company’s policy is to accrue and charge to current expense identified exposures related to environmental remediation sites based on estimates of investigation, cleanup and monitoring costs to be incurred. For matters that affect Avista Utilities’ or AEL&P's operations, the Company seeks, to the extent appropriate, recovery of incurred costs through the ratemaking process.
The Company has potential liabilities under the Endangered Species Act for species of fish, plants and wildlife that have either already been added to the endangered species list, listed as “threatened” or petitioned for listing. Thus far, measures adopted and implemented have had minimal impact on the Company. However, the Company will continue to seek recovery, through the ratemaking process, of all operating and capitalized costs related to these issues.
Under the federal licenses for its hydroelectric projects, the Company is obligated to protect its property rights, including water rights. In addition, the company holds additional non-hydro water rights. The state of Montana is examining the status of all water right claims within state boundaries through a general adjudication. Claims within the Clark Fork River basin could adversely affect the energy production of the Company’s Cabinet Gorge and Noxon Rapids hydroelectric facilities. The state of Idaho has initiated adjudication in northern Idaho, which will ultimately include the lower Clark Fork River, the Spokane River and the Coeur d’Alene basin. The Company is and will continue to be a participant in these and any other relevant adjudication processes. The complexity of such adjudications makes each unlikely to be concluded in the foreseeable future. As such, it is not possible for the Company to estimate the impact of any outcome at this time. The Company will continue to seek recovery, through the ratemaking process, of all operating and capitalized costs related to this issue.
132
Regulatory Assets and Liabilities
The following table presents the Company’s regulatory assets and liabilities as of
December 31, 2016
(dollars in thousands):
|
|
|
Receiving
Regulatory Treatment
|
|
|
|
|||||||||||||||||
|
|
Remaining
Amortization
Period
|
(1)
Earning
A Return
|
Not
Earning
A Return
|
(2)
Expected
Recovery or Refund
|
Total
2016 |
Total
2015 |
||||||||||||||||
|
Regulatory Assets:
|
||||||||||||||||||||||
|
Investment in exchange power-net
|
2019
|
|
$
|
6,533
|
|
$
|
—
|
|
$
|
—
|
|
$
|
6,533
|
|
$
|
8,983
|
|
|||||
|
Regulatory assets for deferred income tax
|
(3
|
)
|
101,372
|
|
8,481
|
|
—
|
|
109,853
|
|
101,240
|
|
||||||||||
|
Regulatory assets for pensions and other postretirement benefit plans
|
(4
|
)
|
—
|
|
240,114
|
|
—
|
|
240,114
|
|
235,009
|
|
||||||||||
|
Current regulatory asset for energy commodity derivatives
|
(5
|
)
|
—
|
|
11,365
|
|
—
|
|
11,365
|
|
17,260
|
|
||||||||||
|
Unamortized debt repurchase costs
|
(6
|
)
|
13,700
|
|
—
|
|
—
|
|
13,700
|
|
15,520
|
|
||||||||||
|
Regulatory asset for settlement with Coeur d’Alene Tribe
|
2059
|
|
45,265
|
|
—
|
|
—
|
|
45,265
|
|
46,576
|
|
||||||||||
|
Demand side management programs
|
(3
|
)
|
—
|
|
15,700
|
|
—
|
|
15,700
|
|
3,168
|
|
||||||||||
|
Deferred maintenance costs
|
2018
|
|
—
|
|
2,672
|
|
—
|
|
2,672
|
|
4,823
|
|
||||||||||
|
Decoupling surcharge
|
2018
|
|
43,126
|
|
—
|
|
—
|
|
43,126
|
|
13,312
|
|
||||||||||
|
Regulatory asset for utility plant to be abandoned
|
(7
|
)
|
19,100
|
|
—
|
|
—
|
|
19,100
|
|
—
|
|
||||||||||
|
Regulatory asset for interest rate swaps
|
(8
|
)
|
37,912
|
|
—
|
|
123,596
|
|
161,508
|
|
83,973
|
|
||||||||||
|
Non-current regulatory asset for energy commodity derivatives
|
(5
|
)
|
—
|
|
16,919
|
|
—
|
|
16,919
|
|
32,420
|
|
||||||||||
|
Other regulatory assets
|
(3
|
)
|
3,633
|
|
5,755
|
|
4,585
|
|
13,973
|
|
17,348
|
|
||||||||||
|
Total regulatory assets
|
$
|
270,641
|
|
$
|
301,006
|
|
$
|
128,181
|
|
$
|
699,828
|
|
$
|
579,632
|
|
|||||||
|
Regulatory Liabilities:
|
||||||||||||||||||||||
|
Natural gas deferrals
|
(3
|
)
|
$
|
30,820
|
|
$
|
—
|
|
$
|
—
|
|
$
|
30,820
|
|
$
|
17,880
|
|
|||||
|
Power deferrals
|
(3
|
)
|
23,528
|
|
—
|
|
—
|
|
23,528
|
|
18,747
|
|
||||||||||
|
Regulatory liability for utility plant retirement costs
|
(9
|
)
|
273,983
|
|
—
|
|
—
|
|
273,983
|
|
261,594
|
|
||||||||||
|
Income tax related liabilities
|
(3
|
)
|
—
|
|
28,966
|
|
—
|
|
28,966
|
|
17,609
|
|
||||||||||
|
Regulatory liability for interest rate swaps
|
(8
|
)
|
12,442
|
|
—
|
|
8,749
|
|
21,191
|
|
23
|
|
||||||||||
|
Provision for earnings sharing rebate
|
(3
|
)
|
—
|
|
3,697
|
|
6,600
|
|
10,297
|
|
12,237
|
|
||||||||||
|
Decoupling rebate
|
2017
|
|
2,405
|
|
—
|
|
—
|
|
2,405
|
|
2,373
|
|
||||||||||
|
Other regulatory liabilities
|
(3
|
)
|
2,505
|
|
3,257
|
|
—
|
|
5,762
|
|
3,420
|
|
||||||||||
|
Total regulatory liabilities
|
$
|
345,683
|
|
$
|
35,920
|
|
$
|
15,349
|
|
$
|
396,952
|
|
$
|
333,883
|
|
|||||||
|
(1)
|
Earning a return includes either interest on the regulatory asset/liability or a return on the investment as a component of rate base at the allowed rate of return.
|
|
(2)
|
Expected recovery is pending regulatory treatment including regulatory assets and liabilities with prior regulatory precedence.
|
|
(3)
|
Remaining amortization period varies depending on timing of underlying transactions.
|
|
(4)
|
As the Company has historically recovered and currently recovers its pension and other postretirement benefit costs related to its regulated operations in retail rates, the Company records a regulatory asset for that portion of its pension and other postretirement benefit funding deficiency.
|
133
|
(5)
|
The UTC and the IPUC issued accounting orders authorizing Avista Corp. to offset energy commodity derivative assets or liabilities with a regulatory asset or liability. This accounting treatment is intended to defer the recognition of mark-to-market gains and losses on energy commodity transactions until the period of settlement, subject to approval for recovery through retail rates. Realized gains and losses, subject to regulatory approval, result in adjustments to retail rates through purchased gas cost adjustments, the ERM in Washington, the PCA mechanism in Idaho, and periodic general rates cases.
|
|
(6)
|
For the Company’s Washington jurisdiction and for any debt repurchases beginning in 2007 in all jurisdictions, premiums paid to repurchase debt are amortized over the remaining life of the original debt that was repurchased or, if new debt is issued in connection with the repurchase, these costs are amortized over the life of the new debt. In the Company’s other regulatory jurisdictions, premiums paid to repurchase debt prior to 2007 are being amortized over the average remaining maturity of outstanding debt when no new debt was issued in connection with the debt repurchase. These costs are included in the Company's cost of debt calculation for ratemaking purposes and are recovered through retail rates.
|
|
(7)
|
In March 2016, the UTC granted the Company's Petition for an Accounting Order to defer and include in a regulatory asset the undepreciated value of its existing Washington electric meters for the opportunity for later recovery. This accounting treatment is related to the Company's plan to replace approximately 253,000 of its existing electric meters with new two-way digital meters and the related software and support services through its AMI project in Washington State. Replacement of the meters is expected to begin in the second half of 2017. For ratemaking purposes, the existing electric meters won't be recorded as regulatory assets until they are physically removed from service, but for GAAP purposes, they are regulatory assets upon the commitment by management to retire the meters.
|
|
(8)
|
For interest rate swap derivatives, each period Avista Utilities records all mark-to-market gains and losses in each accounting period as assets and liabilities and records offsetting regulatory assets and liabilities, such that there is no income statement impact. This is similar to the treatment of energy commodity derivatives described above. Upon settlement of interest rate swap derivatives, the regulatory asset or liability is amortized as a component of interest expense over the term of the associated debt and are also included as a part of the Company's cost of debt calculation for ratemaking purposes. See Note 14 regarding a reclassification of settled interest rate swap derivatives during 2016. Settled interest rate swap derivatives which have been through a general rate case proceeding are classified as earning a return in the table above, whereas all unsettled interest rate swap derivatives and settled interest rate swap derivatives which have not been included in a general rate case are classified as expected recovery.
|
|
(9)
|
This amount is dependent upon the cost of removal of underlying utility plant assets and the life of utility plant.
|
Power Cost Deferrals and Recovery Mechanisms
Deferred power supply costs are recorded as a deferred charge on the Consolidated Balance Sheets for future prudence review and recovery through retail rates. The power supply costs deferred include certain differences between actual net power supply costs incurred by Avista Utilities and the costs included in base retail rates. This difference in net power supply costs primarily results from changes in:
|
•
|
short-term wholesale market prices and sales and purchase volumes,
|
|
•
|
the level and availability of hydroelectric generation,
|
|
•
|
the level and availability of thermal generation (including changes in fuel prices), and
|
|
•
|
retail loads.
|
In Washington, the ERM allows Avista Utilities to periodically increase or decrease electric rates with UTC approval to reflect changes in power supply costs. The ERM is an accounting method used to track certain differences between actual power supply costs, net of wholesale sales and sales of fuel, and the amount included in base retail rates for Washington customers. The Washington ERM calculation is subject to certain deadbands and sharing bands. For
2016
, the Company recognized a pre-tax benefit of
$5.1 million
under the ERM in Washington compared to a benefit of
$6.3 million
for
2015
. Total net deferred power costs under the ERM were a liability of
$21.3 million
as of
December 31, 2016
compared to a liability of
$18.0 million
as of
December 31, 2015
, and these deferred power cost balances represent amounts due to customers.
Avista Utilities has a PCA mechanism in Idaho that allows it to modify electric rates on October 1 of each year with IPUC approval. Under the PCA mechanism, Avista Utilities defers 90 percent of the difference between certain actual net power supply expenses and the amount included in base retail rates for its Idaho customers. The October 1 rate adjustments recover or rebate power costs deferred during the preceding July-June twelve-month period. Total net power supply costs deferred under the PCA mechanism were a liability of
$2.2 million
as of
December 31, 2016
compared to an asset of
$0.2 million
as of
December 31, 2015
.
134
Natural Gas Cost Deferrals and Recovery Mechanisms
Avista Utilities files a PGA in all three states it serves to adjust natural gas rates for: 1) estimated commodity and pipeline transportation costs to serve natural gas customers for the coming year, and 2) the difference between actual and estimated commodity and transportation costs for the prior year. Total net deferred natural gas costs to be refunded to customers were a liability of
$30.8 million
as of
December 31, 2016
compared to a liability of
$17.9 million
as of
December 31, 2015
.
Decoupling and Earnings Sharing Mechanisms
Decoupling is a mechanism designed to sever the link between a utility's revenues and consumers' energy usage. In each of Avista Utilities' jurisdictions, each month Avista Utilities' electric and natural gas revenues are adjusted so as to be based on the number of customers in certain customer rate classes, rather than KWh and therm sales. The difference between revenues based on the number of customers and revenues based on actual usage is deferred and either surcharged or rebated to customers beginning in the following year.
Washington Decoupling and Earnings Sharing
In Washington, the UTC approved the Company's decoupling mechanisms for electric and natural gas for a five-year period beginning January 1, 2015. Electric and natural gas decoupling surcharge rate adjustments to customers are limited to
3 percent
on an annual basis, with any remaining surcharge balance carried forward for recovery in a future period. There is no limit on the level of rebate rate adjustments.
The electric and natural gas decoupling mechanisms each include an after-the-fact earnings test. At the end of each calendar year, separate electric and natural gas earnings calculations will be made for the prior calendar year. These earnings tests will reflect actual decoupled revenues, normalized power supply costs and other normalizing adjustments. See below for a summary of cumulative balances under the decoupling and earnings sharing mechanisms.
Idaho Fixed Cost Adjustment (FCA) and Earnings Sharing Mechanisms
In Idaho, the IPUC approved the implementation of FCAs for electric and natural gas (similar in operation and effect to the Washington decoupling mechanisms) for an initial term of three years, beginning January 1, 2016.
For the period 2013 through 2015 the Company had an after-the-fact earnings test, such that if Avista Corp., on a consolidated basis for electric and natural gas operations in Idaho, earned more than a
9.8 percent
ROE, the Company was required to share with customers 50 percent of any earnings above the
9.8 percent
. There was no provision for a surcharge to customers if the Company's ROE was less than
9.8 percent
. This after-the-fact earnings test was discontinued as part of the settlement of the Company's 2015 Idaho electric and natural gas general rates cases. See below for a summary of cumulative balances under the decoupling and earnings sharing mechanisms.
Oregon Decoupling Mechanism
In February 2016, the OPUC approved the implementation of a decoupling mechanism for natural gas, similar to the Washington and Idaho mechanisms described above. The decoupling mechanism became effective on March 1, 2016 and there will be an opportunity for interested parties to review the mechanism and recommend changes, if any, by September 2019. An earnings review is conducted on an annual basis, which is filed by the Company with the OPUC on or before June 1 of each year for the prior calendar year. In the annual earnings review, if the Company earns more than 100 basis points above its allowed return on equity, one-third of the earnings above the 100 basis points would be deferred and later returned to customers. The earnings review is separate from the decoupling mechanism and was in place prior to decoupling. See below for a summary of cumulative balances under the decoupling and earnings sharing mechanisms.
135
Cumulative Decoupling and Earnings Sharing Mechanism Balances
As of
December 31, 2016
and
December 31, 2015
, the Company had the following cumulative balances outstanding related to decoupling and earnings sharing mechanisms in its various jurisdictions (dollars in thousands):
|
December 31,
|
December 31,
|
||||||
|
|
2016
|
2015
|
|||||
|
Washington
|
|||||||
|
Decoupling surcharge
|
$
|
30,408
|
|
$
|
10,933
|
|
|
|
Provision for earnings sharing rebate
|
(5,113
|
)
|
(3,422
|
)
|
|||
|
Idaho
|
|||||||
|
Decoupling surcharge
|
$
|
8,292
|
|
n/a
|
|
||
|
Provision for earnings sharing rebate
|
(5,184
|
)
|
(8,814
|
)
|
|||
|
Oregon
|
|||||||
|
Decoupling surcharge
|
$
|
2,021
|
|
n/a
|
|
||
|
Provision for earnings sharing rebate
|
—
|
|
—
|
|
|||
(n/a) This mechanism did not exist during this time period.
The business segment presentation reflects the basis used by the Company's management to analyze performance and determine the allocation of resources. The Company's management evaluates performance based on income (loss) from operations before income taxes as well as net income (loss) attributable to Avista Corp. shareholders. The accounting policies of the segments are the same as those described in the summary of significant accounting policies. Avista Utilities' business is managed based on the total regulated utility operation; therefore, it is considered one segment. AEL&P is a separate reportable business segment as it has separate financial reports that are reviewed in detail by the Chief Operating Decision Maker and its operations and risks are sufficiently different from Avista Utilities and the other businesses at AERC that it cannot be aggregated with any other operating segments. The Other category, which is not a reportable segment, includes other investments and operations of various subsidiaries, as well as certain other operations of Avista Capital.
The following table presents information for each of the Company’s business segments (dollars in thousands):
|
Avista
Utilities
|
Alaska Electric Light and Power Company
|
Total Utility
|
Other
|
Intersegment
Eliminations
(1)
|
Total
|
||||||||||||||||||
|
For the year ended December 31, 2016:
|
|||||||||||||||||||||||
|
Operating revenues
|
$
|
1,372,638
|
|
$
|
46,276
|
|
$
|
1,418,914
|
|
$
|
23,569
|
|
$
|
—
|
|
$
|
1,442,483
|
|
|||||
|
Resource costs
|
539,352
|
|
12,014
|
|
551,366
|
|
—
|
|
—
|
|
551,366
|
|
|||||||||||
|
Other operating expenses
|
304,644
|
|
11,151
|
|
315,795
|
|
25,501
|
|
—
|
|
341,296
|
|
|||||||||||
|
Depreciation and amortization
|
155,162
|
|
5,352
|
|
160,514
|
|
769
|
|
—
|
|
161,283
|
|
|||||||||||
|
Income (loss) from operations
|
277,070
|
|
15,434
|
|
292,504
|
|
(2,701
|
)
|
—
|
|
289,803
|
|
|||||||||||
|
Interest expense (2)
|
83,070
|
|
3,584
|
|
86,654
|
|
608
|
|
(132
|
)
|
87,130
|
|
|||||||||||
|
Income taxes
|
74,121
|
|
5,321
|
|
79,442
|
|
(1,356
|
)
|
—
|
|
78,086
|
|
|||||||||||
|
Net income (loss) from continuing operations attributable to Avista Corp. shareholders
|
132,490
|
|
7,968
|
|
140,458
|
|
(3,230
|
)
|
—
|
|
137,228
|
|
|||||||||||
|
Capital expenditures (3)
|
390,690
|
|
15,954
|
|
406,644
|
|
353
|
|
—
|
|
406,997
|
|
|||||||||||
136
|
Avista
Utilities
|
Alaska Electric Light and Power Company
|
Total Utility
|
Other
|
Intersegment
Eliminations
(1)
|
Total
|
||||||||||||||||||
|
For the year ended December 31, 2015:
|
|||||||||||||||||||||||
|
Operating revenues
|
$
|
1,411,863
|
|
$
|
44,778
|
|
$
|
1,456,641
|
|
$
|
28,685
|
|
$
|
(550
|
)
|
$
|
1,484,776
|
|
|||||
|
Resource costs
|
644,991
|
|
11,973
|
|
656,964
|
|
—
|
|
—
|
|
656,964
|
|
|||||||||||
|
Other operating expenses
|
292,096
|
|
11,125
|
|
303,221
|
|
30,076
|
|
(550
|
)
|
332,747
|
|
|||||||||||
|
Depreciation and amortization
|
138,236
|
|
5,263
|
|
143,499
|
|
695
|
|
—
|
|
144,194
|
|
|||||||||||
|
Income (loss) from operations
|
241,228
|
|
14,072
|
|
255,300
|
|
(2,086
|
)
|
—
|
|
253,214
|
|
|||||||||||
|
Interest expense (2)
|
76,405
|
|
3,558
|
|
79,963
|
|
610
|
|
(132
|
)
|
80,441
|
|
|||||||||||
|
Income taxes
|
64,489
|
|
4,202
|
|
68,691
|
|
(1,242
|
)
|
—
|
|
67,449
|
|
|||||||||||
|
Net income (loss) from continuing operations attributable to Avista Corp. shareholders
|
113,360
|
|
6,641
|
|
120,001
|
|
(1,921
|
)
|
—
|
|
118,080
|
|
|||||||||||
|
Capital expenditures (3)
|
381,174
|
|
12,251
|
|
393,425
|
|
885
|
|
—
|
|
394,310
|
|
|||||||||||
|
For the year ended December 31, 2014:
|
|||||||||||||||||||||||
|
Operating revenues
|
$
|
1,413,499
|
|
$
|
21,644
|
|
$
|
1,435,143
|
|
$
|
39,219
|
|
$
|
(1,800
|
)
|
$
|
1,472,562
|
|
|||||
|
Resource costs
|
672,344
|
|
5,900
|
|
678,244
|
|
—
|
|
—
|
|
678,244
|
|
|||||||||||
|
Other operating expenses
|
280,964
|
|
5,868
|
|
286,832
|
|
32,218
|
|
(1,800
|
)
|
317,250
|
|
|||||||||||
|
Depreciation and amortization
|
126,987
|
|
2,583
|
|
129,570
|
|
610
|
|
—
|
|
130,180
|
|
|||||||||||
|
Income from operations
|
239,976
|
|
6,221
|
|
246,197
|
|
6,391
|
|
—
|
|
252,588
|
|
|||||||||||
|
Interest expense (2)
|
73,750
|
|
1,382
|
|
75,132
|
|
1,004
|
|
(384
|
)
|
75,752
|
|
|||||||||||
|
Income taxes
|
67,634
|
|
1,816
|
|
69,450
|
|
2,790
|
|
—
|
|
72,240
|
|
|||||||||||
|
Net income from continuing operations attributable to Avista Corp. shareholders
|
113,263
|
|
3,152
|
|
116,415
|
|
3,236
|
|
166
|
|
119,817
|
|
|||||||||||
|
Capital expenditures (3)
|
323,931
|
|
1,585
|
|
325,516
|
|
406
|
|
—
|
|
325,922
|
|
|||||||||||
|
Total Assets:
|
|||||||||||||||||||||||
|
As of December 31, 2016
|
$
|
4,975,555
|
|
$
|
273,770
|
|
$
|
5,249,325
|
|
$
|
60,430
|
|
$
|
—
|
|
$
|
5,309,755
|
|
|||||
|
As of December 31, 2015
|
$
|
4,601,708
|
|
$
|
265,735
|
|
$
|
4,867,443
|
|
$
|
39,206
|
|
$
|
—
|
|
$
|
4,906,649
|
|
|||||
|
As of December 31, 2014
|
$
|
4,357,760
|
|
$
|
263,070
|
|
$
|
4,620,830
|
|
$
|
80,141
|
|
$
|
—
|
|
$
|
4,700,971
|
|
|||||
|
(1)
|
Intersegment eliminations reported as operating revenues and resource costs represent intercompany purchases and sales of electric capacity and energy between Avista Utilities and Spokane Energy (included in other). Intersegment eliminations reported as interest expense and net income (loss) attributable to Avista Corp. shareholders represent intercompany interest.
|
|
(2)
|
Including interest expense to affiliated trusts.
|
|
(3)
|
The capital expenditures for the other businesses are included as other capital expenditures on the Consolidated Statements of Cash Flows. The remainder of the balance included in other capital expenditures on the Consolidated Statements of Cash Flows for 2014 are related to Ecova.
|
The Company’s energy operations are significantly affected by weather conditions. Consequently, there can be large variances in revenues, expenses and net income between quarters based on seasonal factors such as, but not limited to, temperatures and streamflow conditions.
137
A summary of quarterly operations (in thousands, except per share amounts) for
2016
and
2015
follows:
|
|
Three Months Ended
|
||||||||||||||
|
|
March 31
|
June 30
|
September 30
|
December 31
|
|||||||||||
|
2016
|
|||||||||||||||
|
Operating revenues
|
$
|
418,173
|
|
$
|
318,838
|
|
$
|
303,349
|
|
$
|
402,123
|
|
|||
|
Operating expenses
|
312,088
|
|
257,247
|
|
263,755
|
|
319,590
|
|
|||||||
|
Income from operations
|
$
|
106,085
|
|
$
|
61,591
|
|
$
|
39,594
|
|
$
|
82,533
|
|
|||
|
Net income (1)
|
57,665
|
|
27,287
|
|
12,261
|
|
40,103
|
|
|||||||
|
Net income attributable to noncontrolling interests
|
(16
|
)
|
(33
|
)
|
(27
|
)
|
(12
|
)
|
|||||||
|
Net income attributable to Avista Corporation shareholders (1)
|
$
|
57,649
|
|
$
|
27,254
|
|
$
|
12,234
|
|
$
|
40,091
|
|
|||
|
Outstanding common stock:
|
|||||||||||||||
|
weighted-average, basic
|
62,605
|
|
63,386
|
|
63,857
|
|
64,185
|
|
|||||||
|
weighted-average, diluted
|
62,907
|
|
63,783
|
|
64,325
|
|
64,620
|
|
|||||||
|
Earnings per common share attributable to Avista Corp. shareholders, diluted (1)
|
$
|
0.92
|
|
$
|
0.43
|
|
$
|
0.19
|
|
$
|
0.62
|
|
|||
|
|
Three Months Ended
|
||||||||||||||
|
|
March 31
|
June 30
|
September 30
|
December 31
|
|||||||||||
|
2015
|
|||||||||||||||
|
Operating revenues from continuing operations
|
$
|
446,490
|
|
$
|
337,332
|
|
$
|
313,649
|
|
$
|
387,305
|
|
|||
|
Operating expenses from continuing operations
|
356,915
|
|
279,972
|
|
277,737
|
|
316,938
|
|
|||||||
|
Income from continuing operations
|
$
|
89,575
|
|
$
|
57,360
|
|
$
|
35,912
|
|
$
|
70,367
|
|
|||
|
Net income from continuing operations
|
$
|
46,462
|
|
$
|
25,078
|
|
$
|
12,754
|
|
$
|
33,876
|
|
|||
|
Net income from discontinued operations
|
—
|
|
196
|
|
289
|
|
4,662
|
|
|||||||
|
Net income
|
46,462
|
|
25,274
|
|
13,043
|
|
38,538
|
|
|||||||
|
Net income attributable to noncontrolling interests
|
(13
|
)
|
(28
|
)
|
(32
|
)
|
(17
|
)
|
|||||||
|
Net income attributable to Avista Corporation shareholders
|
$
|
46,449
|
|
$
|
25,246
|
|
$
|
13,011
|
|
$
|
38,521
|
|
|||
|
Amounts attributable to Avista Corp. shareholders:
|
|||||||||||||||
|
Net income from continuing operations attributable to Avista Corp. shareholders
|
$
|
46,449
|
|
$
|
25,050
|
|
$
|
12,722
|
|
$
|
33,859
|
|
|||
|
Net income from discontinued operations attributable to Avista Corp. shareholders
|
—
|
|
196
|
|
289
|
|
4,662
|
|
|||||||
|
Net income attributable to Avista Corp. shareholders
|
$
|
46,449
|
|
$
|
25,246
|
|
$
|
13,011
|
|
$
|
38,521
|
|
|||
|
Outstanding common stock:
|
|||||||||||||||
|
weighted-average, basic
|
62,318
|
|
62,281
|
|
62,299
|
|
62,308
|
|
|||||||
|
weighted-average, diluted
|
62,889
|
|
62,600
|
|
62,688
|
|
62,758
|
|
|||||||
|
Earnings per common share attributable to Avista Corp. shareholders, diluted:
|
|||||||||||||||
|
Earnings per common share from continuing operations
|
$
|
0.74
|
|
$
|
0.40
|
|
$
|
0.21
|
|
$
|
0.54
|
|
|||
|
Earnings per common share from discontinued operations
|
—
|
|
—
|
|
—
|
|
0.07
|
|
|||||||
|
Total earnings per common share attributable to Avista Corp. shareholders, diluted
|
$
|
0.74
|
|
$
|
0.40
|
|
$
|
0.21
|
|
$
|
0.61
|
|
|||
|
(1)
|
The Company adopted ASU 2016-09 during the second quarter of 2016, with a retrospective effective date of January 1, 2016. The adoption of this standard resulted in a recognized income tax benefit of
$1.6 million
in 2016 associated with excess tax benefits on settled share-based employee payments. Because this standard was adopted in the second quarter of 2016, but has a retrospective effective date of January 1, 2016, the effects from the adoption were pushed back to the first quarter of 2016 and the results for that quarter were recast in the presentation above. In all future reports which include the first quarter of 2016, the results for that quarter will be recast to include the effects of the excess tax benefits recognized.
|
138
Not applicable.
Conclusion Regarding the Effectiveness of Disclosure Controls and Procedures
The Company has disclosure controls and procedures (as defined in Rules 13a-15(e) and 15d-15(e) under the Securities Exchange Act of 1934, as amended (Act) that are designed to ensure that information required to be disclosed in the reports it files or submits under the Act is recorded, processed, summarized and reported on a timely basis. Disclosure controls and procedures include, without limitation, controls and procedures designed to ensure that information required to be disclosed by the Company in the reports that it files or submits under the Act is accumulated and communicated to the Company’s management, including its principal executive and principal financial officers, as appropriate, to allow timely decisions regarding required disclosure. With the participation of the Company’s principal executive officer and principal financial officer, the Company's management evaluated its disclosure controls and procedures as of the end of the period covered by this report. There are inherent limitations to the effectiveness of any system of disclosure controls and procedures, including the possibility of human error and the circumvention or overriding of the controls and procedures. Accordingly, even effective disclosure controls and procedures can only provide reasonable assurance of achieving their control objectives. Based upon this evaluation, the Company’s principal executive officer and principal financial officer have concluded that the Company’s disclosure controls and procedures are effective at a reasonable assurance level as of
December 31, 2016
.
Management’s Report on Internal Control Over Financial Reporting
The Company’s management, together with its consolidated subsidiaries, is responsible for establishing and maintaining adequate internal control over financial reporting (as defined in Rule 13a-15(f) under the Securities Exchange Act of 1934). The Company’s internal control over financial reporting is a process designed under the supervision of the Company’s principal executive officer and principal financial officer to provide reasonable assurance regarding the reliability of financial reporting and the preparation of the Company’s financial statements for external reporting purposes in accordance with accounting principles generally accepted in the United States of America.
The Company’s internal control over financial reporting includes policies and procedures that pertain to the maintenance of records that, in reasonable detail, accurately and fairly reflect transactions and dispositions of assets; provide reasonable assurances that transactions are recorded as necessary to permit preparation of financial statements in accordance with accounting principles generally accepted in the United States of America, and that receipts and expenditures are being made only in accordance with authorizations of management and the directors of the Company; and provide reasonable assurance regarding prevention or timely detection of unauthorized acquisition, use or disposition of the Company’s assets that could have a material effect on the Company’s financial statements.
Under the supervision and with the participation of the Company’s management, including the Company’s principal executive officer and principal financial officer, the Company conducted an assessment of the effectiveness of the Company’s internal control over financial reporting based on the framework established in Internal Control-Integrated Framework (2013) issued by the Committee of Sponsoring Organizations of the Treadway Commission. Based on this assessment, management determined that the Company’s internal control over financial reporting as of
December 31, 2016
is effective at a reasonable assurance level.
The Company’s independent registered public accounting firm, Deloitte & Touche LLP, has issued an attestation report on the Company’s internal control over financial reporting as of
December 31, 2016
.
Changes in Internal Control Over Financial Reporting
There have been no changes in the Company’s internal control over financial reporting that occurred during the Company’s last fiscal quarter that has materially affected, or is reasonably likely to materially affect, the Company’s internal control over financial reporting.
139
REPORT OF INDEPENDENT REGISTERED PUBLIC ACCOUNTING FIRM
To the Board of Directors and Shareholders of
Avista Corporation
Spokane, Washington
We have audited the internal control over financial reporting of Avista Corporation and subsidiaries (the “Company”) as of December 31, 2016, based on criteria established in
Internal Control - Integrated Framework (2013)
issued by the Committee of Sponsoring Organizations of the Treadway Commission. The Company’s management is responsible for maintaining effective internal control over financial reporting and for its assessment of the effectiveness of internal control over financial reporting, included in the accompanying
Management’s Report on Internal Control Over Financial Reporting
. Our responsibility is to express an opinion on the Company’s internal control over financial reporting based on our audit.
We conducted our audit in accordance with the standards of the Public Company Accounting Oversight Board (United States). Those standards require that we plan and perform the audit to obtain reasonable assurance about whether effective internal control over financial reporting was maintained in all material respects. Our audit included obtaining an understanding of internal control over financial reporting, assessing the risk that a material weakness exists, testing and evaluating the design and operating effectiveness of internal control based on the assessed risk, and performing such other procedures as we considered necessary in the circumstances. We believe that our audit provides a reasonable basis for our opinion.
A company's internal control over financial reporting is a process designed by, or under the supervision of, the company's principal executive and principal financial officers, or persons performing similar functions, and effected by the company's board of directors, management, and other personnel to provide reasonable assurance regarding the reliability of financial reporting and the preparation of financial statements for external purposes in accordance with generally accepted accounting principles. A company's internal control over financial reporting includes those policies and procedures that (1) pertain to the maintenance of records that, in reasonable detail, accurately and fairly reflect the transactions and dispositions of the assets of the company; (2) provide reasonable assurance that transactions are recorded as necessary to permit preparation of financial statements in accordance with generally accepted accounting principles, and that receipts and expenditures of the company are being made only in accordance with authorizations of management and directors of the company; and (3) provide reasonable assurance regarding prevention or timely detection of unauthorized acquisition, use, or disposition of the company's assets that could have a material effect on the financial statements.
Because of the inherent limitations of internal control over financial reporting, including the possibility of collusion or improper management override of controls, material misstatements due to error or fraud may not be prevented or detected on a timely basis. Also, projections of any evaluation of the effectiveness of the internal control over financial reporting to future periods are subject to the risk that the controls may become inadequate because of changes in conditions, or that the degree of compliance with the policies or procedures may deteriorate.
In our opinion, the Company maintained, in all material respects, effective internal control over financial reporting as of December 31, 2016, based on the criteria established in
Internal Control - Integrated Framework (2013)
issued by the Committee of Sponsoring Organizations of the Treadway Commission.
We have also audited, in accordance with the standards of the Public Company Accounting Oversight Board (United States), the consolidated financial statements as of and for the year ended December 31, 2016 of the Company and our report dated February 21, 2017 expressed an unqualified opinion on those financial statements.
/s/ Deloitte & Touche LLP
Seattle, Washington
February 21, 2017
140
None.
The information required by this Item (other than the information regarding executive officers and the Company's Code of Business Conduct and Ethics set forth below) is omitted pursuant to General Instruction G to Form 10-K. Such information is incorporated herein by reference as follows:
|
•
|
on and after the date of filing with the SEC the Registrant's definitive Proxy Statement relating to its Annual Meeting of Shareholders scheduled to be held on
May 11, 2017
, from such Proxy Statement; and
|
|
•
|
prior to such date, from the Registrant's definitive Proxy Statement, dated
March 31, 2016
, relating to its Annual Meeting of Shareholders held on
May 12, 2016
.
|
|
Executive Officers of the Registrant
|
|||||
|
Name
|
Age
|
Business Experience
|
|||
|
Scott L. Morris
|
59
|
|
Chairman, President and Chief Executive Officer effective January 1, 2008. Director since February 9, 2007; President and Chief Operating Officer May 2006 – December 2007; Senior Vice President February 2002 – May 2006; Vice President November 2000 – February 2002; President – Avista Utilities August 2000 – December 2008; General Manager – Avista Utilities for the Oregon and California operations October 1991 – August 2000; various other management and staff positions with the Company since 1981.
|
||
|
Mark T. Thies
|
53
|
|
Treasurer since January 2013; Senior Vice President and Chief Financial Officer (Principal Financial Officer) since September 2008; prior to employment with the Company held the following positions with Black Hills Corporation: Executive Vice President and Chief Financial Officer March 2003 to January 2008; Senior Vice President and Chief Financial Officer March 2000 to March 2003; Controller May 1997 to March 2000.
|
||
|
Marian M. Durkin
|
63
|
|
Senior Vice President, General Counsel and Chief Compliance Officer since November 2005; Corporate Secretary since May 2016; Senior Vice President and General Counsel August 2005 – November 2005; prior to employment with the Company: held several legal positions with United Air Lines, Inc. from 1995 to August 2005, most recently served as Vice President Deputy General Counsel and Assistant Secretary.
|
||
|
Karen S. Feltes
|
61
|
|
Senior Vice President of Human Resources since November 2005; Corporate Secretary November 2005 – April 2016; Vice President of Human Resources and Corporate Secretary March 2003 – November 2005; Vice President of Human Resources and Corporate Services February 2002 – March 2003; various human resources positions with the Company April 1998 – February 2002.
|
||
|
Dennis P. Vermillion
|
55
|
|
Senior Vice President since January 2010; Vice President July 2007- December 2009; President – Avista Utilities since January 2009; Vice President of Energy Resources and Optimization – Avista Utilities July 2007 – December 2008; President and Chief Operating Officer of Avista Energy February 2001 – July 2007; various other management and staff positions with the Company since 1985.
|
||
|
Jason R. Thackston
|
47
|
|
Senior Vice President since January 2014; Vice President of Energy Resources since December 2012; Vice President of Customer Solutions – Avista Utilities June 2012 - December 2012; Vice President of Energy Delivery April 2011 – December 2012; Vice President of Finance June 2009 – April 2011; various other management and staff positions with the Company since 1996.
|
||
|
Ryan L. Krasselt
|
47
|
|
Vice President, Controller and Principal Accounting Officer since October 2015; various other management and staff positions with the Company since 2001.
|
||
|
Kevin J. Christie
|
49
|
|
Vice President of Customer Solutions since February 2015; various other management and staff positions with the Company since 2005.
|
||
|
James M. Kensok
|
58
|
|
Vice President and Chief Information Officer since January 2007; Chief Information Officer February 2001 – December 2006; various other management and staff positions with the Company since 1996.
|
||
|
David J. Meyer
|
63
|
|
Vice President and Chief Counsel for Regulatory and Governmental Affairs since February 2004; Senior Vice President and General Counsel September 1998 – February 2004.
|
||
141
|
Executive Officers of the Registrant
|
|||||
|
Name
|
Age
|
Business Experience
|
|||
|
Kelly O. Norwood
|
58
|
|
Vice President since November 2000; Vice President of State and Federal Regulation – Avista Utilities since March 2002; Vice President and General Manager of Energy Resources - Avista Utilities August 2000 – March 2002; various other management and staff positions with the Company since 1981.
|
||
|
Heather L. Rosentrater
|
39
|
|
Vice President of Energy Delivery since December 2015; various other management and staff positions with the Company since 1996.
|
||
|
Edward D. Schlect Jr.
|
56
|
|
Vice President and Chief Strategy Officer since September 2015; prior to employment with the Company, Executive Vice President of Corporate Development at Ecova, Inc.
|
||
All of the Company’s executive officers, with the exception of James M. Kensok, David J. Meyer, Kelly O. Norwood, Kevin J. Christie and Heather L. Rosentrater were officers or directors of one or more of the Company’s subsidiaries in
2016
. The Company’s executive officers are elected annually by the Board of Directors.
The Company has adopted a Code of Conduct for directors, officers (including the principal executive officer, principal financial officer and principal accounting officer), and employees. The Code of Conduct is available on the Company’s website at www.avistacorp.com and will also be provided to any shareholder without charge upon written request to:
Avista Corp.
General Counsel
P.O. Box 3727 MSC-12
Spokane, Washington 99220-3727
Any changes to or waivers for executive officers and directors of the Company’s Code of Conduct will be posted on the Company’s website.
The information required by this Item is omitted pursuant to General Instruction G to Form 10-K. Such information is incorporated herein by reference as follows:
|
•
|
on and after the date of filing with the SEC the Registrant's definitive Proxy Statement relating to its Annual Meeting of Shareholders scheduled to be held on
May 11, 2017
, from such Proxy Statement; and
|
|
•
|
prior to such date, from the Registrant's definitive Proxy Statement, dated
March 31, 2016
, relating to its Annual Meeting of Shareholders held on
May 12, 2016
.
|
|
(a)
|
Security ownership of certain beneficial owners (owning 5 percent or more of Registrant’s voting securities):
|
Information regarding security ownership of certain beneficial owners (owning 5 percent or more of Registrant’s voting securities) has been omitted pursuant to General Instruction G to Form 10-K. Such information is incorporated herein by reference as follows:
|
•
|
on and after the date of filing with the SEC the Registrant's definitive Proxy Statement relating to its Annual Meeting of Shareholders scheduled to be held on
May 11, 2017
, from such Proxy Statement; and
|
|
•
|
prior to such date, from the Registrant's definitive Proxy Statement, dated
March 31, 2016
, relating to its Annual Meeting of Shareholders held on
May 12, 2016
; reference also being made to Schedules 13G, as amended, in file with the SEC with respect to the Registrant's voting securities (the information contained in such schedules 13G, as amended, not being incorporated herein by reference).
|
|
(b)
|
Security ownership of management:
|
The information required by this Item regarding the security ownership of management is omitted pursuant to General Instruction G to Form 10-K. Such information is incorporated herein by reference as follows:
|
•
|
on and after the date of filing with the SEC the Registrant's definitive Proxy Statement relating to its Annual Meeting of Shareholders scheduled to be held on
May 11, 2017
, from such Proxy Statement; and
|
|
•
|
prior to such date, from the Registrant's definitive Proxy Statement, dated
March 31, 2016
, relating to its Annual Meeting of Shareholders held on
May 12, 2016
.
|
142
|
(c)
|
Changes in control:
|
None.
|
(d)
|
Securities authorized for issuance under equity compensation plans as of
December 31, 2016
:
|
|
Plan category
|
(a)
Number of securities to be
issued upon exercise of
outstanding options,
warrants and rights
|
(b)
Weighted average
exercise price of
outstanding options,
warrants and rights
|
(c)
Number of securities remaining
available for future issuance under
equity compensation plans
(excluding securities reflected in
column (a))
|
||||||
|
(1)
|
|||||||||
|
Equity compensation plans approved by security holders (2)
|
—
|
|
$
|
—
|
|
1,752,979
|
|
||
|
(1)
|
Excludes unvested restricted shares and performance share awards granted under Avista Corp.’s Long-Term Incentive Plan. At
December 31, 2016
,
109,806
Restricted Share awards were outstanding. Performance and market-based share awards may be paid out at zero shares at a minimum achievement level;
332,680
shares at target level; or
665,360
shares at a maximum level. Because there is no exercise price associated with restricted shares or performance and market-based share awards, such shares are not included in the weighted-average price calculation.
|
|
(2)
|
Includes the Long-Term Incentive Plan approved by shareholders in 1998 and the Non-Employee Director Stock Plan approved by shareholders in 1996. In February 2005, the Board of Directors elected to terminate the Non-Employee Director Stock Plan.
|
The information required by this Item is omitted pursuant to General Instruction G to Form 10-K. Such information is incorporated herein by reference as follows:
|
•
|
on and after the date of filing with the SEC the Registrant's definitive Proxy Statement relating to its Annual Meeting of Shareholders scheduled to be held on
May 11, 2017
, from such Proxy Statement; and
|
|
•
|
prior to such date, from the Registrant's definitive Proxy Statement, dated
March 31, 2016
, relating to its Annual Meeting of Shareholders held on
May 12, 2016
.
|
143
|
(a)
|
1. Financial Statements (Included in Part II of this report):
|
Report of Independent Registered Public Accounting Firm
Consolidated Statements of Income for the Years Ended December 31,
2016
,
2015
and
2014
Consolidated Statements of Comprehensive Income for the Years Ended December 31,
2016
,
2015
and
2014
Consolidated Balance Sheets as of December 31,
2016
and
2015
Consolidated Statements of Cash Flows for the Years Ended December 31,
2016
,
2015
and
2014
Consolidated Statements of Equity and Redeemable Noncontrolling Interests for the Years Ended December 31,
2016
,
2015
and
2014
Notes to Consolidated Financial Statements
|
(a)
|
2. Financial Statement Schedules:
|
None
|
(a)
|
3. Exhibits:
|
Reference is made to the Exhibit Index commencing on page 147. The Exhibits include the management contracts and compensatory plans or arrangements required to be filed as exhibits to this Form 10-K pursuant to Item 15(b).
144
SIGNATURES
Pursuant to the requirements of Section 13 or 15(d) of the Securities Exchange Act of 1934, the Registrant has duly caused this report to be signed on its behalf by the undersigned, thereunto duly authorized.
|
|
AVISTA CORPORATION
|
||||
|
February 21, 2017
|
|
By
|
/s/ Scott L. Morris
|
||
|
Date
|
|
Scott L. Morris
|
|||
|
|
Chairman of the Board, President and Chief Executive Officer
|
||||
Pursuant to the requirements of the Securities Exchange Act of 1934, this report has been signed below by the following persons on behalf of the Registrant and in the capacities and on the dates indicated.
|
Signature
|
Title
|
Date
|
|
/s/ Scott L. Morris
|
Principal Executive Officer
|
February 21, 2017
|
|
Scott L. Morris
|
||
|
Chairman of the Board, President
and Chief Executive Officer
|
||
|
/s/ Mark T. Thies
|
Principal Financial Officer
|
February 21, 2017
|
|
Mark T. Thies (Senior Vice President,
Chief Financial Officer, and Treasurer)
|
||
|
/s/ Ryan L. Krasselt
|
Principal Accounting Officer
|
February 21, 2017
|
|
Ryan L. Krasselt (Vice President,
Controller and Principal Accounting Officer)
|
||
|
/s/ Erik J. Anderson
|
Director
|
February 21, 2017
|
|
Erik J. Anderson
|
||
|
/s/ Kristianne Blake
|
Director
|
February 21, 2017
|
|
Kristianne Blake
|
||
|
/s/ Donald C. Burke
|
Director
|
February 21, 2017
|
|
Donald C. Burke
|
||
|
/s/ John F. Kelly
|
Director
|
February 21, 2017
|
|
John F. Kelly
|
||
|
/s/ Rebecca A. Klein
|
Director
|
February 21, 2017
|
|
Rebecca A. Klein
|
||
|
/s/ Marc F. Racicot
|
Director
|
February 21, 2017
|
|
Marc F. Racicot
|
||
145
|
/s/ Heidi B. Stanley
|
Director
|
February 21, 2017
|
|
Heidi B. Stanley
|
||
|
/s/ R. John Taylor
|
Director
|
February 21, 2017
|
|
R. John Taylor
|
||
|
/s/ Janet D. Widmann
|
Director
|
February 21, 2017
|
|
Janet D. Widmann
|
||
|
/s/ Scott H. Maw
|
Director
|
February 21, 2017
|
|
Scott H. Maw
|
||
146
EXHIBIT INDEX
|
|
Previously Filed (1)
|
|
||||
|
Exhibit
|
With
Registration Number |
As
Exhibit |
|
|||
|
3.1
|
(with June 30, 2012 Form 10-Q)
|
3.1
|
Restated Articles of Incorporation of Avista Corporation, as amended and restated June 6, 2012.
|
|||
|
3.2
|
(with Form 8-K filed as of November 14, 2014)
|
3.2
|
Bylaws of Avista Corporation, as amended November 14, 2014.
|
|||
|
4.1
|
2-4077
|
B-3
|
Mortgage and Deed of Trust, dated as of June 1, 1939.
|
|||
|
4.2
|
2-9812
|
4(c)
|
First Supplemental Indenture, dated as of October 1, 1952.
|
|||
|
4.3
|
2-60728
|
2(b)-2
|
Second Supplemental Indenture, dated as of May 1, 1953.
|
|||
|
4.4
|
2-13421
|
4(b)-3
|
Third Supplemental Indenture, dated as of December 1, 1955.
|
|||
|
4.5
|
2-13421
|
4(b)-4
|
Fourth Supplemental Indenture, dated as of March 15, 1967.
|
|||
|
4.6
|
2-60728
|
2(b)-5
|
Fifth Supplemental Indenture, dated as of July 1, 1957.
|
|||
|
4.7
|
2-60728
|
2(b)-6
|
Sixth Supplemental Indenture, dated as of January 1, 1958.
|
|||
|
4.8
|
2-60728
|
2(b)-7
|
Seventh Supplemental Indenture, dated as of August 1, 1958.
|
|||
|
4.9
|
2-60728
|
2(b)-8
|
Eighth Supplemental Indenture, dated as of January 1, 1959.
|
|||
|
4.10
|
2-60728
|
2(b)-9
|
Ninth Supplemental Indenture, dated as of January 1, 1960.
|
|||
|
4.11
|
2-60728
|
2(b)-10
|
Tenth Supplemental Indenture, dated as of April 1, 1964.
|
|||
|
4.12
|
2-60728
|
2(b)-11
|
Eleventh Supplemental Indenture, dated as of March 1, 1965.
|
|||
|
4.13
|
2-60728
|
2(b)-12
|
Twelfth Supplemental Indenture, dated as of May 1, 1966.
|
|||
|
4.14
|
2-60728
|
2(b)-13
|
Thirteenth Supplemental Indenture, dated as of August 1, 1966.
|
|||
|
4.15
|
2-60728
|
2(b)-14
|
Fourteenth Supplemental Indenture, dated as of April 1, 1970.
|
|||
|
4.16
|
2-60728
|
2(b)-15
|
Fifteenth Supplemental Indenture, dated as of May 1, 1973.
|
|||
|
4.17
|
2-60728
|
2(b)-16
|
Sixteenth Supplemental Indenture, dated as of February 1, 1975.
|
|||
|
4.18
|
2-60728
|
2(b)-17
|
Seventeenth Supplemental Indenture, dated as of November 1, 1976.
|
|||
|
4.19
|
2-69080
|
2(b)-18
|
Eighteenth Supplemental Indenture, dated as of June 1, 1980.
|
|||
|
4.20
|
(with 1980 Form 10-K)
|
4(a)-20
|
Nineteenth Supplemental Indenture, dated as of January 1, 1981.
|
|||
|
4.21
|
2-79571
|
4(a)-21
|
Twentieth Supplemental Indenture, dated as of August 1, 1982.
|
|||
|
4.22
|
(with Form 8-K dated September 20, 1983)
|
4(a)-22
|
Twenty-First Supplemental Indenture, dated as of September 1, 1983.
|
|||
|
4.23
|
2-94816
|
4(a)-23
|
Twenty-Second Supplemental Indenture, dated as of March 1, 1984.
|
|||
147
|
|
Previously Filed (1)
|
|
||||
|
Exhibit
|
With
Registration Number |
As
Exhibit |
|
|||
|
4.24
|
(with 1986 Form 10-K)
|
4(a)-24
|
Twenty-Third Supplemental Indenture, dated as of December 1, 1986.
|
|||
|
4.25
|
(with 1987 Form 10-K)
|
4(a)-25
|
Twenty-Fourth Supplemental Indenture, dated as of January 1, 1988.
|
|||
|
4.26
|
(with 1989 Form 10-K)
|
4(a)-26
|
Twenty-Fifth Supplemental Indenture, dated as of October 1, 1989.
|
|||
|
4.27
|
33-51669
|
4(a)-27
|
Twenty-Sixth Supplemental Indenture, dated as of April 1, 1993.
|
|||
|
4.28
|
(with 1993 Form 10-K)
|
4(a)-28
|
Twenty-Seventh Supplemental Indenture, dated as of January 1, 1994.
|
|||
|
4.29
|
(with 2001 Form 10-K)
|
4(a)-29
|
Twenty-Eighth Supplemental Indenture, dated as of September 1, 2001.
|
|||
|
4.30
|
333-82502
|
4(b)
|
Twenty-Ninth Supplemental Indenture, dated as of December 1, 2001.
|
|||
|
4.31
|
(with June 30, 2002 Form 10-Q)
|
4(f)
|
Thirtieth Supplemental Indenture, dated as of May 1, 2002.
|
|||
|
4.32
|
333-39551
|
4(b)
|
Thirty-First Supplemental Indenture, dated as of May 1, 2003.
|
|||
|
4.33
|
(with September 30, 2003 Form 10-Q)
|
4(f)
|
Thirty-Second Supplemental Indenture, dated as of September 1, 2003.
|
|||
|
4.34
|
333-64652
|
4(a)33
|
Thirty-Third Supplemental Indenture, dated as of May 1, 2004.
|
|||
|
4.35
|
(with Form 8-K dated as of December 15, 2004)
|
4.1
|
Thirty-Fourth Supplemental Indenture, dated as of November 1, 2004.
|
|||
|
4.36
|
(with Form 8-K dated as of December 15, 2004)
|
4.2
|
Thirty-Fifth Supplemental Indenture, dated as of December 1, 2004.
|
|||
|
4.37
|
(with Form 8-K dated as of December 15, 2004)
|
4.3
|
Thirty-Sixth Supplemental Indenture, dated as of December 1, 2004.
|
|||
|
4.38
|
(with Form 8-K dated as of December 15, 2004)
|
4.4
|
Thirty-Seventh Supplemental Indenture, dated as of December 1, 2004.
|
|||
|
4.39
|
(with Form 8-K dated as of May 12, 2005)
|
4.1
|
Thirty-Eighth Supplemental Indenture, dated as of May 1, 2005.
|
|||
|
4.40
|
(with Form 8-K dated as of November 17, 2005)
|
4.1
|
Thirty-Ninth Supplemental Indenture, dated as of November 1, 2005.
|
|||
|
4.41
|
(with Form 8-K dated as of April 6, 2006)
|
4.1
|
Fortieth Supplemental Indenture, dated as of April 1, 2006.
|
|||
|
4.42
|
(with Form 8-K dated as of December 15, 2006)
|
4.1
|
Forty-First Supplemental Indenture, dated as of December 1, 2006.
|
|||
|
4.43
|
(with Form 8-K dated as of April 3, 2008)
|
4.1
|
Forty-Second Supplemental Indenture, dated as of April 1, 2008.
|
|||
|
4.44
|
(with Form 8-K dated as of November 26, 2008)
|
4.1
|
Forty-Third Supplemental Indenture, dated as of November 1, 2008.
|
|||
|
4.45
|
(with Form 8-K dated as of December 16, 2008)
|
4.1
|
Forty-Fourth Supplemental Indenture, dated as of December 1, 2008.
|
|||
|
4.46
|
(with Form 8-K dated as of December 30, 2008)
|
4.3
|
Forty-Fifth Supplemental Indenture, dated as of December 1, 2008.
|
|||
|
4.47
|
(with Form 8-K dated as of September 15, 2009)
|
4.1
|
Forty-Sixth Supplemental Indenture, dated as of September 1, 2009.
|
|||
|
4.48
|
(with Form 8-K dated as of November 25, 2009)
|
4.1
|
Forty-Seventh Supplemental Indenture, dated as of November 1, 2009.
|
|||
|
4.49
|
(with Form 8-K dated as of December 15, 2010)
|
4.5
|
Forty-Eighth Supplemental Indenture, dated as of December 1, 2010.
|
|||
|
4.50
|
(with Form 8-K dated as of December 20, 2010)
|
4.1
|
Forty-Ninth Supplemental Indenture, dated as of December 1, 2010.
|
|||
148
|
|
Previously Filed (1)
|
|
||||
|
Exhibit
|
With
Registration Number |
As
Exhibit |
|
|||
|
4.51
|
(with Form 8-K dated as of December 30, 2010)
|
4.1
|
Fiftieth Supplemental Indenture, dated as of December 1, 2010.
|
|||
|
4.52
|
(with Form 8-K dated as of February 11, 2011)
|
4.1
|
Fifty-First Supplemental Indenture, dated as of February 1, 2011.
|
|||
|
4.53
|
(with Form 8-K dated as of August 16, 2011)
|
4.1
|
Fifty-Second Supplemental Indenture, dated as of August 1, 2011.
|
|||
|
4.54
|
(with Form 8-K dated as of December 14, 2011)
|
4.1
|
Fifty-Third Supplemental Indenture, dated as of December 1, 2011.
|
|||
|
4.55
|
(with Form 8-K dated as of November 30, 2012)
|
4.1
|
Fifty-Fourth Supplemental Indenture, dated as of November 1, 2012.
|
|||
|
4.56
|
(with Form 8-K dated as of August 14, 2013)
|
4.1
|
Fifty-Fifth Supplemental Indenture, dated as of August 1, 2013.
|
|||
|
4.57
|
(with Form 8-K dated as of April 18, 2014)
|
4.1
|
Fifty-Sixth Supplemental Indenture, dated as of April 1, 2014.
|
|||
|
4.58
|
(with Form 8-K dated as of December 18, 2014)
|
4.1
|
Fifty-Seventh Supplemental Indenture, dated as of December 1, 2014.
|
|||
|
4.59
|
(with Form 8-K dated as of December 16, 2015)
|
4.1
|
Fifty-Eighth Supplemental Indenture, dated as of December 1, 2015.
|
|||
|
4.60
|
(with Form 8-K dated as of December 16, 2016)
|
4.1
|
Fifty-Ninth Supplemental Indenture, dated as of December 1, 2016.
|
|||
|
4.61
|
(with Form 8-K dated as of December 15, 2004)
|
4.5
|
Supplemental Indenture No. 1, dated as of December 1, 2004 to the Indenture dated as of April 1, 1998 between Avista Corporation and JPMorgan Chase Bank, N.A.
|
|||
|
4.62
|
333-82165
|
4(a)
|
Indenture dated as of April 1, 1998 between Avista Corporation and The Bank of New York, as Successor Trustee.
|
|||
|
4.63
|
(with Form 8-K dated as of December 15, 2010)
|
4.1
|
Loan Agreement between City of Forsyth, Montana and Avista Corporation $66,700,000 City of Forsyth, Montana Pollution Control Revenue Refunding Bonds (Avista Corporation Colstrip Project) Series 2010A dated as of December 1, 2010.
|
|||
|
4.64
|
(with Form 8-K dated as of December 15, 2010)
|
4.3
|
Trust Indenture between City of Forsyth, and the Bank of New York Mellon Trust Company, N.A., as Trustee, $66,700,000 City of Forsyth, Montana Pollution Control Revenue Refunding Bonds (Avista Corporation Colstrip Project) Series 2010A, dated as of December 1, 2010.
|
|||
|
4.65
|
(with Form 8-K dated as of December 15, 2010)
|
4.2
|
Loan Agreement between City of Forsyth, Montana and Avista Corporation $17,000,000 City of Forsyth, Montana Pollution Control Revenue Refunding Bonds (Avista Corporation Colstrip Project) Series 2010B dated as of December 1, 2010.
|
|||
|
4.66
|
(with Form 8-K dated as of December 15, 2010)
|
4.4
|
Trust Indenture between City of Forsyth, and the Bank of New York Mellon Trust Company, N.A., as Trustee, $17,000,000 City of Forsyth, Montana Pollution Control Revenue Refunding Bonds (Avista Corporation Colstrip Project) Series 2010B, dated as of December 1, 2010.
|
|||
|
4.67
|
(with June 30, 2012 Form 10-Q)
|
3.1
|
Restated Articles of Incorporation of Avista Corporation, as amended and restated June 6, 2012 (see Exhibit 3.1 herein).
|
|||
|
4.68
|
(with Form 8-K filed as of November 14, 2014)
|
3.2
|
Bylaws of Avista Corporation, as amended November 14, 2014 (see Exhibit 3.2 herein).
|
|||
|
4.69
|
(Form 10/A)
|
N/A
|
Post-Effective Amendment No. 1 on Form 10/A, filed February 26, 2015, to Registration Statement on Form 10, filed September 1952.
|
|||
|
10.1
|
(with Form 8-K dated as of February 11, 2011)
|
10.1
|
Credit Agreement, dated as of February 11, 2011, among Avista Corporation, the Banks Party hereto, The Bank of New York Mellon, Keybank National Association, and U.S. Bank National Association, as Co-Documentation Agents, Wells Fargo Bank National Association as Syndication Agent and an Issuing Bank, and Union Bank N.A. as Administrative Agent and an Issuing Bank.
|
|||
149
|
|
Previously Filed (1)
|
|
||||
|
Exhibit
|
With
Registration Number |
As
Exhibit |
|
|||
|
10.2
|
(with Form 8-K dated as of April 18, 2014)
|
10.1
|
Second Amendment to Credit Agreement, dated as of April 18, 2014, among Avista Corporation, Wells Fargo Bank, National Association, as an Issuing Bank, Union Bank, N.A. as Administrative Agent and an Issuing Bank, and the financial institutions identified hereof as Continuing Lenders and Exiting Lender.
|
|||
|
10.3
|
(with Form 8-K dated as of April 18, 2014)
|
10.2
|
Bond Delivery Agreement, dated as of April 18, 2014, between Avista Corporation and Union Bank, N.A.
|
|||
|
10.4
|
(with Form 8-K dated as of December 14, 2011)
|
10.1
|
First Amendment and Waiver Thereunder, dated as of December 14, 2011, to the Credit Agreement dated as of February 11, 2011, among Avista Corporation, the Banks Party hereto, Wells Fargo Bank National Association as an Issuing Bank, and Union Bank N.A. as Administrative Agent and an Issuing Bank.
|
|||
|
10.5
|
(with 2002 Form 10-K)
|
10(b)-3
|
Priest Rapids Project Product Sales Contract executed by Public Utility District No. 2 of Grant County, Washington and Avista Corporation dated December 12, 2001 (effective November 1, 2005 for the Priest Rapids Development and November 1, 2009 for the Wanapum Development).
|
|||
|
10.6
|
(with 2002 Form 10-K)
|
10(b)-4
|
Priest Rapids Project Reasonable Portion Power Sales Contract executed by Public Utility District No. 2 of Grant County, Washington and Avista Corporation dated December 12, 2001 (effective November 1, 2005 for the Priest Rapids Development and November 1, 2009 for the Wanapum Development).
|
|||
|
10.7
|
(with 2002 Form 10-K)
|
10(b)-5
|
Additional Product Sales Agreement (Priest Rapids Project) executed by Public Utility District No. 2 of Grant County, Washington and Avista Corporation dated December 12, 2001 (effective November 1, 2005 for the Priest Rapids Development and November 1, 2009 for the Wanapum Development).
|
|||
|
10.8
|
2-60728
|
5(g)
|
Power Sales Contract (Wells Project) with Public Utility District No. 1 of Douglas County, Washington, dated as of September 18, 1963.
|
|||
|
10.9
|
2-60728
|
5(g)-1
|
Amendment to Power Sales Contract (Wells Project) with Public Utility District No. 1 of Douglas County, Washington, dated as of February 9, 1965.
|
|||
|
10.10
|
2-60728
|
5(h)
|
Reserved Share Power Sales Contract (Wells Project) with Public Utility District No. 1 of Douglas County, Washington, dated as of September 18, 1963.
|
|||
|
10.11
|
2-60728
|
5(h)-1
|
Amendment to Reserved Share Power Sales Contract (Wells Project) with Public Utility District No. 1 of Douglas County, Washington, dated as of February 9, 1965.
|
|||
|
10.12
|
(with September 30, 1985 Form 10-Q)
|
1
|
Settlement Agreement and Covenant Not to Sue executed by the United States Department of Energy acting by and through the Bonneville Power Administration and the Company, dated as of September 17, 1985, describing the settlement of Project 3 litigation.
|
|||
|
10.13
|
(with 1981 Form 10-K)
|
10(s)-7
|
Ownership and Operation Agreement for Colstrip Units No. 3 & 4, dated as of May 6, 1981.
|
|||
|
10.14
|
(with 2011 Form 10-K)
|
10.15
|
Avista Corporation Executive Deferral Plan. (3)
|
|||
|
10.15
|
(with 2011 Form 10-K)
|
10.16
|
Avista Corporation Executive Deferral Plan. (3)(8)
|
|||
|
10.16
|
(with 2011 Form 10-K)
|
10.17
|
Avista Corporation Supplemental Executive Retirement Plan. (3)(8)
|
|||
|
10.17
|
(with 2011 Form 10-K)
|
10.18
|
Avista Corporation Supplemental Executive Retirement Plan. (3)(8)
|
|||
|
10.18
|
(with 1992 Form 10-K)
|
10(t)-11
|
The Company’s Unfunded Supplemental Executive Disability Plan. (3)
|
|||
|
10.19
|
(with 2007 Form 10-K)
|
10.34
|
Income Continuation Plan of the Company. (3)
|
|||
150
|
|
Previously Filed (1)
|
|
||||
|
Exhibit
|
With
Registration Number |
As
Exhibit |
|
|||
|
10.20
|
(with 2010 Definitive Proxy Statement filed March 31, 2010)
|
Appendix A
|
Avista Corporation Long-Term Incentive Plan. (3)
|
|||
|
10.21
|
(with 2010 Form 10-K)
|
10.23
|
Avista Corporation Performance Award Plan Summary. (3)
|
|||
|
10.22
|
(with 2014 Form 10-K)
|
10.30
|
Avista Corporation Performance Award Agreement 2014. (3)
|
|||
|
10.23
|
(with 2015 Form 10-K)
|
10.31
|
Avista Corporation Performance Award Agreement 2015. (3)
|
|||
|
10.24
|
(2)
|
Avista Corporation Performance Award Agreement 2016. (3)
|
||||
|
10.25
|
(with Form 8-K dated June 21, 2005)
|
10.1
|
Employment Agreement between the Company and Marian Durkin in the form of a Letter of Employment. (3)
|
|||
|
10.26
|
(with Form 8-K dated August 13, 2008)
|
10.1
|
Employment Agreement between the Company and Mark T. Thies in the form of a Letter of Employment. (3)
|
|||
|
10.27
|
333-47290
|
99.1
|
Non-Officer Employee Long-Term Incentive Plan.
|
|||
|
10.28
|
(with 2010 Form 10-K)
|
Form of Change of Control Agreement between the Company and its Executive Officers. (3)(5)
|
||||
|
10.29
|
(with 2010 Form 10-K)
|
Form of Change of Control Agreement between the Company and its Executive Officers. (3)(6)
|
||||
|
10.30
|
(with 2010 Form 10-K)
|
Form of Change of Control Agreement between the Company and its Executive Officers. (3)(7)
|
||||
|
10.31
|
(with 2010 Form 10-K)
|
Form of Change of Control Agreement between the Company and its Executive Officers. (3)(7)
|
||||
|
10.32
|
(2)
|
Avista Corporation Non-Employee Director Compensation.
|
||||
|
12
|
(2)
|
Statement Re: computation of ratio of earnings to fixed charges.
|
||||
|
21
|
(2)
|
Subsidiaries of Registrant.
|
||||
|
23
|
(2)
|
Consent of Independent Registered Public Accounting Firm.
|
||||
|
31.1
|
(2)
|
Certification of Chief Executive Officer (Pursuant to 18 U.S.C. Section 1350, as Adopted Pursuant to Section 302 of the Sarbanes-Oxley Act of 2002).
|
||||
|
31.2
|
(2)
|
Certification of Chief Financial Officer (Pursuant to 18 U.S.C. Section 1350, as Adopted Pursuant to Section 302 of the Sarbanes-Oxley Act of 2002).
|
||||
|
32
|
(4)
|
Certification of Corporate Officers (Pursuant to 18 U.S.C. Section 1350, as Adopted Pursuant to Section 906 of the Sarbanes-Oxley Act of 2002).
|
||||
|
101
|
(2)
|
The following financial information from the Annual Report on Form 10 K for the period ended December 31, 2016, formatted in XBRL (Extensible Business Reporting Language) and filed electronically herewith: (i) the Consolidated Statements of Income; (ii) Consolidated Statements of Comprehensive Income; (iii) the Consolidated Balance Sheets; (iv) the Consolidated Statements of Cash Flows; (v) the Consolidated Statements of Equity and Redeemable Noncontrolling Interests; and (vi) the Notes to Consolidated Financial Statements.
|
||||
|
(1)
|
Incorporated herein by reference.
|
|
(2)
|
Filed herewith.
|
|
(3)
|
Management contracts or compensatory plans filed as exhibits to this Form 10-K pursuant to Item 15(b).
|
|
(4)
|
Furnished herewith.
|
|
(5)
|
Applies to James M. Kensok, David J. Meyer, Kelly O. Norwood, Jason R. Thackston and Dennis P. Vermillion.
|
|
(6)
|
Applies to Marian M. Durkin, Karen S. Feltes, Scott L. Morris, and Mark T. Thies.
|
|
(7)
|
Applies to executive officers appointed after October 1, 2010. This applies to Kevin J. Christie, Ryan L. Krasselt, Ed D. Schlect and Heather L. Rosentrater.
|
151
|
(8)
|
Applies to executive officers appointed after February 4, 2011. This applies to Kevin J. Christie, Ryan L. Krasselt, Ed D. Schlect and Heather L. Rosentrater.
|
152
TABLE OF CONTENTS
Part IItem 1. BusinessItem 1A. Risk FactorsItem 1B. Unresolved Staff CommentsItem 2. PropertiesItem 3. Legal ProceedingsItem 4. Mine Safety DisclosuresPart IIItem 5. Market For Registrant's Common Equity, Related Stockholder Matters and Issuer Purchases Of Equity SecuritiesItem 6. Selected Financial DataItem 7. Management's Discussion and Analysis Of Financial Condition and Results Of OperationsItem 7A. Quantitative and Qualitative Disclosures About Market RiskItem 8. Financial Statements and Supplementary DataNote 1. Summary Of Significant Accounting PoliciesNote 2. New Accounting StandardsNote 3. Variable Interest EntitiesNote 4. Business AcquisitionsNote 5. Discontinued OperationsNote 6. Derivatives and Risk ManagementNote 7. Jointly Owned Electric FacilitiesNote 8. Property, Plant and EquipmentNote 9. Asset Retirement ObligationsNote 10. Pension Plans and Other Postretirement Benefit PlansNote 11. Accounting For Income TaxesNote 12. Energy Purchase ContractsNote 13. Committed Lines Of CreditNote 14. Long-term Debt and Capital LeasesNote 15. Long-term Debt To Affiliated TrustsNote 16. Fair ValueNote 17. Common StockNote 18. Earnings Per Common Share Attributable To Avista Corporation ShareholdersNote 19. Commitments and ContingenciesNote 20. Regulatory MattersNote 21. Information By Business SegmentsNote 22. Selected Quarterly Financial Data (unaudited)Item 9. Changes in and Disagreements with Accountants on Accounting and Financial DisclosureItem 9A. Controls and ProceduresItem 9B. Other InformationPart IIIItem 10. Directors, Executive Officers and Corporate GovernanceItem 11. Executive CompensationItem 12. Security Ownership Of Certain Beneficial Owners and Management and Related Stockholder MattersItem 13. Certain Relationships and Related Transactions, and Director IndependenceItem 14. Principal Accounting Fees and ServicesPart IVItem 15. Exhibits, Financial Statement Schedules