AVISTA CORP
10-Ks and 10-Qs
|
|
|
|
|
|
|
|
|
|
|
|
|
|
|
|
|
|
|
|
|
|
|
|
|
|
|
|
|
|
|
|
|
|
|
|
|
|
|
|
|
|
|
|
|
|
|
|
|
|
|
|
|
|
|
|
UNITED STATES
SECURITIES AND EXCHANGE COMMISSION
Washington, D.C. 20549
__________________________________________________________________________________________
Form 10-Q
(Mark One)
|
x
|
QUARTERLY REPORT PURSUANT TO SECTION 13 OR 15(d) OF THE SECURITIES EXCHANGE ACT OF 1934
|
FOR THE QUARTERLY PERIOD ENDED
June 30, 2018
OR
|
¨
|
TRANSITION REPORT PURSUANT TO SECTION 13 OR 15(d) OF THE SECURITIES EXCHANGE ACT OF 1934
|
FOR THE TRANSITION PERIOD FROM TO
Commission file number
1-3701
__________________________________________________________________________________________
|
AVISTA CORPORATION
|
|
(Exact name of Registrant as specified in its charter)
|
|
Washington
|
|
91-0462470
|
|
(State or other jurisdiction of
incorporation or organization)
|
|
(I.R.S. Employer
Identification No.)
|
|
1411 East Mission Avenue, Spokane, Washington
|
|
99202-2600
|
|
(Address of principal executive offices)
|
|
(Zip Code)
|
Registrant’s telephone number, including area code:
509-489-0500
Web site: http://www.avistacorp.com
|
None
|
|
(Former name, former address and former fiscal year, if changed since last report)
|
Indicate by check mark whether the registrant (1) has filed all reports required to be filed by Section 13 or 15(d) of the Securities Exchange Act of 1934 during the preceding 12 months (or for such shorter period that the Registrant was required to file such reports), and (2) has been subject to such filing requirements for the past 90 days: Yes
x
No
¨
Indicate by check mark whether the registrant has submitted electronically and posted on its corporate Web site, if any, every Interactive Data File required to be submitted and posted pursuant to Rule 405 of Regulation S-T (§232.405 of this chapter) during the preceding 12 months (or for such shorter period that the registrant was required to submit and post such files). Yes
x
No
¨
Indicate by check mark whether the registrant is a large accelerated filer, an accelerated filer, a non-accelerated filer, smaller reporting company, or an emerging growth company. See the definitions of “large accelerated filer,” “accelerated filer,” “smaller reporting company,” and "emerging growth company" in Rule 12b-2 of the Exchange Act.
|
Large accelerated filer
|
x
|
Accelerated filer
|
¨
|
|
Non-accelerated filer
|
¨
(Do not check if a smaller reporting company)
|
Smaller reporting company
|
¨
|
|
Emerging growth company
|
¨
|
||
If an emerging growth company, indicate by check mark if the registrant has elected not to use the extended transition period for complying with any new or revised financial accounting standards provided pursuant to Section 13(a) of the
Exchange Act
¨
Indicate by check mark whether the Registrant is a shell company (as defined in Rule 12b-2 of the Exchange Act): Yes
¨
No
x
As of
July 30, 2018
,
65,688,000
shares of Registrant’s Common Stock, no par value (the only class of common stock), were outstanding.
AVISTA CORPORATION
INDEX
|
Item No.
|
|
Page
No.
|
|
|
Item 1.
|
|||
|
Item 2.
|
|||
i
|
Item 3.
|
|||
|
Item 4.
|
|||
|
Item 1.
|
|||
|
Item 1A.
|
|||
|
Item 2.
|
|||
|
Item 4.
|
|||
|
Item 6.
|
|||
ii
Forward-Looking Statements
From time to time, we make forward-looking statements such as statements regarding projected or future:
|
•
|
financial performance;
|
|
•
|
cash flows;
|
|
•
|
capital expenditures;
|
|
•
|
dividends;
|
|
•
|
capital structure;
|
|
•
|
other financial items;
|
|
•
|
strategic goals and objectives;
|
|
•
|
business environment; and
|
|
•
|
plans for operations.
|
These statements are based upon underlying assumptions (many of which are based, in turn, upon further assumptions). Such statements are made both in our reports filed under the Securities Exchange Act of 1934, as amended (including this Quarterly Report on Form 10-Q), and elsewhere. Forward-looking statements are all statements except those of historical fact including, without limitation, those that are identified by the use of words that include “will,” “may,” “could,” “should,” “intends,” “plans,” “seeks,” “anticipates,” “estimates,” “expects,” “forecasts,” “projects,” “predicts,” and similar expressions.
Forward-looking statements (including those made in this Quarterly Report on Form 10-Q) are subject to a variety of risks, uncertainties and other factors. Most of these factors are beyond our control and may have a significant effect on our operations, results of operations, financial condition or cash flows, which could cause actual results to differ materially from those anticipated in our statements. Such risks, uncertainties and other factors include, among others:
Financial Risk
|
•
|
weather conditions, which affect both energy demand and electric generating capability, including the effect of precipitation and temperature on hydroelectric resources, the effect of wind patterns on wind-generated power, weather-sensitive customer demand, and similar effects on supply and demand in the wholesale energy markets;
|
|
•
|
our ability to obtain financing through the issuance of debt and/or equity securities, which can be affected by various factors including our credit ratings, interest rates and other capital market conditions and the global economy;
|
|
•
|
changes in interest rates that affect borrowing costs, our ability to effectively hedge interest rates for anticipated debt issuances, variable interest rate borrowing and the extent to which we recover interest costs through retail rates collected from customers;
|
|
•
|
changes in actuarial assumptions, interest rates and the actual return on plan assets for our pension and other postretirement benefit plans, which can affect future funding obligations, pension and other postretirement benefit expense and the related liabilities;
|
|
•
|
deterioration in the creditworthiness of our customers;
|
|
•
|
the outcome of legal proceedings and other contingencies;
|
|
•
|
economic conditions in our service areas, including the economy's effects on customer demand for utility services;
|
|
•
|
declining energy demand related to customer energy efficiency, conservation measures and/or increased distributed generation;
|
|
•
|
changes in long-term climates, both globally and within our utilities' service areas, which can affect, among other things, customer demand patterns and the volume and timing of streamflows to our hydroelectric resources;
|
Utility Regulatory Risk
|
•
|
state and federal regulatory decisions or related judicial decisions that affect our ability to recover costs and earn a reasonable return including, but not limited to, disallowance or delay in the recovery of capital investments, operating costs, commodity costs, interest rate swap derivatives and discretion over allowed return on investment;
|
1
Energy Commodity Risk
|
•
|
volatility and illiquidity in wholesale energy markets, including the availability of willing buyers and sellers, changes in wholesale energy prices that can affect operating income, cash requirements to purchase electricity and natural gas, value received for wholesale sales, collateral required of us by counterparties in wholesale energy transactions and credit risk to us from such transactions, and the market value of derivative assets and liabilities;
|
|
•
|
default or nonperformance on the part of any parties from whom we purchase and/or sell capacity or energy;
|
|
•
|
potential environmental regulations or lawsuits affecting our ability to utilize or resulting in the obsolescence of our power supply resources;
|
Operational Risk
|
•
|
severe weather or natural disasters, including, but not limited to, avalanches, wind storms, wildfires, earthquakes, snow and ice storms, that can disrupt energy generation, transmission and distribution, as well as the availability and costs of materials, equipment, supplies and support services;
|
|
•
|
explosions, fires, accidents, mechanical breakdowns or other incidents that may impair assets and may disrupt operations of any of our generation facilities, transmission, and electric and natural gas distribution systems or other operations and may require us to purchase replacement power;
|
|
•
|
explosions, fires, accidents or other incidents arising from or allegedly arising from our operations that may cause wildfires, injuries to the public or property damage;
|
|
•
|
blackouts or disruptions of interconnected transmission systems (the regional power grid);
|
|
•
|
terrorist attacks, cyber attacks or other malicious acts that may disrupt or cause damage to our utility assets or to the national or regional economy in general, including any effects of terrorism, cyber attacks or vandalism that damage or disrupt information technology systems;
|
|
•
|
work force issues, including changes in collective bargaining unit agreements, strikes, work stoppages, the loss of key executives, availability of workers in a variety of skill areas, and our ability to recruit and retain employees;
|
|
•
|
increasing costs of insurance, more restrictive coverage terms and our ability to obtain insurance;
|
|
•
|
delays or changes in construction costs, and/or our ability to obtain required permits and materials for present or prospective facilities;
|
|
•
|
increasing health care costs and cost of health insurance provided to our employees and retirees;
|
|
•
|
third party construction of buildings, billboard signs, towers or other structures within our rights of way, or placement of fuel containers within close proximity to our transformers or other equipment, including overbuild atop natural gas distribution lines;
|
|
•
|
the loss of key suppliers for materials or services or other disruptions to the supply chain;
|
|
•
|
adverse impacts to our Alaska operations that could result from an extended outage of its hydroelectric generating resources or their inability to deliver energy, due to their lack of interconnectivity to any other electrical grids and the cost of replacement power (diesel);
|
|
•
|
changing river regulation or operations at hydroelectric facilities not owned by us, which could impact our hydroelectric facilities downstream;
|
|
•
|
change in the use, availability or abundancy of water resources and/or rights needed for operation of our hydroelectric facilities;
|
Compliance Risk
|
•
|
compliance with extensive federal, state and local legislation and regulation, including numerous environmental, health, safety, infrastructure protection, reliability and other laws and regulations that affect our operations and costs;
|
|
•
|
the ability to comply with the terms of the licenses and permits for our hydroelectric or thermal generating facilities at cost-effective levels;
|
2
Technology Risk
|
•
|
cyber attacks on us or our vendors or other potential lapses that result in unauthorized disclosure of private information, which could result in liabilities against us, costs to investigate, remediate and defend, and damage to our reputation;
|
|
•
|
disruption to or breakdowns of information systems, automated controls and other technologies that we rely on for our operations, communications and customer service;
|
|
•
|
changes in costs that impede our ability to effectively implement new information technology systems or to operate and maintain current production technology;
|
|
•
|
changes in technologies, possibly making some of the current technology we utilize obsolete or introducing new cyber security risks;
|
|
•
|
insufficient technology skills, which could lead to the inability to develop, modify or maintain our information systems;
|
Strategic Risk
|
•
|
growth or decline of our customer base and the extent to which new uses for our services may materialize or existing uses may decline, including, but not limited to, the effect of the trend toward distributed generation at customer sites;
|
|
•
|
the potential effects of negative publicity regarding our business practices, whether true or not, which could hurt our reputation and result in litigation or a decline in our common stock price;
|
|
•
|
changes in our strategic business plans, which may be affected by any or all of the foregoing, including the entry into new businesses and/or the exit from existing businesses and the extent of our business development efforts where potential future business is uncertain;
|
|
•
|
entering into or growth of non-regulated activities may increase earnings volatility;
|
|
•
|
failure to complete the proposed acquisition of the Company by Hydro One Limited (Hydro One), which would negatively impact the market price of Avista Corp.'s common stock and could result in termination fees that would have a material adverse effect on our results of operations, financial condition, and cash flows;
|
External Mandates Risk
|
•
|
changes in environmental laws, regulations, decisions and policies, including present and potential environmental remediation costs and our compliance with these matters;
|
|
•
|
the potential effects of initiatives, legislation or administrative rulemaking at the federal, state or local levels, including possible effects on our generating resources of restrictions on greenhouse gas emissions to mitigate concerns over global climate changes;
|
|
•
|
political pressures or regulatory practices that could constrain or place additional cost burdens on our distribution systems through accelerated adoption of distributed generation or electric-powered transportation or on our energy supply sources, such as campaigns to halt coal-fired power generation and opposition to other thermal generation, wind turbines or hydroelectric facilities;
|
|
•
|
wholesale and retail competition including alternative energy sources, growth in customer-owned power resource technologies that displace utility-supplied energy or that may be sold back to the utility, and alternative energy suppliers and delivery arrangements;
|
|
•
|
failure to identify changes in legislation, taxation and regulatory issues which are detrimental or beneficial to our overall business;
|
|
•
|
the Tax Cuts and Jobs Act and its intended and unintended consequences on financial results and future cash flows, including the potential impact to credit ratings, which may affect our ability to borrow funds or increase the cost of borrowing in the future;
|
|
•
|
policy and/or legislative changes in various regulated areas, including, but not limited to, environmental regulation, healthcare regulations and import/export regulations; and
|
|
•
|
the risk of municipalization in any of our service territories.
|
Our expectations, beliefs and projections are expressed in good faith. We believe they are reasonable based on, without limitation, an examination of historical operating trends, our records and other information available from third parties. There
3
can be no assurance that our expectations, beliefs or projections will be achieved or accomplished. Furthermore, any forward-looking statement speaks only as of the date on which such statement is made. We undertake no obligation to update any forward-looking statement or statements to reflect events or circumstances that occur after the date on which such statement is made or to reflect the occurrence of unanticipated events. New risks, uncertainties and other factors emerge from time to time, and it is not possible for us to predict all such factors, nor can we assess the effect of each such factor on our business or the extent that any such factor or combination of factors may cause actual results to differ materially from those contained in any forward-looking statement.
Available Information
Our website address is www.avistacorp.com. We make annual, quarterly and current reports available on our website as soon as practicable after electronically filing these reports with the U.S. Securities and Exchange Commission (SEC). Information contained on our website is not part of this report.
4
CONDENSED CONSOLIDATED STATEMENTS OF INCOME
|
Avista Corporation
|
For the Three and
Six Months Ended
June 30
Dollars in thousands, except per share amounts
(Unaudited)
|
Three months ended June 30,
|
Six months ended June 30,
|
||||||||||||||
|
2018
|
2017
|
2018
|
2017
|
||||||||||||
|
Operating Revenues:
|
|||||||||||||||
|
Utility revenues:
|
|||||||||||||||
|
Utility revenues, exclusive of alternative revenue programs
|
$
|
309,134
|
|
$
|
304,404
|
|
$
|
717,490
|
|
$
|
749,977
|
|
|||
|
Alternative revenue programs
|
3,570
|
|
4,325
|
|
(2,369
|
)
|
(10,711
|
)
|
|||||||
|
Total utility revenues
|
312,704
|
|
308,729
|
|
715,121
|
|
739,266
|
|
|||||||
|
Non-utility revenues
|
6,594
|
|
5,772
|
|
13,538
|
|
11,705
|
|
|||||||
|
Total operating revenues
|
319,298
|
|
314,501
|
|
728,659
|
|
750,971
|
|
|||||||
|
Operating Expenses:
|
|||||||||||||||
|
Utility operating expenses:
|
|||||||||||||||
|
Resource costs
|
105,969
|
|
102,751
|
|
260,587
|
|
268,337
|
|
|||||||
|
Other operating expenses
|
81,078
|
|
78,842
|
|
158,376
|
|
151,285
|
|
|||||||
|
Acquisition costs
|
983
|
|
1,274
|
|
1,655
|
|
1,274
|
|
|||||||
|
Depreciation and amortization
|
45,651
|
|
42,643
|
|
90,384
|
|
84,628
|
|
|||||||
|
Taxes other than income taxes
|
25,596
|
|
23,802
|
|
56,425
|
|
56,464
|
|
|||||||
|
Non-utility operating expenses:
|
|||||||||||||||
|
Other operating expenses
|
6,543
|
|
7,086
|
|
13,367
|
|
13,265
|
|
|||||||
|
Depreciation and amortization
|
199
|
|
157
|
|
380
|
|
345
|
|
|||||||
|
Total operating expenses
|
266,019
|
|
256,555
|
|
581,174
|
|
575,598
|
|
|||||||
|
Income from operations
|
53,279
|
|
57,946
|
|
147,485
|
|
175,373
|
|
|||||||
|
Interest expense
|
25,170
|
|
23,670
|
|
49,946
|
|
47,215
|
|
|||||||
|
Interest expense to affiliated trusts
|
302
|
|
200
|
|
555
|
|
385
|
|
|||||||
|
Capitalized interest
|
(1,139
|
)
|
(890
|
)
|
(2,107
|
)
|
(1,614
|
)
|
|||||||
|
Other expense (income)-net
|
(1,907
|
)
|
193
|
|
2,572
|
|
(867
|
)
|
|||||||
|
Income before income taxes
|
30,853
|
|
34,773
|
|
96,519
|
|
130,254
|
|
|||||||
|
Income tax expense
|
5,209
|
|
13,051
|
|
15,919
|
|
46,395
|
|
|||||||
|
Net income
|
25,644
|
|
21,722
|
|
80,600
|
|
83,859
|
|
|||||||
|
Net loss (income) attributable to noncontrolling interests
|
(67
|
)
|
49
|
|
(133
|
)
|
28
|
|
|||||||
|
Net income attributable to Avista Corp. shareholders
|
$
|
25,577
|
|
$
|
21,771
|
|
$
|
80,467
|
|
$
|
83,887
|
|
|||
|
Weighted-average common shares outstanding (thousands), basic
|
65,677
|
|
64,401
|
|
65,658
|
|
64,382
|
|
|||||||
|
Weighted-average common shares outstanding (thousands), diluted
|
65,983
|
|
64,553
|
|
65,957
|
|
64,511
|
|
|||||||
|
Earnings per common share attributable to Avista Corp. shareholders:
|
|||||||||||||||
|
Basic
|
$
|
0.39
|
|
$
|
0.34
|
|
$
|
1.23
|
|
$
|
1.30
|
|
|||
|
Diluted
|
$
|
0.39
|
|
$
|
0.34
|
|
$
|
1.22
|
|
$
|
1.30
|
|
|||
|
Dividends declared per common share
|
$
|
0.3725
|
|
$
|
0.3575
|
|
$
|
0.7450
|
|
$
|
0.7150
|
|
|||
The Accompanying Notes are an Integral Part of These Statements.
5
CONDENSED CONSOLIDATED STATEMENTS OF COMPREHENSIVE INCOME
|
Avista Corporation
|
For the Three and
Six Months Ended
June 30
Dollars in thousands
(Unaudited)
|
Three months ended June 30,
|
Six months ended June 30,
|
||||||||||||||
|
2018
|
2017
|
2018
|
2017
|
||||||||||||
|
Net income
|
$
|
25,644
|
|
$
|
21,722
|
|
$
|
80,600
|
|
$
|
83,859
|
|
|||
|
Other Comprehensive Income:
|
|||||||||||||||
|
Change in unfunded benefit obligation for pension and other postretirement benefit plans - net of taxes of $54, $99, $109 and $197 respectively
|
204
|
|
183
|
|
408
|
|
366
|
|
|||||||
|
Total other comprehensive income
|
204
|
|
183
|
|
408
|
|
366
|
|
|||||||
|
Comprehensive income
|
25,848
|
|
21,905
|
|
81,008
|
|
84,225
|
|
|||||||
|
Comprehensive loss (income) attributable to noncontrolling interests
|
(67
|
)
|
49
|
|
(133
|
)
|
28
|
|
|||||||
|
Comprehensive income attributable to Avista Corporation shareholders
|
$
|
25,781
|
|
$
|
21,954
|
|
$
|
80,875
|
|
$
|
84,253
|
|
|||
The Accompanying Notes are an Integral Part of These Statements.
6
CONDENSED CONSOLIDATED BALANCE SHEETS
|
Avista Corporation
|
Dollars in thousands
(Unaudited)
|
June 30,
|
December 31,
|
||||||
|
2018
|
2017
|
||||||
|
Assets:
|
|||||||
|
Current Assets:
|
|||||||
|
Cash and cash equivalents
|
$
|
35,333
|
|
$
|
16,172
|
|
|
|
Accounts and notes receivable-less allowances of $5,986 and $5,132, respectively
|
117,831
|
|
185,664
|
|
|||
|
Materials and supplies, fuel stock and stored natural gas
|
56,901
|
|
58,075
|
|
|||
|
Regulatory assets
|
27,404
|
|
44,750
|
|
|||
|
Other current assets
|
22,516
|
|
32,873
|
|
|||
|
Total current assets
|
259,985
|
|
337,534
|
|
|||
|
Net utility property
|
4,485,698
|
|
4,398,810
|
|
|||
|
Goodwill
|
57,672
|
|
57,672
|
|
|||
|
Non-current regulatory assets
|
581,495
|
|
619,399
|
|
|||
|
Other property and investments-net and other non-current assets
|
116,930
|
|
101,317
|
|
|||
|
Total assets
|
$
|
5,501,780
|
|
$
|
5,514,732
|
|
|
|
Liabilities and Equity:
|
|||||||
|
Current Liabilities:
|
|||||||
|
Accounts payable
|
$
|
76,558
|
|
$
|
107,289
|
|
|
|
Current portion of long-term debt and capital leases
|
2,598
|
|
277,438
|
|
|||
|
Short-term borrowings
|
—
|
|
105,398
|
|
|||
|
Regulatory liabilities
|
88,500
|
|
48,264
|
|
|||
|
Other current liabilities
|
121,414
|
|
159,113
|
|
|||
|
Total current liabilities
|
289,070
|
|
697,502
|
|
|||
|
Long-term debt and capital leases
|
1,861,584
|
|
1,491,799
|
|
|||
|
Long-term debt to affiliated trusts
|
51,547
|
|
51,547
|
|
|||
|
Pensions and other postretirement benefits
|
195,227
|
|
203,566
|
|
|||
|
Deferred income taxes
|
472,551
|
|
466,630
|
|
|||
|
Non-current regulatory liabilities
|
799,661
|
|
800,089
|
|
|||
|
Other non-current liabilities and deferred credits
|
69,433
|
|
73,115
|
|
|||
|
Total liabilities
|
3,739,073
|
|
3,784,248
|
|
|||
|
Commitments and Contingencies (See Notes to Condensed Consolidated Financial Statements)
|
|||||||
|
Equity:
|
|||||||
|
Avista Corporation Shareholders’ Equity:
|
|||||||
|
Common stock, no par value; 200,000,000 shares authorized; 65,687,492 and 65,494,333 shares issued and outstanding, respectively
|
1,134,304
|
|
1,133,448
|
|
|||
|
Accumulated other comprehensive loss
|
(9,424
|
)
|
(8,090
|
)
|
|||
|
Retained earnings
|
637,578
|
|
604,470
|
|
|||
|
Total Avista Corporation shareholders’ equity
|
1,762,458
|
|
1,729,828
|
|
|||
|
Noncontrolling Interests
|
249
|
|
656
|
|
|||
|
Total equity
|
1,762,707
|
|
1,730,484
|
|
|||
|
Total liabilities and equity
|
$
|
5,501,780
|
|
$
|
5,514,732
|
|
|
The Accompanying Notes are an Integral Part of These Statements.
7
CONDENSED CONSOLIDATED STATEMENTS OF CASH FLOWS
|
Avista Corporation
|
For the
Six Months Ended June 30
Dollars in thousands
(Unaudited)
|
2018
|
2017
|
||||||
|
Operating Activities:
|
|||||||
|
Net income
|
$
|
80,600
|
|
$
|
83,859
|
|
|
|
Non-cash items included in net income:
|
|||||||
|
Depreciation and amortization
|
92,584
|
|
86,790
|
|
|||
|
Deferred income tax provision (benefit) and investment tax credits
|
(1,272
|
)
|
36,169
|
|
|||
|
Power and natural gas cost amortizations, net
|
6,701
|
|
6,366
|
|
|||
|
Amortization of debt expense
|
1,635
|
|
1,627
|
|
|||
|
Amortization of investment in exchange power
|
1,225
|
|
1,225
|
|
|||
|
Stock-based compensation expense
|
3,878
|
|
2,643
|
|
|||
|
Equity-related Allowance for Funds Used During Construction (AFUDC)
|
(2,845
|
)
|
(3,292
|
)
|
|||
|
Pension and other postretirement benefit expense
|
16,025
|
|
18,539
|
|
|||
|
Other regulatory assets and liabilities and deferred debits and credits
|
21,323
|
|
(8,831
|
)
|
|||
|
Change in decoupling regulatory deferral
|
2,226
|
|
10,365
|
|
|||
|
Other
|
2,108
|
|
420
|
|
|||
|
Contributions to defined benefit pension plan
|
(14,600
|
)
|
(14,800
|
)
|
|||
|
Cash paid for settlement of interest rate swap agreements
|
(31,484
|
)
|
—
|
|
|||
|
Cash received for settlement of interest rate swap agreements
|
5,594
|
|
—
|
|
|||
|
Changes in certain current assets and liabilities:
|
|||||||
|
Accounts and notes receivable
|
65,843
|
|
45,375
|
|
|||
|
Materials and supplies, fuel stock and stored natural gas
|
1,174
|
|
(7,879
|
)
|
|||
|
Collateral posted for derivative instruments
|
44,080
|
|
(5,460
|
)
|
|||
|
Income taxes receivable
|
(76
|
)
|
12,457
|
|
|||
|
Other current assets
|
3,908
|
|
(3,825
|
)
|
|||
|
Accounts payable
|
(21,642
|
)
|
(29,435
|
)
|
|||
|
Other current liabilities
|
(1,560
|
)
|
(3,787
|
)
|
|||
|
Net cash provided by operating activities
|
275,425
|
|
228,526
|
|
|||
|
Investing Activities:
|
|||||||
|
Utility property capital expenditures (excluding equity-related AFUDC)
|
(183,132
|
)
|
(177,714
|
)
|
|||
|
Issuance of notes receivable at subsidiaries
|
(2,780
|
)
|
(2,500
|
)
|
|||
|
Equity and property investments made by subsidiaries
|
(7,431
|
)
|
(10,347
|
)
|
|||
|
Other
|
438
|
|
972
|
|
|||
|
Net cash used in investing activities
|
(192,905
|
)
|
(189,589
|
)
|
|||
The Accompanying Notes are an Integral Part of These Statements.
8
CONDENSED CONSOLIDATED STATEMENTS OF CASH FLOWS (continued)
|
Avista Corporation
|
For the
Six Months Ended June 30
Dollars in thousands
(Unaudited)
|
2018
|
2017
|
||||||
|
Financing Activities:
|
|||||||
|
Net increase (decrease) in short-term borrowings
|
$
|
(105,398
|
)
|
$
|
16,000
|
|
|
|
Proceeds from issuance of long-term debt
|
374,621
|
|
—
|
|
|||
|
Maturity of long-term debt and capital leases
|
(276,170
|
)
|
(1,643
|
)
|
|||
|
Issuance of common stock, net of issuance costs
|
1,227
|
|
1,247
|
|
|||
|
Cash dividends paid
|
(49,101
|
)
|
(46,193
|
)
|
|||
|
Other
|
(8,538
|
)
|
(3,445
|
)
|
|||
|
Net cash used in financing activities
|
(63,359
|
)
|
(34,034
|
)
|
|||
|
Net increase in cash and cash equivalents
|
19,161
|
|
4,903
|
|
|||
|
Cash and cash equivalents at beginning of period
|
16,172
|
|
8,507
|
|
|||
|
Cash and cash equivalents at end of period
|
$
|
35,333
|
|
$
|
13,410
|
|
|
The Accompanying Notes are an Integral Part of These Statements.
9
CONDENSED CONSOLIDATED STATEMENTS OF EQUITY
|
Avista Corporation
|
For the
Six Months Ended June 30
Dollars in thousands
(Unaudited)
|
2018
|
2017
|
||||||
|
Common Stock, Shares:
|
|||||||
|
Shares outstanding at beginning of period
|
65,494,333
|
|
64,187,934
|
|
|||
|
Shares issued
|
193,159
|
|
221,049
|
|
|||
|
Shares outstanding at end of period
|
65,687,492
|
|
64,408,983
|
|
|||
|
Common Stock, Amount:
|
|||||||
|
Balance at beginning of period
|
$
|
1,133,448
|
|
$
|
1,075,281
|
|
|
|
Equity compensation expense
|
3,558
|
|
2,559
|
|
|||
|
Issuance of common stock, net of issuance costs
|
1,227
|
|
1,247
|
|
|||
|
Payment of minimum tax withholdings for share-based payment awards
|
(3,929
|
)
|
(3,420
|
)
|
|||
|
Balance at end of period
|
1,134,304
|
|
1,075,667
|
|
|||
|
Accumulated Other Comprehensive Loss:
|
|||||||
|
Balance at beginning of period
|
(8,090
|
)
|
(7,568
|
)
|
|||
|
Other comprehensive income
|
408
|
|
366
|
|
|||
|
Reclassification of excess income tax benefits
|
(1,742
|
)
|
—
|
|
|||
|
Balance at end of period
|
(9,424
|
)
|
(7,202
|
)
|
|||
|
Retained Earnings:
|
|||||||
|
Balance at beginning of period
|
604,470
|
|
581,014
|
|
|||
|
Net income attributable to Avista Corporation shareholders
|
80,467
|
|
83,887
|
|
|||
|
Cash dividends paid on common stock
|
(49,101
|
)
|
(46,193
|
)
|
|||
|
Reclassification of excess income tax benefits
|
1,742
|
|
—
|
|
|||
|
Balance at end of period
|
637,578
|
|
618,708
|
|
|||
|
Total Avista Corporation shareholders’ equity
|
1,762,458
|
|
1,687,173
|
|
|||
|
Noncontrolling Interests:
|
|||||||
|
Balance at beginning of period
|
656
|
|
(251
|
)
|
|||
|
Net income (loss) attributable to noncontrolling interests
|
133
|
|
(28
|
)
|
|||
|
Cash dividends paid to subsidiary noncontrolling interests
|
(540
|
)
|
—
|
|
|||
|
Balance at end of period
|
249
|
|
(279
|
)
|
|||
|
Total equity
|
$
|
1,762,707
|
|
$
|
1,686,894
|
|
|
The Accompanying Notes are an Integral Part of These Statements.
10
|
NOTES TO CONDENSED CONSOLIDATED FINANCIAL STATEMENTS (Unaudited)
|
The accompanying condensed consolidated financial statements of Avista Corporation (Avista Corp. or the Company) as of and for the interim periods ended
June 30, 2018
and
June 30, 2017
are unaudited; however, in the opinion of management, the statements reflect all adjustments necessary for a fair statement of the results for the interim periods. All such adjustments are of a normal recurring nature. The condensed consolidated financial statements have been prepared in accordance with GAAP for interim financial information and with the instructions to Form 10-Q and Rule 10-01 of Regulation S-X. The Condensed Consolidated Statements of Income for the interim periods are not necessarily indicative of the results to be expected for the full year. These condensed consolidated financial statements do not contain the detail or footnote disclosure concerning accounting policies and other matters which would be included in full fiscal year consolidated financial statements; therefore, they should be read in conjunction with the Company's audited consolidated financial statements included in the Company's Annual Report on Form 10-K for the year ended
December 31, 2017
(
2017
Form 10-K). Please refer to the section “Acronyms and Terms” in the
2017
Form 10-K for definitions of certain terms not defined herein. The acronyms and terms are an integral part of these condensed consolidated financial statements.
Nature of Business
Avista Corp. is primarily an electric and natural gas utility with certain other business ventures. Avista Utilities is an operating division of Avista Corp., comprising the regulated utility operations in the Pacific Northwest. Avista Utilities provides electric distribution and transmission, and natural gas distribution services in parts of eastern Washington and northern Idaho. Avista Utilities also provides natural gas distribution service in parts of northeastern and southwestern Oregon. Avista Utilities has electric generating facilities in Washington, Idaho, Oregon and Montana. Avista Utilities also supplies electricity to a small number of customers in Montana, most of whom are employees who operate Avista Utilities' Noxon Rapids generating facility.
AERC is a wholly-owned subsidiary of Avista Corp. The primary subsidiary of AERC is AEL&P, which comprises Avista Corp.'s regulated utility operations in Alaska.
Avista Capital, a wholly owned non-regulated subsidiary of Avista Corp., is the parent company of all of the subsidiary companies in the non-utility businesses, with the exception of AJT Mining Properties, Inc., which is a subsidiary of AERC. See Note 14 for business segment information.
On July 19, 2017, Avista Corp. entered into an Agreement and Plan of Merger (Merger Agreement) to become a wholly-owned subsidiary of Hydro One Limited (Hydro One). Consummation of the pending acquisition is subject to a number of approvals and the satisfaction or waiver of other specified conditions. The transaction is expected to close in the second half of 2018. See Note 15 for additional information.
Basis of Reporting
The condensed consolidated financial statements include the assets, liabilities, revenues and expenses of the Company and its subsidiaries and other majority owned subsidiaries and variable interest entities for which the Company or its subsidiaries are the primary beneficiaries. Intercompany balances were eliminated in consolidation. The accompanying condensed consolidated financial statements include the Company’s proportionate share of utility plant and related operations resulting from its interests in jointly owned plants.
Certain line items are presented in a more condensed form on the Condensed Consolidated Balance Sheets as of
June 30, 2018
than in prior periods. The prior year amounts were reclassified to conform to the current year presentation. The primary classification changes were related to classifying all current regulatory assets, current regulatory liabilities, non-current regulatory assets and non-current regulatory liabilities into their own line items. Previously, these items were either on many separate line items or embedded in other line items such as "Other property and investments-net and other non-current assets" or "Other non-current liabilities, regulatory liabilities and deferred credits." See Note 2 for a summary of the items contained in certain balance sheet accounts.
Derivative Assets and Liabilities
Derivatives are recorded as either assets or liabilities on the Condensed Consolidated Balance Sheets measured at estimated fair value.
The WUTC and the IPUC issued accounting orders authorizing Avista Corp. to offset energy commodity derivative assets or liabilities with a regulatory asset or liability. This accounting treatment is intended to defer the recognition of mark-to-market gains and losses on energy commodity transactions until the period of delivery. Realized benefits and costs result in adjustments
11
to retail rates through purchased gas cost adjustments, the ERM in Washington, the PCA mechanism in Idaho, and periodic general rate cases. The resulting regulatory assets have been concluded to be probable of recovery through future rates.
Substantially all forward contracts to purchase or sell power and natural gas are recorded as derivative assets or liabilities at estimated fair value with an offsetting regulatory asset or liability. Contracts that are not considered derivatives are accounted for on the accrual basis until they are settled or realized unless there is a decline in the fair value of the contract that is determined to be other-than-temporary.
For interest rate swap derivatives, Avista Corp. records all mark-to-market gains and losses in each accounting period as assets and liabilities, as well as offsetting regulatory assets and liabilities, such that there is no income statement impact. The interest rate swap derivatives are risk management tools similar to energy commodity derivatives. Upon settlement of interest rate swap derivatives, the regulatory asset or liability is amortized as a component of interest expense over the term of the associated debt. The Company records an offset of interest rate swap derivative assets and liabilities with regulatory assets and liabilities, based on the prior practice of the commissions to provide recovery through the ratemaking process.
The Company has multiple master netting agreements with a variety of entities that allow for cross-commodity netting of derivative agreements with the same counterparty (i.e. power derivatives can be netted with natural gas derivatives). In addition, some master netting agreements allow for the netting of commodity derivatives and interest rate swap derivatives for the same counterparty. The Company does not have any agreements which allow for cross-affiliate netting among multiple affiliated legal entities. The Company nets all derivative instruments when allowed by the agreement for presentation in the Condensed Consolidated Balance Sheets.
Fair Value Measurements
Fair value represents the price that would be received when selling an asset or paid to transfer a liability (an exit price) in an orderly transaction between market participants at the measurement date. Energy commodity derivative assets and liabilities, deferred compensation assets, as well as derivatives related to interest rate swaps and foreign currency exchange contracts, are reported at estimated fair value on the Condensed Consolidated Balance Sheets. See Note 10 for the Company’s fair value disclosures.
Accumulated Other Comprehensive Loss
Accumulated other comprehensive loss, net of tax, consisted of the following as of
June 30, 2018
and
December 31, 2017
(dollars in thousands):
|
June 30,
|
December 31,
|
||||||
|
2018
|
2017
|
||||||
|
Unfunded benefit obligation for pensions and other postretirement benefit plans - net of taxes of $2,505 and $4,356, respectively (a)
|
$
|
9,424
|
|
$
|
8,090
|
|
|
|
(a)
|
Effective January 1, 2018, the Company adopted ASU No. 2018-02. As a result of the adoption of this new standard,
$1.7 million
in excess tax benefits was reclassified from accumulated other comprehensive loss to retained earnings. See Note 3 for additional discussion of the adoption of this standard.
|
12
The following table details the reclassifications out of accumulated other comprehensive loss to net income by component for the three and
six months ended June 30
(dollars in thousands).
|
Amounts Reclassified from Accumulated Other Comprehensive Loss
|
||||||||||||||||||
|
Three months ended June 30,
|
Six months ended June 30,
|
|||||||||||||||||
|
Details about Accumulated Other Comprehensive Loss Components
|
2018
|
2017
|
2018
|
2017
|
Affected Line Item in Statement of Income
|
|||||||||||||
|
Amortization of defined benefit pension items
|
||||||||||||||||||
|
Amortization of net prior service cost
|
$
|
(228
|
)
|
$
|
(299
|
)
|
$
|
(456
|
)
|
$
|
(598
|
)
|
(a)
|
|||||
|
Amortization of net loss
|
2,995
|
|
3,638
|
|
$
|
5,990
|
|
$
|
7,276
|
|
(a)
|
|||||||
|
Adjustment due to effects of regulation
|
(2,509
|
)
|
(3,057
|
)
|
(5,017
|
)
|
(6,115
|
)
|
(a)
|
|||||||||
|
258
|
|
282
|
|
517
|
|
563
|
|
Total before tax
|
||||||||||
|
(54
|
)
|
(99
|
)
|
(109
|
)
|
(197
|
)
|
Tax expense
|
||||||||||
|
$
|
204
|
|
$
|
183
|
|
$
|
408
|
|
$
|
366
|
|
Net of tax
|
||||||
|
(a)
|
These accumulated other comprehensive loss components are included in the computation of net periodic pension cost (see Note 6 for additional details).
|
Effective Income Tax Rate
For the three months ended
June 30,
2018
and
2017
, the Company's effective tax rate was
16.9 percent
and
37.5 percent
, respectively. For the
six months ended
June 30,
2018
and
2017
, the Company's effective tax rate was
16.5 percent
and
35.6 percent
, respectively. The effective tax rate decreased during 2018 due to federal income tax law changes which were enacted during the fourth quarter of 2017, which lowered the federal income tax rate from
35 percent
to
21 percent
. In addition, the amortization of plant excess deferred income taxes under the Average Rate Assumption Method (ARAM), decreased the effective tax rate by
6.4 percent
for the second quarter and
3.1 percent
for the year-to-date, and excess tax benefits from the settlement of equity awards during the first quarter of 2018 decreased the effective tax rate by
1.0 percent
for the year-to-date.
Contingencies
The Company has unresolved regulatory, legal and tax issues which have inherently uncertain outcomes. The Company accrues a loss contingency if it is probable that a liability has been incurred and the amount of the loss or impairment can be reasonably estimated. The Company also discloses loss contingencies that do not meet these conditions for accrual if there is a reasonable possibility that a material loss may be incurred. As of
June 30, 2018
, the Company has not recorded any significant amounts related to unresolved contingencies. See Note 13 for further discussion of the Company's commitments and contingencies.
Materials and Supplies, Fuel Stock and Stored Natural Gas
Inventories of materials and supplies, fuel stock and stored natural gas are recorded at average cost for our regulated operations and the lower of cost or market for our non-regulated operations and consisted of the following as of
June 30, 2018
and
December 31, 2017
(dollars in thousands):
|
June 30,
|
December 31,
|
||||||
|
2018
|
2017
|
||||||
|
Materials and supplies
|
$
|
44,335
|
|
$
|
41,493
|
|
|
|
Fuel stock
|
5,958
|
|
4,843
|
|
|||
|
Stored natural gas
|
6,608
|
|
11,739
|
|
|||
|
Total
|
$
|
56,901
|
|
$
|
58,075
|
|
|
13
Net Utility Property
Net utility property consisted of the following as of
June 30, 2018
and
December 31, 2017
(dollars in thousands):
|
June 30,
|
December 31,
|
||||||
|
2018
|
2017
|
||||||
|
Utility plant in service
|
$
|
5,965,811
|
|
$
|
5,853,308
|
|
|
|
Construction work in progress
|
185,650
|
|
157,839
|
|
|||
|
Total
|
6,151,461
|
|
6,011,147
|
|
|||
|
Less: Accumulated depreciation and amortization
|
1,665,763
|
|
1,612,337
|
|
|||
|
Total net utility property
|
$
|
4,485,698
|
|
$
|
4,398,810
|
|
|
Other Current Liabilities
Other current liabilities consisted of the following as of
June 30, 2018
and
December 31, 2017
(dollars in thousands):
|
June 30,
|
December 31,
|
||||||
|
2018
|
2017
|
||||||
|
Accrued taxes other than income taxes
|
$
|
34,951
|
|
$
|
33,802
|
|
|
|
Current unsettled interest rate swap derivative liabilities
|
—
|
|
34,447
|
|
|||
|
Employee paid time off accruals
|
20,538
|
|
20,330
|
|
|||
|
Accrued interest
|
16,659
|
|
16,351
|
|
|||
|
Current portion of pensions and other postretirement benefits
|
10,376
|
|
11,544
|
|
|||
|
Utility energy commodity derivative liabilities
|
7,789
|
|
8,848
|
|
|||
|
Other current liabilities
|
31,101
|
|
33,791
|
|
|||
|
Total other current liabilities
|
$
|
121,414
|
|
$
|
159,113
|
|
|
Regulatory Assets and Liabilities
Regulatory assets and liabilities consisted of the following as of
June 30, 2018
and
December 31, 2017
(dollars in thousands):
|
June 30, 2018
|
December 31, 2017
|
||||||||||||||
|
Current
|
Non-Current
|
Current
|
Non-Current
|
||||||||||||
|
Regulatory Assets
|
|||||||||||||||
|
Energy commodity derivatives
|
$
|
21,750
|
|
$
|
11,277
|
|
$
|
24,991
|
|
$
|
18,967
|
|
|||
|
Decoupling surcharge
|
5,571
|
|
13,308
|
|
19,759
|
|
2,600
|
|
|||||||
|
Pension and other postretirement benefit plans
|
—
|
|
204,129
|
|
—
|
|
209,115
|
|
|||||||
|
Interest rate swaps
|
—
|
|
134,078
|
|
—
|
|
169,704
|
|
|||||||
|
Deferred income taxes
|
—
|
|
91,925
|
|
—
|
|
90,315
|
|
|||||||
|
Settlement with Coeur d'Alene Tribe
|
—
|
|
43,299
|
|
—
|
|
43,954
|
|
|||||||
|
Demand side management programs
|
—
|
|
21,932
|
|
—
|
|
24,620
|
|
|||||||
|
Utility plant to be abandoned
|
—
|
|
23,773
|
|
—
|
|
24,330
|
|
|||||||
|
Other regulatory assets
|
83
|
|
37,774
|
|
—
|
|
35,794
|
|
|||||||
|
Total regulatory assets
|
$
|
27,404
|
|
$
|
581,495
|
|
$
|
44,750
|
|
$
|
619,399
|
|
|||
|
Regulatory Liabilities
|
|||||||||||||||
|
Income tax related liabilities
|
$
|
26,512
|
|
$
|
428,825
|
|
$
|
—
|
|
$
|
460,542
|
|
|||
|
Deferred natural gas costs
|
31,515
|
|
—
|
|
37,474
|
|
—
|
|
|||||||
|
Deferral power costs
|
9,160
|
|
34,212
|
|
5,816
|
|
24,057
|
|
|||||||
|
Utility plant retirement costs
|
—
|
|
290,568
|
|
—
|
|
285,786
|
|
|||||||
|
Interest rate swaps
|
—
|
|
30,994
|
|
—
|
|
18,638
|
|
|||||||
|
Other regulatory liabilities
|
21,313
|
|
15,062
|
|
4,974
|
|
11,066
|
|
|||||||
|
Total regulatory liabilities
|
$
|
88,500
|
|
$
|
799,661
|
|
$
|
48,264
|
|
$
|
800,089
|
|
|||
14
ASU No. 2014-09, “Revenue from Contracts with Customers (Topic 606)”
On January 1, 2018, the Company adopted ASU No. 2014-09, which outlines a single comprehensive model for entities to use in accounting for revenue arising from contracts with customers and supersedes most current revenue recognition guidance, including industry-specific guidance.
The Company elected to use a modified retrospective method of adoption, which required a cumulative adjustment to opening retained earnings (if any were identified), as opposed to a full retrospective application. The Company did not identify any adjustments required to opening retained earnings related to the adoption of the new revenue standard. The Company applied the retrospective application only to contracts that were not completed as of the implementation date. The Company did not apply the new guidance to contracts that were completed with all revenue recognized prior to the implementation date. In addition, total operating revenues on the Condensed Consolidated Statements of Income in years prior to 2018 would not have changed if the Company had elected to apply the full retrospective method of adoption.
Since the majority of Avista Corp.’s revenue is from rate-regulated sales of electricity and natural gas to retail customers and revenue is recognized as energy is delivered to these customers, the Company does not expect any significant change in operating revenues or net income going forward.
The only changes in revenue that resulted from the adoption of this ASU were related to the presentation of utility-related taxes collected from customers and the timing of when revenue from self-generated RECs is recognized.
Under ASU No. 2014-09, revenue associated with the sale of RECs is recognized at the time of generation and sale of the credits as opposed to when the RECs are certified in the Western Renewable Energy Generation Information System, which generally occurs during a period subsequent to the sale. This represents a change from the Company's prior practice, which was to defer revenue recognition until the time of certification. Revenue associated with the sale of RECs is not material to the financial statements and almost all of the Company's REC revenue is deferred for future rebate to retail customers. As such, the change in the timing of revenue recognition does not have a material impact on net income.
See Note 4 for the Company's complete revenue disclosures.
ASU No. 2016-02 “Leases (Topic 842)”
In February 2016, the FASB issued ASU No. 2016-02. This ASU introduces a new lessee model that requires most leases to be capitalized and shown on the balance sheet with corresponding lease assets and liabilities. The standard also aligns certain of the underlying principles of the new lessor model with those in Topic 606, the FASB’s new revenue recognition standard. Furthermore, this ASU addresses other issues that arise under the current lease model; for example, eliminating the required use of bright-line tests in current GAAP for determining lease classification (operating leases versus capital leases). This ASU also includes enhanced disclosures surrounding leases. This ASU is effective for periods beginning on or after December 15, 2018; however, early adoption is permitted. Under ASU No. 2016-02, upon adoption, the effects of this standard must be applied using a modified retrospective approach to the earliest period presented, which will likely require restatements of previously issued financial statements. The modified retrospective approach includes a number of optional practical expedients that entities may elect to apply. In July 2018, the FASB issued ASU No. 2018-11 which provides a practical expedient that allows companies to use an optional transition method. Under the optional transition method, a cumulative adjustment to retained earnings during the period of adoption is recorded and prior periods would not require restatement.
The Company evaluated ASU No. 2016-02 and determined that it will not early adopt this standard before its effective date in 2019.
The Company has formed a lease standard implementation team that is working through the implementation process. Based on work to date, the implementation team has identified a complete population of existing and potential leases under the new standard and has completed its review of the agreements associated with this population. However, the team has not yet quantified the impact of recording these leases. In addition, the team is developing a process to identify any new potential leases that may be entered into prior to the standard implementation date in 2019.
The Company is monitoring utility industry implementation guidance as it relates to several unresolved issues to determine if there will be an industry consensus. The Company has not estimated the potential impact on its future financial condition, results of operations and cash flows.
15
ASU No. 2017-07 “Compensation-Retirement Benefits (Topic 715): Improving the Presentation of Net Periodic Pension Cost and Net Periodic Postretirement Benefit Cost”
On January 1, 2018, the Company adopted ASU No. 2017-07, which amended the income statement presentation of the components of net period benefit cost for an entity’s defined benefit pension and other postretirement plans. Under previous GAAP, net benefit cost consisted of several components that reflected different aspects of an employer’s financial arrangements as well as the cost of benefits earned by employees. These components were aggregated and reported net in the financial statements. ASU No. 2017-07 requires entities to (1) disaggregate the current service-cost component from the other components of net benefit cost (other components) and present it with other current compensation costs for related employees in the income statement and (2) present the other components elsewhere in the income statement and outside of income from operations.
In addition, only the service-cost component of net benefit cost is eligible for capitalization (e.g., as part of utility plant). This is a change from prior practice, under which entities capitalized the aggregate net benefit cost to utility plant when applicable, in accordance with FERC accounting guidance. Avista Corp. is a rate-regulated entity and all components of net benefit cost are currently recovered from customers as a component of utility plant and, under the new ASU, these costs will continue to be recovered from customers in the same manner over the depreciable lives of utility plant. As all such costs are expected to continue to be recoverable, the components that are no longer eligible to be recorded as a component of utility plant for GAAP will be recorded as regulatory assets.
Upon adoption, entities must use a retrospective transition method to adopt the requirement for separate presentation in the income statement and a prospective transition method to adopt the requirement to limit the capitalization of benefit costs to the service-cost component. Due to the retrospective requirements for income statement presentation, for the three and
six months ended
June 30, 2017
, the Company reclassified
$1.8 million
and
$3.9 million
, respectively in non-service cost components of pension and other postretirement benefits from utility other operating expenses to other expense (income)-net on the Condensed Consolidated Statements of Income. See Note 6 for additional discussion regarding pension and other postretirement benefit expense.
ASU No. 2018-02 “Income Statement-Reporting Comprehensive Income (Topic 220): Reclassification of Certain Tax Effects from Accumulated Other Comprehensive Income”
In February 2018, the FASB issued ASU No. 2018-02, which amended the guidance for reporting comprehensive income. This ASU allows a reclassification from accumulated other comprehensive income to retained earnings for stranded tax effects resulting from the enactment of the TCJA in December 2017. This ASU is effective for periods beginning after December 15, 2018 and early adoption is permitted. Upon adoption, the requirements of this ASU must be applied either in the period of adoption or retrospectively to each period (or periods) in which the effect of the change in the U.S. federal corporate income tax rate in the TCJA is recognized. The Company early adopted this standard effective January 1, 2018 and elected to apply the guidance during the period of adoption rather than apply the standard retrospectively. As a result, the Company reclassified
$1.7 million
in tax benefits from accumulated other comprehensive loss to retained earnings during the
six months ended
June 30, 2018
.
ASC 606, which outlines a single comprehensive model for entities to use in accounting for revenue arising from contracts with customers and superseded previous revenue recognition guidance, including industry-specific guidance, became effective on January 1, 2018. The core principle of the revenue model is that an entity should identify the various performance obligations in a contract, allocate the transaction price among the performance obligations and recognize revenue when (or as) the entity satisfies each performance obligation.
Utility Revenues
Revenue from Contracts with Customers
General
The majority of Avista Corp.’s revenue is from rate-regulated sales of electricity and natural gas to retail customers, which has two performance obligations, (1) having service available for a specified period (typically a month at a time) and (2) the delivery of energy to customers. The total energy price generally has a fixed component (basic charge) related to having service available and a usage-based component, related to the delivery and consumption of energy.
16
In addition, the sale of electricity and natural gas is governed by the various state utility commissions, which set rates, charges, terms and conditions of service, and prices. Collectively, these rates, charges, terms and conditions are included in a “tariff,” which governs all aspects of the provision of regulated services. Tariffs are only permitted to be changed through a rate-setting process involving an independent, third-party regulator empowered by statute to establish rates that bind customers. Thus, all regulated sales by the Company are conducted subject to the regulator-approved tariff.
Tariff sales involve the current provision of commodity service (electricity and/or natural gas) to customers for a price that generally has a basic charge and a usage-based component. Tariff rates also include certain pass-through costs to customers such as natural gas costs, retail revenue credits and other miscellaneous regulatory items that do not impact net income, but can cause total revenue to fluctuate significantly up or down compared to previous periods. The commodity is sold and/or delivered to and consumed by the customer simultaneously, and the provisions of the relevant tariff determine the charges the Company may bill the customer, payment due date, and other pertinent rights and obligations of both parties. Generally, tariff sales do not involve a written contract. Given that all revenue recognition criteria are met upon the delivery of energy to customers, revenue is recognized immediately at that time.
Revenues from contracts with customers are presented in the Condensed Consolidated Statements of Income in the line item "Utility revenues, exclusive of alternative revenue programs."
Unbilled Revenue from Contracts with Customers
The determination of the volume of energy sales to individual customers is based on the reading of their meters, which occurs on a systematic basis throughout the month (once per month for each individual customer). At the end of each calendar month, the amount of energy delivered to customers since the date of the last meter reading is estimated and the corresponding unbilled revenue is estimated and recorded. The Company's estimate of unbilled revenue is based on:
|
•
|
the number of customers,
|
|
•
|
current rates,
|
|
•
|
meter reading dates,
|
|
•
|
actual native load for electricity,
|
|
•
|
actual throughput for natural gas, and
|
|
•
|
electric line losses and natural gas system losses.
|
Any difference between actual and estimated revenue is automatically corrected in the following month when the actual meter reading and customer billing occurs.
Accounts receivable includes unbilled energy revenues of the following amounts as of
June 30, 2018
and
December 31, 2017
(dollars in thousands):
|
June 30,
|
December 31,
|
||||||
|
2018
|
2017
|
||||||
|
Unbilled accounts receivable
|
$
|
39,383
|
|
$
|
68,641
|
|
|
Non-Derivative Wholesale Contracts
The Company has certain wholesale contracts which do not meet the criteria for classification as derivatives. Since they do not meet the definition of a derivative, they are within the scope of ASC 606 and are considered revenue from contracts with customers. Revenue is recognized as energy is delivered to the customer or the service is available for specified period of time, consistent with the discussion of tariff sales above.
Alternative Revenue Programs (Decoupling)
ASC 606 retained existing GAAP associated with alternative revenue programs, which specified that alternative revenue programs are contracts between an entity and a regulator of utilities, not a contract between an entity and a customer. GAAP requires that an entity present revenue arising from alternative revenue programs separately from revenues arising from contracts with customers on the face of the Condensed Consolidated Statements of Income. The Company's decoupling mechanisms (also known as a FCA in Idaho) qualify as alternative revenue programs. Decoupling revenue deferrals are recognized in the Condensed Consolidated Statements of Income during the period they occur (i.e. during the period of revenue shortfall or excess due to fluctuations in customer usage), subject to certain limitations, and a regulatory asset or liability is established which will be surcharged or rebated to customers in future periods. GAAP requires that for any alternative revenue program, like decoupling, the revenue must be expected to be collected from customers within 24 months of the deferral to
17
qualify for recognition in the current period Condensed Consolidated Statement of Income. Any amounts included in the Company's decoupling program that are not expected to be collected from customers within 24 months are not recorded in the financial statements until the period in which revenue recognition criteria are met. The amounts expected to be collected from customers within 24 months represents an estimate which must be made by the Company on an ongoing basis due to it being based on the volumes of electric and natural gas sold to customers on a go-forward basis.
Two acceptable methods of presenting decoupling revenue have evolved within the utility industry and a policy election is required by the Company. The two options relate to how the collection/refund of previously recognized decoupling revenue is presented within total revenue. The first option is the gross method, which is to amortize the decoupling regulatory asset/liability to the alternative revenue program line item on the Condensed Consolidated Statement of Income as it is collected from or refunded to customers. The cash passing between the Company and the customers is presented in revenue from contracts with customers since it is a portion of the overall tariff paid by customers. This method results in a gross-up to both revenue from contracts with customers and revenue from alternative revenue programs, but has a net zero impact on total revenue. The second option is the net method, which requires the amortization of the decoupling regulatory asset/liability to be presented within revenue from contracts with customers such that, when netted against the cash passing between the Company and the customers within the same line item, there is a net zero impact to revenue from contracts with customers and total revenue. The Company has elected the gross method for the presentation of alternative revenue program revenue, consistent with historical practice. Depending on whether the previous deferral balance being amortized was a regulatory asset or regulatory liability, and depending on the size and direction of the current year deferral of surcharges and/or rebates to customers, it could result in negative alternative revenue program revenue during the year.
Derivative Revenue
Most wholesale electric and natural gas transactions (including both physical and financial transactions), and the sale of fuel are considered derivatives, which are specifically scoped out of ASC 606. As such, these revenues are disclosed separately from revenue from contracts with customers. Revenue is recognized for these items upon the settlement/expiration of the derivative contract. Derivative revenue includes those transactions which are entered into and settled within the same month.
Other Utility Revenue
Other utility revenue includes rent, revenues from the lineman training school, sales of materials, late fees and other charges that do not represent contracts with customers.
Other utility revenue also includes the provision for earnings sharing and the deferral and amortization of refunds to customers associated with the TCJA, enacted in December 2017. This revenue is scoped out of ASC 606, as this revenue does not represent items where a customer is a party that has contracted with the Company to obtain goods or services that are an output of the Company’s ordinary activities in exchange for consideration. As such, these revenues are presented separately from revenue from contracts with customers.
Other Considerations for Utility Revenues
Contracts with Multiple Performance Obligations
In addition to the tariff sales described above, which are stand-alone energy sales, the Company has bundled arrangements which contain multiple performance obligations including some combination of energy, capacity, energy reserves and RECs. Under these arrangements, the total contract price is allocated to the various performance obligations and revenue is recognized as the obligations are satisfied. Depending on the source of the revenue, it could either be included in revenue from contracts with customers or derivative revenue.
Gross Versus Net Presentation
Revenues and resource costs from Avista Utilities’ settled energy contracts that are “booked out” (not physically delivered) are reported on a net basis as part of derivative revenues.
Utility-related taxes collected from customers (primarily state excise taxes and city utility taxes) are taxes that are imposed on Avista Utilities as opposed to being imposed on its customers; therefore, Avista Utilities is the taxpayer and records these transactions on a gross basis in revenue from contracts with customers and operating expense (taxes other than income taxes). The utility-related taxes collected from customers at AEL&P are imposed on the customers rather than AEL&P; therefore, the customers are the taxpayers and AEL&P is acting as their agent. As such, effective January 1, 2018, these transactions at AEL&P are presented on a net basis within revenue from contracts with customers. Prior to the adoption of ASU No. 2014-09, the Company presented utility-related taxes at AEL&P on a gross basis, consistent with the presentation for Avista Utilities. In prior years, there were approximately
$2.0 million
annually in utility-related taxes collected from customers included in revenue for AEL&P.
18
Utility-related taxes that were included in revenue from contracts with customers were as follows for the three and
six months ended June 30
(dollars in thousands):
|
Three months ended June 30,
|
Six months ended June 30,
|
||||||||||||||
|
2018
|
2017
|
2018
|
2017
|
||||||||||||
|
Utility-related taxes
|
$
|
12,986
|
|
$
|
13,552
|
|
$
|
32,153
|
|
$
|
35,136
|
|
|||
Non-Utility Revenues
Revenue from Contracts with Customers
Non-utility revenues from contracts with customers are primarily derived from the operations of METALfx. The contracts associated with METALfx have one performance obligation, the delivery of a product, and revenues are recognized when the risk of loss transfers to the customer, which occurs when products are shipped.
Other Revenue
Other non-utility revenue primarily relates to rent revenue, which is scoped out of ASC 606; therefore, this revenue is presented separately from revenue from contracts with customers.
Significant Judgments and Unsatisfied Performance Obligations
The vast majority of the Company's revenues are derived from the rate-regulated sale of electricity and natural gas that have two performance obligations that are satisfied throughout the period and as energy is delivered to customers. In addition, the customers do not pay for energy in advance of receiving it. As such, the Company does not have any significant unsatisfied performance obligations or deferred revenues as of period-end associated with these revenues. Also, the only significant judgments involving revenue recognition are estimates surrounding unbilled revenue and receivables from contracts with customers (discussed in detail above) and estimates surrounding the amount of decoupling revenues which will be collected from customers within 24 months.
The Company has certain capacity arrangements, where the Company has a contractual obligation to provide either electric or natural gas capacity to its customers for a fixed fee. Most of these arrangements are paid for in arrears by the customers and do not result in deferred revenue and only result in receivables from the customers. The Company does have one capacity agreement where the customer makes payments throughout the year and depending on the timing of the customer payments, it can result in an immaterial amount of deferred revenue or a receivable from the customer. As of
June 30, 2018
, the Company estimates it had unsatisfied capacity performance obligations of
$12.6 million
, which will be recognized as revenue in future periods as the capacity is provided to the customers. These performance obligations are not reflected in the financial statements, as the Company has not received payment for these services.
19
Disaggregation of Total Operating Revenue
The following table disaggregates total operating revenue by segment and source for the three and
six months ended June 30
(dollars in thousands):
|
Three months ended
|
Six months ended
|
||||||
|
|
June 30, 2018
|
June 30, 2018
|
|||||
|
Avista Utilities
|
|||||||
|
Revenue from contracts with customers
|
$
|
239,113
|
|
$
|
593,275
|
|
|
|
Derivative revenues
|
56,357
|
|
114,749
|
|
|||
|
Alternative revenue programs
|
3,570
|
|
(2,369
|
)
|
|||
|
Deferrals and amortizations for rate refunds to customers
|
982
|
|
(18,840
|
)
|
|||
|
Other utility revenues
|
2,200
|
|
4,161
|
|
|||
|
Total Avista Utilities
|
302,222
|
|
690,976
|
|
|||
|
AEL&P
|
|||||||
|
Revenue from contracts with customers
|
10,759
|
|
25,409
|
|
|||
|
Deferrals and amortizations for rate refunds to customers
|
(427
|
)
|
(1,549
|
)
|
|||
|
Other utility revenues
|
150
|
|
285
|
|
|||
|
Total AEL&P
|
10,482
|
|
24,145
|
|
|||
|
Other
|
|||||||
|
Revenue from contracts with customers
|
6,324
|
|
13,053
|
|
|||
|
Other revenues
|
270
|
|
485
|
|
|||
|
Total other
|
6,594
|
|
13,538
|
|
|||
|
Total operating revenues
|
$
|
319,298
|
|
$
|
728,659
|
|
|
Utility Revenue from Contracts with Customers by Type and Service
The following table disaggregates revenue from contracts with customers associated with the Company's utility operations for the three and
six months ended June 30
(dollars in thousands):
|
|
Three months ended June 30, 2018
|
Six months ended June 30, 2018
|
|||||||||||||||||||||
|
|
Avista Utilities
|
AEL&P
|
Total Utility
|
Avista Utilities
|
AEL&P
|
Total Utility
|
|||||||||||||||||
|
ELECTRIC OPERATIONS
|
|||||||||||||||||||||||
|
Revenue from contracts with customers
|
|||||||||||||||||||||||
|
Residential
|
$
|
74,818
|
|
$
|
4,155
|
|
$
|
78,973
|
|
$
|
189,571
|
|
$
|
10,693
|
|
$
|
200,264
|
|
|||||
|
Commercial and governmental
|
76,462
|
|
6,541
|
|
83,003
|
|
155,371
|
|
14,585
|
|
169,956
|
|
|||||||||||
|
Industrial
|
27,985
|
|
—
|
|
27,985
|
|
53,104
|
|
—
|
|
53,104
|
|
|||||||||||
|
Public street and highway lighting
|
1,899
|
|
63
|
|
1,962
|
|
3,758
|
|
131
|
|
3,889
|
|
|||||||||||
|
Total retail revenue
|
181,164
|
|
10,759
|
|
191,923
|
|
401,804
|
|
25,409
|
|
427,213
|
|
|||||||||||
|
Transmission
|
4,171
|
|
—
|
|
4,171
|
|
8,001
|
|
—
|
|
8,001
|
|
|||||||||||
|
Other revenue from contracts with customers
|
3,919
|
|
—
|
|
3,919
|
|
10,210
|
|
—
|
|
10,210
|
|
|||||||||||
|
Total revenue from contracts with customers
|
$
|
189,254
|
|
$
|
10,759
|
|
$
|
200,013
|
|
$
|
420,015
|
|
$
|
25,409
|
|
$
|
445,424
|
|
|||||
20
|
|
Three months ended June 30, 2018
|
Six months ended June 30, 2018
|
|||||||||||||||||||||
|
|
Avista Utilities
|
AEL&P
|
Total Utility
|
Avista Utilities
|
AEL&P
|
Total Utility
|
|||||||||||||||||
|
NATURAL GAS OPERATIONS
|
|||||||||||||||||||||||
|
Revenue from contracts with customers
|
|
|
|
|
|
|
|||||||||||||||||
|
Residential
|
$
|
30,767
|
|
$
|
—
|
|
$
|
30,767
|
|
$
|
111,421
|
|
$
|
—
|
|
$
|
111,421
|
|
|||||
|
Commercial
|
14,668
|
|
—
|
|
14,668
|
|
52,040
|
|
—
|
|
52,040
|
|
|||||||||||
|
Industrial and interruptible
|
1,078
|
|
—
|
|
1,078
|
|
2,761
|
|
—
|
|
2,761
|
|
|||||||||||
|
Total retail revenue
|
46,513
|
|
—
|
|
46,513
|
|
166,222
|
|
—
|
|
166,222
|
|
|||||||||||
|
Transportation
|
2,221
|
|
—
|
|
2,221
|
|
4,788
|
|
—
|
|
4,788
|
|
|||||||||||
|
Other revenue from contracts with customers
|
1,125
|
|
—
|
|
1,125
|
|
2,250
|
|
—
|
|
2,250
|
|
|||||||||||
|
Total revenue from contracts with customers
|
$
|
49,859
|
|
$
|
—
|
|
$
|
49,859
|
|
$
|
173,260
|
|
$
|
—
|
|
$
|
173,260
|
|
|||||
Energy Commodity Derivatives
Avista Corp. is exposed to market risks relating to changes in electricity and natural gas commodity prices and certain other fuel prices. Market risk is, in general, the risk of fluctuation in the market price of the commodity being traded and is influenced primarily by supply and demand. Market risk includes the fluctuation in the market price of associated derivative commodity instruments. Avista Corp. utilizes derivative instruments, such as forwards, futures, swap derivatives and options in order to manage the various risks relating to these commodity price exposures. Avista Corp. has an energy resources risk policy and control procedures to manage these risks.
As part of Avista Corp.'s resource procurement and management operations in the electric business, Avista Corp. engages in an ongoing process of resource optimization, which involves the economic selection from available energy resources to serve Avista Corp.'s load obligations and the use of these resources to capture available economic value through wholesale market transactions. These include sales and purchases of electric capacity and energy, fuel for electric generation, and derivative contracts related to capacity, energy and fuel. Such transactions are part of the process of matching resources with load obligations and hedging a portion of the related financial risks. These transactions range from terms of intra-hour up to multiple years.
As part of its resource procurement and management of its natural gas business, Avista Corp. makes continuing projections of its natural gas loads and assesses available natural gas resources including natural gas storage availability. Natural gas resource planning typically includes peak requirements, low and average monthly requirements and delivery constraints from natural gas supply locations to Avista Corp.’s distribution system. However, daily variations in natural gas demand can be significantly different than monthly demand projections. On the basis of these projections, Avista Corp. plans and executes a series of transactions to hedge a portion of its projected natural gas requirements through forward market transactions and derivative instruments. These transactions may extend as much as four natural gas operating years (November through October) into the future. Avista Corp. also leaves a significant portion of its natural gas supply requirements unhedged for purchase in short-term and spot markets.
Avista Corp. plans for sufficient natural gas delivery capacity to serve its retail customers for a theoretical peak day event. Avista Corp. generally has more pipeline and storage capacity than what is needed during periods other than a peak-day. Avista Corp. optimizes its natural gas resources by using market opportunities to generate economic value that helps mitigate fixed costs. Avista Corp. also optimizes its natural gas storage capacity by purchasing and storing natural gas when prices are traditionally lower, typically in the summer, and withdrawing during higher priced months, typically during the winter. However, if market conditions and prices indicate that Avista Corp. should buy or sell natural gas at other times during the year, Avista Corp. engages in optimization transactions to capture value in the marketplace. Natural gas optimization activities include, but are not limited to, wholesale market sales of surplus natural gas supplies, purchases and sales of natural gas to optimize use of pipeline and storage capacity, and participation in the transportation capacity release market.
21
The following table presents the underlying energy commodity derivative volumes as of
June 30, 2018
that are expected to be delivered in each respective year (in thousands of MWhs and mmBTUs):
|
|
Purchases
|
Sales
|
|||||||||||||||||||||
|
|
Electric Derivatives
|
Gas Derivatives
|
Electric Derivatives
|
Gas Derivatives
|
|||||||||||||||||||
|
Year
|
Physical (1)
MWh
|
Financial (1)
MWh
|
Physical (1)
mmBTUs
|
Financial (1)
mmBTUs
|
Physical (1)
MWh |
Financial (1)
MWh |
Physical (1)
mmBTUs |
Financial (1)
mmBTUs |
|||||||||||||||
|
Remainder 2018
|
140
|
|
450
|
|
8,399
|
|
65,063
|
|
153
|
|
967
|
|
3,699
|
|
39,963
|
|
|||||||
|
2019
|
173
|
|
737
|
|
610
|
|
73,923
|
|
156
|
|
1,912
|
|
1,795
|
|
40,363
|
|
|||||||
|
2020
|
—
|
|
—
|
|
910
|
|
27,265
|
|
—
|
|
836
|
|
1,430
|
|
3,500
|
|
|||||||
|
2021
|
—
|
|
—
|
|
—
|
|
2,250
|
|
—
|
|
—
|
|
1,049
|
|
450
|
|
|||||||
|
2022
|
—
|
|
—
|
|
—
|
|
—
|
|
—
|
|
—
|
|
—
|
|
—
|
|
|||||||
|
Thereafter
|
—
|
|
—
|
|
—
|
|
—
|
|
—
|
|
—
|
|
—
|
|
—
|
|
|||||||
The following table presents the underlying energy commodity derivative volumes as of
December 31, 2017
that are expected to be delivered in each respective year (in thousands of MWhs and mmBTUs):
|
|
Purchases
|
Sales
|
|||||||||||||||||||||
|
|
Electric Derivatives
|
Gas Derivatives
|
Electric Derivatives
|
Gas Derivatives
|
|||||||||||||||||||
|
Year
|
Physical (1)
MWh |
Financial (1)
MWh |
Physical (1)
mmBTUs |
Financial (1)
mmBTUs |
Physical (1)
MWh |
Financial (1)
MWh |
Physical (1)
mmBTUs |
Financial (1)
mmBTUs |
|||||||||||||||
|
2018
|
426
|
|
763
|
|
10,572
|
|
107,580
|
|
213
|
|
1,739
|
|
3,643
|
|
67,375
|
|
|||||||
|
2019
|
235
|
|
737
|
|
610
|
|
61,073
|
|
94
|
|
1,420
|
|
1,345
|
|
35,438
|
|
|||||||
|
2020
|
—
|
|
—
|
|
910
|
|
16,590
|
|
—
|
|
589
|
|
1,430
|
|
915
|
|
|||||||
|
2021
|
—
|
|
—
|
|
—
|
|
—
|
|
—
|
|
—
|
|
1,049
|
|
—
|
|
|||||||
|
2022
|
—
|
|
—
|
|
—
|
|
—
|
|
—
|
|
—
|
|
—
|
|
—
|
|
|||||||
|
Thereafter
|
—
|
|
—
|
|
—
|
|
—
|
|
—
|
|
—
|
|
—
|
|
—
|
|
|||||||
|
(1)
|
Physical transactions represent commodity transactions in which Avista Corp. will take or make delivery of either electricity or natural gas; financial transactions represent derivative instruments with delivery of cash in the amount of the benefit or cost but with no physical delivery of the commodity, such as futures, swap derivatives, options, or forward contracts.
|
The electric and natural gas derivative contracts above will be included in either power supply costs or natural gas supply costs during the period they are delivered and will be included in the various deferral and recovery mechanisms (ERM, PCA and PGAs), or in the general rate case process, and are expected to be collected through retail rates from customers.
Foreign Currency Exchange Derivatives
A significant portion of Avista Corp.’s natural gas supply (including fuel for power generation) is obtained from Canadian sources. Most of those transactions are executed in U.S. dollars, which avoids foreign currency risk. A portion of Avista Corp.’s short-term natural gas transactions and long-term Canadian transportation contracts are committed based on Canadian currency prices and settled within
60 days
with U.S. dollars. Avista Corp. hedges foreign currency risk by purchasing Canadian currency exchange derivatives when such commodity transactions are initiated. The foreign currency exchange derivatives and the unhedged foreign currency risk have not had a material effect on Avista Corp.’s financial condition, results of operations or cash flows and these differences in cost related to currency fluctuations are included with natural gas supply costs for ratemaking.
The following table summarizes the foreign currency exchange derivatives that Avista Corp. has outstanding as of
June 30, 2018
and
December 31, 2017
(dollars in thousands):
|
June 30,
|
December 31,
|
||||||
|
2018
|
2017
|
||||||
|
Number of contracts
|
23
|
|
18
|
|
|||
|
Notional amount (in United States dollars)
|
$
|
3,494
|
|
$
|
2,552
|
|
|
|
Notional amount (in Canadian dollars)
|
4,586
|
|
3,241
|
|
|||
22
Interest Rate Derivatives
Avista Corp. is affected by fluctuating interest rates related to a portion of its existing debt, and future borrowing requirements. Avista Corp. hedges a portion of its interest rate risk with financial derivative instruments, which may include interest rate swap derivatives and U.S. Treasury lock agreements. These interest rate swap derivatives and U.S. Treasury lock agreements are considered economic hedges against fluctuations in future cash flows associated with anticipated debt issuances.
The following table summarizes the unsettled interest rate swap derivatives that Avista Corp. has outstanding as of
June 30, 2018
and
December 31, 2017
(dollars in thousands):
|
Balance Sheet Date
|
Number of Contracts
|
Notional Amount
|
Mandatory Cash Settlement Date
|
|||||
|
June 30, 2018
|
6
|
$
|
70,000
|
|
2019
|
|||
|
4
|
40,000
|
|
2020
|
|||||
|
1
|
15,000
|
|
2021
|
|||||
|
5
|
60,000
|
|
2022
|
|||||
|
December 31, 2017
|
14
|
$
|
275,000
|
|
2018
|
|||
|
6
|
70,000
|
|
2019
|
|||||
|
3
|
30,000
|
|
2020
|
|||||
|
1
|
15,000
|
|
2021
|
|||||
|
5
|
60,000
|
|
2022
|
|||||
During the second quarter 2018, in connection with the issuance and sale of $375.0 million of Avista Corp. first mortgage bonds (see Note 8), the Company cash-settled
fourteen
interest rate swap derivatives (notional aggregate amount of
$275.0 million
) and paid a net amount of
$25.9 million
. Upon settlement of interest rate swap derivatives, the cash payments made or received are recorded as a regulatory asset or liability and are subsequently amortized as a component of interest expense over the life of the associated debt. The settled interest rate swap derivatives are also included as a part of Avista Corp.'s cost of debt calculation for ratemaking purposes.
The fair value of outstanding interest rate swap derivatives can vary significantly from period to period depending on the total notional amount of swap derivatives outstanding and fluctuations in market interest rates compared to the interest rates fixed by the swaps. Avista Corp. is required to make cash payments to settle the interest rate swap derivatives when the fixed rates are higher than prevailing market rates at the date of settlement. Conversely, Avista Corp. receives cash to settle its interest rate swap derivatives when prevailing market rates at the time of settlement exceed the fixed swap rates.
23
Summary of Outstanding Derivative Instruments
The amounts recorded on the Condensed Consolidated Balance Sheet as of
June 30, 2018
and
December 31, 2017
reflect the offsetting of derivative assets and liabilities where a legal right of offset exists.
The following table presents the fair values and locations of derivative instruments recorded on the Condensed Consolidated Balance Sheet as of
June 30, 2018
(in thousands):
|
|
Fair Value
|
|||||||||||||||
|
Derivative and Balance Sheet Location
|
Gross
Asset
|
Gross
Liability
|
Collateral
Netted
|
Net Asset
(Liability)
on Balance
Sheet
|
||||||||||||
|
Foreign currency exchange derivatives
|
||||||||||||||||
|
Other current liabilities
|
$
|
16
|
|
$
|
(21
|
)
|
$
|
—
|
|
$
|
(5
|
)
|
||||
|
Interest rate swap derivatives
|
||||||||||||||||
|
Other property and investments-net and other non-current assets
|
12,314
|
|
—
|
|
—
|
|
12,314
|
|
||||||||
|
Other non-current liabilities and deferred credits
|
—
|
|
(5,491
|
)
|
590
|
|
(4,901
|
)
|
||||||||
|
Energy commodity derivatives
|
||||||||||||||||
|
Other current assets
|
96
|
|
—
|
|
—
|
|
96
|
|
||||||||
|
Other property and investments-net and other non-current assets
|
15
|
|
—
|
|
—
|
|
15
|
|
||||||||
|
Other current liabilities
|
32,292
|
|
(54,138
|
)
|
14,057
|
|
(7,789
|
)
|
||||||||
|
Other non-current liabilities and deferred credits
|
10,558
|
|
(21,850
|
)
|
7,724
|
|
(3,568
|
)
|
||||||||
|
Total derivative instruments recorded on the balance sheet
|
$
|
55,291
|
|
$
|
(81,500
|
)
|
$
|
22,371
|
|
$
|
(3,838
|
)
|
||||
The following table presents the fair values and locations of derivative instruments recorded on the Condensed Consolidated Balance Sheet as of
December 31, 2017
(in thousands):
|
|
Fair Value
|
|||||||||||||||
|
Derivative and Balance Sheet Location
|
Gross
Asset
|
Gross
Liability
|
Collateral
Netted |
Net Asset
(Liability) on Balance Sheet |
||||||||||||
|
Foreign currency exchange derivatives
|
||||||||||||||||
|
Other current assets
|
$
|
32
|
|
$
|
(1
|
)
|
$
|
—
|
|
$
|
31
|
|
||||
|
Interest rate swap derivatives
|
||||||||||||||||
|
Other current assets
|
2,597
|
|
(270
|
)
|
—
|
|
2,327
|
|
||||||||
|
Other property and investments-net and other non-current assets
|
4,880
|
|
(2,304
|
)
|
—
|
|
2,576
|
|
||||||||
|
Other current liabilities
|
—
|
|
(63,399
|
)
|
28,952
|
|
(34,447
|
)
|
||||||||
|
Other non-current liabilities and deferred credits
|
—
|
|
(7,540
|
)
|
6,018
|
|
(1,522
|
)
|
||||||||
|
Energy commodity derivatives
|
||||||||||||||||
|
Other current assets
|
1,386
|
|
(122
|
)
|
—
|
|
1,264
|
|
||||||||
|
Other current liabilities
|
26,641
|
|
(52,895
|
)
|
17,406
|
|
(8,848
|
)
|
||||||||
|
Other non-current liabilities and deferred credits
|
15,970
|
|
(34,936
|
)
|
10,032
|
|
(8,934
|
)
|
||||||||
|
Total derivative instruments recorded on the balance sheet
|
$
|
51,506
|
|
$
|
(161,467
|
)
|
$
|
62,408
|
|
$
|
(47,553
|
)
|
||||
Exposure to Demands for Collateral
Avista Corp.'s derivative contracts often require collateral (in the form of cash or letters of credit) or other credit enhancements, or reductions or terminations of a portion of the contract through cash settlement. In the event of a downgrade in Avista Corp.'s credit ratings or changes in market prices, additional collateral may be required. In periods of price volatility, the level of exposure can change significantly. As a result, sudden and significant demands may be made against Avista Corp.'s credit facilities and cash. Avista Corp. actively monitors the exposure to possible collateral calls and takes steps to mitigate capital requirements.
24
The following table presents Avista Corp.'s collateral outstanding related to its derivative instruments as of
June 30, 2018
and
December 31, 2017
(in thousands):
|
June 30,
|
December 31,
|
||||||
|
2018
|
2017
|
||||||
|
Energy commodity derivatives
|
|||||||
|
Cash collateral posted
|
$
|
29,757
|
|
$
|
39,458
|
|
|
|
Letters of credit outstanding
|
21,700
|
|
23,000
|
|
|||
|
Balance sheet offsetting (cash collateral against net derivative positions)
|
21,781
|
|
27,438
|
|
|||
|
Interest rate swap derivatives
|
|||||||
|
Cash collateral posted
|
590
|
|
34,970
|
|
|||
|
Letters of credit outstanding
|
—
|
|
5,000
|
|
|||
|
Balance sheet offsetting (cash collateral against net derivative positions)
|
590
|
|
34,970
|
|
|||
Certain of Avista Corp.’s derivative instruments contain provisions that require Avista Corp. to maintain an "investment grade" credit rating from the major credit rating agencies. If Avista Corp.’s credit ratings were to fall below "investment grade," it would be in violation of these provisions, and the counterparties to the derivative instruments could request immediate payment or demand immediate and ongoing collateralization on derivative instruments in net liability positions.
The following table presents the aggregate fair value of all derivative instruments with credit-risk-related contingent features that are in a liability position and the amount of additional collateral Avista Corp. could be required to post as of
June 30, 2018
and
December 31, 2017
(in thousands):
|
June 30,
|
December 31,
|
||||||
|
2018
|
2017
|
||||||
|
Energy commodity derivatives
|
|||||||
|
Liabilities with credit-risk-related contingent features
|
$
|
1,529
|
|
$
|
1,336
|
|
|
|
Additional collateral to post
|
1,529
|
|
1,336
|
|
|||
|
Interest rate swap derivatives
|
|||||||
|
Liabilities with credit-risk-related contingent features
|
5,491
|
|
73,514
|
|
|||
|
Additional collateral to post
|
2,400
|
|
18,770
|
|
|||
Avista Utilities
Avista Utilities’ pension and other postretirement plans have not changed during the
six months ended June 30, 2018
. The Company’s funding policy is to contribute at least the minimum amounts that are required to be funded under the Employee Retirement Income Security Act, but not more than the maximum amounts that are currently deductible for income tax purposes. The Company contributed
$14.6 million
in cash to the pension plan for the
six months ended June 30, 2018
and expects to contribute a total of
$22.0 million
in 2018.
25
The Company uses a December 31 measurement date for its defined benefit pension and other postretirement benefit plans. The following table sets forth the components of net periodic benefit costs for the three and
six months ended June 30
(dollars in thousands):
|
Pension Benefits
|
Other Postretirement Benefits
|
||||||||||||||
|
2018
|
2017
|
2018
|
2017
|
||||||||||||
|
Three months ended June 30:
|
|||||||||||||||
|
Service cost (a)
|
$
|
5,450
|
|
$
|
5,092
|
|
$
|
804
|
|
$
|
799
|
|
|||
|
Interest cost
|
6,466
|
|
6,976
|
|
1,197
|
|
1,374
|
|
|||||||
|
Expected return on plan assets
|
(8,250
|
)
|
(7,900
|
)
|
(500
|
)
|
(475
|
)
|
|||||||
|
Amortization of prior service cost
|
75
|
|
—
|
|
209
|
|
(312
|
)
|
|||||||
|
Net loss recognition
|
1,842
|
|
2,317
|
|
562
|
|
1,320
|
|
|||||||
|
Net periodic benefit cost
|
$
|
5,583
|
|
$
|
6,485
|
|
$
|
2,272
|
|
$
|
2,706
|
|
|||
|
Six months ended June 30:
|
|||||||||||||||
|
Service cost (a)
|
$
|
10,900
|
|
$
|
10,134
|
|
$
|
1,608
|
|
$
|
1,623
|
|
|||
|
Interest cost
|
12,932
|
|
13,927
|
|
2,394
|
|
2,773
|
|
|||||||
|
Expected return on plan assets
|
(16,500
|
)
|
(15,800
|
)
|
(1,000
|
)
|
(950
|
)
|
|||||||
|
Amortization of prior service cost
|
150
|
|
—
|
|
(606
|
)
|
(624
|
)
|
|||||||
|
Net loss recognition
|
3,930
|
|
4,863
|
|
2,217
|
|
2,593
|
|
|||||||
|
Net periodic benefit cost
|
$
|
11,412
|
|
$
|
13,124
|
|
$
|
4,613
|
|
$
|
5,415
|
|
|||
|
(a)
|
Total service costs in the table above are recorded to the same accounts as labor expense. Labor and benefits expense is recorded to various projects based on whether the work is a capital project or an operating expense. Approximately
40 percent
of all labor and benefits is capitalized to utility property and
60 percent
is expensed to utility other operating expenses.
|
See Note 3 for discussion regarding the adoption of ASU No. 2017-07 and its impact to the presentation of pension and other postretirement benefits in the Condensed Consolidated Statements of Income and the Condensed Consolidated Balance Sheets.
Avista Corp.
Avista Corp. has a committed line of credit with various financial institutions in the total amount of
$400.0 million
that expires in
April 2021
. The committed line of credit is secured by non-transferable first mortgage bonds of the Company issued to the agent bank that would only become due and payable in the event, and then only to the extent, that the Company defaults on its obligations under the committed line of credit.
Balances outstanding and interest rates of borrowings (excluding letters of credit) under the Company’s revolving committed line of credit were as follows as of
June 30, 2018
and
December 31, 2017
(dollars in thousands):
|
June 30,
|
December 31,
|
||||||
|
2018
|
2017
|
||||||
|
Balance outstanding at end of period (1)
|
$
|
—
|
|
$
|
105,000
|
|
|
|
Letters of credit outstanding at end of period
|
$
|
25,620
|
|
$
|
34,420
|
|
|
|
Average interest rate at end of period
|
—
|
%
|
2.26
|
%
|
|||
|
(1)
|
As of
December 31, 2017
, the balance outstanding was classified as short-term borrowings on the Condensed Consolidated Balance Sheet.
|
AEL&P
AEL&P has a committed line of credit in the amount of
$25.0 million
that expires in
November 2019
. As of
June 30, 2018
and
December 31, 2017
, there were no borrowings or letters of credit outstanding under this committed line of credit. The committed line of credit is secured by non-transferable first mortgage bonds of AEL&P issued to the agent bank that would only become due and payable in the event, and then only to the extent, that AEL&P defaults on its obligations under the committed line of credit.
26
The following details long-term debt outstanding as of
June 30, 2018
and
December 31, 2017
(dollars in thousands):
|
Maturity
Year
|
Description
|
Interest
Rate
|
June 30,
2018 |
December 31,
2017 |
||||||||
|
Avista Corp. Secured Long-Term Debt
|
||||||||||||
|
2018
|
First Mortgage Bonds
|
5.95%
|
$
|
—
|
|
$
|
250,000
|
|
||||
|
2018
|
Secured Medium-Term Notes
|
7.39%-7.45%
|
—
|
|
22,500
|
|
||||||
|
2019
|
First Mortgage Bonds
|
5.45%
|
90,000
|
|
90,000
|
|
||||||
|
2020
|
First Mortgage Bonds
|
3.89%
|
52,000
|
|
52,000
|
|
||||||
|
2022
|
First Mortgage Bonds
|
5.13%
|
250,000
|
|
250,000
|
|
||||||
|
2023
|
Secured Medium-Term Notes
|
7.18%-7.54%
|
13,500
|
|
13,500
|
|
||||||
|
2028
|
Secured Medium-Term Notes
|
6.37%
|
25,000
|
|
25,000
|
|
||||||
|
2032
|
Secured Pollution Control Bonds (1)
|
(1)
|
66,700
|
|
66,700
|
|
||||||
|
2034
|
Secured Pollution Control Bonds (1)
|
(1)
|
17,000
|
|
17,000
|
|
||||||
|
2035
|
First Mortgage Bonds
|
6.25%
|
150,000
|
|
150,000
|
|
||||||
|
2037
|
First Mortgage Bonds
|
5.70%
|
150,000
|
|
150,000
|
|
||||||
|
2040
|
First Mortgage Bonds
|
5.55%
|
35,000
|
|
35,000
|
|
||||||
|
2041
|
First Mortgage Bonds
|
4.45%
|
85,000
|
|
85,000
|
|
||||||
|
2044
|
First Mortgage Bonds
|
4.11%
|
60,000
|
|
60,000
|
|
||||||
|
2045
|
First Mortgage Bonds
|
4.37%
|
100,000
|
|
100,000
|
|
||||||
|
2047
|
First Mortgage Bonds
|
4.23%
|
80,000
|
|
80,000
|
|
||||||
|
2047
|
First Mortgage Bonds
|
3.91%
|
90,000
|
|
90,000
|
|
||||||
|
2048
|
First Mortgage Bonds (2)
|
4.35%
|
375,000
|
|
—
|
|
||||||
|
2051
|
First Mortgage Bonds
|
3.54%
|
175,000
|
|
175,000
|
|
||||||
|
Total Avista Corp. secured long-term debt
|
1,814,200
|
|
1,711,700
|
|
||||||||
|
Alaska Electric Light and Power Company Secured Long-Term Debt
|
||||||||||||
|
2044
|
First Mortgage Bonds
|
4.54%
|
75,000
|
|
75,000
|
|
||||||
|
Total secured long-term debt
|
1,889,200
|
|
1,786,700
|
|
||||||||
|
Alaska Energy and Resources Company Unsecured Long-Term Debt
|
||||||||||||
|
2019
|
Unsecured Term Loan
|
3.85%
|
15,000
|
|
15,000
|
|
||||||
|
Total secured and unsecured long-term debt
|
1,904,200
|
|
1,801,700
|
|
||||||||
|
Other Long-Term Debt Components
|
||||||||||||
|
Capital lease obligations
|
58,478
|
|
62,148
|
|
||||||||
|
Unamortized debt discount
|
(922
|
)
|
(626
|
)
|
||||||||
|
Unamortized long-term debt issuance costs
|
(13,874
|
)
|
(10,285
|
)
|
||||||||
|
Total
|
1,947,882
|
|
1,852,937
|
|
||||||||
|
Secured Pollution Control Bonds held by Avista Corporation (1)
|
(83,700
|
)
|
(83,700
|
)
|
||||||||
|
Current portion of long-term debt and capital leases
|
(2,598
|
)
|
(277,438
|
)
|
||||||||
|
Total long-term debt and capital leases
|
$
|
1,861,584
|
|
$
|
1,491,799
|
|
||||||
|
(1)
|
In December 2010,
$66.7 million
and
$17.0 million
of the City of Forsyth, Montana Pollution Control Revenue Refunding Bonds (Avista Corporation Colstrip Project) due in
2032
and
2034
, respectively, which had been held by Avista Corp. since 2008 and 2009, respectively, were refunded by new variable rate bond issues (Series 2010A and Series 2010B). The new bonds were not offered to the public and were purchased by Avista Corp. due to market conditions. The Company expects that at a later date, subject to market conditions, these bonds may be remarketed to unaffiliated investors. So long as Avista Corp. is the holder of these bonds, the bonds will not be reflected as an asset or a liability on Avista Corp.'s Condensed Consolidated Balance Sheets.
|
27
|
(2)
|
In May 2018, the Company issued and sold
$375.0 million
of
4.35 percent
first mortgage bonds due in
2048
through a public offering. The total net proceeds from the sale of the bonds were used to repay maturing long-term debt of
$276.2 million
, repay the outstanding balance under Avista Corp.'s $400.0 million committed line of credit and for other general corporate purposes. In connection with the issuance and sale of the first mortgage bonds, the Company cash-settled
fourteen
interest rate swap derivatives (notional aggregate amount of
$275.0 million
) and paid a net amount of
$25.9 million
. See Note 5 for a discussion of interest rate swap derivatives.
|
In 1997, the Company issued Floating Rate Junior Subordinated Deferrable Interest Debentures, Series B, with a principal amount of
$51.5 million
to Avista Capital II, an affiliated business trust formed by the Company. Avista Capital II issued
$50.0 million
of Preferred Trust Securities with a floating distribution rate of
LIBOR
plus
0.875 percent
, calculated and reset quarterly.
The distribution rates paid were as follows during the
six months ended June 30, 2018
and the year ended
December 31, 2017
:
|
June 30,
|
December 31,
|
||||
|
2018
|
2017
|
||||
|
Low distribution rate
|
2.36
|
%
|
1.81
|
%
|
|
|
High distribution rate
|
3.18
|
%
|
2.36
|
%
|
|
|
Distribution rate at the end of the period
|
3.18
|
%
|
2.36
|
%
|
|
Concurrent with the issuance of the Preferred Trust Securities, Avista Capital II issued
$1.5 million
of Common Trust Securities to the Company. The Preferred Trust Securities may be redeemed at the option of Avista Capital II at any time and mature on June 1, 2037. In December 2000, the Company purchased
$10.0 million
of these Preferred Trust Securities.
The Company owns
100 percent
of Avista Capital II and has solely and unconditionally guaranteed the payment of distributions on, and redemption price and liquidation amount for, the Preferred Trust Securities to the extent that Avista Capital II has funds available for such payments from the respective debt securities. Upon maturity or prior redemption of such debt securities, the Preferred Trust Securities will be mandatorily redeemed. The Company does not include these capital trusts in its consolidated financial statements as Avista Corp. is not the primary beneficiary. As such, the sole assets of the capital trusts are
$51.5 million
of junior subordinated deferrable interest debentures of Avista Corp., which are reflected on the Condensed Consolidated Balance Sheets. Interest expense to affiliated trusts in the Condensed Consolidated Statements of Income represents interest expense on these debentures.
The carrying values of cash and cash equivalents, accounts and notes receivable, accounts payable, and short-term borrowings are reasonable estimates of their fair values. Long-term debt (including current portion and material capital leases) and long-term debt to affiliated trusts are reported at carrying value on the Condensed Consolidated Balance Sheets.
The fair value hierarchy prioritizes the inputs used to measure fair value. The hierarchy gives the highest priority to unadjusted quoted prices in active markets for identical assets or liabilities (Level 1 measurement) and the lowest priority to fair values derived from unobservable inputs (Level 3 measurement).
The three levels of the fair value hierarchy are defined as follows:
Level 1 – Quoted prices are available in active markets for identical assets or liabilities. Active markets are those in which transactions for the asset or liability occur with sufficient frequency and volume to provide pricing information on an ongoing basis.
Level 2 – Pricing inputs are other than quoted prices in active markets included in Level 1, but which are either directly or indirectly observable as of the reporting date. Level 2 includes those financial instruments that are valued using models or other valuation methodologies. These models are primarily industry-standard models that consider various assumptions, including quoted forward prices for commodities, time value, volatility factors, and current market and contractual prices for the underlying instruments, as well as other relevant economic measures. Substantially all of these assumptions are observable in the marketplace throughout the full term of the instrument, can be derived from observable data or are supported by observable levels at which transactions are executed in the marketplace.
Level 3 – Pricing inputs include significant inputs that are generally unobservable from objective sources. These inputs may be used with internally developed methodologies that result in management’s best estimate of fair value.
28
Financial assets and liabilities are classified in their entirety based on the lowest level of input that is significant to the fair value measurement. The Company’s assessment of the significance of a particular input to the fair value measurement requires judgment, and may affect the valuation of fair value assets and liabilities and their placement within the fair value hierarchy levels. The determination of the fair values incorporates various factors that not only include the credit standing of the counterparties involved and the impact of credit enhancements (such as cash deposits and letters of credit), but also the impact of Avista Corp.’s nonperformance risk on its liabilities.
The following table sets forth the carrying value and estimated fair value of the Company’s financial instruments not reported at estimated fair value on the Condensed Consolidated Balance Sheets as of
June 30, 2018
and
December 31, 2017
(dollars in thousands):
|
|
June 30, 2018
|
December 31, 2017
|
|||||||||||||
|
|
Carrying
Value
|
Estimated
Fair Value
|
Carrying
Value
|
Estimated
Fair Value
|
|||||||||||
|
Long-term debt (Level 2)
|
$
|
1,053,500
|
|
$
|
1,126,643
|
|
$
|
951,000
|
|
$
|
1,067,783
|
|
|||
|
Long-term debt (Level 3)
|
767,000
|
|
748,342
|
|
767,000
|
|
810,598
|
|
|||||||
|
Snettisham capital lease obligation (Level 3)
|
58,478
|
|
57,000
|
|
59,745
|
|
61,700
|
|
|||||||
|
Long-term debt to affiliated trusts (Level 3)
|
51,547
|
|
40,207
|
|
51,547
|
|
41,882
|
|
|||||||
These estimates of fair value of long-term debt and long-term debt to affiliated trusts were primarily based on available market information, which generally consists of estimated market prices from third party brokers for debt with similar risk and terms. The price ranges obtained from the third party brokers consisted of par values of
78.00
to
119.80
, where a par value of
100.0
represents the carrying value recorded on the Condensed Consolidated Balance Sheets. Level 2 long-term debt represents publicly issued bonds with quoted market prices; however, due to their limited trading activity, they are classified as Level 2 because brokers must generate quotes and make estimates if there is no trading activity near a period end. Level 3 long-term debt consists of private placement bonds and debt to affiliated trusts, which typically have no secondary trading activity. Fair values in Level 3 are estimated based on market prices from third party brokers using secondary market quotes for debt with similar risk and terms to generate quotes for Avista Corp. bonds. Due to the unique nature of the Snettisham capital lease obligation, the estimated fair value of these items was determined based on a discounted cash flow model using available market information. The Snettisham capital lease obligation was discounted to present value using the Morgan Markets A Ex-Fin discount rate as published on
June 30, 2018
.
The following table discloses by level within the fair value hierarchy the Company’s assets and liabilities measured and reported on the Condensed Consolidated Balance Sheets as of
June 30, 2018
and
December 31, 2017
at fair value on a recurring basis (dollars in thousands):
|
Level 1
|
Level 2
|
Level 3
|
Counterparty
and Cash Collateral Netting (1) |
Total
|
|||||||||||||||
|
June 30, 2018
|
|||||||||||||||||||
|
Assets:
|
|||||||||||||||||||
|
Energy commodity derivatives
|
$
|
—
|
|
$
|
42,936
|
|
$
|
—
|
|
$
|
(42,825
|
)
|
$
|
111
|
|
||||
|
Level 3 energy commodity derivatives:
|
|||||||||||||||||||
|
Natural gas exchange agreement
|
—
|
|
—
|
|
25
|
|
(25
|
)
|
—
|
|
|||||||||
|
Foreign currency exchange derivatives
|
—
|
|
16
|
|
—
|
|
(16
|
)
|
—
|
|
|||||||||
|
Interest rate swap derivatives
|
—
|
|
12,314
|
|
—
|
|
—
|
|
12,314
|
|
|||||||||
|
Deferred compensation assets:
|
|||||||||||||||||||
|
Mutual Funds:
|
|||||||||||||||||||
|
Fixed income securities (2)
|
1,850
|
|
—
|
|
—
|
|
—
|
|
1,850
|
|
|||||||||
|
Equity securities (2)
|
6,488
|
|
—
|
|
—
|
|
—
|
|
6,488
|
|
|||||||||
|
Total
|
$
|
8,338
|
|
$
|
55,266
|
|
$
|
25
|
|
$
|
(42,866
|
)
|
$
|
20,763
|
|
||||
29
|
Level 1
|
Level 2
|
Level 3
|
Counterparty
and Cash Collateral Netting (1) |
Total
|
|||||||||||||||
|
Liabilities:
|
|||||||||||||||||||
|
Energy commodity derivatives
|
$
|
—
|
|
$
|
66,133
|
|
$
|
—
|
|
$
|
(64,606
|
)
|
$
|
1,527
|
|
||||
|
Level 3 energy commodity derivatives:
|
|||||||||||||||||||
|
Natural gas exchange agreement
|
—
|
|
—
|
|
3,505
|
|
(25
|
)
|
3,480
|
|
|||||||||
|
Power exchange agreement
|
—
|
|
—
|
|
6,345
|
|
—
|
|
6,345
|
|
|||||||||
|
Power option agreement
|
—
|
|
—
|
|
5
|
|
—
|
|
5
|
|
|||||||||
|
Foreign currency exchange derivatives
|
—
|
|
21
|
|
—
|
|
(16
|
)
|
5
|
|
|||||||||
|
Interest rate swap derivatives
|
—
|
|
5,491
|
|
—
|
|
(590
|
)
|
4,901
|
|
|||||||||
|
Total
|
$
|
—
|
|
$
|
71,645
|
|
$
|
9,855
|
|
$
|
(65,237
|
)
|
$
|
16,263
|
|
||||
|
December 31, 2017
|
|||||||||||||||||||
|
Assets:
|
|||||||||||||||||||
|
Energy commodity derivatives
|
$
|
—
|
|
$
|
43,814
|
|
$
|
—
|
|
$
|
(42,550
|
)
|
$
|
1,264
|
|
||||
|
Level 3 energy commodity derivatives:
|
|||||||||||||||||||
|
Natural gas exchange agreement
|
—
|
|
—
|
|
183
|
|
(183
|
)
|
—
|
|
|||||||||
|
Foreign currency exchange derivatives
|
—
|
|
32
|
|
—
|
|
(1
|
)
|
31
|
|
|||||||||
|
Interest rate swap derivatives
|
—
|
|
7,477
|
|
—
|
|
(2,574
|
)
|
4,903
|
|
|||||||||
|
Deferred compensation assets:
|
|||||||||||||||||||
|
Mutual Funds:
|
|||||||||||||||||||
|
Fixed income securities (2)
|
1,638
|
|
—
|
|
—
|
|
—
|
|
1,638
|
|
|||||||||
|
Equity securities (2)
|
6,631
|
|
—
|
|
—
|
|
—
|
|
6,631
|
|
|||||||||
|
Total
|
$
|
8,269
|
|
$
|
51,323
|
|
$
|
183
|
|
$
|
(45,308
|
)
|
$
|
14,467
|
|
||||
|
Liabilities:
|
|||||||||||||||||||
|
Energy commodity derivatives
|
$
|
—
|
|
$
|
71,342
|
|
$
|
—
|
|
$
|
(69,988
|
)
|
$
|
1,354
|
|
||||
|
Level 3 energy commodity derivatives:
|
|||||||||||||||||||
|
Natural gas exchange agreement
|
—
|
|
—
|
|
3,347
|
|
(183
|
)
|
3,164
|
|
|||||||||
|
Power exchange agreement
|
—
|
|
—
|
|
13,245
|
|
—
|
|
13,245
|
|
|||||||||
|
Power option agreement
|
—
|
|
—
|
|
19
|
|
—
|
|
19
|
|
|||||||||
|
Foreign currency exchange derivatives
|
—
|
|
1
|
|
—
|
|
(1
|
)
|
—
|
|
|||||||||
|
Interest rate swap derivatives
|
—
|
|
73,513
|
|
—
|
|
(37,544
|
)
|
35,969
|
|
|||||||||
|
Total
|
$
|
—
|
|
$
|
144,856
|
|
$
|
16,611
|
|
$
|
(107,716
|
)
|
$
|
53,751
|
|
||||
|
(1)
|
The Company is permitted to net derivative assets and derivative liabilities with the same counterparty when a legally enforceable master netting agreement exists. In addition, the Company nets derivative assets and derivative liabilities against any payables and receivables for cash collateral held or placed with these same counterparties.
|
|
(2)
|
These assets are trading securities and are included in other property and investments-net and other non-current assets on the Condensed Consolidated Balance Sheets.
|
The difference between the amount of derivative assets and liabilities disclosed in respective levels in the table above and the amount of derivative assets and liabilities disclosed on the Condensed Consolidated Balance Sheets is due to netting arrangements with certain counterparties. See Note 5 for additional discussion of derivative netting.
To establish fair value for energy commodity derivatives, the Company uses quoted market prices and forward price curves to estimate the fair value of energy commodity derivative instruments included in Level 2. In particular, electric derivative valuations are performed using market quotes, adjusted for periods in between quotable periods. Natural gas derivative valuations are estimated using New York Mercantile Exchange (NYMEX) pricing for similar instruments, adjusted for basin differences, using market quotes. Where observable inputs are available for substantially the full term of the contract, the derivative asset or liability is included in Level 2.
To establish fair values for interest rate swap derivatives, the Company uses forward market curves for interest rates for the term of the swaps and discounts the cash flows back to present value using an appropriate discount rate. The discount rate is
30
calculated by third party brokers according to the terms of the swap derivatives and evaluated by the Company for reasonableness, with consideration given to the potential non-performance risk by the Company. Future cash flows of the interest rate swap derivatives are equal to the fixed interest rate in the swap compared to the floating market interest rate multiplied by the notional amount for each period.
To establish fair value for foreign currency derivatives, the Company uses forward market curves for Canadian dollars against the US dollar and multiplies the difference between the locked-in price and the market price by the notional amount of the derivative. Forward foreign currency market curves are provided by third party brokers. The Company's credit spread is factored into the locked-in price of the foreign exchange contracts.
Deferred compensation assets and liabilities represent funds held by the Company in a Rabbi Trust for an executive deferral plan. These funds consist of actively traded equity and bond funds with quoted prices in active markets. The balance disclosed in the table above excludes cash and cash equivalents of
$0.4 million
as of
June 30, 2018
and
$0.2 million
as of
December 31, 2017
.
Level 3 Fair Value
Under the power exchange agreement the Company purchases power at a price that is based on the average operating and maintenance (O&M) charges from three surrogate nuclear power plants around the country. To estimate the fair value of this agreement, the Company estimates the difference between the purchase price based on the future O&M charges and forward prices for energy. The Company compares the Level 2 brokered quotes and forward price curves described above to an internally developed forward price which is based on the average O&M charges from the three surrogate nuclear power plants for the current year. The Company estimates the volumes of the transactions that will take place in the future based on historical average transaction volumes per delivery year (November to April). Significant increases or decreases in any of these inputs in isolation would result in a significantly higher or lower fair value measurement.
For the power commodity option agreement, which expires in June 2019, the Company uses the Black-Scholes-Merton valuation model to estimate the fair value, and this model includes significant inputs not observable or corroborated in the market. These inputs include: 1) the strike price (which is an internally derived price based on a combination of generation plant heat rate factors, natural gas market pricing, delivery and other O&M charges) and 2) estimated delivery volumes. Significant increases or decreases in these inputs in isolation would result in a significantly higher or lower fair value measurement. Generally, changes in overall commodity market prices are accompanied by directionally similar changes in the strike price assumptions used in the calculation.
For the natural gas commodity exchange agreement, the Company uses the same Level 2 brokered quotes described above; however, the Company also estimates the purchase and sales volumes (within contractual limits) as well as the timing of those transactions. Changing the timing of volume estimates changes the timing of purchases and sales, impacting which brokered quote is used. Because the brokered quotes can vary significantly from period to period, the unobservable estimates of the timing and volume of transactions can have a significant impact on the calculated fair value. The Company currently estimates volumes and timing of transactions based on a most likely scenario using historical data. Historically, the timing and volume of transactions have not been highly correlated with market prices and market volatility.
The following table presents the quantitative information which was used to estimate the fair values of the Level 3 assets and liabilities above as of
June 30, 2018
(dollars in thousands):
|
Fair Value (Net) at
|
||||||||||
|
June 30, 2018
|
Valuation Technique
|
Unobservable
Input
|
Range
|
|||||||
|
Power exchange agreement
|
$
|
(6,345
|
)
|
Surrogate facility
pricing
|
O&M charges
|
$40.05-$52.59/MWh (1)
|
||||
|
Transaction volumes
|
292,145 MWhs
|
|||||||||
|
Power option agreement
|
$
|
(5
|
)
|
Black-Scholes-
Merton
|
Strike price
|
$36.20/MWh - 2019
|
||||
|
$41.55/MWh - 2019
|
||||||||||
|
Delivery volumes
|
94,221 - 96,907 MWhs
|
|||||||||
|
Natural gas exchange
agreement
|
$
|
(3,480
|
)
|
Internally derived
weighted average cost of gas |
Forward purchase
prices
|
$1.28 - $1.67/mmBTU
|
||||
|
Forward sales prices
|
$1.34 - $3.01/mmBTU
|
|||||||||
|
Purchase volumes
|
115,000 - 310,000 mmBTUs
|
|||||||||
|
Sales volumes
|
60,000 - 310,000 mmBTUs
|
|||||||||
31
(1) The average O&M charges for the delivery year beginning in November 2018 are
$45.61
per MWh.
The valuation methods, significant inputs and resulting fair values described above were developed by the Company's management and are reviewed on at least a quarterly basis to ensure they provide a reasonable estimate of fair value each reporting period.
The following table presents activity for energy commodity derivative assets (liabilities) measured at fair value using significant unobservable inputs (Level 3) for the three and
six months ended June 30
(dollars in thousands):
|
|
Natural Gas Exchange Agreement
|
Power Exchange Agreement
|
Power Option Agreement
|
Total
|
|||||||||||
|
Three months ended June 30, 2018:
|
|||||||||||||||
|
Balance as of April 1, 2018
|
$
|
(2,805
|
)
|
$
|
(10,163
|
)
|
$
|
(5
|
)
|
$
|
(12,973
|
)
|
|||
|
Total gains or (losses):
|
|||||||||||||||
|
Included in regulatory assets/liabilities (1)
|
(768
|
)
|
2,597
|
|
—
|
|
1,829
|
|
|||||||
|
Settlements
|
93
|
|
1,221
|
|
—
|
|
1,314
|
|
|||||||
|
Ending balance as of June 30, 2018 (2)
|
$
|
(3,480
|
)
|
$
|
(6,345
|
)
|
$
|
(5
|
)
|
$
|
(9,830
|
)
|
|||
|
Three months ended June 30, 2017:
|
|||||||||||||||
|
Balance as of April 1, 2017
|
$
|
(4,278
|
)
|
$
|
(14,419
|
)
|
$
|
(266
|
)
|
$
|
(18,963
|
)
|
|||
|
Total gains or (losses):
|
|||||||||||||||
|
Included in regulatory assets/liabilities (1)
|
(195
|
)
|
(672
|
)
|
223
|
|
(644
|
)
|
|||||||
|
Settlements
|
300
|
|
1,307
|
|
—
|
|
1,607
|
|
|||||||
|
Ending balance as of June 30, 2017 (2)
|
$
|
(4,173
|
)
|
$
|
(13,784
|
)
|
$
|
(43
|
)
|
$
|
(18,000
|
)
|
|||
|
Six months ended June 30, 2018:
|
|||||||||||||||
|
Balance as of January 1, 2018
|
$
|
(3,164
|
)
|
$
|
(13,245
|
)
|
$
|
(19
|
)
|
$
|
(16,428
|
)
|
|||
|
Total gains or (losses) (realized/unrealized):
|
|||||||||||||||
|
Included in regulatory assets/liabilities (1)
|
(565
|
)
|
720
|
|
14
|
|
169
|
|
|||||||
|
Settlements
|
249
|
|
6,180
|
|
—
|
|
6,429
|
|
|||||||
|
Ending balance as of June 30, 2018 (2)
|
$
|
(3,480
|
)
|
$
|
(6,345
|
)
|
$
|
(5
|
)
|
$
|
(9,830
|
)
|
|||
|
Six months ended June 30, 2017:
|
|||||||||||||||
|
Balance as of January 1, 2017
|
$
|
(5,885
|
)
|
$
|
(13,449
|
)
|
$
|
(76
|
)
|
$
|
(19,410
|
)
|
|||
|
Total gains or (losses) (realized/unrealized):
|
|||||||||||||||
|
Included in regulatory assets/liabilities (1)
|
1,817
|
|
(5,165
|
)
|
33
|
|
(3,315
|
)
|
|||||||
|
Settlements
|
(105
|
)
|
4,830
|
|
—
|
|
4,725
|
|
|||||||
|
Ending balance as of June 30, 2017 (2)
|
$
|
(4,173
|
)
|
$
|
(13,784
|
)
|
$
|
(43
|
)
|
$
|
(18,000
|
)
|
|||
|
(1)
|
All gains and losses are included in other regulatory assets and liabilities. There were no gains and losses included in either net income or other comprehensive income during any of the periods presented in the table above.
|
|
(2)
|
There were no purchases, issuances or transfers from other categories of any derivatives instruments during the periods presented in the table above.
|
The Company has entered into four separate sales agency agreements under which the sales agents may offer and sell new shares of the Company’s common stock from time to time. No shares were issued under these agreements during the
six months ended
June 30, 2018
. These agreements provide for the offering of a maximum of approximately
3.8 million
shares, of which approximately
1.1 million
remain unissued as of
June 30, 2018
. Subject to the satisfaction of customary conditions (including any required regulatory approvals), the Company has the right to increase the maximum number of shares that may be offered under these agreements.
32
The following table presents the computation of basic and diluted earnings per common share attributable to Avista Corp. shareholders for the three and
six months ended June 30
(in thousands, except per share amounts):
|
Three months ended June 30,
|
Six months ended June 30,
|
||||||||||||||
|
2018
|
2017
|
2018
|
2017
|
||||||||||||
|
Numerator:
|
|||||||||||||||
|
Net income attributable to Avista Corp. shareholders
|
$
|
25,577
|
|
$
|
21,771
|
|
$
|
80,467
|
|
$
|
83,887
|
|
|||
|
Denominator:
|
|||||||||||||||
|
Weighted-average number of common shares outstanding-basic
|
65,677
|
|
64,401
|
|
65,658
|
|
64,382
|
|
|||||||
|
Effect of dilutive securities:
|
|||||||||||||||
|
Performance and restricted stock awards
|
306
|
|
152
|
|
299
|
|
129
|
|
|||||||
|
Weighted-average number of common shares outstanding-diluted
|
65,983
|
|
64,553
|
|
65,957
|
|
64,511
|
|
|||||||
|
Earnings per common share attributable to Avista Corp. shareholders:
|
|||||||||||||||
|
Basic
|
$
|
0.39
|
|
$
|
0.34
|
|
$
|
1.23
|
|
$
|
1.30
|
|
|||
|
Diluted
|
$
|
0.39
|
|
$
|
0.34
|
|
$
|
1.22
|
|
$
|
1.30
|
|
|||
There were no shares excluded from the calculation because they were antidilutive.
In the course of its business, the Company becomes involved in various claims, controversies, disputes and other contingent matters, including the items described in this Note. Some of these claims, controversies, disputes and other contingent matters involve litigation or other contested proceedings. For all such matters, the Company intends to vigorously protect and defend its interests and pursue its rights. However, no assurance can be given as to the ultimate outcome of any particular matter because litigation and other contested proceedings are inherently subject to numerous uncertainties. For matters that affect Avista Utilities’ or AEL&P's operations, the Company intends to seek, to the extent appropriate, recovery of incurred costs through the ratemaking process.
California Refund Proceeding
In February 2016, APX, a market maker in the California Refund Proceedings in whose markets Avista Energy participated in the summer of 2000, asserted that Avista Energy and its other customer/participants may be responsible for a share of the disgorgement penalty APX may be found to owe to Pacific Gas & Electric (PG&E), Southern California Edison, San Diego Gas & Electric, the California Attorney General (AG), the California Department of Water Resources (CERS), and the California Public Utilities Commission (together, the “California Parties”). The penalty arises as a result of the FERC's finding that APX committed violations in the California market in the summer of 2000. APX is making these assertions despite Avista Energy having been dismissed in FERC Opinion No. 536 from the on-going administrative proceeding at the FERC regarding potential wrongdoing in the California markets in the summer of 2000. APX has identified Avista Energy’s share of APX’s exposure to be as much as
$16.0 million
even though no wrongdoing allegations are specifically attributable to Avista Energy. Avista Energy believes its settlement with the California Parties in 2014 insulates it from any such liability and that as a dismissed party it cannot be drawn back into the litigation. On May 3, 2018, the FERC issued an order, Order on Compliance Filings, resolving in the Company’s favor the last indirect exposure the Company had related to the California Refund Proceedings. That order, which fully absolved the Company of any further exposure, was not challenged and is now final and not subject to appeal.
Cabinet Gorge Total Dissolved Gas Abatement Plan
Dissolved atmospheric gas levels (referred to as "Total Dissolved Gas" or "TDG") in the Clark Fork River exceed state of Idaho and federal water quality numeric standards downstream of Cabinet Gorge particularly during periods when excess river flows must be diverted over the spillway. Under the terms of the Clark Fork Settlement Agreement (CFSA) as incorporated in Avista Corp.’s FERC license for the Clark Fork Project, Avista Corp. has worked in consultation with agencies, tribes and other stakeholders to address this issue. Under the terms of a gas supersaturation mitigation plan, Avista Corp. is reducing TDG by constructing spill crest modifications on spill gates at the dam. These modifications have been shown to be effective in reducing TDG downstream. TDG monitoring and analysis is ongoing. Under the terms of the mitigation plan, Avista Corp. will continue to work with stakeholders to determine the degree to which TDG abatement reduces future mitigation obligations. The
33
Company has sought, and will continue to seek recovery, through the ratemaking process, of all operating and capitalized costs related to this issue.
Legal Proceedings Related to the Pending Acquisition by Hydro One
See Note 15 for information regarding the proposed acquisition of the Company by Hydro One.
In connection with the proposed acquisition, as of the date of this quarterly report, the three lawsuits that had been filed in the United States District Court for the Eastern District of Washington have been voluntarily dismissed by the plaintiffs. Those cases were captioned as follows:
|
•
|
Jenβ v. Avista Corporation., et al.
, No. 2:17-cv-00333 (E.D. Wash.) (filed September 25, 2017);
|
|
•
|
Samuel v. Avista Corporation, et al
., No. 2:17-cv-00334 (E.D. Wash.) (filed September 26, 2017); and
|
|
•
|
Sharpenter v. Avista Corporation., et al.
, No. 2:17-cv-00336 (E.D. Wash.) (filed September 26, 2017)
|
There remains one lawsuit that has been filed in the Superior Court for the State of Washington in and for Spokane County, captioned as follows:
|
•
|
Fink v. Morris, et al.,
No. 17203616-6 (filed September 15, 2017, amended complaint filed October 25, 2017).
|
This lawsuit was filed against Hydro One Limited, Olympus Holding Corp., Olympus Corp. and Bank of America Merrill Lynch, as well as all members of the Company's Board of Directors, namely Erik Anderson, Kristianne Blake, Donald Burke, Rebecca Klein, Scott Maw, Scott Morris, Marc Racicot, Heidi Stanley, John Taylor and Janet Widmann. While Avista Corp. is not a named defendant in this lawsuit, the Company has the obligation to indemnify members of its Board of Directors.
The complaint generally alleges that the members of the Board breached their fiduciary duties by, among other things, conducting an allegedly inadequate sale process and agreeing to the acquisition at a price that allegedly undervalues Avista Corporation, and that Hydro One Limited, Olympus Holding Corp., and Olympus Corp. aided and abetted those purported breaches of duty. The aiding and abetting claims were brought only against Hydro One Limited, Olympus Holding Corp. and Olympus Corp. The complaint seeks various remedies, including monetary damages, attorneys’ fees and expenses. The complaint has been stayed by the court until the closing of the transaction at which time the plaintiff will have the option to file an amended complaint within 30 days of such closing. If the amended complaint is not filed within the 30 days the suit will be dismissed.
All defendants deny any wrongdoing in connection with the proposed acquisition and plan to vigorously defend against all pending claims; however, the Company cannot at this time predict the eventual outcome.
Other Contingencies
In the normal course of business, the Company has various other legal claims and contingent matters outstanding. The Company believes that any ultimate liability arising from these actions will not have a material impact on its financial condition, results of operations or cash flows. It is possible that a change could occur in the Company’s estimates of the probability or amount of a liability being incurred. Such a change, should it occur, could be significant. See "Note 19 of the Notes to Consolidated Financial Statements" in the 2017 Form 10-K for additional discussion regarding other contingencies.
The business segment presentation reflects the basis used by the Company's management to analyze performance and determine the allocation of resources. The Company's management evaluates performance based on income (loss) from operations before income taxes as well as net income (loss) attributable to Avista Corp. shareholders. The accounting policies of the segments are the same as those described in the summary of significant accounting policies. Avista Utilities' business is managed based on the total regulated utility operation; therefore, it is considered one segment. AEL&P is a separate reportable business segment as it has separate financial reports that are reviewed in detail by the Chief Operating Decision Maker and its operations and risks are sufficiently different from Avista Utilities and the other businesses at AERC that it cannot be aggregated with any other operating segments. The Other category, which is not a reportable segment, includes other investments and operations of various subsidiaries, as well as certain other operations of Avista Capital.
34
The following table presents information for each of the Company’s business segments (dollars in thousands):
|
Avista
Utilities
|
Alaska Electric Light and Power Company
|
Total Utility
|
Other
|
Intersegment
Eliminations
(1)
|
Total
|
||||||||||||||||||
|
For the three months ended June 30, 2018:
|
|||||||||||||||||||||||
|
Operating revenues
|
$
|
302,222
|
|
$
|
10,482
|
|
$
|
312,704
|
|
$
|
6,594
|
|
$
|
—
|
|
$
|
319,298
|
|
|||||
|
Resource costs
|
103,022
|
|
2,947
|
|
105,969
|
|
—
|
|
—
|
|
105,969
|
|
|||||||||||
|
Other operating expenses (2)
|
78,848
|
|
3,213
|
|
82,061
|
|
6,543
|
|
—
|
|
88,604
|
|
|||||||||||
|
Depreciation and amortization
|
44,186
|
|
1,465
|
|
45,651
|
|
199
|
|
—
|
|
45,850
|
|
|||||||||||
|
Income (loss) from operations
|
50,848
|
|
2,579
|
|
53,427
|
|
(148
|
)
|
—
|
|
53,279
|
|
|||||||||||
|
Interest expense (3)
|
24,428
|
|
896
|
|
25,324
|
|
382
|
|
(234
|
)
|
25,472
|
|
|||||||||||
|
Income taxes
|
4,735
|
|
446
|
|
5,181
|
|
28
|
|
—
|
|
5,209
|
|
|||||||||||
|
Net income attributable to Avista Corp. shareholders
|
24,252
|
|
1,282
|
|
25,534
|
|
43
|
|
—
|
|
25,577
|
|
|||||||||||
|
Capital expenditures (4)
|
97,963
|
|
3,352
|
|
101,315
|
|
338
|
|
—
|
|
101,653
|
|
|||||||||||
|
For the three months ended June 30, 2017:
|
|||||||||||||||||||||||
|
Operating revenues
|
$
|
296,747
|
|
$
|
11,982
|
|
$
|
308,729
|
|
$
|
5,772
|
|
$
|
—
|
|
$
|
314,501
|
|
|||||
|
Resource costs
|
99,461
|
|
3,290
|
|
102,751
|
|
—
|
|
—
|
|
102,751
|
|
|||||||||||
|
Other operating expenses (5)
|
77,121
|
|
2,995
|
|
80,116
|
|
7,086
|
|
—
|
|
87,202
|
|
|||||||||||
|
Depreciation and amortization
|
41,195
|
|
1,448
|
|
42,643
|
|
157
|
|
—
|
|
42,800
|
|
|||||||||||
|
Income (loss) from operations (5)
|
55,820
|
|
3,597
|
|
59,417
|
|
(1,471
|
)
|
—
|
|
57,946
|
|
|||||||||||
|
Interest expense (3)
|
22,826
|
|
895
|
|
23,721
|
|
176
|
|
(27
|
)
|
23,870
|
|
|||||||||||
|
Income taxes
|
12,892
|
|
1,075
|
|
13,967
|
|
(916
|
)
|
—
|
|
13,051
|
|
|||||||||||
|
Net income (loss) attributable to Avista Corp. shareholders
|
21,765
|
|
1,681
|
|
23,446
|
|
(1,675
|
)
|
—
|
|
21,771
|
|
|||||||||||
|
Capital expenditures (4)
|
88,612
|
|
2,339
|
|
90,951
|
|
134
|
|
—
|
|
91,085
|
|
|||||||||||
|
For the six months ended June 30, 2018:
|
|||||||||||||||||||||||
|
Operating revenues
|
$
|
690,976
|
|
$
|
24,145
|
|
$
|
715,121
|
|
$
|
13,538
|
|
$
|
—
|
|
$
|
728,659
|
|
|||||
|
Resource costs
|
254,687
|
|
5,900
|
|
260,587
|
|
—
|
|
—
|
|
260,587
|
|
|||||||||||
|
Other operating expenses (2)
|
153,987
|
|
6,044
|
|
160,031
|
|
13,367
|
|
—
|
|
173,398
|
|
|||||||||||
|
Depreciation and amortization
|
87,453
|
|
2,931
|
|
90,384
|
|
380
|
|
—
|
|
90,764
|
|
|||||||||||
|
Income (loss) from operations
|
138,993
|
|
8,701
|
|
147,694
|
|
(209
|
)
|
—
|
|
147,485
|
|
|||||||||||
|
Interest expense (3)
|
48,393
|
|
1,790
|
|
50,183
|
|
717
|
|
(399
|
)
|
50,501
|
|
|||||||||||
|
Income taxes
|
15,152
|
|
1,910
|
|
17,062
|
|
(1,143
|
)
|
—
|
|
15,919
|
|
|||||||||||
|
Net income (loss) attributable to Avista Corp. shareholders
|
79,792
|
|
5,054
|
|
84,846
|
|
(4,379
|
)
|
—
|
|
80,467
|
|
|||||||||||
|
Capital expenditures (4)
|
179,139
|
|
3,993
|
|
183,132
|
|
552
|
|
—
|
|
183,684
|
|
|||||||||||
|
For the six months ended June 30, 2017:
|
|||||||||||||||||||||||
|
Operating revenues
|
$
|
712,128
|
|
$
|
27,138
|
|
$
|
739,266
|
|
$
|
11,705
|
|
$
|
—
|
|
$
|
750,971
|
|
|||||
|
Resource costs
|
262,074
|
|
6,263
|
|
268,337
|
|
—
|
|
—
|
|
268,337
|
|
|||||||||||
|
Other operating expenses
|
146,792
|
|
5,767
|
|
152,559
|
|
13,265
|
|
—
|
|
165,824
|
|
|||||||||||
|
Depreciation and amortization
|
81,733
|
|
2,895
|
|
84,628
|
|
345
|
|
—
|
|
84,973
|
|
|||||||||||
|
Income (loss) from operations
|
166,496
|
|
10,782
|
|
177,278
|
|
(1,905
|
)
|
—
|
|
175,373
|
|
|||||||||||
|
Interest expense (3)
|
45,509
|
|
1,789
|
|
47,298
|
|
343
|
|
(41
|
)
|
47,600
|
|
|||||||||||
|
Income taxes
|
43,909
|
|
3,538
|
|
47,447
|
|
(1,052
|
)
|
—
|
|
46,395
|
|
|||||||||||
|
Net income (loss) attributable to Avista Corp. shareholders
|
80,204
|
|
5,534
|
|
85,738
|
|
(1,851
|
)
|
—
|
|
83,887
|
|
|||||||||||
|
Capital expenditures (4)
|
174,015
|
|
3,699
|
|
177,714
|
|
169
|
|
—
|
|
177,883
|
|
|||||||||||
|
Total Assets:
|
|||||||||||||||||||||||
|
As of June 30, 2018:
|
$
|
5,164,670
|
|
$
|
283,540
|
|
$
|
5,448,210
|
|
$
|
80,245
|
|
$
|
(26,675
|
)
|
$
|
5,501,780
|
|
|||||
|
As of December 31, 2017:
|
$
|
5,177,878
|
|
$
|
278,688
|
|
$
|
5,456,566
|
|
$
|
73,241
|
|
$
|
(15,075
|
)
|
$
|
5,514,732
|
|
|||||
35
|
(1)
|
Intersegment eliminations reported as interest expense represent intercompany interest.
|
|
(2)
|
Other operating expenses for Avista Utilities for the three and
six months ended June 30
, 2018 include acquisition costs of
$1.0 million
and
$1.7 million
, respectively, which are separately disclosed on the Condensed Consolidated Statements of Income. The three and
six months ended June 30
, 2017 include acquisition costs of
$1.3 million
, which are also separately disclosed.
|
|
(3)
|
Including interest expense to affiliated trusts.
|
|
(4)
|
The capital expenditures for the other businesses are included in other investing activities on the Condensed Consolidated Statements of Cash Flows.
|
|
(5)
|
Effective January 1, 2018, the Company adopted ASU No. 2017-07, which resulted in a
$1.8 million
and
$3.9 million
reclassification of the non-service cost component of pension and other postretirement benefit costs for the three and
six months ended June 30
, 2017, respectively. The costs were reclassified from utility other operating expenses to other expense (income) - net on the Condensed Consolidated Statements of Income.
|
On July 19, 2017, Avista Corp. entered into a Merger Agreement, by and among Hydro One, Olympus Holding Corp., a wholly owned subsidiary of Hydro One (US parent), and Olympus Corp., a wholly owned subsidiary of US parent (Merger Sub). Subject to the terms and conditions of the Merger Agreement, Merger Sub will be merged with and into Avista Corp., with Avista Corp. surviving as an indirect, wholly-owned subsidiary of Hydro One. Hydro One, based in Toronto, is Ontario’s largest electricity transmission and distribution provider.
At the effective time of the acquisition, each share of Avista Corp. common stock issued and outstanding, other than shares of Avista Corp. common stock that are owned by Hydro One, US Parent (as defined in the Merger Agreement) or Merger Sub or any of their respective subsidiaries, will be converted automatically into the right to receive an amount in cash equal to
$53
, without interest.
Hydro One Leadership Changes
The following disclosure is based upon information provided by Hydro One. On July 11, 2018, Hydro One announced that it had entered into an agreement with the Province of Ontario (“Province”), which is Hydro One's largest shareholder (owning approximately 47 percent of the outstanding shares of common stock) for the purpose of the orderly replacement of the board of directors of Hydro One and Hydro One Inc. and the retirement of Mayo Schmidt as the chief executive officer effective July 11, 2018.
Other key highlights of the agreement with the Province include:
|
•
|
Each of the current directors of Hydro One will resign and be replaced by nominees identified as set out below.
|
|
•
|
The new board of directors will initially consist of 10 members. The Province will nominate four replacement directors and the remaining six nominees will be identified through an ad hoc nominating committee comprised of representatives from four of the five largest Hydro One shareholders other than the Province. The new board of directors will be in place by August 15, 2018, and is expected to serve until Hydro One's next annual meeting or until they otherwise cease to hold office.
|
|
•
|
The new board of directors will be responsible for appointing a new chief executive officer who will also be appointed as the eleventh member of the replacement board of directors.
|
|
•
|
Hydro One has agreed to consult with the Province in respect of future matters of executive compensation.
|
|
•
|
Paul Dobson
,
Hydro One's chief financial officer, was appointed as acting chief executive officer until such time as the replacement board of directors, once constituted, can appoint a new chief executive officer.
|
The leadership changes described above, in and of themselves, do not directly relate to or affect the obligations of any party under the Merger Agreement. See further discussion below regarding developments with respect to the regulatory proceedings to approve the transaction.
Closing Conditions, Required Approvals
Consummation of the acquisition is subject to the satisfaction or waiver, if permissible under applicable law, of specified closing conditions, including, but not limited to, (i) the approval of the acquisition by the holders of a majority of the outstanding shares of Avista Corp. Common Stock, (ii) the receipt of regulatory approvals required to consummate the acquisition, including approval from the FERC, the Committee on Foreign Investment in the United States (CFIUS), the Federal Communications Commission (FCC), the WUTC, IPUC, MPSC, OPUC, and the RCA, and (iii) meeting the requirements of the Hart-Scott-Rodino Antitrust Improvements Act of 1976 (HSR Act), as amended. Under the HSR Act and the rules and regulations promulgated thereunder, the acquisition may not be completed until notification and report forms have
36
been filed with the U.S. Department of Justice (DOJ) and the Federal Trade Commission (FTC) and the applicable waiting period has expired or been terminated.
The transaction is expected to close in the fourth quarter of 2018 subject to remaining referenced approvals and the satisfaction or waiver of other specified conditions.
The Merger Agreement may be terminated by each of the Company and US Parent under certain circumstances, including if the acquisition is not consummated by September 30, 2018 (subject to an extension of up to six months by either party, if all of the conditions to closing, other than the conditions related to obtaining required regulatory approvals, the absence of a law or injunction preventing the consummation of the acquisition and the absence of a Burdensome Condition, as defined in the Merger Agreement, in any required regulatory approval, have been satisfied).
The table below presents the approvals required for the consummation of the acquisition by Hydro One, as well as the date the Company filed an approval request and the current status of each required approval.
|
Required Approval
|
Approval Request Filing Date
|
Status
|
|||
|
Avista Corp. shareholder approval
|
October 2, 2017
|
Approved November 21, 2017, no further action
|
|||
|
FERC
|
September 14, 2017
|
Approved January 16, 2018, no further action
|
|||
|
HSR Act
|
March 6, 2018
|
Approved April 6, 2018, no further action
|
|||
|
CFIUS
|
February 9, 2018
|
Approved May 18, 2018, no further action
|
|||
|
FCC
|
April 13, 2018
|
Approved May 4, 2018
|
(a)
|
||
|
WUTC
|
September 14, 2017
|
Settlement agreement filed with WUTC
|
(b)
|
||
|
IPUC
|
September 14, 2017
|
Settlement agreement filed with IPUC
|
(c)
|
||
|
OPUC
|
September 14, 2017
|
Settlement agreement filed with OPUC
|
(d)
|
||
|
RCA
|
November 21, 2017
|
Approved June 4, 2018
|
(e)
|
||
|
MPSC
|
September 14, 2017
|
Approved July 10, 2018
|
(f)
|
||
|
(a)
|
FCC
- The transaction was approved by the FCC on May 4, 2018; however, this approval expires on November 5, 2018. If the acquisition is not completed by the expiration date, the Company must file for an extension with the FCC.
|
|
(b)
|
Washington
- On March 27, 2018, Avista Corp. and Hydro One filed an all-parties, all-issues settlement agreement with the WUTC recommending approval of the acquisition of the Company by Hydro One. This represents a full settlement that all parties, including the WUTC Staff, have agreed results in a net benefit to the Company's Washington customers. The settlement agreement is subject to WUTC approval.
|
The settlement includes financial and non-financial commitments by the Company. The settlement, if approved, would result in a rate credit of approximately
$31 million
over a 5-year period. In the settlement, Hydro One and Avista Corp. also agreed to a number of other financial commitments, including providing funding for low income participation in new renewable energy and replacing certain manufactured homes. If the settlement is approved, the Company's financial commitments in Washington would total approximately
$42 million
, including the rate credits. As a result of settlement agreements in Washington, Oregon and Idaho and final approvals in Alaska and Montana, the total financial commitment across all states, if approved, would be approximately
$78.6 million
. No costs associated with the transaction will be recovered from Avista Corp. or Hydro One customers.
The settlement agreement also provides for the use of a portion of Avista Corp.’s excess deferred federal income taxes for the purpose of accelerating the depreciation schedule for Colstrip Units 3 and 4 to reflect a remaining useful life of those units through December 31, 2027. In addition, included in the financial commitments described above is funding toward a Colstrip community transition fund which is intended to help the Colstrip community transition from coal-fired generation in the event of a future closure. The settlement does not reflect any agreement with respect to the ultimate closure of Colstrip Units 3 and 4 as that decision would be made in conjunction with the other owners of Colstrip.
In response to the developments regarding the change in the leadership and board of Hydro One, on July 20, 2018, the WUTC issued a Notice of Extension of Time for Process and Deliberation. Under state law, the WUTC extended the time allowed for it to enter an order in the proceeding by up to four months, until December 14, 2018. The Company anticipates that a new Procedural Schedule, which will call for additional pre-filed testimony and an additional hearing, will be set during the first week of August, 2018.
37
|
(c)
|
Idaho
-
On April 13, 2018, Avista Corp. and Hydro One filed an all-issues settlement agreement with the IPUC recommending approval of the acquisition of the Company by Hydro One. The settlement agreement is subject to IPUC approval.
|
The settlement agreement reflects similar financial and non-financial commitments that align in value with those agreed to in Washington. The Idaho portion of the shareholder-funded rate credits is approximately
$16 million
over a 5-year period. The total amount of financial commitments for Idaho, including the rate credit, is approximately
$21 million
.
The settlement agreement in Idaho does not address Colstrip in the same manner as Washington; rather the parties to the settlement agreement have recommended that Colstrip be addressed in a separate filing requesting revised depreciation rates. The Company will be proposing that a portion of the benefits from the TCJA be set aside for the purpose of accelerating the depreciation schedule for Colstrip Units 3 and 4 to reflect a remaining useful life of those units through December 31, 2027.
In response to the developments regarding the change in the leadership and board of Hydro One, on July 20, 2018, the IPUC issued an Order that vacated the July 23, 2018 Technical Hearing, but stated that it will postpone the technical hearing until a new chief executive officer and board are in place at Hydro One. Any future hearing will be conducted through pre-filed testimony, with those deadlines determined in a later order.
|
(d)
|
Oregon
- On May 25, 2018, Avista Corp. and Hydro One filed an all-parties, all-issues settlement agreement with the OPUC related to the Oregon merger proceeding. The settlement agreement is subject to review and approval by the OPUC. The settlement agreement in Oregon includes financial and non-financial commitments. Under the settlement agreement, customers in Oregon would receive benefits in the form of a rate credit of approximately
$8 million
over a 5-year period, along with additional safeguards to assure the continued financial well-being of Avista Corp. The total amount of financial commitments for Oregon, including the rate credit, is approximately
$10 million
.
|
Also, as part of the commitments included in the Oregon settlement agreement, Avista Corp. has agreed that the base rates established on November 1, 2017 as part of its latest Oregon natural gas general rate case will remain in effect until at least January 1, 2020.
In response to the developments regarding the change in the leadership and board of Hydro One, on July 25, 2018, the OPUC held a Prehearing Conference and adopted a new Procedural Schedule which calls for additional pre-filed testimony, with a placeholder for a potential hearing, should the OPUC request it. The parties, including Hydro One and Avista Corp., requested a December 14, 2018 target date for the final order and the OPUC adopted this target date.
|
(e)
|
Alaska
-
On June 4, 2018, Avista Corp. and Hydro One received approval from the RCA on the proposed merger with financial and non-financial commitments. The commitments included among other items, that AEL&P's capital structure is maintained at its previously ordered 46 percent debt and 54 percent equity levels and that the parties adhere to all commitments filed with the RCA on April 3, 2018, which included enhanced community giving and provides a
$1 million
rate credit over five years for AEL&P’s customers. This rate credit period would begin at the close of the transaction.
|
|
(f)
|
Montana
- On July 10, 2018, Avista Corp. and Hydro One received approval from the MPSC on the proposed merger, with conditions. The MPSC did not accept, for ratemaking purposes in Montana, an accelerated 2027 depreciation schedule for Colstrip, as otherwise agreed to by the parties in Washington. On May 10, 2018, Avista and Hydro One signed a Memorandum of Agreement with the City of Colstrip, whereby Avista and Hydro One agreed that upon the completion of the transaction,
$4.5 million
of funding would be made available to assist the community of Colstrip in meeting its immediate and future needs.
|
Avista Corp. and Hydro One intend to continue to work with the various commissions, their staff and other parties to try and satisfy any concerns associated with the proposed transaction.
Other Information Related to the Acquisition
The Merger Agreement also contains customary representations, warranties and covenants of Avista Corp., Hydro One, US Parent and Merger Sub. These covenants include, among others, an obligation on behalf of Avista Corp. to operate its business in the ordinary course until the acquisition is consummated, subject to certain exceptions. In addition, the parties are required to use reasonable best efforts to obtain any required regulatory approvals.
Avista Corp. has made certain additional customary covenants, including, among others, and subject to certain exceptions, a customary non-solicitation covenant prohibiting Avista Corp. from soliciting, providing non-public information or entering into discussions or negotiations concerning proposals relating to alternative business combination transactions, except as and to the extent permitted under the Merger Agreement with respect to an unsolicited written Takeover Proposal (as defined in the Merger Agreement) made prior to the approval of the acquisition by Avista Corp.'s shareholders if, among other things, Avista
38
Corp.'s board of directors determines in good faith that such Takeover Proposal is or could be reasonably expected to lead to a Superior Proposal (as defined in the Merger Agreement) and that failure to take such actions would reasonably be expected to be inconsistent with its fiduciary duties under applicable law. No such Takeover Proposals have been received.
The Merger Agreement may be terminated by Avista Corp. and Hydro One by mutual consent and by either Avista Corp. or Hydro One under certain circumstances, including if the acquisition is not consummated by September 30, 2018 (subject to an extension of up to six months by either party if all of the conditions to closing, other than the conditions related to obtaining required regulatory approvals, the absence of a law or injunction preventing the consummation of the acquisition and the absence of a Burdensome Condition (as defined in the Merger Agreement) in any required regulatory approval, have been satisfied). The Merger Agreement also provides for certain additional termination rights for each of Avista Corp. and Hydro One. Upon termination of the Merger Agreement under certain specified circumstances, including (i) termination by Avista Corp. in order to enter into a definitive agreement with respect to a Superior Proposal, or (ii) termination by Hydro One following a withdrawal by Avista Corp.'s board or directors of its recommendation of the Merger Agreement, Avista Corp. will be required to pay Hydro One the Company Termination Fee of
$103.0 million
. Avista Corp. will also be required to pay Hydro One the Company Termination Fee in the event Avista Corp. signs or consummates any specified alternative transaction within twelve months following the termination of the Merger Agreement under certain circumstances. In addition, if the Merger Agreement is terminated under certain circumstances due to the failure to obtain required regulatory approvals, the imposition of a Burdensome Condition with respect to a required regulatory approval, or the breach by Hydro One, US Parent or Merger Sub of their obligations in respect to obtaining regulatory approvals, Hydro One will be required to pay Avista Corp. a termination fee of
$103.0 million
.
The Company is incurring significant acquisition costs associated with the pending Hydro One acquisition consisting primarily of consulting, banking fees, legal fees and employee time, and are not being passed through to customers. In addition, a significant portion of these costs are not deductible for income tax purposes.
See Note 13 for discussion of shareholder lawsuits filed against the Company, the Company’s directors, Hydro One, Olympus Holding Corp., and Olympus Corp. in relation to the Merger Agreement and the proposed acquisition.
39
REPORT OF INDEPENDENT REGISTERED PUBLIC ACCOUNTING FIRM
To the Shareholders and Board of Directors of
Avista Corporation
Spokane, Washington
Results of Review of Interim Financial Information
We have reviewed the accompanying condensed consolidated balance sheet of Avista Corporation and subsidiaries (the "Company") as of June 30, 2018, the related condensed consolidated statements of income and comprehensive income for the three-month and six-month periods ended June 30, 2018 and 2017, the related condensed consolidated statements of equity and cash flows for the six-month periods ended June 30, 2018 and 2017, and the related notes (collectively referred to as the "interim financial information"). Based on our reviews, we are not aware of any material modifications that should be made to the accompanying interim financial information for it to be in conformity with accounting principles generally accepted in the United States of America.
We have previously audited, in accordance with the standards of the Public Company Accounting Oversight Board (United States) (PCAOB), the consolidated balance sheet of the Company as of December 31, 2017, and the related consolidated statements of income, comprehensive income, equity, and cash flows for the year then ended (not presented herein); and in our report dated February 20, 2018, we expressed an unqualified opinion on those consolidated financial statements. In our opinion, the information set forth in the accompanying condensed consolidated balance sheet as of December 31, 2017, is fairly stated, in all material respects, in relation to the consolidated balance sheet from which it has been derived.
Basis for Review Results
This interim financial information is the responsibility of the Company's management. We are a public accounting firm registered with the PCAOB and are required to be independent with respect to the Company in accordance with the U.S. federal securities laws and the applicable rules and regulations of the Securities and Exchange Commission and the PCAOB.
We conducted our reviews in accordance with standards of the PCAOB. A review of interim financial information consists principally of applying analytical procedures and making inquiries of persons responsible for financial and accounting matters. It is substantially less in scope than an audit conducted in accordance with the standards of the PCAOB, the objective of which is the expression of an opinion regarding the financial statements taken as a whole. Accordingly, we do not express such an opinion.
/s/ Deloitte & Touche LLP
Seattle, Washington
July 31, 2018
40
Management’s Discussion and Analysis of Financial Condition and Results of Operations has been prepared in accordance with GAAP for interim financial information and with the instructions to Form 10-Q. The interim Management’s Discussion and Analysis of Financial Condition and Results of Operations does not contain the full detail or analysis which would be included in a full fiscal year Form 10-K; therefore, it should be read in conjunction with the Company's
2017
Form 10-K.
Business Segments
Our business segments have not changed during the
six months ended June 30, 2018
. See the
2017
Form 10-K as well as “Note 14 of the Notes to Condensed Consolidated Financial Statements” for further information regarding our business segments.
The following table presents net income (loss) attributable to Avista Corp. shareholders for each of our business segments (and the other businesses) for the three and
six months ended June 30
(dollars in thousands):
|
Three months ended June 30,
|
Six months ended June 30,
|
||||||||||||||
|
2018
|
2017
|
2018
|
2017
|
||||||||||||
|
Avista Utilities
|
$
|
24,252
|
|
$
|
21,765
|
|
$
|
79,792
|
|
$
|
80,204
|
|
|||
|
AEL&P
|
1,282
|
|
1,681
|
|
5,054
|
|
5,534
|
|
|||||||
|
Other
|
43
|
|
(1,675
|
)
|
(4,379
|
)
|
(1,851
|
)
|
|||||||
|
Net income attributable to Avista Corp. shareholders
|
$
|
25,577
|
|
$
|
21,771
|
|
$
|
80,467
|
|
$
|
83,887
|
|
|||
Executive Level Summary
Overall Results
Net income attributable to Avista Corp. shareholders was
$25.6 million
for the
three months ended June 30, 2018
, an increase from
$21.8 million
for the
three months ended June 30, 2017
. Net income attributable to Avista Corp. shareholders was
$80.5 million
for the
six months ended June 30, 2018
, a decrease from
$83.9 million
for the
six months ended June 30, 2017
.
The increase in earnings for the
second quarter
of 2018 was due to an increase in earnings at Avista Utilities and our other businesses, partially offset by a slight decrease in earnings at AEL&P. The decrease in earnings for the year-to-date was due to a decrease in earnings at all business segments.
Avista Utilities' earnings increased for the
second quarter
of
2018
but decreased for the year-to-date. Gross margin (operating revenues less resource costs) for the second quarter and the year-to-date 2018 reflects the positive impact of general rate increases and customer growth, but also reflects the negative impact of income tax related refunds (which reduced gross margin, but had no impact on net income due to a corresponding reduction in income tax expense). The fluctuations in gross margin were partially offset in the second quarter, and fully offset for the year-to-date, by an increase in transmission and distribution operating costs, compensation costs, depreciation and amortization, and interest expense.
AEL&P earnings decreased for the
second quarter
of
2018
and the year-to-date primarily due to an increase in other operating expenses as compared to the same periods in the prior year, as well as a slight decrease in volumes related to commercial customers.
The increase in losses at our other businesses for the year-to-date was related to increased expenses at one of our subsidiaries associated with the insolvency of the general contractor on a renovation project. The general contractor's insolvency resulted in the recording of a liability to various subcontractors in the first quarter of 2018. In addition, we recognized an impairment loss on one equity investment and we recognized our portion of net losses from our other equity investments. There was not any significant activity at the other businesses during the second quarter of 2018; however, during the
second quarter
of
2017
, we had increased compliance costs at one of our subsidiaries that did not reoccur during 2018, which contributed to an increase in earnings in the second quarter of 2018 as compared to the second quarter of 2017.
More detailed explanations of the fluctuations are provided in the results of operations and business segment discussions (Avista Utilities, AEL&P, and the other businesses) that follow this section.
Pending Acquisition by Hydro One
On July 19, 2017, Avista Corp. entered into a Merger Agreement that provides for Avista Corp. to become an indirect, wholly-owned subsidiary of Hydro One. Subject to the satisfaction or waiver of specified closing conditions, including approval by regulatory agencies, the transaction is expected to close during the second half of 2018. At the effective time of the acquisition, each share of Avista Corp. common stock issued and outstanding other than shares of Avista Corp. common stock that are owned by Hydro One, Olympus Holding Corp., a wholly owned subsidiary of Hydro One (US parent), and Olympus Corp., a wholly owned subsidiary of US parent (Merger Sub) or any of their respective subsidiaries, will be converted automatically into
41
the right to receive an amount in cash equal to $53, without interest. For further information, see Note 15 of the "Notes to Condensed Consolidated Financial Statements” as well as "Regulatory Matters."
Federal Income Tax Law Changes
On December 22, 2017, the TCJA was signed into law, with most provisions of the new law effective on January 1, 2018. As a result of the TCJA and its reduction of the corporate income tax rate from 35 percent to 21 percent (among many other changes in the law), we recorded a regulatory liability associated with the revaluing of our deferred income tax assets and liabilities to the new corporate tax rate. The total net amount of the regulatory liability associated with the TCJA is
$437.2 million
as of
June 30, 2018
, compared to
$442.3 million
as of December 31, 2017, which reflects the amounts to be refunded to customers through the regulatory process. We expect the Avista Utilities plant related amounts will be returned to customers over a period of approximately 36 years using the ARAM. We expect the AEL&P plant related amounts to be returned to customers over a period of approximately 40 years using the Reverse South Georgia Method. The regulatory liability attributable to non-plant excess deferred taxes of approximately
$17.6 million
(among all jurisdictions) will be returned to customers as prescribed by the Washington and Idaho regulatory orders discussed below, whereas the return of Oregon’s share of this balance, as well as all other Oregon tax benefits, are yet to be determined.
Because most of the provisions of the TCJA were effective as of January 1, 2018 but customers' rates included a 35 percent corporate tax rate built in from prior general rate cases, we began accruing for a refund to customers for the change in federal income tax expense beginning January 1, 2018 forward. For Washington and Idaho, this accrual was recorded until all benefits prior to a permanent rate change were properly captured through the deferral process. Refunds have begun, as discussed below, to Washington and Idaho customers through tariffs or other regulatory mechanisms or proceedings. For Oregon, we will continue to defer these benefits until reflected in a future regulatory proceeding as approved by the OPUC. As of
June 30, 2018
, we have recorded a customer refund liability of
$19.5 million
(among all jurisdictions) associated with the difference between the actual corporate tax rate and the corporate tax rate built into customer rates.
For Washington, effective May 1, 2018, the WUTC approved base rates reflecting a permanent reduction of $26.9 million for electric and $5.5 million for natural gas, as a result of the federal income tax rate change from 35 percent to 21 percent, and the amortization of the regulatory liability for plant excess deferred income taxes that was recorded as of December 31, 2017. The WUTC also ordered, effective June 1, 2018, one-year temporary reductions of $7.9 million for electric and $3.2 million for natural gas, passed back to customers through temporary tariff schedules. These reductions reflect the return of tax benefits associated with the non-plant excess deferred income taxes and the customer refund liability that was established in 2018 related to the change in federal income tax expense for the period January 1, 2018 to April 30, 2018.
In addition, the WUTC agreed to set aside $10.4 million of electric tax benefits to offset costs associated with accelerating the depreciation of Colstrip Units 3 and 4, to reflect a remaining useful life of those units through December 31, 2027 (per Avista/Hydro One merger agreement settlement in principle). The tax benefits being utilized are related to non-plant excess deferred income taxes. Although the parties have agreed to the acceleration of depreciation of Colstrip Units 3 and 4, the settlement in principle does not reflect any agreement with respect to the ultimate closure of Colstrip Units 3 and 4, since that decision would have to be made in conjunction with the other owners of Colstrip.
For Idaho, on May 31, 2018, the IPUC approved the all-party settlement agreement related to the income tax benefits associated with the TCJA filed by the parties on April 30, 2018. Effective June 1, 2018, through separate tariff schedules, until such time as these changes can be reflected in base rates within the next general rate case, current customer rates were reduced to reflect the reduction of the federal income tax rate to 21 percent, and the amortization of the regulatory liability for plant excess deferred income taxes. This permanent reduction reduces annual electric rates by $13.7 million (or 5.3 percent reduction to base rates) and natural gas rates by $2.6 million (or 6.1 percent reduction to base rates).
In addition to the above amounts, the IPUC also set aside approximately $12.0 million of electric tax benefits to offset costs associated with accelerating the depreciation of Colstrip Units 3 and 4, to reflect a remaining useful life of those units through December 31, 2027 (per Avista/Hydro One merger settlement in principle), or for other purposes. That issue is pending in the Company’s current depreciation case. The tax benefits being utilized are related to non-plant excess deferred income taxes, and the customer refund liability that was established in 2018 related to the change in federal income tax expense for the period January 1, 2018 to May 31, 2018. There are also $0.5 million in tax benefits attributable to natural gas, which will be included in the PGA filing effective November 1, 2018. These tax benefits include the natural gas amounts associated with non-plant excess deferred income taxes, and the customer refund liability deferred for the period January 1, 2018 to May 31, 2018.
For AEL&P, the RCA approved the proposed settlement agreement between AEL&P and the Attorney General filed on June 15, 2018 (Order 3). Per Order 3, effective August 1, 2018, AEL&P will reduce firm customer base rates by an overall 6.7 percent (approximately $2.4 million annually), to reflect income tax expense reductions associated with the TCJA. The RCA also approved AEL&P's proposal to refund to customers a one-time credit amount equal to the 6.7 percent rate reduction for bills
42
rendered between January 1 and July 31, 2018. AEL&P committed to completing all one-time credit refunds by August 30, 2018. The impact of the TCJA on AEL&P’s deferred income taxes will be addressed in AEL&P’s next general rate case, due to be filed by August 30, 2021.
See the 2017 Form 10-K for a detailed discussion of the TCJA, including the impact to us and any risks that may be associated with the new law.
Regulatory Matters
General Rate Cases
We regularly review the need for electric and natural gas rate changes in each state in which we provide service. We expect to continue to file for rate adjustments to:
|
•
|
seek recovery of operating costs and capital investments, and
|
|
•
|
seek the opportunity to earn reasonable returns as allowed by regulators.
|
With regards to the timing and plans for future filings, the assessment of our need for rate relief and the development of rate case plans takes into consideration short-term and long-term needs, as well as specific factors that can affect the timing of rate filings. Such factors include, but are not limited to, in-service dates of major capital investments and the timing of changes in major revenue and expense items.
Avista Utilities
Washington General Rate Cases
2015 General Rate Cases
In January 2016, we received an order (Order 05) that concluded our electric and natural gas general rate cases that were originally filed with the WUTC in February 2015. New electric and natural gas rates were effective on January 11, 2016.
The WUTC-approved rates were designed to provide a 1.6 percent, or $8.1 million decrease in electric base revenue, and a 7.4 percent, or $10.8 million increase in natural gas base revenue. The WUTC also approved a rate of return (ROR) on rate base of 7.29 percent, with a common equity ratio of 48.5 percent and a 9.5 percent return on equity (ROE).
WUTC Order Denying Industrial Customers of Northwest Utilities / Public Counsel Joint Motion for Clarification, WUTC Staff Motion to Reconsider and WUTC Staff Motion to Reopen Record
In January 2016, the Industrial Customers of Northwest Utilities (ICNU), the Public Counsel Unit of the Washington State Office of the Attorney General (PC) and the WUTC Staff, which is a separate party in the general rate case proceedings from the WUTC Advisory Staff, filed Motions for Clarification requesting the WUTC to clarify their attrition adjustment and the end result electric revenue decrease of $8.1 million. The Motions for Clarification suggested that the electric revenue decrease should have been significantly larger.
In February 2016, the WUTC issued an order (Order 06) denying the Motions summarized above and affirming Order 05, including an $8.1 million decrease in electric base revenue.
PC Petition for Judicial Review
In March 2016, PC filed in Thurston County Superior Court a Petition for Judicial Review of the WUTC's Order 05 and Order 06 described above that concluded our 2015 electric and natural gas general rate cases.
PC is requesting that the Court (1) vacate or set aside portions of the WUTC’s orders; (2) identify the errors contained in the WUTC’s orders; (3) find that the rates approved in Order 05 and reaffirmed in Order 06 are unlawful and not fair, just and reasonable; (4) remand the matter to the WUTC for further proceedings consistent with these rulings, including a determination of our revenue requirement for electric and natural gas services; and (5) find the customers are entitled to a refund. A decision from the Court is expected sometime in 2018.
The new rates established by Order 05 will continue in effect while the Petition for Judicial Review is being considered. We believe the WUTC's Order 05 and Order 06 finalizing the electric and natural gas general rate cases provide a reasonable end result for all parties. If the outcome of the judicial review were to result in an electric rate reduction greater than the decrease ordered by the WUTC, it may result in a refund liability to customers of up to $9.5 million, which is net of an approximately $2.5 million refund for Washington electric customers related to the 2016 provision for earnings sharing that we have already accrued. The potential refund liability amount is limited to 2016 revenues and
43
would not impact 2017 revenues collected from customers. See the 2017 Form 10-K for additional information on these proceedings.
2016 General Rate Cases
In December 2016, the WUTC issued an order related to our Washington electric and natural gas general rate cases that were originally filed with the WUTC in February 2016. The WUTC order denied the Company's proposed electric and natural gas rate increase requests of $38.6 million and $4.4 million, respectively. Accordingly, our electric and natural gas retail rates remained unchanged in Washington State following the order.
The primary reason given by the WUTC in reaching its conclusion was that, in our request, we did not follow an “appropriate methodology” to show the existence of attrition, as between historical data and current and projected data. In support of its decision, the WUTC stated that we did not demonstrate that our current revenue was insufficient for covering costs and providing the opportunity to earn a reasonable return during the 2017 rate period. The WUTC also stated that we did not demonstrate that our capital expenditures and increased operating costs are both necessary and immediate.
We did not appeal the WUTC's decision to the courts and instead focused on new general rate cases.
2017 General Rate Cases
On April 26, 2018, the WUTC issued a final order in our electric and natural gas general rate cases that were originally filed on May 26, 2017. In the order, the WUTC approved new electric rates, effective on May 1, 2018, that increased base rates by 2.2 percent (designed to increase electric revenues by $10.8 million). The net increase in electric base rates was made up of an increase in base revenues of $23.2 million, an increase of $14.5 million in power supply costs and a decrease of $26.9 million for the impacts from the TCJA.
While the WUTC authorized an increase in the ERM baseline to reflect increased power supply costs, it directed the parties to examine the functionality and rationale of the Company's power cost modeling and adjust the baseline only in extraordinary circumstances if necessary to more closely match the baseline to actual conditions.
For natural gas, the WUTC approved new natural gas base rates, effective on May 1, 2018, that decreased base rates by 2.4 percent (designed to decrease natural gas revenues by $2.1 million). The net decrease in natural gas base rates was made up of an increase in base revenues of $3.4 million that was offset by a decrease of $5.5 million for the impacts from the TCJA.
In the order, the WUTC also agreed to withhold $10.4 million of the electric excess deferred federal income taxes that resulted from the TCJA for the purpose of accelerating the depreciation schedule for Colstrip Units 3 and 4 to reflect a remaining useful life of those units through December 31, 2027. This finding by the WUTC was in recognition of the settlement agreement in the Pending Acquisition of Avista by Hydro One proceeding which provides for the use of a portion of Avista Corp.’s excess deferred federal income taxes for the purpose of accelerating the depreciation schedule for Colstrip Units 3 and 4 to reflect a remaining useful life of those units through December 31, 2027.
The new rates are based on a ROR of 7.50 percent with a common equity ratio of 48.5 percent and a 9.5 percent ROE.
In our original filings, we requested three-year rate plans for electric and natural gas; however, in the final order the WUTC only provided for new rates effective on May 1, 2018.
In addition to the above, in filed testimony to our general rate cases, the WUTC Staff recommended the exclusion of our 2016 settlement costs of interest rate swaps from the cost of capital calculation. In the final order, the WUTC disagreed with WUTC Staff and did not disallow the settlement costs of our interest rate swaps. However, they did recommend that we make changes to our interest rate risk hedging policy to be more risk responsive. We are evaluating changes to our policy to meet the WUTC recommendations.
Idaho General Rate Cases
2017 General Rate Cases
On December 28, 2017, the IPUC approved a settlement agreement between us and other parties to our electric and natural gas general rate cases. New rates were effective on January 1, 2018 and additional rate changes will take effect on January 1, 2019.
44
The settlement agreement is a two-year rate plan and has the following electric and natural gas base rate changes each year, which are designed to result in the following increases in annual revenues (dollars in millions):
|
Electric
|
Natural Gas
|
|||||||||||||
|
Effective Date
|
Revenue
Increase |
Base
Rate Increase |
Revenue
Increase
|
Base
Rate Increase
|
||||||||||
|
January 1, 2018
|
$
|
12.9
|
|
5.2
|
%
|
$
|
1.2
|
|
2.9
|
%
|
||||
|
January 1, 2019
|
$
|
4.5
|
|
1.8
|
%
|
$
|
1.1
|
|
2.7
|
%
|
||||
The settlement agreement is based on a ROR of 7.61 percent with a common equity ratio of 50 percent and a 9.5 percent ROE.
As a part of the two-year rate plan the Company will not file a new general rate case for a new rate plan to be effective prior to January 1, 2020.
Oregon General Rate Cases
2016 General Rate Case
In September 2017, the OPUC approved a settlement agreement between us and other parties to our natural gas general rate case that was filed with the OPUC in November 2016, which resolved all issues in the case.
The OPUC approved rates designed to increase annual base revenues by 5.9 percent or $3.5 million. A rate adjustment of $2.6 million became effective October 1, 2017, and a second adjustment of $0.9 million became effective on November 1, 2017 to cover specific capital projects identified in the settlement agreement, which were completed in October.
In addition, in the settlement agreement we agreed to non-recovery of certain utility plant expenditures, which resulted in a write-off of $0.8 million in the second quarter of 2017.
The settlement agreement reflects a 7.35 percent ROR with a common equity ratio of 50 percent and a 9.4 percent ROE.
In the settlement agreement that was filed with the OPUC in May 2018 associated with the proposed Hydro One transaction, as part of the commitments, Avista Corp. has agreed that the base rates established on November 1, 2017 as part of this general rate case will remain in effect until at least January 1, 2020.
Alaska Electric Light and Power Company
Alaska General Rate Case
In November 2017, the RCA approved an all-party settlement agreement related to AEL&P's electric general rate case, which was originally filed in September 2016. The settlement agreement is designed to increase base electric revenue by 3.86 percent or $1.3 million, making permanent the interim rate increase approved by the RCA in 2016.
The agreement reflects an 8.91 percent ROR with a common equity ratio of 58.18 percent and an 11.95 percent ROE.
Avista Utilities
Purchased Gas Adjustments
PGAs are designed to pass through changes in natural gas costs to Avista Utilities' customers with no change in gross margin (operating revenues less resource costs) or net income. In Oregon, we absorb (cost or benefit) 10 percent of the difference between actual and projected natural gas costs included in retail rates for supply that is not hedged. Total net deferred natural gas costs among all jurisdictions were a liability of
$31.5 million
as of
June 30, 2018
and a liability of
$37.5 million
as of
December 31, 2017
. These deferred natural gas costs balances represent amounts due to customers. Due to declining wholesale natural gas prices that have occurred since the 2017 PGAs were filed and went into effect, we filed, and the respective commissions approved, out of cycle PGAs in January 2018 to reduce customer rates and pass through expected lower costs during the winter heating months, rather than waiting until the next regular PGA cycle.
Power Cost Deferrals and Recovery Mechanisms
The ERM in Washington is an accounting method used to track certain differences between Avista Utilities' actual power supply costs, net of wholesale sales and sales of fuel, and the amount included in base retail rates for our Washington customers. See the 2017 Form 10-K for a full discussion of the mechanics of the ERM and the various sharing bands. Total net deferred power costs under the ERM were a liability of
$31.9 million
as of
June 30, 2018
, compared to a liability of
$23.7 million
as of
December 31, 2017
. These deferred power cost balances represent amounts due to customers.
45
Avista Utilities has a PCA mechanism in Idaho that allows us to modify electric rates on October 1 of each year with IPUC approval. Under the PCA mechanism, we defer 90 percent of the difference between certain actual net power supply expenses and the amount included in base retail rates for our Idaho customers. The October 1 rate adjustments recover or rebate power supply costs deferred during the preceding July-June twelve-month period. Total net power supply costs deferred under the PCA mechanism were a liability of
$11.5 million
as of
June 30, 2018
, compared to a liability of
$6.1 million
as of
December 31, 2017
. These deferred power cost balances represent amounts due to customers.
Decoupling and Earnings Sharing Mechanisms
Decoupling (also known as a FCA in Idaho) is a mechanism designed to sever the link between a utility's revenues and consumers' energy usage. In each of our jurisdictions, Avista Utilities' electric and natural gas revenues are adjusted so as to be based on the number of customers in certain customer rate classes and assumed "normal" kilowatt hour and therm sales, rather than being based on actual kilowatt hour and therm sales. The difference between revenues based on the number of customers and "normal" sales and revenues based on actual usage is deferred and either surcharged or rebated to customers beginning in the following year. Only residential and certain commercial customer classes are included in our decoupling mechanisms. During the first quarter of 2018, the FCA in Idaho was extended for a one-year term through December 31, 2019. See the 2017 Form 10-K for a discussion of the mechanisms in each jurisdiction.
Total net cumulative decoupling deferrals among all jurisdictions were regulatory assets of
$14.3 million
as of
June 30, 2018
and
$16.5 million
as of
December 31, 2017
. These decoupling assets represent amounts due from customers. Total net earnings sharing balances among all jurisdictions were regulatory liabilities of
$5.9 million
as of
June 30, 2018
and
$5.8 million
as of
December 31, 2017
. These earnings sharing liabilities represent amounts due to customers.
See "Results of Operations - Avista Utilities" for further discussion of the amounts recorded to operating revenues in 2018 and 2017 related to the decoupling and earnings sharing mechanisms.
State Regulatory Approval Requirements Related to the Pending Acquisition by Hydro One
See "Note 15 of the Notes to Condensed Consolidated Financial Statements" for discussion of the regulatory approvals related to the pending acquisition by Hydro One, as well as their current status.
Results of Operations - Overall
The following provides an overview of changes in our Condensed Consolidated Statements of Income. More detailed explanations are provided, particularly for operating revenues and operating expenses, in the business segment discussions (Avista Utilities, AEL&P, and the other businesses) that follow this section.
The balances included below for utility operations reconcile to the Condensed Consolidated Statements of Income.
Three months ended
June 30, 2018
compared to the three months ended
June 30, 2017
The following graph shows the total change in net income attributable to Avista Corp. shareholders for the
second quarter
of
2017
to the
second quarter
of
2018
, as well as the various factors that caused such change (dollars in millions):
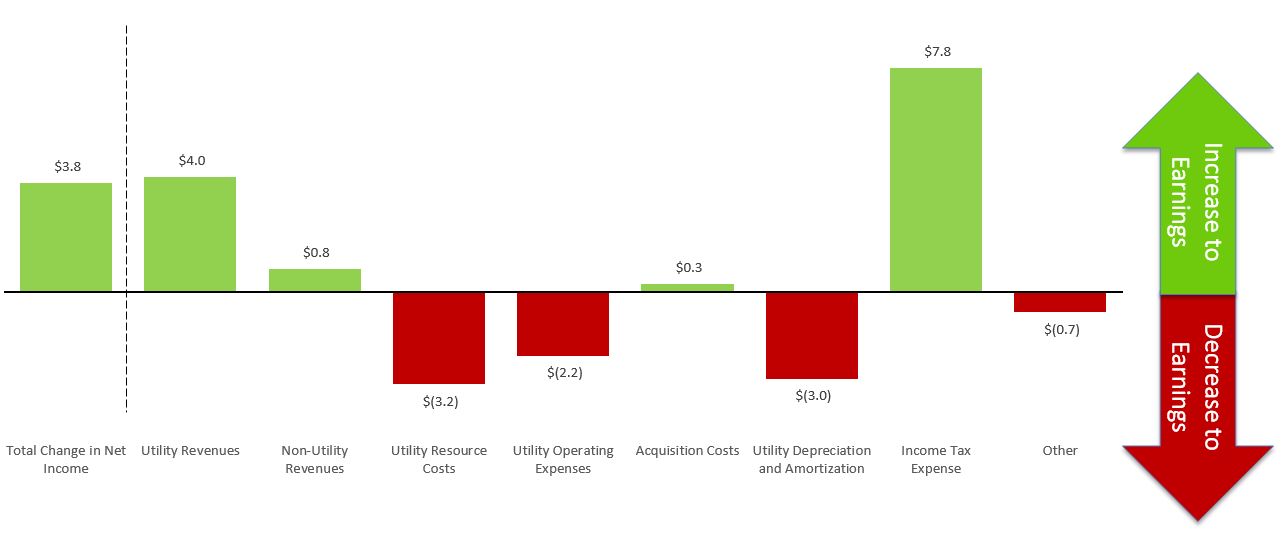
46
Utility revenues increased at Avista Utilities and decreased at AEL&P. Avista Utilities' revenues increased due to general rate increases in Washington, Idaho and Oregon, customer growth and an increase in wholesale electric revenues (due to an increase in sales volumes). This was partially offset by an accrual for refunds to customers related to federal income tax law changes that lowered the corporate tax rate from 35 percent to 21 percent. As our customers' rates had the 35 percent corporate tax rate built in from prior general rate cases through May 1, 2018 in Washington and June 1, 2018 in Idaho, we deferred the impact of the change beginning January 1, 2018. Effective May 1, 2018 in Washington and June 1, 2018 in Idaho, base rates reflect the lower 21 percent corporate tax. Base rates in Oregon continue to have the 35 percent corporate tax rate built in and we are deferring the impact. There is no impact to our net income as there was a corresponding decrease in income tax expense. AEL&P's revenues decreased due to an accrual for tax refunds to customers and a slight decrease in volumes sold to commercial customers.
Utility resource costs increased at Avista Utilities and decreased at AEL&P. The increase at Avista Utilities was primarily due to an increase in power purchased (due to an increase in the volumes purchased, partially offset by lower prices), an increase in fuel for generation and an increase in regulatory amortizations. These were partially offset by a decrease in natural gas purchased (due to a decrease in prices, partially offset by an increase in volumes).
The increase in utility other operating expenses was due to an increase at Avista Utilities and AEL&P. The increase at Avista Utilities was the result of an increase in transmission and distribution operating costs, and compensation costs, partially offset by a decrease in pension and other postretirement benefit costs.
The acquisition costs are related to the pending Hydro One acquisition and consist primarily of employee time incurred during the
second quarter
of
2018
and are not being passed through to customers.
Utility depreciation and amortization increased due to additions to utility plant.
Income taxes decreased due to federal income tax law changes, which reduced the corporate tax rate from 35 percent to 21 percent. Our effective tax rate was
16.9 percent
for the
second quarter
of
2018
compared to
37.5 percent
for the
second quarter
of
2017
. In addition to the enacted tax rate decrease, the amortization of plant excess deferred income taxes under the ARAM decreased our effective tax rate by 6.4 percent in the second quarter of 2018.
Other was primarily related to an increase in interest expense, due to additional debt being outstanding during 2018 as compared to 2017.
Six months ended
June 30, 2018
compared to the
six months ended
June 30, 2017
The following graph shows the total change in net income attributable to Avista Corp. shareholders for the
six months ended
June 30, 2017
to the
six months ended
June 30, 2018
, as well as the various factors that caused such change (dollars in millions):
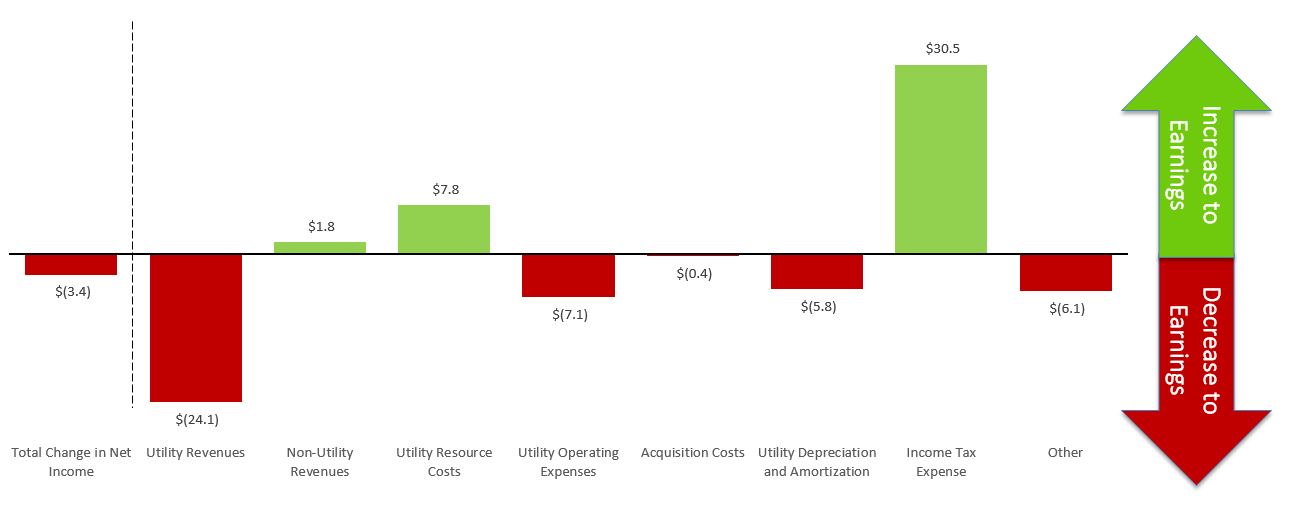
Utility revenues decreased due to decreases at both Avista Utilities and AEL&P. Avista Utilities' revenues decreased primarily due to an accrual for refunds to customers and decreases to retail rates related to federal income tax law changes. This was partially offset by an increase in revenue due to general rate increases in Washington, Idaho and Oregon, customer growth and an increase in wholesale electric revenues (due to an increase in sales volumes). AEL&P's revenues decreased due to an accrual for refunds to customers related to federal income tax law changes and a slight decrease in volumes sold to commercial customers.
47
Utility resource costs decreased at both Avista Utilities and AEL&P. The decrease at Avista Utilities was primarily due to a decrease in natural gas purchased (due to a decrease in prices and volumes) and a decrease in natural gas regulatory amortizations.
The increase in utility other operating expenses was due to an increase at Avista Utilities and AEL&P. The increase at Avista Utilities was the result of an increase in transmission and distribution operating costs, and compensation costs, partially offset by a decrease in pension and other postretirement benefit costs.
The acquisition costs are related to the pending Hydro One acquisition and consist primarily of employee time incurred directly related to the transaction and are not being passed through to customers.
Utility depreciation and amortization increased due to additions to utility plant.
Income taxes decreased due to federal income tax law changes, which reduced the corporate tax rate from 35 percent to 21 percent. Our effective tax rate was
16.5 percent
for
2018
, compared to
35.6 percent
for 2017. In addition to the enacted tax rate decrease, the amortization of plant excess deferred income taxes under the ARAM decreased our effective tax rate by 3.1 percent, and excess tax benefits from the settlement of equity awards during the first quarter of 2018 decreased our effective tax rate by 1.0 percent.
Other was primarily related to an increase in interest expense, due to additional debt being outstanding during 2018 as compared to 2017. Also, there were increased expenses at one of our subsidiaries associated with the insolvency of the general contractor on a renovation project. The general contractor's insolvency resulted in the recording of a liability to various subcontractors. In addition, we recognized an impairment loss on one equity investment.
Non-GAAP Financial Measures
The following discussion for Avista Utilities includes two financial measures that are considered “non-GAAP financial measures,” electric gross margin and natural gas gross margin. In the AEL&P section, we include a discussion of electric gross margin, which is also a non-GAAP financial measure.
Generally, a non-GAAP financial measure is a numerical measure of a company's financial performance, financial position or cash flows that excludes (or includes) amounts that are included (excluded) in the most directly comparable measure calculated and presented in accordance with GAAP. The presentation of electric gross margin and natural gas gross margin is intended to supplement an understanding of operating performance. We use these measures to determine whether the appropriate amount of revenue is being collected from our customers to allow for the recovery of energy resource costs and operating costs, as well as to analyze how changes in loads (due to weather, economic or other conditions), rates, supply costs and other factors impact our results of operations. In addition, we present electric and natural gas gross margin separately below for Avista Utilities since each business has different cost sources, cost recovery mechanisms and jurisdictions, such that separate analysis is beneficial. These measures are not intended to replace income from operations as determined in accordance with GAAP as an indicator of operating performance. The calculations of electric and natural gas gross margins are presented below.
Results of Operations - Avista Utilities
Three months ended
June 30, 2018
compared to the three months ended
June 30, 2017
The following table presents Avista Utilities' operating revenues, resource costs and resulting gross margin for the three months ended
June 30
(dollars in thousands):
|
|
Electric
|
Natural Gas
|
Intracompany
|
Total
|
|||||||||||||||||||||||||||
|
|
2018
|
2017
|
2018
|
2017
|
2018
|
2017
|
2018
|
2017
|
|||||||||||||||||||||||
|
Operating revenues
|
$
|
235,558
|
|
$
|
230,558
|
|
$
|
75,946
|
|
$
|
80,430
|
|
$
|
(9,282
|
)
|
$
|
(14,241
|
)
|
$
|
302,222
|
|
$
|
296,747
|
|
|||||||
|
Resource costs
|
75,766
|
|
69,427
|
|
36,538
|
|
44,275
|
|
(9,282
|
)
|
(14,241
|
)
|
103,022
|
|
99,461
|
|
|||||||||||||||
|
Gross margin
|
$
|
159,792
|
|
$
|
161,131
|
|
$
|
39,408
|
|
$
|
36,155
|
|
$
|
—
|
|
$
|
—
|
|
$
|
199,200
|
|
$
|
197,286
|
|
|||||||
The gross margin on electric sales decreased
$1.3 million
and the gross margin on natural gas sales increased
$3.3 million
in the
second quarter
of
2018
compared to the
second quarter
of
2017
.
The primary reason for the decrease in electric gross margin was federal income tax law changes that lowered the corporate tax rate from 35 percent to 21 percent. As our customers' rates continued to have the 35 percent corporate tax rate built in from prior general rate cases, we deferred the impact of the change beginning January 1, 2018. Effective May 1, 2018 in Washington and June 1, 2018 in Idaho, base rates reflect the lower 21 percent corporate tax, as such, we are no longer deferring the tax rate change in these jurisdictions. There is no impact to our net income as there was a corresponding decrease in income tax expense.
48
Excluding the effects of the reduction in the corporate tax rate, electric gross margin increased primarily due to general rate increases in Idaho (effective January 1, 2018) and Washington (effective May 1, 2018), as well as customer growth. For the
second quarter
of
2018
, we had a
$1.0 million
pre-tax benefit under the ERM in Washington, compared to a
$0.6 million
pre-tax benefit for the
second quarter
of
2017
. For the full year of
2018
, we expect to be in a benefit position under the ERM within the 90 percent customer/10 percent Company sharing band, primarily due to above normal hydroelectric generation and lower natural gas fuel prices. Because of the above normal hydroelectric generation and lower natural gas fuel prices, we are able to engage in additional optimization activities to capture value in the energy markets.
Natural gas gross margin increased primarily due to general rate increases in Oregon (effective October 1 and November 1, 2017), Idaho (effective January 1, 2018) and Washington (effective May 1, 2018), as well as customer growth. These increases were partially offset by the impact of the reduction in the corporate tax rate.
Intracompany revenues and resource costs represent purchases and sales of natural gas between our natural gas distribution operations and our electric generation operations (as fuel for our generation plants). These transactions are eliminated in the presentation of total results for Avista Utilities and in the condensed consolidated financial statements but are included in the separate results for electric and natural gas presented below.
The following graphs present Avista Utilities' electric operating revenues and megawatt-hour (MWh) sales for the three months ended
June 30
(dollars in millions and MWhs in thousands):
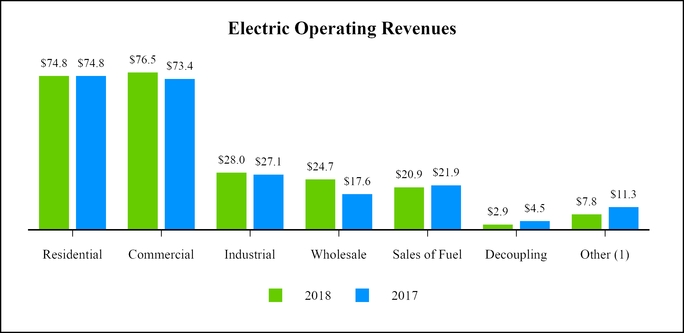
|
(1)
|
This balance includes public street and highway lighting, which is considered part of retail electric revenues, and deferrals/amortizations to customers related to federal income tax law changes.
|
49
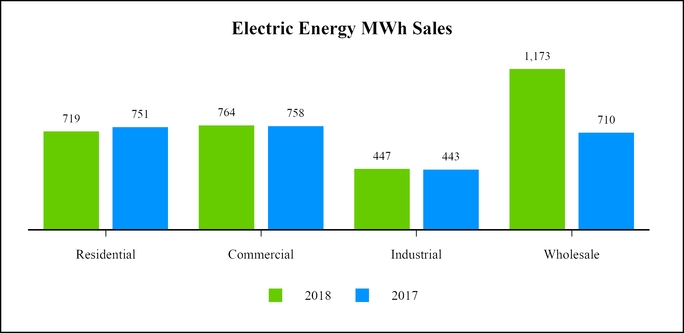
The following table presents the current year deferrals and the amortization of prior year decoupling balances that are reflected in utility electric operating revenues for the three months ended
June 30
(dollars in thousands):
|
|
Electric Operating
Revenues |
||||||
|
|
2018
|
2017
|
|||||
|
Current year decoupling deferrals (a)
|
$
|
6,274
|
|
$
|
5,036
|
|
|
|
Amortization of prior year decoupling deferrals (b)
|
(3,396
|
)
|
(513
|
)
|
|||
|
Total electric decoupling revenue
|
$
|
2,878
|
|
$
|
4,523
|
|
|
|
(a)
|
Positive amounts are increases in decoupling revenue in the current year and will be surcharged to customers in future years. Negative numbers are decreases in decoupling revenue in the current year and will be rebated to customers in future years.
|
|
(b)
|
Positive amounts are increases in decoupling revenue in the current year and are related to the amortization of rebate balances that resulted in prior years and are being refunded to customers (causing a corresponding decrease in retail revenue from customers) in the current year. Negative numbers are decreases in decoupling revenue in the current year and are related to the amortization of surcharge balances that resulted in prior years and are being surcharged to customers (causing a corresponding increase in retail revenue from customers) in the current year.
|
Total electric revenues increased
$5.0 million
for the
second quarter
of
2018
as compared to the
second quarter
of
2017
primarily reflecting the following:
|
•
|
a
$4.1 million
increase in retail electric revenue due to an increase in revenue per MWh (increased revenues
$6.2 million
), partially offset by a decrease in total MWhs sold (decreased revenues
$2.1 million
).
|
|
◦
|
The decrease in total retail MWhs sold was the result of weather that was milder than the prior year (which decreased electric heating and cooling loads), partially offset by customer growth. Compared to the
second quarter
of
2017
, residential electric use per customer decreased
6 percent
and commercial use per customer did not change significantly. Heating degree days in Spokane were
23 percent
below normal and
14 percent
below the
second quarter
of
2017
. Cooling degree days in Spokane were
10 percent
below normal and
39 percent
below the
second quarter
of
2017
.
|
|
◦
|
The increase in revenue per MWh was primarily due to general rate increases in Idaho (effective January 1, 2018) and Washington (effective May 1, 2018), as well as an increase in decoupling surcharge rates. This was partially offset by rate decreases associated with the lower corporate tax rate.
|
|
•
|
a
$7.1 million
increase in wholesale electric revenues due to an increase in sales volumes (increased revenues
$9.8 million
), partially offset by a decrease in sales prices (decreased revenues
$2.7 million
). The fluctuation in volumes
|
50
and prices was primarily the result of our optimization activities.
|
•
|
a
$1.0 million
decrease in sales of fuel due to a decrease in sales of natural gas fuel as part of thermal generation resource optimization activities. For the
second quarter
of
2018
,
$2.0 million
of these sales were made to our natural gas operations and are included as intracompany revenues and resource costs. For the
second quarter
of
2017
,
$5.3 million
of these sales were made to our natural gas operations.
|
|
•
|
a
$1.6 million
decrease in electric revenue due to decoupling. Weather was warmer than normal in the
second quarter
of
2018
, which resulted in decoupling deferral surcharges related to the current year at a higher level than the second quarter of 2017. This was offset by the amortization of decoupling balances from prior years at a higher rate than the
second quarter
of
2017
.
|
|
•
|
a $1.9 million decrease in transmission revenue (included in other revenue in the graph above).
|
The following graphs present Avista Utilities' natural gas operating revenues and therms delivered for the three months ended
June 30
(dollars in millions and therms in thousands):
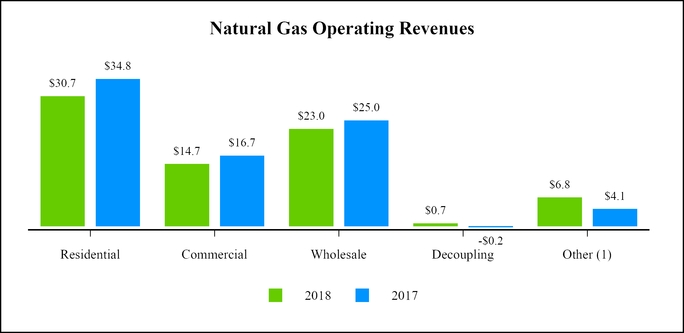
|
(1)
|
This balance includes interruptible and industrial revenues, which are considered part of retail natural gas revenues, and deferrals/amortizations to customers related to federal income tax law changes.
|
51
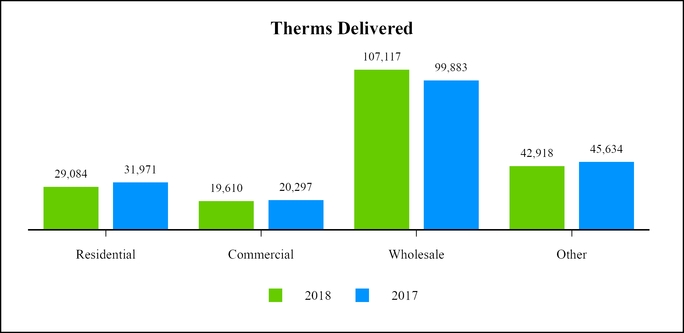
The following table presents the current year deferrals and the amortization of prior year decoupling balances that are reflected in utility natural gas operating revenues for the three months ended
June 30
(dollars in thousands):
|
|
Natural Gas Operating
Revenues |
||||||
|
|
2018
|
2017
|
|||||
|
Current year decoupling deferrals (a)
|
$
|
2,458
|
|
$
|
466
|
|
|
|
Amortization of prior year decoupling deferrals (b)
|
(1,767
|
)
|
(663
|
)
|
|||
|
Total natural gas decoupling revenue
|
$
|
691
|
|
$
|
(197
|
)
|
|
|
(a)
|
Positive amounts are increases in decoupling revenue in the current year and will be surcharged to customers in future years. Negative numbers are decreases in decoupling revenue in the current year and will be rebated to customers in future years.
|
|
(b)
|
Positive amounts are increases in decoupling revenue in the current year and are related to the amortization of rebate balances that resulted in prior years and are being refunded to customers (causing a corresponding decrease in retail revenue from customers) in the current year. Negative numbers are decreases in decoupling revenue in the current year and are related to the amortization of surcharge balances that resulted in prior years and are being surcharged to customers (causing a corresponding increase in retail revenue from customers) in the current year.
|
Total natural gas revenues decreased
$4.5 million
for the
second quarter
of
2018
as compared to the
second quarter
of
2017
primarily reflecting the following:
|
•
|
a
$6.1 million
decrease in natural gas retail revenues due to a decrease in volumes (decreased revenues
$3.2 million
) and lower retail rates (decreased revenues
$2.9 million
).
|
|
◦
|
We sold less retail natural gas in the
second quarter
of
2018
as compared to the
second quarter
of
2017
due to weather that was warmer than the prior year, partially offset by customer growth. Compared to the
second quarter
of
2017
, residential natural gas use per customer decreased
11 percent
and commercial use per customer decreased
4 percent
. Heating degree days in Spokane were
23 percent
below normal and
14 percent
below the
second quarter
of
2017
. Heating degree days in Medford were
24 percent
below normal and
14 percent
below the
second quarter
of
2017
.
|
|
◦
|
Lower retail rates were due to PGAs and rate decreases associated with the lower corporate tax rate, partially offset by general rate increases in Oregon (effective October 1 and November 1, 2017), Idaho (effective January 1, 2018) and Washington (effective May 1, 2018), as well as an increase in decoupling surcharge rates.
|
52
|
•
|
a
$1.9 million
decrease in wholesale natural gas revenues due to a decrease in prices (decreased revenues
$3.5 million
), partially offset by an increase in volumes (increased revenues
$1.6 million
). In the
second quarter
of
2018
,
$7.3 million
of these sales were made to our electric generation operations and are included as intracompany revenues and resource costs. In the
second quarter
of
2017
,
$9.0 million
of these sales were made to our electric generation operations. Differences between revenues and costs from sales of resources in excess of retail load requirements and from resource optimization are accounted for through the PGA mechanisms.
|
|
•
|
a
$0.9 million
increase in natural gas revenue due to decoupling. Weather was warmer than normal in the
second quarter
of
2018
, which resulted in decoupling surcharges at a higher level than the
second quarter
of
2017
. This was offset by the amortization of decoupling surcharges from prior years at a higher rate than the
second quarter
of
2017
.
|
|
•
|
a $2.4 million increase to revenue due to revisions to our estimated provision for rate refunds associated with the federal income tax law changes, which resulted in a true-up that reduced the provision for rate refunds by $2.8 million (increased revenue). The revised estimate was due to the receipt of final orders from Washington and Idaho regarding the regulatory treatment of the tax refunds. The true-up to the estimate was partially offset by deferrals to customers prior to the receipt of the orders and the continued deferral in Oregon.
|
The following table presents Avista Utilities' average number of electric and natural gas retail customers for the three months ended
June 30
:
|
|
Electric
Customers
|
Natural Gas
Customers
|
|||||||||
|
|
2018
|
2017
|
2018
|
2017
|
|||||||
|
Residential
|
339,010
|
|
333,465
|
|
313,782
|
|
306,238
|
|
|||
|
Commercial
|
42,539
|
|
42,074
|
|
35,480
|
|
35,197
|
|
|||
|
Interruptible
|
—
|
|
—
|
|
39
|
|
38
|
|
|||
|
Industrial
|
1,312
|
|
1,328
|
|
246
|
|
250
|
|
|||
|
Public street and highway lighting
|
594
|
|
558
|
|
—
|
|
—
|
|
|||
|
Total retail customers
|
383,455
|
|
377,425
|
|
349,547
|
|
341,723
|
|
|||
The following graphs present Avista Utilities' resource costs for the three months ended
June 30
(dollars in millions):
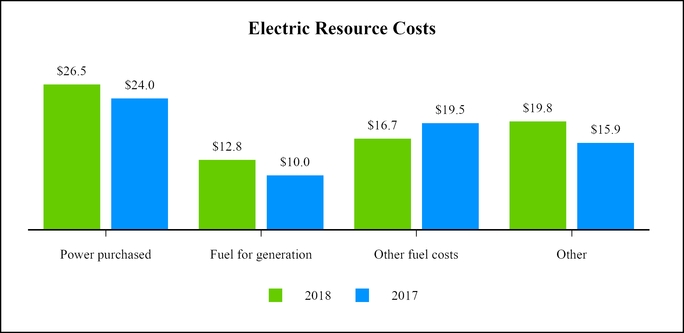
Total electric resource costs in the graph above include intracompany resource costs of
$7.3 million
and
$9.0 million
for the three months ended
June 30, 2018
and
June 30, 2017
, respectively.
53
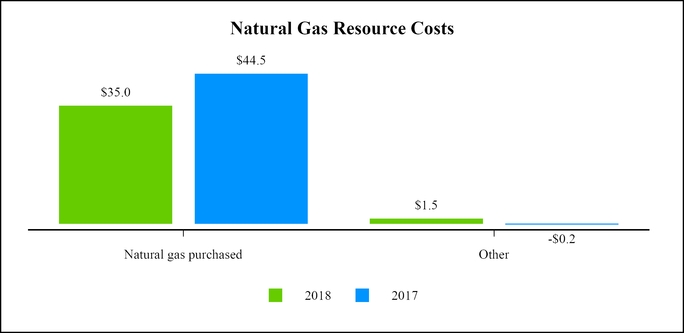
Total natural gas resource costs in the graph above include intracompany resource costs of
$2.0 million
and
$5.3 million
for the three months ended
June 30, 2018
and
June 30, 2017
, respectively.
Total electric resource costs increased
$6.3 million
for the
second quarter
of
2018
as compared to the
second quarter
of
2017
primarily reflecting the following:
|
•
|
a
$2.5 million
increase in purchased power due to an increase in the volume of power purchases (increased costs
$4.4 million
), partially offset by a decrease in wholesale prices (decreased costs
$1.9 million
). The fluctuation in volumes and prices was primarily the result of our optimization activities during the quarter.
|
|
•
|
a
$2.8 million
increase in fuel for generation primarily due to an increase in thermal generation, partially offset by a decrease in natural gas fuel prices.
|
|
•
|
a
$2.8 million
decrease in other fuel costs. This represents fuel and the related derivative instruments that were purchased for generation but were later sold when conditions indicated that it was more economical to sell the fuel as part of the resource optimization process. When the fuel or related derivative instruments are sold, that revenue is included in sales of fuel.
|
|
•
|
a
$1.8 million
increase from net amortizations and deferrals of power costs. This change was primarily the result of lower net power supply costs.
|
|
•
|
a
$2.0 million
net increase from other regulatory amortizations and other electric resource costs.
|
Total natural gas resource costs decreased
$7.7 million
for the
second quarter
of
2018
as compared to the
second quarter
of
2017
primarily reflecting the following:
|
•
|
a
$9.5 million
decrease in natural gas purchased due to a decrease in the price of natural gas (decreased costs
$10.3 million
), partially offset by an increase in total therms purchased (increased costs
$0.8 million
).
|
|
•
|
a
$0.6 million
decrease in other regulatory amortizations.
|
|
•
|
a
$2.4 million
increase from net amortizations and deferrals of natural gas costs.
|
54
Six months ended
June 30, 2018
compared to the
six months ended
June 30, 2017
The following table presents Avista Utilities' operating revenues, resource costs and resulting gross margin for the
six months ended
June 30
(dollars in thousands):
|
|
Electric
|
Natural Gas
|
Intracompany
|
Total
|
|||||||||||||||||||||||||||
|
|
2018
|
2017
|
2018
|
2017
|
2018
|
2017
|
2018
|
2017
|
|||||||||||||||||||||||
|
Operating revenues
|
$
|
498,035
|
|
$
|
494,276
|
|
$
|
219,394
|
|
$
|
250,642
|
|
$
|
(26,453
|
)
|
$
|
(32,790
|
)
|
$
|
690,976
|
|
$
|
712,128
|
|
|||||||
|
Resource costs
|
174,656
|
|
160,302
|
|
106,484
|
|
134,562
|
|
(26,453
|
)
|
(32,790
|
)
|
254,687
|
|
262,074
|
|
|||||||||||||||
|
Gross margin
|
$
|
323,379
|
|
$
|
333,974
|
|
$
|
112,910
|
|
$
|
116,080
|
|
$
|
—
|
|
$
|
—
|
|
$
|
436,289
|
|
$
|
450,054
|
|
|||||||
The gross margin on electric sales decreased
$10.6 million
and the gross margin on natural gas sales decreased
$3.2 million
.
The primary reason for the decrease in both electric and natural gas gross margin was federal income tax law changes that lowered the corporate tax rate from 35 percent to 21 percent. As our customers' rates continued to have the 35 percent corporate tax rate built in from prior general rate cases, we deferred the impact of the change beginning January 1, 2018. Effective May 1, 2018 in Washington and June 1, 2018 in Idaho, base rates reflect the lower 21 percent corporate tax, as such, we are no longer deferring the tax rate change in these jurisdictions. There is no impact to our net income as there was a corresponding decrease in income tax expense.
Excluding the effects of the reduction in the corporate tax rate, electric gross margin increased primarily due to general rate increases in Idaho (effective January 1, 2018) and Washington (effective May 1, 2018), as well as customer growth. For the
six months ended
June 30, 2018
, we recognized a pre-tax benefit of
$5.8 million
under the ERM in Washington compared to a benefit of
$4.6 million
for the
six months ended
June 30, 2017
. For the full year of
2018
, we expect to be in a benefit position under the ERM within the 90 percent customer/10 percent Company sharing band, primarily due to above normal hydroelectric generation and lower natural gas fuel prices, which allows us to engage in additional optimization activities.
Excluding the effects of the reduction in the corporate tax rate, natural gas gross margin increased primarily due to general rate increases in Oregon (effective October 1 and November 1, 2017), Idaho (effective January 1, 2018) and Washington (effective May 1, 2018), as well as customer growth.
Intracompany revenues and resource costs represent purchases and sales of natural gas between our natural gas distribution operations and our electric generation operations (as fuel for our generation plants). These transactions are eliminated in the presentation of total results for Avista Utilities and in the condensed consolidated financial statements but are included in the separate results for electric and natural gas presented below.
The following graphs present Avista Utilities' electric operating revenues and megawatt-hour (MWh) sales for the
six months ended
June 30
(dollars in millions and MWhs in thousands):
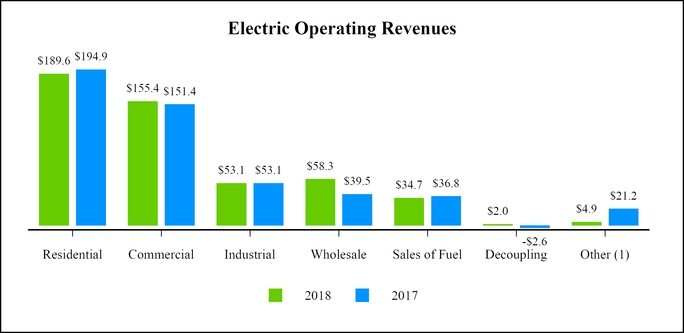
55
|
(1)
|
This balance includes public street and highway lighting, which is considered part of retail electric revenues, and deferrals/amortizations to customers related to federal income tax law changes.
|
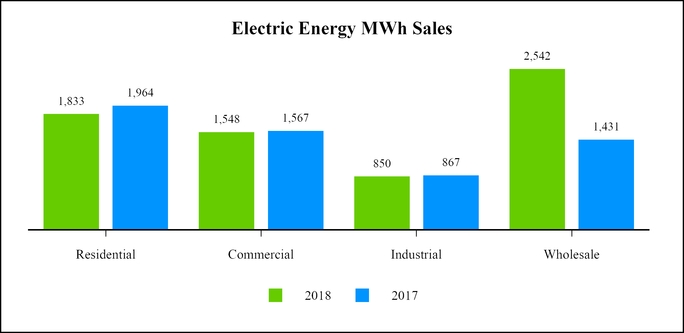
The following table presents the current year deferrals and the amortization of prior year decoupling balances that are reflected in utility electric operating revenues for the
six months ended
June 30
(dollars in thousands):
|
|
Electric Operating
Revenues |
||||||
|
|
2018
|
2017
|
|||||
|
Current year decoupling deferrals (a)
|
$
|
10,286
|
|
$
|
(797
|
)
|
|
|
Amortization of prior year decoupling deferrals (b)
|
(8,276
|
)
|
(1,760
|
)
|
|||
|
Total electric decoupling revenue
|
$
|
2,010
|
|
$
|
(2,557
|
)
|
|
|
(a)
|
Positive amounts are increases in decoupling revenue in the current year and will be surcharged to customers in future years. Negative numbers are decreases in decoupling revenue in the current year and will be rebated to customers in future years.
|
|
(b)
|
Positive amounts are increases in decoupling revenue in the current year and are related to the amortization of rebate balances that resulted in prior years and are being refunded to customers (causing a corresponding decrease in retail revenue from customers) in the current year. Negative numbers are decreases in decoupling revenue in the current year and are related to the amortization of surcharge balances that resulted in prior years and are being surcharged to customers (causing a corresponding increase in retail revenue from customers) in the current year.
|
Total electric revenues increased
$3.8 million
for the
six months ended
June 30, 2018
as compared to the
six months ended
June 30, 2017
primarily reflecting the following:
|
•
|
a
$1.3 million
decrease in retail electric revenue due to a decrease in total MWhs sold (decreased revenues
$16.0 million
), partially offset by an increase in revenue per MWh (increased revenues
$14.7 million
).
|
|
◦
|
The decrease in total retail MWhs sold was the result of weather that was warmer than the prior year during the heating season (which decreased electric heating loads) and cooler than the prior year during the cooling season (which decreased electric cooling loads), partially offset by customer growth. Compared to the
six months ended
June 30, 2017
, residential electric use per customer decreased
8 percent
and commercial use per customer decreased
2 percent
. Heating degree days in Spokane were
8 percent
below normal and
13 percent
below the first
six months
of
2017
. Year-to-date
2018
cooling degree days were
10 percent
below normal and
39 percent
below the prior year.
|
|
◦
|
The increase in revenue per MWh was primarily due to general rate increases in Idaho (effective January 1, 2018) and Washington (effective May 1, 2018), as well as an increase in decoupling surcharge rates. This was partially offset by rate decreases associated with the lower corporate tax rate.
|
56
|
•
|
an
$18.8 million
increase in wholesale electric revenues due to an increase in sales volumes (increased revenues
$25.5 million
), partially offset by a decrease in sales prices (decreased revenues
$6.7 million
). The fluctuation in volumes and prices was primarily the result of our optimization activities.
|
|
•
|
a
$2.1 million
decrease in sales of fuel due to a decrease in sales of natural gas fuel as part of thermal generation resource optimization activities. For the
six months ended
June 30, 2018
,
$8.9 million
of these sales were made to our natural gas operations and are included as intracompany revenues and resource costs. For the
six months ended
June 30, 2017
,
$13.3 million
of these sales were made to our natural gas operations.
|
|
•
|
a
$4.6 million
increase in electric revenue due to decoupling. Weather was warmer than normal during the heating season and cooler than normal during the cooling season in
2018
, which resulted in decoupling surcharges for the first
six months
of
2018
. This was offset by the amortization of decoupling surcharge balances from prior years at a higher rate than the prior year. Weather was cooler than normal during the heating season in
2017
, which resulted in decoupling rebates. This was offset by the amortization of decoupling surcharges from prior years.
|
|
•
|
a
$12.5 million
decrease in electric revenue due to net deferrals for refunds to customers related to the federal income tax law changes that lowered the corporate tax rate from 35 percent to 21 percent. As our customers' rates had the 35 percent corporate tax rate built in from prior general rate cases through May 1, 2018 in Washington and June 1, 2018 in Idaho, we deferred the impact of the change beginning January 1, 2018. Effective May 1, 2018 in Washington and June 1, 2018 in Idaho, base rates reflect the lower 21 percent corporate tax.
|
|
•
|
a $2.7 million decrease in transmission revenue (included in other revenue in the graph above).
|
The following graphs present Avista Utilities' natural gas operating revenues and therms delivered for the
six months ended
June 30
(dollars in millions and therms in thousands):
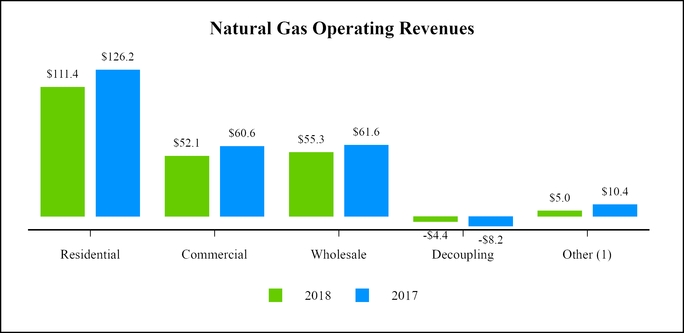
|
(1)
|
This balance includes interruptible and industrial revenues, which are considered part of retail natural gas revenues, and deferrals/amortizations to customers related to federal income tax law changes.
|
57
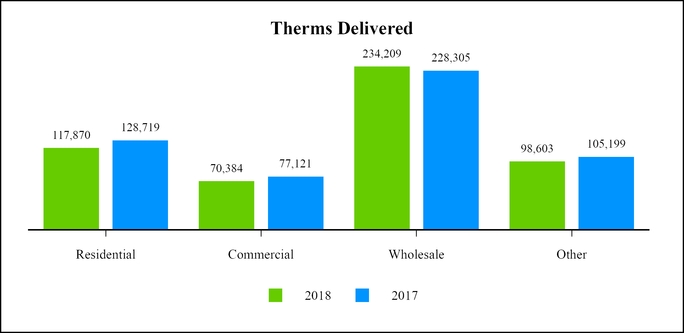
The following table presents the current year deferrals and the amortization of prior year decoupling balances that are reflected in natural gas operating revenues for the
six months ended
June 30
(dollars in thousands):
|
|
Natural Gas Operating
Revenues |
||||||
|
|
2018
|
2017
|
|||||
|
Current year decoupling deferrals (a)
|
$
|
2,606
|
|
$
|
(5,338
|
)
|
|
|
Amortization of prior year decoupling deferrals (b)
|
(6,986
|
)
|
(2,816
|
)
|
|||
|
Total natural gas decoupling revenue
|
$
|
(4,380
|
)
|
$
|
(8,154
|
)
|
|
|
(a)
|
Positive amounts are increases in decoupling revenue in the current year and will be surcharged to customers in future years. Negative numbers are decreases in decoupling revenue in the current year and will be rebated to customers in future years.
|
|
(b)
|
Positive amounts are increases in decoupling revenue in the current year and are related to the amortization of rebate balances that resulted in prior years and are being refunded to customers (causing a corresponding decrease in retail revenue from customers) in the current year. Negative numbers are decreases in decoupling revenue in the current year and are related to the amortization of surcharge balances that resulted in prior years and are being surcharged to customers (causing a corresponding increase in retail revenue from customers) in the current year.
|
Total natural gas revenues decreased
$31.2 million
for the
six months ended
June 30, 2018
as compared to the
six months ended
June 30, 2017
primarily reflecting the following:
|
•
|
a
$23.7 million
decrease in natural gas retail revenues due to a decrease in volumes (decreased revenues
$15.3 million
) and lower retail rates (decreased revenues
$8.4 million
).
|
|
◦
|
We sold less retail natural gas in the
six months ended
June 30, 2018
as compared to the
six months ended
June 30, 2017
due to warmer weather during the heating season, partially offset by customer growth. Compared to the first
six months
of
2017
, residential natural gas use per customer decreased
10 percent
and commercial use per customer decreased
9 percent
. Heating degree days in Spokane were
8 percent
below normal and
13 percent
below the first
six months
of
2017
. Heating degree days in Medford were
5 percent
below normal, and
3 percent
below the first
six months
of
2017
.
|
|
◦
|
Lower retail rates were due to PGAs and rate decreases associated with the lower corporate tax rate, partially offset by general rate increases in Washington, Oregon and Idaho, as well as an increase in decoupling surcharge rates.
|
|
•
|
a
$6.3 million
decrease in wholesale natural gas revenues due to a decrease in prices (decreased revenues
$7.7 million
), partially offset by an increase in volumes (increased revenues
$1.4 million
). In the
six months ended
June 30,
|
58
2018
,
$17.6 million
of these sales were made to our electric generation operations and are included as intracompany revenues and resource costs. In the
six months ended
June 30, 2017
,
$19.5 million
of these sales were made to our electric generation operations. Differences between revenues and costs from sales of resources in excess of retail load requirements and from resource optimization are accounted for through the PGA mechanisms.
|
•
|
a
$3.8 million
increase in natural gas revenue due to decoupling. Weather was warmer than normal in the first
six months
of
2018
, which resulted in decoupling surcharges. This was offset by the amortization of decoupling surcharges from prior years at a higher rate than the prior year. Weather was cooler than normal in the first
six months
of
2017
, which resulted in decoupling rebates.
|
|
•
|
a
$5.5 million
decrease in natural gas revenue due to net deferrals for refunds to customers related to the federal income tax law changes that lowered the corporate tax rate from 35 percent to 21 percent. As our customers' rates had the 35 percent corporate tax rate built in from prior general rate cases through May 1, 2018 in Washington and June 1, 2018 in Idaho, we deferred the impact of the change beginning January 1, 2018. Effective May 1, 2018 in Washington and June 1, 2018 in Idaho, base rates reflect the lower 21 percent corporate tax. Base rates in Oregon continue to have the 35 percent corporate tax rate built in and we are deferring the impact.
|
The following table presents Avista Utilities' average number of electric and natural gas retail customers for the
six months ended
June 30
:
|
|
Electric
Customers
|
Natural Gas
Customers
|
|||||||||
|
|
2018
|
2017
|
2018
|
2017
|
|||||||
|
Residential
|
339,114
|
|
333,885
|
|
313,515
|
|
306,231
|
|
|||
|
Commercial
|
42,582
|
|
42,070
|
|
35,493
|
|
35,217
|
|
|||
|
Interruptible
|
—
|
|
—
|
|
39
|
|
37
|
|
|||
|
Industrial
|
1,317
|
|
1,327
|
|
247
|
|
251
|
|
|||
|
Public street and highway lighting
|
591
|
|
562
|
|
—
|
|
—
|
|
|||
|
Total retail customers
|
383,604
|
|
377,844
|
|
349,294
|
|
341,736
|
|
|||
The following graphs present Avista Utilities' resource costs for the
six months ended
June 30
(dollars in millions):
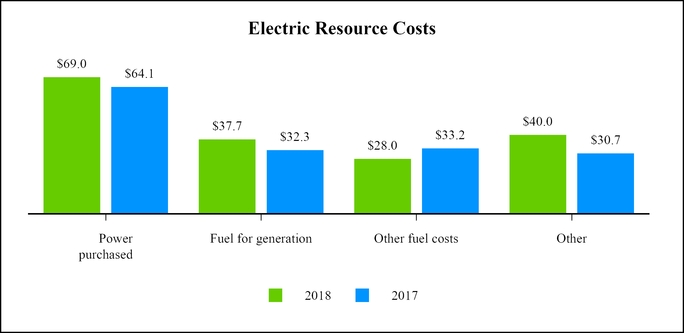
Total electric resource costs in the graph above include intracompany resource costs of
$17.6 million
and
$19.5 million
for the
six months ended
June 30, 2018
and
June 30, 2017
, respectively.
59
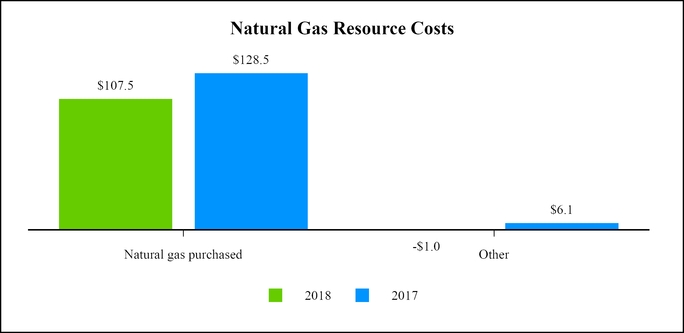
Total natural gas resource costs in the graph above include intracompany resource costs of
$8.9 million
and
$13.3 million
for the
six months ended
June 30, 2018
and
June 30, 2017
, respectively.
Total electric resource costs increased
$14.4 million
for the
six months ended
June 30, 2018
as compared to the
six months ended
June 30, 2017
primarily reflecting the following:
|
•
|
a
$4.9 million
increase in purchased power due to an increase in the volume of power purchases (increased costs
$12.0 million
), partially offset by a decrease in wholesale prices (decreased costs
$7.1 million
). The fluctuation in volumes and prices was primarily the result of our optimization activities during the period.
|
|
•
|
a
$5.4 million
increase in fuel for generation primarily due to an increase in thermal generation, partially offset by a decrease in natural gas fuel prices.
|
|
•
|
a
$5.2 million
decrease in other fuel costs.
|
|
•
|
a
$5.1 million
increase from amortizations and deferrals of power costs. This change was primarily the result of lower net power supply costs.
|
|
•
|
a
$4.2 million
increase in other regulatory amortizations and other electric resource costs.
|
Total natural gas resource costs decreased
$28.1 million
for the
six months ended
June 30, 2018
as compared to the
six months ended
June 30, 2017
primarily reflecting the following:
|
•
|
a
$21.0 million
decrease in natural gas purchased due to a decrease in the price of natural gas (decreased costs
$18.0 million
) and a decrease in total therms purchased (decreased costs
$3.0 million
). Total therms purchased decreased due to a decrease in retail sales, partially offset by an increase in wholesale sales.
|
|
•
|
a
$4.2 million
decrease from amortizations and deferrals of natural gas costs.
|
|
•
|
a
$2.9 million
decrease in other regulatory amortizations.
|
Results of Operations - Alaska Electric Light and Power Company
Three months ended
June 30, 2018
compared to the three months ended
June 30, 2017
and
six months ended
June 30, 2018
compared to the
six months ended
June 30, 2017
Net income for AEL&P was
$1.3 million
for the three months ended
June 30, 2018
compared to
$1.7 million
for the three months ended
June 30, 2017
. Net income was
$5.1 million
for the
six months ended
June 30, 2018
compared to
$5.5 million
for the
six months ended
June 30, 2017
.
60
The following table presents AEL&P's electric operating revenues, electric resource costs and resulting electric gross margin for the three and
six months ended June 30
(dollars in thousands):
|
Three months ended June 30,
|
Six months ended June 30,
|
||||||||||||||
|
2018
|
2017
|
2018
|
2017
|
||||||||||||
|
Operating revenues
|
$
|
10,482
|
|
$
|
11,982
|
|
$
|
24,145
|
|
$
|
27,138
|
|
|||
|
Resource costs
|
2,947
|
|
3,290
|
|
5,900
|
|
6,263
|
|
|||||||
|
Gross margin
|
$
|
7,535
|
|
$
|
8,692
|
|
$
|
18,245
|
|
$
|
20,875
|
|
|||
Electric gross margin decreased for both the
second quarter
of
2018
and the year-to-date primarily due to the accrual for refunds to customers related to the federal income tax law changes that lowered the corporate tax rate from 35 percent to 21 percent. As of June 30, 2018, AEL&P has recorded a customer refund liability of
$1.5 million
related to this tax law change, which will be refunded to customers in future periods. There is no impact to net income as there is a corresponding decrease in income tax expense. See "Executive Level Summary" for additional discussion regarding the regulatory proceedings surrounding the tax law change and the timing of when this customer refund liability will be returned to customers.
In addition, effective January 1, 2018, due to the adoption of ASU No. 2014-09 (revenue recognition standard), AEL&P no longer records utility-related taxes collected from customers on a gross basis in revenue and taxes other than income taxes. These taxes are currently recorded on a net basis within revenue. This change in accounting reduced 2018 revenue, gross margin and taxes other than income taxes by $0.4 million for the
second quarter
and $0.9 million for the year-to-date as compared to the same periods in 2017 with no impact to net income.
Excluding the impacts of the TCJA and the adoption of ASU No. 2014-09, retail revenues decreased slightly compared to 2017 primarily due to a decrease in commercial volumes, partially offset by an increase in residential and commercial customers.
In addition to the decrease in gross margin, there was an increase in other operating expenses primarily due to an increase in distribution and transmission maintenance expenses, partially offset by a decrease in generation maintenance and supplies expense.
Results of Operations - Other Businesses
Net income for our other businesses was less than
$0.1 million
for the three months ended
June 30, 2018
compared to a net loss of
$1.7 million
for the three months ended
June 30, 2017
. Net losses were
$4.4 million
for the
six months ended
June 30, 2018
compared to
$1.9 million
for the
six months ended
June 30, 2017
.
Net losses for the
six months ended
June 30, 2018
were primarily related to increased expenses at one of our subsidiaries associated with the insolvency of the general contractor on a renovation project. The general contractor's insolvency resulted in the recording of a liability to various subcontractors. In addition, we recognized an impairment loss on one equity investment and we recognized our portion of net losses from our other equity investments, which were larger in 2018 as compared to 2017. During the
second quarter
of
2017
, we had increased compliance costs at one of our subsidiaries that did not reoccur during 2018, which contributed to an increase in earnings in the second quarter of 2018 as compared to the second quarter of 2017.
Critical Accounting Policies and Estimates
The preparation of our consolidated financial statements in conformity with GAAP requires us to make estimates and assumptions that affect amounts reported in the consolidated financial statements. Changes in these estimates and assumptions are considered reasonably possible and may have a material effect on our consolidated financial statements and thus actual results could differ from the amounts reported and disclosed herein. Our critical accounting policies that require the use of estimates and assumptions were discussed in detail in the
2017
Form 10-K and have not changed materially from that discussion.
Liquidity and Capital Resources
Overall Liquidity
Our sources of overall liquidity and the requirements for liquidity have not materially changed in the
six months ended June 30, 2018
. See the
2017
Form 10-K for further discussion.
As of
June 30, 2018
, we had
$374.4 million
of available liquidity under the Avista Corp. committed line of credit and
$25.0 million
under the AEL&P committed line of credit. With our
$400.0 million
credit facility that expires in
April 2021
and AEL&P's
$25.0 million
credit facility that expires in
November 2019
, we believe that we have adequate liquidity to meet our needs for the next 12 months.
61
Operating Activities
Net cash provided by operating activities was
$275.4 million
for the
six months ended
June 30, 2018
compared to
$228.5 million
for the
six months ended June 30, 2017
. The increase in net cash provided by operating activities was primarily related to cash collateral posted for derivative instruments. During 2018, our cash collateral posted has decreased by
$44.1 million
, primarily due to the settlement of derivative interest rate swaps which were in a liability position. We paid a net amount of
$25.9 million
during the second quarter of 2018 to settle the derivative interest rate swaps. Also, there were favorable fluctuations in the fair value of our outstanding interest rate swaps and energy commodity derivatives, which contributed to the decrease in collateral requirements. This is compared to the first half of 2017, which required additional cash collateral to be posted of
$5.5 million
.
In addition, lower federal income tax rates went into effect on January 1, 2018, but our customers' rates continued to have a 35 percent corporate income tax rate built into our base rates from prior general rate cases. As a result, we deferred the difference between the 35 percent income tax rate and the current income tax rate of 21 percent and we recorded a customer refund liability of
$19.5 million
that will be returned to customers in future periods.
The increases above were partially offset because during the first half of 2018 we had decreased net income (after consideration of non-cash items included in net income) of
$222.1 million
, compared to
$235.5 million
for the first half of 2017.
Investing Activities
Net cash used in investing activities was
$192.9 million
for the
six months ended
June 30, 2018
, compared to
$189.6 million
for the
six months ended June 30, 2017
. During the
six months ended
June 30, 2018
, we paid
$183.1 million
for utility capital expenditures compared to
$177.7 million
for the
six months ended June 30, 2017
. Also, during 2018, our subsidiaries invested
$7.4 million
in equity and property, compared to
$10.3 million
invested during 2017.
Financing Activities
Net cash used by financing activities was
$63.4 million
for the
six months ended
June 30, 2018
, compared to
$34.0 million
for the
six months ended June 30, 2017
. We had the following transactions:
|
•
|
net proceeds from the issuance of long-term debt of
$374.6 million
, which was used to repay maturing long-term debt of
$276.2 million
and repay the outstanding balance under our committed line of credit of
$105.4 million
during 2018. This was compared to an increase in short-term borrowings of
$16.0 million
in 2017, and
|
|
•
|
cash dividends paid to Avista Corp. shareholders increased to
$49.1 million
(or
$0.7450
per share) for the
six months ended
June 30, 2018
from
$46.2 million
(or
$0.7150
per share) for the
six months ended June 30, 2017
.
|
Capital Resources
Our consolidated capital structure, including the current portion of long-term debt and short-term borrowings, and excluding noncontrolling interests, consisted of the following as of
June 30, 2018
and
December 31, 2017
(dollars in thousands):
|
|
June 30, 2018
|
December 31, 2017
|
|||||||||||
|
|
Amount
|
Percent
of total
|
Amount
|
Percent
of total
|
|||||||||
|
Current portion of long-term debt and capital leases
|
$
|
2,598
|
|
0.1
|
%
|
$
|
277,438
|
|
7.6
|
%
|
|||
|
Short-term borrowings
|
—
|
|
—
|
%
|
105,398
|
|
2.9
|
%
|
|||||
|
Long-term debt to affiliated trusts
|
51,547
|
|
1.4
|
%
|
51,547
|
|
1.4
|
%
|
|||||
|
Long-term debt and capital leases
|
1,861,584
|
|
50.6
|
%
|
1,491,799
|
|
40.8
|
%
|
|||||
|
Total debt
|
1,915,729
|
|
52.1
|
%
|
1,926,182
|
|
52.7
|
%
|
|||||
|
Total Avista Corporation shareholders’ equity
|
1,762,458
|
|
47.9
|
%
|
1,729,828
|
|
47.3
|
%
|
|||||
|
Total
|
$
|
3,678,187
|
|
100.0
|
%
|
$
|
3,656,010
|
|
100.0
|
%
|
|||
Our shareholders’ equity increased
$32.6 million
during the first
six months
of
2018
primarily due to net income, partially offset by dividends.
We need to finance capital expenditures and acquire additional funds for operations from time to time. The cash requirements needed to service our indebtedness, both short-term and long-term, reduce the amount of cash flow available to fund capital expenditures, purchased power, fuel and natural gas costs, dividends and other requirements.
62
Committed Lines of Credit
Avista Corp. has a committed line of credit with various financial institutions in the total amount of
$400.0 million
that expires in
April 2021
. As of
June 30, 2018
, there was
$374.4 million
of available liquidity under this line of credit.
The Avista Corp. credit facility contains customary covenants and default provisions, including a covenant which does not permit our ratio of “consolidated total debt” to “consolidated total capitalization” to be greater than
65 percent
at any time. As of
June 30, 2018
, we were in compliance with this covenant with a ratio of
52.1 percent
.
AEL&P has a
$25.0 million
committed line of credit that expires in
November 2019
. As of
June 30, 2018
, there were no borrowings or letters of credit outstanding under this committed line of credit.
The AEL&P credit facility contains customary covenants and default provisions including a covenant which does not permit the ratio of “consolidated total debt at AEL&P” to “consolidated total capitalization at AEL&P,” (including the impact of the Snettisham obligation) to be greater than
67.5 percent
at any time. As of
June 30, 2018
, AEL&P was in compliance with this covenant with a ratio of
52.4 percent
.
Balances outstanding and interest rates of borrowings (excluding letters of credit) under Avista Corp.'s committed line of credit were as follows as of and for the
six months ended June 30
(dollars in thousands):
|
2018
|
2017
|
||||||
|
Borrowings outstanding at end of period
|
$
|
—
|
|
$
|
136,000
|
|
|
|
Letters of credit outstanding at end of period
|
$
|
25,620
|
|
$
|
56,703
|
|
|
|
Maximum borrowings outstanding during the period
|
$
|
111,000
|
|
$
|
136,000
|
|
|
|
Average borrowings outstanding during the period
|
$
|
48,442
|
|
$
|
105,157
|
|
|
|
Average interest rate on borrowings during the period
|
2.37
|
%
|
1.67
|
%
|
|||
|
Average interest rate on borrowings at end of period
|
—
|
%
|
1.99
|
%
|
|||
As of
June 30, 2018
, Avista Corp. and its subsidiaries were in compliance with all of the covenants of their financing agreements, and none of Avista Corp.'s subsidiaries constituted a “significant subsidiary” as defined in Avista Corp.'s committed line of credit.
2018 Liquidity Expectations
During 2018, we have issued
$375.0 million
of long-term debt as discussed above. We do not expect any further long-term debt issuances in 2018. We expect to issue up to
$110.0 million
of equity in order to fund planned capital expenditures, maintain an appropriate capital structure and for other general corporate purposes. The
$110.0 million
of equity in 2018 may come through the sale of shares through our sales agency agreements or from an equity contribution from Hydro One after consummation of the acquisition or from a combination of those sources. Our equity estimate has increased from our previous estimate of
$85.0 million
due to a change in the regulatory procedural timeline regarding the Hydro One acquisition. Due to the extended timeline, a fourth quarter common stock dividend could be declared by the Avista Corp. Board of Directors, which would necessitate additional funding.
After considering the issuance of long-term debt and the expected issuance of equity during
2018
, we expect net cash flows from operating activities, together with cash available under our committed line of credit agreements, to provide adequate resources to fund capital expenditures, dividends, and other contractual commitments.
2019 and Forward Operating Cash Flows
Due to federal income tax law changes, we expect our operating cash flows will be negatively impacted going forward primarily due to the loss of the bonus depreciation tax deduction and from the timing of the return of excess deferred taxes to customers. As a result, we may need to raise additional capital.
Capital Expenditures
We are making capital investments to enhance service and system reliability for our customers and replace aging infrastructure. Our estimated capital expenditures for
2018
,
2019
and
2020
have not materially changed during the
six months ended June 30, 2018
. See the
2017
Form 10-K for further information.
Off-Balance Sheet Arrangements
As of
June 30, 2018
, we had
$25.6 million
in letters of credit outstanding under our
$400.0 million
committed line of credit, compared to
$34.4 million
as of
December 31, 2017
.
63
Pension Plan
Avista Utilities
In the
six months ended
June 30, 2018
we contributed
$14.6 million
to the pension plan and we expect to contribute a total of
$22.0 million
in
2018
. We expect to contribute a total of
$110.0 million
to the pension plan in the period
2018
through
2022
, with annual contributions of
$22.0 million
over that period.
The final determination of pension plan contributions for future periods is subject to multiple variables, most of which are beyond our control, including changes to the fair value of pension plan assets, changes in actuarial assumptions (in particular the discount rate used in determining the benefit obligation), or changes in federal legislation. We may change our pension plan contributions in the future depending on changes to any variables, including those listed above.
See "Note 6 of the Notes to Condensed Consolidated Financial Statements" for additional information regarding the pension plan.
Contractual Obligations
Our future contractual obligations have not materially changed during the
six months ended June 30, 2018
other than the issuance and sale of
$375.0 million
of
4.35 percent
first mortgage bonds due in
June 2048
through a public offering. See "Note 8 of the Notes to Condensed Consolidated Financial Statements" for additional discussion of the bond issuance. See the
2017
Form 10-K for our contractual obligations.
Environmental Issues and Contingencies
Our environmental issues and contingencies disclosures have not materially changed during the
six months ended June 30, 2018
other than the following:
Climate Change - State Legislation and State Regulatory Activities - Washington
Clean Air Rule
In September 2016, the Washington State Department of Ecology (Ecology) adopted the Clean Air Rule (CAR) to cap and reduce greenhouse gas (GHG) emissions across the State of Washington in pursuit of the State’s GHG goals, which were enacted in 2008 by the Washington State Legislature.
In September 2016, Avista Corp., Cascade Natural Gas Corp., NW Natural and Puget Sound Energy (collectively, Petitioners) jointly filed an action in the U.S. District Court for the Eastern District of Washington challenging Ecology’s promulgated CAR. The four companies also filed litigation in Thurston County Superior Court.
The case in the U.S. District Court has been tolled while the state court case proceeds. On December 15, 2017, the Thurston County Superior Court issued a ruling invalidating the CAR. On April 27, 2018, the Superior Court entered its order invalidating CAR. On May 11, 2018, Ecology filed a notice of appeal with the Washington Supreme Court seeking direct review of the order. We cannot predict the outcome of these matters at this time, but plan to seek recovery of costs related to compliance with surviving requirements through the ratemaking process.
See the
2017
Form 10-K for further discussion of environmental issues and contingencies.
Enterprise Risk Management
The material risks to our businesses were discussed in our
2017
Form 10-K and have not materially changed during the
six months ended June 30, 2018
. Refer to the
2017
Form 10-K for further discussion of our risks and the mitigation of those risks.
Financial Risk
Our financial risks have not materially changed during the
six months ended June 30, 2018
. Refer to the
2017
Form 10-K. The financial risks included below are required interim disclosures, even if they have not materially changed from
December 31, 2017
.
Interest Rate Risk
We use a variety of techniques to manage our interest rate risks. We have an interest rate risk policy and have established a policy to limit our variable rate exposures to a percentage of total capitalization. Additionally, interest rate risk is managed by monitoring market conditions when timing the issuance of long-term debt and optional debt redemptions and establishing fixed rate long-term debt with varying maturities. See "Note 5 of the Notes to Condensed Consolidated Financial Statements" for a summary of our interest rate swap derivatives outstanding as of
June 30, 2018
and
December 31, 2017
and the amount of additional collateral we would have to post in certain circumstances.
64
Credit Risk
Avista Utilities' contracts for the purchase and sale of energy commodities can require collateral in the form of cash or letters of credit. As of
June 30, 2018
, we had cash deposited as collateral in the amount of
$29.8 million
and letters of credit of
$21.7 million
outstanding related to our energy derivative contracts. Price movements and/or a downgrade in our credit ratings could impact further the amount of collateral required. See “Credit Ratings” in the
2017
Form 10-K for further information. For example, in addition to limiting our ability to conduct transactions, if our credit ratings were lowered to below “investment grade” based on our positions outstanding at
June 30, 2018
, we would potentially be required to post up to
$3.5 million
of additional collateral. This amount is different from the
$1.5 million
disclosed in “Note 5 of the Notes to Condensed Consolidated Financial Statements” because, while this analysis includes contracts that are not considered derivatives in addition to the contracts considered in Note 5, this analysis takes into account contractual threshold limits that are not considered in Note 5. Without contractual threshold limits, we would potentially be required to post up to
$4.5 million
of additional collateral.
Under the terms of interest rate swap derivatives that we enter into periodically, we may be required to post cash or letters of credit as collateral depending on fluctuations in the fair value of the instrument. As of
June 30, 2018
, we had interest rate swap derivatives outstanding with a notional amount totaling
$185.0 million
and we had deposited cash in the amount of
$0.6 million
as collateral for these interest rate swap derivatives. If our credit ratings were lowered to below “investment grade” based on our interest rate swap derivatives outstanding at
June 30, 2018
, we would be required to post up to
$2.4 million
of additional collateral.
Energy Commodity Risk
Our energy commodity risks have not materially changed during the
six months ended June 30, 2018
, except as discussed below. Refer to the
2017
Form 10-K. The following table presents energy commodity derivative fair values as a net asset or (liability) as of
June 30, 2018
that are expected to settle in each respective year (dollars in thousands):
|
|
Purchases
|
Sales
|
|||||||||||||||||||||||||||||
|
|
Electric Derivatives
|
Gas Derivatives
|
Electric Derivatives
|
Gas Derivatives
|
|||||||||||||||||||||||||||
|
Year
|
Physical (1)
|
Financial (1)
|
Physical (1)
|
Financial (1)
|
Physical (1)
|
Financial (1)
|
Physical (1)
|
Financial (1)
|
|||||||||||||||||||||||
|
Remainder 2018
|
$
|
(2,185
|
)
|
$
|
2,127
|
|
$
|
(115
|
)
|
$
|
(19,567
|
)
|
$
|
(158
|
)
|
$
|
(3,122
|
)
|
$
|
(468
|
)
|
$
|
10,528
|
|
|||||||
|
2019
|
(3,900
|
)
|
(1,522
|
)
|
(624
|
)
|
(23,617
|
)
|
10
|
|
5,108
|
|
(1,261
|
)
|
12,447
|
|
|||||||||||||||
|
2020
|
—
|
|
—
|
|
(852
|
)
|
(4,889
|
)
|
—
|
|
479
|
|
(1,069
|
)
|
347
|
|
|||||||||||||||
|
2021
|
—
|
|
—
|
|
—
|
|
(165
|
)
|
—
|
|
—
|
|
(624
|
)
|
65
|
|
|||||||||||||||
|
2022
|
—
|
|
—
|
|
—
|
|
—
|
|
—
|
|
—
|
|
—
|
|
—
|
|
|||||||||||||||
|
Thereafter
|
—
|
|
—
|
|
—
|
|
—
|
|
—
|
|
—
|
|
—
|
|
—
|
|
|||||||||||||||
The following table presents energy commodity derivative fair values as a net asset or (liability) as of
December 31, 2017
that are expected to be delivered in each respective year (dollars in thousands):
|
|
Purchases
|
Sales
|
|||||||||||||||||||||||||||||
|
|
Electric Derivatives
|
Gas Derivatives
|
Electric Derivatives
|
Gas Derivatives
|
|||||||||||||||||||||||||||
|
Year
|
Physical (1)
|
Financial (1)
|
Physical (1)
|
Financial (1)
|
Physical (1)
|
Financial (1)
|
Physical (1)
|
Financial (1)
|
|||||||||||||||||||||||
|
2018
|
$
|
(8,267
|
)
|
$
|
(501
|
)
|
$
|
1,022
|
|
$
|
(36,834
|
)
|
$
|
35
|
|
$
|
4,100
|
|
$
|
(374
|
)
|
$
|
15,829
|
|
|||||||
|
2019
|
(4,950
|
)
|
(1,159
|
)
|
(570
|
)
|
(17,814
|
)
|
(13
|
)
|
4,621
|
|
(932
|
)
|
6,395
|
|
|||||||||||||||
|
2020
|
—
|
|
—
|
|
(766
|
)
|
(1,882
|
)
|
—
|
|
(194
|
)
|
(1,050
|
)
|
—
|
|
|||||||||||||||
|
2021
|
—
|
|
—
|
|
—
|
|
—
|
|
—
|
|
—
|
|
(655
|
)
|
—
|
|
|||||||||||||||
|
2022
|
—
|
|
—
|
|
—
|
|
—
|
|
—
|
|
—
|
|
—
|
|
—
|
|
|||||||||||||||
|
Thereafter
|
—
|
|
—
|
|
—
|
|
—
|
|
—
|
|
—
|
|
—
|
|
—
|
|
|||||||||||||||
|
(1)
|
Physical transactions represent commodity transactions where we will take or make delivery of either electricity or natural gas; financial transactions represent derivative instruments with delivery of cash in the amount of the benefit or cost but with no physical delivery of the commodity, such as futures, swap derivatives, options, or forward contracts.
|
The above electric and natural gas derivative contracts will be included in either power supply costs or natural gas supply costs during the period they are delivered and will be included in the various deferral and recovery mechanisms (ERM, PCA, and PGAs), or in the general rate case process, and are expected to eventually be collected through retail rates from customers.
65
The information required by this item is set forth in the Enterprise Risk Management section of "Item 2. Management’s Discussion and Analysis of Financial Condition and Results of Operations" and is incorporated herein by reference.
Conclusion Regarding the Effectiveness of Disclosure Controls and Procedures
The Company has disclosure controls and procedures (as defined in Rules 13a-15(e) and 15d-15(e) under the Securities Exchange Act of 1934, as amended) (Act) that are designed to ensure that information required to be disclosed in the reports it files or submits under the Act is recorded, processed, summarized and reported on a timely basis. Disclosure controls and procedures include, without limitation, controls and procedures designed to ensure that information required to be disclosed by the Company in the reports that it files or submits under the Act is accumulated and communicated to the Company’s management, including its principal executive and principal financial officers, as appropriate, to allow timely decisions regarding required disclosure. With the participation of the Company’s principal executive officer and principal financial officer, the Company's management evaluated its disclosure controls and procedures as of the end of the period covered by this report. There are inherent limitations to the effectiveness of any system of disclosure controls and procedures, including the possibility of human error and the circumvention or overriding of the controls and procedures. Accordingly, even effective disclosure controls and procedures can only provide reasonable assurance of achieving their control objectives. Based upon this evaluation, the Company’s principal executive officer and principal financial officer have concluded that the Company’s disclosure controls and procedures are effective at a reasonable assurance level as of
June 30, 2018
.
There have been no changes in the Company's internal control over financial reporting that occurred during the
second quarter
of
2018
that have materially affected, or are reasonably likely to materially affect, the Company's internal control over financial reporting.
See “Note 13 of Notes to Condensed Consolidated Financial Statements” in “Part I. Financial Information Item 1. Condensed Consolidated Financial Statements.”
Please refer to the
2017
Form 10-K for disclosure of risk factors that could have a significant impact on our results of operations, financial condition or cash flows and could cause actual results or outcomes to differ materially from those discussed in our reports filed with the SEC (including this Quarterly Report on Form 10-Q), and elsewhere. These risk factors have not materially changed from the disclosures provided in the
2017
Form 10-K, except for the following:
External Mandates Risk
Import tariffs and/or other mandates imposed by the current presidential administration could potentially lead to a trade war with other foreign governments, and could significantly increase the prices on raw materials that are critical to our business, such as steel poles or wires. In addition, tariff increases may have a similar impact to our other suppliers and certain other customers, which could increase the negative impact on our operating results or future cash flows, as well as impact customer rates.
In addition to these risk facto
rs, see a
lso “Forward-Looking Statements” for additional factors which could have a significant impact on our operations, results of operations, financial condition or cash flows and could cause actual results to differ materially from those anticipated in such statements.
|
(a)
|
Not applicable
|
|
(b)
|
Not applicable
|
|
(c)
|
Not applicable
|
Dividend Restrictions
The restrictions on the payment of dividends on common stock have not materially changed during the
six months ended June 30, 2018
except for the following:
66
As a result of the Merger Agreement with Hydro One, Avista Corp. cannot (A) declare, authorize, set aside for payment or pay any dividend on, or make any other distribution in respect of, any shares of its capital stock, other than (1) dividends paid by any Subsidiary of the Company to the Company or to any wholly owned Subsidiary of the Company, (2) quarterly cash dividends with respect to the Company Common Stock not to exceed the current annual per share dividend rate by more than $0.06 per year, with record dates and payment dates consistent with the Company’s current dividend practice, or (3) a “stub period” dividend to holders of record of Company Common Stock as of immediately prior to the Effective Time equal to the product of (x) the number of days from the record date for payment of the last quarterly dividend paid by the Company prior to the Effective Time, multiplied by (y) a daily dividend rate determined by dividing the amount of the last quarterly dividend prior to the Effective Time by ninety-one or (B) adjust, split, combine, subdivide or reclassify any shares of its capital stock.
For further information regarding limitations on the conduct of Avista Corp.'s business under the Merger Agreement, see Section 5 of the Merger Agreement, which was filed as Exhibit 2.1 to Avista Corp.’s Current Report on Form 8-K filed with the SEC on July 19, 2017. See the 2017 Form 10-K for further information on other restrictions on the payment of dividends on common stock.
Not applicable.
|
|
||
|
|
||
|
|
||
|
|
||
|
|
||
|
|
||
|
101
|
|
The following financial information from the Quarterly Report on Form 10−Q for the period ended June 30, 2018, formatted in XBRL (Extensible Business Reporting Language) and filed electronically herewith: (i) the Condensed Consolidated Statements of Income; (ii) Condensed Consolidated Statements of Comprehensive Income; (iii) the Condensed Consolidated Balance Sheets; (iv) the Condensed Consolidated Statements of Cash Flows; (v) the Condensed Consolidated Statements of Equity; and (vi) the Notes to Condensed Consolidated Financial Statements. (2)
|
|
(1
|
)
|
Previously filed as exhibit 2.1 to the registrant's Current Report on Form 8-K, filed as of July 19, 2017 and incorporated herein by reference.
|
|
(2
|
)
|
Filed herewith.
|
|
(3
|
)
|
Furnished herewith.
|
67
SIGNATURE
Pursuant to the requirements of the Securities Exchange Act of 1934, the registrant has duly caused this report to be signed on its behalf by the undersigned thereunto duly authorized.
|
|
AVISTA CORPORATION
|
||
|
(Registrant)
|
|||
|
Date:
|
July 31, 2018
|
|
/s/ Mark T. Thies
|
|
|
Mark T. Thies
|
||
|
|
Senior Vice President,
Chief Financial Officer, and Treasurer
(Principal Financial Officer)
|
||
68
TABLE OF CONTENTS
Part I. Financial InformationItem 1. Condensed Consolidated Financial StatementsNote 1. Summary Of Significant Accounting PoliciesNote 2. Balance Sheet ComponentsNote 3. New Accounting StandardsNote 4. RevenueNote 5. Derivatives and Risk ManagementNote 6. Pension Plans and Other Postretirement Benefit PlansNote 7. Committed Lines Of CreditNote 8. Long-term Debt and Capital LeasesNote 9. Long-term Debt To Affiliated TrustsNote 10. Fair ValueNote 11. Common StockNote 12. Earnings Per Common Share Attributable To Avista Corp. ShareholdersNote 13. Commitments and ContingenciesNote 14. Information By Business SegmentsNote 15. Pending Acquisition By Hydro OneItem 2. Management S Discussion and Analysis Of Financial Condition and Results Of OperationsItem 3. Quantitative and Qualitative Disclosures About Market RiskItem 4. Controls and ProceduresPart II. Other InformationItem 1. Legal ProceedingsItem 1A. Risk FactorsItem 2. Unregistered Sales Of Equity Securities and Use Of ProceedsItem 4. Mine Safety DisclosuresItem 6. Exhibits