UNITED STATES
SECURITIES AND EXCHANGE COMMISSION
Washington, D.C. 20549
FORM 20-F
(Mark One)
| o |
REGISTRATION STATEMENT PURSUANT TO SECTION 12(b) OR (g) OF THE SECURITIES EXCHANGE ACT OF 1934
|
OR
|
x
|
ANNUAL REPORT PURSUANT TO SECTION 13 OR 15(d) OF THE SECURITIES EXCHANGE ACT OF 1934
|
|
|
for the fiscal year ended December 31, 2011
|
|
|
OR
|
|
o
|
TRANSITION REPORT PURSUANT TO SECTION 13 OR 15(d) OF THE SECURITIES EXCHANGE ACT OF 1934
|
|
|
For the transition period from ________________ to ________________
|
OR
|
o
|
SHELL COMPANY REPORT PURSUANT TO SECTION 13 OR 15(d) OF THE SECURITIES EXCHANGE ACT OF 1934
|
|
|
Date of event requiring this shell company report
|
|
|
Commission file number: 000-54290
|
GRUPO AVAL ACCIONES Y VALORES S.A.
(Exact name of Registrant as specified in its charter)
Republic of Colombia
(Jurisdiction of incorporation)
Carrera 13 No. 26A - 47
Bogotá D.C., Colombia
(Address of principal executive offices)
Javier Díaz Fajardo
Vice President of Investor Relations
Grupo Aval Acciones y Valores S.A.
Carrera 13 No. 2
6A
- 47
Bogotá D.C., Colombia
Phone: (+57 1) 241-9700
Fax: (+57 1) 241-9729
(Name, Telephone, E-mail and/or Facsimile number and Address of Company Contact Person)
Copies to:
Nicholas A. Kronfeld, Esq.
Manuel Garciadiaz, Esq.
Davis Polk & Wardwell LLP
450 Lexington Avenue
New York, NY 10017
Phone: (212) 450-4000
Fax: (212) 701-5800
Securities registered or to be registered pursuant to Section 12(b) of the Act:
None
(Title of Class)
Securities registered or to be registered pursuant to Section 12(g) of the Act:
|
Title of each class
|
Name of each exchange on which registered
|
|
|
Preferred Shares, par value Ps. 1.00 per preferred share
|
Not applicable
|
Securities for which there is a reporting obligation pursuant to Section 15(d) of the Act:
None
(Title of Class)
Indicate the number of outstanding shares of each of the issuer’s classes of capital stock or common stock as of the close of business covered by the annual report.
Preferred shares: 4,745,075,213
Indicate by check mark if the registrant is a well-known seasoned issuer, as defined in Rule 405 of the Securities Act.
o
Yes
x
No
If this report is an annual or transition report, indicate by check mark if the registrant is not required to file reports pursuant to Section 13 or 15(d) of the Securities Exchange Act of 1934.
o
Yes
x
No
Indicate by check mark whether the registrant (1) has filed all reports required to be filed by Section 13 or 15(d) of the Securities Exchange Act of 1934 during the preceding 12 months (or for such shorter period that the registrant was required to file such reports), and (2) has been subject to such filing requirements for the past 90 days.
x
Yes
o
No
Indicate by check mark whether the registrant has submitted electronically and posted on its corporate Web site, if any, every Interactive Data File required to be submitted and posted pursuant to Rule 405 of Regulation S-T during the preceding 12 months (or for such shorter period that the registrant was required to submit and post such files).
o
Yes
x
No
Indicate by check mark whether the registrant is a large accelerated filer, an accelerated filer, or a non-accelerated filer. See definition of “accelerated filer and large accelerated filer” in Rule 12b-2 of the Exchange Act. (Check one):
Indicate by check mark which basis of accounting the registrant has used to prepare the financial statements included in this filing:
|
US GAAP
o
|
International Financial Reporting Standards as issued by the International Accounting Standards Board
o
|
Other
x
|
If “Other” has been checked in response to the previous question indicate by check mark which financial statement item the registrant has elected to follow.
o
Item 17
x
Item 18
If this is an annual report, indicate by check mark whether the registrant is a shell company (as defined in Rule 12b-2 of the Exchange Act).
o
Yes
x
No
GRUPO AVAL ACCIONES Y VALORES S.A.
Page
All references herein to “peso,” “pesos” or “Ps” refer to the lawful currency of Colombia. All references to “U.S. dollars,” “dollars” or “ U.S.$” are to United States dollars. See “Item 3. Key Information—A. Selected financial data—Exchange rates” for information regarding exchange rates for the Colombian currency since 2007. This annual report translates certain Colombian peso amounts into U.S. dollars at specified rates solely for the convenience of the reader. The conversion of amounts expressed in Colombian pesos as of a specified date at the then prevailing exchange rate may result in presentation of U.S. dollar amounts that differ from U.S. dollar amounts that would have been obtained by converting Colombian pesos as of another specified date. Unless otherwise noted in this annual report, all such peso amounts have been translated at the rate of Ps 1,942.70 per U.S.$1.00, which corresponds to the representative market rate calculated on December 31, 2011. The representative market rate is computed and certified by the Superintendency of Finance on a daily basis and represents the weighted average of the buy/sell foreign exchange rates negotiated on the previous day by certain financial institutions authorized to engage in foreign exchange transactions. Such conversion should not be construed as a representation that the peso amounts correspond to, or have been or could be converted into, U.S. dollars at that rate or any other rate. On April 25, 2012, the representative market rate was Ps 1,767.91 per U.S.$1.00.
Definitions
In this annual report, unless otherwise indicated or the context otherwise requires, the terms:
|
|
·
|
“Grupo Aval,” “we,” “us,” “our” and “our company” mean Grupo Aval Acciones y Valores S.A. and its consolidated subsidiaries;
|
|
|
·
|
“banks” and “our banking subsidiaries” mean Banco de Bogotá S.A., Banco de Occidente S.A., Banco Popular S.A. and Banco Comercial AV Villas S.A. and their respective consolidated subsidiaries;
|
|
|
·
|
“Banco de Bogotá” means Banco de Bogotá S.A. and its consolidated subsidiaries;
|
|
|
·
|
“Banco de Occidente” means Banco de Occidente S.A. and its consolidated subsidiaries;
|
|
|
·
|
“Banco Popular” means Banco Popular S.A. and its consolidated subsidiaries;
|
|
|
·
|
“Banco AV Villas” means Banco Comercial AV Villas S.A. and its consolidated subsidiary;
|
|
|
·
|
“BAC Credomatic” or “BAC” means BAC Credomatic Inc. (formerly known as BAC Credomatic GECF Inc.) and its consolidated subsidiaries;
|
|
|
·
|
“Corficolombiana” means Corporación Financiera Colombiana S.A. and its consolidated subsidiaries;
|
|
|
·
|
“Grupo Aval Limited” means our wholly-owned finance subsidiary, Grupo Aval Limited;
|
|
|
·
|
“LB Panama” means Leasing Bogotá S.A., Panama and its consolidated subsidiaries; and
|
|
|
·
|
“Porvenir” means Sociedad Administradora de Fondos de Pensiones y Cesantías Porvenir S.A. and its consolidated subsidiary.
|
The term “Superintendency of Finance” means the Colombian Superintendency of Finance (
Superintendencia Financiera de Colombia
), a supervisory authority ascribed to the Colombian Ministry of Finance and Public Credit (
Ministerio de Hacienda y Crédito Público
), or the “Ministry of Finance,” holding the inspection, supervision and control authority over the persons involved in financial activities, securities markets, insurance and any other operations related to the management, use or investment of resources collected from the public.
In this annual report, references to beneficial ownership are calculated pursuant to the SEC’s definition of beneficial ownership contained in Form 20-F for foreign private issuers. In Form 20-F the term “beneficial owner” of securities refers to any person who, even if not the record owner of the securities, has or shares the underlying benefits of ownership. These benefits include the power to direct the voting or the disposition of the securities or to receive the economic benefit of ownership of the securities. A person also is considered to be the “beneficial owner”
of securities that the person has the right to acquire within 60 days by option or other agreement. Beneficial owners include persons who hold their securities through one or more trustees, brokers, agents, legal representatives or other intermediaries, or through companies in which they have a “controlling interest,” which means the direct or indirect power to direct the management and policies of the entity.
Financial statements
Grupo Aval is an issuer in Colombia of securities registered with the National Registry of Shares and Issuers (
Registro Nacional de Valores y Emisores
), and in this capacity, it is subject to oversight by the Superintendency of Finance. Grupo Aval is a not a financial institution and is not supervised or regulated as a financial institution in Colombia. Grupo Aval is required to comply with corporate governance and periodic reporting requirements to which all issuers are subject, but it is not regulated as a financial institution or as a holding company of banking subsidiaries and, thus, is not required to comply with capital adequacy regulations applicable to banks and other financial institutions. All of our banking subsidiaries (Banco de Bogotá, Banco de Occidente, Banco Popular, Banco AV Villas, and their respective Colombian financial subsidiaries, including Porvenir and Corficolombiana) are entities under the comprehensive supervision of, and subject to inspection and surveillance as financial institutions by, the Superintendency of Finance.
Our consolidated financial statements at December 31, 2011 and 2010 and for each of the years ended December 31, 2011, 2010 and 2009, have been audited, as stated in the report appearing herein, and are included in this annual report and referred to as our audited consolidated financial statements. We have prepared these financial statements and other financial data included herein in accordance with the regulations of the Superintendency of Finance for financial institutions (Resolution 3600 of 1988 and External Circular 100 of 1995) and, on issues not addressed by these regulations,
generally accepted accounting principles prescribed by the Superintendency of Finance for banks to operate in Colombia, or “Colombian GAAP,” consistently applied, together with such regulations, on the filing date, “Colombian Banking GAAP.”
Although we are not a financial institution, we present our consolidated financial statements under Colombian Banking GAAP in this annual report because we believe that presentation on that basis most appropriately reflects our activities as a holding company of a group of banks and other financial institutions. The audited consolidated financial statements have not been reviewed or approved by the Superintendency of Finance; however, consolidated financial statements for each semester, prepared on the basis of Colombian Banking GAAP for each of our subsidiaries (which are the basis for our own consolidated financial statements) are remitted to the Superintendency of Finance for their review. The Colombian Banking GAAP consolidated financial statements included in this annual report differ from the consolidated financial statements published by Grupo Aval in Colombia, which are prepared under Colombian GAAP. Because we are not regulated as a financial institution in Colombia, we are required to prepare our consolidated financial statements for publication in Colombia under Colombian GAAP for companies other than financial institutions (Decree 2649 of 1993 and Circular No. 100-000006 of the Superintendency of Companies (
Superintendencia de Sociedades
) and former Superintendency of Securities (
Superintendencia de Valores
), currently the Superintendency of Finance) No. 011 of 2005, which differs in certain respects from Colombian Banking GAAP. These Colombian GAAP financial statements are presented biannually to our shareholders for approval, are reviewed and published by the Superintendency of Finance and are available in Spanish to the general public on Grupo Aval’s web page. Please see “Item 10. Additional Information––F. Dividends and paying agents—Dividend policy” for a discussion of the main differences between Colombian Banking GAAP and Colombian GAAP. We do not file consolidated financial statements prepared
on the basis of Colombian Banking GAAP with the Superintendency of Finance; however, because we have filed this annual report with the SEC, we may from time to time publish semi-annual or quarterly financial data for subsequent periods on a Colombian Banking GAAP basis. Our Colombian Banking GAAP financial statements will be available on Grupo Aval's webpage only to the extent that they are included in documents filed with, or furnished
to, the SEC.
Colombian Banking GAAP differs in certain significant respects from generally accepted accounting principles in the United States, or U.S. GAAP. Note 30 to our audited consolidated financial statements provides a description of the principal differences between Colombian Banking GAAP and U.S. GAAP as they relate to our audited consolidated financial statements and provides a reconciliation of net income and shareholders’ equity for the years and at the dates indicated herein. Unless otherwise indicated, all financial information of our company included in this annual report is stated on a consolidated basis prepared under Colombian Banking GAAP.
BAC Credomatic acquisition
On July 15, 2010, we entered into a stock purchase agreement with GE Consumer Finance Central Holdings Corp. and General Electric Capital Corporation (collectively, “GE Capital”), to acquire all of the outstanding shares of BAC Credomatic GECF Inc., a company incorporated under the laws of the British Virgin Islands, for U.S.$1.92 billion, subject to certain adjustments. BAC Credomatic is a Central American banking group. We completed the acquisition on December 9, 2010.
See “Item 4. Information on the Company––B. Business overview––BAC Credomatic.”
As a consequence of our acquisition of BAC Credomatic, our results of operations for the years ended December 31, 2011 and 2010 may not be comparable with each other and with prior periods. As permitted by the Superintendency of Finance, we have included a one-month period ended December 31, 2010 of BAC Credomatic financial data in our consolidated results of operations for the year ended December 31, 2010.
In this annual report, we present financial information for BAC Credomatic on a stand-alone basis in accordance with U.S. GAAP. When comparing financial information of BAC Credomatic to other Grupo Aval subsidiaries, we present LB Panama results, prepared under Colombian Banking GAAP, to disclose financial information pertaining to BAC Credomatic in this annual report. LB Panama acquired BAC Credomatic and consolidates its operations under Colombian Banking GAAP; however, LB Panama’s stand-alone operations are immaterial. At December 31, 2011, LB Panama had Ps 2,017.3 billion of goodwill associated with the BAC Credomatic acquisition and Ps 524.5 billion of indebtedness that it incurred to finance, in part, the BAC Credomatic acquisition. Goodwill amortization and interest expense associated with the BAC Credomatic acquisition for the year ended December 31, 2011 were Ps 49.1 billion and Ps 19.4 billion, respectively.
Market share and other information
We obtained the market and competitive position data, including market forecasts, used throughout this annual report from market research, publicly available information and industry publications. We have presented this data on the basis of information from third-party sources that we believe are reliable, including, among others, the International Monetary Fund, or “IMF,” the Superintendency of Finance, the Colombian Stock Exchange, the Colombian National Bureau of Statistics (
Departamento Administrativo Nacional de Estadística
), or “DANE,” the 2010 and 2011 World Bank Development Indicators, the Economist Intelligence Unit and Euromonitor International. Industry and government publications, including those referenced herein, generally state that the information presented has been obtained from sources believed to be reliable, but that the accuracy and completeness of such information is not guaranteed. Unless otherwise indicated, gross domestic product, or “GDP,” figures with respect to Colombia in this annual report are based on the 2005 base year data series published by DANE. Although we have no reason to believe that any of this information or these reports is inaccurate in any material respect, we have not independently verified the competitive position, market share, market size, market growth or other data provided by third parties or by industry or other publications. We do not make any representation or warranty as to the accuracy of such information.
Except where otherwise indicated, our balance sheet and statement of income data included in this annual report reflects consolidated Colombian Banking GAAP information, while comparative disclosures of our financial and operating performance against that of our competitors are based on unconsolidated information prepared on the basis of Colombian Banking GAAP reported to the Superintendency of Finance. Our banking subsidiaries report unconsolidated financial data to the Superintendency of Finance; however, Grupo Aval, as a holding company, is not required to report such data. Unless otherwise indicated or the context otherwise requires, market share and other data comparing our performance and that of our competitors reflects the unconsolidated results of our banking subsidiaries, Porvenir and Corficolombiana. Aggregate Grupo Aval market share data throughout this document pertaining to Grupo Aval reflects the summation of unconsolidated results of our banking subsidiaries. Except where otherwise indicated, financial and market share data pertaining to BAC Credomatic has been prepared on the basis of U.S. GAAP.
Banks, financing companies and finance corporations are deemed credit institutions by the Superintendency of Finance and are the principal institutions authorized to accept deposits and make loans in Colombia. Banks undertake traditional deposit-taking and lending activities. Financing companies place funds in circulation by means of active credit operations, with the purpose of fostering the sale of goods and services, including the development
of leasing operations. Finance corporations invest directly in the economy and thus are the only credit institutions that may invest in non-financial sectors. Banks are permitted to invest in finance corporations.
See “Item 4. Information on the Company––B. Business overview––Supervision and regulation.”
In Colombia, we operate four banks, one financing company and one finance corporation, and our market share is determined by comparing our banks to other banks reporting their results to the Superintendency of Finance; however, if market share data including financing companies and finance corporations is considered, our market shares would generally be lower than in a bank-only comparison, and the gaps between our market shares and those of our competitors would be smaller, but our market leadership in most market categories would be unaffected. We consider our principal competitors in Colombia to be Bancolombia S.A., or “Bancolombia,” Banco Davivienda S.A., or “Davivienda,” and Banco Bilbao Vizcaya Argentaria Colombia S.A., or “BBVA Colombia,” which are the three leading banking groups in Colombia after Grupo Aval.
Other conventions
Certain figures included in this annual report have been subject to rounding adjustments. Accordingly, figures shown as totals in certain tables may not be an arithmetic summation of the figures that precede them. References to “billions” in this annual report are to 1,000,000,000s and to “trillions” are to 1,000,000,000,000s.
“Minority interest” and “non-controlling interest” both refer to the participation of minority shareholders in Grupo Aval and our subsidiaries, as applicable.
This annual report contains estimates and forward-looking statements, principally in “Item 3. Key Information–D. Risk factors,” “Item 4. Information on the Company––B. Business overview” and “Item 5. Operating and Financial Review and Prospects.” Some of the matters discussed concerning our operations and financial performance include estimates and forward-looking statements within the meaning of the Securities Act and the U.S. Securities Exchange Act of 1934, as amended, or the “Exchange Act.”
Our estimates and forward-looking statements are mainly based on our current expectations and estimates on projections of future events and trends, which affect or may affect our businesses and results of operations. Although we believe that these estimates and forward-looking statements are based upon reasonable assumptions, they are subject to several risks and uncertainties and are made in light of information currently available to us. Our estimates and forward-looking statements may be influenced by the following factors, among others:
|
|
·
|
changes in Colombian, Central American, regional and international business and economic, political or other conditions;
|
|
|
·
|
developments affecting Colombian and international capital and financial markets;
|
|
|
·
|
government regulation and tax matters and developments affecting our company and industry;
|
|
|
·
|
increases in defaults by our customers;
|
|
|
·
|
increases in goodwill impairment losses;
|
|
|
·
|
decreases in deposits, customer loss or revenue loss;
|
|
|
·
|
increases in provisions for contingent liabilities;
|
|
|
·
|
our ability to sustain or improve our financial performance;
|
|
|
·
|
increases in inflation rates;
|
|
|
·
|
changes in interest rates which may, among other effects, adversely affect margins and the valuation of our treasury portfolio;
|
|
|
·
|
decreases in the spread between investment yields and implied interest rates in annuities;
|
|
|
·
|
movements in exchange rates;
|
|
|
·
|
competition in the banking and financial services, credit card services, insurance, asset management, pension fund administration and related industries;
|
|
|
·
|
adequacy of risk management procedures and credit, market and other risks of lending and investment activities;
|
|
|
·
|
decreases in our level of capitalization;
|
|
|
·
|
changes in market values of Colombian and Central American securities, particularly Colombian government securities;
|
|
|
·
|
adverse legal or regulatory disputes or proceedings;
|
|
|
·
|
internal security issues affecting countries where we will operate and natural disasters;
|
|
|
·
|
loss of key members of our senior management; and
|
|
|
·
|
other risk factors as set forth under “Item 3. Key Information––D. Risk factors.”
|
The words “believe,” “may,” “will,” “estimate,” “continue,” “anticipate,” “intend,” “expect” and similar words are intended to identify estimates and forward-looking statements. Estimates and forward-looking statements speak only at the date they were made, and we undertake no obligation to update or to review any estimate and/or forward-looking statement because of new information, future events or other factors. Estimates and forward-looking statements involve risks and uncertainties and are not guarantees of future performance. Our future results may differ materially from those expressed in these estimates and forward-looking statements. In light of the risks and uncertainties described above, the estimates and forward-looking statements discussed in this annual report might not occur and our future results and our performance may differ materially from those expressed in these forward-looking statements due to, inclusive, but not limited to, the factors mentioned above. Because of these uncertainties, you should not make any investment decision based on these estimates and forward-looking statements.
Not applicable.
Not applicable.
Not applicable.
Not applicable.
Not applicable.
The following financial data of Grupo Aval at December 31, 2011 and 2010 and for the years ended December 31, 2011, 2010, and 2009 have been derived from the audited consolidated financial statements prepared in accordance with Colombian Banking GAAP included in this annual report. The selected financial data at December 31, 2008 and 2007, and for the years ended December 31, 2008 and 2007 have been derived from our audited consolidated financial statements prepared in accordance with Colombian Banking GAAP that are not included in this annual report. Our historical results are not necessarily indicative of results to be expected for future periods.
This financial data should be read in conjunction with our audited consolidated financial statements and the related notes and “Presentation of Financial and Other Information,” and “Item 5. Operating and Financial Review and Prospects” included in this annual report.
Statement of income data
|
Grupo Aval
|
||||||||||||||||||||||||
|
For the year ended December 31,
|
||||||||||||||||||||||||
|
2011
|
2011
|
2010
|
2009
|
2008
|
2007
|
|||||||||||||||||||
|
Colombian Banking GAAP
|
(in U.S.$ millions, except per share information) (1)
|
(In Ps billions, unless otherwise indicated)
|
||||||||||||||||||||||
|
Operating income:
|
||||||||||||||||||||||||
|
Net interest income
|
2,815.1 | 5,468.9 | 4,628.8 | 4,826.0 | 3,715.3 | 2,816.2 | ||||||||||||||||||
|
Total provisions (reversals), net
|
(214.3 | ) | (416.3 | ) | (1,026.9 | ) | (887.6 | ) | (713.5 | ) | (479.5 | ) | ||||||||||||
|
Total fees and other services income, net
|
1,150.1 | 2,234.4 | 1,617.7 | 1,583.5 | 1,393.9 | 1,226.2 | ||||||||||||||||||
|
Total other operating income
|
493.1 | 958.0 | 785.5 | 684.1 | 612.5 | 505.7 | ||||||||||||||||||
|
Total operating income
|
4,244.1 | 8,244.9 | 6,005.1 | 6,205.9 | 5,008.2 | 4,068.6 | ||||||||||||||||||
|
Total operating expenses
|
(2,539.2 | ) | (4,932.9 | ) | (3,520.0 | ) | (3,292.4 | ) | (3,027.9 | ) | (2,674.2 | ) | ||||||||||||
|
Net operating income
|
1,704.8 | 3,312.0 | 2,485.1 | 2,913.5 | 1,980.3 | 1,394.4 | ||||||||||||||||||
|
Grupo Aval
|
||||||||||||||||||||||||
|
For the year ended December 31,
|
||||||||||||||||||||||||
|
2011
|
2011
|
2010
|
2009
|
2008
|
2007
|
|||||||||||||||||||
|
Colombian Banking GAAP
|
(in U.S.$ millions, except per share information) (1)
|
(In Ps billions, unless otherwise indicated)
|
||||||||||||||||||||||
|
Non-operating income (expense):
|
||||||||||||||||||||||||
|
Other income
|
165.1 | 320.7 | 364.6 | 367.4 | 290.3 | 359.8 | ||||||||||||||||||
|
Other expense
|
(64.1 | ) | (124.5 | ) | (187.6 | ) | (299.7 | ) | (164.9 | ) | (144.5 | ) | ||||||||||||
|
Total non-operating income (expense), net
|
101.0 | 196.2 | 176.9 | 67.7 | 125.4 | 215.3 | ||||||||||||||||||
|
Income before income tax expense and non-controlling interest
|
1,805.8 | 3,508.2 | 2,662.1 | 2,981.2 | 2,105.8 | 1,609.7 | ||||||||||||||||||
|
Income tax expense
|
(585.1 | ) | (1,136.7 | ) | (831.0 | ) | (864.3 | ) | (677.3 | ) | (464.8 | ) | ||||||||||||
|
Income before non-controlling interest
|
1,220.7 | 2,371.5 | 1,831.1 | 2,116.9 | 1,428.4 | 1,144.9 | ||||||||||||||||||
|
Non-controlling interest
|
(556.1 | ) | (1,080.2 | ) | (874.2 | ) | (1,051.5 | ) | (671.3 | ) | (520.4 | ) | ||||||||||||
|
Net income attributable to Grupo Aval shareholders
|
664.7 | 1,291.2 | 956.9 | 1,065.4 | 757.1 | 624.5 | ||||||||||||||||||
|
Earnings per 1,000 shares (basic and diluted earnings):
|
||||||||||||||||||||||||
|
Common and preferred shares (pesos)
|
— | 79,184.3 | 68,621.0 | 76,448.0 | 54,368.0 | 46,064.7 | ||||||||||||||||||
|
Common and preferred shares (U.S.
dollars) (1)
|
— | 40.8 | 35.9 | 37.4 | 24.2 | 22.9 | ||||||||||||||||||
|
Dividends and interest on capital per 1,000 shares (2):
|
||||||||||||||||||||||||
|
Common and preferred shares (pesos)
|
— | 48,465.3 | 37,800.0 | 33,240.0 | 30,000.0 | 26,580.0 | ||||||||||||||||||
|
Common and preferred shares (U.S.
dollars) (1)
|
— | 24.9 | 19.7 | 16.3 | 13.4 | 13.2 | ||||||||||||||||||
|
Weighted average number of common and preferred fully paid shares outstanding (basic and diluted):
|
||||||||||||||||||||||||
|
Outstanding shares
|
— | 16,306,613.4 | 13,943,980.7 | 13,935,966.1 | 13,925,515.2 | 13,556,944.3 | ||||||||||||||||||
|
U.S. GAAP (3)
|
||||||||||||||||||||||||
|
Net income attributable to controlling interest under U.S. GAAP
|
— | 885.3 | 965.3 | 934.5 | 807.1 | — | ||||||||||||||||||
|
Basic and diluted net income per 1,000 shares
|
||||||||||||||||||||||||
|
Outstanding shares
(pesos)
|
— | 54,293.4 | 69,228.4 | 67,060.2 | 57,956.8 | — | ||||||||||||||||||
|
Outstanding shares
(U.S. dollars) (1)
|
— | 27.9 | 36.2 | 32.8 | 25.8 | — | ||||||||||||||||||
|
(1)
|
Translated for convenience only using the representative market rate as computed and certified by the Superintendency of Finance at December 31, 2011 of Ps 1,942.70 per U.S.$1.00.
|
|
(2)
|
Dividends are declared semi-annually in March (for the six-month period ended December 31 of the previous year) and September (for the six-month period ended June 30 of the current year) of each year. We do not declare dividends on a quarterly basis.
|
|
(3)
|
See note 30 to our audited consolidated financial statements included in this annual report for reconciliations to U.S. GAAP.
|
Balance sheet data
|
Grupo Aval
|
||||||||||||||||||||||||
|
At December 31,
|
||||||||||||||||||||||||
|
2011
|
2011
|
2010
|
2009
|
2008
|
2007
|
|||||||||||||||||||
|
Colombian Banking GAAP
|
(in U.S.$ millions, unless otherwise indicated) (1)
|
(In Ps billions, unless otherwise indicated)
|
||||||||||||||||||||||
|
Assets:
|
||||||||||||||||||||||||
|
Total cash and cash equivalents
|
6,021.8 | 11,698.6 | 9,682.6 | 7,370.9 | 6,621.3 | 5,071.7 | ||||||||||||||||||
|
Total investment securities, net
|
9,767.5 | 18,975.2 | 19,174.9 | 16,587.3 | 11,427.7 | 10,759.9 | ||||||||||||||||||
|
Total loans and financial leases, net
|
34,818.2 | 67,641.2 | 56,439.7 | 40,015.6 | 38,518.3 | 32,623.4 | ||||||||||||||||||
|
Total interest accrued on loans and financial leases, net
|
300.4 | 583.5 | 448.2 | 406.1 | 556.0 | 434.3 | ||||||||||||||||||
|
Bankers’ acceptances, spot transactions and derivatives
|
215.6 | 418.8 | 306.9 | 78.8 | 87.8 | 58.9 | ||||||||||||||||||
|
Accounts receivable, net
|
830.2 | 1,612.9 | 1,337.3 | 783.1 | 751.2 | 694.5 | ||||||||||||||||||
|
Property, plant and equipment, net
|
906.6 | 1,761.3 | 1,643.7 | 1,096.5 | 956.7 | 936.2 | ||||||||||||||||||
|
Operating leases, net
|
166.4 | 323.2 | 263.9 | 282.5 | 255.7 | 229.6 | ||||||||||||||||||
|
Foreclosed assets, net
|
40.0 | 77.8 | 85.5 | 48.0 | 42.6 | 52.6 | ||||||||||||||||||
|
Prepaid expenses and deferred charges
|
1,007.0 | 1,956.2 | 920.7 | 611.6 | 521.1 | 504.9 | ||||||||||||||||||
|
Goodwill, net
|
1,601.2 | 3,110.7 | 3,031.4 | 1,020.1 | 1,064.0 | 953.3 | ||||||||||||||||||
|
Other assets, net
|
552.1 | 1,072.6 | 912.0 | 769.5 | 697.6 | 711.3 | ||||||||||||||||||
|
Reappraisal of assets
|
1,168.3 | 2,269.7 | 2,062.5 | 1,923.1 | 1,580.0 | 1,539.5 | ||||||||||||||||||
|
Total assets
|
57,395.3 | 111,501.9 | 96,309.3 | 70,993.1 | 63,079.9 | 54,570.1 | ||||||||||||||||||
|
Liabilities:
|
||||||||||||||||||||||||
|
Total deposits
|
36,551.0 | 71,007.6 | 63,669.3 | 49,348.5 | 45,050.8 | 37,243.8 | ||||||||||||||||||
|
Bankers’ acceptances and derivatives financial instruments
|
241.4 | 469.0 | 309.3 | 41.6 | 64.9 | 37.7 | ||||||||||||||||||
|
Interbank borrowings and overnight funds
|
1,660.1 | 3,225.1 | 2,477.4 | 2,753.7 | 794.8 | 2,459.3 | ||||||||||||||||||
|
Borrowings from banks and others
|
5,887.6 | 11,437.8 | 10,491.2 | 3,854.9 | 5,048.4 | 4,136.3 | ||||||||||||||||||
|
Accounts payable
|
1,592.6 | 3,093.9 | 2,243.5 | 1,518.5 | 1,568.6 | 1,600.2 | ||||||||||||||||||
|
Accrued interest payable
|
161.1 | 313.0 | 247.4 | 269.1 | 381.5 | 266.7 | ||||||||||||||||||
|
Other liabilities
|
745.2 | 1,447.8 | 1,291.9 | 950.7 | 856.1 | 830.7 | ||||||||||||||||||
|
Long-term debt (bonds)
|
3,380.0 | 6,566.2 | 5,952.4 | 3,422.2 | 2,320.3 | 2,000.2 | ||||||||||||||||||
|
Estimated liabilities
|
440.2 | 855.3 | 596.9 | 711.6 | 593.6 | 271.4 | ||||||||||||||||||
|
Non-controlling interest
|
2,536.2 | 4,927.0 | 4,475.5 | 4,038.0 | 3,191.1 | 2,966.4 | ||||||||||||||||||
|
Total liabilities
|
53,195.4 | 103,342.7 | 91,754.7 | 66,908.8 | 59,870.1 | 51,812.7 | ||||||||||||||||||
|
Shareholders’ equity:
|
||||||||||||||||||||||||
|
Subscribed and paid-in capital:
|
||||||||||||||||||||||||
|
Common shares
|
9.5 | 18.6 | 13.9 | 13.9 | 13.9 | 13.9 | ||||||||||||||||||
|
Additional paid-in capital
|
1,889.7 | 3,671.1 | 647.4 | 647.4 | 637.9 | 623.9 | ||||||||||||||||||
|
Retained earnings:
|
||||||||||||||||||||||||
|
Appropriated
|
1,200.4 | 2,332.0 | 1,930.3 | 1,266.0 | 878.5 | 587.9 | ||||||||||||||||||
|
Unappropriated
|
344.4 | 669.0 | 483.3 | 679.7 | 441.0 | 373.7 | ||||||||||||||||||
|
Equity surplus:
|
||||||||||||||||||||||||
|
Equity inflation adjustments
|
381.9 | 741.9 | 742.1 | 743.2 | 746.7 | 752.1 | ||||||||||||||||||
|
Unrealized gains (losses) on investment securities available for sale
|
(150.8 | ) | (293.0 | ) | 29.7 | 18.3 | (90.3 | ) | (124.1 | ) | ||||||||||||||
|
Reappraisal of assets
|
524.8 | 1,019.6 | 707.8 | 715.7 | 581.9 | 530.1 | ||||||||||||||||||
|
Total shareholders’ equity
|
4,199.9 | 8,159.1 | 4,554.6 | 4,084.3 | 3,209.7 | 2,757.5 | ||||||||||||||||||
|
Total liabilities and shareholders’ equity
|
57,395.3 | 111,501.9 | 96,309.3 | 70,993.1 | 63,079.9 | 54,570.1 | ||||||||||||||||||
|
U.S. GAAP (2)
|
||||||||||||||||||||||||
|
Controlling interest shareholders’ equity under U.S. GAAP
|
3,328.7 | 6,466.7 | 3,949.5 | 3,285.7 | 2,563.2 | — | ||||||||||||||||||
|
Controlling interest shareholders’ equity under U.S. GAAP per 1,000 shares
|
204,132.2 | 396,567.6 | 283,242.4 | 235,770.8 | 184,061.6 | — | ||||||||||||||||||
|
(1)
|
Translated for convenience only using the representative market rate as computed and certified by the Superintendency of Finance at December 31, 2011 of Ps 1,942.70 per U.S.$1.00.
|
|
(2)
|
See note 30 to our audited consolidated financial statements included in this annual report for reconciliations to U.S. GAAP.
|
Other financial and operating data
|
Grupo Aval
|
||||||||||||||||||||
|
At and for the year ended December 31,
|
||||||||||||||||||||
|
Colombian Banking GAAP
|
2011
|
2010
|
2009
|
2008
|
2007
|
|||||||||||||||
|
(in percentages, unless otherwise indicated)
|
||||||||||||||||||||
|
Profitability ratios:
|
||||||||||||||||||||
|
Net interest margin (1)
|
6.5 | 7.2 | 8.8 | 7.8 | 6.9 | |||||||||||||||
|
ROAA (2)
|
2.3 | 2.2 | 3.2 | 2.4 | 2.2 | |||||||||||||||
|
ROAE (3)
|
20.3 | 22.2 | 29.2 | 25.4 | 25.8 | |||||||||||||||
|
Efficiency ratio:
|
||||||||||||||||||||
|
Operating expenses before depreciation and amortization / total operating income before net provisions (4)
|
52.7 | 46.6 | 42.9 | 49.0 | 54.2 | |||||||||||||||
|
Capital ratios:
|
||||||||||||||||||||
|
Period-end shareholders’ equity and non-controlling interest as a percentage of period-end total assets
|
11.7 | 9.4 | 11.4 | 10.1 | 10.5 | |||||||||||||||
|
Tangible equity ratio (5)
|
9.2 | 6.4 | 10.1 | 8.6 | 8.9 | |||||||||||||||
|
Credit quality data:
|
||||||||||||||||||||
|
Non-performing loans as a percentage of total loans (6)
|
1.6 | 1.9 | 2.7 | 2.4 | 1.9 | |||||||||||||||
|
Delinquency ratio past due more than 30 days
|
2.2 | 2.7 | 3.6 | 3.6 | 3.0 | |||||||||||||||
|
“C,” “D” and “E” loans as a percentage of total loans (7)
|
3.2 | 3.9 | 4.8 | 4.0 | 3.4 | |||||||||||||||
|
Allowance for loans as a percentage of non-performing loans
|
200.6 | 194.0 | 169.3 | 170.1 | 203.5 | |||||||||||||||
|
Allowance for loans as a percentage of past due loans
|
150.0 | 139.1 | 124.5 | 112.9 | 126.2 | |||||||||||||||
|
Allowance for loans as a percentage of “C,” “D” and “E” loans
|
103.8 | 96.2 | 94.1 | 100.5 | 109.7 | |||||||||||||||
|
Allowance for loans as a percentage of total loans
|
3.3 | 3.7 | 4.5 | 4.0 | 3.8 | |||||||||||||||
|
Operational data (in units):
|
||||||||||||||||||||
|
Number of customers of the banks (8)
|
9,596,694 | 8,700,266 | 6,532,302 | 6,209,746 | 5,535,058 | |||||||||||||||
|
Number of employees
|
54,463 | 53,485 | 36,976 | 35,510 | 32,256 | |||||||||||||||
|
Number of branches
|
1,491 | 1,438 | 1,180 | 1,142 | 1,077 | |||||||||||||||
|
Number of ATMs
|
3,835 | 3,518 | 2,340 | 2,160 | 2,000 | |||||||||||||||
|
(1)
|
Net interest margin is calculated as net interest income divided by total average interest-earning assets.
|
|
(2)
|
For the years ended December 31, ROAA is calculated as income before non-controlling interest divided by average assets (the sum of total assets at December 31 of the fiscal year and total assets at December 31 of the previous fiscal year, divided by two). For the year ended December 31, 2010, BAC Credomatic’s results are included in 1/12 of our 2010 income but in 1/2 of our average assets due to the consolidation of BAC Credomatic financial data in Grupo Aval’s financial statements from December 1, 2010. Excluding BAC Credomatic’s assets from the calculation, results in an adjusted Grupo Aval ROAA of 2.5%. For a reconciliation of ROAA, see “—Non-GAAP measures reconciliation.”
|
|
|
If average assets were calculated using 13 month period consolidated information, rather than the average at the beginning and end of an annual period, our ROAA would be: 2.3%, 2.4%, and 3.2% for the periods ending December 31, 2011, 2010 and 2009. Excluding BAC Credomatic’s assets results in an adjusted Grupo Aval ROAA of 2.4% at December 31, 2010.
|
|
(3)
|
For the years ended December 31, ROAE is calculated as net income divided by average shareholders’ equity (shareholders’ equity at the end of the period plus shareholders’ equity at the end of the prior period, divided by two).
|
|
|
If average shareholders’ equity were calculated using 13 month period consolidated information, rather than the average at the beginning and end of such period, our ROAE would be as follows: 23.8%, 23.3% and 27.2% for the periods ending December 31, 2011, 2010 and 2009. There is no significant effect to shareholders’ equity at December 31, 2010 resulting from the BAC Credomatic transaction.
|
|
(4)
|
See “—Non-GAAP measures reconciliation.”
|
|
(5)
|
Tangible equity ratio is calculated as shareholders’ equity plus non-controlling interest minus goodwill, divided by total assets minus goodwill. See “—Non-GAAP measures reconciliation.”
|
|
(6)
|
Non-performing loans, are microcredit loans that are 31 days or more past due, mortgage and consumer loans that are 61 days or more past due and commercial loans that are 91 days or more past due. Each category includes financial leases respectively. See “Item 4. Information on the Company—B. Business overview—Selected statistical data—Loan portfolio—Risk categories.”
|
|
(7)
|
See “Item 4. Information on the Company—B. Business overview—Selected statistical data—Loan portfolio—Risk categories.”
|
|
(8)
|
Reflects aggregated customers of our banking subsidiaries. Customers of more than one of our banking subsidiaries are counted separately for each banking subsidiary.
|
Non-GAAP measures reconciliation
The tables in this section and elsewhere in this annual report provide a reconciliation of non-GAAP measures to GAAP measures. For a reconciliation of certain capitalization ratios described in “Item 5. Operating and Financial Review and Prospects—B. Liquidity and capital resources,” see “Item 4. Information on the Company—B. Business overview—Supervision and regulation—Capital adequacy requirements.”
ROAA and ROAE
We believe ROAA, which is calculated as net income before non-controlling interest divided by average assets, provides a more meaningful measure of return on assets than a calculation based on net income over average assets because, although non-controlling interests affect the amount of reported net income, they do not affect the profitability of assets. We believe ROAE, which is calculated as net income divided by average shareholders’ equity, provides a meaningful measure of the return generated for our shareholders.
The following table illustrates ROAA and ROAE for our banking subsidiaries, Grupo Aval (consolidated) and our principal competitors, for the period from 2009 to 2011.
|
Year ended December 31,
|
||||||||||||
|
2011
|
2010
|
2009
|
||||||||||
|
(in Ps billions, except where otherwise indicated)
|
||||||||||||
|
Banco de Bogotá:
|
||||||||||||
|
Average assets(1)
|
64,078 | 47,911 | 34,014 | |||||||||
|
Average equity(3)
|
5,382 | 3,679 | 3,075 | |||||||||
|
Net income
|
1,146 | 915 | 956 | |||||||||
|
Net income divided by average assets
|
1.8 | % | 1.9 | % | 2.8 | % | ||||||
|
Non-controlling interest
|
530 | 483 | 551 | |||||||||
|
ROAA(1)
|
2.6 | % | 2.9 | % | 4.4 | % | ||||||
|
ROAE(3)
|
21.3 | % | 24.9 | % | 31.1 | % | ||||||
|
Non-controlling interest divided by income before non-controlling interest
|
31.6 | % | 34.6 | % | 36.6 | % | ||||||
|
Banco de Occidente:
|
||||||||||||
|
Average assets(1)
|
20,409 | 18,356 | 17,290 | |||||||||
|
Average equity(3)
|
2,799 | 2,263 | 1,674 | |||||||||
|
Net income
|
432 | 386 | 382 | |||||||||
|
Net income divided by average assets
|
2.1 | % | 2.1 | % | 2.2 | % | ||||||
|
Non-controlling interest
|
2 | 2 | 45 | |||||||||
|
ROAA(1)
|
2.1 | % | 2.1 | % | 2.5 | % | ||||||
|
ROAE(3)
|
15.4 | % | 17.1 | % | 22.8 | % | ||||||
|
Non-controlling interest divided by income before non-controlling interest
|
0.4 | % | 0.5 | % | 10.5 | % | ||||||
|
Year ended December 31,
|
||||||||||||
|
2011
|
2010
|
2009
|
||||||||||
|
(in Ps billions, except where otherwise indicated)
|
||||||||||||
|
Banco Popular:
|
||||||||||||
|
Average assets(1)
|
13,487 | 11,937 | 10,625 | |||||||||
|
Average equity(3)
|
1,789 | 1,516 | 1,147 | |||||||||
|
Net income
|
372 | 362 | 304 | |||||||||
|
Net income divided by average assets
|
2.8 | % | 3.0 | % | 2.9 | % | ||||||
|
Non-controlling interest
|
5 | 4 | 2 | |||||||||
|
ROAA(1)
|
2.8 | % | 3.1 | % | 2.9 | % | ||||||
|
ROAE(3)
|
20.8 | % | 23.8 | % | 26.5 | % | ||||||
|
Non-controlling interest divided by income before non-controlling interest
|
1.3 | % | 1.0 | % | 0.7 | % | ||||||
|
Banco AV Villas:
|
||||||||||||
|
Average assets(1)
|
7,288 | 6,504 | 5,614 | |||||||||
|
Average equity(3)
|
886 | 786 | 700 | |||||||||
|
Net income
|
165 | 144 | 111 | |||||||||
|
Net income divided by average assets
|
2.3 | % | 2.2 | % | 2.0 | % | ||||||
|
Non-controlling interest
|
0 | 0 | 0 | |||||||||
|
ROAA(1)
|
2.3 | % | 2.2 | % | 2.0 | % | ||||||
|
ROAE(3)
|
18.6 | % | 18.4 | % | 15.8 | % | ||||||
|
Non-controlling interest divided by income before non-controlling interest
|
0.1 | % | 0.3 | % | 0.4 | % | ||||||
|
Grupo Aval (consolidated):
|
||||||||||||
|
Average assets(1)
|
103,906 | 83,651 | 67,036 | |||||||||
|
Average equity(3)
|
6,357 | 4,319 | 3,647 | |||||||||
|
Net income
|
1,291 | 957 | 1,065 | |||||||||
|
Net income divided by average assets
|
1.2 | % | 1.1 | % | 1.6 | % | ||||||
|
Non-controlling interest
|
1,080 | 874 | 1,051 | |||||||||
|
ROAA(1)(2)
|
2.3 | % | 2.2 | % | 3.2 | % | ||||||
|
ROAE(3)
|
20.3 | % | 22.2 | % | 29.2 | % | ||||||
|
Non-controlling interest divided by income before non-controlling interest
|
45.6 | % | 47.7 | % | 49.7 | % | ||||||
|
Bancolombia:
|
||||||||||||
|
Average assets(1)
|
76,779 | 64,980 | 61,824 | |||||||||
|
Average equity(3)
|
8,470 | 7,490 | 6,575 | |||||||||
|
Net income
|
1,664 | 1,436 | 1,257 | |||||||||
|
Net income divided by average assets
|
2.2 | % | 2.2 | % | 2.0 | % | ||||||
|
Non-controlling interest
|
11 | 13 | 15 | |||||||||
|
ROAA(1)
|
2.2 | % | 2.2 | % | 2.1 | % | ||||||
|
ROAE(3)
|
19.6 | % | 19.2 | % | 19.1 | % | ||||||
|
Non-controlling interest divided by income before non-controlling interest
|
0.7 | % | 0.9 | % | 1.2 | % | ||||||
|
Year ended December 31,
|
||||||||||||
|
2011
|
2010
|
2009
|
||||||||||
|
(in Ps billions, except where otherwise indicated)
|
||||||||||||
|
Davivienda:
|
||||||||||||
|
Average assets(1)
|
33,134 | 27,884 | 24,496 | |||||||||
|
Average equity(3)
|
4,182 | 3,133 | 2,483 | |||||||||
|
Net income
|
630 | 579 | 461 | |||||||||
|
Net income divided by average assets
|
1.9 | % | 2.1 | % | 1.9 | % | ||||||
|
Non-controlling interest(4)
|
8 | 6 | 9 | |||||||||
|
ROAA(1)
|
1.9 | % | 2.1 | % | 1.9 | % | ||||||
|
ROAE(3)
|
15.1 | % | 18.5 | % | 18.6 | % | ||||||
|
Non-controlling interest divided by income before non-controlling interest(4)
|
1.2 | % | 1.0 | % | 1.8 | % | ||||||
|
BBVA Colombia:
|
||||||||||||
|
Average assets(1)
|
24,103 | 20,559 | 19,657 | |||||||||
|
Average equity(3)
|
2,409 | 2,138 | 1,899 | |||||||||
|
Net income
|
486 | 424 | 377 | |||||||||
|
Net income divided by average assets
|
2.0 | % | 2.1 | % | 1.9 | % | ||||||
|
Non-controlling interest
|
1 | 1 | 1 | |||||||||
|
ROAA(1)
|
2.0 | % | 2.1 | % | 1.9 | % | ||||||
|
ROAE(3)
|
20.2 | % | 19.8 | % | 19.9 | % | ||||||
|
Non-controlling interest divided by income before non-controlling interest
|
0.2 | % | 0.2 | % | 0.2 | % | ||||||
|
(1)
|
For methodology used to calculate ROAA, see note (2) to the table under “Item 3. Key Information—A. Selected financial data—Other financial and operating data.”
|
|
(2)
|
Excluding BAC financial data, Grupo Aval’s ROAA at December 31, 2010 is calculated below.
|
|
Year ended
December 31, 2010
|
||||
|
Grupo Aval
|
||||
|
Average adjusted assets(1)
|
74,574.0 | |||
|
Net income
|
956.9 | |||
|
Net income divided by average adjusted assets
|
1.3 | % | ||
|
Income attributable to non-controlling interest
|
874.2 | |||
|
ROAA(1)
|
2.5 | % | ||
|
Income attributable to non-controlling interest divided by income before non-controlling interest
|
47.7 | % | ||
|
(3)
|
For methodology used to calculate ROAE, see note (3) to the table under “Item 3. Key Information—A. Selected financial data—Other financial and operating data.”
|
The following table illustrates ROAA and ROAE using 13-month period-end data for average assets and equity for Grupo Aval and its banking subsidiaries for the periods indicated.
|
Year ended December 31,
|
||||||||||||
|
2011
|
2010
|
2009
|
||||||||||
|
(in Ps billions, except where otherwise indicated)
|
||||||||||||
|
Grupo Aval (consolidated):
|
||||||||||||
|
Average assets(1)
|
102,576.0 | 76,622.5 | 66,863.8 | |||||||||
|
Average equity(3)
|
5,429.8 | 4,112.7 | 3,920.5 | |||||||||
|
Net income
|
1,291.2 | 956.9 | 1,065.4 | |||||||||
|
Net income divided by average assets
|
1.3 | % | 1.2 | % | 1.6 | % | ||||||
|
Non-controlling interest
|
1,080.2 | 874.2 | 1,051.5 | |||||||||
|
ROAA(1)(2)
|
2.3 | % | 2.4 | % | 3.2 | % | ||||||
|
ROAE(3)
|
23.8 | % | 23.3 | % | 27.2 | % | ||||||
|
Non-controlling interest divided by income before non-controlling interest
|
45.6 | % | 47.7 | % | 49.7 | % | ||||||
|
(1)
|
For methodology used to calculate ROAA, see note (2) to the table under “Item 3. Key Information—A. Selected financial data—Other financial and operating data.”
|
|
(2)
|
Excluding BAC financial data, Grupo Aval’s ROAA at December 31, 2010 is presented below.
|
|
Year ended
December 31, 2010
|
||||
|
Grupo Aval
|
||||
|
Average adjusted assets(1)
|
75,212.2 | |||
|
Net income
|
956.9 | |||
|
Net income divided by average assets
|
1.3 | % | ||
|
Income attributable to non-controlling interest
|
874.2 | |||
|
ROAA(1)
|
2.4 | % | ||
|
Income attributable to non-controlling interest divided by income before non-controlling interest
|
47.7 | % | ||
|
(3)
|
For methodology used to calculate ROAE, see note (3) to the table under “Item 3. Key Information—A. Selected financial data—Other financial and operating data.”
|
Efficiency ratio
The following table illustrates the efficiency ratio of our banking subsidiaries, Grupo Aval and our principal competitors at December 31, 2011.
|
At December 31, 2011
|
||||||||||||||||||||||||||||||||
|
Banco de Bogotá
|
Banco de Occidente
|
Banco Popular
|
Banco AV Villas
|
Grupo Aval consolidated
|
Bancolombia
|
Davivienda
|
BBVA Colombia
|
|||||||||||||||||||||||||
|
(in Ps billions)
|
||||||||||||||||||||||||||||||||
|
Total operating expenses
|
2,968 | 846 | 623 | 436 | 4,933 | 3,606 | – | 961 | ||||||||||||||||||||||||
|
Depreciation
|
116 | 118 | 23 | 20 | 277 | 223 | – | 45 | ||||||||||||||||||||||||
|
Goodwill amortizations
|
75 | 1 | – | – | 93 | 51 | – | 52 | ||||||||||||||||||||||||
|
Operating expenses before depreciation and amortization
|
2,777 | 727 | 600 | 416 | 4,564 | 3,332 | 1,429 | 865 | ||||||||||||||||||||||||
|
Total operating income
|
5,313 | 1,403 | 1,121 | 670 | 8,245 | 5,665 | – | – | ||||||||||||||||||||||||
|
Provisions, net
|
139 | 177 | 67 | 33 | 416 | 599 | – | – | ||||||||||||||||||||||||
|
Operating income before provisions
|
5,452 | 1,580 | 1,188 | 703 | 8,661 | 6,263 | 3,030 | 1,732 | ||||||||||||||||||||||||
|
Efficiency ratio (1)
|
50.9 | % | 46.0 | % | 50.5 | % | 59.2 | % | 52.7 | % | 53.2 | % | 47.2 | % | 49.9 | % | ||||||||||||||||
|
(1)
|
Efficiency ratio is calculated as operating expenses before depreciation and amortization divided by operating income before net provisions.
|
Tangible equity ratio
The following table illustrates the tangible equity ratio of our subsidiaries, the aggregate of our subsidiaries, Grupo Aval and our principal competitors at December 31, 2011.
|
At December 31, 2011
|
||||||||||||||||||||||||||||||||||||
|
Grupo Aval entities
|
||||||||||||||||||||||||||||||||||||
|
Banco de Bogotá
|
Banco de Occidente
|
Banco Popular
|
Banco AV Villas
|
Grupo Aval aggregate
|
Grupo Aval consolidated
|
Bancolombia
|
Davivienda
|
BBVA Colombia (2)
|
||||||||||||||||||||||||||||
|
(in Ps billions)
|
||||||||||||||||||||||||||||||||||||
|
Shareholders' equity
|
6,846 | 3,015 | 1,883 | 935 | 12,679 | 8,159 | 8,993 | 4,795 | 2,564 | |||||||||||||||||||||||||||
|
Non controlling interest
|
2,457 | 7 | 49 | 4 | 2,517 | 4,927 | 73 | 33 | 4 | |||||||||||||||||||||||||||
|
Total assets
|
68,810 | 22,180 | 14,251 | 7,618 | 112,859 | 111,502 | 85,463 | 36,658 | 26,109 | |||||||||||||||||||||||||||
|
Shareholders' equity + Non controlling
interest / Assets
|
13.5 | % | 13.6 | % | 13.6 | % | 12.3 | % | 13.5 | % | 11.7 | % | 10.6 | % | 13.2 | % | 9.8 | % | ||||||||||||||||||
|
Goodwill
|
2,660 | 26 | – | – | 2,686 | 3,111 | 680 | 1,182 | 432 | |||||||||||||||||||||||||||
|
Shareholders' equity + Non controlling interest – Goodwill
|
6,643 | 2,997 | 1,933 | 938 | 12,510 | 9,975 | 8,387 | 3,647 | 2,137 | |||||||||||||||||||||||||||
|
Total assets – Goodwill
|
66,150 | 22,154 | 14,251 | 7,618 | 110,174 | 108,391 | 84,783 | 35,476 | 25,677 | |||||||||||||||||||||||||||
|
Tangible equity
ratio (1)
|
10.0 | % | 13.5 | % | 13.6 | % | 12.3 | % | 11.4 | % | 9.2 | % | 9.9 | % | 10.3 | % | 8.3 | % | ||||||||||||||||||
|
(1)
|
Tangible equity ratio is calculated as shareholders' equity plus non-controlling interest minus goodwill, divided by total assets minus goodwill.
|
Exchange rates
The Colombian foreign exchange system allows the purchase and sale of foreign currency and the international transfer of pesos by any person or legal entity, regardless of the amount, subject to certain regulatory procedures.
The Superintendency of Finance calculates the representative market rate based on the weighted averages of the buy/sell foreign exchange rates quoted daily by certain financial institutions, including certain of our banking subsidiaries, for the purchase and sale of U.S. dollars. On April 25, 2012, the representative market rate was Ps 1,767.91 per U.S.$1.00, and on December 31, 2011, the representative market rate was Ps 1,942.7 per U.S.$1.00. The Federal Reserve Bank of New York does not report a noon buying rate for pesos/ U.S. dollars.
The following table presents the monthly high and low representative market rate during the months indicated.
|
Recent exchange rates of peso per U.S. dollar
|
Low
|
High
|
||||||
|
Month:
|
||||||||
|
November 2011
|
1,871.49 | 1,967.18 | ||||||
|
December 2011
|
1,920.16 | 1,949.56 | ||||||
|
January 2012
|
1,801.88 | 1,942.70 | ||||||
|
February 2012
|
1,767.83 | 1,805.98 | ||||||
|
March 2012
|
1,758.03 | 1,792.07 | ||||||
|
April 2012 (through April 25, 2012)
|
1,767.84 | 1,793.30 | ||||||
The following table presents the average peso/ U.S. dollar representative market rate for each of the five most recent years, calculated by using the average of the exchange rates on the last day of each month during the period, and the representative year-end market rate for each of the five most recent years.
|
Peso/ U.S.$1.00
representative market rate
|
Average
|
Year-end
|
||||||
|
Period:
|
||||||||
|
2007
|
2,076.57 | 2,014.76 | ||||||
|
2008
|
1,989.35 | 2,243.59 | ||||||
|
2009
|
2,180.19 | 2,044.23 | ||||||
|
2010
|
1,902.50 | 1,913.98 | ||||||
|
2011
|
1,854.02 | 1,942.70 | ||||||
Exchange rate fluctuation will affect the U.S. dollar value of any distributions we make with respect to our shares of preferred stock. See “—D. Risk factors—Risks relating to our preferred shares.”
Not applicable.
Not applicable.
Our business, financial condition and results of operations could be materially and adversely affected if any of the risks described below occur. As a result, the market price of our preferred shares could decline, and you could lose all or part of your investment. We may face additional risks and uncertainties that are not presently known to us, or that we currently deem immaterial, which may also impair our business.
Risks relating to Colombia and other countries in which we operate
Adverse economic and political conditions in Colombia and other countries in which we operate, including the Central American region, may have an adverse effect on our results of operations and financial condition.
Our principal subsidiaries in Colombia are financial institutions (four commercial banks, a pension and severance fund administrator and a merchant bank), and a substantial majority of our operations, properties and customers are located in Colombia. As a consequence, our results of operations and financial condition are materially affected by economic and political conditions in this country.
Colombia is subject to economic, political and other uncertainties, including changes in monetary, exchange control and trade policies that could affect the overall business environment in Colombia, which would, in turn, affect our results of operations and financial condition. For example, the Colombian Central Bank could sharply raise or lower interest rates, which could negatively affect our net interest income and asset quality and also restrict our growth. Extreme variations in exchange rates could also negatively affect the foreign currency position of our borrowers. Any of these events could have an adverse effect on our results of operations and financial condition.
Decreases in the growth rate of the Colombian economy, periods of negative growth, or material increases in inflation or interest rates could result in lower demand for, or affect the pricing of, our services and products. Because a large percentage of the costs and expenses of our subsidiaries is fixed, we may not be able to reduce costs and expenses upon the occurrence of any of these events, in which case our profitability could be affected.
In the case of our pension and severance fund business, economic conditions may affect the businesses and financial capacity of employers, which might result in a drop in employee-contributor head counts or decrease the ability of employers to create new jobs or increase employee incomes.
BAC Credomatic’s results of operations and financial condition depend on economic, political and social conditions in the countries where BAC Credomatic operates, mainly in Central America. The political, economic and social environments in such countries are affected by many different factors, including significant governmental influence over local economies, substantial fluctuations in economic growth, high levels of inflation, exchange rate movements, exchange controls or restrictions on expatriation of earnings, high domestic interest rates, drug trafficking and other forms of organized crime, wage and price controls, changes in tax policies, imposition of trade barriers, and unexpected changes in regulation. BAC Credomatic’s results of operations and financial condition could be affected by changes in economic and other policies of each country’s government, which have exercised and continue to exercise substantial influence over many aspects of the private sector, and by other social and political developments in each such country. During the past several decades, El Salvador, Guatemala, Honduras, Nicaragua and Panama have experienced civil strife and political instability that have included a succession of regimes with differing economic policies and programs. Previous governments have imposed, among other measures, controls on prices, exchange rates, local and foreign investment and international trade, restricted the ability of companies to dismiss employees, expropriated private sector assets and prohibited the remittance of profits to foreign investors.
Adverse economic, political and social developments in Central America may adversely affect demand for banking services and create uncertainty regarding our operating environment, which could have a material adverse effect on BAC Credomatic and, consequently, our company. In addition, changes in political administrations may result in changes in governmental policy, which could affect BAC Credomatic or our business.
The Colombian and Central American economies remain vulnerable to external shocks.
A significant decline in economic growth of any of Colombia’s or Central America’s major trading partners—in particular, the United States, China, Ecuador and Venezuela—could have a material adverse effect on each country’s balance of trade and economic growth. In addition, a “contagion” effect, under which an entire region or class of investments becomes less attractive to, or subject to outflows of funds by, international investors could negatively affect Colombia or Central American countries. Lower economic growth may result in asset quality deterioration and could negatively affect our business.
Pension funds, such as those managed by Porvenir, are global investors and thus are affected by regional and global economic factors. Lower economic growth of Colombia’s major trading partners or a contagion effect in the region or globally may lead to lower pension fund returns, which may, in turn, result in decreases in assets under management and impair our businesses or financial condition. In recent years, pension fund returns have been subject to increased volatility in international financial markets. Foreign investments represented 11.1% and 10.2%, respectively, of Porvenir’s total assets under management at December 31, 2011 and 2010.
The recent global economic and financial crisis, which began in the U.S. financial system and spread to different economic sectors and countries around the world, has had negative effects on the Colombian economy and the economies of Central American countries. During 2009, the economies of the United States and some European countries contracted, which, in turn, affected the Colombian and Central American economies. Although there have recently been signs of recovery in the global economy, this recovery may be fragile and also may reflect temporary benefits from government stimulus programs that may not be sustained. Moreover, in recent months, several European Union members have been obliged to reduce their public expenditures due to their high indebtedness rates, which has negatively affected the Eurozone’s economy. The ability of certain countries, such as Greece, Italy, Portugal and Spain, and companies in those countries and in the Eurozone to repay their debt obligations remains uncertain. In addition, certain events, such as the outbreak of civil and political unrest in several countries in Africa and the Middle East, including Egypt, Libya, Tunisia, Bahrain, Syria and the Ivory Coast, might further strain and affect the global economy and the global financial system.
Even though exports from Colombia have grown at an accelerated rate in recent years, commodity price fluctuations pose a significant challenge to their sustainability. Unemployment continues to be high in Colombia compared to other economies in Latin America. Furthermore, recent political and economic actions in the Latin American region, including Argentina, may negatively affect the perception of the region. We cannot assure you that growth achieved over the past decade in the Colombian economy will continue in future periods.
The long-term effects of the global economic and financial crisis on the international financial system remain uncertain. In addition, the effect on consumer confidence of any actual or perceived deterioration in the Colombian or Central American economies may have a material adverse effect on our results of operations and financial condition.
Colombia has experienced internal security issues that have had or could have a negative effect on the Colombian economy.
Colombia has experienced internal security issues, primarily due to the activities of guerrilla groups such as the Revolutionary Armed Forces of Colombia (
Fuerzas Armadas Revolucionarias de Colombia
), or “FARC,” paramilitary groups and drug cartels. In remote regions of the country, with minimal governmental presence, these groups have exerted influence over the local population and funded their activities by protecting and rendering services to drug traffickers. Even though the Colombian government’s “democratic security” program has reduced guerilla and criminal activity, particularly in the form of terrorism attacks, homicides, kidnappings and extortion, such activities persist in Colombia, and possible escalation of such activities and the effects associated with them have had and may have in the future a negative effect on the Colombian economy and on us, including our customers, employees, results of operations and financial condition.
Tensions with Venezuela and Ecuador may affect the Colombian economy and, consequently, our results of operations and financial condition.
Diplomatic relations with Venezuela and Ecuador, two of Colombia’s main trading partners, have from time to time been tense and affected by events surrounding the Colombian armed forces combat of the FARC throughout Colombia, particularly on Colombia’s borders with Venezuela and Ecuador. Any further deterioration in relations with Venezuela and Ecuador may result in the closing of borders, the imposition of trade barriers or a breakdown of diplomatic ties, any of which could have a negative effect on Colombia’s trade balance, economy and general security situation, which may adversely affect our results of operations and financial condition.
Government policies and actions, and judicial decisions, in Colombia could significantly affect the local economy and, as a result, our results of operations and financial condition.
Our results of operations and financial condition may be adversely affected by changes in Colombian governmental policies and actions, and judicial decisions, involving a broad range of matters, including interest rates, exchange rates, exchange controls, inflation rates, taxation, banking and pension fund regulations and other political or economic developments affecting Colombia. The Colombian government has historically exercised substantial influence over the economy, and its policies are likely to continue to have a significant effect on Colombian companies, including us. The president of Colombia has considerable power to determine governmental policies and actions relating to the economy and may adopt policies that negatively affect us. Future governmental policies and actions, or judicial decisions, could adversely affect our results of operations or financial condition.
New or higher taxes resulting from changes in tax regulations or the interpretation thereof in Colombia could adversely affect our results of operations and financial condition.
New tax laws and regulations, and uncertainties with respect to future tax policies, pose risks to us. In recent years, Colombian tax authorities have imposed additional taxes in a variety of areas, such as taxes on financial transactions and taxes to fund Colombia’s war against terrorism. Changes in tax-related laws and regulations, and interpretations thereof, can affect tax burdens by increasing tax rates and fees, creating new taxes, limiting tax deductions, and eliminating tax-based incentives and non-taxed income. In addition, tax authorities or courts may interpret tax regulations differently from how we do, which could result in tax litigation and associated costs and penalties. In order to avoid double taxation, our Colombian subsidiaries usually distribute dividends from profits that have already been subject to income tax. These dividends are usually not taxable for Grupo Aval in Colombia, and dividends paid by Grupo Aval to its shareholders in Colombia from these sources of income also are usually not taxable, in each case provided that such profits have been taxed at the subsidiary level. This tax treatment may not be maintained in the future, and any change could have a material adverse effect on our results of operations and financial condition.
Natural disasters in Colombia could disrupt our businesses and affect our results of operations and financial condition.
We are exposed to natural disasters in Colombia, such as earthquakes, volcanic eruptions, tornadoes, tropical storms and hurricanes. In recent years, heavy rains in Colombia, attributable in part to the La Niña weather pattern, have resulted in severe flooding and mudslides. La Niña is a recurring weather phenomenon and it may contribute to flooding, mudslides or other natural disasters on an equal or greater scale in the future. In the event of a natural disaster, our disaster recovery plans may prove to be ineffective, which could have a material adverse affect on our ability to conduct our businesses, particularly if such an occurrence affects computer-based data processing, transmission, storage and retrieval systems or destroys customer or other data. In addition, if a significant number of our employees and senior managers were unavailable because of a natural disaster, our ability to conduct our businesses could be compromised. Natural disasters or similar events could also result in substantial volatility in our results of operations for any fiscal quarter or year.
Risks relating to our businesses and industry
Risks relating to our banking business
A decline in asset quality, including the loan portfolios of our banks, may have an adverse effect on our results of operations and financial condition.
Changes in the financial condition or credit profiles of customers of our banking subsidiaries and increases in inflation or interest rates could have a negative effect on the quality of our banks’ loan portfolios, causing them to increase loan loss provisions and resulting in reduced profitability. In particular, the level of non-performing loans may increase in the future as a result of factors beyond our control, such as economic conditions and political events affecting Colombia generally or specific sectors of the economy.
A substantial number of our banks’ customers consist of individuals and small- and medium-sized enterprises, or “SMEs,” and these customers are more likely to be adversely affected by downturns in the Colombian economy than large corporations and high-income individuals. For example, unemployment directly affects the ability of individuals to obtain and repay consumer and residential mortgage loans. Consequently, our banking subsidiaries may experience higher levels of non-performing loans, which could result in increased loan loss provisions due to defaults by, or deterioration in the credit profiles of, individual borrowers. Non-performing loans and resulting loan losses may increase materially in the future and adversely affect our results of operations and financial condition.
Existing loan loss allowances may not be adequate to cover any increases in non-performing loans or deterioration in the credit quality of loan portfolios. As a result, our banking subsidiaries may be required to increase loan loss provisions, which may adversely affect our results of operations and financial condition.
In addition, there is no precise method for predicting loan and credit losses, such that loan loss allowances may not be sufficient to cover actual losses. If we and our banking subsidiaries are unable to manage the level of non-performing or other poor credit quality loans, our results of operations and financial condition would be materially and adversely affected.
The loan portfolios of our banking subsidiaries have grown substantially in recent years. See “Item 4. Information on the Company––B. Business overview––Selected statistical data.” As default rates generally increase with the age of loans, the level of non-performing loans may lag behind the rate of growth in loans but may increase when growth slows or the loan portfolios become more mature. As a result, historic loan loss experience may not necessarily be indicative of future loan loss experience.
Our banking subsidiaries may be unable to realize on collateral or guarantees securing loans, which may adversely affect our results of operations and financial condition.
Our banking subsidiaries make loans that are secured by collateral, including real estate and other assets that are generally located in Colombia. The value of collateral may significantly fluctuate or decline due to factors beyond our control, including, for example, economic and political conditions in the country. At December 31, 2011, 41.0% of our total past due loans (including our foreign operations) were secured. An economic slowdown may lead to a downturn in the Colombian real estate market, which may, in turn, result in declines in the value of real estate securing loans to levels below the principal balances of these loans. Any decline in the value of the collateral securing loans may result in reduced recoveries from collateral realization and have an adverse effect on our results of operations and financial condition.
Our banking subsidiaries also make loans on the basis of guarantees from relatives, affiliates or associated persons of borrowers. To the extent that guarantors encounter financial difficulties due to economic conditions, personal or business circumstances, or otherwise, the ability of our banks to enforce such guarantees may be impaired.
In addition, our banking subsidiaries may face difficulties in enforcing their rights as secured creditors against borrowers, collateral or guarantees. In particular, timing delays and procedural problems in realizing against collateral, as well as a debtor-protective judicial interpretations of the law, may make it difficult to foreclose on
collateral, realize against guarantees or enforce judgments in our favor, which could materially and adversely affect our results of operations and financial condition.
Insolvency laws in Colombia may limit the ability of our banking subsidiaries to collect monetary obligations and enforce rights against collateral or under guarantees.
Colombian insolvency laws provide that creditors of an insolvent debtor in default are prohibited from initiating collection proceedings outside the bankruptcy or reorganization process of such debtor. In addition, all collection proceedings outstanding at the beginning of the bankruptcy or reorganization process must be suspended and any creditors are prevented from enforcing their rights against the collateral and other assets of the debtor. Law 1380 of 2010 provided insolvency protection to individuals who are not merchants. On September 19, 2011, the Colombian Constitutional Court determined that this law was unconstitutional because of defects in the lawmaking process. On September 20, 2011, a new bill was presented on the same terms as Law 1380 of 2010. If this bill is passed, it would enable an individual to submit monetary obligations to extrajudicial conciliation hearings with the individual’s creditors. The collection of interest on the debt subject to such proceedings would be suspended for a period of 60 days or more. After hearings had been initiated, it would not be possible for any creditor, including our banking subsidiaries, to initiate or continue enforcement actions or collect collateral from the debtor. A perception that loans to individuals may be difficult or impossible to recover could cause our banking subsidiaries to enhance credit requirements and result in decreased lending to individuals by making it more expensive. In addition, increased difficulties in enforcing debt and other monetary obligations due to this new insolvency law could have an adverse effect on our results of operations and financial condition.
Any failure of risk management processes, including credit risk, could materially and adversely affect our banking businesses, results of operations and financial condition.
Credit risk is a principal risk inherent in the business of our banks. Although we have groupwide risk management guidelines, each bank is responsible for its own risk management. Each bank’s policies and procedures, which are designed to identify, monitor and manage risk, may prove to be insufficient. Furthermore, our banks may not be able to upgrade, on a timely basis, risk management systems. For example, the risk management systems utilize an internal credit rating system to assess the risk profile of each customer. As this process involves detailed analyses of the customer’s credit risk, taking into account quantitative and qualitative factors, it is necessarily subject to human error. Personnel of our banking subsidiaries may fail to detect risks before they occur, or may not effectively implement their risk management systems, which may increase exposure to credit risk. As a result, any failure by our banking subsidiaries to effectively implement or consistently follow or refine risk management systems may result in higher risk exposures for our banking subsidiaries, which could materially and adversely affect our results of operations and financial condition.
Declines in the value of our banks’ sovereign debt securities portfolios could have an adverse effect on our results of operations.
Our banks’ debt securities portfolios primarily consist of sovereign debt securities, mainly securities issued or guaranteed by the Colombian government. BAC Credomatic’s debt securities portfolios primarily consist of sovereign debt securities, mainly securities issued or guaranteed by various Central American governments. We are exposed to significant credit, market and liquidity risks associated with sovereign debt. At December 31, 2011 and 2010, debt securities represented 14.6% and 17.9%, respectively, of our consolidated total assets, and approximately 64.0% and 67.5%, respectively, of these securities were issued or backed by the Colombian government. A significant decline in the value of these government securities could materially and adversely affect the debt securities portfolios of our banks and, consequently, our financial condition and results of operations. See “Item 4. Information on the Company––B. Business overview––Supervision and regulation—Mandatory investments.”
We are subject to market risk in our banking business.
Our banks are directly and indirectly affected by changes in market conditions. Market risk, or the risk that the value of assets and liabilities or revenues will be adversely affected by variation in market conditions, is inherent in the products and instruments associated with our operations, including loans, deposits, securities, bonds, long-term debt, short-term borrowings, proprietary trading in assets and liabilities and derivatives. Changes in market
conditions that may affect our financial condition and results of operations include fluctuations in interest and currency exchange rates, securities prices, changes in the implied volatility of interest rates and foreign exchange rates, among others.
We are subject to counterparty risk in our banking business.
Our banks and, to a lesser extent, Porvenir and Corficolombiana are exposed to counterparty risks in addition to credit risks associated with lending activities. Counterparty risk may arise from, for example, investing in securities of third parties, entering into derivative contracts under which counterparties have obligations to make payments to us, or executing securities, futures, currency or commodity trades from proprietary trading activities that fail to settle at the required time due to non-delivery by the counterparty or systems failure by clearing agents, exchanges, clearinghouses or other financial intermediaries. These risks could materially and adversely affect our results of operations and financial condition.
Our banks are subject to market and operational risks associated with derivative transactions.
Our banks and, to a lesser extent, Porvenir and Corficolombiana, enter into derivative transactions primarily for hedging purposes and, on a limited basis, on behalf of customers. They are subject to market and operational risks, including basis risk (the risk of loss associated with variations in the spread between the asset yield and the funding and/or hedge cost) and credit or default risk (the risk of insolvency or other inability of a counterparty to perform its obligations to us).
Market practices and documentation for derivative transactions in Colombia may differ from those in other countries. For example, documentation may not incorporate terms and conditions of derivative transactions as commonly understood in other countries. In addition, the execution and performance of these transactions depend on our banks’ ability to develop adequate control and administration systems, and to hire and retain qualified personnel. Moreover, our banks’ ability to monitor and analyze these transactions depends on their information technology systems. These factors may further increase risks associated with derivative transactions and could materially and adversely affect our results of operations and financial condition.
Our banking subsidiaries are subject to liquidity risk, which may result in increases to funding costs.
The principal sources of funding for our banking subsidiaries are savings accounts, time deposits and checking accounts, that together represented approximately 67.7% and 68.3% of consolidated total liabilities at December 31, 2011 and 2010, respectively. Because our banking subsidiaries rely primarily on short-term deposits for funding, a sudden or unexpected shortage of funds in the banking systems in which we operate and money markets may prevent our banking subsidiaries from meeting their obligations or obtaining necessary funding without incurring higher costs or selling certain assets at prices below prevailing market values, which could materially and adversely affect our results of operations and financial condition.
Default by one or more of our largest borrowers could adversely affect our results of operations and financial condition.
The aggregate outstanding loans to our banks’ ten-largest borrowers represented 6.4% of our consolidated total loan portfolio at December 31, 2011. Default on loans by one or more of these borrowers may adversely affect our results of operations and financial condition.
Downgrades in our credit ratings or in the credit ratings of our banking subsidiaries would increase the cost of, or impair access to, funding.
Our credit ratings and those of our banking subsidiaries are an important component of our and our banking subsidiaries ability to obtain funding. Our banking subsidiaries’ ability to compete successfully in the marketplace for deposits depends on various factors, including their financial stability as reflected by their credit ratings. A downgrade in credit ratings may adversely affect perception of their financial stability and ability to raise deposits. Adverse changes in credit ratings could also increase the cost of raising funds in the capital markets or borrowing funds for our subsidiaries and for us. In addition, lenders and counterparties in derivative transactions are sensitive
to the risk of a rating downgrade. Any downgrade in our credit rating or in any of our banking subsidiaries’ credit ratings could materially and adversely affect our results of operations and financial condition.
Our banking subsidiaries’ loan portfolios are subject to risk of prepayment, which may result in reinvestment of assets on less profitable terms.
The loan portfolios of our banking subsidiaries are subject to prepayment risk, which results from the ability of a borrower to pay a loan prior to maturity. Generally, in a declining interest rate environment, prepayment activity increases with the effect of reducing weighted average lives of interest earning assets and adversely affecting results. Prepayment risk also has an adverse effect on credit card and collateralized mortgage obligations, since prepayments could shorten the weighted average life of these portfolios, which may result in a mismatch in funding or in reinvestment at lower yields.
Changes in banking laws and regulations in Colombia and the other countries in which we operate could adversely affect our consolidated results.
Banking and financial services laws and regulations are subject to ongoing review and revision, including changes in response to global regulatory trends and, more recently, the global economic and financial crisis. In the wake of this crisis, governments have been actively considering new banking laws and regulations, and reviewing and revising existing laws and regulations, particularly in relation to capital adequacy and accounting standards, including Basel III. The adoption of new laws or regulations, or changes in the interpretations or enforcement of existing laws or regulations, may have an adverse effect on our results of operations and financial condition.
Regulatory actions may result in fines, penalties, and restrictions that could materially and adversely affect our businesses and financial performance.
Our banks, as well as Porvenir and Corficolombiana, are subject to regulation and supervision by Colombian financial authorities. These regulatory authorities have broad powers to adopt regulations and other requirements affecting or restricting virtually all aspects of our subsidiaries’ organization and operations, including, for example, the imposition of anti-money laundering measures and the authority to regulate the terms and conditions of credit that can be applied by Colombian banks. Failure to comply with applicable regulations could subject our banking subsidiaries to fines or sanctions or even revocation of licenses or permits to operate their businesses. In the event that any of these subsidiaries encounters significant financial problems, is in danger of insolvency or becomes insolvent, or is otherwise not deemed to be viable, the financial authorities would have broad powers to intervene in their management and operations, including by suspending or removing management and, in extreme circumstances, putting our banks, Porvenir and Corficolombiana, into conservatorship or receivership or taking control of our banks, Porvenir and Corficolombiana. Grupo Aval is required, as an issuer of securities in Colombia, to submit information to the Superintendency of Finance and comply with corporate governance requirements; however, we are not regulated as a financial institution or as a bank holding company, and we are not required to comply with capital adequacy regulations applicable to banks and other financial institutions. We may, however, become subject to more stringent regulation in the event that our status as a non-financial entity is not maintained by Colombian authorities in the future.
We may face legal and other challenges to maximizing revenue from credit card fees and other fees from customers.
As part of their credit card business, our banking subsidiaries face risks relating to the pricing of fees and commissions charged to merchants (merchant discounts) and the pricing of bank interchange fees charged by issuer banks to acquiring banks. Banks and card processors in Colombia have been subject to administrative investigations regarding the fees and commissions that are charged to the merchants by the acquiring banks and in respect to the banking interchange fees.
In the past, the Superintendency of Industry and Commerce (
Superintendencia de Industria y Comercio
) has conducted investigations on the practices of
Asociación Gremial de Instituciones Financieras Credibanco
(Visa franchisee in Colombia) and
Redeban Multicolor S.A.
(MasterCard franchisee in Colombia), the entities chosen by most Colombian banks to manage the credit card system in Colombia, relating to alleged price fixing agreements among Colombian banks relating to fees and commissions charged to merchants. The Superintendency of Industry
and Commerce is currently conducting an investigation into certain Colombian banks, including our Colombian banking subsidiaries, for alleged price fixing of bank interchange fees charged during the period from May 2007 to October 2008.
As a result of these investigations, the fees charged to merchants and bank interchange fees could decrease, which could also lead to changes in commercial strategies that could affect our results of operations and financial condition. We may also be subject to financial penalties in connection with these investigations. In addition, fees charged for other banking services have and may continue to be reduced in the future as a result of regulatory measures and/or pressure from retailers and interest groups.
Failure to protect personal information could adversely affect our reputation and our business.
Our banks manage and hold confidential personal information of customers in the conduct of their banking operations. Although our banks have procedures and controls to safeguard personal information in our possession, unauthorized disclosures or unauthorized access to privileged information, fraud or interfering with regular banking and other services could subject our banks and us to legal actions and administrative sanctions as well as damages. Any failure to protect personal information could result in reputational damage and have an adverse effect on our results of operations and financial condition.
Risks relating to our merchant banking business
Difficult market conditions can adversely affect Corficolombiana’s business.
Corficolombiana may be affected by lower than expected returns on investments, reduced opportunities to realize value from investments, and failure to find suitable investments so as to deploy capital effectively. During periods of difficult market conditions (which may span across one or more industries, sectors or geographies), portfolio companies may experience adverse operating performance, decreased revenues, financial losses, difficulty in obtaining access to financing or increased funding costs. Negative financial performance of portfolio companies may materially and adversely affect Corficolombiana’s results of operations and cash flow. To the extent that the operating performance of those portfolio companies (as well as valuation multiples) does not improve or other portfolio companies experience adverse operating performance, it may sell those assets at values that are less than projected or even at a loss. Portfolio companies may also have difficulties in expanding their businesses and operations or meeting debt service and other obligations as they become due. Furthermore, negative market conditions could potentially result in a portfolio company entering bankruptcy proceedings, thereby potentially resulting in a complete loss of the investment. Although market conditions have recently shown some signs of improvement, economic and market conditions may not continue to improve. Even if such conditions do improve broadly and significantly over the long term, adverse conditions and/or other events in particular sectors may cause our performance to suffer further.
Corficolombiana’s due diligence process for evaluating prospective investments may not identify all risks or ensure investment returns.
Before making investments, Corficolombiana conducts due diligence that it deems reasonable and appropriate based on the facts and circumstances applicable to each investment. When conducting due diligence, it may be required to evaluate important and complex business, financial, tax, accounting, environmental and legal issues. Outside consultants, legal advisors, accountants and investment banks may be involved in the due diligence process to varying degrees depending on the type of investment, but we may be unable to engage these third parties in a timely manner, or at all. Nevertheless, the due diligence investigation carried out by Corficolombiana with respect to any investment opportunity may not reveal or highlight all relevant risks of such investment opportunity. Moreover, such an investigation will not necessarily result in the investment being successful.
A significant part of Corficolombiana’s investments is primarily in relatively illiquid assets, and it may fail to realize any profits from these activities for a considerable period of time or lose some or all of the principal amount of these investments.
At December 31, 2011, approximately 40% of Corficolombiana’s investments was in securities of private companies, for which there often are no readily ascertainable market prices. As a result, there may be limited or no
marketability for these investments, and these investments may decline in value while Corficolombiana is seeking to dispose of them. Because there is significant uncertainty as to the valuation of illiquid investments, the stated values of such investments may not necessarily reflect the values that could actually be realized by Corficolombiana. In addition, in some cases, Corficolombiana may be prevented by contract from selling such securities for a period of time. Corficolombiana’s ability to dispose of investments may also be dependent on factors beyond its control. Thus, investments may only be disposed of over a substantial length of time, exposing the investment returns to risks of declines in market prices during the intended disposition period. Accordingly, under certain conditions, Corficolombiana may be forced either to sell securities at lower prices than it had expected to realize or defer—potentially for a considerable period of time—sales that it had planned to make.
Corficolombiana makes minority investments in companies that it does not control.
Corficolombiana’s investments include non-controlling equity interests, and it may also dispose of a portion of its majority equity investments in portfolio companies over time in a manner that results in Corficolombiana retaining minority investments. Those investments will be subject to the risk that the company in which the investment is made may make business, financial or management decisions with which we do not agree. Similarly, the majority stakeholders or the management of the company may take risks or otherwise act in a manner contrary to our interests. If any of the foregoing were to occur, the values of these investments could decrease or we may not be able to dispose of them, which would adversely affect our results of operations and financial condition.
Most of Corficolombiana’s investments are concentrated in three industries.
At December 31, 2011, approximately 78.8% of Corficolombiana’s investment portfolio were concentrated in the infrastructure, energy and gas, and financial sectors. During periods of difficult market conditions or slowdowns in these sectors, Corficolombiana may experience decreased revenues, difficulty in obtaining access to financing and increased funding costs.
Risks relating to our pension and severance fund management business
Porvenir operates in a highly regulated market, which limits its flexibility to manage its businesses.
Porvenir’s operations are regulated by Law 100 of 1993, the Organic Statute of the Financial System (
Estatuto Orgánico del Sistema Financiero
), or “EOSF,” issued by the Ministry of Finance, Decree 2555 of 2010, or “Decree 2555,” and regulations issued by the Superintendency
of Finance and, to the extent applicable, Colombian Corporation Law. These regulations
limit the range of assets in which pension fund administrators, or “AFPs,” may invest and also set investment limits. In addition, each AFP is legally required to provide a minimum return on investment for each of its pension and severance funds. This minimum return is determined pursuant to specified formulas established in Decree 2555, which vary according to the type of fund. If a fund’s return for any month is lower than the minimum return, the AFP must cover the difference within a period of five days. To do so, the AFP must first apply funds from a stabilization reserve (a portion of the AFP’s capital invested in the fund equal to 1% of the value of each pension fund under management). If the stabilization reserve is insufficient to cover the difference, the AFP must provide resources from its own capital. If the AFP does not have enough resources to cover the difference, the Superintendency of Finance may order the capitalization of the AFP. If, notwithstanding the above, an AFP fails to observe either the minimum return or the stabilization reserve requirements or the order of capitalization, the Superintendency of Finance may take possession (
tomar posesión
) of the AFP, in which case the Colombian Deposit Insurance Fund
(
Fondo
de Garantías de Instituciones Financieras
), or “FOGAFIN,” must supply funds to cover the shortfall. Although Porvenir has never failed to meet the minimum requirement, failure to do so could require us to increase our investment in Porvenir, seek capital from alternative sources or forfeit our investment, or lead to dissolution of the AFP and transfer of the fund to another AFP. If Porvenir is unable to fulfill the minimum return or the stabilization reserve requirements, or if new laws or decrees impose more onerous requirements, Porvenir’s business may be materially adversely affected.
In addition, there are regulatory limitations on the amount of commissions that Porvenir may charge for its services. For example, we may only retain 300 basis points of the 16.0% of the base contribution to a mandatory pension fund, a portion of which (currently 145 basis points) we are required to pay to an insurer for life and
disability coverage. The percentage that we pay for this insurance may increase or decrease depending on market conditions and other factors.
In 2009, the regulatory system began to shift from an obligatory pension system to a multi-funds system, allowing pension funds to be more specifically tailored to the individual needs of customers according to their risk profiles. Regulations related to the establishment of the multi-funds system are continuing to be developed. These regulations or their interpretation by the Ministry of Finance or the Superintendency of Finance may not provide a favorable business environment for Porvenir.
A significant amount of debt securities in pension and severance funds managed by Porvenir is issued or guaranteed by the Colombian government.
Porvenir, like our banks and other participants in the banking industry, is subject to the risk of loss in value of sovereign debt securities. At December 31, 2011, total debt securities of Porvenir represented 63.7% of its total assets, and 66.6% of total debt securities were issued or backed by the Colombian government. A significant decline in the value of the securities issued or guaranteed by the Colombian government could adversely affect the debt securities portfolio of Porvenir and, consequently, our results of operations and financial condition.
Other risks relating to our business
We are subject to fluctuations in interest rates and other market risks, which may materially and adversely affect our results of operations and financial condition.
Market risk refers to the probability of variations in income or in the market value of assets and liabilities due to changes in markets, including variations in market rates of interest and foreign currency exchange rates. Changes in interest rates affect the following areas, among others, of our banks’ businesses: net interest income; the volume of loans originated; market value of securities holdings; asset quality; and gains from sales of loans and securities. We do not manage market risk on a groupwide basis and are not subject to regulation or supervision of market risk on a groupwide basis.
Changes in short-term interest rates may affect interest margins quickly and, therefore, net interest income, which comprises the majority of our revenue. Increases in interest rates may reduce the volume of loans originated by our banking subsidiaries. Sustained high interest rates may discourage customers from borrowing and may result in increased delinquencies in outstanding loans and deterioration in the quality of assets. Increases in interest rates may reduce the value of our assets, including the financial assets of our banks, the assets managed by Porvenir and the investments of Corficolombiana. Our banking subsidiaries hold a substantial portfolio of loans and debt securities that have both fixed and floating interest rates. In addition, we may incur costs (which, in turn, will affect our results of operations) if our banking subsidiaries implement strategies to reduce future interest rate exposure. Increases in interest rates may reduce gains or require our banking subsidiaries to record losses on sales of their loans or securities.
High interest rates have historically been common in many countries in Latin America. Following our acquisition of BAC Credomatic, we have even greater regional exposure to fluctuations in interest rates. To the extent that there are significant increases in such rates in any of the countries in which BAC Credomatic operates, our operating margins may be adversely affected and our results of operations may experience significant adverse consequences.
We face exposure to fluctuations in foreign currency exchange, particularly in light of the fact that the currencies in countries where we and BAC Credomatic operate have historically experienced significant devaluations. The types of instruments exposed to foreign exchange rate risk include, for example, investments in foreign subsidiaries, foreign currency-denominated loans and securities, foreign currency-denominated debt and various foreign exchange derivative instruments whose values fluctuate with changes in the level or volatility of currency exchange rates or foreign interest rates.
We may be adversely affected by fluctuations between the value of the Colombian peso or other local currencies and the U.S. dollar as a result of substantial U.S. dollar-denominated debt incurred to finance the BAC Credomatic acquisition.
We financed our acquisition of BAC Credomatic, in part, through the incurrence of approximately U.S.$1.3 billion of U.S. dollar-denominated debt. Because the substantial majority of our revenue is in Colombian pesos, we will be exposed to fluctuations in the exchange rate between the Colombian peso and the U.S. dollar and the uncertainty of the amount of Colombian pesos that will be required to service the principal and interest payments on this debt. Fluctuations in the peso/dollar exchange rate may affect the value of this debt on our balance sheet and cause us to recognize gains or losses on our income statement. While we expect to hedge this indebtedness as described in “Item 4. Information on the Company––B. Business overview––BAC Credomatic—Foreign exchange rate risk related to the BAC Credomatic acquisition,” any substantial increase in the U.S. dollar relative to the Colombian peso could affect our results of operations and our ability to meet our future payment obligations on this debt.
A substantial portion of BAC Credomatic’s earnings, assets and liabilities are in Costa Rican colones, Guatemalan quetzals, Honduran lempiras, Nicaraguan cordobas, Panamanian balboas and U.S. dollars. As a result, we are subject to risks relating to foreign currency exchange rate fluctuations between these currencies and Colombian pesos. Nevertheless, as described in “Item 4. Information on the Company––B. Business overview––BAC Credomatic—Foreign exchange rate risk related to the BAC Credomatic acquisition,” BAC Credomatic maintains a U.S. dollar net asset position that is intended to hedge at least 60% of its shareholders’ equity against the possible devaluations of each of these local currencies.
We are subject to trading risks with respect to our trading activities.
Our banks, Corficolombiana and Porvenir engage in proprietary trading, and we derive a portion of our profits from such trading activities. As a result, any reduction in trading income could adversely affect our results of operations and financial condition. Our trading income is volatile and dependent on numerous factors beyond our control, including, among others, market trading activity, interest rates, exchange rates and general market volatility. A significant decline in our trading income, or large trading losses, could adversely affect our results of operations and financial condition.
Declines in the market price for securities could result in our recording impairment losses as well as increased unrealized losses on other securities. Losses in the Colombian equity markets could result in further losses from impairment or sale of these securities. Any significant increases in exposure to any of these non-traditional risks, or a significant increase in credit risk or bankruptcy of any of the counterparties, could materially and adversely affect our results of operations and financial condition.
Colombian law imposes limitations on interest rates, and future additional restrictions on interest rates or banking fees could negatively affect our profitability.
The Colombian Commercial Code limits the amount of interest that may be charged in commercial transactions, including transactions of our banking subsidiaries. In the future, regulations in Colombia could impose increased limitations regarding interest rates or fees. Law 1430 of December 2010 authorizes the Colombian National Government to impose or place limits on tariffs and fees charged by banks and other financial institutions where the government has determined that there is insufficient competition in a relevant market. Additionally, the law requires the Superintendency of Finance to implement a monitoring scheme of the tariffs and fees charged by the financial institutions in their relevant markets and to report the results of this evaluation semi-annually to the Colombian National Government. Recently, the Colombian Government issued Decree 4809 of 2011, which (1) requires banks to provide each of their clients with statements of all fees charged to such clients on an annual basis, (2) sets a limit on the fees that banks may charge to their clients for withdrawals on automated teller machines, or “ATMs,” of other banks and (3) establishes that transactions through the internet may not cost more than those made through other channels. A significant portion of our banks’ revenues and operating cash flow is generated by credit services and any such increased limitations would materially and adversely affect our results of operations and financial condition.
The Colombian Central Bank may impose requirements on the ability of Colombian residents, including us, to obtain loans denominated in foreign currency.
Under Colombian exchange control operations, the Colombian Central Bank may impose certain mandatory deposit requirements in connection with foreign currency-denominated loans obtained by Colombian residents, including us. Most recently, when the peso appreciated against foreign currencies in 2008, such mandatory deposit requirement was set at 40% of the amounts to be disbursed under any credit facility denominated in a foreign currency. Future measures or requirements imposed by the Colombian Central Bank, such as mandatory deposit requirements, may adversely affect our and our clients’ ability to obtain loans in foreign currency.
We face uncertainty regarding new consumer protection laws.
Law 1328 of 2009, also referred to as the “financial reform law,” creates a new customer protection regime with respect to financial institutions. The financial reform law provides a bill of rights for consumers of financial services and products, including the right to receive clear, complete and reliable information about the services and products offered by financial institutions. The law and the decrees and regulations issued pursuant to it also contain specific new obligations for financial institutions, including a duty to maintain a financial ombudsman in charge of consumer protection and procedures regulating the responsibilities and function of the ombudsan, a duty to create a financial consumer attention center pursuant to terms set by the Superintendency of Finance, an obligation to provide services and products under the same conditions offered to the general public, and a prohibition on the inclusion of predatory or abusive clauses in contracts with consumers. Any violation of this law or the decrees and regulations issued pursuant to this law by us could result in monetary or administrative sanctions or restrictions on our operations.
Our businesses may face constitutional actions, class actions and other legal actions involving claims for significant monetary awards against financial institutions, which may affect our businesses.
Under the Colombian Constitution, individuals may initiate constitutional actions (
acciones populares
), or class actions (
acciones de grupo
), to protect their collective or class rights, respectively. Colombian financial institutions, including our banking subsidiaries, have been, and continue to be, subject to these actions with regard to fees, financial services, mortgage lending and interest rates, the outcomes of which are uncertain. In addition, the number of such actions could increase in the future and could significantly affect our businesses.
Acquisitions and strategic partnerships may not perform in accordance with expectations, may fail to receive required regulatory approvals or may disrupt our operations and adversely affect our profitability.
A component of our strategy is to identify and pursue growth-enhancing strategic opportunities. As part of that strategy, we have acquired interests in various financial institutions in recent years. We continue to actively consider strategic acquisitions and alliances, in and outside of Colombia, in addition to our acquisition of BAC Credomatic. Strategic acquisitions and alliances could expose us to risks with which we have limited or no experience, such as in the case of any significant acquisition outside of Colombia. In addition, potential acquisitions in Colombia and elsewhere may be subject to regulatory approval. We may be unsuccessful in obtaining any such approval or obtaining such approval on terms that are optimal for us—particularly in view of our significant market share in the Colombian banking industry.
We must necessarily base any assessment of potential acquisitions and alliances on assumptions with respect to operations, profitability and other matters that may subsequently prove to be incorrect. Future acquisitions and alliances, as well as other investments, may not produce anticipated synergies or perform in accordance with our expectations and could adversely affect our operations and profitability. In addition, new demands on our existing organization and personnel resulting from the integration of new acquisitions could disrupt our operations and adversely affect our operations and profitability.
We may not be able to manage our growth successfully.
We have been expanding the scope of our operations over the past few years, and we expect that this expansion will continue. As we continue to grow, we must improve our operational, technical and managerial knowledge and compliance systems in order to effectively manage our operations across the expanded group. Failure to integrate, monitor and manage expanded operations could have a material and adverse effect on our reputation and financial
results. Our future growth will also depend on our access to internal and external financing sources. We may be unable to access such financing on commercially acceptable terms or at all.
We are subject to operational risks.
Our business depends on the ability of our banking subsidiaries to process large numbers of transactions efficiently and accurately. Operational risks and losses can result from fraud, employee error, failure to properly document transactions or to obtain proper internal authorization, failure to comply with regulatory requirements, breaches of conduct of business rules, equipment failures, natural disasters or the failure of external systems, among others. Our currently adopted procedures may not be effective in controlling each of the operational risks faced by our banking subsidiaries.
Failure of our information systems could materially and adversely affect the effectiveness of our risk management and internal control processes as well as our results of operations and financial condition.
Our subsidiaries are highly dependent on the ability to collect and process, on a timely basis, a large amount of financial and other information, and services and products, at a time when transaction processes have become more complex with increasing volumes. A partial or complete failure of any of these systems could materially and adversely affect our decision-making process, risk management and internal control systems as well as our ability to respond on a timely basis to changing market conditions.
In addition, our subsidiaries’ ability to remain competitive will depend in part on their ability to upgrade information technology infrastructure on a timely and cost-effective basis. Our subsidiaries must continually make significant investments and improvements in their information technology infrastructure in order to ensure the proper functioning of financial control, accounting and other data collection and processing systems and to remain competitive. In particular, as our banking subsidiaries continue to open new branches, they need to improve their information technology infrastructure, including maintaining and upgrading their software and hardware systems and their back-office operations.
Any failure to effectively improve or upgrade our subsidiaries’ information technology infrastructure and management information systems in a timely manner could damage their reputation and materially and adversely affect their results of operations and financial condition.
Our subsidiaries also rely on information systems to operate their websites, process transactions, respond to customer inquiries on a timely basis and maintain cost-efficient operations. Our subsidiaries may experience operational problems with their information systems as a result of system failures, viruses, computer “hackers” or other causes. Any material disruption or slowdown of our subsidiaries’ systems could cause information, including data related to customer requests, to be lost or to be delivered to our customers with delays or errors, which could reduce demand for their services and products and could materially and adversely affect our results of operations and financial condition.
Our policies and procedures may not be able to detect money laundering and other illegal or improper activities fully or on a timely basis, which could expose us to fines and other liabilities.
We, our banking subsidiaries, Corficolombiana, Porvenir and BAC Credomatic are required to comply with applicable anti-money laundering laws, anti-terrorism financing laws and other regulations. These laws and regulations require us, among other things, to adopt and enforce “know your customer” policies and procedures and to report suspicious or large transactions to the applicable regulatory authorities. While we, our banking subsidiaries, Corficolombiana, Porvenir and BAC Credomatic have adopted policies and procedures aimed at detecting and preventing the use of banking networks for money laundering activities and by terrorists and terrorist-related organizations and individuals generally, such policies and procedures have in some cases only been recently adopted and may not completely eliminate instances where they may be used by other parties to engage in money laundering and other illegal or improper activities. To the extent that we, our banking subsidiaries, Corficolombiana, Porvenir or BAC Credomatic fail to fully comply with applicable laws and regulations, the relevant government authorities to which they report have the power and authority to impose fines and other penalties. In addition, our businesses and reputation could suffer if customers use our banking subsidiaries, Corficolombiana, Porvenir or BAC Credomatic for money laundering or illegal or improper purposes.
Competition and consolidation in the Colombian banking and financial industry could adversely affect our market position.
We operate in a competitive market. Since the 1990s, when the Colombian financial system was deregulated, there has been an ongoing process of consolidation that has included foreign bank participants entering the market. We expect that consolidation to lead to the creation of larger local financial institutions, including additional foreign banks, presenting the risk that we could lose a portion of our market share in the industry, thereby affecting our results of operations.
Various banking institutions, which have recently been incorporated in Colombia, target the microcredit and small and medium enterprise segments. These institutions include Banco de las Microfinanzas-Bancamía S.A., Banco WWB S.A. and Banco Coomeva S.A., as well as two new financial corporations, JP Morgan Corporación Financiera S.A. and BNP Paribas Colombia Corporación Financiera S.A., which are local subsidiaries of international financial institutions. The business of these new credit institutions may affect our market position in the individual, small and medium enterprises and merchant banking segments. In addition, Grupo de Inversiones Suramericana has acquired ING’s pension fund operations, which may affect our market position in the pension and severance fund management market.
Our ability to maintain our competitive position depends mainly on our banks’ ability to anticipate and fulfill the needs of new and current customers through the development of innovative services and products, and our ability to offer adequate services and strengthen our customer base through cross-selling. Our businesses will be adversely affected if we are unable to retain current customers and attract new ones. In addition, our efforts to offer new services and products may not succeed if product or market opportunities develop more slowly than expected or if the profitability of these opportunities is undermined by competitive pressures.
We depend on our senior management, and the loss of their services would have a material adverse effect on our business.
We are highly dependent on our founder and chairman, Mr. Sarmiento Angulo, our president, Mr. Sarmiento Gutiérrez, and members of our senior management teams at both the group and subsidiary levels, all of whom possess considerable experience and expertise and have strong relationships with customers and participants of the Colombian business community. The presidents of our four banks have an average tenure of 25 years with these banks. Accordingly, our success will depend on the continued service of these senior officers, who are not obliged to remain employed with us and some of whom are approaching retirement age. The loss of the services of any of these senior officers could have an adverse effect on our business.
We are subject to reputational risk, and our reputation also is closely tied to that of our founder and chairman, Mr. Sarmiento Angulo, and our president, Mr. Sarmiento Gutiérrez, and that of our subsidiaries.
Damage to our reputation may limit our ability to attract customers, employees and investors. Harm to our reputation can arise from employee misconduct, legal and regulatory requirements, ethical issues, money laundering, and failing to deliver minimum standards of service and quality, among others. In particular, our success has been attributable, in part, to the high esteem in which Mr. Sarmiento Angulo, Mr. Sarmiento Gutiérrez and our subsidiaries are held in Colombia. Reputation plays an integral role in our business operations, which are based on customer confidence and trust. If the public image or reputation of Mr. Sarmiento Angulo, Mr. Sarmiento Gutiérrez, Grupo Aval or any of our subsidiaries is damaged as a result of adverse publicity or otherwise, business relationships with customers of the entire group may deteriorate, which would adversely affect our results of operations and financial condition. Any perceived or real difficulties experienced by any one of our subsidiaries would harm the reputation of Grupo Aval as a whole, which would also have an adverse effect on our results of operations and financial condition.
We are controlled by Mr. Sarmiento Angulo, whose interests could differ from the interests of preferred shareholders.
Mr. Sarmiento Angulo beneficially owns 94.1% of our common shares, as of April 25, 2012, and, accordingly, controls our group. See “Item 7. Major Shareholders and Related Party Transactions—A. Major shareholders.” The preferred shares do not have any voting rights and thus will not affect such control of our group. Mr. Sarmiento
Angulo will continue to have the right to control decisions, regardless of how our minority shareholders may vote on these issues and regardless of the interests of such shareholders, including preferred shareholders. In addition, Mr. Sarmiento Angulo beneficially owns interests in certain of our subsidiaries through entities other than Grupo Aval: 9.6% of Banco de Bogotá, 13.3% of Banco de Occidente, 15.4% of Banco AV Villas and 0.5% of Banco Popular as of December 31, 2011.
Circumstances may occur in which Mr. Sarmiento Angulo may have an interest in pursuing transactions that, in his judgment, enhance the value of his several investments in the banking sector. These transactions may not necessarily be in Grupo Aval’s interest or that of its shareholders. Due to his control, Mr. Sarmiento Angulo has, and will have, the power to:
|
|
·
|
elect a majority of our directors and appoint our executive officers, set our management policies and exercise overall control over our company and subsidiaries;
|
|
|
·
|
agree to sell or otherwise transfer his controlling stake in our company; and
|
|
|
·
|
determine the outcome of substantially all actions requiring shareholder approval, including transactions with related parties, corporate reorganizations, acquisitions and dispositions of assets, and dividends.
|
In addition, the concentration of ownership may have the effect of delaying, preventing or deterring a change of control of our company, could deprive our shareholders of an opportunity to receive a premium for the preferred shares as part of a sale of our company and might ultimately affect the market price of the preferred shares.
We plan to engage in additional transactions with our controlling shareholder, including repayment of debt.
We engage in business and financial transactions with our controlling shareholder and other shareholders that may create conflicts of interest between our company and these shareholders. For example, we may (1) repay loans owed to companies beneficially owned by Mr. Sarmiento Angulo; (2) acquire from Adminegocios & Cia. S.C.A., an entity controlled by Mr. Sarmiento Angulo and a direct shareholder of Grupo Aval, shares of Banco de Bogotá; and (3) acquire from entities controlled by Mr. Sarmiento shares in Banco de Bogotá, Banco de Occidente and Banco AV Villas, that are not owned by us, as described under “Item 7. Major Shareholders and Related Party Transactions—B. Related party transactions.” While we believe that these transactions will be carried out on an arm’s-length basis, commercial and financial transactions between us and our controlling shareholder could create the potential for, or could result in, conflicts of interests between us and our controlling shareholder. To the extent that the price we pay for any assets acquired from our controlling shareholder exceeds the market value of such assets or is not as productive a use of our cash as other uses, our results of operations and financial condition could be adversely affected.
Risks relating to our operation of BAC Credomatic
We may be unsuccessful in addressing the challenges and risks presented by our operations in
countries outside Colombia.
As a result of our acquisition of BAC Credomatic on December 9, 2010, we conduct banking businesses outside our historical home market of Colombia. BAC Credomatic’s operations may involve risks to which we have not previously been exposed. Some of BAC Credomatic’s operations are in countries that may present different or greater risks than those in Colombia, including, for example, in terms of competition. BAC Credomatic has, in particular, a significant consumer finance business, including credit card operations, in the Central American countries in which it operates. At December 31, 2011, BAC Credomatic’s consumer loan portfolio totaled U.S.$2.5 billion (including mortgages, vehicles and other personal loans), which represented 42.1% of BAC Credomatic’s total loan portfolio, and U.S.$1.4 billion in credit card loans, which represented 23.3% of BAC Credomatic’s total loan portfolio. We have limited experience conducting credit card and consumer finance businesses in countries outside Colombia. Accordingly, we may not be successful in managing credit card and consumer finance operations outside of our traditional domestic market. We may face delays in payments by customers and higher delinquency rates in these countries, which could necessitate higher provisions for loan losses and, consequently, have a negative effect on our financial performance.
In addition, we may not be able to realize all of the anticipated benefits from our acquisition of BAC Credomatic. Achieving such benefits will depend, to a large extent, on our ability to run a business outside Colombia. Any failure to do so could adversely affect our margins, results of operations and financial condition.
We depend on BAC Credomatic’s current senior management, and the loss of their services would have a material adverse effect on BAC Credomatic’s business.
We have retained the current senior management of BAC Credomatic, who have worked on average 15 years at BAC Credomatic, and most of whom pre-date GE Capital’s 2005 investment in BAC Credomatic. The loss of services of any of BAC Credomatic’s senior officers could have an adverse effect on BAC Credomatic’s business.
Changes in credit card regulations may adversely affect BAC Credomatic’s business.
BAC Credomatic’s credit card accounts represented 25.7% of total credit card accounts in Central America at December 31, 2010 (calculated based on BAC Credomatic data and information published by Euromonitor International for December 31, 2010). Because the credit card business is an important business segment for BAC Credomatic, representing 23.3% and 24.4% of its total loan portfolio at December 31, 2011 and 2010, respectively, the adoption of new laws and regulations or the revision of the current regulatory regime for credit cards in any of the jurisdictions in which BAC Credomatic operates may have an adverse effect on BAC Credomatic’s results of operations and financial condition.
BAC Credomatic is subject to significant compliance risks in connection with a multi-jurisdictional regulatory regime.
BAC Credomatic’s businesses are subject to regulation under Bahamian, Costa Rican, Guatemalan, Grand Cayman, Honduran, Mexican, Nicaraguan, Panamanian, Salvadoran and U.S. federal, state and other foreign laws, regulations and policies. BAC Credomatic thus is subject to a multi-jurisdictional regulatory regime, with which we have had little or no experience, and, accordingly, following the recent acquisition of BAC Credomatic, we are subject to increased compliance risks. In addition, any changes to the regulatory regime of one of the Central American countries may lead to corresponding changes to the regulatory regime of other countries in the region. BAC Credomatic’s businesses are regularly reviewed or investigated by regulators, which could lead to enforcement actions, fines and penalties or the assertion of private litigation claims and damages.
We are subject to the consequences of consolidated supervision due to regulatory asymmetries.
Regulation of financial institutions varies across the different jurisdictions in which BAC Credomatic operates. These differences are particularly pronounced in the assessment of credit risk and investments. These asymmetries may affect the expected results of operations of BAC Credomatic in each jurisdiction, and as a consequence could adversely affect BAC Credomatic’s consolidated results of operations.
Risks relating to our preferred shares
Exchange rate volatility may adversely affect the Colombian economy.
Pursuant to Colombian law, the Colombian Central Bank maintains the power to intervene in the exchange market in order to consolidate or dispose of international reserves, as well as to control any volatility in the exchange rate, acting through a variety of mechanisms, including discretionary ones. During recent years, the Colombian Central Bank has employed a floating exchange rate system with periodic interventions. From time to time, there have been significant fluctuations in the exchange rate between the Colombian peso and the U.S. dollar. For example, the peso appreciated 10.0% against the U.S. dollar in 2007, depreciated 11.4% against the U.S. dollar in 2008, appreciated 8.9% against the U.S. dollar in 2009, appreciated 6.4% against the U.S. dollar in 2010 and depreciated 1.5% against the U.S. dollar in 2011. Unforeseen events in international markets, fluctuations in interest rates, changes in capital flows, political developments or inflation rates may cause exchange rate instability that could, in turn, depress the value of the Colombian peso, thereby decreasing the U.S. dollar value of the dividends paid.
Restrictions on purchasing our preferred shares may affect the market liquidity of our preferred shares.
Under Colombian securities regulations, any transaction involving the sale of publicly traded shares of any Colombian company, including any sale of our preferred shares for the equivalent of 66,000
Unidades de Valor Real
, or “UVRs,”
(approximately U.S.$6,600), or more, must be effected through the Colombian Stock Exchange. UVR is a Colombian inflation-adjusted monetary index calculated by the board of directors of the Colombian Central Bank and generally used for pricing home-mortgage loans (one UVR = Ps 198.45 (U.S.$0.10) at December 31, 2011). Any transfer of preferred shares may be required to be sold through the Colombian Stock Exchange, which could limit their liquidity or affect their market price.
The relative illiquidity of the Colombian securities markets may impair the ability of preferred shareholders to sell preferred shares.
Our preferred shares have been listed since February 1, 2011 on the Colombian Stock Exchange, which is relatively small and illiquid compared to securities exchanges in major financial centers. In addition, a small number of issuers represent a disproportionately large percentage of market capitalization and trading volume on the Colombian Stock Exchange. A liquid trading market for the preferred shares might not develop on the Colombian Stock Exchange. A limited trading market could impair the ability of a holder of preferred shares on the Colombian Stock Exchange in the amount and at the price and time desired by such holder, and could increase the volatility of the market price of our preferred shares.
An active market for our preferred shares may not continue to develop or be maintained and the market price of our preferred shares may fluctuate in response to numerous factors.
Although our preferred shares were listed on the Colombian Stock Exchange on February 1, 2011, an active public market for the preferred shares may not continue to develop or be maintained. The market price of our preferred shares may fluctuate significantly in response to numerous factors, many of which are beyond our control, including actual or anticipated fluctuations in our operating results, economic downturns, political events in Colombia or other jurisdictions in which we operate, developments affecting the banking industry, changes in financial estimates by securities analysts or our failure to perform in line with such estimates, departures of key personnel, and sales of our preferred shares in the future, including by our banking subsidiaries who may have to sell our preferred shares obtained from investors who entered into loans with them to acquire our preferred shares in our offering of 1,600 million preferred shares on May 12, 2011, or the “Preferred Shares Local Offering.” Our banking subsidiaries extended a total of Ps 654.3 billion (U.S.$363.8 million at the representative market rate on May 12, 2011) of credit disbursed through 14,533 loans to finance the acquisition of preferred shares in the Preferred Shares Local Offering. Depending on the characteristics of the borrower, our banking subsidiaries may have required collateral, which may have included a pledge of the preferred shares that were subject to the financing. Such a pledge would permit our banking subsidiaries to repossess the preferred shares if the borrower defaults. Our banking subsidiaries had, on an aggregate basis, pledges over 196,958,940 preferred shares at December 31, 2011. Under Colombian Law, our banking subsidiaries must sell any repossessed shares as banks are not permitted to hold shares in their parent. If changes in general economic conditions or other factors cause these borrowers to default on their loans, our subsidiaries will have to sell our preferred shares into the market and the market price of our preferred shares may decline as a result.
Holders of our preferred shares have limited rights and may be subject to different corporate rules and regulations than those available in other jurisdictions.
Under Colombian law, our preferred shareholders may have fewer rights than shareholders of a corporation incorporated in the United States. A holder of our preferred shares under Colombian law may have fewer alternatives to protect its interests relative to actions by our board of directors or executive officers, and these alternatives may be less well-defined than under the laws of those other jurisdictions.
The Colombian securities markets are not so highly regulated and supervised as the U.S. securities markets or the markets in some other jurisdictions. In addition, rules and policies against self-dealing or for preserving shareholder interests may be less well-defined and enforced in Colombia than in the United States and certain other
countries, which may put holders of our preferred shares at a potential disadvantage. Corporate disclosures also may be less complete or informative than for a public company in the United States or in certain other countries.
Grupo Aval’s by-laws contain an arbitration clause that provides for the exclusive jurisdiction of an arbitral tribunal to be seated at the Bogotá Chamber of Commerce. The arbitration provision provides that any conflict arising among shareholders, or between shareholders and Grupo Aval in connection with the by-laws must be resolved by an arbitral tribunal.
In addition, holders of our preferred shares are not entitled to vote for the election of directors or to influence our management policies. Under our by-laws and Colombian law, holders of preferred shares have no voting rights in respect of preferred shares, other than in limited circumstances.
Our ability to pay dividends on our preferred shares may be limited by Colombian law and because we are a holding company dependent on dividends from subsidiaries.
Under Colombian law, a company may only distribute dividends to the extent such distribution is fully supported by accurate financial statements demonstrating the financial condition of the company. Any dividends distributed in violation of this norm may not be reclaimed from shareholders who received such payments in good faith, and any subsequent distribution of profits may be suspended. In addition, dividends may not be distributed until losses from previous fiscal years have been absorbed.
Our ability to pay dividends on the preferred shares will be contingent upon the financial condition of our subsidiaries. In addition, we conduct substantially all of our operations through subsidiaries and are dependent upon dividends from our subsidiaries to meet our obligations.
Our status as a foreign private issuer allows us to follow local corporate governance practices which may limit the protections afforded to investors.
We currently follow Colombian practices concerning corporate governance and intend to continue to do so. Accordingly, you will not have the same protections afforded to shareholders of U.S. public or of foreign private issuers subject to corporate governance requirements of stock exchanges located in the United States.
Preemptive rights may not be available to holders of preferred shares.
Colombian law and our by-laws require that, whenever we issue new common shares, we must offer to the holders of common shares the right to subscribe a number of shares of such class sufficient to maintain their existing percentage ownership of our aggregate share capital. On the other hand, holders of preferred shares are entitled to preemptive rights only when so declared at a common shareholders’ meeting. Our common shareholders’ may decide not to provide for such preemptive rights.
Banking regulations, accounting standards and corporate disclosure applicable to us differ from those in the United States and other countries.
Colombian banking regulations may differ in material respects from regulations applicable to banks in other countries, including those in the United States. For example, in Colombia, Grupo Aval is not subject to regulation applicable to financial institutions, although its banking subsidiaries, Corficolombiana and Porvenir are subject to such regulations. In addition, capital adequacy requirements for banks under Colombian regulations differ from those under U.S. regulations and may differ from those of other countries.
Although we are required to prepare our financial statements in accordance with Colombian GAAP, we also prepare our audited consolidated financial statements in accordance with Colombian Banking GAAP, which differs in significant respects from U.S. GAAP and International Financial Reporting Standards, or “IFRS.” As a result, the financial statements of Colombian companies, such as ours, may differ from those of companies in other countries. Some of the main differences affecting earnings and shareholders’ equity include the accounting treatment for restructuring, loan origination fees and costs, deferred income taxes and business combinations. Moreover, under Colombian Banking GAAP, allowances for non-performing loans are computed by establishing the inherent risk in each non-performing loan, using criteria established by the Superintendency of Finance that differ from criteria used, for example, under U.S. GAAP. See “Presentation of Financial and Other Information.”
Although the Colombian government has undertaken a review of accounting, audit and information disclosure regulations and the Colombian Congress passed Law 1314 of 2009, purporting to provide for convergence with IFRS, current regulations continue to differ in certain respects from those in other countries, and any changes in those regulations would only become effective in 2013 or after. There may be less publicly available information about us than is regularly published by or about U.S. issuers or issuers in other countries.
Judgments of Colombian courts with respect to our common and preferred shares will be payable only in pesos.
If proceedings are brought in the courts of Colombia seeking to enforce the rights of holders of the preferred shares, we will not be required to discharge our obligations in a currency other than pesos
.
Under Colombian laws, an obligation in Colombia to pay amounts denominated in a currency other than pesos
may only be satisfied in Colombian currency at the exchange rate, as determined by the Colombian Central Bank and published by the Superintendency of Finance, also known as
Tasa Representativa del Mercado
, in effect on the date the judgment is obtained, and such amounts are then adjusted to reflect exchange rate variations through the effective payment date. The then-prevailing exchange rate may not afford non-Colombian investors with full compensation for any claim arising out of or related to our obligations under the preferred shares.
U.S. investors in our preferred shares may find it difficult or impossible to enforce service of process and enforcement of judgments against us and our officers and directors.
We are incorporated under the laws of Colombia, and all of our subsidiaries are incorporated in jurisdictions outside the United States. In addition, our executive offices are located outside of the United States. All of our directors and officers reside outside of the United States, and all or a substantial portion of our assets and the assets of most of our officers and directors are, and will most likely continue to be, located outside of the United States. As a result, it may be difficult or impossible for U.S. investors to serve legal process within the United States upon us or any of these persons or to enforce a judgment against us for civil liabilities in U.S. courts. In addition, you should not assume that courts in the countries in which we or our subsidiaries are incorporated or where our or our subsidiaries’ assets are located (1) would enforce judgments of U.S. courts obtained in actions against us or our subsidiaries based upon the civil liability provisions of applicable U.S. federal and state securities laws or (2) would enforce, in original actions, liabilities against us or our subsidiaries based on those laws.
There is also substantial doubt that the courts of Colombia would enter judgment in original actions brought in those courts predicated on U.S. federal or state securities laws. We have been advised by our Colombian counsel that there is no legal basis for original actions to be brought against us or our directors and executive officers in a Colombian court predicated solely upon the provisions of the U.S. securities laws. In addition, certain remedies available under provisions of the U.S. securities laws may not be admitted or enforced by Colombian courts.
Grupo Aval’s by-laws contain an arbitration clause that provides for the exclusive jurisdiction of an arbitral tribunal to be seated at the Bogotá Chamber of Commerce. The arbitration provision provides that any conflict arising among shareholders, or between shareholders and Grupo Aval in connection with the by-laws must be resolved by an arbitral tribunal.
See “Item 4. Information on the Company—B. Business overview—Service of process and enforcement of judgments.”
Our company
Grupo Aval is Colombia’s largest banking group; and, through our BAC Credomatic operations we are also a leading banking group in Central America.
Our registered and principal executive offices are located at Carrera 13 No. 26A - 47, Bogotá D.C., Colombia, and our general telephone number is (+57) 1 241-9700.
Colombian operations
Grupo Aval is Colombia’s largest banking group based on total assets, and its most profitable based on ROAE, as compared to our principal competitors, in each case at and for the years ended December 31, 2011, 2010 and 2009. Grupo Aval provides a comprehensive range of financial services and products across the Colombian market, ranging from traditional banking services, such as loans and deposits, to pension and severance fund management.
Grupo Aval currently consists of four commercial banks in Colombia (Banco de Bogotá, Banco de Occidente, Banco Popular and Banco AV Villas), as well as the largest pension and severance fund manager in Colombia (Porvenir) and the largest merchant bank in Colombia (Corficolombiana), each of which we control and consolidate into our results.
We have the largest banking network in Colombia, with 1,265 branches and 2,649 ATMs, at December 31, 2011. Customers of any of our banks may access Grupo Aval’s other bank branches to carry out basic banking transactions throughout our
Red de Grupo Aval
(Grupo Aval network).
Under our multi-brand strategy, each of our banks focuses on particular types of customers, geographic regions and products. Our banks are encouraged to compete among themselves and with other market participants, while remaining subject to group-level oversight and direction. We believe that this strategy has contributed to our strong financial performance and allowed us to provide an integrated service network to our customers. Underlying Grupo Aval’s competitive strengths are group-level policies focused on comprehensive risk management, convergence of technologies and cost controls that we believe promote best practices, realization of synergies and efficiency across our subsidiaries.
The following table shows market shares of our Colombian banking subsidiaries and principal competitors at December 31, 2011.
|
At December 31, 2011
|
||||||||||||||||||||||||||||||||
|
Grupo Aval entities
|
Bancolombia
|
Davivienda
|
BBVA Colombia
|
|||||||||||||||||||||||||||||
|
Banco de Bogotá
|
Banco de Occidente
|
Banco Popular
|
Banco AV Villas
|
Aggregate (1)
|
||||||||||||||||||||||||||||
|
(in percentages)
|
||||||||||||||||||||||||||||||||
|
Colombian market share:
|
||||||||||||||||||||||||||||||||
|
Deposits
|
14.8 | 6.6 | 4.9 | 3.3 | 29.5 | 19.6 | 11.5 | 9.8 | ||||||||||||||||||||||||
|
Gross loans and financial leases
|
13.4 | 7.3 | 5.1 | 2.5 | 28.3 | 21.9 | 12.8 | 9.4 | ||||||||||||||||||||||||
|
Assets
|
14.6 | 7.1 | 4.8 | 2.6 | 29.0 | 21.0 | 11.9 | 8.8 | ||||||||||||||||||||||||
|
Branches
|
12.7 | 3.7 | 3.7 | 5.5 | 25.7 | 15.4 | 11.3 | 6.9 | ||||||||||||||||||||||||
|
ATMs
|
9.4 | 1.6 | 8.5 | 4.9 | 24.3 | 26.4 | 13.3 | 8.8 | ||||||||||||||||||||||||
|
(1)
|
Reflects aggregated unconsolidated amounts of our banking subsidiaries.
|
Central American operations
Following our acquisition of BAC Credomatic on December 9, 2010, we became one of the leading banking groups in Central America based on consolidated assets. We believe that the BAC Credomatic acquisition provides us with a leading Central American presence with operations that are complementary to our Colombian businesses and with the opportunity to enter the consumer and credit card banking businesses in this region.
BAC Credomatic has operations in each of the six Central American countries: Costa Rica, El Salvador, Guatemala, Honduras, Nicaragua and Panama. BAC Credomatic is one of the leading credit card issuance and merchant-acquiring franchises in Central America. BAC Credomatic’s credit card accounts represented 25.7% of total credit card accounts in Central America (calculated based on BAC Credomatic data and information published by Euromonitor International) at December 31, 2010. BAC Credomatic has the only network that processes all major credit card brands in the region.
Through a network of 477 points of contact (including 226 full-service branches, 39 in-store branches, 184 on-site branches and 28 auto/drive-thru branches) and 1,186 ATMs at December 31, 2011, BAC Credomatic provides us with more than two million additional customers and access to a region with a population of approximately 43 million, providing significant opportunity for growth in financial services.
While our primary focus will continue to be the Colombian market, our BAC Credomatic acquisition extends our franchise to an important contiguous economic region. BAC Credomatic represented the equivalent of 18.9% of our assets at December 31, 2010 and 17.8% of our assets at December 31, 2011.
As with our approach in our acquisitions in Colombia to date, we have retained a vast majority of BAC Credomatic’s senior management. These executives have on average 15 years of experience at BAC Credomatic and for the most part pre-date GE Capital’s 2005 investment in BAC Credomatic. By implementing our best practices, we believe we can improve BAC Credomatic’s efficiency ratio of 57.6% compared to 51.4% for our Colombian operations, each at December 31, 2011.
Preferred Shares Local Offering
Grupo Aval concluded the Preferred Shares Local Offering on May 12, 2011, selling 1,600 million preferred shares and raising an aggregate amount of Ps 2.1 trillion (U.S.$1.1 billion at the representative market rate on such date), before deducting brokerage commissions and discounts, and transaction expenses. The Preferred Shares Local Offering was conducted at a fixed price of Ps 1,300 (U.S.$0.72 at the representative market rate on such date) on a public basis in Colombia and also made to institutional investors in Chile and Peru. At the time of the offering, the Preferred Shares Local Offering was the largest offering of shares ever made by a privately owned company in Colombia.
Grupo Aval’s banking subsidiaries extended a total of Ps 654.3 billion (U.S.$363.8 million at the representative market rate on May 12, 2011) of credit disbursed through 14,387 loans to finance the acquisition of preferred shares in the Preferred Shares Local Offering. The term of the financing offered ranged from one year to three years. Depending on the characteristics of the borrower, our banking subsidiaries may have required collateral, which may have included a pledge of the preferred shares that were subject to the financing. Such a pledge permits the banking subsidiary to seek the sale of the preferred shares if the borrower defaults. All the loans are full-recourse loans. Under the terms of the pledge, the shareholders are limited from selling their shares until the loans are repaid. Our banking subsidiaries will immediately seek, directly or through judicial process, the sale of the preferred shares as banks are not permitted to hold shares in their parent under Colombian law. Our banking subsidiaries have, on an aggregate basis, pledges over 196.958.940 preferred shares at December 31, 2011. For the performance of our preferred shares, see “Item 9. The Offer and Listing—C. Markets.” The proceeds of the Preferred Shares Local Offering have been used for the payment of certain outstanding loans and general corporate purposes.
Recent developments
On February 1, 2012, Grupo Aval completed an offering of U.S.$600 million of 5.25% Senior Notes due 2017, or the “Grupo Aval Debt Offering.” The notes were issued by Grupo Aval’s wholly-owned finance subsidiary, Grupo Aval Limited, and guaranteed by Grupo Aval. The notes were offered pursuant to Rule 144A and Regulation S under the United States Securities Act of 1933. Grupo Aval intends to use the net proceeds of the Grupo Aval Debt Offering for general corporate purposes,
which may include enhancing our strategic interests in the financial services sector, through acquisitions or other corporate transactions, strengthening the capital base of our subsidiaries and prepaying outstanding indebtedness, including to related parties.
Capitalization ratios
The following table presents consolidated capitalization ratios for our banking subsidiaries, Grupo Aval and our principal
competitors
at the dates indicated.
|
At December 31, 2011
|
||||||||||||||||||||||||||||||||||||
|
Grupo Aval entities
|
||||||||||||||||||||||||||||||||||||
|
Colombian Banking GAAP
|
Banco de Bogotá
|
Banco de Occidente
|
Banco Popular
|
Banco AV Villas
|
Aggregate (1)
|
Grupo Aval consolidated
|
Bancolombia
|
Davivienda
|
BBVA Colombia
|
|||||||||||||||||||||||||||
|
(in percentages)
|
||||||||||||||||||||||||||||||||||||
|
Tangible equity ratio (2)
|
10.0 | 13.5 | 13.6 | 12.3 | 11.4 | 9.2 | 9.9 | 10.3 | 8.3 | |||||||||||||||||||||||||||
|
Tier 1 ratio (3)
|
12.0 | 8.7 | 9.1 | 12.5 | 11.0 | – | 9.0 | 11.4 | 9.5 | |||||||||||||||||||||||||||
|
Solvency ratio (4)
|
13.3 | 10.1 | 11.7 | 14.2 | 12.6 | – | 12.5 | 14.4 | 12.3 | |||||||||||||||||||||||||||
|
(1)
|
Reflects the summation of calculated amounts for each line item for each of our banking subsidiaries.
|
|
(2)
|
Tangible equity ratio is calculated as total shareholders’ equity plus minority interest minus goodwill, divided by total assets minus goodwill. See “Item 3. Key Information—A. Selected financial data—Non-GAAP measures reconciliation.”
|
|
(3)
|
Tier 1 ratio is calculated as primary capital divided by risk-weighted assets.
|
|
(4)
|
Solvency ratio is calculated as technical capital divided by risk-weighted assets. For a definition of technical capital, see “—B. Business overview—Supervision and regulation—Capital adequacy requirements.”
|
|
|
Tangible solvency ratio differs from solvency ratio. Tangible solvency ratio is calculated as technical capital minus goodwill, divided by risk-weighted assets minus goodwill. The tangible solvency ratios for the following entities at December 31, 2011 were: Banco de Bogotá 9.3%, Banco de Occidente 9.9%, Banco Popular 11.7%, Banco AV Villas 14.2%, Grupo Aval (aggregate) 10.0%, Bancolombia 11.7%, Davivienda 11.3% and BBVA Colombia 10.5%.
|
Our business strengths
We believe that we have achieved our leading positions in the Colombian and Central American banking industry through the following competitive strengths.
Our multi-brand business model
Our differentiated multi-brand business model builds on the individual strengths of our banks and the market-wide recognition of their brands. Each of our banks has developed a focus on particular and, to a degree, overlapping market sectors, geographic regions, services and products. We believe this specialization has contributed to the individual success of our banks and the diversity of Grupo Aval as a whole. Our banking subsidiaries operate as four independent banks that are encouraged to compete among themselves and with other market participants, while operating within central guidelines established by us in the areas of internal control, credit risk management, brand management, strategic planning, general procurement and information technology. These guidelines, together with group support services, are designed to allow each bank to achieve economies of scale and benefit from cross-bank synergies and groupwide best practices without affecting individual competition and the decision-making abilities of each bank’s management. We may, in the future, consider merging one or more of our subsidiaries in our group if meaningful improvements in efficiencies, revenue or other benefits could be achieved. We plan to continue executing our multi-brand business model by maintaining the BAC Credomatic brand and integrating BAC Credomatic into our operations.
Largest player in most banking sectors in Colombia
We are the largest participant in most sectors of the Colombian banking market, with market-leading shares of 31.5% of commercial loans and 27.7% of consumer loans, at December 31, 2011. We also have the largest market share of deposits at 29.5% at December 31, 2011. Our
Red de Grupo Aval
is the largest combined ATM and banking network in the country and has been a key element of our competitive positioning in the Colombian market.
At December 31, 2011 our ATM and banking network had market shares of 24.3% and 25.7% of ATMs and branches, respectively.
Strong track record of financial performance
We believe that our leading position in the Colombian market, cross-bank synergies, economies of scale, low-cost funding and operating efficiencies have assisted us in achieving higher and more stable profits compared to our competitors. Our average ROAE of 23.9% and average ROAA of 2.5% for the 2009 to 2011 period, and our ROAE of 20.3% and ROAA of 2.3% for the year ended December 31, 2011, have been the highest among our direct competitors in the Colombian market, and our consolidated net interest margin (net interest income divided by total average interest-earning assets) has been in the range of 6.5% to 8.8% for the 2009 to 2011 period. We believe that our ROAA and ROAE outperform those of our competitors mainly due to better yields on loans (from our diversified loan portfolio), significant yields from our investment portfolio, lower net provisions (due to a lower ratio of charge-offs to total loans) and better efficiency margins. Our total assets have grown at a compounded annual growth rate, or “CAGR,” of 25.3% from 2009 to 2011 (13.6% excluding BAC). During the same period, our total deposits have grown at a CAGR of 20.0% (9.0% excluding BAC).
Diversified sources of funding
We have diverse sources of funding, including deposits and debt securities placed in the Colombian market, which result in a low cost of funding. At December 31, 2011, in Colombia, our market share of deposits was 29.5%, supported by a 38.0% market share in checking accounts and 28.4% in savings accounts. Deposits represented 76.9% of our total funding at that date, compared to 83% at December 31, 2009, which provides us with a stable, and cheap funding base. As a result of our efforts to broaden our funding base, we increased our funding from Ps 59.4 trillion (U.S.$30.6 billion) at December 31, 2009 to Ps 92.4 trillion (U.S.$47.5 million) at December 31, 2011. On May 12, 2011, we completed an offering of 1.6 billion preferred shares, raising an aggregate amount of Ps 2.1 trillion (U.S.$1.1 billion) (Ps 1,300 (U.S.$0.72 at the representative market rate at such date) per share), before deducting brokerage commissions and discounts, and expenses of the offering. We believe that our funding base supports our initiatives to expand our businesses.
Sound risk management
We believe that we have asset quality that is superior to the market average. We have maintained our relative asset quality, as evidenced by our ratio of non-performing loans to total loans of 1.6% for December 31, 2011, and a ratio of charge-offs to average outstanding loans (annualized) of 1.1% at December 31, 2011. In addition, we believe that our reputation as a conservative banking group has allowed us to consistently retain and attract new customers. Each of our banking subsidiaries has a comprehensive risk management system, which we view as fundamental to their long-term stability and viability, and enables them to identify risks and resolve potential problems on a timely basis. In addition, we have established upward loan reporting processes, and Grupo Aval’s risk management staff meets on a weekly basis to discuss the loan portfolio, developments in the industry, risks and opportunities.
Each of our banks and Grupo Aval has strong capital adequacy ratios. The aggregate solvency ratio of our banks on an unconsolidated basis was 13.8% at December 31, 2011, compared to an average solvency ratio of 14.8% for our principal competitors at the same date and to 9.0%, Colombia’s minimum regulatory requirement.
Focus on best practices
Grupo Aval applies groupwide best practices for all of its operating subsidiaries. These practices are designed to encourage a consistent approach with respect to effective risk management, efficient use of capital, cost control, brand management, general procurement and integration of information technology. We believe that these practices have helped us to achieve economies of scale and synergies to reduce operating and administrative costs. At December 31, 2011, we had a consolidated efficiency ratio of 52.7%, and our banking subsidiaries had efficiency ratios ranging from 46.0% (Banco de Occidente) to 59.2% (Banco AV Villas).
Leading banking operations in Central America
BAC Credomatic is one of the leading financial institutions in Central America with a record of strong financial performance. It has achieved an average of 22.9% in annual ROAE for the period from 2007 to 2011 (excluding extraordinary gains in 2007 and 2008). BAC Credomatic is a full-service financial institution with one of the leading card-issuing and acquiring businesses in the region. Its Credomatic brand has key alliances with major credit card networks, such as Visa, MasterCard, American Express and Diners Club, and has the only network that processes all major credit card brands in the region. BAC Credomatic customer base and distribution network are sizable when compared to our Colombian banks. At December 31, 2011, it served more than 2.2 million customers through 477 points of contact including 226 full-service branches, 39 in-store branches offering teller services in retail stores, 184 on-site branches offering full banking services for corporate employees, and 28 auto/drive-thru branches throughout Central America, connected through a single technological platform that allows online transactions between countries in the region. BAC Credomatic’s market share in terms of loans varies in the different countries as follows, as of December 31, 2011: Costa Rica 10.7%, El Salvador 9.7%, Guatemala 3.2%, Honduras 13.0%, Nicaragua 27.2% and Panama 2.8%.
Experienced management teams
Our qualified and experienced management teams, both at the group and operating subsidiary levels, have played a key role in guiding our growth. Our chairman, Mr. Sarmiento Angulo, has over 50 years of business experience, including 40 years in the banking and related financial services industry. Our president Mr. Luis Carlos Sarmiento Gutiérrez, has over 15 years of experience in the banking and related financial services industry and 25 years of business experience as a banking executive in Colombia and the United States. The presidents of our four banks have an average tenure of 25 years with these banks, and the president of BAC Credomatic has a tenure of 35 years with BAC Credomatic. We believe that the strength of management at all levels within Grupo Aval has enabled us to become Colombia’s largest banking group and its most profitable based on return on ROAE as compared to our principal competitors. Our and each of our operating subsidiaries’ management teams are dedicated to formulating and executing business strategies through a culture of excellence, innovation and cooperation, which has served as our guiding vision throughout the various acquisitions and initiatives undertaken by Grupo Aval.
Our strategy
Our overall objectives are to build upon our competitive strengths to pursue opportunities for growth and to enhance our long-term financial performance. To achieve these objectives, we intend to pursue a strategy with the following principal elements:
Further penetrate the Colombian market
We believe that Colombia offers significant opportunities to expand our business because of the country’s strong economic fundamentals and low penetration rates for banking and other financial services and products, as compared to other countries in the region. For example, domestic credit to the private sector accounts for 43.5% of GDP in Colombia as compared to 83.3% for Chile, 57.0% for Brazil and 24.3% for Peru at December 31, 2010. See “—B. Business overview—Industry—Colombia—Credit volumes.” We anticipate that demand for such services and products will increase across all customer sectors. As Colombia’s leading banking group, and drawing upon our distinctive multi-brand business model, we believe that we are well-positioned to take advantage of this significant growth potential.
Continue capitalizing on synergies and improving efficiencies
We believe that there is additional room to create synergies among our subsidiaries and leverage their combined strength without affecting our multi-brand business model. We intend to continue identifying and working on groupwide projects, mainly in information technology, and we will continue to seek economies of scale by fostering procurement of goods and services for multiple subsidiaries, which we believe have contributed to improvements in our efficiency ratios. As an example, we are in the process of replacing the core banking systems in our subsidiaries to converge to a common platform.
Expand our services offerings and diversify our sources of income
We believe that we offer the most comprehensive range of banking services and products in Colombia, and we continually seek to expand these offerings to meet evolving customer needs and enhance our profitability. For example, we are currently implementing initiatives to increase our non-interest income, which consists primarily of net fee income. Net fee income accounted for 25.8% and 23.0% of our consolidated total operating income before net provisions for the years ended December 31, 2011 and 2010, respectively. We believe that we can expand the contribution of non-interest income to our profitability in future periods by, for example, expanding bancassurance (i.e., bank-offered third-party insurance products) through our distribution networks and credit card fee income through an increase in credit card loan volume across all of our banks.
Integrate BAC Credomatic and further penetrate the Central American market
We plan to continue executing our multi-brand business model by maintaining the BAC Credomatic brand and integrating it into our operations. We intend to capitalize on the expansion of the Central American market as we believe the BAC Credomatic acquisition will offer us significant opportunities for organic and acquisition growth in financial services in this region. In order to improve operational efficiency and increase market share in key sectors, we intend to share our groupwide commercial and operational standards and best practices with BAC Credomatic, while capitalizing on its regional expertise, brand recognition, customer base, and services and products, such as credit card issuance and merchant-acquiring businesses. We believe that we can substantially improve BAC Credomatic’s efficiency ratio, which at December 31, 2011 was 57.6%, compared to 51.4% for Grupo Aval’s Colombian operations, by implementing our best practices at BAC Credomatic.
Pursue other selected acquisitions
We have a proven track record of identifying, acquiring and integrating interests in companies that we believe have strategic value to us. We are interested in expanding our businesses in Colombia and Central America and to other regions. We regularly evaluate acquisition candidates that may permit us to expand the services and products we offer and markets we can access, such as BAC Credomatic. We actively consider additional strategic investments, alliances and acquisitions, principally in Colombia, Central America and other selected Latin American countries.
Oversight
As the holding company of the group, we closely monitor the performance of our banks. We actively participate in developing each bank’s long-term business plan, and we require our banks to present us with a yearly budget and profitability targets. We develop our own independent profitability targets for each bank before discussing and recommending any changes thereto with its management team. In addition, we make recommendations for setting the compensation of management in each of our banks annually, and link incentive compensation to achieving budget goals and other financial and strategic performance targets.
Our banks are required to report their financial performance to us on a regular basis, including daily summaries and monthly detailed information. We monitor the performance of our banks against their respective budgets and the performance of our competitors. This systematic control process is complemented by ad-hoc analyses of key operational drivers, such as the loan portfolio quality of each bank relative to our other banks and our competitors. When a bank deviates from its plan or when weaknesses are identified, we meet with the respective bank’s management to discuss remedial measures and a course of action. Similarly, when a bank finds itself in a new or unfamiliar situation, such as the mortgage and financial crisis of 1999, we provide guidance. Our senior management and the banks meet at least twice a month to discuss strategy, opportunities and current operations.
Our internal control department regularly audits our banks, Porvenir and Corficolombiana, as well as their operating subsidiaries, to provide objective assurance to our management and board of directors regarding the effectiveness of our subsidiaries’ financial reporting and control mechanisms as well as to monitor compliance with our best practices and guidelines. Our internal control department also plays an integral part in our corporate governance. When our internal control department discovers deviations from our best practices and guidelines, we recommend remedial measures and enhance our monitoring of the respective entity.
Strategic focus
From time to time, our banks explore merger and acquisition opportunities and, as part of its equity portfolio management activities, Corficolombiana makes investments in strategic sectors. We provide support to our bank management teams in identifying opportunities, negotiating favorable outcomes and implementing acquisitions. We independently assess a prospective target’s strategic fit with the acquiring banking subsidiary and within our group as a whole. In addition, we explore new business initiatives and often recommend new product lines and services to our banks, such as bancassurance, and provide assistance to our banks in evaluating, negotiating and implementing acquisitions such as Banco de Bogotá’s acquisition of Megabanco and Banco de Occidente’s acquisition of Banco Unión. Our acquisition of BAC Credomatic illustrates our approach to identifying and pursuing growth opportunities outside of our existing portfolio.
Credit risk management
Although each bank is responsible for its credit decisions and risk management, we oversee the implementation of appropriate risk management controls at our banks and have established upward loan reporting processes. Our risk management staff meets on a weekly basis to discuss our subsidiaries’ loan portfolio, developments in the industry, risks and opportunities. For potential loan transactions that would result in an aggregated exposure to a single issuer exceeding Ps 20 billion at the group level, our risk management staff will evaluate the transaction and will often make recommendations with respect to the structure of the loan (such as guarantees, interest rates, commissions and covenants). We also coordinate loan syndication among our banks to effectively leverage the combined equity of our banks and manage any risk issues. For a discussion of our risk management guidelines, see “Item 11. Quantitative and Qualitative Disclosures About Risk—Risk management.”
Marketing
Our centralized marketing strategy pursues two main objectives: to increase the competitiveness of our banks and to strengthen our corporate image. To achieve these objectives, we negotiate with third parties for the provision of certain marketing services and to design and implement advertising campaigns for the launch of new services and products. We have set up marketing guidelines and pursue communications that increase the exposure of our brands and those of our subsidiaries. Our service efforts are aimed at achieving customer and shareholder satisfaction.
Network integration
Each bank is responsible for its information technology systems and distribution network; however, we seek to maximize the effectiveness of our distribution network and the levels of customer service and customer retention across all our banks through our
Red de Grupo Aval
network, which connects all of our banks’ networks. Our network allows each of our banking subsidiaries’ customers to access basic banking services at any ATM or branch office in any of our banks. Although each bank maintains its own information technology system, Grupo Aval works to identify potential synergies and assists in the implementation of technology and products developed at the Grupo Aval level within our banks, and the standardization of technology and processes across our banks. For example, we are developing a new technology model based on service-oriented architecture for our institutions. For a discussion of our current technology projects, see “––
B. Business overview—Other corporate information—Technology.”
Risk factors
We face risks and uncertainties that may affect our future financial and operating performance, including, among others, the following: economic and political conditions in Colombia and other countries in which we operate; internal security issues affecting the countries in which we operate; governmental and regulatory actions and developments affecting our operating subsidiaries and our industry; natural disasters; declines in the quality of our loan portfolio and other assets; adequacy of risk management procedures and systems; counterparty risks; exposures in derivatives transactions; increases in funding costs; changes in interest and exchange rates and other market risks; losses from trading operations; completion and integration of acquisitions, including our recent BAC Credomatic acquisition; failures of information technology and other systems; competition; loss of key members of senior management; and litigation and other legal proceedings. One or more of these matters could negatively affect our business or financial performance as well as our ability to successfully implement our strategy.
Our markets
The majority of our operations are in Colombia, representing 83.5% and 83.3% of our net income and gross loan portfolio respectively, and in the six countries in Central America, representing 16.5% and 16.7% of our net income and gross loan portfolio in each case at and for the year ended December 31, 2011.
We believe that Colombia’s financial system presents significant growth potential given its favorable economic conditions and one of the lowest penetration rates for banking and financial services in Latin America. According to International Monetary Fund data, at December 31, 2010, Colombia’s population and economy were the third and fifth largest in Latin America, respectively. According to DANE, in 2010 Colombia’s population was approximately 45.5 million people and its GDP was Ps 548.3 trillion (U.S.$288.7 billion). Colombia’s GDP per capita increased from Ps 7.93 million in 2005 (U.S.$3,416 using the average exchange rate for that year) to Ps 12.1 million in 2010 (U.S.$6,344 using the average exchange rate for that year).
During the decade ended December 31, 2010, Colombia outperformed the average GDP growth rate for Latin America by 1.1 percentage points, while reducing the country’s dependency on foreign financing as reflected in an external debt to GDP ratio of 22.8% at December 31, 2011. According to IMF data, Colombia has achieved GDP growth every year during the last half century (other than 1999). Unlike other emerging Latin American countries, Colombia has regularly met all principal and interest payments on external debt and has avoided hyperinflation, maintaining a single-digit inflation rate for the ten years ended December 31, 2011. According to the Colombian Central Bank, Colombia’s annual inflation rate for 2011 was 3.7%, close to the 50-year low of 2.0% in 2009. These economic fundamentals, together with Colombia’s record as a stable democracy, account for Colombia’s relative strength during the recent global economic and financial crisis.
During the decade ended December 31, 2011, according to the Superintendency of Finance, Colombia’s financial system grew at a CAGR of 11.5% in terms of loans and 8.9% in terms of deposits, on an inflation-adjusted basis, compared to 4.5% for the country’s GDP during the same period. Despite this recent growth, Colombia’s bank-loans-to-GDP ratio remains relatively low, with an approximate 32.5% ratio at December 31, 2011, according to the Superintendency of Finance. As Colombia’s largest banking group, we believe that we are well-positioned to take advantage of Colombia’s potential for growth in financial services and products. The capitalization of Colombia’s banking sector consists mostly of primary capital (Tier I) with a primary capital (Tier I) to risk-adjusted assets ratio of 10.7% at December 31, 2011, according to the Superintendency of Finance.
We view Central America as a strategic region that meets our expansion criteria. At December 31, 2011, Central America had a total population of approximately 43 million, making it the fourth-largest market in Latin America by population. At the same date, Central America posted an estimated combined GDP of U.S.$164 billion, ranking the region as the eighth-largest economy in Latin America. According to estimates prepared by the IMF, Central America’s GDP is expected to grow at an annual average rate of 4.2% between 2012 and 2014, compared to Colombia’s expected average growth rate of 4.5% during the same period. In terms of banking penetration, Central America had a ratio of private credit to GDP of 47.1% as of December 31, 2010, mainly driven by Panama’s 91.5% ratio. This indicator for the other countries in the region ranges from 32.5% to 50.5%, leading us to believe that growth in the financial sector could outperform GDP growth. Also, we see the additional penetration of credit cards in the population as an important growth opportunity, as Central America currently has a ratio of credit cards to economically active population of 27.4%, which compares to 31.4% in Colombia and 52.5%, 296.8%, 183.0% and 155.8% in Mexico, Chile, Brazil and Argentina, respectively, at December 31, 2009.
Our history
Grupo Aval was created by our chairman, Mr. Sarmiento Angulo, to consolidate his interests in the Colombian financial sector. The milestones in the formation of Grupo Aval were the following:
|
|
·
|
Mr. Sarmiento Angulo established a real estate development firm in Bogotá in 1956, and in 1959 founded Organización Luis Carlos Sarmiento Angulo, which developed low- and middle-income housing neighborhoods in Bogotá in the 1960s and 1970s;
|
|
|
·
|
In 1971, Mr. Sarmiento Angulo acquired a majority stake in Banco de Occidente, and in 1972 founded Corporación de Ahorro y Vivienda Las Villas to focus on low- and middle-income mortgage financing;
|
|
|
·
|
In 1981, Mr. Sarmiento Angulo purchased a minority stake in Banco de Bogotá, and in 1988 he acquired a majority stake and control, consolidating a major participation in the banking system. Banco de Bogotá acquired a substantial majority of, and absorbed, Banco del Comercio in 1992;
|
|
|
·
|
In 1991, Banco de Bogotá and Banco de Occidente founded Porvenir as a severance fund manager, and following the creation in 1993 of the private pension fund system in Colombia, expanded the business to include pension fund management in 1994;
|
|
|
·
|
Banco Popular was acquired in 1996 from the Colombian government through a privatization process;
|
|
|
·
|
In 1997, Mr. Sarmiento Angulo acquired Corporación de Ahorro y Vivienda Ahorramas and merged it with Corporación de Ahorro y Vivienda Las Villas in 2000 to form Banco AV Villas in 2002;
|
|
|
·
|
In 1999, Grupo Aval conducted an initial public offering in Colombia and listed its common shares on the Colombian Stock Exchange under the ticker “GRUPOAVAL.” Grupo Aval’s initial public offering was the first large-scale equity offering of a Colombian company to the general public, which allowed several thousand investors to become our shareholders;
|
|
|
·
|
Corficolombiana, which was founded in 1959 as an affiliate of Banco de Bogotá, acquired and merged with several merchant banks between 1997 and 1999, including Corfitolima, Corfiprogreso, Corfes, Corfiboyacá, Corfisantander, Corfiandes and Indufinanciera. In 2005, Corfivalle, also a merchant bank, and Corficolombiana merged;
|
|
|
·
|
Grupo Aval concluded its third public offering of shares to the Colombian public on May 12, 2011, consisting of 1.6 billion preferred shares at a price of Ps 1,300 (U.S.$0.72 at the representative market rate at such date) per share;
|
|
|
·
|
On December 19, 2011, Banco de Bogotá completed its first international bond offering, raising U.S.$600 million of 5.00% Senior Notes due 2017; and
|
|
|
·
|
On February 1, 2012, we completed our first international bond offering, raising
U.S.$600 million of 5.25% Senior Notes due 2017.
|
In order to provide a single administrative platform for his financial institution holdings, in 1998, Mr. Sarmiento Angulo contributed a majority of his direct and indirect holdings in the financial institutions to Grupo Aval. The
Red de Grupo
Aval
was also established in 1998 to integrate the branches and ATM networks of our banks. In 1999, Grupo Aval listed its shares on the Colombian Stock Exchange, where 2.4% of its share capital was sold to the general public. In 2007, we completed a follow-on offering resulting in a total public float of 7.5% of the total share capital.
Mr. Sarmiento Angulo’s son, Luis Carlos Sarmiento Gutiérrez, became our president in 2000. He is responsible for our day-to-day management.
Since 1998, Grupo Aval has, directly and indirectly, made a series of acquisitions to further extend and consolidate its position as the leading banking group in Colombia, including Banco de Occidente’s acquisition of Banco Aliadas in 2005 and Banco Unión in 2006, the merger of Corfivalle and Corficolombiana in 2005, and Banco de Bogotá’s acquisition of Megabanco in 2006. Pursuant to our growth strategy, on July 15, 2010, we entered into a stock purchase agreement with GE Capital for the acquisition of all of the outstanding shares of BAC Credomatic. We completed the acquisition of BAC Credomatic on December 9, 2010.
On June 23, 2011, Grupo Aval acquired 43.5% of Banco Popular’s outstanding shares held by Rendifin S.A. in exchange for 2,073,115,004 of our preferred shares at a ratio of 1.62 Banco Popular share per Grupo Aval preferred share, and as a result, we increased our direct ownership in Banco Popular to 74.2%.
On September 20, 2011, Grupo Aval acquired additional ownership interests in Banco Popular to increase its direct ownership in Banco Popular to 93.7%. See “Item 7. Major Shareholders and Related Party Transactions—B. Related party transactions—Other transactions with Mr. Sarmiento Angulo and his affiliates—Banco Popular share ownership reorganization.”
Grupo Aval Acciones y Valores S.A. is a
sociedad anónima
, incorporated under the laws of Colombia on January 7, 1994 under the name Administraciones Bancarias S.A. On April 18, 1997, the company changed its name to Sociedad A.B. S.A., and on January 8, 1998, to Grupo Aval Acciones y Valores S.A.
Our operations
We conduct our operations through our four banks (Banco de Bogotá, Banco de Occidente, Banco Popular and Banco AV Villas), our pension and severance fund manager (Porvenir), our merchant bank (Corficolombiana) and our Central American banking group, BAC Credomatic, which we acquired on December 9, 2010. The following chart presents our ownership structure.

|
(1)
|
Corficolombiana held an additional 4.0% beneficial interest in Banco de Occidente at December 31, 2011, due to the merger of Leasing de Occidente into Banco de Occidente in June 2010. These shares are expected to be sold in open-market transactions through the Colombian Stock Exchange.
|
|
(2)
|
Porvenir and Corficolombiana are subsidiaries of Banco de Bogotá, whose financial data is consolidated into Banco de Bogotá’s results. Ownership percentages shown include direct and indirect participation.
|
|
(3)
|
This acquisition was completed on December 9, 2010. BAC Credomatic’s results of operations prior to December 1, 2010 are not included in Grupo Aval’s and Banco de Bogotá’s results that are described in this annual report.
|
We own 64.4% of the share capital of Banco de Bogotá, 68.2% of Banco de Occidente, 93.7% of Banco Popular, 79.9% of Banco AV Villas, 100.0% of Porvenir (20.0% directly and the remainder indirectly through our banks) and 56.4% of Corficolombiana indirectly through our banks, at December 31, 2011. In addition to his interest in Grupo Aval, Mr. Sarmiento Angulo beneficially owns 9.6% of Banco de Bogotá, 13.3% of Banco de Occidente, 0.5% of Banco Popular and 15.4% of Banco AV Villas, at December 31, 2011. We acquired an additional 43.5% of Banco Popular’s outstanding shares from Rendifin S.A., a company beneficially owned by Mr. Sarmiento Angulo on June, 23, 2011 and an additional 19.6% from Popular Securities S.A. and Inversiones Escorial S.A., companies beneficially owned by Mr. Sarmiento Angulo, on September 20, 2011. Each of our banks and Corficolombiana are publicly traded on the Colombian Stock Exchange and the remaining shares in these companies are held by minority shareholders.
We believe that each of our banking subsidiaries, as well as Porvenir, Corficolombiana and BAC Credomatic has an excellent reputation in the market within their individual sectors. Each of our banks and Corficolombiana are publicly-traded on the Colombian Stock Exchange, and the remaining shares in these companies that are not beneficially owned by Mr. Sarmiento Angulo are held by minority shareholders.
Banco de Bogotá
, founded in 1870, is Colombia’s oldest financial institution and the second-largest bank in the country based on total consolidated assets at December 31, 2011 and net income for the year ended December 31, 2011. Banco de Bogotá had market shares of 14.8% of deposits and 13.4% of loans at December 31, 2011. It is also the largest financial institution within our group by assets and the largest contributor of net income before income tax expense and non-controlling interest. Banco de Bogotá is a full-service bank with nationwide coverage and a comprehensive portfolio of services and products, distributed through a network of 626 branches and 1,019 ATMs. While Banco de Bogotá serves all segments in the market through differentiated service and product offerings, it is particularly focused on commercial lending with a market share of 18.3% of commercial loans at December 31, 2011. Banco de Bogotá’s ROAE averaged 25.7% between 2009 and 2011 and was 21.3% for the year ended December 31, 2011. Its efficiency ratio worsened from 39.0% in 2009 to 50.9% for the year ended December 31, 2011 primarily due to the acquisition of BAC Credomatic.
Banco de Occidente
is the fifth-largest bank in Colombia, based on assets and loans at December 31, 2011. It focuses on enterprise customers, state-owned entities and retail customers. Banco de Occidente has strong market shares in the financial leasing business (18.6%, the second-largest market share in the Colombian leasing market, which is comprised of leasing companies and banks). Banco de Occidente’s ROAE averaged 18.4% between 2009 and 2011 and was 15.4% for the year ended December 31, 2011. Its efficiency ratio worsened from 39.8% in 2009 to 46.0% for the year ended December 31, 2011.
Banco Popular
is the pioneer of, and the market leader in, payroll loans and is a premier provider of financial solutions to government entities throughout Colombia. Banco Popular achieved strong returns on its consumer loan portfolio due to its access to payroll deductions for repayment of loans, which results in consumer loans with a substantially lower-risk profile (consumer past due loans of 2.6% compared to a banking system average of 4.2% at December 31, 2011). Banco Popular’s ROAE averaged 23.7% between 2009 and 2011 and was 20.8% for the year ended December 31, 2011. Its efficiency ratio worsened from 46.7% in 2009 to 50.5% for the year ended December 31, 2011.
Banco AV Villas
is a consumer-focused bank, which targets mid- and low-income segments of the population and serves its clients through a nationwide service-point network and an advanced mobile banking platform. It is also Grupo Aval’s most active bank in terms of usage of non-traditional channels (mobile banking, non-banking correspondents and virtual branches). Over the past decade, Banco AV Villas has evolved from being a lender exclusively focused on mortgages to a diversified full-service consumer bank. Banco AV Villas’ risk management systems provide the bank with real-time and in-depth credit quality analyses that allow the bank to approve consumer loans on an accelerated basis. Banco AV Villas’ ROAE averaged 17.6% between 2009 and 2011 and was 18.6% for the year ended December 31, 2011. Its efficiency ratio worsened from 50.3% in 2009 to 59.2% for the year ended December 31, 2011.
Porvenir
is the market leader in the pension and severance fund management business in Colombia, with a 27.3% market share of assets under management at December 31, 2011. Pension funds provide individual savings for retirement, while severance funds provide temporary income to employees who lose their jobs. Porvenir has experienced a decrease in earnings with a -3.5% CAGR for the 2009 to 2011 period. Porvenir is the most profitable
and efficient pension and severance fund manager in the market, with an ROAE that averaged 34.1% between 2009 and 2011 and was 27.1% for the year ended December 31, 2011.
Corficolombiana
is a merchant bank that primarily invests in strategic sectors of the Colombian economy, including infrastructure, energy and finance, and also provides treasury, investment banking and private banking services. Corficolombiana provides Banco de Bogotá with a consistent dividend stream, having declared dividends totaling more than Ps 202 billion (approximately U.S.$104 million) payable to Banco de Bogotá for the year ended December 31, 2011. Corficolombiana’s ROAE averaged 24.0% between 2009 and 2011 and was 21.3% for the year ended December 31, 2011.
BAC Credomatic
is a leading Central American banking group with operations in Costa Rica, El Salvador, Guatemala, Honduras, Nicaragua and Panama. BAC Credomatic is a full-service financial institution with one of the leading credit card issuance and merchant-acquiring franchises in Central America. Its credit card accounts represented
25.7
% of total credit card accounts in Central America (calculated based on BAC Credomatic data and information published by Euromonitor International) at December 31, 2010. It has achieved processing volumes of U.S.$9,661 million for the year ended December 31, 2011 in the merchant acquiring business, which compares favorably to processing volumes of other leading Latin American issuers. BAC Credomatic’s ROAE averaged 22.9% between 2007 and 2011 (excluding extraordinary gains in 2007 and 2008) and was 21.8% for the year ended December 31, 2011.
Competition
We operate in a competitive market. Our principal competitors in Colombia are Bancolombia, Davivienda, and BBVA Colombia, which are the three leading banking groups in Colombia following Grupo Aval.
We are the market leader in Colombia in terms of market share of deposits, loans and our distribution network. Despite the expansion and contraction of recent economic cycles, since 1996, our banks have been more profitable than our principal competitor banks as measured by ROAE. Recently, we have outperformed one or more of our principal competitors under key operational metrics such as the ratio of loans past due more than 30 days over gross loan portfolio and operational efficiency. We believe that these results have been achieved due to our banks’ historically strong franchises, results-oriented philosophy and the Grupo Aval multi-brand business model. These features have also allowed our banks to increase their deposit and loan portfolio market share organically over time, and during times of contraction, our strong balance sheets have allowed for inorganic growth through acquisitions.
Since 2000 through December 2011, we have increased our market share by 6.9% in deposits and 5.8% in loans. Acquisitions have accounted for 3.3% of the increase in deposit market share and 4.1% of the increase in loan market share.
Except where otherwise indicated, the balance sheet and statement of income data for each of our banking subsidiaries included in this annual report reflects its consolidated Colombian Banking GAAP information, while comparative disclosures of the financial and operating performance of our banking subsidiaries and that of our competitors are based on unconsolidated information prepared on the basis of Colombian Banking GAAP reported to the Superintendency of Finance. Our banking subsidiaries report unconsolidated financial data to the Superintendency of Finance; however, Grupo Aval, as a holding company, is not required to report such data. Unless otherwise indicated or the context otherwise requires, market share and other data comparing our performance and that of our competitors reflects the unconsolidated results of our banking subsidiaries.
Banks, financing companies and finance corporations are deemed credit institutions under Colombian banking regulations, and are the principal institutions authorized to accept deposits and make loans in Colombia. Banks undertake traditional deposit-taking and lending activities. Financing companies place funds in circulation by means of active credit operations, with the purpose of fostering the sale of goods and services, including the development of leasing operations. Finance corporations invest directly in the economy and thus are the only vehicle through which a bank may invest in non-financial sectors. See “—Supervision and regulation.” We operate four banks, one financing company and one finance corporation, and our market share is determined by comparing our banks to other banks reporting their results to the Superintendency of Finance; however, if market share data including financing companies and finance corporations is considered, our market shares would generally be lower than in a
bank-only comparison and the gaps between our market shares and those of our competitors would be smaller, but our market leadership in most market categories would be unaffected.
In addition to our market-leading banking business, we are the market leader in the pension and severance fund management market through Porvenir. Porvenir also has the largest share of individual customers and funds under management in the severance fund and mandatory pension fund markets.
Corficolombiana is the largest finance corporation in Colombia.
Market share and other data from unconsolidated financial information
The following market share and other data comparing us and our banking subsidiaries to our competitors is based on information derived from unconsolidated financial information reported to the Superintendency of Finance by commercial banks based on Colombian Banking GAAP.
Deposits
We have the largest market share of total deposits, with an aggregate of 29.5% of all deposits in Colombia at December 31, 2011. Our principal competitor banks—Bancolombia, Davivienda and BBVA Colombia—had market shares of 19.6%, 11.5%, and 9.8%, respectively at December 31, 2011. At December 31, 2011, we had increased our market share of total deposits by 6.9% since 2000, primarily through acquisitions.
The following graph presents the market share of deposits in Colombia for the period from 2007 to 2011.
Market share by deposits

|
(1)
|
Grupo Aval figures reflect aggregated amounts of our banking subsidiaries.
|
The following table presents a breakdown of market share of deposits by type of deposit at December 31, 2011.
|
At December 31, 2011
|
||||||||||||||||||||
|
Grupo Aval (aggregate) (1)
|
Bancolombia
|
Davivienda
|
BBVA Colombia
|
Rest of the Colombian market
|
||||||||||||||||
|
(in percentages)
|
||||||||||||||||||||
|
Checking accounts
|
38.0 | 22.5 | 9.5 | 9.1 | 20.8 | |||||||||||||||
|
Savings accounts
|
28.4 | 22.3 | 12.9 | 11.7 | 24.6 | |||||||||||||||
|
Time deposits
|
27.7 | 13.3 | 11.2 | 7.7 | 40.1 | |||||||||||||||
|
Other deposits (2)
|
12.1 | 12.8 | 3.4 | 4.2 | 67.5 | |||||||||||||||
|
Total deposits
|
29.5 | 19.6 | 11.5 | 9.8 | 29.7 | |||||||||||||||
|
(1)
|
Grupo Aval figures reflect aggregated amounts of our banking subsidiaries.
|
|
(2)
|
Other deposits consist of correspondent bank deposits, cashier checks and collection services.
|
At December 31, 2011, deposits represented a larger share of our total funding than that of most of our principal competitor banks, and we had a higher concentration of checking accounts, which are generally the lowest cost source of funds. Our funding mix yielded a lower average cost of funds than that of most of our principal competitor banks at December 31, 2011. The table below present the total funding mix of the market at December 31, 2011.
|
At December 31, 2011
|
||||||||||||||||||||
|
Grupo Aval (aggregate)
(1)
|
Bancolombia
|
Davivienda
|
BBVA Colombia
|
Rest of the Colombian market
|
||||||||||||||||
|
(in percentages)
|
||||||||||||||||||||
|
Funding:
|
||||||||||||||||||||
|
Deposits
|
82.0 | 73.4 | 75.0 | 83.5 | 76.2 | |||||||||||||||
|
Other funding
|
18.0 | 26.6 | 25.0 | 16.5 | 23.8 | |||||||||||||||
|
Total funding
|
100.0 | 100.0 | 100.0 | 100.0 | 100.0 | |||||||||||||||
|
Deposits:
|
||||||||||||||||||||
|
Checking accounts
|
24.6 | 21.9 | 15.9 | 17.7 | 13.4 | |||||||||||||||
|
Savings accounts
|
48.5 | 57.3 | 56.5 | 59.7 | 41.7 | |||||||||||||||
|
Time deposits
|
25.4 | 18.3 | 26.5 | 21.1 | 36.5 | |||||||||||||||
|
Other deposits
|
1.5 | 2.4 | 1.1 | 1.6 | 8.4 | |||||||||||||||
|
Total deposits
|
100.0 | 100.0 | 100.0 | 100.0 | 100.0 | |||||||||||||||
|
Average funding rate:
|
||||||||||||||||||||
|
Average deposit rate
|
2.9 | 2.5 | 2.6 | 2.8 | 2.9 | |||||||||||||||
|
Average other funding rate
|
4.4 | 5.1 | 5.2 | 5.5 | 4.9 | |||||||||||||||
|
Average total funding rate
|
3.2 | 3.2 | 3.2 | 3.3 | 3.4 | |||||||||||||||
|
(1)
|
Grupo Aval figures reflect aggregated amounts of our banking subsidiaries.
|
Loans
We have the largest market share of loans, with an aggregate of 28.3% of all loans at December 31, 2011. Our principal competitors banks—Bancolombia, Davivienda and BBVA Colombia—had market shares of 21.9%, 12.8% and 9.4%, respectively. At December 31, 2011, we had increased our market share by 3.3% since 2005 and by 5.8% since 2000, primarily through acquisitions.
The following graph presents the market share of loans in Colombia for the period from 2007 to 2011.
Market share by loans
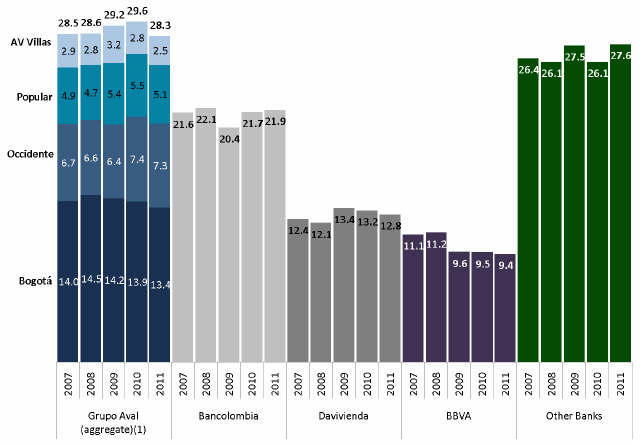
|
(1)
|
Grupo Aval figures reflect aggregated amounts of our banking subsidiaries.
|
The following table presents a breakdown of the market share of loans by category at December 31, 2011.
|
At December 31, 2011
|
||||||||||||||||||||
|
Grupo Aval (aggregate) (1)
|
Bancolombia
|
Davivienda
|
BBVA Colombia
|
Rest of the Colombian market
|
||||||||||||||||
|
(in percentages)
|
||||||||||||||||||||
|
Commercial
|
31.5 | 28.0 | 11.4 | 7.1 | 22.0 | |||||||||||||||
|
Consumer
|
27.7 | 13.8 | 15.2 | 10.2 | 33.2 | |||||||||||||||
|
Microcredit
|
5.1 | 5.0 | – | – | 89.8 | |||||||||||||||
|
Mortgages
|
4.7 | 25.9 | 15.9 | 27.8 | 25.7 | |||||||||||||||
|
Financial leases
|
44.8 | 1.6 | 17.4 | 7.6 | 28.7 | |||||||||||||||
|
Total
|
28.3 | 21.9 | 12.8 | 9.4 | 27.6 | |||||||||||||||
|
(1)
|
Grupo Aval figures reflect aggregated amounts of our banking subsidiaries.
|
Our banks have been strategically focused on developing commercial and consumer loans, including payroll loans, and limiting their exposure to mortgage loans. Consistent with our strategy, at December 31, 2011, our combined loan portfolio had a higher portion of commercial and consumer loans, in particular payroll loans and a lower portion of mortgage loans than the market average.
The following table presents the distribution by loan category of the market at December 31, 2011.
|
At December 31, 2010
|
||||||||||||||||||||
|
Grupo Aval (aggregate) (1)
|
Bancolombia
|
Davivienda
|
BBVA Colombia
|
Rest of the Colombian market
|
||||||||||||||||
|
(in percentages)
|
||||||||||||||||||||
|
Commercial
|
63.1 | 72.3 | 50.5 | 42.9 | 45.1 | |||||||||||||||
|
Consumer
|
27.3 | 17.6 | 33.2 | 30.2 | 33.6 | |||||||||||||||
|
Microcredit
|
0.5 | 0.6 | – | – | 9.0 | |||||||||||||||
|
Mortgages
|
1.3 | 9.1 | 9.6 | 22.8 | 7.2 | |||||||||||||||
|
Financial leases
|
7.8 | 0.4 | 6.7 | 4.0 | 5.2 | |||||||||||||||
|
Total
|
100.0 | 100.0 | 100.0 | 100.0 | 100.0 | |||||||||||||||
|
(1)
|
Grupo Aval figures reflect aggregated amounts of our banking subsidiaries.
|
Loan portfolio quality
We believe that the credit quality of our loan portfolio compares favorably with that of our principal competitors. The following table presents credit quality metrics for our loan portfolio at the dates indicated.
|
At December 31,
|
||||||||||||||||||||||||||||||||
|
Loans past due more than 30 days / gross loan portfolio
|
Loans rated C, D or E / gross loan portfolio
|
Provision expense / gross loan portfolio
|
Allowance / loans past due more than 30 days
|
|||||||||||||||||||||||||||||
|
2011
|
2010
|
2011
|
2010
|
2011
|
2010
|
2011
|
2010
|
|||||||||||||||||||||||||
|
(in percentages)
|
||||||||||||||||||||||||||||||||
|
Banco de Bogotá
|
1.6 | 2.3 | 2.7 | 3.7 | 2.8 | 3.4 | 194.0 | 159.1 | ||||||||||||||||||||||||
|
Banco de Occidente
|
2.5 | 2.8 | 4.0 | 4.8 | 3.6 | 5.1 | 158.1 | 163.1 | ||||||||||||||||||||||||
|
Banco Popular
|
2.1 | 2.5 | 3.2 | 3.9 | 2.9 | 3.6 | 182.3 | 167.1 | ||||||||||||||||||||||||
|
Banco AV Villas
|
3.6 | 4.5 | 3.1 | 3.3 | 4.2 | 5.4 | 133.1 | 128.7 | ||||||||||||||||||||||||
|
Grupo Aval (aggregate) (1)
|
2.1 | 2.6 | 3.2 | 3.9 | 3.1 | 4.0 | 171.8 | 156.6 | ||||||||||||||||||||||||
|
Bancolombia
|
2.2 | 2.8 | 3.3 | 3.6 | 3.0 | 3.8 | 199.5 | 173.6 | ||||||||||||||||||||||||
|
Davivienda
|
3.9 | 3.7 | 3.5 | 3.6 | 6.2 | 6.5 | 125.9 | 144.2 | ||||||||||||||||||||||||
|
BBVA Colombia
|
2.4 | 3.2 | 2.5 | 3.5 | 2.9 | 4.7 | 161.5 | 133.9 | ||||||||||||||||||||||||
|
Rest of the Colombian market
|
3.6 | 3.7 | 5.0 | 5.4 | 4.3 | 5.0 | 151.4 | 143.6 | ||||||||||||||||||||||||
|
(1)
|
Grupo Aval figures reflect aggregated amounts of our banking subsidiaries.
|
Branches and ATM network
Through our banking subsidiaries we have the largest banking network in Colombia, with 1,265 branches and 2,649 ATMs at December 31, 2011. The following table presents the distribution of branches and ATMs across the market at December 31, 2011.
|
At December 31, 2011
|
||||||||||||||||
|
Branches
|
ATMs
|
|||||||||||||||
|
# of
branches
|
Market
share %
|
# of
ATMs
|
Market
share %
|
|||||||||||||
|
Grupo Aval (aggregate) (1)
|
1,265 | 25.7 | % | 2,649 | 24.3 | % | ||||||||||
|
Bancolombia
|
758 | 15.4 | % | 2,876 | 26.4 | % | ||||||||||
|
Davivienda
|
559 | 11.3 | % | 1,445 | 13.3 | % | ||||||||||
|
BBVA Colombia
|
339 | 6.9 | % | 952 | 8.8 | % | ||||||||||
|
Rest of the Colombian market
|
2,006 | 40.7 | % | 2,957 | 27.2 | % | ||||||||||
|
(1)
|
Grupo Aval figures reflect aggregated amounts of our banking subsidiaries.
|
Competition and other data from consolidated financial information
The following information on Grupo Aval and our subsidiaries is based on consolidated financial information at and for the years ended December 31, 2011, 2010 and 2009. Competition and other data that compare us and our subsidiaries to Bancolombia, our main competitor, is readily obtained given that Bancolombia also prepares and publishes detailed consolidated financial information. Our other principal competitors, Davivienda and BBVA, publish financial information with a lesser degree of detail; therefore, we only refer to these competitors where applicable based on publicly available information.
Profitability
We are the most profitable banking group in Colombia based on ROAE, as compared to our principal competitors, for the years ended December 31, 2011, 2010 and 2009.
ROAE
The following table presents the ROAE for each of our banks, Grupo Aval, and our principal competitors for the periods indicated.
|
Year ended December 31,
|
||||||||||||
|
2011
|
2010
|
2009
|
||||||||||
|
ROAE (1)
|
(in percentages)
|
|||||||||||
|
Banco de Bogotá
|
21.3 | 24.9 | 31.1 | |||||||||
|
Banco de Occidente
|
15.4 | 17.1 | 22.8 | |||||||||
|
Banco Popular
|
20.8 | 23.8 | 26.5 | |||||||||
|
Banco AV Villas
|
18.6 | 18.4 | 15.8 | |||||||||
|
Grupo Aval
|
20.3 | 22.2 | 29.2 | |||||||||
|
Bancolombia
|
19.6 | 19.2 | 19.1 | |||||||||
|
Davivienda
|
15.1 | 18.5 | 18.6 | |||||||||
|
BBVA Colombia
|
20.2 | 19.8 | 19.9 | |||||||||
|
(1)
|
For methodology used to calculate ROAE, see note 3 to the table under “Item 3. Key Information—A. Selected financial data—Other financial and operating data.”
|
ROAA
The following table presents the ROAA for each of our banks, Grupo Aval and our principal competitors, for the periods indicated.
|
Year ended December 31,
|
||||||||||||
|
2011
|
2010
|
2009
|
||||||||||
|
ROAA (1)
|
(in percentages)
|
|||||||||||
|
Banco de Bogotá
|
2.6 | 2.9 | 4.4 | |||||||||
|
Banco de Occidente
|
2.1 | 2.1 | 2.5 | |||||||||
|
Banco Popular
|
2.8 | 3.1 | 2.9 | |||||||||
|
Banco AV Villas
|
2.3 | 2.2 | 2.0 | |||||||||
|
Grupo Aval
|
2.3 | 2.2 | 3.2 | |||||||||
|
Bancolombia
|
2.2 | 2.2 | 2.1 | |||||||||
|
Davivienda
|
1.9 | 2.1 | 1.9 | |||||||||
|
BBVA Colombia
|
2.0 | 2.1 | 1.9 | |||||||||
|
(1)
|
For methodology used to calculate ROAA, see note (2) to the table under “Item 3. Key Information—A. Selected financial data—Other financial and operating data.”
|
Regulatory capital
Banks in Colombia are required to have regulatory capital of at least 9.0% of risk-weighted assets plus a risk premium calculated pursuant to the rules of the Superintendency of Finance. For a description of these requirements, see “—Supervision and regulation—Capital adequacy requirements.” Our banks are well-capitalized under Colombian regulatory capital requirements, and we believe that our current capitalization provides us with substantial flexibility to expand our operations.
The tables below present our capitalization (on an aggregate basis), the capitalization of our banking subsidiaries, and the capitalization of our principal competitors at December 31, 2011. Grupo Aval is not subject to capital requirements other than those that apply to its subsidiaries; therefore, we believe that our capitalization on an aggregate basis provides a more meaningful measure than our regulatory capital adequacy.
|
At December 31, 2011
|
||||||||||||||||||||||||||||||||
|
Grupo Aval entities
|
Bancolombia
|
Davivienda
|
BBVA Colombia
|
|||||||||||||||||||||||||||||
|
Banco de Bogotá
|
Banco de Occidente
|
Banco Popular
|
Banco AV Villas
|
Aggregate
(3)
|
||||||||||||||||||||||||||||
|
(in percentages)
|
||||||||||||||||||||||||||||||||
|
Consolidated:
|
||||||||||||||||||||||||||||||||
|
Primary capital (Tier I) (1)
|
12.0 | 8.7 | 9.1 | 12.5 | 11.0 | 9.0 | 11.4 | 9.5 | ||||||||||||||||||||||||
|
Secondary capital (Tier II) (2)
|
1.4 | 1.3 | 2.6 | 1.8 | 1.5 | 3.5 | 3.0 | 2.8 | ||||||||||||||||||||||||
|
Total consolidated capitalization
|
13.3 | 10.1 | 11.7 | 14.2 | 12.6 | 12.5 | 14.4 | 12.3 | ||||||||||||||||||||||||
|
(1)
|
Includes primary capital and reserves. See “—Supervision and regulation—Capital adequacy requirements.”
|
|
(2)
|
Includes primarily subordinated debt and unrealized gains on certain assets, including real estate. See “—Supervision and regulation—Capital adequacy requirements.”
|
|
(3)
|
Grupo Aval figures reflect aggregated regulatory capital of our banking subsidiaries.
|
Porvenir and Corficolombiana are controlled by Banco de Bogotá. Banco de Occidente and Banco Popular hold non-controlling interests in Corficolombiana and Banco de Occidente holds a non-controlling interest in Porvenir. In calculating a bank’s regulatory capital, Colombian regulations require banks to deduct from capital the corresponding amount of their non-controlling interests, regardless of whether these investments and the bank are controlled by the same entity. This accounting treatment lowers Banco de Bogotá’s, Banco de Occidente’s and Banco Popular’s consolidated regulatory capital by 33 basis points, 389 basis points and 179 basis points, respectively, at December 31, 2011.
Capitalization ratio
s
The following table presents consolidated capitalization ratios for our banking subsidiaries, Grupo Aval and our principal
competitors
at December 31, 2011.
|
At December 31, 2011
|
|||||||||||||||||||||||||||||||||||||
|
Grupo Aval entities
|
|||||||||||||||||||||||||||||||||||||
|
Colombian Banking GAAP
|
Banco de Bogotá
|
Banco de Occidente
|
Banco Popular
|
Banco AV Villas
|
Aggregate (1)
|
Grupo Aval consolidated
|
Bancolombia
|
Davivienda
|
BBVA Colombia
|
||||||||||||||||||||||||||||
|
(in percentages)
|
|||||||||||||||||||||||||||||||||||||
|
Tangible equity ratio (2)
|
10.0 | 13.5 | 13.6 | 12.3 | 11.4 | 9.2 | 9.9 | 10.3 | 8.3 | ||||||||||||||||||||||||||||
|
Tier 1 ratio (3)
|
12.0 | 8.7 | 9.1 | 12.5 | 11.0 | – | 9.0 | 11.4 | 9.5 | ||||||||||||||||||||||||||||
|
Solvency ratio (4)
|
13.3 | 10.1 | 11.7 | 14.2 | 12.6 | – | 12.5 | 14.4 | 12.3 | ||||||||||||||||||||||||||||
|
(1)
|
Reflects the summation of calculated amounts for each line item for each of our banking subsidiaries.
|
|
(2)
|
Tangible equity ratio is calculated as total shareholders’ equity plus minority interest minus goodwill, divided by total assets minus goodwill. See “Item 3. Key Information—A. Selected financial data—Non-GAAP measures reconciliation.”
|
|
(3)
|
Tier 1 ratio is calculated as primary capital divided by risk-weighted assets.
|
|
(4)
|
Solvency ratio is calculated as technical capital divided by risk-weighted assets. For a definition of technical capital, see “—B. Business overview—Supervision and regulation—Capital adequacy requirements.”
|
|
|
Tangible solvency ratio differs from solvency ratio. Tangible solvency ratio is calculated as technical capital minus goodwill, divided by risk-weighted assets minus goodwill. The tangible solvency ratios for the following entities at December 31, 2011 were: Banco de Bogotá 9.3%, Banco de Occidente 9.9%, Banco Popular 11.7%, Banco AV Villas 14.2%, Grupo Aval (aggregate) 10.0%, Bancolombia 11.7%, Davivienda 11.3% and BBVA Colombia 10.5%.
|
Operational efficiency
Grupo Aval’s efficiency ratio of 52.7% for the year ended December 31, 2011 makes us one of the most efficient banking groups in Colombia. Efficiency ratio is calculated as operating expense minus depreciation and goodwill amortization divided by total operating income plus total net provisions.
The following table presents efficiency ratios for our banks, Grupo Aval, Bancolombia, Davivienda and BBVA at December 31, 2011, 2010 and 2009.
|
At December 31,
|
||||||||||||
|
2011
|
2010
|
2009
|
||||||||||
|
(in percentages)
|
||||||||||||
|
Banco de Bogotá
|
50.9 | 40.1 | 39.0 | |||||||||
|
Banco de Occidente
|
46.0 | 44.5 | 39.8 | |||||||||
|
Banco Popular
|
50.5 | 47.6 | 46.7 | |||||||||
|
Banco AV Villas
|
59.2 | 53.9 | 50.3 | |||||||||
|
Grupo Aval
|
52.7 | 46.6 | 42.9 | |||||||||
|
Bancolombia
|
53.2 | 51.7 | 46.4 | |||||||||
|
Davivienda
|
47.2 | 50.8 | 49.8 | |||||||||
|
BBVA
|
49.9 | 50.2 | 54.8 | |||||||||
Loan portfolio quality
We believe that the credit quality of our loan portfolio compares favorably with that of our principal competitor. The following table presents credit quality metrics for the loan portfolio of our banks and for Bancolombia, at December 31, 2011 and 2010.
|
At December 31,
|
||||||||||||||||||||||||||||||||
|
Loans past due more than 30 days / gross loan portfolio
|
Loans rated C, D or E / gross loan portfolio
|
Provision expense / gross loan portfolio
|
Allowance / loans past due more than 30 days
|
|||||||||||||||||||||||||||||
|
2011
|
2010
|
2011
|
2010
|
2011
|
2010
|
2011
|
2010
|
|||||||||||||||||||||||||
|
(in percentages)
|
||||||||||||||||||||||||||||||||
|
Banco de Bogotá
|
1.9 | 2.5 | 2.8 | 3.7 | 2.3 | 2.3 | 140.9 | 124.6 | ||||||||||||||||||||||||
|
Banco de Occidente
|
2.5 | 2.8 | 4.1 | 4.7 | 3.6 | 5.0 | 158.4 | 163.3 | ||||||||||||||||||||||||
|
Banco Popular
|
2.1 | 2.5 | 3.2 | 3.8 | 2.8 | 3.7 | 184.3 | 167.5 | ||||||||||||||||||||||||
|
Banco AV Villas
|
3.6 | 4.5 | 3.1 | 3.3 | 4.2 | 5.4 | 133.1 | 128.7 | ||||||||||||||||||||||||
|
Grupo Aval
|
2.2 | 2.7 | 3.2 | 3.9 | 2.8 | 3.3 | 150.0 | 139.1 | ||||||||||||||||||||||||
|
Bancolombia
|
2.2 | 2.9 | 3.8 | 4.3 | 2.9 | 3.8 | 209.8 | 179.9 | ||||||||||||||||||||||||
Pension and severance fund management – Porvenir
Porvenir is the largest pension fund administrator in Colombia in terms of funds under management and has the largest share of earnings in the pension and severance fund management market in Colombia. Porvenir’s principal competitors are other pension fund administrators, including Protección, BBVA Horizonte, ING, Colfondos and Skandia. Grupo de Inversiones Suramericana, which holds a significant interest in Protección, has acquired ING’s pension fund operations.
Porvenir also has under management the largest share of individual customers of mandatory pension funds and assets. It also has had a higher ROAE than the average of the AFPs in Colombia in 2010 and 2011.
The following table presents the market shares of the main market participants with respect to assets under management and individual customers of mandatory pension funds at December 31, 2011, and net income for the year ended December 31, 2011.
|
At and for the year ended December 31, 2011
|
||||||||||||||||||||||||
|
Porvenir
|
Protección
|
BBVA
Horizonte
|
Colfondos
|
ING
|
Skandia
|
|||||||||||||||||||
|
(in percentages)
|
||||||||||||||||||||||||
|
Individual customers to pension funds:
|
||||||||||||||||||||||||
|
Mandatory
|
32.0 | 21.3 | 17.8 | 16.0 | 12.2 | 0.8 | ||||||||||||||||||
|
Severance
|
29.4 | 20.2 | 27.6 | 10.8 | 11.3 | 0.7 | ||||||||||||||||||
|
Voluntary
|
23.0 | 34.1 | 10.8 | 9.0 | 5.6 | 17.5 | ||||||||||||||||||
|
Funds under management:
|
||||||||||||||||||||||||
|
Mandatory
|
27.8 | 25.4 | 15.9 | 14.0 | 11.7 | 5.2 | ||||||||||||||||||
|
Severance
|
33.1 | 26.0 | 16.9 | 9.8 | 12.0 | 2.2 | ||||||||||||||||||
|
Voluntary
|
18.9 | 31.4 | 4.2 | 4.5 | 5.0 | 36.1 | ||||||||||||||||||
|
Total
|
27.3 | 25.9 | 14.9 | 13.0 | 11.2 | 7.6 | ||||||||||||||||||
|
Net income:
|
46.1 | 15.8 | 17.6 | 8.3 | (1.5 | ) | 13.6 | |||||||||||||||||
Merchant banking – Corficolombiana
Corficolombiana is the largest merchant bank in Colombia in terms of assets and equity at December 31, 2011. Corficolombiana faces competition from local and global banks focused on merchant and investment banking. Bancolombia, through its subsidiary Banca de Inversión Bancolombia S.A., is Corficolombiana’s largest local competitor. On an international level, Corficolombiana faces competition from global banks with local investment banking operations. In addition, as an equity investor, Corficolombiana faces competition from other equity investors such as hedge funds, private equity firms and others.
The following table presents the market shares of Corficolombiana and its principal competitors by assets, liabilities and equity at December 31, 2011, 2010 and 2009.
|
Assets
|
Liabilities
|
Equity
|
||||||||||||||||||||||||||||||||||
|
At December 31,
|
At December 31,
|
At December 31,
|
||||||||||||||||||||||||||||||||||
|
2011
|
2010
|
2009
|
2011
|
2010
|
2009
|
2011
|
2010
|
2009
|
||||||||||||||||||||||||||||
|
(in percentages)
|
||||||||||||||||||||||||||||||||||||
|
Corficolombiana
|
85.8 | 83.7 | 86.4 | 92.8 | 88.0 | 93.1 | 76.8 | 79.1 | 78.7 | |||||||||||||||||||||||||||
|
Banca de Inversión Bancolombia S.A.
|
5.5 | 6.0 | 5.8 | 0.9 | 1.2 | 1.3 | 11.4 | 11.1 | 11.0 | |||||||||||||||||||||||||||
|
J.P. Morgan Corporación Financiera S.A.
|
7.6 | 10.3 | 7.8 | 6.2 | 10.8 | 5.6 | 9.2 | 9.7 | 10.3 | |||||||||||||||||||||||||||
|
BNP Paribas Colombia Corporación Financiera S.A.(1)
|
1.2 | – | – | 0.1 | – | – | 2.6 | – | – | |||||||||||||||||||||||||||
|
(1)
|
BNP Paribas Corporación Financiera S.A. was incorporated in 2011.
|
Colombian banking business overview
Our differentiated multi-brand business model builds on the individual strengths of our banks and the wide recognition of their brands. Each of our banks has developed over time a focus on particular and, to a degree, overlapping market sectors, geographic regions and services and products. As a group, we are present in all banking businesses in Colombia, as shown in the following chart.

Through the subsidiaries of our banks, we also offer fiduciary, bonded warehousing and brokerage transactions, and provide deposit and lending operations in foreign currencies. Through Corficolombiana, we operate as a merchant and investment bank, and, through Porvenir, we participate in pension and severance fund management.
Enterprise customers
Our banks provide services and products to public and private sector customers. Our banks segment their enterprise customers into separate categories based principally on their annual revenues. We believe that these customer classifications, which are unique to each bank, allow our entities to tailor their services and products to the needs of each customer classification sector.
At December 31, 2011, our banks had an aggregate of approximately 251,100 enterprise customers, which may include customer overlap among our banks, an increase of 19.7% over approximately 209,700 enterprise customers at December 31, 2010. The following table presents the number of enterprise customers that our banks served at December 31, 2011 and 2010.
|
Grupo Aval
|
||||||||||||||||||||
|
Banco de Bogotá
|
Banco de Occidente
|
Banco Popular
|
Banco AV Villas
|
Aggregate (1)
|
||||||||||||||||
|
(in thousands)
|
||||||||||||||||||||
|
Total enterprise customers:
|
||||||||||||||||||||
|
2011
|
153.6 | 62.5 | 7.3 | 27.7 | 251.1 | |||||||||||||||
|
2010
|
114.4 | 60.1 | 6.7 | 28.4 | 209.7 | |||||||||||||||
|
(1)
|
Reflects aggregated amounts of our banking subsidiaries.
|
Individual customers
Our banks provide services and products to individuals throughout Colombia. Our banks classify their individual banking customers into separate categories based principally on income.
At December 31, 2011, our banks had a total of approximately 7,143,600 individual customers, an increase of 11.4% over approximately 6,414,800 individual customers at December 31, 2010. Customers of more than one of our banking subsidiaries are counted separately for each banking subsidiary.
The following table presents the number of individual customers that our banks served at December 31, 2011 and 2010.
|
Grupo Aval
|
||||||||||||||||||||
|
Banco de Bogotá
|
Banco de Occidente
|
Banco Popular
|
Banco AV Villas
|
Aggregate (1)
|
||||||||||||||||
|
(in thousands)
|
||||||||||||||||||||
|
Total individual customers:
|
||||||||||||||||||||
|
2011
|
3,071.9 | 441.8 | 2,533.8 | 1,096.1 | 7,143.6 | |||||||||||||||
|
2010
|
2,807.6 | 425.3 | 2,106.6 | 1,075.2 | 6,414.8 | |||||||||||||||
|
(1)
|
Reflects aggregated amounts of our banking subsidiaries.
|
Lending activities
In accordance with Superintendency of Finance guidelines, we classify our banks’ loans into the following categories: commercial, consumer, microcredit, mortgages and financial leasing.
The following table presents our loan portfolio at December 31, 2011.
|
At December 31, 2011
|
||||||||||||||||||||||||
|
Grupo Aval entities
|
Grupo Aval consolidated (3)(4)
|
|||||||||||||||||||||||
|
Banco de Bogotá
|
Banco de Occidente
|
Banco Popular
|
Banco AV Villas
|
Aggregate (2)
|
||||||||||||||||||||
|
(in Ps billions)
|
||||||||||||||||||||||||
|
Commercial
|
25,434.3 | 8,619.6 | 4,407.7 | 2,119.0 | 40,580.5 | 40,545.5 | ||||||||||||||||||
|
Consumer
|
9,282.1 | 2,805.9 | 5,411.9 | 2,236.0 | 19,735.9 | 19,735.9 | ||||||||||||||||||
|
Microcredit (1)
|
240.7 | – | 20.8 | 22.7 | 284.2 | 284.2 | ||||||||||||||||||
|
Mortgages
|
3,444.7 | – | 92.8 | 680.9 | 4,218.4 | 4,218.4 | ||||||||||||||||||
|
Financial leasing
|
1,633.3 | 3,288.3 | 264.2 | – | 5,185.8 | 5,163.8 | ||||||||||||||||||
|
Total
|
40,035.0 | 14,713.8 | 10,197.3 | 5,058.6 | 70,004.7 | 69,947.7 | ||||||||||||||||||
|
(1)
|
Microcredit loans are issued for the purpose of encouraging the activities of small businesses and are subject to the following requirements: the maximum amount to be lent is equal to 25 times the minimum wage (
salario mínimo mensual legal vigente
) without the balance of one single borrower exceeding such amount at any time, and the main source of payment for the corresponding obligation shall be the revenues obtained from the activities of the borrower’s micro business. The borrower’s outstanding indebtedness may not exceed 120 times the minimum wage.
|
|
(2)
|
Reflects aggregated amounts of our banking subsidiaries.
|
|
(3)
|
Includes eliminations for intercompany or intra-group operations between Grupo Aval subsidiaries.
|
|
(4)
|
Reflects Banco de Bogotá consolidated figures which include BAC Credomatic’s operations.
|
As of December 31, 2011, the aggregate outstanding loans to our banks’ ten-largest borrowers, our 11th to 50th-largest borrowers and our 51st to 160th-largest borrowers, represented
6.4
%,
9.9
% and
7.5%,
respectively, of our consolidated total loan portfolio.
Commercial loans
Our commercial loan portfolio consists of general purpose loans (loans with a maturity of over one year), working capital loans (loans with a maturity of up to one year), loans funded by development banks, corporate credit cards and overdraft loans. Loans funded by development banks are loans granted to customers and focused on specific economic sectors and are funded by national or international government or government-related institutions.
The following table presents our commercial loan portfolio at December 31, 2011.
|
At December 31, 2011
|
||||||||||||||||||||||||
|
Grupo Aval entities
|
||||||||||||||||||||||||
|
Banco de Bogotá (3)
|
Banco de Occidente
|
Banco Popular
|
Banco AV Villas
|
Aggregate (1)(3)
|
Grupo Aval consolidated (2)(3)
|
|||||||||||||||||||
|
(in Ps billions)
|
||||||||||||||||||||||||
|
General purpose loans
|
16,861.7 | 5,811.3 | 3,520.5 | 1,979.5 | 28,172.9 | 28,138.0 | ||||||||||||||||||
|
Loans funded by development banks
|
939.3 | 396.8 | 407.6 | 127.7 | 1,871.4 | 1,871.4 | ||||||||||||||||||
|
Working capital loans
|
7,344.2 | 2,300.1 | 467.5 | – | 10,111.8 | 10,111.8 | ||||||||||||||||||
|
Credit cards
|
135.2 | 44.3 | 2.1 | 1.9 | 183.5 | 183.5 | ||||||||||||||||||
|
Overdrafts
|
153.9 | 67.1 | 9.9 | 9.9 | 240.8 | 240.8 | ||||||||||||||||||
|
Total
|
25,434.3 | 8,619.6 | 4,407.7 | 2,119.0 | 40,580.5 | 40,545.5 | ||||||||||||||||||
|
(1)
|
Reflects aggregated amounts of our banking subsidiaries.
|
|
(2)
|
Includes eliminations for intercompany or intra-group operations between Grupo Aval subsidiaries.
|
|
(3)
|
Reflects Banco de Bogotá consolidated figures which include BAC Credomatic’s operations.
|
Consumer loans
Our consumer loan portfolio consists of personal loans, automobile and other vehicle loans, credit cards, overdrafts, loans funded by development banks and general purpose loans. Personal loans consist primarily of payroll loans. A payroll loan is a short- or medium-term loan, where payments are deducted directly from an employer’s salary.
The following table presents our consumer loan portfolio at December 31, 2011.
|
At December 31, 2011
|
||||||||||||||||||||||||
|
Grupo Aval entities
|
||||||||||||||||||||||||
|
Banco de Bogotá (4)
|
Banco de Occidente
|
Banco Popular
|
Banco AV Villas
|
Aggregate (1)(4)
|
Grupo Aval
Consolidated (2)(4)
|
|||||||||||||||||||
|
(in Ps billions)
|
||||||||||||||||||||||||
|
Personal loans
|
4,048.6 | 1,106.4 | 5,321.8 | 2,020.5 | 12,497.3 | 12,497.3 | ||||||||||||||||||
|
Automobile and other vehicle loans
|
1,482.4 | 1,065.0 | 16.3 | – | 2,563.7 | 2,563.7 | ||||||||||||||||||
|
Credit cards
|
3,699.2 | 469.4 | 67.6 | 213.6 | 4,449.8 | 4,449.8 | ||||||||||||||||||
|
Overdrafts
|
51.8 | 9.9 | 1.3 | 1.9 | 64.9 | 64.9 | ||||||||||||||||||
|
Loans funded by development banks
|
– | – | 0.2 | – | 0.2 | 0.2 | ||||||||||||||||||
|
General purpose loans
|
0.0 | 155.3 | 4.7 | – | 160.0 | 160.0 | ||||||||||||||||||
|
Working capital loans
|
– | – | – | – | – | – | ||||||||||||||||||
|
Total (3)
|
9,282.1 | 2,805.9 | 5,411.9 | 2,236.0 | 19,735.9 | 19,735.9 | ||||||||||||||||||
|
(1)
|
Reflects aggregated amounts of our banking subsidiaries.
|
|
(2)
|
Includes eliminations for intercompany or intra-group operations between Grupo Aval subsidiaries.
|
|
(3)
|
Includes microcredit loans.
|
|
(4)
|
Reflects Banco de Bogotá consolidated figures, which include BAC Credomatic’s operations.
|
Mortgages
Banco AV Villas is our principal provider of loans to customers for the purchase of real estate secured by mortgages, and Banco de Bogotá is gradually entering this business. We have implemented strict underwriting standards: we do not offer mortgage loans in amounts greater than 70% of the value of the property to be purchased, and all of our mortgage loans have maturities of between five and fifteen years. The average maturity at December 31, 2011 was 123 months. Borrowers must also meet certain minimum income levels, and payments may not exceed 30% of the borrower’s monthly income. As a result, our average loan-to-value ratio was 42.3% at December 31, 2011.
Financial leases
Pursuant to Law 1328 of 2009, also referred to as the “financial reform law,” commercial banks are permitted to offer leasing products. In 2010, to take advantage of our banks’ lower cost of funding, wider distribution network and centralized administration, we merged the majority of our leasing subsidiaries with our banks. Prior to 2010, our banks offered leasing products through independent subsidiaries.
The following table presents our leasing portfolio at December 31, 2011.
|
At December 31, 2011
|
||||||||||||||||||||||||
|
Grupo Aval entities
|
||||||||||||||||||||||||
|
Banco de Bogotá
|
Banco de Occidente
|
Banco Popular
|
Banco AV Villas
|
Aggregate
(1) (3)
|
Grupo Aval consolidated (2) (3)
|
|||||||||||||||||||
|
(in Ps billions)
|
||||||||||||||||||||||||
|
Commercial leases
|
1,562.7 | 3,280.0 | 246.6 | – | 5,089.3 | 5,067.2 | ||||||||||||||||||
|
Consumer leases
|
70.7 | 8.3 | 17.6 | – | 96.5 | 96.5 | ||||||||||||||||||
|
Total
|
1,633.3 | 3,288.3 | 264.2 | – | 5,185.8 | 5,163.8 | ||||||||||||||||||
|
(1)
|
Reflects aggregated amounts of our banking subsidiaries.
|
|
(2)
|
Includes eliminations for intercompany or intra-group operations between Grupo Aval subsidiaries.
|
|
(3)
|
Reflects Banco de Bogotá consolidated figures which include BAC Credomatic’s operations.
|
Credit cards
We provide credit card services to our bank customers through the
Visa
and
MasterCard
networks. The following table presents the number of active issued credit cards of our banks at December 31, 2011.
|
Active issued credit cards
|
||||
|
Bank
|
December 31, 2011
|
|||
|
Banco de Bogotá
|
553,287 | |||
|
Banco de Occidente
|
410,477 | |||
|
Banco Popular
|
64,279 | |||
|
Banco AV Villas
|
204,639 | |||
|
Total Colombian active issued credit cards (1)
|
1,232,682 | |||
|
(1)
|
BAC Credomatic had approximately 1,051,000 credit card accounts in Centr
al America at December 31, 2011. See “―BAC Credomatic operations―Lending activities― Credit cards.
”
|
Deposit-taking activities
Deposits
Our banks offer traditional deposit services and products, including checking accounts, savings accounts, time deposits and other deposits. Checking accounts typically bear very low or no interest. Checking accounts and savings accounts are payable on demand, although a significant portion of these accounts tend to be stable in amount over time. Time deposits typically have a maturity up to 12 months and earn interest at a fixed rate.
The following table presents our deposits by product type at the dates indicated.
|
At December 31,
|
||||||||||||||||||||||||||||||||||||||||||||||||
|
Banco de Bogotá
|
Banco de Occidente
|
Banco Popular
|
Banco AV Villas
|
Aggregate (1)
|
Consolidated (3) (4)
|
|||||||||||||||||||||||||||||||||||||||||||
|
2011
|
2010
|
2011
|
2010
|
2011
|
2010
|
2011
|
2010
|
2011
|
2010
|
2011
|
2010
|
|||||||||||||||||||||||||||||||||||||
|
(in Ps billions)
|
||||||||||||||||||||||||||||||||||||||||||||||||
|
Checking
accounts
|
12,510.6 | 11,004.6 | 4,897.7 | 5,301.5 | 1,493.3 | 1,270.6 | 535.2 | 513.3 | 19,436.8 | 18,089.9 | 19,417.8 | 18,052.4 | ||||||||||||||||||||||||||||||||||||
|
Savings accounts
|
14,805.4 | 13,653.7 | 5,729.0 | 4,436.1 | 5,751.2 | 5,497.9 | 3,286.0 | 2,598.5 | 29,571.6 | 26,186.2 | 27,912.0 | 26,021.2 | ||||||||||||||||||||||||||||||||||||
|
Time deposits (CDs)
|
15,450.3 | 12,774.7 | 3,002.7 | 2,463.7 | 1,916.5 | 1,460.1 | 2,279.5 | 1,921.8 | 22,649.0 | 18,620.2 | 22,630.5 | 18,615.0 | ||||||||||||||||||||||||||||||||||||
|
Other deposits
|
600.2 | 559.3 | 291.1 | 240.2 | 94.3 | 119.6 | 61.8 | 61.6 | 1,047.4 | 980.6 | 1,047.4 | 980.6 | ||||||||||||||||||||||||||||||||||||
|
Total (2)
|
43,366.5 | 37,992.3 | 13,920.5 | 12,441.4 | 9,255.3 | 8,348.1 | 6,162.5 | 5,095.1 | 72,704.8 | 63,876.9 | 71,007.6 | 63,669.3 | ||||||||||||||||||||||||||||||||||||
|
(1)
|
Reflects aggregated amounts of our banking subsidiaries.
|
|
(2)
|
Interbank deposits have been excluded.
|
|
(3)
|
Includes eliminations for intercompany or intra-group operations between Grupo Aval subsidiaries.
|
|
(4)
|
Reflects Banco de Bogotá consolidated figures which include BAC Credomatic’s operations.
|
Treasury operations
Our banks’ treasury departments are responsible for managing their proprietary trading activities, liquidity and distribution of treasury services and products to customers and are focused on fixed-income securities, foreign exchange transactions and derivatives. Our banks’ proprietary trading activities include fixed income trading, derivatives and foreign exchange operations. We do not have any proprietary trading activities in equities and each of our banks have implemented trading activities policies. Our banks also accept deposits from financial institutions as part of their treasury operations. These deposits are represented by certificates of interbank deposit, or “CDIs,” and earn interest at the interbank deposit rate. Banco de Bogotá and Banco de Occidente have active treasury operations, while Banco Popular and Banco AV Villas have small treasury operations.
Distribution
Our banks provide services and products to their customers through our network. Each of our banks manages its own distribution network. In 1998, we created the
Red de Grupo Aval
network which allows customers of any of our banks to make transfers, payments and undertake other basic banking functions in the networks of our other banks, through traditional channels and electronic networks, with results posting in real time to the accountholder’s bank with no additional fees.
Red de Grupo Aval
network services vary for each channel.
The following chart shows the distribution channels of our network.
|
Distribution channel
|
Description
|
|
|
Full-service branches
|
We had 1,265 full-service branches at December 31, 2011.
Red de Grupo Aval
network service points across our banks allow our bank customers to perform check cashing, deposits, savings account withdrawals, loan and credit card payments, transfers and advances at any of our branches.
|
|
|
ATMs and electronic service points
|
We had 2,649 ATMs and 531 other electronic service points (non-cash dispensing teller machines) at December 31, 2011. Through our ATMs and electronic service points, all of our bank customers can, among other services, consult their balances, execute loan and credit card payments, transfers and advances, and pay for certain third-party services where we have a payment collection agreement in place (such as utility service companies).
|
|
|
Payment collection centers (
Centros de pagos
)
|
We had 104 payment collection centers at December 31, 2011, which allow our customers to pay for certain third-party services where we have a payment collection agreement in place (such as utility service companies).
|
|
|
Non-banking correspondents (
Corresponsales no bancarios
)
|
We had 9,454 non-banking correspondents at December 31, 2011. Our banks enter into agreements with various third parties, including convenience store owners, to provide all of our bank customers with certain services which can include checking and savings account withdrawals, account balance consultation, loan and credit card payments, transfers and advances, and payments for certain third-party services where we have a payment collection agreement in place with such third-party (such as utility service companies).
|
|
|
Automated telephone banking, mobile banking and online banking
|
Through our banks’ websites, mobile banking services and automated telephone banking, customers may pay loan and credit card balances, make transfers between accounts and make payments for collection agreements originated in any of our banks. In addition, for customers who have bank accounts with one or more of our banks, our website (www.grupoaval.com) allows for simultaneous consultation of balances and transactions from a single portal.
|
The following map presents our banks’ points of service across the principal regions of Colombia, at December 31, 2010 and 2011.
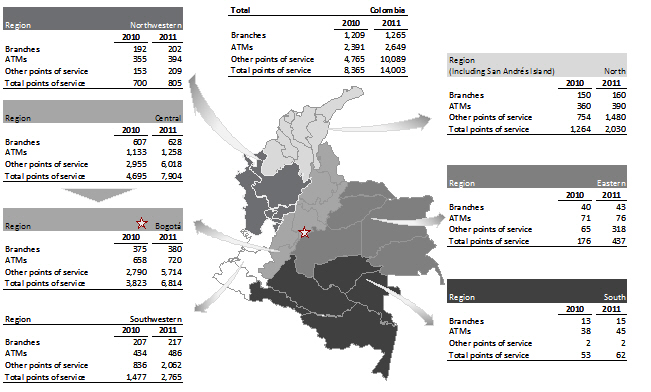
Note: Other points of service include non-banking correspondents including our
Red Cerca
operations,
(corresponsales no bancarios
) or
“CNBs,” electronic service points (
agilizadores electrónicos
) and payment collection centers (
centros de pago
). The increase in total points of service from 2010 to 2011 was due to an increase of our
Red Cerca
operations.
The following table presents transaction volumes through our branches and ATMs at December 31, 2011 and 2010.
|
Transactions
|
% of total transactions
|
|||||||||||||||
|
At December 31,
|
At December 31,
|
|||||||||||||||
|
Grupo Aval
|
2011
|
2010
|
2011
|
2010
|
||||||||||||
|
(in thousands)
|
||||||||||||||||
|
Branches
|
252,853 | 240,178 | 36.1 | 37.2 | ||||||||||||
|
ATMs
|
136,157 | 122,556 | 19.4 | 19.0 | ||||||||||||
|
Other
|
40,557 | 22,017 | 5.8 | 3.4 | ||||||||||||
|
Total service points
|
429,567 | 384,752 | 61.4 | 59.6 | ||||||||||||
In addition, the following table presents transaction volumes for online banking, mobile banking and automated telephone banking channels which, pursuant to our growth strategy, are expected to grow on an annual basis relative to total transactions, at December 31, 2011 and 2010.
|
Transactions
|
% of total transactions
|
|||||||||||||||
|
At December 31,
|
At December 31,
|
|||||||||||||||
|
Grupo Aval
|
2011
|
2010
|
2011
|
2010
|
||||||||||||
|
(in thousands)
|
||||||||||||||||
|
Online banking
|
248,021 | 237,183 | 35.4 | 36.8 | ||||||||||||
|
Mobile banking
|
9,058 | 7,583 | 1.3 | 1.2 | ||||||||||||
|
Automated telephone banking
|
13,525 | 15,505 | 1.9 | 2.4 | ||||||||||||
|
Total
|
270,604 | 260,272 | 38.6 | 40.4 | ||||||||||||
In 2011, a total of 22.8 million messages were sent through our mobile phone banking system, an increase of approximately 68% as compared to 13.8 million messages in 2010.
Our call centers provide our customers with assistance relating to bank services and products, information updates, service-related complaints, payment or account linkages, and credit card blockage. Our call centers are also used for telemarketing, collection of past-due loans and customer loyalty initiatives. In 2011, the number of inbound calls to our call centers was 7.3 million and the number of outbound calls was 24.6 million. In 2010, the number of inbound calls to our call centers was 7.3 million and the number of outbound calls was 29.5 million.
Banco de Bogotá
Banco de Bogotá is Colombia’s oldest financial institution and the second-largest bank in the country based on net income, with a market share of 14.8% of deposits and 13.4% of loans at December 31, 2011.
At and for the year ended December 31, 2011, Banco de Bogotá had total assets of Ps 68,809.6 billion and net income of Ps 1,145.7 billion.
Banco de Bogotá is a full-service bank with nationwide coverage and a comprehensive portfolio of services and products, distributed through a network of 626 branches and 1,019 ATMs in Colombia at December 31, 2011. While Banco de Bogotá serves all market segments, it has a leading presence in commercial loans historically, with a particular focus on large corporations and a market share of 18.3% of commercial loans at December 31, 2011. Following its 2006 acquisition of Megabanco, Banco de Bogotá expanded its consumer banking business and now has a market share of 9.0% of consumer loans as of December 31, 2011. Banco de Bogotá’s ROAE of 21.3% and efficiency ratio of 50.9% for the year ended December 31, 2011 make it one of the most profitable and efficient banks in Colombia.
Ownership
The following table presents the share ownership structure of Banco de Bogotá at December 31, 2011.
|
Banco de Bogotá
ownership
|
||||
|
(in percentages)
|
||||
|
Grupo Aval
|
64.4 | |||
|
Mr. Sarmiento Angulo (additional beneficial ownership)
|
9.6 | |||
|
Subtotal
|
74.0 | |||
|
Other investors (1)
|
13.3 | |||
|
General public
|
12.7 | |||
|
Total
|
100.0 | |||
|
(1)
|
Based on publicly available information, we have identified a group of investors who have maintained ownership of record of at least one percent in Banco de Bogotá over a significant period of time.
|
History
Founded in 1870, Banco de Bogotá is the oldest and second-largest financial institution in Colombia. In 1922, it opened its first branch outside of Bogotá. Throughout the 1920s, Banco de Bogotá’s network outside Bogotá expanded, due in part to a series of acquisitions. In 1967, Banco de Bogotá opened its first office in Panama; in 1974, it opened a branch office in New York City; and in 1977, it founded Banco de Bogotá Trust Company (subsequently sold). In 1980, Banco de Bogotá Trust Company established Banco de Bogotá International Corporation, an affiliate in Miami, Florida. The New York City branch office and the Miami affiliate were subsequently converted into agencies. Banco de Bogotá was reorganized in 1988 following the acquisition of a majority ownership interest by Mr. Sarmiento Angulo, Grupo Aval’s chairman and majority shareholder, earlier that year. Porvenir was formed in 1991 and began its operations as a severance fund manager. In 1992, Banco de Bogotá completed a merger with Bancomercio. In 1998, Mr. Sarmiento Angulo contributed a majority of his Banco de Bogotá ownership interest to Grupo Aval. In 2006, Banco de Bogotá acquired and merged with Megabanco, which expanded its services for lower income consumers. In May 2010, Banco de Bogotá completed the merger of its wholly-owned subsidiary, Leasing Bogotá, which allows it to perform leasing operations. In December 2010, Banco de Bogotá acquired BAC Credomatic. In December 2011, Banco de Bogotá completed its first international bond offering raising U.S.$600 million.
Corficolombiana was founded in 1959 as an affiliate of Banco de Bogotá. Since 1997, it has acquired and merged with seven financial institutions in Colombia. In 2005, Corficolombiana completed its most recent merger, with Corfivalle, which resulted in Corficolombiana becoming the largest financial corporation in the country based on total assets. Following this merger, Corficolombiana transferred its loan portfolio to Banco de Bogotá to focus on its investment business.
As part of the government’s public auction of Megabanco, on June 21, 2006, Megabanco and FOGAFIN entered into an assumption of legal contingencies agreement, whereby FOGAFIN committed to assume up to 80% of the losses and expenses derived from legal contingencies against Megabanco, related to matters arising prior to the date of acquisition or discovered within 24 months of the acquisition of Megabanco. The guarantees will be effective up to the date in which all the covered legal contingencies conclude.
Business overview and operations
In addition to deposits and loans, Banco de Bogotá offers its enterprise customers a broad range of services and products focused on cash management, collection solutions and payment solutions, namely tax and customs services, consignment services, online and bar code collection, web services, credit card collection, electronic collection, automatic debit, third-party electronic payments, programmed service payments, social security payments and prepaid cards. Banco de Bogotá also performs various services in connection with customers’ import/export activities, including general purpose loans, foreign exchange services, documentation services and guarantees. For individual customers, it offers general purpose loans, auto financing, payroll loans, credit cards and different deposit and basic treasury products.
The following chart presents Banco de Bogotá’s principal subsidiaries as of December 31, 2011
.
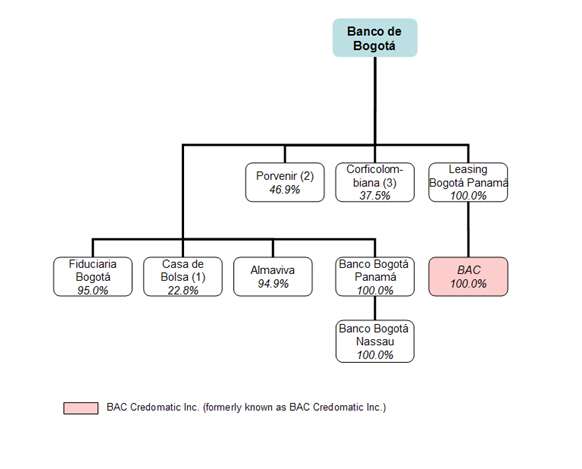
|
(1)
|
The remaining shares of Casa de Bolsa S.A. Sociedad Comisionista de Bolsa, or “Casa de Bolsa,” are held 38.9% by Corficolombiana, 7.9% by Banco de Occidente, 25.8% by Banco Popular, 3.1% by other related individuals or entities and 1.5% by other shareholders.
|
|
(2)
|
The ownership in Porvenir includes the shares that Banco de Bogota owns directly (35.3%) and indirectly through Fiduciaria Bogotá S.A., or “Fidubogotá,” a subsidiary of Banco de Bogotá (11.6%). The remaining shares of Porvenir are held by Grupo Aval (20.0%) and Banco de Occidente and its subsidiaries (33.1%).
|
|
(3)
|
The remaining shares of Corficolombiana are 18.9% owned by Grupo Aval entities, 2.1% by funds managed by Porvenir, 13.0% by other investors who have maintained ownership of record of at least one percent in Corficolombiana over a significant period of time and 28.5% by the general public.
|
Enterprise
customers
Banco de Bogotá’s enterprise customers are classified as follows: very large corporations, with annual incomes in excess of Ps 50 billion; large corporations, with annual incomes of between Ps 8 billion and Ps 50 billion; public sector customers and cooperative institutions; small- and medium-size enterprises, with revenues of between Ps 0.5 billion and Ps 8 billion; and very small businesses, with revenues under Ps 0.5 billion. Banco de Bogotá’s primary focus is on very large corporations, large corporations, public sector customers and cooperative institutions, which represented 70.3% of its total loan portfolio at December 31, 2011 on an unconsolidated basis.
At December 31, 2011, Banco de Bogotá had a total of approximately 153,600 enterprise customers, an increase of 34.3% over the approximately 114,400 enterprise customers at December 31, 2010 on an unconsolidated basis. The following table presents the number of Banco de Bogotá’s enterprise customers at the dates indicated on an unconsolidated basis.
|
At December 31,
|
||||||||
|
2011
|
2010
|
|||||||
|
(in thousands)
|
||||||||
|
Very large corporations, large corporations and public sector customers
and cooperative institutions
|
6.9 | 6.9 | ||||||
|
Small- and medium-size enterprises
|
22.1 | 20.1 | ||||||
|
Very small businesses
|
30.8 | 29.9 | ||||||
|
Other (1)
|
93.9 | 57.5 | ||||||
|
Total
|
153.6 | 114.4 | ||||||
|
(1)
|
Includes education institutes, civic associations, museums, sports leagues, religious institutions and others.
|
Individual customers
Banco de Bogotá’s individual customers are classified as follows: preferential customers, with annual incomes in excess of ten times the annual minimum wage of Ps 6,427,200; high net-worth customers, with annual incomes of between six and ten times the minimum wage; individual customers, with annual incomes of between two and six times the minimum wage; and low-income customers, with annual incomes of under two times the minimum wage. Banco de Bogotá’s individual customer strategy is to focus on preferential customers, who represented 3.9% of the total customer base and 3.2% of its loan portfolio at December 31, 2011 on an unconsolidated basis.
At December 31, 2011, the bank had a total of approximately 3,071,900 individual customers, an increase of 9.4% over the approximately 2,807,600 individual customers at December 31, 2010 on an unconsolidated basis.
The following table presents the number of individual customers that Banco de Bogotá served at the dates indicated on an unconsolidated basis.
|
At December 31,
|
||||||||
|
2011
|
2010
|
|||||||
|
(in thousands)
|
||||||||
|
Preferential individual customers
|
127.3 | 103.6 | ||||||
|
Other individual customers
|
2,944.7 | 2,704.1 | ||||||
|
Total
|
3,071.9 | 2,807.6 | ||||||
Lending activities
The following table presents Banco de Bogotá’s loan portfolio at the dates indicated.
|
At December 31, (1)
|
Change, December 31, 2011 vs. December 31, 2010
|
||||||||||||||||
|
2011
|
2010
|
# |
%
|
||||||||||||||
|
(in Ps billions)
|
|||||||||||||||||
|
Commercial
|
25,434.3 | 21,520.9 | 3,913.4 | 18.2 | |||||||||||||
|
Consumer
|
9,282.1 | 7,712.3 | 1,569.8 | 20.4 | |||||||||||||
|
Microcredit
|
240.7 | 198.5 | 42.2 | 21.3 | |||||||||||||
|
Mortgages
|
3,444.7 | 3,144.5 | 300.1 | 9.5 | |||||||||||||
|
Financial leases
|
1,633.3 | 972.3 | 661.0 | 68.0 | |||||||||||||
|
Total
|
40,035.0 | 33,548.5 | 6,486.5 | 19.3 | |||||||||||||
|
(1)
|
Reflects Banco de Bogotá consolidated figures, which include BAC Credomatic’s operations.
|
Commercial loans
Banco de Bogotá’s commercial loan portfolio consists of general purpose loans, loans funded by development banks, working capital loans, credit cards and overdrafts.
The following table presents Banco de Bogotá’s commercial loan portfolio at the dates indicated.
|
At December 31, (1)
|
Change, December 31, 2011 vs. December 31, 2010
|
|||||||||||||||
|
2011
|
2010
|
# |
%
|
|||||||||||||
|
(in Ps billions)
|
||||||||||||||||
|
General purpose loans
|
16,861.7 | 15,144.7 | 1,716.9 | 11.3 | ||||||||||||
|
Loans funded by development banks
|
939.3 | 894.9 | 44.4 | 5.0 | ||||||||||||
|
Working capital loans
|
7,344.2 | 5,239.8 | 2,104.4 | 40.2 | ||||||||||||
|
Credit cards
|
135.2 | 116.2 | 19.0 | 16.4 | ||||||||||||
|
Overdrafts
|
153.9 | 125.3 | 28.6 | 22.8 | ||||||||||||
|
Total
|
25,434.3 | 21,520.9 | 3,913.4 | 18.2 | ||||||||||||
|
(1)
|
Reflects Banco de Bogotá consolidated figures, which include BAC Credomatic’s operations.
|
Consumer loans
Banco de Bogotá’s consumer loan portfolio consists of personal loans, automobile and other vehicle loans, credit cards and overdrafts.
The following table presents Banco de Bogotá’s consumer loan portfolio at the dates indicated.
|
At December 31, (1)
|
Change, December 31, 2011 vs. December 31, 2010
|
|||||||||||||||
|
2011
|
2010
|
# |
%
|
|||||||||||||
|
(in Ps billions)
|
||||||||||||||||
|
Credit cards
|
3,699.2 | 3,275.9 | 423.3 | 12.9 | ||||||||||||
|
Personal loans
|
4,048.6 | 3,045.9 | 1,002.7 | 32.9 | ||||||||||||
|
Automobile and other vehicle loans
|
1,482.4 | 1,320.9 | 161.5 | 12.2 | ||||||||||||
|
Overdrafts
|
51.8 | 34.6 | 17.2 | 49.8 | ||||||||||||
|
Working capital loans
|
0 | 35.0 | (35.0 | ) | (100.0 | ) | ||||||||||
|
Total
|
9,282.1 | 7,712.3 | 1,569.8 | 20.4 | ||||||||||||
|
(1)
|
Reflects Banco de Bogotá consolidated figures, which include BAC Credomatic’s operations.
|
Financial leases
Banco de Bogotá had Ps 1,633.3 billion and Ps 972.3 billion of financial leasing assets at December 31, 2011 and December 31, 2010, respectively, on a consolidated basis.
Leasing Corficolombiana, Corficolombiana’s leasing subsidiary, had Ps 509.9 billion and Ps 427.6 billion of financial leasing assets at December 31, 2011 and 2010, respectively, and Ps 13.7 billion and Ps 13.1 billion of net income for the years ended December 31, 2011 and 2010, respectively. Corficolombiana is a subsidiary of Banco de Bogotá.
Deposit-taking activities
Banco de Bogotá offers customers checking accounts, savings accounts, time deposits (CDs) and other deposits as described in the table below.
The following table presents a breakdown of Banco de Bogotá’s deposits by product type at the dates indicated.
|
At December 31, (1)
|
Change, December 31, 2011 vs. December 31, 2010
|
|||||||||||||||
|
2011
|
2010
|
# |
%
|
|||||||||||||
|
(in Ps billions)
|
||||||||||||||||
|
Checking accounts
|
12,510.6 | 11,004.6 | 1,506.1 | 13.7 | ||||||||||||
|
Savings accounts
|
14,805.4 | 13,653.7 | 1,151.7 | 8.4 | ||||||||||||
|
Time deposits
|
15,450.3 | 12,774.7 | 2,675.6 | 20.9 | ||||||||||||
|
Other deposits
|
600.2 | 559.3 | 40.9 | 7.3 | ||||||||||||
|
Total
|
43,366.5 | 37,992.3 | 5,374.2 | 14.1 | ||||||||||||
Treasury operations
Banco de Bogotá’s treasury operations are focused on fixed-income securities, foreign exchange transactions and derivatives. Derivatives transactions include basic coverage such as forwards, options and swaps.
Since 2008, Banco de Bogotá is active in the Colombian futures market, with futures operations in securities and exchange rate indexes.
For additional information, see “Item 5. Operating and Financial Review and Prospects—Liquidity and capital resources—Funding.”
Distribution
The following map presents Banco de Bogotá’s points of service across the principal regions of Colombia at December 31, 2010 and 2011.
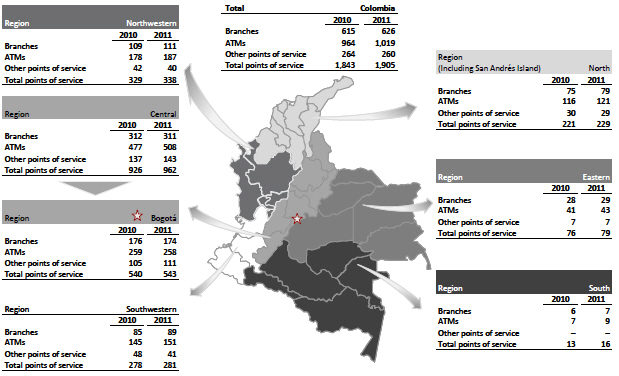
Note: Other points of service include non-banking correspondents
(corresponsales no bancarios)
, electronic service points (
agilizadores electrónicos
) and collection centers (
centros de pago
).
Banco de Bogotá has network concentration of approximately 50.5% in Colombia’s central region, of which Bogotá represents approximately 56.4%. Banco de Bogotá has market share of approximately 12.7% of branches and approximately 9.4% of ATMs at December 31, 2011.
The following table presents transaction volumes through Banco de Bogotá’s physical distribution channels in Colombia at the dates indicated.
|
Transactions
|
% of total transactions
|
|||||||||||||||
|
At December 31,
|
At December 31,
|
|||||||||||||||
|
Banco de Bogotá
|
2011
|
2010
|
2011
|
2010
|
||||||||||||
|
(in thousands)
|
||||||||||||||||
|
Branches
|
131,012 | 128,322 | 45.0 | 46.5 | ||||||||||||
|
ATMs
|
43,272 | 39,374 | 14.9 | 14.3 | ||||||||||||
|
Other
|
7,998 | 8,643 | 2.7 | 3.1 | ||||||||||||
|
Total
|
182,282 | 176,340 | 62.7 | 63.9 | ||||||||||||
The following table presents transaction volume for online banking, mobile banking and automated telephone banking channels in Colombia at the dates indicated.
|
Transactions
|
% of total transactions
|
|||||||||||||||
|
At December 31,
|
At December 31,
|
|||||||||||||||
|
Banco de Bogotá
|
2011
|
2010
|
2011
|
2010
|
||||||||||||
|
(in thousands)
|
||||||||||||||||
|
Online banking
|
100,790 | 90,527 | 34.6 | 32.8 | ||||||||||||
|
Mobile banking
|
510 | 411 | 0.2 | 0.1 | ||||||||||||
|
Automated telephone banking
|
7,300 | 8,530 | 2.5 | 3.1 | ||||||||||||
|
Total
|
108,600 | 99,469 | 37.3 | 36.1 | ||||||||||||
Other services and products
In addition to the banking services and products offered pursuant to its strategy, Banco de Bogotá also offers the following other services and products:
|
|
·
|
fiduciary services including portfolio management, collateral and payment services for project finance, and real estate escrow services through its 95.0% direct ownership interest in Fidubogotá, the second-largest fiduciary in Colombia as measured by net income and the third-largest as measured by assets under management at December 31, 2011;
|
|
|
·
|
merchandise storage and deposit, customs agency, cargo management and merchandise distribution, through its subsidiary Almaviva;
|
|
|
·
|
brokerage services, fund management, portfolio management, securities management and capital markets consulting services through its 22.8% direct ownership interest in Casa de Bolsa;
|
|
|
·
|
pension fund administration through Porvenir, by which Banco de Bogotá is the leading pension fund administrator in Colombia, as measured by number of customers, assets under management, ROAE and profitability at December 31, 2011;
|
|
|
·
|
Central American banking operations through BAC Credomatic; and
|
|
|
·
|
investment banking, treasury and private banking services through Corficolombiana, the largest merchant bank and financial corporation in Colombia as measured by assets. Private banking services have also been provided directly by Banco de Bogotá since 2003.
|
In 2009, through its bancassurance line, Banco de Bogotá began offering unemployment insurance for its loans, through which the insurer provides coverage for the first six months of missed payments. In 2012, Banco de Bogotá began offering mortgage loans through its points of service in Colombia. Banco de Bogotá intends to expand its bancassurance offerings and mortgage loans over the next few years.
Banco de Occidente
Banco de Occidente is the fifth-largest bank in Colombia, with market shares of 6.6% of deposits and 7.3% of loans at December 31, 2011.
Banco de Occidente focuses on enterprise customers, state-owned entities and retail customers and has a diversified revenue stream. For the year ended December 31, 2011, its loan portfolio was distributed as follows: approximately 22.3% in consumer and auto lending; approximately 57.9% in corporate and public sector lending; and approximately 19.8% in SMEs. Banco de Occidente had market shares of 7.5% of commercial loans and 5.0% of consumer loans at December 31, 2011.
Historically, Banco de Occidente has had a market share of approximately 14.1% of checking accounts for the past five years. Additional areas of focus for future growth include low-risk consumer loan services and products such as payroll loans and loans to government agencies. Banco de Occidente’s ROAE was 15.4% for 2011.
Ownership
The following table presents the share ownership structure of Banco de Occidente at December 31, 2011.
|
Banco de Occidente ownership
|
||||
|
(in percentages)
|
||||
|
Grupo Aval
|
68.2 | |||
|
Corficolombiana (1)
|
4.0 | |||
|
Mr. Sarmiento Angulo (additional beneficial ownership)
|
13.3 | |||
|
Subtotal
|
85.5 | |||
|
Other investors (2)
|
5.4 | |||
|
General public
|
9.1 | |||
|
Total
|
100.0 | |||
|
(1)
|
Corficolombiana held this 4.0% beneficial interest in Banco de Occidente at December 31, 2011, due to the merger of Leasing de Occidente into Banco de Occidente in June 2010. These shares are expected to be sold in open-market transactions through the Colombian Stock Exchange.
|
|
(2)
|
Based on publicly available information, we have identified a group of investors who have maintained ownership of record of at least one percent in Banco de Occidente over a significant period of time.
|
History
Founded in 1965 in Cali, Colombia, Banco de Occidente was acquired by Mr. Sarmiento Angulo in 1971. In 1976, Banco de Occidente launched the “
Credencial
” credit card, which was initially conceived and operated as an independent credit card system but which now operates under the
Visa
and
MasterCard
franchises.
Banco de Occidente (Panama) was established in 1982. Fiduciaria de Occidente was founded in 1991 and provides financial services focused in the southwest of Colombia. Banco de Occidente acquired and merged Banco Aliadas and Banco Unión into its operations in 2005 and 2006, seeking to strengthen its automobile finance and high-end consumer loan business, as well as to expand to other regions of Colombia.
On September 22, 2011, Banco de Occidente raised Ps 200,000 million (U.S.$106 million) in an equity offering of 6,060,606 ordinary shares. Grupo Aval subscribed for Ps 149,639 million (U.S.$80 million) of shares, and our ownership in Banco de Occidente increased slightly from 68.0% to 68.2% at December 31, 2011.
Business overview and operations
Banco de Occidente offers a comprehensive services and product portfolio, including a broad range of loan and leasing services and products. It serves enterprise customers with a focus on large- and medium-sized companies, and consumers with medium- to high-income levels. Banco de Occidente also offers its customers an extensive range of services focused on collection and payment solutions, such as: tax payment and customs services, consignment services, online and bar code collection, web services, credit card collection, electronic collection, automatic debit, third-party electronic payments, programmed service payments, social security payments and prepaid cards. Banco de Occidente also performs various services in connection with customers’ import/export activities, including foreign exchange services, documentation services and guarantees.
The following chart presents Banco de Occidente’s principal subsidiaries at December 31, 2011.
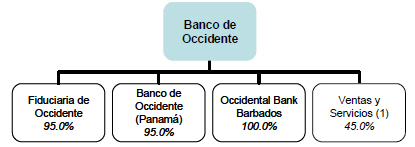
|
(1)
|
Remaining shares held 35.0% by Fiduciaria de Occidente and 19.9% by Corficolombiana.
|
Enterprise customers
Banco de Occidente’s enterprise customers are classified as follows: very large corporations, with annual incomes in excess of Ps 60 billion; large corporations, with annual incomes of between Ps 15 billion and Ps 60 billion; medium-size businesses, with annual incomes of between Ps 5.5 billion and 15 billion; small businesses, with annual incomes of between Ps 0.5 billion and Ps 5.5 billion; and public sector institutions. Banco de Occidente’s focus is on very large and large corporations, which represented approximately 51.7% of its loan portfolio at December 31, 2011.
At December 31, 2011, Banco de Occidente had approximately 62,500 enterprise customers, an increase of approximately 4.0% over the approximately 60,100 enterprise customers at December 31, 2010.
The following table presents Banco de Occidente’s enterprise customers at the dates indicated.
|
At December 31,
|
||||||||
|
2011
|
2010
|
|||||||
|
(in thousands)
|
||||||||
|
Very large corporations
|
2.0 | 1.5 | ||||||
|
Large corporations
|
5.1 | 4.5 | ||||||
|
Medium-size businesses
|
6.2 | 6.0 | ||||||
|
Small businesses
|
47.7 | 46.7 | ||||||
|
Public sector institutions
|
1.5 | 1.4 | ||||||
|
Total
|
62.5 | 60.1 | ||||||
Individual customers
Banco de Occidente’s individual customers are classified as follows: preferential customers, with annual income in excess of 43 times the annual minimum wage of Ps 6,427,200 in 2011; high net-worth individuals, with annual income of between six and 43 times the annual minimum wage; mass-market and microfinance individuals, with annual income of between 1.5 and six times the annual minimum wage; and microfinance businesses, with
annual incomes of under Ps 0.5 billion. Banco de Occidente’s individual customer strategy is to focus on high net-worth individuals.
At December 31, 2011, Banco de Occidente had a total of approximately 441,800 individual customers, an increase of approximately 3.9% over the approximately 425,300 individual customers at the end of 2010.
The following table presents the number of individual customers that Banco de Occidente served at the dates indicated.
|
At December 31,
|
||||||||
|
2011
|
2010
|
|||||||
|
Preferential customers
|
3.4 | 2.4 | ||||||
|
High net-worth individuals
|
104.9 | 89.4 | ||||||
|
Mass-market, microfinance individuals and microfinance businesses
|
333.5 | 333.5 | ||||||
|
Total
|
441.8 | 425.3 | ||||||
Lending activities
The following table presents Banco de Occidente’s loan portfolio at the dates indicated.
|
At December 31,
|
Change, December 31, 2011 vs. December 31, 2010
|
|||||||||||||||
|
2011
|
2010
|
# |
%
|
|||||||||||||
|
(in Ps billions)
|
||||||||||||||||
|
Commercial
|
8,619.6 | 7,026.0 | 1,593.6 | 22.7 | ||||||||||||
|
Consumer
|
2,805.9 | 2,297.7 | 508.2 | 22.1 | ||||||||||||
|
Microcredit
|
– | – | – | – | ||||||||||||
|
Mortgages
|
0.0 | 11.2 | (11.2 | ) | (99.7 | ) | ||||||||||
|
Financial leases
|
3,288.3 | 2,549.1 | 739.2 | 29.0 | ||||||||||||
|
Total
|
14,713.8 | 11,884.0 | 2,829.8 | 23.8 | ||||||||||||
Commercial loans
Banco de Occidente’s commercial loan portfolio consists of general purpose loans, loans funded by development banks, working capital loans, credit cards and overdrafts.
The following table presents Banco de Occidente’s commercial loan portfolio at the dates indicated.
|
At December 31,
|
Change, December 31, 2011 vs. December 31, 2010
|
|||||||||||||||
|
2011
|
2010
|
# |
%
|
|||||||||||||
|
(in Ps billions)
|
||||||||||||||||
|
General purpose loans
|
5,811.3 | 4,601.6 | 1,209.7 | 26.3 | ||||||||||||
|
Loans funded by development banks
|
396.8 | 427.6 | (30.8 | ) | (7.2 | ) | ||||||||||
|
Working capital loans
|
2,300.1 | 1,926.1 | 374.0 | 19.4 | ||||||||||||
|
Credit cards
|
44.3 | 39.6 | 4.7 | 11.9 | ||||||||||||
|
Overdrafts
|
67.1 | 31.1 | 36.0 | 115.5 | ||||||||||||
|
Total
|
8,619.6 | 7,026.0 | 1,593.6 | 22.7 | ||||||||||||
Consumer loans
Banco de Occidente’s consumer loan portfolio consists of personal loans, automobile and other vehicle loans, credit cards, overdrafts, general purpose loans and other loans.
The following table presents Banco de Occidente’s consumer loan portfolio at the dates indicated.
|
At December 31,
|
Change, December 31, 2011 vs. December 31, 2010
|
|||||||||||||||
|
2011
|
2010
|
# |
%
|
|||||||||||||
|
(in Ps billions)
|
||||||||||||||||
|
Credit cards
|
469.4 | 420.4 | 48.9 | 11.6 | ||||||||||||
|
Personal loans
|
1,106.4 | 841.7 | 264.7 | 31.4 | ||||||||||||
|
Automobile and other vehicle loans
|
1,065.0 | 879.6 | 185.3 | 21.1 | ||||||||||||
|
Overdrafts
|
9.9 | 8.3 | 1.5 | 18.3 | ||||||||||||
|
Loans funded by development banks
|
– | – | – | 0.0 | ||||||||||||
|
General purpose loans and other loans
|
155.3 | 147.6 | 7.7 | 5.2 | ||||||||||||
|
Total
|
2,805.9 | 2,297.7 | 508.2 | 22.1 | ||||||||||||
Financial leases
Leasing de Occidente S.A., which was formerly Banco de Occidente’s leasing subsidiary until June 2010 (when it was merged into Banco de Occidente), was the second-largest leasing business in Colombia as measured by assets at the date of the merger.
To take advantage of Banco de Occidente’s lower cost of funding, wider distribution network and centralized administration, Leasing de Occidente was merged into Banco de Occidente, and Banco de Occidente now directly offers leasing products. Upon completion of the merger, our share ownership of Banco de Occidente decreased from 73.2% to 68.0%. Banco de Occidente had Ps 3,288.3 billion of loan leases at December 31, 2011, an increase of 29.0% over the Ps 2,549.1 billion of loan leases at December 31, 2010.
Deposit-taking activities
Banco de Occidente has a relatively low cost of funds as a result of its relatively high proportion of deposits held in checking accounts. At December 31, 2011, approximately 37.2% of Banco de Occidente’s deposits were held by customers in checking accounts, as compared to a national banking system average of approximately 19.1% at that date.
Banco de Occidente offers checking accounts, savings accounts, time deposits and other deposits as described in the table below. The following table presents a breakdown of Banco de Occidente’s deposits by product type at the dates indicated.
|
At December 31,
|
Change, December 31, 2011 vs. December 31, 2010
|
|||||||||||||||
|
2011
|
2010
|
# |
%
|
|||||||||||||
|
(in Ps billions)
|
||||||||||||||||
|
Checking accounts
|
4,897.7 | 5,301.5 | (403.8 | ) | (7.6 | ) | ||||||||||
|
Savings accounts
|
5,729.0 | 4,436.1 | 1,292.9 | 29.1 | ||||||||||||
|
Time deposits
|
3,002.7 | 2,463.7 | 539.1 | 21.9 | ||||||||||||
|
Other deposits (1)
|
291.1 | 240.2 | 50.9 | 21.2 | ||||||||||||
|
Total
|
13,920.5 | 12,441.4 | 1,479.1 | 11.9 | ||||||||||||
|
(1)
|
Includes active account portfolios, payroll accounts, funds held in trust, banks and correspondents, special deposits and temporary deposits held in connection with collection services agreements.
|
Treasury operations
Banco de Occidente’s treasury operations are focused on fixed-income securities, foreign exchange transactions and derivatives. With respect to its derivatives operations, Banco de Occidente mainly provides foreign exchange coverage to its customers and seeks interest rate and foreign exchange coverage for its own assets, especially strategic assets denominated in foreign currency and permanent investments in subsidiaries.
For additional information, see “Item 5. Operating and Financial Review and Prospects—B. Liquidity and capital resources—Funding.”
Distribution
The following map presents Banco de Occidente’s points of service across the principal regions of Colombia, at December 31, 2010 and 2011.

Note: Other points of service include non-banking correspondents
(corresponsales no bancarios)
, electronic service points (
agilizadores electrónicos
) and collection centers (
centros de pago
).
Banco de Occidente had a network concentration of approximately 42.9% in Colombia’s central region and approximately 30.8% in Bogotá at December 31, 2011. Banco de Occidente is also active in the southwestern region of Colombia, in which approximately 22.0% of its distribution network is located. Banco de Occidente had approximately 3.7% market share of branches and approximately 1.6% market share of ATMs at December 31, 2011.
The following table presents transaction volumes through Banco de Occidente’s physical distribution channels at the dates indicated.
|
Transactions
|
% of total transactions
|
|||||||||||||||
|
At December 31,
|
At December 31,
|
|||||||||||||||
|
Banco de Occidente
|
2011
|
2010
|
2011
|
2010
|
||||||||||||
|
(in thousands)
|
||||||||||||||||
|
Branches
|
41,735 | 37,071 | 31.3 | 33.5 | ||||||||||||
|
ATMs
|
5,943 | 5,923 | 4.5 | 5.4 | ||||||||||||
|
Other
|
20,765 | 5,824 | 15.6 | 5.3 | ||||||||||||
|
Total
|
68,443 | 48,818 | 51.4 | 44.1 | ||||||||||||
The following table presents transaction volume for online banking, mobile banking and automated telephone banking channels at the dates indicated.
|
Transactions
|
% of total transactions
|
|||||||||||||||
|
At December 31,
|
At December 31,
|
|||||||||||||||
|
Banco de Occidente
|
2011
|
2010
|
2011
|
2010
|
||||||||||||
|
(in thousands)
|
||||||||||||||||
|
Online banking
|
61,826 | 58,475 | 46.4 | 52.9 | ||||||||||||
|
Mobile banking
|
31 | 21 | – | – | ||||||||||||
|
Automated telephone banking
|
2,828 | 3,317 | 2.1 | 3.0 | ||||||||||||
|
Total
|
64,685 | 61,813 | 48.6 | 55.9 | ||||||||||||
Other services and products
In addition to the banking services and products offered pursuant to its strategy, Banco de Occidente also offers the following services:
|
|
·
|
fiduciary services, including portfolio management, trust management and fiduciary guarantees through its 95% ownership interest in Fiduciaria de Occidente S.A., the fourth-largest fiduciary in Colombia as measured by net income and assets under management at December 31, 2011; and
|
|
|
·
|
deposits and loans in foreign currencies through its 95% ownership interest in Banco de Occidente (Panama) and U.S. dollar and Euro deposits, loans and credit cards through Occidental Bank (Barbados) Limited.
|
In 2009, through its bancassurance line, Banco de Occidente began offering unemployment insurance for its loans, where the insurer provides coverage for the first six months of missed payments. In 2011, Banco de Occidente transformed the bancassurance line into a division entrusted with creating additional insurance options for the bank's customers and developing a marketing strategy that uses diverse channels. The bank expanded its offering of unemployment insurance to other credit-related products, such as financing large vehicles and motorcycles. It also launched an individual insurance portfolio that includes coverage for certain cancers, other serious illnesses and personal accidents. The bank sells insurance products through its own sales force and telemarketing, and it intends to continue expanding its bancassurance offerings over the next few years.
Banco Popular
Banco Popular is the seventh-largest bank in Colombia, with a market share of 4.9% of deposits and 5.1% of loans at December 31, 2011. Banco Popular operates primarily in the consumer and public sector businesses, with operations across all regions of Colombia. Banco Popular is a premier provider of financial solutions to government entities nationwide with a particular strength in public sector deposits and loans, and a significant part of its portfolio consists of payroll loans to public sector employees.
Banco Popular achieved improved returns on its consumer loan portfolio due to its access to payroll deductions for repayment of loans, which has resulted in consumer loans with a substantially lower-risk profile for consumer loans (consumer past-due loans of 2.6% compared to a banking system average of 4.2% at December 31, 2011). At
and for the year ended December 31, 2011, Banco Popular had total assets of Ps 14,251.4 billion and net income of Ps 372.2 billion and 184 branches.
Banco Popular’s focus on consumer loans and institutional customers generates a mix of well-diversified and stable sources of revenues, which contributed to its status as the most profitable bank among our principal competitors in 2011 with an ROAE of 20.8%.
Banco Popular’s strategy for the future is based on four pillars: (1) increasing participation in payroll loans; (2) further penetrating the medium-size business sector (companies with annual incomes of between Ps 2 billion and Ps 40 billion); (3) maintaining dynamic credit origination with Grupo Aval’s other banking subsidiaries; and (4) continuing to optimize its funding sources, taking advantage of currently low interest rates and longer tenor for the issuance of bonds in Colombia. Banco Popular had issued mortgages in the past, but they represent less than 1% of Banco Popular’s loan book. Banco Popular does not target this segment actively.
Ownership
The following table presents the share ownership structure of Banco Popular at December 31, 2011.
|
Banco Popular ownership
|
||||
|
(in percentages)
|
||||
|
Grupo Aval
|
93.7 | |||
|
Mr. Sarmiento Angulo (additional beneficial ownership) (1)
|
0.5 | |||
|
Subtotal
|
94.2 | |||
|
Ownership by funds managed by Porvenir
|
1.1 | |||
|
Other investors and general public (2)
|
4.7 | |||
|
Total
|
100.0 | |||
|
(1)
|
On April 3, 2012, Mr. Sarmiento Angulo increased his beneficial ownership in Banco Popular by an additional 0.2%.
|
|
(2)
|
Includes the remaining interest of the Colombian government following privatization.
|
History
Banco Popular was founded in 1950 as a government-owned entity. It was privatized in 1996 through the sale of approximately 82% of its stock to Popular Investment S.A., an entity beneficially owned by Mr. Sarmiento Angulo. Banco Popular was not integrated into Grupo Aval in 1998 because, among other reasons, at the time Banco Popular had not achieved the same standards of operation as the other Grupo Aval entities and because of contractual limitations set forth in the credit agreements used to finance the acquisition of Banco Popular.
Between 2005 and 2006, Grupo Aval acquired approximately 19% of the shares of Banco Popular through the Colombian Stock Exchange from entities beneficially owned by Mr. Sarmiento Angulo, and in 2006 we assumed control of Banco Popular through a shareholders’ agreement with the majority shareholder Rendifin S.A. (successor to Popular Investments S.A. and beneficially owned by Mr. Sarmiento Angulo). In 2008, Grupo Aval acquired an additional 12% interest in Banco Popular from the Colombian government and other official entities.
Banco Popular share ownership reorganization
During 2011, Grupo Aval acquired ownership interests in Banco Popular to increase its direct ownership in Banco Popular to 93.7%, consistent with Mr. Sarmiento’s objective of consolidating ownership in our banking subsidiaries at the Grupo Aval level. The acquisition was undertaken in two tranches with three entities, Rendifin S.A., Popular Securities S.A. and Inversiones Escorial S.A., each of which is beneficially owned by Mr. Sarmiento Angulo.
On January 31, 2011, Grupo Aval entered into an
escisión
agreement with Rendifin S.A. pursuant to which Grupo Aval agreed to acquire through
escisión
43.5% of Banco Popular’s outstanding shares held by Rendifin S.A. in exchange for 2,073,115,004 of our preferred shares at a ratio of 1.6 Banco Popular share per Grupo Aval
preferred share, or the “First Banco Popular Share Ownership Reorganization Transaction.” This transaction was completed on June 23, 2011, and as a result, we increased our direct ownership in Banco Popular to 74.1%.
On April 29, 2011, we entered into a second
escisión
agreement with Popular Securities S.A. and Inversiones Escorial S.A. to acquire an additional 19.6% of Banco Popular in exchange for 934,669,126 preferred shares at the same ratio of 1.6 Banco Popular share per Grupo Aval preferred share, or the “Second Banco Popular Share Ownership Reorganization Transaction,” which, together with the First Banco Popular Share Ownership Reorganization Transaction, increased our stake to 93.7%. The Second Banco Popular Share Ownership Reorganization Transaction closed on September 20, 2011.
Rothschild de Mexico S.A. de C.V. issued a fairness opinion on January 6, 2011, stating that the exchange ratio of 1.62 Banco Popular shares to one Grupo Aval preferred share was reasonable to Grupo Aval shareholders. For a description of Mr. Sarmiento Angulo’s beneficial ownership in Banco Popular see “Item 7. Major Shareholders and Related Party Transactions––B. Related party transactions—Other transactions with Mr. Sarmiento Angulo and his affiliates.”
Business overview and operations
Banco Popular is a consumer bank with a comprehensive product portfolio, including a broad range of loan and leasing services and products aimed at specific customer sectors, as described below.
The following chart presents Banco Popular’s principal subsidiaries at December 31, 2011.
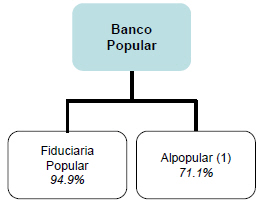
|
(1)
|
The remaining 28.9% shares of Alpopular are held by Corferias (an entity owned mainly by the Bogotá Chamber of Commerce).
|
Enterprise customers
Banco Popular’s enterprise customers are classified as follows: very large corporations, with incomes in excess of Ps 120 billion; large corporations, with revenues of between Ps 40 billion and Ps 120 billion; medium-size business customers, with revenues of between Ps 2 billion and Ps 40 billion; and public sector entities.
At December 31, 2011, Banco Popular had a total of approximately 7,300 corporate and public sector customers, an increase of approximately 9.0% over approximately 6,700 corporate and public sector customers at December 31, 2010. The following table presents the number of Banco Popular’s enterprise customers at the dates indicated.
|
At December 31,
|
||||||||
|
2011
|
2010
|
|||||||
|
(in thousands)
|
||||||||
|
Very large corporations
|
0.6 | 0.5 | ||||||
|
Large corporations
|
0.6 | 0.5 | ||||||
|
Medium-size businesses
|
3.9 | 3.5 | ||||||
|
Public sector entities
|
1.3 | 1.4 | ||||||
|
Other
|
0.9 | 0.8 | ||||||
|
Total
|
7.3 | 6.7 | ||||||
Individual customers
Banco Popular classifies as individual mass-market customers all the individual or corporate customers with an income under Ps 2.0 billion. At December 31, 2011, approximately 51.7% of Banco Popular’s total loan portfolio consisted of payroll loans, which Banco Popular believes allow it to obtain higher returns with less risk of default.
At December 31, 2011, Banco Popular had a total of approximately 2,533,800 individual mass-market customers, an increase of approximately 20.3% over approximately 2,106,600 individual customers at December 31, 2010.
Lending activities
The following table presents Banco Popular’s loan portfolio at the dates indicated.
|
At December 31,
|
Change, December 31, 2011 vs. December 31, 2010
|
|||||||||||||||
|
2011
|
2010
|
# |
%
|
|||||||||||||
|
(in Ps billions)
|
||||||||||||||||
|
Commercial
|
4,407.7 | 3,747.8 | 659.9 | 17.6 | ||||||||||||
|
Consumer
|
5,411.9 | 4,650.5 | 761.4 | 16.4 | ||||||||||||
|
Microcredit
|
20.8 | 27.8 | (7.1 | ) | (25.4 | ) | ||||||||||
|
Mortgages
|
92.8 | 101.5 | (8.7 | ) | (8.6 | ) | ||||||||||
|
Financial leases
|
264.2 | 224.5 | 39.7 | 17.7 | ||||||||||||
|
Total
|
10,197.3 | 8,752.1 | 1,445.2 | 16.5 | ||||||||||||
Commercial loans
Banco Popular’s commercial loan portfolio consists of general purpose loans, loans funded by development banks, working capital loans, credit cards and overdrafts.
The following table presents Banco Popular’s commercial loan portfolio at the dates indicated.
|
At December 31,
|
Change, December 31, 2011 vs. December 31, 2010
|
|||||||||||||||
|
2011
|
2010
|
# |
%
|
|||||||||||||
|
(in Ps billions)
|
||||||||||||||||
|
General purpose loans
|
3,520.5 | 2,959.5 | 561.0 | 19.0 | ||||||||||||
|
Loans funded by development banks
|
407.6 | 198.9 | 208.7 | 104.9 | ||||||||||||
|
Working capital loans
|
467.5 | 579.1 | (111.6 | ) | (19.3 | ) | ||||||||||
|
Credit cards
|
2.1 | 3.3 | (1.2 | ) | (36.0 | ) | ||||||||||
|
Overdrafts
|
9.9 | 7.0 | 2.9 | 42.0 | ||||||||||||
|
Total
|
4,407.7 | 3,747.8 | 659.9 | 17.6 | ||||||||||||
Consumer loans
Banco Popular’s consumer loan portfolio consists of personal loans, automobile and vehicle loans, credit cards, overdrafts and general purpose loans.
The following table presents Banco Popular’s consumer loan portfolio at the dates indicated.
|
At December 31,
|
Change, December 31, 2011 vs. December 31, 2010
|
|||||||||||||||
|
2011
|
2010
|
# |
%
|
|||||||||||||
|
(in Ps billions)
|
||||||||||||||||
|
Personal loans (1)
|
5,321.8 | 4,554.5 | 767.3 | 16.8 | ||||||||||||
|
Automobile and vehicle loans
|
16.3 | 19.3 | (3.0 | ) | (15.7 | ) | ||||||||||
|
Credit cards
|
67.6 | 69.9 | (2.2 | ) | (3.2 | ) | ||||||||||
|
Overdrafts
|
1.3 | 3.2 | (1.9 | ) | (59.4 | ) | ||||||||||
|
General purpose loans
|
4.7 | 3.6 | 1.1 | 31.0 | ||||||||||||
|
Loans funded by developments banks
|
0.2 | 0.0 | 0.1 | 358.9 | ||||||||||||
|
Total
|
5,411.9 | 4,650.5 | 761.4 | 16.4 | ||||||||||||
|
(1)
|
Payroll loans represented 99.0% of personal loans at December 31, 2011 and 2010.
|
Financial leases
Banco Popular had Ps 264.2 billion of financial leasing assets at December 31, 2011.
Deposit-taking activities
Banco Popular generates a substantial portion of its deposits through agreements with customers pursuant to which they agree to maintain a certain level of deposits in checking and/or savings accounts in exchange for the performance of services, primarily payment and collection services. These deposits totaled Ps 4.7 billion, representing approximately 50.6% of total deposits, at December 31, 2011.
Banco Popular offers customers checking accounts, savings accounts and time deposits.
The following table presents a breakdown of Banco Popular’s deposits by product type at the dates indicated.
|
At December 31,
|
Change, December 31, 2011 vs. December 31, 2010
|
|||||||||||||||
|
2011
|
2010
|
# |
%
|
|||||||||||||
|
(in Ps billions)
|
||||||||||||||||
|
Checking accounts
|
1,493.3 | 1,270.6 | 222.8 | 17.5 | ||||||||||||
|
Savings accounts
|
5,751.2 | 5,497.9 | 253.3 | 4.6 | ||||||||||||
|
Time deposits
|
1,916.5 | 1,460.1 | 456.5 | 31.3 | ||||||||||||
|
Other deposits
|
94.3 | 119.6 | (25.3 | ) | (21.2 | ) | ||||||||||
|
Total
|
9,255.3 | 8,348.1 | 907.2 | 10.9 | ||||||||||||
For additional information, see “Item 5. Operating and Financial Review and Prospects—B. Liquidity and capital resources—Funding.”
Distribution
The following map presents Banco Popular’s points of service across the principal regions of Colombia at December 31, 2010 and 2011.

Note: Other points of service include non-banking correspondents
(corresponsales no bancarios)
, electronic service points (
agilizadores electrónicos
) and collection centers (
centros de pago
).
Banco Popular had a network concentration of approximately 50.1% in Colombia’s central region and approximately 27.9% in Bogotá at December 31, 2011. Banco Popular had a market share of approximately 3.7% of branches and a market share of approximately 8.5% of ATMs at December 31, 2011.
The following table presents transaction volumes through Banco Popular’s physical distribution channels at the dates indicated.
|
Transactions
|
% of total transactions
|
|||||||||||||||
|
At December 31,
|
At December 31,
|
|||||||||||||||
|
Banco Popular
|
2011
|
2010
|
2011
|
2010
|
||||||||||||
|
(in thousands)
|
||||||||||||||||
|
Branches
|
36,886 | 32,241 | 33.6 | 35.3 | ||||||||||||
|
ATMs
|
46,283 | 37,315 | 42.2 | 40.9 | ||||||||||||
|
Other
|
2,565 | 1,623 | 2.3 | 1.8 | ||||||||||||
|
Total
|
85,734 | 71,179 | 78.1 | 78.0 | ||||||||||||
The following table presents transaction volume for online banking and automated telephone banking channels at the dates indicated.
|
Transactions
|
% of total transactions
|
|||||||||||||||
|
At December 31,
|
At December 31,
|
|||||||||||||||
|
Banco Popular
|
2011
|
2010
|
2011
|
2010
|
||||||||||||
|
(in thousands)
|
||||||||||||||||
|
Online banking
|
21,299 | 18,156 | 19.4 | 19.9 | ||||||||||||
|
Automated telephone banking
|
2,741 | 1,965 | 2.5 | 2.2 | ||||||||||||
|
Total
|
24,040 | 20,121 | 21.9 | 22.0 | ||||||||||||
Other services and products
In addition to the banking services and products offered pursuant to its strategy, Banco Popular also offers the following services and products:
|
|
·
|
fiduciary services, including portfolio management and trust management through its 94.9% ownership interest in Fiduciaria Popular S.A.;
|
|
|
·
|
merchandise and document storage and deposit, customs agency, cargo management, surety bond, merchandise distribution and other related services through its 71.1% ownership interest in Alpopular Almacén General de Depósito S.A.; and
|
|
|
·
|
collection, payment, consignment, investment and foreign exchange services.
|
In 2009, through its bancassurance line, Banco Popular began offering unemployment insurance for its loans, where the insurer provides coverage for the first six months of missed payments. In 2011, Banco Popular expanded its insurance offerings to consumer loans and credit cards, and in 2012 the bank expects to provide insurance for savings and checking deposits. Banco Popular intends to expand its bancassurance offerings over the next few years.
Banco AV Villas
Banco AV Villas has evolved from being a traditional mortgage lender to a diversified full-service consumer bank targeting middle- and low-income customers. It is our most active bank in usage of non-traditional distribution channels (mobile banking, non-banking correspondents and virtual branches). Banco AV Villas has a broad service network throughout central and northern Colombia, including Bogotá. Banco AV Villas had a market share of 3.3% of deposits, 2.5% of loans, 4.0% of consumer loans and 4.4% of mortgages at December 31, 2011.
At and for the year ended December 31, 2011, Banco AV Villas had total assets of Ps 7,618.2 billion, net income of Ps 165.2 billion and 272 bank branches. Banco AV Villas’ ROAE was 18.6% for the year ended December 31, 2011. Banco AV Villas’ efficiency ratio for the year ended December 31, 2011 was 59.2%.
In the consumer segment, Banco AV Villas focuses on high-margin services and products such as general purpose loans, payroll loans and credit cards, as well as its traditional line of mortgages. It serves customers through a recently expanded sales force and through its traditional retail network, entrepreneurial business centers and instant credit offices, known as “OCIs,” where credit applicants receive the outcome of their credit application within two hours. Banco AV Villas also seeks to continue to expand in the small- and medium-size corporate segment. In order to increase transaction volume through electronic channels and improve efficiency, Banco AV Villas has developed projects, such as the Nearby Network (
Red Cerca
), that will allow it to increase coverage by non-banking correspondents and offer a wide array of services to individuals and small- and medium-size businesses through its mobile banking platform.
Ownership
The following table presents the share ownership structure of Banco AV Villas at December 31, 2011.
|
Banco AV Villas ownership (includes common and preferred shares)
|
||||
|
(in percentages)
|
||||
|
Grupo Aval
|
79.9 | (1) | ||
|
Mr. Sarmiento Angulo (additional beneficial ownership)
|
15.4 | |||
|
Subtotal
|
95.2 | |||
|
General public
|
4.8 | |||
|
Total
|
100.0 | |||
|
(1)
|
Includes 0.1% of preferred shares.
|
History
Corporación de Ahorro y Vivienda Las Villas (predecessor entity to Banco AV Villas) was established by Mr. Sarmiento Angulo in 1972 to finance real estate housing developments. Throughout the 1970s, 1980s and the first half of the 1990s, Corporación de Ahorro y Vivienda Las Villas was a major participant in the mortgage business, particularly in low- to-middle-income residential neighborhoods. This preeminence in the mortgage business led to the brand’s positioning and the high level of recognition that it still holds. In 2000, Corporación de Ahorro y Vivienda Las Villas was merged with Corporación de Ahorro y Vivienda Ahorramás, which Grupo Aval acquired in 1997, and in 2002 the merged entity was transformed into a bank under the name Banco AV Villas following a Ps 30.0 billion capital injection by Grupo Aval to weather the Colombian mortgage crisis of the late 1990s. Since that time, the bank’s business focus has been on commercial banking for individuals and small- and medium-size businesses as well as on a smaller mortgage business.
Business overview and operations
The following chart shows Banco AV Villas’ main equity investment at December 31, 2011.
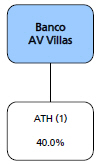
|
(1)
|
The remaining 60% of A Toda Hora S.A. is owned by Banco de Bogotá, Banco de Occidente and Banco Popular.
|
A Toda Hora S.A., or “ATH,” is a wholly-owned indirect subsidiary of Grupo Aval and is the administrator of Grupo Aval’s ATMs and the transactional services that flow through the
Red de Grupo Aval
network, such as internet, e-banking, electronic service points and payment spots, in which Banco AV Villas has a 40% interest.
At December 31, 2011, ATH managed approximately 57% of
Red de Grupo Aval’s
2,649 ATMs.
Enterprise customers
Banco AV Villas’ enterprise customers are classified as follows: enterprise customers, incomes of at least Ps 20 billion; government and institutional customers; small- and medium-size businesses, with revenues between Ps 1 billion and Ps 20 billion; micro businesses, with revenues under Ps 1 billion; and mortgages.
At December 31, 2011, Banco AV Villas had a total of approximately 27,700 enterprise customers, a decrease of 2.5% over the approximately 28,400 enterprise customers at December 31, 2010. Banco AV Villas’ focus is on micro-businesses and SME enterprise customers. The following table presents Banco AV Villas’ enterprise customers at the dates indicated.
|
At December 31,
|
||||||||
|
2011
|
2010
|
|||||||
|
(in thousands)
|
||||||||
|
Enterprise
|
0.9 | 1.0 | ||||||
|
Governmental and institutional
|
0.8 | 0.7 | ||||||
|
Small- and medium-size businesses
|
5.1 | 5.5 | ||||||
|
Micro businesses
|
20.7 | 21.1 | ||||||
|
Other
|
0.1 | 0.1 | ||||||
|
Total
|
27.7 | 28.4 | ||||||
Individual customers
Banco AV Villas’ individual customers are classified as follows: preferential customers, with annual income in excess of six times the annual minimum wage of Ps 6,427,200, and other individual customers, with annual incomes lower than six times the annual minimum wage. Individual customers represented approximately 59.4% of Banco AV Villas’ loan portfolio at December 31, 2011. Approximately 38.0% of Banco AV Villas individual customer’s loan portfolio consists of payroll loans.
At December 31, 2011, Banco AV Villas had a total of approximately 1,096,100 individual customers, an increase of 1.9% over the approximately 1,075,200 individual customers at December 31, 2010. The following table presents the number of individual customers that Banco AV Villas served at the dates indicated.
|
At December 31,
|
||||||||
|
2011
|
2010
|
|||||||
|
(in thousands)
|
||||||||
|
Preferential customers
|
77.1 | 102.1 | ||||||
|
Other individual customers
|
1,018.9 | 973.2 | ||||||
|
Total
|
1,096.1 | 1,075.2 | ||||||
Lending activities
The following table presents Banco AV Villas’ loan portfolio at the dates indicated.
|
At December 31,
|
Change, December 31, 2011 vs. December 31, 2010
|
|||||||||||||||
|
2011
|
2010
|
# |
%
|
|||||||||||||
|
(in Ps billions)
|
||||||||||||||||
|
Commercial
|
2,119.0 | 1,867.5 | 251.5 | 13.5 | ||||||||||||
|
Consumer
|
2,236.0 | 1,964.7 | 271.3 | 13.8 | ||||||||||||
|
Microcredit
|
22.7 | 23.8 | (1.0 | ) | (4.4 | ) | ||||||||||
|
Mortgages
|
680.9 | 587.1 | 93.8 | 16.0 | ||||||||||||
|
Leasing
|
– | – | – | – | ||||||||||||
|
Total
|
5,058.6 | 4,443.1 | 615.5 | 13.9 | ||||||||||||
Commercial loans
Banco AV Villas’ commercial loan portfolio consists of general purpose loans, loans funded by development banks, credit cards and overdrafts.
The following table presents Banco AV Villas’ commercial loan portfolio at the dates indicated.
|
At December 31,
|
Change, December 31, 2011 vs. December 31, 2010
|
|||||||||||||||
|
2011
|
2010
|
# |
%
|
|||||||||||||
|
(in Ps billions)
|
||||||||||||||||
|
General purpose loans
|
1,979.5 | 1,747.1 | 232.4 | 13.3 | ||||||||||||
|
Loans funded by development banks
|
127.7 | 112.8 | 14.9 | 13.3 | ||||||||||||
|
Credit cards
|
1.9 | 2.4 | (0.4 | ) | (18.1 | ) | ||||||||||
|
Overdrafts
|
9.9 | 5.2 | 4.6 | 88.0 | ||||||||||||
|
Total
|
2,119.0 | 1,867.5 | 251.5 | 13.5 | ||||||||||||
Consumer loans
Banco AV Villas’ consumer loan portfolio consists of personal loans, credit cards and overdrafts.
The following table presents Banco AV Villas’ consumer loan portfolio at the dates indicated.
|
At December 31,
|
Change, December 31, 2011 vs. December 31, 2010
|
|||||||||||||||
|
2011
|
2010
|
# |
%
|
|||||||||||||
|
(in Ps billions)
|
||||||||||||||||
|
Personal loans
|
2,020.5 | 1,800.9 | 219.6 | 12.2 | ||||||||||||
|
Credit cards
|
213.6 | 162.2 | 51.3 | 31.7 | ||||||||||||
|
Overdrafts
|
1.9 | 1.5 | 0.4 | 24.4 | ||||||||||||
|
Total
|
2,236.0 | 1,964.7 | 271.3 | 13.8 | ||||||||||||
Mortgages
Banco AV Villas is the principal bank in Grupo Aval that currently offers mortgage loans with strict underwriting standards: Banco AV Villas does not offer mortgage loans in amounts greater than 70.0% of the value of the property to be purchased, and all of our mortgage loans have maturities of between 5 and 15 years. The average maturity at December 31, 2011 was 123 months. Borrowers must also meet certain minimum income levels, and payments may not exceed 30% of the borrower’s monthly income. As a result, its average loan-to-value ratio was 42.3% at December 31, 2011. Banco AV Villas’ mortgage portfolio consisted of Ps 680.9 billion at December 31, 2011, a 16.0% increase from Ps 587.1 billion at December 31, 2010.
Deposit-taking activities
Banco AV Villas offers customers checking accounts, savings accounts, time deposits and other deposits consisting primarily of transactional accounts. Banco AV Villas’ average savings account rate, one of the lowest in the market, is explained by a significant retail network and a low concentration of corporate and government accounts. For 2011, the average savings account rate was 1.9% for Banco AV Villas and 2.9% for the market as a whole.
The following table presents a breakdown of Banco AV Villas’ deposits by product type at the dates indicated.
|
At December 31,
|
Change, December 31, 2011 vs. December 31, 2010
|
|||||||||||||||
|
2011
|
2010
|
# |
%
|
|||||||||||||
|
(in Ps billions)
|
||||||||||||||||
|
Checking accounts
|
535.2 | 513.3 | 21.8 | 4.3 | ||||||||||||
|
Savings accounts
|
3,286.0 | 2,598.5 | 687.5 | 26.5 | ||||||||||||
|
Time deposits
|
2,279.5 | 1,921.8 | 357.7 | 18.6 | ||||||||||||
|
Other deposits
|
61.8 | 61.6 | 0.3 | 0.4 | ||||||||||||
|
Total
|
6,162.5 | 5,095.1 | 1,067.4 | 20.9 | ||||||||||||
For additional information, see “Item 5. Operating and financial review and prospects—B. Liquidity and capital resources—Funding.”
Distribution
The following map presents Banco AV Villas’ points of service across the principal regions of Colombia at December 31, 2010 and 2011.

Note: Other points of service include non-banking correspondents, including our
Red Cerca
operations, CNBs, electronic service points (
agilizadores electrónicos
) and payment collection centers (
centros de pago
). The increase in total points of service from 2010 to 2011 was due to an increase of our
Red Cerca
operations.
Banco AV Villas had a network concentration of approximately 59.1% in Colombia’s central region and approximately 56.2% in Bogotá at December 31, 2011. Banco AV Villas had approximately 21.3% of its network in the southwestern region at December 31, 2011. Banco AV Villas had a market share of approximately
5.5
% of branches and a market share of approximately
4.9
% of ATMs at December 31, 2011.
The following table presents transaction volume through Banco AV Villas’ physical distribution channels at the dates indicated.
|
Transactions
|
% of total transactions
|
||||||||||||||||
|
At December 31,
|
At December 31,
|
||||||||||||||||
|
Banco AV Villas
|
2011
|
2010
|
2011
|
2010
|
|||||||||||||
|
(in thousands)
|
|||||||||||||||||
|
Branches
|
43,220 | 42,544 | 26.0 | 25.4 | |||||||||||||
|
ATMs
|
40,659 | 39,944 | 24.4 | 23.9 | |||||||||||||
|
Other
|
9,229 | 5,927 | 5.5 | 3.5 | |||||||||||||
|
Total
|
93,108 | 88,415 | 56.0 | 52.9 | |||||||||||||
The following table presents transaction volume for online banking, mobile banking and automated telephone banking channels at the dates indicated.
|
Transactions
|
% of total transactions
|
||||||||||||||||
|
At December 31,
|
At December 31,
|
||||||||||||||||
|
Banco AV Villas
|
2011
|
2010
|
2011
|
2010
|
|||||||||||||
|
(in thousands)
|
|||||||||||||||||
|
Online banking
|
64,106 | 70,025 | 38.5 | 41.9 | |||||||||||||
|
Mobile banking
|
8,517 | 7,151 | 5.1 | 4.3 | |||||||||||||
|
Automated telephone banking
|
656 | 1,693 | 0.4 | 1.0 | |||||||||||||
|
Total
|
73,279 | 78,869 | 44.0 | 47.1 | |||||||||||||
Other services and products
In addition to the banking services and products offered pursuant to its strategy, Banco AV Villas offers payment and collection services, as well as foreign exchange services.
In 2009, through its bancassurance line, Banco AV Villas began offering unemployment insurance for its loans, where the insurer provides coverage for the first nine months of missed payments. In 2011, Banco AV Villas began marketing to its customers voluntary insurance related to credit and debit card risks. This insurance protects clients in many circumstances, such as fraud, theft, unauthorized payments, critical illness, accidental death and unemployment. Banco AV Villas intends to expand its bancassurance offerings over the next few years.
Porvenir
Porvenir is the leading private AFP in Colombia, with a market share of 32.0% of mandatory pension fund individual customers and 29.4% of severance plan individual customers at December 31, 2011. See “—B. Business Overview—Competition—Pension and severance fund management – Porvenir.” Porvenir also provides voluntary pension funds and manages third-party sponsored pension funds. Pension funds provide individual savings for retirement, and severance funds provide temporary income to employees who lose their jobs. Through Gestión y Contacto S.A., Porvenir manages pension-related information systems designed to provide employees with efficient payment solutions.
At December 31, 2011, Porvenir had Ps 41.2 billion in total assets under management, of which Ps 28.9 billion was managed under the mandatory pension fund, 1.9 billion was managed under the severance fund, Ps 1.9 billion was managed under the voluntary pension fund and 8.6 billion was managed as a third-party sponsored pension liability fund.
At December 31, 2011, Porvenir had shareholders’ equity of Ps 620.3 billion and net profits of Ps 154.5 billion. Since its inception, Porvenir has been the leader in the Colombian private pension and severance fund markets.
Porvenir’s strengths include the following:
|
|
·
|
Porvenir is the most profitable AFP in Colombia, with an ROAE of 27.1% at December 31, 2011;
|
|
|
·
|
Porvenir has the largest and, we believe, most effective sales force in the industry with a nationwide presence. At the same time, it is the most efficient AFP in Colombia, with an efficiency ratio of 45.1% at December 31, 2011; and
|
|
|
·
|
Porvenir has access to Grupo Aval’s banking network. This advantage is particularly relevant in the severance market, as Grupo Aval’s banks provide financing to employers to comply with legally imposed annual severance allowance liabilities for their employees. In addition, the banks of Grupo Aval provide collection services for all of the funds administered by Porvenir.
|
Ownership
The following table presents the share ownership structure of Porvenir at December 31, 2011.
|
Porvenir ownership
|
||||
|
%
|
||||
|
Banco de Bogotá
|
35.3 | |||
|
Grupo Aval
|
20.0 | |||
|
Banco de Occidente
|
23.1 | |||
|
Fidubogotá (1)
|
11.6 | |||
|
Fiduciaria de Occidente (2)
|
10.0 | |||
|
Total
|
100.0 | |||
|
(1)
|
Fidubogotá is 95.0% owned by Banco de Bogotá. The remaining 3.6% is owned by Corporación Banco de Bogotá and 1.4% by Rendifin S.A., an affiliate of Mr. Sarmiento Angulo.
|
(2) Fiduciaria de Occidente is a subsidiary of Banco de Occidente.
History
Porvenir was formed in 1991 and began its operations as a leading severance fund manager with nationwide operations. The pension fund system in Colombia has been historically administered by the Colombian Institute of Social Security (now Colpensiones) and was a government-sponsored defined public benefit plan. In 1993, however, a system of defined individual contributions was introduced, to be administered by private pension companies under the supervision of the Superintendency of Finance. In contrast to the “pay as you go” system, this new system was characterized by being funded by the savings of each individual customer. This system has grown significantly to become the principal pension fund system in Colombia. As a result of the market shift, private pension companies have become important participants in the local capital markets.
In 1994, Porvenir commenced operations under this new regime and rapidly became the leader in mandatory pension fund plans. At that time, Porvenir’s ownership was divided between Grupo Aval’s banks, which held a majority interest, and Provida, the largest AFP in Chile. In 2003, Porvenir founded an AFP in the Dominican Republic in association with local banks, which it sold in the same year to one of Provida’s related companies. At the same time Provida’s participation in Porvenir was bought by Grupo Aval entities.
In 2009, the regulatory system changed the mandatory pension system from a single fund for all affiliates to a multi-fund system (following examples in Chile, Mexico and Peru), which will continue to be implemented through 2011, allowing individuals to select from among funds with different risk profiles. This shift represented a milestone in the Colombian pension fund industry and allows for more flexibility and greater opportunities for AFPs in Colombia.
The following chart shows Porvenir’s principal subsidiary at December 31, 2011.
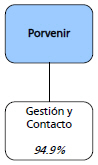
Business overview
The Ministry of Finance limits the range of assets in which AFPs can invest and also sets concentration limits. In addition, each AFP is required by law to provide a minimum return on investment for each of its mandatory pension and severance funds. This minimum return is determined pursuant to certain formulas established by means of Decree 2555 of 2010, which vary pursuant to the type of fund. Prior to the multi-fund scheme, the minimum return was calculated on a 36-month time horizon for mandatory pension funds and 24-month time horizon for severance funds. With the introduction of the multi-fund scheme, a new risk profile system came into effect which differentiates conservative, moderate and aggressive risk portfolios for individual clients of severance and mandatory pension funds. To adjust the minimum return of mandatory pension funds to the new risk profile portfolios, the time horizon for the minimum return will change from 36 months to a range of 36 to 60 months, depending on the risk profile of each portfolio. For severance funds, the long-term portfolio will continue to have a 24-month time horizon, and the short-term portfolio will have a three-month time horizon.
If a fund’s cumulative return for any month is lower than the minimum return, the AFP must supplement the necessary amount to cover the difference within a period of five days. To do so, the AFP must first apply funds from its “stabilization reserve,” which is a portion of the AFP’s capital invested in the fund administered by the AFP and which must represent at least 1.00% of the value of that fund. If the stabilization reserve is insufficient to cover the difference, the AFP must provide resources from its remaining capital. If the AFP does not have enough resources to cover the difference, the Superintendency of Finance may order the capitalization of the AFP. If, notwithstanding the above, an AFP fails to observe either the minimum return or the stabilization requirements or the order of capitalization, the Superintendency of Finance may take possession (
tomar posesión
) of the AFP, in which case FOGAFIN, the Colombian deposit insurance fund, is required to supply funds to cover the shortfall. In that event, the AFP may be dissolved and the fund transferred to another AFP. See “Item 3. Key Information—D. Risk factors—Risks relating to our businesses and industry—Risks relating to our pension and severance fund management business—Porvenir operates in a highly regulated market, which limits its flexibility to manage its businesses.”
At December 31, 2011, 66.2% of Porvenir’s revenues were derived from mandatory pension funds, 12.6% from severance funds, 9.6% from voluntary pension funds and 4.5% from third-party sponsored pension liability funds. Porvenir derived the remaining 7.1% of its revenues from a combination of its own portfolio, stabilization reserves and other income.
Mandatory pension funds
Mandatory pension funds are independent trusts formed by contributions made by individual customers to the social security pension system.
At December 31, 2011, mandatory pension funds represented 70.1% of Porvenir’s assets under management and constituted its main line of business.
Contributions to these pension funds are mandatory for all employees in Colombia and are jointly funded by the employer and the employee. The base contribution rate is 16.0% (up to 18.0% for employees meeting a certain salary threshold) of an employee’s base salary, whereby the employer contributes 75.0% and the employee 25.0% of the base contribution rate. Contributions are paid on a monthly basis. Of the 16.0%-18.0% total contribution, 11.5% goes to the individual customer’s fund. The AFP retains 300 basis points (3.0%) as compensation, of which Porvenir currently pays 145 basis points (1.45%) to an insurer for life and disability coverage, to which it is required by law to subscribe. The percentage that Porvenir pays for this insurance may increase or decrease depending on market conditions and other factors. The remainder is distributed between the National Solidarity Fund (
Fondo de Solidaridad Pensional
), depending on the employee’s salary (up to 2.0%), and the National Minimum Pension Warranty Fund (
Fondo de Garantía de Pensión Mínima
) (at 1.5%). The following chart presents this breakdown.
Breakdown of contributions for mandatory pension funds

|
(1)
|
Porvenir currently pays 1.45% of this 3.00% compensation for life and disability insurance coverage.
|
Porvenir earns revenues related only to an individual customer’s monthly contributions and does not charge a fee for the balance that is managed for its active customers. Inactive customers are charged a fee, calculated based on the monthly fund returns.
Employees may freely select their mandatory pension fund, a private AFP of their choice or the government-sponsored defined public benefit plan, administered by Colpensiones, and can change plans after meeting minimum tenure requirements of five years to switch from the public fund to a private plan, and six months to switch between private fund providers. Whenever an employee changes from one AFP to another, his/her entire savings balance at the fund is transferred to the pension fund administered by the new AFP.
Mandatory pension funds cannot be withdrawn prematurely, and they generally expand over the individual’s working years. Porvenir is the market leader in the mandatory pensions area, with Ps 28.9 billion of assets under management and 3.2 million individual customers at December 31, 2011. Since March 22, 2011, pension fund managers offer three types of mandatory funds under the new multi-fund regulatory system from which individual customers may choose. These funds are:
|
|
·
|
Conservative fund:
for individual customers with a low financial risk profile, or who are close to reaching retirement. The fund attempts to have the best possible return with low risk exposure. The maximum limit of equity securities is 20% of the fund’s value;
|
|
|
·
|
Moderate fund:
for individual customers with a medium financial risk profile, or in the middle of their working lives. The fund attempts to have the best possible return with a medium risk exposure. The maximum limit of equity securities is 45% of the fund’s value; and
|
|
|
·
|
Higher risk fund:
for individual customers with a high financial risk profile, or in the beginning of their working lives. The fund attempts to have the best possible return with higher risk exposure. The maximum limit of equity securities is 70% of the fund’s value.
|
Severance funds
Severance funds are independent trusts formed by the accumulated severance payment allowance required by Colombian labor law. The severance payment allowance is a social benefit inuring to employees for which employers are responsible under an employment agreement. The allowance consists of the payment of one month’s salary per year of service and pro rata amounts for fractions of a year. This amount is deposited directly with the AFP by the employer.
Severance accounts represented 4.6% of Porvenir’s assets under management at December 31, 2011.
Under Law 1328 of 2009, severance funds are divided into two portfolios, one for a long-term administration and a second for a short-term administration of the resources. Severance funds tend to be withdrawn fully over the 12 months following their deposit. Long-term growth comes from returns on these funds accumulated over the year. Porvenir and all other AFPs in Colombia charge a fee (per year for assets under management) of 1.0% for amounts in the mandatory investments short-term portfolio and 3.0% in the long-term portfolio. Until 2009, AFPs charged a flat fee of 4.0%. Employees may choose a different AFP to manage their severance fund payments from the AFP chosen to manage those of their mandatory pension fund.
Porvenir is the market leader in the severance area, with Ps 1.9 billion of assets under management and 1.6 million customers at December 31, 2011.
Voluntary pension funds
Voluntary pension funds are independent trusts formed by contributions from their participants and/or sponsors and their respective yields, for the purposes of complying with one or several voluntary retirement or disability pension plans.
Voluntary pension funds represented 4.6% of Porvenir’s assets under management at December 31, 2011.
All contributors to voluntary pension funds can invest their funds in one or more portfolios with different objectives, durations and risk profiles.
Porvenir earns annual management commissions for assets under management that range between 1.0% and 4.0%, depending on the balance of the customer and the selected portfolios (lower commissions for liquidity portfolios and higher commissions for more complex portfolios). At December 31, 2011, Porvenir had Ps 1.9 billion of voluntary pension assets under management and approximately 91,900 voluntary pension fund individual customers.
Third-party sponsored pension liability funds
Third-party sponsored pension liability funds represent approximately 20.8% of Porvenir’s assets under management at December 31, 2011. Third-party sponsored pension liability funds are made up of deposits from different institutions (both private and publicly owned) that require a professional institution to manage a fund that is usually created to finance particular pension regimes (i.e., pensions that are paid by the employer; before 1994, companies were allowed to establish their own internal pension systems).
Third-party sponsored pension liability funds in some cases have a minimum guaranteed return pursuant to their terms. Porvenir had Ps 8.6 billion of such assets under management at December 31, 2011, mostly under contracts of five years. The most important of these contracts is with the National Pension Fund of Territorial Entities (
Fondo Nacional de Pensiones de las Entidades Territoriales
), or “FONPET,” which is subject to renewal upon expiration in June 2012. Porvenir retains a percentage of the yearly returns of each third-party sponsored pension liability fund, and in some cases, a portion of assets under management.
Porvenir’s investments
Porvenir is required to own at least 1.00% of the funds it manages that are subject to a minimum return, known as the stabilization reserve. This stabilization reserve represents 49.6% of Porvenir’s proprietary investments. In addition, Porvenir holds voluntary investments. Revenues related to Porvenir’s stabilization reserve and its proprietary portfolio represented 4.0% of the total revenues of the company at December 31, 2011.
Distribution
Porvenir attracts new individual customers mainly through its large direct sales force (approximately 1,000 individuals) who report to four regional sales managers located in Barranquilla (northern region), Medellín (northwestern region), Cali (southern region) and Bogotá (central region). At December 31, 2011, Porvenir has 35 offices, 9 service modules, 50 electronic service centers and 5 business service centers. It maintains a presence in all regions of Colombia through its service agreements with Grupo Aval’s banks.
Corficolombiana
Corficolombiana is the largest merchant bank in Colombia based on total assets at December 31, 2011. Corficolombiana focuses on four main lines of business: (1) equity investments in strategic sectors of the Colombian economy, including, in particular, infrastructure, electricity and gas and finance; (2) investment banking, including services relating to capital markets, mergers and acquisitions and project finance transactions; (3) treasury operations; and (4) private banking.
Corficolombiana had total consolidated assets and shareholders’ equity of Ps 10,280.3 billion and Ps 2,930.4 billion, respectively, at December 31, 2011 and net income of Ps 608.1 billion for the year ended December 31, 2011.
The following table presents the share ownership structure of Corficolombiana at December 31, 2011.
|
Corficolombiana ownership (includes common and preferred shares)
|
||||
|
(in percentages)
|
||||
|
Banco de Bogotá
|
37.5 | |||
|
Banco de Occidente
|
13.4 | |||
|
Banco Popular
|
5.5 | |||
|
Ownership by funds managed by Porvenir(1)
|
2.1 | |||
|
Other investors (2)
|
13.0 | |||
|
General public
|
28.5 | |||
|
Total
|
100.0 | |||
|
(1)
|
Includes 1.0% of preferred shares.
|
|
(2)
|
Based on publicly available information, we have identified a group of investors who have maintained positions of at least one percent in Corficolombiana over a significant period of time.
|
Corficolombiana’s business model is based on three premises: (1) investing in businesses in strategic sectors of the Colombian economy; (2) distributing cash flows generated by its equity investment portfolio to its shareholders; and (3) acting as an investment fund and financial advisor that is listed on the Colombian Stock Exchange and regulated by the Superintendency of Finance. Corficolombiana’s equity investment strategy is to acquire and hold majority or substantial stakes in strategic businesses. These investments enable Corficolombiana to exert significant influence or control over these businesses’ operations and to promote revenue growth, operational efficiencies and optimization of the capital structures. Corficolombiana endeavors to achieve a balance between companies with potential to generate cash and companies with capacity to create value.
Corficolombiana’s funding strategy seeks to minimize liquidity risk by funding equity investments using its own equity, principally retained earnings. It has not sought to raise equity capital from its shareholders in the last five years. Between January 1, 2008 and December 31, 2011, the book value of Corficolombiana’s equity investment portfolio increased by 86.2% (on a consolidated basis and 70.6% on an unconsolidated basis) and its shareholders’ equity increased by 50.2% (on a consolidated basis and 57.6% on an unconsolidated basis). At December 31, 2011, the gross book value of Corficolombiana’s investment portfolio before provisions totaled Ps 2,532 billion on a consolidated basis (and Ps 3,450 billion on an unconsolidated basis) and its shareholders’ equity totaled Ps 2,930 billion (on a consolidated basis).
Corficolombiana is regulated as a finance corporation by the Superintendency of Finance. Under Colombian law, a finance corporation is permitted to hold equity ownership positions in both financial and non-financial companies, unlike banks, which may only invest in financial companies. See “—Supervision and regulation.”
History
Corficolombiana was founded in 1959 as an affiliate of Banco de Bogotá. Since 1997, it has acquired and merged with seven financial institutions. In 2005, Corficolombiana completed its most recent merger, with Corfivalle S.A., which resulted in Corficolombiana becoming the largest merchant bank in the country. Following this merger, Corficolombiana transferred its loan portfolio to Banco de Bogotá in order to focus on its merchant banking businesses.
Equity investment portfolio
Corficolombiana primarily invests in six sectors of the Colombian economy: infrastructure; electricity and gas; retail fuel distribution; financial services; hotels; and agribusiness. It generally seeks to invest in businesses with leading market positions, strong cash flows and growth potential.
The following charts provide information concerning Corficolombiana’s investments in sectors of the Colombian economy at December 31, 2011 and for the year ended December 31, 2011, as the case may be.
|
Sector breakdown by
book value of investments
at December 31, 2011
|
Sector breakdown by earnings (1)
for the year ended December 31, 2011
|
|

|

|
|
(1)
|
Corresponds to the sum of the net income of each of the investments, adjusted to reflect the ownership interest of Corficolombiana.
|
Corficolombiana has a track record of growth in its equity investment portfolio as measured by its book value evolution. Future growth will depend, in large part, on the identification of new investments and growth in the economic sectors in which it invests. During 2011, Corficolombiana made at least one new investment in each of its six key sectors and believes that it will have opportunities for further investments in each such sector in the coming years. In terms of its existing portfolio of equity investments, Corficolombiana intends to focus on realizing value from these investments through private sales or public offerings.
Corficolombiana’s infrastructure investments are concentrated in highway concession projects, a sector in which it is the leading private investor in Colombia. Among other investments, it has controlling ownership positions in four highway concession projects, consisting of the 85.6 kilometer highway between Bogotá and Villavicencio, the 57.0 kilometer highway between Buga, Tuluá and La Paila (subsequently extended by 20.1 kilometers to La Victoria), the 111 kilometer highway between Los Alpes and Villeta, Chuguacal and Cambao and the 38.3 kilometer highway between Fontibón and Facatativá. Corficolombiana’s infrastructure investments totaled Ps 362.0 billion after provisions at December 31, 2011 (on an unconsolidated basis).
Corficolombiana’s main investments in the energy and gas sector include minority stakes in the second-largest natural gas pipeline company in Colombia (Promigas S.A. E.S.P., or “Promigas”), an electricity and gas conglomerate (Empresa de Energía de Bogotá, or “EEB”) and a majority stake in a gas distribution company in northern Peru (Gas Comprimido del Peru S.A., or “Gascop”).
On February 10, 2011, Corficolombiana, Empresa de Energía de Bogotá and two Colombian private investment funds purchased from AEI three special purpose vehicles located in the Cayman Islands (AEI Promigas Holdings Ltd., AEI Promigas Ltd. and AEI Promigas Investments Ltd.), which together hold a 52.13% stake in Promigas.
Corficolombiana acquired 20.3% of the Special Purpose Vehicles. Corficolombiana and Porvenir, together with Corredores Asociados, an independent brokerage firm in Colombia, are also the investors in one of the private investment funds that participated in the transaction. Such private investment fund, which is independently directed by Corredores Asociados, acquired 47.9% of the Special Purpose Vehicles.
The total purchase price of this transaction was U.S.$792.8 million. Corficolombiana and Porvenir invested U.S.$388.7 million and U.S.$151.6 million in this transaction, respectively. Upon completion of the transaction, Corficolombiana had a 24.9% direct and indirect economic interest in Promigas. In addition, Corficolombiana and Porvenir together had a further 24.9% economic exposure to Promigas as a result of their respective holdings in the private investment fund.
Corficolombiana’s principal investment in the retail fuel distribution sector is a minority interest in Sociedad de Inversiones en Energía S.A., or “Terpel,” a company that operates 1,794 service stations in Colombia and four countries in Latin America (Chile, Ecuador, Panama and Peru). Terpel is the leading operator of service stations in Colombia, with a market share of 40.7% at December 31, 2011. Corficolombiana’s retail fuel distribution investments totaled Ps 106.5 billion at December 31, 2011 (on an unconsolidated basis and after provisions).
In the financial sector, Corficolombiana offers leasing, trust, brokerage and offshore banking services to third-party customers through three subsidiaries: Leasing Corficolombiana S.A., Fiduciaria Corficolombiana S.A. and Banco Corficolombiana (Panama) S.A. Corficolombiana’s investments in these three subsidiaries totaled Ps 334.7 billion at December 31, 2011 (on an unconsolidated basis and after provisions).
Investment banking, treasury and private banking businesses
Corficolombiana’s investment banking groups provide advice to third-party clients in the Colombian market covering a broad range of transactions, including, among others, capital markets, mergers and acquisitions, project finance and private banking. Corficolombiana has helped to shape the participation of the private sector in infrastructure projects, to develop the domestic capital markets and to expand the resources and operations of local companies in the region. In 2011, Corficolombiana’s investment bank helped secure financing and coordinate projects for its clients totaling more than Ps 2.4 trillion.
Corficolombiana’s treasury operations are a leading participant in Colombian capital markets, both in sovereign and corporate debt securities and foreign currency denominated securities. It is also an active participant in the derivatives market, and an active market maker for Colombian sovereign debt securities. At December 31, 2011, Corficolombiana had total fixed income assets of Ps 2,916.1 billion (on a consolidated basis).
Corficolombiana’s private banking business provides high income customers with a wide range of investment services and products. The private banking operations had approximately Ps 957.8 billion in assets under management for its customers at December 31, 2011.
BAC Credomatic
On December 9, 2010, we acquired all of the outstanding shares of BAC Credomatic GECF Inc., a company incorporated under the laws of the British Virgin Islands, pursuant to a stock purchase agreement with GE Consumer Finance Central Holdings Corp. and General Electric Capital Corporation (collectively, GE Capital) for U.S.$1.92 billion. BAC Credomatic GECF Inc. was renamed BAC Credomatic Inc. on June 7, 2011.
The BAC Credomatic acquisition provided us with a leading Central American presence with operations that are complementary to our businesses and with the opportunity to enter primarily the consumer and credit card banking businesses in this region. BAC Credomatic is a leading Central American banking group with operations in Costa Rica, El Salvador, Guatemala, Honduras, Nicaragua and Panama. BAC Credomatic maintains a credit card-issuing operation in Mexico, a small merchant and card processing center in the state of Florida and offshore subsidiaries in the Bahamas and the Cayman Islands. BAC Credomatic is one of the leading credit card issuance and merchant-acquiring franchises in Central America. BAC Credomatic’s credit card accounts represented 25.7% of total credit card accounts in Central America (calculated based on BAC Credomatic data and information published by Euromonitor International) at December 31, 2010.
We financed the BAC Credomatic acquisition, which was carried out by LB Panama, a subsidiary of Banco de Bogotá, with the following funds:
|
|
·
|
The issuance by Banco de Bogotá of Ps 2,284.6 billion (U.S.$1.18 billion) of mandatorily convertible bonds, which bore interest at 3.00%, until converted into Banco de Bogotá’s shares. All these notes converted into Banco de Bogotá shares by November 2011. These notes were initially subscribed as follows:
|
|
|
·
|
Grupo Aval: Ps 1,374.1 billion (U.S.$707.3 million);
|
|
|
·
|
Adminegocios & Cia. S.C.A., an entity beneficially owned by Mr. Sarmiento Angulo: Ps 425.4 billion (U.S.$219.0 million); and
|
|
|
·
|
other Banco de Bogotá’s shareholders and assignees of preferred rights: Ps 485.0 billion (U.S.$249.6 million).
|
|
|
·
|
Banco de Bogotá entered into a 364-day U.S.$1.0 billion (Ps 1,942.7 billion) senior bridge loan facility dated December 1, 2010 with Citibank, N.A., acting through its international banking facility, HSBC Bank USA, National Association and JPMorgan Chase Bank, N.A., an affiliate of J.P. Morgan Securities LLC, an initial purchaser, as lenders, or the “Senior Bridge Loan Facility.” Borrowings under the facility accrued interest at one-, two-, three- or six-month LIBOR, at Banco de Bogotá’s election, plus (1) 100 basis points until six months after December 1, 2010, (2) 125 basis points from six months after December 1, 2010 until nine months after December 1, 2010 and (3) 150 basis points from nine months after December 1, 2010 until the 364th day after December 1, 2010. On November 30, 2011, Banco de Bogotá entered into an amendment to the Senior Bridge Loan Facility with the lenders, which extended the maturity date of the facility to December 23, 2011, at an interest rate of LIBOR plus 175 basis points. On December 19, 2011, Banco de Bogotá completed an offering of U.S.$600 million of 5.00% Senior Notes due 2017, or the “Banco de Bogotá Debt Offering.” The net proceeds of the Banco de Bogotá Debt Offering were used to make repayments to the Senior Bridge Loan Facility. On December 19, 2011, Banco de Bogotá entered into a three-year U.S.$500 million unsecured term loan facility with HSBC Bank USA, National Association, as administrative agent, Citigroup Global Markets Inc., HSBC Securities (USA) Inc. and J.P. Morgan Securities LLC, as joint lead arrangers, and various financial institutions as lenders, or the “Banco de Bogotá Term Loan.” Borrowings under the facility will accrue interest at three or six months LIBOR, at Banco de Bogotá’s election, plus 225 bps per annum at any time. The proceeds of the loans were used, first, to repay amounts outstanding under the Senior Bridge Loan Facility and, second, for general corporate purposes. As such, the Senior Bridge Loan Facility has been fully repaid; and
|
|
|
·
|
LB Panama entered into two U.S.$135.0 million, totaling U.S.$270.0 million (Ps 524.5 billion), five-year term loans with Bancolombia S.A. and Bancolombia Miami Agency at 180 day LIBOR plus 3.125% on November 26, 2010.
|
A substantial portion of BAC Credomatic’s earnings, assets and liabilities is denominated in foreign currencies. As a result, BAC Credomatic is subject to risks relating to foreign currency exchange rate fluctuations. See “Item 3. Key Information—D. Risk factors—Risks relating to our businesses and industry—Other risks relating to our business—We are subject to fluctuations in interest rates and other market risks, which may materially and adversely affect our results of operations and financial condition.”
To mitigate this risk, BAC Credomatic seeks to maintain a U.S. dollar net asset position (long U.S. dollar position) which is intended to hedge 100% (and in no case less than 60%) of its shareholders’ equity against possible devaluations of each of the local currencies in the countries where it operates against the U.S. dollar. See “—BAC Credomatic operations—Foreign exchange rate risk related to the BAC Credomatic acquisition.”
Grupo Aval’s international expansion strategy
Historically, growth of Grupo Aval banks in terms of size and earnings has come principally from three sources: (1) Colombia’s banking system’s organic growth; (2) our banking subsidiaries’ ability to outpace the system’s organic growth; and (3) acquisitions, mainly in Colombia. We have applied different approaches to post-acquisition integration. Brands such as Banco de Bogotá, Banco de Occidente and Banco Popular have been retained as stand-alone institutions under our multi-brand approach. Others such as Megabanco, Banco Aliadas, Banco Unión, Banco del Comercio, Ahorramás and Corfivalle have been merged into Grupo Aval institutions. Given our leading position in the Colombian banking system, we expect growth through acquisitions to be opportunistic and of limited scope in the future.
In search of additional sources of growth, value creation for our shareholders and diversification, Grupo Aval has in recent years been considering options to expand outside Colombia. The intent of any expansion within this strategy has been:
|
|
·
|
to expand within our core businesses;
|
|
|
·
|
to consummate acquisitions of a size large enough to generate a meaningful source of future growth, but small enough not to distract management from its existing business or represent a significant risk for Grupo Aval’s current business; and
|
|
|
·
|
to consummate acquisitions in countries where our investment can give us a meaningful market share, with growth potential similar to or higher than that of Colombia, and with a favorable climate for foreign investment.
|
BAC Credomatic meets our criteria for international expansion because of the following factors:
|
|
·
|
it is one of the leading institutions in Central America as measured by net income, assets and deposits, and has a significant presence in the credit card-issuing and merchant acquiring markets;
|
|
|
·
|
it is present throughout the region with a common technological platform that allows it to provide its customers with transactional services online across Central America;
|
|
|
·
|
it has a proven track record of high profitability, with ROAE of 21.8% in 2011, 17.3% in 2010, 18.8% in 2009, 28.4% in 2008 and 28.2% in 2007 (excluding extraordinary gains in 2008 and 2007);
|
|
|
·
|
its management team has an average tenure of 15 years, most of whom pre-date GE Capital’s investment in BAC Credomatic; and
|
|
|
·
|
its size offers substantial room for growth in most of the countries in which it currently operates.
|
BAC Credomatic overview
BAC Credomatic is one of the leading financial institutions in Central America with a record of strong financial performance. It has achieved an average of 22.9% in annual ROAE for the period from 2007 to 2011 (excluding extraordinary gains in 2007 and 2008). BAC Credomatic is a full-service financial institution with one of the leading credit card-issuing and acquiring businesses in the region. BAC Credomatic offers commercial and retail banking, brokerage, insurance, pension fund management and other financial services. Its coverage extends throughout Central America with operations in Costa Rica, El Salvador, Guatemala, Honduras, Nicaragua and Panama, as well as Mexico (with a small credit card-issuing operation) and the state of Florida (with a merchant and card processing center). It also has a presence in the Bahamas and the Cayman Islands. Its Credomatic brand has key alliances with major credit card networks, such as
Visa, MasterCard, American Express
and
Diners Club
.
The table below shows BAC Credomatic financial data on a country-by-country basis at and for the year ended December 31, 2011.
|
At and for year ended December 31, 2011
|
||||||||||||||||||||||||
|
Net income
|
Loans
|
Deposits
|
||||||||||||||||||||||
|
(in U.S.$ millions except percentages)
|
||||||||||||||||||||||||
|
Costa Rica
|
81.4 | 37.7 | % | 1,829.5 | 30.5 | % | 1,628.3 | 26.0 | % | |||||||||||||||
|
El Salvador
|
26.2 | 12.1 | % | 840.1 | 14.0 | % | 947.8 | 15.1 | % | |||||||||||||||
|
Guatemala
|
54.7 | 25.4 | % | 668.8 | 11.1 | % | 632.9 | 10.1 | % | |||||||||||||||
|
Honduras
|
37.6 | 17.4 | % | 992.3 | 16.5 | % | 987.2 | 15.7 | % | |||||||||||||||
|
Nicaragua
|
30.2 | 14.0 | % | 624.1 | 10.4 | % | 792.7 | 12.6 | % | |||||||||||||||
|
Panama (1)
|
7.1 | 3.3 | % | 976.1 | 16.3 | % | 1,010.4 | 16.1 | % | |||||||||||||||
|
Mexico
|
(8.9 | ) | (4.1 | %) | 57.2 | 1.0 | % | 0.0 | 0.0 | % | ||||||||||||||
|
Regional offshore operations (2)
|
11.7 | 5.4 | % | 17.1 | 0.3 | % | 275.4 | 4.4 | % | |||||||||||||||
|
Corporate and eliminations
|
(24.2 | ) | (11.2 | %) | 0.0 | 0.0 | % | (3.0 | ) | 0.0 | % | |||||||||||||
|
Consolidated
|
215.8 | 100.0 | % | 6,005.2 | 100.0 | % | 6,271.7 | 100.0 | % | |||||||||||||||
|
(1)
|
Panama loans include operations from BAC Credomatic’s Panama subsidiaries and certain intercompany adjustments.
|
|
(2)
|
Includes BAC Bahamas Bank Ltd. and BAC International Bank (Grand Cayman).
|
The table below presents BAC Credomatic’s percentage of total loans and deposits in each of its main markets at December 31, 2011.
|
At December 31, 2011
|
||||||||
|
Loans
|
Deposits
|
|||||||
|
(in percentages)
|
||||||||
|
Costa Rica (1)
|
10.7 | % | 8.9 | % | ||||
|
El Salvador
|
9.7 | % | 10.1 | % | ||||
|
Guatemala
(2)
|
3.2 | % | 2.8 | % | ||||
|
Honduras
|
13.0 | % | 12.0 | % | ||||
|
Nicaragua
|
27.2 | % | 21.9 | % | ||||
|
Panama
|
2.8 | % | 3.0 | % | ||||
|
(1)
|
Percentage calculation for Costa Rica includes state-owned banks (Banco Nacional de Costa Rica, Banco de Costa Rica and Banco Crédito Agrícola de Cartago), which at December 31, 2011 and December 31, 2010, respectively, had a 49.3% and 48.3% market share by loans and a 57.6% and 58.1% market share by deposits.
|
|
(2)
|
Percentage in Guatemala by loans and deposits are 4.5% and 3.3% at December 31, 2011 and 5.0% and 3.8% at December 31, 2010, respectively, when considering data for financial groups, as reported to the local regulator. Source: Superintendency of Banks of Guatemala (Superintendencia de Bancos de Guatemala).
|
History
BAC Credomatic has been providing financial services in the Central American region since 1952, when Banco de America (a predecessor entity) was founded in Nicaragua. In 1974, BAC Credomatic (at the time, Credomatic) began its credit card operations in Central America through Credomatic and launched its payment systems network. In 1985, BAC Credomatic entered the banking business in Costa Rica. As part of its regional expansion strategy, in 2007 BAC Credomatic acquired Banco Mercantil in Honduras, Propemi in El Salvador and Corporación Financiera Miravalles in Costa Rica.
In June 2005, GE Capital acquired 49.99% of the capital stock of BAC Credomatic from entities affiliated with Mr. Carlos Pellas (including BAC Credomatic Holding Company Ltd., or the minority shareholder), who owns a conglomerate of financial, industrial and commercial companies in Central America. In June 2009, GE Capital increased its ownership stake in BAC Credomatic to 75%, as contemplated by the shareholders’ agreement between GE Capital and the minority shareholder. In July 2010, GE Capital and Grupo Aval reached an agreement to sell 100% of BAC Credomatic to Banco de Bogotá. The acquisition was completed on December 9, 2010. Immediately prior to closing the transaction, GE Capital acquired the remaining 25.0% of BAC Credomatic’s share capital that it did not own from the minority shareholder.
As with our approach in our acquisitions in Colombia to date, we have retained a majority of BAC Credomatic’s senior management. These executives have on average 15 years experience at BAC Credomatic and for the most part pre-date GE Capital’s 2005 investment in BAC Credomatic. We plan to continue executing our multi-brand business model by maintaining the BAC Credomatic brand and integrating it into our operations. We currently review BAC Credomatic’s results of operations on a monthly basis and consolidate such results in our audited financial statements through Banco de Bogotá.
BAC Credomatic operations
BAC Credomatic provides banking, credit card and other financial services mainly in Costa Rica, El Salvador, Guatemala, Honduras, Nicaragua and Panama. The BAC Credomatic brand is widely recognized in Central America, a region that is comparable to Colombia, with significant growth potential in financial services. At December 31, 2011, BAC Credomatic had assets of U.S.$9.2 billion, loans at book value of U.S.$6.0 billion and deposits of U.S.$6.3 billion. At December 31, 2011, BAC Credomatic had shareholders’ equity of U.S.$1,049 million and reported net income of U.S.$216 million for the year ended December 31, 2011. BAC Credomatic served more than 2.2 million customers through 477 points of contact including 226 full-service branches, 39 in-store branches offering teller services in retail stores, 184 on-site branches offering full banking services for corporate employees, and 28 auto/drive-thru branches throughout Central America at December 31, 2011 and a single technological platform that allows online transactions between countries in the region
.
We believe that BAC Credomatic has a leading presence in the credit card-issuing business and a significant presence in the acquiring market in Central America. At December 31, 2011, BAC Credomatic had approximately 2.4 million credit card and debit card accounts, of which approximately 1.4 million were debit card accounts and approximately 1.0 million were credit card accounts. At December 31, 2010, BAC Credomatic’s credit card accounts represented approximately 25.7% of total credit card accounts in Central America (calculated based on BAC Credomatic data and information published by Euromonitor International). Through its merchant acquiring business, BAC Credomatic’s processing volume amounted to U.S.$9,661 million for the year ended December 31, 2011, representing an increase of U.S.$1,620 million, or 20.1%, from U.S.$8,041 million for the year ended December 31, 2010, mainly driven by strong performance in Costa Rica, Guatemala and Honduras.
BAC Credomatic offers a wide range of products and integrated financial solutions to its clients throughout the region. BAC Credomatic operates across two main integrated business lines, offering credit card and banking services to its customers.
The following chart shows BAC Credomatic’s principal subsidiaries at December 31, 2011.

Lending activities
The following table shows BAC Credomatic’s gross loan portfolio at the dates indicated. BAC Credomatic’s loan portfolio consists of credit card loans, commercial loans, mortgage loans, automobile and vehicle loans and personal loans. BAC Credomatic’s loan portfolio increased by U.S.$649 million (12.1%) at December 31, 2011. This increase was mainly driven by commercial loans, mortgages and credit cards, as economic activity recovered.
|
At December 31,
|
||||||||
|
2011
|
2010
|
|||||||
|
(in U.S.$ millions)
|
||||||||
|
Credit card loans
|
1,398 | 1,306 | ||||||
|
Commercial loans (1)
|
2,077 | 1,740 | ||||||
|
Mortgage loans (2)
|
1,742 | 1,616 | ||||||
|
Automobile and vehicle loans
|
441 | 382 | ||||||
|
Other personal loans
|
347 | 312 | ||||||
|
Total
|
6,005 | 5,356 | ||||||
|
(1)
|
Represents loans to businesses.
|
|
(2)
|
Includes loans measured at fair value.
|
We believe that BAC Credomatic’s customer knowledge, coupled with a centralized risk-management structure, has resulted in a high quality loan portfolio, with an average 90 days and more past due loan ratio of 1.5% from 2008 to 2011, and 1.0% at December 31, 2011.
Credit cards
BAC Credomatic has a leading presence in the credit card-issuing business and a significant presence in the merchant acquiring business in the region. Through its Credomatic brand, BAC Credomatic offers its customers a wide variety of credit and debit cards including
Visa
,
MasterCard
,
American Express
and
Diners Club
, and is the only network that processes all major brands in the region. Additionally, BAC Credomatic and its customers benefit from co-branding agreements with major airlines (such as American Airlines and TACA Avianca) and major supermarkets (such as Pricesmart and Wal-Mart) present in the region. BAC Credomatic has been a member of
Visa
and
MasterCard
for more than 20 years, issuing both national and international credit cards. Moreover, BAC
Credomatic is currently the exclusive credit card issuer and merchant acquirer of
American Express
in the Central American region, with the exception of Panama.
Card-issuing
BAC Credomatic has a leading presence in the Central American card-issuing market. At December 31, 2011, BAC Credomatic had approximately 2.4 million credit card and debit card accounts, of which 1.4 million were debit card accounts and 1.0 million were credit card accounts. BAC Credomatic’s credit card accounts represented 25.7% of total credit card accounts in Central America at December 31, 2010 (calculated based on BAC Credomatic data and information published by Euromonitor International). From December 31, 2005 to December 31, 2011, BAC Credomatic’s credit card accounts grew at a CAGR of 6.1% and its debit card accounts grew at a CAGR of approximately 22.1%. The following table shows the number of credit card and debit card accounts at the dates indicated.
|
At December 31,
|
||||||||
|
2011
|
2010
|
|||||||
|
(in thousands)
|
||||||||
|
Credit cards
|
1,051 | 1,011 | ||||||
|
Debit cards
|
1,380 | 1,075 | ||||||
|
Total
|
2,431 | 2,085 | ||||||
For the year ended December 31, 2011, BAC Credomatic’s billed volume was U.S.$5,444 million, a 21.8% increase over the U.S.$4,469 million billed volume for the year ended December 31, 2010.
|
At December 31,
|
||||||||
|
2011
|
2010
|
|||||||
|
(in U.S.$ millions)
|
||||||||
|
Credit cards
|
4,584 | 3,789 | ||||||
|
Debit cards
|
861 | 680 | ||||||
|
Total
|
5,444 | 4,469 | ||||||
In its card-issuing business, BAC Credomatic has a strong presence in the premier and high-end customer segments in Central America. BAC Credomatic’s Platinum credit card clients averaged yearly expenditures in 2011 of U.S.$13,293 and represented approximately 14.7% of BAC Credomatic’s total credit card portfolio, and its Gold credit card clients averaged yearly expenditures in 2011 of U.S.$5,364 and represented approximately 22.2% of BAC Credomatic’s total credit card portfolio. BAC Credomatic’s Classic credit card clients, who averaged yearly expenditures in 2011 of U.S.$1,682, represented 55.9% of BAC Credomatic’s credit card portfolio while other clients represented the remaining 7.2%.
At December 31, 2011, BAC Credomatic’s credit card portfolio totaled U.S.$1.4 billion, growing at a 12.1% CAGR from U.S.$706 million in December 31, 2005. At this same date, 74.3% of BAC Credomatic’s credit card portfolio was distributed across Costa Rica, El Salvador, Guatemala and Panama. The remaining 25.7% was distributed among Honduras, Nicaragua and Mexico. The following table shows the credit card portfolio breakdown by country at the dates presented.
|
At December 31,
|
||||||||||||||||
|
2011
|
2010
|
|||||||||||||||
|
(in U.S.$ millions, except percentages)
|
||||||||||||||||
|
Costa Rica
|
425 | 30.4 | % | 408 | 31.2 | % | ||||||||||
|
El Salvador
|
215 | 15.4 | % | 219 | 16.8 | % | ||||||||||
|
Guatemala
|
205 | 14.6 | % | 185 | 14.2 | % | ||||||||||
|
Honduras
|
199 | 14.2 | % | 181 | 13.9 | % | ||||||||||
|
Nicaragua
|
104 | 7.4 | % | 94 | 7.2 | % | ||||||||||
|
Panama
|
193 | 13.8 | % | 164 | 12.6 | % | ||||||||||
|
Mexico
|
57 | 4.1 | % | 55 | 4.1 | % | ||||||||||
|
Total
|
1,398 | 100.0 | % | 1,306 | 100.0 | % | ||||||||||
For the past three years, BAC Credomatic has maintained a stable credit card portfolio quality. Of its total credit card portfolio, BAC Credomatic’s 90 days and more past due loans represented 1.7% at December 31, 2011, 2.0% at December 31, 2010 and 2.8% at December 31, 2009.
Merchant acquiring
BAC Credomatic has a significant presence in Central America’s merchant acquiring business, achieving processing volumes of U.S.$9,661 million and U.S.$8,041 million for the years ended December 31, 2011 and 2010, respectively. This performance compares favorably to processing volumes of other leading Latin American issuers at December 2010 according to the Nilson Report at May 2011, such as Cielo’s (formerly known as Visanet) U.S.$151,615 million (Brazil), Redecard’s U.S.$105,639 million (Brazil), Santander Serfin’s U.S.$6,258 million (Mexico), Banorte’s U.S.$4,435 million (Mexico) and Grupo Bancolombia’s U.S.$4,613 million (Colombia). From December 31, 2005 to December 31, 2011, BAC Credomatic’s processing volume grew at a CAGR of 15.1%.
The table set forth below shows the processing volume for the period presented.
|
At December 31,
|
||||||||
|
2011
|
2010
|
|||||||
|
(in U.S.$ millions)
|
||||||||
|
Local
|
7,826 | 6,444 | ||||||
|
International
|
1,835 | 1,598 | ||||||
|
Total
|
9,661 | 8,041 | ||||||
BAC Credomatic’s processing volume for the year ended December 31, 2011 of U.S.$9,661 million represented an increase of U.S.$1,620 million, or 20.1%, from U.S.$8,041 for the previous year. This increase is primarily due to a recovery in the economic activity compared to 2010 and is mainly driven by strong performance in Costa Rica, Guatemala and Honduras.
BAC Credomatic has the only network in Central America that processes all the major brands including
Visa
,
MasterCard
,
American Express
and
Diners Club
. Furthermore, BAC Credomatic has exclusive card-issuing and merchant acquiring agreements with
American Express
for the Central American region, with the exception of Panama.
At December 31, 2011, BAC Credomatic serviced approximately 138,494 merchant locations, with 95% of credit card authorizations processed electronically through its 110,345 point-of-sale devices.
Banking
BAC Credomatic’s commercial and consumer banking divisions offer traditional banking services and products. In some jurisdictions, BAC Credomatic also offers pension plan administration, investment fund advice, financial advisory, leasing, private banking and insurance services to its customers. Through its network and deep customer knowledge, BAC Credomatic is able to effectively offer services and solutions to its customers in addition to instant payment processing and funds transfers within the BAC Credomatic regional network.
Commercial banking
BAC Credomatic offers traditional commercial banking services and products. At December 31, 2011, 59.3% of BAC Credomatic’s commercial loan portfolio was distributed across Costa Rica, El Salvador, Guatemala and Panama. The remaining 40.7% was distributed among Honduras, Nicaragua, and regional offshore operations. The following table displays BAC Credomatic’s commercial loan portfolio by country at the dates presented.
|
At December 31,
|
||||||||||||||||
|
2011
|
2010
|
|||||||||||||||
|
(in U.S.$ millions, except percentages)
|
||||||||||||||||
|
Costa Rica
|
552 | 26.6 | % | 421 | 24.2 | % | ||||||||||
|
El Salvador
|
267 | 12.9 | % | 235 | 13.5 | % | ||||||||||
|
Guatemala
|
169 | 8.1 | % | 129 | 7.4 | % | ||||||||||
|
Honduras
|
472 | 22.7 | % | 459 | 26.4 | % | ||||||||||
|
Nicaragua
|
362 | 17.4 | % | 290 | 16.6 | % | ||||||||||
|
Panama (1)
|
243 | 11.7 | % | 191 | 11.0 | % | ||||||||||
|
Regional offshore operations (2)
|
12 | 0.6 | % | 14 | 0.8 | % | ||||||||||
|
Total
|
2,077 | 100.0 | % | 1,740 | 100.0 | % | ||||||||||
|
(1)
|
Panama loans include our operations from BAC Credomatic’s Panama subsidiaries and certain BAC Credomatic intercompany adjustments.
|
|
(2)
|
Includes BAC Bahamas Bank Ltd. and BAC International Bank (Grand Cayman).
|
BAC Credomatic has managed its commercial portfolio risk conservatively, maintaining high quality and coverage metrics. The following table displays BAC Credomatic’s commercial loan portfolio 90 days and more past due loan ratio, as well as its 90 days and more past due loan coverage ratio at the dates presented.
|
At December 31,
|
||||||||
|
2011
|
2010
|
|||||||
|
(in percentages)
|
||||||||
|
90 days and more past due loan ratio
|
0.6 | 1.4 | ||||||
|
90 days and more past due loan coverage ratio
|
215.2 | 128.3 | ||||||
BAC Credomatic also offers investment products, supplier and payroll ePayments, Ameritransfer (online transfer of funds among deposit accounts in BAC Credomatic’s network), online banking and foreign exchange services as part of its commercial banking platform in the region. At December 31, 2011, BAC Credomatic had more than 72,493 enterprise customers, divided into three main sectors: (1) corporate, consisting of companies with over U.S.$250,000 in deposits, more than 100 employees and loans over U.S.$1,000,000, which represented 81.1% of total commercial loans; (2) midsize companies, composed of companies with deposits of U.S.$50,000 to U.S.$250,000, between 51 to 100 employees and loans between U.S.$300,000 to U.S.$1,000,000, which represented 10.5% of total commercial loans; and (3) small companies, consisting of companies with deposits of less than U.S.$50,000, fewer than 50 employees and loans under U.S.$300,000, which represented 8.2% of total commercial loans.
BAC Credomatic’s electronic transfer and payment capabilities allow corporate clients to instantly transfer funds between different commercial and consumer accounts, provided that all parties have a BAC Credomatic account. BAC Credomatic recorded over U.S.$25.8 billion in electronic payments in 2011.
Electronic transfers originate mainly from: (1) merchant deposit transfer payments (instant electronic payments to merchants); (2) Ameritransfer (online transfer of funds across the region); (3) supplier ePayments (instant electronic payments from merchants to suppliers); and (4) payroll ePayments (payroll payments from companies to employees). The following table breaks down BAC Credomatic’s electronic transfers by product for the dates presented.
|
At December 31,
|
||||||||
|
2011
|
2010
|
|||||||
|
(in U.S.$ billions)
|
||||||||
|
Merchant deposit transfers
|
9.7 | 8.0 | ||||||
|
Ameritransfer
|
5.1 | 4.5 | ||||||
|
Payroll ePayments
|
3.5 | 3.0 | ||||||
|
Supplier ePayments
|
7.6 | 6.0 | ||||||
|
Total
|
25.8 | 21.5 | ||||||
Consumer banking
At December 31, 2011, as a proportion of BAC Credomatic’s total consumer loan portfolio, mortgage loans represented 68.8%, automobile and vehicle loans represented 17.4% and other personal loans represented 13.7%. Approximately 83.6% of the total consumer loan portfolio had a maturity greater than five years. At December 31, 2011, consumer loans amounted to U.S.$2.5 billion, a 9.6% increase over U.S$2.3 billion at December 31, 2010. At December 31, 2011, 80.8% of BAC Credomatic’s consumer loan portfolio was distributed across Costa Rica, El Salvador, Guatemala and Panama. The remaining 19.2% was distributed among Honduras, Nicaragua and regional offshore operations. The following table displays BAC Credomatic’s consumer loan portfolio by country at the dates presented.
|
At December 31,
|
||||||||||||||||
|
2011
|
2010
|
|||||||||||||||
|
(in U.S.$ millions, except percentages)
|
||||||||||||||||
|
Costa Rica (1)
|
852 | 33.7 | % | 717 | 31.0 | % | ||||||||||
|
El Salvador
|
358 | 14.1 | % | 354 | 15.3 | % | ||||||||||
|
Guatemala
|
295 | 11.7 | % | 300 | 13.0 | % | ||||||||||
|
Honduras
|
322 | 12.7 | % | 301 | 13.0 | % | ||||||||||
|
Nicaragua
|
159 | 6.3 | % | 147 | 6.4 | % | ||||||||||
|
Panama (2)
|
539 | 21.3 | % | 467 | 20.2 | % | ||||||||||
|
Regional offshore operations (3)
|
5 | 0.2 | % | 25 | 1.1 | % | ||||||||||
|
Total
|
2,531 | 100.0 | % | 2,310 | 100.0 | % | ||||||||||
|
(1)
|
Includes loans measured at fair value.
|
|
(2)
|
Loans include operations of BAC Credomatic’s Panama subsidiaries and certain BAC Credomatic intercompany adjustments.
|
|
(3)
|
Includes BAC Bahamas Bank Ltd. and BAC International Bank (Grand Cayman).
|
At December 31, 2011, BAC Credomatic’s mortgage loans had an individual average mortgage balance of approximately U.S.$1.7 billion, with an average loan-to-value ratio of approximately 58.7%. Given that BAC Credomatic’s mortgage loan portfolio has no significant exposure to the higher risk sectors such as vacation homes or second-home mortgages, it maintains a 90 days and more past due loan ratio of 1.2% and a coverage of 90 days and more past due loan coverage ratio of 146.6% (includes recovery value of collateral). The following table displays BAC Credomatic’s mortgage loan portfolio 90 days and more past due loan ratio, as well as its 90 days and more past due loan coverage ratio at the dates presented.
|
At December 31,
|
||||||||
|
2011
|
2010
|
|||||||
|
(in percentages)
|
||||||||
|
90 days and more past due loan ratio
|
1.2 | 1.4 | ||||||
|
90 days and more past due loan coverage ratio (1)
|
146.6 | 130.4 | ||||||
|
(1)
|
Includes recovery value of collateral.
|
At December 31, 2011, BAC Credomatic’s automobile and vehicle loan portfolio had an individual average balance of approximately U.S.$409.1 million, maintaining a 90 days and more past due loan ratio of 0.3%. The following table displays BAC Credomatic’s auto loan portfolio 90 days and more past due loan ratio, as well as its 90 days and more past due loan coverage ratio at the dates presented.
|
At December 31,
|
||||||||
|
2011
|
2010
|
|||||||
|
(in percentages)
|
||||||||
|
90 days and more past due loan ratio
|
0.3 | 0.5 | ||||||
|
90 days and more past due loan coverage ratio
|
147.8 | 156.5 | ||||||
BAC Credomatic’s personal loan portfolio includes individual loans, retirement linked loans, payroll loans and consumer finance loans. At December 31, 2011, BAC Credomatic’s personal loan portfolio had an individual average loan balance of approximately U.S.$334.7 million, and a 90 days and more past due loan ratio of 0.3%. The following table displays BAC Credomatic’s personal loan portfolio 90 days and more past due loan ratio, as well as its 90 days and more past due loan coverage ratio at the dates presented.
|
At December 31,
|
||||||||
|
2011
|
2010
|
|||||||
|
(in percentages)
|
||||||||
|
90 days and more past due loan ratio
|
0.3 | 0.8 | ||||||
|
90 days and more past due loan coverage ratio
|
272.8 | 153.3 | ||||||
Deposit activities
The following table shows BAC Credomatic’s deposit breakdown at the dates indicated. At December 31, 2011, 44.9% of BAC Credomatic’s deposit base was represented by demand deposits. Total deposits increased by 4.0% from December 31, 2010 to December 31, 2011. From December 31, 2005 to December 31, 2011, the CAGR of total deposits has been 18.5%.
|
At December 31,
|
||||||||
|
2011
|
2010
|
|||||||
|
(in U.S.$ millions)
|
||||||||
|
Demand deposits
|
2,814 | 2,731 | ||||||
|
Savings deposits
|
1,272 | 1,130 | ||||||
|
Time deposits
|
2,186 | 2,171 | ||||||
|
Total
|
6,272 | 6,032 | ||||||
Distribution network
BAC Credomatic serves its customers throughout Central America with a diversified distribution network that includes branches, kiosks (non-cash machines which provide online banking capabilities as well as a full keyboard), ATMs, a standardized online banking platform, call centers, and mobile phone banking. Additionally, BAC Credomatic’s strong point-of-sale presence in 138,494 merchant locations in Central America at December 31, 2011 allows clients to perform various transactions, including purchases, using credit or debit cards, payments of credit card balances and loyalty program services.
BAC Credomatic serves its clients through multiple channels to cover the needs of different customer segments across the region.
The following map shows BAC Credomatic’s branch distribution at December 31, 2010 and 2011.
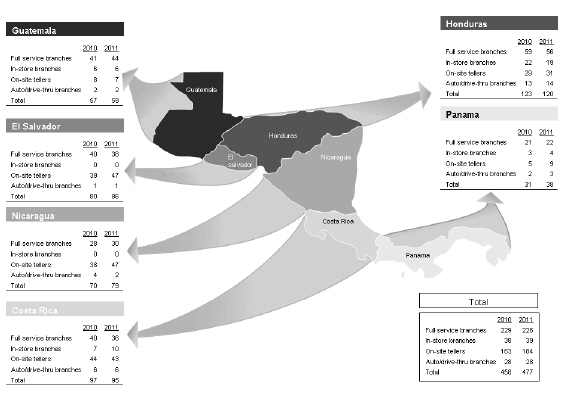
At December 31, 2011, BAC Credomatic had a network of 1,186 ATMs in the region. BAC Credomatic was the first bank in Central America to offer deposit capabilities with instant credit balance through its ATMs. Additionally, BAC Credomatic has 231 self-service kiosks.
BAC Credomatic deployed the first mobile banking platform in Central America and expects to benefit from further regional penetration. BAC Credomatic’s mobile banking system is SMS-enabled and it has several smart phone applications under development.
Foreign exchange rate risk related to the BAC Credomatic acquisition
Because of the BAC Credomatic acquisition, Grupo Aval is exposed to changes in the values of current holdings and future cash flows denominated in other currencies. The types of instruments exposed to foreign exchange rate risk include, for example, investments in foreign subsidiaries, foreign currency-denominated loans and securities, foreign currency-denominated debt and various foreign exchange derivative instruments whose values fluctuate with changes in the level or volatility of currency exchange rates or foreign interest rates. Hedging instruments used to mitigate this risk include foreign exchange options, currency swaps, futures, forwards, foreign currency-denominated senior notes and term loan facilities amounting to approximately U.S.$1.4 billion and deposits.
Grupo Aval, through Banco de Bogotá and LB Panama, has financed the BAC Credomatic acquisition, as described in this section, through the use of facilities denominated in U.S. dollars and currently amounting to approximately U.S.$1.4 billion. The foreign exchange rate risk associated with this U.S. dollar-denominated liability is hedged with the net investment that Grupo Aval maintains in BAC Credomatic. The difference between the U.S. dollar-denominated debt and the net investment in BAC Credomatic (including any goodwill associated with the acquisition) may result in a net U.S. dollar asset position which Grupo Aval, through Banco de Bogotá and LB Panama may hedge with forward contracts.
In accordance with its market risk policies, BAC Credomatic maintains a U.S. dollar net asset position (long U.S. dollar position) which is intended to hedge 100% (and in no case less than 60%) of its shareholders’ equity against possible devaluations of each of the local currencies in the countries where it operates against the U.S. dollar.
Other corporate information
Technology
We continuously invest in new technology and the renewal of equipment and infrastructure in order to serve customers effectively, improve our profitability and grow our business. We believe that proper management of technology is key to the efficient management of our business. Our technology architecture focuses on our customers and supports our business model.
Our banking subsidiaries, Porvenir and Corficolombiana, currently maintain their own technological infrastructure and software. We believe that this technology provides us with an opportunity to seek potential additional synergies as we implement our overall technology model: assisting with the standardization and implementation of systems developed in our subsidiaries and sister banks.
One of our most successful initiatives to date has been the coordination of banking branches and electronic channels within our Colombian banks, in Porvenir and ATH, the administrator of our ATMs and the transactional services that flow through the
Red de Grupo Aval
network. Although these electronic channels have been fully implemented, we plan to continue to enhance their operations with new technology. The
Red de Grupo
Aval
network coordinates connectivity between branches, technical support, webpages and transactional Internet, mobile banking, non-banking correspondence and payments and collections.
Our principal projects currently consist of the following:
|
|
·
|
Technological architecture: We are pursuing a new technology model to deploy a new core banking system and to adopt and transform applications based on a service-oriented architecture that will increase efficiencies; and
|
|
|
·
|
Business basic software: Our focus is on implementing a CRM (customer relationship management) and BI (business intelligence), credit card solutions and approval process, commercial portfolio, finance trade, collections and the SARO (operational risk management system) project.
|
We incurred Ps 620.0 billion of capital expenditures relating to information technology in the year ended December 31, 2011 and expect to invest approximately the same amount in 2012.
Intellectual property
At December 31, 2011, Grupo Aval had approximately 30 registered brands and trademarks in Colombia and approximately 22 registered brands and trademarks in Bolivia, Brazil, Chile, Ecuador, México, Panama, Paraguay, Peru, United States and Venezuela.
Banco de Bogotá has approximately 223 brands and trademarks, as well as 14 slogans. Banco de Occidente has approximately 111 brands and trademarks as well as 5 slogans. Banco Popular has approximately 42 brands and trademarks and one slogan. Banco AV Villas has approximately 121 brands and trademarks and 9 slogans. Porvenir has approximately 61 registered brands and trademarks and 9 slogans. Corficolombiana has approximately 25 brands and trademarks and one slogan. All of the brands and trademarks of Banco de Bogotá, Banco de Occidente, Banco Popular, Banco AV Villas, Porvenir and Corficolombiana are registered in Colombia, and some are also registered in other countries.
Corporate social responsibility
We coordinate with several corporate social responsibility initiatives our banks that help us maintain the strength of our image and reputation with respect to all our stakeholders. We participate in community education and professional training programs for micro- and small- enterprises, and we engage in microfinance, social inclusion, cultural, sporting, human rights awareness and health projects for low-income populations throughout Colombia. We consistently seek to improve our environmental footprint by, for example, sponsoring the “Planeta Azul” prize for the best water-conservation project, and by promoting the use of electronic means over paper. Our banks have donated the money to build 400 priority housing solutions for families who lost their houses in the heavy flooding that took place in Colombia in 2010.
We follow corporate human resources policies that seek employee well-being in areas such as hiring, promotion and work-related development and training. In 2011, we spent approximately Ps 21.4 billion in corporate social responsibility initiatives, and in 2010 we spent Ps 10.5 billion on such initiatives.
Selected statistical data
The following information is included for analytical purposes and should be read in conjunction with our consolidated financial statements included in this annual report as well as “Operating and financial review and prospects.” This information has been prepared based on our financial records, which are prepared in accordance with Colombian Banking GAAP and do not reflect adjustments necessary to present the information in accordance with U.S. GAAP. This information includes Grupo Aval’s financial information at and for the fiscal years ended December 31, 2011, 2010, 2009, 2008 and 2007, as applicable. As permitted by the Superintendency of Finance, Grupo Aval began consolidating BAC Credomatic’s results from December 1, 2010 in its consolidated financial statements. Prior to our acquisition of BAC Credomatic, Grupo Aval had limited operations outside of Colombia. Accordingly, we are providing disclosure on our foreign operations commencing the fiscal year ended December 31, 2010.
Distribution of assets, liabilities and shareholders’ equity, interest rates and interest differential
Average balances have been calculated as follows: for each month, the actual month-end balances were established. The average balance for each period is the average of these month-end balances over a 13-month period. We stop accruing interest on loans after they are past due by more than a certain number of days that depends on the type of loan. See “—Loan portfolio—Suspension of accruals.” For purposes of the presentation in the following tables, non-performing loans have been treated as non-interest-earning assets.
Under Colombian Banking GAAP, interest on investment securities includes accrued interest on debt instruments, valuation adjustments and gains (losses) realized on debt and equity securities that are accounted for as “available for sale,” gains (losses) on repurchase transactions (repos), gains (losses) realized on the sale of debt securities, and mark-to-market gains (losses) on our trading securities portfolio.
Average balance sheet
For the years ended December 31, 2011, 2010 and 2009, the following table presents:
|
|
·
|
average balances calculated using actual month-end balances for our assets and liabilities (based on non-consolidated monthly amounts for a 13-month period and the last day of the prior year, adjusted for consolidation by the addition or subtraction of, as applicable, average balances for the three respective semi-annual periods);
|
|
|
·
|
interest income and expense amounts; and
|
|
|
·
|
average yield and interest rate for our interest-earning assets and interest-bearing liabilities, respectively.
|
The interest rate subtotals are based on the weighted average of the average peso-denominated and foreign currency-denominated balances.
|
Average balance sheet and income from interest-earning assets for years ended December 31,
|
||||||||||||||||||||||||||||||||||||
|
2011
|
2010
|
2009
|
||||||||||||||||||||||||||||||||||
|
Average balance
|
Interest income earned
|
Average yield
|
Average balance
|
Interest income earned
|
Average yield
|
Average balance
|
Interest income earned
|
Average yield
|
||||||||||||||||||||||||||||
|
(in Ps billions, except percentages)
|
||||||||||||||||||||||||||||||||||||
|
Assets
|
||||||||||||||||||||||||||||||||||||
|
Interest-earning assets
|
||||||||||||||||||||||||||||||||||||
|
Interbank and overnight funds
|
||||||||||||||||||||||||||||||||||||
|
Domestic
|
||||||||||||||||||||||||||||||||||||
|
Peso-denominated
|
1,081.9 | 115.7 | 10.7 | % | 1,798.1 | 89.2 | 5.0 | % | 695.0 | 140.0 | 20.1 | % | ||||||||||||||||||||||||
|
Foreign-denominated
|
745.0 | 6.8 | 0.9 | % | 665.8 | 7.9 | 1.2 | % | 1,129.6 | 8.9 | 0.8 | % | ||||||||||||||||||||||||
|
Total domestic
|
1,827.0 | 122.5 | 6.7 | % | 2,464.0 | 97.1 | 3.9 | % | 1,824.6 | 148.9 | 8.2 | % | ||||||||||||||||||||||||
|
Foreign
|
1,033.8 | 23.0 | 2.2 | % | 92.0 | 1.9 | 2.1 | % | – | – | – | |||||||||||||||||||||||||
|
Total
|
2,860.8 | 145.5 | 5.1 | % | 2,556.0 | 99.0 | 3.9 | % | 1,824.6 | 148.9 | 8.2 | % | ||||||||||||||||||||||||
|
Investment securities (1)
|
||||||||||||||||||||||||||||||||||||
|
Domestic
|
||||||||||||||||||||||||||||||||||||
|
Peso-denominated
|
15,709.1 | 878.6 | 5.6 | % | 15,363.0 | 1,308.2 | 8.5 | % | 11,789.4 | 1,534.3 | 13.0 | % | ||||||||||||||||||||||||
|
Foreign-denominated
|
1,926.9 | 98.4 | 5.1 | % | 1,978.5 | 140.4 | 7.1 | % | 1,854.4 | 142.6 | 7.7 | % | ||||||||||||||||||||||||
|
Total domestic
|
17,636.0 | 977.0 | 5.5 | % | 17,341.5 | 1,448.6 | 8.4 | % | 13,643.8 | 1,676.9 | 12.3 | % | ||||||||||||||||||||||||
|
Foreign
|
1,333.4 | 52.8 | 4.0 | % | 104.3 | 4.1 | 3.9 | % | – | – | – | |||||||||||||||||||||||||
|
Total
|
18,969.4 | 1,029.8 | 5.4 | % | 17,445.8 | 1,452.7 | 8.3 | % | 13,643.8 | 1,676.9 | 12.3 | % | ||||||||||||||||||||||||
|
Loans and financial
leases (2)
|
||||||||||||||||||||||||||||||||||||
|
Domestic
|
||||||||||||||||||||||||||||||||||||
|
Peso-denominated
|
47,784.5 | 5,510.5 | 11.5 | % | 40,237.3 | 4,796.3 | 11.9 | % | 36,688.6 | 5,736.8 | 15.6 | % | ||||||||||||||||||||||||
|
Foreign-denominated
|
4,198.1 | 125.9 | 3.0 | % | 2,970.2 | 81.7 | 2.7 | % | 2,684.2 | 117.4 | 4.4 | % | ||||||||||||||||||||||||
|
Total domestic
|
51,982.6 | 5,636.4 | 10.8 | % | 43,207.5 | 4,877.9 | 11.3 | % | 39,372.8 | 5,854.2 | 14.9 | % | ||||||||||||||||||||||||
|
Foreign
|
9,961.3 | 1,339.2 | 13.4 | % | 769.6 | 113.0 | 14.7 | % | – | – | – | |||||||||||||||||||||||||
|
Total
|
61,943.8 | 6,975.5 | 11.3 | % | 43,977.1 | 4,990.9 | 11.3 | % | 39,372.8 | 5,854.2 | 14.9 | % | ||||||||||||||||||||||||
|
Total interest-earnings assets
|
||||||||||||||||||||||||||||||||||||
|
Domestic
|
||||||||||||||||||||||||||||||||||||
|
Peso-denominated
|
64,575.5 | 6,504.7 | 10.1 | % | 57,398.4 | 6,193.6 | 10.8 | % | 49,173.0 | 7,411.1 | 15.1 | % | ||||||||||||||||||||||||
|
Foreign-denominated
|
6,870.0 | 231.1 | 3.4 | % | 5,614.6 | 230.0 | 4.1 | % | 5,668.2 | 268.9 | 4.7 | % | ||||||||||||||||||||||||
|
Total domestic
|
71,445.5 | 6,735.9 | 9.4 | % | 63,013.0 | 6,423.6 | 10.2 | % | 54,841.2 | 7,680.0 | 14.0 | % | ||||||||||||||||||||||||
|
Foreign
|
12,328.4 | 1,415.0 | 11.5 | % | 965.9 | 119.0 | 12.3 | % | – | – | – | |||||||||||||||||||||||||
|
Total interest-earnings assets
|
83,773.9 | 8,150.8 | 9.7 | % | 63,978.9 | 6,542.6 | 10.2 | % | 54,841.2 | 7,680.0 | 14.0 | % | ||||||||||||||||||||||||
|
Non-interest-earnings assets
|
||||||||||||||||||||||||||||||||||||
|
Cash and due from banks
|
||||||||||||||||||||||||||||||||||||
|
Domestic
|
||||||||||||||||||||||||||||||||||||
|
Peso-denominated
|
4,805.7 | – | – | 4,675.2 | – | – | 4,457.4 | – | – | |||||||||||||||||||||||||||
|
Foreign-denominated
|
488.2 | – | – | 530.2 | – | – | 476.7 | – | – | |||||||||||||||||||||||||||
|
Total domestic
|
5,293.9 | – | – | 5,205.3 | – | – | 4,934.1 | – | – | |||||||||||||||||||||||||||
|
Foreign
|
2,438.1 | – | – | 211.3 | – | – | – | – | – | |||||||||||||||||||||||||||
|
Total
|
7,732.1 | – | – | 5,416.7 | – | – | 4,934.1 | – | – | |||||||||||||||||||||||||||
|
Allowance for loan and financial lease losses
|
||||||||||||||||||||||||||||||||||||
|
Domestic
|
||||||||||||||||||||||||||||||||||||
|
Peso-denominated
|
(2,005.6 | ) | – | – | (1,953.6 | ) | – | – | (1,749.5 | ) | – | – | ||||||||||||||||||||||||
|
Foreign-denominated
|
(11.5 | ) | – | – | (10.4 | ) | – | – | (10.6 | ) | – | – | ||||||||||||||||||||||||
|
Total domestic
|
(2,017.1 | ) | – | – | (1,964.0 | ) | – | – | (1,760.2 | ) | – | – | ||||||||||||||||||||||||
|
Foreign
|
(108.7 | ) | – | – | (15.9 | ) | – | – | – | – | – | |||||||||||||||||||||||||
|
Total
|
(2,125.9 | ) | – | – | (1,979.8 | ) | – | – | (1,760.2 | ) | – | – | ||||||||||||||||||||||||
|
Past Due Loans (3)
|
||||||||||||||||||||||||||||||||||||
|
Domestic
|
||||||||||||||||||||||||||||||||||||
|
Peso-denominated
|
1,258.5 | – | – | 1,124.7 | – | – | 1,537.2 | – | – | |||||||||||||||||||||||||||
|
Foreign-denominated
|
9.8 | – | – | 10.2 | – | – | 8.5 | – | – | |||||||||||||||||||||||||||
|
Total domestic
|
1,268.3 | – | – | 1,134.9 | – | – | 1,545.7 | – | – | |||||||||||||||||||||||||||
|
Foreign
|
260.1 | – | – | 15.0 | – | – | – | – | – | |||||||||||||||||||||||||||
|
Total
|
1,528.4 | – | – | 1,149.9 | – | – | 1,545.7 | – | – | |||||||||||||||||||||||||||
|
Average balance sheet and income from interest-earning assets for years ended December 31,
|
||||||||||||||||||||||||||||||||||||
|
2011
|
2010
|
2009
|
||||||||||||||||||||||||||||||||||
|
Average balance
|
Interest income earned
|
Average yield
|
Average balance
|
Interest income earned
|
Average yield
|
Average balance
|
Interest income earned
|
Average yield
|
||||||||||||||||||||||||||||
|
(in Ps billions, except percentages)
|
||||||||||||||||||||||||||||||||||||
|
Bankers’ acceptances, spot transactions and derivatives
|
||||||||||||||||||||||||||||||||||||
|
Domestic
|
||||||||||||||||||||||||||||||||||||
|
Peso-denominated
|
828.7 | – | – | 1,505.3 | – | – | 775.8 | – | – | |||||||||||||||||||||||||||
|
Foreign-denominated
|
(415.5 | ) | – | – | (1,211.4 | ) | – | – | (679.7 | ) | – | – | ||||||||||||||||||||||||
|
Total domestic
|
413.2 | – | – | 293.9 | – | – | 96.1 | – | – | |||||||||||||||||||||||||||
|
Foreign
|
16.5 | – | – | 0.7 | – | – | – | – | – | |||||||||||||||||||||||||||
|
Total
|
429.7 | – | – | 294.6 | – | – | 96.1 | – | – | |||||||||||||||||||||||||||
|
Accounts receivable, net
|
||||||||||||||||||||||||||||||||||||
|
Domestic
|
||||||||||||||||||||||||||||||||||||
|
Peso-denominated
|
1,678.6 | – | – | 1,495.0 | – | – | 1,273.7 | – | – | |||||||||||||||||||||||||||
|
Foreign-denominated
|
78.6 | – | – | 49.8 | – | – | 51.7 | – | – | |||||||||||||||||||||||||||
|
Total domestic
|
1,757.2 | – | – | 1,544.7 | – | – | 1,325.4 | – | – | |||||||||||||||||||||||||||
|
Foreign
|
335.4 | – | – | 18.8 | – | – | – | – | – | |||||||||||||||||||||||||||
|
Total
|
2,092.6 | – | – | 1,563.6 | – | – | 1,325.4 | – | – | |||||||||||||||||||||||||||
|
Foreclosed assets, net
|
||||||||||||||||||||||||||||||||||||
|
Domestic
|
||||||||||||||||||||||||||||||||||||
|
Peso-denominated
|
61.4 | – | – | 44.1 | – | – | 49.5 | – | – | |||||||||||||||||||||||||||
|
Foreign-denominated
|
– | – | – | 0.1 | – | – | 0.2 | – | – | |||||||||||||||||||||||||||
|
Total domestic
|
61.4 | – | – | 44.2 | – | – | 49.7 | – | – | |||||||||||||||||||||||||||
|
Foreign
|
37.1 | – | – | 3.3 | – | – | – | – | – | |||||||||||||||||||||||||||
|
Total
|
98.5 | – | – | 47.5 | – | – | 49.7 | – | – | |||||||||||||||||||||||||||
|
Property, plant and equipment, net
|
||||||||||||||||||||||||||||||||||||
|
Domestic
|
||||||||||||||||||||||||||||||||||||
|
Peso-denominated
|
1,625.6 | – | – | 1,382.7 | – | – | 1,248.4 | – | – | |||||||||||||||||||||||||||
|
Foreign-denominated
|
43.2 | – | – | 26.5 | – | – | 10.2 | – | – | |||||||||||||||||||||||||||
|
Total domestic
|
1,668.9 | – | – | 1,409.2 | – | – | 1,258.6 | – | – | |||||||||||||||||||||||||||
|
Foreign
|
307.6 | – | – | 24.9 | – | – | – | – | – | |||||||||||||||||||||||||||
|
Total
|
1,976.5 | – | – | 1,434.1 | – | – | 1,258.6 | – | – | |||||||||||||||||||||||||||
|
Other assets net
|
||||||||||||||||||||||||||||||||||||
|
Domestic
|
||||||||||||||||||||||||||||||||||||
|
Peso-denominated
|
4,802.9 | – | – | 4,507.0 | – | – | 4,533.1 | – | – | |||||||||||||||||||||||||||
|
Foreign-denominated
|
35.5 | – | – | 23.9 | – | – | 40.1 | – | – | |||||||||||||||||||||||||||
|
Total domestic
|
4,838.4 | – | – | 4,530.9 | – | – | 4,573.2 | – | – | |||||||||||||||||||||||||||
|
Foreign
|
2,231.8 | – | – | 186.2 | – | – | – | – | – | |||||||||||||||||||||||||||
|
Total
|
7,070.2 | – | – | 4,717.1 | – | – | 4,573.2 | – | – | |||||||||||||||||||||||||||
|
Total non-interest-earnings assets
|
||||||||||||||||||||||||||||||||||||
|
Domestic
|
||||||||||||||||||||||||||||||||||||
|
Peso-denominated
|
13,055.7 | – | – | 12,780.3 | – | – | 12,125.5 | – | – | |||||||||||||||||||||||||||
|
Foreign-denominated
|
228.3 | – | – | (581.1 | ) | – | – | (102.9 | ) | – | – | |||||||||||||||||||||||||
|
Total domestic
|
13,284.1 | – | – | 12,199.2 | – | – | 12,022.6 | – | – | |||||||||||||||||||||||||||
|
Foreign
|
5,518.0 | – | – | 444.4 | – | – | – | – | – | |||||||||||||||||||||||||||
|
Total non-interest-earnings assets
|
18,802.1 | – | – | 12,643.6 | – | – | 12,022.6 | – | – | |||||||||||||||||||||||||||
|
Total interest and non-interest-earnings assets
|
||||||||||||||||||||||||||||||||||||
|
Domestic
|
||||||||||||||||||||||||||||||||||||
|
Peso-denominated
|
77,631.2 | 6,504.7 | 8.4 | % | 70,178.8 | 6,193.6 | 8.8 | % | 61,298.5 | 7,411.1 | 12.1 | % | ||||||||||||||||||||||||
|
Foreign-denominated
|
7,098.3 | 231.1 | 3.3 | % | 5,033.4 | 230.0 | 4.6 | % | 5,565.3 | 268.9 | 4.8 | % | ||||||||||||||||||||||||
|
Total domestic
|
84,729.6 | 6,735.9 | 7.9 | % | 75,212.2 | 6,423.6 | 8.5 | % | 66,863.8 | 7,680.0 | 11.5 | % | ||||||||||||||||||||||||
|
Foreign
|
17,846.4 | 1,415.0 | 7.9 | % | 1,410.3 | 119.0 | 8.4 | % | – | – | – | |||||||||||||||||||||||||
|
Total assets
|
102,576.0 | 8,150.8 | 7.9 | % | 76,622.5 | 6,542.6 | 8.5 | % | 66,863.8 | 7,680.0 | 11.5 | % | ||||||||||||||||||||||||
|
Average balance sheet and income from interest-bearing liabilities for years ended December 31,
|
||||||||||||||||||||||||||||||||||||
|
2011
|
2010
|
2009
|
||||||||||||||||||||||||||||||||||
|
Average balance
|
Interest expense paid
|
Average interest rate
|
Average balance
|
Interest expense paid
|
Average interest rate
|
Average balance
|
Interest expense paid
|
Average interest rate
|
||||||||||||||||||||||||||||
|
(in Ps billions, except percentages)
|
||||||||||||||||||||||||||||||||||||
|
Liabilities and shareholders’ equity
|
||||||||||||||||||||||||||||||||||||
|
Interest-bearing liabilities
|
||||||||||||||||||||||||||||||||||||
|
Checking accounts
|
||||||||||||||||||||||||||||||||||||
|
Domestic
|
||||||||||||||||||||||||||||||||||||
|
Peso-denominated
|
1,747.9 | 52.4 | 3.0 | % | 1,309.1 | 29.0 | 2.2 | % | 1,287.3 | 53.0 | 4.1 | % | ||||||||||||||||||||||||
|
Foreign-denominated
|
163.1 | 0.4 | 0.3 | % | 93.3 | 0.5 | 0.5 | % | 110.2 | 0.2 | 0.2 | % | ||||||||||||||||||||||||
|
Total domestic
|
1,911.0 | 52.8 | 2.8 | % | 1,402.4 | 29.5 | 2.1 | % | 1,397.5 | 53.2 | 3.8 | % | ||||||||||||||||||||||||
|
Foreign
|
4,223.0 | 29.6 | 0.7 | % | 353.6 | – | – | – | – | – | ||||||||||||||||||||||||||
|
Total
|
6,134.0 | 82.4 | 1.3 | % | 1,756.0 | 29.5 | 1.7 | % | 1,397.5 | 53.2 | 3.8 | % | ||||||||||||||||||||||||
|
Savings deposits
|
||||||||||||||||||||||||||||||||||||
|
Domestic
|
||||||||||||||||||||||||||||||||||||
|
Peso-denominated
|
25,105.9 | 774.9 | 3.1 | % | 22,941.9 | 634.0 | 2.8 | % | 19,727.0 | 923.1 | 4.7 | % | ||||||||||||||||||||||||
|
Foreign-denominated
|
301.1 | 1.7 | 0.6 | % | 253.8 | 1.7 | 0.7 | % | 224.5 | 2.3 | 1.0 | % | ||||||||||||||||||||||||
|
Total domestic
|
25,407.1 | 776.6 | 3.1 | % | 23,195.7 | 635.6 | 2.7 | % | 19,951.5 | 925.3 | 4.6 | % | ||||||||||||||||||||||||
|
Foreign
|
2,212.6 | 31.5 | 1.4 | % | 166.4 | 5.2 | 3.1 | % | – | – | – | |||||||||||||||||||||||||
|
Total
|
27,619.7 | 808.1 | 2.9 | % | 23,362.1 | 640.8 | 2.7 | % | 19,951.5 | 925.3 | 4.6 | % | ||||||||||||||||||||||||
|
Time deposits
|
||||||||||||||||||||||||||||||||||||
|
Domestic
|
||||||||||||||||||||||||||||||||||||
|
Peso-denominated
|
13,430.0 | 643.6 | 4.8 | % | 12,936.7 | 603.8 | 4.7 | % | 13,950.1 | 1,153.2 | 8.3 | % | ||||||||||||||||||||||||
|
Foreign-denominated
|
2,744.3 | 60.6 | 2.2 | % | 2,714.0 | 60.2 | 2.2 | % | 2,897.1 | 65.8 | 2.3 | % | ||||||||||||||||||||||||
|
Total domestic
|
16,174.4 | 704.2 | 4.4 | % | 15,650.7 | 664.0 | 4.2 | % | 16,847.2 | 1,219.0 | 7.2 | % | ||||||||||||||||||||||||
|
Foreign
|
4,079.5 | 164.9 | 4.0 | % | 319.7 | 15.1 | 4.7 | % | – | – | – | |||||||||||||||||||||||||
|
Total
|
20,253.9 | 869.1 | 4.3 | % | 15,970.4 | 679.1 | 4.3 | % | 16,847.2 | 1,219.0 | 7.2 | % | ||||||||||||||||||||||||
|
Interbank borrowings and overnight funds (4)
|
||||||||||||||||||||||||||||||||||||
|
Domestic
|
||||||||||||||||||||||||||||||||||||
|
Peso-denominated
|
3,907.1 | 134.4 | 3.4 | % | 3,781.6 | 106.6 | 2.8 | % | 2,076.3 | 107.1 | 5.2 | % | ||||||||||||||||||||||||
|
Foreign-denominated
|
254.8 | 5.5 | 2.1 | % | 132.7 | 2.3 | 1.7 | % | 301.4 | 4.5 | 1.5 | % | ||||||||||||||||||||||||
|
Total domestic
|
4,161.8 | 139.9 | 3.4 | % | 3,914.3 | 108.9 | 2.8 | % | 2,377.7 | 111.7 | 4.7 | % | ||||||||||||||||||||||||
|
Foreign
|
117.8 | 7.1 | 6.0 | % | 6.1 | 0.4 | 6.9 | % | – | – | – | |||||||||||||||||||||||||
|
Total
|
4,279.6 | 146.9 | 3.4 | % | 3,920.4 | 109.3 | 2.8 | % | 2,377.7 | 111.7 | 4.7 | % | ||||||||||||||||||||||||
|
Borrowings from banks and others (5)
|
||||||||||||||||||||||||||||||||||||
|
Domestic
|
||||||||||||||||||||||||||||||||||||
|
Peso-denominated
|
4,477.2 | 297.1 | 6.6 | % | 2,961.6 | 156.6 | 5.3 | % | 3,038.2 | 266.1 | 8.8 | % | ||||||||||||||||||||||||
|
Foreign-denominated
|
4,181.9 | 55.4 | 1.3 | % | 1,501.0 | 13.9 | 0.9 | % | 930.7 | 25.4 | 2.7 | % | ||||||||||||||||||||||||
|
Total domestic
|
8,659.2 | 352.4 | 4.1 | % | 4,462.6 | 170.5 | 3.8 | % | 3,968.9 | 291.5 | 7.3 | % | ||||||||||||||||||||||||
|
Foreign
|
2,358.2 | 83.4 | 3.5 | % | 185.5 | 6.5 | 3.5 | % | – | – | – | |||||||||||||||||||||||||
|
Total
|
11,017.4 | 435.8 | 4.0 | % | 4,648.1 | 177.0 | 3.8 | % | 3,968.9 | 291.5 | 7.3 | % | ||||||||||||||||||||||||
|
Bonds
|
||||||||||||||||||||||||||||||||||||
|
Domestic
|
||||||||||||||||||||||||||||||||||||
|
Peso-denominated
|
5,185.0 | 318.9 | 6.2 | % | 4,334.9 | 276.4 | 6.4 | % | 2,665.2 | 253.4 | 9.5 | % | ||||||||||||||||||||||||
|
Foreign-denominated
|
89.7 | 2.0 | 2.2 | % | – | – | – | – | – | – | ||||||||||||||||||||||||||
|
Total domestic
|
5,274.6 | 320.9 | 6.1 | % | 4,334.9 | 276.4 | 6.4 | % | 2,665.2 | 253.4 | 9.5 | % | ||||||||||||||||||||||||
|
Foreign
|
295.4 | 18.7 | 6.3 | % | 23.3 | 1.8 | 7.5 | % | – | – | – | |||||||||||||||||||||||||
|
Total
|
5,570.0 | 339.6 | 6.1 | % | 4,358.2 | 278.1 | 6.4 | % | 2,665.2 | 253.4 | 9.5 | % | ||||||||||||||||||||||||
|
Total interest-bearing liabilities
|
||||||||||||||||||||||||||||||||||||
|
Domestic
|
||||||||||||||||||||||||||||||||||||
|
Peso-denominated
|
53,853.2 | 2,221.2 | 4.1 | % | 48,265.8 | 1,806.3 | 3.7 | % | 42,744.2 | 2,755.9 | 6.4 | % | ||||||||||||||||||||||||
|
Foreign-denominated
|
7,734.9 | 125.6 | 1.6 | % | 4,694.8 | 78.5 | 1.7 | % | 4,463.9 | 98.1 | 2.2 | % | ||||||||||||||||||||||||
|
Total domestic
|
61,588.1 | 2,346.8 | 3.8 | % | 52,960.6 | 1,884.8 | 3.6 | % | 47,208.1 | 2,854.0 | 6.0 | % | ||||||||||||||||||||||||
|
Foreign
|
13,286.5 | 335.1 | 2.5 | % | 1,054.6 | 29.0 | 2.7 | % | – | – | – | |||||||||||||||||||||||||
|
Total
|
74,874.6 | 2,681.9 | 3.6 | % | 54,015.2 | 1,913.8 | 3.5 | % | 47,208.1 | 2,854.0 | 6.0 | % | ||||||||||||||||||||||||
|
Total non-interest-bearing liabilities and shareholders’ equity
|
27,701.4 | – | – | 22,607.3 | – | – | 19,655.8 | – | – | |||||||||||||||||||||||||||
|
Total liabilities and shareholders’ equity
|
102,576.0 | 2,681.9 | 2.6 | % | 76,622.5 | 1,913.8 | 2.5 | % | 66,863.8 | 2,854.0 | 4.3 | % | ||||||||||||||||||||||||
|
(1)
|
Includes available for sale securities, in which yields are based on historical cost balances.
|
|
(2)
|
Includes an immaterial amount of interest earned on loans rated “C,” “D” and “E.”
|
|
(3)
|
See “—Loan portfolio—Risk categories.”
|
|
(4)
|
Reflects operations involving: common short-term interbank funds, repurchase transactions (repos), simultaneous operations and transactions involving the temporary transfer of securities.
|
|
(5)
|
Reflects loans made by other financial institutions including development banks and international correspondent banks.
|
Changes in net interest income and expenses — volume and rate analysis
The following tables allocate by currency of denomination, changes in our net interest income to changes in average volume, changes in nominal rates and the net variance caused by changes in both average volume and nominal rates for the year ended December 31, 2011 compared to the year ended December 31, 2010, and the year ended December 31, 2010 compared to the year ended December 31, 2009. Volume and rate variances have been calculated based on variances in average balances over the period and changes in nominal interest rates on average interest-earning assets and average interest-bearing liabilities. Net changes attributable to changes in both volume and interest rate have been allocated to changes in volume.
|
2010 – 2011
Increase (decrease)
due to changes in
|
2009 – 2010
Increase (decrease)
due to changes in
|
|||||||||||||||||||||||
|
Volume
|
Rate
|
Net change
|
Volume
|
Rate
|
Net change
|
|||||||||||||||||||
|
(in Ps billions, except percentages)
|
||||||||||||||||||||||||
|
Interest-earnings assets
|
||||||||||||||||||||||||
|
Interbank and overnight funds
|
||||||||||||||||||||||||
|
Domestic
|
||||||||||||||||||||||||
|
Peso-denominated
|
(76.6 | ) | 103.1 | 26.5 | 54.7 | (105.5 | ) | (50.8 | ) | |||||||||||||||
|
Foreign currency-denominated
|
0.7 | (1.8 | ) | (1.1 | ) | (5.5 | ) | 4.5 | (1.0 | ) | ||||||||||||||
|
Total domestic
|
(75.9 | ) | 101.3 | 25.4 | 49.2 | (101.0 | ) | (51.7 | ) | |||||||||||||||
|
Investment securities
|
||||||||||||||||||||||||
|
Domestic
|
||||||||||||||||||||||||
|
Peso-denominated
|
19.4 | (449.0 | ) | (429.6 | ) | 304.3 | (530.5 | ) | (226.2 | ) | ||||||||||||||
|
Foreign currency-denominated
|
(2.6 | ) | (39.4 | ) | (42.0 | ) | 8.8 | (11.0 | ) | (2.2 | ) | |||||||||||||
|
Total domestic
|
16.7 | (488.4 | ) | (471.6 | ) | 313.1 | (541.5 | ) | (228.4 | ) | ||||||||||||||
|
Loans and financial leases (1)
|
||||||||||||||||||||||||
|
Domestic
|
||||||||||||||||||||||||
|
Peso-denominated
|
870.3 | (156.1 | ) | 714.2 | 423.0 | (1,363.5 | ) | (940.5 | ) | |||||||||||||||
|
Foreign currency-denominated
|
36.8 | 7.4 | 44.2 | 7.9 | (43.6 | ) | (35.8 | ) | ||||||||||||||||
|
Total domestic
|
907.2 | (148.7 | ) | 758.5 | 430.9 | (1,407.1 | ) | (976.3 | ) | |||||||||||||||
|
Total interest-earnings assets
|
||||||||||||||||||||||||
|
Domestic
|
||||||||||||||||||||||||
|
Peso-denominated
|
813.1 | (502.0 | ) | 311.1 | 782.0 | (1,999.4 | ) | (1,217.4 | ) | |||||||||||||||
|
Foreign currency-denominated
|
34.9 | (33.8 | ) | 1.1 | 11.2 | (50.1 | ) | (39.0 | ) | |||||||||||||||
|
Total domestic
|
848.0 | (535.8 | ) | 312.2 | 793.2 | (2,049.6 | ) | (1,256.4 | ) | |||||||||||||||
|
Foreign (2)
|
1,296.0 | 119.0 | ||||||||||||||||||||||
|
Total
interest-earnings assets
|
1,962.9 | (354.7 | ) | 1,608.2 | 848.0 | (1,985.4 | ) | (1,137.4 | ) | |||||||||||||||
|
(1)
|
Includes an immaterial amount of interest earned on loans rated “C,” “D” and “E.”
|
|
(2)
|
A breakdown of our foreign allocation changes in volume and rates is not presented because average balances and interest amounts were not recorded prior to December 31, 2010 for our foreign activities. Foreign activities primarily reflect BAC Credomatic data, which was acquired in December 2010.
|
|
2010 – 2011
Increase (decrease)
due to changes in
|
2009 – 2010
Increase (decrease)
due to changes in
|
|||||||||||||||||||||||
|
Volume
|
Rate
|
Net change
|
Volume
|
Rate
|
Net change
|
|||||||||||||||||||
|
(in Ps billions, except percentages)
|
||||||||||||||||||||||||
|
Interest-bearing liabilities
|
||||||||||||||||||||||||
|
Checking accounts
|
||||||||||||||||||||||||
|
Domestic
|
||||||||||||||||||||||||
|
Peso-denominated
|
13.2 | 10.2 | 23.4 | 0.5 | (24.4 | ) | (24.0 | ) | ||||||||||||||||
|
Foreign currency-denominated
|
0.2 | (0.2 | ) | – | (0.1 | ) | 0.4 | 0.3 | ||||||||||||||||
|
Total domestic
|
13.3 | 10.0 | 23.4 | 0.4 | (24.1 | ) | (23.7 | ) | ||||||||||||||||
|
Savings deposits
|
||||||||||||||||||||||||
|
Domestic
|
||||||||||||||||||||||||
|
Peso-denominated
|
66.8 | 74.1 | 140.9 | 88.8 | (377.9 | ) | (289.1 | ) | ||||||||||||||||
|
Foreign currency-denominated
|
0.3 | (0.2 | ) | – | 0.2 | (0.8 | ) | (0.6 | ) | |||||||||||||||
|
Total domestic
|
67.1 | 73.9 | 140.9 | 89.0 | (378.7 | ) | (289.7 | ) | ||||||||||||||||
|
Time deposits
|
||||||||||||||||||||||||
|
Domestic
|
||||||||||||||||||||||||
|
Peso-denominated
|
23.6 | 16.2 | 39.8 | (47.3 | ) | (502.1 | ) | (549.4 | ) | |||||||||||||||
|
Foreign currency-denominated
|
0.7 | (0.2 | ) | 0.4 | (4.1 | ) | (1.5 | ) | (5.6 | ) | ||||||||||||||
|
Total domestic
|
24.3 | 15.9 | 40.3 | (51.4 | ) | (503.6 | ) | (555.0 | ) | |||||||||||||||
|
Interbank borrowings and overnight funds
|
||||||||||||||||||||||||
|
Domestic
|
||||||||||||||||||||||||
|
Peso-denominated
|
4.3 | 23.5 | 27.8 | 48.1 | (48.6 | ) | (0.6 | ) | ||||||||||||||||
|
Foreign currency-denominated
|
2.6 | 0.6 | 3.2 | (2.9 | ) | 0.7 | (2.2 | ) | ||||||||||||||||
|
Total domestic
|
6.9 | 24.0 | 31.0 | 45.2 | (47.9 | ) | (2.8 | ) | ||||||||||||||||
|
Borrowings from banks and others
|
||||||||||||||||||||||||
|
Domestic
|
||||||||||||||||||||||||
|
Peso-denominated
|
100.6 | 39.9 | 140.5 | (4.1 | ) | (105.5 | ) | (109.5 | ) | |||||||||||||||
|
Foreign currency-denominated
|
35.5 | 6.0 | 41.5 | 5.3 | (16.8 | ) | (11.5 | ) | ||||||||||||||||
|
Total domestic
|
136.0 | 45.9 | 181.9 | 1.2 | (122.2 | ) | (121.0 | ) | ||||||||||||||||
|
Long-term debt (bonds)
|
||||||||||||||||||||||||
|
Domestic
|
||||||||||||||||||||||||
|
Peso-denominated
|
52.3 | (9.8 | ) | 42.5 | 106.4 | (83.5 | ) | 23.0 | ||||||||||||||||
|
Foreign currency-denominated
|
2.0 | – | 2.0 | – | – | – | ||||||||||||||||||
|
Total domestic
|
54.3 | (9.8 | ) | 44.5 | 106.4 | (83.5 | ) | 23.0 | ||||||||||||||||
|
Total interest-bearing liabilities
|
||||||||||||||||||||||||
|
Domestic
|
||||||||||||||||||||||||
|
Peso-denominated
|
260.7 | 154.1 | 414.9 | 192.5 | (1,142.1 | ) | (949.6 | ) | ||||||||||||||||
|
Foreign currency-denominated
|
41.2 | 5.8 | 47.1 | (1.6 | ) | (18.0 | ) | (19.6 | ) | |||||||||||||||
|
Total domestic
|
302.0 | 160.0 | 462.0 | 190.9 | (1,160.1 | ) | (969.2 | ) | ||||||||||||||||
|
Foreign (1)
|
306.1 | 29.0 | ||||||||||||||||||||||
|
Total interest-bearing liabilities
|
570.9 | 197.2 | 768.1 | 207.1 | (1,147.4 | ) | (940.2 | ) | ||||||||||||||||
|
(1)
|
A breakdown of our foreign allocation changes in volume and rates is not presented because average balances and interest amounts were not recorded prior to December 31, 2010 for our foreign activities. Foreign activities primarily reflect BAC Credomatic data, which was acquired in December 2010.
|
Interest-earning assets — net interest margin and spread
The following table presents average balances of interest-earning assets as well as our yields on our average interest-earning assets, net interest earned, net interest margin and interest spread for the years ended December 31, 2011, 2010 and 2009.
|
For the year ended December 31,
|
||||||||||||
|
2011
|
2010
|
2009
|
||||||||||
|
(in Ps billions, except percentages)
|
||||||||||||
|
Interbank and overnight funds
|
||||||||||||
|
Domestic
|
||||||||||||
|
Peso-denominated
|
1,081.9 | 1,798.1 | 695.0 | |||||||||
|
Foreign currency-denominated
|
745.0 | 665.8 | 1,129.6 | |||||||||
|
Total Domestic
|
1,827.0 | 2,464.0 | 1,824.6 | |||||||||
|
Foreign
|
1,033.8 | 92.0 | – | |||||||||
|
Total
|
2,860.8 | 2,556.0 | 1,824.6 | |||||||||
|
Investment securities
|
||||||||||||
|
Domestic
|
||||||||||||
|
Peso-denominated
|
15,709.1 | 15,363.0 | 11,789.4 | |||||||||
|
Foreign currency-denominated
|
1,926.9 | 1,978.5 | 1,854.4 | |||||||||
|
Total Domestic
|
17,636.0 | 17,341.5 | 13,643.8 | |||||||||
|
Foreign
|
1,333.4 | 104.3 | – | |||||||||
|
Total
|
18,969.4 | 17,445.8 | 13,643.8 | |||||||||
|
Loans and financial leases (1)
|
||||||||||||
|
Domestic
|
||||||||||||
|
Peso-denominated
|
47,784.5 | 40,237.3 | 36,688.6 | |||||||||
|
Foreign currency-denominated
|
4,198.1 | 2,970.2 | 2,684.2 | |||||||||
|
Total Domestic
|
51,982.6 | 43,207.5 | 39,372.8 | |||||||||
|
Foreign
|
9,961.3 | 769.6 | – | |||||||||
|
Total
|
61,943.8 | 43,977.1 | 39,372.8 | |||||||||
|
Other interest-earning assets
|
||||||||||||
|
Domestic
|
||||||||||||
|
Peso-denominated
|
– | – | – | |||||||||
|
Foreign currency-denominated
|
– | – | – | |||||||||
|
Total Domestic
|
– | – | – | |||||||||
|
Foreign
|
– | – | – | |||||||||
|
Total
|
– | – | – | |||||||||
|
Total average interest-earning assets
|
||||||||||||
|
Domestic
|
||||||||||||
|
Peso-denominated
|
64,575.5 | 57,398.4 | 49,173.0 | |||||||||
|
Foreign currency-denominated
|
6,870.0 | 5,614.6 | 5,668.2 | |||||||||
|
Total Domestic
|
71,445.5 | 63,013.0 | 54,841.2 | |||||||||
|
Foreign
|
12,328.4 | 965.9 | – | |||||||||
|
Total
|
83,773.9 | 63,978.9 | 54,841.2 | |||||||||
|
Net interest earned (2)
|
||||||||||||
|
Domestic
|
||||||||||||
|
Peso-denominated
|
4,283.5 | 4,387.3 | 4,655.2 | |||||||||
|
Foreign currency-denominated
|
105.5 | 151.5 | 170.8 | |||||||||
|
Total Domestic
|
4,389.1 | 4,538.8 | 4,826.0 | |||||||||
|
Foreign
|
1,079.8 | 90.0 | – | |||||||||
|
Total
|
5,468.9 | 4,628.8 | 4,826.0 | |||||||||
|
Average yield on interest-earning assets
|
||||||||||||
|
Domestic
|
||||||||||||
|
Peso-denominated
|
10.1 | % | 10.8 | % | 15.1 | % | ||||||
|
Foreign currency-denominated
|
3.4 | % | 4.1 | % | 4.7 | % | ||||||
|
Total Domestic
|
9.4 | % | 10.2 | % | 14.0 | % | ||||||
|
Foreign
|
11.5 | % | 12.3 | % | – | |||||||
|
Total
|
9.7 | % | 10.2 | % | 14.0 | % | ||||||
|
Net interest margin (3)
|
||||||||||||
|
Domestic
|
||||||||||||
|
Peso-denominated
|
6.6 | % | 7.6 | % | 9.5 | % | ||||||
|
Foreign currency-denominated
|
1.5 | % | 2.7 | % | 3.0 | % | ||||||
|
Total Domestic
|
6.1 | % | 7.2 | % | 8.8 | % | ||||||
|
Foreign
|
8.8 | % | 9.3 | % | – | |||||||
|
Total
|
6.5 | % | 7.2 | % | 8.8 | % | ||||||
|
For the year ended December 31,
|
||||||||||||
|
2011
|
2010
|
2009
|
||||||||||
|
(in Ps billions, except percentages)
|
||||||||||||
|
Interest spread on loans and financial leases (4)
|
||||||||||||
|
Domestic
|
||||||||||||
|
Peso-denominated
|
7.4 | % | 8.2 | % | 9.2 | % | ||||||
|
Foreign currency-denominated
|
1.4 | % | 1.1 | % | 2.2 | % | ||||||
|
Total Domestic
|
7.0 | % | 7.7 | % | 8.8 | % | ||||||
|
Foreign
|
10.9 | % | 11.9 | % | – | |||||||
|
Total
|
7.7 | % | 7.8 | % | 8.8 | % | ||||||
|
Interest spread on total interest-earning assets (5)
|
||||||||||||
|
Domestic
|
||||||||||||
|
Peso-denominated
|
5.9 | % | 7.0 | % | 8.6 | % | ||||||
|
Foreign currency-denominated
|
1.7 | % | 2.4 | % | 2.5 | % | ||||||
|
Total Domestic
|
5.6 | % | 6.6 | % | 8.0 | % | ||||||
|
Foreign
|
9.0 | % | 9.6 | % | – | |||||||
|
Total
|
6.1 | % | 6.7 | % | 8.0 | % | ||||||
|
(1)
|
Includes an immaterial amount of interest earned on loans rated “C,” “D” and “E.”
|
|
(2)
|
Net interest earned is calculated as interest income less interest paid and includes accrued interest, valuation adjustments and gains (losses) realized on debt and equity securities that are accounted for as “available for sale,” gains (losses) on repurchase transactions (repos), gains (losses) realized on the sale of debt securities, and mark-to-market gains (losses) on trading securities portfolio.
|
|
(3)
|
Net interest margin is calculated as net interest income divided by total average interest-earning assets.
|
|
(4)
|
Interest spread on loans and financial leases is calculated as the difference between the average yield on interest-earning loans and financial leases and the average rate paid on interest-bearing liabilities.
|
|
(5)
|
Interest spread on total interest-earning assets is calculated as the difference between the average yield on interest-earning assets and the average rate paid on interest-bearing liabilities.
|
Investment portfolio
We acquire and hold fixed income debt and equity securities for liquidity and other strategic purposes, or when required by law. In recent years, credit institutions, including our banking subsidiaries, have been required to hold certain debt securities issued by the Colombian Government or Government-related entities. Central Bank regulations require credit institutions to make investments in agricultural development bonds (
Títulos de Desarrollo Agropecuario
), or “TDAs,” issued by the Agricultural Sector Financing Fund (
Fondo para el Financiamiento del Sector Agropecuario
), or “Finagro.” Finagro is a development bank affiliated with the Ministry of Agriculture and finances the production and marketing activities of the agricultural and livestock sector. These securities yield below-market interest rates. The amount of these mandatory investments, which our subsidiaries are still required to hold, is calculated as a percentage of short-term deposits. Another mandatory investment, still on our portfolio but no longer subject to new issuances, is in debt reduction bonds (
Títulos de Reducción de Deuda
), or “TRDs,” issued by the Colombian Government. Under government discretion, authorities may extend the scope of current regulations or require additional disbursements on current or new types of mandatory investments. See “––Supervision and regulation—Mandatory investments.”
The Superintendency of Finance requires investments to be classified as “trading,” “available for sale” or “held to maturity.” Trading investments are investments acquired primarily to obtain profits from fluctuations in short-term prices and are recorded at market value. The difference between current and previous market value is added to, or subtracted from, the value of the investment and credited or charged to earnings. “Available for sale” investments are those investments that we intend, and are able, to hold for at least one year and are recorded on the balance sheet at market value with changes to the values of these securities recorded in a separate equity account called “unrealized gains and losses”; when a portion of the gains or losses is realized, such amount is transferred to the statement of income. “Held to maturity” investments are investments acquired and that we intend, and are able, to hold until maturity, and are valued at amortized cost.
In accordance with Chapter 1 of Circular 100 of 1995 issued by the Superintendency of Finance, investments in debt securities are fully reviewed for impairment in June and December and partially reviewed every three months, by considering the related solvency, market, currency exchange rate and country risks. Investments in securities with
certain ratings by external rating agencies recognized by the Superintendency of Finance cannot be recorded on our balance sheet for an amount higher than specified percentages of the face value, net of amortizations recorded at the valuation date.
|
Long-term classification
|
Maximum face value (%)
|
|
|
BB+, BB, BB-
|
90
|
|
|
B+, B, B-
|
70
|
|
|
CCC
|
50
|
|
|
DD, EE
|
–
|
|
Short-term classification
|
Maximum face value (%)
|
|
|
3
|
90
|
|
|
4
|
50
|
|
|
5 and 6
|
–
|
Internal or external debt securities issued or guaranteed by the Republic of Colombia, as well as those issued by the Colombian Central Bank and those issued or guaranteed by FOGAFIN, are not subject to this adjustment.
The following table presents the book value of our investments, net of allowance for investment securities losses, at the dates indicated.
|
At December 31,
|
||||||||||||
|
2011
|
2010
|
2009
|
||||||||||
|
(in Ps billions)
|
||||||||||||
|
Debt securities
|
||||||||||||
|
Peso-denominated
|
||||||||||||
|
Securities issued or secured by the Colombian central government (1)
|
9,778.8 | 10,829.8 | 9,542.2 | |||||||||
|
Securities issued or secured by the Colombian Central Bank
|
– | – | – | |||||||||
|
Securities issued or secured by other Colombian government entities
|
2,484.2 | 2,222.8 | 1,937.2 | |||||||||
|
Securities issued or secured by other financial entities (2)
|
644.1 | 365.2 | 374.1 | |||||||||
|
Other securities (3)
|
484.4 | 778.4 | 604.6 | |||||||||
|
Total peso-denominated
|
13,391.6 | 14,196.1 | 12,458.1 | |||||||||
|
Foreign currency-denominated
|
||||||||||||
|
Securities issued or secured by the Colombian central government (1)
|
664.2 | 798.2 | 1,069.1 | |||||||||
|
Securities issued or secured by other Colombian government entities
|
150.3 | 308.0 | 354.9 | |||||||||
|
Securities issued or secured by other financial entities (2)
|
951.4 | 695.6 | 132.2 | |||||||||
|
Securities issued by foreign governments
|
974.2 | 892.3 | 204.5 | |||||||||
|
Other securities (3)
|
184.2 | 329.7 | 473.0 | |||||||||
|
Total foreign currency-denominated
|
2,924.2 | 3,023.7 | 2,233.6 | |||||||||
|
Total debt securities, net
|
16,315.8 | 17,219.8 | 14,691.7 | |||||||||
|
Equity securities, net
|
2,659.4 | 1,955.1 | 1,895.6 | |||||||||
|
Total investment securities, net
|
18,975.2 | 19,174.9 | 16,587.3 | |||||||||
|
(1)
|
Includes Colombian central government-issued treasuries (
Títulos de Tesorería
), or “TESs.”
|
|
(2)
|
Reflects investments made in debt securities issued by private financial entities.
|
|
(3)
|
Reflects investments made in debt securities issued by multilateral institutions and non-financial companies.
|
At December 31, 2011, 2010 and 2009, we held securities issued by foreign governments and in the principal amounts, as follows.
|
At
December 31,
|
Issuer
|
Investment amount – book value
|
Investment amount – book value
|
|||||||
|
(in Ps billions)
|
(in U.S.$ thousands)
|
|||||||||
|
2011
|
||||||||||
|
Brazil
|
17.5 | 9,022 | ||||||||
|
Costa Rica
|
338.0 | 174,001 | ||||||||
|
Mexico
|
23.6 | 12,164 | ||||||||
|
Panama
|
71.5 | 36,802 | ||||||||
|
United States of America
|
16.1 | 8,286 | ||||||||
|
El Salvador
|
23.2 | 11,921 | ||||||||
|
Chile
|
3.1 | 1,614 | ||||||||
|
Guatemala
|
150.3 | 77,373 | ||||||||
|
Nicaragua
|
31.9 | 16,406 | ||||||||
|
Honduras
|
276.2 | 142,148 | ||||||||
|
Total 2011
|
951.4 | 489,738 | ||||||||
|
2010
|
||||||||||
|
Brazil
|
23.9 | 12,500 | ||||||||
|
Costa Rica
|
255.4 | 133,460 | ||||||||
|
Mexico
|
14.1 | 7,369 | ||||||||
|
Panama
|
155.2 | 81,076 | ||||||||
|
United States of America
|
266.8 | 139,405 | ||||||||
|
El Salvador
|
28.2 | 14,742 | ||||||||
|
Chile
|
3.2 | 1,665 | ||||||||
|
Guatemala
|
121.7 | 63,563 | ||||||||
|
Nicaragua
|
2.0 | 1,041 | ||||||||
|
Honduras
|
21.8 | 11,364 | ||||||||
|
Total 2010
|
892.3 | 466,184 | ||||||||
|
2009
|
||||||||||
|
Brazil
|
28.6 | 14,013 | ||||||||
|
Costa Rica
|
5.5 | 2,714 | ||||||||
|
Mexico
|
14.3 | 7,007 | ||||||||
|
Panama
|
137.1 | 67,050 | ||||||||
|
United States of America
|
18.9 | 9,258 | ||||||||
|
Total 2009
|
204.5 | 100,043 | ||||||||
Investment securities portfolio maturity
The following table summarizes the maturities and weighted average nominal yields of our debt investment securities at December 31, 2011.
|
At December 31, 2011
|
||||||||||||||||||||||||||||||||||||||||
|
Maturity less than
1 year
|
Maturity between 1 and 5 years
|
Maturity between 5 and 10 years
|
Maturity more than 10 years
|
Total
|
||||||||||||||||||||||||||||||||||||
|
Balance (1)
|
Yield % (2)
|
Balance (1)
|
Yield % (2)
|
Balance (1)
|
Yield % (2)
|
Balance (1)
|
Yield % (2)
|
Balance (1)
|
Yield % (2)
|
|||||||||||||||||||||||||||||||
|
(in Ps billions, except yields)
|
||||||||||||||||||||||||||||||||||||||||
|
Debt securities
|
||||||||||||||||||||||||||||||||||||||||
|
Peso-denominated
|
||||||||||||||||||||||||||||||||||||||||
|
Securities issued or secured by the Colombian central government
|
968.8 | 4.3 | % | 6,278.6 | 6.1 | % | 2,127.9 | 7.5 | % | 403.6 | 7.7 | % | 9,778.8 | 6.3 | % | |||||||||||||||||||||||||
|
Securities issued or secured by the Colombian Central Bank
|
– | – | – | – | – | – | – | – | – | – | ||||||||||||||||||||||||||||||
|
Securities issued or secured by Colombian government entities
|
2,164.6 | 3.9 | % | 185.1 | 5.1 | % | 134.6 | 7.6 | % | – | – | 2,484.2 | 4.2 | % | ||||||||||||||||||||||||||
|
Securities issued or secured by other financial entities
|
140.5 | 5.9 | % | 370.7 | 6.7 | % | 125.7 | 6.5 | % | 7.2 | 8.5 | % | 644.1 | 6.5 | % | |||||||||||||||||||||||||
|
Other securities
|
14.0 | 5.6 | % | 40.6 | 6.9 | % | 387.6 | 6.5 | % | 42.3 | 12.1 | % | 484.4 | 7.0 | % | |||||||||||||||||||||||||
|
Total peso-denominated
|
3,287.8 | 4.1 | % | 6,875.0 | 6.1 | % | 2,775.7 | 7.3 | % | 453.1 | 8.1 | % | 13,391.6 | 5.9 | % | |||||||||||||||||||||||||
|
Foreign currency-denominated
|
||||||||||||||||||||||||||||||||||||||||
|
Securities issued or secured by the Colombian central government
|
79.7 | -3.4 | % | 510.6 | 1.8 | % | 73.9 | 2.8 | % | – | – | 664.2 | 1.3 | % | ||||||||||||||||||||||||||
|
Securities issued or secured by Colombian government entities
|
– | – | – | – | 150.3 | 7.1 | % | – | – | 150.3 | 7.1 | % | ||||||||||||||||||||||||||||
|
Securities issued or secured by other financial entities
|
248.4 | 2.5 | % | 513.4 | 3.6 | % | 212.3 | 4.8 | % | – | – | 974.2 | 3.6 | % | ||||||||||||||||||||||||||
|
Securities issued by foreign governments
|
463.2 | 4.3 | % | 448.4 | 5.8 | % | 30.1 | 6.0 | % | 9.8 | 5.3 | % | 951.4 | 5.1 | % | |||||||||||||||||||||||||
|
Other securities
|
5.7 | 3.4 | % | 104.5 | 4.1 | % | 65.0 | 7.2 | % | 9.0 | 7.3 | % | 184.2 | 5.3 | % | |||||||||||||||||||||||||
|
Total foreign currency-denominated
|
797.0 | 3.0 | % | 1,576.8 | 3.7 | % | 531.5 | 5.5 | % | 18.8 | 6.3 | % | 2,924.2 | 3.8 | % | |||||||||||||||||||||||||
|
Total debt securities, net
|
4,084.8 | – | 8,451.8 | – | 3,307.2 | – | 471.9 | – | 16,315.8 | – | ||||||||||||||||||||||||||||||
|
Equity securities, net
|
– | – | – | – | – | – | – | – | 2,659.4 | – | ||||||||||||||||||||||||||||||
|
Total investment securities, net
|
– | – | – | – | – | – | – | – | 18,975.2 | – | ||||||||||||||||||||||||||||||
|
(1)
|
Amounts for debt securities are net of allowances for decline in value, which amounted to Ps 4.0 billion at December 31, 2011. Amounts for equity securities are net of allowances, which amounted to Ps 4.7 billion at December 31, 2011.
|
|
(2)
|
Yield was calculated using the internal rate of return, or “IRR,” at December 31, 2011.
|
At December 31, 2011, we had the following investments in securities of issuers that exceeded 10% of our shareholders’ equity.
|
December 31, 2011
|
|||||||||
|
Issuer
|
Book value
|
Market value
|
|||||||
|
(in Ps billions)
|
|||||||||
|
Securities issued or secured by the Colombian central government
|
Ministry of Finance
|
10,539.7 | 10,489.5 | ||||||
|
Securities issued or secured by Colombian government entities
|
Finagro
|
2,011.2 | 1,979.4 | ||||||
|
Securities issued by other financial entities
|
Titularizadora Colombiana S.A. (1)
|
402.5 | 404.8 | ||||||
|
Total
|
12,953.4 | 12,873.7 | |||||||
|
(1)
|
Titularizadora Colombiana S.A. is a corporation owned by the International Finance Corporation, or “IFC,” an affiliate of the World Bank, and certain mortgage-lending Colombian banks; it carries out mortgage securitizations.
|
Loan portfolio
The following table presents our loan portfolio classified into commercial, consumer, microcredit, financial leases and mortgage loans.
|
At December 31,
|
||||||||||||||||||||
|
2011
|
2010
|
2009
|
2008
|
2007
|
||||||||||||||||
|
(in Ps billions)
|
||||||||||||||||||||
|
Domestic
|
||||||||||||||||||||
|
Commercial
|
||||||||||||||||||||
|
General purpose loans (1)
|
25,969.1 | 22,503.6 | 15,050.8 | 13,916.2 | 12,365.3 | |||||||||||||||
|
Loans funded by development banks
|
1,871.4 | 1,634.2 | 1,565.7 | 1,535.2 | 1,310.4 | |||||||||||||||
|
Working capital loans
|
8,562.4 | 6,611.1 | 9,232.7 | 9,741.7 | 7,131.9 | |||||||||||||||
|
Credit cards
|
183.5 | 161.4 | 163.4 | 155.8 | 128.5 | |||||||||||||||
|
Overdrafts
|
185.3 | 115.3 | 126.8 | 177.2 | 180.9 | |||||||||||||||
|
Total commercial
|
36,771.7 | 31,025.5 | 26,139.3 | 25,526.1 | 21,117.0 | |||||||||||||||
|
Consumer
|
||||||||||||||||||||
|
Credit cards
|
1,735.3 | 1,462.1 | 1,338.7 | 1,345.2 | 1,184.7 | |||||||||||||||
|
Personal loans
|
11,822.2 | 9,697.2 | 8,438.2 | 7,343.8 | 6,118.5 | |||||||||||||||
|
Automobile and vehicle loans
|
1,706.8 | 1,493.3 | 1,425.0 | 1,482.3 | 1,350.6 | |||||||||||||||
|
Overdrafts
|
53.2 | 47.7 | 51.5 | 67.6 | 72.4 | |||||||||||||||
|
Loans funded by development banks
|
0.2 | – | 0.4 | 0.1 | – | |||||||||||||||
|
General purpose loans
|
160.0 | 151.2 | 142.0 | 131.4 | 123.7 | |||||||||||||||
|
Working capital loans
|
– | – | – | – | – | |||||||||||||||
|
Total consumer
|
15,477.7 | 12,851.5 | 11,395.8 | 10,370.2 | 8,849.8 | |||||||||||||||
|
Microcredit
|
284.2 | 250.1 | 286.0 | 274.6 | 152.4 | |||||||||||||||
|
Mortgages
|
834.6 | 755.3 | 865.4 | 869.0 | 974.7 | |||||||||||||||
|
Financial leases
|
4,917.8 | 3,541.3 | 3,210.1 | 3,104.0 | 2,807.7 | |||||||||||||||
|
Total domestic
|
58,285.9 | 48,423.8 | 41,896.7 | 40,144.0 | 33,901.6 | |||||||||||||||
|
Foreign
|
||||||||||||||||||||
|
Commercial
|
||||||||||||||||||||
|
General purpose loans (1)
|
2,168.9 | 1,945.3 | – | – | – | |||||||||||||||
|
Loans funded by development banks
|
– | – | – | – | – | |||||||||||||||
|
Working capital loans
|
1,549.4 | 1,133.9 | – | – | – | |||||||||||||||
|
Credit cards
|
– | – | – | – | – | |||||||||||||||
|
Overdrafts
|
55.5 | 53.3 | – | – | – | |||||||||||||||
|
Total commercial
|
3,773.8 | 3,132.6 | – | – | – | |||||||||||||||
|
At December 31,
|
||||||||||||||||||||
|
2011
|
2010
|
2009
|
2008
|
2007
|
||||||||||||||||
|
(in Ps billions)
|
||||||||||||||||||||
|
Consumer
|
||||||||||||||||||||
|
Credit cards
|
2,714.5 | 2,466.3 | – | – | – | |||||||||||||||
|
Personal loans
|
675.0 | 545.8 | – | – | – | |||||||||||||||
|
Automobile and vehicle loans
|
856.9 | 726.7 | – | – | – | |||||||||||||||
|
Overdrafts
|
11.7 | – | – | – | – | |||||||||||||||
|
Loans funded by development banks
|
– | – | – | – | – | |||||||||||||||
|
General purpose loans
|
– | – | – | – | – | |||||||||||||||
|
Working capital loans
|
– | 35.0 | – | – | – | |||||||||||||||
|
Total consumer
|
4,258.2 | 3,773.7 | – | – | – | |||||||||||||||
|
Microcredit
|
– | – | – | – | – | |||||||||||||||
|
Mortgages
|
3,383.8 | 3,089.0 | – | – | – | |||||||||||||||
|
Financial leases
|
246.0 | 204.6 | – | – | – | |||||||||||||||
|
Total foreign
|
11,661.8 | 10,199.9 | – | – | – | |||||||||||||||
|
Total portfolio
|
69,947.7 | 58,623.6 | 41,896.7 | 40,144.0 | 33,901.6 | |||||||||||||||
|
Allowance for loan portfolio
|
(2,306.5 | ) | (2,183.9 | ) | (1,881.1 | ) | (1,625.8 | ) | (1,278.2 | ) | ||||||||||
|
Total portfolio, net
|
67,641.2 | 56,439.7 | 40,015.6 | 38,518.3 | 32,623.4 | |||||||||||||||
|
(1)
|
General purpose commercial loans primarily include short-term loans (
créditos de tesorería
), trade finance loans, project finance loans and loans for capital expenditures.
|
We classify our loan portfolio into the following categories:
|
|
·
|
Commercial loans
: Commercial loans are granted to companies or individuals to carry out economic activities.
|
|
|
·
|
Consumer loans
: Consumer loans are granted to individuals for the purchase of consumer goods or to pay for non-commercial or non-business services.
|
|
|
·
|
Microcredit loans
: Microcredit loans are issued for the purpose of encouraging the activities of small businesses and are subject to the following requirements: the maximum amount to be lent is equal to 25 times the minimum wage (
salario mínimo mensual legal vigente),
or “SMMLV,” without the balance of one single borrower exceeding such amount at any time, and the main source of payment for the corresponding obligation shall be the revenues obtained from the activities of the borrower’s micro business. The borrower’s outstanding indebtedness may not exceed 120 times the SMMLV.
|
|
|
·
|
Mortgages
: Mortgages are loans granted to individuals for the purchase of new or used housing or to build a home, all in accordance with Law 546 of 1999. These loans include loans that are denominated in UVR or local currency, that are guaranteed by a senior mortgage on the property and that are financed with a total repayment term of five to 30 years.
|
|
|
·
|
Financial leases
: Financial leases are transactions involving the transfer under a lease agreement of property where financing is provided in exchange for rental payments that are paid over a period of time; the lessee has an option to purchase the property at the end of such period.
|
Maturity and interest rate sensitivity of loans and financial leases
The following table presents the maturities of our loan portfolio at December 31, 2011.
|
At December 31, 2011
|
||||||||||||||||
|
Due in one year or less
|
Due from one to five years
|
Due after five years
|
Total
|
|||||||||||||
|
(in Ps billions)
|
||||||||||||||||
|
Domestic currency-denominated
|
||||||||||||||||
|
Commercial
|
||||||||||||||||
|
General purpose loans
|
12,742.2 | 12,094.9 | 1,102.4 | 25,939.5 | ||||||||||||
|
Loans funded by development banks
|
553.7 | 971.0 | 346.7 | 1,871.4 | ||||||||||||
|
Working capital loans
|
7,805.4 | 686.6 | 32.3 | 8,524.2 | ||||||||||||
|
Credit cards
|
130.7 | 52.9 | – | 183.6 | ||||||||||||
|
Overdrafts
|
187.6 | (2.4 | ) | – | 185.3 | |||||||||||
|
Total commercial
|
21,419.6 | 13,803.0 | 1,481.4 | 36,704.0 | ||||||||||||
|
Consumer
|
||||||||||||||||
|
Credit cards
|
1,319.0 | 416.4 | – | 1,735.3 | ||||||||||||
|
Personal loans
|
3,662.2 | 7,558.9 | 601.1 | 11,822.2 | ||||||||||||
|
Automobile and vehicle loans
|
542.9 | 1,135.8 | 28.1 | 1,706.8 | ||||||||||||
|
Overdrafts
|
53.2 | – | – | 53.2 | ||||||||||||
|
Loans funded by development banks
|
– | 0.1 | – | 0.2 | ||||||||||||
|
General purpose loans
|
74.4 | 85.6 | – | 160.0 | ||||||||||||
|
Working capital loans
|
– | – | – | – | ||||||||||||
|
Total consumer
|
5,651.7 | 9,196.7 | 629.2 | 15,477.7 | ||||||||||||
|
Microcredit
|
117.5 | 166.7 | – | 284.2 | ||||||||||||
|
Mortgages
|
102.4 | 320.2 | 412.0 | 834.6 | ||||||||||||
|
Financial leases
|
1,441.6 | 2,815.1 | 661.0 | 4,917.8 | ||||||||||||
|
Total domestic portfolio
|
28,732.8 | 26,301.7 | 3,183.7 | 58,218.2 | ||||||||||||
|
Foreign currency-denominated
|
||||||||||||||||
|
Commercial
|
||||||||||||||||
|
General purpose loans
|
464.4 | 985.9 | 748.2 | 2,198.5 | ||||||||||||
|
Loans funded by development banks
|
– | – | – | – | ||||||||||||
|
Working capital loans
|
1,385.0 | 198.1 | 4.5 | 1,587.6 | ||||||||||||
|
Credit cards
|
– | – | – | – | ||||||||||||
|
Overdrafts
|
55.5 | – | – | 55.5 | ||||||||||||
|
Total commercial
|
1,904.9 | 1,184.0 | 752.7 | 3,841.6 | ||||||||||||
|
Consumer
|
||||||||||||||||
|
Credit cards
|
2,601.0 | 110.5 | 2.9 | 2,714.5 | ||||||||||||
|
Personal loans
|
48.4 | 175.3 | 451.3 | 675.0 | ||||||||||||
|
Automobile and vehicle loans
|
27.1 | 608.7 | 221.1 | 856.9 | ||||||||||||
|
Overdrafts
|
11.7 | – | – | 11.8 | ||||||||||||
|
Loans funded by development banks
|
– | – | – | – | ||||||||||||
|
General purpose loans
|
– | – | – | – | ||||||||||||
|
Working capital loans
|
– | – | – | – | ||||||||||||
|
Total consumer
|
2,688.3 | 894.6 | 675.3 | 4,258.2 | ||||||||||||
|
Microcredit
|
– | – | – | – | ||||||||||||
|
Mortgages
|
3.1 | 116.2 | 3,264.6 | 3,383.8 | ||||||||||||
|
Financial leases
|
21.0 | 222.8 | 2.1 | 246.0 | ||||||||||||
|
Total foreign portfolio
|
4,617.3 | 2,417.6 | 4,694.7 | 11,729.6 | ||||||||||||
|
Total loan portfolio
|
33,350.1 | 28,719.3 | 7,878.4 | 69,947.7 | ||||||||||||
The following table presents the interest rate sensitivity of our loan portfolio due after one year and within one year or less at December 31, 2011.
|
At December 31, 2011
|
||||
|
(in Ps billions)
|
||||
|
Loans with terms of one year or less
|
||||
|
Variable rate
|
||||
|
Domestic
|
||||
|
Domestic-denominated
|
21,615.7 | |||
|
Foreign-denominated
|
47.3 | |||
|
Total domestic
|
21,663.0 | |||
|
Foreign
|
1,567.7 | |||
|
Total
|
23,230.7 | |||
|
Fixed rate
|
||||
|
Domestic
|
||||
|
Domestic-denominated
|
7,117.1 | |||
|
Foreign-denominated
|
10.5 | |||
|
Total domestic
|
7,127.5 | |||
|
Foreign
|
2,991.8 | |||
|
Total
|
10,119.3 | |||
|
Total loans with terms of one year or less
|
33,350.0 | |||
|
Loans with terms of more than one year
|
||||
|
Variable rate
|
||||
|
Domestic-denominated
|
18,814.8 | |||
|
Foreign-denominated
|
10.0 | |||
|
Total domestic
|
18,824.8 | |||
|
Foreign
|
3,709.6 | |||
|
Total
|
22,534.5 | |||
|
Fixed rate
|
||||
|
Domestic-denominated
|
10,670.6 | |||
|
Foreign-denominated
|
- | |||
|
Total domestic
|
10,670.6 | |||
|
Foreign
|
3,392.7 | |||
|
Total
|
14,063.3 | |||
|
Total loans with terms of more than one year
|
36,597.7 | |||
|
Total loan portfolio
|
69,947.7 | |||
Loan portfolio by economic activity
The following table summarizes our loan portfolio, at the dates indicated, by the principal activity of the borrower using the International Standard Industrial Classification of All Economic Activities. Where we have not assigned a code to a borrower, classification of the relevant loan has been made based on the purpose of the loan as described by the borrower.
|
At December 31,
|
||||||||||||||||||||||||||||||||||||||||
|
2011
|
%
|
2010
|
%
|
2009
|
%
|
2008
|
%
|
2007
|
%
|
|||||||||||||||||||||||||||||||
|
(in Ps billions, except when in percentages)
|
||||||||||||||||||||||||||||||||||||||||
|
Agricultural
|
1,835.2 | 2.6 | 1,286.2 | 2.2 | 939.0 | 2.2 | 993.3 | 2.5 | 900.9 | 2.7 | ||||||||||||||||||||||||||||||
|
Mining products and oil
|
2,861.2 | 4.1 | 1,369.7 | 2.3 | 710.3 | 1.7 | 211.0 | 0.5 | 165.7 | 0.5 | ||||||||||||||||||||||||||||||
|
Food, beverage and tobacco
|
2,055.9 | 2.9 | 1,866.1 | 3.2 | 1,618.1 | 3.9 | 1,780.7 | 4.4 | 1,174.8 | 3.5 | ||||||||||||||||||||||||||||||
|
Chemical production
|
1,673.7 | 2.4 | 1,405.0 | 2.4 | 1,719.6 | 4.1 | 1,499.3 | 3.7 | 1,021.9 | 3.0 | ||||||||||||||||||||||||||||||
|
Other industrial and manufacturing products
|
4,501.1 | 6.4 | 4,211.3 | 7.2 | 7,070.4 | 16.9 | 7,531.9 | 18.8 | 5,720.2 | 16.9 | ||||||||||||||||||||||||||||||
|
Government
|
2,234.1 | 3.2 | 1,877.2 | 3.2 | 1,599.6 | 3.8 | 1,398.0 | 3.5 | 1,417.2 | 4.2 | ||||||||||||||||||||||||||||||
|
Construction
|
4,519.1 | 6.5 | 2,681.6 | 4.6 | 2,309.5 | 5.5 | 2,048.0 | 5.1 | 1,927.5 | 5.7 | ||||||||||||||||||||||||||||||
|
Trade and tourism
|
840.4 | 1.2 | 698.7 | 1.2 | 711.7 | 1.7 | 691.4 | 1.7 | 481.1 | 1.4 | ||||||||||||||||||||||||||||||
|
Transportation and communications
|
3,906.1 | 5.6 | 2,925.3 | 5.0 | 2,520.5 | 6.0 | 2,175.1 | 5.4 | 1,971.1 | 5.8 | ||||||||||||||||||||||||||||||
|
Public services
|
3,362.6 | 4.8 | 3,229.6 | 5.5 | 1,681.6 | 4.0 | 1,703.0 | 4.2 | 1,273.8 | 3.8 | ||||||||||||||||||||||||||||||
|
Consumer services(1)
|
22,908.8 | 32.8 | 18,190.5 | 31.0 | 12,210.5 | 29.1 | 11,589.9 | 28.9 | 9,965.9 | 29.4 | ||||||||||||||||||||||||||||||
|
Commercial services(2)
|
17,814.4 | 25.5 | 13,902.4 | 23.7 | 8,196.0 | 19.6 | 7,901.9 | 19.7 | 7,358.5 | 21.7 | ||||||||||||||||||||||||||||||
|
Other (3)
|
1,435.2 | 2.1 | 4,980.0 | 8.5 | 609.8 | 1.5 | 620.6 | 1.5 | 522.8 | 1.5 | ||||||||||||||||||||||||||||||
|
Total domestic loan portfolio
|
69,947.7 | 100.0 | 58,623.6 | 100.0 | 41,896.7 | 100.0 | 40,144.0 | 100.0 | 33,901.6 | 100.0 | ||||||||||||||||||||||||||||||
|
(1)
|
Consumer services include loans to individuals, such as consumer loans (credit cards, vehicle, personal and others) and mortgage loans.
|
|
(2)
|
Commercial services include wholesale trade and retail, consulting and business support services, health and social services, moneylending and other activities.
|
|
(3)
|
In 2010, the Superintendency of Finance implemented the revised International Standard Industrial Classification of All Economic Activities as published by the United Nations in 2008 which updated the loans base by economic activity and also contributed to the increase in loans recorded under “Other” since December 2010.
|
Credit categories
The following table presents our loan portfolio, for the purpose of credit risk evaluation, categorized in accordance with the regulations of the Superintendency of Finance, in effect at the relevant dates.
|
Loan portfolio by type of loan
|
||||||||||||||||||||
|
At December 31,
|
||||||||||||||||||||
|
Domestic
|
2011
|
2010
|
2009
|
2008
|
2007
|
|||||||||||||||
|
(in Ps billions)
|
||||||||||||||||||||
|
Commercial loans
|
36,771.7 | 31,025.5 | 26,139.3 | 25,526.1 | 21,117.0 | |||||||||||||||
|
Consumer loans
|
15,477.7 | 12,851.5 | 11,395.8 | 10,370.2 | 8,849.8 | |||||||||||||||
|
Microcredit loans
|
284.2 | 250.1 | 286.0 | 274.6 | 152.4 | |||||||||||||||
|
Mortgages
|
834.6 | 755.3 | 865.4 | 869.0 | 974.7 | |||||||||||||||
|
Financial leases
|
4,917.8 | 3,541.3 | 3,210.1 | 3,104.0 | 2,807.7 | |||||||||||||||
|
Total domestic loan portfolio
|
58,285.9 | 48,423.8 | 41,896.7 | 40,144.0 | 33,901.6 | |||||||||||||||
|
Allowance for loans and financial lease losses
|
(2,093.0 | ) | (1,977.6 | ) | (1,881.1 | ) | (1,625.8 | ) | (1,278.2 | ) | ||||||||||
|
Total domestic loan portfolio, net
|
56,192.9 | 46,446.2 | 40,015.6 | 38,518.3 | 32,623.4 | |||||||||||||||
|
Loan portfolio by type of loan
|
||||||||||||||||||||
|
At December 31,
|
||||||||||||||||||||
|
Foreign
|
2011
|
2010
|
2009
|
2008
|
2007
|
|||||||||||||||
|
(in Ps billions)
|
||||||||||||||||||||
|
Commercial loans
|
3,773.8 | 3,132.6 | – | – | – | |||||||||||||||
|
Consumer loans
|
4,258.2 | 3,773.7 | – | – | – | |||||||||||||||
|
Microcredit loans
|
– | – | – | – | – | |||||||||||||||
|
Mortgages
|
3,383.8 | 3,089.0 | – | – | – | |||||||||||||||
|
Financial leases
|
246.0 | 204.6 | – | – | – | |||||||||||||||
|
Total foreign loan portfolio
|
11,661.8 | 10,199.9 | – | – | – | |||||||||||||||
|
Allowance for loans and financial lease losses
|
(213.5 | ) | (206.3 | ) | – | – | – | |||||||||||||
|
Total foreign loan portfolio, net
|
11,448.3 | 9,993.6 | – | – | – | |||||||||||||||
|
Total loan portfolio, net
|
67,641.2 | 56,439.7 | 40,015.6 | 38,518.3 | 32,623.4 | |||||||||||||||
Risk categories
The Superintendency of Finance prescribes the minimum risk classifications for loans and financial leases. Management assigns loans and financial leases to these classifications on the basis of models developed by management and reviewed by the Superintendency of Finance. These models incorporate both subjective and objective criteria. See note 2(h) to our audited consolidated financial statements.
Category A — “
Normal risk
”: Loans and financial leases in this category are appropriately serviced. The debtor’s financial statements or its projected cash flows, as well as all other credit information available to us, reflect adequate paying capacity.
Category B — “
Acceptable risk, above normal
”: Loans and financial leases in this category are acceptably serviced and guaranty-protected, but there are weaknesses which may potentially affect, on a transitory or permanent basis, the debtor’s paying capacity or its projected cash flows, to the extent that, if not timely corrected, would affect the normal collection of credit or contracts.
Category C — “
Appreciable risk
”: Loans and financial leases in this category have debtors with insufficient paying capacity or relate to projects with insufficient cash flow, which may compromise the normal collection of the obligations.
Category D — “
Significant risk
”: Loans and financial leases in this category have the same deficiencies as loans in category C, but to a larger extent; consequently, the probability of collection is highly doubtful.
Category E — “
Risk of non-recoverability
”: Loans and financial leases in this category are deemed uncollectible.
The following table presents the breakdown of our loan portfolio by risk classification in effect at December 31 of each year.
|
At December 31,
|
||||||||||||||||||||||||||||||||||||||||
|
Domestic
|
2011
|
%
|
2010
|
%
|
2009
|
%
|
2008
|
%
|
2007
|
%
|
||||||||||||||||||||||||||||||
|
(in Ps billions, except percentages)
|
||||||||||||||||||||||||||||||||||||||||
|
“A” Normal risk
|
54,599.9 | 93.7 | 44,718.3 | 92.3 | 38,054.0 | 90.8 | 37,186.0 | 92.6 | 31,932.0 | 94.2 | ||||||||||||||||||||||||||||||
|
“B” Acceptable risk, above normal
|
1,867.8 | 3.2 | 1,817.1 | 3.8 | 1,844.7 | 4.4 | 1,340.1 | 3.3 | 804.6 | 2.4 | ||||||||||||||||||||||||||||||
|
“C” Appreciable risk
|
700.9 | 1.2 | 645.3 | 1.3 | 637.1 | 1.5 | 522.4 | 1.3 | 367.9 | 1.1 | ||||||||||||||||||||||||||||||
|
“D” Significant risk
|
710.7 | 1.2 | 894.9 | 1.8 | 1,033.7 | 2.5 | 800.6 | 2.0 | 531.4 | 1.6 | ||||||||||||||||||||||||||||||
|
“E” Risk of non-recoverability
|
406.6 | 0.7 | 348.2 | 0.7 | 327.1 | 0.8 | 295.0 | 0.7 | 265.7 | 0.8 | ||||||||||||||||||||||||||||||
|
Total domestic loan portfolio
|
58,285.9 | 100.0 | 48,423.8 | 100.0 | 41,896.7 | 100.0 | 40,144.0 | 100.0 | 33,901.6 | 100.0 | ||||||||||||||||||||||||||||||
|
Loan portfolio classified as “C,” “D” and “E” as a percentage of total loan portfolio
|
3.1 | – | 3.9 | – | 4.8 | – | 4.0 | – | 3.4 | – | ||||||||||||||||||||||||||||||
|
At December 31,
|
||||||||||||||||||||||||||||||||||||||||
|
Foreign
|
2011
|
%
|
2010
|
%
|
2009
|
%
|
2008
|
%
|
2007
|
%
|
||||||||||||||||||||||||||||||
|
(in Ps billions, except percentages)
|
||||||||||||||||||||||||||||||||||||||||
|
“A” Normal risk
|
11,051.4 | 94.8 | 9,407.9 | 92.2 | – | – | – | – | – | – | ||||||||||||||||||||||||||||||
|
“B” Acceptable risk, above normal
|
222.1 | 1.9 | 409.1 | 4.0 | – | – | – | – | – | – | ||||||||||||||||||||||||||||||
|
“C” Appreciable risk
|
219.5 | 1.9 | 219.7 | 2.2 | – | – | – | – | – | – | ||||||||||||||||||||||||||||||
|
“D” Significant risk
|
83.4 | 0.7 | 110.9 | 1.1 | – | – | – | – | – | – | ||||||||||||||||||||||||||||||
|
“E” Risk of non-recoverability
|
85.4 | 0.7 | 52.3 | 0.5 | – | – | – | – | – | – | ||||||||||||||||||||||||||||||
|
Total foreign loan portfolio
|
11,661.8 | 100 | 10,199.9 | 100.0 | – | – | – | – | – | – | ||||||||||||||||||||||||||||||
|
Loan portfolio classified as “C,” “D” and “E” as a percentage of total loan portfolio
|
3.2 | – | 3.8 | – | – | – | – | – | – | – | ||||||||||||||||||||||||||||||
|
Total loan portfolio
|
69,947.7 | 100.0 | 58,623.6 | 100.0 | 41,896.7 | 100.0 | 40,144.0 | 100.0 | 33,901.6 | 100.0 | ||||||||||||||||||||||||||||||
Suspension of accruals
The Superintendency of Finance mandates that interest, UVRs, lease payments and other items of income cease to be accrued in the statement of income and begin to be recorded in memorandum accounts until any payment is collected, once a loan or financial lease is in arrears for more than 90 days for commercial loans or financial leases, 60 days for mortgage and consumer loans or financial leases and 30 days for microcredit loans.
Interest paid on non-accrued loans is recorded as “interest on loans” on our statement of income.
The following table presents the breakdown of our past due loans by type of loan in accordance with the criteria of the Superintendency of Finance in effect at December 31 of each year.
|
At December 31,
|
||||||||||||||||||||||||||||||||||||||||
|
2011
|
%
|
2010
|
%
|
2009
|
%
|
2008
|
%
|
2007
|
%
|
|||||||||||||||||||||||||||||||
|
(in Ps billions, except percentages)
|
||||||||||||||||||||||||||||||||||||||||
|
Domestic
|
||||||||||||||||||||||||||||||||||||||||
|
Performing past due loans: (1)
|
||||||||||||||||||||||||||||||||||||||||
|
Commercial loans past due from 31 days to 90 days
|
85.7 | 7.1 | 121.2 | 9.6 | 143.4 | 9.5 | 172.0 | 11.9 | 132.8 | 13.1 | ||||||||||||||||||||||||||||||
|
Consumer loans past due from 31 days to 60 days
|
143.4 | 11.9 | 134.3 | 10.7 | 146.2 | 9.7 | 176.4 | 12.3 | 136.1 | 13.4 | ||||||||||||||||||||||||||||||
|
Microcredit loans past due up to 30 days
|
0.6 | – | 0.6 | – | 1.7 | 0.1 | 2.9 | 0.2 | 0.5 | 0.1 | ||||||||||||||||||||||||||||||
|
Mortgage loans past due from 31 days to 60 days
|
22.8 | 1.9 | 29.0 | 2.3 | 34.5 | 2.3 | 44.1 | 3.1 | 47.8 | 4.7 | ||||||||||||||||||||||||||||||
|
Financial leases past due from 31 days to 60/90 days (2)
|
72.5 | 6.0 | 40.2 | 3.2 | 74.6 | 4.9 | 88.4 | 6.1 | 67.9 | 6.7 | ||||||||||||||||||||||||||||||
|
Total domestic performing past due loan portfolio
|
324.9 | 27.0 | 325.3 | 25.9 | 400.5 | 26.5 | 483.8 | 33.6 | 385.1 | 38.0 | ||||||||||||||||||||||||||||||
|
Non-performing past due loans:
|
||||||||||||||||||||||||||||||||||||||||
|
Commercial loans past due more than 90 days
|
347.7 | 28.8 | 417.6 | 33.3 | 525.7 | 34.8 | 374.6 | 26.0 | 236.5 | 23.3 | ||||||||||||||||||||||||||||||
|
Consumer loans past due more than 60 days
|
398.0 | 33.0 | 368.6 | 29.3 | 417.8 | 27.6 | 380.5 | 26.4 | 242.3 | 23.9 | ||||||||||||||||||||||||||||||
|
Microcredit loans past due more than 30 days
|
12.6 | 1.0 | 15.5 | 1.2 | 17.3 | 1.1 | 12.7 | 0.9 | 7.3 | 0.7 | ||||||||||||||||||||||||||||||
|
Mortgage loans past due more than 60 days
|
46.8 | 3.9 | 51.2 | 4.1 | 67.1 | 4.4 | 106.9 | 7.4 | 103.5 | 10.2 | ||||||||||||||||||||||||||||||
|
Financial leases past due more than 60/90 days
|
75.4 | 6.3 | 77.6 | 6.2 | 82.9 | 5.5 | 81.4 | 5.7 | 38.5 | 3.8 | ||||||||||||||||||||||||||||||
|
Total domestic non-performing past due loan portfolio
|
880.5 | 73.0 | 930.4 | 74.1 | 1,110.8 | 73.5 | 956.0 | 66.4 | 628.0 | 62.0 | ||||||||||||||||||||||||||||||
|
Total domestic past due loan portfolio
|
1,205.5 | 100.0 | 1,255.8 | 100.0 | 1,511.3 | 100.0 | 1,439.8 | 100.0 | 1,013.1 | 100.0 | ||||||||||||||||||||||||||||||
|
Total non-performing past due loan portfolio
|
880.5 | – | 930.4 | – | 1,110.8 | – | 956.0 | – | 628.0 | – | ||||||||||||||||||||||||||||||
|
Foreclosed assets
|
161.8 | – | 148.1 | – | 171.5 | – | 168.8 | – | 201.7 | – | ||||||||||||||||||||||||||||||
|
Other accounts receivable more than 180 days past due
|
31.8 | – | 40.8 | – | 39.8 | – | 25.6 | – | 13.3 | – | ||||||||||||||||||||||||||||||
|
Total domestic non-performing assets
|
1,074.1 | – | 1,119.3 | – | 1,322.2 | – | 1,150.4 | – | 843.1 | – | ||||||||||||||||||||||||||||||
|
Allowance for loan and financial lease losses
|
2,093.0 | – | 1,977.6 | – | 1,881.1 | – | 1,625.8 | – | 1,278.1 | – | ||||||||||||||||||||||||||||||
|
Allowance for estimated losses on foreclosed assets
|
113.6 | – | 105.8 | – | 123.5 | – | 126.2 | – | 149.1 | – | ||||||||||||||||||||||||||||||
|
Allowance for accounts receivable and accrued interest losses
|
57.2 | – | 55.4 | – | 69.4 | – | 47.0 | – | 30.1 | – | ||||||||||||||||||||||||||||||
|
Loans and financial leases at least 31 days past due as a percentage of total loans
|
2.1 | % | – | 2.6 | % | – | 3.6 | % | – | 3.6 | % | – | 3.0 | % | – | |||||||||||||||||||||||||
|
Allowance for loan and financial lease losses as a percentage of loans at least 31 days past due
|
173.6 | % | – | 157.5 | % | – | 124.5 | % | – | 112.9 | % | – | 126.2 | % | – | |||||||||||||||||||||||||
|
Allowance for loan and financial lease losses as a percentage of loans classified as “C,” “D” and “E”
|
114.1 | % | – | 104.7 | % | – | 94.1 | % | – | 100.5 | % | – | 109.7 | % | – | |||||||||||||||||||||||||
|
Percentage of performing loans and financial leases to total loans and financial leases
|
98.5 | % | – | 98.1 | % | – | 96.4 | % | – | 97.6 | % | – | 98.1 | % | – | |||||||||||||||||||||||||
|
At December 31,
|
||||||||||||||||||||||||||||||||||||||||
| 2011 |
%
|
2010 |
%
|
2009 |
%
|
2008 |
%
|
2007 |
%
|
|||||||||||||||||||||||||||||||
|
(in Ps billions, except percentages)
|
||||||||||||||||||||||||||||||||||||||||
|
Foreign
|
||||||||||||||||||||||||||||||||||||||||
|
Performing past due loans: (1)
|
||||||||||||||||||||||||||||||||||||||||
|
Commercial loans past due from 31 days to 90 days
|
14.4 | 4.3 | 8.6 | 2.7 | – | – | – | – | – | – | ||||||||||||||||||||||||||||||
|
Consumer loans past due loans from 31 days to 60 days
|
46.4 | 14.0 | 70.8 | 22.6 | – | – | – | – | – | – | ||||||||||||||||||||||||||||||
|
Microcredit loans past due up to 30 days
|
– | – | – | – | – | – | – | – | – | – | ||||||||||||||||||||||||||||||
|
Mortgage loans past due from 31 days to 60 days
|
– | – | 38.4 | 12.2 | – | – | – | – | – | – | ||||||||||||||||||||||||||||||
|
Financial leases past due from 31 days to 60/90 days (2)
|
1.5 | 0.5 | 1.1 | 0.3 | – | – | – | – | – | – | ||||||||||||||||||||||||||||||
|
Total Foreign performing past due loan portfolio
|
62.4 | 18.8 | 118.9 | 37.9 | – | – | – | – | – | – | ||||||||||||||||||||||||||||||
|
Non-performing past due loans:
|
||||||||||||||||||||||||||||||||||||||||
|
Commercial loans past due more than 90 days
|
80.0 | 24.1 | 50.6 | 16.1 | – | – | – | – | – | – | ||||||||||||||||||||||||||||||
|
Consumer loans past due more than 60 days
|
86.9 | 26.2 | 89.7 | 28.6 | – | – | – | – | – | – | ||||||||||||||||||||||||||||||
|
Microcredit loans past due more than 30 days
|
– | – | – | – | – | – | – | – | – | – | ||||||||||||||||||||||||||||||
|
Mortgage loans past due more than 60 days
|
100.1 | 30.2 | 54.2 | 17.3 | – | – | – | – | – | – | ||||||||||||||||||||||||||||||
|
Financial leases past due more than 60/90 days
|
2.3 | 0.7 | 0.5 | 0.2 | – | – | – | – | – | – | ||||||||||||||||||||||||||||||
|
Total Foreign non-performing past due loan portfolio
|
269.4 | 81.2 | 195.0 | 62.1 | – | – | – | – | – | – | ||||||||||||||||||||||||||||||
|
Total Foreign past due loan portfolio
|
331.8 | 100.0 | 313.9 | 100.0 | – | – | – | – | – | – | ||||||||||||||||||||||||||||||
|
Total non-performing past due loan portfolio
|
269.4 | – | 195.0 | – | – | – | – | – | – | – | ||||||||||||||||||||||||||||||
|
Foreclosed assets
|
61.8 | – | 67.4 | – | – | – | – | – | – | – | ||||||||||||||||||||||||||||||
|
Other accounts receivable more than 180 days past due
|
– | – | – | – | – | – | – | – | – | – | ||||||||||||||||||||||||||||||
|
Total Foreign non-performing assets
|
331.2 | – | 262.4 | – | – | – | – | – | – | – | ||||||||||||||||||||||||||||||
|
Allowance for loan and financial lease losses
|
213.5 | – | 206.3 | – | – | – | – | – | – | – | ||||||||||||||||||||||||||||||
|
Allowance for estimated losses on foreclosed assets
|
29.5 | – | 24.2 | – | – | – | – | – | – | – | ||||||||||||||||||||||||||||||
|
Allowance for accounts receivable and accrued interest losses
|
- | – | – | – | – | – | – | – | – | – | ||||||||||||||||||||||||||||||
|
Loans and financial leases at least 31 days past due as a percentage of total loans
|
2.8 | % | – | 3.1 | % | – | – | – | – | – | – | – | ||||||||||||||||||||||||||||
|
Allowance for loan and financial lease losses as a percentage of loans at least 31 days past due
|
64.3 | % | – | 65.7 | % | – | – | – | – | – | – | – | ||||||||||||||||||||||||||||
|
Allowance for loan and financial lease losses as a percentage of loans classified as “C,” “D” and “E”
|
55.0 | % | – | 53.9 | % | – | – | – | – | – | – | – | ||||||||||||||||||||||||||||
|
Percentage of performing loans and financial leases to total loans and financial leases
|
97.2 | % | – | 98.1 | % | – | – | – | – | – | – | – | ||||||||||||||||||||||||||||
|
(1)
|
Performing past due loans are loans upon which interest has not been received for the periods indicated; however, we continue to recognize income. Once interest is unpaid on accrual loans for greater than the amount of days specified in the respective line item above, the loan is classified as non-performing.
|
|
(2)
|
Includes commercial and consumer financial leases.
|
The following table presents the breakdown of the non-performing past due loans by type of loan in accordance with the criteria of the Superintendency of Finance for domestic and foreign loans at the periods indicated.
|
At December 31,
|
||||||||||||||||||||
|
2011
|
2010
|
2009
|
2008
|
2007
|
||||||||||||||||
|
(in Ps billions)
|
||||||||||||||||||||
|
Domestic
|
||||||||||||||||||||
|
Non-performing past due loans:
|
||||||||||||||||||||
|
Commercial loans past due more than 90 days
|
347.7 | 417.6 | 525.7 | 374.5 | 236.3 | |||||||||||||||
|
Consumer loans past due more than 60 days
|
398.0 | 368.6 | 417.8 | 380.5 | 242.3 | |||||||||||||||
|
Microcredit loans past due more than 30 days
|
12.6 | 15.5 | 17.3 | 12.7 | 7.3 | |||||||||||||||
|
Mortgage loans past due more than 60 days
|
46.8 | 51.2 | 67.1 | 106.9 | 103.5 | |||||||||||||||
|
Financial leases past due more than 60 days
|
75.4 | 77.6 | 82.9 | 81.4 | 38.5 | |||||||||||||||
|
Total domestic non-performing past due loan portfolio
|
880.5 | 930.4 | 1,110.8 | 955.8 | 627.9 | |||||||||||||||
|
Foreign
|
||||||||||||||||||||
|
Non-performing past due loans:
|
||||||||||||||||||||
|
Commercial loans past due more than 90 days
|
80.0 | 50.6 | – | 0.2 | 0.2 | |||||||||||||||
|
Consumer loans past due more than 60 days
|
86.9 | 89.7 | – | – | – | |||||||||||||||
|
Microcredit loans past due more than 30 days
|
- | – | – | – | – | |||||||||||||||
|
Mortgage loans past due more than 60 days
|
100.1 | 54.2 | – | – | – | |||||||||||||||
|
Financial leases past due more than 60/90 days
|
2.3 | 0.5 | – | – | – | |||||||||||||||
|
Total foreign non-performing past due loan portfolio
|
269.4 | 195.0 | – | 0.2 | 0.2 | |||||||||||||||
|
Total domestic and foreign non-performing past due loan portfolio
|
1,149.9 | 1,125.5 | 1,110.8 | 956.0 | 628.0 | |||||||||||||||
The following table presents our past due loan portfolio by type of loan.
|
At December 31,
|
||||||||||||||||||||||||||||||||||||||||
|
2011
|
%
|
2010
|
%
|
2009
|
%
|
2008
|
%
|
2007
|
%
|
|||||||||||||||||||||||||||||||
|
(in Ps billions, except percentages)
|
||||||||||||||||||||||||||||||||||||||||
|
Commercial
|
||||||||||||||||||||||||||||||||||||||||
|
General purpose loans
|
384.3 | 25.0 | 453.7 | 28.9 | 492.3 | 32.6 | 427.7 | 29.7 | 283.2 | 28.0 | ||||||||||||||||||||||||||||||
|
Loans funded by development banks
|
31.1 | 2.0 | 42.4 | 2.7 | 35.2 | 2.3 | 35.7 | 2.5 | 28.0 | 2.8 | ||||||||||||||||||||||||||||||
|
Working capital loans
|
48.4 | 3.2 | 76.1 | 4.8 | 108.9 | 7.2 | 50.2 | 3.5 | 34.3 | 3.4 | ||||||||||||||||||||||||||||||
|
Credit cards
|
12.6 | 0.8 | 15.7 | 1.0 | 19.1 | 1.3 | 15.0 | 1.0 | 10.6 | 1.0 | ||||||||||||||||||||||||||||||
|
Overdrafts
|
51.5 | 3.3 | 10.0 | 0.6 | 13.7 | 0.9 | 18.0 | 1.3 | 13.2 | 1.3 | ||||||||||||||||||||||||||||||
|
Total commercial
|
527.9 | 34.3 | 597.9 | 38.1 | 669.1 | 44.3 | 546.6 | 38.0 | 369.3 | 36.4 | ||||||||||||||||||||||||||||||
|
Consumer
|
||||||||||||||||||||||||||||||||||||||||
|
Credit cards
|
202.2 | 13.2 | 219.4 | 14.0 | 98.9 | 6.5 | 111.0 | 7.7 | 70.3 | 6.9 | ||||||||||||||||||||||||||||||
|
Personal loans
|
371.3 | 24.2 | 346.3 | 22.1 | 355.7 | 23.5 | 331.5 | 23.0 | 238.2 | 23.5 | ||||||||||||||||||||||||||||||
|
Automobile and vehicle loans
|
87.1 | 5.7 | 79.0 | 5.0 | 79.1 | 5.2 | 77.7 | 5.4 | 43.4 | 4.3 | ||||||||||||||||||||||||||||||
|
Overdrafts
|
8.6 | 0.6 | 6.9 | 0.4 | 11.2 | 0.7 | 14.6 | 1.0 | 11.0 | 1.1 | ||||||||||||||||||||||||||||||
|
Loans funded by development banks
|
0.1 | – | – | – | 5.9 | 0.4 | 4.8 | 0.3 | 3.7 | 0.4 | ||||||||||||||||||||||||||||||
|
General purpose loans
|
5.5 | 0.4 | 5.9 | 0.4 | 12.8 | 0.8 | 17.1 | 1.2 | 11.7 | 1.2 | ||||||||||||||||||||||||||||||
|
Working capital loans
|
– | – | 5.9 | 0.4 | 0.4 | – | 0.2 | – | 0.1 | – | ||||||||||||||||||||||||||||||
|
Total consumer
|
674.7 | 43.9 | 663.4 | 42.3 | 564.0 | 37.3 | 556.9 | 38.7 | 378.4 | 37.3 | ||||||||||||||||||||||||||||||
|
Microcredit
|
13.2 | 0.9 | 16.1 | 1.0 | 19.0 | 1.3 | 15.5 | 1.1 | 7.8 | 0.8 | ||||||||||||||||||||||||||||||
|
Mortgages
|
169.7 | 11.0 | 172.8 | 11.0 | 101.6 | 6.7 | 151.0 | 10.5 | 151.3 | 14.9 | ||||||||||||||||||||||||||||||
|
Financial leases
|
151.8 | 9.9 | 119.4 | 7.6 | 157.6 | 10.4 | 169.8 | 11.8 | 106.3 | 10.5 | ||||||||||||||||||||||||||||||
|
Total past due loan portfolio
|
1,537.3 | 100.0 | 1,569.7 | 100.0 | 1,511.3 | 100.0 | 1,439.8 | 100.0 | 1,013.1 | 100.0 | ||||||||||||||||||||||||||||||
The following table presents information with respect to our loan portfolio at least 31 days past due based on the nature of the collateral for the loan.
|
At December 31,
|
||||||||||||||||||||||||||||||||||||||||
|
2011
|
%
|
2010
|
%
|
2009
|
%
|
2008
|
%
|
2007
|
%
|
|||||||||||||||||||||||||||||||
|
(in Ps billions, except percentages)
|
||||||||||||||||||||||||||||||||||||||||
|
Secured
|
||||||||||||||||||||||||||||||||||||||||
|
Past due 31 to 360 days
|
||||||||||||||||||||||||||||||||||||||||
|
Commercial
|
143.9 | 0.2 | 165.3 | 0.3 | 249.3 | 0.6 | 270.0 | 0.7 | 148.9 | 0.5 | ||||||||||||||||||||||||||||||
|
Consumer
|
83.7 | 0.1 | 100.1 | 0.2 | 78.4 | 0.2 | 82.3 | 0.2 | 47.6 | 0.1 | ||||||||||||||||||||||||||||||
|
Microcredit
|
7.7 | – | 5.4 | – | 8.8 | – | 5.5 | – | 2.3 | – | ||||||||||||||||||||||||||||||
|
Mortgages
|
143.6 | 0.2 | 149.7 | 0.3 | 83.5 | 0.2 | 124.4 | 0.3 | 125.4 | 0.4 | ||||||||||||||||||||||||||||||
|
Financial leases
|
115.9 | 0.2 | 83.8 | 0.1 | 128.0 | 0.3 | 144.2 | 0.4 | 100.6 | 0.3 | ||||||||||||||||||||||||||||||
|
Total 31 to 360 days
|
494.8 | 0.7 | 504.3 | 0.9 | 547.9 | 1.4 | 626.4 | 1.6 | 424.7 | 1.3 | ||||||||||||||||||||||||||||||
|
Total past due more than 360 days
|
135.4 | 0.2 | 126.9 | 0.2 | 131.1 | 0.3 | 115.5 | 0.3 | 76.9 | 0.2 | ||||||||||||||||||||||||||||||
|
Total current
|
22,374.1 | 33.1 | 20,383.2 | 36.1 | 12,840.7 | 32.1 | 12,259.0 | 31.8 | 11,145.7 | 34.2 | ||||||||||||||||||||||||||||||
|
Total secured loan portfolio
|
23,004.3 | 34.0 | 21,014.4 | 37.2 | 13,519.7 | 33.8 | 13,000.9 | 33.8 | 11,647.3 | 35.7 | ||||||||||||||||||||||||||||||
|
Unsecured (1)
|
||||||||||||||||||||||||||||||||||||||||
|
Past due 31 to 360 days
|
||||||||||||||||||||||||||||||||||||||||
|
Commercial
|
187.8 | 0.3 | 231.9 | 0.4 | 243.4 | 0.6 | 154.4 | 0.4 | 148.1 | 0.5 | ||||||||||||||||||||||||||||||
|
Consumer
|
529.1 | 0.8 | 512.1 | 0.9 | 421.7 | 1.1 | 446.8 | 1.2 | 305.4 | 0.9 | ||||||||||||||||||||||||||||||
|
Microcredit
|
4.5 | – | 5.3 | – | 5.2 | – | 7.9 | – | 3.5 | – | ||||||||||||||||||||||||||||||
|
Mortgages
|
– | – | – | – | – | – | – | – | – | – | ||||||||||||||||||||||||||||||
|
Financial leases
|
– | – | – | – | – | – | – | – | – | – | ||||||||||||||||||||||||||||||
|
Total 31 to 360 days
|
721.3 | 1.1 | 749.2 | 1.3 | 670.3 | 1.7 | 609.2 | 1.6 | 457.0 | 1.4 | ||||||||||||||||||||||||||||||
|
Total past due more than 360 days
|
185.8 | 0.3 | 189.2 | 0.3 | 162.0 | 0.4 | 88.7 | 0.2 | 54.5 | 0.2 | ||||||||||||||||||||||||||||||
|
Total current
|
46.036.4 | 68.1 | 36,670.8 | 65.0 | 27,544.7 | 68.8 | 26,445.2 | 68.7 | 21,742.8 | 66.6 | ||||||||||||||||||||||||||||||
|
Total unsecured loan portfolio
|
46,943.5 | 69.4 | 37,609.2 | 66.6 | 28,377.0 | 70.9 | 27,143.2 | 70.5 | 22,254.3 | 68.2 | ||||||||||||||||||||||||||||||
|
Total loan portfolio, gross
|
69,947.7 | 103.4 | 58,623.6 | 103.9 | 41,896.7 | 104.7 | 40,144.0 | 104.2 | 33,901.6 | 103.9 | ||||||||||||||||||||||||||||||
|
Allowances
|
(2,306.5 | ) | (3.4 | ) | (2,183.9 | ) | (3.9 | ) | (1,881.1 | ) | (4.7 | ) | (1,625.8 | ) | (4.2 | ) | (1,278.2 | ) | (3.9 | ) | ||||||||||||||||||||
|
Total loan portfolio, net
|
67,641.2 | 100.0 | 56,439.7 | 100.0 | 40,015.6 | 100.0 | 38,518.3 | 100.0 | 32,623.4 | 100.0 | ||||||||||||||||||||||||||||||
|
(1)
|
Includes loans with personal guarantees.
|
Non-accrual, non-performing loans, performing loans, and performing troubled restructured loans
Non-
accrual
loans
The following table presents loans accounted for on a non-accrual basis classified into domestic and foreign loans, the gross interest income that would have been recorded in the relevant period if the loans had been current in accordance with their original terms and had been outstanding throughout the period or since origination, and the amount of interest income on those loans that was included in net income for that period.
|
At and for the year ended December 31, 2011
|
||||||||||||
|
Amount of loans
|
Gross interest income
|
Interest income included in net income for the period
|
||||||||||
|
(in Ps billions)
|
||||||||||||
|
Domestic
|
880.5 | 161.7 | 62.5 | |||||||||
|
Foreign
|
269.4 | 15.1 | – | |||||||||
|
Total non-accrual loan portfolio
|
1,149.9 | 176.8 | 62.5 | |||||||||
Non-performing troubled debt restructured loans
The following table presents our non-performing troubled debt restructured loans classified into domestic and foreign loans, the gross interest income that would have been recorded in the relevant period if the loans had been current in accordance with their original terms and had been outstanding throughout the period or since origination, and the amount of interest income on those loans that was included in net income for that period.
|
At and for the year ended December 31, 2011
|
||||||||||||
|
Amount of loans
|
Gross interest income
|
Interest income included in net income for the period
|
||||||||||
|
(in Ps billions)
|
||||||||||||
|
Domestic
|
908.7 | 81.5 | 63.9 | |||||||||
|
Foreign
|
29.9 | 4.6 | – | |||||||||
|
Total non-performing troubled debt restructured loan portfolio
|
938.5 | 86.2 | 63.9 | |||||||||
Performing troubled restructured loans
The following table presents our performing troubled debt restructured loan portfolio classified into domestic and foreign loans, the gross interest income that would have been recorded in the period that ended if the loans had been current in accordance with their original terms and had been outstanding throughout the period or since origination and the amount of interest income on those loans that was included in net income for the period.
|
At and for the year ended December 31, 2011
|
||||||||||||
|
Amount of loans
|
Gross interest income
|
Interest income included in net income for the period
|
||||||||||
|
(in Ps billions)
|
||||||||||||
|
Domestic
|
613.3 | 56.4 | 54.9 | |||||||||
|
Foreign
|
122.0 | 24.2 | 23.7 | |||||||||
|
Total performing troubled debt restructured loan portfolio
|
735.2 | 80.6 | 78.6 | |||||||||
The following table presents a summary of our troubled debt restructuring loan portfolio, classified into domestic and foreign loans, accounted for on a performing basis in accordance with the criteria of the Superintendency of Finance in effect at the end of each period.
|
At December 31,
|
||||||||||||||||||||
|
2011
|
2010
|
2009
|
2008
|
2007
|
||||||||||||||||
|
(in Ps billions)
|
||||||||||||||||||||
|
Domestic
|
613.3 | 703.6 | 660.6 | 508.0 | 536.5 | |||||||||||||||
|
Foreign
|
122.0 | 182.4 | – | – | – | |||||||||||||||
|
Total performing troubled debt restructuring loan portfolio(1)
|
735.2 | 886.0 | 660.6 | 508.0 | 536.5 | |||||||||||||||
|
(1)
|
Restructured loans are loans that have been modified due to an impairment of the conditions of the beneficiary.
|
Movements in allowances for credit losses
Allowance for loan losses
We record allowance for loan and financial lease losses in accordance with regulations established by the Superintendency of Finance. For further information regarding the regulation and methodologies for the calculation of such allowances, see note 2(i) to our audited consolidated financial statements.
The following tables present the changes in the allowance for loan and financial lease losses during the periods indicated.
|
Year ended December 31,
|
||||||||||||||||||||
|
2011
|
2010
|
2009
|
2008
|
2007
|
||||||||||||||||
|
(in Ps billions)
|
||||||||||||||||||||
|
Domestic
|
||||||||||||||||||||
|
Balance at beginning of period
|
1,977.6 | 1,881.1 | 1,625.8 | 1,278.2 | 948.7 | |||||||||||||||
|
Increase in allowance through business combinations(1)
|
1.7 | 1.8 | – | – | – | |||||||||||||||
|
Allowance for financial leasing reclassification
|
0.1 | – | – | – | – | |||||||||||||||
|
Provisions for loan losses
|
1,794.8 | 1,927.1 | 1,855.6 | 1,600.4 | 1,318.8 | |||||||||||||||
|
Charge-offs
|
(511.6 | ) | (660.1 | ) | (558.2 | ) | (369.8 | ) | (247.1 | ) | ||||||||||
|
Effect of difference in exchange rate
|
(0.8 | ) | (0.6 | ) | (0.8 | ) | 0.7 | (0.6 | ) | |||||||||||
|
Reclassification – securitization
|
(9.7 | ) | (8.4 | ) | (6.9 | ) | 0.5 | (0.2 | ) | |||||||||||
|
Reversals of provisions
|
(1,159.0 | ) | (1,163.4 | ) | (1,034.3 | ) | (884.2 | ) | (741.5 | ) | ||||||||||
|
Balance at end of year (domestic)
|
2,093.0 | 1,977.6 | 1,881.1 | 1,625.8 | 1,278.2 | |||||||||||||||
|
Year ended December 31,
|
||||||||||||||||||||
|
2011
|
2010
|
2009
|
2008
|
2007
|
||||||||||||||||
|
(in Ps billions)
|
||||||||||||||||||||
|
Foreign
|
||||||||||||||||||||
|
Balance at beginning of period
|
206.3 | – | – | – | – | |||||||||||||||
|
Increase in allowance through business combinations(1)
|
– | 184.4 | – | – | – | |||||||||||||||
|
Allowance for financial leasing reclassification
|
– | – | – | – | – | |||||||||||||||
|
Provisions for loan losses
|
170.5 | 1.0 | – | – | – | |||||||||||||||
|
Charge-offs
|
(165.1 | ) | (17.5 | ) | – | – | – | |||||||||||||
|
Effect of difference in exchange rate
|
10.8 | 38.7 | – | – | – | |||||||||||||||
|
Reclassification – securitization
|
– | – | – | – | – | |||||||||||||||
|
Reversals of provisions
|
(9.1 | ) | (0.3 | ) | – | – | – | |||||||||||||
|
Balance at end of year (foreign)
|
213.5 | 206.3 | – | – | – | |||||||||||||||
|
Balance at end of year total (2)
|
2,306.5 | 2,183.9 | 1,881.1 | 1,625.8 | 1,278.2 | |||||||||||||||
|
(1)
|
Reflects business acquisitions of BAC Credomatic in 2010.
|
|
(2)
|
The allowance balance for accrued interest receivable, which is not included in this item, amounted to Ps 61.2 billion, Ps 55.4 billion, Ps 69.4 billion, Ps 47.0 billion and Ps 30.1 billion for the years ended December 31, 2011, 2010, 2009, 2008, and 2007, respectively.
|
Recoveries of charged-off loans are recorded on the statement of income under recovery of charged-off assets and are not included in provisions for loan losses.
The following table presents the allocation of our allowance for loan losses by category of loan and financial lease losses.
|
At December 31,
|
||||||||||||||||||||
|
2011
|
2010
|
2009
|
2008
|
2007
|
||||||||||||||||
|
(in Ps billions)
|
||||||||||||||||||||
|
Domestic
|
||||||||||||||||||||
|
Commercial
|
1,117.3 | 1,138.3 | 1,062.4 | 898.9 | 748.7 | |||||||||||||||
|
Consumer
|
780.3 | 658.6 | 653.3 | 556.5 | 300.5 | |||||||||||||||
|
Microcredit
|
10.3 | 13.1 | 12.4 | 9.0 | 5.3 | |||||||||||||||
|
Mortgages
|
16.3 | 15.6 | 23.3 | 29.4 | 29.2 | |||||||||||||||
|
Financial leases
|
158.6 | 142.9 | 117.1 | 119.8 | 87.7 | |||||||||||||||
|
General (1)
|
10.2 | 9.1 | 12.7 | 12.2 | 106.8 | |||||||||||||||
|
Total domestic
|
2,093.0 | 1,977.6 | 1,881.1 | 1,625.8 | 1,278.2 | |||||||||||||||
|
Foreign
|
||||||||||||||||||||
|
Commercial
|
63.8 | 77.4 | – | – | – | |||||||||||||||
|
Consumer
|
122.3 | 104.0 | – | – | – | |||||||||||||||
|
Microcredit
|
– | – | – | – | – | |||||||||||||||
|
Mortgages
|
24.7 | 23.5 | – | – | – | |||||||||||||||
|
Financial leases
|
2.7 | 1.4 | – | – | – | |||||||||||||||
|
General (1)
|
– | – | – | – | – | |||||||||||||||
|
Total foreign
|
213.5 | 206.3 | – | – | – | |||||||||||||||
|
Total allowance for loan and financial lease losses
|
2,306.5 | 2,183.9 | 1,881.1 | 1,625.8 | 1,278.2 | |||||||||||||||
|
(1)
|
Our banking subsidiaries adopted the Commercial Reference Model (July 2007) and the Consumer Reference Model (July 2008) issued by the Superintendency of Finance. Notwithstanding the elimination of the general allowance for loan losses dictated by these models, this did not result in a decrease in the total amount of allowances, as allowances for individual loans increased. At December 31, 2010, the general allowance includes an amount equal to 1.0% of gross mortgage and microcredit loans in Colombia and general allowances in other jurisdictions.
|
The following table presents the allocation of our allowance for loans and financial lease losses by type of loan.
|
At December 31,
|
||||||||||||||||||||||||||||||||||||||||
|
2011
|
%
|
2010
|
%
|
2009
|
%
|
2008
|
%
|
2007
|
%
|
|||||||||||||||||||||||||||||||
|
(in Ps billions, except percentages)
|
||||||||||||||||||||||||||||||||||||||||
|
Domestic
|
||||||||||||||||||||||||||||||||||||||||
|
Commercial
|
||||||||||||||||||||||||||||||||||||||||
|
General purpose loans
|
883.0 | 38.3 | 906.2 | 41.5 | 783.5 | 41.7 | 668.8 | 41.1 | 571.6 | 44.7 | ||||||||||||||||||||||||||||||
|
Loans funded by development banks
|
54.5 | 2.4 | 57.8 | 2.6 | 54.5 | 2.9 | 50.9 | 3.1 | 42.6 | 3.3 | ||||||||||||||||||||||||||||||
|
Working capital loans
|
156.9 | 6.8 | 149.8 | 6.9 | 194.2 | 10.3 | 155.4 | 9.6 | 115.3 | 9.0 | ||||||||||||||||||||||||||||||
|
Credit cards
|
13.7 | 0.6 | 16.0 | 0.7 | 16.7 | 0.9 | 12.7 | 0.8 | 9.4 | 0.7 | ||||||||||||||||||||||||||||||
|
Overdrafts
|
9.1 | 0.4 | 8.6 | 0.4 | 13.4 | 0.7 | 11.1 | 0.7 | 9.8 | 0.8 | ||||||||||||||||||||||||||||||
|
Total commercial
|
1,117.3 | 48.4 | 1,138.3 | 52.1 | 1,062.4 | 56.5 | 898.9 | 55.3 | 748.7 | 58.6 | ||||||||||||||||||||||||||||||
|
Consumer
|
||||||||||||||||||||||||||||||||||||||||
|
Credit cards
|
111.6 | 4.8 | 90.7 | 4.2 | 93.1 | 5.0 | 95.0 | 5.8 | 54.6 | 4.3 | ||||||||||||||||||||||||||||||
|
Personal loans
|
367.0 | 15.9 | 488.0 | 22.3 | 473.3 | 25.2 | 378.3 | 23.3 | 205.0 | 16.0 | ||||||||||||||||||||||||||||||
|
Automobile and vehicle loans
|
285.9 | 12.4 | 65.7 | 3.0 | 69.2 | 3.7 | 61.2 | 3.8 | 28.2 | 2.2 | ||||||||||||||||||||||||||||||
|
Overdrafts
|
6.4 | 0.3 | 5.3 | 0.2 | 7.4 | 0.4 | 8.1 | 0.5 | 5.1 | 0.4 | ||||||||||||||||||||||||||||||
|
Loans funded by development banks
|
– | – | – | – | – | – | – | – | – | – | ||||||||||||||||||||||||||||||
|
General purpose loans
|
9.3 | 0.4 | 8.9 | 0.4 | 10.3 | 0.5 | 13.8 | 0.8 | 7.6 | 0.6 | ||||||||||||||||||||||||||||||
|
Working capital loans
|
– | – | – | – | – | – | – | – | – | – | ||||||||||||||||||||||||||||||
|
Total consumer
|
780.3 | 33.8 | 658.6 | 30.2 | 653.3 | 34.7 | 556.5 | 34.2 | 300.5 | 23.5 | ||||||||||||||||||||||||||||||
|
Microcredit
|
10.3 | 0.4 | 13.1 | 0.6 | 12.4 | 0.7 | 9.0 | 0.6 | 5.3 | 0.4 | ||||||||||||||||||||||||||||||
|
Mortgages
|
16.3 | 0.7 | 15.6 | 0.7 | 23.3 | 1.2 | 29.4 | 1.8 | 29.2 | 2.3 | ||||||||||||||||||||||||||||||
|
Financial leases
|
158.6 | 6.9 | 142.9 | 6.5 | 117.1 | 6.2 | 119.8 | 7.4 | 87.7 | 6.9 | ||||||||||||||||||||||||||||||
|
General
|
10.3 | 0.4 | 9.1 | 0.4 | 12.7 | 0.7 | 12.2 | 0.7 | 106.8 | 8.4 | ||||||||||||||||||||||||||||||
|
Total domestic
|
2,093.0 | 90.7 | 1,977.6 | 90.6 | 1,881.2 | 100.0 | 1,625.8 | 100.0 | 1,278.2 | 100.1 | ||||||||||||||||||||||||||||||
|
Foreign
|
||||||||||||||||||||||||||||||||||||||||
|
Commercial
|
||||||||||||||||||||||||||||||||||||||||
|
General purpose loans
|
50.1 | 2.2 | 62.6 | 2.9 | – | – | – | – | – | – | ||||||||||||||||||||||||||||||
|
Loans funded by development banks
|
– | – | – | – | – | – | – | – | – | – | ||||||||||||||||||||||||||||||
|
Working capital loans
|
12.7 | 0.6 | 9.1 | 0.4 | – | – | – | – | – | – | ||||||||||||||||||||||||||||||
|
Credit cards
|
– | – | – | – | – | – | – | – | – | – | ||||||||||||||||||||||||||||||
|
Overdrafts
|
1.0 | – | 5.7 | 0.3 | – | – | – | – | – | – | ||||||||||||||||||||||||||||||
|
Total commercial
|
63.8 | 2.8 | 77.4 | 3.5 | – | – | – | – | – | – | ||||||||||||||||||||||||||||||
|
Consumer
|
||||||||||||||||||||||||||||||||||||||||
|
Credit cards
|
107.4 | 4.7 | 94.6 | 4.3 | – | – | – | – | – | – | ||||||||||||||||||||||||||||||
|
Personal loans
|
7.4 | 0.3 | 4.1 | 0.2 | – | – | – | – | – | – | ||||||||||||||||||||||||||||||
|
Automobile and vehicle loans
|
5.4 | 0.2 | 5.3 | 0.2 | – | – | – | – | – | – | ||||||||||||||||||||||||||||||
|
Overdrafts
|
2.1 | 0.1 | – | – | – | – | – | – | – | – | ||||||||||||||||||||||||||||||
|
Loans funded by development banks
|
– | – | – | – | – | – | – | – | – | – | ||||||||||||||||||||||||||||||
|
General purpose loans
|
– | – | – | – | – | – | – | – | – | – | ||||||||||||||||||||||||||||||
|
Working capital loans
|
– | – | – | – | – | – | – | – | – | – | ||||||||||||||||||||||||||||||
|
Total consumer
|
122.3 | 5.3 | 104.0 | 4.8 | – | – | – | – | – | – | ||||||||||||||||||||||||||||||
|
Microcredit
|
– | – | – | – | – | – | – | – | – | – | ||||||||||||||||||||||||||||||
|
Mortgages
|
24.7 | 1.1 | 23.5 | 1.1 | – | – | – | – | – | – | ||||||||||||||||||||||||||||||
|
Financial leases
|
2.7 | 0.1 | 1.4 | 0.1 | – | – | – | – | – | – | ||||||||||||||||||||||||||||||
|
General
|
– | – | – | – | – | – | – | – | – | – | ||||||||||||||||||||||||||||||
|
Total foreign
|
213.5 | 9.3 | 206.3 | 9.4 | – | – | – | – | – | – | ||||||||||||||||||||||||||||||
|
Total allowance for loan and financial lease losses
|
2,306.5 | 100.0 | 2,183.9 | 100.0 | 1,881.1 | 100.0 | 1,625.8 | 100.0 | 1,278.2 | 100.0 | ||||||||||||||||||||||||||||||
Charge-offs
The following table presents the allocation of our charge-offs by type of loan for the years ended December 31, 2011, 2010, 2009, 2008 and 2007.
|
Year ended December 31,
|
||||||||||||||||||||
|
2011
|
2010
|
2009
|
2008
|
2007
|
||||||||||||||||
|
(in Ps billions)
|
||||||||||||||||||||
|
Domestic
|
||||||||||||||||||||
|
Commercial and consumer
|
||||||||||||||||||||
|
General purpose loans
|
138.0 | 166.7 | 130.5 | 85.2 | 61.8 | |||||||||||||||
|
Loans funded by development banks
|
5.5 | 8.8 | 7.0 | 5.9 | 1.8 | |||||||||||||||
|
Working capital loans
|
31.1 | 34.7 | 11.2 | 5.6 | 2.3 | |||||||||||||||
|
Credit cards
|
73.0 | 80.3 | 89.6 | 63.4 | 45.6 | |||||||||||||||
|
Personal loans
|
193.5 | 257.7 | 232.6 | 172.8 | 122.0 | |||||||||||||||
|
Automobile and vehicle loans
|
37.5 | 50.6 | 41.8 | 16.0 | 4.0 | |||||||||||||||
|
Overdrafts
|
6.7 | 12.4 | 9.0 | 8.7 | 4.7 | |||||||||||||||
|
Total commercial and consumer
|
485.2 | 611.2 | 521.6 | 357.5 | 242.4 | |||||||||||||||
|
Microcredit
|
11.6 | 12.0 | 6.0 | 1.9 | 0.5 | |||||||||||||||
|
Mortgages and other
|
0.6 | 11.4 | 2.6 | 2.8 | 0.9 | |||||||||||||||
|
Financial leases
|
14.2 | 25.5 | 28.1 | 7.6 | 3.3 | |||||||||||||||
|
Total domestic
|
511.6 | 660.1 | 558.2 | 369.8 | 247.1 | |||||||||||||||
|
Foreign
|
||||||||||||||||||||
|
Commercial and consumer
|
||||||||||||||||||||
|
General purpose loans
|
17.6 | 1.8 | – | – | – | |||||||||||||||
|
Loans funded by development banks
|
– | – | – | – | – | |||||||||||||||
|
Working capital loans
|
6.2 | 1.1 | – | – | – | |||||||||||||||
|
Credit cards
|
117.4 | 12.8 | – | – | – | |||||||||||||||
|
Personal loans
|
7.4 | 0.7 | – | – | – | |||||||||||||||
|
Automobile and vehicle loans
|
2.8 | 0.4 | – | – | – | |||||||||||||||
|
Overdrafts
|
5.0 | – | – | – | – | |||||||||||||||
|
Total commercial and consumer
|
156.5 | 16.8 | – | – | – | |||||||||||||||
|
Microcredit
|
– | – | – | – | – | |||||||||||||||
|
Mortgages and other
|
8.1 | 0.2 | – | – | – | |||||||||||||||
|
Financial leases
|
0.5 | 0.5 | – | – | – | |||||||||||||||
|
Total foreign
|
165.1 | 17.5 | – | – | – | |||||||||||||||
|
Total charge-offs
|
676.7 | 677.6 | 558.2 | 369.8 | 247.1 | |||||||||||||||
The ratio of charge-offs to average outstanding loans for the periods indicated was as follows.
|
Year ended December 31,
|
||||||||||||
|
2011
|
2010
|
2009
|
||||||||||
|
(in percentages)
|
||||||||||||
|
Ratio of charge-offs to average outstanding loans
|
1.1 | % | 1.5 | % | 1.4 | % | ||||||
Loans are subject to charge-offs when all possible collection mechanisms have been exhausted and when they are one hundred percent (100%) provisioned.
Charge-offs do not, however, eliminate the bank’s obligation to continue to engage in collection efforts to accomplish recovery. The recovery of charged-off loans is accounted for in our consolidated statements of income.
The board of directors of each of our banks is the only administrative body with legal authority to approve charge-offs of transactions deemed uncollectable. The recovery of charged-off loans is accounted for as income in our consolidated statement of income.
Potential problem loans
In order to carefully monitor the credit risk associated with clients, we have established a committee that meets monthly to identify potential problem loans, which are then included on a watch list. In general, these are loans issued to clients that could face difficulties in the future repayment of their obligations, but who have had a good payment record with us in the past. These potential difficulties could be related to factors such as a decline in economic activity, financial weakness or any other event that could affect the client’s business. Our banks also monitor the credit risk associated with these clients.
Potential problem loans are primarily those classified as “B” under the Superintendency of Finance’s credit classification and provisioning guidelines. See “Item 11. Quantitative and Qualitative Disclosures About Risk—Risk management—Credit classification and provisioning.” At December 31, 2011, Ps 2,089.8 billion, or 3.0% of our subsidiaries’ loans were classified as potential problem loans under these guidelines.
Separately, we also monitor loans granted by our banks to a single borrower where we have an aggregate exposure of Ps 2.0 billion.
Cross-border outstanding loans and investments
We do not have any cross-border outstanding loans and investments to a borrower in any country that exceeded 0.75% of our total assets. The following table presents information with respect to our cross-border outstanding loans and investments, at December 31, 2011, 2010 and 2009. See “—Loan portfolio” above for a description of cross-border outstandings by type of foreign borrower.
|
At December 31,
|
||||||||||||
|
2011
|
2010
|
2009
|
||||||||||
|
(in Ps billions)
|
||||||||||||
|
Loans
|
||||||||||||
|
Commercial
|
||||||||||||
|
Costa Rica
|
956.0 | 647.7 | 4.2 | |||||||||
|
El Salvador
|
520.4 | 436.5 | – | |||||||||
|
Guatemala
|
337.7 | 266.8 | 5.5 | |||||||||
|
Honduras
|
934.6 | 902.3 | – | |||||||||
|
Nicaragua
|
704.2 | 586.5 | – | |||||||||
|
Panama
|
350.0 | 257.6 | 19.2 | |||||||||
|
Consumer
|
||||||||||||
|
Costa Rica
|
423.7 | 296.7 | – | |||||||||
|
El Salvador
|
174.8 | 150.7 | – | |||||||||
|
Guatemala
|
79.5 | 58.4 | – | |||||||||
|
Honduras
|
158.6 | 139.2 | – | |||||||||
|
Nicaragua
|
138.0 | 112.8 | – | |||||||||
|
Panama
|
602.3 | 537.9 | – | |||||||||
|
Financial Leases
|
||||||||||||
|
Costa Rica
|
195.9 | 154.2 | – | |||||||||
|
El Salvador
|
16.4 | 20.7 | – | |||||||||
|
Guatemala
|
9.6 | 0.3 | – | |||||||||
|
Honduras
|
4.1 | 0.8 | – | |||||||||
|
Nicaragua
|
3.8 | 0.6 | – | |||||||||
|
Panama
|
49.4 | 28.1 | – | |||||||||
|
Mortgages
|
||||||||||||
|
Costa Rica
|
1,235.9 | 1,140.9 | – | |||||||||
|
El Salvador
|
530.1 | 526.1 | – | |||||||||
|
Guatemala
|
512.7 | 505.4 | – | |||||||||
|
Honduras
|
474.1 | 430.1 | – | |||||||||
|
Nicaragua
|
170.8 | 165.8 | – | |||||||||
|
Panama
|
493.4 | 392.5 | – | |||||||||
|
At December 31,
|
||||||||||||
|
2011
|
2010
|
2009
|
||||||||||
|
(in Ps billions)
|
||||||||||||
|
Credit Cards
|
||||||||||||
|
Costa Rica
|
827.9 | 781.2 | – | |||||||||
|
El Salvador
|
417.7 | 420.1 | – | |||||||||
|
Guatemala
|
407.1 | 331.3 | – | |||||||||
|
Honduras
|
388.4 | 346.7 | – | |||||||||
|
Nicaragua
|
201.2 | 179.2 | – | |||||||||
|
Panama
|
394.3 | 314.8 | – | |||||||||
|
Unearned Income
|
||||||||||||
|
Costa Rica
|
– | – | – | |||||||||
|
El Salvador
|
– | – | – | |||||||||
|
Guatemala
|
– | – | – | |||||||||
|
Honduras
|
– | – | – | |||||||||
|
Nicaragua
|
– | – | – | |||||||||
|
Panama
|
– | – | – | |||||||||
|
Total per country
|
||||||||||||
|
Costa Rica
|
3,639.4 | 3,020.7 | 4.2 | |||||||||
|
El Salvador
|
1,659.4 | 1,554.1 | – | |||||||||
|
Guatemala
|
1,346.6 | 1,162.2 | 5.5 | |||||||||
|
Honduras
|
1,959.8 | 1,819.1 | – | |||||||||
|
Nicaragua
|
1,218.0 | 1,044.9 | – | |||||||||
|
Panama
|
1,889.4 | 1,530.9 | 19.2 | |||||||||
|
Investments
|
||||||||||||
|
Australia
|
279.0 | 4.2 | – | |||||||||
|
Brazil
|
136.9 | 110.4 | 154.1 | |||||||||
|
British Virgin Islands
|
– | 7.5 | 8.7 | |||||||||
|
Barbados
|
– | – | – | |||||||||
|
Canada
|
10.3 | 100.4 | 90.4 | |||||||||
|
Cayman Islands
|
120.9 | 162.9 | 152.7 | |||||||||
|
Chile
|
49.9 | 53.3 | 18.7 | |||||||||
|
Costa Rica
|
372.3 | 315.2 | 5.5 | |||||||||
|
El Salvador
|
23.2 | 28.2 | – | |||||||||
|
France
|
– | – | – | |||||||||
|
Germany
|
14.2 | 21.9 | 4.1 | |||||||||
|
Guatemala
|
– | 121.7 | – | |||||||||
|
Honduras
|
32.6 | 182.5 | – | |||||||||
|
Mexico
|
40.6 | 16.0 | 41.3 | |||||||||
|
Netherlands
|
– | – | 10.5 | |||||||||
|
Nicaragua
|
5.5 | 2.0 | – | |||||||||
|
Panama
|
116.8 | 184.2 | 140.9 | |||||||||
|
Peru .
|
46.7 | 0.4 | – | |||||||||
|
Spain
|
- | 14.3 | 13.0 | |||||||||
|
United Kingdom
|
13.9 | 11.6 | – | |||||||||
|
United States of America
|
441.4 | 597.0 | 38.2 | |||||||||
|
BAC San José Liquid Fund (
BAC San José Fondo líquido – Riesgo País Mixto)
|
– | 3.9 | – | |||||||||
|
Multilateral – Bank Information Center (
Centro de información sobre la banca
)
|
4.0 | 4.0 | – | |||||||||
|
Multilateral – Andean Development Corporation (
Corporación Andina de Fomento
)
|
18.3 | 37.7 | 24.9 | |||||||||
|
Multilateral – Central American Bank for Economic Integration
|
46.8 | 35.4 | 6.0 | |||||||||
|
Multilateral – Latin America Reserve Fund (
Fondo Latinoamericano de Reservas
)
|
– | – | 37.3 | |||||||||
|
Total investments
|
1,773.2 | 2,014.6 | 745.8 | |||||||||
Deposits
The principal components of our deposits are customer demand (checking and saving accounts) and time deposits. Our retail customers are the principal source of our demand and time deposits. The following table presents the composition of our deposits at December 31, 2011, 2010 and 2009.
|
At December 31,
|
||||||||||||
|
2011
|
2010
|
2009
|
||||||||||
|
(in Ps billions)
|
||||||||||||
|
Domestic
|
||||||||||||
|
Interest-bearing deposits:
|
||||||||||||
|
Checking accounts
|
2,505.1 | 1,604.5 | 1,629.3 | |||||||||
|
Time deposits
|
18,383.4 | 14,459.4 | 16,144.2 | |||||||||
|
Savings deposits
|
25,441.8 | 23,857.8 | 21,313.7 | |||||||||
|
Total
|
46,330.3 | 39,921.7 | 39,087.2 | |||||||||
|
Non-interest-bearing deposits:
|
||||||||||||
|
Checking accounts
|
11,450.2 | 11,224.0 | 9,511.2 | |||||||||
|
Other deposits (1)
|
866.5 | 834.5 | 750.1 | |||||||||
|
Total
|
12,316.7 | 12,058.5 | 10,261.3 | |||||||||
|
Total domestic deposits
|
58,647.0 | 51,980.2 | 49,348.5 | |||||||||
|
Foreign
|
||||||||||||
|
Interest-bearing deposits:
|
||||||||||||
|
Checking accounts
|
4,662.7 | 4,586.6 | – | |||||||||
|
Time deposits
|
4,247.1 | 4,155.6 | – | |||||||||
|
Savings deposits
|
2,470.2 | 2,163.4 | – | |||||||||
|
Total
|
11,380.0 | 10,905.7 | – | |||||||||
|
Non-interest-bearing deposits:
|
||||||||||||
|
Checking accounts
|
799.8 | 637.2 | – | |||||||||
|
Other deposits (1)
|
180.8 | 146.2 | – | |||||||||
|
Total
|
980.6 | 783.4 | – | |||||||||
|
Total foreign deposits
|
12,360.6 | 11,689.1 | – | |||||||||
|
Total deposits
|
71,007.6 | 63,669.3 | 49,348.5 | |||||||||
|
(1)
|
Consists of deposits from correspondent banks, cashier checks and collection services.
|
The following table presents time deposits, by amount and maturity, at December 31, 2011.
|
At December 31, 2011
|
||||||||||||
|
Peso-denominated
|
Foreign currency-denominated
|
Total
|
||||||||||
|
(in Ps billions)
|
||||||||||||
|
Domestic
|
||||||||||||
|
Up to 3 months
|
3,607.4 | 1,906.0 | 5,513.4 | |||||||||
|
From 3 to 6 months
|
1,878.0 | 329.9 | 2,208.0 | |||||||||
|
From 6 to 12 months
|
4,114.2 | 512.9 | 4,627.1 | |||||||||
|
More than 12 months
|
3,404.2 | 133.5 | 3,537.7 | |||||||||
|
Time deposits less than U.S.$100,000 (1)
|
2,317.7 | 179.5 | 2,497.3 | |||||||||
|
Total domestic
|
15,321.5 | 3,061.9 | 18,383.4 | |||||||||
|
Foreign (2)
|
– | 4,247.1 | 4,247.1 | |||||||||
|
Total
|
15,321.5 | 7,309.0 | 22,630.5 | |||||||||
|
(1)
|
U.S.$100,000 is the equivalent of Ps 194,270,000 (translated at the representative market rate of Ps 1,942.70 to U.S.$1.00 at December 31, 2011).
|
|
(2)
|
Represents operations outside of Colombia.
|
Return on equity and assets
The following table presents certain selected financial ratios for the periods indicated.
|
At December 31,
|
||||||||||||
|
2011
|
2010
|
2009
|
||||||||||
|
(in percentages)
|
||||||||||||
|
ROAA:
Return on average total assets (1)
|
2.3 | 2.2 | 3.2 | |||||||||
|
ROAE:
Return on average shareholders’ equity (2)
|
20.3 | 22.2 | 29.2 | |||||||||
|
Average shareholders’ equity as a percentage of average total assets
|
5.3 | 5.4 | 5.9 | |||||||||
|
Period-end shareholders’ equity and non-controlling interest as a percentage of period-end total assets
|
11.7 | 9.4 | 11.4 | |||||||||
|
Dividend payout ratio (3)
|
61.2 | 54.9 | 43.5 | |||||||||
|
(1)
|
For methodology used to calculate ROAA, see note (2) to the table under “Item 3. Key Information—A. Selected financial data—Other financial and operating data.”
|
|
(2)
|
For methodology used to calculate ROAE, see note (3) to the table under “Item 3. Key Information—A. Selected financial data—Other financial and operating data.”
|
|
(3)
|
Dividend payout ratio (dividends declared per share divided by net income per share).
|
Short-term borrowings
The following table presents our short-term borrowings, consisting of interbank and overnight funds, for the periods indicated.
|
At December 31,
|
||||||||||||||||||||||||
|
2011
|
2010
|
2009
|
||||||||||||||||||||||
|
Amount
|
Nominal rate
|
Amount
|
Nominal rate
|
Amount
|
Nominal rate
|
|||||||||||||||||||
|
(in Ps billions, except percentages)
|
||||||||||||||||||||||||
|
Short-term borrowings
|
||||||||||||||||||||||||
|
Interbank borrowings and overnight funds
|
||||||||||||||||||||||||
|
End of period
|
3,225.1 | – | 2,477.4 | – | 2,753.7 | – | ||||||||||||||||||
|
Average during period
|
4,279.6 | 3.4 | % | 3,955.4 | 2.5 | % | 2,377.7 | 4.7 | % | |||||||||||||||
|
Maximum amount of borrowing at any month-end
|
5,977.3 | – | 6,884.8 | – | 3,619.1 | – | ||||||||||||||||||
|
Interest paid during the period
|
146.9 | – | 99.0 | – | 111.7 | – | ||||||||||||||||||
Industry
Colombia
Prior to the 1990s, Colombia’s financial system consisted of a large number of specialized entities, which focused on specific areas of finance and the majority of which were separately regulated. However, following the enactment of a series of laws promoting the deregulation of the financial system, including the enactment of Law 45 of 1990, Law 35 of 1993 and Decree 663 of 1993, as amended (
Estatuto Orgánico del Sistema Financiero
), or “EOSF,” the financial system transformed from a system consisting of several smaller financial institutions providing a limited set of services to a system consisting of several large financial conglomerates with multiple capabilities within the same organization.
The economic crisis of the late 1990s affected most countries in Latin America, including Colombia. Many financial companies were acquired by large commercial banks, while others were nationalized or liquidated. In the aftermath of the crisis and partly as a result of it, the foundation for the current Colombian financial system was developed with the establishment of solid regulatory principles and strengthened financial groups operating under a single regulatory framework.
In recent years, the financial system in Colombia has continued the consolidation process, leading to relatively high merger and acquisition activity since 2005, particularly between 2005 and 2010: the merger of Corporación Nacional de Ahorro y Vivienda S.A., or “Conavi,” Corporación Financiera Nacional y Suramericana S.A., or “Corfinsura,” and Bancolombia; the acquisition of Banco Aliadas S.A. by Banco de Occidente; the merger of Banco Tequendama S.A. and Banco GNB Sudameris S.A.; the merger of Banco Colmena S.A. and Banco Caja Social S.A. to form BCSC S.A.; the acquisition of Bansuperior S.A. by Davivienda; the acquisition of Banco Granahorrar S.A. by BBVA Colombia; and the acquisition of Banco Unión Colombiano S.A. by Banco de Occidente. Also, during 2006, Banco de Bogotá acquired Megabanco and Davivienda acquired Gran Banco – Bancafé S.A. In 2007, Bancolombia completed the acquisition of Banagrícola in El Salvador, and in 2008, ABN AMRO Bank Colombia S.A. became Royal Bank of Scotland (Colombia) S.A. following the acquisition of ABN AMRO Bank NV by a consortium led by Royal Bank of Scotland, Fortis and Banco Santander S.A. Also, in 2008, General Electric Money purchased a 49.7% stake in Banco Colpatria. In 2010, Scotiabank acquired Royal Bank of Scotland (Colombia) S.A., and five financing companies merged with their respective commercial banks (BBVA Leasing, Leasing Popular, Leasing de Occidente, Leasing Bogotá, and Helm Leasing). In 2011, Scotiabank agreed to acquire a 51% stake in Banco Colpatria, which was approved by the Superintendency of Finance, and Banco Santander S.A. agreed to sell Banco Santander Colombia S.A. to Corpbanca S.A., a Chilean financial services company. Banco WWB S.A., Banco Coomeva S.A., Banco Finandina S.A., Banco Falabella S.A. and Banco Pichincha S.A. entered the banking market in Colombia.
Various banking institutions, which have recently been incorporated in Colombia, target the microcredit and small and medium enterprises segments. These institutions include Banco de las Microfinanzas-Bancamía S.A., Banco WWB S.A. and Banco Coomeva S.A., as well as two new financial corporations, JP Morgan Corporación Financiera S.A. and BNP Paribas Colombia Corporación Financiera S.A., which are local subsidiaries of international financial institutions. The business of these new credit institutions may affect our market position in the individual, small and medium enterprises and merchant banking segments.
While the Colombian government has been promoting consolidation and expansion of the scope of activities of Colombian financial institutions, it has simultaneously been strengthening corporate governance, risk management and supervision. See “—Supervision and regulation.”
Banking system during the recent global economic and financial crisis
Following the bankruptcy of Lehman Brothers in September 2008, international financial markets faced extraordinary levels of volatility. Colombia’s financial system was comparatively less vulnerable to the effects of the global economic and financial crisis due to a combination of factors, including high capitalization ratios, lack of exposure to complex financial products such as credit default swaps and collateralized debt obligations, and a strong foundation of domestic deposits with little dependence on capital markets or external funding (approximately 3% of liabilities were denominated in foreign currency). Overall, the Colombian banking system benefited from these factors and from the Colombian Central Bank’s ability to adopt a countercyclical monetary policy. In the aftermath of the global crisis, the system’s profitability measures remained stable.
Recent growth of financial sector
From a macroeconomic perspective, the Colombian financial sector has been one of the primary engines of economic growth in the country in recent years. According to DANE, GDP of the financial sector comprising financial intermediation, insurance and other related services, grew at a CAGR of 7.6% in the five-year period from 2007 to 2011 in real terms, 3.3 percentage points above that of annual growth of total GDP during the same period. Economic stability, improvements in security conditions, increased employment rates and enhanced purchasing power on the part of the Colombian population have contributed to an increase in the penetration of financial services. According to DANE, Colombian real GDP per capita grew by 16.9% in the five-year period ending in 2011. Also, prior to the recent global financial crisis, Colombia’s unemployment rate had been falling consistently during the previous five-year period from an annual average of 11.8% in 2005 to a minimum of 11.0% by mid-2008, before rising to 11.8% in 2010. At December 31, 2011, Colombia’s annual average unemployment rate decreased to 10.8%. At the same time, deposits in the banking system grew an aggregate 55% in real terms 91.5% in nominal terms) during the five-year period ending in 2011 as adjusted to include deposit growth of the five financing companies that merged with commercial banks during 2010 (BBVA Leasing S.A., Leasing Popular S.A., Leasing de Occidente S.A., Leasing Bogotá S.A. and Helm Leasing S.A.), and the three financing companies and the cooperative bank that converted to commercial banks during 2011 (Banco Pichincha S.A., Banco Falabella S.A., Banco Finandina S.A. and Bancoomeva S.A.).
The following charts present the sector evolution and annual growth of total GDP and GDP of the financial sector for the periods indicated.

Credit volumes
Credit volumes in Colombia have grown steadily since 2004. Despite this increase in lending, the Colombian market still has a relatively low credit penetration rate as compared to that of other developed and emerging market countries. The following chart presents domestic credit to the private sector as a percentage of GDP of specified countries at December 31, 2010.
Domestic credit to private sector / GDP
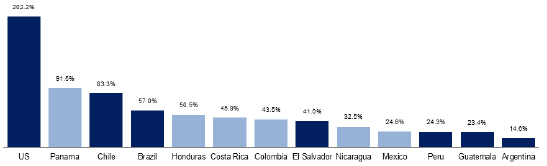
Source: 2011 World Bank Development Indicators. Data at December 31, 2010. Domestic credit to private sector refers to financial resources provided to the private sector, which may include, among others, loans, purchases of non-equity securities, and trade credits and other accounts receivable, that establish a claim for repayment. For some countries these claims include credit to public enterprises.
Domestic credit to the private sector as a percentage of GDP, as defined by the World Bank Development Indicators, refers to financial resources provided to the private sector, such as through loans, purchases of non-equity securities, and trade credits and other accounts receivable, that establish a claim for repayment. This metric encompasses a broad range of entities that provide credit, and is not limited to banking institutions. It is widely used for comparison purposes across countries due to its reliability and homogeneity. The World Bank Development Indicators cover 216 countries from 1960 to 2010.
Credit provided exclusively by banking institutions is used to refer to bank intermediation, as it is the main business of Banco de Bogotá. Specifically, when referring to bank credit penetration, bank credit refers to gross loans and leasing operations provided by commercial banks in Colombia, according to data from the Superintendency of Finance, and GDP refers to nominal GDP in Colombian pesos, according to data from DANE. We believe these metrics, and the calculation resulting therefrom, reflect more appropriately Colombia’s domestic credit-to-GDP situation and render a 29.3% and 32.5% ratio for the years ended December 31, 2010 and 2011, respectively.
The Colombian bank credit market consists of the extension of loans to individuals and corporations through four main business lines: commercial, consumer, microcredit and mortgage. According to the Superintendency of Finance, at December 31, 2011, a total of Ps 200.3 trillion (U.S.$103.1 billion) of gross loans granted by Colombian banks were outstanding, of which 61.2% were commercial loans, 28.1% were consumer loans, 7.7% were mortgages and 2.7% were microcredit loans.
Gross bank loans in the Colombian banking sector as a percentage of GDP also increased in the past five years from 24.6% in 2007 to 32.5% in the year ended December 31, 2011. The following chart presents bank credit as a percentage of GDP over the last fifteen years.

Source: Company estimates, based on DANE and Superintendency of Finance. Data shown starts in 1996 in order to capture the negative effect that the economic crisis of the late 1990s had on bank credit penetration. GDP series used are those of 2005 as the base year, and nominal GDP prior to 2000 is calculated by applying reported nominal growth to the 2005 series. Previously, these ratios were calculated using the GDP series of 2000 as base year, which was discontinued by DANE in 2010 and replaced by the GDP series of 2005 as base year.
Although loan quality and loan loss coverage ratios deteriorated between 2007 and mid-2009 as a result of the economic slowdown preceding the global crisis, overall loan quality and coverage ratios have improved significantly during the last ten years in Colombia. The following charts illustrate this trend and present non-performing loans as a percentage of total loans and the loan loss coverage ratio from December 2001 to December 2011.
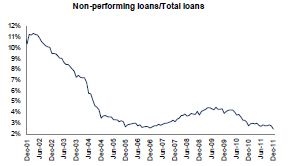
|

|
Colombia’s banking system is well capitalized, with an average risk-based capital ratio of 14.2% at December 31, 2011, significantly above the minimum regulatory requirement of 9.0%. The capital-to-total assets ratio and the risk-based capital ratio have increased since 2005: the former currently exceeds that of comparable countries in Latin America, while the latter is at a level similar to that of Chile and Peru. The following charts present capital as a percentage of risk-weighted assets, and capital as a percentage of total assets over the five-year period from 2005 to 2010 for the banking sector in Brazil, Colombia, Chile, Peru and Mexico.


At the same time, the profitability of the financial sector improved significantly during the first half of the decade starting in 2000 and remained relatively stable in the second half of the decade, including during the global economic and financial crisis. The following charts present ROAA and ROAE for the Colombian financial sector from December 2000 to December 2011.

|

|
The following charts present ROAA and ROAE over the five-year period from 2005 to 2010 for the banking sector in Brazil, Colombia, Chile, Peru and Mexico.
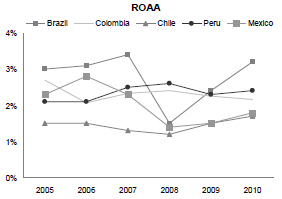

Main market participants
According to the Superintendency of Finance, at December 31, 2011, the principal participants in the Colombian financial system were the Colombian Central Bank, 23 commercial banks (fifteen domestic banks, seven subsidiaries of foreign institutions and one bank owned by the Colombian government), 20 financing companies and four finance corporations. In addition, trust companies, cooperatives, insurance companies, insurance brokerage firms, bonded warehouses, special state-owned institutions that provide credit to specific segments of the population who generally lack normal access to commercial and retail banking, and pension and severance pay funds also participate. For a description of the roles of these entities, see “—Supervision and regulation—Regulatory framework for Colombian financial institutions.” For information about our competitive position, see “—Competition.
Our principal competitors are Bancolombia, Davivienda and BBVA Colombia, which are the three leading banking groups in Colombia after Grupo Aval. International players active in the Colombian market include Banco Santander Colombia S.A. (in the process of being acquired by Corpbanca S.A.), Banco Bilbao Vizcaya Argentaria Colombia, S.A., Citibank-Colombia S.A., HSBC Colombia S.A. and Scotiabank-Colombia S.A.
Recent developments in the Colombian stock market
Colombia’s stock market has been one of the top performers worldwide following the global economic and financial crisis of 2008. The Colombian Stock Market Index (
Indice General de la Bolsa de Colombia
), or “IGBC,” decreased 18.3% in 2011, and increased 53.5% in 2009 and 33.6% in 2010, after falling 29.3% in 2008. Colombia’s stock market capitalization stood at Ps 404.0 trillion (U.S.$208.4 billion) at December 31, 2011. Simultaneously, the daily average trading volume in the stock market increased to Ps 162.6 billion (U.S.$83.7 million) during 2011 from Ps 151.3 billion (U.S.$77.9 million) during 2010, an increase of 7.5%. During the first two months of 2012, the IGBC increased 17.9%, and the daily average trading volume in the stock market increased to Ps 223.8 billion (U.S.$123.1 million).
The increase in trading volumes and elevated returns until 2010 had been mainly driven by the following factors: (1) the expansionary monetary policy conducted by Colombia’s Central Bank, which cut its overnight lending rate by 700 bps to 3.0% from December 2008 until April 2010 (the lowest level ever recorded), and increased it moderately by 175 basis points to 4.75% until December 2011; (2) a sharp decline in global risk aversion since March 2009 through the end of 2010; (3) expectations of a healthy recovery in local economic activity since the second semester of 2009, which intensified during 2010 and 2011 due to the release of positive economic data suggesting a stronger recovery than initially expected by local authorities and analysts; and (4) a limited supply of local stock market securities to match a fast-growing demand. Despite stronger domestic economic activity, the worsening of the European sovereign debt crisis in 2011 had a significant adverse impact on equity markets worldwide including Colombian markets. However, the intervention announced by the European
Central Bank at the end of 2011 assisted in stabilizing financial markets, which prompted a strong rally in local equity markets during the first months of 2012.
Some of the main participants in the local stock market are the private pension fund managers, individual investors and brokerage firms (
Sociedades Comisionistas de Bolsa
). Private pension funds managed a portfolio of Ps 45.2 trillion (U.S.$23.3 billion) in equity securities, of which Ps 33 trillion (U.S.$17 billion) corresponded to the local stock market at December 31, 2011; equity securities represented 44.3% of total assets under management at December 31, 2011. The share of equity securities in private pension funds’ portfolios has increased substantially in recent years from an average of 23.8% in 2007, 28.1% in 2008 and 33.1% in 2009, to 46.4% at December 31, 2010 and 44.3% at December 31, 2011.
Private pension fund system
A private pension fund system came into operation in Colombia in 1994, and during the last decade the scope of permissible activity by pension funds has expanded. The pension system consists of a government-sponsored defined public benefit plan, or “RPM,” currently administered by the Colombian Pension Service, Colpensiones, (previously administered by the Colombian Institute of Social Security), and a defined contribution or individual savings system, or “RAIS,” administered by private pension fund administrators under the supervision of the Superintendency of Finance. Since its creation, RAIS has experienced significant growth and is now the principal pension system in Colombia (10 million of individual customers in RAIS, compared to 6.4 million in RPM, at December 31, 2011). We operate in the pension fund management markets of RAIS through Porvenir. For information about Porvenir’s competitive position, see “—Competition.” At December 31, 2011, there were six private pension and severance funds managing a total of Ps 121 trillion (U.S.$62.3 billion) in assets, consisting of Ps 103.8 trillion (U.S.$52.5 billion) in mandatory pension fund assets; Ps 11.5 trillion (U.S.$5.9 billion) in voluntary pension funds’ assets; and Ps 5.7 trillion (U.S.$2.9 billion) in severance assets. For information about the main participants in the Colombian RAIS pension sector and our market share and position in the pension fund market, see “—Competition.”
Colombia has high-growth potential in the individual savings pension regime due to (1) the low average age of individual customers (34 years); (2) the current penetration levels of pension plans (approximately 80% of the employed population at December 31, 2011 participated in either a government-sponsored or a private pension scheme); and (3) the recent trend of individual customers investing in private pension funds, such as Porvenir, instead of the government-sponsored alternative (individual customers in RAIS increased from 7.8 million in 2007 to 8.6 million in 2008, 8.7 million in 2009, 9.3 million in 2010 and 10 million as of December 31, 2011, while individual customers in RPM increased from 6.1 million in 2007 to 6.2 million in 2008 before leveling off at 6.4 million in 2009, 2010 and 2011).
Central America
We consider the Central American region to comprise Costa Rica, El Salvador, Guatemala, Honduras, Nicaragua and Panama. Central America presents a market with similar characteristics to that of Colombia and with growth potential in financial services.
At December 31, 2011, Central America had a total estimated population of 43 million, making it the fourth-largest market in Latin America by population after Brazil (population of 195 million), Mexico (population of 110 million) and Colombia (population of 46 million) as reported by the IMF. At the same date, Central America posted an estimated combined GDP of U.S.$164 billion, ranking as the eighth-largest economy in Latin America after Brazil (nominal GDP of U.S.$2,518 billion), Mexico (nominal GDP of U.S.$1,185 billion), Argentina (nominal GDP of U.S.$435 billion), Venezuela (nominal GDP of U.S.$310 billion), Colombia (nominal GDP of U.S.$322 billion), Chile (nominal GDP of U.S.$243 billion) and Peru (nominal GDP of U.S.$169 billion). According to estimates prepared by the IMF, Central America’s GDP is expected to grow at an annual average rate of 4.2% between 2012 and 2014, compared to Colombia’s expected average growth rate of 4.5% during the same period.
The following table presents population and historical and projected GDP growth data for Central America.
|
Costa Rica
|
El Salvador
|
Guatemala
|
Honduras
|
Nicaragua
|
Panama
|
Total Central America(1)
|
||||||||||||||||||||||
|
2011 population (millions) estimated
|
4.7 | 5.9 | 14.7 | 8.2 | 5.9 | 3.6 | 43.0 | |||||||||||||||||||||
|
2011 nominal GDP (U.S.$ billions)
|
40.0 | 22.6 | 46.7 | 17.3 | 7.1 | 30.2 | 163.9 | |||||||||||||||||||||
|
2011 GDP per capita (U.S.$)
|
8,489 | 3,831 | 3,177 | 2,105 | 1,202 | 8,421 | 3,812 | |||||||||||||||||||||
|
CAGR real GDP 2001-2010
|
4.6 | % | 1.9 | % | 3.4 | % | 4.2 | % | 2.9 | % | 6.9 | % | 4.2 | % | ||||||||||||||
|
GDP growth 2012 expected
|
4.1 | % | 2.5 | % | 3.0 | % | 3.5 | % | 3.3 | % | 7.2 | % | 4.1 | % | ||||||||||||||
|
GDP growth 2013 expected
|
4.4 | % | 3.0 | % | 3.5 | % | 4.0 | % | 4.0 | % | 6.6 | % | 4.3 | % | ||||||||||||||
|
GDP growth 2014 expected
|
4.5 | % | 4.0 | % | 3.5 | % | 4.0 | % | 4.0 | % | 5.8 | % | 4.3 | % | ||||||||||||||
|
(1)
|
Reflects a GDP-weighted average of Costa Rica, El Salvador, Guatemala, Honduras, Nicaragua and Panama.
|
During the last several years, countries in the Central American region have increased their efforts to promote fiscal prudence and foreign investment. Countries such as Costa Rica, El Salvador, Guatemala and Nicaragua have signed agreements with the IMF under which governments receive credit, subject to adopting fiscal discipline in their economic policies.
Panama, capitalizing on its geographical advantage and the Panama Canal, a main continental connecting route, continues to be an important logistical hub and center for commerce and services within the region. In this context, the expansion of the Panama Canal, scheduled to be completed in 2014, is expected to positively affect the growth rate of the economy and strengthen Panama’s attractiveness within the region for foreign direct investment.
The Central American region offers a stable market that is expected to further converge towards an integrated economy as a result of the ongoing implementation of free-trade agreements. The United States–Dominican Republic–Central America Free Trade Agreement, or “DR-CAFTA,” gradually eliminates barriers to trade and investment among Costa Rica, El Salvador, Guatemala, Honduras Nicaragua, the Dominican Republic and the United States. The agreement allows the Central American region to access markets in the United States and establishes common regulatory standards among these countries. DR-CAFTA covers most types of trade and commercial exchange between these countries and the United States.
Central American financial services sector
Central America’s financial system has gone through two major phases of consolidation. In the early 2000s, local banks began expanding operations in their own markets through aggressive acquisition strategies, creating local financial groups. Notable examples include Grupo Financiero Cuscatlán’s acquisition of Lloyds TSB Group Plc’s operations in the region in 2004 and Banco de la Producción, S.A. (BANPRO)’s acquisition of Banco Caley Dagnall S.A. from Banco Agrícola S.A. in Nicaragua in March 2005. Following this period of internal consolidation and encouraged by the stability and growth prospects of the region, international banking groups began entering the region in 2004 through acquisitions in various jurisdictions, such as The Bank of Nova Scotia’s acquisition of El Salvador’s Banco de Comercio de El Salvador, S.A. in 2004, Costa Rica’s Banco Interfin S.A. in 2006, and Guatemala’s Banco de Antigua S.A. in 2008; GE Capital’s acquisition of a 49.99% stake in BAC Credomatic in 2005; Citigroup, Inc.’s merger of its Central American operations with Grupo Financiero Cuscatlán and Grupo Financiero Uno S.A. in 2006; and Grupo Financiero HSBC, S.A. de C.V.’s acquisition of Primer Banco del Istmo, S.A. (Banistmo) and Banco Salvadoreño, S.A. (Bancosal) in 2007. Other regional financial institutions have also acquired banks in Central America: Grupo Bancolombia acquired El Salvador’s Banco Agrícola in 2006, and Honduras’ Banco Industrial S.A. acquired Banco del País S.A. in 2007. Recently, in 2010 Banco de Bogotá acquired 100% of BAC Credomatic and in 2012 Banco Davivienda agreed to acquire HSBC’s operations in Costa Rica, El Salvador and Honduras.
The following chart sets forth the credit card market relative to the economically active population of selected economic regions, including Central America. Relative to other countries, the Central American credit card market has significant potential for expansion.
Credit card market / economically active population(1)
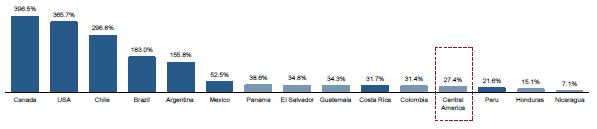
|
(1)
|
Calculated as the number of credit cards as a percentage of the economically active population, which comprises eligible individuals who either are employed or are actively seeking employment.
|
The chart below sets forth domestic credit to private sector as a percentage of GDP for Central America and selected countries.
Domestic credit to private sector / GDP
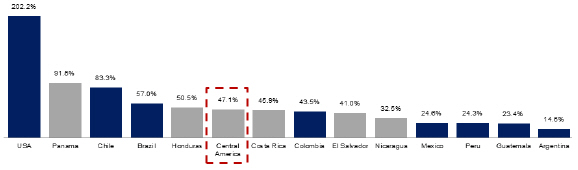
Supervision and regulation
Colombian banking regulators
Pursuant to the Colombian Constitution, Colombia’s Congress has the power to prescribe the general legal framework within which the government and other authorities may regulate the financial system. The Colombian Constitution also permits the Congress to authorize government intervention in the economy by statute. The agencies vested with the authority to regulate the financial system are the board of directors of the Colombian Central Bank, the Colombian Ministry of Finance and Public Credit, the Superintendency of Finance, the Superintendency of Industry and Commerce and the Securities Market Self-Regulatory Organization.
Central Bank
The Colombian Central Bank exercises the customary functions of a central bank, including price stabilization, legal currency issuance, regulation of currency circulation, credit and exchange rate monitoring and administration of international reserves. Its board of directors is the regulatory authority for monetary, currency exchange and credit policies, and is responsible for the direction and execution of the Colombian Central Bank duties. The Colombian Central Bank also acts as a last resort lender to financial institutions.
Pursuant to the Colombian Constitution, the Colombian Central Bank is autonomous and independent from the government in the formulation of monetary policy and currency exchange and credit policies. Specifically, the Colombian Constitution provides administrative, technical, budgetary and legal autonomy for the Colombian Central Bank and its board of directors in respect of monetary, credit and foreign exchange matters. The Colombian Central Bank reports to the National Congress. Its board of directors has seven members, one of whom is the Minister of Finance and Public Credit, one of whom is the General Manager of the Colombian Central Bank, and the other five, who are full-time employees, are appointed by the President of Colombia for four-year terms that can be extended.
Ministry of Finance and Public Credit
The Ministry of Finance designs, coordinates, regulates and executes economic policy, seeking to create an optimal administration of public finances for the economic and social development of the country. The Ministry of Finance regulates all aspects of finance, securities and insurance activities, pursuant to powers conferred by the Colombian Constitution. As part of its duties, the Ministry of Finance issues decrees related mainly to financial, taxation, customs, public credit and budgetary matters that may affect banking transactions in Colombia. In particular, the Ministry of Finance is responsible for regulations relating to financial institutions’ capital adequacy, risk limitations, authorized transactions, disclosure of information and accounting.
According to Decree 4172 of 2011, the “
Unidad Administrativa Especial, Unidad de Proyección Normativa y Estudios de Regulación Financiera
,” an independent unit of the Ministry of Finance is responsible for preparing and drafting any new financial regulation to be issued by the Ministry of Finance.
Superintendency of Finance
The Superintendency of Finance was created as a result of the merger between the Superintendency of Banking and the Superintendency of Securities in 2005. All of the powers and responsibilities of the former Superintendency of Banking and Superintendency of Securities were assigned to the newly created Superintendency of Finance.
The Superintendency of Finance is a technical entity affiliated with the Ministry of Finance that acts as the inspection, supervision and control authority of persons involved in financial, insurance and securities exchange activities, and any other operations related to the management, use or investment of resources collected from the public. The Superintendency of Finance is responsible for supervising the Colombian financial system with the purpose of preserving its stability and trustworthiness, as well as promoting, organizing and developing the Colombian securities market and protecting the users of financial and insurance services and investors in general.
Financial institutions must obtain the authorization of the Superintendency of Finance before commencing operations. In addition, all public offerings of securities require the prior approval of the Superintendency of Finance.
Violations of the financial system rules and regulations are subject to administrative and, in some cases, criminal sanctions. The Superintendency of Finance may inspect Colombian financial institutions on a discretionary basis and has the authority to impose fines on such institutions and their directors and officers for violations of Colombian laws or regulations, or such financial institutions’ by-laws.
The Superintendency of Finance exerts its supervisory powers over the financial sector on a consolidated and comprehensive basis. The consolidated supervision extends to all financial institutions including banks operating in Colombia and their subsidiaries abroad, in the latter case to the extent permitted by the laws of the respective country of incorporation. For these purposes, the Superintendency of Finance has executed several memorandums of understanding with foreign financial sector regulators, including the Superintendency of Banks of Panama and the Superintendency of the Financial System of El Salvador, and is currently negotiating the execution of additional memorandums of understanding with other financial regulators to promote an exchange of information and enhance its consolidated and comprehensive supervision.
According to Colombian law (Decree 2555 of 2010 and Basic Accounting Circular), and in order to facilitate the Superintendency of Finance’s supervision, financial institutions are required to consolidate the results of operations of all of their subsidiaries in order to present consolidated financial statements of the controlling entity and its subsidiaries, consolidated solvency ratios and capital adequacy requirements of the group. As Grupo Aval is not regulated as a financial institution or as a holding company of banking subsidiaries, it is not required to comply with these requirements; however, all of its financial subsidiaries are required to comply.
According to Article 48-1 of Decree 2080 of 2000, when granting authorizations to Colombian financial institutions to invest in foreign financial entities, the Superintendency of Finance must take into account the possibility of exercising comprehensive and consolidated supervision. In addition, according to Law 1328 of 2009 and Decree 4032 of 2010: (1) direct capital investments by Colombian financial institutions in foreign financial, brokerage or insurance companies, branches or agencies, require the prior authorization by the Superintendency of Finance, and (2) indirect capital investment (i.e., through a subsidiary) in foreign financial, brokerage or insurance companies, branches or agencies, require the prior authorization by the Superintendency of Finance if: (a) the initial investments equal or exceed 10% of the investor’s paid-in capital, (b) additional investments equal or exceed 5% of the investor’s paid-in capital or (c) the financial regulatory authority of the country where the investments is to be made has not executed a memorandum of understanding with the Superintendency of Finance. Other indirect investments do not require the approval of the Superintendency of Finance but must be reported to such entity prior to the respective investment.
As an issuer of securities traded on the Colombian Stock Exchange, Grupo Aval is subject to the supervision and regulation of the Superintendency of Finance. Additionally, Grupo Aval’s financial and stock brokerage subsidiaries located in Colombia (including banks, finance corporations, financing companies, trust companies, managers of pensions and severance payment funds, bonded warehouses and stock brokerage firms) are each subject to the regulatory supervision of the Superintendency of Finance. The level of supervision and regulation is different, though, taking into account that Grupo Aval is not a financial institution. Grupo Aval is subject to supervision (
control
) as an issuer of securities in the public market, while financial institutions and stock brokerage firms are subject to inspection and surveillance (
inspección y vigilancia
).
FOGAFIN
FOGAFIN was created in 1985 pursuant to Law 117. The primary function of FOGAFIN is to administer the deposit insurance system, with the objective of guaranteeing the deposits and savings held by the general public in Colombian financial institutions. See “—Troubled financial institutions—Deposit insurance.” The other primary purposes for which FOGAFIN was formed were to support the banking industry, to facilitate the privatization of financial institutions by the Colombian government, and to liquidate financial institutions under receivership.
FOGAFIN has tools and mechanisms that enable it to administer and temporarily take equity stakes in troubled financial institutions in order to allow it to determine whether a financial institution is viable or requires liquidation.
Securities market self-regulatory organization
Self-regulation in the capital markets was formally introduced in Colombia by Law 964 of 2005, and the securities market self-regulatory organization (
Autoregulador del Mercado de Valores
), or “SRO,” was created in June 2006.
The SRO has the power to supervise, sanction and regulate the entities subject to self-regulation (i.e., including securities intermediaries and any entity that voluntarily submits itself to self-regulation).
The SRO’s supervisory powers entitle it to review compliance with applicable laws and regulations and impose sanctions in the case of violations. The SRO may also propose regulation aimed at various matters, including conflicts of interest and improving the integrity and quality of the capital markets.
Superintendency of Industry and Commerce
According to Law 1340 of 2009, the Superintendency of Industry and Commerce is the competent national authority for all antitrust matters in every sector of the economy, including the financial sector.
As such, the Superintendency of Industry and Commerce is responsible for advancing administrative investigations of antitrust violations to financial and non-financial corporations, and has the power to impose corresponding sanctions.
The Superintendency of Industry and Commerce is responsible for approving economic mergers, acquisitions and integrations between and among enterprises, except for mergers, acquisitions or integrations between financial entities. The Superintendency of Finance is the authority responsible for approving mergers, acquisitions and integrations between financial institutions. For such approvals, the Superintendency of Finance must obtain a prior written opinion by the Superintendency of Industry and Commerce.
Regulatory framework for Colombian financial institutions
Basic framework: Decree 663 of 1993
The basic regulatory framework for the operations of the Colombian financial sector is set forth in the EOSF, as amended by Laws 510 of 1999, 546 of 1999, 795 of 2003, 964 of 2005 and 1328 of 2009, Decree 2555 of 2010, as well as in Resolution 8 of 2000 (exchange control regulation statute) and Resolution 4 of 2006 issued by the board of directors of the Colombian Central Bank.
The EOSF defines the structure of the Colombian financial system and establishes various business entities, including (1) credit institutions (which are further categorized into banks, finance corporations, financing companies and finance cooperatives), (2) financial services entities, (3) capitalization corporations, (4) insurance companies and (5) insurance intermediaries.
The EOSF also provides that no financial, banking or credit institution may operate in Colombia without the prior approval of the Superintendency of Finance. Subject to prior approval of the Superintendency of Finance, foreign banks may operate in Colombia through their subsidiaries established and incorporated in Colombia. Under Law 1328 of 2009, foreign banks, starting in 2013, will be permitted to operate through their “branches” and are not under the obligation of incorporating a Colombian subsidiary. Operations through these branches will be subject to prior approval by the Superintendency of Finance.
The main role of banks, finance corporations and financing companies is to receive deposits. Banks place funds back into circulation by means of loans or any active credit operation; finance corporations place funds into circulation by means of active credit operations or investments, with the purpose of promoting the creation or expansion of enterprises; and financing companies place funds back into circulation by means of active credit
operations, with the purpose of fostering the sale of goods and services, including the development of leasing operations.
Each credit institution must be separately authorized before it may develop and provide financial services. Furthermore, the activities of credit institutions are subject to limitations and restrictions, including limitations and restrictions relating to the extension of credit, risk concentration, investments, conditional operations, foreign currency loans and negotiations, and the administration of third-party funds. One of the principal restrictions on financial activities is that banks may not acquire or hold products, merchandise, shares of corporations, income bonds, or other similar securities, except (1) when the bank has received those goods or securities as collateral for loans it has made or (2) with respect to shares, when they are issued by companies where banks are permitted to hold investments (mainly financial affiliates). Banks are also subject to other limitations, including limitations on lending activities.
Laws 510 of 1999, 546 of 1999, 795 of 2003 and 1328 of 2009 substantially modified the control, regulation and surveillance powers of the Superintendency of Finance. In addition, Law 510 of 1999 and Law 1328 of 2009 streamlined the procedures and powers for FOGAFIN.
The main purpose of Law 510 of 1999 was to increase the solvency and stability of Colombia’s financial institutions by establishing rules regarding their incorporation, as well as the permitted investments of credit institutions, insurance companies and investment companies. Law 546 of 1999 was enacted in order to regulate the system of long-term home loans.
Law 795 of 2003 was enacted with the purpose of broadening the scope of activities to be performed by financial institutions and to update Colombian regulations with the latest principles of the Basel Committee at that time. Law 795 of 2003 also increased the minimum capital requirements needed to incorporate a financial institution (see “—Minimum capital requirements”) and authorized the Superintendency of Finance to take precautionary measures with respect to financial institutions whose capital falls below certain thresholds. For example, in order to avoid a temporary taking of possession by the Superintendency of Finance, troubled financial institutions must submit a restructuring program to the Superintendency of Finance.
Law 1328 of 2009 provided a new set of rights and responsibilities for customers of the financial system and a set of obligations for financial institutions, in order to minimize disputes. This law also broadened the scope of permitted business activities by regulated entities: following its adoption, banks were allowed to operate leasing businesses and to extend loans to third parties so that borrowers may acquire control of other companies.
In order to implement and enforce the provisions related to Colombia’s financial system, the Superintendency of Finance has issued periodic circulars and resolutions. The External Circular 007 of 1996, as amended, consolidates all of the rules and regulations applicable to financial institutions, including rules and regulations relating to the management, operations, investments, lending activities and money laundering prevention activities of financial institutions. The External Circular 100 of 1995, or the “Basic Accounting Circular,” as amended, consolidates all of the regulations applicable to the accounting and financial rules of financial institutions. Furthermore, the Basic Accounting Circular regulated the assessment of credit institutions’ investments, risk management, financial statements, information disclosure and inter-banking credits.
Violations of Laws 510 of 1999, 546 of 1999, 795 of 2003 or 1328 of 2009, as well as of specific provisions of Decree 663 of 1993 and their relevant regulations, are subject to administrative sanctions and, in some cases, criminal sanctions.
Key interest rates
Colombian commercial banks, finance corporations and financing companies are required to report data to the Colombian Central Bank on a weekly basis regarding the total volume (in pesos) of certificates of deposit issued during the prior week and the average interest rates paid for certificates of deposit with maturities of 90 days. Based on such reports, the Colombian Central Bank calculates the fixed-term deposit rate (
Depósitos a Término Fijo
), or “DTF,” which is published at the beginning of the following week for use in calculating interest rates payable by financial institutions. The DTF is the weighted average interest rate paid by commercial banks, finance corporations and financing companies for certificates of deposit with maturities of 90 days. For the week of December 31, 2011, the DTF was 4.98%.
The Colombian Central Bank also calculates the interbank rate (
Interés Bancario de Referencia
), or “IBR,” which acts as a reference of overnight and one-month interbank loans, based on quotations submitted each business day by eight participating banks to the Colombian Central Bank. Using a weighted average of the quotations submitted, the Colombian Central Bank calculates the overnight IBR each business day. The one-month IBR is calculated each Tuesday.
Article 884 of the Colombian Commercial Code provides for a limit on the amount of interest that may be charged in commercial transactions. The limit is 1.5 times the current banking interest rate (
Interés Bancario Corriente
), calculated as the average of the interest ordinarily charged by banks within a set period of time. The current banking interest rate is certified by the Superintendency of Finance.
Capital adequacy requirements
Capital adequacy requirements for Colombian credit institutions (as set forth in Decree 2555 of 2010) are based on the Basel Committee standards. The regulations establish five categories of assets, which are each assigned different risk weights, and require that a credit institution’s technical capital (as defined below) be at least 9.0% of that institution’s total risk-weighted assets.
To prepare for the implementation of the Basel III accords in Colombia, the Ministry of Finance, in consultation with the Superintendency of Finance, has initiated an internal review of regulations applicable to financial institutions. Although it is expected that the Ministry of Finance will review all such regulations, to date it has focused its review on:
|
|
·
|
the cyclical and countercyclical effects of changes in the financial environment: the Ministry of Finance has appointed a special committee to track financial developments, which is currently evaluating macroprudential instruments based on the Basel III accord;
|
|
|
·
|
regulatory capital adequacy requirements: the Ministry of Finance is evaluating the different components of Tier 1 and Tier 2 capital and expects to issue a proposal shortly, which it will discuss with the financial industry; and
|
|
|
·
|
the need for further adjustments to manage liquidity risk: the Ministry of Finance is currently reviewing the links and interactions between different market agents for how this could affect the liquidity of financial institutions.
|
The Colombian government is actively working on implementing the Basel III accord, and changes to current regulations may begin in 2012.
Technical capital (
patrimonio técnico
), for the purposes of the regulations, consists of the sum of basic capital (
patrimonio básico
), or primary capital (Tier I), and secondary capital (
patrimonio adicional
), or secondary capital (Tier II). Primary capital (Tier I) consists mainly of the following:
|
|
·
|
outstanding and paid-in share capital;
|
|
|
·
|
legal and other reserves;
|
|
|
·
|
profits retained from prior fiscal years;
|
|
|
·
|
the total value of the revaluation of the equity account (
revalorización del patrimonio
), if positive, and of the foreign currency translation adjustment account (
ajuste por conversión de estados financieros
);
|
|
|
·
|
current fiscal year profits in a proportion equal to the percentage of prior fiscal year profits that were capitalized, or allocated to increase the legal reserve, or all profits that must be used to cover accrued losses;
|
|
|
·
|
any representative shares held as security by FOGAFIN when the entity is in compliance with a recovery program aimed at bringing the institution back into compliance with capital adequacy requirements (if the Superintendency of Finance establishes that such recovery program has failed, these shares shall not be taken into account when determining primary capital (Tier I));
|
|
|
·
|
subordinated bonds issued by financial institutions and subscribed by FOGAFIN when they comply with the requirements stated in the regulations;
|
|
|
·
|
the part of the surplus capital account from donations that complies with the requirements set forth in the applicable regulation;
|
|
|
·
|
the value of dividends declared to be paid in shares; and
|
|
|
·
|
the value of the liabilities owned by non-controlling interests.
|
Items deducted from primary capital (Tier I) consist of the following:
|
|
·
|
losses of any prior or current period;
|
|
|
·
|
the total value of the capital revaluation account (
revalorización del patrimonio
), if negative;
|
|
|
·
|
accumulated inflation adjustment on non-monetary assets; provided that the respective assets have not been transferred;
|
|
|
·
|
investments in subordinated debt instruments issued by entities (excluding subsidiaries) that are subject to the supervision of the Superintendency of Finance, but excluding appraisals and investments in Finagro credit establishments and investments undertaken pursuant to Article 63 of Decree 663 of 1993; and
|
|
|
·
|
investments in shares, mandatory convertible bonds, subordinated bonds that may be convertible into shares or subordinated debt instruments issued by foreign financial institutions where the investor directly or indirectly holds at least 20.0% of the capital of said institution (excluding subsidiaries). This amount includes foreign currency translation and excludes appraisals.
|
Secondary capital (Tier II) consists of other reserves and retained earnings, which are added to primary capital (Tier I) to calculate technical capital. Secondary capital (Tier II) includes:
|
|
·
|
50.0% of the accumulated inflation adjustment of non-monetary assets (provided that such assets have not been disposed of);
|
|
|
·
|
50.0% of asset reappraisal (excluding revaluations of foreclosed assets or assets received as payment of credits); excluded from said amount is (1) the reappraisal of direct or indirect capital investments and investments in subordinated debt in entities subject to the supervision of the Superintendency of Finance, excluding subsidiaries, in compliance with the requirements set forth in the applicable regulation and (2) the reappraisal of direct or indirect capital investments and investments in subordinated debt in foreign financial entities with respect to which the bank’s share is or exceeds 20% of the entity’s subscribed capital;
|
|
|
·
|
mandatory convertible bonds effectively subscribed and paid, with maturities of up to five years (provided that the terms and conditions of their issuance were approved by the Superintendency of Finance and subject to the conditions set forth by the Superintendency of Finance);
|
|
|
·
|
subordinated monetary obligations not in excess of 50.0% of primary capital (Tier I) and in compliance with additional requirements stated in the regulations;
|
|
|
·
|
the part of the surplus capital account from donations in compliance with the requirements set forth in the applicable regulations; and
|
|
|
·
|
general allowances made in accordance with the instructions issued by the Superintendency of Finance.
|
The following items are deducted from Secondary capital (Tier II):
|
|
·
|
50% of the direct or indirect capital investments (in entities subject to the supervision of the Superintendency of Finance, excluding subsidiaries) and mandatory convertible bonds reappraisal that complies with the requirements set forth in the applicable regulation;
|
|
|
·
|
50% of the direct or indirect capital investments (excluding subsidiaries) and mandatory convertible bonds reappraisal of foreign financial entities with respect to which the bank’s share is or exceeds 20% of the entity’s subscribed capital; and
|
|
|
·
|
the value of the devaluation of equity investments with low exchange volume or which are unquoted.
|
In computing technical capital, additional capital (Tier II) may not exceed the total amount of primary capital (Tier I).
The following tables set forth our reported and as-adjusted consolidated capital adequacy information at December 31, 2011 and 2010. The reported figures are calculated using the methodology prescribed by the Superintendency of Finance, which requires that we subtract investments in non-consolidated entities from our regulatory capital. The as-adjusted amounts have been adjusted not to subtract non-controlling interest in financial institutions which are consolidated in other Grupo Aval subsidiaries at December 31, 2011 and 2010 (principally Banco de Bogotá’s non-controlling interest held in Banco de Occidente at December 31, 2011; Banco de Occidente’s investment in Corficolombiana and Porvenir, consolidated into Grupo Aval through Banco de Bogotá; and Banco Popular’s stake in Corficolombiana, consolidated into Grupo Aval through Banco de Bogotá). We believe that the inclusion of such investments presents a more comprehensive picture of our capitalization.
Banco de Bogotá
|
At December 31,
|
||||||||||||||||
|
2011
|
2010
|
|||||||||||||||
|
Actual
|
As adjusted (1)
|
Actual
|
As adjusted (1)
|
|||||||||||||
|
(in Ps billions)
|
||||||||||||||||
|
Subscribed capital
|
3 | 3 | 2 | 2 | ||||||||||||
|
Reserves and profits
|
5,368 | 5,368 | 2,856 | 2,856 | ||||||||||||
|
Non-controlling interests
|
2,126 | 2,126 | 2,016 | 2,016 | ||||||||||||
|
Less:
|
||||||||||||||||
|
Inflation adjustments on non-monetary assets
|
(95 | ) | (96 | ) | (104 | ) | (105 | ) | ||||||||
|
Unconsolidated financial sector investments
|
(228 | ) | – | (273 | ) | – | ||||||||||
|
Less/more others
|
– | – | – | – | ||||||||||||
|
Primary capital (Tier I)
|
7,175 | 7,401 | 4,497 | 4,769 | ||||||||||||
|
Inflation adjustments on non-monetary assets
|
48 | 48 | 52 | 52 | ||||||||||||
|
Unrealized gains/losses on securities available for sale (2)
|
3 | 3 | 14 | 14 | ||||||||||||
|
Valuations
|
410 | 410 | 382 | 382 | ||||||||||||
|
Subordinated bonds
|
375 | 375 | 2,694 | 2,694 | ||||||||||||
|
Less:
|
||||||||||||||||
|
Devaluations
|
(12 | ) | (13 | ) | – | – | ||||||||||
|
Unconsolidated financial sector investments
|
(3 | ) | – | (3 | ) | – | ||||||||||
|
Less/more others
|
3 | 3 | (2 | ) | (2 | ) | ||||||||||
|
Computed secondary capital (Tier II)
|
823 | 826 | 3,137 | 3,141 | ||||||||||||
|
Technical capital
|
7,998 | 8,227 | 7,635 | 7,910 | ||||||||||||
|
Risk-weighted assets
|
53,630 | 53,858 | 45,047 | 45,320 | ||||||||||||
|
Value at risk
|
570 | 570 | 506 | 506 | ||||||||||||
|
Regulatory value at risk (3)
|
6,331 | 6,331 | 5,617 | 5,617 | ||||||||||||
|
Risk-weighted assets including regulatory value at risk
|
59,961 | 60,189 | 50,664 | 50,937 | ||||||||||||
|
Primary capital (Tier I) to risk-weighted assets including regulatory value at risk
|
12.0 | % | 12.3 | % | 8.9 | % | 9.4 | % | ||||||||
|
Secondary capital (Tier II) to risk-weighted assets including regulatory value at risk
|
1.4 | % | 1.4 | % | 6.2 | % | 6.2 | % | ||||||||
|
Solvency ratio (4)
|
13.3 | % | 13.7 | % | 15.1 | % | 15.5 | % | ||||||||
|
(1)
|
The as-adjusted calculation of the solvency ratio eliminates the effect of excluding investments in unconsolidated financial institutions.
|
|
(2)
|
Unrealized gains/losses on securities available for sale do not flow through the statement of income until such securities are disposed of and the gain or loss is realized.
|
|
(3)
|
Regulatory value at risk consists of value at risk multiplied by (100/9) as required by the Superintendency of Finance. See “—Capital adequacy requirements.”
|
|
(4)
|
Solvency ratio is calculated as technical capital to risk-weighted assets including regulatory value at risk.
|
Banco de Occidente
|
At December 31,
|
||||||||||||||||
|
2011
|
2010
|
|||||||||||||||
|
Actual
|
As adjusted (1)
|
Actual
|
As adjusted (1)
|
|||||||||||||
|
(in Ps billions)
|
||||||||||||||||
|
Subscribed capital
|
5 | 5 | 4 | 4 | ||||||||||||
|
Reserves and profits
|
2,031 | 2,031 | 1,586 | 1,586 | ||||||||||||
|
Non-controlling interests
|
6 | 6 | 6 | 6 | ||||||||||||
|
Less:
|
||||||||||||||||
|
Inflation adjustments on non-monetary assets
|
(33 | ) | (40 | ) | (33 | ) | (41 | ) | ||||||||
|
Unconsolidated financial sector investments
|
(443 | ) | – | (369 | ) | – | ||||||||||
|
Less/more others
|
1 | 1 | 1 | 1 | ||||||||||||
|
Primary capital (Tier I)
|
1,568 | 2,003 | 1,196 | 1,557 | ||||||||||||
|
Inflation adjustments on non-monetary assets
|
20 | 20 | 20 | 20 | ||||||||||||
|
Unrealized gains/losses on securities available for sale (2)
|
306 | 306 | 319 | 319 | ||||||||||||
|
Valuations
|
135 | 135 | 124 | 124 | ||||||||||||
|
Subordinated bonds
|
104 | 104 | 168 | 168 | ||||||||||||
|
Less:
|
||||||||||||||||
|
Devaluations
|
– | 0 | – | 0 | ||||||||||||
|
Unconsolidated financial sector investments
|
(325 | ) | – | (329 | ) | – | ||||||||||
|
Less/more others
|
– | – | – | – | ||||||||||||
|
Computed secondary capital (Tier II)
|
239 | 565 | 302 | 631 | ||||||||||||
|
Technical capital
|
1,808 | 2,567 | 1,498 | 2,189 | ||||||||||||
|
Risk-weighted assets
|
17,369 | 17,812 | 14,160 | 14,529 | ||||||||||||
|
Value at risk
|
52 | 52 | 69 | 69 | ||||||||||||
|
Regulatory value at risk (3)
|
578 | 578 | 761 | 761 | ||||||||||||
|
Risk-weighted assets including regulatory value at risk
|
17,947 | 18,390 | 14,921 | 15,290 | ||||||||||||
|
Primary capital (Tier I) to risk-weighted assets including regulatory value at risk
|
8.7 | % | 10.9 | % | 8.0 | % | 10.2 | % | ||||||||
|
Secondary capital (Tier II) to risk-weighted assets including regulatory value at risk
|
1.3 | % | 3.1 | % | 2.0 | % | 4.1 | % | ||||||||
|
Solvency ratio (4)
|
10.1 | % | 14.0 | % | 10.0 | % | 14.3 | % | ||||||||
|
(1)
|
The as-adjusted calculation of the solvency ratio eliminates the effect of excluding investments in unconsolidated financial institutions.
|
|
(2)
|
Unrealized gains/losses on securities available for sale do not flow through the statement of income until such securities are disposed of and the gain or loss is realized.
|
|
(3)
|
Regulatory value at risk consists of value at risk multiplied by (100/9) as required by the Superintendency of Finance. See “—Capital adequacy requirements.”
|
|
(4)
|
Solvency ratio is calculated as technical capital to risk-weighted assets including regulatory value at risk.
|
Banco Popular
|
At December 31,
|
||||||||||||||||
|
2011
|
2010
|
|||||||||||||||
|
Actual
|
As adjusted (1)
|
Actual
|
As adjusted (1)
|
|||||||||||||
|
(in Ps billions)
|
||||||||||||||||
|
Subscribed capital
|
77 | 77 | 77 | 77 | ||||||||||||
|
Reserves and profits
|
1,104 | 1,104 | 915 | 915 | ||||||||||||
|
Non-controlling interests
|
30 | 30 | 29 | 29 | ||||||||||||
|
Less:
|
||||||||||||||||
|
Inflation adjustments on non-monetary assets
|
(30 | ) | (30 | ) | (30 | ) | (30 | ) | ||||||||
|
Unconsolidated financial sector investments
|
(87 | ) | – | (69 | ) | – | ||||||||||
|
Less/more others
|
– | – | – | – | ||||||||||||
|
Primary capital (Tier I)
|
1,095 | 1,181 | 921 | 991 | ||||||||||||
|
Inflation adjustments on non-monetary assets
|
15 | 15 | 15 | 15 | ||||||||||||
|
Unrealized gains/losses on securities available for sale (2)
|
141 | 141 | 148 | 148 | ||||||||||||
|
Valuations
|
163 | 163 | 160 | 160 | ||||||||||||
|
Subordinated bonds
|
131 | 131 | 200 | 200 | ||||||||||||
|
Less:
|
||||||||||||||||
|
Devaluations
|
(0 | ) | (0 | ) | – | – | ||||||||||
|
Unconsolidated financial sector investments
|
(140 | ) | – | (143 | ) | – | ||||||||||
|
Less/more others
|
1 | 1 | 1 | 1 | ||||||||||||
|
Secondary capital (Tier II)
|
311 | 451 | 380 | 523 | ||||||||||||
|
Technical capital
|
1,405 | 1,632 | 1,301 | 1,514 | ||||||||||||
|
Risk-weighted assets
|
10,915 | 11,002 | 9,417 | 9,486 | ||||||||||||
|
Value at risk
|
102 | 102 | 142 | 142 | ||||||||||||
|
Regulatory value at risk (3)
|
1,132 | 1,132 | 1,582 | 1,582 | ||||||||||||
|
Risk-weighted assets including regulatory value at risk
|
12,047 | 12,134 | 10,998 | 11,068 | ||||||||||||
|
Primary capital (Tier I) to risk-weighted assets including regulatory value at risk
|
9.1 | % | 9.7 | % | 8.4 | % | 9.0 | % | ||||||||
|
Secondary capital (Tier II) to risk-weighted assets including regulatory value at risk
|
2.6 | % | 3.7 | % | 3.5 | % | 4.7 | % | ||||||||
|
Solvency ratio (4)
|
11.7 | % | 13.5 | % | 11.8 | % | 13.7 | % | ||||||||
|
(1)
|
The as-adjusted calculation of the solvency ratio eliminates the effect of excluding investments in unconsolidated financial institutions.
|
|
(2)
|
Unrealized gains/losses on securities available for sale do not flow through the statement of income until such securities are disposed of and the gain or loss is realized.
|
|
(3)
|
Regulatory value at risk consists of value at risk multiplied by (100/9) as required by the Superintendency of Finance. See “—Capital adequacy requirements.”
|
|
(4)
|
Solvency ratio is calculated as technical capital to risk-weighted assets including regulatory value at risk.
|
Banco AV Villas
|
At December 31,
|
||||||||
|
2011
|
2010
|
|||||||
|
(in Ps billions)
|
||||||||
|
Subscribed capital
|
22 | 22 | ||||||
|
Reserves and profits
|
697 | 602 | ||||||
|
Non-controlling interests
|
4 | – | ||||||
|
Less:
|
||||||||
|
Inflation adjustments on non-monetary assets
|
(13 | ) | (14 | ) | ||||
|
Unconsolidated financial sector investments
|
(11 | ) | (11 | ) | ||||
|
Less/more others
|
– | – | ||||||
|
Primary capital (Tier I)
|
700 | 599 | ||||||
|
Inflation adjustments on non-monetary assets
|
6 | 7 | ||||||
|
Unrealized gains/losses on securities available for
sale (1)
|
3 | 10 | ||||||
|
Valuations
|
84 | 77 | ||||||
|
Subordinated bonds
|
– | – | ||||||
|
Less:
|
||||||||
|
Devaluations
|
– | – | ||||||
|
Unconsolidated financial sector investments
|
– | – | ||||||
|
Less/more others
|
7 | 6 | ||||||
|
Computed secondary capital (Tier II)
|
100 | 101 | ||||||
|
Technical capital
|
800 | 699 | ||||||
|
Risk-weighted assets
|
5,007 | 4,383 | ||||||
|
Value at risk
|
55 | 50 | ||||||
|
Regulatory value at risk (2)
|
610 | 561 | ||||||
|
Risk-weighted assets including regulatory value at risk
|
5,617 | 4,943 | ||||||
|
Primary capital (Tier I) to risk-weighted assets including regulatory value at risk
|
12.5 | % | 12.1 | % | ||||
|
Secondary capital (Tier II) to risk-weighted assets including regulatory value at risk
|
1.8 | % | 2.0 | % | ||||
|
Solvency ratio (3)
|
14.2 | % | 14.1 | % | ||||
|
(1)
|
Unrealized gains/losses on securities available for sale do not flow through the statement of income until such securities are disposed of and the gain or loss is realized.
|
|
(2)
|
Regulatory value at risk consists of value at risk multiplied by (100/9) as required by the Superintendency of Finance. See “—Capital adequacy requirements.”
|
|
(3)
|
Solvency ratio is calculated as technical capital to risk-weighted assets including regulatory value at risk.
|
Grupo Aval (aggregate)
The following table sets forth aggregate capital adequacy information for Grupo Aval at December 31, 2011 and 2010.
|
At December 31,
|
||||||||
|
2011
|
2010
|
|||||||
|
(in Ps billions)
|
||||||||
|
Subscribed capital
|
107 | 107 | ||||||
|
Reserves and profits
|
9,200 | 5,959 | ||||||
|
Non-controlling interests
|
2,167 | 2,050 | ||||||
|
Less:
|
||||||||
|
Inflation adjustments on non-monetary assets
|
(170 | ) | (180 | ) | ||||
|
Unconsolidated financial sector investments
|
(768 | ) | (723 | ) | ||||
|
Less/more others
|
1 | 1 | ||||||
|
Primary capital (Tier I)
|
10,537 | 7,213 | ||||||
|
Inflation adjustments on non-monetary assets
|
90 | 95 | ||||||
|
Unrealized gains/losses on securities available for sale (1)
|
453 | 491 | ||||||
|
Valuations
|
792 | 743 | ||||||
|
Subordinated bonds
|
609 | 3,061 | ||||||
|
Less:
|
||||||||
|
Devaluations
|
(12 | ) | – | |||||
|
Unconsolidated financial sector investments
|
(468 | ) | (475 | ) | ||||
|
Less/more others
|
10 | 5 | ||||||
|
Computed secondary capital (Tier II)
|
1,473 | 3,920 | ||||||
|
Technical capital
|
12,011 | 11,133 | ||||||
|
Risk-weighted assets
|
86,921 | 73,006 | ||||||
|
Value at risk
|
779 | 767 | ||||||
|
Regulatory value at risk (2)
|
8,651 | 8,521 | ||||||
|
Risk-weighted assets including regulatory value at risk
|
95,572 | 81,526 | ||||||
|
Primary capital (Tier I) to risk-weighted assets including regulatory value at risk
|
11.0 | % | 8.8 | % | ||||
|
Secondary capital (Tier II) to risk-weighted assets including regulatory value at risk
|
1.5 | % | 4.8 | % | ||||
|
Solvency ratio
|
12.6 | % | 13.7 | % | ||||
|
(1)
|
Unrealized gains/losses on securities available for sale do not flow through the statement of income until such securities are disposed of and the gain or loss is realized.
|
|
(2)
|
Regulatory value at risk consists of value at risk multiplied by (100/9) as required by the Superintendency of Finance. See “—Capital adequacy requirements.”
|
At December 31, 2011, our banks’ technical capital ratios were 13.3% (Banco de Bogotá), 10.1% (Banco de Occidente), 11.7% (Banco Popular) and 14.2% (Banco AV Villas) exceeding on average the requirement of the Colombian government and the Superintendency of Finance by 333 basis points. At December 31, 2010, our banks’ technical capital ratios were 15.1% (Banco de Bogotá), 10.0% (Banco de Occidente), 11.8% (Banco Popular) and 14.1% (Banco AV Villas), exceeding on average the requirement of the Colombian government and the Superintendency of Finance by 377 basis points. The year-over-year average decrease in capital adequacy ratios is explained by the growth in technical capital, which increased 7.9%, lagging behind the growth of risk-weighted assets, including regulatory value at risk, which was 17.2%.
The basic accounting circular contains provisions relating to liquidity risk, interest rate risk, foreign exchange rate risk and market risk. Colombian banks are required to calculate a value at risk, or “VaR,” based on a methodology provided by the Superintendency of Finance. VaR is used in assessing a banks’ solvency. Future changes in VaR requirements could have a material impact on our operations in the future. See “Item 11. Quantitative and Qualitative Disclosure About Risk—Liquidity Risk.”
Grupo Aval’s combined loan portfolio, net of provisions, is 77.9% weighted as risk-weighted assets at December 31, 2011. The provisions corresponding to each of our banks’ operations is determined by measuring credit risk. For this purpose, credit extensions are rated according to their risk level (A, B, C, D or E); the Superintendency of Finance has established minimum provision levels for each rating.
Mandatory investments
Colombian banking institutions are required to invest in agricultural development bonds (
Títulos de Desarrollo Agropecuario
) issued by Finagro, a government entity, according to External Resolution 3 of 2000 of the Colombian Central Bank, as amended by External Resolution 6 of 2008. The Colombian Central Bank requires that each bank maintains a total investment in these bonds equal to 5.8% of its checking and savings deposits, plus 4.4% of its time deposits with a maturity of up to 18 months. Finagro may issue two different types of agricultural development bonds, Class A with an interest rate of 4 percentage points below the DTF rate and Class B with an interest rate of 2 percentage points below DTF. If the DTF interest rate falls to 4% or less, the profitability of the Class A DTAs will be 0%, and if the DTF interest rate falls to 2% or less, the profitability of the Class B DTAs will be 0%. Banks are required to invest 37% of the total mandatory investment in Class A TDAs and 63% in Class B TDAs.
Until 2006, banking institutions were required to invest in debt reduction bonds (
Títulos de Reducción de Deuda
), issued by the Colombian government. These bonds are no longer a mandatory investment but are still outstanding in the portfolios of bank institutions until maturity.
Under government discretion, authorities may extend the scope of current regulations or require additional disbursements on current or new types of mandatory investments.
Minimum capital requirements
Article 80 of Decree 663 of 1993, as amended by Law 795 of 2003, establishes minimum incorporation capital requirements for different financial institutions. When a financial institution fails to comply with the minimum required capital after a cure period granted by law, the Superintendency of Finance may intervene and require the financial institution to be liquidated, merged into another institution or its corporate form shall be converted into another category of financial institution, notwithstanding the fact that the institution may be subject to fines imposed by the Superintendency of Finance.
The minimum incorporation capital requirement for banks on an unconsolidated basis for 2010 was Ps 68.9 billion. Through December 31, 2011, all of our banks have consistently satisfied this incorporation capital requirement.
Capital investment limit
All investments in subsidiaries and other authorized capital investments, other than those carried out in order to fulfill legal provisions, may not exceed 100% of the total aggregate of the capital, equity reserves and the equity reappraisal account of the respective bank, financial corporation or financing company, excluding unadjusted fixed assets and including deductions for accumulated losses.
Foreign currency position requirements
According to External Resolution 5 of 2005 issued by the Board of Directors of the Colombian Central Bank, as amended by External Resolutions 11 of 2005, 4 of 2007, 3 and 13 of 2008, 1 and 7 of 2009, and 3 of 2011, a financial institution’s foreign currency position is the difference between such institution’s foreign currency-denominated assets and liabilities (including any off-balance sheet items), realized or contingent, including those that may be sold in Colombian legal currency.
Resolution 4 of 2007 (as amended by Resolution 3 of 2008) of the Board of Directors of the Colombian Central Bank provides guidelines for foreign currency positions of financial institutions, including the following:
|
|
·
|
the average of a bank’s foreign currency position for three business days cannot exceed the equivalent in foreign currency of 20.0% of the bank’s technical capital. Currency exchange intermediaries such as Grupo Aval’s bank subsidiaries are permitted to hold a three business days’ average negative foreign currency position not exceeding the equivalent in foreign currency of 5.0% of its technical capital (with penalties being payable after the first business day). At December 31, 2011, Banco de Bogotá, Banco de Occidente, Banco Popular and Banco AV Villas had unconsolidated foreign currency positions of U.S.$3.7 million, U.S.$(3.6) million, U.S.$10.4 million and U.S.$(1.2) million, respectively, which fell within these regulatory guidelines;
|
|
|
·
|
foreign currency position in cash is defined as the difference between all foreign currency-denominated assets and liabilities. A bank’s three business days’ average foreign currency position in cash cannot exceed 50.0% of the bank’s technical capital. In accordance with Resolution 4 of 2007 (as amended by Resolution 3 of 2008) of the Board of Directors of the Colombian Central Bank, the three-day average shall be calculated on a daily basis and the foreign currency position in cash cannot be negative. At December 31, 2011, Banco de Bogotá, Banco de Occidente, Banco Popular and Banco AV Villas had unconsolidated foreign currency positions in cash of U.S.$41.3 million, U.S.$6.8 million, U.S.$10.4 million and U.S.$0.03 million, respectively, which fell within these regulatory guidelines; and
|
|
|
·
|
gross position of leverage, defined as (1) the value of term contracts denominated in foreign currency, plus (2) the value of transactions denominated in foreign currency to be settled in cash within one or more days, and (3) the value of the exchange rate risk exposure associated with exchange rate options and derivatives. Resolution 4 of 2007 (as amended by Resolution 3 of 2011) of the Board of Directors of the Colombian Central Bank establishes that the average of a bank’s gross position of leverage for three business days
|
|
|
|
cannot exceed 550.0% of the technical capital of such bank. In calculating the gross position of leverage, Resolution 3 of 2011 of the Board of Directors of the Colombian Central Bank excludes any foreign exchange transactions that intermediaries of the FX Market perform as local suppliers of liquidity of foreign currency using the Systems of Compensation and Liquidation of Currencies when there is a breach of payment by a participant. At December 31, 2011, Banco de Bogotá, Banco de Occidente, Banco Popular and Banco AV Villas had an unconsolidated gross position of leverage of U.S.$7,306.2 million, U.S.$1,975.2 million, U.S.$2.4 million and U.S.$7.9 million, respectively, which fell within these regulatory guidelines.
|
Reserve requirements
Commercial banks are required by the Board of Directors of the Colombian Central Bank to satisfy reserve requirements with respect to deposits and other cash demands. These reserves are held by the Colombian Central Bank in the form of cash deposits. According to Resolution 11 of 2008, the reserve requirements for Colombian banks are measured bi-weekly and the amounts depend on the class of deposits.
The reserves of credit institutions range between zero and 11.0%. For example, credit institutions must maintain reserves of 11.0% for checking account deposits and saving account deposits, reserves of 4.5% for term deposits with a maturity of less than 540 days, and no reserves for term deposits with a maturity of more than 540 days.
Credit institutions may maintain these reserves in their accounts at the Colombian Central Bank.
Foreign currency loans
Colombian residents may only obtain foreign currency loans from foreign financial institutions registered with the Colombian Central Bank or from Colombian financial institutions. Foreign currency loans must be either channeled through foreign exchange intermediaries (such as Colombian financial institutions) or deposited in offshore compensation accounts (including specially designated accounts at foreign banks held by Colombian residents and registered before the Colombian Central Bank).
Under regulations issued by the Colombian Central Bank, every Colombian resident and institution borrowing funds in foreign currency is generally required to post with the Colombian Central Bank non-interest-bearing deposits for a specified term; however, the size of the required deposit is currently zero. No such deposits would be required for foreign currency loans aimed at financing Colombian investments abroad or for short-term exportation loans (provided the loan is disbursed against the funds of
Banco de Comercio Exterior – Bancoldex
).
In addition, pursuant to Law 9 of 1991, the Board of Directors of the Colombian Central Bank is entitled to impose conditions and limitations on the incurrence of foreign currency indebtedness in order to avoid pressure in the foreign exchange market. See “Item
3. Key Information—D. Risk factors—Risks relating to our businesses and industry—Other risks relating to our business—
The Colombian Central Bank may impose requirements on the ability of Colombian residents, including us, to obtain loans denominated in foreign currency
.”
To reduce pressure on the foreign exchange market, the Colombian central government issued Decree 4145 dated November 5, 2010, which provides that interest payments on new foreign indebtedness (or on new disbursements of previously-agreed loans) are subject to a 33% withholding tax and, thereafter, Law 1430 of 2010 reduced the rate to 14%. Nevertheless, certain exceptions apply to this rule, including (1) foreign indebtedness incurred by entities controlled by the Colombian government and (2) loans obtained abroad incurred by Colombian banks and financial corporations.
Restrictions on foreign investment in Colombia
Colombia’s foreign investment statute regulates the manner in which non-residents are permitted to invest in Colombia and participate in the Colombian securities market. Among other requirements, Colombian law requires foreign investors to register certain foreign exchange transactions with the Colombian Central Bank and obtain authorization for certain types of investments. Certain foreign exchange transactions, including those between residents and non-residents, must be made through authorized foreign exchange market participants.
Non-residents are permitted to hold portfolio investments in Colombia, through either a registered stock brokerage firm, a trust company or an investment firm. Investors would only be allowed to transfer dividends abroad after the foreign investment registration procedure with the Colombian Central Bank has been completed. The failure of a non-resident investor to report or register foreign exchange transactions with the Colombian Central Bank relating to investments in Colombia on a timely basis may prevent the investor from remitting dividends, or an investigation that may result in a fine may be commenced.
Allowance for loan losses
The Superintendency of Finance has issued guidelines relating to allowances for loan losses in the Basic Accounting Circular, as amended, and External Circular 054 of 2009, which refer to the adoption of the
unified System for Administration of Credit Risks, or “SARC,”
by credit institutions.
As previously mentioned, the SARC system adopted by each credit institution must contain policies and procedures defining the manner in which the institution assesses, evaluates, classifies, grades, controls and covers credit risk. Management must adopt policies and procedures to ensure adequate risk management in connection with the establishment of allowances and of lending and continuous monitoring standards.
Under the current model of allowances for loan losses, loans must be classified and graded in five different categories, from “A” to “E” as established by the Superintendency of Finance. Loans classified in category “A” are considered “normal” or “ordinary,” with a regular credit risk. Loans classified in category “B” are those considered to have an acceptable risk. In category “C,” institutions must include loans with an appreciable risk, while category “D” must contain loans with a significant or material credit risk. Finally, loans that are not able to be recovered, or that have a reduced chance of being recovered, must be classified in category “E.” Each bank must follow this system.
The Superintendency of Finance’s guidelines specify the criteria for classifying loans, including type of loan (i.e., commercial, consumer, mortgage or microcredit loan), age of loan, term of default, and variation of the credit risk of the debtor (by determining repayment capability and payment record). Credit institutions are also required to apply specific allowances to particular categories of loans, which are calculated as a percentage of the outstanding balance.
For mortgage loans and microcredit loans, a general allowance for loan losses of 1% of the principal amount must be established for each mortgage and microcredit loan.
In addition to the general allowance, individual allowances for loan losses must be established.
The following table presents the minimum individual allowance for mortgage loan losses, as established by the Superintendency of Finance.
|
Credit category
|
Percentage of allowance over the guaranteed portion of the loan
|
Percentage of allowance over the non-guaranteed portion of the loan
|
||||||
|
A
|
1.0 | % | 1.0 | % | ||||
|
B
|
3.2 | % | 100.0 | % | ||||
|
C
|
10.0 | % | 100.0 | % | ||||
|
D
|
20.0 | % | 100.0 | % | ||||
|
E
|
30.0 | % | 100.0 | % | ||||
The following table presents the minimum individual allowance for microcredit loan losses.
|
Credit grade
|
Minimum Allowance Percentage(1)
|
Minimum Allowance Percentage(2)
|
||||||
|
A
|
0.0 | % | 1.0 | % | ||||
|
B
|
1.0 | % | 2.2 | % | ||||
|
C
|
20.0 | % | 0.0 | % | ||||
|
D
|
50.0 | % | 0.0 | % | ||||
|
E
|
100.0 | % | 0.0 | % | ||||
|
(1)
|
Allowance percentage that will be applied over the balance due on the loan, after discounting the value of acceptable guarantees, taking into account the rules provided in Annex 1 of Chapter II of the Basic Accounting Circular.
|
|
(2)
|
Allowance percentage that will be applied over the balance due on the loan, without discounting the value of acceptable guarantees.
|
|
|
In any case, the minimum individual allowance for credit losses corresponds to the sum of:
|
|
|
1.
|
The allowance percentage applicable to the balance due, net of the value of acceptable guarantees; and
|
|
|
2.
|
The allowance percentage applicable to the entire balance due on the loan. See Note 2(i) to our audited annual consolidated financial statements
.
|
In the case of consumer and commercial loans, Annex 3 to Chapter II of the Basic Accounting Circular (as amended by External Circular No. 22 of 2008), issued by the Superintendency of Finance, establishes that financial institutions which provide consumer and commercial loans may prepare lending internal models which classify and qualify all consumer and commercial loans granted by said entity, in order to constitute non-performing loan allowances (which includes countercyclical parameters) reflecting the classification and qualification set in the model.
Under this regulation, each financial institution may submit its own internal models for the review (and non objection opinion) of the Superintendency of Finance. However, if an entity does not propose such internal models or if they are objected to by the Superintendency of Finance, the reference models contained in the Basic Accounting Circular must be applied to their lending activities.
Title II, Book I of Part II of Decree 2555 of 2010 provides that a financial institution may not lend to a single borrower an amount in excess of 10% of such institution’s technical capital, or 25% if amounts above 5% are secured by collateral in accordance with the financial institution’s guidelines.
Pursuant to Title VI, Book 36 of Part II of Decree 2555 of 2010, a bank may not make a loan to any shareholder that holds directly more than 10% of its share capital for one year after such shareholder reaches the 10% threshold. In no event may a loan to a shareholder holding, directly or indirectly, 20% or more of a bank’s share capital exceed 20% of a bank’s technical capital. In addition, no loan to a single financial institution may exceed 30% of a bank’s technical capital, with the exception of loans funded by Colombian development banks for which no limit exists.
If a financial institution exceeds these limits, the Superintendency of Finance may impose a fine equal to up to twice the amount by which any such loan exceeded the limit and, in some cases, there may be criminal sanctions.
At December 31, 2011, our banks were subject to the following lending limits for unsecured and secured loans: Banco de Bogotá’s lending limit per borrower on an unconsolidated basis was Ps 660.0 billion for unsecured loans and Ps 1,650.1 billion for secured loans. Banco de Occidente’s lending limit per borrower on an unconsolidated basis was Ps 185.3 billion for unsecured loans and Ps 463.3 billion for secured loans. Banco AV Villas’ lending limit per borrower on an unconsolidated basis was 79.5 billion for unsecured loans and Ps 198.6 billion for secured loans. Banco Popular’s lending limit per borrower on an unconsolidated basis was Ps 137.0 billion for unsecured loans and Ps 342.6 billion for secured loans.
No concentration limits apply to Grupo Aval on a consolidated basis.
Decree 2555 of 2010 sets a maximum limit for risk concentrated in one single party, equivalent to 30% of a bank’s technical capital, the calculation of which includes loans, leasing operations and equity and debt investments.
The Colombian Central Bank also has the authority to establish maximum limits on the interest rates that commercial banks and other financial institutions may charge on loans.
Public tender offer rules
Pursuant to Colombian law, the acquisition of the beneficial ownership of 25.0% or more of the outstanding shares with voting rights of a listed company, or the purchase of 5.0% or more of the outstanding shares with voting rights by a shareholder or group shareholders beneficially owning 25.0% or more of such outstanding shares of a listed company, should be made pursuant to the public tender offer rules. The preferred shares offered hereby are not shares with voting rights for purposes of this requirement.
Under Article 6.15.2.1.1 of Decree 2555 of 2010, any entity or group of entities ultimately representing the same beneficial owner, directly or through one or more intermediaries, may only become the beneficial owner of more than 25.0% of the outstanding shares with voting rights of a company that is publicly traded in Colombia by making a tender offer directed at all holders of such shares of that company, following the procedures established by the Superintendency of Finance.
Moreover, any beneficial owner of more than 25.0% of the outstanding shares with voting rights of a company who wants to acquire additional shares of the company representing more than 5.0% of the company’s outstanding shares with voting rights may only do so by making a tender offer directed at all holders of such company’s shares, following the procedures established by the Colombian central government.
These requirements do not need to be met in certain circumstances described in Article 6.15.2.1.2 of Decree 2555 of 2010, including: (1) if the purchase is approved by 100% of the holders of the outstanding shares of the company, (2) if the purchaser acquires the percentages indicated above through an offer in a privatization process, (3) if the company reacquires its own shares or (4) if the company issues voting shares.
Sales of publicly traded stock
Any transaction involving the sale of publicly traded stock of any Colombian company, including any sale of our preferred shares for the peso equivalent of 66,000 UVRs (approximately U.S.$6,600) or more must be effected through the Colombian Stock Exchange. At December 31, 2011 one UVR equals Ps 198.45 and 66,000 UVRs equal Ps 13,097,482.20.
Intervention powers of the Superintendency of Finance – Bankruptcy considerations
Pursuant to the Colombian Banking Law, the Superintendency of Finance has the power to intervene in the operations of a bank in order to prevent it from, or to control and reduce the effects of, a bank failure.
The Superintendency of Finance may intervene in a bank’s business (1) prior to the liquidation of the bank, by taking precautionary measures in order to prevent the bank from being taken over by the Superintendency of Finance, or (2) to take possession of the bank to either administer the bank or order its liquidation, depending on the severity of the situation.
The purpose of taking possession is to allow the Superintendency of Finance to decide (1) whether the entity should be liquidated, (2) whether it is possible to place it in a position to continue doing business in the ordinary course, or (3) whether other measures may be adopted to secure better conditions so that depositors, creditors and investors may obtain the full or partial payment of their credits.
If the Superintendency of Finance takes possession of a bank, FOGAFIN must appoint a special agent (who must be accepted by the Superintendency of Finance) to administer the affairs of the bank during such process and until the bank is ordered to be liquidated or the entity is reestablished to continue doing business in the ordinary course.
During the period of the Superintendency of Finance’s possession (which period ends when the liquidation process begins), Colombian banking laws prevent any creditor of the bank from (1) initiating any procedure for the collection of any amount owed by the bank, (2) enforcing any judicial decision rendered against the bank to secure payment of any of its obligations, (3) placing a lien or attachment on any of the assets of the bank to secure payment of any of its obligations, or (4) making any payment, advance or compensation or assuming any obligation on behalf of the bank, with the funds or assets that may belong to it and are held by third parties, except for payments that are made by way of set-off between regulated entities of the Colombian financial and insurance systems.
In the event that the bank is liquidated, the Superintendency of Finance must, among other measures, provide that all term obligations of the bank are due and payable at the date when the order to liquidate becomes effective.
Troubled financial institutions – Deposit insurance
Subject to specific limitations, FOGAFIN is authorized to provide equity and/or secured loans to troubled financial institutions and to insure deposits of commercial banks and certain other financial institutions. In 1998 and 1999, to address the adverse effects of the economic crisis, certain regulations were adopted, among others, Law 546 of 1999 (
Ley de Vivienda
) and Law 550 of 1999 (
Ley de Reactivación Económica
).
To protect the customers of commercial banks and certain financial institutions, Resolution No. 1 of 1988 of FOGAFIN, as amended by Resolution No. 1 of 2010, and as amended by Resolutions No. 2 and No. 4 of 2011, requires mandatory deposit insurance. Under this resolution, banks must pay an annual premium of 0.3% of total funds received on savings accounts, checking accounts and certificates of deposit. If a bank is liquidated, the deposit insurance will cover the funds deposited by an individual or corporation with such bank, up to a maximum of Ps 20 million, regardless of the number of accounts held.
Anti-money laundering provisions
The regulatory framework to prevent and control money laundering is contained in, among others, the EOSF and Circulars 26 of 2008 and 19 of 2010 issued by the Superintendency of Finance, as well as Law 599 of 2000 (the Colombian Criminal Code).
Colombian laws adopt the latest guidelines related to anti-money laundering and other terrorist activities established by the Financial Action Task Force on Money Laundering, or “FATF.” Colombia, as a member of the GAFI-SUD (an FATF-style regional body) follows all of FATF’s 40 recommendations and eight special recommendations.
Anti-money laundering provisions have been complemented with provisions aimed at deterring terrorism financing. For that purpose, by means of Circular 26 of 2008, the Superintendency of Finance has issued regulations requiring the implementation by financial institutions of a system of controls for money laundering and terrorism financing.
The requirements include “know your customer” rules and procedures to protect financial institutions from being used directly by shareholders and executives in money laundering activities, for channeling funds for terrorist activities, or for the concealment of assets from such activities; those rules and procedures set forth detailed instructions for monitoring these risks.
Circular 60 of 2008, issued by the Superintendency of Finance and applicable to issuers of securities in the capital markets, provides rules and guidelines regarding the prevention of money laundering and terrorism financing.
Finally, the Colombian Criminal Code introduced criminal rules and regulations to prevent, control, detect, eliminate and prosecute all matters related to financing terrorism and money laundering. The criminal rules and regulations cover the omission of reports on cash transactions, mobilization or storage of cash, and the lack of controls.
Regulatory framework for non-financial subsidiaries
All of Grupo Aval’s Colombian subsidiaries listed in note 1 to our consolidated audited financial statements that are not part of the financial sector are governed by the laws and regulations of the Colombian Civil Code and the Colombian Code of Commerce, as well as any regulations issued by the Colombian Superintendency of Industry and Commerce and the Superintendency of Corporations or any other type of special regulations that may be applicable to the commercial and industrial activities carried out by these subsidiaries.
Panamanian regulation
BAC International Bank, Inc. operates as a full-service bank in Panama with a general license to offer banking services to residents of Panama and abroad.
The Panamanian financial system is regulated by the Superintendency of Banks of Panama (
Superintendencia de Bancos de Panama
), or “SBP,” which is in charge of regulating and overseeing all areas of banking, including solvency, liquidity, credit limits, risk management, financial information disclosure, accounting standards, bank customer protection and anti-money laundering policies.
The SBP requires Panamanian banks to maintain certain minimum capital ratios. Banks’ capital adequacy ratios must be held at a minimum of 8%, measured as a percentage of adjusted capital to risk-weighted assets, and their provisions must be held at a minimum of 1% over total loans. The SBP also limits banks’ concentration risk within a particular economic interest group and for related parties to 25%. Additionally, the ratio of assets to local deposits and the liquidity ratio are limited to 85% and 30%, respectively.
The SBP performs one audit per year and requires consolidated financial statements and capital adequacy reports on a quarterly basis and audited financials on a semi-annual basis.
Guatemalan regulation
Grupo BAC-Credomatic Guatemala is subject to the regulations of the Central Bank of Guatemala (
Banco de Guatemala
) and the Superintendency of Banks of Guatemala (
Superintendencia de Bancos de Guatemala
). Their areas of oversight include capital adequacy, lending limits, concentration limits, liquidity, exchange rate risk, financial statements disclosure, accounting standards, anti-money laundering and terrorism financing.
Grupo BAC-Credomatic Guatemala submits periodic reports to the Superintendency of Banks. In addition, the Superintendency of Banks maintains an office within Grupo BAC-Credomatic Guatemala and continuously audits the different areas of the bank. This is common practice with all Guatemalan banks.
The offshore operations of Grupo BAC-Credomatic Guatemala are also subject to regulation by the Superintendency of Banks of Guatemala as well as the banking authority where they are domiciled. BAC Bank Inc., BAC-Credomatic Guatemala Offshore’s offshore subsidiary domiciled in Panama, is regulated by the Panamanian Superintendency of Banks.
Additionally, as an issuer of debt securities, Credomatic de Guatemala, S.A. is subject to certain requirements including financial statements disclosure to the market and the obligation to be rated by an independent rating agency, and BAC Valores Guatemala, S.A., as a brokerage house, is regulated by the Securities Exchange of Guatemala.
Costa Rican regulation
Banco BAC San José S.A. is regulated by the General Superintendency of Financial Institutions (
Superintendencia General de Entidades Financieras
), or “SUGEF,” and the Costa Rican Central Bank. Their areas of oversight include capital adequacy, related party lending, limits to credit to a single economic group, external auditors, financial statements disclosure, loan loss reserves, risk management, corporate governance and anti-money laundering.
Costa Rican banks are required to maintain certain minimum ratios: banks’ capital adequacy ratios must be held at a minimum of 10%, measured as a percentage of adjusted capital to risk-weighted assets, and the bank’s average rating score must be held at a minimum of 1.75. The average rating score is calculated using the CAMELS score,
which is measured based on capital adequacy, asset quality, management quality, earnings, liquidity, and sensitivity to market risk and represents 80% of the total score, and the bank’s management examination, which represents 20% of the total score. Exchange rate risk is also regulated and is included as part of the capital adequacy requirements, as 10% of the bank’s net position in foreign currency. Additionally, concentration risk within a particular economic interest group and for related parties is limited in each case to 20%.
The SUGEF performs audits and receives periodic reports on a continuous basis. In addition, the brokerage house and the mutual funds management company are regulated by the General Superintendency of Securities (
Superintendencia General de Valores
) and the pension funds company is regulated by the General Superintendency of Pensions (
Superintendencia de Pensiones
).
Honduran regulation
Banco de America Central S.A., Honduras is regulated by the National Banking and Insurance Commission (
Comisión Nacional de Bancos y Seguros
) and the Honduran Central Bank (
Banco Central de Honduras
). Their areas of oversight include capital adequacy, loss loan reserve, accounting standards, external auditors, foreign exchange, related party lending, limits to credit to a single economic group, corporate governance and anti-money laundering.
Honduran banks are required to maintain certain minimum capital adequacy ratios, as fixed by the National Commission of Banks and Insurance Companies, or the “Commission.” Currently, the capital adequacy ratio must be held at a minimum of 10%, measured as a percentage of adjusted capital to risk-weighted assets. Additionally, concentration risk within a particular economic interest group and for transactions with related parties is limited to 20% and 30%, respectively; although, in the first case, the percentage can be increased to up to 30%. The Commission has also established prudential guidelines with the goal of safeguarding the liquidity of the financial institutions system. The Commission requires periodic reports covering various topics to be submitted daily, weekly, bi-weekly, monthly and annually. Furthermore, the Commission, via the Superintendency of Banks, performs audits including an annual evaluation of the bank’s risk management.
El Salvadorian regulation
Banco de America Central S.A. El Salvador is regulated by El Salvador Central Bank (
Banco Central de Reserva de El Salvador
) and the Financial System Superintendency of El Salvador (
Superintendencia del Sistema Financiero
). Their areas of oversight include capital adequacy, liquidity, related party transactions, external auditors, risk management, financial information disclosure, investments, accounting standards and anti-money laundering.
Salvadorian banks are required to maintain certain minimum ratios. Capital adequacy ratios must be held to a minimum of 12%, measured as a percentage of adjusted capital to the sum of the weighted assets, net of depreciation, reserves, and write-off provisions. Concentration risk is also limited by the superintendency within a particular economic interest group and for transactions with related parties to 25% and 5%, respectively. Additionally, the local superintendency performs periodic audits across multiple areas of the bank and requires an average of 17 periodic reports to be submitted on a weekly, monthly and/or quarterly basis.
Banco de America Central, S.A., as an issuer of debt securities, and Inversiones Bursatiles Credomatic, S.A. de C.V., Casa de Corredores de Bolsa, as a securities broker, are also subject to the regulations of the securities’ market, via the Financial System Superintendency of El Salvador.
Nicaraguan regulation
Banco de America Central S.A. Nicaragua is regulated by the Banking and Other Financial Institutions Superintendency (
Superintendencia de Bancos y de Otras Instituciones Financieras
). The banking authorities have issued prudential guidelines in the areas of capital adequacy, related party lending, concentration risk, risk management, relationship with external auditors, financial information disclosure, anti-money laundering and terrorism financing prevention, among others.
Nicaraguan banks are required to maintain certain minimum ratios: capital adequacy ratios must be held at a minimum of 10%, measured as a percentage of adjusted capital to risk-weighted assets. Liquidity gap models are
also applied, which limit the liquidity gaps within a period of 0-30 days to be no more than one time the bank’s equity base and within the period of 0-90 days to be no more than two times the equity base. Likewise, the banks have legal reserve requirements to guarantee liquidity buffers. The Banking and Other Financial Institutions Superintendency also regulates limited concentration risk within a particular economic interest group and for related parties to 30%. The Banking and Other Financial Institutions Superintendency requires a minimum of one audit per year and approximately 36 periodic reports are required on a daily, weekly, monthly, quarterly, semi-annual and annual basis.
Service of process and enforcement of judgments
Grupo Aval is incorporated under the laws of Colombia. All of our directors and officers reside outside the United States. Substantially all of our assets are located outside the United States, primarily in Colombia. As a result, it may not be possible, or it may be difficult, for you to effect service of process upon us or these other persons within the United States or to enforce judgments obtained in U.S. courts against us or them, including those predicated upon the civil liability provisions of the U.S. federal securities laws.
Colombian courts will determine whether to enforce a U.S. judgment predicated on the U.S. securities laws through a procedural system known under Colombian law as “exequatur.” Colombian courts will enforce a foreign judgment, without reconsideration of the merits, only if the judgment satisfies the requirements of Articles 693 and 694 of Colombia’s Code of Civil Procedure, which provide that the foreign judgment will be enforced if:
|
|
·
|
a treaty or convention exists between Colombia and the country where the judgment was granted or there is reciprocity in the recognition of foreign judgments between the courts of the relevant jurisdiction and the courts of Colombia;
|
|
|
·
|
the foreign judgment does not relate to “in rem” rights vested in assets that were located in Colombia at the time the suit was filed;
|
|
|
·
|
the foreign judgment does not contravene or conflict with Colombian laws relating to public order other than those governing judicial procedures;
|
|
|
·
|
the foreign judgment, in accordance with the laws of the country in which it was obtained, is final and not subject to appeal, and a duly certified and authenticated copy of the judgment has been presented to a competent court in Colombia;
|
|
|
·
|
the foreign judgment does not refer to any matter upon which Colombian courts have exclusive jurisdiction;
|
|
|
·
|
no proceeding is pending in Colombia with respect to the same cause of action, and no final judgment has been awarded in any proceeding in Colombia on the same subject matter and between the same parties; and
|
|
|
·
|
in the proceeding commenced in the foreign court that issued the judgment, the defendant was served in accordance with the law of such jurisdiction and in a manner reasonably designed to give the defendant an opportunity to defend itself against the action.
|
The United States and Colombia do not have a bilateral treaty providing for automatic reciprocal recognition and enforcement of judgments in civil and commercial matters. The Colombian Supreme Court, which is the only Colombian court that can recognize foreign judgments, has generally accepted that reciprocity exists when it has been proven that either a U.S. court has enforced a Colombian judgment or that a U.S. court would enforce a foreign judgment, including a judgment issued by a Colombian court. However, decisions as to enforceability are considered by Colombian courts on a case-by-case-basis, and we do not believe there has been a case to date in which the Colombian Supreme Court was asked to enforce a U.S. judgment relating to U.S. securities laws.
We cannot assure you that a Colombian court would enforce a U.S. court judgment with respect to the notes based on U.S. securities laws. We have been advised by our Colombian counsel that there is no legal basis for original actions to be brought against us or our directors and executive officers in a Colombian court predicated solely upon the provisions of the U.S. securities laws. In addition, certain remedies available under provisions of the U.S. securities laws may not be admitted or enforced by Colombian courts.
Grupo Aval’s articles of incorporation and by-laws contain an arbitration clause that provides for the exclusive jurisdiction of an arbitral tribunal to be seated at the Bogotá Chamber of Commerce. The arbitration provision provides that any conflict arising among shareholders, or between shareholders and Grupo Aval in connection with the by-laws, must be resolved by an arbitral tribunal.
We conduct our operations through our four banks (Banco de Bogotá, Banco de Occidente, Banco Popular and Banco AV Villas), our pension and severance fund manager (Porvenir), our merchant bank (Corficolombiana) and our Central American banking group, BAC Credomatic, which we acquired on December 9, 2010. The following chart presents our ownership structure.
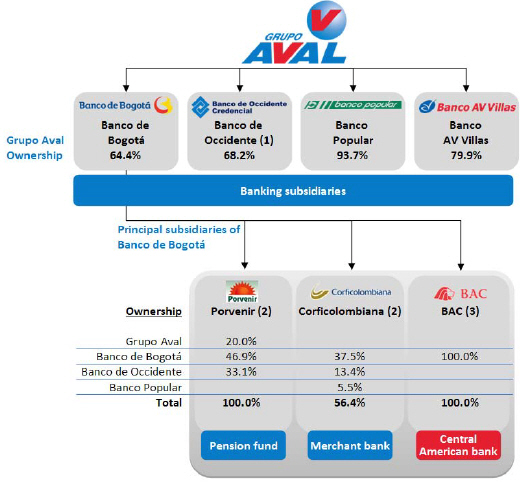
|
(1)
|
Corficolombiana held an additional 4.0% beneficial interest in Banco de Occidente at December 31, 2011, due to the merger of Leasing de Occidente into Banco de Occidente in June 2010. These shares are expected to be sold in open-market transactions through the Colombian Stock Exchange.
|
|
(2)
|
Porvenir and Corficolombiana are subsidiaries of Banco de Bogotá, whose financial data is consolidated into Banco de Bogotá’s results. Ownership percentages shown include direct and indirect participation.
|
|
(3)
|
This acquisition was completed on December 9, 2010. BAC Credomatic’s results of operations prior to December 1, 2010 are not included in Grupo Aval’s and Banco de Bogotá’s results that are described in this annual report.
|
We own 64.4% of the share capital of Banco de Bogotá, 68.2% of Banco de Occidente, 93.7% of Banco Popular, 79.9% of Banco AV Villas, 100.0% of Porvenir (20.0% directly and the remainder indirectly through our banks) and 56.4% of Corficolombiana indirectly through our banks, at December 31, 2011. In addition to his interest in Grupo Aval, Mr. Sarmiento Angulo beneficially owns 9.6% of Banco de Bogotá, 13.3% of Banco de Occidente, 0.5% of Banco Popular and 15.4% of Banco AV Villas, at December 31, 2011. We acquired an additional 43.5% of Banco Popular’s outstanding shares from Rendifin S.A., a company beneficially owned by Mr. Sarmiento Angulo on June, 23, 2011 and an additional 19.6% from Popular Securities S.A. and Inversiones Escorial S.A., companies beneficially owned by Mr. Sarmiento Angulo, on September 20, 2011. Each of our banks and Corficolombiana are publicly traded on the Colombian Stock Exchange and the remaining shares in these companies are held by minority shareholders.
We believe that each of our banking subsidiaries, as well as Porvenir, Corficolombiana and BAC Credomatic has an excellent reputation in the market within their individual sectors. Each of our banks and Corficolombiana are publicly traded on the Colombian Stock Exchange, and the remaining shares in these companies that are not beneficially owned by Mr. Sarmiento Angulo are held by minority shareholders.
Properties
Grupo Aval does not directly own any properties. We have listed below the property holdings of each of our banking subsidiaries, Porvenir, Corficolombiana and BAC Credomatic at December 31, 2011. All our subsidiaries own properties for corporate purposes only.
|
Value of properties
|
||||||||||||||||
|
Number of properties
|
Book value
|
Reappraisal
|
Total
|
|||||||||||||
|
(Ps billions)
|
||||||||||||||||
|
Banco de Bogotá
|
435 | 161.4 | 536.5 | 697.9 | ||||||||||||
|
Banco de Occidente
|
165 | 106.2 | 213.0 | 319.2 | ||||||||||||
|
Banco Popular
|
185 | 76.3 | 270.2 | 346.5 | ||||||||||||
|
Banco AV Villas
|
133 | 78.0 | 153.6 | 231.6 | ||||||||||||
|
Corficolombiana
|
112 | 5.2 | 26.1 | 31.3 | ||||||||||||
|
Porvenir
|
135 | 35.4 | 27.1 | 62.5 | ||||||||||||
|
BAC Credomatic
|
80 | 126.4 | 152.6 | 279.0 | ||||||||||||
|
Total
|
1,245 | 588.9 | 1,379.1 | 1,968.0 | ||||||||||||
Not applicable.
The following discussion of our financial condition and results of operations should be read in conjunction with our audited consolidated financial statements at December 31, 2011 and 2010 and for the years ended December 31, 2011, 2010 and 2009, and the related notes thereto, and with the other financial information included in this annual report. The preparation of the financial statements required the adoption of assumptions and estimates that affect the amounts recorded as assets, liabilities, revenue and expenses in the years and periods addressed and are subject to certain risks and uncertainties. Our future results may vary substantially from those indicated because of various factors that affect our business, including, among others, those identified under “Forward-Looking Statements” and “Item 3. Key Information—D. Risk factors” and other factors discussed in this annual report. Our audited consolidated financial statements at December 31, 2011 and 2010 and for the years ended December 31, 2011, 2010 and 2009 included in this annual report have been prepared in accordance with Colombian Banking GAAP.
Principal factors affecting our financial condition and results of operations
Colombian economic conditions
.
The Colombian economy has expanded in recent years, driven by strong growth in fundamental areas including capital investment, domestic consumption and exports. Colombian GDP grew at a CAGR of 4.4% in the five-year period from 2007 to 2011.
Our operations are primarily concentrated in Colombia, such that our results are linked to the country’s economic performance. After peaking at 6.9% in 2007, the pace of economic growth declined in 2008 and 2009, in large part due to the effects of the global economic and financial crisis. Annual GDP grew by 3.5% in 2008 and 1.7% in 2009, while the level of gross capital formation reached a peak of 25.2% of GDP in 2008 and dropped slightly to 24.1% of GDP in 2009. In response to the global economic environment and in order to stimulate growth in Colombia, the Colombian Central Bank loosened its monetary policy by cutting interest rates by 700 basis points between December 2008 and April 2010. Recently, economic activity in the country has been recovering. For example, the economy expanded 5.9% in 2011 as compared to 2010 (6.1% during the three-month period ended December 31, 2011 as compared to the same period in 2010) and expanded 4.0% in 2010 as compared to 2009, coupled with improved consumer confidence levels, strong capital inflows and an improvement in foreign trade. For 2012, the Colombian Central Bank’s GDP growth forecast currently stands in a range of 4.0% to 6.0%.
Labor markets
. During the year ended December 31, 2011, the Colombian unemployment rate decreased to 9.8% at December 31, 2011 as compared to 11.1% at December 31, 2010, according to DANE. The participation rate (i.e., economically active population divided by working age population) grew to 64.9% at December 31, 2011 from 62.9% at December 31, 2010, and the employment rate (i.e., employed population divided by working age population) increased to 58.5% at December 31, 2011 as compared to 55.9% at December 31, 2010. The increase in the employment rate derived primarily from increased employment in the trade, services and manufacturing economic sectors.
Interest rates.
Since the implementation of an inflation-targeting regime in 1999, the Colombian Central Bank’s overnight lending rate has been reduced from 26.0% in 1999 to 6.0% at the end of 2005, to 3.0% at the end of 2010, and to 4.75% at December 31, 2011.
Between 2006 and the summer of 2008, the Colombian Central Bank increased the overnight lending rate by 400 basis points to 10% in the face of accelerated growth and a series of perceived supply shortages. The conservative monetary policy of the Colombian Central Bank during this period, which included increases in reserve requirements, contributed to an increase in the DTF, which reached a high of 10.33% in 2008, the first double-digit DTF rate in six years. The DTF is a benchmark interest rate that represents the financial system’s average rate for 90-day term deposits.
A significant portion of Grupo Aval’s assets are linked to the DTF; accordingly, changes in the DTF affect our net interest income. The average DTF was 7.96% during 2007, and 9.69% during 2008. With the loosening of monetary policy that began in late 2008, the DTF fell throughout 2009, reaching a low of 4.11% and an average of 6.22% during 2009, and a low of 3.39% and an average of 3.67% during 2010. As the economy recovered and the
output gap began to close, the Colombian Central Bank increased its interest rate throughout 2011, starting in February of that year. It is expected that the DTF will increase moderately, but will remain at historically low levels during most of 2012. The average DTF was 4.15% during 2011.
Inflation
. Lower interest rates and stability in terms of inflation generally lead to increased consumer confidence and increased consumer demand for credit. Colombian Central Bank independence, and the adoption of an inflation-targeting regime and a free-floating currency in 1999, have contributed to declining inflation rates and increased price stability in Colombia. However, an increase in levels of economic activity in Colombia, combined with typical inflationary pressures in an expanding economic cycle, which inflated the price of basic food items, caused inflation to rise in 2007 and 2008, notwithstanding significant efforts by the Colombian Central Bank to control inflation. These efforts included increasing the intervention rate while maintaining reserve requirements, restrictions on foreign indebtedness and, as described above, increases in the overnight lending rate. Inflation rates reached 5.7% in 2007
and 7.7% in 2008, in excess of the Colombian Central Bank’s target rate.
In 2009, declines in commodity prices as a result of the global economic downturn and the slowdown in aggregate demand led to a significant downward adjustment in the inflation rate to 2.0%, the lowest rate in 50 years and well below the Colombian Central Bank’s target band of 4.5%-5.5% for that year. Despite the economic recovery, the inflation rate increased only slightly to 3.2% in 2010. At December 31, 2011, the inflation rate was 3.7%, within the Colombian Central Bank’s target band of 2.0% to 4.0%. The Colombian Central Bank’s preemptive approach with respect to monetary policy has resulted in a decrease in inflation expectations.
Credit volumes
. Credit volumes in Colombia have grown since 2005, mainly driven by the above-mentioned factors, including lower inflation rates, decreasing interest rates and consistent economic growth. According to the Superintendency of Finance, year-over-year bank credit volume growth, based on gross loans reported by all credit institutions to the Superintendency of Finance, was 24.1% in 2007 and 18.6% in 2008. However, the sharp slowdown in economic activity due to the global economic and financial crisis resulted in a significant moderation of bank credit volume growth in 2009 to 2.5%. In 2010, the pace of bank credit volume growth picked up gradually, along with a moderate recovery of economic activity and fueled by historic low interest rates. At December 31, 2010, year-over-year bank credit volume growth was 14.6% (including credit volume growth of five financing companies that merged with commercial banks during the previous 12 months, as reported by the Superintendency of Finance), while at December 31, 2011 growth was 22.1% (including three financing companies and one cooperative bank that converted to commercial banks during the previous 12 months, as reported by the Superintendency of Finance) and 20.5% when adjusted for securitized mortgage loans data, as reported by Titularizadora Colombiana S.A. We believe that Colombia offers significant opportunities to expand our business due to the country’s strong economic fundamentals and low penetration rates of domestic credit to the private sector as a percentage of GDP for banking and other financial services and products in 2010 of 43.5% as compared to 57.0% for Brazil, 86.3% for Chile and 24.3% for Peru, as reported in the 2011 World Bank Development Indicators.
In 2010, Colombia’s bank loans-to-GDP ratio was 29.3%, and at December 31, 2011 that ratio was 32.5%. See “Item 4. Information on the Company—B. Business overview—Industry—Colombia—Credit volumes.”
Reserve requirements
.
The Colombian Central Bank’s reserve requirements significantly affect our results of operations. The raising or lowering of these requirements directly affects our results by increasing or decreasing the funds available for lending.
Colombian banks are required to maintain a determined level of reserves depending on the volume and mix of their deposits. These are reflected in the line item “cash and cash equivalents” on our balance sheet. During 2008, this level of cash reserves, referred to as the general minimum deposit requirement, was first increased by the Colombian Central Bank from 8.3% to 11.5% for checking and saving accounts and from 2.5% to 6.0% for time deposits. Near the end of 2008, it was decreased to 11.0% for checking and saving accounts and 4.5% for time deposits.
In May 2007, as a cautionary measure, the Colombian Central Bank forced banks to maintain, in addition to the general minimum deposit requirement
,
a marginal minimum deposit requirement of approximately 13% of total deposits that exceeded the level that each bank had at May 7, 2007. This marginal minimum deposit requirement (27% for current accounts, 12.5% for saving accounts and 5% for time deposits) was a temporary measure aimed at decreasing the level of liquidity in the market and was eliminated by the Colombian Central Bank in mid-2008.
Reserve requirements have remained stable since late 2008; the Colombian Central Bank, however, has the power to modify these requirements.
Tax policies
. Changes in Colombian tax policies can significantly affect our results of operations. According to the Ministry of Finance, the fiscal balance of the consolidated public sector improved from a deficit of 2.9% of GDP in 2001 to a deficit of 0.1% of GDP in 2008. At the Colombian central government level, the deficit fell from 5.1% in 2001 to 2.3% of GDP in 2008. As a result, net debt at the non-financial public sector decreased from 40.5% of GDP at December 31, 2001 to 31.7% of GDP at December 31, 2008. During the same period Colombian central government debt decreased from 40.4% to 36.2% of GDP. However, given the moderate scope for countercyclical fiscal policy during the downturn of 2009, the deficit of the consolidated public sector expanded to 2.7% of GDP in 2009 and 3.2% of GDP in 2010, and the deficit of the Colombian central government expanded to 4.1% of GDP in 2009 and 3.8% of GDP in 2010.
The Colombian central government initially expected that the final fiscal deficit figures for 2011 would remain high, partly due to the relief and reconstruction efforts following the worst floods to hit the country in recent history, but it expected that the figures would start falling in 2012. In spite of these predictions, the preliminary figures for fiscal 2011 have been better than expected, with the consolidated public sector’s deficit shrinking to 2.2% of GDP and the Colombian central Government’s deficit also shrinking to 2.9% of GDP.
In order to address weaknesses in fiscal accounts, the Colombian central government enacted several laws to strengthen the fiscal regulatory regime, along with reforms on taxes and oil and mining royalties. The improvement in the fiscal regulatory regime requires expenses to grow in line with revenues and savings from excess oil revenues, with the goal of reducing Colombian central government public debt to below 30% of GDP by 2020.
In December 2009, the Colombian central government enacted Law No. 1370, creating a tax on equity (
Impuesto al Patrimonio
), or the “Equity Tax.” The Equity Tax is levied based on net worth as of January 1, 2011, subject to certain adjustments.
The tax rate applicable to us and our subsidiaries is 4.8% of our and their net worth. In addition, in December 2010 the Colombian central government enacted Decree No. 4825, creating a surcharge to the Equity Tax to fund certain costs associated with the natural disasters resulting from severe rainfalls. The surcharge rate applicable to us and our subsidiaries is 1.2%. This tax and the surcharge are payable in eight separate installments through 2014, resulting in an annual average rate of 1.5%. Pursuant to this tax regulation, Grupo Aval accrued a total liability of Ps 783.4 billion, and two installments of PS 97.9 billion each were paid in 2011.
In the future, declines in tax revenues and increasing public debt and administrative expenses may make it difficult for the Colombian central Government to balance the budget and may result in higher levels of taxation, which can significantly affect our results of operations or financial condition.
Central American economic conditions
. For the year ended December 31, 2011, Central America posted an estimated combined GDP of U.S.$
47.4
billion, ranking as the eighth-largest economy in Latin America after Brazil (nominal GDP of U.S.$2,518 billion), Mexico (nominal GDP of U.S.$1,185 billion), Argentina (nominal GDP of U.S.$435 billion), Venezuela (nominal GDP of U.S.$310 billion), Colombia (nominal GDP of U.S.$322 billion), Chile (nominal GDP of U.S.$243 billion) and Peru (nominal GDP of U.S.$169 billion).
Because BAC’s operations are concentrated in Central America, their results are linked to the region’s economic performance. According to estimates prepared by the IMF, Central America’s GDP is expected to grow at an annual average rate of
4.2
% between 2012 and 2014, compared to Colombia’s expected average growth rate of
4.5
% during the same period.
During the last several years, countries in the Central American region have increased their efforts to promote fiscal prudence and foreign investment. Countries such as Costa Rica, El Salvador, Guatemala and Nicaragua have signed agreements with the IMF under which their respective governments receive credit, subject to adopting fiscal discipline in their economic policies.
We believe that the Central America region offers a stable market that is expected to further converge toward an integrated economy as a result of the ongoing implementation of free trade agreements. DR-CAFTA gradually eliminates barriers to trade and investment among Costa Rica, El Salvador, Guatemala, Honduras, Nicaragua, the Dominican Republic and the United States. The agreement allows the Central American region to access markets in
the United States and establishes common regulatory standards among these countries. DR-CAFTA covers most types of trade and commercial exchange between these countries and the United States.
Critical accounting policies under Colombian Banking GAAP
Our principal accounting policies are described in note 2 to our audited consolidated financial statements included in this annual report. The following discussion describes those policies, under Colombian Banking GAAP, that require the most significant management judgments and estimates. These accounting estimates require management to make assumptions about matters that are highly uncertain and affect the reported amount of assets and liabilities at the date of the financial statements and the reported amounts of revenues and expenses during the reporting period. In each case, if management had made other estimates, or if changes in these estimates occur from period to period, our results of operations and financial condition could be materially affected. For a discussion of critical accounting policies under U.S. GAAP, see “—Critical accounting policies under U.S. GAAP.”
Management bases its estimates and judgments on historical experience and on factors that are believed to be reasonable under current circumstances. Actual results may differ from these estimates if actual experience differs from our assumptions or our assumptions change. Judgments or changes in assumptions are submitted to the audit committee of the board of directors and/or to our regulatory authorities and are disclosed in the notes to our consolidated financial statements.
Loan loss allowances and provisions.
We perform qualitative and quantitative analysis to assign a risk category to individual assets, under the rules issued by the Superintendency of Finance. The qualitative loan analysis involves an evaluation of specific factors to determine potential deficiencies that may affect the borrower’s payment capacity. For the quantitative evaluation, we first determine whether the loan has become due and then classify the loan according to the number of days past due. The Superintendency of Finance requires our banks to maintain minimum allowance levels for each category of credit risk and each type of loan.
Commercial and consumer loans are provisioned according to models developed by the Superintendency of Finance, which take into consideration the number of days the credits are past due. The allowance for these loans calculated in these models is determined by considering the “expected loss.” The expected loss for these loans is determined by multiplying the exposure to default of the credit by its “probability of default” (likelihood of a borrower defaulting on an obligation within the next 12 months) and its “loss given default” (an estimate of the amount the Bank would expect to lose in the event a borrower defaults). For purposes of calculating “loss given default,” loans collateralized are appraised by independent third parties. These appraisals may differ from the appraisals that would be calculated when the collateral finally would be recorded. Both the probability of default and the loss given default values are provided by the Superintendency of Finance depending on each category of credit risk and each type of loan. Furthermore, portfolios for which the Superintendency of Finance does not provide a standard model, specifically mortgage and microcredit loans, have a general allowance equal to 1.0% of the gross portfolio value in addition to specific provisions mandated according to the individual loans’ risk category.
We consider the accounting estimates used in this evaluation to be part of our critical accounting policies because: (1) we make qualitative judgments and assumptions regarding the quality of our loan portfolio to determine allowances and provisions; (2) our methods are dependent on the existence and magnitude of certain factors, which do not necessarily indicate future losses; and (3) we apply a discount percentage to each loan (based on its assigned risk category) that may not accurately reflect the future probability of loss.
Contingent liabilities.
Contingent liabilities arise from the normal conduct of our business activities and include liabilities for judicial, regulatory and arbitration proceedings, and tax and other claims. We record contingent liabilities, pursuant to Article 52 of Decree 2649 of 1993, to cover certain of our liabilities including those pertaining to damage claims from third parties based on professional responsibility, torts, labor law, breach of contract and others for which the contingency for loss is probable and its value can be reasonably quantified.
Article 52 of Decree 2649 of 1993 establishes that provisions should be recorded to cover estimated liabilities and contingencies of probable losses and to decrease the restated value of assets when necessary, as required in accordance with accounting standards. The provisions must be justifiable, quantifiable and reliable. A contingency is a condition, situation or set of circumstances that exist, which involve questions regarding a potential gain or loss by an economic entity, and which will be resolved when one or more future events occur or fail to occur.
Lawyers and actuaries assist us and our banks in evaluating probabilities and estimating amounts which are recorded and updated at the end of each period.
We consider the estimates used in assessing contingent liabilities to be part of our critical accounting policies because of the high level of judgment that is necessary to assess the probability of their occurrence. Our judgment may not necessarily coincide with the outcome of the proceedings.
Pension plans.
Under Decree 2984 of 2009, we are required to bring our non-contributory defined benefit pension plans from an underfunded to a funded status by 2029 according to the actuarial calculation, by crediting liabilities created for this specific purpose. By means of Resolution 1555 of July 30, 2010, the Superintendency of Finance replaced the mortality charts used to prepare the actuarial computation and determined that the effect of this change may be recognized gradually. At December 31, 2011, the underfunded level totaled Ps 366.9 billion (Banco de Bogotá amounted for Ps 133.7 billion, Banco de Occidente to Ps 3.7 billion and Banco Popular to Ps 229.5 billion). From that year on, the plans must be kept fully funded. Under Grupo Aval’s non-contributory defined benefit pension plan, benefits are based on length of service and level of compensation.
We consider the accounting estimates related to our and our subsidiaries’ pension plans to be part of our critical accounting policies as the amounts contributed to the plans involve certain assumptions and determinations made by our actuaries relating to, among others, adjustments to pensions and salaries, variations to the employee base and the employees’ partners, and discount rates for the pension liability adjustments. Key assumptions include weighted averages of past inflation rates, mortality rates, and average rates of return of certificates of deposit. Most of these parameters are provided by Colombian regulations and governmental institutions.
Recognition and measurement of financial instruments at fair value.
Under Colombian Banking GAAP, the fair value of a financial instrument is defined as the estimated amount at which the instrument could be exchanged in a current transaction between willing and independent parties.
Some of our assets are carried at fair value for Colombian Banking GAAP purposes, including equity and debt securities with quotations available or quoted prices for similar assets, aside from our merchant banking investments, derivatives and customers’ acceptances. The majority of our assets reported at fair value are based on quoted market prices, which provide the best indication of fair value, or quoted market prices for similar assets.
For our remaining assets, if quoted market prices or quoted market prices for similar assets are not available, we calculate their fair value by discounting the expected cash flows using market interest rates which take into account the credit quality and duration of the investment or by utilizing internally developed valuation techniques. In particular, management is involved in estimating future cash flows, based on variable terms of the instruments and the inherent credit risk, and in defining the applicable interest rate to discount those cash flows. Our fixed rate investments in this category are insignificant in value; however, we have material equity investments in this category, principally our equity investments
through our merchant bank, Corficolombiana.
We consider the determination of fair value for such assets to be part of our critical accounting policies because of the high degree of judgment and assumptions involved in developing and applying valuation methodologies.
Impairment evaluation of investment securities.
Securities are classified according to a methodology defined by Grupo Aval’s banking subsidiaries and approved by the Superintendency of Finance. The securities are categorized as “A” except for when there is a risk associated with them, in which case they are rated from “B” to “E.” For securities rated from “B” to “E,” the Superintendency of Finance has established a certain level of provision for each category. Additionally, t
he Superintendency of Finance in Colombia allows financial institutions to recognize, on a case-by-case-basis and after receiving the appropriate approval by the regulator, cautionary provisions for equity securities on the basis of management expectations on future decreases in fair value. Information used by management of our subsidiaries for the assessment consists of possible economic scenarios and expectations. At December 31, 2011, no issuers associated with any of these specific provisions were undergoing financial difficulties.
We consider the determination of the impairment of investments to be part of our critical accounting policies because of the high degree of judgment and assumptions involved in developing and applying valuation methodologies.
Goodwill recognized upon business combinations.
We test goodwill recognized upon business combinations for impairment at least annually using a two-step process beginning with an estimation of the fair value of a reporting unit. First, we screen for potential impairment, and, second, we measure the amount of impairment, if any. However, if certain criteria are met, the requirement to test goodwill for impairment annually may be satisfied without a remeasurement of the fair value of a reporting unit. Fair value is determined by management by reference to market value, if available, or by pricing models or with the assistance of a qualified evaluator. The latter two options require management to use estimates and make assumptions, which management considers reasonable and supportable in the existing market environment and commensurate with the risk profile of the valued assets. The valuation models used to determine the fair value of these companies and the intangibles are sensitive to changes in the assumptions. Adverse changes in any of these factors could lead us to record a goodwill or intangible impairment charge.
The Superintendency of Finance requires financial entities to calculate amortization of goodwill using the exponential method. Consistent with Colombian Banking GAAP we also perform impairment tests using the discounted cash flow methodology. The amortization of goodwill shown in our consolidated financial statements is the larger of these two amounts.
We consider goodwill amortization and impairment tests to be part of our critical accounting policies because of the considerable effect assumptions and estimates used in the analysis have on its results.
Recent Colombian Banking GAAP pronouncements
In 2009, the Colombian Superintendency of Finance published External Circular No. 035, titled “Individual allowances for loans losses,” effective April 1, 2010, for the purpose of enhancing risk management. According to the allowance methodology of External Circular No. 035, individual allowances are the sum of two components: contra-cyclical individual allowances (which reflect the possible changes in credit risk of debtors during a period of deteriorating loan quality) and pro-cyclical individual allowances (which reflect the actual credit risk of the debtor). The adoption of this pronouncement did not have a significant impact on the consolidated financial statements of Grupo Aval.
Since July 15, 2009, and pursuant to Law 1328 of 2009, known as the Financial Reform Law, banking institutions were authorized to perform leasing transactions. Consequently, our banks adopted the specific accounting regulations established by the Superintendency of Finance for this type of operation, which up until then only related to commercial finance companies. Prior to the implementation of Law 1328, our banks’ leasing operations were required to be conducted through subsidiaries. The adoption of this pronouncement did not have any impact on the consolidated financial statements of Grupo Aval.
On July 13, 2009, Law 1314 was signed by the President of Colombia. This law regulates the accounting, reporting and information assurance principles and standards that are generally accepted in Colombia and describes the procedure by which said principles and standards are to be issued by the oversight authorities. This law is generally expected to bring the currently generally accepted accounting principles in Colombia in line with International Financial Reporting Standards; however, changes to current regulations will only become effective, at the earliest, in 2012. Colombian authorities have proposed a schedule intended to determine the steps for implementing IFRS accounting principles in Colombia, which remained subject to comments until March 31, 2012. According to the proposed schedule, Colombian companies would (i) prepare a starting balance sheet as of January 1, 2013, and (ii) prepare financial statements in full compliance with IFRS accounting principles no later than December 31, 2014. Accounting for derivatives is regulated by External Circular 25 of 2008, Resolution 1420 of 2008 and Circular 66 of 2009 issued by the Superintendency of Finance. Before January 1, 2010, derivatives were recorded as a net asset at fair value, for both, positive or negative values. Since January 1, 2010, derivatives with a positive fair value are recorded as an asset, while derivatives with a negative fair value are recorded as a liability. This change in the accounting for derivatives may affect forward, option, swap and futures contracts entered into by Grupo Aval’s banking subsidiaries. To date, Grupo Aval is evaluating the application of these accounting standards, as such the effect on the consolidated financial statements has not been determined, due to the complexity of the conversion process.
Before Decree 2984 of August 12, 2009 became effective, Grupo Aval’s banking subsidiaries adhered to the requirements of Decree 1517 of August 4, 1998, which stated that, through annual installments, the provision of the
actuarial cost had to be 100.0% of coverage by December 31, 2010. Once Decree 2984 became effective, the annual provision increased on a straight-line basis in such a manner that 100.0% of the actuarial cost will be accomplished by of December 31, 2023. By means of Resolution 1555 of July 30, 2010, the Superintendency of Finance replaced the mortality charts used to prepare the actuarial computation and determined that the change effect may be recognized gradually. Later that year, Decree 4565 of December 7, 2010, modified the accounting standards on the amortization of the actuarial computation effective until that date. In conformity with this new Decree, companies whose actuarial computation had been 100% amortized as of December 31, 2009, may gradually amortize the increase on the 2010 estimated actuarial computation, using the new mortality charts until the year 2029. Considering the above, Grupo Aval modified its accounting policy on actuarial computation amortization regarding pension payments, quotas, parts and pension and health bonuses (commuted liabilities), and, as of 2010, it adopted a 19-year term to amortize the 2010 actuarial computation increase. As of 2009, the actuarial computation year’s increase was recorded as an expense for the period, because the actuarial computation was 100% amortized based on the previous charts. Payments of retirement pensions are made against the pertinent reserve. The adoption of this regulation increase the pension liability by Ps. 86,949 during the year 2010, which will be amortized up to 2029.
From January 1992 until December 2000, Grupo Aval and its consolidated banking subsidiaries’ financial statements were subject to inflation adjustments. The cumulative effect of these adjustments in non-monetary assets and liabilities is included in each of the adjusted accounts, and the adjustments to the equity accounts are included in the “equity inflation adjustments” line item.
During 2011, 2010 and 2009, the amount of such accounts decreased due to a payment of the Equity Tax. According to Law 1111 of 2006, under Colombian Banking GAAP, the Equity Tax was recorded against deferred charges and will be amortized in straight monthly basis between 2011 to 2014 with charges to the consolidated statement of income.
For recent U.S. GAAP pronouncements, see “—Recent U.S. GAAP pronouncements.”
Results of operations
Sources of income
Grupo Aval generates revenue through several sources. Its main source of income is the net interest income that its banking subsidiaries earn by borrowing funds from customers at certain rates and lending them to customers at higher rates.
The company also derives income from trading activities as follows: (1) interest and dividends from investments in fixed income and equity securities; (2) investment gains from fixed income, equity and derivative positions; and (3) the spread on derivative transactions entered into by the company’s banking subsidiaries to hedge market risk exposure.
In addition, the company earns fee and commission income from the different banking and financial services its banking subsidiaries provide, including fiduciary activities, leasing services, payment and collection services, credit and debit cards, and insurance.
Grupo Aval also earns income from the activities of Porvenir, the largest pension and severance fund manager in Colombia, which derives its revenue mainly from customers’ fee-based contributions for pension management, and Corficolombiana, our merchant bank, which generates revenues mainly from its equity and fixed income portfolios, as well as from gains on merchant banking investments, investment banking fees, and treasury operations. Porvenir and Corficolombiana are controlled by Grupo Aval’s banking subsidiaries.
As a consequence of our acquisition of BAC Credomatic, our results of operations for the years ended December 31, 2011 and 2010 may not be comparable with each other and with prior periods. LB Panama’s financial information is prepared in accordance with Colombian Banking GAAP and primarily reflects BAC Credomatic’s consolidated results, which are consolidated in LB Panama’s results from December 1, 2010. At December 31, 2011, LB Panama had Ps 2,017.3 billion of goodwill associated with the BAC Credomatic acquisition and Ps 524.5 billion of indebtedness that it incurred to finance, in part, the BAC Credomatic acquisition. Goodwill amortization and interest expense associated with the BAC Credomatic acquisition for the year ended December 31, 2011 were Ps 49.1 billion and Ps 19.4 billion, respectively.
Results of operations for the year ended December 31, 2011 compared to the year ended December 31, 2010
The following tables present our consolidated results of operations for the year ended December 31, 2011 as compared to the year ended December 31, 2010, broken down among our four banking subsidiaries, adjusted to reflect intercompany eliminations and our contribution as the holding company.
|
For the year ended December 31, 2011
|
||||||||||||||||||||||||
|
Banco de Bogotá
|
Banco de Occidente
|
Banco Popular
|
Banco AV Villas
|
Grupo Aval and eliminations
|
Grupo Aval consolidated
|
|||||||||||||||||||
|
(in Ps billions)
|
||||||||||||||||||||||||
|
Total interest income
|
4,395.9 | 1,592.7 | 1,403.2 | 717.6 | 41.4 | 8,150.8 | ||||||||||||||||||
|
Total interest expense
|
(1,459.2 | ) | (525.5 | ) | (417.8 | ) | (169.0 | ) | (110.4 | ) | (2,681.9 | ) | ||||||||||||
|
Net interest income
|
2,936.7 | 1,067.2 | 985.4 | 548.6 | (69.0 | ) | 5,468.9 | |||||||||||||||||
|
Total provisions (reversals), net
|
(139.0 | ) | (176.6 | ) | (67.3 | ) | (33.4 | ) | (0.0 | ) | (416.3 | ) | ||||||||||||
|
Total fees and other services income, net
|
1,756.8 | 198.5 | 150.7 | 151.2 | (22.8 | ) | 2,234.4 | |||||||||||||||||
|
Total other operating income
|
758.1 | 314.3 | 51.8 | 3.4 | (169.7 | ) | 958.0 | |||||||||||||||||
|
Total operating income
|
5,312.6 | 1,403.5 | 1,120.7 | 669.7 | (261.5 | ) | 8,244.9 | |||||||||||||||||
|
Total operating expenses
|
(2,968.0 | ) | (846.3 | ) | (623.2 | ) | (436.0 | ) | (59.6 | ) | (4,932.9 | ) | ||||||||||||
|
Net operating income
|
2,344.6 | 557.2 | 497.5 | 233.8 | (321.1 | ) | 3,312.0 | |||||||||||||||||
|
Total non-operating income (expense), net
|
68.5 | 15.5 | 57.2 | 7.1 | 48.0 | 196.2 | ||||||||||||||||||
|
Income before income tax expense and non-controlling interest
|
2,413.1 | 572.7 | 554.7 | 240.8 | (273.1 | ) | 3,508.2 | |||||||||||||||||
|
Income tax expense
|
(737.2 | ) | (139.0 | ) | (177.5 | ) | (75.4 | ) | (7.7 | ) | (1,136.7 | ) | ||||||||||||
|
Income before non-controlling interest
|
1,675.9 | 433.7 | 377.2 | 165.5 | (280.8 | ) | 2,371.5 | |||||||||||||||||
|
Non-controlling interest
|
(530.2 | ) | (1.6 | ) | (5.0 | ) | (0.2 | ) | (543.3 | ) | (1,080.2 | ) | ||||||||||||
|
Net income attributable to shareholders
|
1,145.7 | 432.1 | 372.2 | 165.2 | (824.0 | ) | 1,291.2 | |||||||||||||||||
|
For the year ended December 31, 2010
|
||||||||||||||||||||||||
|
Banco de Bogotá
|
Banco de Occidente
|
Banco Popular
|
Banco AV Villas
|
Grupo Aval and eliminations
|
Grupo Aval consolidated
|
|||||||||||||||||||
|
(in Ps billions)
|
||||||||||||||||||||||||
|
Total interest income
|
3,345.6 | 1,403.9 | 1,276.2 | 683.1 | (166.2 | ) | 6,542.6 | |||||||||||||||||
|
Total interest expense
|
(902.1 | ) | (457.2 | ) | (325.3 | ) | (142.8 | ) | (86.4 | ) | (1,913.8 | ) | ||||||||||||
|
Net interest income
|
2,443.5 | 946.7 | 950.9 | 540.3 | (252.6 | ) | 4,628.8 | |||||||||||||||||
|
Total provisions (reversals), net
|
(610.6 | ) | (192.3 | ) | (101.6 | ) | (122.4 | ) | (0.0 | ) | (1,026.9 | ) | ||||||||||||
|
Total fees and other services income, net
|
1,155.1 | 186.6 | 136.1 | 140.5 | (0.6 | ) | 1,617.7 | |||||||||||||||||
|
Total other operating income
|
582.4 | 316.7 | 42.0 | 9.7 | (165.3 | ) | 785.5 | |||||||||||||||||
|
Total operating income
|
3,570.3 | 1,257.6 | 1,027.5 | 568.1 | (418.5 | ) | 6,005.1 | |||||||||||||||||
|
Total operating expenses
|
(1,757.9 | ) | (764.4 | ) | (558.3 | ) | (389.8 | ) | (49.5 | ) | (3,520.0 | ) | ||||||||||||
|
Net operating income
|
1,812.4 | 493.2 | 469.2 | 178.4 | (468.0 | ) | 2,485.1 | |||||||||||||||||
|
Total non-operating income (expense), net
|
96.0 | 21.4 | 53.0 | 16.2 | (9.6 | ) | 176.9 | |||||||||||||||||
|
Income before income tax expense and non-controlling interest
|
1,908.3 | 514.6 | 522.2 | 194.5 | (477.6 | ) | 2,662.1 | |||||||||||||||||
|
Income tax expense
|
(510.0 | ) | (126.2 | ) | (156.8 | ) | (49.9 | ) | 11.8 | (831.0 | ) | |||||||||||||
|
Income before non-controlling interest
|
1,398.3 | 388.4 | 365.4 | 144.7 | (465.8 | ) | 1,831.1 | |||||||||||||||||
|
Non-controlling interest
|
(483.4 | ) | (2.0 | ) | (3.8 | ) | (0.4 | ) | (384.7 | ) | (874.2 | ) | ||||||||||||
|
Net income attributable to shareholders
|
914.9 | 386.4 | 361.6 | 144.3 | (850.4 | ) | 956.9 | |||||||||||||||||
|
Grupo Aval
|
||||||||
|
Change, 2011 vs. 2010
|
||||||||
|
(in Ps billions)
|
%
|
|||||||
|
Total interest income
|
1,608.2 | 24.6 | ||||||
|
Total interest expense
|
768.1 | 40.1 | ||||||
|
Net interest income
|
840.1 | 18.1 | ||||||
|
Total provisions (reversals), net
|
(610.6 | ) | (59.5 | ) | ||||
|
Total fees and other services income, net
|
616.6 | 38.1 | ||||||
|
Total other operating income
|
172.5 | 22.0 | ||||||
|
Total operating income
|
2,239.9 | 37.3 | ||||||
|
Total operating expenses
|
1,413.0 | 40.1 | ||||||
|
Net operating income
|
826.9 | 33.3 | ||||||
|
Total non-operating income (expense), net
|
19.3 | 10.9 | ||||||
|
Income before income tax expense and non-controlling interest
|
846.1 | 31.8 | ||||||
|
Income tax expense
|
305.8 | 36.8 | ||||||
|
Income before non-controlling interest
|
540.4 | 29.5 | ||||||
|
Non-controlling interest
|
206.0 | 23.6 | ||||||
|
Net income attributable to shareholders
|
334.4 | 34.9 | ||||||
“Grupo Aval and eliminations” comprises our unconsolidated results at the holding company level and intercompany consolidation eliminations. The principal components are the following:
|
|
·
|
interest expense, which primarily reflects the cost of the bonds we have issued both in the Colombian and in the international markets at the holding company level;
|
|
|
·
|
total other operating income, which reflects the elimination of intercompany dividends;
|
|
|
·
|
total operating expenses, which reflect expenses at the holding company level, net of eliminations of intercompany operating expenses; and
|
|
|
·
|
non-controlling interest, net of applicable intercompany consolidation eliminations.
|
For further information, see “Grupo Aval HoldCo” and “Eliminations” described in “note 30—iv) Summary of significant differences and required U.S. GAAP disclosures—y) Segments disclosure” to our audited consolidated financial statements.
Grupo Aval and Banco de Bogotá’s results of operations in 2011 include 12 months of BAC Credomatic operations whereas the 2010 results include only one month of BAC Credomatic operations. In order to provide a meaningful comparison of Grupo Aval’s and Banco de Bogotá’s results in 2011 and 2010, we present LB Panama
’
s results, prepared under Colombian Banking GAAP, to disclose financial information of BAC Credomatic. LB Panama acquired 100% of BAC Credomatic on December 9, 2010 and consolidates its operations. LB Panama’s operations other than BAC Credomatic are immaterial. At December 31, 2011, LB Panama had Ps 2,017.3 billion (U.S.$903 million) of goodwill associated with the BAC Credomatic acquisition and Ps 524.5 billion (U.S.$270 million), of indebtedness that it incurred to finance, in part, the BAC Credomatic acquisition.
The following table presents Grupo Aval’s consolidated results and Grupo Aval’s consolidated results excluding LB Panama’s results. “Grupo Aval consolidated excluding LB Panama” is the result of subtracting “LB Panama” results from “Grupo Aval consolidated” results and subtracting the minority interest of the portion of LB Panama results attributable to third parties, which was Ps 117.7 billion for the year ended December 31, 2011 and Ps 18.4 billion for the year ended December 31, 2010.
|
Year ended December 31,
|
Change, 2011 vs. 2010
|
|||||||||||||||
|
2011
|
2010
|
# |
%
|
|||||||||||||
|
(in Ps billions)
|
||||||||||||||||
|
Total interest income
|
8,150.8 | 6,542.6 | 1,608.2 | 24.6 | ||||||||||||
|
Total interest expense
|
(2,681.9 | ) | (1,913.8 | ) | 768.1 | 40.1 | ||||||||||
|
Net interest income
|
5,468.9 | 4,628.8 | 840.1 | 18.1 | ||||||||||||
|
Total provisions (reversals), net
|
(416.3 | ) | (1,026.9 | ) | (610.6 | ) | (59.5 | ) | ||||||||
|
Total fees and other services income, net
|
2,234.4 | 1,617.7 | 616.6 | 38.1 | ||||||||||||
|
Total other operating income
|
958.0 | 785.5 | 172.5 | 22.0 | ||||||||||||
|
Total operating income
|
8,244.9 | 6,005.1 | 2,239.9 | 37.3 | ||||||||||||
|
Total operating expenses
|
(4,932.9 | ) | (3,520.0 | ) | 1,413.0 | 40.1 | ||||||||||
|
Net operating income
|
3,312.0 | 2,485.1 | 826.9 | 33.3 | ||||||||||||
|
Total non-operating income (expense), net
|
196.2 | 176.9 | 19.3 | 10.9 | ||||||||||||
|
Income before income tax expense and non-controlling interest
|
3,508.2 | 2,662.1 | 846.1 | 31.8 | ||||||||||||
|
Income tax expense
|
(1,136.7 | ) | (831.0 | ) | 305.8 | 36.8 | ||||||||||
|
Income before non-controlling interest
|
2,371.5 | 1,831.1 | 540.4 | 29.5 | ||||||||||||
|
Non-controlling interest
|
(1,080.2 | ) | (874.2 | ) | 206.0 | 23.6 | ||||||||||
|
Net income attributable to shareholders
|
1,291.2 | 956.9 | 334.4 | 34.9 | ||||||||||||
|
Grupo Aval consolidated excluding LB Panama
|
LB Panama (1)
|
|||||||||||||||||||||||||||
|
Year ended December 31,
|
Change, 2011 vs. 2010
|
Year ended December 31,
|
Change, 2011 vs. 2010
|
|||||||||||||||||||||||||
|
2011
|
2010
|
# |
%
|
2011 | 2010 | # | ||||||||||||||||||||||
|
(in Ps billions)
|
(in Ps billions)
|
|||||||||||||||||||||||||||
|
Total interest income
|
6,735.9 | 6,423.6 | 312.2 | 4.9 | 1,415.0 | 119.0 | 1,296.0 | |||||||||||||||||||||
|
Total interest expense
|
(2,346.8 | ) | (1,884.8 | ) | 462.0 | 24.5 | (335.1 | ) | (29.0 | ) | 306.2 | |||||||||||||||||
|
Net interest income
|
4,389.1 | 4,538.8 | (149.7 | ) | (3.3 | ) | 1,079.8 | 90.0 | 989.8 | |||||||||||||||||||
|
Total provisions (reversals), net
|
(251.3 | ) | (1,024.7 | ) | (773.4 | ) | (75.5 | ) | (165.0 | ) | (2.3 | ) | 162.7 | |||||||||||||||
|
Total fees and other services income, net
|
1,635.0 | 1,562.7 | 72.4 | 4.6 | 599.3 | 55.1 | 544.3 | |||||||||||||||||||||
|
Total other operating income
|
861.5 | 768.2 | 93.3 | 12.1 | 96.5 | 17.3 | 79.2 | |||||||||||||||||||||
|
Total operating income
|
6,634.3 | 5,845.0 | 789.3 | 13.5 | 1,610.6 | 160.1 | 1,450.5 | |||||||||||||||||||||
|
Total operating expenses
|
(3,798.4 | ) | (3,406.0 | ) | 392.5 | 11.5 | (1,134.5 | ) | (114.0 | ) | 1,020.5 | |||||||||||||||||
|
Net operating income
|
2,835.9 | 2,439.0 | 396.9 | 16.3 | 476.1 | 46.1 | 430.0 | |||||||||||||||||||||
|
Total non-operating income (expense), net
|
193.4 | 148.7 | 44.7 | 30.1 | 2.9 | 28.3 | (25.4 | ) | ||||||||||||||||||||
|
Income before income tax expense and non-controlling interest
|
3,029.2 | 2,587.7 | 441.6 | 17.1 | 479.0 | 74.4 | 404.6 | |||||||||||||||||||||
|
Income tax expense
|
(988.8 | ) | (809.6 | ) | 179.3 | 22.1 | (147.9 | ) | (21.4 | ) | 126.5 | |||||||||||||||||
|
Income before non-controlling interest
|
2,040.4 | 1,778.1 | 262.3 | 14.8 | 331.1 | 53.0 | 278.1 | |||||||||||||||||||||
|
Non-controlling interest
|
(962.5 | ) | (855.9 | ) | 106.6 | 12.5 | (0.1 | ) | (0.0 | ) | 0.1 | |||||||||||||||||
|
Net income attributable to shareholders
|
1,077.9 | 922.2 | 155.7 | 16.9 | 331.0 | 53.0 | 278.0 | |||||||||||||||||||||
|
(1)
|
LB Panama’s financial information is prepared in accordance with Colombian Banking GAAP and primarily reflects BAC Credomatic’s consolidated results, which are consolidated in LB Panama’s results from December 1, 2010. At December 31, 2011, LB Panama had Ps 2,017.3 billion of goodwill associated with the BAC Credomatic acquisition and Ps 524.5 billion of indebtedness that it incurred to finance, in part, the BAC Credomatic acquisition. Goodwill amortization and interest expense associated with the BAC Credomatic acquisition for the year ended December 31, 2011 were Ps 49.1 billion and Ps 19.4 billion, respectively.
|
Grupo Aval
Overview
Our net income attributable to shareholders for the year ended December 31, 2011 increased by 34.9%, or Ps 334.4 billion, to Ps 1,291.2 billion primarily due to the inclusion of a full fiscal year of BAC Credomatic’s results and growth in our Colombian operations. Our operations excluding LB Panama contributed Ps 1,077.9 billion, 83.5%, and LB Panama’s operations contributed Ps 213.3 billion (which is equivalent to 64.4%, Grupo Aval’s direct ownership in Banco de Bogotá, of Ps 331.0 billion of LB Panama’s net income before minority interest in 2011) or 16.5% to net income attributable to shareholders.
Net income from our operations excluding LB Panama increased by 16.9%, or Ps 155.7 billion, to Ps 1,077.9 billion for the year ended December 31, 2011, primarily due to (1) a rise in interest income from loans and financial leases of Ps 758.5 billion, or 15.5%, attributable to the 20.3% growth in the average balance of loans and financial leases, (2) an increase in net fee income of Ps 72.4 billion or 4.6%, (3) an increase in other operational income of Ps 93.3 billion or 12.1%, and (4) a decrease in net provision expense of Ps 773.4 billion, or 75.5%, attributable for the most part to Corficolombiana’s reversal of provisions relating to its non-consolidated equity investments during 2010 and an improvement in our loan portfolio quality. These effects were partially offset by a decrease in interest income from investment securities of Ps 471.6 billion, or 32.6%, associated with non-recurring gains that were realized in 2010 at Corficolombiana (see
“
—
Segment results of operations for the year ended December 31, 2011 compared to the year ended December 31, 2010
—
Banco de Bogotá
—
Banco de Bogotá subsidiary analysis
—
Corficolombiana
”
), an increase in total interest expense of Ps 462.0 billion, or 24.5%, and an increase in operational expenses of Ps 392.5 billion or 11.5%.
The following discussion describes the principal drivers of our consolidated results of operations for the year ended December 31, 2011 and 2010. Further detail is provided in the discussions of the results of operations of each of our banking subsidiaries, LB Panama, Porvenir and Corficolombiana.
Net interest income
|
Year ended December 31,
|
Change, 2011 vs. 2010
|
|||||||||||||||
|
2011
|
2010
|
# |
%
|
|||||||||||||
|
(in Ps billions)
|
||||||||||||||||
|
Interest income:
|
||||||||||||||||
|
Interest on loans
|
6,514.6 | 4,627.3 | 1,887.3 | 40.8 | ||||||||||||
|
Interest on investment securities
|
1,029.8 | 1,452.7 | (422.9 | ) | (29.1 | ) | ||||||||||
|
Interbank and overnight funds
|
145.5 | 99.0 | 46.5 | 47.0 | ||||||||||||
|
Financial leases
|
460.9 | 363.6 | 97.3 | 26.8 | ||||||||||||
|
Total interest income
|
8,150.8 | 6,542.6 | 1,608.2 | 24.6 | ||||||||||||
|
Interest expense:
|
||||||||||||||||
|
Checking accounts
|
(82.4 | ) | (29.5 | ) | 52.9 | 179.5 | ||||||||||
|
Time deposits
|
(869.1 | ) | (679.1 | ) | 190.1 | 28.0 | ||||||||||
|
Savings deposits
|
(808.1 | ) | (640.8 | ) | 167.2 | 26.1 | ||||||||||
|
Total interest expense on deposits
|
(1,759.6 | ) | (1,349.4 | ) | 410.2 | 30.4 | ||||||||||
|
Borrowings from banks and others
|
(435.8 | ) | (177.0 | ) | 258.8 | 146.3 | ||||||||||
|
Interbank and overnight funds (expenses)
|
(146.9 | ) | (109.3 | ) | 37.6 | 34.4 | ||||||||||
|
Long-term debt (bonds)
|
(339.6 | ) | (278.1 | ) | 61.5 | 22.1 | ||||||||||
|
Total interest expense
|
(2,681.9 | ) | (1,913.8 | ) | 768.1 | 40.1 | ||||||||||
|
Net interest income
|
5,468.9 | 4,628.8 | 840.1 | 18.1 | ||||||||||||
|
Grupo Aval consolidated excluding LB Panama
|
LB Panama (1)
|
|||||||||||||||||||||||||||
|
Year ended December 31,
|
Change, 2011 vs. 2010
|
Year ended December 31,
|
Change, 2011 vs. 2010
|
|||||||||||||||||||||||||
|
2011
|
2010
|
# |
%
|
2011 | 2010 | # | ||||||||||||||||||||||
|
(in Ps billions)
|
(in Ps billions)
|
|||||||||||||||||||||||||||
|
Interest income:
|
||||||||||||||||||||||||||||
|
Interest on loans
|
5,195.6 | 4,515.9 | 679.7 | 15.1 | 1,319.0 | 111.4 | 1,207.6 | |||||||||||||||||||||
|
Interest on investment securities
|
977.0 | 1,448.6 | (471.6 | ) | (32.6 | ) | 52.8 | 4.1 | 48.7 | |||||||||||||||||||
|
Interbank and overnight funds
|
122.5 | 97.1 | 25.4 | 26.2 | 23.0 | 1.9 | 21.1 | |||||||||||||||||||||
|
Financial leases
|
440.8 | 362.0 | 78.7 | 21.7 | 20.1 | 1.6 | 18.6 | |||||||||||||||||||||
|
Total interest income
|
6,735.9 | 6,423.6 | 312.2 | 4.9 | 1,415.0 | 119.0 | 1,296.0 | |||||||||||||||||||||
|
Interest expense:
|
||||||||||||||||||||||||||||
|
Checking accounts
|
(52.8 | ) | (29.5 | ) | 23.3 | 79.2 | (29.6 | ) | - | 29.6 | ||||||||||||||||||
|
Time deposits
|
(704.2 | ) | (664.0 | ) | 40.3 | 6.1 | (164.9 | ) | (15.1 | ) | 149.8 | |||||||||||||||||
|
Savings deposits
|
(776.6 | ) | (635.6 | ) | 140.9 | 22.2 | (31.5 | ) | (5.2 | ) | 26.3 | |||||||||||||||||
|
Total interest expense from deposits
|
(1,533.6 | ) | (1,329.1 | ) | 204.5 | 15.4 | (226.0 | ) | (20.3 | ) | 205.7 | |||||||||||||||||
|
Borrowing from banks and others
|
(352.4 | ) | (170.5 | ) | 181.9 | 106.7 | (83.4 | ) | (6.5 | ) | 76.9 | |||||||||||||||||
|
Interbank and overnight funds (expenses)
|
(139.9 | ) | (108.9 | ) | 31.0 | 28.4 | (7.0 | ) | (0.4 | ) | 6.6 | |||||||||||||||||
|
Long-term debt (bonds)
|
(320.9 | ) | (276.4 | ) | 44.5 | 16.1 | (18.7 | ) | (1.8 | ) | 17.0 | |||||||||||||||||
|
Total interest expense
|
(2,346.8 | ) | (1,884.8 | ) | 462.0 | 24.5 | (335.1 | ) | (29.0 | ) | 306.2 | |||||||||||||||||
|
Net interest income
|
4,389.1 | 4,538.8 | (149.7 | ) | (3.3 | ) | 1,079.8 | 90.0 | 989.8 | |||||||||||||||||||
|
(1)
|
LB Panama’s financial information is prepared in accordance with Colombian Banking GAAP and primarily reflects BAC Credomatic’s consolidated results, which are consolidated in LB Panama’s results from December 1, 2010. At December 31, 2011, LB Panama had Ps 2,017.3 billion of goodwill associated with the BAC Credomatic acquisition and Ps 524.5 billion of indebtedness that it incurred to finance, in part, the BAC Credomatic acquisition. Goodwill amortization and interest expense associated with the BAC Credomatic acquisition for the year ended December 31, 2011 were Ps 49.1 billion and Ps 19.4 billion, respectively.
|
Our net interest income increased by 18.1% to Ps 5,468.9 billion for the year ended December 31, 2011. Our operations excluding LB Panama contributed Ps 4,389.1 billion (reflecting a decrease of 3.3%, or Ps 149.7 billion, as compared to fiscal year 2010) and LB Panama contributed Ps 1,079.8 billion.
The main reasons for the increase in net interest income was a Ps 1,984.6 billion increase in interest income on loans and financial leases, partially offset by a Ps 768.1 billion increase in total interest expense and a Ps 422.9 billion decrease in income from investment securities
LB Panama contributed 61.8% or Ps 1,226.2 billion of the increase in interest income on loans and financial leases and our operations excluding LB Panama contributed 38.2% or Ps 758.5 billion of such increase. In our operations excluding LB Panama, the Ps 758.5 billion or 15.5% increase in interest on loans and financial leases was achieved by a 20.3% or Ps 8,775.0 billion increase in the combined average balance of loans and financial leases and was partially offset by a decrease in the annualized yield on loans and financial leases from 11.3% for the year ended in December 31, 2010 to 10.8% for the year ended December 31, 2011. The decrease in the average yield on loans and financial leases from 11.3% for the year ended December 31, 2010 to 10.8% for the year ended December 31, 2011 primarily reflects a declining interest rate environment in the second half of 2010 and early 2011 together with a strong growth of our loan portfolio during 2011. After reaching the inflection point during the first quarter of 2011, we recorded an increase in the average yield on loans and financial leases in Colombia which partially reflected the increase in the Colombian Central Bank’s overnight lending rate. This trend continued through the rest of 2011. The average interest yield on loans and financial leases for Grupo Aval excluding LB Panama was 11.1%, during the last quarter of 2011.
LB Panama’s average balance of loans and financial leases for the year ended December 31, 2011 was Ps 9,961.3 billion and its yield on loans and financial leases was 13.4%.
Partially offsetting the increase in interest earned on loans and financial leases was a decrease in interest earned on investment securities of Ps 422.9 billion, or 29.1% to 1,029.8 billion for the year ended December 31, 2011 of which our operations excluding LB Panama contributed Ps 977.0 billion (resulting in a decrease of Ps 471.6 billion, or 32.6% versus results of 2010) and LB Panama contributed Ps 52.8 billion.
Under Colombian Banking GAAP, interest income from investment securities includes accrued interest on debt instruments, valuation adjustments and gains (losses) realized on debt and equity securities that are accounted for as “available for sale,” gains (losses) on repurchase transactions (i.e., repos), gains (losses) realized on the sale of debt securities, and mark-to-market gains (losses) on the trading securities portfolio.
The income yielded by Grupo Aval’s equity securities portfolio for the year ended December 31, 2011, was equivalent to 6.5% of our total income from investment securities for the period as compared to 34.8% for the year ended December 31, 2010. This decreased by Ps 439.1 billion, or 86.7%, to Ps 67.2 billion in the year ended December 31, 2011 from Ps 506.3 billion yielded in the year ended December 31, 2010. As further explained in the Corficolombiana December 2011 – December 2010 discussion, this decrease primarily reflected the fact that the gains realized by Corficolombiana related to the appreciation of its investments were significantly smaller during the year ended December 31, 2011 than during the same period ended December 31, 2010.
Grupo Aval’s fixed income portfolio yielded Ps 962.6 billion of income in the year ended December 31, 2011, and accounted for 93.5% of our earnings on investment securities for this period. These fixed income earnings were 1.7%, or Ps 16.2 billion, higher than the fixed income earnings generated in the year ended December 31, 2010. LB Panama accounted for a Ps 48.0 billion increase in fixed income partially offset by a Ps 31.8 billion decrease from our operations excluding LB Panama.
Also offsetting the increase in interest earned on loans and financial leases was the increase in total interest expense of Ps 768.1 billion or 40.1% to Ps 2,681.9 billion for the year ended December 31, 2011 of which our operations excluding LB Panama contributed Ps 2,346.8 billion (resulting in an increase of Ps 462.0 billion, or 24.5% as compared to total 2010) and LB Panama contributed. 335.1 billion.
The increase in total interest expense was mainly driven by a 38.6%, or Ps 20,859.4 billion, increase in the average balance of interest-bearing liabilities to Ps 74,874.6 billion, primarily due to (1) the inclusion of a full fiscal year of BAC Credomatic’s results and (2) the funding of and the foreign exchange rate risk management associated with this acquisition. Our operations excluding LB Panama recorded an average balance of interest-bearing liabilities of Ps 61,588.1 billion (Ps 8,627.6 billion or 16.3% higher than the average of 2010) and LB Panama recorded an average balance of interest-bearing liabilities of Ps 13,286.5 billion for the year December 31, 2011. In our operations excluding LB Panama, the above mentioned increase in the average balance of interest-bearing liabilities was mainly driven by a Ps 4,196.5 billion increase in the average balance of borrowings from banks and others to Ps 8,659.2 billion (partly due to a portion of the acquisition financing for BAC Credomatic’s purchase), a Ps 2,211.4 billion increase in the average balance of savings deposits to Ps 25,407.1 billion, and a Ps 939.8 billion increase in the average balance of long-term debt to Ps 5,274.6 billion.
Also contributing to the increase in interest expense in Grupo Aval was a slight increase in the average interest rate paid on interest-bearing liabilities from 3.5% in 2010 to 3.6% in 2011. The average interest rate paid on interest-bearing liabilities in our operations excluding LB Panama increased from 3.6% to 3.8%, in line with a rising interest rate environment as the average DTF rate increased from 3.66% in 2010 to 4.21% in 2011, while LB Panama registered an average interest rate paid on interest-bearing liabilities of 2.5%. For our operations excluding LB Panama the average rate paid on savings deposits increased from 2.7% in 2010 to 3.1% in 2011, the average rate paid on time deposits increased from 4.2% in 2010 to 4.4% in 2011 and the average rate paid on borrowings from banks and others increased from 3.8% in 2010 to 4,1% in 2011.
Our average interest-earning assets increased by 30.9% to Ps 83,773.9 billion in 2011 from Ps 63,978.9 billion in 2010 while our average interest-bearing liabilities increased by 38.6% to Ps 74,874.6 billion in 2011 from Ps 54,015.2 billion in 2010, which resulted in the ratio of average interest-earning assets to average interest-bearing liabilities decreasing from 1.18 at December 31, 2010 to 1.12 at December 31, 2011. The decrease in this ratio was mainly driven by the acquisition and financing of BAC Credomatic. LB Panama’s average interest-earning assets to
average interest-bearing liabilities ratio was 0.93 at December 31, 2011, while the ratio for our operations excluding LB Panama was 1.16 at December 31, 2011 as compared to 1.19 at December 31, 2010.
The average yield on interest earning assets for Grupo Aval decreased from 10.2% for the year ended December 31, 2010 to 9.7% for the year ended December 31, 2011, mainly driven by the decrease in the yield earned on investment securities (in particular a decline at Corficolombiana) resulting in lower investment securities income earned in 2011. The average yield earned on interest earning assets decreased despite the average balance of interest earning assets increasing during the year by Ps 19,795.1 billion or 30.9% in total interest earning assets to Ps 83,773.9 billion for the year December 31, 2011. The spread between the average yield on loans and financial leases and the average yield paid on interest-bearing liabilities decreased by 10 bps, from 7.8% for the year ended December 31, 2010 to 7.7% for the year ended December 31, 2011 because our liabilities repriced faster than our loans and financial leases, due to competitive pricing. Finally, Grupo Aval’s net interest margin decreased from 7.2% for the year ended December 31, 2010 to 6.5% for the year ended December 31, 2011 affected by the decrease in the average yield on loans and financial leases, a decrease in the average yield on investment securities associated with Corficolombiana’s non-consolidated equity securities and an increase in the average yield paid on interest-
bearing liabilities.
Provisions
Our total net provisions decreased by 59.5%, or Ps 610.6 billion, to Ps 416.3 billion for the year ended December 31, 2011. This decrease was mainly attributable to the Ps 606.7 billion decrease in net provisions for foreclosed assets and other assets to Ps (291.1 billion) indicating a recovery of Ps 291.1 billion. This decrease was mainly driven by Corficolombiana’s reversal of a Ps 245 billion cautionary market risk provision for its equity investments and a Ps 69.7 billion gross provision related to the realization of income stemming from its investment in SIE, which were established in 2010 (further explained in the Corficolombiana December 2011 – December 2010 discussion).
Our net provisions for loan and financial lease losses increased by 4.3% or 32.8 billion to Ps 797.2 billion. For our operations excluding LB Panama, provisions for loan and financial lease losses decreased by 16.8%, reflecting the improvement in the quality of our loan and financial lease portfolio, which was consistent with the recovery of the Colombian economy. According to DANE, for the year ended December 31, 2011 Colombia’s real GDP grew 5.9%, as compared to 4.0% for the year ended December 31, 2010.
The largest decrease in net provision for loans and financial leases losses was recorded by Banco AV Villas, where provisions decreased by Ps 77.5 billion or 53.4%, and Banco Popular, where provisions decreased by Ps 38.5 billion or 30.0%.
Past due loans and financial leases for Grupo Aval decreased by 2.1% to Ps 1,537.3 billion at December 31, 2011. In our operations excluding LB Panama past due loans and financial leases decreased by 4.0% to Ps 1,205.5 billion at December 31, 2011 while LB Panama’s past due loans and financial leases increased by 5.7% to Ps 331.8 billion at December 31, 2011. The decrease in past due loans and financial leases in our operations excluding LB Panama was concentrated primarily in commercial loans past due, which decreased by 19.6% to Ps 433.3 billion (with a delinquency ratio (calculated as the ratio of loans and financial leases at least 31 days past due to total gross loans and financial leases) improving from 1.7% to 1.2%) and mortgage loans past due, which decreased by 13.2% to Ps 69.6 billion (with a delinquency ratio improving from 10.6% to 8.3%).
Grupo Aval’s delinquency ratio improved from 2.7% (2.6% for our operations excluding LB Panama) at December 31, 2010 to 2.2% (2.1% for our operations excluding LB Panama) at December 31, 2011. LB Panama’s delinquency ratio at December 31, 2011 was 2.8% compared to 3.1% at December 31, 2010.
In our operations excluding LB Panama, each of our banks recorded improved delinquency ratios. Banco de Bogotá had the lowest delinquency ratio (1.6% at December 31, 2011, as compared to 2.2% at December 31, 2010), while Banco AV Villas continued to have the highest delinquency ratio (3.6% at December 31, 2011, as compared to 4.5% at December 31, 2010). The delinquency ratio at Banco AV Villas reflects a higher exposure to mortgage and traditional consumer loans. At December 31, 2011, 13.5% of Banco AV Villas’ total gross loans were mortgage loans (compared to 0.2%, 0.0%, and 0.9% for Banco de Bogotá’s operations excluding LB Panama, Banco de
Occidente, and Banco Popular, respectively) and 44.2% of Banco AV Villas’ total gross loans were consumer loans (compared to 17.7% and 19.1% at Banco de Bogotá’s operations excluding LB Panama and Banco de Occidente, respectively). Banco Popular has a higher proportion of consumer loans, though 97.4% of these loans are payroll loans which have a much higher credit quality than traditional consumer loans.
At December 31, 2011, charge-offs decreased by 0.1% to Ps 676.7 billion. Ps 511.6 billion correspond to our operations excluding LB Panama and Ps 165.1 to LB Panama’s. Our charge-off to average loan ratio decreased by 44 basis points to 1.07%. In our operations excluding LB Panama, our charge-offs decreased by 22.5%, and our charge-off to average loan ratio decreased by 53 basis points to 0.96%. For further information, see “Item 4. Information on the Company—B. Business overview—Selected statistical data—Movements in allowances for credit losses—Charge-offs.”
The higher level of our net provisions for loan and financial lease losses relative to our charge-offs resulted in the 5.6% growth of our allowance for loan and financial lease losses to Ps 2,306.5 billion at December 31, 2011. The growth of our allowance for loan and financial lease losses and the decrease in our past due loans resulted in an increase in our coverage ratio (defined as our allowance for loan and financial lease losses to loans at least 31 days past due) from 139.1% at December 31, 2010 to 150.0% at December 31, 2011. In our operations excluding LB Panama, our allowance increased by 5.8% to Ps 2,093.0 billion and the coverage ratio was 173.6% at December 31, 2011. The lower coverage ratio when incorporating the impact of LB Panama is due to the fact that LB Panama contributed more in past due loans than in allowance, given the fact that 29.0% of LB Panama’s gross loan portfolio is concentrated in mortgage loans (which require less allowance than other types of loans).
Net provisions for accrued interest and other receivables increased by Ps 21.8 billion to Ps 77.7 billion, while the recovery of charged-off assets increased by Ps 58.5 billion to Ps 167.5 billion primarily as a result of higher charge-offs and a more successful recovery effort.
Total fees and other services income, net
|
Year ended December 31,
|
Change, 2011 vs. 2010
|
|||||||||||||||
|
2011
|
2010
|
# |
%
|
|||||||||||||
|
(in Ps billions)
|
||||||||||||||||
|
Fees and other services income:
|
||||||||||||||||
|
Commissions from banking services
|
1,290.0 | 916.0 | 374.1 | 40.8 | ||||||||||||
|
Branch network services
|
35.0 | 22.2 | 12.8 | 57.9 | ||||||||||||
|
Credit card merchant fees
|
320.3 | 165.6 | 154.7 | 93.4 | ||||||||||||
|
Checking fees
|
74.4 | 69.5 | 4.8 | 7.0 | ||||||||||||
|
Warehouse services
|
175.0 | 147.5 | 27.5 | 18.7 | ||||||||||||
|
Fiduciary activities
|
149.9 | 146.9 | 3.0 | 2.1 | ||||||||||||
|
Pension plan administration
|
458.1 | 409.9 | 48.2 | 11.8 | ||||||||||||
|
Other
|
170.0 | 103.3 | 66.7 | 64.5 | ||||||||||||
|
Total fees and other services income
|
2,672.8 | 1,980.9 | 691.9 | 34.9 | ||||||||||||
|
Fees and other services expenses
|
(438.4 | ) | (363.1 | ) | 75.2 | 20.7 | ||||||||||
|
Total fees and other services income, net
|
2,234.4 | 1,617.7 | 616.6 | 38.1 | ||||||||||||
|
Grupo Aval consolidated excluding LB Panama
|
LB Panama (1)
|
|||||||||||||||||||||||||||
|
Year ended December 31,
|
Change, 2011 vs. 2010
|
Year ended December 31,
|
Change, 2011 vs. 2010
|
|||||||||||||||||||||||||
|
2011
|
2010
|
# |
%
|
2011 | 2010 | # | ||||||||||||||||||||||
|
(in Ps billions)
|
(in Ps billions)
|
|||||||||||||||||||||||||||
|
Fees and other services income:
|
||||||||||||||||||||||||||||
|
Commissions from banking services
|
873.8 | 878.0 | (4.2 | ) | (0.5 | ) | 416.2 | 37.9 | 378.3 | |||||||||||||||||||
|
Branch network services
|
35.0 | 22.2 | 12.8 | 57.9 | – | – | – | |||||||||||||||||||||
|
Credit card merchant fees
|
146.9 | 147.0 | (0.0 | ) | (0.0 | ) | 173.4 | 18.6 | 154.8 | |||||||||||||||||||
|
Checking fees
|
74.4 | 69.5 | 4.8 | 7.0 | – | – | – | |||||||||||||||||||||
|
Warehouse services
|
175.0 | 147.5 | 27.5 | 18.7 | – | – | – | |||||||||||||||||||||
|
Fiduciary activities
|
149.9 | 146.9 | 3.0 | 2.1 | – | – | – | |||||||||||||||||||||
|
Pension plan administration
|
448.4 | 409.9 | 38.4 | 9.4 | 9.8 | – | 9.8 | |||||||||||||||||||||
|
Other
|
115.0 | 97.6 | 17.4 | 17.9 | 55.0 | 5.7 | 49.3 | |||||||||||||||||||||
|
Total fees and other services income
|
2,018.4 | 1,918.6 | 99.8 | 5.2 | 654.4 | 62.3 | 592.1 | |||||||||||||||||||||
|
Fees and other services expenses
|
(383.4 | ) | (355.9 | ) | 27.4 | 7.7 | (55.0 | ) | (7.2 | ) | 47.8 | |||||||||||||||||
|
Total fees and other services income, net
|
1,635.0 | 1,562.7 | 72.4 | 4.6 | 599.3 | 55.1 | 544.3 | |||||||||||||||||||||
|
(1)
|
LB Panama’s financial information is prepared in accordance with Colombian Banking GAAP and primarily reflects BAC Credomatic’s consolidated results, which are consolidated in LB Panama’s results from December 1, 2010. At December 31, 2011, LB Panama had Ps 2,017.3 billion of goodwill associated with the BAC Credomatic acquisition and Ps 524.5 billion of indebtedness that it incurred to finance, in part, the BAC Credomatic acquisition. Goodwill amortization and interest expense associated with the BAC Credomatic acquisition for the year ended December 31, 2011 were Ps 49.1 billion and Ps 19.4 billion, respectively.
|
Total fees and other services income, net increased by 38.1% to Ps 2,234.4 billion for the year ended December 31, 2011. Total fees and other services income increased by Ps 691.1 billion to Ps 2,672.8 billion, while fees and other services expenses increased by Ps 75.2 billion to Ps 438.4 billion. Of the total fees and other service income, net our operations excluding LB Panama contributed Ps 1,635.0 billion (reflecting an increase of Ps 72.4 billion or 4.6% from Ps 1,562.7 billion in 2010), and LB Panama contributed Ps 599.3 billion.
In our operations excluding LB Panama gross total fees and other services income increased by Ps 99.8 billion or 5.2% to Ps 2,018.4 billion, while fees and other services expenses increased by Ps 27.4 billion or 7.7% to Ps 383.4 billion for the year ended December 31, 2011. The main drivers of the increase in fee and other services income were (1) an increase of Ps 38.4 billion or 9.4% to Ps 448.4 billion in 2011 in fees from the pension plan administration (for further detail see Porvenir 2011-2010 results of operations discussion), (2) an increase in warehouse services of Ps 27.5 billion or 18.7% to Ps 175.0 billion in 2011 from Almaviva and Alpopular, (3) an increase in Others of Ps 17.4 billion or 17.9% to 115.0 billion (of which Ps 10.8 billion correspond to Banco AV Villas) and (4) an increase of 12.8 billion or 57.9% in branch network services.
LB Panama accounted for Ps 416.2 billion in income from commissions from banking services, Ps 173.4 billion in income from credit card merchant fees, Ps 55.0 billion in “Other” fee income and Ps 55.0 billion in fees and other services expenses, each for the year ended December 31, 2011.
Other operating income
|
Year ended December 31,
|
Change, 2011 vs. 2010
|
|||||||||||||||
|
2011
|
2010
|
# |
%
|
|||||||||||||
|
(in Ps billions)
|
||||||||||||||||
|
Foreign exchange gains (losses), net
|
206.4 | 49.5 | 156.9 | 316.9 | ||||||||||||
|
Gains (losses) on derivative operations, net
|
(18.8 | ) | 92.9 | (111.7 | ) | (120.3 | ) | |||||||||
|
Gains on sales of investments in equity securities, net
|
41.9 | 87.5 | (45.6 | ) | (52.1 | ) | ||||||||||
|
Income from non-financial sector, net(1)
|
441.7 | 294.8 | 146.9 | 49.8 | ||||||||||||
|
Dividend income
|
78.9 | 43.5 | 35.4 | 81.3 | ||||||||||||
|
Other
|
208.0 | 217.4 | (9.4 | ) | (4.3 | ) | ||||||||||
|
Total other operating income
|
958.0 | 785.5 | 172.5 | 22.0 | ||||||||||||
|
Grupo Aval consolidated excluding LB Panama
|
LB Panama (2)
|
|||||||||||||||||||||||||||
|
Year ended December 31,
|
Change, 2011 vs. 2010
|
Year ended December 31,
|
Change, 2011 vs. 2010
|
|||||||||||||||||||||||||
|
2011
|
2010
|
# |
%
|
2011 | 2010 | # | ||||||||||||||||||||||
|
(in Ps billions)
|
(in Ps billions)
|
|||||||||||||||||||||||||||
|
Foreign exchange gains (losses), net
|
105.6 | 34.2 | 71.4 | 208.6 | 100.9 | 15.3 | 85.5 | |||||||||||||||||||||
|
Gains on derivative operations, net
|
(14.3 | ) | 90.9 | (105.1 | ) | (115.7 | ) | (4.6 | ) | 2.0 | (6.6 | ) | ||||||||||||||||
|
Gains on sales of investments in equity securities, net
|
41.9 | 87.5 | (45.6 | ) | (52.1 | ) | – | (0.0 | ) | 0.0 | ||||||||||||||||||
|
Income from non-financial sector, net(1)
|
441.7 | 294.8 | 146.9 | 49.8 | – | – | – | |||||||||||||||||||||
|
Dividend income
|
78.9 | 43.5 | 35.4 | 81.3 | – | – | – | |||||||||||||||||||||
|
Other
|
207.8 | 217.3 | (9.6 | ) | (4.4 | ) | 0.2 | 0.0 | 0.2 | |||||||||||||||||||
|
Other operating income
|
861.5 | 768.2 | 93.3 | 12.1 | 96.5 | 17.3 | 79.2 | |||||||||||||||||||||
|
(1)
|
Income from non-financial sector reflects the operating results of Corficolombiana ( Banco de Bogotá’s subsidiary) in its consolidated investments in companies not related to the financial sector such as Estudios Proyectos e Inversiones de los Andes S.A., or “Epiandes,” Hoteles Estelar S.A., or “Hoteles Estelar,” and Organización Pajonales S.A., or “Organización Pajonales,” among others. This result is net of the following operating and administrative expenses in the year ended December 31, 2011 and 2010: Ps 852.7 billion and Ps 644.3 billion, respectively. For a description of these investments, see “Item 4. Information on the Company—B. Business overview—Corficolombiana—Equity investment portfolio.”
|
|
(2)
|
LB Panama’s financial information is prepared in accordance with Colombian Banking GAAP and primarily reflects BAC Credomatic’s consolidated results, which are consolidated in LB Panama’s results from December 1, 2010. At December 31, 2011, LB Panama had Ps 2,017.3 billion of goodwill associated with the BAC Credomatic acquisition and Ps 524.5 billion of indebtedness that it incurred to finance, in part, the BAC Credomatic acquisition. Goodwill amortization and interest expense associated with the BAC Credomatic acquisition for the year ended December 31, 2011 were Ps 49.1 billion and Ps 19.4 billion, respectively.
|
Total other operating income increased by 22.0% to Ps 958.0 billion for the year ended December 31, 2011. Our operations excluding LB Panama contributed Ps 861.5 billion (showing an increase of Ps 93.3 billion or 12.1% versus the results in 2010) and LB Panama contributed Ps 96.5 billion.
The increase (including LB Panama) was primarily due to Ps 146.9 billion increase in income from non-financial sector investments attributable to better operating results of Epiandes, Episol, Pisa, Unipalma and Hoteles Estelar, whose results are consolidated in Corficolombiana’s financial statements, a Ps 35.4 billion or 81.3% increase in dividend income which primarily reflects dividend income from Promigas, a non-consolidated company of Corficolombiana which in 2010 was classified as “trading” and thus its dividend income was registered as interest income from investment securities, and a Ps 45.2 billion or 31.7 % increase in net foreign exchange and derivative operations.
The increase in net foreign exchange and derivative operations was mainly due to a Ps 156.9 billion increase in net foreign exchange gains, as a result of the volatility of the Colombian peso - U.S. dollar exchange rate (“Item 3. Key Information—A. Selected financial data—Exchange rates”). This was partially offset by the Ps 111.7 billion decrease in gains on derivative operations (primarily forward contracts in foreign currency). In the ordinary course of business, we enter into forward contracts and other derivative transactions in foreign currency through our treasury departments almost entirely for hedging purposes and on behalf of clients.
Operating expenses
|
Year ended December 31,
|
Change, 2011 vs. 2010
|
|||||||||||||||
|
2011
|
2010
|
# |
%
|
|||||||||||||
|
(in Ps billions)
|
||||||||||||||||
|
Salaries and employee benefits
|
(1,773.7 | ) | (1,262.4 | ) | 511.3 | 40.5 | ||||||||||
|
Bonus plan payments
|
(104.5 | ) | (45.1 | ) | 59.4 | 131.5 | ||||||||||
|
Termination payments
|
(23.9 | ) | (11.6 | ) | 12.3 | 106.3 | ||||||||||
|
Administrative and other expenses
|
(2,476.8 | ) | (1,817.1 | ) | 659.7 | 36.3 | ||||||||||
|
Deposit security, net
|
(162.8 | ) | (133.1 | ) | 29.7 | 22.3 | ||||||||||
|
Charitable and other donation expenses
|
(21.9 | ) | (7.2 | ) | 14.8 | 204.9 | ||||||||||
|
Depreciation
|
(276.7 | ) | (214.8 | ) | 61.9 | 28.8 | ||||||||||
|
Goodwill amortization
|
(92.6 | ) | (28.6 | ) | 64.0 | 223.7 | ||||||||||
|
Total operating expenses
|
(4,932.9 | ) | (3,520.0 | ) | 1,413.0 | 40.1 | ||||||||||
|
Grupo Aval consolidated excluding LB Panama
|
LB Panama (1)
|
|||||||||||||||||||||||||||
|
Year ended December 31,
|
Change, 2011 vs. 2010
|
Year ended December 31,
|
Change, 2011 vs. 2010
|
|||||||||||||||||||||||||
|
2011
|
2010
|
# |
%
|
2011 | 2010 | # | ||||||||||||||||||||||
|
(in Ps billions)
|
(in Ps billions)
|
|||||||||||||||||||||||||||
|
Salaries and employee benefits
|
(1,322.7 | ) | (1,226.7 | ) | 96.0 | 7.8 | (451.0 | ) | (35.7 | ) | 415.3 | |||||||||||||||||
|
Bonus plan payments
|
(50.6 | ) | (42.3 | ) | 8.3 | 19.6 | (53.9 | ) | (2.9 | ) | 51.1 | |||||||||||||||||
|
Termination payments
|
(6.6 | ) | (7.7 | ) | (1.0 | ) | (13.6 | ) | (17.3 | ) | (3.9 | ) | 13.4 | |||||||||||||||
|
Administrative and other expenses
|
(1,986.0 | ) | (1,753.8 | ) | 232.3 | 13.2 | (490.7 | ) | (63.3 | ) | 427.4 | |||||||||||||||||
|
Deposit security, net
|
(154.2 | ) | (132.4 | ) | 21.8 | 16.5 | (8.6 | ) | (0.7 | ) | 7.8 | |||||||||||||||||
|
Charitable and other donation expenses
|
(20.2 | ) | (7.0 | ) | 13.3 | 190.7 | (1.7 | ) | (0.2 | ) | 1.5 | |||||||||||||||||
|
Depreciation
|
(219.8 | ) | (210.4 | ) | 9.4 | 4.5 | (56.9 | ) | (4.4 | ) | 52.5 | |||||||||||||||||
|
Goodwill amortization
|
(38.3 | ) | (25.8 | ) | 12.5 | 48.4 | (54.4 | ) | (2.8 | ) | 51.5 | |||||||||||||||||
|
Total operating expenses
|
(3,798.4 | ) | (3,406.0 | ) | 392.5 | 11.5 | (1,134.5 | ) | (114.0 | ) | 1,020.5 | |||||||||||||||||
|
(1)
|
LB Panama’s financial information is prepared in accordance with Colombian Banking GAAP and primarily reflects BAC Credomatic’s consolidated results, which are consolidated in LB Panama’s results from December 1, 2010. At December 31, 2011, LB Panama had Ps 2,017.3 billion of goodwill associated with the BAC Credomatic acquisition and Ps 524.5 billion of indebtedness that it incurred to finance, in part, the BAC Credomatic acquisition. Goodwill amortization and interest expense associated with the BAC Credomatic acquisition for the year ended December 31, 2011 were Ps 49.1 billion and Ps 19.4 billion, respectively.
|
Total operating expenses for the year ended December 31, 2011 increased by 40.1%, or Ps 1,413.0 billion, to Ps 4,932.9 billion. Our operations excluding LB Panama contributed Ps 3,798.4 billion (reflecting an increase of Ps 392.5 billion or 11.5% as compared to the year ended December 31, 2010) and LB Panama’s operations contributed Ps 1,134.5 billion, to total operating expenses for the year ended December 31, 2011.
In our operations excluding LB Panama, total operating expenses increased primarily due to a Ps 232.3 billion or 13.2% rise in administrative and other expenses to Ps 1,986.0 billion and a Ps 96.0 billion or 7.8% increase in salaries and employee benefits to Ps 1,322.7 billion.
The increase in administrative and other expenses in our operations excluding LB Panama was mainly driven by the increase in the Equity Tax paid by Grupo Aval and its subsidiaries. In 2011, the Equity Tax was levied on each entity based on its adjusted net worth as of January 1, 2011, while in 2010, the Equity Tax was calculated based on each entity’s adjusted net worth as of December 31, 2006. The tax rate applicable to Grupo Aval and its subsidiaries for 2011 was 4.8% of each entity’s net worth. In addition, in December 2010 the Colombian Government enacted Decree No. 4825, creating an additional surcharge to the Equity Tax in order to fund certain costs that resulted from natural disasters in Colombia. The surcharge rate applicable to Grupo Aval and its subsidiaries is an additional
1.2%, resulting in an aggregate rate of 6.0%. This tax (including the surcharge) is payable in four separate installments commencing in May 2011 through to May 2014 (4 yearly payments of 1.5% of the adjusted net worth at January 1, 2011 per entity). See “—Principal factors affecting our financial condition and results of operations—Tax policies.” On a consolidated basis, Grupo Aval accrued a liability of Ps 783.4 billion as of January 1, 2011 for the payment of the Equity Tax and as of December 31, 2011, such liability had decreased to Ps 587.5 billion, reflecting the payment of the first installment. (See “—Principal factors affecting our financial condition and results of operations—Tax policies.”).
Salaries and employee benefits in our operations excluding LB Panama increased 7.8% during 2011. They customarily increase on a yearly basis using as basis the previous year’s Consumer Price Index (CPI), which was 3.2% in 2010. Total Colombian headcount increased by 3.3% from 37,710 at December 31, 2010 to 38,965 at December 31, 2011, and on a per capita basis salary and employee benefits increased by 4.4%.
Because our total operating expenses before depreciation and amortization grew at 39.3%, while our operating income before provisions increased by 23.2% (both including LB Panama), our efficiency ratio deteriorated at December 31, 2011 compared to December 31, 2010 from 46.6% to 52.7% at December 31, 2011. The efficiency ratio of our operations excluding LB Panama deteriorated from 46.1% to 51.4% while LB Panama’s efficiency ratio at December 31, 2011 was 57.6%. The deterioration in our efficiency ratio was associated with the contraction in the net interest margin explained in the net interest income subsection. The ratio of operating expenses before depreciation and amortization as a percentage of average earning assets excluding LB Panama was 5.0% for both 2010 and 2011.
Non-operating income (expense)
Total net non-operating income (expense) for the year ended December 31, 2011 was Ps 196.2 billion, which represents a Ps 19.3 billion or 10.9% increase from total net non-operating income of Ps 176.9 billion for the year ended December 31, 2010. This increase was primarily due to a one-time income caused by the difference between the conversion price of Banco de Bogota’s BOCEAS and the intrinsic value of Banco de Bogotá’s shares in Grupo Aval’s financial statements, which was responsible for generating Ps 43.5 billion of income, partially offset by Ps 25.4 billion decrease in reversals associated with LB Panama (further explained in “—Segment results of operations for the year ended December 31, 2011 compared to the year ended December 31, 2010—Banco de Bogotá subsidiary analysis—LB Panama”).
Income tax expense
Income before income tax expense and non-controlling interest, including LB Panama, increased by Ps 846.1 billion or 31.8% from Ps 2,662.1 billion for the year ended December 31, 2010 to Ps 3,508.0 billion for the year ended December 31, 2011. Our income tax expense increased by 36.8% to Ps 1,136.7 billion for the year ended December 31, 2011. Our effective tax rate increased from 31.2% for the year ended December 31, 2010 to 32.4% for the year ended December 31, 2011 due to higher non-tax deductible expenses such as Equity Tax.
Non-controlling interest
Income before non-controlling interest increased by 29.5% from Ps 1,831.1 billion for the year ended December 31, 2010 to Ps 2,371.5 billion in for the same period in 2011, and our non-controlling interest increased by 23.6% to Ps 1,080.2 billion for the year ended December 31, 2011. Factors such as the acquisition of BAC and the increase of Grupo Aval’s ownership in Banco Popular during 2011 were responsible for decreasing the ratio of our non-controlling interest over income before non-controlling interest from 47.7% to 45.6% between December 31, 2010 and December 31, 2011.
Results of operations for the year ended December 31, 2010 compared to the year ended December 31, 2009
The following tables present our consolidated results of operations for the year ended December 31, 2010 as compared to the year ended December 31, 2009, broken down among our four banking subsidiaries and adjusted to reflect intercompany eliminations and our contribution as the holding company.
|
For the year ended December 31, 2010
|
||||||||||||||||||||||||
|
Banco de Bogotá
|
Banco de Occidente
|
Banco Popular
|
Banco AV Villas
|
Grupo Aval and eliminations
|
Grupo Aval consolidated
|
|||||||||||||||||||
|
(in Ps billions)
|
||||||||||||||||||||||||
|
Total interest income
|
3,345.6 | 1,403.9 | 1,276.2 | 683.1 | (166.2 | ) | 6,542.6 | |||||||||||||||||
|
Total interest expense
|
(902.1 | ) | (457.2 | ) | (325.3 | ) | (142.8 | ) | (86.4 | ) | (1,913.8 | ) | ||||||||||||
|
Net interest income
|
2,443.5 | 946.7 | 950.9 | 540.3 | (252.6 | ) | 4,628.8 | |||||||||||||||||
|
Total provisions (reversals), net
|
(610.6 | ) | (192.3 | ) | (101.6 | ) | (122.4 | ) | (0.0 | ) | (1,026.9 | ) | ||||||||||||
|
Total fees and other services income, net
|
1,155.1 | 186.6 | 136.1 | 140.5 | (0.6 | ) | 1,617.7 | |||||||||||||||||
|
Total other operating income
|
582.4 | 316.7 | 42.0 | 9.7 | (165.3 | ) | 785.5 | |||||||||||||||||
|
Total operating income
|
3,570.3 | 1,257.6 | 1,027.5 | 568.1 | (418.5 | ) | 6,005.1 | |||||||||||||||||
|
Total operating expenses
|
(1,757.9 | ) | (764.4 | ) | (558.3 | ) | (389.8 | ) | (49.5 | ) | (3,520.0 | ) | ||||||||||||
|
Net operating income
|
1,812.4 | 493.2 | 469.2 | 178.4 | (468.0 | ) | 2,485.1 | |||||||||||||||||
|
Total non-operating income (expense), net
|
96.0 | 21.4 | 53.0 | 16.2 | (9.6 | ) | 176.9 | |||||||||||||||||
|
Income before income tax expense and non-controlling interest
|
1,908.3 | 514.6 | 522.2 | 194.5 | (477.6 | ) | 2,662.1 | |||||||||||||||||
|
Income tax expense
|
(510.0 | ) | (126.2 | ) | (156.8 | ) | (49.9 | ) | 11.8 | (831.0 | ) | |||||||||||||
|
Income before non-controlling interest
|
1,398.3 | 388.4 | 365.4 | 144.7 | (465.8 | ) | 1,831.1 | |||||||||||||||||
|
Non-controlling interest
|
(483.4 | ) | (2.0 | ) | (3.8 | ) | (0.4 | ) | (384.7 | ) | (874.2 | ) | ||||||||||||
|
Net income attributable to shareholders
|
914.9 | 386.4 | 361.6 | 144.3 | (850.4 | ) | 956.9 | |||||||||||||||||
|
For the year ended December 31, 2009
|
||||||||||||||||||||||||
|
Banco de Bogotá
|
Banco de Occidente
|
Banco Popular
|
Banco AV Villas
|
Grupo Aval and eliminations
|
Grupo Aval consolidated
|
|||||||||||||||||||
|
(in Ps billions)
|
||||||||||||||||||||||||
|
Total interest income
|
3,614.1 | 1,821.7 | 1,453.1 | 789.1 | 2.1 | 7,680.0 | ||||||||||||||||||
|
Total interest expense
|
(1,297.1 | ) | (732.0 | ) | (514.2 | ) | (217.0 | ) | (93.7 | ) | (2,854.0 | ) | ||||||||||||
|
Net interest income
|
2,317.0 | 1,089.7 | 938.8 | 572.1 | (91.6 | ) | 4,826.0 | |||||||||||||||||
|
Total provisions (reversals), net
|
(347.8 | ) | (257.3 | ) | (94.5 | ) | (188.0 | ) | (0.0 | ) | (887.6 | ) | ||||||||||||
|
Total fees and other services income, net
|
1,075.6 | 216.6 | 143.2 | 143.3 | 4.7 | 1,583.5 | ||||||||||||||||||
|
Total other operating income
|
492.1 | 282.0 | 29.4 | 4.3 | (123.6 | ) | 684.1 | |||||||||||||||||
|
Total operating income
|
3,536.9 | 1,331.0 | 1,017.0 | 531.6 | (210.5 | ) | 6,205.9 | |||||||||||||||||
|
Total operating expenses
|
(1,585.3 | ) | (764.7 | ) | (536.5 | ) | (377.8 | ) | (28.1 | ) | (3,292.4 | ) | ||||||||||||
|
Net operating income
|
1,951.6 | 566.2 | 480.4 | 153.9 | (238.6 | ) | 2,913.5 | |||||||||||||||||
|
Total non-operating income (expense), net
|
78.0 | 12.8 | (42.3 | ) | 12.6 | 6.6 | 67.7 | |||||||||||||||||
|
Income before tax expense and non-controlling interest
|
2,029.6 | 579.0 | 438.1 | 166.5 | (232.0 | ) | 2,981.2 | |||||||||||||||||
|
Income tax expense
|
(522.7 | ) | (152.0 | ) | (132.5 | ) | (55.4 | ) | (1.7 | ) | (864.3 | ) | ||||||||||||
|
Income before non-controlling interest
|
1,506.9 | 427.0 | 305.6 | 111.1 | (233.7 | ) | 2,116.9 | |||||||||||||||||
|
Non-controlling interest
|
(551.1 | ) | (44.9 | ) | (2.1 | ) | (0.4 | ) | (453.1 | ) | (1,051.5 | ) | ||||||||||||
|
Net income attributable to shareholders
|
955.8 | 382.1 | 303.6 | 110.7 | (686.8 | ) | 1,065.4 | |||||||||||||||||
|
Grupo Aval
|
||||||||
|
Change, 2010 vs. 2009
|
||||||||
|
(in Ps billions)
|
%
|
|||||||
|
Total interest income
|
(1,137.4 | ) | (14.8 | ) | ||||
|
Total interest expense
|
(940.2 | ) | (32.9 | ) | ||||
|
Net interest income
|
(197.2 | ) | (4.1 | ) | ||||
|
Total provisions (reversals), net
|
139.3 | 15.7 | ||||||
|
Total fees and other services income, net
|
34.2 | 2.2 | ||||||
|
Total other operating income
|
101.5 | 14.8 | ||||||
|
Total operating income
|
(200.8 | ) | (3.2 | ) | ||||
|
Total operating expenses
|
227.6 | 6.9 | ||||||
|
Net operating income
|
(428.4 | ) | (14.7 | ) | ||||
|
Total non-operating income (expense), net
|
109.3 | 161.5 | ||||||
|
Income before income tax expense and non-controlling interest
|
(319.1 | ) | (10.7 | ) | ||||
|
Income tax expense
|
(33.3 | ) | (3.9 | ) | ||||
|
Income before non-controlling interest
|
(285.8 | ) | (13.5 | ) | ||||
|
Non-controlling interest
|
(177.3 | ) | (16.9 | ) | ||||
|
Net income attributable to shareholders
|
(108.5 | ) | (10.2 | ) | ||||
Grupo Aval
Overview
Our net income attributable to our shareholders in 2010 decreased by 10.2%, or Ps 108.5 billion, to Ps 956.9 billion. The primary driver of this decrease in net income was the decline in total interest income, due to the overall declining interest rate environment in Colombia, which was only partially offset by a decrease in total interest expense. Despite the improvement in credit quality, our total provisions increased as a result of the Ps 298.0 billion increase in net provisions for foreclosed assets and other assets, which was principally due to provisions established by Corficolombiana associated with the realization of income from several of its equity security investments. The slight 6.9% increase in operating expense, due principally to higher administrative and other expenses and salaries and employee benefits, was consistent with the organic growth of the business and reflects BAC Credomatic’s December 2010 expenses. As a result of these factors, our efficiency ratio (which we calculate as total operating expenses minus depreciation and amortization, divided by total operating income plus net provisions) deteriorated from 42.9% in 2009 to 46.6% in 2010.
The following discussion describes the principal drivers of our consolidated results of operations for 2010 and 2009. Further detail is provided in the discussions of the results of operations of each of our banking subsidiaries, Porvenir and Corficolombiana.
Net interest income
|
Year ended December 31,
|
Change, 2010 vs. 2009
|
|||||||||||||||
|
2010
|
2009
|
# |
%
|
|||||||||||||
|
(in Ps billions)
|
||||||||||||||||
|
Interest income:
|
||||||||||||||||
|
Interest on loans
|
4,627.3 | 5,418.5 | (791.2 | ) | (14.6 | ) | ||||||||||
|
Interest on investment securities
|
1,452.7 | 1,676.9 | (224.3 | ) | (13.4 | ) | ||||||||||
|
Interbank and overnight funds
|
99.0 | 148.9 | (49.9 | ) | (33.5 | ) | ||||||||||
|
Financial leases
|
363.6 | 435.7 | (72.1 | ) | (16.5 | ) | ||||||||||
|
Total interest income
|
6,542.6 | 7,680.0 | (1,137.4 | ) | (14.8 | ) | ||||||||||
|
Interest expense:
|
||||||||||||||||
|
Checking accounts
|
(29.5 | ) | (53.2 | ) | (23.7 | ) | (44.5 | ) | ||||||||
|
Time deposits
|
(679.1 | ) | (1,219.0 | ) | (539.9 | ) | (44.3 | ) | ||||||||
|
Savings deposits
|
(640.8 | ) | (925.3 | ) | (284.5 | ) | (30.7 | ) | ||||||||
|
Total interest expense on deposits
|
(1,349.4 | ) | (2,197.5 | ) | (848.1 | ) | (38.6 | ) | ||||||||
|
Borrowings from banks and others
|
(177.0 | ) | (291.5 | ) | (114.5 | ) | (39.3 | ) | ||||||||
|
Interbank and overnight funds (expenses)
|
(109.3 | ) | (111.7 | ) | (2.4 | ) | (2.1 | ) | ||||||||
|
Long-term debt (bonds)
|
(278.1 | ) | (253.4 | ) | 24.7 | 9.8 | ||||||||||
|
Total interest expense
|
(1,913.8 | ) | (2,854.0 | ) | (940.2 | ) | (32.9 | ) | ||||||||
|
Net interest income
|
4,628.8 | 4,826.0 | (197.2 | ) | (4.1 | ) | ||||||||||
Our net interest income decreased by 4.1% to Ps 4,628.8 billion in 2010, primarily due to a Ps 863.3 billion decrease in interest income on loans and financial leases and a Ps 224.3 billion decline in interest income on investment securities, partially offset by a Ps 940.2 billion decrease in total interest expense.
Average interest-earning assets grew slightly faster than average interest-bearing liabilities, which resulted in the ratio of average interest-earning assets to average interest-bearing liabilities increasing from 1.16 in 2009 to 1.18 in 2010. The increase in this ratio reflects the 16.7% growth of our average interest-earning assets from Ps 54,841.2 billion in 2009 to Ps 63,978.9 billion in 2010. However, the spread between the yield earned on our interest-earning assets and the interest rate paid on our interest-bearing liabilities decreased by 126 basis points, from 8.0% in 2009 to 6.7% in 2010, which was primarily a result of the decrease in yield from our loans and financial leases. The spread between the yield earned on loans and financial leases and the cost of interest-bearing liabilities decreased by 102 basis points from 8.8% in 2009 to 7.8% in 2010, because our loans and financial leases, especially our commercial loans, repriced faster than our liabilities in a declining interest rate environment. The deterioration of the spread between interest-earning assets and interest-bearing liabilities also resulted from a decrease in the yield of our investment securities portfolio, due primarily to the fact that while 2010 presented a favorable environment for fixed income securities, 2009 was even more favorable and the same results were not repeated. The decrease in income from the compression of the spread between the yield earned on our interest-earning assets and the interest rate paid on our interest-bearing liabilities was only partially offset by the increase in income resulting from the slight growth in the ratio of average interest-earning assets to average interest-bearing liabilities, and as a result, our net interest income decreased in 2010. Ultimately, our net interest margin declined from 8.8% in 2009 to 7.2% in 2010.
The primary driver of the decrease in net interest income was a Ps 863.3 billion, or 14.7%, decrease in interest income from loans and financial leases, primarily due to a decline in average yield, partly offset by an increase in average balances. Average yields for loans and financial leases decreased from 14.9% in 2009 to 11.3% in 2010. This reduction in yield was consistent with the 265 basis point decline in the average DTF rate (from a weekly average of 6.33% for 2009 to a weekly average of 3.68% for 2010, representing a 41.9% decrease). The DTF rate is the 90-day time deposit benchmark interest rate in Colombia and the rate most commonly used by banks to index the majority of their domestic interest-earning assets (excluding investment securities) and their deposits. However, our subsidiary banks’ results in 2010 indicate that the decrease in yield from loans and financial leases was not uniform across all loan types, with the percentage decrease in the yield from commercial loans being considerably higher than that for consumer loans. While commercial loans and interest-bearing liabilities are predominantly indexed to the DTF, consumer loans are usually indexed to industry averages and are set at rates close to the Tasa Usura (the legal limit for all loans other than microcredit loans). For 2010, the average Tasa Usura was approximately 22.7%,
compared to an average Tasa Usura of approximately 28.8% for 2009, which represented a 21.0% decrease in the average Tasa Usura for 2010 as compared to 2009. This decrease was less than the decrease in commercial loan yield, which much more closely resembled the 41.9% decrease in the average weekly DTF rate. This rate dynamic is typically observed, as movements in the Tasa Usura tend to exhibit a lag and the rate is initially less sensitive to increases / decreases in general interest rates. The decline of the average interest rate on loans and financial leases generated a Ps 1,341.3 billion decrease in interest income on a period-over-period basis. This decrease was partially offset by the 11.7% growth of the average balance of our loan and financial lease portfolio to Ps 43,977.1 billion, primarily due to the growth of commercial loans, and was responsible for producing a Ps 477.9 billion increase in interest income. See “Item 4. Information on the Company—B. Business overview—Selected statistical data.”
A Ps 224.3 billion decrease in interest income from investment securities also contributed to the decline in net interest income. Under Colombian Banking GAAP, interest income from investment securities includes accrued interest on debt instruments, valuation adjustments and gains (losses) realized on debt and equity securities that are accounted for as “available for sale,” gains (losses) on repurchase transactions (i.e., repos), gains (losses) realized on the sale of debt securities, and mark-to-market gains (losses) on the trading securities portfolio.
Our fixed income portfolio, which yielded Ps 946.0 billion of income in 2010, accounted for 65.1% of our earnings on investment securities for the year. These fixed income earnings were 17.5%, or Ps 200.3 billion, less than the fixed income earnings generated in 2009, reflecting the fact that in 2009 interest rates declined significantly and at a steady pace, while in 2010 interest rates were more volatile and ultimately declined less. However, it is important to note that fixed income earnings in 2010 were nonetheless 23.6% higher than in 2008, illustrating that 2010 presented a favorable environment for fixed income securities, but that 2009 was even better. During 2009, the interest rate on the Colombian Treasury Bond due in 2020, a benchmark for tracking the movement of fixed income rates, decreased by 216 basis points and closed December 31, 2009 at 8.47%. On the other hand, in 2010, the same benchmark index decreased by 85 basis points to 7.70%. Moreover, in January and February of 2010, this benchmark rate increased 61 basis points — at one point reaching 9.16%. This increase in rates proved particularly deleterious for Banco de Occidente, as 53.8% of its fixed income security investments were classified as “for trading” (compared to 29.8%, 12.4%, and 32.1% for Banco de Bogotá, Banco Popular and Banco AV Villas, respectively) at December 31, 2009 and thus the corresponding mark-to-market losses flowed to its income statement and reduced its income from investment securities. Following this increase in rates, a significant portion of each bank’s fixed income investments was reclassified as available for sale, as evidenced by the fact that at December 31, 2010 the percent of fixed income securities classified as “for trading” at each bank was 16.2%, 32.8%, 12.7%, and 42.0% for Banco de Bogotá, Banco de Occidente, Banco Popular and Banco AV Villas, respectively. While this risk management action sought to provide greater insulation for the banks in case of a further increase in rates, it also resulted in less income being generated for the remainder of 2010 when rates once again began to decline.
The income yielded by our equity securities portfolio in 2010 also decreased, but only by 4.6% to Ps 506.3 billion. This represented 34.9% of our income from investment securities in 2010. Income from the equity securities portfolio was almost entirely driven by Banco de Bogotá and, more specifically, Corficolombiana. As further explained in the Corficolombiana 2010-2009 discussion, this decrease primarily reflected the fact that the income realized by Corficolombiana related to the appreciation of its investments was lower in 2010 as compared to 2009.
The decrease in total interest expense partially offset the decrease in total interest income, reflecting a 250 basis point decrease in the average interest rate paid on interest-bearing liabilities from 6.0% in 2009 to 3.5% in 2010. The reduction in funding costs was consistent with the aforementioned decrease in the average DTF rate. The decrease in interest expense was primarily due to the 298 basis point decline in the average interest rate paid on time deposits, from 7.2% in 2009 to 4.3% in 2010, and the 189 basis point decline in average interest rate on savings deposits, from 4.6% in 2009 to 2.7% in 2010. The decline in interest rates paid on interest-bearing liabilities resulted in a Ps 1,147.4 billion decrease in interest expense.
The decline in funding costs was partially offset by the 14.4% increase in the average balance of interest-bearing liabilities to Ps 54,015.2 billion. This growth was primarily a result of the 17.1% increase in the average balance of savings deposits to Ps 23,362.1 billion, the 63.5% increase in the average balance of long-term debt to Ps 4,358.2 billion, and the 64.9% increase in the average balance of interbank and overnight funds to Ps 3,920.4 billion.
Only time deposits saw their average balance decrease, by 5.2% to Ps 15,970.4. The increase in the average balances of savings deposits, long-term debt, and interbank and overnight funds, as well as the decrease in the average balance of time deposits, was primarily the result of our banks searching for cheaper sources of funding in 2010. The overall increase in the average balance of interest-bearing liabilities was responsible for generating a Ps 207.1 billion increase in interest expense in 2010.
Provisions
Our total net provisions increased by 15.7% to Ps 1,026.9 billion in 2010. This increase was mainly attributable to the Ps 298.0 billion increase in net provisions for foreclosed assets and other assets to Ps 315.6 billion. The primary reason for this increase was a cautionary Ps 245.1 billion market risk provision established by Corficolombiana in December, after discussion with the Superintendency of Finance, in order to cover risks associated with potential future fluctuations of the share prices of its equity investments. Additionally, Corficolombiana established a Ps 69.8 billion net provision for foreclosed assets and other assets, with the permission of the Superintendency of Finance, related to the realization of income stemming from its investment in
Sociedad de Inversiones en Energía S.A.
(SIE) (further explained in the Corficolombiana 2010-2009 discussion).
Despite the increase in net provisions, our net provisions for loan and financial lease losses, accrued interest and other receivables decreased by 13.9% to Ps 820.3 billion. The main component of this line item, net provisions for loans and financial leases, decreased by 6.9% to Ps 764.5 billion (including BAC Credomatic financial data, which added Ps 0.7 billion in net provisions for loan and financial lease losses). The largest decrease in net provisions for loan and financial lease losses was recorded by Banco AV Villas, where provisions declined by Ps 58.7 billion or 28.8%. By contrast, Banco Popular’s net provisions for loan and financial lease losses increased by Ps 34.3 billion to Ps 128.6 billion due primarily to the deterioration of the credit quality of certain loans throughout the fourth quarter that were ultimately charged-off (further explained in the Banco Popular 2010-2009 discussion).
The decrease in provisions for loan and financial lease losses reflected the improvement in the quality of our loan and financial lease portfolio, which was consistent with the recovery of the Colombian economy. According to DANE, in 2010 Colombia’s real GDP grew 4.3%, as compared to 1.5% in 2009.
Past due loans and financial leases rose by 3.9% to Ps 1,569.7 billion at December 31, 2010; however, this increase was due to the BAC Credomatic acquisition, as our Colombian operations’ past due loans and financial leases decreased by 16.9% to Ps 1,255.8 billion at December 31, 2010. Our delinquency ratio (calculated as the ratio of loans and financial leases at least 31 days past due to total gross loans and financial leases) decreased from 3.6% at December 31, 2009 to 2.7% at December 31, 2010. Our delinquency ratio for our Colombian operations at December 31, 2010 was 2.6%. The decrease in past due loans and financial leases in our Colombian operations, by volume, was concentrated primarily in commercial loans past due, which decreased by 19.5% to Ps 538.7 billion (with its delinquency ratio declining from 2.6% to 1.7%) and consumer loans past due, which decreased by 10.8% to Ps 502.9 billion (with its delinquency ratio declining from 4.9% to 3.9%). Financial leases past due also decreased significantly, declining by 25.2% to Ps 117.8 billion (with its delinquency ratio declining from 4.9% to 3.3%). Incorporating the impact of BAC, our delinquency ratios for commercial, consumer, and financial leases at December 31, 2010 were 1.8%, 4.0%, and 3.2%, respectively.
At the subsidiary level, Banco Popular had the lowest delinquency ratio (2.5% at December 31, 2010, as compared to 3.7% at December 31, 2009), while Banco AV Villas continued to have the highest delinquency ratio (4.5% at December 31, 2010, as compared to 5.5% at December 31, 2009). The delinquency ratio at Banco AV Villas reflects its exposure to mortgage and traditional consumer loans, which generally have higher delinquency ratios. At December 31, 2010, 13.2% of Banco AV Villas’ total gross loans were mortgage loans (compared to 0.2%, 0.1%, and 1.2% at Banco de Bogotá excluding the effect of the BAC Credomatic acquisition, Banco de Occidente, and Banco Popular, respectively, at December 31, 2010), while 44.2% of its total gross loans were consumer loans (compared to 16.9% and 19.3% at Banco de Bogotá excluding the effect of the impact of BAC and Banco de Occidente acquisition, respectively. Banco de Bogotá with BAC holds 9.4% of its total gross loans as mortgage loans and 23.0% of its total gross loans as consumer loans. Although Banco Popular has a higher proportion of consumer loans, 99.7% of these loans are payroll loans (compared to an equivalent figure of approximately 40.0% for Banco AV Villas), which are of a much higher credit quality than traditional consumer loans.
Provisions for loans and financial lease losses decreased slightly less than past due loans and financial leases primarily as a result of an increase in charge-offs, for which we record provisions of 100% before they are charged-off. For further information, see “Item 4. Information on the Company—B. Business overview—Selected statistical data—Movements in allowances for credit losses—Charge-offs.” In 2010, charge-offs increased by 21.4% to Ps 677.6 billion (including BAC Credomatic’s impact, which contributed Ps 17.5 billion in charge-offs). As a result of the increase in charge-offs, which was due to the write-off of several loans by our subsidiary banks’ primarily related to the fact that with the recovery of the economy it became clear certain loans were going to be unrecoverable (for further detail refer to our subsidiary banks’ 2010 – 2009 discussions), our charge-off to average loan ratio increased by 14 basis points to 1.50%. In our Colombian operations, our charge-offs increased by 18.2%, while our charge-off to average loan ratio increased by 13 basis points to 1.49%.
The higher level of our net provisions for loan and financial lease losses relative to our charge-offs resulted in the 16.1% growth of our allowance for loan and financial lease losses to Ps 2,183.9 billion at December 31, 2010. For our Colombian operations, our allowance increased by 5.1% to Ps 1,977.6 billion. The growth of our allowance for loan and financial lease losses, combined with the slight increase in our past due loans due to the BAC Credomatic acquisition, resulted in an increase in our coverage ratio (defined as our allowance for loan and financial lease losses to loans at least 31 days past due) from 124.5% at December 31, 2009 to 139.1% at December 31, 2010. The coverage ratio for our Colombian operations was 157.5% at December 31, 2010. The lower coverage ratio incorporating the impact of BAC is due to the fact that proportionately BAC contributed more in past due loans than in allowance, which was expected considering 30.3% of BAC’s gross loan portfolio was concentrated in mortgage loans (which require less allowance than other types of loans).
Net provisions for accrued interest and other receivables decreased by 57.6% to Ps 55.9 billion in 2010, which was primarily a result of the improvement in the Colombian economy described above and a change in provisioning requirements mandated by the Superintendency of Finance in 2009. Prior to June 30, 2009, when any of our institutions suspended the accrual of interest on interest-earning assets, the interest accrued up to that time was provisioned for based on the ratio calculated by the commercial and consumer reference models. See “Item 11. Quantitative and Qualitative Disclosures About Risk——Risk management—Credit risk.” Effective as of July 1, 2009, the Superintendency of Finance required that financial institutions provision 100% of such accrued interest, which resulted in considerably higher provisioning for these accounts in the remainder of 2009. Following the initial increase in provisions to 100% of accrued interest and other receivables in 2009, our institutions were required to increase or decrease provisions based on marginal changes, and thus, the provision expense in 2010 decreased as compared to the provision expense for in 2009.
The recovery of charged-off assets increased by Ps 25.7 billion to Ps 109.0 billion, primarily as a result of higher charge-offs and a more effective recovery effort.
Total fees and other services income
|
Year ended December 31,
|
Change, 2010 vs. 2009
|
|||||||||||||||
|
2010
|
2009
|
# |
%
|
|||||||||||||
|
(in Ps billions)
|
||||||||||||||||
|
Fees and other services income:
|
||||||||||||||||
|
Commissions from banking services
|
916.0 | 866.0 | 50.0 | 5.8 | ||||||||||||
|
Branch network services
|
22.2 | 19.5 | 2.6 | 13.5 | ||||||||||||
|
Credit card merchant fees
|
165.6 | 97.8 | 67.8 | 69.4 | ||||||||||||
|
Checking fees
|
69.5 | 70.7 | (1.1 | ) | (1.6 | ) | ||||||||||
|
Warehouse services
|
147.5 | 149.7 | (2.2 | ) | (1.5 | ) | ||||||||||
|
Fiduciary activities
|
146.9 | 137.6 | 9.2 | 6.7 | ||||||||||||
|
Pension plan administration
|
409.9 | 400.2 | 9.7 | 2.4 | ||||||||||||
|
Other
|
103.3 | 119.8 | (16.5 | ) | (13.8 | ) | ||||||||||
|
Total fees and other services income
|
1,980.9 | 1,861.3 | 119.6 | 6.4 | ||||||||||||
|
Fees and other services expenses
|
(363.1 | ) | (277.8 | ) | 85.3 | 30.7 | ||||||||||
|
Total fees and other services income, net
|
1,617.7 | 1,583.5 | 34.2 | 2.2 | ||||||||||||
Total fees and other services income, net increased by 2.2% to Ps 1,617.7 billion in 2010. Gross total fees and other services income increased by Ps 119.6 billion to Ps 1,980.9 billion, while fees and other services expenses increased by Ps 85.3 billion to Ps 363.1 billion. As explained in more detail in the Banco de Occidente 2010-2009 discussion below, one of the main reasons for the increase in both credit card merchant fees and fee expenses was due to a reclassification of certain accounts stemming from the fact that Banco de Occidente previously recorded credit card merchant fees net of expenses. A second reclassification, which is further explained in the Banco AV Villas 2010-2009 discussion, is an important reason for the increase in commissions from banking services and the decrease in “Other.”
These reclassifications aside, the acquisition of BAC Credomatic, and the 30 days of its income consolidated in our 2010 results, explains a number of these increases. BAC Credomatic is particularly strong in the generation of fee income, contributing: approximately Ps 37.9 billion in commissions from banking services, Ps 18.6 billion in credit card merchant fees, and Ps 5.7 billion in “Other” fees, while adding approximately Ps 7.2 billion in fee expense.
Furthermore, fiduciary activity fees increased by 6.7% to Ps 146.9 billion, principally due to higher returns generated by Banco de Bogotá and Banco de Occidente’s fiduciary subsidiaries, while pension plan administration fees increased by 2.4% to Ps 409.9 billion due to higher fees contributed by Porvenir.
Other operating income
|
Year ended December 31,
|
Change, 2010 vs. 2009
|
|||||||||||||||
|
2010
|
2009
|
# |
%
|
|||||||||||||
|
(in Ps billions)
|
||||||||||||||||
|
Foreign exchange gains (losses), net
|
49.5 | (141.5 | ) | 191.0 | 135.0 | |||||||||||
|
Gains on derivative operations, net
|
92.9 | 287.5 | (194.6 | ) | (67.7 | ) | ||||||||||
|
Gains on sales of investments in equity securities, net
|
87.5 | 4.0 | 83.4 | 2066.9 | ||||||||||||
|
Income from non-financial sector, net (1)
|
294.8 | 231.2 | 63.6 | 27.5 | ||||||||||||
|
Dividend income
|
43.5 | 68.9 | (25.4 | ) | (36.9 | ) | ||||||||||
|
Other
|
217.4 | 233.9 | (16.5 | ) | (7.1 | ) | ||||||||||
|
Total other operating income
|
785.5 | 684.1 | 101.5 | 14.8 | ||||||||||||
|
(1)
|
Income from non-financial sector reflects Corficolombiana’s (Banco de Bogotá’s subsidiary) operating results in its consolidated investments in companies not related to the financial sector such as Epiandes, Hoteles Estelar and Organización Pajonales, among others. This result is net of the following operating and administrative expenses for 2010 and 2009: Ps 644.3 billion and Ps 549.2 billion, respectively. For a description of these investments, see “Item 4. Information on the Company—Business overview—Corficolombiana—Equity investment portfolio.”
|
Total other operating income increased by 14.8% to Ps 785.5 billion in 2010, primarily due to a Ps 83.4 billion increase in net gains on sales of investments in equity securities. This was principally due to Corficolombiana’s sale of a portion of its stake in Banco de Occidente in October and December 2010 and its entire position in Colombina S.A. (further explained in the Corficolombiana 2010-2009 discussion)
.
The second major driver in the increase in other operating income was 27.5% increase in net income from the non-financial sector to Ps 294.8 billion, which was due almost entirely to greater income generated by Corficolombiana’s investments in the non-financial sector (further explained in the Corficolombiana 2010-2009 discussion).
Partially offsetting these increases in income was a 36.9% decrease in dividend income to Ps 43.5 billion, principally reflecting an accounting convention regarding how dividend income for certain of Corficolombiana’s unconsolidated investments is recorded (see Corficolombiana 2010 – 2009 discussion for further information). The 7.1% decrease in “Other” income to Ps 217.4 billion is primarily attributable to the decrease in income generated by a few of Fidubogotá’s, Banco de Bogotá’s fiduciary subsidiary, jointly-managed fiduciary contracts (further
explained in the Banco de Bogotá 2010-2009 discussion). Finally, the Ps 194.6 billion decrease in net gains on derivative operations was almost entirely offset by the Ps 191.0 billion increase in related net foreign exchange gains. In the ordinary course of business, we enter into forward contracts and other derivative transactions in foreign currency through our treasury department almost entirely for hedging purposes and on behalf of clients.
Operating expenses
|
Year ended December 31,
|
Change, 2010 vs. 2009
|
|||||||||||||||
|
2010
|
2009
|
# |
%
|
|||||||||||||
|
(in Ps billions)
|
||||||||||||||||
|
Salaries and employee benefits
|
(1,262.4 | ) | (1,183.9 | ) | 78.5 | 6.6 | ||||||||||
|
Bonus plan payments
|
(45.1 | ) | (42.5 | ) | 2.6 | 6.2 | ||||||||||
|
Termination payments
|
(11.6 | ) | (7.2 | ) | 4.4 | 61.5 | ||||||||||
|
Administrative and other expenses
|
(1,817.1 | ) | (1,675.3 | ) | 141.8 | 8.5 | ||||||||||
|
Deposit security, net
|
(133.1 | ) | (126.8 | ) | 6.3 | 5.0 | ||||||||||
|
Charitable and other donation expenses
|
(7.2 | ) | (8.1 | ) | (0.9 | ) | (11.1 | ) | ||||||||
|
Depreciation
|
(214.8 | ) | (205.2 | ) | 9.6 | 4.7 | ||||||||||
|
Goodwill amortization
|
(28.6 | ) | (43.5 | ) | (14.9 | ) | (34.2 | ) | ||||||||
|
Total operating expenses
|
(3,520.0 | ) | (3,292.4 | ) | 227.6 | 6.9 | ||||||||||
Total operating expenses increased by 6.9% to Ps 3,520.0 billion in 2010. This increase was primarily due to an 8.5% rise in administrative and other expenses to Ps 1,817.1 billion and a 6.6% increase in salaries and employee benefits to Ps 1,262.4 billion, which were in line with the organic growth of the business and reflect the addition of BAC Credomatic’s December expenses. Salaries customarily are increased on a yearly basis using the previous year’s Consumer Price Index, or “CPI,” which was 2.0% in 2009, as a benchmark. Total headcount increased from 36,976 at December 31, 2009 to 53,485 at December 31, 2010, which includes the addition of 15,775 employees from BAC Credomatic. Our headcount in our Colombian operations increased 2.0% to 37,710. at December 31, 2010.
Because our total operating expenses before depreciation and amortization grew at 7.6%, while our operating income before provisions decreased by 0.9%, our efficiency ratio slightly deteriorated in 2010 as compared to 2009, rising from 42.9% in 2009 to 46.6% in 2010. Despite this increase, our efficiency ratio remains one of the best in the financial industry in Colombia.
Non-operating income (expense)
Total net non-operating income (expense) for 2010 was Ps 176.9 billion, which represents a Ps 109.3 billion increase from total net non-operating income of Ps 67.7 billion in 2009. Total non-operating income decreased marginally, by 0.8% to Ps 364.6 billion, while total non-operating expense decreased by 37.4% to Ps 187.6 billion between 2009 and 2010. The decrease in total non-operating expense is primarily explained by a decline in this line item for Banco de Bogotá and Banco Popular (further explained in the Banco de Bogotá and Banco Popular 2010-2009 discussions). The rise in non-operating income was primarily due to an increase at Banco Popular, due to the reversal of a portion of their provisions for employee pension plans and the recovery of charged-off loans from the Fondo Nacional de Garantías (further explained in the Banco Popular 2010-2009 discussion).
Income tax expense
Income before income tax expense and non-controlling interest decreased 10.7% from Ps 2,981.2 billion in 2009 to Ps 2,662.1 billion in 2010. Despite a slight increase in our effective tax rate, from 29.0% in 2009 to 31.2% in 2010, our income tax expense decreased by 3.9% to Ps 831.0 billion in 2010, reflecting the lower income before tax expense and non-controlling interest in 2010.
Non-controlling interest
Our non-controlling interest decreased by 16.9% to Ps 874.2 billion in 2010. This decrease was primarily due to the performance of Corficolombiana, of which our banking subsidiaries own 56.4% (funds managed by Porvenir own an additional 3.3% of Corficolombiana, which are not consolidated into Porvenir or us). In 2009, Corficolombiana represented a greater percentage of our consolidated net income before non-controlling interest as compared to our consolidated net income before non-controlling interest in 2010.
Segment results of operations for the year ended December 31, 2011 compared to the year ended December 31, 2010
Banco de Bogotá
Overview
Banco de Bogotá’s net income attributable to its shareholders in the year ended December 31, 2011 increased by 25.2%, or Ps 230.8 billion, to Ps 1,145.7 billion. Banco de Bogota’s operations excluding LB Panama contributed Ps 814.7 billion and LB Panama’s operation contributed Ps 331.0 billion.
Net income from Banco de Bogotá’s operations excluding LB Panama decreased by 5.5%, or Ps 47.2 billion, in the year ended December 31, 2011. The primary reasons for this decrease were a decrease in income from investment securities, an increase in interest expense and an increase in operating expenses only partially offset by higher income from loans and financial leases, lower net provisions (indicating a recovery) and higher net fee income.
The following discussion describes the principal drivers of Banco de Bogotá’s consolidated results of operations for the years ended December 31, 2011 and 2010. Further detail is provided in the discussion of the results of operations of LB Panama, Porvenir and Corficolombiana.
Banco de Bogotá’s results of operations in 2011 include 12 months of BAC Credomatic operations whereas the 2010 results include only one month of BAC Credomatic operations. In order to provide a meaningful comparison, we present in the following tables information that shows “Banco de Bogota’s consolidated”, “Banco de Bogotá consolidated excluding LB Panama” and “ LB Panama’s” results. “Banco de Bogotá consolidated excluding LB Panama” is the result of subtracting “LB Panama” results from “Banco de Bogotá consolidated” results.
|
Banco de Bogotá consolidated
|
||||||||||||||||
|
Year ended December 31,
|
Change, 2011 vs. 2010
|
|||||||||||||||
|
2011
|
2010
|
# |
%
|
|||||||||||||
|
(in Ps billions)
|
||||||||||||||||
|
Total interest income
|
4,395.9 | 3,345.6 | 1,050.3 | 31.4 | ||||||||||||
|
Total interest expense
|
(1,459.2 | ) | (902.1 | ) | 557.1 | 61.8 | ||||||||||
|
Net interest income
|
2,936.7 | 2,443.5 | 493.2 | 20.2 | ||||||||||||
|
Total provisions (reversals), net
|
(139.0 | ) | (610.6 | ) | (471.6 | ) | (77.2 | ) | ||||||||
|
Total fees and other services income, net
|
1,756.8 | 1,155.1 | 601.7 | 52.1 | ||||||||||||
|
Total other operating income
|
758.1 | 582.4 | 175.8 | 30.2 | ||||||||||||
|
Total operating income
|
5,312.6 | 3,570.3 | 1,742.3 | 48.8 | ||||||||||||
|
Total operating expenses
|
(2,968.0 | ) | (1,757.9 | ) | 1,210.0 | 68.8 | ||||||||||
|
Net operating income
|
2,344.6 | 1,812.4 | 532.2 | 29.4 | ||||||||||||
|
Total non-operating income (expense), net
|
68.5 | 96.0 | (27.5 | ) | (28.6 | ) | ||||||||||
|
Income before income tax expense and non-controlling interest
|
2,413.1 | 1,908.3 | 504.8 | 26.5 | ||||||||||||
|
Income tax expense
|
(737.2 | ) | (510.0 | ) | 227.2 | 44.5 | ||||||||||
|
Income before non-controlling interest
|
1,675.9 | 1,398.3 | 277.6 | 19.8 | ||||||||||||
|
Non-controlling interest
|
(530.2 | ) | (483.4 | ) | 46.8 | 9.7 | ||||||||||
|
Net income attributable to shareholders
|
1,145.7 | 914.9 | 230.8 | 25.2 | ||||||||||||
|
Banco de Bogotá excl. LB Panama
|
LB Panama (1)
|
|||||||||||||||||||||||||||
|
Year ended December 31,
|
Change, 2011 vs. 2010
|
Year ended December 31,
|
Change, 2011
vs. 2010
|
|||||||||||||||||||||||||
|
2011
|
2010
|
# |
%
|
2011 | 2010 | # | ||||||||||||||||||||||
|
(in Ps billions)
|
(in Ps billions)
|
|||||||||||||||||||||||||||
|
Total interest income
|
2,981.0 | 3,226.6 | (245.7 | ) | (7.6 | ) | 1,415.0 | 119.0 | 1,296.0 | |||||||||||||||||||
|
Total interest expense
|
(1,124.1 | ) | (873.2 | ) | 250.9 | 28.7 | (335.1 | ) | (29.0 | ) | 306.2 | |||||||||||||||||
|
Net interest income
|
1,856.9 | 2,353.5 | (496.6 | ) | (21.1 | ) | 1,079.8 | 90.0 | 989.8 | |||||||||||||||||||
|
Total provisions (reversals), net
|
26.0 | (608.3 | ) | (634.3 | ) | (104.3 | ) | (165.0 | ) | (2.3 | ) | 162.7 | ||||||||||||||||
|
Total fees and other services income, net
|
1,157.4 | 1,100.0 | 57.4 | 5.2 | 599.3 | 55.1 | 544.3 | |||||||||||||||||||||
|
Total other operating income
|
661.7 | 565.1 | 96.6 | 17.1 | 96.5 | 17.3 | 79.2 | |||||||||||||||||||||
|
Total operating income
|
3,701.9 | 3,410.2 | 291.8 | 8.6 | 1,610.6 | 160.1 | 1,450.5 | |||||||||||||||||||||
|
Total operating expenses
|
(1,833.4 | ) | (1,643.9 | ) | 189.5 | 11.5 | (1,134.5 | ) | (114.0 | ) | 1,020.5 | |||||||||||||||||
|
Net operating income
|
1,868.5 | 1,766.3 | 102.2 | 5.8 | 476.1 | 46.1 | 430.0 | |||||||||||||||||||||
|
Total non-operating income (expense), net
|
65.6 | 67.7 | (2.1 | ) | (3.0 | ) | 2.9 | 28.3 | (25.4 | ) | ||||||||||||||||||
|
Income before income tax expense and non-controlling interest
|
1,934.1 | 1,833.9 | 100.2 | 5.5 | 479.0 | 74.4 | 404.6 | |||||||||||||||||||||
|
Income tax expense
|
(589.3 | ) | (488.6 | ) | 100.7 | 20.6 | (147.9 | ) | (21.4 | ) | 126.5 | |||||||||||||||||
|
Income before non-controlling interest
|
1,344.8 | 1,345.4 | (0.5 | ) | (0.0 | ) | 331.1 | 53.0 | 278.1 | |||||||||||||||||||
|
Non-controlling interest
|
(530.1 | ) | (483.4 | ) | 46.7 | 9.7 | (0.1 | ) | (0.0 | ) | 0.1 | |||||||||||||||||
|
Net income attributable to shareholders
|
814.7 | 862.0 | (47.2 | ) | (5.5 | ) | 331.0 | 53.0 | 278.0 | |||||||||||||||||||
|
(1)
|
LB Panama’s financial information is prepared in accordance with Colombian Banking GAAP and primarily reflects BAC Credomatic’s consolidated results, which are consolidated in LB Panama’s results from December 1, 2010. At December 31, 2011, LB Panama had Ps 2,017.3 billion of goodwill associated with the BAC Credomatic acquisition and Ps 524.5 billion of indebtedness that it incurred to finance, in part, the BAC Credomatic acquisition. Goodwill amortization and interest expense associated with the BAC Credomatic acquisition for the year ended December 31, 2011 were Ps 49.1 billion and Ps 19.4 billion, respectively.
|
Net interest income
|
Year ended December 31,
|
Change, 2011 vs. 2010
|
|||||||||||||||
|
2011
|
2010
|
# |
%
|
|||||||||||||
|
(in Ps billions)
|
||||||||||||||||
|
Interest income:
|
||||||||||||||||
|
Interest on loans
|
3,618.6 | 2,040.9 | 1,577.6 | 77.3 | ||||||||||||
|
Interest on investment securities
|
552.2 | 1,156.7 | (604.5 | ) | (52.3 | ) | ||||||||||
|
Interbank and overnight funds
|
98.2 | 67.8 | 30.3 | 44.7 | ||||||||||||
|
Financial leases
|
127.0 | 80.1 | 46.9 | 58.6 | ||||||||||||
|
Total interest income
|
4,395.9 | 3,345.6 | 1,050.3 | 31.4 | ||||||||||||
|
Interest expense:
|
||||||||||||||||
|
Checking accounts
|
(66.0 | ) | (22.4 | ) | 43.6 | 194.3 | ||||||||||
|
Time deposits
|
(571.7 | ) | (374.0 | ) | 197.8 | 52.9 | ||||||||||
|
Savings deposits
|
(421.7 | ) | (290.4 | ) | 131.3 | 45.2 | ||||||||||
|
Total interest expense from deposits
|
(1,059.4 | ) | (686.8 | ) | 372.7 | 54.3 | ||||||||||
|
Borrowing from banks and others
|
(204.0 | ) | (62.2 | ) | 141.9 | 228.1 | ||||||||||
|
Interbank and overnight funds (expenses)
|
(111.1 | ) | (86.6 | ) | 24.5 | 28.3 | ||||||||||
|
Long-term debt (bonds)
|
(84.6 | ) | (66.6 | ) | 18.1 | 27.1 | ||||||||||
|
Total interest expense
|
(1,459.2 | ) | (902.1 | ) | 557.1 | 61.8 | ||||||||||
|
Net interest income
|
2,936.7 | 2,443.5 | 493.2 | 20.2 | ||||||||||||
|
Banco de Bogotá excl. LB Panama
|
LB Panama (1)
|
|||||||||||||||||||||||||||
|
Year ended December 31,
|
Change, 2011 vs. 2010
|
Year ended December 31,
|
Change, 2011
vs. 2010
|
|||||||||||||||||||||||||
|
2011
|
2010
|
# |
%
|
2011 | 2010 | # | ||||||||||||||||||||||
|
(in Ps billions)
|
(in Ps billions)
|
|||||||||||||||||||||||||||
|
Interest income:
|
||||||||||||||||||||||||||||
|
Interest on loans
|
2,299.5 | 1,929.5 | 370.0 | 19.2 | 1,319.0 | 111.4 | 1,207.6 | |||||||||||||||||||||
|
Interest on investment securities
|
499.4 | 1,152.6 | (653.3 | ) | (56.7 | ) | 52.8 | 4.1 | 48.7 | |||||||||||||||||||
|
Interbank and overnight funds
|
75.2 | 65.9 | 9.3 | 14.0 | 23.0 | 1.9 | 21.1 | |||||||||||||||||||||
|
Financial leases
|
106.9 | 78.5 | 28.4 | 36.1 | 20.1 | 1.6 | 18.6 | |||||||||||||||||||||
|
Total interest income
|
2,981.0 | 3,226.6 | (245.7 | ) | (7.6 | ) | 1,415.0 | 119.0 | 1,296.0 | |||||||||||||||||||
|
Interest expense:
|
||||||||||||||||||||||||||||
|
Checking accounts
|
(36.4 | ) | (22.4 | ) | 14.0 | 62.4 | (29.6 | ) | — | 29.6 | ||||||||||||||||||
|
Time deposits
|
(406.8 | ) | (358.9 | ) | 48.0 | 13.4 | (164.9 | ) | (15.1 | ) | 149.8 | |||||||||||||||||
|
Savings deposits
|
(390.2 | ) | (285.2 | ) | 105.0 | 36.8 | (31.5 | ) | (5.2 | ) | 26.3 | |||||||||||||||||
|
Total interest expense from deposits
|
(833.5 | ) | (666.5 | ) | 167.0 | 25.1 | (226.0 | ) | (20.3 | ) | 205.7 | |||||||||||||||||
|
Borrowing from banks and others
|
(120.7 | ) | (55.7 | ) | 65.0 | 116.7 | (83.4 | ) | (6.5 | ) | 76.9 | |||||||||||||||||
|
Interbank and overnight funds (expenses)
|
(104.1 | ) | (86.2 | ) | 17.9 | 20.8 | (7.0 | ) | (0.4 | ) | 6.6 | |||||||||||||||||
|
Long-term debt (bonds)
|
(65.9 | ) | (64.8 | ) | 1.1 | 1.7 | (18.7 | ) | (1.8 | ) | 17.0 | |||||||||||||||||
|
Total interest expense
|
(1,124.1 | ) | (873.2 | ) | 250.9 | 28.7 | (335.1 | ) | (29.0 | ) | 306.2 | |||||||||||||||||
|
Net interest income
|
1,856.9 | 2,353.5 | (496.6 | ) | (21.1 | ) | 1,079.8 | 90.0 | 989.8 | |||||||||||||||||||
|
(1)
|
LB Panama’s financial information is prepared in accordance with Colombian Banking GAAP and primarily reflects BAC Credomatic’s consolidated results, which are consolidated in LB Panama’s results from December 1, 2010. At December 31, 2011, LB Panama had Ps 2,017.3 billion of goodwill associated with the BAC Credomatic acquisition and Ps 524.5 billion of indebtedness that it incurred to finance, in part, the BAC Credomatic acquisition. Goodwill amortization and interest expense associated with the BAC Credomatic acquisition for the year ended December 31, 2011 were Ps 49.1 billion and Ps 19.4 billion, respectively.
|
Banco de Bogotá’s net interest income increased by 20.2% from Ps 2,443.5 billion in the year ended December 31, 2010 to Ps 2,936.7 billion in the year ended December 31, 2011. Banco de Bogotá’s operations excluding LB Panama contributed Ps 1,856.9 billion (a decrease of 21.1% or Ps 496.6 billion from Ps 2,353.5 billion for the year ended December 31, 2010) and LB Panama contributed Ps 1,079.8 billion. The decrease in Banco de Bogotá’s operations excluding LB Panama was driven by a 7.6%, or Ps 245.7 billion, decrease in total interest income to Ps 2,981.0 billion for the year ended December 31, 2011 and a 28.7%, or Ps 250.9 billion, increase in total interest expense to Ps 1,124.1 billion for the year ended December 31, 2011.
Total interest income increased by 31.4%, from Ps 3,345.6 billion in the year ended December 31, 2010 to Ps 4,395.9 billion in the year ended December 31, 2011, primarily due to an increase in interest income from loans and financial leases, which rose by Ps 1,624.6 billion to Ps 3,745.6 billion in the year ended December 31, 2011. Of the total interest income from loans and financial leases for the year ended December 31, 2011, Ps 2,406.4 billion were contributed by Banco de Bogotá’s operations excluding LB Panama (an increase of 19.8% or Ps 398.4 billion from Ps 2,008.0 billion for the year ended December 31, 2010) and Ps 1,339.2 billion were contributed by LB Panama’s operations.
The increase generated in Banco de Bogotá’s operations excluding LB Panama primarily reflected a 23.7%, or Ps 4,883.6 billion growth of the combined average of the loans and financial leases portfolios from Ps 20,638.2 billion in 2010 to Ps 25,521.9 billion in 2011, which increased interest income by Ps 440.8 billion. Partly offsetting this increase was a decrease in the annualized yield on loans and financial leases of Banco de Bogotá’s operations excluding LB Panama from 9.7% in the year ended December 31, 2010 to 9.4% in the same period in 2011, which decreased interest income from loans and financial leases by Ps 42.4 billion. The decrease in the yield on loans and financial leases in Banco de Bogotá’s operations excluding LB Panama primarily reflects a declining interest
rate environment in the second half of 2010 and early 2011 together with the strong growth of our loan portfolio during 2011. The average interest yield on loans and financial leases for Banco de Bogotá excluding LB Panama was 10.0% during the last quarter of 2011. The reasons for the decrease in the average yield on loans and financial leases are further discussed under “—Results of operations for the year ended December 31, 2011 compared to the year ended December 31, 2010—Grupo Aval Net interest income.”
During 2011, the average portfolio loans and financial leases for LB Panama was Ps 9,961.3 billion and the annualized yield on its loans and financial leases was 13.4%.
Partially offsetting the increase in interest income from loans and from financial leases was a 52.3% decrease in income from investment securities, from Ps 1,156.7 billion to Ps 552.2 billion for the years ended December 31, 2010 and 2011 respectively. Under Colombian Banking GAAP, interest income from investment securities includes accrued interest on debt instruments, valuation adjustments and gains (losses) realized on debt and equity securities that are accounted for as “available for sale,” gains (losses) on repurchase transactions (i.e., repos), gains (losses) realized on the sale of debt securities, and mark-to-market gains (losses) on the trading securities portfolio.
Of the Ps 552.2 billion of interest income from investment securities, Banco de Bogotá’s operations excluding LB Panama contributed Ps 499.4 billion (a decrease of 56.7% or Ps 653.3 billion from Ps 1,152.6 billion for the year ended December 31, 2010) while LB Panama contributed Ps 52.8 billion.
Interest income from equity investments from Banco de Bogotá’s operations excluding LB Panama decreased by Ps 662.9 billion, or 97.5%, to Ps 17.0 billion mainly as a result of Corficolombiana having realized mark-to-market gains on its investments in Sociedad de Inversiones en Energía S.A. or “SIE,” Banco de Occidente, Empresa de Energía de Bogotá or “EEB” and Promigas during 2010 and realizing mark-to-market losses for those investments during 2011(further explained in “—Segment results of operations for the year ended December 31, 2011 compared to the year ended December 31, 2010—Banco de Bogotá subsidiary analysis—Corficolombiana—Net interest income”). Interest income derived from the fixed income portfolio of Banco de Bogotá’s operations excluding LB Panama increased by 2.0% or Ps 9.6 billion driven by an increase in the average fixed income investment portfolio.
Total interest expense in Banco de Bogotá increased by Ps 557.1 billion or 61.8% from Ps 902.1 billion in the same period in 2010 to Ps 1,459.2 billion in the year ended December 31, 2011 out of which Ps 1,124.1 billion was incurred by Banco de Bogotá’s operations excluding LB Panama (an increase of Ps 250.9 billion or 28.7% from Ps 873.2 billion in the year ended December 31, 2010) and Ps 335.1 billion was incurred by LB Panama.
Total interest expense in Banco de Bogotá’s operations excluding LB Panama increased due to the combined effect of a 20.3%, or Ps 5,450.3 billion, increase in the average balance of interest-bearing liabilities increasing to Ps 32,334.6 billion at December 31, 2011, and an increase in the average cost of funding from 3.2% in the year ended December 31, 2010 to 3.5% in the year ended December 31, 2011. The main reason for the increase in the average cost of funding in Banco de Bogotá’s operations excluding LB Panama was increase of the average DTF as discussed under “—Results of operations for the year ended December 31, 2011 compared to the year ended December 31, 2010—Grupo Aval.”
During 2011, the average balance of interest-bearing liabilities for LB Panama was Ps 13,286.5 billion and the annualized cost of funds was 2.5%.
Banco de Bogotá’s net interest margin (calculated as net interest income divided by total average interest-earning assets) decreased from 7.4% in the year ended December 31, 2010 to 6.0% in the same period in 2011. The net interest margin of Banco de Bogotá’s operations excluding LB Panama decreased from 7.3% to 5.0%, mainly driven by a decrease in the annualized yield of its investment portfolio from 11.7% in 2010 to 4.8% in 2011 due to Corficolombiana’s equity investments results, as discussed above and further explained under “—Segment results of operations for the year ended December 31, 2011 compared to the year ended December 31, 2010—Banco de Bogotá subsidiary analysis—Corficolombiana.” LB Panama’s net interest margin was 8.8% for the year ended December 31, 2011.
Provisions
Total net provisions decreased by 77.2% to Ps 139.0 billion in the year ended December 31, 2011, driven primarily by a Ps 613.4 billion decrease in net provisions for foreclosed assets and other assets. This decrease was driven by a Ps 306.9 billion decrease in provision expense and a Ps 306.5 billion increase in recovery of provisions in the year ended December 31, 2011. These changes are associated with Corficolombiana’s gross provision made during 2010 for covering risk associated with potential future fluctuations on the share price of its equity investment and the gross provision made during 2010 on its investment in SIE, both provisions were reversed during 2011 (further explained in “—Segment results of operations for the year ended December 31, 2011 compared to the year ended December 31, 2010—Banco de Bogotá subsidiary analysis—Corficolombiana—Provisions”).
Partially offsetting the decrease in total net provisions for foreclosed assets and other assets was the increase in net provisions for loan and financial lease losses which increased by Ps 147.8 billion from Ps 286.6 billion for the year ended December 31, 2010 to Ps 434.4 billion for the year ended December 31, 2011.
Out of the Ps 434.4 billion of net provisions for loans and financial leases for the year ended December 31, 2011, Ps 273.0 billion were generated by Banco de Bogotá’s operations excluding LB Panama (a decrease of 4.5% or Ps 12.9 billion from Ps 285.9 billion for the year ended December 31, 2010) and Ps 161.4 billion was generated by LB Panama’s operations.
Banco de Bogotá’s past due loans at December 31, 2011 decreased by 5.6% to Ps 780.4 billion and its delinquency ratio improved by 60 basis points from 2.5% at December 31, 2010 to 1.9% at December 31, 2011. Banco de Bogota’s delinquency ratio excluding LB Panama was 1.6% at December 31, 2011, and LB Panama’s was 2.8% at December 31, 2011. LB Panama’s higher delinquency ratio is due to a greater concentration of consumer loans in BAC Credomatic’s business (including credit cards) than in Banco de Bogota’s operations excluding LB Panama.
Banco de Bogotá’s charge-offs increased by Ps 131.9 billion from Ps 245.7 billion in December 31, 2010 to Ps 377.5 billion in December 31, 2011. Out of the Ps 377.5 billion of charge-offs for the year ended December 31, 2011, Ps 212.5 billion were generated by Banco de Bogotá’s operations excluding LB Panama (a decrease of 6.9% or Ps 15.7 billion from Ps 228.2 for the year ended December 31, 2010) and Ps 165.1 billion was generated by LB Panama’s operations.
Banco de Bogotá’s charge-offs to average loan ratio decreased from 1.1% in December 31, 2010 to 1.0% in December 31, 2011. Banco de Bogotá’s operations excluding LB Panama charge-offs to average loan ratio decreased from 1.1% in December 31, 2010 to 0.8% in December 31, 2011.
Banco de Bogotá’s allowance for loans and financial leases increased by Ps 68.6 billion to Ps 1,099.4 billion at December 31, 2011 increasing Banco de Bogotá’s coverage ratio from 124.6% at December 31, 2010 to 140.9% at December 31, 2011.
In its Banco de Bogotá’s operations excluding LB Panama, Banco de Bogotá’s net provisions for loan and financial lease losses were greater than its charge-offs, which resulted in a 7.5% increase in its allowance for loan financial lease losses to Ps 885.9 billion at December 31, 2011. This growth combined with the decrease in past due loans resulted in an increase in its coverage ratio from 160.7% at December 31, 2010 to 197.5% at December 31, 2011.
LB Panama’s coverage ratio for the year ended December 31, 2011 was 64.3% compared to 65.7.% for the year ended December 31, 2010.
Banco de Bogotá’s net provisions for accrued interest and other receivables increased by Ps 16.6 billion, or 50.3%, to Ps 49.5 billion, Ps 10.4 billion of this increase was driven by Banco de Bogotá’s operations excluding LB Panama and Ps 6.2 billion was driven by LB Panama’s operations. The recovery of charged-off assets increased by Ps 22.6 billion, or 76.3%, to Ps 52.2 billion primarily as a result of a more successful recovery effort by Banco de Bogotá.
Total fees and other services income
|
Year ended December 31,
|
Change, 2011 vs. 2010
|
|||||||||||||||
|
2011
|
2010
|
# |
%
|
|||||||||||||
|
(in Ps billions)
|
||||||||||||||||
|
Fees and other services income:
|
||||||||||||||||
|
Commissions from banking services
|
943.1 | 557.9 | 385.2 | 69.0 | ||||||||||||
|
Branch network services
|
35.0 | 22.2 | 12.8 | 57.9 | ||||||||||||
|
Credit card merchant fees
|
228.6 | 70.3 | 158.4 | 225.4 | ||||||||||||
|
Checking fees
|
42.4 | 42.0 | 0.5 | 1.1 | ||||||||||||
|
Warehouse services
|
114.7 | 92.2 | 22.5 | 24.4 | ||||||||||||
|
Fiduciary activities
|
99.7 | 98.3 | 1.3 | 1.4 | ||||||||||||
|
Pension plan administration
|
457.1 | 408.3 | 48.8 | 11.9 | ||||||||||||
|
Other
|
90.1 | 37.1 | 52.9 | 142.5 | ||||||||||||
|
Total fees and other services income
|
2,010.6 | 1,328.2 | 682.4 | 51.4 | ||||||||||||
|
Fees and other services expenses
|
(253.8 | ) | (173.2 | ) | 80.7 | 46.6 | ||||||||||
|
Total fees and other services income, net
|
1,756.8 | 1,155.1 | 601.7 | 52.1 | ||||||||||||
|
Banco de Bogotá’s operations excluding LB Panama
|
LB Panama (1)
|
|||||||||||||||||||||||||||
|
Year ended December 31,
|
Change, 2011 vs. 2010
|
Year ended December 31,
|
Change, 2011
vs. 2010
|
|||||||||||||||||||||||||
|
2011
|
2010
|
# |
%
|
2011 | 2010 | # | ||||||||||||||||||||||
|
(in Ps billions)
|
(in Ps billions)
|
|||||||||||||||||||||||||||
|
Fees and other services income:
|
||||||||||||||||||||||||||||
|
Commissions from banking services
|
526.8 | 519.9 | 6.9 | 1.3 | 416.2 | 37.9 | 378.3 | |||||||||||||||||||||
|
Branch network services
|
35.0 | 22.2 | 12.8 | 57.9 | – | – | – | |||||||||||||||||||||
|
Credit card merchant fees
|
55.2 | 51.6 | 3.6 | 7.0 | 173.4 | 18.6 | 154.8 | |||||||||||||||||||||
|
Checking fees
|
42.4 | 42.0 | 0.5 | 1.1 | – | – | – | |||||||||||||||||||||
|
Warehouse services
|
114.7 | 92.2 | 22.5 | 24.4 | – | – | – | |||||||||||||||||||||
|
Fiduciary activities
|
99.7 | 98.3 | 1.3 | 1.4 | – | – | – | |||||||||||||||||||||
|
Pension plan administration
|
447.3 | 408.3 | 39.0 | 9.6 | 9.8 | – | 9.8 | |||||||||||||||||||||
|
Other
|
35.1 | 31.4 | 3.7 | 11.7 | 55.0 | 5.7 | 49.3 | |||||||||||||||||||||
|
Total fees and other services income
|
1,356.2 | 1,265.9 | 90.3 | 7.1 | 654.4 | 62.3 | 592.1 | |||||||||||||||||||||
|
Fees and other services expenses
|
(198.8 | ) | (166.0 | ) | 32.9 | 19.8 | (55.0 | ) | (7.2 | ) | 47.8 | |||||||||||||||||
|
Total fees and other services income, net
|
1,157.4 | 1,100.0 | 57.4 | 5.2 | 599.3 | 55.1 | 544.3 | |||||||||||||||||||||
|
(1)
|
LB Panama’s financial information is prepared in accordance with Colombian Banking GAAP and primarily reflects BAC Credomatic’s consolidated results, which are consolidated in LB Panama’s results from December 1, 2010. At December 31, 2011, LB Panama had Ps 2,017.3 billion of goodwill associated with the BAC Credomatic acquisition and Ps 524.5 billion of indebtedness that it incurred to finance, in part, the BAC Credomatic acquisition. Goodwill amortization and interest expense associated with the BAC Credomatic acquisition for the year ended December 31, 2011 were Ps 49.1 billion and Ps 19.4 billion, respectively.
|
Total net fees and other services income increased by 52.1% to Ps 1,756.8 billion in the year ended December 31, 2011, primarily as a result of higher commissions from banking services and increased credit card merchant fees
For the year ended December 31, 2011, Banco de Bogotá’s operations excluding LB Panama contributed Ps 1,157.4 billion in total fees and other income, net which includes Ps 526.8 billion in commissions from banking services and Ps 55.2 billion in credit card merchant fees. LB Panama, in turn, contributed Ps 599.3 billion in total fees and other income, net which includes Ps 416.2 billion in commissions from banking services and Ps 173.4 billion in credit card merchant fees.
The 11.9% (9.6% in Banco de Bogota’s operations excluding LB Panama) increase in pension plan administration fees is mainly as a result of higher fee income produced by Porvenir consisting of commissions earned on the administration of mandatory pension funds, severance funds, voluntary pension funds and third-party liability pension funds, further explained in “—Segment results of operations for the year ended December 31, 2011 compared to the year ended December 31, 2010—Banco de Bogotá subsidiary analysis—Porvenir—Net income.”
The Ps 52.9 billion, or 142.5%, increase to Ps 90.1 billion in “Other” fees is primarily attributable to a Ps 49.3 billion increase in income generated by LB Panama, which includes insurance sales commissions, investment fund administration fees, travel agency fees and others.
Warehouse services fees increased by Ps 22.5 billion, or 24.4%, to Ps 114.7 billion due to fees contributed by Almaviva, Banco de Bogota’s warehouse subsidiary. This rise in the income of warehouse services resulted from greater imports / exports from existing clients and the addition of new clients.
Other operating income
|
Year ended December 31,
|
Change, 2011 vs. 2010
|
|||||||||||||||
|
2011
|
2010
|
# |
%
|
|||||||||||||
|
(in Ps billions)
|
||||||||||||||||
|
Foreign exchange gains (losses), net
|
186.9 | 32.6 | 154.3 | 473.8 | ||||||||||||
|
Gains (losses) on derivative operations, net
|
(22.8 | ) | 63.6 | (86.4 | ) | (135.9 | ) | |||||||||
|
Gains on sales of investments in equity securities, net
|
41.8 | 112.1 | (70.3 | ) | (62.7 | ) | ||||||||||
|
Income from non-financial sector, net (2)
|
431.8 | 289.8 | 142.0 | 49.0 | ||||||||||||
|
Dividend income
|
78.7 | 44.1 | 34.6 | 78.4 | ||||||||||||
|
Other
|
41.8 | 40.3 | 1.5 | 3.8 | ||||||||||||
|
Other operating income
|
758.1 | 582.4 | 175.8 | 30.2 | ||||||||||||
|
Banco de Bogotá’s operations excluding LB Panama
|
LB Panama (1)
|
|||||||||||||||||||||||||||
|
Year ended December 31,
|
Change, 2011 vs. 2010
|
Year ended December 31,
|
Change, 2011 vs. 2010
|
|||||||||||||||||||||||||
|
2011
|
2010
|
# |
%
|
2011 | 2010 | # | ||||||||||||||||||||||
|
(in Ps billions)
|
(in Ps billions)
|
|||||||||||||||||||||||||||
|
Foreign exchange gains (losses), net
|
86.0 | 17.3 | 68.8 | 398.4 | 100.9 | 15.3 | 85.5 | |||||||||||||||||||||
|
Gains (losses) on derivative operations, net
|
(18.3 | ) | 61.5 | (79.8 | ) | (129.7 | ) | (4.6 | ) | 2.0 | (6.6 | ) | ||||||||||||||||
|
Gains on sales of investments in equity securities, net
|
41.8 | 112.1 | (70.3 | ) | (62.7 | ) | – | (0.0 | ) | 0.0 | ||||||||||||||||||
|
Income from non-financial sector, net
|
431.8 | 289.8 | 142.0 | 49.0 | – | – | – | |||||||||||||||||||||
|
Dividend income
|
78.7 | 44.1 | 34.6 | 78.4 | – | – | – | |||||||||||||||||||||
|
Other
|
41.6 | 40.3 | 1.3 | 3.3 | 0.2 | 0.0 | 0.2 | |||||||||||||||||||||
|
Other operating income
|
661.7 | 565.1 | 96.6 | 17.1 | 96.5 | 17.3 | 79.2 | |||||||||||||||||||||
|
(1)
|
LB Panama’s financial information is prepared in accordance with Colombian Banking GAAP and primarily reflects BAC Credomatic’s consolidated results, which are consolidated in LB Panama’s results from December 1, 2010. At December 31, 2011, LB Panama had Ps 2,017.3 billion of goodwill associated with the BAC Credomatic acquisition and Ps 524.5 billion of indebtedness that it incurred to finance, in part, the BAC Credomatic acquisition. Goodwill amortization and interest expense associated with the BAC Credomatic acquisition for the year ended December 31, 2011 were Ps 49.1 billion and Ps 19.4 billion, respectively.
|
|
(2)
|
Income from non-financial sector reflects the operating results of Corficolombiana in its consolidated investments in companies not related to the financial sector such as Epiandes, Hoteles Estelar and Organización Pajonales, among others. This result is net of the following operating and administrative expenses in the year ended December 31, 2011 and 2010: Ps 852.7 billion and Ps 644.3 billion, respectively. For a description of these investments, see “Item 4. Information on the Company—Business overview—Corficolombiana—Equity investment portfolio.”
|
Total other operating income, net increased by 30.2% to Ps 758.1 billion in the year ended December 31, 2011 due primarily to a Ps 142.0 billion increase in income from the non-financial sector, which reflected the net income growth of non-financial companies consolidated by Corficolombiana further explained in the Corficolombiana 2011-2010 discussion.
Also contributing to the increase in other operating income was a Ps 67.9 billion increase in net foreign exchange and derivative operations. Foreign exchange gains (losses) and gains on derivative operations, which are related as Banco de Bogotá employs derivative operations to hedge foreign exchange risk, netted a gain of Ps 164.0 billion for the year ended December 31, 2011 as compared to Ps 96.1 billion for the year ended December 31, 2010. Net foreign exchange and derivative operations for Banco de Bogotá’s operations excluding LB Panama decreased by Ps 11.0 billion from Ps 78.8 billion for the year ended December 31, 2010 to Ps 67.8 billion for the year ended December 31, 2011. During 2011, LB Panama’s operations netted a gain of Ps 96.3 billion.
The increase in dividend income of Ps 34.6 billion was mainly attributable to dividend income from Promigas, a non-consolidated company of Corficolombiana which in 2010 was classified as “trading” and thus its dividend income was registered as interest income from investment securities (further explained in “—Segment results of operations for the year ended December 31, 2011 compared to the year ended December 31, 2010—Banco de Bogotá subsidiary analysis—Corficolombiana”).
Partially offsetting the increase in other operating income was a Ps 70.3 billion decrease in gains on sales of equity securities, resulting from Corficolombiana’s gains from the sale of part of its stake in Banco de Occidente and Proenergía in 2010 (further explained in “—Segment results of operations for the year ended December 31, 2011 compared to the year ended December 31, 2010—Banco de Bogotá subsidiary analysis—Corficolombiana—Other operating income”).
Operating expenses
|
Year
ended December 31,
|
Change, 2011 vs. 2010
|
|||||||||||||||
|
2011
|
2010
|
# |
%
|
|||||||||||||
|
(in Ps billions)
|
||||||||||||||||
|
Salaries and employee benefits
|
(1,068.0 | ) | (612.3 | ) | 455.7 | 74.4 | ||||||||||
|
Bonus plan payments
|
(73.2 | ) | (19.6 | ) | 53.7 | 274.0 | ||||||||||
|
Termination payments
|
(19.5 | ) | (5.8 | ) | 13.7 | 235.7 | ||||||||||
|
Administrative and other expenses
|
(1,518.6 | ) | (968.3 | ) | 550.3 | 56.8 | ||||||||||
|
Deposit security, net
|
(85.0 | ) | (68.3 | ) | 16.7 | 24.4 | ||||||||||
|
Charitable and other donation expenses
|
(12.6 | ) | (4.0 | ) | 8.6 | 217.0 | ||||||||||
|
Depreciation
|
(116.0 | ) | (57.9 | ) | 58.1 | 100.4 | ||||||||||
|
Goodwill amortization
|
(75.2 | ) | (21.8 | ) | 53.3 | 244.3 | ||||||||||
|
Total operating expenses
|
(2,968.0 | ) | (1,757.9 | ) | 1,210.0 | 68.8 | ||||||||||
|
Banco de Bogotá’s operations excluding LB Panama
|
LB Panama (1)
|
|||||||||||||||||||||||||||
|
Year ended December 31,
|
Change, 2011 vs. 2010
|
Year ended December 31,
|
Change, 2011 vs. 2010
|
|||||||||||||||||||||||||
|
2011
|
2010
|
# |
%
|
2011 | 2010 | # | ||||||||||||||||||||||
|
(in Ps billions)
|
(in Ps billions)
|
|||||||||||||||||||||||||||
|
Salaries and employee benefits
|
(617.0 | ) | (576.6 | ) | 40.4 | 7.0 | (451.0 | ) | (35.7 | ) | 415.3 | |||||||||||||||||
|
Bonus plan payments
|
(19.3 | ) | (16.7 | ) | 2.6 | 15.5 | (53.9 | ) | (2.9 | ) | 51.1 | |||||||||||||||||
|
Termination payments
|
(2.2 | ) | (1.9 | ) | 0.3 | 16.6 | (17.3 | ) | (3.9 | ) | 13.4 | |||||||||||||||||
|
Administrative and other expenses
|
(1,027.8 | ) | (905.0 | ) | 122.9 | 13.6 | (490.7 | ) | (63.3 | ) | 427.4 | |||||||||||||||||
|
Deposit security, net
|
(76.4 | ) | (67.5 | ) | 8.8 | 13.1 | (8.6 | ) | (0.7 | ) | 7.8 | |||||||||||||||||
|
Charitable and other donation expenses
|
(10.9 | ) | (3.7 | ) | 7.1 | 191.2 | (1.7 | ) | (0.2 | ) | 1.5 | |||||||||||||||||
|
Depreciation
|
(59.1 | ) | (53.4 | ) | 5.6 | 10.5 | (56.9 | ) | (4.4 | ) | 52.5 | |||||||||||||||||
|
Goodwill amortization
|
(20.8 | ) | (19.0 | ) | 1.8 | 9.5 | (54.4 | ) | (2.8 | ) | 51.5 | |||||||||||||||||
|
Total operating expenses
|
(1,833.4 | ) | (1,643.9 | ) | 189.5 | 11.5 | (1,134.5 | ) | (114.0 | ) | 1,020.5 | |||||||||||||||||
|
(1)
|
LB Panama’s financial information is prepared in accordance with Colombian Banking GAAP and primarily reflects BAC Credomatic’s consolidated results, which are consolidated in LB Panama’s results from December 1, 2010. At December 31, 2011, LB Panama had Ps 2,017.3 billion of goodwill associated with the BAC Credomatic acquisition and Ps 524.5 billion of indebtedness that it incurred to finance, in part, the BAC Credomatic acquisition. Goodwill amortization and interest expense associated with the BAC Credomatic acquisition for the year ended December 31, 2011 were Ps 49.1 billion and Ps 19.4 billion, respectively.
|
Total operating expenses increased by 68.8% to Ps 2,968.0 billion in the year ended December 31, 2011 out of which Ps 1,833.4 billion were incurred by Banco de Bogotá’s operations excluding LB Panama and Ps 1,134.5 billion were incurred by LB Panama.
The increase in total operating expenses primarily reflected a 74.4% or Ps 455.7 billion and a 56.8% or Ps 550.3 billion increase in salaries and employee benefits, and administrative and other expenses, respectively. Salaries and employee benefits from Banco de Bogotá’s operations excluding LB Panama increased by 7.0% or Ps 40.4 billion to Ps 617.0 billion in the year ended December 31, 2011 due to an increase in personnel, while administrative and other expenses grew by 13.6% or Ps 122.9 billion to Ps 1,027.8 billion in the year ended December 31, 2011 due primarily to additional costs associated with growth of Banco de Bogotá’s loan portfolio and the increase in the Equity Tax (further explained in
“
Results of operations for the year ended December 31, 2011 compared to year ended December 31, 2010 – Grupo Aval
–
Net interest income
”
). LB Panama’s salaries and employee benefits and administrative and other expenses totaled Ps 451.0 billion and Ps 490.7 billion, respectively, for the year ended December 31, 2011.
Banco de Bogotá’s efficiency ratio deteriorated from 40.1% at December 31, 2010 to 50.9% at December 31, 2011. Banco de Bogotá’s efficiency ratio for its Banco de Bogotá’s operations excluding LB Panama deteriorated from 39.1% to 47.7% during these same periods and LB Panama’s efficiency ratio at December 31, 2011 was 57.6% associated with the contraction in net interest margin explained in the net interest subsection. Depreciation and goodwill amortization increased by Ps 111.4 billion from Ps 79.7 billion in the year ended December 31, 2010 to Ps 191.1 billion in the year ended December 31, 2011, primarily due to LB Panama’s acquisition which impacts LB Panama’s results. The ratio of operating expenses before depreciation and amortization as a percentage of average earning assets excluding LB Panama improved from 4.9% in 2010 to 4.7% in 2011.
Non-operating income (expense)
Total non-operating income (expense) decreased by Ps 27.5 from Ps 96.0 billion to Ps 68.5 billion in the year ended December 31, 2011 due to a decrease in reversals associated with LB Panama (further explained in “—Segment results of operations for the year ended December 31, 2011 compared to the year ended December 31, 2010—Banco de Bogotá subsidiary analysis—LB Panama”).
Income tax expense
Income before income tax expense and non-controlling interest increased 26.5% from Ps 1,908.3 billion for the year ended December 31, 2010 to Ps 2,413.1 billion for the year ended December 31, 2011. Income tax expense, in turn, increased by 44.5% to Ps 737.2 billion for the year ended December 31, 2011. Accordingly, Banco de Bogotá’s effective tax rate increased from 26.7% for the year ended December 31, 2010 to 30.5% for the year ended December 31, 2011, due to an increase in non-tax deductible expenses in Banco de Bogotá’s operations excluding LB Panama, such as the increase in the Equity Tax (further explained in the “Results of operations for the year ended December 31, 2011 compared to the year ended December 31, 2010 – Grupo Aval
”
), and a higher effective tax rate of 30.9% in LB Panama’s operations.
Non-controlling interest
Banco de Bogotá’s non-controlling interest increased by Ps 46.8 billion, or 9.7%, in the year ended December 31, 2011. The increase in non-controlling interest was primarily a result of Corficolombiana achieving better results in the year ended December 31, 2011 as compared to the same period in 2010 (Ps 608.1 billion as compared to Ps 564.8 billion, respectively) as further described in “—Segment results of operations for the year ended December 31, 2011 compared to the year ended December 31, 2010—Banco de Bogotá subsidiary analysis—Corficolombiana.”
Banco de Bogotá subsidiary analysis
Banco de Bogotá’s results of operations are significantly affected by the results of operations of its subsidiaries, LB Panama, Corficolombiana and Porvenir. In order to fully disclose the effect of these subsidiaries on Banco de Bogotá, the following is an analysis of the results of operations of each of LB Panama, Corficolombiana and Porvenir in the year ended December 31, 2011 compared to the year ended December 31, 2010.
Corficolombiana
Net income
|
Year ended December 31,
|
Change, 2011 vs. 2010
|
|||||||||||||||
|
2011
|
2010
|
# |
%
|
|||||||||||||
|
(in Ps billions)
|
||||||||||||||||
|
Total interest income
|
270.2 | 858.3 | (588.1 | ) | (68.5 | ) | ||||||||||
|
Total interest expense
|
(197.1 | ) | (161.8 | ) | 35.3 | 21.8 | ||||||||||
|
Net interest income
|
73.1 | 696.5 | (623.3 | ) | (89.5 | ) | ||||||||||
|
Total provisions (reversals), net
|
285.5 | (321.6 | ) | (607.1 | ) | (188.8 | ) | |||||||||
|
Total fees and other services income, net
|
46.7 | 43.6 | 3.0 | 7.0 | ||||||||||||
|
Total other operating income
|
573.4 | 435.2 | 138.2 | 31.8 | ||||||||||||
|
Total operating income
|
978.7 | 853.7 | 125.0 | 14.6 | ||||||||||||
|
Total operating expenses
|
(137.2 | ) | (118.8 | ) | 18.4 | 15.5 | ||||||||||
|
Net operating income
|
841.5 | 734.9 | 106.6 | 14.5 | ||||||||||||
|
Total non-operating income (expense), net
|
(6.3 | ) | (3.2 | ) | (3.2 | ) | (99.5 | ) | ||||||||
|
Income before income tax expense and non-controlling interest
|
835.2 | 731.8 | 103.4 | 14.1 | ||||||||||||
|
Income tax expense
|
(150.5 | ) | (104.2 | ) | 46.3 | 44.4 | ||||||||||
|
Income before non-controlling interest
|
684.7 | 627.6 | 57.1 | 9.1 | ||||||||||||
|
Non-controlling interest
|
(76.6 | ) | (62.8 | ) | 13.8 | 22.0 | ||||||||||
|
Net income attributable to shareholders
|
608.1 | 564.8 | 43.3 | 7.7 | ||||||||||||
Corficolombiana’s net income increased by 7.7% to Ps 608.1 billion in the year ended December 31, 2011 as compared to the year ended December 31, 2010. The most significant drivers of the increase in net income were the decrease of 89.5% or Ps 623.3 billion in net interest income, which was primarily due to a reduction in interest income from investment securities, was partially offset by a decrease of Ps 607.1 billion in total provisions (reversals), net
(reflecting a recovery of Ps 285.5 billion in 2011) and an increase in total other operating income, which reflected an increase in dividend income and net income from the non-financial sector.
Net interest income
|
Year ended December 31,
|
Change, 2011 vs. 2010
|
|||||||||||||||
|
2011
|
2010
|
# |
%
|
|||||||||||||
|
(in Ps billions)
|
||||||||||||||||
|
Interest income:
|
||||||||||||||||
|
Interest on loans
|
13.8 | 10.6 | 3.2 | 30.0 | ||||||||||||
|
Interest on investment securities
|
161.7 | 753.9 | (592.2 | ) | (78.5 | ) | ||||||||||
|
Interbank and overnight funds
|
43.1 | 43.0 | 0.1 | 0.3 | ||||||||||||
|
Financial leases
|
51.6 | 50.8 | 0.8 | 1.5 | ||||||||||||
|
Total interest income
|
270.2 | 858.3 | (588.1 | ) | (68.5 | ) | ||||||||||
|
Interest expense:
|
||||||||||||||||
|
Checking accounts
|
– | – | – | – | ||||||||||||
|
Time deposits
|
(91.6 | ) | (74.7 | ) | 17.0 | 22.7 | ||||||||||
|
Savings deposits
|
(2.7 | ) | (5.5 | ) | (2.8 | ) | (51.4 | ) | ||||||||
|
Total interest expense on deposits
|
(94.3 | ) | (80.1 | ) | 14.1 | 17.7 | ||||||||||
|
Borrowing from banks and others
|
(35.6 | ) | (9.5 | ) | 26.1 | 274.7 | ||||||||||
|
Interbank and overnight funds (expenses)
|
(60.6 | ) | (63.6 | ) | (3.0 | ) | (4.7 | ) | ||||||||
|
Long-term debt (bonds)
|
(6.6 | ) | (8.6 | ) | (2.0 | ) | (23.1 | ) | ||||||||
|
Total interest expense
|
(197.1 | ) | (161.8 | ) | 35.3 | 21.8 | ||||||||||
|
Net interest income
|
73.1 | 696.5 | (623.3 | ) | (89.5 | ) | ||||||||||
Net interest income decreased by 89.5% to Ps 73.1 billion in the year ended December 31, 2011. Total interest income, which consists of income from loans, investment securities, interbank and overnight funds and financial leases, decreased by 68.5% to Ps 270.2 billion in 2011. This decline was almost entirely due to the Ps 592.2 billion decrease in income on investment securities from Ps 753.9 billion in the year ended December 31, 2010 to Ps 161.7 billion in the year ended December 31, 2011. The decrease in income from investment securities was due to a decline in income from the equity portfolio, partially offset by an increase in income from the fixed income portfolio.
Corficolombiana’s equity portfolio generated Ps 5.0 billion in income in the year ended December 31, 2011, which represented a 99.2% decrease from the Ps 616.3 billion yielded in the year ended December 31, 2010. The primary reason for the decrease was the fact that in the year ended December 31, 2010 Corficolombiana recorded a Ps 199.1 billion gain associated with its investment in Sociedad de Inversiones en Energía S.A., or “SIE,” the majority of which was related to the reclassification of SIE in February 2010 from “available for sale” to “trading” (as further explained in “—Segment results of operations for the year ended December 31, 2010 compared to the year ended December 31, 2009—Banco de Bogotá—Banco de Bogotá subsidiary analysis—Corficolombiana—Net interest income”), while in the year ended December 31, 2011 Corficolombiana recorded a Ps 34.7 billion mark-to-market loss from this investment. This investment was sold in October 2011.
Corficolombiana recorded a Ps 44.3 billion mark-to-market loss on its investment in Banco de Occidente in the year ended December 31, 2011 as compared to a Ps 186.0 billion mark-to-market gain for the year ended December 31, 2010. In November 2010, the Colombian Stock Exchange reclassified Banco de Occidente’s stock from “low” to “medium” liquidity (
bursatilidad
) and Colombian regulations require the owner of an investment that has had its liquidity classification increase to “medium” by the Colombian Stock Exchange to reclassify its investment as trading and realize the unrealized gains (losses) associated with this investment as gains (losses) on the income statement. At December 31, 2011, Corficolombiana continued to have Banco de Occidente classified as “trading.”
Corficolombiana did not record any income from investment securities related to its investment in Empresa de Energía de Bogotá S.A. E.S.P., or “EEB,” in the year ended December 31, 2011 as it was classified as “available for sale” since late December 2010. By contrast, in the year ended December 31, 2010 it recorded Ps 209.0 billion in mark-to-market gain from this investment as it was classified as “trading” (further explained in “—Segment results of operations for the year ended December 31, 2010 compared to the year ended December 31, 2009—Banco de Bogotá—Banco de Bogotá subsidiary analysis—Corficolombiana—Net interest income”).
Additionally, in the year ended December 31, 2011 Corficolombiana recorded a Ps 122.1 billion loss from its investment in Promigas, while in the year ended December 31, 2010 Promigas generated a Ps 14.4 billion gain. In February 2011, the Colombian Stock Exchange reclassified Promigas’ stock from “medium” to “low” liquidity (
bursatilidad
) and Colombian regulations require the owner of an investment that has had its liquidity classification decreased to “low” by the Colombian Stock Exchange to realize the unrealized gains (losses) associated with that investment as gains (losses) on the income statement, regardless of its balance sheet classification. As a result, despite the fact that Promigas had been classified as “available for sale” since December 2010 (and remains
classified as “available for sale”), Corficolombiana was required to realize its Ps 122.1 billion unrealized loss associated with this investment.
Partially offsetting these declines in interest income from investment securities was the recording of Ps 136.7 billion in income stemming from Corficolombiana’s private investment fund, which is independently directed by Corredores Asociados. This private investment fund was created in 2011.
Corficolombiana also recorded Ps 67.2 billion in income from investment securities related to mark-to-market gains on its investment in Proenergia, which Corficolombiana classified as “trading” in January 2011. The investment has experienced changes in liquidity (
bursatilidad
) since then and at December 31, 2011 it was classified as “available for sale.” Proenergia was not listed on the Colombian Stock Exchange until November 2010 and as a result it did not generate any mark-to-market gains / losses in the year ended December 31, 2010.
Corficolombiana’s fixed income portfolio generated Ps 156.7 billion of income in the year ended December 31, 2011, which was Ps 19.2 billion higher than the Ps 137.6 billion generated in the year ended December 31, 2010. This was primarily due to an increase in the average yield earned on its fixed income portfolio in the year ended December 31, 2011.
Interest expense increased by 21.8% to Ps 197.1 billion in the year ended December 31, 2011 as compared to the year ended December 31, 2010, primarily due to a Ps 26.1 billion increase in expenses from borrowings from banks and others to Ps 35.6 billion.
Provisions
Corficolombiana’s net provisions decreased by Ps 607.1 billion to Ps (285.5) billion (indicating a recovery of Ps 285.5 billion) in the year ended December 31, 2011 as compared to the year ended December 31, 2010. This decrease was attributable in part to the reversal of the cautionary Ps 245 billion market risk provision established by Corficolombiana in December 2010 (see “—Segment results of operations for the year ended December 31, 2010 compared to the year ended December 31, 2009—Banco de Bogotá—Banco de Bogotá subsidiary analysis—Corficolombiana—Net interest income”).
In addition, provisions were higher than usual in the year ended December 31, 2010 due to a Ps 69.7 billion gross provision established by Corficolombiana related to the realization of income stemming from its investment in SIE (see “—Segment results of operations for the year ended December 31, 2010 compared to the year ended December 31, 2009—Banco de Bogotá—Banco de Bogotá subsidiary analysis—Corficolombiana—Net interest income”). During the year ended December 31, 2011, all of this provision was reversed due to the sale of this investment in October 2011.
Total fees and other services income
|
Year ended December 31,
|
Change, 2011 vs. 2010
|
|||||||||||||||
|
2011
|
2010
|
# |
%
|
|||||||||||||
|
(in Ps billions)
|
||||||||||||||||
|
Fees and other services income:
|
||||||||||||||||
|
Commissions
from banking services
|
2.5 | 4.4 | (1.9 | ) | (43.2 | ) | ||||||||||
|
Fiduciary activities
|
32.6 | 33.8 | (1.2 | ) | (3.5 | ) | ||||||||||
|
Other
|
18.8 | 12.4 | 6.3 | 51.1 | ||||||||||||
|
Total fees and other services income
|
53.8 | 50.6 | 3.2 | 6.4 | ||||||||||||
|
Fees and other services expenses
|
(7.1 | ) | (6.9 | ) | 0.2 | 3.0 | ||||||||||
|
Total fees and other services income, net
|
46.7 | 43.6 | 3.0 | 7.0 | ||||||||||||
Net fee and other services income increased by Ps 3.0 billion to Ps 46.7 billion in the year ended December 31, 2011. This increase was primarily due to a Ps 6.3 billion increase in the “Other” fee line-item, which principally reflected an increase in investment banking advisory fees in the year ended December 31, 2011 as compared to the year ended December 31, 2010.
Other operating income
|
Year ended December 31,
|
Change, 2011 vs. 2010
|
|||||||||||||||
|
2011
|
2010
|
# |
%
|
|||||||||||||
|
(in Ps billions)
|
||||||||||||||||
|
Foreign exchange gains (losses), net
|
4.8 | (37.8 | ) | 42.6 | 112.7 | |||||||||||
|
Gains on derivative operations, net
|
22.9 | 29.6 | (6.7 | ) | (22.7 | ) | ||||||||||
|
Gains on sales of investments in equity securities, net
|
41.2 | 109.6 | (68.4 | ) | (62.4 | ) | ||||||||||
|
Income from non-financial sector, net
|
422.7 | 289.8 | 132.9 | 45.9 | ||||||||||||
|
Dividend income
|
76.2 | 38.5 | 37.6 | 97.7 | ||||||||||||
|
Other
|
5.6 | 5.4 | 0.1 | 2.7 | ||||||||||||
|
Total other operating income
|
573.4 | 435.2 | 138.2 | 31.8 | ||||||||||||
Total other operating income increased by 31.8% to Ps 573.4 billion in the year ended December 31, 2011. This increase was driven by an increase of Ps 132.9 billion in net income from non-financial sector, Ps 37.6 billion in dividend income and Ps 35.9 billion in net foreign exchange and derivative operations. Partially offsetting this increase was a Ps 68.4 billion decrease in gains
on sales of investments in equity securities.
Net income from the non-financial sector increased by 45.9% to Ps 422.7 billion in the year ended December 31, 2011, primarily as a result of a rise in the operational income of Epiandes, Episol, Pisa, Unipalma and Hoteles Estelar (some of Corficolombiana’s consolidated non-financial-sector investments).
The Ps 37.6 billion increase in dividend income to Ps 76.2 billion reflects Promigas’ investment accounting reclassification in 2010. In the year ended December 31, 2010, Promigas’ dividends were not recorded under the dividend income line-item because at the time this investment was classified as “trading,” and as a result of Colombian accounting regulations, its dividends were recorded under the line-item “interest from investment securities.” In the year ended December 31, 2011, Promigas’ contributed Ps 36.0 billion in dividends that were recorded under the “dividend income” line-item, since Promigas’ is, now classified as “available for sale.”
Net foreign exchange losses in 2010 decreased by Ps 42.6 billion resulting in a Ps 4.8 billion gain in 2011 due to the lower appreciation of the Colombian Peso in the year ended December 31, 2011 as compared to the year ended December 31, 2010. This gain was partially offset by lesser gain on net gains on derivative operations, which declined by Ps 6.7 billion to Ps 22.9 billion, as a result of the above-mentioned lower appreciation of the Colombian peso and lesser profits generated by local currency fixed income derivative positions.
The Ps 68.4 billion decrease in gains
on sales of investments in equity securities was mainly driven by the Ps 62.8 billion and the Ps 19.0 billion gains on the sale of part of Corficolombiana’s investment in Banco de Occidente and in Proenergía, respectively, in the year ended December 31, 2010. These decreases were partially offset by the Ps 17.1 billion gain on the sale of Corficolombiana’s investment in SIE in the year ended December 31, 2011.
Operating expenses
|
Year ended December 31,
|
Change, 2011 vs. 2010
|
|||||||||||||||
|
2011
|
2010
|
# |
%
|
|||||||||||||
|
(in Ps billions)
|
||||||||||||||||
|
Salaries and employee benefits
|
(49.7 | ) | (45.2 | ) | 4.6 | 10.1 | ||||||||||
|
Bonus plan payments
|
(3.7 | ) | (4.7 | ) | (0.9 | ) | (20.1 | ) | ||||||||
|
Termination payments
|
(1.0 | ) | (0.4 | ) | 0.7 | 186.2 | ||||||||||
|
Administrative and other expenses
|
(71.9 | ) | (58.1 | ) | 13.8 | 23.9 | ||||||||||
|
Deposit security, net
|
(5.8 | ) | (5.5 | ) | 0.3 | 5.5 | ||||||||||
|
Charitable and other donation expenses
|
(0.8 | ) | (1.9 | ) | (1.1 | ) | (56.8 | ) | ||||||||
|
Depreciation
|
(3.7 | ) | (3.2 | ) | 0.6 | 17.5 | ||||||||||
|
Goodwill amortization
|
(0.5 | ) | – | 0.5 | – | |||||||||||
|
Total operating expenses
|
(137.2 | ) | (118.8 | ) | 18.4 | 15.5 | ||||||||||
Corficolombiana’s total operating expenses increased by 15.5% to Ps 137.2 billion in the year ended December 31, 2011 as compared to the year ended December 31, 2010. This increase was almost entirely due to a Ps 13.8 billion increase in administrative and other expenses, almost entirely attributable to the additional Equity Tax imposed on Colombian institutions in 2011, as explained in further detail in Grupo Aval’s discussion of results of the year ended December 31, 2011. Total operating expenses before depreciation and goodwill amortization grew more rapidly than total operating income before provisions, worsening Corficolombiana’s efficiency ratio by increasing from 9.8% in the year ended December 31, 2010 to 19.2% in the year ended December 31, 2011.
Non-operating income (expense)
Total non-operating income (expense) decreased by Ps 3.2 billion to Ps (6.3) billion (reflecting a net non-operating expense of Ps 6.3 billion) in the year ended December 31, 2011, mainly due to a decrease in non-operating income from Ps 54.2 billion in 2010 to Ps 53.2 billion in 2011 and an increase in non-operating expenses from Ps 57.4 billion in 2010 to Ps 59.6 billion in 2011.
Income tax expense
Income tax expense increased by Ps 46.3 billion to Ps 150.5 billion for the year ended December 31, 2011. This increase was primarily due to higher income before income tax expense and non-controlling interest. Corficolombiana’s effective tax rate, calculated before non-controlling interest, increased from 14.2% for the year ended December 31, 2010 to 18.0% for the year ended December 31, 2011, primarily due to an increase in non-tax deductible expenses such as the Equity Tax
(further explained in the
“
Results of operations for the year ended December 31, 2011 compared to the year ended December 31, 2010 – Grupo Aval
”
)
.
Porvenir
Porvenir generates income primarily from fees on its customers’ pension contributions, which consist predominantly of monthly mandatory contributions. It also generates net interest income, composed almost entirely of investment income from the appreciation of Porvenir’s proprietary trading portfolio, which can be divided into two components: (1) income from its stabilization reserve, which is the legally required proprietary stake (1% of assets under management) in its funds that are subject to a minimum return guarantee; and (2) direct investment portfolio income, which includes income from fixed income securities and money market instruments. As a result, Porvenir’s revenue is mainly affected by the number of contributors, the salaries of contributors, any changes in applicable fee rates and the rate of return of its assets under management.
Net income
|
Year ended December 31,
|
Change, 2011 vs. 2010
|
|||||||||||||||
|
2011
|
2010
|
# |
%
|
|||||||||||||
|
(in Ps billions)
|
||||||||||||||||
|
Total interest income
|
17.7 | 58.7 | (40.9 | ) | (69.8 | ) | ||||||||||
|
Total interest expense
|
(2.9 | ) | (0.2 | ) | 2.7 | 1,234.0 | ||||||||||
|
Net interest income
|
14.8 | 58.5 | (43.6 | ) | (74.6 | ) | ||||||||||
|
Total provisions (reversals), net
|
(1.0 | ) | (0.0 | ) | 1.0 | – | ||||||||||
|
Total fees and other services income, net
|
406.3 | 373.6 | 32.6 | 8.7 | ||||||||||||
|
Total other operating income
|
13.3 | 2.7 | 10.6 | 385.9 | ||||||||||||
|
Total operating income
|
433.3 | 434.8 | (1.4 | ) | (0.3 | ) | ||||||||||
|
Total operating expenses
|
(202.3 | ) | (197.5 | ) | 4.7 | 2.4 | ||||||||||
|
Net operating income
|
231.1 | 237.3 | (6.2 | ) | (2.6 | ) | ||||||||||
|
Total non-operating income (expense), net
|
12.2 | 1.3 | 10.8 | 811.5 | ||||||||||||
|
Income before income tax expense and non-controlling interest
|
243.2 | 238.6 | 4.6 | 1.9 | ||||||||||||
|
Income tax expense
|
(88.5 | ) | (82.1 | ) | 6.4 | 7.8 | ||||||||||
|
Non-controlling interest
|
(0.2 | ) | (0.1 | ) | 0.1 | 40.9 | ||||||||||
|
Net income
|
154.5 | 156.4 | (1.8 | ) | (1.2 | ) | ||||||||||
Porvenir’s net income decreased by 1.2% to Ps 154.5 billion in the year ended December 31, 2011 as compared to the year ended December 31, 2010. This fall was primarily driven by a decrease in net interest income and an increase in total operating expenses, offset, in most part, by an increase in net fee income, other operating income and non-operating income.
Total fees and other services income
Total net fees and other services income consist primarily of commissions earned on the administration of mandatory pension funds, severance funds, voluntary pension funds and third-party liability pension funds. Porvenir’s total net fees and other services income increased by 8.7% to Ps 406.3 billion in the year ended December 31, 2011, driven primarily by the increase in the revenues received from the administration of mandatory pension funds, which rose by Ps 38.8 billion, from Ps 266.4 billion in the year ended December 31, 2010 to Ps 305.2 billion in the year ended December 31, 2011, due to a 7.9% increase in the average number of contributors and a 3.8% increase in the average wage earned per contributor to Ps 1.2 million.
Also contributing to the increase in fee income was a Ps 5.1 billion increase in fees from severance fund management, which rose from Ps 55.7 billion in the year ended December 31, 2010 to Ps 60.8 billion in the year ended December 31, 2011. This increase was mainly due to the migration of assets from the short-term portfolio to the long-term portfolio and the rise in the assets under management in the severance fund, which increased by 0.3% in the same period of time.
Additionally, an increase in revenue associated with the management of voluntary pension funds, which rose by Ps 1.5 billion, from Ps 44.5 billion in the year ended December 31, 2010 to Ps 46.0 billion in the year ended December 31, 2011, also contributed to the increase in fee revenue.
Third-party liability pension funds decreased by Ps 0.5 billion from Ps 22.0 billion in the year ended December 31, 2010 to Ps 21.5 billion in the year ended December 31, 2011. This fall was due to a decrease in the commissions earned from the third-party liability pension funds that depend on the rate of return of the portfolios as prevailing local and global market conditions during 2011 were not particularly favorable.
Other fees associated with pension fund administration, such as non-contributor affiliate fees and transfer fees, decreased by Ps 5.8 billion from Ps 19.7 billion for the year ended December 31, 2010 to Ps 13.8 billion for the year ended December 31, 2011. Non-contributor affiliate fees are charged on income from the managed funds. Because returns on funds were lower in 2011 than in 2010 the fees charged were lower in 2011 than in 2010.
Commissions from banking services, consisting primarily of fees charged to customers for the processing of information and the early withdrawal of pensions, decreased by Ps 6.3 billion to Ps 7.6 billion in the year ended December 31, 2011. This decrease was mainly due to a Ps 8.5 billion reclassification of income from Gestión y Contacto S.A., which was included as commissions from banking services in 2010 and is classified as “other operating income” in 2011.
Fees and other service expenses increased marginally from Ps 50.1 billion for the year ended December 31, 2010 to Ps 50.5 billion for the year ended December 31, 2011.
Net interest income
Net interest income decreased by Ps 43.6 billion to Ps 14.8 billion in the year ended December 31, 2011. This decrease was primarily due to the decline in the rate of return of Porvenir’s mandatory investment in its stability reserve as prevailing market conditions during 2011 were not particularly favorable, in the local and global equity markets. In the local market, income from fixed income investments decreased due to the increase in the average Colombian Central Bank intervention and income from equity portfolios decreased due to the 17.6% decrease in the Colombian stock exchange index, or “IGBC,” during 2011. Porvenir’s rate of return on its investment portfolio decreased from 11.5% in the year ended December 31, 2010 to 2.2% in the year ended December 31, 2011. This effect was partially offset by an increase in the average volume of the investment portfolio, which grew by 30.4% from Ps 507.1 billion at December 31, 2010 to Ps 661.2 billion at December 31, 2011.
Operating expenses
|
Year ended December 31,
|
Change, 2011 vs. 2010
|
|||||||||||||||
|
2011
|
2010
|
# |
%
|
|||||||||||||
|
(in Ps billions)
|
||||||||||||||||
|
Salaries and employee benefits
|
(79.8 | ) | (77.5 | ) | 2.3 | 3.0 | ||||||||||
|
Bonus plan payments
|
(1.4 | ) | (3.7 | ) | (2.3 | ) | (62.8 | ) | ||||||||
|
Termination payments
|
(0.1 | ) | (0.5 | ) | (0.4 | ) | (85.6 | ) | ||||||||
|
Administrative and other expenses
|
(112.5 | ) | (110.8 | ) | 1.7 | 1.5 | ||||||||||
|
Deposit security, net
|
– | – | – | – | ||||||||||||
|
Charitable and other donation expenses
|
(2.2 | ) | (0.1 | ) | 2.0 | 1,412.8 | ||||||||||
|
Depreciation
|
(6.4 | ) | (5.0 | ) | 1.4 | 28.6 | ||||||||||
|
Goodwill amortization
|
– | – | – | – | ||||||||||||
|
Total operating expenses
|
(202.3 | ) | (197.5 | ) | 4.7 | 2.4 | ||||||||||
Porvenir’s total operating expenses in the year ended December 31, 2011 increased by 2.4% to Ps 202.3 billion due primarily to the 3.0% growth of salaries and employee benefits to Ps 79.8 billion, which was consistent with the organic growth of the business. Also contributing to this increase in operating expenses was a Ps 2.0 billion increase in charitable and other donation expenses, which rose from Ps 0.1 billion in the year ended December 31, 2010 to Ps 2.2 billion in the year ended December 31, 2011 due to increased charitable donations related to the Colombian floods in 2011. Porvenir’s efficiency ratio in the year ended December 31, 2011 worsened in comparison to the same period in 2010, increasing from 44.3% to 45.1%.
Other operating income
Total other operating income in the year ended December 31, 2011 increased by Ps 10.6 billion from Ps 2.7 billion in the year ended December 31, 2010 to Ps 13.3 billion. This increase was mainly due to a Ps 8.5 billion reclassification of income from Gestión y Contacto S.A., which was included as commissions from banking services in 2010 and is classified as “other operating income” in 2011.
Non-operating income (expense, net)
Total non-operating income (expense), net includes provisions, gains on sale of property, administrative authority fines, and labor demand penalties. Total non-operating income (expense), net in the year ended December 31, 2011 increased by Ps 10.8 billion from Ps 1.3 billion in the year ended December 31, 2010 to Ps 12.2 billion. This increase was due to reversals of provisions.
Income tax expense
Income tax expense increased by 6.4% to Ps 88.5 billion for the year ended December 31, 2011. This increase was primarily due to higher income before income tax expense and non-controlling interest. Porvenir’s effective tax rate, calculated before non-controlling interest, increased from 34.3% for the year ended December 31, 2010 to 36.4% for the year ended December 31, 2011, primarily due to an increase in non-tax deductible expenses such as the Equity Tax
(further explained in the “Results of operations for the year ended December 31, 2011 compared to the year ended December 31, 2010 – Grupo Aval
”
)
.
LB Panama
The following information is presented to illustrate the impact that LB Panama had on Banco de Bogotá’s consolidated results for the years ended December 31, 2011 and December 31, 2010. The results of operations in 2011 of LB Panama include twelve months of results of BAC Credomatic as compared to one month of BAC Credomatic
’
s operations in 2010. At December 31, 2011, LB Panama had U.S.$903 million of goodwill associated with the BAC Credomatic acquisition and U.S.$270 million of indebtedness that it incurred to finance, in part, the BAC Credomatic acquisition.
|
Year ended December 31,
|
Change, 2011 vs. 2010
|
|||||||||||
|
2011
|
2010
|
# | ||||||||||
|
(in Ps billions)
|
||||||||||||
|
Total interest income
|
1,415.0 | 119.0 | 1,296.0 | |||||||||
|
Total interest expense
|
(335.1 | ) | (29.0 | ) | 306.2 | |||||||
|
Net interest income
|
1,079.8 | 90.0 | 989.8 | |||||||||
|
Total provisions (reversals), net
|
(165.0 | ) | (2.3 | ) | 162.7 | |||||||
|
Total fees and other services income, net
|
599.3 | 55.1 | 544.3 | |||||||||
|
Total other operating income
|
96.5 | 17.3 | 79.2 | |||||||||
|
Total operating income
|
1,610.6 | 160.1 | 1,450.5 | |||||||||
|
Total operating expenses
|
(1,134.5 | ) | (114.0 | ) | 1,020.5 | |||||||
|
Net operating income
|
476.1 | 46.1 | 430.0 | |||||||||
|
Total non-operating income (expense), net
|
2.9 | 28.3 | (25.4 | ) | ||||||||
|
Income before income tax expense and
non-controlling interest
|
479.0 | 74.4 | 404.6 | |||||||||
|
Income tax expense
|
(147.9 | ) | (21.4 | ) | 126.5 | |||||||
|
Income before non-controlling interest
|
331.1 | 53.0 | 278.1 | |||||||||
|
Non-controlling interest
|
(0.1 | ) | (0.0 | ) | 0.1 | |||||||
|
Net income attributable to shareholders
|
331.0 | 53.0 | 278.0 | |||||||||
|
(1)
|
LB Panama’s financial information is prepared in accordance with Colombian Banking GAAP and primarily reflects BAC Credomatic’s consolidated results, which are consolidated in LB Panama’s results from December 1, 2010. At December 31, 2011, LB Panama had Ps 2,017.3 billion of goodwill associated with the BAC Credomatic acquisition and Ps 524.5 billion of indebtedness that it incurred to finance, in part, the BAC Credomatic acquisition. Goodwill amortization and interest expense associated with the BAC Credomatic acquisition for the year ended December 31, 2011 were Ps 49.1 billion and Ps 19.4 billion, respectively.
|
LB Panama’s net income attributable to its shareholders in the year ended December 31, 2011 increased by Ps 278.0 billion, to Ps 331.0 billion mainly due to an increase of Ps 989.8 billion in net interest income and an increase of Ps 544.3 billion in total fees and income from services, net partially offset by an increase in total net provisions of Ps 162.7 billion, an increase in total operating expenses of Ps 1,020.5 billion and an increase of income tax expense of Ps 126.5 billion.
Net interest income
|
LB Panama (1)
|
||||||||||||
|
Year ended December 31,
|
Change, 2011 vs. 2010
|
|||||||||||
|
2011
|
2010
|
# | ||||||||||
|
(in Ps billions)
|
||||||||||||
|
Interest income:
|
||||||||||||
|
Interest on loans
|
1,319.0 | 111.4 | 1,207.6 | |||||||||
|
Interest on investment securities
|
52.8 | 4.1 | 48.7 | |||||||||
|
Interbank and overnight funds
|
23.0 | 1.9 | 21.1 | |||||||||
|
Financial leases
|
20.1 | 1.6 | 18.6 | |||||||||
|
Total interest income
|
1,415.0 | 119.0 | 1,296.0 | |||||||||
|
Interest expense:
|
||||||||||||
|
Checking accounts
|
(29.6 | ) | - | 29.6 | ||||||||
|
Time deposits
|
(164.9 | ) | (15.1 | ) | 149.8 | |||||||
|
Savings deposits
|
(31.5 | ) | (5.2 | ) | 26.3 | |||||||
|
Total interest expense from deposits
|
(226.0 | ) | (20.3 | ) | 205.7 | |||||||
|
Borrowing from banks and others
|
(83.4 | ) | (6.5 | ) | 76.9 | |||||||
|
Interbank and overnight funds (expenses)
|
(7.0 | ) | (0.4 | ) | 6.6 | |||||||
|
Long-term debt (bonds)
|
(18.7 | ) | (1.8 | ) | 17.0 | |||||||
|
Total interest expense
|
(335.1 | ) | (29.0 | ) | 306.2 | |||||||
|
Net interest income
|
1,079.8 | 90.0 | 989.8 | |||||||||
|
(1)
|
LB Panama’s financial information is prepared in accordance with Colombian Banking GAAP and primarily reflects BAC Credomatic’s consolidated results, which are consolidated in LB Panama’s results from December 1, 2010. At December 31, 2011, LB Panama had Ps 2,017.3 billion of goodwill associated with the BAC Credomatic acquisition and Ps 524.5 billion of indebtedness that it incurred to finance, in part, the BAC Credomatic acquisition. Goodwill amortization and interest expense associated with the BAC Credomatic acquisition for the year ended December 31, 2011 were Ps 49.1 billion and Ps 19.4 billion, respectively.
|
LB Panama’s net interest income increased by Ps 989.8 billion from Ps 90.0 billion in the year ended December 31, 2010 to Ps 1,079.8 billion in the year ended December 31, 2011.
Total interest income increased by Ps 1,296.0 billion, from Ps 119.0 billion in the year ended December 31, 2010 to Ps 1,415.0 billion in the year ended December 31, 2011, primarily due to an increase in interest income from loans and financial leases, which rose by Ps 1,226.2 billion to Ps 1,339.2 billion in the year ended December 31, 2011. During 2011, the average balance of loans and financial leases for LB Panama was Ps 9,961.3 billion and the annualized yield on its loans and financial leases was 13.4%.
Interest on investment securities and income from interbank and overnight funds increased by Ps 48.7 billion and Ps 21.1 billion, respectively, during 2011. The average balance of investment securities during 2011 was Ps 1,333.4 billion and the average yield on investments was 4.0%.
Partially offsetting the increase in interest income from loans and financial leases, investment securities and overnight funds was a Ps 306.2 billion increase in total interest expense from Ps 29.0 billion in 2010 to Ps 335.1 billion in 2011. The average balance of interest-bearing liabilities was Ps 13,286.5 billion and the annualized rate paid on interest-bearing liabilities was 2.5%.
LB Panama’s net interest margin (calculated as net interest income divided by total average interest-earning assets) was 8.8% in the year ended December 31, 2011. The spread between the yield earned on its loans and financial leases and the cost of its interest-bearing liabilities was 10.9% in the year ended December 31, 2011.
Provisions
Total net provision increased by Ps 162.7 billion to Ps 165.0 billion for the year ended December 31, 2011. Net Provisions for loans and financial leases contributed Ps 161.4 billion of this total. LB Panama’s past due loans improved from 3.1% of total loans in 2010 to 2.8% of total loans in 2011. LB Panama’s charge offs were Ps 165.1 billion in 2011, equivalent to 1.6% of average outstanding loans. LB Panama’s coverage ratio for the year ended December 31, 2011 was 64.3% compared to 65.7% for the year ended December 31, 2010.
Total fees and other services income
|
LB Panama (1)
|
||||||||||||
|
Year ended December 31,
|
Change, 2011 vs. 2010
|
|||||||||||
|
2011
|
2010
|
# | ||||||||||
|
(in Ps billions)
|
||||||||||||
|
Fees and other services income:
|
||||||||||||
|
Commissions from banking services
|
416.2 | 37.9 | 378.3 | |||||||||
|
Branch network services
|
– | – | – | |||||||||
|
Credit card merchant fees
|
173.4 | 18.6 | 154.8 | |||||||||
|
Checking fees
|
– | – | – | |||||||||
|
Warehouse services
|
– | – | – | |||||||||
|
Fiduciary activities
|
– | – | – | |||||||||
|
Pension plan administration
|
9.8 | – | 9.8 | |||||||||
|
Other
|
55.0 | 5.7 | 49.3 | |||||||||
|
Total fees and other services income
|
654.4 | 62.3 | 592.1 | |||||||||
|
Fees and other services expenses
|
(55.0 | ) | (7.2 | ) | 47.8 | |||||||
|
Total fees and other services income, net
|
599.3 | 55.1 | 544.3 | |||||||||
|
(1)
|
LB Panama’s financial information is prepared in accordance with Colombian Banking GAAP and primarily reflects BAC Credomatic’s consolidated results, which are consolidated in LB Panama’s results from December 1, 2010. At December 31, 2011, LB Panama had Ps 2,017.3 billion of goodwill associated with the BAC Credomatic acquisition and Ps 524.5 billion of indebtedness that it incurred to finance, in part, the BAC Credomatic acquisition. Goodwill amortization and interest expense associated with the BAC Credomatic acquisition for the year ended December 31, 2011 were Ps 49.1 billion and Ps 19.4 billion, respectively.
|
Total net fees and other services income increased by Ps 544.3 billion to Ps 599.3 billion in the year ended December 31, 2011, primarily as a result of higher commissions from banking services and increased credit card merchant fees.
Other operating income
|
LB Panama (1)
|
||||||||||||
|
Year ended December 31,
|
Change, 2011 vs. 2010
|
|||||||||||
|
2011
|
2010
|
# | ||||||||||
|
(in Ps billions)
|
||||||||||||
|
Foreign exchange gains (losses), net
|
100.9 | 15.3 | 85.5 | |||||||||
|
Gains (losses) on derivative operations, net
|
(4.6 | ) | 2.0 | (6.6 | ) | |||||||
|
Gains on sales of investments in equity securities, net
|
– | (0.0 | ) | 0.0 | ||||||||
|
Income from non-financial sector, net
|
– | – | – | |||||||||
|
Dividend income
|
– | – | – | |||||||||
|
Other
|
0.2 | 0.0 | 0.2 | |||||||||
|
Other operating income
|
96.5 | 17.3 | 79.2 | |||||||||
|
(1)
|
LB Panama’s financial information is prepared in accordance with Colombian Banking GAAP and primarily reflects BAC Credomatic’s consolidated results, which are consolidated in LB Panama’s results from December 1, 2010. At December 31, 2011, LB Panama had Ps 2,017.3 billion of goodwill associated with the BAC Credomatic acquisition and Ps 524.5 billion of indebtedness that it incurred to finance, in part, the BAC Credomatic acquisition. Goodwill amortization and interest expense associated with the BAC Credomatic acquisition for the year ended December 31, 2011 were Ps 49.1 billion and Ps 19.4 billion, respectively.
|
Total other operating income, net increased by Ps 79.2 billion to Ps 96.5 billion in the year ended December 31, 2011 due primarily to a Ps 85.5 billion increase associated with foreign exchange gains (losses), net. In the ordinary course of business, LB Panama enters into forward contracts and other derivative transactions in foreign currency through its treasury department almost entirely for hedging purposes and on behalf of clients.
Operating expenses
|
LB Panama (1)
|
||||||||||||
|
Year ended December 31,
|
Change, 2011 vs. 2010
|
|||||||||||
| 201 | 2010 | # | ||||||||||
|
(in Ps billions)
|
||||||||||||
|
Salaries and employee benefits
|
(451.0 | ) | (35.7 | ) | 415.3 | |||||||
|
Bonus plan payments
|
(53.9 | ) | (2.9 | ) | 51.1 | |||||||
|
Termination payments
|
(17.3 | ) | (3.9 | ) | 13.4 | |||||||
|
Administrative and other expenses
|
(490.7 | ) | (63.3 | ) | 427.4 | |||||||
|
Deposit security, net
|
(8.6 | ) | (0.7 | ) | 7.8 | |||||||
|
Charitable and other donation expenses
|
(1.7 | ) | (0.2 | ) | 1.5 | |||||||
|
Depreciation
|
(56.9 | ) | (4.4 | ) | 52.5 | |||||||
|
Goodwill amortization
|
(54.4 | ) | (2.8 | ) | 51.5 | |||||||
|
Total operating expenses
|
(1,134.5 | ) | (114.0 | ) | 1,020.5 | |||||||
|
(1)
|
LB Panama’s financial information is prepared in accordance with Colombian Banking GAAP and primarily reflects BAC Credomatic’s consolidated results, which are consolidated in LB Panama’s results from December 1, 2010. At December 31, 2011, LB Panama had Ps 2,017.3 billion of goodwill associated with the BAC Credomatic acquisition and Ps 524.5 billion of indebtedness that it incurred to finance, in part, the BAC Credomatic acquisition. Goodwill amortization and interest expense associated with the BAC Credomatic acquisition for the year ended December 31, 2011 were Ps 49.1 billion and Ps 19.4 billion, respectively.
|
Total operating expenses increased by Ps 1,020.5 billion to Ps 1,134.5 billion in the year ended December 31, 2011. The increase is mainly due to a Ps 427.4 billion increase to Ps 490.7 billion in administrative and other expenses and to a Ps 415.3 billion increase to Ps 451.0 billion in salaries and employee benefits. LB Panama’s number of employees decreased from 15,755 in 2010 to 15,498 in 2011. LB Panama’s efficiency ratio at December 31, 2011 was 57.6%, which improved from the 65.7% ratio at December 31, 2010, but still higher than Grupo Aval’s Colombian operations.
Non-operating income (expense)
Total non-operating income (expense) decreased by Ps 25.4 billion to Ps 2.9 billion for the year ended December 31, 2011 because at December 2010 LB Panama registered non-recurring income associated with a reversal of provisions for withholding taxes on dividends paid to BAC Credomatic by its subsidiaries.
Income tax expense
Income before income tax expense and non-controlling interest increased by Ps 126.5 billion to Ps 147.9 billion for the year ended December 31, 2011. LB Panama’s effective tax rate was 30.9% for the year ended December 31, 2011.
Non-controlling interest
LB Panama’s non-controlling interest is not material. It accounted for Ps 0.1 billion for the year ended December 31, 2011.
Banco de Occidente
Net income
|
Year ended December 31,
|
Change, 2011 vs. 2010
|
|||||||||||||||
|
2011
|
2010
|
# |
%
|
|||||||||||||
|
(in Ps billions)
|
||||||||||||||||
|
Total interest income
|
1,592.7 | 1,403.9 | 188.8 | 13.5 | ||||||||||||
|
Total interest expense
|
(525.5 | ) | (457.2 | ) | 68.2 | 14.9 | ||||||||||
|
Net interest income
|
1,067.2 | 946.7 | 120.6 | 12.7 | ||||||||||||
|
Total provisions (reversals), net
|
(176.6 | ) | (192.3 | ) | (15.7 | ) | (8.2 | ) | ||||||||
|
Total fees and other services income, net
|
198.5 | 186.6 | 11.9 | 6.4 | ||||||||||||
|
Total other operating income
|
314.3 | 316.7 | (2.3 | ) | (0.7 | ) | ||||||||||
|
Total operating income
|
1,403.5 | 1,257.6 | 145.9 | 11.6 | ||||||||||||
|
Total operating expenses
|
(846.3 | ) | (764.4 | ) | 81.8 | 10.7 | ||||||||||
|
Net operating income
|
557.2 | 493.2 | 64.0 | 13.0 | ||||||||||||
|
Total non-operating income (expense), net
|
15.5 | 21.4 | (5.9 | ) | (27.6 | ) | ||||||||||
|
Income before income tax expense and non-controlling interest
|
572.7 | 514.6 | 58.1 | 11.3 | ||||||||||||
|
Income tax expense
|
(139.0 | ) | (126.2 | ) | 12.8 | 10.2 | ||||||||||
|
Income before non-controlling interest
|
433.7 | 388.4 | 45.3 | 11.7 | ||||||||||||
|
Non-controlling interest
|
(1.6 | ) | (2.0 | ) | (0.4 | ) | (21.1 | ) | ||||||||
|
Net income attributable to shareholders
|
432.1 | 386.4 | 45.7 | 11.8 | ||||||||||||
Banco de Occidente’s net income attributable to its shareholders increased by 11.8% to Ps 432.1 billion for the year ended December 31, 2011. The most important drivers of this increase were the growth in net interest income and a decrease in total net provisions, offset in part by an increase in total operating expense and an increase in income tax expense.
Net interest income
|
Year ended December 31,
|
Change, 2011 vs. 2010
|
|||||||||||||||
|
2011
|
2010
|
# |
%
|
|||||||||||||
|
(in Ps billions)
|
||||||||||||||||
|
Interest income:
|
||||||||||||||||
|
Interest on loans
|
1,080.2 | 945.3 | 134.9 | 14.3 | ||||||||||||
|
Interest on investment securities
|
177.1 | 193.9 | (16.7 | ) | (8.6 | ) | ||||||||||
|
Interbank and overnight funds
|
29.2 | 8.4 | 20.8 | 247.1 | ||||||||||||
|
Financial leases
|
306.1 | 256.3 | 49.8 | 19.4 | ||||||||||||
|
Total interest income
|
1,592.7 | 1,403.9 | 188.8 | 13.5 | ||||||||||||
|
Interest expense:
|
||||||||||||||||
|
Checking accounts
|
(7.3 | ) | (4.9 | ) | 2.4 | 50.1 | ||||||||||
|
Time deposits
|
(116.5 | ) | (137.6 | ) | (21.1 | ) | (15.3 | ) | ||||||||
|
Savings deposits
|
(188.5 | ) | (141.6 | ) | 46.9 | 33.2 | ||||||||||
|
Total interest expense from deposits
|
(312.3 | ) | (284.1 | ) | 28.3 | 9.9 | ||||||||||
|
Borrowing from banks and others
|
(75.3 | ) | (76.8 | ) | (1.4 | ) | (1.9 | ) | ||||||||
|
Interbank and overnight funds (expenses)
|
(14.6 | ) | (6.7 | ) | 7.9 | 118.0 | ||||||||||
|
Long-term debt (bonds)
|
(123.3 | ) | (89.7 | ) | 33.6 | 37.4 | ||||||||||
|
Total interest expense
|
(525.5 | ) | (457.2 | ) | 68.2 | 14.9 | ||||||||||
|
Net interest income
|
1,067.2 | 946.7 | 120.6 | 12.7 | ||||||||||||
Banco de Occidente’s net interest income increased by 12.7% from Ps 946.7 billion for the year ended December 31, 2010 to Ps 1,067.2 billion for the year ended December 31, 2011. This increase was primarily driven by a 15.4% increase in the interest earned on loans and financial leases to Ps 1,386.3 billion for the year ended December 31, 2011. A 17.8% growth of Banco de Occidente’s average loan and financial lease portfolio to Ps 12,674.7 billion on December 31, 2011 resulted in a Ps 196.1 billion increase in interest income from loans and financial leases over the same period. Partially offsetting this increase was the decrease in average yield on loans and financial leases from 11.2% for the year ended December 31, 2010 to 10.9% for the same period in 2011, which resulted in a Ps 11.3 billion decrease in interest income from loans and financial leases. The decrease in the yield for loans and financial leases reflects a declining rate environment in the second half of 2010 and early 2011 together with the strong growth of our loan portfolio during 2011. The average interest yield on loans and financial leases for Banco de Occidente was 10.9% during the last quarter of 2011 as previously discussed in
“
Results of operations for the year ended December 31, 2011 compared to the year ended December 31, 2010 – Grupo Aval
–
Net interest income.
”
Also contributing to the increase in interest income was a Ps 20.8 billion increase in income from interbank and overnight funds to Ps 29.2 billion for the year ended December 31, 2011. This increase was mainly driven by the increase in the average yield from 2.1% in 2010 to 5.5% in 2011.
Interest income from investment securities decreased by 8.6% to Ps 177.1 billion for the year ended December 31, 2011. The fixed income portfolio generated Ps 177.1 billion, or 99.99%, of Banco de Occidente’s earnings on investment securities in December 31, 2011, which was 8.6% lower than the Ps 193.8 billion earned on fixed income investments in December 31, 2010 due to a decrease in the average balance. The equity portfolio generated the remaining Ps 0.01 billion, or 0.01%, of the interest income from investment securities, which was marginally down from the Ps 0.05 billion produced by the equity portfolio in December 31, 2010.
The 14.9% increase in total interest expense to Ps 525.5 billion for the year ended December 31, 2011 partially offset the increase in interest income. The increase in interest paid on interest-bearing liabilities was concentrated in savings deposits, for which interest expense increased by Ps 46.9 billion (Ps 25.0 billion due to an increase in rate paid and Ps 21.9 billion due to an increase in their average balance) and long-term debt, for which interest expense increased by Ps 33.6 billion (Ps 30.9 billion due to an increase in their average balance and Ps 2.6 billion due to a decrease in rate paid). These increases were partially offset by a Ps 21.1 billion decrease in interest expense for time deposits (Ps 16.3 billion due to a decrease in rate paid and Ps 4.9 billion due to a decrease in average balance). The increase in the average balance of time deposits was driven by the issuance of Ps 647.1 billion in bonds during 2011 to cover long-term operations on loans and financial leases.
The average rate paid on interest-bearing liabilities remained basically unchanged at 4.1% for the year ended December 31, 2011 as compared to the year ended December 31, 2010, and the average yield earned on interest-earning assets increased from 8.8% for the year ended December 31, 2010 to 9.0% for the year ended December 31, 2011.
For the reasons explained above, the spread between the yield earned on its loans and financial leases and the cost of its interest-bearing liabilities decreased by 21 basis points from 7.1% for the year ended December 31, 2010 to 6.9% for the year ended December 31, 2011 due to the fact that the yield on loans and financial leases decreased by 23 basis points while the cost of funds remained basically unchanged. Banco de Occidente’s net interest margin, however, remained unchanged at 6.0% at December 31, 2011 and December 31, 2010.
Provisions
Total net provisions decreased by 8.2%, or Ps 15.7 billion, to Ps 176.6 billion for the year ended December 31, 2011, mainly driven by an increase in recovery of charged-off assets, which increased by Ps 17.7 billion to Ps 57.0 billion for the year ended December 31, 2011 primarily as a result of the improving Colombian economy and a more effective recovery effort by Banco de Occidente.
Net provisions for loan and financial lease losses, the main component of total net provisions, increased by 0.5%, or Ps 1.0 billion, to Ps 205.2 billion for the year ended December 31, 2011. Despite an increase in past due loans, in line with general growth of the loan portfolio, Banco de Occidente
’
s delinquency ratio improved from 2.8% at December 31,
2010 to 2.5% at December 31, 2011. This improvement was primarily a result of a reduction in past due commercial loans, which decreased by 8.4% to Ps 122.3 billion (with a drop in their delinquency ratio from 1.9% to 1.4%) due to the improvement of the Colombian economy.
Charge-offs decreased by 26.3% to Ps 167.8 billion for the year ended December 31, 2011, reflecting the improvement in Banco de Occidente’s credit quality. Banco de Occidente’s charge-offs to average loans and financial leases ratio decreased from 2.1% at December 31, 2010 to 1.3% at December 31, 2011. Banco de Occidente’s coverage ratio decreased slightly from 163.3% for the year ended December 31, 2010 to 158.4% for the year ended December 31, 2011.
Net provisions for accrued interest and other receivables decreased by 3.5%, or Ps 0.9 billion, to Ps 25.1 billion due to the aforementioned improvement in the Colombian economy.
Net provisions for foreclosed assets and other assets increased by Ps 1.9 billion to Ps 3.3 billion for the year ended December 31, 2011. Gross provisions for foreclosed assets and other assets increased by Ps 4.5 billion to Ps 11.4 billion as operating leases increased, and reversals of provisions for foreclosed and other assets increased by Ps 2.6 billion to Ps 8.0 billion primarily as a result of the improving Colombian economy.
Total fees and other services income, net
|
Year ended December 31,
|
Change, 2011 vs. 2010
|
|||||||||||||||
|
2011
|
2010
|
# |
%
|
|||||||||||||
|
(in Ps billions)
|
||||||||||||||||
|
Fees and other services income:
|
||||||||||||||||
|
Commissions from banking services
|
140.6 | 124.5 | 16.1 | 12.9 | ||||||||||||
|
Branch network services
|
– | – | – | – | ||||||||||||
|
Credit card merchant fees
|
75.3 | 81.5 | (6.2 | ) | (7.6 | ) | ||||||||||
|
Checking fees
|
23.7 | 23.3 | 0.5 | 1.9 | ||||||||||||
|
Warehouse services
|
– | – | – | – | ||||||||||||
|
Fiduciary activities
|
38.5 | 37.9 | 0.6 | 1.7 | ||||||||||||
|
Pension plan administration
|
– | – | – | – | ||||||||||||
|
Other
|
29.6 | 27.0 | 2.6 | 9.6 | ||||||||||||
|
Total fees and other services income
|
307.7 | 294.1 | 13.6 | 4.6 | ||||||||||||
|
Fees and other services expenses
|
(109.2 | ) | (107.5 | ) | 1.7 | 1.6 | ||||||||||
|
Total fees and other services income, net
|
198.5 | 186.6 | 11.9 | 6.4 | ||||||||||||
Total net fees and other services income increased by 6.4% to Ps 198.5 billion for the year ended December 31, 2011. This increase was primarily due to a Ps 16.1 billion increase in commissions from banking services, due to fees received from processing social security payments and fees received from ACH (Automated Clearing House). The increase was partially offset by a Ps 6.2 billion decrease in credit card and merchant fees and a Ps 1.7 billion increase in fees and other services expense.
Other operating income
|
Year ended December 31,
|
Change, 2011 vs. 2010
|
|||||||||||||||
|
2011
|
2010
|
# |
%
|
|||||||||||||
|
(in Ps billions)
|
||||||||||||||||
|
Foreign exchange gains (losses), net
|
18.6 | 17.1 | 1.6 | (9.3 | ) | |||||||||||
|
Gains on derivative operations, net
|
4.3 | 27.6 | (23.3 | ) | (84.6 | ) | ||||||||||
|
Gains on sales of investments in equity securities, net
|
3.7 | - | 3.7 | - | ||||||||||||
|
Income from non-financial sector, net
|
2.0 | 1.6 | 0.4 | 28.1 | ||||||||||||
|
Dividend income
|
126.7 | 111.7 | 15.0 | 13.4 | ||||||||||||
|
Other
|
159.1 | 158.8 | 0.3 | 0.2 | ||||||||||||
|
Other operating income
|
314.3 | 316.7 | (2.3 | ) | (0.7 | ) | ||||||||||
Total other operating income decreased by 0.7% to Ps 314.3 billion for the year ended December 31, 2011. This decrease was mainly driven by a Ps 21.7 billion decrease in net foreign exchange and derivative operations. Partially offsetting these decreases was a Ps 15.0 billion increase in dividend income and a Ps 3.7 billion increase in gains on sales of investments in equity securities.
The Ps 23.3 billion decrease on gains on derivative operations, net was due to a higher appreciation of the Peso than the amount predicted by Banco de Occidente.
Operating expenses
|
Year ended December 31,
|
Change, 2011 vs. 2010
|
|||||||||||||||
|
2011
|
2010
|
# |
%
|
|||||||||||||
|
(in Ps billions)
|
||||||||||||||||
|
Salaries and employee benefits
|
(298.1 | ) | (275.1 | ) | 23.1 | 8.4 | ||||||||||
|
Bonus plan payments
|
(24.6 | ) | (20.1 | ) | 4.5 | 22.1 | ||||||||||
|
Termination payments
|
(2.9 | ) | (3.7 | ) | (0.8 | ) | (22.5 | ) | ||||||||
|
Administrative and other expenses
|
(363.6 | ) | (320.6 | ) | 43.0 | 13.4 | ||||||||||
|
Deposit security, net
|
(34.1 | ) | (23.6 | ) | 10.6 | 44.9 | ||||||||||
|
Charitable and other donation expenses
|
(3.7 | ) | (1.4 | ) | 2.3 | 161.2 | ||||||||||
|
Depreciation
|
(117.9 | ) | (118.6 | ) | (0.7 | ) | (0.6 | ) | ||||||||
|
Goodwill amortization
|
(1.4 | ) | (1.3 | ) | 0.1 | 6.6 | ||||||||||
|
Total operating expenses
|
(846.3 | ) | (764.4 | ) | 81.8 | 10.7 | ||||||||||
Total operating expenses for the year ended December 31, 2011 increased by Ps 81.8 billion, or 10.7%, to Ps 846.3 billion primarily due to a Ps 43.0 billion increase in administrative and other expenses to Ps 363.6 billion for the year ended December 31, 2011. This was driven principally by an increase in the Equity Tax (further discussed in the “Results of operations for the year ended December 31, 2011 compared to the year ended December 31, 2010 – Grupo Aval
”
) and an increase in operating expenses related to the growth in the loan and financial lease portfolio.
Salaries and employee benefits increased by Ps 23.1 billion, or 8.4%, to Ps 298.1 billion. This increase was explained by an increase in the number of Banco de Occidente’s employees from 8,269 on December 31, 2010 to 9,002 on December 31, 2011. On a per capita basis, salary and employee benefits decreased by 0.4%.
Deposit security expense increased by Ps 10.6 billion. Prior to 2010, this insurance expense was charged quarterly in advance; however, since then it is charged quarterly in arrears. Because of this, the Ps 23.6 billion in December 31, 2010 reflects only the expense of the last three quarters of 2010 (the expense for the first quarter was recorded in December 2009), while the Ps 34.1 billion for the year ended December 31, 2011 reflects the expense for the year.
Banco de Occidente’s efficiency ratio deteriorated slightly from the year ended December 31, 2010 as compared to the year ended December 31, 2011, increasing from 44.5% to 46.0%. The ratio of operating expenses before depreciation and amortization as a percentage of average earning assets was 4.1% for both 2010 and 2011.
Non-operating income (expense)
Total non-operating income (expense), which represented 2.7% of income before income tax expense and non-controlling interest for the year ended December 31, 2011, includes gains (losses) from the sale of foreclosed assets, property, plant and equipment, and other assets and income. This line item decreased by Ps 5.9 billion to Ps 15.5 billion for the year ended December 31, 2011 mainly because during 2010, Banco de Occidente sold a warehouse that generated a non-recurring non-operating income of approximately Ps 5.0 billion.
Income tax expense
Income tax expense increased by Ps 12.8 to Ps 139.0 billion for the year ended December 31, 2011. This was primarily due to higher income before income tax expense and non-controlling interest. The effective tax rate decreased slightly from 24.5% in December 2010 to 24.3% in December 2011.
Non-controlling interest
Banco de Occidente’s non-controlling interest remained basically unchanged from the year ended December 31, 2010, decreasing by Ps 0.4 billion to 1.6 billion for the year ended December 31, 2011. Since the merger of Banco de Occidente and Leasing de Occidente, non-controlling interest is not a significant factor to Banco de Occidente’s net income, responsible for only 0.4% of net income before non-controlling interest for the year ended December 31, 2011.
Banco Popular
Net income
|
Year ended December 31,
|
Change, 2011 vs. 2010
|
|||||||||||||||
|
2011
|
2010
|
# |
%
|
|||||||||||||
|
(in Ps billions)
|
||||||||||||||||
|
Total interest income
|
1,403.2 | 1,276.2 | 127.1 | 10.0 | ||||||||||||
|
Total interest expense
|
(417.8 | ) | (325.3 | ) | 92.5 | 28.4 | ||||||||||
|
Net interest income
|
985.4 | 950.9 | 34.5 | 3.6 | ||||||||||||
|
Total provisions (reversals), net
|
(67.3 | ) | (101.6 | ) | (34.3 | ) | (33.8 | ) | ||||||||
|
Total fees and other services income, net
|
150.7 | 136.1 | 14.6 | 10.7 | ||||||||||||
|
Total other operating income
|
51.8 | 42.0 | 9.8 | 23.3 | ||||||||||||
|
Total operating income
|
1,120.7 | 1,027.5 | 93.2 | 9.1 | ||||||||||||
|
Total operating expenses
|
(623.2 | ) | (558.3 | ) | 64.9 | 11.6 | ||||||||||
|
Net operating income
|
497.5 | 469.2 | 28.3 | 6.0 | ||||||||||||
|
Total non-operating income (expense), net
|
57.2 | 53.0 | 4.2 | 7.8 | ||||||||||||
|
Income before income tax expense and non-controlling interest
|
554.7 | 522.2 | 32.4 | 6.2 | ||||||||||||
|
Income tax expense
|
(177.5 | ) | (156.8 | ) | 20.7 | 13.2 | ||||||||||
|
Income before non-controlling interest
|
377.2 | 365.4 | 11.7 | 3.2 | ||||||||||||
|
Non-controlling interest
|
(5.0 | ) | (3.8 | ) | 1.2 | 31.0 | ||||||||||
|
Net income attributable to shareholders
|
372.2 | 361.6 | 10.6 | 2.9 | ||||||||||||
Banco Popular’s net income attributable to its shareholders increased by 2.9% to Ps 372.2 billion for the year ended December 31, 2011. This increase was primarily due to an increase in net interest income, a decrease in
total provisions (reversals), net
and a rise in total fees and other services income, offset in part by an increase in total operating expenses and income tax expense.
Net interest income
|
Year ended December 31,
|
Change, 2011 vs. 2010
|
|||||||||||||||
|
2011
|
2010
|
# |
%
|
|||||||||||||
|
(in Ps billions)
|
||||||||||||||||
|
Interest income:
|
||||||||||||||||
|
Interest on loans
|
1,215.4 | 1,067.4 | 148.0 | 13.9 | ||||||||||||
|
Interest on investment securities
|
141.6 | 164.8 | (23.1 | ) | (14.0 | ) | ||||||||||
|
Interbank and overnight funds
|
16.2 | 16.8 | (0.5 | ) | (3.2 | ) | ||||||||||
|
Financial leases
|
30.0 | 27.3 | 2.7 | 9.9 | ||||||||||||
|
Total interest income
|
1,403.2 | 1,276.2 | 127.1 | 10.0 | ||||||||||||
|
Interest expense:
|
||||||||||||||||
|
Checking accounts
|
(8.4 | ) | (1.9 | ) | 6.5 | 341.4 | ||||||||||
|
Time deposits
|
(89.7 | ) | (81.8 | ) | 7.9 | 9.7 | ||||||||||
|
Savings deposits
|
(205.2 | ) | (170.6 | ) | 34.6 | 20.3 | ||||||||||
|
Total interest expense on deposits
|
(303.3 | ) | (254.3 | ) | 49.0 | 19.3 | ||||||||||
|
Borrowing from banks and others
|
(15.3 | ) | (9.9 | ) | 5.4 | 54.2 | ||||||||||
|
Interbank and overnight funds (expenses)
|
(6.7 | ) | (2.5 | ) | 4.2 | 166.9 | ||||||||||
|
Long-term debt (bonds)
|
(92.4 | ) | (58.5 | ) | 34.0 | 58.1 | ||||||||||
|
Total interest expense
|
(417.8 | ) | (325.3 | ) | 92.5 | 28.4 | ||||||||||
|
Net interest income
|
985.4 | 950.9 | 34.5 | 3.6 | ||||||||||||
Banco Popular’s net interest income grew by 3.6% to Ps 985.4 billion for the year ended December 31, 2011 as compared to the year ended December 31, 2010. This increase was driven primarily by the 13.8% increase in interest income from loans and financial leases to Ps 1,245.4 billion for the year ended December 31, 2011. Banco Popular’s average loans and financial lease portfolio grew by 21.0% to Ps 9,193.1 billion, resulting in a Ps 211.7 billion increase in interest income from loans and financial leases. Partially offsetting this increase was the decrease in average yield from 14.4% for the year ended December 31, 2010 to 13.5% for the year ended December 31, 2011, which resulted in a Ps 61.0 billion decrease in interest income from loans and financial leases. The decrease in the yield for loans and financial leases reflects a declining rate environment in the second half of 2010 and early 2011 together with the strong growth of our loan portfolio during 2011. The average interest yield on loans and financial leases for Banco Popular was 13.4% during the last quarter of 2011 as explained in the Grupo Aval discussion.
A decrease in interest income from investment securities, which declined by 14.0% to Ps 141.6 billion for the year ended December 31, 2011, partially offset the increase in interest income from loans and financial leases. The fixed income portfolio generated Ps 138.5 billion of interest income from investment securities, accounting for 97.8% of Banco Popular’s earnings on investment securities for the year ended December 31, 2011. This was 15.6% lower than the Ps 164.0 billion of income generated by fixed income securities for the year ended December 31, 2010 driven by a decrease in the average annualized yield and a decrease in the average fixed income portfolio. Banco Popular’s equity portfolio generated the remaining Ps 3.2 billion (Ps 2.1 billion of which was due to the realization of gains from the sale of an investment in VISA), or 2.2%, of income from investment securities for the year ended December 31, 2011.
The average yield earned on interest-earning assets decreased from 12.0% for the year ended December 31, 2010 to 11.6% for the year ended December 31, 2011, driven by the decrease in the average yield on loans and financial leases and in the yield on investment securities.
The increase in interest income was also partially offset by a 28.4%, or Ps 92.5 billion, increase in total interest expense to Ps 417.8 billion for the year ended December 31, 2011. The increase in interest expense was concentrated in savings accounts, for which interest expense increased by Ps 34.6 billion (Ps 24.1 billion due to an increase in rate paid and a Ps 10.5 billion increase due to an increase in their average balance) and long-term debt, for which interest expense increased by Ps 34.0 billion (Ps 31.6 billion due to an increase in their average balance and a Ps 2.3 billion increase due to an increase in rate paid). The average rate paid on interest-bearing liabilities increased from 3.8% in 2010 to 4.2% in 2011, which was consistent with the increase in the average DTF explained in the Grupo Aval discussion.
For the reasons explained above, Banco Popular’s net interest margin decreased by 82 basis points from 9.0% for the year ended December 31, 2010, to 8.1% for the year ended December 31, 2011. Similarly, the spread between the yield earned on its loans and financial leases and the cost of its interest-bearing liabilities decreased by 133 basis points from 10.6% for the year ended December 31, 2010 to 9.3% for the year ended December 31, 2011.
Provisions
Total net provisions decreased by Ps 34.3 billion to Ps 67.3 billion for the year ended December 31, 2011, driven primarily by a 30.0%, or Ps 38.5 billion, decrease in net provisions for loans and financial leases to Ps 90.1 billion. Gross provisions for loan and financial lease losses decreased by 11.6% to Ps 289.4 billion, while the reversal of provisions increased by 0.2% to Ps 199.3 billion for the year ended December 31, 2011.
The decrease in provisions for loans and financial leases losses was consistent with the improvement of Banco Popular’s credit quality, which stemmed primarily from the recovery of the Colombian economy. Past due loans
decreased by 2.0% to Ps 211.2 billion for the year ended December 31, 2011 as compared to the year ended December 31, 2010, but the bank’s delinquency ratio improved from 2.5% at December 31, 2010 to 2.1% at December 31, 2011. This improvement was primarily a result of a reduction in commercial loans past due, which decreased by 36.9% to Ps 46.6 billion (with a drop in their delinquency ratio from 2.0% to 1.1%) because of the strength of the Colombian economy and the bank’s more effective collection efforts. Consumer loans and financial leases past due partially offset this improvement. Consumer loans and financial leases past due increased by Ps 23.7 billion to Ps 140.4 billion and their delinquency ratio increased from 2.5% to 2.6%. Nevertheless, Banco Popular’s consumer loan and financial lease delinquency ratio is still lower than that of our other banking subsidiaries and the industry average because the majority of its consumer loans are payroll loans.
The decrease in past due loans was accompanied by a reduction in charge-offs, which was also due to the recovery of the Colombian economy. Charge-offs decreased by 47.4% to Ps 51.9 billion for the year ended December 31, 2011 as compared to the year ended December 31, 2010. Consistent with the decrease in charge-offs, Banco Popular’s charge-offs to average loan ratio decreased from 1.3% at December 31, 2010 to 0.6% at December 31, 2011. Since Banco Popular’s net provisions for loans and financial leases were greater than its charge-offs for the year ended December 31, 2011, its allowance for loan and financial lease losses increased by 7.9% to Ps 389.3 billion at December 31, 2011. Banco Popular’s coverage ratio improved from 167.5% to 184.3%.
Net provisions for accrued interest and other receivables increased by Ps 1.7 billion to Ps (3.9) billion (indicating a recovery of Ps 3.9 billion) due to the aforementioned improvement in the Colombian economy.
Net provisions for foreclosed assets and other assets increased by Ps 4.3 billion to Ps (0.7) billion (indicating a net recovery of Ps 0.7 billion) at December 31, 2011. Gross provisions for foreclosed assets and other assets decreased by Ps 0.5 billion to Ps 3.5 billion, while reversals of provisions for foreclosed and other assets decreased by Ps 4.7 billion to Ps 4.3 billion for the year ended December 31, 2011. Finally, Banco Popular’s recovery of charged-off assets increased by Ps 1.8 billion to Ps 18.1 billion over the same periods.
Total fees and other services income, net
|
Year ended December 31,
|
Change, 2011 vs. 2010
|
|||||||||||||||
|
2011
|
2010
|
# |
%
|
|||||||||||||
|
(in Ps billions)
|
||||||||||||||||
|
Fees and other services income:
|
||||||||||||||||
|
Commissions from banking services
|
88.8 | 86.9 | 2.0 | 2.3 | ||||||||||||
|
Branch network services
|
– | – | – | – | ||||||||||||
|
Credit card merchant fees
|
5.4 | 5.1 | 0.4 | 7.0 | ||||||||||||
|
Checking fees
|
4.1 | 4.3 | (0.2 | ) | (5.7 | ) | ||||||||||
|
Warehouse services
|
61.1 | 55.3 | 5.8 | 10.5 | ||||||||||||
|
Fiduciary activities
|
11.8 | 10.7 | 1.1 | 10.4 | ||||||||||||
|
Pension plan administration
|
1.1 | 1.6 | (0.6 | ) | (35.9 | ) | ||||||||||
|
Others
|
10.7 | 10.3 | 0.4 | 3.9 | ||||||||||||
|
Total fees and other services income
|
182.9 | 174.1 | 8.8 | 5.1 | ||||||||||||
|
Fees and other services expenses
|
(32.2 | ) | (38.0 | ) | (5.7 | ) | (15.1 | ) | ||||||||
|
Total fees and other services income, net
|
150.7 | 136.1 | 14.6 | 10.7 | ||||||||||||
Total net fees and other services income increased by 10.7% to Ps 150.7 billion for the year ended December 31, 2011. This increase was primarily due to a Ps 5.8 billion increase in warehouse services to Ps 61.1 billion, a Ps 2.0 billion increase in commissions from banking services to Ps 88.8 billion and a Ps 5.7 billion decrease in fees and other services expenses to Ps 32.2 billion.
Fees from warehouse services are contributed by Alpopular, Banco de Occidente’s warehouse subsidiary. The rise in the income from warehouse services resulted from greater imports/exports from existing clients and the addition of new clients.
The decrease in fees and other services expenses was mainly driven by a decrease in commissions and banking services expenses.
Other operating income
|
Year ended December 31,
|
Change, 2011 vs. 2010
|
|||||||||||||||
|
2011
|
2010
|
# |
%
|
|||||||||||||
|
(in Ps billions)
|
||||||||||||||||
|
Foreign exchange gains (losses), net
|
0.3 | (1.6 | ) | 1.9 | 117.3 | |||||||||||
|
Gains on derivative operations, net
|
0.0 | 0.0 | 0.0 | – | ||||||||||||
|
Gains on sales of investments in equity securities, net
|
– | (0.0 | ) | 0.0 | – | |||||||||||
|
Income from non-financial sector, net
|
7.9 | 3.5 | 4.4 | 128.8 | ||||||||||||
|
Dividend income
|
31.6 | 28.1 | 3.5 | 12.6 | ||||||||||||
|
Other
|
12.0 | 12.1 | (0.1 | ) | (0.5 | ) | ||||||||||
|
Total other operating income
|
51.8 | 42.0 | 9.8 | 23.3 | ||||||||||||
Total other operating income increased by 23.3% to Ps 51.8 billion for the year ended December 31, 2011. This increase was primarily a result of a Ps 4.4 billion increase in net income from the non-financial sector, which is income contributed by Inca Fruenhauf S.A., or “Inca,” (Inca is a manufacturer of vehicle-towing equipment of which Banco Popular owns approximately 44.6%) a Ps 3.5 billion increase in dividend income and a Ps 1.9 billion increase in foreign exchange gains.
Operating expenses
|
Year ended December 31,
|
Change, 2011 vs. 2010
|
|||||||||||||||
|
2011
|
2010
|
# |
%
|
|||||||||||||
|
(in Ps billions)
|
||||||||||||||||
|
Salaries and employee benefits
|
(244.9 | ) | (224.1 | ) | 20.8 | 9.3 | ||||||||||
|
Bonus plan payments
|
(4.8 | ) | (3.8 | ) | 0.9 | 24.3 | ||||||||||
|
Termination payments
|
(0.2 | ) | (0.1 | ) | 0.1 | 65.1 | ||||||||||
|
Administrative and other expenses
|
(321.5 | ) | (281.2 | ) | 40.2 | 14.3 | ||||||||||
|
Deposit security, net
|
(27.2 | ) | (26.7 | ) | 0.5 | 1.7 | ||||||||||
|
Charitable and other donation expenses
|
(1.6 | ) | (1.3 | ) | 0.3 | 20.8 | ||||||||||
|
Depreciation
|
(23.1 | ) | (20.9 | ) | 2.2 | 10.4 | ||||||||||
|
Goodwill amortization
|
– | – | – | – | ||||||||||||
|
Total operating expenses
|
(623.2 | ) | (558.3 | ) | 64.9 | 11.6 | ||||||||||
Total operating expenses increased by 11.6% to Ps 623.2 billion for the year ended December 31, 2011, principally due to a 14.3% increase in administrative and other expenses. This increase was driven by a rise in the Equity Tax (further explained in “Results of operations for the year ended December 31, 2011 compared to the year ended December 31, 2010 – Grupo Aval
”
) and an increase in operating expenses related to the growth in the loan and financial lease portfolio. Salaries and employee benefits increased by 9.3% to Ps 244.9 billion, which was partially explained by the increase in headcount from 6,180 at December 31, 2010 to 6,414 at December 31, 2011. On a per capita basis, salaries and employee benefits increased by 5.3%. Banco Popular’s efficiency ratio worsened from 47.6% at December 31, 2010 to 50.5% at December 31, 2011, associated with the contraction in net interest margin explained in the net interest income subsection. The ratio of operating expenses before depreciation and amortization as a percentage of average earning assets improved from 5.1% in 2010 to 5.0% in 2011.
Non-operating income (expense)
Total net non-operating income (expense) increased by Ps 4.2 billion to Ps 57.2 billion for the year ended December 31, 2011, from a net non-operating income of Ps 53.0 billion for the year ended December 31, 2010, due to reversals of provisions.
Income tax expense
Income tax expense for Banco Popular increased by Ps 20.7 billion to Ps 177.5 billion for the year ended December 31, 2011. This increase was primarily due to higher income before income tax expense and non-controlling interest. Banco Popular’s effective tax rate, calculated before non-controlling interest, increased from 30.0% for the year ended December 31, 2010 to 32.0% for the year December 31, 2011, due to an increase in non-tax deductible expenses such as the Equity Tax (further explained in the “Results of operations for the year ended December 31, 2011 compared to the year ended December 31, 2010 – Grupo Aval
”
).
Non-controlling interest
Banco Popular’s non-controlling interest increased by Ps 1.2 billion to Ps 5.0 billion. Non-controlling interest is not a significant contributor to net income for Banco Popular, responsible for only 1.3% of net income before non-controlling interest for the year ended December 31, 2011.
Banco AV Villas
Net income
|
Year ended December 31,
|
Change, 2011 vs. 2010
|
|||||||||||||||
|
2011
|
2010
|
# |
%
|
|||||||||||||
|
(in Ps billions)
|
||||||||||||||||
|
Total interest income
|
717.6 | 683.1 | 34.4 | 5.0 | ||||||||||||
|
Total interest expense
|
(169.0 | ) | (142.8 | ) | 26.2 | 18.3 | ||||||||||
|
Net interest income
|
548.6 | 540.3 | 8.3 | 1.5 | ||||||||||||
|
Total provisions (reversals), net
|
(33.4 | ) | (122.4 | ) | (89.0 | ) | (72.7 | ) | ||||||||
|
Total fees and other services income, net
|
151.2 | 140.5 | 10.7 | 7.6 | ||||||||||||
|
Total other operating income
|
3.4 | 9.7 | (6.3 | ) | (65.2 | ) | ||||||||||
|
Total operating income
|
669.7 | 568.1 | 101.6 | 17.9 | ||||||||||||
|
Total operating expenses
|
(436.0 | ) | (389.8 | ) | 46.2 | 11.8 | ||||||||||
|
Net operating income
|
233.8 | 178.4 | 55.4 | 31.1 | ||||||||||||
|
Total non-operating income (expense), net
|
7.1 | 16.2 | (9.1 | ) | (56.3 | ) | ||||||||||
|
Income before income tax expense and non-controlling interest
|
240.8 | 194.5 | 46.3 | 23.8 | ||||||||||||
|
Income tax expense
|
(75.4 | ) | (49.9 | ) | 25.5 | 51.2 | ||||||||||
|
Income before non-controlling interest
|
165.5 | 144.7 | 20.8 | 14.4 | ||||||||||||
|
Non-controlling interest
|
(0.2 | ) | (0.4 | ) | (0.1 | ) | (39.1 | ) | ||||||||
|
Net income attributable to shareholders
|
165.2 | 144.3 | 20.9 | 14.5 | ||||||||||||
Banco AV Villas’ net income attributable to its shareholders increased by 14.5% or Ps 20.9 billion to Ps 165.2 billion for the year ended December 31, 2011. The increase was primarily due to an increase in net interest income, in total fees and other service income, net and a decrease in net provisions, offset in part by an increase in total operating expense and an increase in income tax expense.
Net interest income
|
Year ended December 31,
|
Change, 2011 vs. 2010
|
|||||||||||||||
|
2011
|
2010
|
# |
%
|
|||||||||||||
|
(in Ps billions)
|
||||||||||||||||
|
Interest income:
|
||||||||||||||||
|
Interest on loans
|
600.7 | 573.7 | 27.0 | 4.7 | ||||||||||||
|
Interest on investment securities
|
111.9 | 103.5 | 8.4 | 8.1 | ||||||||||||
|
Interbank and overnight funds
|
4.9 | 6.0 | (1.0 | ) | (17.2 | ) | ||||||||||
|
Financial leases
|
– | – | – | – | ||||||||||||
|
Total interest income
|
717.6 | 683.1 | 34.4 | 5.0 | ||||||||||||
|
Interest expense:
|
||||||||||||||||
|
Checking accounts
|
(0.7 | ) | (0.3 | ) | 0.4 | 146.8 | ||||||||||
|
Time deposits
|
(91.6 | ) | (85.7 | ) | 6.0 | 7.0 | ||||||||||
|
Savings deposits
|
(55.1 | ) | (38.3 | ) | 16.9 | 44.0 | ||||||||||
|
Total interest expense from deposits
|
(147.4 | ) | (124.2 | ) | 23.2 | 18.7 | ||||||||||
|
Borrowing from banks and others
|
(6.8 | ) | (5.1 | ) | 1.7 | 34.1 | ||||||||||
|
Interbank and overnight funds (expenses)
|
(14.8 | ) | (13.5 | ) | 1.2 | 9.2 | ||||||||||
|
Long-term debt (bonds)
|
– | – | – | – | ||||||||||||
|
Total interest expense
|
(169.0 | ) | (142.8 | ) | 26.2 | 18.3 | ||||||||||
|
Net interest income
|
548.6 | 540.3 | 8.3 | 1.5 | ||||||||||||
Banco AV Villas’ net interest income increased by 1.5%, or Ps. 8.3 billion, from Ps 540.3 billion for the year ended December 31, 2010 to Ps 548.6 billion for the year ended December 31, 2011. This increase was primarily driven by a Ps 27.0 billion increase in the interest income from loans and a Ps 8.4 billion increase in interest income from investment securities, partially offset by an increase in interest expense of Ps 26.2 billion.
Interest earned on loans increased by 4.7%, or Ps. 27.0 billion, to Ps 600.7 billion for the year ended December 31, 2011. The increase in interest earned on loans was due to a 9.3%, or Ps 393.3 billion, growth on Banco AV Villas’ average loan portfolio to Ps 4,616.1 billion, which resulted in an increase of Ps 51.2 billion in interest income on loans. Partially off-setting the increase associated with a higher average loan portfolio was the decline in the average yield for loans from 13.6% for the year ended December 31, 2010 to 13.0% for the year ended December 31, 2011, which resulted in a Ps 24.1 billion decrease in interest income from loans. The decrease in the yield for loans reflects a declining rate environment in the second half of 2010 and early 2011, together with the strong growth of our loan portfolio during 2011. The average interest yield on loans and financial leases for Banco AV Villas was 13.2% during the last quarter of 2011 as previously discussed in
“
Results of operations for the year ended December 31, 2011 compared to the year ended December 31, 2010 – Grupo Aval
–
Net interest income.
”
Interest income from investment securities increased by 8.1%, or Ps 8.4 billion, to Ps 111.9 billion for the year ended December 31, 2011. The fixed income portfolio generated Ps 111.8 billion, or 99.9%, of Banco AV Villas’ earnings on investment securities for the year ended December 31, 2011. The earnings from the fixed income portfolio for the year ended December 31, 2011 increased by 8.1%,
or Ps 8.4 billion, primarily due to the increase in the average balance of the fixed income portfolio, partially offset by a decrease in the average yield driven by the increasing rate environment in Colombia. The equity portfolio generated the remaining Ps 0.1 billion, or 0.1%, of the interest income from investment securities.
The average yield earned on interest-earning assets decreased from 11.7% for the year ended December 31, 2010 to 11.2% for the year ended December 31, 2011, driven by the decrease in the average yield on loans and in the yield on investment securities.
Total interest expense increased by 18.3%, or Ps 26.2 billion, to Ps 169.0 billion for the year ended December 31, 2011. This increase was mainly driven by a Ps 16.9 billion increase in savings deposits and a Ps 6.0 billion increase in time deposits.
The increase in interest expense on savings deposits was driven by a 19.4%, or Ps. 471.5 billion, increase in the average balance of savings deposits to Ps 2,903.7 billion for the year ended December 31, 2011, which resulted in a Ps 9.0 billion increase in interest expense and an increase in the nominal interest rate paid from 1.6% for the year ended December 31, 2010 to 1.9% for the year ended December 31, 2011, and resulted in a Ps 7.9 billion increase in interest expense. The increase in the interest rate paid was consistent with the increase of the average DTF, explained in the Grupo Aval discussion.
The increase in interest expense on time deposits was driven by a 5.5%, or Ps 109.1 billion, increase in the average balance of time deposits to Ps 2,007.5 billion for the year ended December 31, 2011, which resulted in a Ps 4.8 billion increase in interest expense and a slight increase in the nominal interest rate paid from 4.35% for the year ended December 31, 2010 to 4.41% for the year ended December 31, 2011, and resulted in a Ps 1.1 billion
increase in interest expense. The increase in the interest rate paid was consistent with the increase of the average DTF explained in the Grupo Aval discussion.
For the reasons explained above, Banco AV Villas’ net interest margin decreased from 9.2% for the year ended December 31, 2010 to 8.5% for the year ended December 31, 2011. Similarly, the spread between the yield earned on its loans and financial leases and the cost of its interest-bearing liabilities decreased from 10.8% for the year ended December 31, 2010 to 10.0% for the year ended December 31, 2011.
Provisions
Total net provisions decreased by 72.7%, or Ps 89.0 billion, to Ps 33.4 billion for the year ended December 31, 2011. This decrease was primarily driven by a decrease in net provisions for loan and financial lease losses, the main component (by volume) of total net provisions, which decreased by 53.4%, or Ps 77.5 billion, to Ps 67.6 billion as a result of the improvement of Banco AV Villas’ credit quality. Banco AV Villas’ past due loans decreased by 7.8% to Ps 183.1 billion and its delinquency ratio improved from 4.5% at December 31, 2010 to 3.6% at December 31, 2011. This improvement was primarily a result of a reduction in past due commercial loans, which decreased by 24.9% to Ps 26.1 billion (with a drop in their delinquency ratio from 1.9% to 1.2%) and past due mortgage loans, which decreased by 10.9% to Ps 59.7 billion (with a drop in their delinquency ratio from 11.4% to 8.8%).
Charge-offs decreased by 24.8% to Ps 79.4 billion for the year ended December 31, 2011. Banco AV Villas’ charge-offs to average loans and financial leases ratio decreased from an annualized 2.4% for the year ended December 31, 2010 to 1.7% for the year ended December 31, 2011. Banco AV Villas’ net provisions for loan and financial lease losses decreased more than its charge-offs, which resulted in a 4.6% decrease in its allowance for loan and financial lease losses to Ps 243.7 billion at December 31, 2011. Even though there was a decrease in Banco AV Villas’ allowance, its coverage ratio increased from 128.7% at December 31, 2010 to 133.1% at December 31, 2011.
Net provisions for accrued interest and other receivables increased by Ps 4.4 billion to Ps 7.1 billion for the year ended December 31, 2011, due to a decrease of approximately Ps 3.0 billion in recoveries of Colombian Treasury Bonds.
Net provisions for foreclosed assets and other assets increased by Ps 0.5 billion to Ps (1.0) billion (indicating a recovery of Ps 1.0 billion) for the year ended December 31, 2011. Gross provisions for foreclosed assets and other assets increased by Ps 0.4 billion to Ps 2.8 billion, and reversals of provisions for foreclosed and other assets decreased by Ps 0.1 billion to Ps 3.8 billion.
The recovery of charged-off assets increased by Ps 16.5 billion to Ps 40.2 billion, primarily as a result of the improving Colombian economy and a more effective recovery effort by Banco AV Villas.
Total fees and other services income, net
|
Year ended December 31,
|
Change, 2011 vs. 2010
|
|||||||||||||||
|
2011
|
2010
|
# |
%
|
|||||||||||||
|
(in Ps billions)
|
||||||||||||||||
|
Fees and other services income:
|
||||||||||||||||
|
Commissions from banking services
|
143.8 | 146.8 | (3.0 | ) | (2.0 | ) | ||||||||||
|
Branch network services
|
– | – | – | – | ||||||||||||
|
Credit card merchant fees
|
11.1 | 8.8 | 2.3 | 26.1 | ||||||||||||
|
Checking fees
|
4.2 | – | 4.2 | – | ||||||||||||
|
Warehouse services
|
– | – | – | – | ||||||||||||
|
Fiduciary activities
|
– | – | – | – | ||||||||||||
|
Pension plan administration
|
– | – | – | – | ||||||||||||
|
Other
|
39.7 | 28.9 | 10.8 | 37.3 | ||||||||||||
|
Total fees and other services income
|
198.7 | 184.5 | 14.2 | 7.7 | ||||||||||||
|
Fees and other services expenses
|
(47.5 | ) | (43.9 | ) | 3.6 | 8.1 | ||||||||||
|
Total fees and other services income, net
|
151.2 | 140.5 | 10.7 | 7.6 | ||||||||||||
Total net fees and other services income increased by 7.6%, or Ps 10.7 billion, to Ps 151.2 billion for the year ended December 31, 2011. This was primarily due to a Ps 10.8 billion increase in “Other,” including fees received from social security payments and a Ps 4.2 billion increase in checking fees. This was partially offset by a Ps 3.6 billion increase in fees and other services expenses and a Ps 3.0 billion decrease in commissions from banking services.
Other operating income
|
Year ended December 31,
|
Change, 2011 vs. 2010
|
|||||||||||||||
|
2011
|
2010
|
# |
%
|
|||||||||||||
|
(in Ps billions)
|
||||||||||||||||
|
Foreign exchange gains (losses), net
|
0.6 | (0.7 | ) | 1.3 | 181.1 | |||||||||||
|
Gains on derivative operations, net
|
(0.3 | ) | 1.8 | (2.0 | ) | (114.3 | ) | |||||||||
|
Gains on sales of investments in equity securities, net
|
– | – | – | – | ||||||||||||
|
Income from non-financial sector, net
|
– | – | – | – | ||||||||||||
|
Dividend income
|
3.0 | 2.5 | 0.5 | 20.7 | ||||||||||||
|
Other
|
0.0 | 6.2 | (6.2 | ) | (99.7 | ) | ||||||||||
|
Other operating income
|
3.4 | 9.7 | (6.3 | ) | (65.2 | ) | ||||||||||
Total other operating income decreased by 65.2% or Ps 6.3 billion to Ps 3.4 billion for the year ended December 31, 2011. This decrease was mainly driven by a non-recurring income registered in December 2010 associated with the sale of Ps 149.6 billion of the mortgage loan portfolio.
Operating expenses
|
Year ended December 31,
|
Change, 2011 vs. 2010
|
|||||||||||||||
|
2011
|
2010
|
# |
%
|
|||||||||||||
|
(in Ps billions)
|
||||||||||||||||
|
Salaries and employee benefits
|
(144.9 | ) | (136.4 | ) | 8.5 | 6.2 | ||||||||||
|
Bonus plan payments
|
(1.9 | ) | (1.6 | ) | 0.3 | 19.1 | ||||||||||
|
Termination payments
|
(1.4 | ) | (2.0 | ) | (0.6 | ) | (29.8 | ) | ||||||||
|
Administrative and other expenses
|
(247.7 | ) | (217.6 | ) | 30.2 | 13.9 | ||||||||||
|
Deposit security, net
|
(16.5 | ) | (14.6 | ) | 2.0 | 13.4 | ||||||||||
|
Charitable and other donation expenses
|
(4.0 | ) | (0.5 | ) | 3.6 | 759.5 | ||||||||||
|
Depreciation
|
(19.6 | ) | (17.3 | ) | 2.3 | 13.3 | ||||||||||
|
Goodwill amortization
|
– | – | – | – | ||||||||||||
|
Total operating expenses
|
(436.0 | ) | (389.8 | ) | 46.2 | 11.8 | ||||||||||
Total operating expenses for the year ended December 31, 2011 increased by 11.8%, or Ps 46.2 billion, to Ps 436.0 billion. Administrative and other expenses increased by Ps 30.2 billion to Ps 247.7 billion, principally driven by an increase in the Equity Tax (further explained in the “Results of operations for the year ended December 31, 2011 compared to the year ended December 31, 2010 – Grupo Aval
”
) and also related to the organic growth of the business and managing Banco AV Villas’ larger loan portfolio. Salaries and employee benefits increased by Ps 8.5 billion, or 6.2%, to Ps 144.9 billion, which was partially explained by the growth in the number of Banco AV Villas’ employees from 6,064 on December 31, 2010 to 6,160 on December 31, 2011. On a per capita basis, salary and employee benefits increased by 4.6%. Charitable and other donation expenses increased by Ps 3.6 billion, due to a Ps 4.0 billion donation made by Banco AV Villas for the flood victims in Colombia during the year ended December 31, 2011. Banco AV Villas’ efficiency ratio worsened at December 31, 2011 as compared to December 31, 2010, increasing from 53.9% to 59.2%, associated with the contraction in net interest margin explained in the net interest income subsection. The ratio of operating expenses before depreciation and amortization as a percentage of average earning assets was 6.4% in 2010 and 6.5% in 2011.
Non-operating income (expense)
Total non-operating income (expense) decreased by Ps 9.1 billion to Ps 7.1 billion for the year ended December 31, 2011. This decrease was driven by a Ps 9.7 billion decrease in non-operating income and a Ps 0.6 billion decrease in non-operating expenses due to lower recoveries from estimated liabilities, such as tax provisions and compensation provisions, in 2011 than in 2010.
Income tax expense
Income tax expense increased by Ps 25.5 billion to Ps 75.4 billion for the year ended December 31, 2011. This was primarily due to higher income before income tax expense and non-controlling interest. The effective tax rate increased from 25.6% for the year ended December 31, 2010 to 31.3% for the year ended December 31, 2011. This increase was driven by higher non-tax deductible expenses, such as the Equity Tax (recorded in administrative and other expenses), and lower non-taxable revenues in 2011 than in 2010.
Non-controlling interest
Banco AV Villas’ non-controlling interest, responsible for only 0.1% of its net income before non-controlling interest for the year ended December 31, 2011, decreased by Ps 0.1 billion from Ps 0.4 billion for the year ended December 31, 2010. Banco AV Villas’ non-controlling interest reflects other Grupo Aval banks’ ownership in A Toda Hora S.A. See “Item 4. Information on the Company—Business overview—Banco AV Villas.”
Segment results of operations for the year ended December 31, 2010 compared to the year ended December 31, 2009
Banco de Bogotá
Net income
|
Year ended December 31,
|
Change, 2010 vs. 2009
|
|||||||||||||||
|
2010
|
2009
|
# |
%
|
|||||||||||||
|
(in Ps billions)
|
||||||||||||||||
|
Total interest income
|
3,345.6 | 3,614.1 | (268.5 | ) | (7.4 | ) | ||||||||||
|
Total interest expense
|
(902.1 | ) | (1,297.1 | ) | (395.0 | ) | (30.5 | ) | ||||||||
|
Net interest income
|
2,443.5 | 2,317.0 | 126.5 | 5.5 | ||||||||||||
|
Total net provisions
|
(610.6 | ) | (347.8 | ) | 262.8 | 75.6 | ||||||||||
|
Total fees and other services income, net
|
1,155.1 | 1,075.6 | 79.4 | 7.4 | ||||||||||||
|
Total other operating income
|
582.4 | 492.1 | 90.3 | 18.4 | ||||||||||||
|
Total operating income
|
3,570.3 | 3,536.9 | 33.4 | 0.9 | ||||||||||||
|
Total operating expenses
|
(1,757.9 | ) | (1,585.3 | ) | 172.6 | 10.9 | ||||||||||
|
Net operating income
|
1,812.4 | 1,951.6 | (139.2 | ) | (7.1 | ) | ||||||||||
|
Total non-operating income (expense), net
|
96.0 | 78.0 | 17.9 | 23.0 | ||||||||||||
|
Income before income tax expense and non-controlling interest
|
1,908.3 | 2,029.6 | (121.3 | ) | (6.0 | ) | ||||||||||
|
Income tax expense
|
(510.0 | ) | (522.7 | ) | (12.7 | ) | (2.4 | ) | ||||||||
|
Income before non-controlling interest
|
1,398.3 | 1,506.9 | (108.5 | ) | (7.2 | ) | ||||||||||
|
Non-controlling interest
|
(483.4 | ) | (551.1 | ) | (67.7 | ) | (12.3 | ) | ||||||||
|
Net income attributable to shareholders
|
914.9 | 955.8 | (40.9 | ) | (4.3 | ) | ||||||||||
Banco de Bogotá’s net income attributable to its shareholders decreased by 4.3% to Ps 914.9 billion in 2010. This decrease primarily reflected an increase in provisions established by Corficolombiana for its investment securities portfolio and an increase in operating expenses, partially offset by an increase in net interest income and total other operating income (primarily reflecting the sale of certain equity investments by Corficolombiana). As a result of these factors, Banco de Bogotá’s efficiency ratio deteriorated slightly from 39.0% in 2009 to 40.1% in 2010.
Net interest income
|
Year ended December 31,
|
Change, 2010 vs. 2009
|
|||||||||||||||
|
2010
|
2009
|
# |
%
|
|||||||||||||
|
(in Ps billions)
|
||||||||||||||||
|
Interest income:
|
|
|
|
|||||||||||||
|
Interest on loans
|
2,040.9 | 2,439.3 | (398.3 | ) | (16.3 | ) | ||||||||||
|
Interest on investment securities
|
1,156.7 | 1,002.9 | 153.9 | 15.3 | ||||||||||||
|
Interbank and overnight funds
|
67.8 | 69.0 | (1.1 | ) | (1.7 | ) | ||||||||||
|
Financial leases
|
80.1 | 102.9 | (22.8 | ) | (22.2 | ) | ||||||||||
|
Total interest income
|
3,345.6 | 3,614.1 | (268.5 | ) | (7.4 | ) | ||||||||||
|
Interest expense:
|
||||||||||||||||
|
Checking accounts
|
(22.4 | ) | (32.0 | ) | (9.5 | ) | (29.8 | ) | ||||||||
|
Time deposit
|
(374.0 | ) | (644.7 | ) | (270.8 | ) | (42.0 | ) | ||||||||
|
Savings deposits
|
(290.4 | ) | (393.7 | ) | (103.4 | ) | (26.2 | ) | ||||||||
|
Total interest expense on deposits
|
(686.8 | ) | (1,070.4 | ) | (383.6 | ) | (35.8 | ) | ||||||||
|
Borrowing from banks and others
|
(62.2 | ) | (94.8 | ) | (32.6 | ) | (34.4 | ) | ||||||||
|
Interbank and overnight funds (expenses)
|
(86.6 | ) | (79.4 | ) | 7.1 | 9.0 | ||||||||||
|
Long-term debt (bonds)
|
(66.6 | ) | (52.4 | ) | 14.1 | 27.0 | ||||||||||
|
Total interest expense
|
(902.1 | ) | (1,297.1 | ) | (395.0 | ) | (30.5 | ) | ||||||||
|
Net interest income
|
2,443.5 | 2,317.0 | 126.5 | 5.5 | ||||||||||||
Banco de Bogotá’s net interest income increased by 5.5% to Ps 2,443.5 billion in 2010. This was due to the fact that the bank was able to reduce its total interest expense by more than the decline in its total interest income. Total interest expense decreased by 30.5% to Ps 902.1 billion, which reflected decreased average cost of funding, primarily for time deposits, in a declining interest rate environment. The nominal interest rate paid on interest-bearing liabilities declined from an average of 5.7% in 2009 to 3.2% in 2010, which resulted in a Ps 530.2 billion decrease in interest expense. This decrease was partially offset by a 21.7% increase in the balance of average interest-bearing liabilities to Ps 27,939.0 billion (primarily reflecting increased savings deposits and interbank and overnight funds) in 2010, which was responsible for a Ps 135.3 billion increase in interest expense.
The decline in interest expense was partially offset by a 7.4% decrease in total interest income to Ps 3,345.6 billion. Total interest income fell mainly due to a decrease in interest income from loans and financial leases, which declined by 16.6% to Ps 2,121.0 billion. This primarily reflected a decrease in yield, especially from commercial loans (78.8% of Banco de Bogotá’s total gross loans and financial lease portfolio at December 31, 2010 from our Colombian operations), which as explained in the Grupo Aval 2010-2009 discussion, were particularly impacted by the declining interest rate environment. The decrease in the yield of loans and financial leases from 13.2% in 2009 to 9.9% in 2010 resulted in a Ps 601.8 billion decrease in interest income from loans and financial leases. Partly offsetting this decrease in interest income was the 11.5% growth of Banco de Bogotá’s average loan and financial lease portfolio, primarily in corporate and consumer loans, to Ps 21,407.8 billion. The growth in the balance of this portfolio resulted in an increase of Ps 180.6 billion in interest income.
Partially offsetting the decline in interest income from loans and financial leases was the increase in income from investment securities, which increased by 15.3% to Ps 1,156.7 billion in 2010. The equity portfolio generated Ps 679.8 billion in income in 2010, up 29.7% from the Ps 524.3 billion produced in 2009, mainly as a result of the fact that Corficolombiana realized greater income from the appreciation of its equity portfolio in 2010 than in 2009 (further explained in the Corficolombiana 2010-2009 discussion). The fixed income portfolio generated the remaining Ps 476.5 billion of interest income from investment securities, reflecting gains resulting from the declining interest rate environment as well as interest accrued on the portfolio. The income generated by the fixed income portfolio in 2010 was 0.4% lower than the fixed income earnings in 2009, which were Ps 478.6 billion. Despite the fact that the market environment for fixed income was more favorable in 2009, as can be seen by the performance of Grupo Aval’s other banking subsidiaries’ fixed income portfolios, Banco de Bogotá was able to generate very similar returns by increasing the volume of its fixed income investments; its balance of fixed income investments increased from Ps 7,123.3 billion at December 31, 2009 to 9,378.9 billion at December 31, 2010 (a portion of this increase was attributable to the BAC acquisition, which added Ps 1,360.9 billion in fixed income investments). Banco de Bogotá consolidated BAC Credomatic’s financials from December 1, 2010.
As a result of the aforementioned factors, Banco de Bogotá’s net interest margin decreased from 8.4% in 2009 to 7.4% in 2010. Similarly, the spread between the yield earned on its loans and financial leases and the cost of its interest-bearing liabilities decreased from 7.6% in 2009 to 6.7% in 2010.
Provisions
Despite the improvement of Banco de Bogotá’s credit quality, total net provisions increased by 75.6% to Ps 610.6 billion in 2010, driven primarily by the growth of net provisions for foreclosed assets and other assets, which increased by Ps 303.1 billion to Ps 320.7 billion. This increase was due to provisions established by Corficolombiana associated with the realization of income from several of its equity security investments (further explained in the Corficolombiana 2010-2009 discussion).
Unlike provisions for foreclosed assets and other assets, net provisions for loan and financial lease losses decreased slightly, declining by 1.6% to Ps 286.6 billion, which was consistent with the fact Banco de Bogotá’s credit quality improved. Despite the fact that Banco de Bogotá’s past due loans at December 31, 2010 exhibited a 43.2% growth to Ps 827.0 billion, this was entirely due to the BAC Credomatic acquisition. Removing BAC Credomatic’s impact, Banco de Bogotá’s past due loans at December 31, 2010 decreased by 11.2% to Ps 513.1 billion. Banco de Bogotá’s delinquency ratio decreased from 2.9% at December 31, 2009 to 2.5% at December 31, 2010, due to the BAC Credomatic acquisition and was 2.2% for the Colombian operations. The slightly higher
delinquency ratio with BAC is due primarily to BAC having a higher balance of past due credit card loans, which was expected as a result of BAC’s focus on the credit card business.
Charge-offs increased by 31.1% to Ps 245.7 billion in 2010, and Ps 17.5 billion (or 9.4%) of this growth was due to the acquisition of BAC. The remaining Ps 228.2 billion (or 21.7%) portion of the increase was primarily due to an increase in Banco de Bogotá’s Colombian loan portfolio (total gross loans grew by 18.7% from 2009 to 2010). As a result, despite the 31.1% increase in charge-offs, Banco de Bogotá’s charge-offs to average loan ratio increased only marginally, from 1.0% in 2009 to 1.1% in 2010.
Banco de Bogotá’s allowance for loan and financial lease losses increased by 34.7% to Ps 1,030.7 billion at December 31, 2010. This increase was primarily due to the acquisition of BAC which resulted in Banco de Bogotá’s past due loans growing at a faster pace and its coverage ratio decreasing from 132.5% at December 31, 2009 to 124.6% at December 31, 2010. The lower coverage ratio is due to the fact that BAC proportionally contributed more in past due loans than in allowance, which was expected considering 30.3% of BAC’s gross loan portfolio was concentrated in mortgage loans, which require lower allowances than other types of loans. In its Colombian operations, Banco de Bogotá’s net provisions for loan and financial lease losses were greater than its charge-offs, which resulted in a 7.7% increase in its allowance for loan financial lease losses attributable to its Colombian operations to Ps 824.4 billion at December 31, 2010. This growth combined with the decrease in past due loans in its Colombian operations, resulted in the increase of its coverage ratio of its Colombian operations from 132.5% at December 31, 2009 to 160.7% at December 31, 2010.
Also partially offsetting the increase in provisions for foreclosed assets and other assets was a decrease in net provisions for accrued interest and other receivables, which declined by 47.0% from Ps 62.2 billion to Ps 33.0 billion. This drop was a result of the aforementioned improvement in the Colombian economy.
The recovery of charged-off assets increased by Ps 6.4 billion to Ps 29.6 billion primarily as a result of a slightly more successful recovery effort by Banco de Bogotá.
Total fees and other services income
|
Year ended December 31,
|
Change, 2010 vs. 2009
|
|||||||||||||||
|
2010
|
2009
|
# |
%
|
|||||||||||||
|
(in Ps billions)
|
||||||||||||||||
|
Fees and other services income:
|
|
|
|
|||||||||||||
|
Commissions from banking services
|
557.9 | 508.8 | 49.1 | 9.6 | ||||||||||||
|
Branch network services
|
22.2 | 19.5 | 2.6 | 13.5 | ||||||||||||
|
Credit card merchant fees
|
70.3 | 46.8 | 23.5 | 50.1 | ||||||||||||
|
Checking fees
|
42.0 | 43.3 | (1.3 | ) | (3.0 | ) | ||||||||||
|
Warehouse services
|
92.2 | 91.8 | 0.4 | 0.5 | ||||||||||||
|
Fiduciary activities
|
98.3 | 93.0 | 5.3 | 5.7 | ||||||||||||
|
Pension plan administration
|
408.3 | 399.2 | 9.1 | 2.3 | ||||||||||||
|
Other
|
37.1 | 24.5 | 12.6 | 51.5 | ||||||||||||
|
Total fees and other services income
|
1,328.2 | 1,226.9 | 101.4 | 8.3 | ||||||||||||
|
Fees and other services expenses
|
(173.2 | ) | (151.2 | ) | 21.9 | 14.5 | ||||||||||
|
Total fees and other services income, net
|
1,155.1 | 1,075.6 | 79.4 | 7.4 | ||||||||||||
Total net fees and other services income increased by 7.4% to Ps 1,155.1 billion in 2010, primarily as a result of higher commissions from banking services and increased credit card merchant fees. As explained in the Grupo Aval 2010-2009 discussion, the acquisition of BAC Credomatic and the income it contributed in 2010 were a major factor in these increases. Specifically, BAC Credomatic contributed Ps 37.9 billion in commissions from banking services and Ps 18.6 billion in credit card merchant fees, while adding approximately Ps 7.2 billion in fee expenses. The additional increase in commissions from banking services was due to increased interest-bearing deposits and higher income generated by social security payments. The 2.3% increase in pension plan administration fees is a result of higher income produced by Porvenir, which is further explained in the Porvenir 2010-2009 discussion. The Ps 12.6 billion increase in “Other” fees is primarily attributable to a Ps 9.7 billion increase in income generated by
Casa de
Bolsa, Banco de Bogotá’s brokerage subsidiary. This increase in income was primarily due to the fact that in October 2009 Valores Bogotá merged with Valores Occidente and the other brokerage subsidiaries of Grupo Aval to form
Casa de
Bolsa
, an entity which is consolidated by Banco de Bogotá; thus, while 2009 only reflected three months of such combined company’s income, 2010 reflected a full year.
Other operating income
|
Year ended December 31,
|
Change, 2010 vs. 2009
|
|||||||||||||||
|
2010
|
2009
|
# |
%
|
|||||||||||||
|
(in Ps billions)
|
||||||||||||||||
|
Foreign exchange gains (losses), net
|
32.6 | (114.1 | ) | 146.7 | 128.5 | |||||||||||
|
Gains on derivative operations, net
|
63.6 | 228.3 | (164.7 | ) | (72.2 | ) | ||||||||||
|
Gains on sales of investments in equity securities, net
|
112.1 | 4.0 | 108.1 | 2677.7 | ||||||||||||
|
Income from non-financial sector, net (1)
|
289.8 | 231.2 | 58.5 | 25.3 | ||||||||||||
|
Dividend income
|
44.1 | 84.5 | (40.3 | ) | (47.8 | ) | ||||||||||
|
Other
|
40.3 | 58.2 | (17.9 | ) | (30.8 | ) | ||||||||||
|
Total other operating income
|
582.4 | 492.1 | 90.3 | 18.4 | ||||||||||||
|
(1)
|
Income from non-financial sector reflects Corficolombiana’s (Banco de Bogotá’s subsidiary) operating results in its consolidated investments in companies not related to the financial sector such as Epiandes, Hoteles Estelar and Organización Pajonales, among others. This result is net of the following operating and administrative expenses for the year ended December 31, 2010 and 2009: Ps 644.3 billion and Ps 549.2 billion , respectively. For a description of these investments, see “Item 4. Information on the Company—B. Business overview—Corficolombiana—Equity investment portfolio.”
|
Total other operating income, net increased by 18.4% to Ps 582.4 billion in 2010 due primarily to a Ps 108.1 billion increase in gains on sales of investments in equity securities, resulting primarily from Corficolombiana’s sale of its stake in Banco de Occidente and Colombina S.A. (further explained in Corficolombiana’s 2010-2009 discussion under the “Other operating income” section). The 25.3% increase in income from the non-financial sector to Ps 289.8 billion, which reflected the net income growth of non-financial companies consolidated by Corficolombiana (further explained in the Corficolombiana 2010-2009 discussion), also contributed to the increase in other operating income.
Partially offsetting the increase was a 47.8% decrease in dividend income to Ps 44.1 billion. This principally reflects an accounting convention regarding how dividend income for a few of Corficolombiana’s unconsolidated investments was recorded (see Corficolombiana 2010 – 2009 discussion for further information). The 30.8% decrease in “Other” other operating income to Ps 40.3 billion also contributed to the decline in other operating income. This stemmed primarily from a decrease in income from jointly managed fiduciary contracts belonging to Fidubogotá, Banco de Bogotá’s fiduciary subsidiary. In particular, the contract to manage FONPET (jointly managed with Porvenir), a third party liability fund, generated less income due to the fact that fees on the management of this fund depend upon the yield of the fund, which was lower in 2010 as compared to 2009 due to more challenging market conditions. Foreign exchange gains (losses) and gains on derivative operations, which are related, netted a decrease of Ps 18.0 billion. This was primarily due to the operations at the level of Corficolombiana (see Corficolombiana 2010 – 2009 discussion for further information).
Operating expenses
|
Year ended December 31,
|
Change, 2010 vs. 2009
|
|||||||||||||||
|
2010
|
2009
|
# |
%
|
|||||||||||||
|
(in Ps billions)
|
||||||||||||||||
|
Salaries and employee benefits
|
(612.3 | ) | (539.8 | ) | 72.5 | 13.4 | ||||||||||
|
Bonus plan payments
|
(19.6 | ) | (19.8 | ) | (0.3 | ) | (1.3 | ) | ||||||||
|
Termination payments
|
(5.8 | ) | (2.8 | ) | 3.0 | 107.6 | ||||||||||
|
Administrative and other expenses
|
(968.3 | ) | (891.8 | ) | 76.5 | 8.6 | ||||||||||
|
Deposit security, net
|
(68.3 | ) | (59.1 | ) | 9.2 | 15.5 | ||||||||||
|
Charitable and other donation expenses
|
(4.0 | ) | (2.3 | ) | 1.6 | 69.5 | ||||||||||
|
Depreciation
|
(57.8 | ) | (51.9 | ) | 5.9 | 11.4 | ||||||||||
|
Goodwill amortization
|
(21.8 | ) | (17.8 | ) | 4.1 | 22.9 | ||||||||||
|
Total operating expenses
|
(1,757.9 | ) | (1,585.3 | ) | 172.6 | 10.9 | ||||||||||
Total operating expenses increased by 10.9% to Ps 1,757.9 billion in 2010. This increase primarily reflected a 13.4% rise in salaries and employee benefits to Ps 612.3 billion, which was in line with the organic growth of the business and also included BAC Credomatic’s personnel expenses in December 2010. Salaries and employee benefits from Banco de Bogotá’s Colombian operations increased by 6.8% to Ps 576.7 billion for 2010, while headcount grew by 1.7% from 16,811 at December 31, 2009 to 17,095 at December 31, 2010. As a result, on a per capita basis, salaries and employee benefits for Banco de Bogotá without BAC increased by 5.1%. BAC Credomatic’s headcount at December 31, 2010 was 15,775. The 8.6% increase in administrative and other expenses to Ps 968.3 billion was primarily due to the BAC Credomatic acquisition. As a result of both the slight increase in operating expenses and the decrease in operating income, Banco de Bogotá’s efficiency ratio deteriorated from 39.0% in 2009 to 40.1% in 2010.
Non-operating income (expense)
Total non-operating income (expense) increased by 23.0% to Ps 96.0 billion primarily due to Ps 21.4 billion in income from the sale of foreclosed assets. Of this income, Ps 17.6 billion was due to the sale of land in
Guayuriba
.
Income tax expense
Income tax expense was Ps 510.0 billion in 2010, which was 2.4% lower than in 2009. Banco de Bogotá’s effective tax rate increased slightly in 2010, rising to 26.7% from 25.8% in 2009. The effective tax rate increased primarily due to the fact that its non-taxable dividend income associated with Corficolombiana’s unconsolidated investments decreased by 47.8%, or Ps 40.3 billion, for the reasons further explained in the “Other operating income” section.
Non-controlling interest
Banco de Bogotá’s non-controlling interest decreased by Ps 67.7 billion, or 12.3%, in 2010. The decrease in non-controlling interest was primarily due to the fact that net income before non-controlling interest was lower, but it should be noted that non-controlling interest as a percent of net income before non-controlling interest also decreased, dropping from 36.6% to 34.6%. This was primarily a result of Corficolombiana contributing a greater percentage of net income before non-controlling interest in 2009 as compared to 2010 (Ps 668.4 billion as compared to Ps 564.8 billion, respectively).
Banco de Bogotá subsidiary analysis
As discussed above, Banco de Bogotá’s results of operations are significantly affected by the results of operations of its subsidiaries, Corficolombiana and Porvenir. In order to fully disclose the impact of these subsidiaries on Banco de Bogotá, set forth below is an analysis of the results of operations of each of Corficolombiana and Porvenir for 2010 as compared to 2009.
Corficolombiana
Net income
|
Year ended December 31,
|
Change, 2010 vs. 2009
|
|||||||||||||||
|
2010
|
2009
|
# |
%
|
|||||||||||||
|
(in Ps billions)
|
||||||||||||||||
|
Total interest income
|
858.3 | 716.5 | 141.8 | 19.8 | ||||||||||||
|
Total interest expense
|
(161.8 | ) | (181.1 | ) | (19.2 | ) | (10.6 | ) | ||||||||
|
Net interest income
|
696.5 | 535.4 | 161.0 | 30.1 | ||||||||||||
|
Total provisions (reversals), net
|
(321.6 | ) | (7.7 | ) | 313.9 | – | ||||||||||
|
Total fees and other services income, net
|
43.6 | 40.1 | 3.6 | 8.9 | ||||||||||||
|
Total other operating income
|
435.2 | 356.2 | 79.0 | 22.2 | ||||||||||||
|
Total operating income
|
853.7 | 924.0 | (70.3 | ) | (7.6 | ) | ||||||||||
|
Total operating expenses
|
(118.8 | ) | (118.4 | ) | 0.4 | 0.3 | ||||||||||
|
Net operating income
|
734.9 | 805.7 | (70.7 | ) | (8.8 | ) | ||||||||||
|
Total non-operating income (expense), net
|
(3.2 | ) | 9.3 | (12.5 | ) | (134.1 | ) | |||||||||
|
Income before income tax expense and non-controlling interest
|
731.8 | 815.0 | (83.2 | ) | (10.2 | ) | ||||||||||
|
Income tax expense
|
(104.2 | ) | (97.0 | ) | 7.2 | 7.4 | ||||||||||
|
Income before non-controlling interest
|
627.6 | 718.0 | (90.4 | ) | (12.6 | ) | ||||||||||
|
Non-controlling interest
|
(62.8 | ) | (49.6 | ) | 13.2 | 26.7 | ||||||||||
|
Net income attributable to shareholders
|
564.8 | 668.4 | (103.6 | ) | (15.5 | ) | ||||||||||
Corficolombiana’s net income decreased by 15.5% to Ps 564.8 billion in 2010. The main reason for this decrease in net income was an increase in total net provisions, specifically in provisions for its unconsolidated equity security investments. Nevertheless, since Corficolombiana’s operating income before provisions increased, while its operating expenses remained essentially unchanged, its efficiency ratio improved from 12.4% in 2009 to 9.8% in 2010.
Net interest income
Corficolombiana’s net interest income increased by 30.1% to Ps 696.5 billion in 2010. Total interest income, which consists of income from loans, investment securities, interbank and overnight funds and financial leases, increased by 19.8% to Ps 858.3 billion in 2010. This increase was primarily due to the 21.9% rise in income from investment securities from Ps 618.3 billion in 2009 to Ps 753.9 billion in 2010. The increase in income from investment securities was due to a growth in income from the equity securities portfolio, which was partially offset by a marginal decrease in income from the fixed income portfolio in 2010.
Corficolombiana’s equity portfolio generated Ps 616.3 billion in income in 2010, which represented a 29.9% increase from the Ps 474.5 billion produced in 2009. This income was mainly comprised of the Ps 594.2 billion associated with the appreciation and reclassification of certain investments in Corficolombiana’s equity portfolio, in particular
Empresa de Energía de Bogotá
(EEB),
Sociedad de Inversiones en Energía S.A.
(SIE), and
Banco de Occidente,
which are publicly traded companies in Colombia.
Over the course of 2010, Corficolombiana’s investment in
Empresa de Energía de Bogotá
(EEB), which was classified as “trading” until late December 2010, generated Ps 209.0 billion of income. Prior to December 2010, if an equity security was classified by the
Bolsa de Valores de Colombia
(BVC; Colombian Stock Exchange) as either “medium” or “high” liquidity, the Superintendency of Finance required the owner of the security to classify the investment as “trading.” However, in late December 2010 the Superintendency of Finance issued a statement allowing
corporaciones financieras
(finance corporations), such as Corficolombiana, to reclassify certain “medium” or “high” liquidity equity securities to “available for sale” from “trading” if the Board of Directors of those institutions deemed those investments of a long-term, strategic nature. The Board of Directors deemed Corficolombiana’s investment in EEB as a long-term, strategic investment, and as a result in December 2010 it was
reclassified as “available for sale.” The impact of this reclassification going forward is that Corficolombiana will treat EEB as it does all of its “available for sale” investments.
In February 2010, Corficolombiana reclassified its investment in the shares of
Sociedad de Inversiones en Energía S.A.
(SIE) from “available for sale” to “trading” because the BVC reclassified SIE’s stock from “low” to “medium” liquidity. At that time, Colombian law established by the Superintendency of Finance mandated (in accordance with External Circular 100 of 1995, Chapter 1, numeral 4.2) that when the BVC increased the liquidity classification of a stock, if it was held as “available for sale,” the owner of the investment must reclassify the shares as “trading” and recognize the gains / losses associated with these shares that had previously been recorded as “unrealized net gains on investments” in order to reflect the appropriate value of the investment. In 2010, Corficolombiana realized Ps 196.5 billion in income from its investment in SIE (corresponding to the net unrealized gains at February 2010 plus the net mark-to-market gains generated post-February 2010). At December 31, 2010, this investment continued to be classified as “trading.”
Finally, in June 2010, due to the share-exchange merger between Banco de Occidente and Leasing de Occidente (of which Corficolombiana was the largest shareholder with a 45.2% stake), Corficolombiana was left with a 6.1% stake in Banco de Occidente classified as “available for sale”—the transaction is further explained in the Banco de Occidente 2010-2009 discussion. In October 2010, Corficolombiana sold 2.56 million shares of Banco de Occidente, or 1.71%, for a realized net gain of Ps 62.3 billion—this income was recorded under “Other operating income” under the line-item “Gains on sales of equity securities.” In November 2010, the BVC reclassified Banco de Occidente’s shares from “low” to “medium” liquidity, and as a result of this reclassification, Corficolombiana was required to realize the Ps 173.8 billion in income that was previously recorded as “unrealized net gains on investments” for its 4.42% stake in Banco de Occidente (its remaining share ownership in Banco de Occidente after the 1.71% sale in October 2010). The income generated by this reclassification, as well as the Ps 0.7 billion generated from mark-to-market gains following this reclassification, is ultimately eliminated from Grupo Aval’s consolidated statement of income because Grupo Aval consolidates Banco de Occidente in its financial statements, and thus, already reflects the value of its investment. In December 2010, Corficolombiana sold 0.60 million shares of Banco de Occidente, or 0.40%. In contrast with the sale in October, no gains were generated under “Other operating income” under the line-item “Gains on sales of equity securities” because its Banco de Occidente investment had been marked-to-market since the November 2010 reclassification to “trading.” At
December 31, 2010, t
his investment continued to be classified as “trading.”
Corficolombiana’s fixed income portfolio generated Ps 137.56 billion of income in 2010 due primarily to gains arising from the declining interest rate environment. While this was a relatively high figure for Corficolombiana, it was 2.7% less than the Ps 141.3 billion generated in 2009, which as previously mentioned, reflected an even steeper decline in interest rates.
Corficolombiana’s interest expense decreased by 10.6% to Ps 161.8 billion in 2010, primarily due to a Ps 16.3 billion, or 17.9%, decrease in interest expense on time deposits to Ps 74.7 billion. Again, the reduction in interest expense was primarily a result of the previously discussed declining interest rate environment.
Provisions
Corficolombiana’s net provisions increased by Ps 313.9 billion to Ps 321.6 billion in 2010. This increase was mainly attributable to a Ps 245.1 billion cautionary market risk provision established by Corficolombiana in December, after discussion with the Superintendency of Finance, in order to cover risks associated with potential future fluctuations of the share prices of the equity securities portfolio.
Corficolombiana also recorded a Ps 69.8 billion net provision in 2010 under the provisions for foreclosed assets and other assets line-item, with the permission of the Superintendency of Finance, related to the previously mentioned realization of income stemming from its investment in SIE. Given that SIE recently began trading publicly on October 8, 2009, Corficolombiana established a provision in order to moderate the impact of potential future fluctuations in its price.
Total fees and other services income
|
Year ended December 31,
|
Change, 2010 vs. 2009
|
|||||||||||||||
|
2010
|
2009
|
# |
%
|
|||||||||||||
|
(in Ps billions)
|
||||||||||||||||
|
Fees and other services income:
|
||||||||||||||||
|
Commissions from banking services
|
4.4 | 3.6 | 0.8 | 22.5 | ||||||||||||
|
Fiduciary activities
|
33.8 | 34.3 | (0.5 | ) | (1.6 | ) | ||||||||||
|
Other
|
12.4 | 10.8 | 1.6 | 14.7 | ||||||||||||
|
Total fees and other services income
|
50.6 | 48.7 | 1.9 | 3.8 | ||||||||||||
|
Fees and other services expenses
|
(6.9 | ) | (8.6 | ) | (1.7 | ) | (19.8 | ) | ||||||||
|
Total fees and other services income, net
|
43.6 | 40.1 | 3.6 | 8.9 | ||||||||||||
Net fee and other services income increased by 8.9% to Ps 43.6 billion in 2010. While the fiduciary business produced marginally less income, this decrease was more than compensated by an increase in commissions from banking services and a decrease in fee expenses and other service expenses.
Other operating income
|
Year ended December 31,
|
Change, 2010 vs. 2009
|
|||||||||||||||
|
2010
|
2009
|
# |
%
|
|||||||||||||
|
(in Ps billions)
|
||||||||||||||||
|
Foreign exchange gains (losses), net
|
(37.8 | ) | (80.9 | ) | 43.1 | 53.3 | ||||||||||
|
Gains on derivative operations, net
|
29.6 | 116.3 | (86.7 | ) | (74.5 | ) | ||||||||||
|
Gains on sales of investments in equity securities, net
|
109.6 | 0.2 | 109.4 | – | ||||||||||||
|
Income from non-financial sector, net
|
289.8 | 231.2 | 58.5 | 25.3 | ||||||||||||
|
Dividend income
|
38.5 | 81.8 | (43.3 | ) | (52.9 | ) | ||||||||||
|
Other
|
5.4 | 7.5 | (2.1 | ) | (27.8 | ) | ||||||||||
|
Total other operating income
|
435.2 | 356.2 | 79.0 | 22.2 | ||||||||||||
Total other operating income increased by 22.2% to Ps 435.2 billion in 2010. This was primarily due to a Ps 109.4 billion increase in net gains on sales of investments in equity securities. Over the course of 2010, Corficolombiana sold three significant investments. The first was the sale of its 7.6% stake in Colombina S.A. Although the sale was formalized in December 2009, due to the form of payment, half of the income was recorded in 2010. This sale generated Ps 21.0 billion in income in that year. The second was the aforementioned sale of the portion of Corficolombiana’s stake in Banco de Occidente in October 2010, which generated Ps 62.3 billion in income. Finally, in December 2010 Corficolombiana sold 5.8 million shares of Proenergia S.A., which amounts to 4.4% of the company, for a gain of Ps 19.0 billion.
Also contributing to the increase in total other operating income was a 25.3% increase in net income from the non-financial sector to Ps 289.8 billion. This increased income resulted primarily from Epiandes and PISA, two of Corficolombiana’s consolidated investments.
Partially offsetting this increase was a 74.5% decline in gains on derivative operations to Ps 29.6 billion, which reflected the fact that Corficolombiana reduced the duration of its underlying assets (resulting in a small residual exposure in its derivative operations due to imperfect matching, as the rest were hedged) in order to reduce its risk exposure (and thus its potential returns) from the more volatile derivative markets in 2010. The greater appreciation of the Colombian peso in 2009 as compared to 2010, 8.9% against 6.4%, respectively, also decreased gains on derivative operations as Corficolombiana utilized its derivative positions to hedge its risk from its foreign exchange operations (in which it was net short of the Colombian Peso). The opposite results can be observed in the changes in Corficolombiana’s foreign exchange gains (losses) line item, which partially offset the decrease in income on derivative operations. Corficolombiana’s foreign exchange losses were reduced by Ps 43.1 billion to Ps (37.8) billion.
In a year where the Colombian Peso appreciated less and Corficolombiana reduced its derivative and foreign exchange positions, both net foreign exchange losses and net derivative gains were diminished from previous years.
Also partially offsetting the increase in total other operating income was a 52.9% decrease in dividend income to Ps 38.5 billion in 2010. This decrease was driven principally by the accounting reclassification of some of Corficolombiana’s equity investments. In 2009, Promigas’ and Empresa de Energía de Bogotá’s (EEB) dividends were recorded under the dividend income line-item, but as a result of an accounting convention, when the shares of these companies were reclassified from “Available for sale” to “trading” (for Promigas and EEB reclassification explanations see Corficolombiana 2010-2009 and 2009-2008 discussions), their dividends began to be recorded under “Interest from investment securities” rather than under the dividend income line-item. Even though Promigas was once again classified as “available for sale” from June 2010 to November 2010, its dividends were not recorded under the dividend income line-item due to the fact that after its first reclassification to “Trading,” the investment was left without any unrealized gains on the balance sheet; Colombian banking regulations mandate that dividends from an “Available for sale” investment can only be registered on the income statement if the amount received is greater than the value recorded as unrealized gains. In instances such as this where that is not the case, the equity method mandates that dividends must be registered as a reduction in the value of the investment on the balance sheet. Promigas’ and EEB’s dividends in 2009 were Ps 29.5 and Ps 11.8 billion, respectively.
Operating expenses
|
Year ended December 31,
|
Change, 2010 vs. 2009
|
|||||||||||||||
|
2010
|
2009
|
# |
%
|
|||||||||||||
|
(in Ps billions)
|
||||||||||||||||
|
Salaries and employee benefits
|
(45.2 | ) | (43.1 | ) | 2.1 | 4.8 | ||||||||||
|
Bonus plan payments
|
(4.7 | ) | (8.3 | ) | (3.7 | ) | (44.2 | ) | ||||||||
|
Termination payments
|
(0.4 | ) | (0.6 | ) | (0.3 | ) | (42.8 | ) | ||||||||
|
Administrative and other expenses
|
(58.1 | ) | (58.2 | ) | (0.2 | ) | (0.3 | ) | ||||||||
|
Deposit security, net
|
(5.5 | ) | (4.1 | ) | 1.4 | 33.7 | ||||||||||
|
Charitable and other donation expenses
|
(1.9 | ) | (1.1 | ) | 0.8 | 79.8 | ||||||||||
|
Depreciation
|
(3.2 | ) | (2.9 | ) | 0.2 | 7.6 | ||||||||||
|
Goodwill amortization
|
– | – | – | – | ||||||||||||
|
Total operating expenses
|
(118.8 | ) | (118.4 | ) | 0.4 | 0.3 | ||||||||||
Corficolombiana’s total operating expenses remained essentially unchanged in 2010, increasing by 0.3% to Ps 118.8 billion. Since operating expenses remained basically unchanged in 2010, while operating income before provisions increased
by 26.1% to Ps 1,175.3 billion
, Corficolombiana’s efficiency ratio improved, decreasing from 12.4% in 2009 to 9.8% in 2010.
Non-operating income (expense)
Total non-operating income (expense) decreased by Ps 12.5 billion to Ps (3.2) billion (indicating a net non-operating expense) in 2010, mainly due to an increase in non-operating expenses from Ps 44.2 billion in 2009 to Ps 57.4 billion in 2010. The primary driver for this was a Ps 8.4 billion increase in the non-operating expenses of one of Corficolombiana’s consolidated investments (Estudios y Proyectos del Sol S.A., or Episol) in 2010. Although during this period Episol’s non-operating income also increased by a similar amount (Episol’s income and expenses are reported as non-operating because the company is still in a pre-operational stage), Corficolombiana’s non-operating income account did not reflect this increase primarily due to the fact that in 2009 Epiandes contributed Ps 11.0 billion in non-operating income that was not repeated in 2010.
Porvenir
Porvenir generates income primarily from fees on its customers’ pension contributions, which consist predominantly of monthly mandatory contributions. It also generates net interest income, composed almost entirely of investment income from the appreciation of Porvenir’s proprietary trading portfolio, which can be divided into two components: (1) income from its stabilization reserve, which is the legally required proprietary stake (1% of assets under management) in its funds that are subject to a minimum return guarantee and (2) direct investment portfolio income, which includes income from fixed income securities and money market instruments. As a result,
Porvenir’s revenue is mainly affected by the number of contributors, the salaries of contributors, any changes in applicable fee rates and the rate of return of its assets under management.
Net income
|
Year ended December 31,
|
Change, 2010 vs. 2009
|
|||||||||||||||
|
2010
|
2009
|
# |
%
|
|||||||||||||
|
(in Ps billions)
|
||||||||||||||||
|
Total interest income
|
58.7 | 65.3 | (6.6 | ) | (10.1 | ) | ||||||||||
|
Total interest expense
|
(0.2 | ) | (0.3 | ) | (0.1 | ) | (35.6 | ) | ||||||||
|
Net interest income
|
58.5 | 64.9 | (6.5 | ) | (10.0 | ) | ||||||||||
|
Total provisions (reversals), net
|
(0.0 | ) | (2.5 | ) | (2.5 | ) | (99.0 | ) | ||||||||
|
Total fees and other services income, net
|
373.6 | 366.8 | 6.9 | 1.9 | ||||||||||||
|
Total other operating income
|
2.7 | 4.7 | (2.0 | ) | (41.7 | ) | ||||||||||
|
Total operating income
|
434.8 | 433.9 | 0.9 | 0.2 | ||||||||||||
|
Total operating expenses
|
(197.5 | ) | (182.7 | ) | 14.8 | 8.1 | ||||||||||
|
Net operating income
|
237.3 | 251.2 | (13.9 | ) | (5.5 | ) | ||||||||||
|
Total non-operating income (expense), net
|
1.3 | 3.2 | (1.9 | ) | (58.4 | ) | ||||||||||
|
Income before income tax expense and non-controlling interest
|
238.6 | 254.4 | (15.8 | ) | (6.2 | ) | ||||||||||
|
Income tax expense
|
(82.1 | ) | (88.3 | ) | (6.2 | ) | (7.0 | ) | ||||||||
|
Income before non-controlling interest
|
156.5 | 166.0 | (9.5 | ) | (5.7 | ) | ||||||||||
|
Non-controlling interest
|
(0.1 | ) | (0.0 | ) | 0.1 | 157.5 | ||||||||||
|
Net income
|
156.4 | 166.0 | (9.6 | ) | (5.8 | ) | ||||||||||
Porvenir’s net income decreased by 5.8% to Ps 156.4 billion in 2010. This was primarily due to the decrease in net interest income and the increase in total operating expenses, which offset the increase in fees and other services income and the decrease in provisions. As a result, Porvenir’s efficiency ratio worsened over this period, increasing from 40.8% in 2009 to 44.3% in 2010.
Total fees and other services income
Total net fees and other services income consists primarily of commissions earned on the administration of mandatory pension funds, severance funds, voluntary pension funds and third-party liability pension funds. Porvenir’s total net fees and other services income increased slightly by 1.9% to Ps 373.6 billion in 2010, driven primarily by the increase in the revenues received from the administration of mandatory pension funds, which rose by Ps 28.4 billion, from Ps 237.9 billion in 2009 to Ps 266.4 billion in 2010, due to a 5.1% increase in the average number of contributors and a 4.9% increase in the average monthly wage per contributor to Ps 1.13 million.
Additionally, an increase in revenue associated with the management of voluntary pension funds, which rose by Ps 9.8 billion, from Ps 34.7 billion in 2009 to Ps 44.5 billion in 2010, also contributed to the increase in fee revenue.
These increases were partially offset by a Ps 12.0 billion decrease in income from third-party liability pension funds from Ps 34.0 billion in 2009 to Ps 22.0 billion in 2010. This was due to the fact that fees on the management of these funds are dependent upon the yield of the funds, which were lower in 2010 as compared to 2009 due to more challenging market conditions.
Further offsetting the increase in fee income was a Ps 16.1 billion decline in fees from severance fund management, which dropped from Ps 71.8 billion in 2009 to Ps 55.7 billion in 2010. The primary cause of this decrease was a new regulation issued by the Superintendency of Finance that required the creation of two distinct severance funds, a short-term one and a long-term one, as opposed to having just one severance fund, with the maximum permissible fee rate being reduced from 4.0% to 3.0% for the long-term severance fund and to 1.0% for the short term fund.
Commissions from banking services, consisting primarily of fees charged to customers for the processing of information and the early withdrawal of pensions, increased by Ps 5.5 billion to Ps 13.9 billion in 2010.
Fees and other service expenses rose slightly, from Ps 42.2 billion in 2009 to Ps 50.1 billion in 2010. This was a product of the organic growth of the business and its main product lines.
Net interest income
Net interest income decreased by Ps 6.5 billion to Ps 58.5 billion in 2010. This decrease was primarily due to the decline in the rate of return of Porvenir’s total investment portfolio. While prevailing market conditions in 2010 were favorable, market conditions in 2009 were even more favorable. As a result, Porvenir’s rate of return on its investment portfolio decreased from 17.0% in 2009 to 11.5% in 2010. This was partially offset by an increase in the average volume of the investment portfolio, which increased by 40.3%, from Ps 452.7 billion at December 31, 2009 to Ps 635.2 billion at December 31, 2010.
Operating expenses
|
Year ended December 31,
|
Change, 2010 vs. 2009
|
|||||||||||||||
|
2010
|
2009
|
# |
%
|
|||||||||||||
|
(in Ps billions)
|
||||||||||||||||
|
Salaries and employee benefits
|
(77.5 | ) | (69.4 | ) | 8.0 | 11.6 | ||||||||||
|
Bonus plan payments
|
(3.7 | ) | (5.3 | ) | (1.6 | ) | (30.2 | ) | ||||||||
|
Termination payments
|
(0.5 | ) | (1.0 | ) | (0.5 | ) | (51.8 | ) | ||||||||
|
Administrative and other expenses
|
(110.8 | ) | (101.9 | ) | 8.9 | 8.7 | ||||||||||
|
Deposit security, net
|
– | – | – | – | ||||||||||||
|
Charitable and other donation expenses
|
(0.1 | ) | (0.3 | ) | (0.2 | ) | – | |||||||||
|
Depreciation
|
(5.0 | ) | (4.8 | ) | 0.2 | 3.4 | ||||||||||
|
Goodwill amortization
|
– | – | – | – | ||||||||||||
|
Total operating expenses
|
(197.5 | ) | (182.7 | ) | 14.8 | 8.1 | ||||||||||
Porvenir’s total operating expenses increased by 8.1% to Ps 197.5 billion in 2010, due primarily to the 8.7% growth of administrative and other expenses to Ps 110.8 billion and the 11.6% increase in salaries and employee benefits to Ps 77.5 billion, both consistent with the organic growth of the business. As previously mentioned, Porvenir’s 2010 efficiency ratio slightly worsened in comparison to its 2009 figure, increasing from 40.8% in 2009 to 44.3% in 2010.
Non-operating income (expense)
Total non-operating income (expense) decreased by Ps 1.9 billion in 2010. A higher reversal of provisions in 2009, which was not repeated in 2010, was the main driver of the decrease in non-operating income. Non-operating income composed 0.6% of total net income before income tax and non-controlling interest in 2010.
Banco de Occidente
Net income
|
Year ended December 31,
|
Change, 2010 vs. 2009
|
|||||||||||||||
|
2010
|
2009
|
# |
%
|
|||||||||||||
|
(in Ps billions)
|
||||||||||||||||
|
Total interest income
|
1,403.9 | 1,821.7 | (417.8 | ) | (22.9 | ) | ||||||||||
|
Total interest expense
|
(457.2 | ) | (732.0 | ) | (274.7 | ) | (37.5 | ) | ||||||||
|
Net interest income
|
946.7 | 1,089.7 | (143.1 | ) | (13.1 | ) | ||||||||||
|
Total provisions (reversals), net
|
(192.3 | ) | (257.3 | ) | (65.0 | ) | (25.3 | ) | ||||||||
|
Total fees and other services income, net
|
186.6 | 216.6 | (30.0 | ) | (13.8 | ) | ||||||||||
|
Total other operating income
|
316.7 | 282.0 | 34.7 | 12.3 | ||||||||||||
|
Total operating income
|
1,257.6 | 1,331.0 | (73.3 | ) | (5.5 | ) | ||||||||||
|
Total operating expenses
|
(764.4 | ) | (764.7 | ) | (0.3 | ) | 0.0 | |||||||||
|
Net operating income
|
493.2 | 566.2 | (73.0 | ) | (12.9 | ) | ||||||||||
|
Total non-operating income (expense), net
|
21.4 | 12.8 | 8.6 | 67.3 | ||||||||||||
|
Income before income tax expense and non-controlling interest
|
514.6 | 579.0 | (64.4 | ) | (11.1 | ) | ||||||||||
|
Income tax expense
|
(126.2 | ) | (152.0 | ) | (25.8 | ) | (17.0 | ) | ||||||||
|
Income before non-controlling interest
|
388.4 | 427.0 | (38.6 | ) | (9.0 | ) | ||||||||||
|
Non-controlling interest
|
(2.0 | ) | (44.9 | ) | (42.9 | ) | (95.5 | ) | ||||||||
|
Net income attributable to shareholders
|
386.4 | 382.1 | 4.3 | 1.1 | ||||||||||||
Banco de Occidente’s net income attributable to its shareholders increased by 1.1% to Ps 386.4 billion in 2010. The primary cause of this increase was the decrease in minority interest, by 95.5% to Ps 2.0 billion, due to the merger of Banco de Occidente and Leasing de Occidente, which occurred in the first half of 2010. The growth of total other operating income by 12.3% to Ps 316.7 billion (mainly as a result of a rise in dividend income from Corficolombiana, of which Banco de Occidente owns 13.4%) also contributed to the increase in net income. Banco de Occidente’s efficiency ratio worsened during this period, increasing from 39.8% in 2009 to 44.5% in 2010.
Net interest income
|
Year ended December 31,
|
Change, 2010 vs. 2009
|
|||||||||||||||
|
2010
|
2009
|
# |
%
|
|||||||||||||
|
(in Ps billions)
|
||||||||||||||||
|
Interest income:
|
||||||||||||||||
|
Interest on loans
|
945.3 | 1,223.8 | (278.5 | ) | (22.8 | ) | ||||||||||
|
Interest on investment securities
|
193.9 | 263.2 | (69.3 | ) | (26.3 | ) | ||||||||||
|
Interbank and overnight funds
|
8.4 | 32.1 | (23.6 | ) | (73.7 | ) | ||||||||||
|
Financial leases
|
256.3 | 302.6 | (46.4 | ) | (15.3 | ) | ||||||||||
|
Total interest income
|
1,403.9 | 1,821.7 | (417.8 | ) | (22.9 | ) | ||||||||||
|
Interest expense:
|
||||||||||||||||
|
Checking accounts
|
(4.9 | ) | (3.9 | ) | 1.0 | 26.3 | ||||||||||
|
Time deposits
|
(137.6 | ) | (263.5 | ) | (125.8 | ) | (47.8 | ) | ||||||||
|
Savings deposits
|
(141.6 | ) | (215.3 | ) | (73.8 | ) | (34.3 | ) | ||||||||
|
Total interest expense from deposits
|
(284.1 | ) | (482.7 | ) | (198.6 | ) | (41.1 | ) | ||||||||
|
Borrowing from banks and others
|
(76.8 | ) | (116.7 | ) | (39.9 | ) | (34.2 | ) | ||||||||
|
Interbank and overnight funds (expenses)
|
(6.7 | ) | (5.5 | ) | 1.2 | 21.6 | ||||||||||
|
Long-term debt (bonds)
|
(89.7 | ) | (127.1 | ) | (37.4 | ) | (29.4 | ) | ||||||||
|
Total interest expense
|
(457.2 | ) | (732.0 | ) | (274.7 | ) | (37.5 | ) | ||||||||
|
Net interest income
|
946.7 | 1,089.7 | (143.1 | ) | (13.1 | ) | ||||||||||
Banco de Occidente’s net interest income decreased by 13.1% from Ps 1,089.7 billion in 2009 to Ps 946.7 billion in 2010. This decrease was primarily driven by a 21.3% decrease in the interest earned on loans and financial leases to Ps 1,201.6 billion in 2010. The decrease in average annualized yield for loans and financial leases from 15.0% in 2009 to 11.2% in 2010 reflected the fact that 59.1% of Banco de Occidente’s gross loan portfolio at December 31, 2010 was concentrated in commercial loans which, as mentioned in the 2010-2009 Grupo Aval discussion above, saw their yield particularly affected by the declining interest rate environment. The decrease in yield resulted in a Ps 394.0 billion decline in interest income from loans and financial leases. Partially offsetting this decrease in interest income was the 5.7% growth of Banco de Occidente’s average loan and financial lease portfolio, primarily in consumer loans and financial leases, to Ps 10,763.8 billion. The growth in the balance of this portfolio resulted in an increase of Ps 69.1 billion in interest income.
Interest income from investment securities decreased by 26.3% to Ps 193.9 billion. The fixed income portfolio generated Ps 193.8 billion, or 99.97%, of Banco de Occidente’s earnings on investment securities in 2010, reflecting gains resulting from the declining interest rate environment as well as interest accrued on the portfolio. Nevertheless, the earnings from fixed income investments for 2010 were 25.5% less than the Ps 260.0 billion earned on fixed income investments in 2009, primarily due to challenging months in January and February 2010 stemming from the volatility of fixed income interest rates in these first couple of months (explained in further depth in the Grupo Aval 2010-2009 discussion). The equity portfolio generated the remaining Ps 0.05 billion, or 0.03%, of the interest income from investment securities, which was down from the Ps 3.2 billion produced by the equity portfolio in 2009.
The decrease in interest income was partially offset by a 37.5% decline in total interest expense to Ps 457.2 billion in 2010. The decrease in interest paid on interest-bearing liabilities reflected a decreased average cost of funding, primarily in savings deposits and time deposits. The nominal interest rate paid on interest-bearing liabilities decreased from an average of 6.6% in 2009 to 4.1% in 2010, which resulted in a Ps 242.4 billion decrease in interest expense. The average balance of interest-bearing liabilities increased by 1.5% to Ps 11,174.8 billion from 2009 to 2010; however, Banco de Occidente changed its composition of interest-bearing liabilities throughout 2010: the average balance of savings deposits, which are relatively less expensive than time deposits, increased by 11.6% to Ps 4,860.9 billion, while the average balance of time deposits decreased by 16.3% to Ps 2,854.7 billion. As a result, the increase in volume of interest-bearing liabilities actually contributed to a Ps 32.3 billion decrease in interest expense.
Banco de Occidente’s net interest margin decreased to 6.0% in 2010, down from 7.7% in 2009. Similarly, the spread between the yield earned on its loans and financial leases and the cost of its interest-bearing liabilities decreased from 8.3% in 2009 to 7.1% in 2010. In addition to its high concentration in commercial loans, Banco de Occidente’s assets repriced faster than its liabilities due to the fact that a high proportion of its gross loans are due in one year or less (53.9% at December 31, 2010 compared to the Grupo Aval consolidated average of 45.9%, and 47.0% before including BAC Credomatic’s impact, each at December 31, 2010), which are particularly sensitive to repricing in an environment of declining interest rates.
Provisions
Total net provisions decreased by 25.3% to Ps 192.3 billion in 2010, driven by a decrease in provisions for loans and financial leases and a marginal increase in recoveries. Net provisions for loan and financial lease losses, the main component of total net provisions, decreased by 12.0% to Ps 204.2 billion as a result of the improvement of Banco de Occidente’s credit quality. Banco de Occidente’s past due loans decreased by 24.7% to Ps 328.7 billion and its delinquency ratio decreased from 4.0% at December 31, 2009 to 2.8% at December 31, 2010. This decrease was primarily a result of a reduction in past due commercial loans, which decreased by 34.9% to Ps 133.5 billion (with a drop in their delinquency ratio from 3.2% to 1.9%).
Charge-offs increased by 9.4% to Ps 227.6 billion in 2010 due almost entirely to an increase in write-offs in the fourth quarter of 2010 as compared to the fourth quarter of 2009 (Banco de Occidente had almost identical charge-off figures for the first nine months of 2010 as compared to the first nine months of 2009, Ps 147.2 and Ps 147.7, respectively). Charge-offs in the fourth quarter of 2010 were higher than usual primarily due to two events: (1) the write-off of a Ps 10.2 billion loan made to a construction company that declared bankruptcy in October 2010 and (2) a Ps 5.7 billion write-off in November 2010 for a loan issued to an agriculture company that experienced economic difficulties. Banco de Occidente’s charge-offs to average loans and financial leases ratio rose from 1.9% in 2009 to 2.1% in 2010. Due to the increase in charge-offs and a decrease in its net provisions, Banco de Occidente’s allowance for loan and financial lease losses decreased by 4.2% to Ps 536.8 billion at December 31, 2010. However, since the percentage decrease in past due loans was greater than the percentage decrease in allowance, Banco de Occidente’s coverage ratio improved from 128.4% to 163.3%.
Net provisions for accrued interest and other receivables decreased by 49.8% to Ps 26.0 billion due to the aforementioned improvement in the Colombian economy.
Net provisions for foreclosed assets and other assets decreased by Ps 1.2 billion, or 44.4%, to Ps 1.5 billion in 2010. Gross provisions for foreclosed assets and other assets decreased by Ps 1.5 billion to Ps 6.9 billion, and reversals of provisions for foreclosed and other assets decreased by Ps 0.3 billion to Ps 5.4 billion.
The recovery of charged-off assets increased by Ps 10.3 billion primarily as a result of the improving Colombian economy and a more effective recovery effort by Banco de Occidente.
Total fees and other services income
|
Year ended December 31,
|
Change, 2010 vs. 2009
|
|||||||||||||||
|
2010
|
2009
|
# |
%
|
|||||||||||||
|
(in Ps billions)
|
||||||||||||||||
|
Fees and other services income:
|
|
|||||||||||||||
|
Commissions from banking services
|
124.5 | 150.5 | (26.0 | ) | (17.3 | ) | ||||||||||
|
Branch network services
|
– | – | – | – | ||||||||||||
|
Credit card merchant fees
|
81.5 | 42.6 | 38.8 | 91.1 | ||||||||||||
|
Checking fees
|
23.3 | 22.7 | 0.6 | 2.6 | ||||||||||||
|
Warehouse services
|
– | – | – | – | ||||||||||||
|
Fiduciary activities
|
37.9 | 33.8 | 4.1 | 12.1 | ||||||||||||
|
Pension plan administration
|
– | – | – | – | ||||||||||||
|
Other
|
27.0 | 26.0 | 1.1 | 4.2 | ||||||||||||
|
Total fees and other services income
|
294.1 | 275.5 | 18.6 | 6.7 | ||||||||||||
|
Fees and other services expenses
|
(107.5 | ) | (59.0 | ) | 48.5 | 82.3 | ||||||||||
|
Total fees and other services income, net
|
186.6 | 216.6 | (30.0 | ) | (13.8 | ) | ||||||||||
Total net fees and other services income decreased by 13.8% to Ps 186.6 billion in 2010. At the beginning of the year, the Superintendency of Finance required Banco de Occidente to change the way it classified certain income/expenses. Specifically, it ordered the bank to split its credit card merchant fees into gross revenue and expenses (it was previously recorded on a net basis). This almost entirely explains the Ps 38.8 billion increase in credit card merchant fees, as well as the Ps 48.5 billion increase in fees and other services expenses. The Ps 26.0 billion decrease in commissions from banking services is also explained by a reclassification that occurred in the first semester of 2010. Banco de Occidente moved Ps 34.9 billion of this income to “income from the non-financial sector, net” under “Other operating income,” as it was related to income generated by Ventas y Servicios S.A., a real-sector company consolidated by Banco de Occidente. The reported amount for the line item “income from the non-financial sector” in the 2010 period is much less than the Ps 34.9 billion other income reclassification because the reported amount is net of Ps 33.3 billion of expenses, which were reallocated from operating expenses (primarily administrative and other expenses and salaries and employee benefits).
Other operating income
|
Year ended December 31,
|
Change, 2010 vs. 2009
|
|||||||||||||||
|
2010
|
2009
|
# |
%
|
|||||||||||||
|
(in Ps billions)
|
||||||||||||||||
|
Foreign exchange gains (losses), net
|
17.1 | (7.1 | ) | 24.1 | 341.0 | |||||||||||
|
Gains on derivative operations, net
|
27.6 | 55.8 | (28.3 | ) | (50.6 | ) | ||||||||||
|
Gains on sales of investments in equity securities, net
|
0.0 | – | 0.0 | – | ||||||||||||
|
Income from non-financial sector, net (1)
|
1.6 | – | 1.6 | – | ||||||||||||
|
Dividend income
|
111.7 | 68.6 | 43.1 | 62.7 | ||||||||||||
|
Other
|
158.8 | 164.6 | (5.8 | ) | (3.5 | ) | ||||||||||
|
Other operating income
|
316.7 | 282.0 | 34.7 | 12.3 | ||||||||||||
Total other operating income increased by 12.3% to Ps 316.7 billion in 2010. Banco de Occidente’s dividend income increased by 62.7% to Ps 111.7 billion, primarily as a result of higher dividends paid by Corficolombiana. Corficolombiana’s dividend income in 2010 was much higher due to the fact that its dividend payments are based on its previous year’s net income, and Corficolombiana’s net income in 2009 was particularly high (further explained in
the 2010-2009 Corficolombiana discussion). This increase was partially offset by a Ps 28.3 billion decrease in net gains on derivative operations to Ps 27.6 billion, though this was almost entirely compensated by a related Ps 24.1 billion increase in net foreign exchange gains. The Ps 1.6 billion net income from the non-financial sector is composed of income related to Ventas y Servicios S.A., a subsidiary of Banco de Occidente. Prior to 2010, when a change in accounting policies resulted in Ventas y Servicios’ net income being recorded under the line item “income from non-financial sector,” it was divided among various different line items on Banco de Occidente’s financial statements.
Operating expenses
|
Year ended December 31,
|
Change, 2010 vs. 2009
|
|||||||||||||||
|
2010
|
2009
|
# |
%
|
|||||||||||||
|
(in Ps billions)
|
||||||||||||||||
|
Salaries and employee benefits
|
(275.1 | ) | (274.5 | ) | 0.5 | 0.2 | ||||||||||
|
Bonus plan payments
|
(20.1 | ) | (18.9 | ) | 1.3 | 6.6 | ||||||||||
|
Termination payments
|
(3.7 | ) | (2.4 | ) | 1.3 | 51.9 | ||||||||||
|
Administrative and other expenses
|
(320.6 | ) | (303.7 | ) | 16.9 | 5.6 | ||||||||||
|
Deposit security, net
|
(23.6 | ) | (31.1 | ) | (7.5 | ) | (24.2 | ) | ||||||||
|
Charitable and other donation expenses
|
(1.4 | ) | (1.2 | ) | 0.3 | 21.6 | ||||||||||
|
Depreciation
|
(118.6 | ) | (120.1 | ) | (1.5 | ) | (1.2 | ) | ||||||||
|
Goodwill amortization
|
(1.3 | ) | (12.8 | ) | (11.5 | ) | (90.0 | ) | ||||||||
|
Total operating expenses
|
(764.4 | ) | (764.7 | ) | (0.3 | ) | – | |||||||||
Total operating expenses for 2010 remained basically unchanged from 2009 at Ps 764.4 billion, however, there were a few changes in certain line-items. Goodwill amortization decreased due to the additional amortization of Ps 10.2 billion in the first semester of 2009 that was not repeated in 2010. There was also a Ps 7.5 billion decrease in net deposit security expenses. This decrease was partially offset by a 5.6% increase of administrative and other expenses to Ps 320.6 billion associated with the organic growth of the business. Salaries and employee benefits increased very slightly, by 0.2% to Ps 275.1 billion, which considering the increase in total employees from 7,827 at December 31, 2009 to 8,269 at December 31, 2010, represents a 5.2% per capita decrease. Despite the fact that total operating expenses remained steady, Banco de Occidente’s efficiency ratio slightly worsened in 2010, increasing from 39.8% to 44.5%, respectively. Nevertheless, it should be noted that Banco de Occidente is still among the most efficient of Grupo Aval’s banks, and the Colombian financial system as a whole, due to the bank’s efficient use of its office branch network and its ability to conduct business directly through its Treasury department.
Non-operating income (expense)
Total non-operating income (expense), which represented 4.2% of income before income tax expense and non-controlling interest in 2010, includes gains (losses) from the sale of foreclosed assets, property, plant and equipment, and other assets and income. This line item increased by Ps 8.6 billion to Ps 21.4 billion in 2010, primarily due to the sale of a warehouse in 2010 that generated approximately Ps 5.0 billion of non-operating income.
Income tax expense
Income tax expense decreased by 17.0% to Ps 126.2 billion in 2010. This was reflected in Banco de Occidente’s 24.5% effective tax rate for this period, which was 173 basis points below the 26.3% rate that prevailed in 2009. This decrease was primarily due to the fact that an important portion of the income generated by Banco de Occidente in 2010 stemmed from dividend income from its investment in Corficolombiana, which is non-taxable according to Colombian regulations. It is important to note that Banco de Occidente’s historic (and current) relatively low effective tax rate is a result not only of the significant non-taxable dividend income it receives from Corficolombiana and Porvenir, but also from deductions associated with Leasing de Occidente’s operations, mainly related to the fact that it holds productive assets (which it leases) that provide a tax deduction equivalent to 30% of their purchase price.
Non-controlling interest
Banco de Occidente’s non-controlling interest decreased by 95.5% to Ps 2.0 billion. This decrease was due to Banco de Occidente’s merger with Leasing de Occidente, an entity that Banco de Occidente previously consolidated on its financial statements, despite owning only 34.4%, due to a control agreement signed with Corficolombiana (which owned 45.2% of Leasing de Occidente). As per the merger agreement, Banco de Occidente issued shares in exchange for the outstanding shares of Leasing de Occidente, and as a result, its shares outstanding increased from 137.0 million to 149.8 million. Due to Corficolombiana’s sizable stake in Leasing de Occidente, following the transaction it owned 6.1% of Banco de Occidente’s shares outstanding, although it has since sold 2.11% of these shares at December 31, 2010 and as of May 15, 2011, held 3.9% (further explained in the 2010 – 2009 Corficolombiana discussion).
Banco Popular
Net income
|
Year ended December 31,
|
Change, 2010 vs. 2009
|
|||||||||||||||
|
2010
|
2009
|
# |
%
|
|||||||||||||
|
(in Ps billions)
|
||||||||||||||||
|
Total interest income
|
1,276.2 | 1,453.1 | (176.9 | ) | (12.2 | ) | ||||||||||
|
Total interest expense
|
(325.3 | ) | (514.2 | ) | (189.0 | ) | (36.7 | ) | ||||||||
|
Net interest income
|
950.9 | 938.8 | 12.1 | 1.3 | ||||||||||||
|
Total provisions (reversals), net
|
(101.6 | ) | (94.5 | ) | 7.1 | 7.5 | ||||||||||
|
Total fees and other services income, net
|
136.1 | 143.2 | (7.1 | ) | (5.0 | ) | ||||||||||
|
Total other operating income
|
42.0 | 29.4 | 12.7 | 43.1 | ||||||||||||
|
Total operating income
|
1,027.5 | 1,017.0 | 10.5 | 1.0 | ||||||||||||
|
Total operating expenses
|
(558.3 | ) | (536.5 | ) | 21.8 | 4.1 | ||||||||||
|
Net operating income
|
469.2 | 480.4 | (11.3 | ) | (2.3 | ) | ||||||||||
|
Total non-operating income (expense), net
|
53.0 | (42.3 | ) | 95.3 | (225.3 | ) | ||||||||||
|
Income before income tax expense and non-controlling interest
|
522.2 | 438.1 | 84.1 | 19.2 | ||||||||||||
|
Income tax expense
|
(156.8 | ) | (132.5 | ) | 24.3 | 18.3 | ||||||||||
|
Income before non-controlling interest
|
365.4 | 305.6 | 59.8 | 19.6 | ||||||||||||
|
Non-controlling interest
|
(3.8 | ) | (2.1 | ) | 1.8 | 85.5 | ||||||||||
|
Net income attributable to shareholders
|
361.6 | 303.6 | 58.1 | 19.1 | ||||||||||||
Banco Popular’s net income attributable to its shareholders increased by 19.1% to Ps 361.6 billion in 2010 mainly due to: (1) an increase in net interest income, which was a result of decreasing its total interest expense by more than the decrease in its total interest income, (2) a rise in total other operating income primarily due to an increase in dividend income, and (3) an increase in non-operating income, which was predominantly a result of the reversal of a portion of its provisions for employee pension plans and the recovery of guaranties for charged-off loans from the
Fondo Nacional de Garantías
(Colombian National Guaranty Fund). The slight decrease in net operating income, partially due to the 4.1% increase in its total operating expenses, contributed to a marginal worsening of its efficiency ratio from 46.7% in 2009 to 47.6% in 2010.
Net interest income
|
Year ended December 31,
|
Change, 2010 vs. 2009
|
|||||||||||||||
|
2010
|
2009
|
# |
%
|
|||||||||||||
|
(in Ps billions)
|
||||||||||||||||
|
Interest income:
|
||||||||||||||||
|
Interest on loans
|
1,067.4 | 1,144.8 | (77.5 | ) | (6.8 | ) | ||||||||||
|
Interest on investment securities
|
164.8 | 236.9 | (72.1 | ) | (30.4 | ) | ||||||||||
|
Interbank and overnight funds
|
16.8 | 41.2 | (24.5 | ) | (59.3 | ) | ||||||||||
|
Financial leases
|
27.3 | 30.1 | (2.9 | ) | (9.5 | ) | ||||||||||
|
Total interest income
|
1,276.2 | 1,453.1 | (176.9 | ) | (12.2 | ) | ||||||||||
|
Interest expense:
|
||||||||||||||||
|
Checking accounts
|
(1.9 | ) | (16.6 | ) | (14.7 | ) | (88.5 | ) | ||||||||
|
Time deposits
|
(81.8 | ) | (182.6 | ) | (100.7 | ) | (55.2 | ) | ||||||||
|
Savings deposits
|
(170.6 | ) | (262.6 | ) | (92.0 | ) | (35.0 | ) | ||||||||
|
Total interest expense on deposits
|
(254.3 | ) | (461.8 | ) | (207.4 | ) | (44.9 | ) | ||||||||
|
Borrowing from banks and others
|
(9.9 | ) | (18.5 | ) | (8.5 | ) | (46.3 | ) | ||||||||
|
Interbank and overnight funds (expenses)
|
(2.5 | ) | (2.1 | ) | 0.5 | 22.7 | ||||||||||
|
Long-term debt (bonds)
|
(58.5 | ) | (31.9 | ) | 26.6 | 83.2 | ||||||||||
|
Total interest expense
|
(325.3 | ) | (514.2 | ) | (189.0 | ) | (36.7 | ) | ||||||||
|
Net interest income
|
950.9 | 938.8 | 12.1 | 1.3 | ||||||||||||
Banco Popular’s net interest income grew by 1.3% to Ps 950.9 billion in 2010. This increase was driven primarily by the 36.7% decrease in interest expense to Ps 325.3 billion amidst the previously discussed declining interest rate environment. The decrease in interest expense was concentrated in time deposits, for which interest expense decreased by 100.7 billion (Ps 82.0 billion due to a decrease in rate paid and Ps 18.7 billion as a result of a decline in their average balance), and savings accounts, for which interest expense decreased by Ps 92.0 billion (Ps 109.5 billion due to a decrease in rate paid, partially offset by a Ps 17.5 billion increase associated with the growth of their average balance). The nominal interest rate paid on interest-bearing liabilities decreased from an average of 6.4% in 2009 to 3.8% in 2010, which excluding interbank and overnight funds, resulted in a Ps 224.0 billion decrease in interest expense. This decrease was partially offset by a 7.8% increase in the balance of average interest-bearing liabilities to Ps 8,600.4 billion (primarily reflecting increased savings deposits and long-term debt) in 2010, which was responsible for a Ps 34.6 billion increase in interest expense (excluding the impact of interbank and overnight funds).
A decline in Banco Popular’s interest income from loans and financial leases, which decreased by 6.8% to Ps 1,094.6 billion, partially offset the decrease in interest expense. This decrease in interest income was comparatively less pronounced than what was generally observed throughout the Colombian financial system due to the fact that a substantial portion of its loan portfolio is concentrated in consumer loans (53.1% of its total gross loan portfolio at December 31, 2010), which as mentioned in the Grupo Aval 2010-2009 discussion, were relatively less affected by the declining interest rate environment. Nevertheless, the decrease in average yield for loans and financial leases from 18.5% in 2009 to 14.4% in 2010 resulted in a Ps 260.7 billion decline in interest income from loans and financial leases. Partially offsetting the decrease in interest income from the decline in yield was the 19.6% growth of Banco Popular’s average loan and financial lease portfolio, primarily in consumer and commercial loans, to Ps 7,597.9 billion. The growth in the balance of this portfolio resulted in an increase of Ps 180.3 billion in interest income.
A decrease in interest income from investment securities, which declined by 30.4% to Ps 164.8 billion in 2010, also partially offset the decrease in interest expense. The fixed income portfolio generated Ps 164.0 billion of interest income from investment securities, accounting for 99.5% of Banco Popular’s earnings on investment securities in 2010. This was 30.2% lower than the Ps 234.9 billion of income generated by fixed income securities in 2009 for the reasons explained in the Grupo Aval 2010-2009 discussion. Banco Popular’s equity portfolio generated the remaining Ps 0.7 billion, or 0.5%, of income from investment securities in 2010. This was marginally lower than the Ps 2.0 billion yielded by its equity portfolio in 2009.
For the reasons explained above, Banco Popular’s net interest margin decreased from 10.4% in 2009 to 9.0% in 2010, while its spread between the yield earned on its loans and financial leases and the cost of its interest-bearing liabilities declined from 12.1% in 2009 to 10.6% in 2010.
Provisions
Total net provisions increased by 7.5% to Ps 101.6 billion in 2010, driven primarily by a 36.4% rise in net provisions for loans and financial leases to Ps 128.6 billion. The increase in provisions was primarily due to the deterioration of the credit quality of certain loans throughout the fourth quarter which were ultimately charged off, as illustrated by the Ps 68.1 billion increase in charge-offs to Ps 98.6 billion in 2010 (with Ps 54.5 billion coming in the fourth quarter), were ultimately charged-off. Consistent with the increase in charge-offs, Banco Popular’s charge-offs to average loan ratio increased from 0.5% in 2009 to 1.3% in 2010. Despite this increase, Banco Popular’s ratio of charge-offs to average loans was still relatively low, especially for a bank concentrated in consumer loans. Moreover, even with the increase in charge-offs, Banco Popular’s net provisions for loans and financial leases were still greater than its charge-offs, which resulted in a 6.4% increase in its allowance for loan and financial lease losses to Ps 360.8 billion at December 31, 2010.
As a result of the recovery of the Colombian economy and the charging-off of certain past due loans in 2010, Banco Popular’s past due loans decreased by 19.4% to Ps 215.4 billion at December 31, 2010, and its delinquency ratio decreased from 3.7% at December 31, 2009 to 2.5% at December 31, 2010. This decrease was primarily a result of a reduction in past due commercial loans, which decreased by 25.1% to Ps 73.8 billion (with a drop in their delinquency ratio from 3.7% to 2.0%), and past due consumer loans, which declined by 8.0% to Ps 116.7 billion (with a decrease in their delinquency ratio from 3.0% to 2.5%). The growth of Banco Popular’s allowance, combined with the decrease in its past due loans and financial leases, resulted in the increase of its coverage ratio from 127.0% at December 31, 2009 to 167.5% at December 31, 2010.
Net provisions for accrued interest and other receivables decreased by Ps 16.7 billion to Ps (5.7) billion (indicating a recovery of Ps 5.7 billion) due to the aforementioned improvement in the Colombian economy.
Net provisions for foreclosed assets and other assets decreased by Ps 2.7 billion to Ps (5.0) billion (indicating a net recovery of Ps 5.0 billion) in 2010. Gross provisions for foreclosed assets and other assets decreased by Ps 2.3 billion to Ps 4.0 billion, while reversals of provisions for foreclosed and other assets increased by Ps 0.4 billion to Ps 9.0 billion in 2010.
Banco Popular’s recovery of charged-off assets increased by Ps 7.8 billion to Ps 16.4 billion as a result of both a higher level of charge-offs and higher collections stemming from the overall improved economic environment.
Total fees and other services income
|
Year ended December 31,
|
Change, 2010 vs. 2009
|
|||||||||||||||
|
2010
|
2009
|
# |
%
|
|||||||||||||
|
(in Ps billions)
|
||||||||||||||||
|
Fees and other services income:
|
|
|
|
|||||||||||||
|
Commissions from banking services
|
86.9 | 93.2 | (6.3 | ) | (6.8 | ) | ||||||||||
|
Branch network services
|
– | – | – | – | ||||||||||||
|
Credit card merchant fees
|
5.1 | 4.3 | 0.8 | 18.0 | ||||||||||||
|
Checking fees
|
4.3 | 4.7 | (0.4 | ) | (8.8 | ) | ||||||||||
|
Warehouse services
|
55.3 | 57.9 | (2.7 | ) | (4.6 | ) | ||||||||||
|
Fiduciary activities
|
10.7 | 10.9 | (0.2 | ) | (2.0 | ) | ||||||||||
|
Pension plan administration
|
1.6 | 1.0 | 0.6 | 59.5 | ||||||||||||
|
Others
|
10.3 | 10.5 | (0.2 | ) | (2.2 | ) | ||||||||||
|
Total fees and other services income
|
174.1 | 182.6 | (8.5 | ) | (4.6 | ) | ||||||||||
|
Fees and other services expenses
|
(38.0 | ) | (39.3 | ) | (1.4 | ) | (3.5 | ) | ||||||||
|
Total fees and other services income, net
|
136.1 | 143.2 | (7.1 | ) | (5.0 | ) | ||||||||||
Total net fees and other services income decreased by 5.0% to Ps 136.1 billion in 2010. This decline was primarily due to a 6.8% drop in commissions from banking services to Ps 86.9 billion as a result of the decision not to renew a government contract, for which the Colombian government intended to establish new terms. This contract was assigned to Banco Agrario, the only state-owned bank in Colombia.
Other operating income
|
Year ended December 31,
|
Change, 2010 vs. 2009
|
|||||||||||||||
|
2010
|
2009
|
# |
%
|
|||||||||||||
|
(in Ps billions)
|
||||||||||||||||
|
Foreign exchange gains (losses), net
|
(1.6 | ) | (1.8 | ) | 0.2 | 11.2 | ||||||||||
|
Gains on derivative operations, net
|
0.0 | 0.1 | (0.1 | ) | (96.9 | ) | ||||||||||
|
Gains on sales of investments in equity securities, net
|
(0.0 | ) | – | (0.0 | ) | – | ||||||||||
|
Income from non-financial sector, net
|
3.5 | – | 3.5 | – | ||||||||||||
|
Dividend income
|
28.1 | 14.8 | 13.2 | 89.1 | ||||||||||||
|
Other
|
12.1 | 16.3 | (4.2 | ) | (25.6 | ) | ||||||||||
|
Total other operating income
|
42.0 | 29.4 | 12.7 | 43.1 | ||||||||||||
Total other operating income increased by 43.1% to Ps 42.0 billion in 2010. This increase was primarily a result of an increase in dividend income, in particular from Corficolombiana, of which Banco Popular owns approximately 5.5%. The reason for the increase in dividend income from Corficolombiana is included in the Banco de Occidente 2010-2009 discussion in the section on other operating income. The Ps 3.5 billion of net income from the non-financial sector is income contributed by Inca. Prior to 2010, when a change in accounting policies resulted in Inca’s net income being recorded under the line item “income from non-financial sector,” it was divided among various different line items of Banco Popular’s financial statements.
Operating expenses
|
Year ended December 31,
|
Change, 2010 vs. 2009
|
|||||||||||||||
|
2010
|
2009
|
# |
%
|
|||||||||||||
|
(in Ps billions)
|
||||||||||||||||
|
Salaries and employee benefits
|
(224.1 | ) | (222.3 | ) | 1.8 | 0.8 | ||||||||||
|
Bonus plan payments
|
(3.8 | ) | (2.8 | ) | 1.0 | 34.6 | ||||||||||
|
Termination payments
|
(0.1 | ) | (0.5 | ) | (0.4 | ) | (76.7 | ) | ||||||||
|
Administrative and other expenses
|
(281.2 | ) | (264.8 | ) | 16.5 | 6.2 | ||||||||||
|
Deposit security, net
|
(26.7 | ) | (24.2 | ) | 2.5 | 10.2 | ||||||||||
|
Charitable and other donation expenses
|
(1.3 | ) | (4.4 | ) | (3.0 | ) | (69.4 | ) | ||||||||
|
Depreciation
|
(20.9 | ) | (17.5 | ) | 3.5 | 19.8 | ||||||||||
|
Goodwill amortization
|
– | – | – | – | ||||||||||||
|
Total operating expenses
|
(558.3 | ) | (536.5 | ) | 21.8 | 4.1 | ||||||||||
Total operating expenses increased by 4.1% to Ps 558.3 billion in 2010, principally due to a 6.2% increase in administrative and other expenses as a result of the growth in the loan and financial lease portfolio. Salaries and employee benefits remained basically unchanged at Ps 224.1 billion, which considering the increase in headcount from 5,875 at December 31, 2009 to 6,180 at December 31, 2010, represents a 4.2% decrease on a per capita basis. Since operating expenses before depreciation and the amortization of goodwill grew 3.5%, while total operating income before provisions only grew 1.6%, Banco Popular’s efficiency ratio deteriorated slightly from 46.7% in 2009 to 47.6% in 2010.
Non-operating income (expense)
Total net non-operating income (expense) increased by Ps 95.3 billion to a net non-operating income of Ps 53.0 billion in 2010 from a net non-operating expense of Ps 42.3 billion in 2009, driven primarily by: (1) an approximate Ps 34.4 billion reversal of provisions for employee pension plans, (2) a Ps 18.4 billion recovery of guaranties for charged off loans (primarily corresponding to small and medium-sized business) from the Colombian National Guaranty Fund, which guarantees loans to certain industries and businesses that the government has identified as important strategic investments for the country’s development, (3) the sale of several foreclosed assets that netted Ps 10.3 billion in income, and (4) the reduction of legal expenses for labor lawsuits by approximately Ps 20.0 billion in 2010 as compared to 2009.
Income tax expense
Income tax expense for Banco Popular increased by Ps 24.3 billion to Ps 156.8 billion in 2010. This increase was primarily due to higher income before income tax expense and non-controlling interest, as Banco Popular’s effective tax rate, calculated before removing non-controlling interest, remained essentially unchanged at 30.0% in 2010 (as compared to 30.2% in 2009).
Non-controlling interest
Banco Popular’s non-controlling interest increased by Ps 1.8 billion to Ps 3.8 billion. Non-controlling interest is not a significant contributor to net income for Banco Popular, responsible for only 1.0% of net income before non-controlling interest in 2010.
Banco AV Villas
Net income
|
Year ended December 31,
|
Change, 2010 vs. 2009
|
|||||||||||||||
|
2010
|
2009
|
# |
%
|
|||||||||||||
|
(in Ps billions)
|
||||||||||||||||
|
Total interest income
|
683.1 | 789.1 | (106.0 | ) | (13.4 | ) | ||||||||||
|
Total interest expense
|
(142.8 | ) | (217.0 | ) | (74.2 | ) | (34.2 | ) | ||||||||
|
Net interest income
|
540.3 | 572.1 | (31.7 | ) | (5.5 | ) | ||||||||||
|
Total provisions (reversals), net
|
(122.4 | ) | (188.0 | ) | (65.6 | ) | (34.9 | ) | ||||||||
|
Total fees and other services income, net
|
140.5 | 143.3 | (2.8 | ) | (2.0 | ) | ||||||||||
|
Total other operating income
|
9.7 | 4.3 | 5.5 | 128.2 | ||||||||||||
|
Total operating income
|
568.1 | 531.6 | 36.5 | 6.9 | ||||||||||||
|
Total operating expenses
|
(389.8 | ) | (377.8 | ) | 12.0 | 3.2 | ||||||||||
|
Net operating income
|
178.4 | 153.9 | 24.5 | 15.9 | ||||||||||||
|
Total non-operating income (expense), net
|
16.2 | 12.6 | 3.6 | 28.2 | ||||||||||||
|
Income before income tax expense and non-controlling interest
|
194.5 | 166.5 | 28.0 | 16.8 | ||||||||||||
|
Income tax expense
|
(49.9 | ) | (55.4 | ) | (5.5 | ) | (10.0 | ) | ||||||||
|
Income before non-controlling interest
|
144.7 | 111.1 | 33.6 | 30.2 | ||||||||||||
|
Non-controlling interest
|
(0.4 | ) | (0.4 | ) | (0.1 | ) | (13.5 | ) | ||||||||
|
Net income attributable to shareholders
|
144.3 | 110.7 | 33.6 | 30.4 | ||||||||||||
Banco AV Villas’ net income attributable to its shareholders increased by 30.4% to Ps 144.3 billion in 2010. This increase was primarily due to a reduction in provision expenses (resulting from an improvement in asset quality), partially offset by an increase in operating expenses. During this period, Banco AV Villas’ efficiency ratio worsened slightly, increasing from 50.3% in 2009 to 53.9% in 2010.
Net interest income
|
Year ended December 31,
|
Change, 2010 vs. 2009
|
|||||||||||||||
|
2010
|
2009
|
# |
%
|
|||||||||||||
|
(in Ps billions)
|
||||||||||||||||
|
Interest income:
|
||||||||||||||||
|
Interest on loans
|
573.7 | 610.6 | (36.9 | ) | (6.0 | ) | ||||||||||
|
Interest on investment securities
|
103.5 | 171.9 | (68.5 | ) | (39.8 | ) | ||||||||||
|
Interbank and overnight funds
|
6.0 | 6.5 | (0.6 | ) | (8.9 | ) | ||||||||||
|
Financial leases
|
– | – | – | – | ||||||||||||
|
Total interest income
|
683.1 | 789.1 | (106.0 | ) | (13.4 | ) | ||||||||||
|
Interest expense:
|
||||||||||||||||
|
Checking accounts
|
(0.3 | ) | (0.8 | ) | (0.5 | ) | (64.5 | ) | ||||||||
|
Time deposits
|
(85.7 | ) | (128.2 | ) | (42.6 | ) | (33.2 | ) | ||||||||
|
Savings deposits
|
(38.3 | ) | (59.2 | ) | (21.0 | ) | (35.4 | ) | ||||||||
|
Total interest expense on deposits
|
(124.2 | ) | (188.2 | ) | (64.0 | ) | (34.0 | ) | ||||||||
|
Borrowing from banks and others
|
(5.1 | ) | (4.1 | ) | 0.9 | 22.7 | ||||||||||
|
Interbank and overnight funds (expenses)
|
(13.5 | ) | (24.7 | ) | (11.2 | ) | (45.2 | ) | ||||||||
|
Long-term debt (bonds)
|
– | – | – | – | ||||||||||||
|
Total interest expense
|
(142.8 | ) | (217.0 | ) | (74.2 | ) | (34.2 | ) | ||||||||
|
Net interest income
|
540.3 | 572.1 | (31.7 | ) | (5.5 | ) | ||||||||||
Banco AV Villas’ net interest income decreased by 5.5% to Ps 540.3 billion in 2010. This was primarily due to the 39.8% decrease in income from investment securities to Ps 103.5 billion. The fixed income portfolio generated Ps 103.4 billion, or 99.9%, of Banco AV Villas’ earnings on investment securities in 2010, reflecting gains resulting from the declining interest rate environment as well as interest accrued on the portfolio. Nevertheless, the earnings from fixed income investments in 2010 were 39.5% less than the Ps 170.8 billion earned on fixed income investments in 2009 for the reasons explained in the Grupo Aval 2010-2009 discussion. The equity portfolio generated the remaining Ps 0.1 billion, or 0.1%, of the interest income from investment securities, which was only slightly less than the Ps 1.1 billion in income yielded by the equity portfolio in 2009.
The decrease in interest earned on loans and financial leases by 6.0% to Ps 573.3 billion also contributed to the drop in net interest income in 2010. This was principally due to the decline in average yield for loans and financial leases from 16.6% in 2009 to 13.6% in 2010, which resulted in a Ps 112.4 billion decrease in interest income from loans and financial leases. Partially offsetting this decrease was the 15.1% growth of Banco AV Villas’ average loan and financial lease portfolio, primarily in consumer loans, to Ps 4,222.8 billion. The growth in the balance of this portfolio resulted in an increase of Ps 75.5 billion in interest income.
Total interest expense declined 34.2% to Ps 142.8 billion in 2010. The decrease in interest paid on interest-bearing liabilities reflected a decreased average cost of funding, primarily in time deposits. The nominal interest rate paid on interest-bearing liabilities decreased from an average of 4.9% in 2009 to 2.8% in 2010, which resulted in a Ps 94.7 billion decrease in interest expense. This decrease was partially offset by a 15.5% increase in the balance of average interest-bearing liabilities to Ps 5,102.6 billion in 2010 (primarily reflecting increased savings and time deposits), which was responsible for a Ps 20.5 billion increase in interest expense.
Banco AV Villas’ net interest margin decreased from 11.6% in 2009 to 9.2% in 2010; however, its spread between the yield earned on its loans and financial leases and the cost of its interest-bearing liabilities only decreased from 11.7% in 2009 to 10.8% in 2010, illustrating the primary cause of the decrease in interest income stemmed from investment securities.
Provisions
Total net provisions decreased by 34.9% to Ps 122.4 billion in 2010. This decrease was primarily driven by a decrease in net provisions for loan and financial lease losses, the main component (by volume) of total net provisions, which decreased by 28.8%, or Ps 58.7 billion, to Ps 145.1 billion as a result of the improvement of Banco AV Villas’ credit quality, which was in line with the overall recovery of the Colombian economy. Banco AV Villas’ past due loans decreased by 13.8% to Ps 198.5 billion and its delinquency ratio decreased from 5.5% at December 31, 2009 to 4.5% at December 31, 2010. This decrease was primarily a result of a reduction in past due mortgage loans, which decreased by 18.6% to Ps 67.1 billion (with a drop in their delinquency ratio from 12.1% to 11.4%), and past due commercial loans, which decreased by 36.4% to Ps 34.7 billion (with a drop in their delinquency ratio from 3.1% to 1.9%).
Charge-offs decreased by 20.1% to Ps 105.7 billion in 2010. Consistent with the decrease in charge-offs, Banco AV Villas’ charge-offs to average loan ratio declined from 3.4% in 2009 to 2.4% in 2010. The fact that Banco AV Villas’ net provisions for loan and financial lease losses were greater than its charge-offs resulted in a 18.2% increase in its allowance for loan and financial lease losses to Ps 255.5 billion at December 31, 2010. The growth of Banco AV Villas’ allowance, combined with the decrease in past due loans, resulted in the significant increase of its coverage ratio from 93.9% at December 31, 2009 to 128.7% at December 31, 2010.
Net provisions for accrued interest and other receivables decreased by 62.0% to Ps 2.6 billion as a result of the general improvement of the Colombian economy, as well as a payment received from the Colombian Government (which was fully provisioned) due to adjustments from the mortgage loan portfolio issued in 1999.
Net provisions for foreclosed assets and other assets decreased by Ps 1.3 billion to Ps (1.6) billion (meaning there was a net recovery of Ps 1.6 billion) in 2010. Gross provisions for foreclosed assets and other assets decreased by Ps 0.4 billion to Ps 2.3 billion, while reversals of provisions for foreclosed and other assets increased by Ps 0.9 billion to Ps 3.9 billion.
The recovery of charged-off assets increased by Ps 1.3 billion primarily as a result of a slightly more effective recovery effort by Banco AV Villas.
Total fees and other services income
|
Year ended December 31,
|
Change, 2010 vs. 2009
|
|||||||||||||||
|
2010
|
2009
|
# |
%
|
|||||||||||||
|
(in Ps billions)
|
||||||||||||||||
|
Fees and other services income:
|
|
|
|
|||||||||||||
|
Commissions from banking services
|
146.8 | 116.0 | 30.7 | 26.5 | ||||||||||||
|
Branch network services
|
– | – | – | – | ||||||||||||
|
Credit card merchant fees
|
8.8 | 4.0 | 4.8 | – | ||||||||||||
|
Checking fees
|
– | – | – | – | ||||||||||||
|
Warehouse services
|
– | – | – | – | ||||||||||||
|
Fiduciary activities
|
– | – | – | – | ||||||||||||
|
Pension plan administration
|
– | – | – | – | ||||||||||||
|
Other
|
28.9 | 58.8 | (30.0 | ) | (50.9 | ) | ||||||||||
|
Total fees and other services income
|
184.5 | 178.9 | 5.5 | 3.1 | ||||||||||||
|
Fees and other services expenses
|
(43.9 | ) | (35.6 | ) | 8.3 | 23.4 | ||||||||||
|
Total fees and other services income, net
|
140.5 | 143.3 | (2.8 | ) | (2.0 | ) | ||||||||||
Total fees and other services income decreased by 2.0% to Ps 140.5 billion in 2010. The Ps 30.7 billion increase in commissions from banking services and the Ps 30.0 billion decrease in “Other” is almost entirely explained by a reclassification of accounts, whereby an account related to commissions earned from ATM transfers was moved from the latter to the former. Also partially explaining the decrease in “Other,” was the reclassification of Ps 3.7 billion in income from “Other” to credit card merchant fees, which in turn also predominantly explains the increase in that line-item. The Ps 8.3 billion increase in fees and other service expenses to Ps 43.9 billion was due to a general increase in the volume of transactions and was in line with the organic growth of the business.
Other operating income
|
Year ended December 31,
|
Change, 2010 vs. 2009
|
|||||||||||||||
|
2010
|
2009
|
# |
%
|
|||||||||||||
|
(in Ps billions)
|
||||||||||||||||
|
Foreign exchange gains (losses), net
|
(0.7 | ) | (1.8 | ) | 1.0 | 58.6 | ||||||||||
|
Gains on derivative operations, net
|
1.8 | 3.4 | (1.6 | ) | (47.8 | ) | ||||||||||
|
Gains on sales of investments in equity securities, net
|
– | – | – | – | ||||||||||||
|
Income from non-financial sector, net
|
– | – | – | – | ||||||||||||
|
Dividend income
|
2.5 | 2.7 | (0.2 | ) | (7.4 | ) | ||||||||||
|
Other
|
6.2 | – | 6.2 | – | ||||||||||||
|
Total other operating income
|
9.7 | 4.3 | 5.5 | 128.2 | ||||||||||||
Total other operating income increased by Ps 5.5 billion to Ps 9.7 billion in 2010. This was almost entirely due to income from the sale of a Ps 149.6 billion mortgage loan portfolio that netted Ps 6.2 billion in income. Total other operating income composed only 1.7% of total operating income for 2010.
Operating expenses
|
Year ended December 31,
|
Change, 2010 vs. 2009
|
|||||||||||||||
|
2010
|
2009
|
# |
%
|
|||||||||||||
|
(in Ps billions)
|
||||||||||||||||
|
Salaries and employee benefits
|
(136.4 | ) | (138.1 | ) | (1.7 | ) | (1.2 | ) | ||||||||
|
Bonus plan payments
|
(1.6 | ) | (0.9 | ) | 0.6 | 68.7 | ||||||||||
|
Termination payments
|
(2.0 | ) | (1.5 | ) | 0.5 | 33.9 | ||||||||||
|
Administrative and other expenses
|
(217.6 | ) | (209.1 | ) | 8.4 | 4.0 | ||||||||||
|
Deposit security, net
|
(14.6 | ) | (12.4 | ) | 2.2 | 17.8 | ||||||||||
|
Charitable and other donation expenses
|
(0.5 | ) | (0.2 | ) | 0.3 | – | ||||||||||
|
Depreciation
|
(17.3 | ) | (15.6 | ) | 1.7 | 10.9 | ||||||||||
|
Goodwill amortization
|
– | – | – | – | ||||||||||||
|
Total operating expenses
|
(389.8 | ) | (377.8 | ) | 12.0 | 3.2 | ||||||||||
Total operating expenses increased by 3.2% to Ps 389.8 billion in 2010, primarily due to a 4.0% increase in administrative and other expenses to Ps 217.6 billion related to the organic growth of the business and managing the Banco AV Villas’ larger loan portfolio. Salaries and employee benefits decreased slightly by 1.2% to Ps 136.4 billion, which was in line the 5.0% decrease in headcount from 6,381 at December 31, 2009 to 6,064 at December 31, 2010 (primarily in outsourced positions). On a per capita basis, this represented a 3.9% increase in salaries and employee benefits. The increase in operating expenses contributed to a marginal worsening of Banco AV Villas’ efficiency ratio, which increased from 50.3% in 2009 to 53.9% in 2010.
Non-operating income (expense)
Total non-operating income (expense) in 2010 was Ps 16.2 billion, a Ps 3.6 billion increase from the Ps 12.6 billion in 2009.
Income tax expense
The total income tax expense for Banco AV Villas in 2010 decreased by 10.0% to Ps 49.9 billion. This resulted because, despite the fact that the bank’s income before taxes and non-controlling interest was Ps 28.0 billion higher in 2010, its effective tax rate was 25.6% in 2010, 763 basis points lower than the prevailing 33.3% in 2009. The reason Banco AV Villas’ effective tax rate was lower in 2010 are as follows: (1) in 2010 the bank generated Ps 27.0 billion in non-taxable revenue while in 2009 that figure was only Ps 6.8 billion and (2) non-tax deductible expenses in 2010 were Ps 14.4 billion while in 2009 they were Ps 25.0 billion.
Non-controlling interest
Banco AV Villas’ non-controlling interest, responsible for only 0.3% of its net income before non-controlling interest in 2010, decreased by Ps 0.06 billion from Ps 0.43 billion in 2009. Banco AV Villas’ non-controlling interest reflects other Grupo Aval banks’ ownership in
A Toda Hora
S.A. See “Item 4. Information on the Company––B. Business overview—Banco Popular.”
U.S. GAAP reconciliation
We prepare our financial statements in accordance with Colombian Banking GAAP, which differs in significant respects from U.S. GAAP. Our net income attributable to Grupo Aval shareholders, in accordance with Colombian Banking GAAP, was Ps 1,291.2 billion and Ps 956.9 billion, for the year ended December 31, 2011 and 2010, respectively. Under U.S. GAAP, we would have reported a net income attributable to Grupo Aval shareholders of Ps 781.8 billion and Ps 965.3 billion, for the year ended December 31, 2011 and 2010, respectively.
The following items generated the most significant differences between Colombian Banking GAAP and U.S. GAAP in determining net income and shareholders’ equity:
|
|
·
|
Equity Tax;
|
|
|
·
|
Investments Securities;
|
|
|
·
|
Non-controlling Interest;
|
|
|
·
|
Investments in Affiliated Companies; and
|
|
|
·
|
Business Compensation.
|
For a discussion of the principal differences between Colombian Banking GAAP and U.S. GAAP as they relate to our financial statements and a reconciliation of net income in 2011 and 2010 and shareholders’ equity at December 31, 2011 and 2010, see note 30 to our audited consolidated financial statements.
Critical accounting policies under U.S. GAAP
Allowance for loan losses
Under U.S. GAAP, we consider loans to be impaired when it is probable that all amounts of principal and interest will not be collected according to the contractual terms of the loan agreement. Pursuant to ASC 310, the allowance for significant impaired loans is assessed based on the present value of estimated future cash flows discounted at the current effective loan rate or the fair value of the collateral in the case where the loan is considered collateral-dependent. An allowance for impaired loans is provided when discounted future cash flows or collateral fair value is lower than book value.
In addition, if necessary, a collective allowance for loan losses is established for individual loans, based on recent loss experience, credit scores, the risk characteristics of the various classifications of loans and other factors directly influencing the potential collectability and affecting the quality of the loan portfolio.
To calculate the allowance required for smaller-balance impaired loans, we perform an analysis of historical losses from our loan portfolios in order to estimate losses for U.S. GAAP purposes resulting from loan losses that had been incurred in such loan portfolios at the balance sheet date but which had not been individually identified. Loss estimates are analyzed by loan type and, thus, for homogeneous groups of clients. Such historical ratios are updated to incorporate the most recent data reflecting current economic conditions, industry performance trends, geographic or obligor concentrations within each portfolio segment, and any other pertinent information that may affect the estimation of the allowance for loan losses.
Many factors can affect our estimates of allowance for loan losses, including volatility of default probability, migrations and estimated loss severity.
A 10% decrease in the expected cash flows of significant impaired loans individually analyzed, could result in an additional impairment of approximately Ps 124.9 billion.
A 10% increase in the historical loss ratios for loans collectively analyzed could result in an additional impairment of approximately Ps 119.4 billion.
These sensitivity analyses do not represent management’s expectations of the deterioration in risk ratings or the increases in loss rates but are provided as hypothetical scenarios to assess the sensitivity of the allowance for loan and lease losses to changes in key inputs. We believe the risk ratings and loss severities currently in use are appropriate and that the probability of a downgrade of one level of the internal risk ratings for commercial loans and leases within a short period of time is remote.
The allowance for loan losses, which includes the allowance for loan and lease losses and the reserve for unfunded lending commitments, represents management’s estimate of probable losses inherent in Grupo Aval’s loan portfolio excluding those loans accounted for under the fair value option.
We consider accounting estimates related to loan provisions part of our critical accounting policies because the assumptions and estimates utilized to calculate future estimated losses require a high degree of judgment. It is possible that others, given the same information, may at any point in time reach different reasonable conclusions.
Contingencies
Under U.S. GAAP, ASC 450, “Accounting for Contingencies,” provides guidance for recording contingencies. Under ASC 450, there are three levels of assessment of contingent events: probable, reasonably possible and remote. The term “probable” in ASC 450 is defined as “the future event or events are likely to occur.” The term “reasonably possible” is defined as “the chance of the future event or events occurring is more than remote but less than likely.” In addition, the term “remote” is defined as “the chance of the future event or events occurring is slight.”
Under ASC 450, an estimated loss related to a contingent event is to be accrued by a charge to income if both of the following conditions are met:
|
|
·
|
information available prior to issuance of the financial statements indicates that it is probable that an asset had been impaired or a liability had been incurred at the date of the financial statements; and
|
|
|
·
|
the amount of loss can be reasonably estimated.
|
The amount recorded is an estimate of the amount of loss at the date of the financial statements. If the contingent event is evaluated to be reasonably possible, no provision for the contingent event may be made, but disclosure of the event is required.
We consider contingencies to be part of our critical accounting policies because of the high degree of judgment and assumptions involved in developing and applying valuation methodologies.
Fair value estimates
A portion of our assets is carried at fair value, including trading and available-for-sale securities, derivatives, asset-backed securities, loans, short-term borrowings and long-term debt to meet client needs and to manage liquidity needs and market risk. We determine the fair values of financial instruments based on the fair value hierarchy under applicable accounting guidance which requires an entity to maximize the use of observable inputs and minimize the use of unobservable inputs when measuring fair value. Applicable accounting guidance establishes three levels of inputs used to measure fair value.
ASC 820-10 defines fair value as the price that would be received to sell an asset or paid to transfer a liability in an orderly transaction between market participants at the measurement date. ASC 820-10, among other things, requires Grupo Aval to maximize the use of observable inputs and minimize the use of unobservable inputs when measuring fair value.
In addition, ASC 825-10 provides an option to elect fair value as an alternative measurement for selected financial assets, financial liabilities, unrecognized firm commitments and written loan commitments not previously recorded at fair value. Under ASC 825-10, fair value is used for both the initial and subsequent measurement of the designated assets, liabilities and commitments, with the changes on fair value recognized in net income. As a result of ASC 825-10 analysis, Grupo Aval has not elected to apply fair value accounting for any of its financial instruments not previously carried at fair value.
We consider fair value estimates to be part of our critical accounting policies because of the high degree of judgment and assumptions involved in developing and applying valuation methodologies.
Fair value hierarchy
ASC 820-10 establishes a three-level valuation hierarchy for disclosure of fair value measurements. The valuation hierarchy is based upon the transparency of inputs to the valuation of an asset or liability as of the measurement date. The three levels are defined as follows:
|
|
·
|
Level 1: inputs to the valuation methodology are quoted prices (unadjusted) for identical assets or liabilities in active markets.
|
|
|
·
|
Level 2: inputs to the valuation methodology include quoted prices for similar assets and liabilities in active markets, and inputs that are observable for the asset or liability, either directly or indirectly, for substantially the full term of the asset or liability.
|
Inputs include the following:
|
|
·
|
quoted prices for similar assets or liabilities in active markets;
|
|
|
·
|
quoted prices for identical or similar assets or liabilities in non-active markets;
|
|
|
·
|
pricing models whose inputs are observable for substantially the full term of the asset or liability; and
|
|
|
·
|
pricing models whose inputs are derived principally from or corroborated by observable market data through correlation or other means.
|
|
|
·
|
Level 3: inputs to the valuation methodology are unobservable and significant to the fair value measurement.
|
A financial instrument’s categorization within the valuation hierarchy is based upon the lowest level of input that is significant to the fair value measurement.
Determination of fair value
Fair value is based upon quoted market prices, where available. If listed prices or quotes are not available, fair value is based upon internally developed models that use primarily market-based or independently sourced market parameters, including interest rate yield curves, option volatilities and currency rates. Valuation adjustments may be made to ensure that financial instruments are recorded at fair value. These adjustments include amounts to reflect counterparty credit quality, the Bank’s creditworthiness, liquidity and unobservable parameters that are applied consistently over time.
We consider that the accounting estimates related to the valuation of financial instruments, including derivatives, where quoted market prices are not available to be part of our critical accounting policies, as they are highly susceptible to change and require management to make assumptions about interest rates, volatility, exchange rates, the credit rating of the counterparty, valuation adjustments and specific features of the transactions.
We believe its valuation methods are appropriate and consistent with other market participants. The use of different methodologies, or assumptions, to determine the fair value of certain financial instruments could result in a different estimate of fair value at the reporting date.
Other-than-temporary impairment
Under U.S. GAAP, certain debt securities, including those securities issued or secured by the Colombian government, Colombian government entities or foreign governments, were classified as available-for-sale securities, and therefore, carried at fair value with changes in the fair value reflected in other comprehensive income for the years ended December 31, 2011 and 2010.
ASC 320 establishes a new method of recognizing and reporting other-than-temporary impairments of debt securities. Impairment is now considered to be other-than-temporary if an entity:
|
|
·
|
intends to sell the security;
|
|
|
·
|
is more likely than not to be required to sell the security before recovering its cost; or
|
|
|
·
|
does not expect to recover the security’s entire amortized cost basis (even if the entity does not intend to sell)—that is, a “credit loss.”
|
This credit loss is based on the present value of cash flows expected to be collected from the debt security. If a credit loss exists but an entity does not intend to sell the impaired debt security and is more likely than not to not be required to sell before recovery, the impairment is other-than-temporary. It should, therefore, be separated into:
|
|
·
|
the estimated amount relating to the credit loss; and
|
|
|
·
|
all other changes in fair value.
|
Only the estimated credit loss amount is recognized in profit or loss; the remaining change in fair value is recognized in “Other comprehensive income.” This approach more closely aligns the impairment models for debt securities and loans by reflecting only credit losses as impairment in profit and loss.
The fair value of debt securities was determined on the balance sheet date, based primarily on the quoted market price, and in limited cases, bond valuation models are used. These models take into consideration certain assumptions in estimating future cash flows and a rate under which the cash flows are discounted.
At December 31, 2011 and 2010 the amortized cost exceeded the fair value of these securities. Nevertheless, we have determined, for U.S. GAAP purposes, that unrealized losses on these securities are temporary in nature based on our ability and intent to hold the investment for a period of time sufficient to allow for any anticipated recovery and the results of our review conducted to identify and evaluate investments that have indications of possible impairments.
Impairment of goodwill and intangibles recognized upon business combinations.
At least annually, we test goodwill and intangibles recognized upon business combinations for impairment. We use a two-step process: (1) we screen for potential impairment using an estimation of the fair value of the reporting unit; and (2) we measure the amount of impairment, if any. Management determines fair value either by reference to market value, if available, by a pricing model or with the assistance of a qualified evaluator. Any determination of fair value through a pricing model or by a qualified evaluator requires management to make assumptions and use estimates. In certain circumstances, the requirement to test goodwill for impairment annually can be satisfied without a remeasurement of the fair value of a reporting unit.
The estimated fair value of the reporting unit is highly sensitive to changes in these estimates and assumptions; therefore, in some instances, changes in these assumptions could impact whether the fair value of a reporting unit is greater than its carrying value. We perform sensitivity analyses around these assumptions in order to assess the reasonableness of the assumptions and the resulting estimated fair values. Ultimately, future potential changes in these assumptions may impact the estimated fair value of a reporting unit and cause the fair value of the reporting unit to be below its carrying value.
We consider the accounting practice of impairment testing to be part of our critical accounting policies because it involves a significant degree of estimates and assumptions that must be considered and due to the fact that valuation models are highly sensitive to changes in these assumptions and estimates.
Recognition and measurement of intangibles recognized upon business combinations
Under U.S. GAAP, we use the purchase method of accounting to account for acquired businesses. This requires us to record the assets acquired and liabilities assumed at their respective fair values at the date of acquisition. This process requires us to make certain estimates and assumptions, in particular concerning the fair values of the acquired intangible assets and property, plant and equipment, and the liabilities assumed at the date of the acquisition.
We also determine the useful lives of the acquired intangible assets, property, plant and equipment. Judgments as to purchase price allocation can materially impact our future results and so, for large acquisitions, we may obtain third-party valuations. We use different valuation methodologies for each intangible asset and base our valuation on information available at the acquisition date.
We consider these recognitions and measurements of intangibles to be part of our critical accounting policies because of the high level of estimation and assumptions that must be made.
Pension plans
Under U.S. GAAP, specifically ASC 715-30, pension plan actuarial valuation is determined annually based on the projected unit credit method and is based on actuarial, economic and demographic assumptions about future events.
We consider the accounting estimates related to our pension plans to be part of our critical accounting policies as the amounts contributed to the plans involve certain assumptions and determinations made by our actuaries relating to, among others, future macroeconomic and employee demographics factors, which will not necessarily coincide with the future outcome of such factors.
Deferred income tax assets and liabilities
Income taxes are accounted for under the asset and liability method. Deferred income tax assets and liabilities are recorded for the estimated future tax effects of temporary differences between the carrying amounts of assets and liabilities recorded for accounting and tax reporting purposes and for the future tax effects of net operating loss carryforwards. Deferred tax assets and liabilities are measured using enacted tax rates expected to apply to taxable income in the years in which those temporary differences are expected to be recovered or settled. The effect on deferred tax assets and liabilities of a change in tax rates is recognized in income in the period that includes the enactment date. We recognize a valuation allowance for a deferred tax asset if it is more likely than not that some portion or all of the deferred tax assets will not be realized. We achieve a tax benefit only if we have sufficient taxable income in future periods against which we can apply the above-mentioned carryforward.
Beginning with the adoption of FASB Interpretation No. 48, “Accounting for Uncertainty in Income Taxes (included in FASB ASC Subtopic 740 10 – Income Taxes – Overall”), at January 1, 2009, we recognize the effect of income tax positions only if those positions are more likely than not to be sustained. Recognized income tax positions are measured at the largest amount that is greater than 50% likely of being realized. Changes in recognition or measurement are reflected in the period in which the change in judgment occurs. Prior to the adoption of Interpretation 48, we recognized the effect of income tax positions only if such positions were likely to be sustained.
We review estimated future taxable income and reversals of existing temporary taxable differences in determining valuations allowances. When calculating deferred tax, we take into account our future estimates, financial statements, applicable tax legislation and interpretations of the Colombian tax authorities.
We consider the determination of deferred income tax assets and liabilities to be part of our critical accounting policies as it involves estimates of future taxable income, which can be affected, among others, by economic conditions and changes to tax regulations.
Recent U.S. GAAP pronouncements
In January 2010, the FASB issued Update No. 2010-02, “Accounting and Reporting for Decreases in Ownership of a Subsidiary—a Scope Clarification” (“2010-02”), an update of ASC 810 “Consolidation.” The objective of ASU 2010-02 is to address implementation issues related to changes in ownership provisions. This ASU clarifies that the scope of the decreases in ownership provisions within ASC Topic 810-10 and related guidance applies to decreases in ownership of a subsidiary or group of assets that is a business or nonprofit, a subsidiary that is transferred to an equity method investee or joint venture and an exchange of a group of assets that constitutes a business or nonprofit activity to a non-controlling interest including an equity method investee or a joint venture. The effect of the adoption of this standard did not have any material impact on Grupo Aval’s financial position, results of operations or operating cash flows.
On March 5, 2010, the FASB issued Accounting Standards Update 2010-11, “Scope Exception Related to Embedded Credit Derivatives,” to clarify and amend the accounting for credit derivatives embedded in beneficial interests in securitized financial assets. Currently, certain credit derivative features embedded in beneficial interests in securitized financial assets are not accounted for as derivatives. The new guidance eliminates the scope exception for embedded credit derivatives (except for those that are created solely by subordination) and provides new guidance on the evaluation to be performed. Bifurcation and separate recognition may be required for certain beneficial interests that are currently not accounted for at fair value through earnings. The new guidance became effective the first day of the first fiscal quarter beginning after June 15, 2010 (e.g., the first day of the third quarter of 2010 for calendar year-end companies), with early adoption permitted. At adoption, a company may make a one-time election to apply the fair value option on an instrument-by-instrument basis for any beneficial interest in securitized financial assets. As of December 31, 2011, Grupo Aval has not identified any embedded credit derivatives requiring disclosure.
ASU 2010-06, “Fair Value Measurements and Disclosures (Topic 820): Improving Disclosures about Fair Value Measurements” was issued in January 2010 to add additional disclosures about the different classes of assets and liabilities measured at fair value, the valuation techniques and inputs used, the activity in Level 3 fair value measurements and the transfers between Levels 1, 2 and 3. Those aspects of this disclosure standard required at December 31, 2011 did not have a material impact on the Company’s consolidated financial statements but affected disclosure presented elsewhere herein. The disclosure about purchases, sales, issuances and settlements in the rollforward of activity in level 3 fair value measurements was deferred until fiscal years beginning after December 15, 2010 and did not significantly affect the Company’s consolidated financial statements at December 31, 2011.
In July 2010, the FASB issued ASU No. 2010-20, “Receivables (Topic 310): Disclosures about the Credit Quality of Financing Receivables and the Allowance for Credit Losses.” ASU 2010-20 is intended to provide additional information to assist users of financial statement in assessing an entity’s credit risk exposures and evaluating the adequacy of its allowance for credit losses. The disclosures as of the end of a reporting period are effective for interim and annual reporting periods ending on or after December 15, 2010. The disclosures about activity that occurs during a reporting period are effective for interim and annual reporting periods beginning on or after December 15, 2010. The amendments in ASU 2010-20 encourage, but do not require, comparative disclosures for earlier reporting periods that ended before initial adoption. However, an entity should provide comparative disclosures for those reporting periods ending after initial adoption. The adoption of this guidance did not have a material impact on the Company’s financial statements.
In August 2010, the FASB issued ASU 2010-21, “Accounting for Technical Amendments to Various SEC Rules and Schedules.” This ASU amends Release No. 33-9026: Technical Amendments to Rules, Forms, Schedules, and Codification of Financial Reporting Policies and did not have a significant impact on the Company’s financial statements at December 31, 2011.
In August 2010, the FASB issued ASU 2010-22, “Technical Corrections to SEC Paragraphs – An announcement made by the staff of the U.S. Securities and Exchange Commission.” This ASU amends various SEC paragraphs based on external comments received and the issuance of SAB 112, which amends or rescinds portions of certain SAB topics and did not have a significant impact on the Company’s financial statements at December 31, 2011.
In December 2010, the FASB issued ASU 2010-28, “When to Perform Step 2 of the Intangibles-Goodwill and Others,” to provide guidance on when to perform Step 2 of the goodwill impairment test for reporting units with zero or negative carrying amounts. This amendment to ASC 350 is effective for annual reporting periods beginning after December 15, 2010 for public companies. Transition requirements specify that companies must perform the Step 2 test on adoption for reporting units with a zero or negative carrying amount for which qualitative factors exist that indicate it is more likely than not that a goodwill impairment exists. Any resulting impairment charge would be recorded through a cumulative-effect adjustment to beginning retained earnings. This amendment did not have a material impact on the Company at December 31, 2011.
In January 2011, the FASB issued ASU 2011-01, “Deferral of the Effective Date of Disclosures about Troubled Debt Restructurings in Update No. 2010-20.” This ASU temporarily delays the effective date of the disclosures about troubled debt restructurings in Update 2010-20 for public entities. The delay was intended to allow the FASB time to complete its deliberations on what constitutes a troubled debt restructuring, and was resolved with the issuance of ASU 2011-02.
In April 2011, the FASB issued ASU 2011-02, Receivables (Topic 310), “A Creditor’s Determination of Whether a Restructuring Is a Troubled Debt Restructuring.” The amendments in this update provide additional guidance and clarification to help creditors determine whether a creditor has granted a concession and whether a debtor is experiencing financial difficulties for purposes of determining whether a restructuring constitutes a troubled debt restructuring. The amendments in this update became effective for the first interim or annual reporting period beginning on or after June 15, 2011, and they should be applied retrospectively to the beginning annual period of adoption. As a result of these amendments, an entity may identify receivables that are newly considered impaired. For purposes of measuring impairment of those receivables, an entity should apply the amendments prospectively for the first interim or annual period beginning on or after June 15, 2011. The adoption of this guidance did not have a material impact on the Company’s financial statements.
ASU 2011-03 concerns the improvement of accounting-for-repurchase agreements (repos) and other agreements that both entitle and require a transferor to repurchase or redeem financial assets before their maturity by amending the criteria for determining effective control of collateral. The guidance is effective for fiscal quarters and years beginning on or after December 15, 2011. Grupo Aval does not expect any significant effect from the adoption of this new standard.
In May 2011, the FASB issued ASU 2011-04, “Amendments to Achieve Common Fair Value Measurement and Disclosure Requirements in U.S. GAAP and IFRS.” The amendments in this update result in common fair value measurement and disclosure requirements in U.S. GAAP and IFRS. Consequently, the amendments change the wording used to describe many of the requirements in U.S. GAAP for measuring fair value and for disclosing information about fair value measurements. The amendments in this update are to be applied prospectively. For public entities, the amendments are effective during interim and annual periods beginning after December 15, 2011. For nonpublic entities, the amendments are effective for annual periods beginning after December 15, 2011. Early application by public entities is not permitted. This ASU is not expected to have a significant impact on the Company’s financial statements.
In June 2011, the FASB issued ASU 2011-05, “Presentation of Comprehensive Income.” The amendments in this update improve the comparability, clarity, consistency and transparency of financial reporting and increase the prominence of items reported in other comprehensive income. To increase the prominence of items reported in other comprehensive income and to facilitate convergence of U.S. GAAP and IFRS, the option to present components of other comprehensive income as part of the statement of changes in stockholders’ equity was eliminated. The amendments require that all non-owner changes in stockholders’ equity be presented either in a single continuous statement of comprehensive income or in two separate but consecutive statements. In the two-statement approach, the first statement should present total net income and its components should be followed consecutively by a second statement that should present total other comprehensive income, the components of other comprehensive income and the total of comprehensive income. All entities that report items of comprehensive income, in any period presented, will be affected by the changes in this update. For public entities, the amendments are effective for fiscal years, and interim periods within those years, beginning after December 15, 2011. For nonpublic entities, the amendments are effective for fiscal years ending after December 15, 2012, and interim and annual periods thereafter. The amendments in this update should be applied retrospectively and early adoption is permitted. This ASU is not expected to have a significant impact on the Company’s financial statements.
In September 2011, the FASB issued ASU 2011-08, “Intangibles – Goodwill and Other Topics (Topic 350), Testing Goodwill for Impairment.” The objective of this update is to simplify how entities, both public and nonpublic, test goodwill for impairment. The amendments in the update permit an entity to first assess qualitative factors to determine whether it is more likely than not that the fair value of a reporting unit is less than its carrying amount as a basis for determining whether it is necessary to perform the two-step goodwill impairment test described in Topic 350. The more-likely-than-not threshold is defined as having a likelihood of more than 50 percent. Under the amendments in this update, an entity is not required to calculate the fair value of a reporting unit unless the entity determines that it is more likely than not that its fair value is less than its carrying amount. The amendments in this update apply to all entities, both public and nonpublic, that have goodwill reported in their financial statements. The amendments are effective for interim and annual goodwill impairment tests performed for fiscal years beginning after December 15, 2011. Early adoption is permitted, including for annual and interim goodwill impairment tests performed as of a date before September 15, 2011, if an entity’s financial statements for the most recent annual or interim period have not yet been issued or, for nonpublic entities, have not yet been made available for issuance. This ASU is not expected to have a significant impact on the Company’s financial statements.
In December 2011, FASB issued ASU 2011-12, “Deferral of the Effective Date for Amendments to the Presentation of Reclassifications of Items Out of Accumulated Other Comprehensive Income in Accounting Standards Update No. 2011-05” to effectively defer only those changes in update 2011-05 that relate to the presentation of reclassification adjustments out of accumulated other comprehensive income. The amendments will be temporary to allow the Board time to redeliberate the presentation requirements for reclassifications out of accumulated other comprehensive income for annual and interim financial statements for public, private and non-profit entities. All other requirements in update 2011-05 are not affected by this update, including the requirement to report comprehensive income either in a single continuous financial statement or in two separate but consecutive financial statements. Public entities should apply these requirements for fiscal years, and interim periods within those years, beginning after December 15, 2011.
The following table sets forth our internal and external sources of funding at December 31, 2011, 2010 and 2009.
|
At December 31,
|
||||||||||||
|
2011
|
2010
|
2009
|
||||||||||
|
(in Ps billions)
|
||||||||||||
|
Liabilities and shareholders’ equity:
|
||||||||||||
|
Deposits
|
71,007.6 | 63,669.3 | 49,348.5 | |||||||||
|
Bankers’ acceptances outstanding
|
123.3 | 59.2 | 41.6 | |||||||||
|
Interbank borrowings and overnight funds
|
3,225.1 | 2,477.4 | 2,753.7 | |||||||||
|
Borrowings from banks and others
|
11,437.8 | 10,491.2 | 3,854.9 | |||||||||
|
Accounts payable
|
3,093.9 | 2,243.5 | 1,518.5 | |||||||||
|
Accrued interest payable
|
313.0 | 247.4 | 269.1 | |||||||||
|
Other liabilities
|
1,793.5 | 1,542.0 | 950.7 | |||||||||
|
Long-term debt (bonds)
|
6,566.2 | 5,952.4 | 3,422.2 | |||||||||
|
Estimated liabilities
|
855.3 | 596.9 | 711.6 | |||||||||
|
Non-controlling interest
|
4,927.0 | 4,475.5 | 4,038.0 | |||||||||
|
Total liabilities
|
103,342.7 | 91,754.7 | 66,908.8 | |||||||||
|
Total shareholders’ equity
|
8,159.1 | 4,554.6 | 4,084.3 | |||||||||
|
Total liabilities and shareholders’ equity
|
111,501.9 | 96,309.3 | 70,993.1 | |||||||||
In 2010, the Superintendency of Finance modified the classification criteria for derivatives. Derivatives were previously required to be shown net of liabilities, under assets in the Bankers’ acceptances, spot transactions and derivatives financial instruments line item. They are now shown gross, as assets and liabilities, and the liabilities are added in the Bankers’ acceptances and derivatives financial instruments line item. Pursuant to these rules and for the purposes of this section, derivatives (liabilities) are excluded from the Bankers’ acceptances outstanding line item and are included under “Other liabilities.”
Capitalization ratios
The following table presents consolidated capitalization ratios for our banking subsidiaries, Grupo Aval and our principal
competitors
at December 31, 2011.
|
At December 31, 2011
|
||||||||||||||||||||||||||||||||||||
|
Grupo Aval entities
|
||||||||||||||||||||||||||||||||||||
|
Colombian Banking GAAP
|
Banco de Bogotá
|
Banco de Occidente
|
Banco Popular
|
Banco AV Villas
|
Aggregate (1)
|
Grupo Aval consolidated
|
Bancolombia
|
Davivienda
|
BBVA Colombia
|
|||||||||||||||||||||||||||
|
(in percentages)
|
||||||||||||||||||||||||||||||||||||
|
Tangible equity ratio (2)
|
10.0 | 13.5 | 13.6 | 12.3 | 11.4 | 9.2 | 9.9 | 10.3 | 8.3 | |||||||||||||||||||||||||||
|
Tier 1 ratio (3)
|
12.0 | 8.7 | 9.1 | 12.5 | 11.0 | – | 9.0 | 11.4 | 9.5 | |||||||||||||||||||||||||||
|
Solvency ratio (4)
|
13.3 | 10.1 | 11.7 | 14.2 | 12.6 | – | 12.5 | 14.4 | 12.3 | |||||||||||||||||||||||||||
Source: Company calculations based on each entity’s respective financial statements for the period indicated.
|
(1)
|
Reflects the summation of calculated amounts for each line item for each of our banking subsidiaries.
|
|
(2)
|
Tangible equity ratio is calculated as total shareholders’ equity plus minority interest minus goodwill, divided by total assets minus goodwill. See “Item 3. Key Information—A. Selected financial data—Non-GAAP measures reconciliation.”
|
|
(3)
|
Tier 1 ratio is calculated as primary capital divided by risk-weighted assets.
|
|
(4)
|
Solvency ratio is calculated as technical capital divided by risk-weighted assets. For a definition of technical capital,
|
|
|
see “Item 4. Information on the Company—B. Business overview—Supervision and regulation—Capital adequacy requirements.”
|
|
|
Tangible solvency ratio differs from solvency ratio. Tangible solvency ratio is calculated as technical capital minus goodwill, divided by risk-weighted assets minus goodwill. The tangible solvency ratios for the following entities at December 31, 2011 were: Banco de Bogotá 9.3%, Banco de Occidente 9.9%, Banco Popular 11.7%, Banco AV Villas 14.2%, Grupo Aval (aggregate) 10.0%, Bancolombia 11.7%, Davivienda 11.3% and BBVA Colombia 10.5%.
|
Each of our banking subsidiaries is required by the Superintendency of Finance to maintain a solvency ratio of at least 9.0% of its total risk-weighted assets. As Grupo Aval is not regulated as a financial institution or bank holding company, it is not required to comply with capital adequacy regulations applicable to our banking subsidiaries. The following tables set forth reported and as-adjusted capital adequacy information for each of our banking subsidiaries at December 31, 2011 and 2010. The reported figures are calculated using the methodology prescribed by the Superintendency of Finance, which requires that we subtract investments in non-consolidated entities from our regulatory capital. The as-adjusted amounts have been adjusted not to subtract non-controlling interest in financial institutions, which are consolidated in other Grupo Aval subsidiaries at December 31, 2011 and 2010 (principally Banco de Bogotá’s non-controlling interest held through Corficolombiana in Banco de Occidente at December 31, 2010; Banco de Occidente’s investment in Corficolombiana and Porvenir, consolidated into Grupo Aval through Banco de Bogotá; and Banco Popular’s stake in Corficolombiana, consolidated into Grupo Aval through Banco de Bogotá). Management uses these as-adjusted amounts when reviewing the capitalization of our banking subsidiaries in part because we believe that the inclusion of such investments presents a more comprehensive picture of our capitalization.
The following tables present consolidated capitalization ratios for our banking subsidiaries at December 31, 2011 and 2010. For a reconciliation of these capitalization ratios to Colombian Banking GAAP, “Item 4. Information on the Company—B. Business overview—Industry—Supervision and regulation—Capital adequacy requirements.”
|
Banco de Bogotá (Consolidated)
|
At December 31, 2011
|
At December 31, 2010
|
||||||||||||||||||||||||||||||
|
Reported
|
As-adjusted
|
Reported
|
As-adjusted (2)
|
|||||||||||||||||||||||||||||
|
Amount
|
Ratio
|
Amount
|
Ratio
|
Amount
|
Ratio
|
Amount
|
Ratio
|
|||||||||||||||||||||||||
|
(Ps billions, except percentages)
|
(Ps billions, except percentages)
|
|||||||||||||||||||||||||||||||
|
Primary capital (Tier I)
|
7,175 | 12.0 | % | 7,401 | 12.3 | % | 4,497.1 | 8.9 | % | 4,769.4 | 9.4 | % | ||||||||||||||||||||
|
Secondary capital (Tier II)
|
823 | 1.4 | % | 826 | 1.4 | % | 3,137.5 | 6.2 | % | 3,140.6 | 6.2 | % | ||||||||||||||||||||
|
Primary and secondary capital
(Tier I and II)
|
7,998 | 13.3 | % | 8,227 | 13.7 | % | 7,634.5 | 15.1 | % | 7,910.0 | 15.5 | % | ||||||||||||||||||||
|
Risk-weighted assets including regulatory value at risk (1)
|
59,961 | – | 60,189 | – | 50,663.7 | – | 50,937.1 | – | ||||||||||||||||||||||||
|
(1)
|
Regulatory value at risk is calculated in accordance with the Superintendency of Finance guidelines, see “Item 4. Information on the Company—B. Business overview—Supervision and regulation—Capital adequacy requirements.”
|
|
(2)
|
Adjusted to reflect non-consolidated interests in Leasing de Occidente. In June 2010, Banco de Occidente and Leasing de Occidente merged.
|
|
Banco de Occidente (Consolidated)
|
At December 31, 2011
|
At December 31, 2010
|
||||||||||||||||||||||||||||||
|
Reported
|
As-adjusted (2)
|
Reported
|
As-adjusted (2)
|
|||||||||||||||||||||||||||||
|
Amount
|
Ratio
|
Amount
|
Ratio
|
Amount
|
Ratio
|
Amount
|
Ratio
|
|||||||||||||||||||||||||
|
(Ps billions, except percentages)
|
(Ps billions, except percentages)
|
|||||||||||||||||||||||||||||||
|
Primary capital (Tier I)
|
1,568 | 8.7 | % | 2,003 | 10.9 | % | 1,196.0 | 8.0 | % | 1,557.2 | 10.2 | % | ||||||||||||||||||||
|
Secondary capital (Tier II)
|
239 | 1.3 | % | 565 | 3.1 | % | 302.0 | 2.0 | % | 631.3 | 4.1 | % | ||||||||||||||||||||
|
Primary and secondary capital
(Tier I and II)
|
1,808 | 10.1 | % | 2,567 | 14.0 | % | 1,498.0 | 10.0 | % | 2,188.6 | 14.3 | % | ||||||||||||||||||||
|
Risk-weighted assets including regulatory value at risk (1)
|
17,947 | – | 18,390 | – | 14,921.2 | – | 15,290.3 | – | ||||||||||||||||||||||||
|
(1)
|
Regulatory value at risk is calculated in accordance with the Superintendency of Finance guidelines, see “Item 4. Information on the Company—B. Business overview—Supervision and regulation—Capital adequacy requirements.”
|
|
(2)
|
Adjusted to reflect non-consolidated interests in Porvenir and Corficolombiana.
|
|
Banco Popular (Consolidated)
|
At December 31, 2011
|
At December 31, 2010
|
||||||||||||||||||||||||||||||
|
Reported
|
As-adjusted (2)
|
Reported
|
As-adjusted (2)
|
|||||||||||||||||||||||||||||
|
Amount
|
Ratio
|
Amount
|
Ratio
|
Amount
|
Ratio
|
Amount
|
Ratio
|
|||||||||||||||||||||||||
|
(Ps billions, except percentages)
|
(Ps billions, except percentages)
|
|||||||||||||||||||||||||||||||
|
Primary capital (Tier I)
|
1,095 | 9.1 | % | 1,181 | 9.7 | % | 921.4 | 8.4 | % | 990.8 | 9.0 | % | ||||||||||||||||||||
|
Secondary capital (Tier II)
|
311 | 2.6 | % | 451 | 3.7 | % | 380.1 | 3.5 | % | 522.8 | 4.7 | % | ||||||||||||||||||||
|
Primary and secondary capital
(Tier I and II)
|
1,405 | 11.7 | % | 1,632 | 13.5 | % | 1,301.4 | 11.8 | % | 1,513.6 | 13.7 | % | ||||||||||||||||||||
|
Risk-weighted assets including regulatory value at risk (1)
|
12,047 | – | 12,134 | – | 10,998.5 | – | 11,067.9 | – | ||||||||||||||||||||||||
|
(1)
|
Regulatory value at risk is calculated in accordance with the Superintendency of Finance guidelines, see “Item 4. Information on the Company—B. Business overview—Supervision and regulation—Capital adequacy requirements.”
|
|
(2)
|
Adjusted to reflect non-consolidated interests in Corficolombiana.
|
|
Banco AV Villas (Consolidated)
|
At December 31, 2011
|
At December 31, 2010
|
||||||||||||||
|
Reported
|
Reported
|
|||||||||||||||
|
Amount
|
Ratio
|
Amount
|
Ratio
|
|||||||||||||
|
Primary capital (Tier I)
|
700 | 12.5 | % | 598.8 | 12.1 | % | ||||||||||
|
Secondary capital (Tier II)
|
100 | 1.8 | % | 100.6 | 2.0 | % | ||||||||||
|
Primary and secondary capital (Tier I and II)
|
800 | 14.2 | % | 699.4 | 14.1 | % | ||||||||||
|
Risk-weighted assets including regulatory value at risk (1)
|
5,617 | – | 4,943.1 | – | ||||||||||||
|
(1)
|
Regulatory value at risk is calculated in accordance with the Superintendency of Finance guidelines, see “Item 4. Information on the Company—B. Business overview—Supervision and regulation—Capital adequacy requirements.”
|
Funding
Our banks fund most of their assets with local deposits, consistent with other Colombian banks. Other sources of funding include interbank borrowings and overnight funds, and borrowings from development banks and long-term bond issuances.
The following table summarizes the funding structure of our banks at the dates indicated.
|
At December 31,
|
||||||||||||
|
2011
|
2010
|
2009
|
||||||||||
|
(in Ps billions)
|
||||||||||||
|
Deposits
|
71,007.6 | 63,669.3 | 49,348.5 | |||||||||
|
Borrowings from banks and others
|
11,437.8 | 10,491.2 | 3,854.9 | |||||||||
|
Bankers’ acceptance outstanding
|
123.3 | 59.2 | 41.6 | |||||||||
|
Interbank borrowings and overnight funds
|
3,225.1 | 2,477.4 | 2,753.7 | |||||||||
|
Long-term debt (bonds)
|
6,566.2 | 5,952.4 | 3,422.2 | |||||||||
|
Total funding
|
92,360.0 | 82,649.4 | 59,420.9 | |||||||||
From year-end 2010 to year-end 2011, interbank borrowings and overnight funds increased as a percentage of total funding by 0.5 percentage points, while borrowings from banks and others and deposits decreased by 0.3 and 0.2 percentage points, respectively.
From year-end 2009 to year-end 2010, deposits decreased as a percentage of total funding by 6.0 percentage points, interbank borrowings and overnight funds decreased by 1.6 percentage points, borrowings from banks and others increased by 6.2 percentage points, and bonds increased by 1.4 percentage points.
In 2011 total funding increased by 11.7 percentage points from the same period in 2010, mainly as a result of an increase in deposits and in borrowings from banks and others. From year-end 2010 to year-end 2011 total deposits decreased as a percentage of total funding by 0.2 percentage points, from 77.0% to 76.9%, mainly due to an increase in interbank borrowings and overnight funds which increased from 3.0% of total funding in December 2010 to 3.5% in December 2011.
Our banks’ funding base also benefits from the highest available local credit ratings for each of our banking subsidiaries and each of Porvenir and Corficolombiana, as assigned by BRC Investor Services S.A. S.C.V., an affiliate of Moody’s Investors Services, Inc. Banco Popular and Banco AV Villas have also achieved the highest available local credit ratings as assigned by Value and Risk Rating S.A. S.C.V. In addition, Banco de Bogotá’s 5.00% Senior Notes due 2017 were rated Baa2 by Moody’s, BBB- by Fitch and BBB- by Standard and Poor’s at issuance, and Grupo Aval’s 5.25% Senior Notes due 2017 were rated Baa3 by Moody’s and BBB- by Fitch at issuance. Any adverse change in credit ratings may increase the cost of our funding. See “Item 3. Key Information—D. Risk factors—Risks relating to our businesses and industry—Risks relating to our banking business—Downgrades in our credit rating or in the credit ratings of our banking subsidiaries would increase the cost of, or impair access to, funding.”
We believe that our working capital is sufficient to meet the company’s present requirements and that the current level of funding of each of our banks is adequate to support its business.
The following table presents our consolidated funding from deposits at the dates indicated.
|
At December 31,
|
||||||||||||
|
2011
|
2010
|
2009
|
||||||||||
|
(in Ps billions)
|
||||||||||||
|
Interest-bearing deposits:
|
||||||||||||
|
Checking accounts
|
7,167.8 | 6,191.1 | 1,629.3 | |||||||||
|
Time deposits
|
22,630.5 | 18,615.0 | 16,144.2 | |||||||||
|
Savings deposits
|
27,912.0 | 26,021.2 | 21,313.7 | |||||||||
|
Total
|
57,710.2 | 50,827.4 | 39,087.2 | |||||||||
|
Non-interest-bearing deposits:
|
||||||||||||
|
Checking accounts
|
12,250.0 | 11,861.3 | 9,511.2 | |||||||||
|
Other deposits
|
1,047.4 | 980.6 | 750.1 | |||||||||
|
Total
|
13,297.4 | 12,841.9 | 10,261.3 | |||||||||
|
Total deposits
|
71,007.6 | 63,669.3 | 49,348.5 | |||||||||
Checking accounts.
Our consolidated balance of checking accounts was Ps 19,417.8 billion at December 31, 2011, Ps 18,052.4 billion at December 31, 2010 and Ps 11,140.5 billion at December 31, 2009, representing 21.0%, 21.8% and 18.7% of total funding, respectively. The decrease in total funding share of deposits was primarily due to a lower growth rate of checking accounts and an increase in total funding share of interbank borrowing and overnight funds.
Time deposits.
Our consolidated balance of time deposits was Ps 22,630.5 billion at December 31, 2011, Ps 18,615.0 billion at December 31, 2010 and Ps 16,144.2 billion at December 31, 2009, representing 24.5%, 22.5% and 27.2% of total funding, respectively.
The following table presents time deposits held at December 31, 2011, by amount and maturity for deposits.
|
At December 31, 2011
|
||||||||||||
|
Peso-denominated
|
Foreign currency-denominated
|
Total
|
||||||||||
|
(in Ps billions)
|
||||||||||||
|
Up to 3 months
|
3,607.4 | 3,247.2 | 6,854.5 | |||||||||
|
From 3 to 6 months
|
1,878.0 | 1,084.2 | 2,962.2 | |||||||||
|
From 6 to 12 months
|
4,114.2 | 1,453.1 | 5,567.3 | |||||||||
|
More than 12 months
|
3,404.2 | 610.2 | 4,014.4 | |||||||||
|
Time deposits less than U.S.$100,000 (1)
|
2,317.7 | 914.4 | 3,232.1 | |||||||||
|
Total
|
15,321.5 | 7,309.0 | 22,630.5 | |||||||||
|
(1)
|
Equivalent to Ps 194.3 million at the representative market rate at December 31, 2011.
|
Savings deposits.
Our consolidated balance of savings deposits was Ps 27,912.0 billion at December 31, 2011, Ps 26,021.2 billion at December 31, 2010 and Ps 21,313.7 billion at December 31, 2009, representing 30.2%, 31.5% and 35.9% of total funding, respectively.
Other deposits.
Our consolidated balance of other deposits, which consist of deposits from correspondent banks, cashier checks and collection services, was Ps 1,047.4 billion at December 31, 2011, Ps 980.6 billion at December 31, 2010 and Ps 750.1 billion at December 31, 2009, representing 1.1%, 1.2% and 1.3%, respectively.
Interbank borrowings and overnight funds.
Our consolidated balance of interbank borrowings and overnight funds was Ps 3,225.1 billion at December 31, 2011, Ps 2,477.4 billion at December 31, 2010 and Ps 2,753.7 billion at December 31, 2009, representing 3.5%, 3.0% and 4.6% of total funding, respectively.
The following table sets forth our short-term borrowings consisting of interbank borrowings for the periods indicated.
|
At December 31,
|
||||||||||||||||||||||||
|
2011
|
2010
|
2009
|
||||||||||||||||||||||
|
Amount
|
Nominal
rate
|
Amount
|
Nominal
rate
|
Amount
|
Nominal
rate
|
|||||||||||||||||||
|
(in Ps billions, except percentages)
|
||||||||||||||||||||||||
|
Short-term borrowings
|
||||||||||||||||||||||||
|
Interbank borrowings and overnight funds
|
||||||||||||||||||||||||
|
End of period
|
3,225.1 | – | 2,477.4 | – | 2,753.7 | – | ||||||||||||||||||
|
Average during period
|
4,279.6 | 3.4 | % | 3,955.4 | 2.5 | % | 2,377.7 | 4.7 | % | |||||||||||||||
|
Maximum amount of borrowing at any month-end
|
5,977.3 | – | 6,884.8 | – | 3,619.1 | – | ||||||||||||||||||
|
Interest paid during the period
|
146.9 | – | 99.0 | – | 111.7 | – | ||||||||||||||||||
As part of their interbank transactions, our banks maintain a portfolio of government securities and private sector liquid debt instruments used to obtain overnight funds from other financial institutions or investment funds by selling such securities and simultaneously agreeing to repurchase them. Due to the short-term nature of this source of funding, these transactions are volatile and are generally composed of Colombian government securities.
Borrowings from banks and others.
Borrowings from banks are provided by correspondent banks and by governmental entities to promote lending to specific sectors of the Colombian economy. This funding, which mainly has fully matched maturities and interest rates with related loans, totaled 11,437.8 billion at December 31, 2011, Ps 10,491.2 billion at December 31, 2010 and Ps 3,854.9 billion at December 31, 2009, representing 12.4%, 12.7% and 6.5% of total funding, respectively.
Bankers’ acceptances outstanding.
Our consolidated bankers’ acceptances outstanding balance was Ps 123.3 billion at December 31, 2011, Ps 59.2 billion at December 31, 2010 and Ps 41.6 billion at December 31, 2009, representing 0.1%, 0.1% and 0.1%, of total funding, respectively.
Bonds.
We issue bonds in the Colombian markets. Our consolidated balance of bonds outstanding was Ps 6,566.2 billion at December 31, 2011, Ps 5,952.4 billion at December 31, 2010 and Ps 3,422.2 billion at December 31, 2009, representing 7.1%, 7.2% and 5.8% of total funding, respectively. On December 19, 2011 Banco de Bogotá issued U.S.$600 million (Ps 1,165.6 billion) of its 5.00% Senior Notes due 2017 in the international markets.
The following bond issuances were placed in the Colombian market in 2011:
|
Issuer
|
Issuance date
|
Amount
|
Expiration date
|
Interest rate
|
||||
|
(in Ps billions, unless otherwise indicated)
|
||||||||
|
Banco de Bogotá S.A.
|
2011
|
1,165.6
|
January 2017
|
5.00%
|
||||
|
Banco de Occidente S.A.
|
2011
|
400.0
|
March 2014 to March 2016
|
IPC + 2.49% to IPC + 3.05% to 6.65% to 7.25%
|
||||
|
Banco de Occidente S.A.
|
2011
|
247.1
|
September 2014 to September 2021
|
IPC + 4.0% to IBR + 1.80%
|
||||
|
Banco Popular S.A.
|
2011
|
400.0
|
February 2013 to August 2015
|
IPC + 7.0%
|
||||
|
Banco de América Central
|
2011
|
30.9
|
January 2012 to December 2016
|
4.00% to 4.25%
|
||||
|
BAC Credomatic Guatemala
|
2011
|
164.8
|
January 2012 to December 2012
|
4.65% to 8.69%
|
||||
On February 1, 2012, Grupo Aval
completed the Grupo Aval Debt Offering, consisting of U.S.$600 million of 5.25% Senior Notes due 2017.
Banco de Bogotá
For the year ended December 31, 2011, the proportion of total deposits in Banco de Bogotá’s total funding increased 2.3% due to a significant decrease in long-term debt. The decrease in long-term debt was due to the conversion of the Ps 2,285 billion of convertible bonds issued on November 19, 2010 offset by the issuance on December 19, 2011 of U.S.$600 million (Ps 1,165.6 billion) of 5.00% Senior Notes due 2017.
The following table presents the composition of Banco de Bogotá’s funding at the dates indicated.
|
Year ended December 31,
|
||||||||||||||||||||||||
|
2011
|
2010
|
2009
|
||||||||||||||||||||||
|
(in Ps billions)
|
%
|
(in Ps billions)
|
%
|
(in Ps billions)
|
%
|
|||||||||||||||||||
|
Checking accounts
|
12,510.6 | 22.4 | 11,004.6 | 21.8 | 5,167.1 | 17.8 | ||||||||||||||||||
|
Time deposits
|
15,450.3 | 27.7 | 12,774.7 | 25.4 | 9,137.5 | 31.4 | ||||||||||||||||||
|
Savings deposits
|
14,805.4 | 26.5 | 13,653.7 | 27.1 | 9,729.5 | 33.4 | ||||||||||||||||||
|
Other deposits
|
600.2 | 1.1 | 559.3 | 1.1 | 347.9 | 1.2 | ||||||||||||||||||
|
Total deposits
|
43,366.5 | 77.7 | 37,992.3 | 75.4 | 24,382.0 | 83.8 | ||||||||||||||||||
|
Interbank and overnight funds
|
2,507.2 | 4.5 | 1,789.1 | 3.6 | 2,224.0 | 7.6 | ||||||||||||||||||
|
Borrowings from banks and other
|
7,680.8 | 13.8 | 7,094.2 | 14.1 | 1,850.0 | 6.4 | ||||||||||||||||||
|
Bankers’ acceptance outstanding
|
85.3 | 0.2 | 39.2 | 0.1 | 28.3 | 0.1 | ||||||||||||||||||
|
Long-term debt (includes convertible bonds)
|
2,174.8 | 3.9 | 3,460.7 | 6.9 | 616.5 | 2.1 | ||||||||||||||||||
|
Total other funding
|
12,448.0 | 22.3 | 12,383.2 | 24.6 | 4,718.9 | 16.2 | ||||||||||||||||||
|
Total funding
|
55,814.5 | 100.0 | 50,375.6 | 100.0 | 29,100.9 | 100.0 | ||||||||||||||||||
Banco de Occidente
Checking accounts, which have historically constituted an important proportion of funding for Banco de Occidente, decreased by 7.6% for the year ended December 31, 2011, from 34.4% at December 31, 2010. This decrease was due to a 3.4% increase in interbank and overnight funds a 2.6% increase in savings deposits and a 1.7% increase in long-term debt.
For the year ended December 31, 2011, the proportion of total deposits in Banco de Occidente’s total funding decreased by 4.6% to 76.1%. For the year ended December 31, 2010, the proportion of total deposits in Banco de Occidente’s total funding increased 0.2% primarily due to a decrease in borrowings from banks and others.
The following table presents the composition of Banco de Occidente’s funding at the dates indicated.
|
Year ended December 31,
|
||||||||||||||||||||||||
|
2011
|
2010
|
2009
|
||||||||||||||||||||||
|
(in Ps billions)
|
%
|
(in Ps billions)
|
%
|
(in Ps billions)
|
%
|
|||||||||||||||||||
|
Checking accounts
|
4,897.7 | 26.8 | 5,301.5 | 34.4 | 4,426.1 | 29.0 | ||||||||||||||||||
|
Time deposits
|
3,002.7 | 16.4 | 2,463.7 | 16.0 | 3,219.2 | 21.1 | ||||||||||||||||||
|
Savings deposits
|
5,729.0 | 31.3 | 4,436.1 | 28.8 | 4,434.0 | 29.0 | ||||||||||||||||||
|
Other deposits
|
291.1 | 1.6 | 240.2 | 1.6 | 228.9 | 1.5 | ||||||||||||||||||
|
Total deposits
|
13,920.5 | 76.1 | 12,441.4 | 80.7 | 12,308.2 | 80.5 | ||||||||||||||||||
|
Interbank and overnight funds
|
628.6 | 3.4 | 12.8 | 0.1 | 31.2 | 0.2 | ||||||||||||||||||
|
Borrowings from banks and other
|
1,701.8 | 9.3 | 1,522.6 | 9.9 | 1,578.9 | 10.3 | ||||||||||||||||||
|
Bankers’ acceptance outstanding
|
36.3 | 0.2 | 18.5 | 0.1 | 12.6 | 0.1 | ||||||||||||||||||
|
Long-term debt (bonds)
|
1,995.6 | 10.9 | 1,421.1 | 9.2 | 1,355.7 | 8.9 | ||||||||||||||||||
|
Total other funding
|
4,362.3 | 23.9 | 2,975.0 | 19.3 | 2,978.4 | 19.5 | ||||||||||||||||||
|
Total funding
|
18,282.7 | 100.0 | 15,416.4 | 100.0 | 15,286.6 | 100.0 | ||||||||||||||||||
Banco Popular
In, 2011, Banco Popular decreased its proportion of deposits to total funding by 0.7%. This decrease was primarily due to a decrease in savings deposits by 3.5%. This was partially offset by a 2.5% increase in time deposits.
The following table presents the composition of Banco Popular’s funding at the dates indicated.
|
Year ended December 31,
|
||||||||||||||||||||||||
|
2011
|
2010
|
2009
|
||||||||||||||||||||||
|
(in Ps billions)
|
%
|
(in Ps billions)
|
%
|
(in Ps billions)
|
%
|
|||||||||||||||||||
|
Checking accounts
|
1,493.3 | 13.3 | 1,270.6 | 12.6 | 1,170.9 | 13.1 | ||||||||||||||||||
|
Time deposits
|
1,916.5 | 17.0 | 1,460.1 | 14.5 | 2,030.4 | 22.7 | ||||||||||||||||||
|
Savings deposits
|
5,751.2 | 51.1 | 5,497.9 | 54.6 | 5,050.9 | 56.5 | ||||||||||||||||||
|
Other deposits
|
94.3 | 0.8 | 119.6 | 1.2 | 129.4 | 1.4 | ||||||||||||||||||
|
Total deposits
|
9,255.3 | 82.3 | 8,348.1 | 83.0 | 8,381.6 | 93.8 | ||||||||||||||||||
|
Interbank and overnight funds
|
– | 0.0 | 2.9 | – | – | – | ||||||||||||||||||
|
Borrowings from banks and other
|
539.2 | 4.8 | 309.5 | 3.1 | 252.7 | 2.8 | ||||||||||||||||||
|
Bankers’ acceptance outstanding
|
1.5 | 0.0 | 1.4 | – | 0.7 | – | ||||||||||||||||||
|
Long-term debt (bonds)
|
1,451.5 | 12.9 | 1,400.0 | 13.9 | 300.0 | 3.4 | ||||||||||||||||||
|
Total other funding
|
1,992.1 | 17.7 | 1,713.8 | 17.0 | 553.4 | 6.2 | ||||||||||||||||||
|
Total funding
|
11,247.4 | 100.0 | 10,061.9 | 100.0 | 8,934.9 | 100.0 | ||||||||||||||||||
Banco AV Villas
Historically, Banco AV Villas has had a small proportion of checking accounts to total funding, as it only began providing checking services when it was converted into a commercial bank in 2002.
In 2011, the proportion of savings deposits and time deposits to total funding increased by 7.2 and 3.0 percentage points, respectively, as compared to December 31, 2010. However, the proportion of checking accounts, which historically has had a small proportion of total funding, decreased by 0.4 of a percentage point. During the year ended December 31, 2011, the proportion of total deposits in Banco AV Villas’ total funding increased 9.7% due to a decrease in interbank and overnight funds.
The following table presents the composition of Banco AV Villas’ funding at the dates indicated.
|
Year ended December 31,
|
||||||||||||||||||||||||
|
2011
|
2010
|
2009
|
||||||||||||||||||||||
|
(in Ps billions)
|
%
|
(in Ps billions)
|
%
|
(in Ps billions)
|
%
|
|||||||||||||||||||
|
Checking accounts
|
535.2 | 8.4 | 513.3 | 8.7 | 388.3 | 7.7 | ||||||||||||||||||
|
Time deposits
|
2,279.5 | 35.6 | 1,921.8 | 32.7 | 1,758.0 | 34.7 | ||||||||||||||||||
|
Savings deposits
|
3,286.0 | 51.3 | 2,598.5 | 44.2 | 2,275.7 | 44.9 | ||||||||||||||||||
|
Other deposits
|
61.8 | 1.0 | 61.6 | 1.0 | 50.3 | 1.0 | ||||||||||||||||||
|
Total deposits
|
6,162.5 | 96.3 | 5,095.1 | 86.6 | 4,472.3 | 88.3 | ||||||||||||||||||
|
Interbank and overnight funds
|
108.5 | 1.7 | 675.3 | 11.5 | 498.4 | 9.8 | ||||||||||||||||||
|
Borrowings from banks and other
|
128.9 | 2.0 | 113.6 | 1.9 | 96.1 | 1.9 | ||||||||||||||||||
|
Bankers’ acceptance outstanding
|
0.2 | – | – | – | – | – | ||||||||||||||||||
|
Total other funding
|
237.5 | 3.7 | 788.9 | 13.4 | 594.5 | 11.7 | ||||||||||||||||||
|
Total funding
|
6,400.0 | 100.0 | 5,884.1 | 100.0 | 5,066.8 | 100.0 | ||||||||||||||||||
Capital expenditures
Grupo Aval incurred Ps 225.5 billion of capital expenditures in property, plant and equipment in 2011, an increase from Ps 259.5 billion in 2010 and from Ps 234.2 billion in 2009.
Other than our technology program, we do not have any significant policies or projects relating to research and development, and we own no patents or licenses.
See
“Item 4. Information on the Company—B. Business overview—Other corporate information—Technology.”
For a discussion of Trend information, see “
—
A. Operating results
—
Principal factors affecting our financial condition and results of operations.”
In the ordinary course of business, our banks have entered into various types of off-balance sheet arrangements, including lines and letters of credit and financial guarantees. Our banks utilize these instruments to meet their customers’ financing needs. The contractual amount of these instruments represents the maximum possible credit risk should the counterparty draw down the entire commitment or our bank fulfill its entire obligation under the guarantees, and the counterparty subsequently fails to perform according to the terms of the contract. Our banks may hold cash or other liquid collateral to support these commitments, and our banks generally have legal recourse to recover amounts paid but not recovered from customers under these instruments. Most of these commitments and guarantees expire undrawn. As a result, the total contractual amount of these instruments does not represent our future credit exposure or funding requirements. In addition, some of these commitments, primarily those related to consumer financing, are cancelable by our banks upon notice.
The following table presents the maximum potential amount of future payments under these instruments at the dates presented for Grupo Aval on a consolidated basis.
|
At December 31,
|
||||||||||||
|
(in Ps billions)
|
||||||||||||
|
Grupo Aval
|
2011
|
2010
|
2009
|
|||||||||
|
Unused credit card limits
|
9,538.8 | 8,859.9 | 3,269.2 | |||||||||
|
Civil demands against our banks
|
646.4 | 559.6 | 346.4 | |||||||||
|
Issued and confirmed letters of credit
|
638.1 | 513.6 | 233.0 | |||||||||
|
Unused lines of credit
|
2,807.0 | 2,734.3 | 1,627.5 | |||||||||
|
Bank guarantees
|
1,906.6 | 1,718.1 | 1,202.0 | |||||||||
|
Approved credits not disbursed
|
2,013.5 | 1,573.6 | 1,421.9 | |||||||||
|
Other
|
2,190.5 | 742.0 | 904.4 | |||||||||
|
Total
|
19,740.9 | 16,701.1 | 9,004.4 | |||||||||
The following table presents our contractual obligations at December 31, 2011.
|
At December 31, 2011
|
||||||||||||||||||||
|
Payments due by period
|
||||||||||||||||||||
|
Grupo Aval
|
Total
|
Less than
1 year
|
1-3 years
|
3-5 years
|
After 5 years
|
|||||||||||||||
|
(in Ps billions)
|
||||||||||||||||||||
|
Liabilities:
|
||||||||||||||||||||
|
Long-term debt obligations (1)
|
6,566.2 | 809.6 | 2,423.7 | 1,154.7 | 2,178.2 | |||||||||||||||
|
Time deposits
|
22,630.5 | 16,755.0 | 4,744.3 | 516.8 | 614.4 | |||||||||||||||
|
Long-term borrowings from banks and others
|
11,437.8 | 3,740.4 | 3,983.8 | 1,565.7 | 2,147.9 | |||||||||||||||
|
Repurchase agreements
|
3,019.8 | 3,019.8 | – | – | – | |||||||||||||||
|
Employee benefit plans
|
299.0 | 30.8 | 63.7 | 68.0 | 136.5 | |||||||||||||||
|
Total
|
43,953.3 | 24,355.7 | 11,215.5 | 3,305.1 | 5,076.9 | |||||||||||||||
Board of directors
The board of directors of Grupo Aval is composed of seven principal members and seven alternate members, each of whom serves a one-year term and may be reelected indefinitely. The term for the current directors expires on March 31, 2013. It is our practice that the President of each of our banking subsidiaries is appointed as a member of our board of directors.
The current members of the board of directors were appointed at a shareholders’ meeting held on December 7, 2010 and have been re-elected at subsequent shareholders’ meetings. The following table presents the names of the current principal and alternate members of the board of directors.
|
Board member
|
Alternate
|
|
|
Luis Carlos Sarmiento Angulo
|
José Hernán Rincón Gómez
|
|
|
Alejandro Figueroa Jaramillo
|
Juan María Robledo Uribe
|
|
|
Efraín Otero Álvarez
|
Juan Camilo Ángel Mejía
|
|
|
Mauricio Cárdenas Müller
|
Gabriel Mesa Zuleta
|
|
|
Guillermo Fernández de Soto Valderrama (1)
|
Álvaro Velásquez Cock
|
|
|
Antonio José Urdinola Uribe (1) (2) (3)
|
Enrique Mariño Esguerra (3)
|
|
|
Esther América Paz Montoya (1) (2) (3)
|
Germán Villamil Pardo (3)
|
|
(1)
|
Member of the Audit committee.
|
|
(2)
|
Independent director under SEC Audit Committee rules.
|
|
(3)
|
Independent director under Colombian requirements.
|
Luis Fernando Pabón Pabón is the secretary of our board.
Biographical information of the principal members of our board of directors and the secretary of our board is set forth below.
Luis Carlos Sarmiento Angulo
, age 79, has served as the Chairman of the board of directors of Grupo Aval since 1999. Mr. Sarmiento Angulo is the founder and controlling shareholder of Grupo Aval and, since 1985, has served as a member of the board of directors of Organización Luis Carlos Sarmiento Angulo Ltda., an affiliate of our controlling shareholder. Since 2010 he has served as principal member of the Board of Directors of Casa
Editorial El Tiempo and of CEET TV. He also serves as Chairman of the board of directors of four not-for-profit entities: Asociación Nacional de Instituciones Financieras – ANIF, Fundación para el Futuro de Colombia – Colfuturo; Fundación Grupo Aval and Fundación Luis Carlos Sarmiento Angulo, through which he is sponsoring, among other initiatives, Grameen Aval Colombia, a microfinance not-for-profit organization established in association with Grameen Trust of Bangladesh. He holds a degree in Civil Engineering from Universidad Nacional de Colombia. He is the father of the President of Grupo Aval, Mr. Luis Carlos Sarmiento Gutiérrez. Mr. Sarmiento Angulo’s business address is Carrera 13 No. 26A–47, Bogotá D.C., Colombia.
Alejandro Figueroa Jaramillo
, age 70, has served as a principal member on the board of directors of Grupo Aval since 1999. Mr. Figueroa Jaramillo has been the President of Banco de Bogotá since 1988. He has been employed with Banco de Bogotá since 1978, where he also served as Executive Vice President and Vice President of Finance. He is the Chairman of the board of directors of Porvenir and has been a board member of Porvenir since 1991. He has also been a member of the board of directors of Corficolombiana since 1998 and of Fundación Grupo Aval since 2011. He previously served as Vice-Minister of Economic Development of Colombia and President of Almaviva S.A., Banco de Bogotá’s bonded warehouse. He holds a degree in Civil Engineering from Facultad de Minas de la Universidad Nacional in Antioquia and a Master of Science degree in Economics from Harvard University. Mr. Figueroa Jaramillo’s business address is Calle 35 No. 7–47, Bogotá, D.C., Colombia.
Efraín Otero Álvarez
, age 63, has served as a principal member on the board of directors of Grupo Aval since 1999. Mr. Otero Álvarez has been the President of Banco de Occidente since 1995. He has been employed with Banco de Occidente since 1973, where he also served as Vice President of Finance and Executive Vice President. He has also served as a member of the boards of directors of Porvenir since 1995, of Corficolombiana since 1998, of Banco de Occidente – Panama since 2006 and of Fundación Grupo Aval since 2011. He previously worked as an economist at Corporación Autónoma del Valle del Cauca. He holds a degree in Economics and a Master’s degree in Industrial Engineering, both from the Universidad del Valle. Mr. Otero Álvarez’s business address is Carrera 4 No. 7–61, Cali, Colombia.
Mauricio Cárdenas Müller
, age 42, has served as a principal member on the board of directors of Grupo Aval since 2010, and previously as an alternate member thereof since 2002. Mr. Cárdenas Müller has acted as chief advisor to the President of Organización Luis Carlos Sarmiento Angulo Ltda. and as advisor to the Chairman and the President of Grupo Aval since 2004. He served as a member of the board of directors of Seguros Alfa S.A. and of Seguros de Vida Alfa S.A. from 2002 until 2011, and he serves as a member of the board of directors of Fundación para el Futuro de Colombia – Colfuturo since 2007, of Porvenir since 2008, of Empresa de Energía de Bogotá ESP since 2010 and of Casa Editorial El Tiempo and CEET TV since 2011. He holds a degree in Electrical Engineering from Universidad Javeriana and a Master’s degree in Business Administration from Escuela de Dirección y Negocios de la Universidad de la Sabana – INALDE. Mr. Cárdenas Müller’s business address is Carrera 13 No. 26A–47, Bogotá D.C., Colombia.
Guillermo Fernández de Soto Valderrama
, age 58, has served as a principal member on the board of directors of Grupo Aval since 2008. Mr. Fernández de Soto Valderrama has acted as Executive Secretary of Grupo de Río, President of the Chamber of Commerce of Bogotá, Chancellor of Colombia, Secretary General of the Andean Community of Nations and Ambassador of Colombia to The Netherlands. He has also served as a member of the board of directors of the Corficolombiana since 2008 and of Porvenir since 2010. He holds degrees in Law and Economics from Universidad Javeriana. Mr. Fernández de Soto Valderrama’s business address is Calle 86 No. 10-88 Oficina 202, Bogotá D.C., Colombia.
Antonio José Urdinola Uribe
, age 72, has served as a principal member on the board of directors of Grupo Aval since 2006. Mr. Urdinola Uribe is a private advisor. He has acted as Minister of Finance of Colombia, President of Empresa Colombiana de Petróleos – Ecopetrol, President of Instituto Colombiano de Comercio Exterior – Incomex and advisor to the World Bank, the United Nations, Corporación Andina de Fomento and the Government of Colombia. He has also been a member of the boards of directors of, among other entities, Valorem S.A. since 2005 and Empresa de Energía de Bogotá ESP since 2008. Mr. Urdinola Uribe holds a degree in Economics from the Universidad de los Andes and a diploma in Political Science from the London School of Economics. Mr. Urdinola Uribe’s business address is Carrera 13 No. 26A–47, Bogotá D.C., Colombia.
Esther América Paz Montoya
, age 57, has served as a principal member on the board of directors of Grupo Aval since 2010, and previously as an alternate member thereof since 2005. Ms. Paz Montoya is a former President of Banco AV Villas, where she also served as Vice President of Finance and Vice President of Operations, and a former President of Ahorramás Corporación de Ahorro y Vivienda. She holds a degree in Business Administration from the Universidad del Valle. Ms. Paz Montoya’s business address is Carrera 13 No. 26A–47, Bogotá D.C., Colombia.
Biographical information of the alternate members of our board of directors is set forth below.
José Hernán Rincón Gómez
, age 83, has served as an alternate member of the board of directors of Grupo Aval since 2010 and previously as a principal member thereof since 2005. Mr. Rincón Gómez has been the President of Banco Popular since 1991. He has also served as a member of the board of directors of Corficolombiana since 1998 and of Fundación Grupo Aval since 2011. He is the former President of, among other entities, Banco Comercial Antioqueño (the predecessor to Banco Santander Colombia), Avianca (airline company) and Banco del Estado. He holds a degree in Economics from the Universidad de Antioquia and is qualified as a public accountant. Mr. Rincón Gómez’s business address is Calle 17 No. 7–43, Bogotá D.C., Colombia.
Juan María Robledo Uribe
, age 67, has served as an alternate member on the board of directors of Grupo Aval since 2000. Mr. Robledo Uribe has acted as Executive Vice President of Banco de Bogotá from 1990 to 1992, from 1993 to 2001 and since 2003. He has been employed with Banco de Bogotá for over 40 years, where he has also served as Vice President of Banking Services and Vice President of Commercial Banking. He has been a member of the board of directors of Corficolombiana from 1993 to 2001 and since 2006, of Fidubogotá since 2007, of Porvenir since 1991 and of Fundación Grupo Aval since 2011. He holds a degree in Economics from the Universidad del Rosario. He is also the former President of Banco del Comercio (which merged into Banco de Bogotá in 1992) and of Corficolombiana from 2003 until 2005. Mr. Robledo Uribe’s business address is Calle 35 No. 7–47, Bogotá D.C., Colombia.
Juan Camilo Ángel Mejía
, age 46, has served as an alternate member on the board of directors of Grupo Aval since 2008. Mr. Ángel Mejía has been the President of Banco AV Villas since 2007, and previously acted as its Vice President of Credit and Portfolio, Vice President of Asset Regularization and Vice President of Real Estate. Previously he was an advisor in the Offerings Department of Banco Central Hipotecario and Project Manager in the Capital Markets division of Corfinsura. He has also been a member of the board of directors of Asociación Bancaria de Colombia since 2007, of Titularizadora Colombiana S.A. since 2008 and of Fundación Grupo Aval since 2011. He holds a degree in Civil Engineering from the Universidad de Medellín. Mr. Ángel Mejía’s business address is Carrera 13 No. 26A–47, Bogotá D.C., Colombia.
Gabriel Mesa Zuleta
, age 45, has served as an alternate member on the board of directors of Grupo Aval since 2004. Mr. Mesa Zuleta has been the President of Sadinsa S.A. since 2003 and a member of the board of directors of Banco Popular since 2004, of Seguros Alfa S.A. since 2004 and of Seguros de Vida Alfa S.A. since 2004. He previously acted as Director of the Administrative Department of the President of the Republic of Colombia and as President of Empresa de Telecomunicaciones de Colombia–Telecom. He holds a law degree from the Universidad del Rosario. Mr. Mesa Zuleta’s business address is Carrera 13 No. 26–45, Bogotá D.C., Colombia.
Álvaro Velásquez Cock
, age 72, has served as an alternate member on the board of directors of Grupo Aval since 2008. Mr. Velásquez Cock has served as advisor to Grupo Ethuss since 1994. He has acted as Dean of the Faculty of Economics of the Universidad de Antioquia, Chief of the Departamento Nacional de Estadística–DANE, President of Pedro Gómez & Cía. S.A. and as a member of the Advisory Committee of the Superintendency of Finance. He has been a member of the board of directors of Banco de Bogotá since 2001, of Banco de Bogotá – Panama since 1984, of Corficolombiana since 1992 and of Unipalma since 1996. He holds a degree in Economics from the Universidad de Antioquia. Mr. Velásquez Cock’s business address is Calle 69 No. 9–58, Bogotá D.C., Colombia.
Enrique Mariño Esguerra
, age 86, has served as an alternate member on the board of directors of Grupo Aval since 2006. Mr. Mariño Esguerra is a manager and partner of Ingeniería CEISA. He is a former member of the board of directors of Corporación de Ahorro y Vivienda AV Villas (the predecessor to Banco AV Villas), Cemento Samper S.A., Seguros Alfa S.A. and Seguros de Vida Alfa S.A. He holds a degree in Civil Engineering from the
Universidad Nacional. Mr. Mariño Esguerra’s business address is Avenida Carrera 19 No. 135–30, Bogotá D.C., Colombia.
Germán Villamil Pardo
, age 52, has served as an alternate member on the board of directors of Grupo Aval since 2010 and previously as a principal member thereof since 2006. Mr. Villamil Pardo is a partner of Gómez Pinzón Zuleta Abogados S.A. He previously held several positions in the Ministry of Finance of Colombia as well as in Banco de la República. He holds a law degree with a specialty in tax from the Universidad de los Andes. Mr. Villamil Pardo’s business address is Calle 67 No. 7–35 Oficina 1204, Bogotá D.C., Colombia.
Luis Fernando Pabón Pabón
, age 53, has served as Secretary of the Board of Grupo Aval since 2000. Mr. Pabón Pabón formerly served as Legal Vice President of Banco de Colombia and as Legal Counsel to the President of Banco de Bogotá. He has been a member of the board of directors of Banco AV Villas S.A. since 1998, of Porvenir since 2003, of Almaviva S.A. since 2007, of Organización Luis Carlos Sarmiento Angulo Ltda. since 2006 and of Casa Editorial El Tiempo and CEET TV since 2011. He also serves as legal counsel to Organización Luis Carlos Sarmiento Angulo Ltda. Mr. Pabón Pabón holds a law degree from Universidad Javeriana and a specialization in financial law from the Universidad de los Andes. Mr. Pabón Pabón’s business address is Carrera 13 No. 26A–47, Bogotá D.C., Colombia.
Executive officers
The executive officers of Grupo Aval are responsible for the day-to-day management of our company. The executive officers serve until removed. Although the Presidents of Corficolombiana, Porvenir and BAC Credomatic are not represented in the board of directors or the management of Grupo Aval, they are key individuals in our group’s merchant banking, pension management and Central American businesses.
The following table lists the names and positions of our executive officers and the presidents of our banking subsidiaries, Porvenir and Corficolombiana. Certain of our executive officers are also members of the boards of directors of our subsidiaries.
|
Name
|
Position
|
|
|
Grupo Aval
|
||
|
Luis Carlos Sarmiento Gutiérrez
|
President
|
|
|
Diego Fernando Solano Saravia
|
Chief Financial Officer
|
|
|
Diego Rodríguez Piedrahita
|
Chief Risk Management Officer
|
|
|
Julio Leonzo Álvarez Álvarez
|
Chief Technology Officer
|
|
|
Javier Díaz Fajardo
|
Vice President of Investor Relations
|
|
|
Edgar Enrique Lasso Fonseca
|
Vice President of Corporate Planning
|
|
|
María Edith González Flórez
|
Vice President of Accounting
|
|
|
Rafael Eduardo Neira Torres
|
Vice President of Internal Control
|
|
|
María José Arango Caicedo
|
Vice President of Corporate Services
|
|
|
Banco de Bogotá
|
||
|
Alejandro Figueroa Jaramillo
|
President
|
|
|
Banco de Occidente
|
||
|
Efraín Otero Álvarez
|
President
|
|
|
Banco Popular
|
||
|
José Hernán Rincón Gómez
|
President
|
|
|
Banco AV Villas
|
||
|
Juan Camilo Ángel Mejía
|
President
|
|
|
Corficolombiana
José Elías Melo Acosta
|
President
|
|
Name
|
Position
|
|
|
Porvenir
Miguel Largacha Martínez
|
President
|
|
|
BAC Credomatic
Ernesto Castegnaro
|
President
|
Biographical information of our executive officers and key employees who are not directors is set forth below.
Luis Carlos Sarmiento Gutiérrez
, age 50, has acted as President of Grupo Aval since 2000. Mr. Sarmiento Gutiérrez acted as President of Cocelco S.A. from 1997 until 2000. Previously he served as Executive Vice President at First Bank of the Americas in New York and as an analyst and financial manager at Procter & Gamble’s corporate headquarters. He has been the Chairman of the board of directors of Banco de Bogotá since 2004 of Corficolombiana since 2006 and is a member of the Board of Directors of Empresa de Energía de Bogotá ESP since 2010. He holds a Bachelor of Science degree, magna cum laude, in civil engineering from the University of Miami and a Master’s degree in Business Administration with a concentration in Finance from the Johnson Graduate School of Management at Cornell University. Mr. Sarmiento Gutiérrez is the son of the Chairman of the board of directors of Grupo Aval, Mr. Sarmiento Angulo. Mr. Sarmiento Gutiérrez’s business address is Carrera 13 No. 26A–47, Bogotá D.C., Colombia.
Diego Fernando Solano Saravia
, age 46, has acted as Chief Financial Officer, and formerly as Vice President of Corporate Planning, of Grupo Aval since 2006. Mr. Solano Saravia has been a member of the boards of directors of Porvenir and Gas Natural S.A. since 2009. He previously served as associate principal at McKinsey & Co. and Corporate Vice President at Banco Santander Colombia. He holds a degree in Systems Engineering from the Universidad de los Andes and a Master’s degree in Business Administration from the Wharton School at the University of Pennsylvania. His business address is Carrera 13 No. 26A–47, Bogotá D.C., Colombia.
Diego Rodríguez Piedrahita
, age 53, has acted as Chief Risk Management Officer of Grupo Aval since 1999. Mr. Rodríguez Piedrahita previously worked at Bank of America and ING. He has been the Chairman of the board of directors of Banco AV Villas since 2004 and a board member thereof since 2000. He has also been a member of the board of directors of Fidubogotá since 2000 and of Organización Luis Carlos Sarmiento Angulo Ltda. since 2006. He holds a Bachelor’s degree in Business Management and a Master in Business Administration from George Washington University. Mr. Rodríguez Piedrahita’s business address is Carrera 13 No. 26A–47, Bogotá D.C., Colombia.
Julio Leonzo Álvarez Álvarez
, age 65, has acted as Chief Technology Officer, and formerly as Vice President of Corporate Systems, of Grupo Aval since 1998. Mr. Álvarez Álvarez has acted as President of Avianca (airline company), Cervecería Unión S.A. (beverage company) and Pedro Gómez & Cía (construction company). He has been a member of the board of directors of A Toda Hora S.A. – ATH since 2005, of Porvenir since 2001 and of Banco Popular since 1996. He holds a degree in civil engineering from the Universidad Nacional de Colombia with studies in the Higher Management Program, INALDE – Universidad de la Sabana, Postgraduate Program in Financial Management – Universidad de Medellín, and Postgraduate Program in Statistics Applied to Engineering – Universidad Nacional de Colombia. Mr. Álvarez Álvarez’s business address is Carrera 13 No. 26A–47, Bogotá, D.C., Colombia.
Javier Díaz Fajardo
, age 41, has acted as Vice President of Investor Relations of Grupo Aval since 2010. Mr. Díaz Fajardo acted as Managing Director of Andes Capital LLC from 2007 until 2009. Previously he served as Chief Counsel of the Multilateral Investment Fund, a trust administered by the Inter-American Development Bank, and as associate at the law firms of Cárdenas & Cárdenas in Bogotá, Colombia and Cleary, Gottlieb, Steen & Hamilton in New York, New York. He holds a law degree from Universidad de los Andes and a Master’s in International Business from The Fletcher School at Tufts University. Mr. Díaz Fajardo’s business address is Carrera 13 No. 26A–47, Bogotá D.C., Colombia.
Edgar Enrique Lasso Fonseca
, age 55, has acted as Vice President of Corporate Planning of Grupo Aval since 2008. Mr. Lasso Fonseca held several positions at the Superintendency of Finance, including Delegate for Financial Intermediaries from 1995 until 2007. He previously worked as corporate analyst at Banco de Bogotá. He holds a degree in Economics from Universidad Externado de Colombia and in Banking Management from the Universidad de los Andes. Mr. Lasso Fonseca’s business address is Carrera 13 No. 26A–47, Bogotá D.C., Colombia.
María Edith González Flórez
, age 53, has acted as Vice President of Accounting, and formerly as Financial and Administrative Manager, of Grupo Aval since 2004. Ms. González Flórez previously worked as Financial Manager at Cocelco S.A. and Movistar. She holds a degree in Public Accounting from the Universidad de Santiago de Cali and a Finance specialty from Universidad ICESI. She has been a member of the board of directors of Casa de Bolsa S.A. since 2010. Ms. González Flórez’s business address is Carrera 13 No. 26A–47, Bogotá D.C., Colombia.
Rafael Eduardo Neira Torres
, age 56, has acted as Comptroller of Grupo Aval since 2009. Mr. Neira Torres acted as Deputy Financial Superintendent, and formerly as Adjunct Financial Superintendent, at the Superintendency of Finance from 2006 to 2008. He previously worked as Operations Vice President at Banco Davivienda. He holds a degree in Accounting from the Universidad Jorge Tadeo Lozano and in Banking Management from the Universidad de los Andes. Mr. Neira Torres’ business address is Carrera 13 No. 26A–47, Bogotá D.C., Colombia.
María José Arango Caicedo
, age 46, has acted as Vice President of Corporate Services of Grupo Aval since 2000. She previously worked as Commercial Manager of Cocelco S.A., as Electronic Banking Manager at Banco de Occidente and as Project Manager in Fanalca. She has been a member of the board of directors of Corporación Publicitaria de Colombia S.A. since 2002. She holds a degree in Systems Engineering from Universidad ICESI and a Master’s degree in Business Administration from the Universidad del Valle. Her business address is Carrera 13 No. 26A–47, Bogotá D.C., Colombia.
José Elías Melo Acosta
, age 52, has served as President of Corficolombiana since 2008. Mr. Melo Acosta previously served as President of Megabanco from 1999 to 2006, of Banco del Estado in 1999 and of Confederación de Cooperativas de Colombia from 1994 to 1998. He has also served in several positions within the Colombian government including as Minister of Employment and Social Security, Superintendent of Finance, Vice Minister of Finance and Public Credit and Secretary of the Monetary Board of the Banco de la República. He is a member of the board of directors of Fundación Grupo Aval since 2011. He holds a law degree with specialty in socioeconomic sciences from Universidad Javeriana. His business address is Carrera 13 No. 26–45, Bogotá D.C., Colombia.
Miguel Largacha Martínez
, age 48, has served as President of Porvenir since 2008. Mr. Largacha Martínez previously served as President of BBVA Horizonte Pensiones y Cesantías, and held other positions within BBVA Colombia S.A., including Executive Vice President and Legal Vice President of Banco Ganadero (the predecessor to BBVA Colombia S.A.) and has been a member of the board of directors of Fundación Grupo Aval since 2011. He holds a law degree from Universidad Javeriana and has further completed postgraduate studies in Financial Legislation and Executive Management at the Universidad de los Andes. His business address is Carrera 13 No. 27–75, Bogotá D.C., Colombia.
Ernesto Castegnaro
, age 61, has served as President of BAC Credomatic since 1983. Mr. Castegnaro joined BAC Credomatic in 1976 and has over 30 years of experience managing credit card operations and over 25 years managing banking operations. He is also a director on the MasterCard Latin America Board of Directors. Mr. Castegnaro holds an MBA in Banking and Finance from INCAE and a Civil Engineering degree from the University of Costa Rica. His business address is Centro Corporativo Plaza Roble, Edificio Terrazas B, Escazú, San José, Costa Rica.
Our common shareholders must approve the compensation of our board of directors at the first semi-annual shareholders’ meeting of every calendar year.
Each member of our board of directors, including alternates, receives a fee based on attendance at each board of directors’ session. Members of our audit committee also receive an additional fee for attending audit committee meetings. For 2012, the board of directors’ session fee is Ps 1,575,000 and the audit committee session fee is
Ps 1,575,000. For 2011, the board of directors’ session fee was Ps 1,500,000 and the audit committee session fee was Ps 1,500,000.
We are not required under Colombian law to publish information regarding the compensation of our individual executive officers, and we do not make this information public. Our shareholders, however, can request this information before our semi-annual general shareholders’ meetings. The aggregate amount of compensation, inclusive of bonuses, that we and our subsidiaries paid to directors, alternate directors and executive officers was Ps 36.6 billion (U.S.$18.8 million) in 2011. We pay bonuses to our executive officers which vary according to each officer’s performance and the achievement of certain predefined goals, and, therefore, the amounts paid may vary for each officer.
We do not have, and have not had in the past, any share option plans.
Audit committee
Our audit committee currently consists of three members, appointed by the board of directors: Antonio José Urdinola Uribe, Guillermo Fernandez de Soto and Esther América Paz Montoya, all of whom are independent within the meaning of SEC corporate governance rules of independence for purposes of the audit committee. Mr. Urdinola Uribe is the chair of our audit committee. Pursuant to Colombian law, the audit committee must meet at least quarterly.
Our audit committee advises the board of directors generally on internal control matters, and it specifically undertakes to:
|
|
·
|
review financial statements prior to their submission to the board of directors and to the general shareholders’ meeting;
|
|
|
·
|
supervise the internal auditor to verify if its actions address the internal control needs of the company and to identify limitations with respect to its duties;
|
|
|
·
|
review all internal control reports of the company and supervise compliance with such reports by the company’s management;
|
|
|
·
|
issue its opinion on the independence of the external auditor, based on standards set forth by Colombian and U.S. regulations;
|
|
|
·
|
monitor the company’s levels of risk exposure at least every six months and propose mitigation measures as needed;
|
|
|
·
|
propose to the board of directors control systems to prevent, detect and adequately respond to the risk of fraud and improper conduct by company employees;
|
|
|
·
|
provide assistance to our board of directors in fulfilling its responsibilities with respect to our compliance with legal and regulatory requirements;
|
|
|
·
|
make recommendations to the general shareholders meeting concerning the engagement of the independent accounting firm; and
|
|
|
·
|
issue reports to the board of directors on matters deemed relevant.
|
Pursuant to regulations of the Superintendency of Finance, the audit committee has a charter approved by the board of directors, which sets forth the main aspects related to the operation of such committee, including, among others, its composition and duties.
At December 31, 2011, on a consolidated basis, we employed approximately 54,463 individuals, with 43,817 employees, 5,176 personnel provided by staffing service companies and 5,470 outside contractors.
The following table presents the approximate breakdown of the employees, personnel provided by staffing service companies and outside contractors of our banking subsidiaries, Porvenir, Corficolombiana and Grupo Aval (unconsolidated), at December 31, 2011.
|
Banco de Bogotá (1)(2)
|
Banco de Occidente (3)
|
Banco Popular (4)
|
Banco AV Villas (5)
|
Porvenir
|
Corficolombiana
|
BAC Credomatic
|
Grupo Aval (unconsolidated)
|
Total
|
||||||||||||||||||||||||||||
|
Employees
|
9,227 | 8,351 | 3,879 | 4,497 | 1,943 | 671 | 15,133 | 116 | 43,817 | |||||||||||||||||||||||||||
|
Personnel provided by staffing service companies
|
2,688 | 103 | 1,463 | 416 | 45 | 93 | 365 | 3 | 5,176 | |||||||||||||||||||||||||||
|
Outside contractors
|
2,360 | 548 | 1,072 | 1,247 | 131 | 107 | — | 5 | 5,470 | |||||||||||||||||||||||||||
|
Total
|
14,275 | 9,002 | 6,414 | 6,160 | 2,119 | 871 | 15,498 | 124 | 54,463 | |||||||||||||||||||||||||||
|
(1)
|
Excludes employees of Porvenir, Corficolombiana, BAC and their subsidiaries.
|
|
(2)
|
49.3% (3,757) of Banco de Bogotá’s direct employees (7,628) are represented by unions and 58.38% (4,453) of such employees are covered by collective bargaining agreements that expire in August 2012.
|
|
(3)
|
50.6% (3,454) of Banco de Occidente’s direct employees (6,828) are represented by unions and are covered by collective bargaining agreements that expire in December 2014.
|
|
(4)
|
29.0% (934) of Banco Popular’s direct employees (3,218) are represented by unions and 97.9% (3,151) of such employees are covered by collective bargaining agreements that expire in December 2014.
|
|
(5)
|
Less than 0.1% (2) of Banco AV Villas’ direct employees (3,954) are represented by unions.
|
Mr. Sarmiento Angulo beneficially owns 94.1% of our outstanding common shares and 62.6% of our preferred shares as determined under SEC rules at
April 25
, 2012. See “Item 7. Major Shareholders and Related Party Transactions—A. Major shareholders.” The following table provides the names of our other directors and key executive officers who owned shares of Grupo Aval at April 25, 2012.
|
Shareholder
|
Common shares
|
Percentage of outstanding common shares
|
Preferred shares
|
Percentage of outstanding preferred shares
|
||||||||||||
|
Alejandro Figueroa Jaramillo
|
557,695 | * | 1,538,460 | * | ||||||||||||
|
José Hernán Rincón Gómez
|
300,000 | * | 230,769 | * | ||||||||||||
|
Juan María Robledo Uribe
|
284,917 | * | 384,769 | * | ||||||||||||
|
Esther América Paz Montoya
|
251,718 | * | 423,076 | * | ||||||||||||
|
Efraín Otero Álvarez
|
102,729 | * | 300,000 | * | ||||||||||||
|
Gabriel Mesa Zuleta
|
80,645 | * | 30,769 | * | ||||||||||||
|
Luis Fernando Pabón Pabón
|
78,237 | * | 115,384 | * | ||||||||||||
|
Enrique Mariño Esguerra
|
49,687 | * | 38,461 | * | ||||||||||||
|
Diego Fernando Solano Saravia
|
49,586 | * | 152,078 | * | ||||||||||||
|
Julio Leonzo Álvarez Álvarez
|
41,952 | * | –– | * | ||||||||||||
|
Mauricio Cárdenas Müller
|
40,616 | * | 76,923 | * | ||||||||||||
|
Germán Villamil Pardo
|
33,058 | * | –– | * | ||||||||||||
|
María José Arango Caicedo
|
21,908 | * | 9,230 | * | ||||||||||||
|
Diego Rodríguez Piedrahita
|
16,528 | * | 49,847 | * | ||||||||||||
|
Álvaro Velásquez Cock
|
8,264 | * | 11,538 | * | ||||||||||||
|
Juan Camilo Ángel Mejía
|
7,319 | * | 22,666 | * | ||||||||||||
|
Miguel Largacha Martínez
|
— | * | 172,680 | * | ||||||||||||
|
José Elías Melo Acosta
|
— | * | 16,733 | * | ||||||||||||
|
Shareholder
|
Common shares
|
Percentage of outstanding common shares
|
Preferred shares
|
Percentage of outstanding preferred shares
|
||||||||||||
|
Javier Díaz Fajardo
|
— | * | 5,769 | * | ||||||||||||
|
Guillermo Fernández de Soto Valderrama
|
— | * | — | * | ||||||||||||
|
Antonio José Urdinola Uribe
|
— | * | — | * | ||||||||||||
|
Luis Carlos Sarmiento Gutiérrez
|
— | * | — | * | ||||||||||||
|
Edgar Enrique Lasso Fonseca
|
— | * | — | * | ||||||||||||
|
María Edith González Flórez
|
— | * | — | * | ||||||||||||
|
Rafael Eduardo Neira Torres
|
— | * | — | * | ||||||||||||
|
Ernesto Castegnaro
|
— | * | — | * | ||||||||||||
* less than 0.1%.
Mr. Luis Carlos Sarmiento Angulo controls Grupo Aval and was the beneficial owner of 85.9% of our issued and outstanding share capital at
April 25
, 2012. He retained 94.1% of our voting power by virtue of his beneficial ownership of 94.1% of our outstanding common shares, and beneficially owned 62.6% of our outstanding preferred shares, as determined under SEC rules, at
April 25
, 2012. Beneficial ownership is defined in Form 20-F and generally includes voting or investment power over securities. Percentage of beneficial ownership is based on 18,551,766,453 of our aggregate equity securities outstanding comprising of 13,719,081,181 common shares outstanding and 4,832,685,272 preferred shares outstanding at
April 25
, 2012.
On June 23, 2011, we closed the First Banco Popular Share Ownership Transaction and issued 2,073,115,004 preferred shares to the shareholders of Rendifin S.A. in exchange for 43.47% of the share capital of Banco Popular, raising Mr. Sarmiento Angulo’s beneficial ownership stake in our preferred shares to 56.9% and his beneficial ownership in Grupo Aval to 85.1%. On September 20, 2011, we closed the Second Banco Popular Share Ownership Transaction, in which Mr. Sarmiento Angulo beneficially acquired 934,669,126 preferred shares, raising his total ownership of outstanding preferred shares to approximately 63.8%, and approximately 85.9% of our total share capital. See “—B. Related party transactions—Other transactions with Mr. Sarmiento Angulo and his affiliates—Banco Popular share ownership reorganization.”
The principal shareholder, as a common shareholder, does not have any different or special voting rights in comparison to any other common shareholder.
The following table sets forth information, as of December 31, 2011, regarding the beneficial ownership of our equity securities by:
|
|
·
|
each person that is a beneficial owner of more than 5% of our outstanding equity securities;
|
|
|
·
|
all directors and executive officers as a group; and
|
|
|
·
|
other shareholders.
|
|
At December 31, 2011
|
||||||||||||||||
|
Principal beneficial owners
|
Common shares
|
Percentage of outstanding
common shares
|
Preferred shares
|
Percentage of outstanding preferred shares
|
||||||||||||
|
Luis Carlos Sarmiento Angulo
|
12,905,118,094 | 93.5 | % | 3,024,544,900 | 63.7 | % | ||||||||||
|
Other directors and officers as a group
|
1,924,859 | * | 3,579,152 | * | ||||||||||||
|
Other shareholders
|
899,648,287 | 6.5 | % | 1,716,951,161 | 36.2 | % | ||||||||||
|
Total
|
13,806,691,240 | 100.0 | % | 4,745,075,213 | 100.0 | % | ||||||||||
|
*
|
less than 0.1%.
|
To our knowledge, based on the registers maintained by Deceval, a Colombian registrar of companies, and our records, at March 30, 2012, there were 643 non-Colombian holders of our common
shares
, of which we believe there were at least 20 U.S. holders of our common shares and preferred shares as of March 30, 2012 who held in the aggregate less than 0.1% of our total shares outstanding.
We currently engage in, and expect from time to time in the future to engage in, financial and commercial transactions with “related parties” (within the meaning of the SEC rules). Unless otherwise indicated below, such transactions are conducted on an arm’s-length basis in the ordinary course of business, on terms that would apply to transactions with third parties.
Loans or deposits involving related parties
The following chart presents outstanding amounts of related party transactions involving loans or deposits between Grupo Aval and its consolidated subsidiaries, on one hand, and each of the following individuals and entities.
|
Transactions between Grupo Aval and its subsidiaries, and
|
||||||||||||||||
|
Grupo Aval’s directors and key management and their affiliates (1)
|
Close family members of Mr. Sarmiento Angulo and their affiliates
|
Mr. Sarmiento Gutiérrez and his affiliates
|
Mr. Sarmiento Angulo and his affiliates
|
|||||||||||||
|
(in Ps billions)
|
||||||||||||||||
|
At December 31, 2011
|
||||||||||||||||
|
Outstanding loans (2)
|
11.3 | 42.2 | 0.03 | 1,067 | ||||||||||||
|
Deposits (3)
|
10.2 | 9.3 | 0.2 | 3,548 | ||||||||||||
|
At December 31, 2010
|
||||||||||||||||
|
Outstanding loans (2)
|
7.0 | 22.5 | 0.1 | 1,094 | ||||||||||||
|
Deposits (3)
|
8.8 | 6.1 | 0.6 | 3,327 | ||||||||||||
|
(1)
|
Excludes Mr. Sarmiento Angulo and Mr. Sarmiento Gutiérrez and their affiliates. Key management includes executive officers of Grupo Aval as well as each of the presidents of our banks, Porvenir and Corficolombiana.
|
|
(2)
|
Includes loans approved but not yet disbursed. All outstanding loans are made in the ordinary course of business, and on terms and conditions not materially different from those available to the general public, including interest and collateral. See below “—Loans granted to related parties by our banking subsidiaries.”
|
|
(3)
|
All deposits, including time deposits and investment portfolios, of all related parties held with us are made in the ordinary course of business, held at market rates and on terms and conditions not materially different from those available to the general public.
|
For information on related party transactions in accordance with Colombian disclosure rules, see note 27 to our audited consolidated financial statements. Required Colombian disclosures as to related party transactions differ from those required by the SEC. For the purposes of note 27 to our audited consolidated financial statements, “related parties” includes the principal shareholders of Grupo Aval, members of the board of directors, individuals who are legal representatives of Grupo Aval and companies in which Grupo Aval, its principal shareholders or board members have a direct equity interest of at least 10.0%. For the purposes of this section, and as required by SEC rules, “related parties” includes enterprises that control, or are under common control with Grupo Aval, associates, individuals owning directly or indirectly an interest in the voting power that gives them significant influence over Grupo Aval, close family members, key management personnel (including directors and senior management) and any enterprises in which a substantial interest in the voting power is owned, directly or indirectly, by any of the persons listed above. We determine beneficial ownership under SEC rules. See “—A. Major shareholders.”
Certain members of our board of directors and key management own shares of Grupo Aval which, other than in the case of Mr. Sarmiento Angulo, were acquired in the open market and represent less than 0.1% of our total outstanding shares. On May 12, 2011, Grupo Aval concluded the Preferred Shares Local Offering in which it sold 1,600 million preferred shares, raising an aggregate amount of Ps 2.1 trillion (U.S.$1.1 billion at the representative market rate on such date), before deducting brokerage commissions and discounts, and transaction expenses. In connection with our Preferred Shares Local Offering, certain members of our board of directors and key management acquired preferred shares under the same conditions granted to the general public. See “Item 6. Directors, Senior Management and Employees—E. Share ownership.” We do not, and have not, offered or granted any share options to any of our directors or employees.
Loans granted to Grupo Aval and its subsidiaries by shareholders of Grupo Aval and their affiliates
Certain shareholders of Grupo Aval and their affiliates have granted loans to Grupo Aval and its subsidiaries on an arm’s-length basis. All loans are unsecured and have a five-year term, with a two-year grace period. The following are the outstanding loans granted to Grupo Aval by shareholders of Grupo Aval and their respective affiliates at April
25
, 2012:
|
|
·
|
loans granted by Bienes y Comercio S.A., a company beneficially owned by Mr. Sarmiento Angulo, to Grupo Aval between February 2010 and February 2012, with a total outstanding amount of Ps 166.7 billion (U.S.$85.8 million) at April
25
, 2012 at an interest rate of DTF + 3.0% per annum; and
|
|
|
·
|
loans granted by Adminegocios & Cía. S.C.A., an entity beneficially owned by Mr. Sarmiento Angulo, to Grupo Aval on February 2012, with a total outstanding amount of Ps 8.3 billion (U.S.$4.3 million) at April
25
, 2012, at an interest rate of DTF + 3.0% per annum.
|
The following loans were granted between October 1, 2010 and December 31, 2010 by companies beneficially owned by Mr. Sarmiento Angulo to Grupo Aval in part to fund the acquisition of 13,726,421 mandatorily convertible bonds issued by Banco de Bogotá (convertible into 29,205,152 shares of Banco de Bogotá). The proceeds of the convertible bond issuance were used to finance the BAC Credomatic acquisition. See “Business—BAC Credomatic.” All loans were granted on an arm’s-length basis, are unsecured and have a five-year term, with a two-year grace period, as follows:
|
|
·
|
loans granted by Rendifin S.A. to Grupo Aval with a total outstanding amount of Ps 789.7 billion (U.S.$406.5 million) at an interest rate of DTF + 3.0% per annum; and
|
|
|
·
|
loans granted by Bienes y Comercio S.A. with a total outstanding amount of Ps 189.0 billion (U.S.$97.3 million) at an interest rate of DTF + 3.0% per annum.
|
The total amount of loans outstanding from companies beneficially owned by Mr. Sarmiento Angulo at April
25
, 2012 is Ps 1,153.8 billion (U.S.$593.9 million).
Loans granted to related parties by our banking subsidiaries
Key management of Grupo Aval and our banks, and their respective affiliates, who meet our credit eligibility requirements may subscribe to loans in the ordinary course of business, on market terms and conditions available to the general public.
All outstanding loans with our related parties are made in the ordinary course of business and on terms and conditions, including interest rates and collateral, not materially different from those available to the general public and did not involve more than the normal risk of collectability or present other unfavorable features.
In connection with our Preferred Shares Local Offering, certain members of our board of directors and key management were granted loans by our banking subsidiaries for the purpose of acquiring Grupo Aval preferred shares. These loans were granted at market rates and on terms and conditions not materially different from those available to other purchasers of Grupo Aval shares.
Other transactions with Mr. Sarmiento Angulo and his affiliates
Beneficial ownership in our banking subsidiaries
In addition to his beneficial ownership in Grupo Aval, Mr. Sarmiento Angulo beneficially owns at the date of this annual report, 9.6% of Banco de Bogotá, 13.3% of Banco de Occidente, 15.4% of Banco AV Villas and 0.7% of Banco Popular.
Except as stated above, Mr. Sarmiento Angulo does not have any other beneficial ownership in our banking subsidiaries. For information on the dividend history of our banking subsidiaries, see “Item 10. Additional Information—F. Dividends and paying agents—Dividend history of our banking subsidiaries.”
Banco Popular share ownership reorganization
Immediately prior to the completion of the First Banco Popular Share Ownership Transaction on June 23, 2011, Grupo Aval directly owned 2,368,686,432 shares (or 30.66%) of the share capital of Banco Popular, while Rendifin S.A., Popular Securities S.A. and Inversiones Escorial S.A. (companies beneficially owned by Mr. Sarmiento Angulo) owned 4,872,610,306 (or 63.07%) of the share capital of Banco Popular.
On January 31, 2011, Grupo Aval entered into the First Banco Popular Share Ownership Reorganization Transaction through an agreement with Rendifin S.A. to acquire through escisión 43.47% of Banco Popular’s outstanding shares held by Rendifin S.A. in exchange for 2,073,115,004 of our preferred shares at a ratio of 1.62 Banco Popular share per Grupo Aval preferred share. We completed this transaction on June 23, 2011 and increased our direct ownership in Banco Popular to 74.17% and issued 2,073,115,004 preferred shares to the shareholders of Rendifin S.A.
On April 29, 2011, we entered into the Second Banco Popular Share Ownership Reorganization Transaction through a second agreement with Popular Securities S.A. and Inversiones Escorial S.A. to acquire an additional 19.60% of Banco Popular in exchange for 934,669,126 preferred shares at the same ratio of 1.62 Banco Popular share per Grupo Aval preferred share, which increased our ownership interest in Banco Popular to 93.73%. The Second Banco Popular Share Ownership Reorganization Transaction closed on September 20, 2011.
The independent investment bank Rothschild de Mexico S.A. de C.V. issued a fairness opinion on January 6, 2011, stating that the exchange ratio of 1.62 Banco Popular shares to one Grupo Aval preferred share was reasonable to Grupo Aval shareholders.
Grupo Aval had previously controlled Banco Popular through a shareholders’ agreement with Rendifin S.A. Pursuant to this agreement, Rendifin had granted Grupo Aval irrevocable power to represent Rendifin’s shares in Banco Popular. The agreement provided that all economic rights to the Banco Popular shares would continue to be vested in Rendifin. The agreement terminated on June 23, 2011 because Grupo Aval came to own more than 50% of the issued and outstanding shares of Banco Popular. Prior to termination, Grupo Aval received, as compensation for its services, a monthly fee in the amount of Ps 116,072,351, which was linked to the CPI.
Insurance services
Seguros de Vida Alfa S.A., or “Vida Alfa,” a life insurance affiliate of Mr. Sarmiento Angulo, provides insurance required by law, as well as annuities, relating to the mandatory pension funds managed by Porvenir. The insurance provider is selected by Porvenir through a competitive bidding process once every four years. Premiums under this insurance policy are deducted by Porvenir from the individual customers’ account and transferred to Vida Alfa on behalf of the individual customer.
The table below presents the insurance premiums paid for the periods indicated.
|
Period
|
Amount
|
|||
|
(in Ps billions)
|
||||
|
For the three-month period ended March 31, 2012
|
72.8 | |||
|
For the year ended December 31:
|
||||
|
2011
|
285.7 | |||
|
2010
|
252.7 | |||
Vida Alfa also provides:
|
|
·
|
life insurance, as sole provider and as co-insurer with non-affiliated insurers (pursuant to a competitive bidding process), for individual borrowers of our banking subsidiaries to cover the risk of non-payment upon death. Premiums are paid by the borrowers; and
|
|
|
·
|
workers compensation for all employees of Grupo Aval and its subsidiaries.
|
Seguros Alfa S.A., or “Alfa,” a property and casualty insurance affiliate of Mr. Sarmiento Angulo, provides fire
and
earthquake insurance for mortgage loans granted by certain of our banks. In addition, Alfa provides surety bonds and property insurance for our subsidiaries. Our banking subsidiaries also provide insurance products affiliated with Vida Alfa and Alfa through their bancassurance lines. These transactions are conducted on an arm’s-length basis in the ordinary course of business. Alfa has in the past, but not currently, provided bankers’ blanket bond coverage to our subsidiaries, reinsured under prevailing market conditions, and surety bonds for Corficolombiana’s toll-road concessions. The amounts relating to those transactions are immaterial.
Put/call agreement between Grupo Aval and Adminegocios & Cia. S.C.A., an entity controlled by Mr. Sarmiento Angulo and a direct shareholder of Grupo Aval
On November 24, 2010, Grupo Aval and Adminegocios & Cia. S.C.A., an entity controlled by Mr. Sarmiento Angulo, our controlling shareholder, entered into an agreement whereby Grupo Aval assigned to Adminegocios & Cia. S.C.A. its right to acquire up to 2,605,000 mandatorily convertible bonds issued by Banco de Bogotá (convertible into 5,542,553 shares of Banco de Bogotá). Under the put/call agreement, we have an option to purchase from Adminegocios & Cia. S.C.A., and they have the right to sell, 2,605,000 convertible bonds (or the underlying shares, if converted). In either case, the purchase price we will have to pay Adminegocios & Cia. S.C.A. is the subscription price paid by Adminegocios & Cia. S.C.A. at the time of acquiring the mandatorily convertible bonds issued by Banco de Bogotá plus a premium of 6.5% per annum up to the date of acquisition. The options expire two years from December 2, 2010, the date of first subscription of the mandatorily convertible bonds. With the 2,605,000 convertible bonds assigned by us, Adminegocios & Cia. S.C.A. acquired a total of 4,249,965 convertible bonds from Banco de Bogotá. The mandatorily convertible bonds were acquired by Adminegocios & Cia. S.C.A. in order to finance the BAC Credomatic acquisition. We expect to exercise our option before it expires.
On March 1, 2011, Adminegocios & Cia. S.C.A. converted all of its 4,249,965 mandatorily convertible bonds holding into 9,042,478 common shares of Banco de Bogotá.
We expect to acquire (on the same pricing terms as the put/call agreement and simultaneously with the exercise of our option under such agreement) 3,499,925 shares of Banco de Bogotá from Adminegocios & Cia. S.C.A., in addition to the 5,542,553 shares of Banco de Bogotá subject to the option in the put/call agreement.
Other
The following companies are beneficially owned by Mr. Sarmiento Angulo and may continue to provide services to us and our subsidiaries for amounts that are immaterial: Construcciones Planificadas S.A. (office renovations), Vigía S.A. (security services) and Corporación Publicitaria de Colombia S.A. (advertising).
Not applicable.
Financial statements
See “Item 18. Financial Statements,” which contains our financial statements prepared in accordance with Colombian Banking GAAP.
Legal proceedings
We, our banking subsidiaries, Porvenir and Corficolombiana are party to lawsuits and administrative proceedings incidental to the normal course of our business.
We record contingency provisions when the risk of loss is probable, in which case, we would consider settling. In cases where we litigate a claim, we record a provision for our estimate of the probable loss based on historical data for similar claims. Due to the provisions we have established and the legal opinions we have received, we do not believe that any liabilities related to such lawsuits or proceedings will have a material adverse effect on our financial conditions or results of operations. At December 31, 2011, we, our banking subsidiaries, Corficolombiana and Porvenir have recorded provisions for a total amount of approximately Ps 39.8 billion.
Constitutional actions
We, our banking subsidiaries, Porvenir and Corficolombiana are also party to collective or class actions (“
acciones populares
” or “
acciones de grupo
,” respectively). Collective actions are court actions where an individual seeks to protect collective rights and prevent contingent damages, obtain injunctions and damages caused by an infringement of collective rights of which the following are the most significant.
All pension and severance fund administrators in Colombia, including Porvenir, are subject to at least two class actions in which certain individuals are alleging that the pension and severance funds administrators have caused damages to their customers by (1) paying returns earned by the severance and pension funds below the minimum profitability certified by the Superintendency of Finance, and (2) making payments to its customers—under the scheduled retirement system—below the established standards. Additionally, Porvenir and four of the largest pension and severance funds are subject to a constitutional action relating to charging commissions above the legally established limits for contributions to mandatory pension funds. These constitutional actions are seeking the payment of the alleged damages caused to fund managers’ customers. No provisions have been established in connection with these three constitutional actions because the amount is unquantifiable, and we consider the probability of loss to be remote.
Banco de Bogotá, Banco de Occidente, Banco Popular and Corficolombiana are subject to two relevant constitutional actions, as follows:
|
|
·
|
A constitutional action filed by certain individuals on behalf of the taxpayers of Cali, claiming that Banco de Bogotá S.A., among other financial institutions, abused its dominant position as creditors of the municipality of Cali in connection with credit facilities granted to such institutions, and therefore, are seeking the reimbursement of interest paid by the municipality in excess of the amounts due at September 30, 2009. We believe that the probability of loss in connection with this constitutional action is low (
eventual
) and, as such, have not recorded any provisions in connection with this constitutional action.
|
|
|
·
|
A constitutional action filed by certain individuals on behalf of Department of Valle (
Departamento del Valle
) against several financial institutions, including Banco de Bogotá S.A., claims that the Department has paid interest in a manner prohibited by law, in connection with a credit facility granted to the Province. In addition, the plaintiffs are claiming that the defendants did not pay the alleged real value of the shares of Sociedad Portuaria de Buenaventura and Empresa de Energía del Pacífico, on a sale transaction of said shares. We consider the probability of loss in connection with this constitutional action to be low (
eventual
) and, therefore, have not recorded any provision.
|
Banco AV Villas is subject to constitutional actions brought against several companies in the financial sector in Colombia in connection with the recalculation of mortgage interests that allegedly damaged several mortgage lenders. Banco AV Villas has a comparatively small mortgage portfolio, and we believe that the probability of loss in connection with these constitutional actions is remote.
Other litigation
The Superintendency of Industry and Commerce is currently conducting an investigation into certain Colombian banks, including Banco de Bogotá, Banco de Occidente, Banco Popular and Banco AV Villas, for alleged price fixing of bank interchange fees charged by issuer banks to acquiring banks during the period from May 2007 to October 2008. See “Item 3. Key Information—D. Risk Factors—Risks relating to our businesses and industry—Risks relating to our banking business—We may face legal and other challenges to maximizing revenue from credit card fees and other fees from customers.”
In addition to the matters described above, we, our banking subsidiaries, Porvenir, Corficolombiana and BAC are from time to time subject to claims and parties to legal proceedings incidental to the normal course of our business, including in connection with our lending activities, employees, taxation matters and other general commercial matters. Due to the inherent difficulty of predicting the outcome of legal disputes, we cannot predict the eventual outcome of these pending matters, what the timing of the ultimate resolution of these matters will be or what the eventual loss, fines or penalties related to each pending matter may be. We believe that we have recorded adequate provisions for the anticipated costs in connection with these claims and legal proceedings and believe that liabilities related to such claims and proceedings should not, in the aggregate, have a material adverse effect on our business, financial conditions, or results of operations. However, in light of the uncertainties involved in such claims and proceedings, the ultimate resolution of these matters may exceed the provisions that we have currently recorded. As a result, the outcome of a particular matter could be material to our operating results for a particular period.
A discussion of the significant changes in our business can be found under “Item 4. Information on the Company—A. History and development of the company.”
Not applicable.
Not applicable.
Market price and volume information
Our preferred shares have been listed since February 1, 2011 on the Colombian Stock Exchange, which is relatively small and illiquid compared to securities exchanges in major financial centers. In addition, a small number of issuers represent a disproportionately large percentage of market capitalization and trading volume on the Colombian Stock Exchange. A liquid trading market for the preferred shares might not develop on the Colombian Stock Exchange which could impair the ability of a holder of preferred shares to dispose of such shares on the Colombian Stock Exchange in the amount and at the price and time desired by such holder, and could increase the volatility of the market price of our preferred shares.
Trading history of our preferred shares
Our preferred shares have been listed since February 1, 2011 on the Colombian Stock Exchange under the symbol “PFAVAL” and we first issued preferred shares on May 12, 2011 at the conclusion of the Preferred Shares Local Offering. Due to this recent issuance, historical trading data and prices are limited. The following table
presents the high and low closing sales prices for the periods indicated, and average daily trading volume for our preferred shares on the Colombian Stock Exchange.
|
Colombian Stock Exchange
|
||||||||||||
|
High
|
Low
|
Average daily trading volume
|
||||||||||
|
(Ps per share)
|
(in shares)
|
|||||||||||
|
Year
|
||||||||||||
|
2011 (beginning May 12)
|
1,320 | 1,120 | 3,363,366 | |||||||||
|
Quarter
|
||||||||||||
|
Second Quarter 2011 (beginning May 12)
|
1,315 | 1,250 | 4,392,269 | |||||||||
|
Third Quarter 2011
|
1,320 | 1,120 | 2,151,997 | |||||||||
|
Fourth Quarter 2011
|
1,300 | 1,130 | 3,916,467 | |||||||||
|
First Quarter 2012
|
1,325 | 1,160 | 3,914,596 | |||||||||
|
Second quarter 2012 (through April 25, 2012)
|
1,300 | 1,250 | 2,084,400 | |||||||||
|
Month
|
||||||||||||
|
October 2011
|
1,250 | 1,210 | 1,744,628 | |||||||||
|
November 2011
|
1,300 | 1,130 | 7,825,521 | |||||||||
|
December 2011
|
1,280 | 1,200 | 2,179,253 | |||||||||
|
January 2012
|
1,270 | 1,160 | 1,378,219 | |||||||||
|
February 2012
|
1,260 | 1,210 | 3,298,650 | |||||||||
|
March 2012
|
1,325 | 1,235 | 6,946,139 | |||||||||
|
April 2012 (through April 25, 2012)
|
1,300 | 1,250 | 2,084,400 | |||||||||
On April 25, 2012, the last reported closing sale price on the Colombian Stock Exchange was Ps 1,250 per preferred share.
Trading history of our common shares.
The principal trading market for our common shares is the Colombian Stock Exchange. Shares of our common shares began trading on the Colombian Stock Exchange in 1999 and are listed under the symbol “GRUPOAVAL.” The following table presents the high and low closing sales prices and average daily trading volume for shares of our common shares on the Colombian Stock Exchange for the periods indicated. Due to a relatively low public float (6.0% of our total share capital), our common shares have historically traded at prices that we believe should not be a meaningful factor in determining the price for our preferred shares.
|
Colombian Stock Exchange
|
||||||||||||
|
High
|
Low
|
Average daily trading volume
|
||||||||||
|
(Ps per share)
|
(in shares)
|
|||||||||||
|
Year
|
||||||||||||
|
2006
|
802 | 449 | 1,673,566 | |||||||||
|
2007
|
697 | 570 | 1,638,804 | |||||||||
|
2008
|
645 | 388 | 1,378,067 | |||||||||
|
2009
|
785 | 450 | 1,781,899 | |||||||||
|
2010
|
1,770 | 745 | 2,069,109 | |||||||||
|
2011
|
1,715 | 1,125 | 1,492,887 | |||||||||
|
Quarter
|
||||||||||||
|
First quarter 2010
|
913 | 745 | 1,984,411 | |||||||||
|
Second quarter 2010
|
957 | 875 | 1,505,195 | |||||||||
|
Third quarter 2010
|
1,335 | 918 | 1,941,629 | |||||||||
|
Fourth quarter 2010
|
1,770 | 1,315 | 2,840,134 | |||||||||
|
First quarter 2011
|
1,715 | 1,345 | 1,669,916 | |||||||||
|
Second quarter 2011
|
1,370 | 1,255 | 1,805,270 | |||||||||
|
Third quarter 2011
|
1,315 | 1,125 | 1,119,850 | |||||||||
|
Fourth quarter 2011
|
1,270 | 1,135 | 1,384,055 | |||||||||
|
First quarter 2012
|
1,330 | 1,160 | 597,033 | |||||||||
|
Second quarter 2012 (through April 25, 2012)
|
1,275 | 1,240 | 614,623 | |||||||||
|
Month
|
||||||||||||
|
October 2011
|
1,245 | 1,210 | 1,114,841 | |||||||||
|
November 2011
|
1,260 | 1,135 | 1,427,098 | |||||||||
|
December 2011
|
1,270 | 1,190 | 1,610,227 | |||||||||
|
January 2012
|
1,220 | 1,160 | 333,211 | |||||||||
|
February 2012
|
1,260 | 1,205 | 646,597 | |||||||||
|
March 2012
|
1,330 | 1,230 | 798,729 | |||||||||
|
April 2012 (through April 25, 2012)
|
1,275 | 1,240 | 614,623 | |||||||||
On April 25, 2012, the last reported closing sale price on the Colombian Stock Exchange was Ps 1,240 per common share.
Trading history of common shares of our subsidiaries
The common shares of five of our subsidiaries are listed on the Colombian Stock Exchange, as follows:
|
|
·
|
Banco de Bogotá, under the symbol “BOGOTA”;
|
|
|
·
|
Banco de Occidente, under the symbol “OCCIDENTE”;
|
|
|
·
|
Banco Popular, under the symbol “POPULAR”;
|
|
|
·
|
Banco AV Villas, under the symbol “VILLAS”; and
|
|
|
·
|
Corficolombiana, under the symbol “CORFICOLCF.”
|
The following tables set forth the high and low closing sales prices, and average daily trading volume for the common shares of Banco de Bogotá, Banco de Occidente, Banco Popular, Banco AV Villas and Corficolombiana on the Colombian Stock Exchange for the periods indicated. Due to a relatively low public float (approximately 12.7% of the total share capital of Banco de Bogotá, approximately 4.7% of the total share capital of Banco Popular, approximately 9.1% of the total share capital of Banco de Occidente and approximately 4.9% of the total share capital of Banco AV Villas), the shares of these banking subsidiaries have historically traded at low volumes and traded at prices that we believe should not be a meaningful factor in determining the price for our preferred shares. Very few of the shares of Banco Popular not owned or controlled by us or our controlling shareholder are held by the public; rather, they are held by Colombian governmental institutions. Approximately 28.5% of the total shares of Corficolombiana is held by the public.
Banco de Bogotá
|
Colombian Stock Exchange
|
||||||||||||
|
High
|
Low
|
Average daily trading volume
|
||||||||||
|
(Ps per share)
|
(in shares)
|
|||||||||||
|
Year
|
||||||||||||
|
2009
|
34,580 | 22,100 | 14,003 | |||||||||
|
2010
|
59,000 | 33,100 | 22,523 | |||||||||
|
2011
|
56,000 | 47,300 | 15,547 | |||||||||
|
Quarter
|
||||||||||||
|
First quarter 2011
|
56,000 | 52,520 | 21,981 | |||||||||
|
Second quarter 2011
|
54,600 | 51,900 | 14,337 | |||||||||
|
Third quarter 2011
|
53,300 | 48,020 | 14,999 | |||||||||
|
Fourth quarter 2011
|
50,000 | 47,300 | 10,703 | |||||||||
|
First quarter 2012
|
52,060 | 48,000 | 18,688 | |||||||||
|
Second quarter 2012 (through April 25, 2012)
|
51,000 | 50,160 | 11,588 | |||||||||
On April 25, 2012, the last reported closing sale price on the Colombian Stock Exchange was Ps 50,200 per common share.
Banco de Occidente
|
Colombian Stock Exchange
|
||||||||||||
|
High
|
Low
|
Average daily trading volume
|
||||||||||
|
(Ps per share)
|
(in shares)
|
|||||||||||
|
Year
|
||||||||||||
|
2009
|
28,500 | 15,660 | 966 | |||||||||
|
2010
|
38,900 | 27,780 | 18,251 | |||||||||
|
2011
|
38,800 | 28,940 | 6,650 | |||||||||
|
Quarter
|
||||||||||||
|
First quarter 2011
|
38,800 | 34,000 | 13,752 | |||||||||
|
Second quarter 2011
|
34,980 | 33,000 | 9,186 | |||||||||
|
Third quarter 2011
|
33,500 | 30,000 | 1,456 | |||||||||
|
Fourth quarter 2011
|
30,000 | 28,940 | 2,185 | |||||||||
|
First quarter 2012
|
30,500 | 28,400 | 2,940 | |||||||||
|
Second quarter 2012 (through April 25, 2012)
|
31,000 | 30,000 | 1,929 | |||||||||
On April 25, 2012, the last reported closing sale price on the Colombian Stock Exchange was Ps 30,500 per common share.
Banco Popular
|
Colombian Stock Exchange
|
||||||||||||
|
High
|
Low
|
Average daily trading volume
|
||||||||||
|
(Ps per share)
|
(in shares)
|
|||||||||||
|
Year
|
||||||||||||
|
2009
|
300 | 260 | 4,574 | |||||||||
|
2010
|
560 | 300 | 80,055 | |||||||||
|
2011
|
770 | 499 | 31,010 | |||||||||
|
Quarter
|
||||||||||||
|
First quarter 2011
|
770 | 560 | 83,231 | |||||||||
|
Second quarter 2011
|
650 | 600 | 4,705 | |||||||||
|
Third quarter 2011
|
620 | 620 | 708 | |||||||||
|
Fourth quarter 2011
|
620 | 499 | 35,609 | |||||||||
|
First quarter 2012
|
520 | 520 | 291,076 | |||||||||
|
Second quarter 2012 (through April 25, 2012)
|
– | – | – | |||||||||
The last reported closing sale price on the Colombian Stock Exchange, which was on March 30, 2012, was Ps 520 per common share.
Banco AV Villas
|
Colombian Stock Exchange
|
||||||||||||
|
High
|
Low
|
Average daily trading volume
|
||||||||||
|
(Ps per share)
|
(in shares)
|
|||||||||||
|
Year
|
||||||||||||
|
2009
|
5,280 | 2,950 | 1,198 | |||||||||
|
2010
|
8,200 | 3,205 | 3,751 | |||||||||
|
2011
|
8,200 | 6,500 | 894 | |||||||||
|
Quarter
|
||||||||||||
|
First quarter 2011
|
8,200 | 7,310 | 537 | |||||||||
|
Second quarter 2011
|
8,000 | 7,000 | 733 | |||||||||
|
Third quarter 2011
|
7,000 | 6,500 | 2,090 | |||||||||
|
Fourth quarter 2011
|
7,800 | 6,800 | 172 | |||||||||
|
First quarter 2012
|
7,990 | 5,210 | 861 | |||||||||
|
Second quarter 2012 (through April 25, 2012)
|
7,990 | 7,990 | 122 | |||||||||
.
Source: Colombian Stock Exchange.
On April 25, 2012, the last reported closing sale price on the Colombian Stock Exchange was Ps 7,990 per common share.
Corficolombiana
|
Colombian Stock Exchange
|
||||||||||||
|
High
|
Low
|
Average daily trading volume
|
||||||||||
|
(Ps per share)
|
(in shares)
|
|||||||||||
|
Year
|
||||||||||||
|
2009
|
23,500 | 13,040 | 57,735 | |||||||||
|
2010
|
36,460 | 22,540 | 117,254 | |||||||||
|
2011
|
35,600 | 31,600 | 79,754 | |||||||||
|
Quarter
|
||||||||||||
|
First quarter 2011
|
35,500 | 33,400 | 126,062 | |||||||||
|
Second quarter 2011
|
34,600 | 33,120 | 41,157 | |||||||||
|
Third quarter 2011
|
35,600 | 31,600 | 90,261 | |||||||||
|
Fourth quarter 2011
|
35,180 | 33,100 | 60,109 | |||||||||
|
First quarter 2012
|
34,880 | 33,600 | 67,773 | |||||||||
|
Second quarter 2012 (through April 25, 2012)
|
33,840 | 33,000 | 40,365 | |||||||||
On April 25, 2012, the last reported closing sale price on the Colombian Stock Exchange was Ps 33,300 per common share.
Trading on the Colombian Stock Exchange
The Colombian Stock Exchange is the sole market for the common and preferred shares of Grupo Aval and the common shares of our banking subsidiaries and Corficolombiana. There are no official market makers or independent specialists on the Colombian Stock Exchange to assure market liquidity and, therefore, orders to buy or sell in excess of corresponding orders to sell or buy will not be executed. The aggregate equity market capitalization of the 83 companies listed on the Colombian Stock Exchange at April 25, 2012 was Ps 463.0 trillion (U.S.$261.9 billion). See “Item 4. Information on the Company—B. Business overview—Industry—Colombia—Recent developments in the Colombian stock market.”
Regulation of Colombian securities markets
Colombian securities markets are subject to the supervision and regulation of the Superintendency of Finance, which was created in 2005 following the merger of the Superintendency of Banking and the Superintendency of Securities. The Superintendency of Finance is an independent regulatory entity ascribed to the Ministry of Finance and Public Finance. The Superintendency of Finance has the authority to inspect, supervise and control the financial, insurance and securities exchange sectors and any other activities related to the investment or management of public savings. Accordingly, we are subject to the supervision and control of the Superintendency of Finance as an issuer of securities, and our subsidiaries are subject to its supervision and regulation as financial institutions and issuers of securities. See “Item 4. Information on the Company—B. Business overview—Industry—Supervision and regulation—Colombian banking regulators—Ministry of Finance and Public Credit” and “—Superintendency of Finance.”
Investment in our preferred shares by non-residents of Colombia
The International Investment Statute of Colombia as provided by Decree 2080 of 2000, as amended, regulates the manner in which foreign investors may participate in the Colombian securities markets and undertake other types of investment, prescribes registration with the Colombian Central Bank of certain foreign exchange transactions and specifies procedures under which certain types of foreign investments are to be authorized and administered.
A preferred shareholder may under certain circumstances be required to comply directly with certain registration and other requirements under the foreign investment regulations. Under these regulations, the failure of a non-resident investor to report or register foreign exchange transactions relating to investments in Colombia with the Colombian Central Bank on a timely basis may prevent the investor from obtaining remittance rights, including for the payment of dividends, and constitute an exchange control violation and/or result in a fine.
Under Colombian law, foreign investors receive the same treatment as Colombian citizens with respect to the ownership and voting of our preferred securities. See “Item 3. Key Information—D. Risk factors—Risks relating to our preferred shares.”
Not applicable.
Not applicable.
Not applicable.
Not applicable.
The following is a summary of certain significant provisions of our by-laws, Colombian corporate law, the rules and regulations of the Superintendency of Finance and the Listing Rules of the Colombian Stock Exchange that pertain to our capital, management, periodical and occasional disclosures, as well as other corporate issues applicable to us. The description below includes the material provisions of our by-laws and Colombian corporate law. In Colombia, by-laws are the principal governing document of a corporation.
Our by-laws provide for an authorized share capital of 120,000,000,000 shares of par value of Ps 1.00 each, which may be either of two classes: common shares or shares with a preferred dividend, liquidation preference and no voting. At April 25, 2012, we had 13,719,081,181 common shares outstanding, and 4,832,685,272 preferred shares outstanding.
Our by-laws also provide for the conversion of common shares into preferred shares. A shareholders’ meeting must define, in each case, the procedure to be followed for such conversion and must determine, among other matters, the maximum number or percentage of shares that may be converted. The shareholders’ meeting may also authorize the Board of Directors or the President of our Company to approve the agreements, forms and other documents to be executed in order to give effect to a conversion.
Our shareholders’ meeting held on December 7, 2010, determined that outstanding common shares may be converted into preferred shares on a 1-to-1 basis. Conversion of common shares into preferred shares may only be made once a month, provided that, as required by Colombian law and in accordance with our by-laws, our preferred shares shall not exceed 50% of our subscribed capital.
Voting rights
Common shares
The holders of common shares are entitled to vote on the basis of one vote per share on any matter subject to approval at a general shareholders’ meeting. These general meetings may be ordinary meetings or extraordinary meetings. Ordinary general shareholders’ meetings occur twice a year, no later than the last business day of March and September, for the following purposes:
|
|
·
|
to consider the approval of our report for the preceding semester ending on June 30 or December 31, as applicable, including the financial statements for the above-mentioned term;
|
|
|
·
|
to review the report prepared by the external auditor for the preceding semester ending on June 30 or December 31;
|
|
|
·
|
to elect directors and the external auditor (on an annual basis);
|
|
|
·
|
to determine the compensation of the members of the board of directors and the external auditor (on an annual basis); and
|
|
|
·
|
to determine the dividend policy and the allocation of profits, if any, of the preceding semester ending on June 30 or December 31, respectively, as well as any retained earnings from previous semesters.
|
Pursuant to Law 964 of 2005, at least 25% of the members of our board of directors must be independent within the meaning of Colombian rules. A person who is an “independent director” is understood to mean a director who is not:
|
|
·
|
an employee or director of the issuer or any of its parent or subsidiary companies, including any person acting in such capacity during the year immediately preceding that in which they were appointed to the board, except in the case of an independent member of the board of directors being re-elected;
|
|
|
·
|
a shareholder, who either directly or by virtue of an agreement directs, guides or controls the majority of the entity’s voting rights or who determines the majority composition of the administrative, directing or controlling bodies of this same entity;
|
|
|
·
|
a partner or employee of any association or firm that provides advisory or consultancy services to the issuer or to companies belonging to the same economic group to which such issuer belongs, in the event that income obtained from such services represent for said association or firm at least twenty percent (20.0%) of its total operating income;
|
|
|
·
|
an employee or director of a foundation, association, partnership or corporation that receives significant donations from the issuer. The term “significant donations” is quantified as twenty percent (20.0%) or more of the total amount of donations received by the respective institution;
|
|
|
·
|
an administrator of any entity on whose board of directors a legal representative of the issuer participates; or
|
|
|
·
|
a board member who receives from the issuer any kind of remuneration other than fees as a member of the board of directors, member of the audit committee or any other committee established by the board of directors.
|
Pursuant to Decree 3923 of 2006, the election of independent directors must be in a ballot separate from the ballot to elect the rest of the directors, unless the reaching of the minimum number of independent directors required by law or by the by-laws is assured, or when there is only one list that includes the minimum number of independent directors required by law or by the by-laws.
Both elections are made under a proportional representation voting system
named electoral quotient—
“cociente electoral”
(except for the elections unanimously approved by the general shareholders’ meeting). Under that system:
|
|
·
|
each holder of common shares is entitled at the first annual general shareholders’ meeting to nominate candidates for the election of directors;
|
|
|
·
|
each nomination of one or more directors by a shareholder constitutes a list for the purposes of the election;
|
|
|
·
|
each list of nominees must contain a hierarchy as to the order of preference for nominees in that list to be elected;
|
|
|
·
|
once all lists have been nominated, holders of common shares may cast one vote for each common share held in favor of a particular list of nominees. Votes may not be cast for particular nominees in a list; they may be cast only for the entire list;
|
|
|
·
|
the total number of votes cast in the election is divided by the number of directors to be elected. The resulting quotient is the quota of votes necessary to elect particular directors. For each time that the number of votes cast for a list of nominees is divisible by the quota of votes, one nominee from that list is elected, in the order of the hierarchy of that list; and
|
|
|
·
|
when no list has enough remaining votes to satisfy the quota of votes necessary to elect a director, any remaining board seat or seats are filled by electing the highest remaining nominee from the list with the highest number of remaining votes cast until all available seats have been filled.
|
Extraordinary general shareholders’ meetings may take place when duly called for a specified purpose or purposes, or, without prior notice, when holders representing all outstanding shares entitled to vote on the issues presented are present at the meeting. Extraordinary meetings of shareholders may be called by our board of directors, by our president or by our external auditor, directly or by request of a plural number of shareholders representing no less than 25.0% of the company’s capital. In addition, meetings may be called by the Superintendency of Finance, directly or by request of shareholders holding at least 15.0% of the shares outstanding. Notice of extraordinary meetings should be given at least five days in advance.
Quorum for both ordinary and extraordinary general shareholders’ meetings to be convened at first call requires the presence of two or more shareholders representing at least 50.0% plus one of the outstanding shares entitled to vote at the relevant meeting. If no quorum is present for a general shareholders’ meeting, a subsequent meeting may
be called within 10 to 30 business days at which the presence of two or more shareholders entitled to vote at the relevant meeting constitutes quorum, regardless of the number of shares represented.
Notice of ordinary general meetings must be published in one newspaper of wide circulation, at least 15 business days prior to the proposed date of a general shareholders’ meeting. Notice of extraordinary general meetings, listing the matters to be addressed at such meetings, must be published in one newspaper of wide circulation, at least five calendar days prior to the proposed date of an extraordinary general shareholders’ meeting.
Except where Colombian law requires a supermajority, decisions made at a shareholders’ meeting must be approved by a majority of the shares present. Pursuant to Colombian law and/or our by-laws, special-majorities are required in the following cases:
|
|
·
|
the vote of at least 70.0% of the shares present and entitled to vote at a shareholders’ meeting is required to approve the issuance of common shares not subject to preemptive rights;
|
|
|
·
|
the Company must distribute (1) at least 50.0% of the semester’s net profits according to Article 155 of the Colombian Code of Commerce, or (2) at least 70.0% of the semester’s net profits if the total amount segregated in the legal, statutory and other reserves exceeds the Company’s outstanding capital, according to Article 454 of the Colombian Code of Commerce; however, the vote of at least 78.0% of the shares represented and entitled to vote may approve the distribution of a lower percentage of dividends;
|
|
|
·
|
The vote of at least 80.0% of the shares present and entitled to vote is required to approve the payment of dividends in shares; however, according to Law 222 of 1995, if a “situation of control” exists, whereby the decision-making power is subject to the will of a person or group of persons, a company may only pay dividends by issuing shares, to the shareholders that so accept;
|
|
|
·
|
unanimity is required to replace a vacancy on the board of directors without applying the electoral quotient system described above; and
|
|
|
·
|
the vote of 70.0% of the issued and outstanding common shares and 70.0% of the outstanding and issued preferred shares is required to approve any amendment that may impair the rights of the preferred shares.
|
The adoption by a shareholders’ meeting of certain corporate actions such as mergers,
escisiones
, and share conversions are also subject to authorization by the Superintendency of Finance.
Preferred shares
The holders of preferred shares are not entitled to receive notice of, attend to or vote at any general shareholders’ meeting of holders of common shares, except as described below.
The holders of preferred shares will be entitled to vote on the basis of one vote per share at any shareholders’ meeting, whenever a shareholder vote is required on the following matters:
|
|
·
|
in the event that amendments to our by-laws may impair the conditions or rights assigned to such preferred shares and when the conversion of such shares into common shares is to be approved. In both such cases, the vote of 70.0% of the outstanding and issued preferred shares is required; and
|
|
|
·
|
if at the end of any six-month period, our profits are not sufficient to pay the minimum dividend on the preferred shares and the Superintendency of Finance, by its own decision or upon request of holders of at least 10.0% of preferred shares, determines that benefits were concealed or shareholders were misled with regard to benefits thereby decreasing the profits to be distributed, the Superintendency of Finance may resolve that holders of preferred shares should participate with speaking and voting rights at the general shareholders’ meeting, in the terms established by law.
|
We must issue a notice of any meeting at which holders of preferred shares are entitled to vote, which notice must be published in a newspaper of wide circulation. Depending on the matters to be subjects of the shareholders
meeting, notice to preferred shareholders must be delivered at least 15 business days or 5 calendar days before the meeting. Each notice must contain the following:
|
|
·
|
the date of the meeting;
|
|
|
·
|
a description of any resolution to be proposed for adoption at the meeting on which the holders of preferred shares are entitled to vote; and
|
|
|
·
|
instructions for the delivery of proxies.
|
Redemption
All shareholders (whether holders of common or preferred shares) have, at their option, a redemption right in the following cases:
|
|
·
|
If, as a result of a merger, transformation or
escisión
of the Company, (a) the stockholders must assume a higher level of liability (i.e., by transforming a corporation into a partnership), or (b) the economic rights of the shareholders are impaired. In these events, the shareholders that were not present at the meeting in which the decision was taken or voted against it, may exercise the redemption right.
|
|
|
·
|
Pursuant to Colombian Law (Article 12 of Law 222 of 1995), the economic rights of shareholders are deemed to be impaired if:
|
|
|
·
|
their ownership percentage is reduced as a consequence of the merger, transformation or
escisión
of the Company;
|
|
|
·
|
the equity value or the par value of the shares is reduced (in the latter case, only to the extent that the reduction of the par value implies a decrease in the Company’s stock capital); and
|
|
|
·
|
the negotiability of the shares is restricted or diminished.
|
|
|
·
|
If the Company decides to withdraw the listing of its shares from a stock exchange or its registration before the National Registry of Shares and Issuers (
Registro Nacional de Valores y Emisores
).
|
The exercise of this right is regulated by Articles 15 and 16 of Law 222 of 1995. According to Article 15, within five days following notice of the exercise of this right by a shareholder, the Company must offer to the other shareholders the shares owned by the exercising shareholder. Within the following 15 days, the other shareholders may acquire the shares on a pro rata basis. If all or a part of the shares are not acquired by the other shareholders, then the Company must reacquire them to the extent there are profits or reserves built up by the Company for those purposes. If neither the shareholders nor the Company acquires all of the shares owned by the exercising shareholder, then pursuant to Article 16 of Law 222 of 1995, such exercising shareholder is entitled to the reimbursement of the capital contributions made to the Company.
In both cases, the redemption price of the shares will be established by the agreement of seller and buyer. In the absence of such agreement, the redemption price will be determined by an expert appraiser. Notwithstanding the above, the by-laws may establish other methods for determining the redemption price to be paid in the foregoing circumstances. Our current by-laws do not contemplate such other methods.
Dividends
Common shares
Following the approval of the financial statements at a general shareholders’ meeting, shareholders may determine the allocation of distributable profits, if any, of the preceding semester by a resolution approved by the majority of the holders of common shares present at the ordinary general shareholders’ meeting, pursuant to the recommendation of the board of directors and management.
Under the Colombian Code of Commerce, a company must, after payment of income taxes and appropriation of legal reserves, and after off-setting losses from prior terms, distribute at least 50.0% of net profits to all shareholders, payable in cash, or as determined by the shareholders, within a period of one year following the date on which the shareholders determine the dividends. If the total amount segregated in the legal, statutory and occasional reserves of a company exceeds its outstanding capital, this percentage is increased to 70.0%. The minimum common shares dividend requirement of 50.0% or 70.0%, as the case may be, may be waived by a favorable vote of the holders of 78.0% of a company’s common shares present at the meeting, in which case the shareholders may distribute any percentage of the net profits.
Under Colombian law and our by-laws, net profits obtained in each semester are to be allocated as follows:
|
|
·
|
first, an amount equivalent to 10.0% of net profits is segregated to build a legal reserve, until that reserve is equal to at least 50.0% of our paid-in capital;
|
|
|
·
|
second, payment of the minimum dividend on the preferred shares; and
|
|
|
·
|
third, allocation of the balance of the net profits is determined by the holders of a majority of the common shares entitled to vote on the recommendation of the board of directors and the president and may, subject to further reserves required by the by-laws, be distributed as dividends.
|
Under Colombian law, the dividends payable to the holders of common shares, for each common share, cannot exceed the dividends payable to holders of the preferred shares, for each preferred share. All common shares that are fully paid-in and outstanding at the time a dividend or other distribution is declared are entitled to share equally in that dividend or other distribution. Common shares that are only partially paid-in participate in a dividend or distribution in the same proportion as the shares have been paid in at the time of the dividend or distribution.
The general shareholders’ meeting may allocate a portion of the profits to, among others, welfare, education or civic services.
Preferred shares
Holders of preferred shares are entitled to receive a minimum dividend after deducting losses affecting the capital, and deducting any amounts set aside for legal reserve, but before creating or accruing for any other reserve and before any declared dividends are paid to holders of common shares. Dividends to holders of common shares must be approved by the shareholders. If no dividends are declared, no holder of Grupo Aval’s preferred or common shares will be entitled to payment. The minimum dividend will be equal to Ps 1.00 in each calendar semester, so long as this value is higher than the dividend paid to the holders of common shares. If the minimum preferred dividend is not equal or higher than the per share dividend on the common shares, the minimum dividend will be equal to the dividend paid to the holders of common shares, if any.
Payment of the preferred dividend shall be made at the time and in the manner established in the general shareholders’ meeting and with the priority indicated by Colombian law.
Grupo Aval is under a “situation of control” (whereby the decision-making power is subject to the will of a person or group of persons). As a result, the Company may only pay stock dividends to the shareholders that so accept it. Those shareholders that do not accept to receive a stock dividend, are entitled to receive their dividend in cash.
For additional information regarding dividends, see “Item 10. Additional Information—F. Dividends and paying agents—Dividend policy.”
General aspects involving dividends
The dividend periods may be different from the periods covered by the general balance sheet. In the general shareholders’ meeting, shareholders will determine such dividend periods, the effective date, and the method and the place for payment of dividends.
Dividends declared on the common shares and the preferred shares will be payable to the record holders of those shares, as they are recorded on our share registry, on the appropriate dates as determined in the general shareholders’ meeting. However, in accordance with Decree 4766 of December 14, 2011, issued by the Ministry of Finance and Public Credit:
|
|
·
|
companies whose shares are registered with the
National Registry of Shares and Issuers
must establish a period of at least three trading days between the date that they receive approval to distribute profits from the General Shareholders Assembly and the date of payment; and
|
|
|
·
|
the ex-dividend period (
fecha ex-dividendo
) is the period during which it is understood that a purchase of shares does not include the right to receive dividends. The ex-dividend date shall be set forth by stock exchanges, and it cannot be less than two trading days. According to Colombian Stock Exchange regulations, a transaction is “ex-dividend” if it takes place between the first day of dividend payment and the four trading days preceding that date.
|
Liquidation rights
We will be dissolved if certain events take place, including the following:
|
|
·
|
our term of existence, as stated in our by-laws, set at May 25, 2044, expires without being extended by the shareholders prior to its expiration date;
|
|
|
·
|
losses cause the decrease of our shareholders’ equity below 50% of the amount of outstanding share capital, unless one or more of the corrective measures described in the Colombian Code of Commerce are adopted by the shareholders within six-months;
|
|
|
·
|
by decision at the general shareholders’ meeting; and
|
|
|
·
|
in certain other events expressly provided by law and in the by-laws.
|
Upon dissolution, a liquidator must be appointed by a general meeting of the shareholders to wind up the affairs of our company.
Upon liquidation, and out of the surplus assets available for distribution to shareholders, holders of fully paid preferred shares are entitled to a preference in the reimbursement of their contribution (“
aporte
” as provided by article 63 of Law 222 of 1995) to Grupo Aval. This reimbursement, if any, is payable in pesos before any distribution or payment may be made to holders of common shares. If, upon any liquidation, assets that are available for distribution among the holders of preferred shares are insufficient to pay in full their respective liquidation preferences, such assets will be distributed among those holders pro rata.
Subject to the preferential liquidation rights of holders of preferred shares, and provided there are still sufficient assets remaining, all fully paid common shares will be entitled to participate in any distribution upon liquidation. Partially paid common shares must participate in a distribution upon liquidation in the same proportion that those shares have been paid at the time of the distribution.
To the extent there are surplus assets available for distribution after full payment to the holders of preferred and common shares of their contribution to Grupo Aval, the surplus assets will be distributed among all holders of shares of share capital (common or preferred), pro rata, in accordance with their respective holdings of shares.
Preemptive rights and other anti-dilution provisions
Pursuant to the Colombian Code of Commerce, we are allowed to have an outstanding amount of share capital that is less than the authorized share capital set out in our by-laws. Under our by-laws, the holders of common shares determine the amount of authorized share capital, and our board of directors has the power to (1) order the issuance and regulate the terms of subscription of common shares up to the total amount of authorized share capital, and (2) regulate the issuance of preferred shares, when expressly delegated at the general shareholders’ meeting. The
issuance of preferred shares must be approved by the general shareholders’ meeting, which shall determine the nature and extent of any rights, according to our by-laws and Colombian law.
At the time of incorporation of a Colombian company, its outstanding share capital must represent at least 50% of the authorized capital. Any increases in the authorized share capital or decreases in the outstanding share capital must be approved by the majority of shareholders required to approve a general amendment to the by-laws.
Colombian law requires that, whenever we issue new common shares, we must offer to the holders of common shares the right to subscribe a number of common shares sufficient to maintain their existing ownership percentage of the aggregate share capital. These rights are preemptive rights. On the other hand, holders of preferred shares are entitled to preemptive rights only on the specific situations that the shareholders’ meeting so decides. See “Item 3. Key Information—D. Risk factors—Risks relating to our preferred shares.”
Common shareholders at a general shareholders’ meeting may waive preemptive rights with respect to a particular capital increase by the favorable vote of at least 70.0% of the shares represented at the meeting. Preemptive rights must be exercised within the period stated in the share placement terms of the increase, which cannot be less than 15 business days following the publication of the notice of the public offer of that capital increase. From the date of the notice of the share placement terms, preemptive rights may be transferred separately from the corresponding shares.
The Superintendency of Finance will authorize a decrease in the outstanding share capital approved by the holders of common shares only if:
|
|
·
|
we have no outstanding liabilities;
|
|
|
·
|
our creditors consent in writing; or
|
|
|
·
|
the outstanding share capital remaining after the reduction represents at least twice the amount of our liabilities.
|
Restrictions on purchases and sales of share capital by related parties
Pursuant to the Colombian Code of Commerce, the members of our board of directors and certain of our principal executive officers may not, directly or indirectly, buy or sell shares of our share capital while they hold their positions, unless they obtain the prior approval of the board of directors passed with the vote of two-thirds of its members (excluding, in the case of transactions by a director, such director’s vote). Furthermore, pursuant to Article 262 of the Colombian Code of Commerce, Grupo Aval’s subsidiaries are prohibited from owning (directly or indirectly) shares of Grupo Aval.
In addition, as our shares are publicly traded on the Colombian Stock Exchange, the transfer of the shares is subject to the tender offer rules.
Pursuant to Article 23 of Law 222 of 1995, the members of our board of directors and our legal representatives generally must perform their duties according to the principles of good faith, due diligence and loyalty. In particular, the directors and legal representatives must refrain from entering into any transaction (including any sale and purchase of shares) which may imply competition with the Company or a conflict of interests, unless they obtain the prior approval of the General Shareholders Meeting, which, in any case, shall only be granted if the respective transaction does not harm the Company’s interests.
Transfer and registration of shares
Grupo Aval’s common and preferred shares are listed on the Colombian Stock Exchange. According to Colombian regulations, shares listed on a stock exchange must be sold and transferred only through such exchange, unless such shares were issued outside Colombia and are transferred outside Colombia, or unless the share purchase transaction amounts to a value that is lower than the regulatory threshold of 66,000 UVRs, as required by Article 6.15.1.1.2 of Decree 2555 of 2010. In addition, the following transactions are not required to be effected through the relevant stock exchange:
|
|
·
|
transfers between shareholders with the same beneficial owner;
|
|
|
·
|
transfers of shares owned by financial institutions that are being liquidated under the control and supervision of the Superintendency of Finance;
|
|
|
·
|
issuer repurchases;
|
|
|
·
|
transfers by the State; and
|
|
|
·
|
any other transactions as may be authorized by the Superintendency of Finance.
|
Under Colombian law, shares may be traded either in physical form or electronic form. Transfers of shares are subject to a registry system which differs depending on whether the shares are evidenced in electronic form or physical form. Transfers of shares evidenced by electronic certificates must first be registered with a securities central depositary through a stockbroker. The main purpose of the securities central depositary is to receive, safekeep and manage securities certificates issued by corporations in order to keep a record of the transactions undertaken over such securities, including transfers, pledges and withdrawals. Accordingly, they are not allowed to hold, invest or otherwise use the securities held under their custody.
Transfer of shares evidenced by electronic or physical certificates, as the case may be, must be registered on the company’s share ledger. Only those holders registered on the share ledger are recognized as shareholders. Registration requires endorsement of the certificates or a written instruction from the holder. In the case of electronic certificates, the securities central depositary notifies us regarding the transfer of shares after registering it in its system.
All of our shares are currently deposited with the securities central depositary (
Deceval
).
On July 15, 2010, we entered into a stock purchase agreement with GE Consumer Finance Central Holdings Corp. and General Electric Capital Corporation (collectively, “GE Capital”), to acquire all of the outstanding shares of BAC Credomatic GECF Inc., a company incorporated under the laws of the British Virgin Islands, for U.S.$1.92 billion, subject to certain adjustments. BAC Credomatic is a Central American banking group. We completed the acquisition on December 9, 2010. See “Item 4. Information on the Company—B. Business overview—BAC Credomatic.” As part of the financing of this acquisition, our indirect subsidiary LB Panama entered into two U.S.$135 million (Ps 243.0 billion), totaling U.S.$270 million (Ps 486.0 billion), five-year term loans, respectively, with Bancolombia S.A. and Bancolombia Miami Agency at 180-day LIBOR plus 3.125% on November 26, 2010.
On November 24, 2010 Grupo Aval and Adminegocios & Cia. S.C.A., an entity controlled by Mr. Sarmiento Angulo, our controlling shareholder, entered into an agreement whereby Grupo Aval assigned to Adminegocios & Cia. S.C.A. its right to acquire up to 2,605,000 mandatorily convertible bonds issued by Banco de Bogotá (convertible into 5,542,553 shares of Banco de Bogotá shares).
Under the put/call agreement, we have an option to purchase from Adminegocios
& Cia. S.C.A., and they have the right to sell,
2,605,000 convertible bonds (or the underlying shares, if converted). In either case, the purchase price we will have to pay Adminegocios
& Cia. S.C.A.
is the subscription price paid by Adminegocios
& Cia. S.C.A.
at the time of acquiring the mandatorily convertible bonds issued by Banco de Bogotá, plus a premium of 6.5% per annum up to the date of acquisition. The options expire two years from
December 2, 2010
,
the date of first subscription of the mandatorily convertible bonds.
The mandatorily convertible bonds were acquired by Adminegocios & Cia. S.C.A. in order to finance the BAC Credomatic acquisition.
On January 31, 2011 we entered
into an
escisión
agreement with Rendifin S.A. to acquire 43.47% of Banco Popular’s outstanding shares held by Rendifin S.A. in exchange for 2,073,115,004 of our preferred shares. See “
Item 7. Major Shareholders and Related Party Transactions—B. Related party transactions—
Other transactions with Mr. Sarmiento Angulo and his affiliates—Banco Popular share ownership reorganization.”
On April 29, 2011, we entered into a second escisión agreement with Popular Securities S.A. and Inversiones Escorial S.A. to acquire an additional 19.57% of Banco Popular in exchange for 934,669,126 preferred shares. See
“Item 7. Major Shareholders and Related Party Transactions—B. Related party transactions—Other transactions with Mr. Sarmiento Angulo and his affiliates—Banco Popular share ownership reorganization.”
On February 1, 2012, we entered into an indenture in connection with the Grupo Aval Debt Offering and issued U.S.$600 million of 5.25% Senior Notes due 2017. The indenture was among us, as guarantor, Grupo Aval Limited, as Issuer, Deutsche Bank Trust Company Americas, as Trustee, Registrar, Paying Agent and Transfer Agent and Deutsche Bank Luxembourg S.A., as Luxembourg Paying Agent and Transfer Agent.
Restrictions on foreign investment in Colombia
Colombia’s foreign investment statute regulates the manner in which non-residents are permitted to invest in Colombia and participate in the Colombian securities market. Among other requirements, Colombian law requires foreign investors to register certain foreign exchange transactions with the Colombian Central Bank and obtain authorization for certain types of investments. Certain foreign exchange transactions, including those between residents and non-residents, must be made through authorized foreign exchange market participants.
Non-residents are permitted to hold portfolio investments in Colombia, through either a registered stock brokerage firm, a trust company or an investment firm. Investors would only be allowed to transfer dividends abroad after the foreign investment registration procedure with the Colombian Central Bank has been completed. The failure of a non-resident investor to report or register foreign exchange transactions with the Colombian Central Bank relating to investments in Colombia on a timely basis may prevent the investor from remitting dividends, or an investigation that may result in a fine, may be commenced.
The following summary contains a description of certain Colombian and U.S. federal income tax consequences of the acquisition, ownership and disposition of preferred shares. The summary is based upon the tax laws of Colombia and regulations thereunder and on the tax laws of the United States and regulations thereunder as of the date hereof, which are subject to change.
Colombian tax considerations
For purposes of Colombian taxation, residence consists of the continuous presence in the country for more than six-months either within a fiscal year or consecutive fiscal years, or the presence, whether or not continuous, in the country for more than six months within a fiscal year. Colombians who maintain their immediate family or their principal place of business in Colombia are considered residents for tax purposes, even if they are not present in the country during the fiscal year. For purposes of Colombian taxation, a legal entity is a resident of Colombia if it is organized under the laws of Colombia.
Pursuant to the Colombian Fiscal Statute, resident individuals and Colombian entities are subject to Colombian taxes on income earned in Colombia and worldwide, while non-resident individuals and foreign entities are only taxed on their Colombian-source income.
Taxation of dividends
In Colombia, dividends received by foreign companies or other foreign entities, non-resident individuals and successors of non-residents are not subject to income taxes, insofar as the profits from which they are paid have been taxed at the corporate level (Articles 48, 49 and 245 of the Fiscal Statute). However, if those profits were not taxed at the corporate level, the amount paid as a dividend will be subject to a withholding tax at a rate of 33% (or whatever is the income tax rate at the moment of the accrual or payment of dividends), according to Article 245 of the Fiscal Statute.
Foreign companies, foreign investment funds, and individuals that are not Colombian residents are not required by law to file an income tax return in Colombia either when the dividends received by them have been subject to withholding taxes or when dividends are paid out of profits subject to income tax at the corporate level.
Taxation of sales of shares
Pursuant to Article 36-1 of the Fiscal Statute, gains derived by a non-resident of Colombia from the sale of stock are not subject to income, withholding, remittance or other taxes in Colombia when the stock is listed in the Colombian Stock Exchange and the transaction does not involve the sale of 10% or more of the company’s outstanding stock by the same beneficial owner in the same taxable year.
The sale of stock by foreign institutional capital investment funds is not subject to income tax at the fund level nor at the unitholder level pursuant to Article 18-1 of the Fiscal Statute.
Other Colombian taxes
At the date of this annual report, there is no income tax treaty and no inheritance or gift tax treaty in effect between Colombia and the United States. There are no Colombian stamp, issue, registration, transfer or similar taxes or duties payable by holders of preferred shares.
According to Law 1430 of 2010, enacted on December 29, 2010, gains derived from the sale of derivatives that are considered securities under Colombian law are not subject to income, withholding, remittance or other taxes in Colombia when the underlying asset consists exclusively of shares that are listed on the Colombian Stock Exchange.
United States federal income taxation considerations for U.S. holders
In general
The following is a description of the material U.S. federal income tax consequences to the U.S. Holders described below of owning and disposing of our preferred shares, but it does not purport to be a comprehensive description of all tax considerations that may be relevant to a particular person’s decision to acquire the shares. This discussion applies only to a U.S. Holder that holds our preferred shares as capital assets for tax purposes. In addition, it does not describe all of the tax consequences that may be relevant in light of the U.S. Holder’s particular circumstances, including alternative minimum tax consequences and tax consequences applicable to U.S. Holders subject to special rules, such as:
|
|
·
|
certain financial institutions;
|
|
|
·
|
dealers in securities or currencies or traders in securities who use a mark-to-market method of tax accounting;
|
|
|
·
|
persons holding preferred shares as part of a hedging transaction, straddle, wash sale, conversion transaction or integrated transaction or persons entering into a constructive sale with respect to the preferred shares;
|
|
|
·
|
persons whose functional currency for U.S. federal income tax purposes is not the U.S. dollar;
|
|
|
·
|
entities classified as partnerships for U.S. federal income tax purposes;
|
|
|
·
|
tax-exempt entities, including “individual retirement accounts” or “Roth IRAs”;
|
|
|
·
|
persons that own or are deemed to own ten percent or more of our voting stock; and
|
|
|
·
|
persons holding our preferred shares in connection with a trade or business conducted outside of the United States.
|
If an entity that is classified as a partnership for U.S. federal income tax purposes holds our preferred shares, the U.S. federal income tax treatment of a partner will generally depend on the status of the partner and the activities of the partnership. Partnerships holding our preferred shares and partners in such partnerships should consult their tax advisers as to the particular U.S. federal income tax consequences of holding and disposing of the preferred shares.
This discussion is based on the Internal Revenue Code of 1986, as amended, or the Code, administrative pronouncements, judicial decisions, and final, temporary and proposed Treasury regulations, all as of the date hereof, any of which is subject to change, possibly with retroactive effect.
A “U.S. Holder” is a beneficial owner of our preferred shares who is:
|
|
·
|
a citizen or individual resident of the United States;
|
|
|
·
|
a corporation, or other entity taxable as a corporation, created or organized in or under the laws of the United States, any state therein or the District of Columbia; or
|
|
|
·
|
an estate or trust the income of which is subject to U.S. federal income taxation regardless of its source.
|
U.S. Holders should consult their tax advisers concerning the U.S. federal, state, local and foreign tax consequences of owning and disposing of our preferred shares in their particular circumstances.
Taxation of dividends
The preferred shares constitute equity of our company for U.S. federal income tax purposes. Therefore, subject to the passive foreign investment company, or PFIC, rules described below, distributions paid on our preferred shares will be treated as dividends to the extent paid out of our current or accumulated earnings and profits (as determined under U.S. federal income tax principles). Because we do not maintain calculations of our earnings and profits under U.S. federal income tax principles, it is expected that distributions generally will be reported to U.S. Holders as dividends. Subject to applicable limitations, dividends paid by qualified foreign corporations to certain non-corporate U.S. Holders in taxable years beginning before January 1, 2013 are subject to U.S. federal income tax at lower rates than other types of ordinary income if certain conditions are met. However, because our preferred shares are not tradable on an established securities market in the United States and there is no income tax treaty between Colombia and the United States, we do not expect to be a qualified foreign corporation for this purpose. Accordingly, dividends paid on our preferred shares will be taxed at ordinary income rates.
The amount of a dividend will include any amounts withheld by our company in respect of Colombian taxes. The amount of the dividend will generally be treated as foreign-source dividend income to U.S. Holders and will not be eligible for the dividends-received deduction generally available to U.S. corporations under the Code. Dividends will be included in a U.S. Holder’s income on the date actually or constructively received by the U.S. Holder. The amount of any dividend income paid in pesos will be the U.S. dollar amount calculated by reference to the exchange rate in effect on the applicable date of receipt, regardless of whether the payment is in fact converted into U.S. dollars. If the dividend is converted into U.S. dollars on the applicable date of receipt, a U.S. Holder should not be required to recognize foreign currency gain or loss in respect of the dividend income. A U.S. Holder may have foreign currency gain or loss if the dividend is converted into U.S. dollars after the date of receipt.
Subject to applicable limitations (including a minimum holding period requirement), some of which vary depending upon the U.S. Holder’s circumstances, Colombian income taxes withheld from dividends on preferred shares will be creditable against the U.S. Holder’s U.S. federal income tax liability. In lieu of claiming a foreign tax credit, U.S. Holders may, at their election, deduct foreign taxes, including the Colombian tax, in computing their taxable income, subject to generally applicable limitations under U.S. law. An election to deduct foreign taxes instead of claiming foreign tax credits applies to all taxes paid or accrued in the taxable year to foreign countries and possessions of the United States. The rules governing foreign tax credits are complex, and U.S. Holders should consult their tax advisers regarding the creditability of foreign taxes in their particular circumstances.
Sale or other taxable disposition of preferred shares
Subject to the PFIC rules described below, for U.S. federal income tax purposes, gain or loss realized on the sale or other taxable disposition of our preferred shares will be capital gain or loss, and will be long-term capital gain or loss if the U.S. Holder held the preferred shares for more than one year. The amount of the gain or loss will equal the difference between the U.S. Holder’s tax basis in the preferred shares disposed of and the amount realized on the disposition, in each case as determined in U.S. dollars. This gain or loss will generally be U.S.-source gain or loss for foreign tax credit purposes.
Passive foreign investment company rules
Based on proposed Treasury regulations, which are proposed to be effective for taxable years beginning after December 31, 1994, and on management estimates, we believe we were not a PFIC for U.S. federal income tax purposes for the 2011 taxable year. However, because the proposed Treasury regulations may not be finalized in their current form, because the application of the proposed regulations is not entirely clear and because the composition of our income and assets will vary over time, there can be no assurance that we were not or will not be a PFIC for any taxable year. The determination of whether we are a PFIC, however, is made annually and is based upon the composition of our income and assets (including, among others, entities in which we hold at least a 25% interest), and the nature of our activities. In general, we will be a PFIC for any taxable year in which at least 75% of our gross income is passive income, or at least 50% of the value (determined on a quarterly basis) of our assets is attributable to assets that produce or are held for the production of passive income.
If we are a PFIC for any taxable year during which a U.S. Holder held our preferred shares, any gain recognized by a U.S. Holder on a sale or other taxable disposition of preferred shares would be allocated ratably over the U.S. Holder’s holding period for the preferred shares. The amounts allocated to the taxable year of the sale or other disposition and to any year before we became a PFIC would be taxed as ordinary income. The amount allocated to all other taxable years would be subject to tax at the highest rate in effect for individuals or corporations, as appropriate, for that taxable year, and an interest charge would be imposed on the amount allocated to those taxable years. Further, any distribution in respect of preferred shares in excess of 125% of the average of the annual distributions on preferred shares received by the U.S. Holder during the preceding three years or the U.S. Holder’s holding period, whichever is shorter, would be subject to taxation as described immediately above with respect to gains. Certain elections may be available that would result in alternative treatments (such as mark-to-market treatment) of the preferred shares. U.S. Holders should consult their tax advisers to determine whether any of these elections would be available and, if so, what the consequences of the alternative treatments would be in their particular circumstances.
If we were a PFIC for any taxable year during which a U.S. Holder held the preferred shares, such U.S. Holder may be required to file a report containing such information as the U.S. Treasury may require.
Information reporting and backup withholding
Payments of dividends and sales proceeds that are made within the United States or through certain U.S.-related financial intermediaries generally are subject to information reporting, and may be subject to backup withholding, unless (1) the U.S. Holder is an exempt recipient or (2) in the case of backup withholding, the U.S. Holder provides a correct taxpayer identification number and certifies that it is not subject to backup withholding. The amount of any backup withholding from a payment to a U.S. Holder will be allowed as a credit against the holder’s U.S. federal income tax liability and may entitle it to a refund, provided that the required information is timely furnished to the Internal Revenue Service.
Certain U.S. Holders who are individuals may be required to report information relating to their ownership of an interest in certain foreign financial assets, including stock of a non-U.S. person, subject to certain exceptions (including an exception for stock held in custodial accounts maintained by a U.S. financial institution). Certain U.S. Holders who are entities may be subject to similar rules in the future. U.S. Holders should consult their tax advisers regarding their reporting obligations with respect to the preferred shares.
Dividend policy
The amount of dividends, if any, that we pay will be dependent, in large part, on the amount of dividends received from our subsidiaries. From 2007 to 2011, the amount of dividends that we have paid increased at a compound annual growth rate of 20.8%. Dividends are declared semi-annually in March and September of each year, and we do not declare dividends quarterly. Our subsidiaries declared Ps 711.4 billion in 2011 and Ps 533.5 billion in 2010 of dividends payable to us, and we declared an aggregate of Ps 790.3 billion in 2011 and 527.1 billion in 2010 of dividends to our shareholders.
The following table presents the net profits of, and dividends declared by, each of our banks and Porvenir, and the amount of dividends received by us from each of them during the periods indicated.
|
For the year ended December 31,
|
||||||||||||||||||||||||||||||||||||||||||||||||
|
2011
|
2010
|
2011
|
2010
|
2011
|
2010
|
2011
|
2010
|
2011
|
2010
|
2011
|
2010
|
|||||||||||||||||||||||||||||||||||||
|
Banco de
Bogotá
|
Banco de
Occidente
|
Banco
Popular
|
Banco
AV Villas
|
Porvenir
|
Total
|
|||||||||||||||||||||||||||||||||||||||||||
|
(in Ps billions, except percentages)
|
||||||||||||||||||||||||||||||||||||||||||||||||
|
Direct ownership interest held by Grupo Aval
|
64.4 | % | 65.3 | % | 68.2 | % | 68.0 | % | 93.7 | % | 30.7 | % | 79.9 | % | 79.9 | % | 20.0 | % | 20.0 | % | – | – | ||||||||||||||||||||||||||
|
Unconsolidated net profits
|
1,100 | 782 | 441 | 389 | 367 | 352 | 165 | 144 | 153 | 155 | 2,227 | 1,822 | ||||||||||||||||||||||||||||||||||||
|
Dividends declared
|
495 | 420 | 205 | 185 | 177 | 169 | 71 | 64 | 152 | 155 | 1,099 | 993 | ||||||||||||||||||||||||||||||||||||
|
Dividends contributed to Grupo Aval
|
319 | 275 | 140 | 126 | 166 | 52 | 57 | 51 | 30 | 31 | 711 | 534 | ||||||||||||||||||||||||||||||||||||
|
Dividends declared by Grupo Aval
|
790 | 527 | ||||||||||||||||||||||||||||||||||||||||||||||
The allocation of our distributable profits, if any, is determined by our common shareholders following approval of our semiannual financial statements. Our general shareholders’ meetings generally occur in March and September, three months after the close of the semiannual period. As such, dividends declared in one year may relate to the results of the previous year.
In the past we have paid dividends on a monthly basis. We have not, however, adopted a specific dividend policy with respect to future dividends. The amount of any distributions will depend on many factors, such as the results of operations and financial condition of our company and our subsidiaries, their cash requirements, their prospects and other factors deemed relevant by our board of directors and shareholders.
Our company pays dividends based on the results shown in our semi-annual unconsolidated audited financial statements prepared under Colombian GAAP for companies other than financial institutions. See “Presentation of Financial and Other Information—Financial statements.”
The principal differences between Colombian Banking GAAP and Colombian GAAP for companies other than financial institutions are the following:
|
|
·
|
Valuation of Investments in securities:
Under Colombian GAAP, all investments in debt securities are accounted for at book value, as opposed to Colombian Banking GAAP, according to which, depending on how the securities are classified, investments may be accounted for at market value. Therefore, in our financial statements prepared under Colombian GAAP, investments in debt securities that at the bank’s level had been accounted for at market value, are re-expressed at book value.
|
|
|
·
|
Deferred assets:
Under Colombian GAAP deferred assets are amortized in full on a yearly basis. Under Colombian Banking GAAP deferred assets can be amortized in periods longer than one year. Therefore, in our financial statements prepared under Colombian GAAP, the bank’s deferred assets are fully amortized each year.
|
In addition there are other differences related to the general provision for loans and inflation adjustments that do not have a material effect on our financial statements.
Net income as reported in our consolidated Colombian GAAP financial statements differed from net income as reported in our consolidated Colombian Banking GAAP financial statements by Ps 5.0 billion (0.4%) and Ps 114.8 billion (13.6%) for the years ended December 31, 2011 and 2010, respectively.
We expect that differences between Colombian GAAP and Colombian Banking GAAP will continue to occur in future periods.
The amount of dividends expected from our subsidiaries will also depend on the future share ownership in our subsidiaries.
Dividend history of Grupo Aval
The following table presents the annual cash dividends paid by Grupo Aval on each share during the periods indicated.
|
Dividends declared with respect to net income:
|
Cash dividends per share
|
Cash dividends
per share
|
||||||
|
(Ps)
|
(U.S.$)
|
|||||||
|
Year ended:
|
||||||||
|
2006
|
22.80 | 0.010 | ||||||
|
2007
|
26.58 | 0.013 | ||||||
|
2008
|
30.00 | 0.013 | ||||||
|
2009
|
33.24 | 0.016 | ||||||
|
2010
|
37.80 | 0.020 | ||||||
|
2011
|
42.60 | 0.022 | ||||||
Dividend history of our banking subsidiaries
The following tables set forth the annual cash dividends paid by each of our banks on each share during the periods indicated.
Banco de Bogotá
|
Dividends declared with respect to net income:
|
Cash dividends per share
|
Cash dividends
per share
|
||||||
|
(Ps)
|
(U.S.$)
|
|||||||
|
Year ended:
|
||||||||
|
2006
|
1,284.00 | 0.574 | ||||||
|
2007
|
1,392.00 | 0.691 | ||||||
|
2008
|
1,500.00 | 0.669 | ||||||
|
2009
|
1,566.00 | 0.766 | ||||||
|
2010
|
1,608.00 | 0.840 | ||||||
|
2011
|
1,728.00 | 0.889 | ||||||
Banco de Occidente
|
Dividends declared with respect to net income:
|
Cash dividends per share
|
Cash dividends
per share
|
||||||
|
(Ps)
|
(U.S.$)
|
|||||||
|
Year ended:
|
||||||||
|
2006
|
990.00 | 0.442 | ||||||
|
2007
|
1,107.00 | 0.549 | ||||||
|
2008
|
1,134.00 | 0.505 | ||||||
|
2009
|
1,158.00 | 0.566 | ||||||
|
2010
|
1,233.00 | 0.644 | ||||||
|
2011
|
1,314.00 | 0.676 | ||||||
Banco Popular
|
Dividends declared with respect to net income:
|
Cash dividends per share
|
Cash dividends
per share
|
||||||
|
(Ps)
|
(U.S.$)
|
|||||||
|
Year ended:
|
||||||||
|
2006
|
14.64 | 0.007 | ||||||
|
2007
|
15.09 | 0.007 | ||||||
|
2008
|
11.52 | 0.005 | ||||||
|
2009
|
16.98 | 0.008 | ||||||
|
2010
|
21.84 | 0.011 | ||||||
|
2011
|
22.92 | 0.012 | ||||||
Banco AV Villas
|
Dividends declared with respect to net income:
|
Cash dividends per share
|
Cash dividends
per share
|
||||||
|
(Ps)
|
(U.S.$)
|
|||||||
|
Year ended:
|
||||||||
|
2006
|
32.25 | 0.014 | ||||||
|
2007
|
308.06 | 0.153 | ||||||
|
2008
|
233.08 | 0.104 | ||||||
|
2009
|
249.06 | 0.122 | ||||||
|
2010
|
285.81 | 0.149 | ||||||
|
2011
|
315.00 | 0.162 | ||||||
Dividend history of Porvenir and Corficolombiana
The following tables presents the annual cash dividends paid by Porvenir and Corficolombiana during the periods indicated.
Porvenir
|
Dividends declared with respect to net income:
|
Cash dividends per share
|
Cash dividends
per share
|
||||||
|
(Ps)
|
(U.S.$)
|
|||||||
|
Year ended:
|
||||||||
|
2006
|
948.00 | 0.423 | ||||||
|
2007
|
744.00 | 0.369 | ||||||
|
2008
|
771.00 | 0.344 | ||||||
|
2009
|
1,301.98 | 0.637 | ||||||
|
2010
|
918.00 |
0.480
|
||||||
|
2011
|
972.00 | 0.500 | ||||||
Corficolombiana
|
Dividends declared with respect to net income:
|
Cash dividends per share
|
Cash dividends
per share
|
||||||
|
(Ps)
|
(U.S.$)
|
|||||||
|
Year ended:
|
||||||||
|
2006
|
1,153.62 | 0.515 | ||||||
|
2007
|
1,103.40 | 0.548 | ||||||
|
2008
|
1,038.00 | 0.463 | ||||||
|
2009
|
1,332.00 | 0.652 | ||||||
|
2010
|
882.00 | 0.461 | ||||||
|
2011
|
1,464.00 | 0.754 | ||||||
Dividend history of BAC Credomatic
As of December 31, 2011, BAC Credomatic had declared U.S.$189.6 of cash dividends per share.
General aspects involving dividends
The dividend periods may be different from the periods covered by the general balance sheet. At the general shareholders’ meeting, shareholders will determine such dividend periods, the effective date, the system and the place for payment of dividends.
Dividends declared on the shares of common and preferred shares will be payable to the record holders of those shares, as they are recorded on our stock registry, on the appropriate record dates as determined at the general shareholders’ meeting. However, pursuant to External Circular 13 of 1998 issued by the former Superintendency of Securities (currently, the Superintendency of Finance), if a shareholder sells shares during the ten business days immediately preceding the payment date, dividends corresponding to those shares will be paid by us to the seller.
The vote of at least 80.0% of the shares present and entitled to vote is required to approve the payment of dividends in shares; however, according to Law 222 of 1995, if a “situation of control” exists, whereby the decision-making power is subject to the will of another person or group of persons, a company may only pay dividends by issuing shares, to the shareholders that so accept.
Not applicable.
We are subject to the information requirements of the Exchange Act, except that as a foreign issuer, we will not be subject to the proxy rules or the short-swing profit disclosure rules of the Exchange Act. In accordance with these statutory requirements, we will file or furnish reports and other information with the SEC. You may inspect and copy reports and other information filed with the SEC at the Public Reference Room at 100 F Street NE, Washington, D.C. 20549. Information on the operation of the Public Reference Room may be obtained by calling the SEC at 1-800-SEC-0330. In addition, the SEC maintains an internet website that contains reports and other information about issuers, like us, that file electronically with the SEC. The address of that website is www.sec.gov.
Not applicable.
Risk management
The guiding principles of risk management at Grupo Aval and our banks have been the following:
|
|
·
|
collective decision making for commercial lending at the board level of each of our banks;
|
|
|
·
|
extensive and in-depth market knowledge, the result of our market leadership and our experienced, stable and seasoned senior management;
|
|
|
·
|
clear top-down directives with respect to:
|
|
|
·
|
compliance with know-your-customer policies; and
|
|
|
·
|
commercial loan credit structures based on the clear identification of sources of repayment and on the cash-flow generating capacity of the borrower;
|
|
|
·
|
use of common credit analysis tools and loan pricing tools across all our banks;
|
|
|
·
|
diversification of the commercial loan portfolio with respect to industries and economic groups;
|
|
|
·
|
specialization in consumer product niches;
|
|
|
·
|
extensive use of continuously updated rating and scoring models to ensure the growth of high-credit quality consumer lending;
|
|
|
·
|
use of our extensive market presence in the identification and implementation of best practices for operational risk management; and
|
|
|
·
|
conservative policies in terms of:
|
|
|
·
|
the trading portfolio composition, with a bias towards instruments with lower volatility;
|
|
|
·
|
proprietary trading; and
|
|
|
·
|
the variable remuneration of trading personnel.
|
Unless otherwise indicated, risk management figures for Banco de Bogotá consolidate financial data of BAC Credomatic. BAC Credomatic has in place its own risk management controls for credit risk, market risk and operational risk.
With respect to credit risk, BAC has a centralized structure with a Regional Risk Director reporting to the CEO of BAC, who chairs the Regional Credit Committee and is responsible for setting out credit policies and procedures applicable at the local (individual country) level and defining growth strategies in accordance with country risk. While local credit-risk managers report to the country head, compliance with the credit policies is reported directly to the Regional Risk Director.
With respect to market risk, there are Regional Investment Policies and Regional Asset and Liability Management Policies which set out the guidelines for establishing country risk and issuer limits as well as limits on foreign currency positions and general guidelines for the administration of liquidity, interest rate and exchange-rate risks. The establishment and administration of the regional policies is the responsibility of the Regional Asset and Liability Committee, which is comprised of BAC Credomatic board members.
Daily compliance to these policies in all countries is carried out with the investment portfolio control management module, which documents the entire investment process. The monitoring of exposures is the responsibility of the Regional Financial Director through the local assets and liabilities committees.
Operating Risk Management at BAC Credomatic is carried out using the conceptual methodology of Basel II guidelines and the elements of COSO integral risk management. A centralized operating risk management unit ensures that there are in place policies to ensure a standardized treatment of operating risks including methodologies for the timely recognition of the principal exposures, the ownership of operational risks by functional units, accountability throughout the organization and effective procedures to collect information on operational losses. The centralized operating risk committee is also responsible for putting in place an effective business continuity plan.
Credit risk
The credit-risk management process at all our banks takes into consideration the requirements of the Superintendency of Finance, the guidelines of Grupo Aval credit-risk management and the composition of each of the banks’ loan portfolio, which, in turn, is the result of the execution of each bank’s strategy.
Commercial lending
58.0% of our total loan portfolio is composed of commercial loans to corporate and small- and medium-sized enterprises. However, the level of commercial loans varies in each of our banks. At December 31, 2011, the proportion of commercial loans was 63.5%, 58.6%, 43.2% and 41.9% at Banco de Bogotá, Banco de Occidente, Banco Popular and Banco AV Villas, respectively.
The credit approval process for commercial loans at each of our banks follows the policies and lending authorities established by each bank. The highest lending authority at all banks, other than the board of directors, is the national credit committee (
Comité Nacional de Crédito
at Banco de Bogotá, Banco Popular and Banco AV Villas or
Comité de Crédito Dirección General
at Banco de Occidente), which has lending limits that range between Ps 2.0 billion (approximately U.S.$1.1 million) at Banco AV Villas and Ps 4.0 billion (approximately U.S.$2.2 million) at Banco de Bogotá and Banco de Occidente.
Following the approval of a transaction by the credit committee of any of our banks, information regarding the loan is sent to the Grupo Aval risk management committee if the loan would result in aggregate exposure to the borrower in excess of Ps 5.0 billion. For commercial loans, the credit approval process includes the presentation to the Grupo Aval risk management committee of all potential credit exposures per client that, across all of our banks, represent an exposure in excess of Ps 20.0 billion (approximately U.S.$10 million). This committee, which is composed of the vice presidents of credit of each of our banks and the risk management staff of Grupo Aval, meets on a weekly basis to discuss general developments in the industry and economy, risks and opportunities, and the structure of credit transactions, as well as to consult on and evaluate potential business opportunities. The committee consolidates requests for loans across all banks and evaluates our total exposure to potential borrowers. In each case, the committee evaluates the relevant bank’s application of its credit analysis policy and it may make recommendations with respect to the structure of the loan (such as guarantees, interest rates, commissions and covenants). The risk management committee will then submit the transaction to the Grupo Aval advisory board.
The Grupo Aval advisory board, which is composed of the presidents of our banks and the vice presidents of Grupo Aval, meets on a bimonthly basis to discuss the adoption of policies for risk management and how to accommodate clients with large credit needs, as well as to advise the banks with respect to defaults or other credit risk issues. The advisory board also evaluates transactions submitted to it by the Grupo Aval risk management committee for compliance with applicable policies and makes recommendations to the banks with respect to such loans. The boards of the banks make the ultimate decisions with respect to such loans.
In order to facilitate the analysis of commercial loans which meet the threshold and are thus reviewed by Grupo Aval, we have developed certain tools, including a standardized “
proyecto de crédito
,” a stand-alone document containing all of the information considered necessary for us to make a credit decision. We have also developed financial projection models and pricing models that assist us in analyzing potential loans and comparing the estimated return on a loan with that of a comparable risk-free instrument.
We seek to achieve a profitable, high-quality commercial loan portfolio and an efficient procedure for analyzing potential loans across our banks. To that end, we have established policies and procedures for the analysis and approval of potential commercial credit transactions that seek to focus lending on the following principles:
|
|
·
|
borrowers whose shareholders and management are, in our opinion, of the highest integrity (taking into account not only an analysis of the borrower’s credit profile but also their reputation in the business community and other factors);
|
|
|
·
|
borrowers which participate in key industries;
|
|
|
·
|
borrowers which are leaders or major players in the industries in which they participate;
|
|
|
·
|
transaction structures, including covenants and guarantees, which provide adequate protection; and
|
|
|
·
|
pricing which compensates adequately for capital invested and the market and credit risks incurred.
|
In addition, we make loans to public sector entities. For purposes of evaluating the extension of credit to public sector entities, our banks follow three criteria: (1) the loan must be used to finance an investment that has been approved by local authorities; (2) a source of repayment must be clearly identified, such as tax revenues; and (3) the source of repayment so identified must be pledged to secure the loan.
Consumer lending
Consumer lending represented 28.2% of the total loan portfolio at December 31, 2011; however, the participation and specialization by product varies in each of our banks. At December 31, 2011, Banco Popular consumer lending represented 53.1% of the total loan portfolio and was concentrated on payroll deduction loans (
libranzas
), a product in which it is the leader in Colombia. At Banco AV Villas and Banco de Bogotá, consumer lending represented 44.2% and 23.2% of their total loan portfolio, respectively. At Banco de Occidente, 19.1% of the total loan portfolio consisted of consumer loans, with motor vehicle financing representing 7.2% of the total loan portfolio.
The credit approval process for consumer loans at each of our banks follows the policies and lending authorities established by each bank. The highest lending authority at all banks, other than the board of directors, is the national credit committee (
Comité Nacional de Crédito
at Banco de Bogotá, Banco Popular and Banco AV Villas or
Comité de Crédito Dirección General
at Banco de Occidente), which have lending limits that range between Ps 2.0 billion (approximately U.S.$1.1 million) at Banco AV Villas, and Ps 4.0 billion (approximately U.S.$2.2 million) at Banco de Bogotá and Banco de Occidente.
For consumer banking, each bank has developed a business model designed to take into consideration the product offering. Banco Popular, for which payroll deduction loans represent 51.7%, has developed a business model which concentrates its analysis on the credit and operational risks of the payee (the employer) supported with statistical origination and behavior models. Banco AV Villas is the bank with the most diversified consumer loan portfolio. After being exclusively a mortgage lending institution until 2000, it has developed different niches in consumer lending. The fast growth of consumer lending with above average credit quality has been the result of the development of in-house statistical origination and behavior models and the development of a multiple view vintage analysis tool, which has allowed the sale of consumer loan products to the lower income population, which is a more profitable customer segment in which relatively few banks compete. Banco de Bogotá has successfully integrated Megabanco’s operations into its full-service consumer loan portfolio of credit cards, personal loans, automobile loans and overdrafts. Banco de Occidente has become a leader in motor vehicle financing by maintaining an independent motor vehicle financing unit which has developed its own statistical models and its own origination and collection strategies.
Mortgage lending
Mortgage lending represented 6.0% of the total loan portfolio at December 31, 2011, with Banco AV Villas being the only one of our banks with a significant participation. At Banco AV Villas mortgage lending represents 13.5% of its loan portfolio, a percentage that has decreased consistently since 2005 when it was 44.5%. Although the year-end balance of mortgage loans at Banco AV Villas has decreased consistently over the last five years, there have been new disbursals for approximately Ps 920.6 billion during this same period. In order to ensure an adequate mortgage loan portfolio quality, Banco AV Villas has developed statistical models for the origination and follow-up on new mortgage loans, which has resulted in a very low past due to total loan ratios for recently originated loans.
Financial leases
Financial leases represented 7.4% of the total loan portfolio at December 31, 2011 and corresponded to the financial leasing transactions processed through Banco de Bogotá’s, Banco de Occidente’s and Banco Popular
’
s respective leasing divisions and Leasing Corficolombiana, a subsidiary of Corficolombiana which consolidates with Banco de Bogotá. All leasing subsidiaries have independent credit approval processes and their own credit policies, which in turn are closely supervised by their parent companies.
Microcredit lending
Microcredit loans represented 0.4% of the total loan portfolio at December 31, 2011.
Credit classification and provisioning
Our banks continually engage in the determination of risk factors associated with their credit-related assets, through their duration, including restructurings. For such purposes, they have designed and adopted the SARC in accordance with Superintendency of Finance guidelines. The SARC has integrated credit policies and procedures for the administration of credit risks, models of reference for the determination and calculation of anticipated losses, provisions for coverage of credit risks and internal control procedures.
Our banks are required to classify the loan portfolio in accordance with the rules of the Superintendency of Finance, which established the following loan classification categories: “AA,” “A,” “BB,” “B,” “CC” and “Default,” depending on the strength of the credit and, after the loan is disbursed, its past due status.
Each bank reviews outstanding loan portfolio components under the above-mentioned criteria and classifies individual loans under the risk-rating categories below on the basis of minimum objective criteria, such as balance sheet strength, profitability and cash generation capacity. The classification of new commercial loans is made on the basis of these objective criteria. The criteria are also evaluated on an ongoing basis, together with loan performance, in reviewing the classification of existing commercial loans.
|
Category
|
Approval
|
Commercial loan portfolio
|
Consumer loan portfolio
|
|||
|
“AA”
|
New loans with risk rating at approval of “AA”
|
Outstanding loans and financial leases with past due payments not exceeding 29 days (i.e., between 0 and 29 days past due). The debtor’s financial statements or its projected cash flows, as well as all other credit information available to the financial subsidiaries, reflect excellent paying capacity.
|
Loans whose risk rating is “AA” according to the methodology of the Consumer Reference Model, or “MRCO,” as established by the Superintendency of Finance
|
|||
|
“A”
|
New loans with risk rating at approval of “A”
|
Outstanding loans and financial leases with delayed payments in excess of 30 days but not exceeding 59 days (i.e., between 30 and 59 days past due). The debtor’s financial statements or its projected cash flows, as well as all other credit information available to the financial subsidiaries, reflect appropriate paying capacity.
|
Loans whose risk rating is “A” according to the methodology of the MRCO as established by the Superintendency of Finance
|
|
Category
|
Approval
|
Commercial loan portfolio
|
Consumer loan portfolio
|
|||
|
“BB”
|
New loans with risk rating at approval of “BB”
|
Outstanding loans and financial leases past due more than 60 days but less than 90 days (i.e., between 60 and 89 days past due). Loans in this category are acceptably serviced and collateralized, but there are weaknesses which may potentially affect, on a transitory or permanent basis, the debtor’s ability to pay or its projected cash flows, to the extent that, if not timely corrected, would affect the normal collection of credit or contracts.
|
Loans whose risk rating is “BB” according to the methodology of the MRCO as established by the Superintendency of Finance
|
|||
|
“B”
|
New loans with risk rating at approval of “B”
|
Outstanding loans and financial leases past due over 90 days but less than 120 days (i.e., between 90 and 119 days past due). The debtor shows insufficient paying capacity of its obligations.
|
Loans whose risk rating is “B” according to the methodology of the MRCO as established by the Superintendency of Finance
|
|||
|
“CC”
|
New loans with risk rating at approval of “CC”
|
Outstanding loans and financial leases past due more than 120 days but less than 150 days (i.e., between 120 and 149 days past due). Loans in this category represent grave insufficiencies in the debtors’ paying capacity or in the project’s cash flow, which may compromise the normal collection of the obligations.
|
Loans whose risk rating is “CC” according to the methodology of the MRCO as established by the Superintendency of Finance
|
|||
|
“Default”
|
—
|
Outstanding loans and financial leases past due for 150 days or more. This category is deemed uncollectible. These loans are considered in default.
|
Consumer loan portfolio past due over 90 days
|
For new consumer loans, the banks use their internal statistical origination models to develop an initial classification category (“AA,” “A,” “BB,” “B” and “CC”). Once the loan is disbursed, the banks use formulas provided by the Superintendency of Finance, which incorporate payment performance of the borrower to calculate a score which in turn is used to determine the loan classification.
For financial leases the risk categories are established in the same manner as commercial or consumer loans.
For financial statement reporting purposes, the Superintendency requires that loans and leases be given a risk category on the scale of “A,” “B,” “C,” “D” and “E.” As a result, the risk classifications are aligned to the risk categories as follows.
|
Risk category
|
Risk classification
|
|
|
Commercial
|
Consumer
|
|
|
“A
|
“AA”
|
“AA”
|
|
“A” – between 0 and 30 days past due
|
||
|
“B”
|
“A”
|
“A” – more than 30 days past due
|
|
“BB”
|
“BB”
|
|
|
“C”
|
“B”
|
“B”
|
|
“CC”
|
“CC”
|
|
|
“D”
|
“Default”
|
“Default” – all other past due loans not classified in “E”
|
|
“E”
|
“Default”
|
“Default” – past due loans with a Loss given default (LGD) of 100% (1)
|
|
(1)
|
LGD is defined as a percentage to reflect the credit loss incurred if an obligor defaults. LGD for debtors depends on the type of collateral and would suffer a gradual increase in the percentage of loss according to the amount of days elapsing after being classified in each category. For this purpose, 100% of the collateral value is considered to cover the principal amount.
|
For our mortgage and microcredit loan portfolios the risk categories in effect at December 31, 2011, based on past due status, are as follows.
|
Category
|
Microcredit
|
Mortgage
|
||
|
“A” Normal Risk
|
In compliance or up to date and up to 30 days past due
|
In compliance or up to 60 days past due
|
||
|
“B” Acceptable Risk
|
Past due between 31 and 60 days
|
Past due between 61 and 150 days
|
||
|
“C” Appreciable Risk
|
Past due between 61 and 90 days
|
Past due between 151 and 360 days
|
||
|
“D” Significant Risk
|
Past due between 91 and 120 days
|
Past due between 361 and 540 days
|
||
|
“E” Uncollectable
|
Past due over 120 days
|
Past due over 540 days
|
Loan loss provisions
Our banks follow the norms of the Superintendency of Finance for the establishment of loan loss provisions. There are separate rules for commercial loans and leases, consumer loans and mortgage loans.
For commercial loans and financial leases, the process is as follows:
|
|
·
|
determination of the loan classification (“AA,” “A,” “BB,” “B,” “CC” or “Default”) based on the repayment capacity and payment record, among other considerations, of the borrower;
|
|
|
·
|
determination of the probability of default from tables provided by the Superintendency of Finance which take into account the loan classification (“AA” through “Default”) and the size of the borrower in terms of assets (large, medium or small business);
|
|
|
·
|
determining the loss given default based on the type of credit support (guarantees) and the past due status of the loan, using guides (tables) provided by the Superintendency of Finance; and
|
|
|
·
|
based on the expected loss given default and the exposure at default, the amount of the loan provision for the individual loan is determined and booked.
|
For consumer loans, the process is as follows:
|
|
·
|
determination of the loan classification (“AA,” “A,” “BB,” “B,” “CC” or “Default”) based on the score generated by the bank’s internal statistical origination model (for new loans) or on a score determined by a formula provided by the Superintendency of Finance, which incorporates the payment performance of the borrower;
|
|
|
·
|
determining the probability of default from tables provided by the Superintendency of Finance which take into account the loan classification (“AA” through “Default”);
|
|
|
·
|
determining the loss given default based on the type of credit support and past due status using tables provided by the Superintendency of Finance; and
|
|
|
·
|
based on the expected loss given default and the exposure at default, the amount of the loan provision for the individual loan is determined and booked.
|
For microcredit and mortgage loans, the provision as a percentage of the principal is determined in accordance with the following table.
|
Microcredit loans
|
Mortgage loans
|
|||||||||||||
|
Risk Category
|
Provision as % of principal
|
Provision as % of principal covered by guarantee
|
Provision as % of principal not covered by guarantee
|
|||||||||||
| “A” | 0.0 | 1.0 | 1.0 | |||||||||||
| “B” | 1.0 | 3.2 | 100.0 | |||||||||||
| “C” | 20.0 | 10.0 | 100.0 | |||||||||||
| “D” | 50.0 | 20.0 | 100.0 | |||||||||||
| “E” | 100.0 | 30.0 | 100.0 | |||||||||||
Liquidity risk
As a holding company, Grupo Aval’s liquidity requirements are limited to dividends, debt-service payments and operational expenses. Our liquidity is derived entirely from dividends from subsidiaries, which management believes is sufficient for these purposes. Grupo Aval is not required to maintain minimum liquidity positions. Subject to the capital requirements of each of our banks, there are no limitations on our banks’ ability to pay dividends to Grupo Aval.
Banks controlled by Grupo Aval are required to, and do, maintain adequate liquidity positions based on the Superintendency of Finance’s liquidity parameters, as follows:
|
|
·
|
Until 2009, banks were required to determine liquidity gap, which is the difference between the expected cash flow disbursements from assets and the expected cash flow disbursements from liabilities, classified by time bracket, including in the calculation of both on- and off-balance sheet assets and liabilities as well as contingent assets and liabilities. Cumulative liquidity gap is defined as the sum of liquidity gap for the current and previous periods.
|
|
|
·
|
Banks were generally required to have a positive three-month cumulative liquidity gap and, if this measure was negative, its absolute value was accounted for as “Liquidity Value at Risk.” No bank was allowed to have two consecutive evaluations of Liquidity Value at Risk which exceeded its “Net liquid assets” defined as net interbank loans, tradable debt securities that mature in more than three months, and available cash.
|
|
|
·
|
In 2009, a short-term liquidity index (
Indicador de Riesgo de Liquidez
), or “IRL,” that measures 7-, 15- and 30-day liquidity was established. This index is defined as the difference between adjusted liquid assets and net liquidity requirements. Liquid assets include total debt securities adjusted by market liquidity and exchange rate, excluding investments classified as “held to maturity” different from mandatory investments, and available cash. Net liquidity requirements are the difference between expected contractual asset and liability cash flows. Cash flows from past due loans are not included in this calculation.
|
Our banks have adequate liquidity, as shown in the following table. The three-month cumulative liquidity gap values for our banks for year-end 2011, 2010 and 2009 are those reported to the Superintendency of Finance and reflect unconsolidated figures for each of our banks.
|
Year ended December 31,
|
||||||||||||
|
Three-month cumulative liquidity position
|
2011
|
2010
|
2009
|
|||||||||
|
(in Ps billions)
|
||||||||||||
|
Banco de Bogotá
|
|
|
||||||||||
|
Total assets and contingencies
|
11,941 | 7,685 | 8,733 | |||||||||
|
Total liabilities, equity and contingencies
|
9,960 | 8,094 | 7,215 | |||||||||
|
Liquidity gap
|
1,981 | (409 | ) | 1,518 | ||||||||
|
Net liquid assets (NLA)
|
1,662 | 2,059 | 2,017 | |||||||||
|
Liquidity gap plus NLA
|
3,643 | 1,650 | 3,535 | |||||||||
|
Banco de Occidente
|
||||||||||||
|
Total assets and contingencies
|
5,692 | 4,183 | 3,998 | |||||||||
|
Total liabilities, equity and contingencies
|
3,917 | 2,874 | 2,309 | |||||||||
|
Liquidity gap
|
1,775 | 1,309 | 1,689 | |||||||||
|
Net liquid assets (NLA)
|
1,430 | 1,849 | 2,139 | |||||||||
|
Liquidity gap plus NLA
|
3,205 | 3,157 | 3,828 | |||||||||
|
Banco Popular
|
||||||||||||
|
Total assets and contingencies
|
2,361 | 2,602 | 1,841 | |||||||||
|
Total liabilities, equity and contingencies
|
855 | 1,429 | 1,416 | |||||||||
|
Liquidity gap
|
1,506 | 1,173 | 425 | |||||||||
|
Net liquid assets (NLA)
|
1,163 | 945 | 1,141 | |||||||||
|
Liquidity gap plus NLA
|
2,669 | 2,118 | 1,566 | |||||||||
|
Banco AV Villas
|
||||||||||||
|
Total assets and contingencies
|
1,354 | 1,511 | 1,146 | |||||||||
|
Total liabilities, equity and contingencies
|
1,561 | 2,025 | 1,592 | |||||||||
|
Liquidity gap
|
(207 | ) | (514 | ) | (446 | ) | ||||||
|
Net liquid assets (NLA)
|
809 | 1,074 | 681 | |||||||||
|
Liquidity gap plus NLA
|
602 | 560 | 234 | |||||||||
The following table shows the short-term liquidity index at December 31, 2011 and 2010 (the year in which this index was introduced) for each of our banks.
|
Banco de Bogotá
|
Banco de Occidente
|
Banco Popular
|
Banco AV Villas
|
|||||||||||||||||||||||||||||
|
At December 31,
|
||||||||||||||||||||||||||||||||
|
2011
|
2010
|
2011
|
2010
|
2011
|
2010
|
2011
|
2010
|
|||||||||||||||||||||||||
|
(in Ps billions)
|
||||||||||||||||||||||||||||||||
|
IRL – 7 days
|
6,345 | 4,587 | 2,709 | 2,255 | 2,740 | 1,795 | 2,026 | 1,045 | ||||||||||||||||||||||||
|
IRL – 15 days
|
6,013 | 4,015 | 2,363 | 1,999 | 2,407 | 1,479 | 1,759 | 943 | ||||||||||||||||||||||||
|
IRL – 30 days
|
5,395 | 2,846 | 1,677 | 1,403 | 1,781 | 880 | 1,639 | 392 | ||||||||||||||||||||||||
Operational risk management
The policies with respect to operational risk at Grupo Aval and our banks are directed at complying with the norms established by the Superintendency of Finance (which, in turn, follow the Basel II Accord of 2004), and the U.S. Sarbanes-Oxley Act of 2002. These norms require that Colombian banks establish a system for the administration of operational risks, or “SARO,” which includes the identification, measurement, control and monitoring functions as well as a business continuity plan.
In order to comply with these norms, each of our banks established within its organizational structure an operational risk unit independent of the operational and control areas of each bank. The responsibilities of these units are the establishment and definition of policies and methodologies and the procedures for communicating within each organization all information related to operational risk. In addition to the staff of each operational risk unit, the banks have established the role of operational risk advisors, which are employees in key areas who, in addition to their functional responsibilities, are required to report events or situations which may result in operational losses. Additionally, each bank has an operational risk management committee composed of selected
members of the board of directors, the internal auditor, external auditor and selected vice presidents, which meets on a quarterly basis to review operational risks policies and follow up on the execution of action plans.
At Grupo Aval, an operational risk management committee, composed of the heads of the operational risk units of each bank and staff of Grupo Aval risk management, was established. The principal activities of this committee, which meets on a semi-monthly basis, are as follows:
|
|
·
|
advisory in the engagement of external consultants for the identification of gaps with international standards and the development of work plans to close the gaps;
|
|
|
·
|
coordinated analysis of norms and the impact in each of Grupo Aval’s banks;
|
|
|
·
|
identification and application of best practices;
|
|
|
·
|
identification and implementation of operational risk management tools;
|
|
|
·
|
unification of criteria in the search of business continuity tools;
|
|
|
·
|
economies of scale in the engagement of consultants and the acquisition of tools; and
|
|
|
·
|
coordination in the preparation of requests for proposals and the evaluation of proposals.
|
We implement, from time to time, best practices that result from meetings of the Grupo Aval operational risk management committee.
Market risk management
Grupo Aval does not manage market risk at a consolidated level. Rather each bank monitors its market risk. Grupo Aval on an unconsolidated basis does not have material market risk; however, our banking subsidiaries have substantial market risk, primarily as a result of our banks’ lending, trading and investments businesses. The primary market risks to which we are exposed are interest rate risk, foreign exchange rate risk, variations in stock price risk and investment fund risk.
We are exposed to interest rate risk whenever there is a mismatch between interest-rate-sensitive assets and liabilities, subject to any hedging we have engaged in using interest rate swaps or other off-balance sheet derivative instruments. Interest rate risk arises in connection with both trading and non-trading activities.
We are exposed to foreign exchange rate risk as a result of mismatches between assets and liabilities, and off-balance sheet items denominated in different currencies. We are exposed to variations in stock price risk in connection with investments in equity securities, including our merchant banking investments. We are exposed to fund risk primarily from investments in mutual funds.
We and our banks’ respective boards of directors, through their risk management committees, are responsible for establishing policies, procedures and limits with respect to market risk. These committees also monitor overall performance in light of the risks assumed. These policies and procedures describe the control framework used by us and each of our banks to identify, measure and manage market risk exposures inherent in our and their activities. The main purpose of these policies and procedures is to set limits on risk. All risk managers within Grupo Aval must ensure that each business activity is performed in accordance with the policies established by the relevant bank and also Grupo Aval. These policies and procedures are followed in market risk decision-making in all business units and activities. All of our banks comply with the requirements of SARM (
Sistema de Administración de Riesgos de Mercado
) of the Superintendency of Finance.
Each bank is responsible for setting market risk limits and monitoring market risk.
Risk management personnel at Grupo Aval and each of our banks are responsible for the following:
|
|
·
|
identification, measurement and management of the market risk exposures inherent in their businesses;
|
|
|
·
|
analyzing exposures under stress scenarios;
|
|
|
·
|
confirming compliance with applicable risk management policies, reporting violations of such policies, and proposing new policies;
|
|
|
·
|
designing of methodologies for valuing securities and financial instruments; and
|
|
|
·
|
reporting daily to senior management as to the levels of market risk associated with trading instruments.
|
Tools for measuring and managing market risk
Our banks hold trading and non-trading instruments. Trading instruments are recorded in our banks’ “treasury books” and non-trading instruments are recorded in their “banking books.”
Trading instruments
Trading instruments include our proprietary positions in financial instruments held for sale and/or acquired to take advantage of current and/or expected differences between purchase and sale prices. The tables in this section include certain investments recorded under Colombian Banking GAAP in “Held to maturity” and recorded under U.S. GAAP in “Trading” and “Available for sale.” As a result of trading fixed income and floating rate securities, equity securities, investment funds and foreign exchange, we and our banks are exposed to interest rate, variations in stock prices, investment fund and foreign exchange rate risks, as well as volatility risk when derivatives are used. Our banks trade foreign exchange, fixed income instruments, floating rate securities and basic derivative instruments (forwards, options, cross currency swaps and interest rate swaps).
Our banks use VaR to measure their exposure to market risk in trading instruments. VaR is an estimate of the expected maximum loss in market value of a given portfolio over a time horizon at a specific confidence interval, subject to certain assumptions and limitations discussed below.
VaR models have inherent limitations, including the fact that they rely on historical data, which may not be indicative of future market conditions or trading patterns. As a result, VaR models could overestimate or underestimate the value at risk and should not be viewed as predictive of future results. Furthermore, our banks may incur losses materially in excess of the amounts indicated by the VaR models on a particular trading day or over a period of time. VaR does not calculate the greatest possible loss. In addition, VaR models are subject to the reasonable judgment of our bank’s risk management personnel.
Each bank’s board of directors, assets and liabilities committee, or “ALCO,” and risk management committee establishes the maximum VaR for each type of investment and for each type of risk using their own internal VaR models as well as the Superintendency of Finance methodology, or the regulatory VaR. Our banks use VaR estimates to alert senior management whenever the statistically estimated losses in the banks’ portfolios exceed pre-established levels. Limits on VaR are used to control exposure on a portfolio-by-portfolio basis.
In order to strictly control the trading portfolios, each entity has limits for every risk factor. To determine the limits, the impact of the variation (dollar value for 1 basis point or DV01) in each risk is taken into account. These risk limits are validated through stress testing based on historical extreme scenarios.
As described below, our banks measure interest rate risk, foreign exchange risk, variations in stock price risk and investment fund risk in accordance with VaR models. We use two types of approaches to measure VaR: (1) regulatory VaR methodology and (2) internal VaR models.
|
|
·
|
The regulatory VaR used in the calculation of the capital ratio (solvency ratio) follows the methodology established by the Superintendency of Finance. The Superintendency methodology is based on the Basel II model. The Superintendency of Finance has not made publicly available technical information on how it determines the volatilities used in this model, and only limited information is available. The volatilities used in the Superintendency of Finance’s model are of a magnitude similar to those observed in very high volatility or stress periods. These parameters are seldom changed by the Superintendency of Finance. See “—Regulatory VaR” below.
|
|
|
·
|
In addition, our banks use internal models to manage market risk. Parameters are set to adapt to the evolution of volatility of the risk factors over time using statistical methods to estimate them. Our banks generally give recent data more weight in calculations to reflect actual market conditions. The corporate governance bodies of our banks set limits based on this VaR measure in order to control the market risks. Parametric VaR and historical simulation methodologies are also used.
|
Regulatory VaR
The Regulatory VaR calculation is primarily used for the Superintendency of Finance’s solvency ratio calculations.
The Superintendency of Finance methodology is based on the Basel II model. This model applies only to the banks’ investment portfolio and excludes investments classified as “held to maturity” and any other non-trading positions included in the “Trading” and “Available for sale” portfolios. Total market risk is calculated on a daily basis by aggregating the VaR for each risk exposure category on a ten-day horizon using risk factors calculated in extreme market stress scenarios. VaR at month-end comprises part of the capital adequacy ratio calculation (as set forth in Decree 2555). The Superintendency of Finance’s rules require our banks to calculate VaR for the following risk factors: interest rate risk, foreign exchange rate risk, variations in stock price risk and fund risk; correlations between risk factors are not considered. The fluctuations in the portfolio’s VaR depend on sensitivity factors determined by the Superintendency of Finance, modified duration and changes in balances outstanding. The ten-day horizon is defined as the average time in which an entity could sell a trading position on the market.
The VaR calculation for each bank is the aggregate of the VaR of the bank and its subsidiaries. Trust companies (
fiduciarias
), our pension and severance fund manager, Porvenir, and our brokerage firm, Casa de Bolsa, are not included in this calculation as the risk of their proprietary portfolios is not material to Grupo Aval.
Interest Rate Risk
Our banks’ exposure to interest rate risk in their trading portfolios primarily arises from investments in securities (floating and fixed rate) and derivative instruments. In accordance with the Superintendency of Finance rules, our banks calculate interest rate risk for positions in pesos, foreign currency and UVRs separately. UVR is a Colombian inflation-adjusted monetary index calculated by the board of directors of the Colombian Central Bank and generally used for pricing home-mortgage loans. The interest rate risk model is designed to measure the risk of loss arising from changes in market interest rates. It includes the sum of the net short or long position in the whole trading book, a proportion of the matched positions in each time band (the “vertical disallowance”) and a proportion of the matched positions across different time bands (the “horizontal disallowance”). The interest rate sensitivity factors and vertical and horizontal disallowances are not updated frequently by the Superintendency of Finance because those are calculated based on extreme historical market situations;
the most recent update was made in November 2010 and published in External Circular 42.
A significant portion of the market risk of our banks is interest rate risk VaR as quantified in the tables below. The interest rate risk of our banks is primarily generated by long positions held in Peso-denominated Colombian government debt. Our banks have a preference for these securities as the government debt market is the largest and most developed of the local financial markets. Additionally, government debt securities support the liquidity management of our banks as they are eligible for Colombian Central Bank overnight repo funding and are classified as high-quality liquid assets. Government debt securities also carry a zero weight for capital adequacy calculations making them attractive in terms of utilization of capital. These factors provide a strong incentive for our banks to invest in government debt securities and diversify less into other debt securities that do not possess these characteristics.
Foreign exchange rate risk
Our banks use a sensitivity factor to calculate the probability of losses as a result of fluctuations in currencies in which our banks hold positions. Regulatory VaR is computed daily by multiplying the net position by the maximum probable variation in the price of such positions on a ten-day horizon, determined by the Superintendency of Finance as shown in the following table.
|
U.S. dollar
|
5.5%
|
|
Euro
|
6.0%
|
|
Other currencies
|
8.0%
|
Our banks’ exposure to foreign exchange rate risk arises primarily from changes to the U.S. dollar/peso exchange rate. Our banks use an approximation to estimate the risk in exchange-rate-related option positions based on delta, gamma and vega sensitivities, which is included in foreign exchange risk.
The foreign exchange rate risk VaR calculation under the standard model of the Superintendency of Finance includes both the trading and non-trading book.
Equity price risk
In determining regulatory VaR variations in stock price risk, certain investments are excluded: (a) equity investments in financial institutions that are supervised by the Superintendency of Finance and (b) equity investments derived from corporate restructuring processes (under Law 550 of 1999) or received as in-kind payment for non-performing loans. In addition, as part of the solvency ratio calculation, equity investments in entities supervised by the Superintendency of Finance that do not consolidate are deducted from primary capital. Investments in entities that consolidate but are not supervised by Superintendency of Finance (non-financial investment) are included in VaR calculations.
Variations in stock price risk in Grupo Aval come primarily from Corficolombiana’s non-financial investment portfolio. This risk is factored into Banco de Bogotá variations in stock price risk VaR as it consolidates Corficolombiana and is excluded from Banco de Occidente’s and Banco Popular’s variations in stock price risk calculation.
The Superintendency of Finance’s methodology for determining VaR for variations in stock price risk outlined above results in the inclusion of Corficolombiana’s consolidated and non-consolidated equity investments in non-financial institutions.
In December 2010, the Superintendency of Finance issued a revised methodology that excludes from the VaR calculation investments that are available-for-sale equity securities that are acquired as strategic investments and intended to be held on a long-term horizon. Grupo Aval has historically considered in its internal models that Corficolombiana’s
consolidated equity investments and our investments that are held on a long-term horizon should have more limited variations in stock price risk on us.
Variations in stock price risk VaR is computed daily by multiplying the net position by the maximum probable variation in the price of such positions on a ten-day horizon, determined by the Superintendency of Finance to be 14.7%. This coefficient is based on historic volatilities and is seldom adjusted.
Investment fund risk
Investment fund risk comes from temporary investment of cash in portfolios managed by trust companies.
Investment fund risk VaR is computed daily by multiplying the net position by the maximum probable variation in the price of such positions on a ten-day horizon, determined by the Superintendency of Finance to be 14.7%.
The following tables show the VaR calculation relating to each of the risk factors described above and based on the Superintendency of Finance Methodology for the years ended December 31, 2011 and December 31, 2010, for a ten-day horizon for each of our banks. The averages, minimums and maximums are determined based on end-of-the-month calculations.
Banco de Bogotá
|
Year ended December 31,
|
At December 31,
|
|||||||||||||||||||
|
2011
|
2010
|
|||||||||||||||||||
|
Period end
|
Average
|
Maximum
|
Minimum
|
Period end
|
||||||||||||||||
|
(in Ps millions)
|
||||||||||||||||||||
|
Interest rate risk VaR
|
441,638 | 419,458 | 451,582 | 377,127 | 457,187 | |||||||||||||||
|
Foreign exchange rate risk VaR
|
23,339 | 23,138 | 31,143 | 19,381 | 11,205 | |||||||||||||||
|
Variations in stock price risk VaR
|
15,911 | 35,853 | 47,569 | 15,703 | 32,011 | |||||||||||||||
|
Fund risk VaR
|
85,161 | 74,723 | 92,588 | 2,115 | 2,565 | |||||||||||||||
|
Total market risk VaR
|
566,049 | 553,172 | 613,519 | 485,994 | 502,968 | |||||||||||||||
Banco de Occidente
|
Year ended December 31,
|
At December 31,
|
|||||||||||||||||||
|
2011
|
2010
|
|||||||||||||||||||
|
Period end
|
Average
|
Maximum
|
Minimum
|
Period end
|
||||||||||||||||
|
(in Ps millions)
|
||||||||||||||||||||
|
Interest rate risk VaR
|
63,893 | 73,348 | 81,902 | 63,893 | 76,537 | |||||||||||||||
|
Foreign exchange rate risk VaR
|
596 | 604 | 992 | 86 | 2,440 | |||||||||||||||
|
Variations in stock price risk VaR
|
12 | 298 | 773 | 11 | 776 | |||||||||||||||
|
Fund risk VaR
|
– | 4 | 48 | – | – | |||||||||||||||
|
Total market risk VaR
|
64,502 | 74,253 | 83,012 | 64,502 | 79,753 | |||||||||||||||
Banco Popular
|
Year ended December 31,
|
At December 31,
|
|||||||||||||||||||
|
2011
|
2010
|
|||||||||||||||||||
|
Period end
|
Average
|
Maximum
|
Minimum
|
Period end
|
||||||||||||||||
|
(in Ps millions)
|
||||||||||||||||||||
|
Interest rate risk VaR
|
99,298 | 116,054 | 132,938 | 99,298 | 137,945 | |||||||||||||||
|
Foreign exchange rate risk VaR
|
1,128 | 1,403 | 2,123 | 910 | 1,777 | |||||||||||||||
|
Variations in stock price risk VaR
|
12 | 461 | 1,391 | 11 | 1,345 | |||||||||||||||
|
Fund risk VaR
|
697 | 756 | 813 | 690 | 712 | |||||||||||||||
|
Total market risk VaR
|
101,134 | 118,674 | 136,814 | 101,134 | 141,780 | |||||||||||||||
Banco AV Villas
|
Year ended December 31,
|
At December 31,
|
|||||||||||||||||||
|
2011
|
2010
|
|||||||||||||||||||
|
Period end
|
Average
|
Maximum
|
Minimum
|
Period end
|
||||||||||||||||
|
(in Ps millions)
|
||||||||||||||||||||
|
Interest rate risk VaR
|
54,775 | 60,620 | 71,449 | 50,418 | 50,294 | |||||||||||||||
|
Foreign exchange rate risk VaR
|
119 | 126 | 150 | 116 | 149 | |||||||||||||||
|
Variations in stock price risk VaR
|
– | – | – | – | – | |||||||||||||||
|
Fund risk VaR
|
2 | 2 | 3 | 2 | 2 | |||||||||||||||
|
Total market risk VaR
|
54,896 | 61,508 | 71,569 | 50,570 | 50,446 | |||||||||||||||
Banco Popular’s regulatory VaR is greater than Banco de Occidente’s despite having portfolios of similar values, which is explained by Banco Popular’s average duration being greater than four years while Banco de Occidente’s is less than two years.
Banco de Bogotá’s fund risk VaR increased to Ps 85.2 billion at December 31, 2011 from Ps 2.6 billion at December 31, 2010. This was due to the fact that Corficolombiana recorded in February 2011 an investment security in a private investment fund, which is directed by Corredores Asociados. At December 31, 2011, this exposure is Ps 561.3 billion.
Internal models for VaR calculation
In addition to Regulatory VaR, our banks use internal models to measure VaR in order to determine and control their main risks under normal operating conditions. In particular, all of our banks use internal models to oversee the interest rate risk of their investment portfolio. Banco de Bogotá, Banco de Occidente and Banco Popular use internal models to measure VaR of their full investment portfolio on a daily basis, while Banco AV Villas uses an internal model to measure VaR only for a government bond position.
We use methodologies such as Parametric VaR and historical simulation. The Parametric VaR, which is based on Riskmetrics Group, Inc.’s methodology, involves the identification of specific risks, such as interest and exchange rate risks that could affect the value of assets included in the trading book. The volatility of each factor, measured as a standard deviation, and the correlation with other factors are determined by using an exponentially weighted moving average, or “EWMA,” model. Once this is determined, the expected cash flow of each security included in the portfolio is determined. These cash flows are classified into categories for each risk identified and multiplied by the corresponding volatility to calculate the VaR per factor. The VaR for the various factors is then aggregated using a correlation matrix to identify the overall standard deviation of the bank’s treasury book. The VaR of the bank’s treasury book is determined based on the standard deviation subject to a confidence level of 99% and a one-day horizon.
The historical simulation calculates daily VaR based on the historical behavior of the one-day variations of prices in the market. This methodology does not assume any statistical distribution function for the earnings and loss of a portfolio. This simulation assumes that the market is stable during a period of time and infers the market’s future behavior based on historical data.
Back testing is required by the Superintendency of Finance to establish the validity of the internal models used for VaR calculations. The Superintendency of Finance requires two sets of tests: so called “dirty tests,” which compare the value at risk estimated for the day against the result effectively obtained (profit and loss) of the same day using the previous day’s portfolio; and “clean tests,” which compare the value at risk estimated for the day against an estimated result (profit and loss) based on the previous day’s portfolio. These tests are performed on a daily basis, although the requirement for the “clean” test is on a monthly basis. The methodology and results of these tests are available for review by the Superintendency of Finance.
The following table shows the interest rate VaR calculation based on internal models for 2011 and 2010 on a ten-day horizon (using an adjustment factor applied to VaR on a one day horizon). The values presented for Banco AV Villas were calculated on Banco de Bogotá’s model. Values for all other banks are based on their internal models. The averages, minimums and maximums are determined based on daily calculations except for BAC Credomatic, which are determined based on end-of-the-quarter calculations.
Interest rate risk VaR (per internal model)
|
Banco de Bogotá
|
Banco de Occidente
|
Banco
Popular (1)
|
Banco AV Villas
|
|||||||||||||
|
(in Ps millions)
|
||||||||||||||||
|
2011
|
||||||||||||||||
|
As of December 31
|
94,009 | 27,202 | 13,637 | 8,862 | ||||||||||||
|
Average
|
128,656 | 35,743 | 20,819 | – | ||||||||||||
|
Maximum
|
215,633 | 54,312 | 35,643 | – | ||||||||||||
|
Minimum
|
79,093 | 22,029 | 12,631 | – | ||||||||||||
|
2010
|
||||||||||||||||
|
As of December 31
|
169,265 | 45,667 | 27,465 | 11,984 | ||||||||||||
|
(1)
|
Banco Popular’s internal VaR data reflects Banco Popular’s unconsolidated results. The regulatory VaR, however corresponds to consolidated figures. Banco Popular (unconsolidated) accounts for over 98% of the consolidated regulatory VaR at year-end 2011 and 2010. Banco Popular’s VaR results are lower than Banco de Occidente’s as a significant portion of Banco de Occidente’s portfolio is held in foreign currencies through its subsidiaries in Panama and the Bahamas, resulting in increased volatility. In comparison, an immaterial amount of Banco Popular’s portfolio is denominated in foreign currencies.
|
Considerations on equity price risk regulatory VaR
As stated above, variations in equity price risk measured based on the regulatory VaR methodology include both equity investments held for trading and others held with a long-term horizon. In addition, it does not discriminate between listed and unlisted equity investments or between those which consolidate and those which do not. It focuses on investments in non-financial institutions. VaR calculated under this methodology is higher than VaR calculated with a methodology that focuses on equities held for trading.
Holding periods for many of Corficolombiana’s equity investments exceed ten years. Its largest investments have remained in the portfolio for several years and are intended to remain as permanent investments.
Equity price risk regulatory VaR decreased by Ps 16.1 billion to Ps 15.9 billion in December 31, 2011 from Ps 32.0 billion in December 31, 2010. The reason for this decrease has been the change in classification of investments such as Proenergía and SIE.
The following table breaks down our investments subject to regulatory VaR by time since initial investment at December 31, 2011 and 2010.
|
At December 31,
|
||||||||||||||||||||||||
|
2011
|
2010
|
|||||||||||||||||||||||
|
Investment subject to Regulatory VaR
|
Regulatory VaR
|
Percentage
of
portfolio
|
Investment subject to Regulatory VaR
|
Regulatory VaR
|
Percentage of
portfolio
|
|||||||||||||||||||
|
Less than 18 months
|
– | – | – | – | – | – | ||||||||||||||||||
|
18 - 36 months
|
– | – | – | – | – | – | ||||||||||||||||||
|
More than 36 months
|
106,499 | 15,655 | 100.0 | % | 207,724 | 30,535 | 100.0 | % | ||||||||||||||||
|
Total
|
106,499 | 15,655 | 100.0 | % | 207,724 | 30,535 | 100.0 | % | ||||||||||||||||
Non-trading instruments
Non-trading instruments consist primarily of loans and deposits. Our banks’ primary market risk exposure in their non-trading instruments is interest rate risk, which arises from the possibility of changes in market interest rates. Such changes in market interest rates affect our banks’ net interest income due to timing differences on the repricing of their assets and liabilities. Our banks are also affected by gaps in maturity dates and interest rates in the different asset and liability accounts. As part of their management of interest rate risk, our banks analyze the interest rate mismatches between their interest earning assets and their interest-bearing liabilities.
Superintendency of Finance rules require our banks to measure foreign exchange rate risk VaR not only for treasury book positions but also for all assets and liabilities denominated in foreign currencies. Our non-trading instruments are exposed to foreign exchange rate risk primarily from loans and deposits denominated in dollars. This foreign exchange rate risk is monitored under the VaR methodology described above.
Sensitivity of fair value is determined using either one of two methodologies: (1) determining the difference between the fair value and the net present value of the expected cash flows using a discount rate of 50 basis points and 100 basis points higher than that used for the original calculation; or (2) determining the sensitivity of the remaining cash flows (modified duration), multiplied by the fair value, multiplied by the increase in discount rate for each scenario (50 basis points and 100 basis points). Methodology 1 is in some cases more precise while methodology 2 is a good approximation for moderate variations in the discount rate.
Sensitivity of certain instruments is assumed to be zero because its fair value is equal to its book value as instruments with maturities of 90 days or less, or loans and borrowings from development banks.
Our sensitivity analysis methodology should be interpreted in light of the following limitations: (1) we have assumed a uniform interest rate change for assets and liabilities of varying maturities; and (2) we have assumed that the modified duration of variable rate assets and liabilities is the time remaining until the next interest reset date.
An increase in interest rates negatively affects the value of our banks’ assets and positively affects the value of our banks’ liabilities, as an increase in interest rates decreases the fair value of both assets and liabilities.
The following table presents our sensitivity analysis based on hypothetical changes of 50 and 100 basis point shifts in interest rates on the net present value of interest rate sensitive assets and liabilities for the periods indicated.
|
December 31, 2011
|
December 31, 2010
|
|||||||||||||||||||||||
|
Grupo Aval (aggregated) (1)
|
Fair value
|
+50 basis points
|
+100 basis points
|
Fair value
|
+50 basis points
|
+100 basis points
|
||||||||||||||||||
|
(in Ps millions)
|
||||||||||||||||||||||||
|
Assets
|
||||||||||||||||||||||||
|
Held-to-maturity securities
|
2,965,733 | (12,674 | ) | (25,298 | ) | 2,883,816 | (18,488 | ) | (36,909 | ) | ||||||||||||||
|
Loans
|
72,638,770 | (567,306 | ) | (1,086,986 | ) | 58,617,120 | (467,106 | ) | (942,599 | ) | ||||||||||||||
|
Short-term funds
|
2,944,277 | – | – | 2,351,050 | – | – | ||||||||||||||||||
|
Customer’s acceptances
|
116,625 | – | – | 57,018 | – | – | ||||||||||||||||||
|
Total interest rate sensitive assets
|
78,665,404 | 579,980 | 1,112,284 | 63,909,177 | (485,593 | ) | (979,508 | ) | ||||||||||||||||
|
Liabilities
|
||||||||||||||||||||||||
|
Checking accounts, savings deposits and other
|
50,055,718 | – | – | 45,256,723 | – | – | ||||||||||||||||||
|
Time deposits
|
22,731,759 | (67,833 | ) | (140,008 | ) | 18,667,732 | (41,111 | ) | (81,966 | ) | ||||||||||||||
|
Bank acceptances outstanding
|
123,075 | – | – | 59,812 | – | – | ||||||||||||||||||
|
Short-term funds
|
3,244,247 | – | – | 2,481,088 | – | – | ||||||||||||||||||
|
Borrowings from banks
|
11,563,521 | (53,775 | ) | (105,705 | ) | 10,490,661 | (69,060 | ) | (135,765 | ) | ||||||||||||||
|
Long-term debt
|
6,799,462 | (70,279 | ) | (138,891 | ) | 8,096,192 | (70,605 | ) | (139,557 | ) | ||||||||||||||
|
Total interest rate sensitive liabilities
|
94,517,782 | (191,887 | ) | (384,605 | ) | 85,052,208 | (180,776 | ) | (357,288 | ) | ||||||||||||||
|
Total net change
|
(15,852,377 | ) | (388,093 | ) | (727,679 | ) | (21,143,030 | ) | (304,817 | ) | (622,220 | ) | ||||||||||||
|
(1)
|
Grupo Aval aggregated reflects the sum of the fair values of each of our banking subsidiaries and of Grupo Aval.
|
Not applicable.
Not applicable.
Not applicable.
Not applicable.
No matters to report.
No matters to report.
Not applicable.
As of December 31, 2011, under the supervision and with the participation of our management, including our President and Chief Financial Officer, we performed an evaluation of the effectiveness of the design and operation of our disclosure controls and procedures (as defined in Rule 13a-15(e) under the Exchange Act). There are inherent limitations to the effectiveness of any disclosure controls and procedures system, including the possibility of human error and circumventing or overriding them. Even if effective, disclosure controls and procedures can provide only reasonable assurance of achieving their control objectives.
Based on such evaluation, our President and Chief Financial Officer concluded that our disclosure controls and procedures are effective to provide reasonable assurance that the information we are required to disclose in the reports we file or submit under the Exchange Act is (1) recorded, processed, summarized and reported within the time periods specified in the SEC’s rules and forms and (2) accumulated and communicated to our management to allow timely decisions regarding required disclosures.
Our management is responsible for establishing and maintaining an adequate internal control over financial reporting as defined in Rule 13a-15(f) under the Exchange Act.
Our internal control over financial reporting is a process designed by, or under the supervision of, our principal executive and principal financial officers, management and other personnel, to provide reasonable assurance regarding the reliability of financial reporting and the preparation of our financial statements for external reporting purposes, in accordance with generally accepted accounting principles. These include those policies and procedures that:
|
|
·
|
pertain to the maintenance of records that, in reasonable detail, accurately and fairly reflect transactions and dispositions of our assets;
|
|
|
·
|
provide reasonable assurance that transactions are recorded as necessary to permit preparation of financial statements, in accordance with generally accepted accounting principles, and that receipts and expenditures are being made only in accordance with authorization of our management and directors; and
|
|
|
·
|
provide reasonable assurance regarding prevention or timely detection of unauthorized acquisition, use or disposition of our assets that could have a material effect on our financial statements.
|
Because of its inherent limitations, internal control over financial reporting may not prevent or detect misstatements. Therefore, effective control over financial reporting cannot, and does not, provide absolute assurance of achieving our control objectives. Also, projections of, and any evaluation of effectiveness of the
internal controls in future periods are subject to the risk that controls may become inadequate because of changes in conditions, or that the degree of compliance with the policies or procedures may deteriorate.
We have adapted our internal control over financial reporting based on the guidelines set by the Internal Control – Integrated Framework of the Committee of Sponsoring Organizations of the Treadway Commission (“COSO”).
Under the supervision and with the participation of our management, including our President, our Chief Financial Officer, our Chief Risk Management Officer and our Vice-President of Internal Control, we conducted an evaluation of the effectiveness of our internal control over financial reporting as of December 31, 2011, based on the guidelines set forth by the COSO.
Based on this assessment, management believes that, as of December 31, 2011, its internal control over financial reporting was effective based on those criteria.
Not applicable.
There was no change in our internal control over financial reporting that occurred during the period covered by this annual report that has materially affected, or is reasonably likely to materially affect, our internal control over financial reporting.
Our audit committee currently consists of three members appointed by the board of directors: Antonio José Urdinola Uribe, Guillermo Fernandez de Soto and Esther América Paz Montoya. The board of directors has determined that Esther América Paz Montoya is an audit committee financial expert. While Grupo Aval is not a listed issuer, Esther América Paz Montoya and Antonio José Urdinola Uribe are independent audit committee members under the standards of the New York Stock Exchange, which applies the audit committee independence requirements of the Securities and Exchange Commission.
We have not adopted a written code of ethics because Colombian law does not require us to have a code of ethics.
Amounts paid to KPMG Ltda., for audit and other services were as follows:
|
2011
|
2010
|
|||||||
|
(In Ps millions)
|
||||||||
|
Audit fees
|
53.5 | 52.2 | ||||||
|
Audit-related fees
|
3,609.6 | 4,684.3 | ||||||
|
Tax fees
|
– | – | ||||||
|
Other fees paid
|
– | – | ||||||
The aggregate fees billed under the caption audit fees for professional services rendered to Grupo Aval for the audit of its financial statements and for services that are normally provided to Grupo Aval, in connection with statutory or regulatory filings or engagements totaled Ps 53.5 million and Ps 52.2 million for the years 2011 and 2010, respectively.
Additionally other audit-related fees totaled Ps 3,609.6 million and Ps 4,684.3 million for the years ended 2011 and 2010, respectively. Grupo Aval paid no tax fees or other fees for the years 2011 and 2009, respectively.
The services commissioned from our auditors meet the independence requirements stipulated by the Colombian Central Bank and by SEC rules and regulations, and they did not involve the performance of any work that is incompatible with the audit function.
If we are required to engage an auditing firm for audit and audit-related services, those services have to be pre-approved by the Audit Committee.
The Audit Committee is regularly informed of all fees paid to the auditing firms by us.
Not applicable.
Grupo Aval may repurchase its shares only with retained earnings. On the other hand, Colombian law prohibits the repurchase of shares of entities under the comprehensive supervision of, and subject to inspection and surveillance as financial institutions by, the Superintendency of Finance. As such, Banco de Bogotá, Banco de Occidente, Banco Popular, Banco AV Villas, and their respective financial subsidiaries, including Porvenir and Corficolombiana are not permitted to repurchase their shares or Grupo Aval’s shares.
The following table reflects purchases of our preferred stock by us or our affiliates in 2011.
|
2011
|
Total Number of Shares Purchased
|
Average Price Paid per Share
in
Ps (1)
|
Total Number of Shares Purchased as Part of Publicly Announced Plans or Programs
|
Approximate Value in Ps billions of Shares that May Yet Be Purchased Under the Plans or Programs (1)
|
||||||||||||
|
January 1 to January 31
|
– | – | – | – | ||||||||||||
|
February 1 to February 28 (2)
|
– | – | – | – | ||||||||||||
|
March 1 to March 31
|
– | – | – | – | ||||||||||||
|
April 1 to April 30
|
– | – | – | – | ||||||||||||
|
May 1 to May 31 (3) (4)
|
12,508,782 | 1,292.5 | 12,508,782 | 13.8 | ||||||||||||
|
June 1 to June 30 (4)
|
8,523,969 | 1,282.6 | 8,523,969 | 2.8 | ||||||||||||
|
July 1 to July 31
|
– | – | – | 2.8 | ||||||||||||
|
August 1 to August 31
|
– | – | – | 2.8 | ||||||||||||
|
September 1 to September 30
|
– | – | – | 2.8 | ||||||||||||
|
October 1 to October 31
|
– | – | – | 2.8 | ||||||||||||
|
November 1 to November 30
|
– | – | – | 2.8 | ||||||||||||
|
December 1 to December 31
|
– | – | – | 2.8 | ||||||||||||
|
Total
|
21,032,751 | 1,287.5 | 21,032,751 | 2.8 | ||||||||||||
|
(1)
|
Average price paid per share is the execution price, excluding brokerage fees and value added tax. Including brokerage fees and value added tax would decrease the approximate value of shares that may yet be purchased under the plans or programs.
|
|
(2)
|
Our preferred shares have been listed since February 1, 2011 on the Colombian Stock Exchange under the symbol “PFAVAL.” We first issued preferred shares on May 12, 2011 at the conclusion of the Preferred Shares Local Offering. See “Item 4. Information on the Company—A. History and development of the company—Preferred Shares Local Offering.”
|
|
(3)
|
On May 18, 2011, our board of directors authorized Mr. Luis Carlos Sarmiento Angulo, Chairman of the board of directors of Grupo Aval, to acquire, directly or indirectly, up to Ps 30 billion (U.S.$15.4 million) of our common or preferred shares. The authorization was given by a unanimous vote of the directors, with Mr. Sarmiento Angulo, Chairman of the board of directors of Grupo Aval, abstaining.
|
|
(4)
|
During May 2011, Mr. Sarmiento Angulo acquired 10,454,572 preferred shares at Ps 1,294.2 (average price paid per share) and 2,054,210 common shares at Ps 1,290.7 (average price paid per share). During June 2011, Mr. Sarmiento Angulo acquired 6,306,198 preferred shares at Ps 1,282.4 (average price paid per share) and 2,217,771 common shares at Ps 1,282.7 (average price paid per share).
|
During 2011, all purchases and sales of equity securities were made in open-market transactions.
Not applicable.
Not applicable.
Not applicable.
We have responded to Item 18 in lieu of this item.
Financial Statements are filed as part of this annual report, see page F-1.
|
1.1
|
English translation of By-laws of Grupo Aval (incorporated by reference from our Registration Statement on Form 20-F (File No. 000-54290) filed with the SEC on March 7, 2011).
|
|
2.1
|
Indenture among Grupo Aval Limited, as Issuer, Grupo Aval Acciones y Valores S.A., as Guarantor, Deutsche Bank Trust Company Americas, as Trustee, Registrar, Paying Agent and Transfer Agent and Deutsche Bank Luxembourg S.A., as Luxembourg Paying Agent and Transfer Agent, dated as of February 1, 2012.
|
|
4.1
|
Stock purchase agreement dated as of July 15, 2010 among GE Consumer Finance Central Holdings Corp., General Electric Capital Corporation and Grupo Aval Acciones y Valores S.A. (incorporated by reference from our Registration Statement on Form 20-F (File No. 000-54290) filed with the SEC on March 7, 2011).
|
|
4.2
|
Loan Agreement between Bancolombia S.A. and Leasing Bogota S.A. – Panama, dated as of November 26, 2010 (incorporated by reference from our Registration Statement on Form 20-F (File No. 000-54290) filed with the SEC on March 7, 2011).
|
|
4.3
|
Loan Agreement between Bancolombia S.A. and Leasing Bogota S.A. – Panama, dated as of November 26, 2010 (incorporated by reference from our Registration Statement on Form 20-F (File No. 000-54290) filed with the SEC on March 7, 2011).
|
|
4.4
|
Agreement between Grupo Aval Acciones y Valores S.A. and Adminegocios & Cia. S.C.A. regarding mandatorily convertible bonds issued by Banco de Bogota, dated as of November 24, 2010 (incorporated by reference from our Registration Statement on Form 20-F (File No. 000-54290) filed with the SEC on March 7, 2011).
|
|
4.5
|
Escision Agreement between Grupo Aval Acciones y Valores S.A. and Rendifin S.A., dated as of January 31, 2011 (incorporated by reference from our Registration Statement on Form 20-F (File No. 000-54290) filed with the SEC on March 7, 2011).
|
|
4.6
|
Escision Agreement between Grupo Aval Acciones y Valores S.A. and Inversiones Escorial S.A. and Popular Securities S.A. dated as of April 29, 2011. (incorporated by reference from our Annual Report on Form 20-F (File No. 000-54290) filed with the SEC on June 30, 2011).
|
|
8.1
|
List of subsidiaries.
|
|
12.1
|
Certification pursuant to section 302 of the Sarbanes-Oxley Act of 2002.
|
|
12.2
|
Certification pursuant to section 302 of the Sarbanes-Oxley Act of 2002.
|
|
13.1
|
Certification pursuant to 18 U.S.C. section 1350, as adopted pursuant to section 906 of the Sarbanes-Oxley Act of 2002.
|
|
13.2
|
Certification pursuant to 18 U.S.C. section 1350, as adopted pursuant to section 906 of the Sarbanes-Oxley Act of 2002.
|
SIGNATURES
The registrant hereby certifies that it meets all of the requirements for filing on Form 20-F and that it has duly caused and authorized the undersigned to sign this annual report on its behalf.
|
Grupo Aval Acciones y Valores S.A.
|
|||
|
By:
|
/s/ Luis Carlos Sarmiento Gutiérrez
|
||
|
Name:
|
Luis Carlos Sarmiento Gutiérrez
|
||
|
Title:
|
President
|
||
Date: April 30, 2012
INDEX TO CONSOLIDATED FINANCIAL STATEMENTS
|
Page
|
|
|
Audited consolidated financial statements of Grupo Aval Acciones y Valores S.A. and its subsidiaries as of December 31, 2011 and 2010 and for each of the years ended December 31, 2011, 2010 and 2009
|
|
|
|
KPMG Ltda. | Tel é fono | 57 (1) 6188100 |
| Calle 90 No. 19C - 74 | Fax | 57 (1) 2185490 | |
| Bagot á , D.C. | www.kpmg.com.co | ||
The Board of Directors and Stockholders
Grupo Aval Acciones y Valores, S. A. and Subsidiaries:
We have audited the accompanying consolidated balance sheets of Grupo Aval Acciones y Valores, S. A. and Subsidiaries as of December 31, 2011 and 2010, and the related consolidated statements of income, shareholders´ equity and cash flows for each of the years in the three-year period ended December 31, 2011. These consolidated financial statements are the responsibility of the Company’s management. Our responsibility is to express an opinion on these consolidated financial statements based on our audits.
We conducted our audits in accordance with the standards of the Public Company Accounting Oversight Board (United States). Those standards require that we plan and perform the audit to obtain reasonable assurance about whether the financial statements are free of material misstatement. An audit includes examining, on a test basis, evidence supporting the amounts and disclosures in the financial statements. An audit also includes assessing the accounting principles used and significant estimates made by management, as well as evaluating the overall financial statement presentation. We believe that our audits provide a reasonable basis for our opinion.
In our opinion, the consolidated financial statements referred to above present fairly, in all material respects, the financial position of Grupo Aval Acciones y Valores, S. A. and Subsidiaries as of December 31, 2011 and 2010, and the results of their operations and their cash flows for each of the years in the three-year period ended December 31, 2011, in conformity with generally accepted accounting principles in Colombia and the regulations of the Colombian Superintendency of Finance for financial institutions (collectively “Colombian Banking GAAP”).
The accompanying consolidated financial statements as of and for the year ended December 31, 2011 has been translated into United States dollars solely for the convenience of the reader. We have audited the translation and, in our opinion, the consolidated financial statements expressed in Colombian pesos have been translated into United States dollars on the basis set forth in note 2 (c) of the notes to the consolidated financial statements.
Colombian Banking GAAP varies in certain significant respects from U.S. generally accepted accounting principles. Information relating to the nature and effect of such differences is presented in note 30 to the consolidated financial statements.
April 30, 2012
/s/ KPMG Ltda.
KPMG Ltda.
Bogotá, D.C., Colombia
GRUPO AVAL ACCIONES Y VALORES S. A. AND ITS SUBSIDIARIES
As of December 31, 2011 and 2010
(Stated in millions of Colombian pesos and millions of U.S. dollars)
| 2011 (1) | |||||||||||||||
| Notes | U.S. dollars | 2011 | 2010 | ||||||||||||
|
Assets
|
|||||||||||||||
|
Cash and cash equivalent
|
|||||||||||||||
|
Cash and due from banks
|
3 | US$ | 4,520.5 | Ps. |
8,781,960
|
Ps. |
7,334,254
|
||||||||
|
Interbank and overnight funds
|
1,501.3 | 2,916,627 | 2,348,385 | ||||||||||||
|
Total cash and cash equivalents
|
6,021.8 | 11,698,587 | 9,682,639 | ||||||||||||
|
Investment securities:
|
4 | ||||||||||||||
|
Debt securities:
|
|||||||||||||||
|
Trading
|
1,829.8 | 3,554,761 | 3,717,461 | ||||||||||||
|
Available for sale
|
4,989.5 | 9,693,147 | 10,398,071 | ||||||||||||
|
Held to maturity
|
1,581.2 | 3,071,883 | 3,108,543 | ||||||||||||
|
Total debt securities
|
8,400.5 | 16,319,791 | 17,224,075 | ||||||||||||
|
Equity securities:
|
|||||||||||||||
|
Trading
|
541.7 | 1,052,282 | 663,423 | ||||||||||||
|
Available for sale
|
829.7 | 1,611,891 | 1,622,586 | ||||||||||||
|
Total equity securities
|
1,371.4 | 2,664,173 | 2,286,009 | ||||||||||||
|
Allowance for investment securities
|
(4.5 | ) | (8,735 | ) | (335,147 | ) | |||||||||
|
Total investment securities, net
|
9,767.4 | 18,975,229 | 19,174,937 | ||||||||||||
|
Loans and financial leases:
|
5 | ||||||||||||||
|
Commercial loans
|
20,870.7 | 40,545,544 | 34,158,101 | ||||||||||||
|
Consumer loans
|
10,159.0 | 19,735,885 | 16,625,216 | ||||||||||||
|
Microcredit loans
|
146.3 | 284,167 | 250,106 | ||||||||||||
|
Mortgage loans
|
2,171.4 | 4,218,377 | 3,844,322 | ||||||||||||
|
Financial leases
|
2,658.0 | 5,163,767 | 3,745,881 | ||||||||||||
| 36,005.4 | 69,947,740 | 58,623,626 | |||||||||||||
|
Allowance for loan and financial lease losses
|
(1,187.2 | ) | (2,306,500 | ) | (2,183,886 | ) | |||||||||
|
Total loans and financial leases, net
|
34,818.2 | 67,641,240 | 56,439,740 | ||||||||||||
|
Interest accrued on loans and financial leases
Accrued interest receivable on loans and financial leases
|
6 | 331.9 | 644,676 | 503,570 | |||||||||||
|
Allowance for accrued interest losses
|
(31.5 | ) | (61,156 | ) | (55,357 | ) | |||||||||
|
Total interest accrued on loans and
financial leases, net
|
300.4 | 583,520 | 448,213 | ||||||||||||
|
Bankers’ acceptances, spot transactions and derivatives financial instruments
|
7 | 215.6 | 418,809 | 306,881 | |||||||||||
|
Accounts receivable, net
|
6 | 830.2 | 1,612,903 | 1,337,290 | |||||||||||
|
Property, plant and equipment, net
|
8 | 906.6 | 1,761,309 | 1,643,674 | |||||||||||
|
Operating leases, net
|
9 | 166.4 | 323,249 | 263,875 | |||||||||||
|
Foreclosed assets, net
|
10 | 40.0 | 77,761 | 85,472 | |||||||||||
|
Prepaid expenses and deferred charges
|
11 | 1,007.0 | 1,956,204 | 920,660 | |||||||||||
|
Goodwill, net
|
12 | 1,601.3 | 3,110,745 | 3,031,446 | |||||||||||
|
Other assets, net
|
13 | 552.1 | 1,072,610 | 911,958 | |||||||||||
|
Reappraisal of assets
|
14 | 1,168.3 | 2,269,701 | 2,062,494 | |||||||||||
|
Total assets
|
US$ | 57,395.3 | Ps. |
111,501,867
|
Ps. |
96,309,279
|
|||||||||
|
Memorandum accounts
|
24 | US$ | 213,078.0 | Ps. |
413,946,702
|
Ps. |
347,217,658
|
||||||||
(1) See note 2 (c).
The accompanying notes form an integral part of these Consolidated Financial Statements.
GRUPO AVAL ACCIONES Y VALORES S. A. AND ITS SUBSIDIARIES
CONSOLIDATED BALANCE SHEETS - Continued
As of December 31, 2011 and 2010
(Stated in millions of Colombian pesos and millions of U.S. dollars)
|
2011 (1)
|
|||||||||||||||
|
Notes
|
U.S. dollars
|
2011
|
2010
|
||||||||||||
|
Liabilities and shareholders’ equity
|
|||||||||||||||
|
Deposits:
|
|||||||||||||||
|
Non-interest bearing:
|
|||||||||||||||
|
Checking accounts
|
US$ | 6,305.7 | Ps. |
12,249,991
|
Ps. |
11,861,254
|
|||||||||
|
Other
|
539.1 | 1,047,378 | 980,638 | ||||||||||||
|
Total non-interest bearing deposits
|
6,844.8 | 13,297,369 | 12,841,892 | ||||||||||||
|
Interest bearing:
|
|||||||||||||||
|
Checking accounts
|
3,689.6 | 7,167,800 | 6,191,134 | ||||||||||||
|
Time deposits
|
15 | 11,649.0 | 22,630,493 | 18,615,027 | |||||||||||
|
Saving deposits
|
14,367.6 | 27,911,952 | 26,021,229 | ||||||||||||
|
Total interest bearing deposits
|
29,706.2 | 57,710,245 | 50,827,390 | ||||||||||||
|
Total deposits
|
36,551.0 | 71,007,614 | 63,669,282 | ||||||||||||
|
Bankers´ acceptances and derivatives financial instruments
|
241.4 | 468,963 | 309,297 | ||||||||||||
|
Interbank borrowings and overnight funds
|
16 | 1,660.1 | 3,225,145 | 2,477,424 | |||||||||||
|
Borrowings from banks and others
|
17,27 | 5,887.6 | 11,437,751 | 10,491,181 | |||||||||||
|
Accounts payable
|
18,23 | 1,592.6 | 3,093,949 | 2,243,521 | |||||||||||
|
Accrued interest payable
|
161.1 | 313,030 | 247,376 | ||||||||||||
|
Other liabilities
|
19 | 745.2 | 1,447,764 | 1,291,898 | |||||||||||
|
Bonds
|
20 | 3,380.0 | 6,566,235 | 5,952,378 | |||||||||||
|
Estimated liabilities
|
21 | 440.2 | 855,261 | 596,872 | |||||||||||
|
Non-controlling interest
|
22 | 2,536.2 | 4,927,029 | 4,475,495 | |||||||||||
|
Total liabilities
|
53,195.4 | 103,342,741 | 91,754,724 | ||||||||||||
|
Shareholders´ equity
|
23 | ||||||||||||||
|
Subscribed and paid in capital:
|
|||||||||||||||
|
Common and preferred shares
|
9.5 | 18,551 | 13,944 | ||||||||||||
|
Additional paid in capital
|
1,889.7 | 3,671,048 | 647,414 | ||||||||||||
|
Retained earnings:
|
|||||||||||||||
|
Appropriated
|
1,200.4 | 2,332,030 | 1,930,326 | ||||||||||||
|
Unappropriated
|
344.4 | 668,996 | 483,250 | ||||||||||||
|
Equity surplus:
|
|||||||||||||||
|
Equity inflation adjustments
|
23 | 381.9 | 741,892 | 742,122 | |||||||||||
|
Unrealized net gains on investment securities available for sale
|
(150.8 | ) | (292,952 | ) | 29,705 | ||||||||||
|
Reappraisal of assets
|
14 | 524.8 | 1,019,561 | 707,794 | |||||||||||
|
Total shareholders’ equity
|
4,199.9 | 8,159,126 | 4,554,555 | ||||||||||||
|
Total liabilities and shareholders’ equity
|
US$ | 57,395.3 | Ps. |
111,501,867
|
Ps. |
96,309,279
|
|||||||||
|
Memorandum accounts
|
24 | US$ | 213,078.0 | Ps. |
413,946,702
|
Ps. |
347,217,658
|
||||||||
(1)
See note 2 (c).
The accompanying notes form an integral part of these Consolidated Financial Statements.
GRUPO AVAL ACCIONES Y VALORES S. A. AND ITS SUBSIDIARIES
For years ended December 31, 2011, 2010 and 2009
(Stated in millions of Colombian pesos and millions of U.S. dollars, except per share data)
|
2011(1)
|
|||||||||||||||||||
|
Notes
|
U.S. dollars
|
2011
|
2010 (2)
|
2009
|
|||||||||||||||
|
Interest income:
|
|||||||||||||||||||
|
Interest on loans
|
US$ | 3,353.4 | Ps. |
6,514,632
|
Ps. |
4,627,299
|
Ps. |
5,418,545
|
|||||||||||
|
Interest on investment securities
|
530.1 | 1,029,787 | 1,452,689 | 1,676,942 | |||||||||||||||
|
Interbank and overnight funds
|
74.9 | 145,495 | 99,004 | 148,854 | |||||||||||||||
|
Financial leases
|
237.2 | 460,916 | 363,605 | 435,669 | |||||||||||||||
|
Total interest income
|
4,195.6 | 8,150,830 | 6,542,597 | 7,680,010 | |||||||||||||||
|
Interest expense:
|
|||||||||||||||||||
|
Checking accounts
|
42.4 | 82,429 | 29,492 | 53,177 | |||||||||||||||
|
Time deposits
|
447.5 | 869,120 | 679,068 | 1,218,957 | |||||||||||||||
|
Saving deposits
|
415.9 | 808,055 | 640,847 | 925,349 | |||||||||||||||
|
Total interest expense on deposits
|
905.8 | 1,759,603 | 1,349,407 | 2,197,483 | |||||||||||||||
|
Borrowings from banks and others
|
224.3 | 435,790 | 176,968 | 291,492 | |||||||||||||||
|
Interbank and overnight funds (expenses)
|
75.6 | 146,907 | 109,306 | 111,668 | |||||||||||||||
|
Bonds
|
20 | 174.8 | 339,631 | 278,118 | 253,399 | ||||||||||||||
|
Total interest expense
|
1,380.5 | 2,681,931 | 1,913,799 | 2,854,042 | |||||||||||||||
|
Net Interest Income
|
2,815.1 | 5,468,898 | 4,628,798 | 4,825,968 | |||||||||||||||
|
Provisions for loan and financial lease losses, accrued interest and other receivables, net
|
450.4 | 874,920 | 820,295 | 953,188 | |||||||||||||||
|
Recovery of charged-off assets
|
(86.2 | ) | (167,498 | ) | (108,963 | ) | (83,219 | ) | |||||||||||
|
Provision for investment securities, foreclosed assets and other assets
|
4 | 33.9 | 65,824 | 368,271 | 43,259 | ||||||||||||||
|
Recovery of provisions for investments securities, foreclosed assets and other assets
|
4 | (183.8 | ) | (356,931 | ) | (52,659 | ) | (25,625 | ) | ||||||||||
|
Total provisions, net
|
214.4 | 416,315 | 1,026,944 | 887,603 | |||||||||||||||
|
Net interest income after provisions
|
2,600.8 | 5,052,583 | 3,601,854 | 3,938,365 | |||||||||||||||
|
Fees and other services income:
|
|||||||||||||||||||
|
Commissions from banking services
|
664.0 | 1,290,036 | 915,979 | 865,974 | |||||||||||||||
|
Branch network services
|
18 | 35,001 | 22,163 | 19,521 | |||||||||||||||
|
Credit card merchant fees
|
164.9 | 320,341 | 165,616 | 97,780 | |||||||||||||||
|
Checking fees
|
38.3 | 74,379 | 69,530 | 70,670 | |||||||||||||||
|
Warehouse services
|
90.1 | 174,972 | 147,463 | 149,713 | |||||||||||||||
|
Fiduciary activities
|
77.2 | 149,886 | 146,856 | 137,642 | |||||||||||||||
|
Pension plan management
|
235.8 | 458,123 | 409,930 | 400,203 | |||||||||||||||
|
Other
|
87.5 | 170,015 | 103,324 | 119,798 | |||||||||||||||
|
Total fees and other services income
|
1,375.80 | 2,672,753 | 1,980,861 | 1,861,301 | |||||||||||||||
|
Fees and other services expenses
|
225.6 | 438,388 | 363,141 | 277,830 | |||||||||||||||
|
Total fees and other services income, net
|
US$ | 1,150.20 | Ps. |
2,234,365
|
Ps. |
1,617,720
|
Ps. |
1,583,471
|
|||||||||||
|
(1)
|
See note 2 (c).
|
|
(2)
|
Includes a month period ended December 31, 2010 related to the business combination with BAC Credomatic effective December 9, 2010 (see Note 1(b)).
|
The accompanying notes form an integral part of these Consolidated Financial Statements.
GRUPO AVAL ACCIONES Y VALORES S. A. AND ITS SUBSIDIARIES
CONSOLIDATED STATEMENTS OF INCOME
For years ended December 31, 2011, 2010 and 2009
(Stated in millions of Colombian pesos and millions of U.S. dollars, except per share data)
|
2011(1)
|
|||||||||||||||||||
|
Notes
|
U.S. dollars
|
2011
|
2010 (2)
|
2009
|
|||||||||||||||
|
Other operating income:
|
|||||||||||||||||||
|
Foreign exchange gains (losses), net
|
US$ | 106.2 | Ps. |
206,402
|
Ps. |
49,504
|
Ps. |
(141,536)
|
|||||||||||
|
Gains on derivative operations, net
|
(9.7 | ) | (18,818 | ) | 92,893 | 287,528 | |||||||||||||
|
Gains on sales of investments in equity securities, net
|
21.6 | 41,868 | 87,450 | 4,036 | |||||||||||||||
|
Income from non-financial sector, net (3)
|
227.4 | 441,708 | 294,800 | 231,228 | |||||||||||||||
|
Dividend income
|
4 | 40.6 | 78,883 | 43,516 | 68,920 | ||||||||||||||
|
Other
|
107.0 | 207,950 | 217,350 | 233,883 | |||||||||||||||
|
Total other operating income
|
493.1 | 957,993 | 785,513 | 684,059 | |||||||||||||||
|
Total operating income
|
4,244.1 | 8,244,941 | 6,005,087 | 6,205,895 | |||||||||||||||
|
Operating expenses:
|
|||||||||||||||||||
|
Salaries and employee benefits
|
913.0 | 1,773,734 | 1,262,403 | 1,183,920 | |||||||||||||||
|
Bonus plan payments
|
53.8 | 104,496 | 45,146 | 42,516 | |||||||||||||||
|
Termination payments
|
12.3 | 23,920 | 11,596 | 7,178 | |||||||||||||||
|
Administrative and other expenses
|
25 | 1,274.9 | 2,476,779 | 1,817,086 | 1,675,268 | ||||||||||||||
|
Insurance on deposit, net
|
83.8 | 162,766 | 133,111 | 126,762 | |||||||||||||||
|
Charitable and other donation expenses
|
11.3 | 21,948 | 7,198 | 8,100 | |||||||||||||||
|
Depreciation
|
8,9 | 142.4 | 276,670 | 214,790 | 205,152 | ||||||||||||||
|
Goodwill amortization
|
12 | 47.7 | 92,634 | 28,620 | 43,502 | ||||||||||||||
|
Total operating expenses
|
2,539.2 | 4,932,947 | 3,519,950 | 3,292,398 | |||||||||||||||
|
Net operating income
|
1,704.8 | 3,311,993 | 2,485,137 | 2,913,497 | |||||||||||||||
|
Non-operating income (expense):
|
26 | ||||||||||||||||||
|
Other income
|
165.1 | 320,740 | 364,555 | 367,387 | |||||||||||||||
|
Other expense
|
(64.1 | ) | (124,516 | ) | (187,621 | ) | (299,717 | ) | |||||||||||
|
Total non-operating income (expense), net
|
101.0 | 196,224 | 176,934 | 67,670 | |||||||||||||||
|
Income before income tax expense and non- controlling interest
|
1,805.8 | 3,508,218 | 2,662,071 | 2,981,167 | |||||||||||||||
|
Income tax expense
|
21 | (585.1 | ) | (1,136,748 | ) | (830,989 | ) | (864,294 | ) | ||||||||||
|
Income before non-controlling interest
|
1,220.7 | 2,371,470 | 1,831,082 | 2,116,873 | |||||||||||||||
|
Non-controlling interest
|
556.1 | 1,080,243 | (874,232 | ) | (1,051,496 | ) | |||||||||||||
|
Net income attributable to Grupo Aval shareholders
|
US$ | 664.6 | Ps. |
1,291,226
|
Ps. |
956,850
|
Ps. |
1,065,377
|
|||||||||||
|
Earnings per share (in pesos)
|
Ps. |
79.184
|
Ps. |
68.621
|
Ps. |
76.448
|
|||||||||||||
|
Weighted average number of common and preferred shares outstanding
|
16,306,613,443 | 13,943,980,671 | 13,935,966,116 | ||||||||||||||||
|
(1)
|
See note 2 (c).
|
|
(2)
|
Includes a month period ended December 31, 2010 related to the business combination with BAC Credomatic effective December 9, 2010 (see Note 1(b)).
|
|
(3)
|
Income from non-financial sector reflects the results of Corficolombiana (Banco de Bogotá subsidiary) in its consolidated investments in companies not related to the financial sector, including, among others, Epiandes S.A., Hoteles Estelar S.A., and Organización Pajonales S.A. This result is net of the following operating and administrative expenses for the years ended 2011, 2010 and 2009: Ps. 852,689, Ps. 644,320 and Ps. 549,235, respectively. Additionally, in 2010 Ventas y Servicios S.A. and Inca S.A. non-financial subsidiaries of Banco de Occidente and Banco Popular, were included with operating and administrative expenses of Ps.70,648 and Ps.33,297, for 2011 and 2010, respectively.
|
The accompanying notes form an integral part of these Consolidated Financial Statements.
GRUPO AVAL ACCIONES Y VALORES S. A. AND ITS SUBSIDIARIES
For years ended December 31, 2011, 2010 and 2009
(Stated in millions of Colombian pesos and millions of U.S. dollars)
| Millions of shares |
Retained earnings
|
Equity surplus
:
|
||||||||||||||||||||||||||||||||||||||
|
Preferred non voting shares
|
Voting common shares
|
Par value
|
Additional
paid-in
capital
|
Appropriated
|
Unappropriated
|
Equity inflation
adjustments
|
Unrealized gains
(losses) on investments available
for sale
|
Reappraisal of
assets
|
Total shareholders'
equity
|
|||||||||||||||||||||||||||||||
|
Balance at December 31, 2008
|
- | 13,929 | Ps. |
13,929
|
Ps. |
637,853
|
Ps. |
878,530
|
Ps. |
441,050
|
Ps. |
746,727
|
Ps. |
(90,272
|
) | Ps. |
581,915
|
Ps. |
3,209,732
|
|||||||||||||||||||||
|
Net income
|
- | - | - | - | - | 1,065,377 | - | - | - | 1,065,377 | ||||||||||||||||||||||||||||||
|
Transfer to appropriated retained earnings
|
- | - | - | - | 601,686 | (601,686 | ) | - | - | - | - | |||||||||||||||||||||||||||||
|
Issuance of shares
|
- | 15 | 15 | 9,561 | - | - | - | - | - | 9,576 | ||||||||||||||||||||||||||||||
|
Changes in equity surplus
|
- | - | - | - | - | - | (3,536 | ) | 108,618 | 133,765 | 238,847 | |||||||||||||||||||||||||||||
|
Dividends declared
|
- | - | - | - | (214,180 | ) | (225,055 | ) | - | - | - | (439,235 | ) | |||||||||||||||||||||||||||
|
Contribution to employee benefit plans
|
- | - | - | - | (11 | ) | - | - | - | - | (11 | ) | ||||||||||||||||||||||||||||
|
Balance at December 31, 2009
|
- | 13,944 | 13,944 | 647,414 | 1,266,025 | 679,686 | 743,191 | 18,346 | 715,680 | 4,084,286 | ||||||||||||||||||||||||||||||
|
Net income
|
- | - | - | - | - | 956,850 | - | - | - | 956,850 | ||||||||||||||||||||||||||||||
|
Transfer to appropriated retained earnings
|
- | - | - | - | 897,812 | (897,812 | ) | - | - | - | - | |||||||||||||||||||||||||||||
|
Changes in equity surplus
|
- | - | - | - | - | - | (1,069 | ) | 11,359 | (2) | (7,886 | ) | 2,404 | |||||||||||||||||||||||||||
|
Dividends declared
|
- | - | - | - | (233,360 | ) | (255,474 | ) | - | - | - | (488,834 | ) | |||||||||||||||||||||||||||
|
Donations
|
- | - | - | - | (13 | ) | - | - | - | - | (13 | ) | ||||||||||||||||||||||||||||
|
Contribution to employee benefit plans
|
- | - | - | - | (138 | ) | - | - | - | - | (138 | ) | ||||||||||||||||||||||||||||
|
Balance at December 31, 2010
|
- | 13,944 | 13,944 | 647,414 | 1,930,326 | 483,250 | 742,122 | 29,705 | 707,794 | 4,554,555 | ||||||||||||||||||||||||||||||
|
Net income
|
- | - | - | - | - | 1,291,226 | - | - | - | 1,291,226 | ||||||||||||||||||||||||||||||
|
Transfer to appropriated retained earnings and change of common shares by preferred shares
|
138 | (138 | ) | - | - | 721,683 | (721,683 | ) | - | - | - | - | ||||||||||||||||||||||||||||
| Issuance of preferred shares | 1,600 | - | 1,600 | 2,077,770 | - | - | - | - | - | 2,079,370 | ||||||||||||||||||||||||||||||
|
Issuance of preferred shares increasing the controlling interest in Banco Popular
|
3,007 | - | 3,007 | 945,864 | - | - | - | - | - | 948,871 | ||||||||||||||||||||||||||||||
| Changes in equity surplus | - | - | - | - | - | - | (230 | ) | (322,657) | (2) | 311,767 | (11,120 | ) | |||||||||||||||||||||||||||
| Dividends declared | - | - | - | - | (319,659 | ) | (382,850 | ) | - | - | - | (702,509 | ) | |||||||||||||||||||||||||||
| Donations | - | - | - | - | (301 | ) | (941 | ) | - | - | - | (1,242 | ) | |||||||||||||||||||||||||||
| Contribution to employee benefit plan | - | - | - | - | (19 | ) | (6 | ) | - | - | - | (25 | ) | |||||||||||||||||||||||||||
| Balance at December 31, 2011 | 4,745 | 13,806 | Ps. |
18,551
|
Ps. |
3,671,048
|
Ps. |
2,332,030
|
Ps. |
668,996
|
Ps. |
741,892
|
Ps. |
(292,952
|
) | Ps. |
1,019,561
|
Ps. |
8,159.126
|
|||||||||||||||||||||
|
Balance at December 31, 2011 (1) (U.S. Dollar)
|
US$ | 9.5 | US$ | 1,889.7 | US$ | 1,200.4 | US$ | 344.4 | US$ | 381.9 | US$ | (150.8 | ) | US$ | 524.8 | US$ | 4,199.9 | |||||||||||||||||||||||
|
(1)
|
See Note 2 (c).
|
|
(2)
|
The change includes Ps. 14,848 and 4,409 related to hedge accounting of derivatives financial instruments on investments in foreign operations as of December 31, 2011 and 2010, respectively. (See Note 2 (k))
|
The accompanying notes form an integral part of these Consolidated Financial Statements.
GRUPO AVAL ACCIONES Y VALORES S. A. AND ITS SUBSIDIARIES
For years ended December 31, 2011, 2010 and 2009
(Stated in millions of Colombian pesos and millions of U.S. dollars)
|
2011(1)
|
||||||||||||||||
|
U.S. dollars
|
2011
|
2010
|
2009
|
|||||||||||||
|
Cash flows from operating activities:
|
||||||||||||||||
|
Net income attributable to Grupo Aval’s shareholders for the year
|
US$ | 664.7 | Ps. |
1,291,226
|
Ps. |
956,850
|
Ps. |
1,065,377
|
||||||||
|
Adjustments to reconcile net income to net cash provided by operating activities:
|
||||||||||||||||
|
Depreciation
|
142.4 | 276,670 | 214,790 | 205,152 | ||||||||||||
|
Goodwill amortization
|
47.7 | 92,634 | 28,620 | 43,502 | ||||||||||||
|
Non-controlling interest
|
556.1 | 1,080,243 | 874,232 | 1,051,496 | ||||||||||||
|
Provisions for loan and financial lease losses, accrued interest and other receivables, net
|
450.4 | 874,920 | 820,295 | 953,188 | ||||||||||||
|
Provision (recovery) for foreclosed assets, net
|
6.0 | 11,584 | (7,062 | ) | (1,461 | ) | ||||||||||
|
(Recovery) provision for losses on investment securities, net
|
(167.6 | ) | (325,527 | ) | 342,480 | 2,381 | ||||||||||
|
Recovery of provision for property, plant and equipment
|
(3.4 | ) | (6,538 | ) | (496 | ) | (856 | ) | ||||||||
|
Gain on sales of investment securities ,net
|
(14.9 | ) | (29,025 | ) | (160,279 | ) | (79,286 | ) | ||||||||
|
Unrealized gain on investment securities
|
(298.3 | ) | (579,443 | ) | (1,470,101 | ) | (1,099,454 | ) | ||||||||
|
Gain on sales of foreclosed assets
|
(9.2 | ) | (17,919 | ) | (34,733 | ) | (3,079 | ) | ||||||||
|
Gain on sales of property, plant and equipment
|
(11.2 | ) | (21,728 | ) | (19,777 | ) | (12,424 | ) | ||||||||
|
Realized and unrealized losses (gains) on derivative transactions
|
9.7 | 18,818 | (92,893 | ) | (308,205 | ) | ||||||||||
|
Decrease(Increase) in trading securities
|
1,290.5 | 2,507,219 | 1,480,275 | (2,525,692 | ) | |||||||||||
|
Net change in other assets and liabilities
|
(223.2 | ) | (433,529 | ) | (482,192 | ) | 221,099 | |||||||||
|
Net cash provided by (used in) operating activities
|
2,239.8 | 4,739,605 | 2 ,450,009 | (488,662 | ) | |||||||||||
|
Cash flows from investing activities:
|
||||||||||||||||
|
Increase on loans and financial leases
|
(6,046.8 | ) | (11,747,029 | ) | (7,480,222 | ) | (2,322,856 | ) | ||||||||
|
Proceeds from sales of property, plant and equipment
|
203.5 | 395,413 | 147,610 | 77,137 | ||||||||||||
|
Proceeds from sales of investments securities
|
3,423.8 | 6,651,321 | 2,559,505 | 3,435,280 | ||||||||||||
|
Proceeds from sales of foreclosed assets
|
51.4 | 99,912 | 67,927 | 12,349 | ||||||||||||
|
Acquisition of property, plant and equipment and assets for operating leases
|
(417.6 | ) | (811,260 | ) | (215,717 | ) | (435,651 | ) | ||||||||
|
Payment for purchase of companies
|
(75.7 | ) | (147,011 | ) | (3,611,174 | ) | - | |||||||||
|
Acquisition of investment securities
|
(4,228.6 | ) | (8,214,989 | ) | (4,359,986 | ) | ( 4,784,195 | ) | ||||||||
|
Net cash used in investing activities
|
US$ | (7,090.0 | ) | Ps. |
(13,773,643
|
) | Ps. |
(12,892,057
|
) | Ps. |
(
4,017,936
|
) | ||||
|
(1)
|
See note 2 (c).
|
|
(2)
|
Includes a month period ended December 31, 2010 related to the business combination with BAC Credomatic effective December 9, 2010 (see Note 1(b)).
|
The accompanying notes form an integral part of these Consolidated Financial Statements.
GRUPO AVAL ACCIONES Y VALORES S. A. AND ITS SUBSIDIARIES
CONSOLIDATED STATEMENTS OF CASH FLOWS -Continued
For years ended December 31, 2011, 2010 and 2009
(Stated in millions of Colombian pesos and millions of U.S. dollars)
|
2011(1)
|
||||||||||||||||
|
U.S. dollars
|
2011
|
2010 (2)
|
2009
|
|||||||||||||
|
Cash flows from financing activities:
|
||||||||||||||||
|
Dividends paid
|
US$ | (312.3 | ) | Ps. | (606,725 | ) | Ps. | (477,006 | ) | Ps. | (504,141 | ) | ||||
|
Increase of deposits
|
3,632.5 | 7,056,883 | 3,706,872 | 4,297,679 | ||||||||||||
|
Increase (decrease) in interbank borrowings and overnight funds
|
390.6 | 758,789 | (357,173 | ) | 1,958,808 | |||||||||||
|
Increase (decrease) in borrowings from banks and others
|
400.7 | 778,393 | 4,656,876 | (1,193,522 | ) | |||||||||||
|
Increase in bonds
|
754.2 | 1,465,053 | 2,530,183 | 1,101,875 | ||||||||||||
|
Decrease in non-controlling interest
|
(248.4 | ) | (482,570 | ) | (584,858 | ) | (414,014 | ) | ||||||||
|
Issuance of common and preferred shares
|
1,070.4 | 2,079,370 | - | 9,576 | ||||||||||||
|
Net cash provided by financing activities
|
5,687.5 | 11,049,193 | 9,474,894 | 5,256,261 | ||||||||||||
|
(Decrease) increase in cash and cash equivalents
|
1,037.3 | 2,015,155 | (967,154 | ) | 749,663 | |||||||||||
|
Cash acquired on business combination
|
0.4 | 793 | 3,278,858 | - | ||||||||||||
|
Cash and cash equivalents at beginning of year
|
4,984.1 | 9,682,639 | 7,370,935 | 6,621,272 | ||||||||||||
|
Cash and cash equivalents at end of year
|
US$ | 6,021.8 | Ps. | 11,698,587 | Ps. | 9,682,639 | Ps. | 7,370,935 | ||||||||
|
Supplemental disclosure of cash flow information
|
||||||||||||||||
|
Cash paid during the year for:
|
||||||||||||||||
|
Interest
|
US$ | 1,393.2 | Ps. | 2,706,542 | Ps. | 1,935,534 | Ps. | 2,966,387 | ||||||||
|
Income taxes
|
US$ | 569.8 | Ps. | 1,106,987 | Ps. | 1,005,873 | Ps. | 1,009,876 | ||||||||
|
(1)
|
See note 2 (c).
|
|
(2)
|
Includes a month period ended December 31, 2010 related to the business combination with BAC Credomatic effective December 9, 2010 (see Note 1(b)).
|
The accompanying notes form an integral part of these Consolidated Financial Statements.
GRUPO AVAL ACCIONES Y VALORES S.A. AND ITS SUBSIDIARIES
FOR THE YEARS ENDED DECEMBER 31, 2011, 2010 AND 2009
(
Stated in millions of Colombian pesos and U.S. dollars)
|
(1)
|
ORGANIZATION AND BACKGROUND
|
|
a.
|
Organization
|
Grupo Aval Acciones y Valores S.A. (the “Company” or “Grupo Aval”) was incorporated under Colombian law on January 7, 1994 with a registered office and business address in Bogotá, Colombia. The main purpose of Grupo Aval’s consolidated banking subsidiaries (Banco de Bogotá S.A., Banco de Occidente S.A., Banco Popular S.A. and Banco Comercial AV Villas S.A.) is to carry out all transactions, acts and services inherent to the banking business according to applicable laws and regulations. Through its investments in Corporación Financiera Colombiana S.A. (“Corficolombiana”) and Sociedad Administradora de Fondos de Pensiones y Cesantías Porvenir S.A. (“Porvenir”), Grupo Aval is also present in the merchant banking and pension and severance fund administration businesses in Colombia. Through its investments in BAC Credomatic, Grupo Aval is also present in the Central American banking market in seven countries of the region.
The corporate purpose of Grupo Aval’s (parent company) includes the purchase and sale of stock, bonds and other securities issued by financial and other commercial entities.
In exercising its activities, and pursuant to its by-laws, Grupo Aval may (i) promote the creation of all types of companies related to its corporate purpose; (ii) represent individuals or legal entities that engage in activities that are similar to those mentioned above; (iii) take or grant loans with or without interest; (iv) create liens on its properties as collateral; (v) issue, endorse, acquire, accept, cancel, collect, contest or pay drafts, checks, promissory notes or any other securities, or deliver them in payment; (vi) acquire, divest, encumber, lease or manage all kind of assets; (vii) subscribe or acquire all types of securities and sell or otherwise dispose of them; (viii) participate in companies that seek similar or complementary corporate purposes and freely divest its capital participations in all such companies, (ix) provide services in those areas related to the activities, experience and knowledge of the company; and (x) in general, enter into and execute all actions and agreements directly related to the above purposes in order to permit the exercise of its rights or compliance with its obligations.
|
b.
|
BAC Credomatic GEFC, Inc acquisition
|
On July 15, 2010, Grupo Aval entered into a stock purchase agreement with GE Capital to acquire all of the outstanding shares of BAC Credomatic for US$1.90 billion, subject to certain adjustments. Grupo Aval completed the acquisition on December 9, 2010 for US$1.92 billion. BAC Credomatic is a leading Central American financial group by total assets, loans and deposits, with principal operations in Costa Rica, El Salvador, Guatemala, Honduras, Nicaragua and Panama, as well as a credit card-issuing operation in Mexico, a merchant and card processing center in the State of Florida, and certain offshore subsidiaries. At June 30, 2010, BAC Credomatic had approximately two million credit card and debit card accounts, of which approximately half were debit card accounts and approximately half were BAC Credomatic’s credit card accounts.
By means of a communication dated December 2, 2010, the Colombian Superintendency of Finance authorized the increase of the capital investment of Banco de Bogotá in Leasing Bogotá S.A. Panamá for Ps. 3,090,000 equivalent to US$ 1.64 billion, with the purpose of providing the latter with resources enough to acquire all shares of Sociedad BAC Credomatic GECF, Inc.
The Colombian Superintendency of Finance authorized Banco de Bogotá on December 3, 2010, to make the indirect investment through Leasing Bogotá S.A., on BAC Credomatic GECF, Inc., holding of Grupo Financiero Centroamericano BAC Credomatic.
On December 9, 2010, Leasing Bogotá S.A. Panamá purchased all shares of BAC Credomatic GECF, Inc., in conformity with the terms of the shares purchase contract. The Superintendency of Finance authorized Grupo Aval to include in its consolidated statements of income a one month period ended December 31, 2010. As a result, the 2010 financial statements might not be comparable with other years.
BAC Credomatic consolidated financial statements are prepared under general accepted accounting principles in the United States of America “US GAAP” as permitted by Panamanian rules, where BAC Credomatic holding is incorporated.
GRUPO AVAL ACCIONES Y VALORES S.A. AND ITS SUBSIDIARIES
NOTES TO THE CONSOLIDATED FINANCIAL STATEMENTS
FOR THE YEARS ENDED DECEMBER 31, 2011, 2010 AND 2009
(
Stated in millions of Colombian pesos and U.S. dollars)
According to Colombian Banking Rules those financial statements must be converted to Colombian Banking GAAP to be consolidated into Grupo Aval’s financial statements.
|
c.
|
Grupo Aval and its consolidated subsidiaries
|
These Consolidated Financial Statements include the assets, liabilities, earnings, contingent accounts and memorandum accounts of Grupo Aval Acciones y Valores S.A. and its majority-owned subsidiaries in which it holds, directly or indirectly, 50% or more of the outstanding voting shares as well as companies that Grupo Aval controls despite holding less than 50% of their outstanding voting shares.
All significant inter-company transactions and balances have been eliminated in consolidation.
The following chart shows the banking subsidiaries that Grupo Aval directly consolidates and its share in each of their shareholders’ equity as of December 31, 2001 and 2010:
|
2011
|
2010
|
||
|
Banco de Bogotá S.A. (1)
|
64.44%
|
65.33%
|
|
|
Banco de Occidente S.A. (2)
|
68.24%
|
67.97%
|
|
|
Banco Popular S.A. (3)
|
93.73%
|
30.66%
|
|
|
Banco Comercial AV Villas S.A.
|
79.85%
|
79.85%
|
|
(1)
|
On November 24, 2010 Grupo Aval and Adminegocios & Cia. S.C.A., an entity controlled by Mr. Sarmiento Angulo, our controlling shareholder, entered into an agreement whereby Grupo Aval transferred to Adminegocios & Cia. S.C.A its right to acquire up to 2,605,000 mandatorily convertible bonds issued by Banco de Bogotá (convertible into 5,542,554 shares of Banco de Bogotá). On March 1, 2011, Adminegocios & Cia. S.C.A. converted all of its 2,605,000 mandatorily convertible Banco de Bogotá bonds, into 5,542,554 common shares of Banco de Bogotá and, as a direct consequence of this operation, Grupo Aval’s direct share of Banco de Bogotá was diluted to 64.44%.
|
|
(2)
|
On September 22, 2011, Banco de Occidente raised Ps 200,000 million (US$106 million) in an equity offering of 6,060,606 ordinary shares. Grupo Aval subscribed for Ps 149,639 million (US$80 million) of shares, and its ownership in Banco de Occidente increased slightly from 67.97% at December 31, 2010 to 68.24% at December 31, 2011.
|
|
(3)
|
Escision process related to Banco Popular
|
In these notes we refer to
escisión
as the process whereby, pursuant to Colombian commercial law, a company segregates a portion of its assets for the benefit of another company.
Banco Popular share ownership reorganization
On September 20, 2011, Grupo Aval completed its acquisition of additional ownership interests in Banco Popular to increase its direct ownership in Banco Popular to 93.73%. The acquisition was undertaken in two tranches with three entities, Rendifin S.A., Popular Securities and Inversiones Escorial S.A. An exchange ratio of 1.62 Banco Popular shares to one Grupo Aval preferred share was applied.
On June 22, 2011, Rendifín S.A. (“Rendifín”) transferred to Grupo Aval 3,358,446,312 shares of Banco Popular capital stock, representing 43.47% of Banco Popular’s capital stock pursuant to an
Escisión
Agreement (the “First
Escisión
Agreement”). As consideration, Grupo Aval issued 2,073,115,004 preferred shares (the “Preferred Shares”) to Rendifín’s shareholders, at an exchange ratio of one (1) Preferred Share per 1.62 common shares of Banco Popular, per the exchange ratio contained in the First
Escisión
Agreement. The transaction was approved by the Superintendency of Corporations and the Superintendency of Finance.
GRUPO AVAL ACCIONES Y VALORES S.A. AND ITS SUBSIDIARIES
NOTES TO THE CONSOLIDATED FINANCIAL STATEMENTS
FOR THE YEARS ENDED DECEMBER 31, 2011, 2010 AND 2009
(
Stated in millions of Colombian pesos and U.S. dollars)
On September 20, 2011, Inversiones Escorial S.A. and Popular Securities S.A., , (together with Rendifin S.A. defined as “Sociedades Escindentes”) transferred to Grupo Aval 1,514,163,994 shares of Banco Popular capital stock, representing 19.6% of Banco Popular’s capital stock, pursuant to the second
escisión
agreement (the “Second
Escisión
Agreement”). As consideration, Grupo Aval issued 934,669,126 Preferred Shares to the Sociedades Escindentes’ shareholders, at an exchange ratio of one (1) Preferred Share per 1.62 common shares of Banco Popular, per the exchange ratio contained in the Second
Escisión
Agreement. The transaction was approved by the Superintendency of Corporations and the Superintendency of Finance of Colombia.
Upon completion of the aforementioned transactions the total amount of Grupo Aval’s outstanding shares is of 18,551,766,453 (including common and preferred shares) and Grupo Aval increased its participation in Banco Popular from 30.66% at December 31, 2010 to 93.73% at December 31, 2011.
Banco de Bogotá S. A.
was incorporated as a banking establishment in Bogotá on November 15, 1870. Banco de Bogotá’s business purpose is to engage and carry out all transactions and contracts legally authorized for commercial banks, subject to limitations and requirements imposed by Colombian laws and regulations.
Banco de Occidente S. A.
was
incorporated as a banking establishment on September 8, 1964, and it is authorized to operate under the terms of the Resolution for Renewal No. 2345 dated June 29, 1990 issued by the Superintendency of Finance. Banco de Occidente’s business purpose is to engage and carry out all transactions and contracts legally authorized for commercial banks, subject to limitations and requirements imposed by Colombian laws and regulations.
Banco Popular S. A.
was incorporated as a banking establishment on July 5, 1950. Banco Popular is currently a public/private partnership (98% stake owned by private entities and 2% by governmental entities). Its main business purpose is to engage and carry out all transactions and contracts legally authorized for commercial banks, subject to limitations and requirements imposed by Colombian laws and regulations.
Banco Comercial AV Villas S. A.
was incorporated on November 24, 1972. Banco Comercial AV Villas’ business purpose is to engage and carry out all transactions and contracts legally authorized for commercial banks, subject to limitations and requirements imposed by Colombian laws and regulations.
The following chart shows the assets, liabilities, shareholders’ equity and net income of all the subsidiaries consolidated by Grupo through the above-mentioned banks for the year ended December 31, 2011:
|
For the year ended December 31
2011
|
Assets
|
%
|
Liabilities
|
%
|
Equity
|
%
|
Net Income
|
%
|
||||||||||||||||||||||||
|
Banco de Bogotá S.A. (unconsolidated)
|
Ps. | 43,264,854 | 38.80 | % | Ps. | 35,164,553 | 34.03 | % | Ps. | 8,100,301 | 99.28 | % | Ps. | 1,100,397 | 85.22 | % | ||||||||||||||||
|
Almaviva S.A. and subsidiaries
|
201,572 | 0.18 | % | 52,798 | 0.05 | % | 148,774 | 1.82 | % | 12,929 | 1.00 | % | ||||||||||||||||||||
|
Banco de Bogotá S.A.- Panamá and subsidiaries
|
1,428,409 | 1.28 | % | 1,314,481 | 1.27 | % | 113,929 | 1.40 | % | 9,159 | 0.71 | % | ||||||||||||||||||||
|
Bogotá Finance Corp.
|
161 | 0.00 | % | - | 0.00 | % | 161 | 0.00 | % | 1 | 0.00 | % | ||||||||||||||||||||
|
Casa de Bolsa S.A.
|
32,414 | 0.03 | % | 4,138 | 0.00 | % | 28,276 | 0.35 | % | 348 | 0.03 | % | ||||||||||||||||||||
|
Corficolombiana S.A. and subsidiaries
|
10,280,332 | 9.22 | % | 7,349,963 | 7.11 | % | 2,930,368 | 35.92 | % | 608,076 | 47.09 | % | ||||||||||||||||||||
|
Corp. Financiera Centroamericana FICENTRO
|
6 | 0.00 | % | 6 | 0.00 | % | - | 0.00 | % | - | 0.00 | % | ||||||||||||||||||||
|
Fiduciaria Bogotá S.A.
|
183,575 | 0.16 | % | 48,998 | 0.05 | % | 134,576 | 1.65 | % | 48,395 | 3.75 | % | ||||||||||||||||||||
|
Leasing Bogotá S.A. - Panamá and subsidiaries
|
19,830,965 | 17.78 | % | 16,377,752 | 15.85 | % | 3,453,213 | 42.32 | % | 330,990 | 25.63 | % | ||||||||||||||||||||
|
Megalínea S.A.
|
8,058 | 0.01 | % | 5,935 | 0.01 | % | 2,123 | 0.03 | % | 482 | 0.04 | % | ||||||||||||||||||||
|
Porvenir S.A. and subsidiaries
|
801,808 | 0.72 | % | 181,499 | 0.18 | % | 620,309 | 7.60 | % | 154,545 | 11.97 | % | ||||||||||||||||||||
|
Eliminations from consolidation
|
(7,222,551 | ) | (6.48 | %) | 1,463,585 | 1.42 | % | (8,686,136 | ) | (106.46 | %) | (1,119,609 | ) | (86.71 | %) | |||||||||||||||||
|
Banco de Bogotá S.A. consolidated
|
68,809,602 | 61.71 | % | 61,963,708 | 59.96 | % | 6,845,894 | 83.90 | % | 1,145,713 | 88.73 | % | ||||||||||||||||||||
|
Banco de Occidente S.A. (unconsolidated)
|
20,950,830 | 18.79 | % | 17,920,268 | 17.34 | % | 3,030,562 | 37.14 | % | 441,280 | 34.18 | % | ||||||||||||||||||||
|
Banco de Occidente S.A. – Panamá
|
1,274,137 | 1.14 | % | 1,219,546 | 1.18 | % | 54,591 | 0.67 | % | 1,547 | 0.12 | % | ||||||||||||||||||||
|
Fiduoccidente S.A.
|
112,422 | 0.10 | % | 30,390 | 0.03 | % | 82,032 | 1.01 | % | 28,313 | 2.19 | % | ||||||||||||||||||||
GRUPO AVAL ACCIONES Y VALORES S.A. AND ITS SUBSIDIARIES
NOTES TO THE CONSOLIDATED FINANCIAL STATEMENTS
FOR THE YEARS ENDED DECEMBER 31, 2011, 2010 AND 2009
(
Stated in millions of Colombian pesos and U.S. dollars)
|
For the year ended December 31
2011
|
Assets
|
%
|
Liabilities
|
%
|
Equity
|
%
|
Net Income
|
%
|
||||||||||||||||||||||||
|
Occidental Bank Barbados Ltd.
|
355,290 | 0.32 | % | 319,035 | 0.31 | % | 36,255 | 0.44 | % | 2,326 | 0.18 | % | ||||||||||||||||||||
|
Ventas y Servicios S.A.
|
15,589 | 0.01 | % | 10,747 | 0.01 | % | 4,842 | 0.06 | % | 1,256 | 0.10 | % | ||||||||||||||||||||
|
Eliminations from consolidation
|
(528,180 | ) | (0.47 | %) | (334,944 | ) | (0.32 | %) | (193,236 | ) | (2.37 | %) | (42,613 | ) | (3.30 | %) | ||||||||||||||||
|
Banco de Occidente S.A. consolidated
|
22,180,088 | 19.89 | % | 19,165,042 | 18.55 | % | 3,015,046 | 36.95 | % | 432,109 | 33.47 | % | ||||||||||||||||||||
|
Banco Popular S.A. (unconsolidated)
|
14,151,426 | 12.69 | % | 12,286,211 | 11.89 | % | 1,865,215 | 22.86 | % | 366,545 | 28.39 | % | ||||||||||||||||||||
|
Alpopular S.A.
|
114,842 | 0.10 | % | 18,599 | 0.02 | % | 96,243 | 1.18 | % | 5,912 | 0.46 | % | ||||||||||||||||||||
|
Fiduciaria Popular S.A.
|
58,159 | 0.05 | % | 8,974 | 0.01 | % | 49,185 | 0.60 | % | 4,660 | 0.36 | % | ||||||||||||||||||||
|
INCA S.A.
|
51,774 | 0.05 | % | 18,139 | 0.02 | % | 33,635 | 0.41 | % | 5,404 | 0.42 | % | ||||||||||||||||||||
|
Eliminations from consolidation
|
(124,767 | ) | (0.11 | %) | 36,160 | 0.03 | % | (160,927 | ) | (1.97 | %) | (10,317 | ) | (0.80 | %) | |||||||||||||||||
|
Banco Popular S.A. consolidated
|
14,251,434 | 12.78 | % | 12,368,083 | 11.97 | % | 1,883,351 | 23.08 | % | 372,204 | 28.83 | % | ||||||||||||||||||||
|
Banco Comercial AV Villas S.A. (unconsolidated)
|
7,600,089 | 6.82 | % | 6,665,346 | 6.45 | % | 934,743 | 11.46 | % | 165,074 | 12.78 | % | ||||||||||||||||||||
|
A Toda Hora S.A. (ATH)
|
23,061 | 0.02 | % | 16,563 | 0.02 | % | 6,498 | 0.08 | % | 377 | 0.03 | % | ||||||||||||||||||||
|
Eliminations from consolidation
|
(4,903 | ) | 0.00 | % | 1,769 | 0.00 | % | (6,672 | ) | (0.08 | %) | (226 | ) | (0.02 | %) | |||||||||||||||||
|
Banco Comercial AV Villas S.A. consolidated
|
7,618,247 | 6.83 | % | 6,683,678 | 6.47 | % | 934,569 | 11.45 | % | 165,225 | 12.79 | % | ||||||||||||||||||||
|
Grupo Aval Acciones y Valores S.A. (unconsolidated)
|
13,972,578 | 12.53 | % | 2,718,887 | 2.63 | % | 11,253,691 | 137.93 | % | 416,243 | 32.24 | % | ||||||||||||||||||||
|
Eliminations from consolidation
|
(15,330,082 | ) | (13.75 | %) | 443,343 | 0.43 | % | (15,773,425 | ) | (193.32 | %) | (1,240,268 | ) | (96.06 | %) | |||||||||||||||||
|
Grupo Aval Consolidated
|
Ps. | 111,501,867 | 100.00 | % | Ps. | 103,342,741 | 100.00 | % | Ps. | 8,159,126 | 100.00 | % | Ps. | 1,291,226 | 100.00 | % | ||||||||||||||||
The following chart shows the assets, liabilities, shareholders’ equity and net income of all the subsidiaries consolidated by Grupo Aval for the year ended December 31, 2010:
|
For the year ended December
2010
|
Assets
|
%
|
Liabilities
|
%
|
Equity
|
%
|
Net Income
|
%
|
||||||||||||||||||||||||
|
Banco de Bogotá S.A. (unconsolidated)
|
Ps. | 37,363,724 | 38.80 | % | Ps. | 32,207,358 | 35.10 | % | Ps. | 5,156,366 | 113.21 | % | Ps. | 781,811 | 81.71 | % | ||||||||||||||||
|
Almaviva S.A. and its subsidiaries
|
186,284 | 0.19 | % | 42,887 | 0.05 | % | 143,397 | 3.15 | % | 9,838 | 1.03 | % | ||||||||||||||||||||
|
Banco de Bogotá S.A.- Panamá and its subsidiaries
|
1,166,072 | 1.21 | % | 1,050,667 | 1.14 | % | 115,405 | 2.53 | % | 14,586 | 1.52 | % | ||||||||||||||||||||
|
Bogotá Finance Corp.
|
158 | 0.00 | % | 0 | 0.00 | % | 158 | 0.00 | % | 2 | 0.00 | % | ||||||||||||||||||||
|
Casa de Bolsa S.A.
|
48,582 | 0.05 | % | 19,253 | 0.02 | % | 29,329 | 0.65 | % | 1,189 | 0.12 | % | ||||||||||||||||||||
|
Corficolombiana S.A. and its subsidiaries
|
8,302,438 | 8.62 | % | 5,514,463 | 6.01 | % | 2,787,975 | 61.21 | % | 564,754 | 59.02 | % | ||||||||||||||||||||
|
Corp. Financiera Centroamericana FICENTRO
|
6 | 0.00 | % | 6 | 0.00 | % | - | 0.00 | % | - | 0.00 | % | ||||||||||||||||||||
|
Fiduciaria Bogotá S.A.
|
170,370 | 0.17 | % | 42,255 | 0.05 | % | 128,115 | 2.81 | % | 42,851 | 4.48 | % | ||||||||||||||||||||
|
Leasing Bogotá S.A. - Panamá and its subsidiaries
|
18,154,658 | 18.85 | % | 14,949,292 | 16.29 | % | 3,205,366 | 70.38 | % | 52,981 | 5.54 | % | ||||||||||||||||||||
|
Megalínea S.A.
|
6,790 | 0.01 | % | 5,149 | 0.01 | % | 1,641 | 0.04 | % | 149 | 0.02 | % | ||||||||||||||||||||
|
Porvenir S.A. and its subsidiaries
|
722,130 | 0.75 | % | 203,023 | 0.22 | % | 519,107 | 11.40 | % | 156,393 | 16.34 | % | ||||||||||||||||||||
|
Eliminations from consolidation
|
(6,774,596 | ) | (7.03 | %) | 1,393,998 | 1.52 | % | (8,168,594 | ) | (179.35 | %) | (709,606 | ) | (74.16 | %) | |||||||||||||||||
|
Banco de Bogotá S.A. consolidated
|
59,346,616 | 61.62 | % | 55,428,351 | 60.41 | % | 3,918,265 | 86.03 | % | 914,948 | 95.62 | % | ||||||||||||||||||||
|
Banco de Occidente S.A. (unconsolidated)
|
17,561,403 | 18.23 | % | 14,968,780 | 16.31 | % | 2,592,623 | 56.92 | % | 389,471 | 40.70 | % | ||||||||||||||||||||
|
Banco de Occidente S.A. – Panamá
|
1,164,168 | 1.21 | % | 1,110,412 | 1.21 | % | 53,756 | 1.18 | % | 10,775 | 1.13 | % | ||||||||||||||||||||
|
Fiduoccidente S.A.
|
102,409 | 0.11 | % | 22,793 | 0.03 | % | 79,616 | 1.75 | % | 28,551 | 2.98 | % | ||||||||||||||||||||
|
Occidental Bank Barbados Ltd.
|
321,492 | 0.33 | % | 288,300 | 0.31 | % | 33,192 | 0.73 | % | 3,863 | 0.40 | % | ||||||||||||||||||||
|
Ventas y Servicios S.A.
|
10,822 | 0.01 | % | 7,126 | 0.01 | % | 3,696 | 0.08 | % | 1,011 | 0.11 | % | ||||||||||||||||||||
|
Eliminations from consolidation
|
(522,031 | ) | (0.54 | %) | (343,102 | ) | (0.37 | %) | (178,929 | ) | (3.93 | %) | (47,289 | ) | (4.94 | %) | ||||||||||||||||
|
Banco de Occidente S.A. consolidated
|
18,638,263 | 19.35 | % | 16,054,309 | 17.50 | % | 2,583,954 | 56.73 | % | 386,382 | 40.38 | % | ||||||||||||||||||||
|
Banco Popular S.A. (unconsolidated)
|
12,638,330 | 13.12 | % | 10,957,873 | 11.94 | % | 1,680,457 | 36.89 | % | 352,220 | 36.81 | % | ||||||||||||||||||||
|
Alpopular S.A.
|
107,786 | 0.11 | % | 16,799 | 0.02 | % | 90,987 | 2.00 | % | 5,105 | 0.53 | % | ||||||||||||||||||||
|
Fiduciaria Popular S.A.
|
54,027 | 0.06 | % | 6,470 | 0.01 | % | 47,557 | 1.05 | % | 5,102 | 0.53 | % | ||||||||||||||||||||
|
Leasing Popular S.A. (1)
|
- | 0.00 | % | - | 0.00 | % | - | 0.00 | % | 1,402 | 0.15 | % | ||||||||||||||||||||
|
INCA S.A.
|
41,613 | 0.04 | % | 10,051 | 0.01 | % | 31,562 | 0.69 | % | 2,641 | 0.27 | % | ||||||||||||||||||||
|
Eliminations from consolidation
|
(118,469 | ) | (0.12 | %) | 36,554 | 0.04 | % | (155,023 | ) | (3.40 | %) | (4,828 | ) | (0.50 | %) | |||||||||||||||||
|
Banco Popular S.A. consolidated
|
12,723,287 | 13.21 | % | 11,027,747 | 12.02 | % | 1,695,540 | 37.23 | % | 361,642 | 37.80 | % | ||||||||||||||||||||
|
Banco Comercial AV Villas S.A. (unconsolidated)
|
6,939,537 | 7.20 | % | 6,101,777 | 6.65 | % | 837,760 | 18.39 | % | 144,047 | 15.05 | % | ||||||||||||||||||||
|
A Toda Hora S.A. (ATH)
|
21,769 | 0.02 | % | 15,558 | 0.02 | % | 6,211 | 0.14 | % | 620 | 0.06 | % | ||||||||||||||||||||
|
Eliminations from consolidation
|
(4,522 | ) | (0.00 | %) | 1,715 | 0.00 | % | (6,237 | ) | (0.14 | %) | (373 | ) | (0.04 | %) | |||||||||||||||||
|
Banco Comercial AV Villas S.A. consolidated
|
6,956,784 | 7.22 | % | 6,119,050 | 6.67 | % | 837,734 | 18.39 | % | 144,294 | 15.08 | % | ||||||||||||||||||||
|
Grupo Aval Acciones y Valores S.A. (unconsolidated)
|
4,242,925 | 4.41 | % | 2,713,477 | 2.96 | % | 1,529,448 | 33.59 | % | 383,299 | 40.06 | % | ||||||||||||||||||||
|
and eliminations from consolidation
|
(5,598,596 | ) | (5.81 | %) | 411,790 | 0.45 | % | (6,010,386 | ) | (131.96 | %) | (1,233,715 | ) | (128.65 | %) | |||||||||||||||||
|
Grupo Aval Consolidated
|
Ps. | 96,309,279 | 100.00 | % | Ps. | 91,754,724 | 100.00 | % | Ps. | 4,554,555 | 100.00 | % | Ps. | 956,850 | 100.00 | % | ||||||||||||||||
|
(1)
|
Merged on December 9, 2010 with Banco Popular S.A.
|
GRUPO AVAL ACCIONES Y VALORES S.A. AND ITS SUBSIDIARIES
NOTES TO THE CONSOLIDATED FINANCIAL STATEMENTS
FOR THE YEARS ENDED DECEMBER 31, 2011, 2010 AND 2009
(
Stated in millions of Colombian pesos and U.S. dollars)
|
(2)
|
SUMMARY OF SIGNIFICANT ACCOUNTING POLICIES
|
|
a)
|
Basis of presentation
|
Grupo Aval has prepared these financial statements in accordance with the regulations of the Superintendency of Finance for financial institutions (Resolution 3600 of 1988 and External Circular 100 of 1995) and, on issues not addressed by these regulations, generally accepted accounting principles in Colombia, or “Colombian GAAP” and, together with such regulations, “Colombian Banking GAAP”.
The financial statements of foreign subsidiaries have been adjusted in order to adopt uniform accounting policies as required by Colombian Banking GAAP.
|
b)
|
Translation of foreign currency transactions and consolidated balances
|
Translation of financial statements in foreign currency
Financial statements of Grupo Aval’s subsidiaries with functional currencies different from the Colombian peso are translated to pesos as follows:
Balance sheet accounts are translated to pesos using the “
Tasa Representativa de Mercado”
or market exchange rate applicable at the end of the year, as established by the Superintendency of Finance (except equity accounts which are translated at the historical exchange rate). The market exchange rates at December 31, 2011, 2010 and 2009 were Ps 1,942.70, 1,913.98 and Ps 2,044.23 per US$1.00, respectively. Consolidated statements of income accounts for the years ended December 31, 2011, 2010 and 2009 were translated to pesos using the daily average market exchange rates of Ps. 1,857.47, 1,897,89, and Ps 2,156.29 per US$1.00, respectively. Exchange differences originated in the balance sheet accounts, are recorded as “Cumulative translation adjustments” in Shareholders’ Equity, and exchange differences originated in the statement of income accounts are recorded as “Foreign exchange gains (losses), net”.
Transactions and balances in foreign currency by Grupo Aval and its local subsidiaries
Transactions and balances in foreign currency are translated by Grupo Aval and its banking subsidiaries to pesos using the market exchange rates applicable on the corresponding dates, as established by the Superintendency of Finance. The exchange rates at December 31, 2011, December 31, 2010 and December 31, 2009 are as stated above. Exchange rate differences arising from the translation of assets and liabilities denominated in foreign currency to pesos are recorded in the account “Foreign exchange gains (losses), net” on the consolidated statements of income.
|
c)
|
Convenience translation to U.S. dollars
|
Grupo Aval and its banking subsidiaries present their financial statements in Colombian pesos. The U.S. dollar amounts disclosed in the accompanying consolidated financial statements are presented solely for the convenience of the reader, dividing the peso amounts by the exchange rate of Ps.1,942.70 per US$1.00, which is the market exchange rate at December 31, 2011, as calculated by the Superintendency of Finance. The use of this methodology in translating Colombian pesos to U.S. dollars is referred to as the “U.S. dollar translation methodology,” and should not be construed as a representation that the Colombian peso amounts actually represent or have been, or could be converted into U.S. dollars at that or any other rate.
GRUPO AVAL ACCIONES Y VALORES S.A. AND ITS SUBSIDIARIES
NOTES TO THE CONSOLIDATED FINANCIAL STATEMENTS
FOR THE YEARS ENDED DECEMBER 31, 2011, 2010 AND 2009
(
Stated in millions of Colombian pesos and U.S. dollars)
|
d)
|
Use of estimates in the preparation of consolidated financial statements
|
The preparation of consolidated financial statements, according to Colombian Banking GAAP, requires management to make certain estimates and assumptions that affect the reported amounts of assets and liabilities at the date of consolidated financial statements, as well as the reported amounts of revenues and expenses during the reporting period. Actual amounts could differ from those estimates.
|
e)
|
Real Value Unit rate (UVR)
|
The transactions that Grupo Aval’s banking subsidiaries carry out with regard to mortgage loans linked to the Unidad de Valor Real (the “Real Value Unit” or “UVR”) are adjusted on a daily basis based on the daily value of the UVR, as published by the Central Bank. The values assigned by the Central Bank to the UVR, in Colombian pesos, at December 31, 2011, 2010 and 2009 were Ps. 198.4467, 190.8298 and Ps 186.2734, respectively. The UVR reflects the monthly variance of the IPC (Colombian Consumer Price Index).
|
f)
|
Cash and cash equivalents
|
Cash and cash equivalents consist of cash and due from banks that are highly liquid investments with a maturity of three months or less at the date of acquisition. Interbank borrowings and overnight funds, explained in note 2(g) below, are also included in the “Cash and cash equivalents” account in the consolidated balance sheets
.
|
g)
|
Money market transactions
|
Money market transactions involve interbank and overnight funds, repurchase and resale (repo) transactions, simultaneous transactions and transactions involving the temporary transfer of securities.
Interbank and overnight funds
Interbank and overnight funds consist of funds either received from or placed in, directly, by any of Grupo Aval’s banking subsidiaries, other financial institutions. These transactions are undertaken for periods no longer than 30 calendar days, seeking to either take advantage of excess liquidity positions or compensate for liquidity deficiencies. Interest from interbank and overnight funds operations is recorded as income in the consolidated statements of income.
Repurchase and resale (repo) transactions
A repo transaction is defined as the acquisition or transfer of securities, in exchange for the delivery of liquid funds (with or without a discount), assuming at that time and by virtue of such action, the commitment to transfer or acquire from the counterparty, on either the same day or at a later date, without at any time exceeding the term of one year, at an established price, the securities subject to the transaction or other securities of similar kind. Under the terms of certain repo transactions, securities may be exchanged for other securities, and restrictions may be imposed as to the transferability of such securities. The value of the securities granted or received to support repo transactions is registered in the “Memorandum accounts”. The returns agreed upon for these transactions are based on the Superintendency of Finance rules and regulations and are recorded as income (in the case of lending operations) or expense (in the case of borrowing operations) in the consolidated statements of income.
GRUPO AVAL ACCIONES Y VALORES S.A. AND ITS SUBSIDIARIES
NOTES TO THE CONSOLIDATED FINANCIAL STATEMENTS
FOR THE YEARS ENDED DECEMBER 31, 2011, 2010 AND 2009
(
Stated in millions of Colombian pesos and U.S. dollars)
|
h)
|
Investment securities
|
1.
Classification
Investment securities are classified as “trading”, “available for sale” or “held to maturity”.
1.1.
Trading securities
Trading securities are those acquired mainly with the purpose of obtaining profits from short-term price fluctuations and are accounted for at fair value.
1.2.
Available for sale securities
Available for sale securities are those for which the investor has both a clear intention and legal, contractual, financial and operational capacity to hold for at least one year since the date investments are classified as available for sale. On the first business day after a year has passed since the initial classification of the securities as available for sale, investors decide whether to leave them in this category or reclassify them as trading or held to maturity. If and on the day an available for sale security is reclassified as trading, unrealized gains or losses must be recognized as either income or expense in the consolidated statements of income.
Available for sale securities include, in accordance with the
Bolsa de Valores de Colombia
, (Colombian Stock Exchange), low liquidity level and unquoted equity securities.
These securities can be used in liquidity transactions, including repo and simultaneous transactions. They can also be used as guarantees for derivative transactions if and when the counterparty is a clearinghouse.
1.3.
Held to maturity securities
Held to maturity securities are debt securities acquired with the stated purpose and legal, contractual, financial and operational capacity to hold until maturity. These securities are accounted for at their acquisition cost plus accrued interest using the effective interest rate method and may not be used for liquidity operations, unless they are mandatory investments entered into on the primary market, provided that the counterparty for the transaction is the Colombian Central Bank, institutions overseen by the Superintendency of Finance or, in exceptional cases, as otherwise determined by the Superintendency of Finance.
2.
Initial measurement
Securities are initially accounted for at their acquisition cost. Subsequent recognition depends on their classification.
2.1.
Debt securities
Available for sale and trading debt securities are appraised and valued on a daily basis. Grupo Aval and its banking subsidiaries determine the fair value of these securities by using the prices, reference rates and spreads that “
Información para Valoración” or
“Infoval” (entity created as provider of market prices by the Colombian Stock Exchange) calculates and publishes daily.
Held to maturity debt securities are accounted for at their acquisition cost plus accrued interest using the internal rate of return calculated on the purchase date.
GRUPO AVAL ACCIONES Y VALORES S.A. AND ITS SUBSIDIARIES
NOTES TO THE CONSOLIDATED FINANCIAL STATEMENTS
FOR THE YEARS ENDED DECEMBER 31, 2011, 2010 AND 2009
(
Stated in millions of Colombian pesos and U.S. dollars)
2.2.
Equity securities
The Superintendency of Finance mandates that equity investments are to be marked to market on a daily basis. However, in the case of investments in securities that have low liquidity levels, or that are not listed on a securities exchange, and whose only source of valuation are the financial statements of the issuing company, Grupo Aval and its banking subsidiaries regularly conduct valuations of such investments, recording the amounts thus appraised in their consolidated financial statements.
On August 24, 2009, the Superintendency of Finance eliminated the trade-weighted stock index that was previously used as a benchmark for valuing shares and instead established the following stock valuation method:
a. Listed equity securities, issued and traded in Colombia
Securities are valued daily based on prices published by authorized entities (i.e., the Colombian Stock Exchange). In the absence of a price calculated for the day on which these securities are appraised, the last known valuation price is to be used. In the case of a listed equity security not reporting any trades on the secondary market as of its issue date, and for which there is no indicated market price for its primary issue, it should be appraised based on the guidelines stipulated in 2.2.b below.
b. Non-listed equity securities, issued in Colombia
Securities are valued based on acquisition cost which is later increased or decreased depending upon the investor’s percentage stake in all subsequent changes in the issuer’s shareholders’ equity.
For this purpose, the issuer’s shareholders’ equity is calculated based on audited financial statements at the cut-off dates of June 30 and December 31 of each year. However, when more recent audited financial statements are released, these financial statements may be used to calculate the latest changes to the equity of the issuer. Entities have a maximum allowed time of three months, subsequent to the cut-off date of the financial statements, to update the valuations of their investments.
Prior to August 24, 2009, equity securities were valued based on a liquidity-weighted stock index, calculated by the Colombian Stock Exchange, applicable on each of the dates on which such valuations were conducted. Depending on their liquidity levels, equity securities were valued as follows:
High-liquidity equity securities
: based on the last daily average trade-weighted price published by the Colombian Stock Exchange.
Medium-liquidity equity securities
: based on the average price published by the Colombian Stock Exchange, which corresponded to the average trade-weighted price for the last five days on which such securities were traded.
Low-liquidity equity securities or those not listed on a stock exchange
: based on the increase or decrease of an investor’s percentage stake in the issuers’ shareholders’ equity updated using the latest audited financial statements released by the issuer.
c. Listed equity securities, issued and traded in countries other than Colombia
Securities are valued based on their respective closing prices, and if not available, based on the latest prices reported in the securities exchange where they trade. If there is no price reported for five days preceding each valuation, the securities are valued based on the average reported price of the last 30 days. If there is no price reported for the last 30 days, then securities are valued based on the methodology described in 2.2.b. above for non-listed securities.
The value of such securities is translated to pesos using the market exchange rate of the day they are valued, as published by the Superintendency of Finance.
GRUPO AVAL ACCIONES Y VALORES S.A. AND ITS SUBSIDIARIES
NOTES TO THE CONSOLIDATED FINANCIAL STATEMENTS
FOR THE YEARS ENDED DECEMBER 31, 2011, 2010 AND 2009
(
Stated in millions of Colombian pesos and U.S. dollars)
2.3. Private Investment Funds
Private Investment Funds are valued by multiplying the number of units owned by the value of the unit provided by the administrator of the fund at the date of the closing of its financial statements period.
3. Subsequent measurement
As described above, security investments are initially accounted for at their acquisition cost. Subsequent measurement and recording depend upon how they are classified by the investor as follows:
3.1 Trading securities
These investments are recorded on a daily basis at fair value and include investments in debt and equity securities acquired for short-term trading purposes. Unrealized gain or losses resulting from differences in fair values are included in the consolidated statement of income for the year.
Trading investments are valued at fair value using referential prices published daily by the Bolsa de Valores de Colombia. Debt investments issued by foreign entities are valued using reference published prices sourced from Bloomberg or Reuters.
Dividends in kind, including those that stem from the revaluation of equity accounts do not create income and only affect the number of shares owned of the investment. Dividends in cash, when paid, decrease the value of the investment and affect the income statement at the income on investment securities line item.
3.2 Available-for-sale securities
3.2.1 Debt securities
Differences between the present value of the valuation date and the last present value calculated and recorded are registered as increases or decreases in the “investment securities” account in the balance sheet and are also accounted for in the consolidated statements of income. Differences arising between the market value and the present value are reported as “unrealized gains (losses) on investment securities available for sale” in the investors’ shareholders’ equity. This procedure is performed on a daily basis.
3.2.2 Equity securities
Changes in the value of equity securities depend on their liquidity levels, as reported by the Colombian Stock Exchange, as follows:
3.2.2.1 Securities with low liquidity levels or securities not listed in a stock exchange
If the value of the investment, based on the latest audited financial statements available and released by the issuer, exceeds the investment, the difference reduces the devaluation account of the investment. If the increase in value of the investment exceeds the total value of its devaluation account, this difference is accounted for as a reduction of the investment’s valuation surplus.
If the value of the investment, based on the latest audited financial statements available and released by the issuer, reflects a lesser value than the cost of the investment, the difference reduces the valuation surplus account of the investment. If the decrease in the value of the investment exceeds the total value of its valuation surplus, any excess is recorded as an increase of the investment’s devaluation account.
GRUPO AVAL ACCIONES Y VALORES S.A. AND ITS SUBSIDIARIES
NOTES TO THE CONSOLIDATED FINANCIAL STATEMENTS
FOR THE YEARS ENDED DECEMBER 31, 2011, 2010 AND 2009
(
Stated in millions of Colombian pesos and U.S. dollars)
When dividends or earnings are distributed in cash, including those resulting from the capitalization of the equity revaluation account, the amount recorded in valuation surplus is accounted for as income, that valuation surplus is reversed, and the dividend excess amount is recorded as a lesser value of the investment. When dividends or earnings are distributed in kind, the portion that was accounted for as valuation surplus is recorded as income with a charge against the investment, and the valuation surplus is reversed.
3.2.2.2 Securities with high or medium liquidity levels
Differences between current and previous mark-to-market valuations of these securities are recorded daily as “Unrealized gains or losses on investment securities available for sale”, within the shareholders’ equity accounts, and crediting or debiting the investment securities account.
Dividends received in cash or in kind, including those from capitalizing the equity revaluation account, must be recorded as dividend income up to the amount which corresponds to the investor in the net income or the revaluation of equity account of the investee since the date of the investment with charge to accounts receivable.
3.3 Investments held to maturity
Investments held to maturity are accounted for at acquisition cost plus accrued interest using the effective interest rate method. The effective interest rate is the internal rate of return calculated at the time of the purchase of the investment. Interest accruals are recorded as interest income on investment securities in the consolidated statements of income.
3.4 Securities denominated in foreign currency or UVR
Foreign exchange gains or losses resulting from the conversion of investment securities denominated in foreign currency or UVR are recorded as “Net foreign exchange gains (losses)” in the consolidated statements of income.
4. Impairment evaluation of investment securities
4.1. Securities of issuances or issuers without a credit rating
Securities are classified according to a methodology defined by Grupo Aval’s banking subsidiaries and approved by the Superintendency of Finance. The securities are categorized as “A” except for when there is a risk associated with them, in which case they are rated from “B” to “E”.
The maximum percentage of net value, as defined by the Superintendency of Finance, at which these investments may be recorded, according to their category, as follows:
|
Category
|
Risk Level
|
Investment characteristics
|
Maximum percentage of net value
|
|||
|
A
|
Normal
|
Comply with the agreed terms for the security and have sufficient debt service capacity for both principal and interest
|
100%
|
|||
|
B
|
Acceptable
|
Present factors of uncertainty that could affect the capacity to continue adequately making principal and interest payments. Also, their financial statements and other information available present weaknesses that may affect their financial condition.
|
Net value must not exceed eighty percent (80%) of its acquisition cost.
|
|||
|
C
|
Appreciable
|
Present medium-high probabilities of non-fulfillment of timely payments of principal and interests. Also, their financial statements and other information available evidence deficiencies in the financial condition that compromises the recovery of the underlying investment.
|
Net value must not exceed sixty percent (60%) of its acquisition cost.
|
|||
|
D
|
Significant
|
Present non-fulfillment of agreed terms on the security and material deficiencies in their financial situation; also, their financial statements and other information available evidence marked deficiencies in their financial condition and, as a result, probability of recovery is highly questionable.
|
Net value may not exceed forty percent (40%) of its acquisition cost.
|
|||
|
E
|
Uncollectible
|
Issues that as per their financial statements and other information available deem the investment uncollectible. Also, there are no financial statements as of the closing of June 30 and December 31
of each year.
|
The full value of this item must be entirely reserved.
|
GRUPO AVAL ACCIONES Y VALORES S.A. AND ITS SUBSIDIARIES
NOTES TO THE CONSOLIDATED FINANCIAL STATEMENTS
FOR THE YEARS ENDED DECEMBER 31, 2011, 2010 AND 2009
(
Stated in millions of Colombian pesos and U.S. dollars)
4.2. Securities or issuers that have a local credit rating
The value of securities that are rated by a local rating agency recognized by the Superintendency of Finance cannot be recorded at an amount that exceeds the following percentages of their nominal value, net of amortization as of each valuation date:
|
Long-Term Rating
(local scale)
|
Maximum Amount %
|
Short-Term Rating
(local scale)
|
Maximum Amount %
|
|
BB+, BB, BB-
|
Ninety (90)
|
3
|
Ninety (90)
|
|
B+, B, B-
|
Seventy (70)
|
4
|
Fifty (50)
|
|
CCC
|
Fifty (50)
|
5 and 6
|
Zero (0)
|
|
DD, EE
|
Zero (0)
|
5 and 6
|
Zero (0)
|
4.3. Cautionary provisions for equity securities
The Superintendency of Finance in Colombia allows financial institutions to recognize, on a case by case basis, cautionary provisions for equity securities on the basis of management expectations of on future decreases in fair value. Information used by Grupo Aval’s management for the assessment consists of possible economic scenarios and expectations. These provisions are based on the Prudence criteria established in the Colombian accounting principles.
|
(i)
|
Loans and financial leases
|
Loans and financial leases are recorded at their outstanding principal, net of premiums and discounts on purchased loans. Accrued interest is recorded as other account receivables and unearned interest is recorded as liability. Grupo Aval’s banking subsidiaries grant commercial, consumer, microcredit, mortgage loans and financial leases to customers as follows:
|
(1)
|
Commercial loans
|
Loans to legal entities for business activities different from those extended as microcredit transactions, or to individuals (mainly sole proprietorship enterprises’) for business activities different from those extended as consumer loans.
|
(2)
|
Consumer loans
|
Loans which, regardless of the amount, are extended to individuals for the purchase of consumer goods or payment of services for non-commercial or entrepreneurial purposes and different from those disbursed as microcredit transactions.
|
(3)
|
Microcredit loans
|
Loans defined in accordance with Article 39 of Law 590 of 2000, as well as transactions entered into with micro-businesses, under which the principal repayment source arises from revenues generated by their operations.
A micro-business is defined by such law as a legal entity focused on entrepreneurial activities related to agricultural, industrial, commercial or services nature, rural or urban, for which total number of employees is not higher than ten people and whose total assets are less than 500 minimum legal monthly salaries.
The debtor’s outstanding debt may not exceed the equivalent of 120 minimum legal monthly salaries at the moment of approval of the respective credit transaction. Outstanding indebtedness is the total amount of combined indebtedness of the micro-business with the entire financial sector, as determined through consultation of databases and information provided by the company, excluding mortgage loans for the financing of housing units and adding the new obligation.
GRUPO AVAL ACCIONES Y VALORES S.A. AND ITS SUBSIDIARIES
NOTES TO THE CONSOLIDATED FINANCIAL STATEMENTS
FOR THE YEARS ENDED DECEMBER 31, 2011, 2010 AND 2009
(
Stated in millions of Colombian pesos and U.S. dollars)
|
(4)
|
Mortgage loans
|
Loans granted to individuals for the acquisition of new or used residential units. Loans are denominated in UVRs or pesos and are backed by a first-priority mortgage on the asset financed. Tenure for amortization must fall between a minimum of five years and a maximum of 30 years. Loans may be fully or partially prepaid at any time without penalty. In the event of partial prepayment, the debtor is entitled to choose whether application is to be made against outstanding capital installments or to a reduction in the tenure of the obligation.
|
(5)
|
Financial Leases
|
Commercial agreements where the lessor (Grupo Aval’s banking subsidiaries with leasing operations) acquires an asset (e.g., equipment, vehicle or software) and rents it to a lessee. The lessee pays monthly installments to the lessor in exchange for the use of the asset. The lessee has the option of acquiring the asset once the term for the lease contract expires at a previously agreed upon price.
Evaluation by credit risk categories
Each of Grupo Aval’s banking subsidiaries analyzes, on an ongoing basis, the credit risks to which their loan portfolio is exposed, considering the terms of the corresponding obligations as well as the level of risk associated with each of the borrowers. This risk evaluation is based on information relating to the historical performance data, the particular characteristics of the borrower, collaterals, debt service with other entities, macroeconomic factors and financial information, in addition to other relevant information. Superintendency of Finance rules do not require credit risk evaluation on consolidated basis when the parent prepares its consolidated financial statements.
Grupo Aval’s banking subsidiaries review their outstanding loan portfolio under the above-mentioned criteria and classify individual loans under risk rating categories as follows:
|
Category
|
Approval
|
Commercial loan portfolio
|
Consumer loan portfolio
|
|||
|
“AA”
|
New loans whose assigned classification at approval is “AA”.
|
Outstanding loans and financial leases past due payments not exceeding 29 days (i.e. between 0 and 29 days past due). The debtor’s financial statements or its
projected cash flows, as well as all other credit information
available to the financial subsidiaries, reflect excellent paying capacity.
|
Loans whose risk rating is “AA” according to the methodology of the Consumer Reference Model (MRCO) as established by the Superintendency of Finance.
|
|||
|
“A”
|
New loans whose risk rating at approval is “A”.
|
Outstanding loans and financial leases with delayed payments in excess of 30 days but not exceeding 59 days (i.e. between 30 and 59 days past due). The debtor’s financial statements or its
projected cash flows, as well as all other credit information
available to the financial subsidiaries, reflect appropriate paying capacity.
|
Loans whose risk rating is “A” according to the methodology of the MRCO as established by the Superintendency of Finance.
|
|||
|
“BB”
|
New loans whose risk rating at approval is “BB”.
|
Outstanding loan and financial leases past due more than 60 days but less than 90 days (i.e. between 60 and 89 days past due). Loans in this category are acceptably serviced and collateralized, but there are weaknesses which may potentially affect, on a transitory or permanent basis, the debtor’s ability to pay or its projected cash flows, to the extent that, if not timely corrected, would affect the normal collection of credit or contracts.
|
Loans whose risk rating is “BB” according to the methodology of the MRCO as established by the Superintendency of Finance.
|
|||
|
“B”
|
New loans whose risk rating at approval is “B”.
|
Outstanding loans and financial leases past due over 90 days but less than 120 days (i.e. between 90 and 119 days past due). The debtor shows insufficient paying capacity of its obligations.
|
Loans whose risk rating is “B” according to the methodology of the MRCO as established by the Superintendency of Finance.
|
|||
|
“CC”
|
New loans whose risk rating at approval is “CC”.
|
Outstanding loans and financial leases past due more than 120 days but less than 150 days (i.e. between 120 and 149 days past due). Loans in this category represent grave insufficiencies in the debtors’ paying capacity or in the project’s cash flow, which may compromise the normal collection of the obligations.
|
Loans whose risk rating is “CC” according to the methodology of the MRCO as established by the Superintendency of Finance.
|
|||
|
“Default”
|
-
|
Outstanding loans and financial leases past due for 150 days or more. This category is deemed uncollectible. These loans are considered in default.
|
Consumer loan portfolio past due over 90 days.
|
GRUPO AVAL ACCIONES Y VALORES S.A. AND ITS SUBSIDIARIES
NOTES TO THE CONSOLIDATED FINANCIAL STATEMENTS
FOR THE YEARS ENDED DECEMBER 31, 2011, 2010 AND 2009
(
Stated in millions of Colombian pesos and U.S. dollars)
The previously described risk categories are reorganized into the standard risk ratings shown in Grupo Aval’s consolidated financial statements using the following chart:
|
Consolidated financial statements risk category
|
Reporting category
|
|||
|
Commercial
|
Consumer
|
|||
|
“A” Normal Risk
|
AA
|
AA
A - between 0 and 30 days past due
|
||
|
“B” Acceptable Risk
|
A
BB
|
A - more than 30 days past due
BB
|
||
|
“C” Appreciable Risk
|
B
CC
|
|||
| “D” Significant Risk | "Default" - all other past due loans not classified in "E" | |||
| “E” Uncollectible |
"Default" - past due loans with a LGD (explained below) of 100%
|
|||
Microcredit and mortgage loan portfolios, on the basis of past due loans, are classified as follows:
|
Category
|
Microcredit
|
Mortgage
|
||
|
“A” Normal Risk
|
In compliance or up to 30 days past due
|
In compliance or with up to 60 days past due
|
||
|
“B” Acceptable Risk
|
Past due between 31 and 60 days
|
Past due between 61 and 150 days
|
||
|
“C” Appreciable Risk
|
Past due between 61 and 90 days
|
Past due between 151 and 360 days
|
||
|
“D” Significant Risk
|
Past due between 91 and 120 days
|
Past due between 361 and 540 days
|
||
|
“E” Uncollectible
|
Past due over 120 days
|
Past due over 540 days
|
Allowance for loan and financial lease losses
Commercial and consumer loans
Allowances for loan and financial lease losses are established based on requirements issued by the Superintendency of Finance.
Grupo Aval’s banking subsidiaries adopted the Commercial and Consumer Reference Models (MRC and MRCO), issued by the Superintendency of Finance for their commercial and consumer loans, respectively.
In order to cover loss-related risks, Grupo Aval’s banking subsidiaries implemented a loan-loss reserve system through which allowances are calculated over the outstanding balance of the obligation, depending on actual past due period and on the risk category for all loans under microcredit and mortgage portfolios, and as a function of anticipated losses as calculated by application of the reference models for commercial and consumer loan portfolios. Such system includes the following:
Specific or individual allowance
These allowances reflect the individual credit rating of each debtor and combine a “pro-cyclical” individual allowance component and “counter-cyclical” individual allowance component. The first component reflects credit risk exposure during regular economic conditions, and the second reflects changes in the credit risk exposure of each debtor as a result of impairment of debt service capacity during future crisis periods. Both the MRC and MRCO Reference Models calculate both components of the allowance.
GRUPO AVAL ACCIONES Y VALORES S.A. AND ITS SUBSIDIARIES
NOTES TO THE CONSOLIDATED FINANCIAL STATEMENTS
FOR THE YEARS ENDED DECEMBER 31, 2011, 2010 AND 2009
(
Stated in millions of Colombian pesos and U.S. dollars)
General allowance
Grupo Aval’s banking subsidiaries set up a general allowance corresponding to 1% of the total value of microcredit and mortgage loans.
By virtue of applying the MRC and MRCO Reference Models, rules and regulations allowed for the general allowance pertaining to commercial and consumer loans accounted for before the time these models were applied, to be assigned as part of the individual provisions that were initially required.
The general allowance, however, may be increased if approved by a general shareholders meeting of each of Grupo Aval’s banking subsidiaries, and is updated on a monthly basis according to the increases or decreases in the loan portfolio.
According to the above-mentioned reference models, the allowance for loan losses is stated through the calculation of the Expected Loss:
Expected Loss = [Probability of default (%)] x [Exposure to default] x [Loss given default (%)]
Probability of Default (PD)
PD corresponds to the probability of the debtors defaulting on their obligations in a period of twelve months. PD is defined as a percentage according to the following matrixes, established by the Superintendency of Finance:
Commercial loans
|
Classification
|
Matrix A (1)
|
Matrix B (1)
|
||||||
|
Companies
|
Individuals (2)
|
Companies
|
Individuals (2)
|
|||||
|
Large
|
Medium
|
Small
|
Large
|
Medium
|
Small
|
|||
|
AA
|
1.53%
|
1.51%
|
4.18%
|
5.27%
|
2.19%
|
4.19%
|
7.52%
|
8.22%
|
|
A
|
2.24%
|
2.40%
|
5.30%
|
6.39%
|
3.54%
|
6.32%
|
8.64%
|
9.41%
|
|
BB
|
9.55%
|
11.65%
|
18.56%
|
18.72%
|
14.13%
|
18.49%
|
20.26%
|
22.36%
|
|
B
|
12.24%
|
14.64%
|
22.73%
|
22.00%
|
15.22%
|
21.45%
|
24.15%
|
25.81%
|
|
CC
|
19.77%
|
23.09%
|
32.50%
|
32.21%
|
23.35%
|
26.70%
|
33.57%
|
37.01%
|
|
Default
|
100.00%
|
100.00%
|
100.00%
|
100.00%
|
100.00%
|
100.00%
|
100.00%
|
100.00%
|
|
(1)
|
As defined by the Superintendency of Finance, Matrix A reflects PD in a growing economic scenario while Matrix B reflects PD in a worsening economic scenario. Matrix A is used to calculate the pro-cyclical component of the individual allowance while Matrix B is used to calculate the counter-cyclical component.
|
|
(2)
|
Individuals´ loans mainly refer to sole proprietorships, which are legal entities commonly used in Colombia by individuals with the objective of insulating personal assets from potential business risks.
|
Consumer loans
|
Classification
|
Matrix A(1)
|
Matrix B(1)
|
||||
|
Automobile and
vehicle
loans
|
General
purpose(2)
|
Credit card
|
Automobile and
vehicle loans
|
General
purpose(2)
|
Credit card
|
|
|
AA
|
0.97%
|
2.10%
|
1.58%
|
2.75%
|
3.88%
|
3.36%
|
|
A
|
3.12%
|
3.88%
|
5.35%
|
4.91%
|
5.67%
|
7.13%
|
|
BB
|
7.48%
|
12.68%
|
9.53%
|
16.53%
|
21.72%
|
18.57%
|
|
B
|
15.76%
|
14.16%
|
14.17%
|
24.80%
|
23.20%
|
23.21%
|
|
CC
|
31.01%
|
22.57%
|
17.06%
|
44.84%
|
36.40%
|
30.89%
|
|
Default
|
100.00%
|
100.00%
|
100.00%
|
100.00%
|
100.00%
|
100.00%
|
GRUPO AVAL ACCIONES Y VALORES S.A. AND ITS SUBSIDIARIES
NOTES TO THE CONSOLIDATED FINANCIAL STATEMENTS
FOR THE YEARS ENDED DECEMBER 31, 2011, 2010 AND 2009
(
Stated in millions of Colombian pesos and U.S. dollars)
|
(1)
|
As defined by the Superintendency of Finance, Matrix A reflects PD in a growing economic scenario while Matrix B reflects PD in a worsening economic scenario. Matrix A is used to calculate the pro-cyclical component of the individual allowance while Matrix B is used to calculate the counter-cyclical component.
|
|
(2)
|
“General purpose” refers to all consumer loans other than automobile and vehicle loans and credit cards.
|
Exposure to default
With regard to the MRC and MRCO Reference Models, the exposure value of an asset is the current balance of the principal outstanding, accrued and unpaid interest, and other receivables regarding commercial and consumer loan obligations.
Loss Given Default (LGD)
LGD is defined as a percentage to reflect the credit loss incurred if an obligor defaults.
LGD for debtors depends on the type of collateral and would suffer a gradual increase in the percentage of loss according to the amount of days elapsing after being classified in each category. For this purpose, 100% of the collateral value is considered to cover the principal amount.
In 2011 and 2010, Grupo Aval’s banking subsidiaries applied the criteria for LGD defined by Superintendency of Finance. The following tables show the LGD depending on the type of guarantee:
Commercial loan portfolio
|
Type of guarantee
|
Days past due
|
LGD
|
Days past due
|
LGD
|
Days past due
|
LGD
|
||||||
|
Not admissible guarantee
|
1-269
|
55%
|
270-539
|
70%
|
540 or more
|
100%
|
||||||
|
Subordinated debt
|
1-269
|
75%
|
270-539
|
90%
|
540 or more
|
100%
|
||||||
|
Admissible financial collateral
|
0
|
0 - 12%
|
-
|
-
|
-
|
-
|
||||||
|
Commercial and residential real estate properties
|
1-539
|
40%
|
540-1079
|
70%
|
1080 or more
|
100%
|
||||||
|
Assets under real estate leasing
|
1-539
|
35%
|
540-1079
|
70%
|
1080 or more
|
100%
|
||||||
|
Assets under leasing modalities other than real estate leasing
|
1-359
|
45%
|
360-719
|
80%
|
720 or more
|
100%
|
||||||
|
Other forms of collateral
|
1-359
|
50%
|
360-719
|
80%
|
720 or more
|
100%
|
||||||
|
Collection rights
|
1-359
|
45%
|
360-719
|
80%
|
720 or more
|
100%
|
||||||
|
Unguaranteed
|
1-209
|
55%
|
210-419
|
80%
|
420 or more
|
100%
|
Consumer loan portfolio
|
Type of guarantee
|
Days past due
|
LGD
|
Days past due
|
LGD
|
Days past due
|
LGD
|
||||||
|
Not admissible guarantee
|
1-209
|
60%
|
210-419
|
70%
|
420 or more
|
100%
|
||||||
|
Admissible financial collateral
|
0
|
0 - 12%
|
-
|
-
|
-
|
-
|
||||||
|
Commercial and residential real estate properties
|
1-359
|
40%
|
360-719
|
70%
|
720 or more
|
100%
|
||||||
|
Assets under real estate leasing
|
1-359
|
35%
|
360-719
|
70%
|
720 or more
|
100%
|
||||||
|
Assets under leasing modalities other than real estate leasing
|
1-269
|
45%
|
270-539
|
70%
|
540 or more
|
100%
|
||||||
|
Other forms of collateral
|
1-269
|
50%
|
270-539
|
70%
|
540 or more
|
100%
|
||||||
|
Collection rights
|
1-359
|
45%
|
360-719
|
80%
|
720 or more
|
100%
|
||||||
|
Unguaranteed (1)
|
1-179
|
65%
|
180-359
|
85%
|
360 or more
|
100%
|
(1)
In October 31, 2011, Banco de Bogotá changed its
PDI
and started to apply the following:
|
Type of guarantee
|
Days past due
|
LGD
|
Days past due
|
LGD
|
Days past due
|
LGD
|
||||||
|
Unguaranteed
|
1-30
|
75%
|
31-90
|
85%
|
91 or more
|
100%
|
GRUPO AVAL ACCIONES Y VALORES S.A. AND ITS SUBSIDIARIES
NOTES TO THE CONSOLIDATED FINANCIAL STATEMENTS
FOR THE YEARS ENDED DECEMBER 31, 2011, 2010 AND 2009
(
Stated in millions of Colombian pesos and U.S. dollars)
Microcredit and mortgage loans
Although there are no reference models for microcredit and mortgage loans, the Superintendency of Finance establishes the following tables for provisioning for such loans:
|
Microcredit
|
Mortgage Loans
|
|||
|
Risk Category
|
Provision as % of Principal
|
Provision as % of principal covered by guarantee
|
Provision as % of principal not covered by guarantee
|
|
|
A
|
1.6%
|
1.0%
|
1.0%
|
|
|
B
|
5.0%
|
3.2%
|
100.0%
|
|
|
C
|
20.0%
|
10.0%
|
100.0%
|
|
|
D
|
50.0%
|
20.0%
|
100.0%
|
|
|
E
|
100.0%
|
30.0%(1)
|
100.0%
|
|
|
(1)
|
After two years in risk category E, the provision increases to 60.0%, and after a third year in this category, it increases to 100.0%.
|
The collateral for such loans only covers principal amounts outstanding and is impaired when past due time increases as established by the Superintendency of Finance. Only 70% of the collateral value is considered to cover the principal amount.
All of Grupo Aval’s banking subsidiaries adhere to the provision table detailed above, with the exception of Banco de Bogotá, which holds a provision of at least 1.6% of the principal amount of microcredit A-rated loans, and 5.0% of the principal amount of microcredit B-rated loans.
Valuation of mortgage collateral for allowance purposes
The value of the collateral posted by each of Grupo Aval’s banking subsidiaries is established based on parameters issued by the Superintendency of Finance, as discussed below.
In the case of mortgage collateral consisting of residences, the market value is the initial appraisal value of the collateral adjusted by the corresponding change in the housing price index published by the Colombian National Planning Department. The value is updated at least on a quarterly basis, using the above-mentioned index.
In the case of mortgage collateral consisting of real property, the market value is the appraisal value of the pledged property when the loan was issued or the new appraisal value as subsequently calculated.
Charge-offs
Loans may be subject to charge-offs when all possible collection mechanisms have been exhausted, and when such loans are provisioned for one hundred percent (100%).
Charge-offs do not, however, constitute release of the officers’ responsibility for approval and administration of the incumbent loan, nor do they eliminate their obligation to continue to engage in collection efforts aimed to accomplish recovery. The recovery of charged-off loans is accounted for in the consolidated statements of income.
The Board of Directors of each of Grupo Aval’s banking subsidiaries is the only administrative body with sufficient authority to approve charge-offs of loans deemed uncollectible.
Rules of alignment
Grupo Aval’s banking subsidiaries engage in alignment of loan debtors based on the following criteria:
|
a.
|
Prior to estimation of the allowance for loan-losses and reconciliation of risk ratings, on a monthly basis and for each debtor, each of Grupo Aval’s banking subsidiaries engages in an internal alignment process in which all loans outstanding for one debtor are brought up to the highest risk category assigned to any of them. An exception is made upon demonstration before the Superintendency of Finance of sufficient reasons for classification in a lower risk category.
|
GRUPO AVAL ACCIONES Y VALORES S.A. AND ITS SUBSIDIARIES
NOTES TO THE CONSOLIDATED FINANCIAL STATEMENTS
FOR THE YEARS ENDED DECEMBER 31, 2011, 2010 AND 2009
(
Stated in millions of Colombian pesos and U.S. dollars)
|
b.
|
As per standing legal provisions, all subsidiaries of each banking entity have to assign the same classification to all similar loans extended to one debtor unless it is demonstrated before the Superintendency of Finance that there are sufficient reasons for classification in a lower risk category.
|
Troubled loan restructurings
Loans are restructured when Grupo Aval’s banking subsidiaries grant a concession to a debtor, as a result of economic or legal matters adversely impacting the debtor’s financial situation, which it would not otherwise consider.
Loans can be restructured either through the capitalization of interest recorded in memorandum accounts or by writing-off balances (which may include capital, interest, and other items). The amounts capitalized are recorded as “deferred income” under the “other liabilities” line item, and are amortized in proportion to the amounts actually collected and the income that is recorded on a cash basis.
Extraordinary restructurings are those based on External Memorandum 039 of 1999 issued by the Superintendency of Finance. According to the External Memorandum, reversals of loan loss allowances or improvements of credit risk categories are only acceptable when all the terms of the restructured loan are sufficiently demonstrated. In the event that a debtor with a restructured loan does not comply with each of the agreed terms, its loans are downgraded to the credit risk category that the debtor had prior to the restructuring or to an even higher risk category.
According to Law 550 of 1999, which stipulated restructuring regulations, Grupo Aval’s banking subsidiaries that had restructured loans, adhered to such Law, outstanding as of December 2010, are expected to stop accruing interest on the outstanding loans once the restructuring conditions are agreed upon. Grupo Aval’s banking subsidiaries are required to maintain the same credit risk category on loans pre- and post-restructuring. The only exception is the case in which prior to the restructuring, the loan was classified as
A
. In this situation, the financial subsidiaries must downgrade it at least to
B
and create an allowance of 100.0% of the debt outstanding. Law 1116 of 2006 (“The Bankruptcy Law”) repealed Law 550 of 1999 and stipulated that any debtor that enters into a restructuring agreement is considered as in “default”.
Pursuant to loan restructurings which adhered to the terms established in the Fiscal and Financial Reform Programs stipulated by Law 617 of 2000 and that are still outstanding as of December 2010, Grupo Aval’s banking subsidiaries engage in the application of the following policies:
The Colombian Government guarantees the financial obligations that governmental entities have with financial institutions supervised by the Superintendency of Finance (i.e., all of Grupo Aval’s banking subsidiaries) upon fulfillment of all requirements established under Law 617 of 2000, including, among others, that fiscal adjustment agreements were signed with the Government before June 30, 2001. For loans outstanding as of December 31, 1999, the Government guarantees up to 40.0%, and for all new loans intended to fulfill the signed fiscal adjustment agreement, the Government guarantees up to 100.0%.
Previously established allowances for restructured loans under Law 617 of 2000 were reversed for the portion guaranteed by the Government. The portion of the loan not guaranteed by the Government maintained the credit risk category that it had as of June 30, 2001.
Suspension of accruals
The Superintendency of Finance established that interest, income for UVR, lease payments and other items of income cease to be accrued in the consolidated statements of income and begin to be recorded in Memorandum Accounts until effective payment is collected after a loan is in arrears for more than sixty (60) days for mortgage and consumer loans, ninety (90) days for commercial loans, and thirty (30) days for microcredit loans. After the suspension of accruals, interests collected are recorded in the consolidated statements of income on a cash basis.
GRUPO AVAL ACCIONES Y VALORES S.A. AND ITS SUBSIDIARIES
NOTES TO THE CONSOLIDATED FINANCIAL STATEMENTS
FOR THE YEARS ENDED DECEMBER 31, 2011, 2010 AND 2009
(
Stated in millions of Colombian pesos and U.S. dollars)
|
(j)
|
Loan fees
|
Loan origination and commitment fees, as well as direct loan origination and commitment costs, are recorded in the consolidated statements of income as incurred.
|
(k)
|
Bankers’ acceptances, spot transactions and derivatives financial instruments
|
Bankers’ acceptances
Bankers’ acceptances have a maximum maturity up to one year and may only be originated from import and export (i.e., trade- related) transactions or under purchases and sales of domestic movable assets (personal property).
After maturity, bankers’ acceptances are subject to reserve requirements prescribed by the Colombian Central Bank. These reserve requirements are based on a percentage of short-term deposits maintained at Grupo Aval’s banking subsidiaries.
Spot transactions
Spot transactions are transactions whose liquidation and settlements takes place within the next three business days after their agreement.
Derivatives financial instruments
Derivatives are held on behalf of customers, for trading, as economic hedges, or as qualifying accounting hedges, with the determination made when Grupo Aval enters into the derivative contract. The designation may change based upon management’s reassessment or changing circumstances. Derivatives utilized by Grupo Aval’s banking subsidiaries, include swaps, future and forward contracts and options.
Grupo Aval’s banking subsidiaries recognize derivative financial instruments as either assets or liabilities in the consolidated balance sheet at their related fair values. Changes in the fair value of a derivative are recorded depending on the intended use of the derivative and the resulting designation. Fair value measurements include neither the Grupo Aval’s own credit standing or counterparty credit risk.
Since January 1, 2010, the Colombian Superintendency of Finance allows the application of hedge accounting as either fair value hedges, cash flow hedges or hedges on foreign assets and liabilities financial instruments. Before 2010 hedge accounting was not permitted. For derivative instruments that are not designated as accounting hedges, changes in fair value are recognized in income in the period of change. Grupo Aval’s banking subsidiaries manage foreign currency exchange rate sensitivity predominantly through the use of derivatives. Before that date hedge accounting was not allowed.
During the year ended December 31, 2011, Banco de Bogotá applied hedge accounting over its net investment in Leasing Bogotá Panamá. For accounting hedges, Banco de Bogotá formally documents at inception all relationships between hedging instruments and hedged items, as well as the risk management objectives and strategies for undertaking various accounting hedges. Additionally, it applies on a monthly basis and for each reporting period retrospective and prospective, effectiveness test to assess whether the derivative used in its hedging transaction is expected to be and has been highly effective, in a range between 80% and 100%, in offsetting changes in the fair value of the hedged item.
In accordance to rules issued by the Colombian Superintendency of Finance, Banco de Bogotá records changes in the fair value of derivatives used as hedges of the net investment in foreign operations, to the extent ineffective, as a component of stockholders’ equity. The effective portion of the hedge relationship is recorded in the income statement. If a derivative instrument in a foreign assets and liabilities hedge is terminated or the hedge designation is removed, related amounts in stockholders’ equity are reclassified into earnings in the same period or periods during which the hedged transaction was discontinued.
GRUPO AVAL ACCIONES Y VALORES S.A. AND ITS SUBSIDIARIES
NOTES TO THE CONSOLIDATED FINANCIAL STATEMENTS
FOR THE YEARS ENDED DECEMBER 31, 2011, 2010 AND 2009
(
Stated in millions of Colombian pesos and U.S. dollars)
Grupo Aval’s banking subsidiaries discontinue hedge accounting when it is determined that a derivative is not expected to be or has ceased to be highly effective as a hedge, and then reflects changes in fair value of the derivative in earnings after termination of the hedge relationship.
For hedging instruments under Colombian Banking GAAP purposes, Grupo Aval follows the forward-rate method for the U.S. dollar forwards in order to test effectiveness. The test is done every month.
Management’s intention is to renew forward contracts for hedging purposes as those mature.
For the U.S. dollar forwards designated as hedging instruments, ineffectiveness could be generated between the hedging instrument and the hedged item if both have different notional amounts or different currencies. Grupo Aval will measure hedge ineffectiveness by comparing the change in the value of the actual derivative with the change in value of a hypothetical derivative with the same maturity.
In addition and also effective on January 1, 2010, any day one gain or losses derived from valuations performed, on Swaps are required to be deferred and amortized on a straight-line basis during the life of the associated derivative instrument.
Fair value measurements
The fair value of derivative financial instruments is measured as follows:
Forward contracts
Since January 2009, forwards are valued using the standardized methodology issued by the Superintendency of Finance, which uses quoted forward price points published by authorized providers and/or brokerage firms that encompass a major portion of the market’s liquidity. Regulations established by the Superintendency of Finance suggest the following:
The value of the obligation that a forward contract seller (right for its buyer) has to register in its balance sheet is calculated as the product of the amount of foreign currency being negotiated, times the exchange rate of the day of the valuation plus the appropriate quoted forward price points of the transaction, all divided by 1 plus the zero coupon rate as of the maturity of the forward times the result of dividing the maturity of the forward (in days) by 360. The value of the right that the forward contract seller (obligation for its buyer) has to register in its balance sheet is calculated as the product of the amount of foreign currency being negotiated times the expected exchange rate of the day of the maturity, all divided by 1 plus the zero coupon rate as of the maturity of the forward times the result of dividing the maturity of the forward (in days) by 360. To calculate income or expense associated to the transaction, the investor has to consider the difference between the agreed forward exchange rate and the actual forward exchange rate of the day of the valuation. The present value of this difference is calculated using a zero coupon rate. If the resulting value is positive, then the seller of the forward has to recognize it as income in its consolidated statement of operations and the buyer has to recognize a loss for the same value. If the resulting value is negative, then the buyer of the forward has to recognize it as income in its consolidated statement of operations and the seller has to recognize a loss for the same value.
Swap contracts
The fair value of swap contracts is determined using the discounted cash flow method at the interest rates applicable for each cash flow. Interest rate curves are drawn up for each operation based on information sourced from Bloomberg and Infoval.
Option contracts
Options are appraised as stipulated by the Superintendency of Finance using the Black-Scholes/Merton method, which is the model commonly used on an international basis.
The information to be used in the model for the valuation of options is obtained from financial information systems which provide data for the variables involved (volatilities, risk-free rates and exchange rates).
GRUPO AVAL ACCIONES Y VALORES S.A. AND ITS SUBSIDIARIES
NOTES TO THE CONSOLIDATED FINANCIAL STATEMENTS
FOR THE YEARS ENDED DECEMBER 31, 2011, 2010 AND 2009
(
Stated in millions of Colombian pesos and U.S. dollars)
Call options are initially accounted at their acquisition cost in the related asset; put options are initially accounted in the related liability at the value of the premiums received. Subsequent variations on the fair value options are adjusted in the related asset or liability, through profit and loss.
When the Bank buys a call or put option, the premium paid and the daily variations to the fair market price are recorded in assets.
If the Bank sells an option, the premium received and the daily variations to the fair market price are recorded as liabilities.
On the contract settlement date, balances corresponding to the right and the obligation are cancelled out, and any difference with the proceeds is recorded as a profit or loss on valuation of derivatives.
|
(l)
|
Foreclosed assets
|
Grupo Aval’s banking subsidiaries record the value of assets received as collateral using the following criteria:
|
·
|
Foreclosed assets represented by real estate properties are recognized based on commercial appraisals technically determined and personal properties, stocks and equity interests are received based on market values.
|
|
·
|
When foreclosed assets are not in a condition to be immediately liquidated, their cost increases with all those expenses required in order to prepare such assets ready for sale.
|
|
·
|
If the proceeds of the sale are more than the settlement value agreed upon with the debtor, that difference is recorded as accounts payable to the debtor. If the proceeds of the sale are expected to be insufficient to cover the outstanding debt, the difference must be immediately recorded charged as a non-operating expense.
|
|
·
|
Personal property received in payment corresponding to investment securities is valued by applying the criteria indicated in this note under
“2(h) Investment securities”,
but taking into account provision requirements for the periods referred to below.
|
|
·
|
The profits obtained from a credit sale are deferred over the life of the credit, and are realized as the obligation is paid off.
|
|
·
|
When the commercial value of the property is lower than its book value, a provision is recorded for the difference.
|
|
·
|
Reappraisals of foreclosed assets are recorded as memorandum accounts.
|
Legal term for sale of foreclosed assets
Banking subsidiaries must sell the foreclosed assets, in a period no later than two years after the foreclosure date, except when, upon the request of each of Grupo Aval’s banking subsidiaries, the Superintendency of Finance extends the term. However, in any event the extension may not exceed an additional period of two years.
Provisions for foreclosed assets
All of Grupo Aval’s banking subsidiaries register their provisions for foreclosed assets according to External Circular 034 of 2003, both for real estate assets and for movable assets (personal property).
GRUPO AVAL ACCIONES Y VALORES S.A. AND ITS SUBSIDIARIES
NOTES TO THE CONSOLIDATED FINANCIAL STATEMENTS
FOR THE YEARS ENDED DECEMBER 31, 2011, 2010 AND 2009
(
Stated in millions of Colombian pesos and U.S. dollars)
According to the External Circular mentioned above, during the first year following the receipt of the real estate asset, a provision of 30% of the carrying value of the asset at the time of receipt is recognized in the consolidated income statement in proportional monthly installments. This provision increases by an additional 30% in proportional monthly installments within the second year following date of foreclosure of the asset up to 60% of the cost of the asset. Once the legal term for sale has expired an authorization for extension is required by the Superintendency of Finance. If the authorization is not granted, a provision equal to 80% of the carrying value of the asset should be recognized. If extension is granted, this provision should be recognized by the end of the extension period.
For foreclosed assets different from real estate, the provision is equal to 35% of the carrying value of the asset at the time of foreclosure and should be constituted in proportional monthly installments within the first year following the receipt. This provision should be increased by an additional 35% within the second year up to 70% of the cost of the assets. Once the legal term for sale has expired without authorization for extension, the provision should be increased up to 100%. If extension is granted, the remaining 30% of the provision should be recognized by the end of the extension period.
Banco de Bogotá S.A. has established its own model of reference to determine the allowance for foreclosed assets, which was approved by the Superintendency of Finance.
|
(m)
|
Property, plant and equipment
|
This account includes tangible assets acquired or leased, constructed or in the process of importation or construction and permanently used in the course of business which have a useful life exceeding one year. Property, plant and equipment is recorded at the cost of acquisition, including direct and indirect costs and expenses incurred up to the time that the asset is in a usable condition (adjusted for inflation up to 2001).
Additions, improvements and extraordinary repairs that have a significant increase in the useful life of these assets are capitalized, while maintenance and repairs are expensed as incurred.
Depreciation is calculated on a straight-line basis over the estimated useful life of the asset. The annual depreciation rates for each asset item are:
|
Buildings
|
5.0 %
|
|
|
Equipment, furniture and fixtures
|
10.0 %
|
|
|
Computer equipment
|
20.0 %
|
|
|
Vehicles
|
20.0 %
|
The individual net book value of buildings (cost less accumulated depreciation) is compared against fair values taken from independent professional appraisals. If the fair value is higher, the difference is recorded as a “Reappraisal of assets” with credit on the “Reappraisal of assets” in shareholders´ equity; if the fair value is lower, the difference first affects the revaluation account and if the value of such an account is not sufficient to absorb such a difference, then the amount that was not recorded as a lesser value of the revaluation is charged to expenses as a provision for other assets of the period. Appraisals must be made at least every three years.
|
(n)
|
Operating leases
|
In the normal course of business, Banco de Bogotá, Banco de Occidente and Banco Popular lease different assets under operating leasing arrangements through their leasing subsidiaries. These assets are recorded at cost.
Depreciation for these assets is applied over either the asset’s useful life or the term of the leasing agreement, whichever period is the shorter.
GRUPO AVAL ACCIONES Y VALORES S.A. AND ITS SUBSIDIARIES
NOTES TO THE CONSOLIDATED FINANCIAL STATEMENTS
FOR THE YEARS ENDED DECEMBER 31, 2011, 2010 AND 2009
(
Stated in millions of Colombian pesos and U.S. dollars)
General provision of 1% of the book value of these assets is recorded.
|
(o)
|
Prepaid expenses and deferred charges
|
Amortization of prepaid expenses and deferred charges is calculated from the date on which they start contributing to the generation of income, based on the following factors:
Prepaid expenses
Prepaid expenses mainly include the following monetary items: leases, amortized over the period prepaid; insurance premiums, amortized over the life of the policy; equipment maintenance, amortized over the life of the contract; and other prepaid expenses amortized over the period in which services are received or costs and expenses are incurred.
Deferred Charges
|
a.
|
Expenses incurred in the reorganization and pre-operational expenses which are amortized over a period not longer than five years.
|
|
b.
|
Remodeling, research and development of studies are amortized over a period not longer than two years.
|
|
c.
|
Computer programs are amortized over periods not longer than three years.
|
|
d.
|
Fixtures are amortized based on its actual consumption.
|
|
e.
|
Leasehold improvements are amortized during the lesser of the initial duration of the underlying contract and its probable useful life.
|
|
f.
|
Discounts on an issuance of debt in foreign currency are amortized over a period of five years which corresponds to the life of the related debt by which the costs were incurred.
|
|
g.
|
Commissions paid for the issuance of debt are amortized over a period of five years which corresponds to the life of the related debt by which the costs were incurred.
|
|
h.
|
Deferred income tax assets resulting from temporary differences are amortized upon compliance with legal and regulatory fiscal requirements.
|
|
i.
|
Improvements on road constructions and inflation adjustments are amortized over each joint venture project.
|
|
j.
|
Equity tax is amortized in 48 monthly quotas between years 2011 to 2014.
|
|
k.
|
Losses for valuation of securities are amortized up to its maturity
|
|
l.
|
Other concepts are amortized over the period for recovery of the cash outlay or during the period in which benefits are received.
|
|
m.
|
Commissions paid for derivatives are amortized during the time of the redemption of the titles.
|
GRUPO AVAL ACCIONES Y VALORES S.A. AND ITS SUBSIDIARIES
NOTES TO THE CONSOLIDATED FINANCIAL STATEMENTS
FOR THE YEARS ENDED DECEMBER 31, 2011, 2010 AND 2009
(
Stated in millions of Colombian pesos and U.S. dollars)
Deferred charges corresponding to studies and projects, institutional advertising and publicity are not recorded. Disbursements made in connection with these items are recorded directly on the consolidated statements of income as “Administrative and other expenses”.
|
(p)
|
Intangible assets
|
Goodwill
The Superintendency of Finance stipulates how to value, where to register and how to amortize goodwill. According to the Superintendency of Finance rules, goodwill is defined as the difference between the amount of capital paid in an acquisition of a business and the book value of equity of the acquired entity. Goodwill is created only after the acquiring company achieves control of the acquired entity.
Allocation of goodwill in business lines is allowed according the rules of the Superintendency of Finance and amortization is to be done in a monthly basis over a period of 20 years, unless a financial entity decides to amortize it in a shorter period of time. The methodology proposed by the Superintendency of Finance to amortize goodwill uses an exponential method based on the following formula:
y = e
x/15
The following chart shows the results of the application of such formula where
x
equals each year of goodwill amortization (20 years in this chart);
e
equals 2.71828; and
Y%
= [y
x /
å
y
(1-20)
] and shows the percentage of the goodwill to be amortized per year.
|
x
|
Y
|
Y%
|
x
|
y
|
Y%
|
|||||
|
1
|
1.07
|
2.47%
|
11
|
2.08
|
4.81%
|
|||||
|
2
|
1.14
|
2.64%
|
12
|
2.23
|
5.14%
|
|||||
|
3
|
1.22
|
2.82%
|
13
|
2.38
|
5.49%
|
|||||
|
4
|
1.31
|
3.01%
|
14
|
2.54
|
5.87%
|
|||||
|
5
|
1.40
|
3.22%
|
15
|
2.72
|
6.28%
|
|||||
|
6
|
1.49
|
3.44%
|
16
|
2.91
|
6.71%
|
|||||
|
7
|
1.59
|
3.68%
|
17
|
3.11
|
7.17%
|
|||||
|
8
|
1.70
|
3.94%
|
18
|
3.32
|
7.66%
|
|||||
|
9
|
1.82
|
4.21%
|
19
|
3.55
|
8.19%
|
|||||
|
10
|
1.95
|
4.50%
|
20
|
3.79
|
8.76%
|
|
(q)
|
Other assets
|
Other assets primarily include assets held for sale, investments in trusts, assets available for lease contracts, and prepaid taxes.
Assets held for sale correspond to assets which are no longer used in the core business of Grupo Aval’s banking subsidiaries and which are depreciated until their realization. Moreover, those assets are tested for impairment and any deterioration is charged to the consolidated statement of income. Investments in trusts include rights acquired in trust operations. The assets held under trust agreements are accounted for based on their adjusted costs and neither income nor expense is generated by such transaction. Impact of the consolidated statements of income is registered when the assets are actually sold or transferred to a third party. Assets available for lease contracts correspond to the inventory of assets which are expected to be placed under lease contracts in short term.
|
(r)
|
Rights under trust agreements
|
This account records the rights generated through the execution of all mercantile fiduciary agreements which give either the trustee or the beneficiary the right to exert in accordance with either the contract or legal dispositions.
GRUPO AVAL ACCIONES Y VALORES S.A. AND ITS SUBSIDIARIES
NOTES TO THE CONSOLIDATED FINANCIAL STATEMENTS
FOR THE YEARS ENDED DECEMBER 31, 2011, 2010 AND 2009
(
Stated in millions of Colombian pesos and U.S. dollars)
|
(s)
|
Reappraisals
|
This account includes reappraisal of investments available for sale with low liquidity levels and properties and equipment - specifically, real estate, vehicles and works of art.
Reappraisal of available for sale equity securities is recorded based on the shareholder’s stake in the issuers’ equity.
Reappraisal of real estate properties is measured as the difference between the net cost of the assets and the value of their commercial appraisal conducted by firms with recognized experience and reputation in these matters. In the event of devaluation in the value of the property, under a rule of prudence, an allowance is recorded. According to Decree 2649 of 1993, reappraisals of assets should be done at least once every three years.
Reappraisal of works of art is recorded taking into account the condition of preservation of the works, their authenticity, size, technique and the price of similar works.
In the consolidation process, the portion of equity surplus from reappraisal of assets acquired in business combination is eliminated while the portion related with the assets remained in the balance sheet until the asset is sold. An other portion of the reappraisal of assets from subsidiaries not wholly owned for Colombian Banking GAAP related with non controlling interest is reclassified as part of the liability.
|
(t)
|
Deferred income
|
This account records deferred income and income received in advance in the regular course of business. Amounts recorded in this account are amortized over the period to which they relate, or in which the services are rendered or the money is collected in the case of profits obtained from the sale of goods sold on credit.
The capitalization of yields on restructured loans that have been recorded in memorandum accounts or as charge-off loan balances are included in this category as indicated in note 2 (i) above.
|
(u)
|
Deferred tax
|
In Colombia, the inclusion of timing differences related to the amortization of carry over losses and the excess of presumed income over ordinary income as a deferred tax asset is restricted.
|
(v)
|
Equity tax
|
In December 30, 2009, the Congress of Colombia enacted Law No. 1370, which added a net worth tax on the wealth of corporate entities (hereinafter referred to as the “Equity Tax”). The Equity Tax accrued on January 1, 2011 amounted to Ps. 783,354 payable in eight equal installments through 2014. The tax rate to be paid by Grupo Aval and its subsidiaries is 6.0% of their net fiscal worth. As of December 31, 2011, Grupo Aval’s remaining consolidated liability was Ps. 587,516.
In accordance with Colombian Banking GAAP this liability was recorded against deferred charges and amortized on straight monthly basis between 2011 to 2014 with a charge to the statement of income except for some subsidiaries charge to shareholders’ equity within the account “equity inflation adjustment”, according to Decree 514 of 2010.
|
(w)
|
Pension plan and benefits to employees
|
Before Decree 2984 of August 12, 2009 became effective, Grupo Aval’s banking subsidiaries adhered to the requirements of Decree 1517 of August 4, 1998 which stated that, through annual installments, the provision of the actuarial cost had to be 100.0% of coverage by December 31, 2010. Once Decree 2984 became effective, the annual provision is now increased on a straight-line basis in such a manner that 100.0% of the actuarial cost will be accomplished as of December 31, 2023.
GRUPO AVAL ACCIONES Y VALORES S.A. AND ITS SUBSIDIARIES
NOTES TO THE CONSOLIDATED FINANCIAL STATEMENTS
FOR THE YEARS ENDED DECEMBER 31, 2011, 2010 AND 2009
(
Stated in millions of Colombian pesos and U.S. dollars)
By means of Resolution 1555 of July 30, 2010, the Superintendency of Finance replaced the mortality charts used to prepare the actuarial computation and determined that the change effect may be recognized gradually.
Later, Decree 4565 of December 7, 2010, modified the accounting standards on the amortization of the actuarial computation effective until that date. In conformity with the new Decree, companies which actuarial computation had been 100% amortized as of December 31, 2009, may gradually amortize the increase on the 2010 estimated actuarial computation, using the new Mortality Charts until the year 2029.
Considering the above, Grupo Aval modified its accounting policy on actuarial computation amortization regarding pension payments, quotas, parts and pension and health bonuses (commuted liabilities), and, as from 2010, it adopted a 19-year term to amortize the 2010 actuarial computation increase. As of 2009, the actuarial computation year’s increase was recorded as an expense for the period, because the actuarial computation was 100% amortized which was based on the previous charts.
Payments of retirement pensions are made against the pertinent reserve.
Grupo Aval’s banking subsidiaries recorded other benefits to employees based on labor agreements with its employees which cover, health, education and seniority bonus.
|
(x)
|
Estimated liabilities and provisions
|
Grupo Aval’s banking subsidiaries have created reserves to cover justifiable, quantifiable and verifiable liabilities. This account also records estimates for taxes and labor contribution expenses. Estimated labor liabilities are recorded based on applicable legislation and current labor agreements.
|
(y)
|
Equity inflation adjustments
|
Since January 1992 until December 2000, Grupo Aval and its consolidated banking subsidiaries’ financial statements were subject to inflation adjustments. The cumulative effect of such adjustments in non-monetary assets and liabilities is included in each of the adjusted accounts, and the adjustments to the equity accounts are included in the “equity inflation adjustments” line item.
During 2011, 2010 and 2009, the amount of such account decreased due to a payment of the “equity tax” mandated by law. According to Law 1111 of 2006, all entities subject to payment of the “equity tax” are allowed to charge those taxes against the “equity inflation adjustments” and not charge them in the consolidated statements of income.
|
(z)
|
Recognition of financial income, costs and expenses
|
Financial income and expenses are recognized on an accrual basis.
Loan origination costs are recorded in the consolidated statements of income when incurred and the corresponding revenues are collected. Grupo Aval’s banking subsidiaries do not implement a policy of collecting commissions on the origination of the loans. Commissions that they collect from credit cards are recorded in the consolidated statements of income using the accrual method.
All profits obtained from credit sales of foreclosed assets are recorded as revenues when the value of the credit is collected.
Suspension of accruals of interest is detailed in note 2 (
i
)- “
Loans and Financial Leases”.
GRUPO AVAL ACCIONES Y VALORES S.A. AND ITS SUBSIDIARIES
NOTES TO THE CONSOLIDATED FINANCIAL STATEMENTS
FOR THE YEARS ENDED DECEMBER 31, 2011, 2010 AND 2009
(
Stated in millions of Colombian pesos and U.S. dollars)
|
(aa)
|
Memorandum accounts
|
Memorandum accounts record transactions in which Grupo Aval’s banking subsidiaries acquire contingent rights or assume contingent obligations, which are in each case conditioned by possible or remote future events. These accounts also include financial income accrued since the time at which the balance sheet ceases to accrue on the income accounts with regard to the loan portfolio and financial leasing operations.
Contingencies including fines, sanctions, litigation and lawsuits are evaluated by each of the banking subsidiaries’ legal departments. Estimating loss contingencies necessarily implies exercising judgment and is, therefore, subject to opinion. In estimating loss contingencies regarding pending legal proceedings against each banking subsidiary, each legal department evaluates, among other aspects, the merits of each case, the case law of the courts in question and the current status of the individual proceedings.
If this evaluation reveals the probability that a material loss has occurred and the amount of the liability can be estimated, then this is recorded in the consolidated financial statements. If the evaluation reveals that a potential loss is not probable or the outcome either is uncertain or probable but the amount of the loss cannot be estimated, then the nature of the corresponding contingency is disclosed in a note to the consolidated financial statements along with the probable estimated range of the loss. Loss contingencies that are estimated as being remote are not disclosed.
Memorandum accounts record third-party operations whose nature does not affect the financial situation of Grupo Aval’s banking subsidiaries. This also includes tax memorandum accounts that record figures for drawing up tax returns and internal control or management information accounts.
|
(ab)
|
Earnings Per Share
|
Earnings per share as of December 2011, 2010 and 2009 are calculated based on the weighted average number of shares outstanding, which for the year ended December 2011, 2010 and 2009 was 16,306,613,443, 13,943,980,671 and 13,935,966,116, respectively, with a nominal price of Ps 1.00 each. As of December 2011, 2010 and 2009, the number of shares outstanding was 18,551,766,456, 13,943,982,323 for 2010 and 2009. The number of fully paid shares was 18,551,299,996, 13,943,980,671 and 13,943,980,671 as of December, 2011, 2010 and 2009, respectively. In the consolidated financial statements earnings per share are shown as “Earnings per share”.
|
(ac)
|
Business Combination
|
Upon a business combination, the purchase method of accounting requires that (i) the purchase price be allocated to the acquired assets and liabilities on the basis of their book value under Colombian Banking GAAP, (ii) the statement of income of the acquiring company for the period in which a business combination occurs include the income of the acquired company as if the acquisition had occurred on the first day of the reporting period, except for the acquisition of BAC Credomatic where Grupo Aval obtained a waiver from the Superintendency of Finance to consolidate only the results generated after the acquisition date and (iii) the costs directly related to the purchase business combination are expensed as incurred.
|
(ad)
|
Shares obtained through the escisión process related to Banco Popular.
|
The shares obtained through the
escisión
process related to Banco Popular are recorded at the book value, just as they were recorded at the Sociedades Escindentes’s financial statements. The difference between the historical cost and the book value of the shares carried by the Sociedades Escindentes was recorded in the “equity surplus/ reappraisal of assets” account for a net value of Ps. 201,750.
GRUPO AVAL ACCIONES Y VALORES S.A. AND ITS SUBSIDIARIES
NOTES TO THE CONSOLIDATED FINANCIAL STATEMENTS
FOR THE YEARS ENDED DECEMBER 31, 2011, 2010 AND 2009
(
Stated in millions of Colombian pesos and U.S. dollars)
The following reappraisal ensued from the
escisión
process:
|
June 23, 2011
|
September 20, 2011
|
Total
|
||||||||||
|
Banco Popular equity at the end of the previous month
|
Ps. | 1,758,109 | Ps. | 1,789,264 | - | |||||||
|
Shares outstanding
|
7,725,326,503 | 7,725,326,503 | 7,725,326,503 | |||||||||
|
Book value per share (in pesos)
|
Ps. | 228 | Ps. | 232 | - | |||||||
|
Acquired shares in
escisión
processes
|
3,358,446,312 | 1,514,163,995 | 4,872,610,307 | |||||||||
|
Book value of acquired shares
|
Ps. | 764,306 | Ps. | 350,696 | Ps. | 1,115,002 | ||||||
|
Value recorded as cost
|
(231,878 | ) | (681,374 | ) | (913,252 | ) | ||||||
|
Reappraisal assets in
escisión
process
|
Ps. | 532,428 | Ps. | (330,678 | ) | Ps. | 201,750 | |||||
|
(3)
|
CASH AND DUE FROM BANKS
|
The balances of cash and due from banks consisted of the following:
| 2011 | 2010 | |||||||
|
Colombian peso-denominated
:
|
||||||||
|
Cash
|
Ps. | 2,001,632 | Ps. | 1,816,038 | ||||
|
Due from the Colombian Central Bank
|
3,129,391 | 2,199,585 | ||||||
|
Due from domestic banks
|
234,284 | 400,149 | ||||||
|
Remittances of domestic negotiated checks in transit
|
2,127 | 3,024 | ||||||
|
Allowance for cash and due from banks
|
(2,248 | ) | (2,241 | ) | ||||
|
Total peso-denominated
|
5,365,186 | 4,416,555 | ||||||
|
Foreign currency-denominated:
|
||||||||
|
Cash
|
481,417 | 482,982 | ||||||
|
Due from the Colombian Central Bank
|
375 | 431 | ||||||
|
Due from foreign banks
|
2,735,380 | 2,279,361 | ||||||
|
Remittances of foreign negotiated checks in transit
|
193,152 | 154,925 | ||||||
|
Foreign correspondents
|
6,450 | - | ||||||
|
Total foreign currency-denominated
|
3,416,774 | 2,917,699 | ||||||
|
Total cash and due from banks
|
Ps. | 8,781,960 | Ps. | 7,334,254 | ||||
The central banks in Colombia and other foreign countries where subsidiaries of Grupo Aval operate, require financial institutions to set aside specific amounts of cash as reserves against deposits. These reserves may be held as vault cash in a noninterest-bearing account with the central banks. Though one objective of reserve requirements is to safeguard liquidity in the banking system, institutions do not look to their reserves as a primary source of liquidity.
Grupo Aval’s banking subsidiaries had reserves in cash and deposits with the central banks amounting Ps. 5,288,450 and Ps. 4,468,661 at December 31, 2011 and 2010, respectively.
In Colombia, according to Resolution 11 of 2008, reserve requirements are measured bi-weekly and the amounts depend on the type of deposit (11.0% for checking and saving accounts and 4.5% for time deposits with a maturity of less than 540 days).
GRUPO AVAL ACCIONES Y VALORES S.A. AND ITS SUBSIDIARIES
NOTES TO THE CONSOLIDATED FINANCIAL STATEMENTS
FOR THE YEARS ENDED DECEMBER 31, 2011, 2010 AND 2009
(
Stated in millions of Colombian pesos and U.S. dollars)
For the entities in Central America in 2011 the reserve requirements were as follows:
|
Costa Rica
|
Panamá
|
Nicaragua
|
El Salvador
|
Honduras
|
Guatemala
|
||||||
|
Current account
|
15%
|
30% (1)
|
16.25%
|
25%
|
Non bearing local currency 6%. Bearing local currency and foreign currency 12%.
|
14.6%
|
|||||
|
Time deposits and saving deposits
|
15%
|
30% (1)
|
16.25%
|
20%
|
Non bearing local currency 6%. Bearing local currency and foreign currency 12%.
|
14.6%
|
|||||
|
Loans abroad, except multilateral loans
|
15%
|
30% (1)
|
N/A
|
5%
|
Non bearing local currency 6%. Bearing local currency and foreign currency 12%.
|
14.6%
|
|||||
|
Measurement frequency
|
Bi-monthly
|
Weekly
|
Weekly
|
Bi-weekly
|
Bi-weekly
|
Monthly
|
|
(1)
|
It is a liquidity indicator and not a reserve requirement.
|
|
(4)
|
INVESTMENT SECURITIES
|
Investment in trading securities consisted of the following
:
|
2011
|
2010
|
|||||||
|
Trading-debt securities
|
||||||||
|
Colombian peso-denominated:
|
||||||||
|
Colombian Government
|
Ps. | 2,181,405 | Ps. | 2,683,334 | ||||
|
Government entities
|
151,874 | 78,611 | ||||||
|
Financial institutions
|
586,848 | 257,230 | ||||||
|
Corporate bonds
|
114,414 | 96,057 | ||||||
|
Total Colombian-peso denominated
|
3,034,541 | 3,115,232 | ||||||
|
Foreign currency-denominated:
|
||||||||
|
Colombian Government
|
28,113 | 194,454 | ||||||
|
Foreign governments
|
111,526 | 132,689 | ||||||
|
Government entities
|
85,366 | 31,751 | ||||||
|
Financial institutions
|
234,730 | 68,086 | ||||||
|
Corporate bonds
|
60,485 | 175,249 | ||||||
|
Total foreign currency-denominated
|
520,220 | 602,229 | ||||||
|
Total trading-debt securities
|
Ps. | 3,554,761 | Ps. | 3,717,461 | ||||
The foreign currency-denominated debt securities issued or secured by the Colombian Government are bonds denominated in U.S. dollars, purchased at nominal value, with annual average interest rates of 1.30% and 2.45% for 2011 and 2010, respectively.
GRUPO AVAL ACCIONES Y VALORES S.A. AND ITS SUBSIDIARIES
NOTES TO THE CONSOLIDATED FINANCIAL STATEMENTS
FOR THE YEARS ENDED DECEMBER 31, 2011, 2010 AND 2009
(
Stated in millions of Colombian pesos and U.S. dollars)
|
2011
|
2010
|
|||||||
|
Trading-equity securities
|
||||||||
|
Colombian peso-denominated:
|
||||||||
|
Private investment funds (1)
|
Ps. | 693,446 | Ps. | - | ||||
|
Mandatory investment funds (2)
|
308,489 | 300,138 | ||||||
|
Sociedad de Inversiones de Energía S.A. (3)
|
- | 207,724 | ||||||
|
Bolsa de Valores de Colombia S.A.
|
3,368 | 1,661 | ||||||
|
Common investment funds
|
40,750 | 136,845 | ||||||
|
Other
|
5,630 | 17,018 | ||||||
|
Total Colombian peso-denominated
|
1,051,683 | 663,386 | ||||||
|
Foreign currency-denominated:
|
||||||||
|
Banco de Comercio-Peru
|
563 | - | ||||||
|
Investment Funds
|
36 | 37 | ||||||
|
Total foreign currency-denominated:
|
599 | 37 | ||||||
|
Total trading-equity securities
|
Ps. | 1,052,282 | Ps. | 663,423 | ||||
|
(1)
|
On February 10, 2011, Corficolombiana invested in a Private Fund (Fondo de Capital Privado Corredores Capital I) Ps. 424,585 to participate in the acquisition of shares or any other securities related to companies in USA, South America, Central America and the Caribbean.
|
|
(2)
|
Mandatory investment funds relate to investments required by law to pension funds administrators to operate in the pension fund market and the stock exchange market. Grupo Aval operates such markets through its subsidiary Porvenir S.A.
|
|
(3)
|
On October 31, 2011, Banco de Bogotá sold its investment in Sociedad de Inversiones en Energía for Ps. 183,967, and recognized a gain in the consolidated statement of income of Ps. 17,093.
|
Available for sale debt securities as of December 31, 2011 and 2010 consisted of the following:
|
2011
|
2010
|
|||||||
|
Available for sale debt securities
|
||||||||
|
Colombian peso-denominated:
|
||||||||
|
Colombian Government
|
Ps. | 6,834,260 | Ps. | 7,355,221 | ||||
|
Financial institutions
|
54,813 | 99,745 | ||||||
|
Government entities
|
61,097 | 43,506 | ||||||
|
Other (*)
|
383,873 | 641,975 | ||||||
|
Total Colombian peso-denominated
|
7,334,043 | 8,140,447 | ||||||
|
Foreign currency-denominated:
|
||||||||
|
Colombian Government
|
623,027 | 499,647 | ||||||
|
Government entities
|
237,984 | 277,111 | ||||||
|
Foreign governments
|
653,699 | 733,545 | ||||||
|
Financial institutions
|
711,888 | 619,636 | ||||||
|
Other
|
132,506 | 127,685 | ||||||
|
Total foreign currency-denominated
|
2,359,104 | 2,257,624 | ||||||
|
Total available for sale debt securities
|
Ps. | 9,693,147 | Ps. | 10,398,071 | ||||
|
(*)
|
Primarily includes investments in securitization titles.
|
GRUPO AVAL ACCIONES Y VALORES S.A. AND ITS SUBSIDIARIES
NOTES TO THE CONSOLIDATED FINANCIAL STATEMENTS
FOR THE YEARS ENDED DECEMBER 31, 2011, 2010 AND 2009
(
Stated in millions of Colombian pesos and U.S. dollars)
Available for sale equity securities as of December 31, 2011 and 2010 consisted of the following:
|
Ownership % as of
December 31, 2011
|
2011
|
Ownership % as of
December 31, 2010
|
2010
|
|||||||||||||
|
Available for sale-equity securities
|
||||||||||||||||
|
Promigás S.A.
|
14.4 | % | Ps. | 533,165 | 14.4 | % | Ps. | 655,298 | ||||||||
|
Empresa De Energía de Bogotá “EEB” (1)
|
3.6 | % | 384,402 | 3.8 | % | 570,878 | ||||||||||
|
Proenergia Internacional S.A. (2)
|
10.0 | % | 117,482 | 10.0 | % | 54,250 | ||||||||||
|
Promigas Holding
|
20.3 | % | 112,524 | - | - | |||||||||||
|
Promigas Investment
|
20.3 | % | 100,351 | - | - | |||||||||||
|
Promigas LTD (3)
|
20.3 | % | 100,351 | - | - | |||||||||||
|
Mineros S.A.
|
7.0 | % | 87,905 | 7.0 | % | 143,645 | ||||||||||
|
Gas Natural S.A.
|
1.7 | % | 53,481 | 1.7 | % | 53,481 | ||||||||||
|
Concesionaria Ruta del Sol S.A. (4)
|
33.0 | % | 41,534 | 33.0 | % | 15,487 | ||||||||||
|
Bolsa de Valores de Colombia S.A. “BVC”
|
3.4 | % | 17,215 | 6.4 | % | 27,769 | ||||||||||
|
Jardín Plaza S.A.
|
17.8 | % | 10,031 | 17.8 | % | 10,031 | ||||||||||
|
Concesionaria Tibitoc S.A.
|
33.3 | % | 9,823 | 33.3 | % | 9,823 | ||||||||||
|
Titularizadora Colombiana S.A.
|
10.0 | % | 6,867 | 10.0 | % | 8,251 | ||||||||||
|
Redeban Redmulticolor S.A.
|
20.2 | % | 4,552 | 20.2 | % | 4,552 | ||||||||||
|
Sociedad Transportadora de Gas de Occidente S.A.
|
2.8 | % | 4,236 | 2.8 | % | 11,466 | ||||||||||
|
Aerocali S.A.
|
33.3 | % | 2,474 | 33.3 | % | 2,474 | ||||||||||
|
Textiles del Espinal S.A.
|
8.6 | % | 2,399 | 8.6 | % | 2,399 | ||||||||||
|
ACH Colombia S.A.
|
33.8 | % | 2,380 | 33.9 | % | 2,380 | ||||||||||
|
Deposito Centralizado de Valores de Colombia “DECEVAL”
|
8.0 | % | 2,843 | 8.0 | % | 2,843 | ||||||||||
|
Promisión Celular S.A. “PROMICEL”
|
0.0 | % | - | 16.6 | % | 4,804 | ||||||||||
|
Sociedad Transportadora del Oriente S.A.
|
0.0 | % | - | 5.5 | % | 2,826 | ||||||||||
|
Trust Fiducolombia - Fiducolombia patrimonio
|
0.0 | % | - | 1.0 | % | 405 | ||||||||||
|
Visa Inc
|
0.0 | % | - | 0.0 | % | 21,744 | ||||||||||
|
Others
|
17,876 | 17,780 | ||||||||||||||
|
Total available for sale equity securities
|
Ps. | 1,611,891 | Ps. | 1,622,586 | ||||||||||||
Dividends received from equity investments amounted to Ps. 78,883, Ps. 43,516 and Ps. 68,920 for the years ended December 31, 2011, 2010 and 2009, respectively.
|
(1)
|
In December, 2010 Corficolombiana’s investment in “EEB” was reclassified from trading portfolio to available for sale portfolio due to a decrease in its liquidity level. While recorded as trading, Corficolombiana had realized an income of Ps. 208,971.
|
|
(2)
|
On January and March 2011, Corficolombiana reclassified the investment in Proenergía Internacional from available for sale to trading, due to a change in its liquidity level from low to medium; these reclassifications generated an income of Ps.64,689. On February and May 2011, the investment was reclassified again from trading to available for sale, due to a change in its liquidity level from medium to low.
|
GRUPO AVAL ACCIONES Y VALORES S.A. AND ITS SUBSIDIARIES
NOTES TO THE CONSOLIDATED FINANCIAL STATEMENTS
FOR THE YEARS ENDED DECEMBER 31, 2011, 2010 AND 2009
(
Stated in millions of Colombian pesos and U.S. dollars)
|
(3)
|
On February 10, 2011, Corficolombiana, Empresa de Energia de Bogotá and two Colombian private investment funds, purchased from AEI three Special Purpose Vehicles located in the Cayman Islands (AEI Promigas Holdings Ltd., AEI Promigas Ltd. and AEI Promigas Investments Ltd.) which together hold a 52.13% stake in Promigas SA ESP. Corficolombiana acquired 20.3% percent of the Special Purpose Vehicles. Corficolombiana and Porvenir, together with Corredores Asociados, an independent brokerage firm in Colombia, are also the investors in one of the private investment funds that participated in the transaction. Such private investment fund, which is independently directed by Corredores Asociados, acquired 47.9% of the Special Purpose Vehicles. The total purchase price of this transaction was US$ 792.8 million. Corficolombiana and Porvenir invested US$ 388.7 million and US$ 151.6 million in this transaction, respectively. Upon completion of the transaction, Corficolombiana had a 24.9% direct and indirect economic interest in Promigas. In addition, Corficolombiana and Porvenir together had a further 24.9% economic exposure to Promigas as a result of their respective holdings in the private investment fund.
|
|
(4)
|
In 2009, “Consesionaria Ruta del Sol S.A.”, signed an agreement with the INCO, for the construction, operation and maintenance of a 528 km in length public toll road. Under the agreement “Consesionaria Ruta del Sol S.A.” would bear all costs of construction for the right to impose and collect a toll on road users for a period of fifteen years ending in 2025.
|
All equity investments were classified as category A as of December 31, 2011 and 2010, except for the investments shown in the table below:
|
Category
|
2011 Allowance
|
Category
|
2010 Allowance
|
||||
|
Petróleos Colombianos Limited
|
E
|
96
|
E
|
95
|
|||
|
Petróleos Nacionales S. A.
|
E
|
257
|
E
|
257
|
|||
|
Promisión Celular S.A. “PROMICEL”
|
-
|
-
|
E
|
4,804
|
|||
|
Promotora de Inversiones Ruitoque S. A.
|
B
|
198
|
B
|
198
|
|||
|
Promotora La Alborada S.A.
|
E
|
316
|
E
|
316
|
|||
|
Promotora la Enseñanza S.A.
|
E
|
70
|
E
|
70
|
|||
|
Textiles del Espinal S.A.
|
E
|
2,399
|
E
|
2,399
|
|||
|
Cautionary Provision (*)
|
-
|
-
|
-
|
245,138
|
|||
|
Other
|
E
|
1,396
|
E
|
2,661
|
|||
|
Total allowance for available for sale equity securities
|
Ps.
4,732
|
Ps.
255,938
|
|||||
|
(*)
|
In 2010, Corficolombiana made, after discussing the topic with the Superintendency of Finance, a cautionary market risk provision for Ps. 245,138 million with the objective of covering risk associated with potential future fluctuations on the share price of its equity investments.
|
During 2011, the provision established in 2010 for Ps. 245,138 million was fully reversed driven by a decrease in the level of exposure that Corficolombiana´s results of operations had with regards to the volatility of share prices of its investments.
GRUPO AVAL ACCIONES Y VALORES S.A. AND ITS SUBSIDIARIES
NOTES TO THE CONSOLIDATED FINANCIAL STATEMENTS
FOR THE YEARS ENDED DECEMBER 31, 2011, 2010 AND 2009
(
Stated in millions of Colombian pesos and U.S. dollars)
Investment in held to maturity debt securities as of December 31, 2011 and 2010 consisted of the following:
|
2011
|
2010
|
|||||||
|
Held to maturity debt securities
|
||||||||
|
Colombian peso- denominated:
|
||||||||
|
Colombian government
|
Ps. | 763,160 | Ps. | 791,232 | ||||
|
Colombian government entities
|
2,250,100 | 2,100,752 | ||||||
|
Financial institutions
|
2,374 | 9,078 | ||||||
|
Corporate bonds
|
10,457 | 43,611 | ||||||
|
Total peso-denominated
|
3,026,091 | 2,944,673 | ||||||
|
Foreign currency-denominated:
|
||||||||
|
Colombian government entities
|
13,057 | 103,209 | ||||||
|
Governmental entities
|
2,069 | - | ||||||
|
Foreign government
|
11,854 | 31,677 | ||||||
|
Financial institutions
|
14,486 | 7,875 | ||||||
|
Other
|
4,326 | 21,109 | ||||||
|
Total foreign currency-denominated
|
45,792 | 163,870 | ||||||
|
Total held to maturity debt securities
|
Ps. | 3,071,883 | Ps. | 3,108,543 | ||||
Grupo Aval redeemed investment securities held to maturity and sold securities available for sale for Ps. 2,176,762 and Ps.2,442,964 during the years ended December 31, 2011 and 2010 respectively.
The maturity and yield of debt securities held to maturity, as of December 31, 2011, were as follow:
|
Balance
|
Yield (1)
|
|||||||
|
Maturity
|
||||||||
|
One year or less
|
Ps. | 2,319,844 | 3.92 | % | ||||
|
One year through five years
|
741,297 | 4.22 | % | |||||
|
Five years through ten years
|
10,742 | 6.93 | % | |||||
|
Total
|
Ps. | 3,071,883 | 4.00 | % | ||||
(1)
Calculated using internal return rate (IRR) as of December 31, 2011.
Allowance for investment securities as of December 31, 2011 and 2010, are as follows:
|
2011
|
2010
|
|||||||
|
Debt securities:
|
||||||||
|
Trading
|
Ps. | 1,720 | Ps. | 1,296 | ||||
|
Available for sale
|
2,283 | 2,094 | ||||||
|
Held to maturity
|
- | 869 | ||||||
|
Total debt securities
|
4,003 | 4,259 | ||||||
|
Equity securities:
|
||||||||
|
Trading
|
- | 74,950 | ||||||
|
Available for sale (*)
|
4,732 | 255,938 | ||||||
|
Total equity securities
|
4,732 | 330,888 | ||||||
|
Total allowance for investment securities
|
Ps. | 8,735 | Ps. | 335,147 | ||||
|
(*)
|
During the year ended December 31, 2010, Grupo Aval recorded a cautionary reserve for trading equity securities and available for sale securities. These provisions were reversed in 2011.
|
GRUPO AVAL ACCIONES Y VALORES S.A. AND ITS SUBSIDIARIES
NOTES TO THE CONSOLIDATED FINANCIAL STATEMENTS
FOR THE YEARS ENDED DECEMBER 31, 2011, 2010 AND 2009
(
Stated in millions of Colombian pesos and U.S. dollars)
|
(5)
|
LOANS AND FINANCIAL LEASES
|
Loan portfolio and financial lease contracts were classified in accordance with the requirements of the Superintendency of Finance and were as of December 31, 2011 and 2010 as follows:
As of December 31, 2011
|
Classification
|
Commercial
|
Consumer
|
Microcredit
|
Mortgage
|
Financial leases
|
Total
|
||||||||||||||||||
|
“A” Normal risk
|
Ps. | 37,962,254 | Ps. | 18,675,229 | Ps. | 270,609 | Ps. | 3,975,342 | Ps. | 4,767,843 | Ps. | 65,651,277 | ||||||||||||
|
“B” Acceptable risk
|
1,431,281 | 309,831 | 3,525 | 116,004 | 229,274 | 2,089,915 | ||||||||||||||||||
|
“C” Appreciable risk
|
529,818 | 266,578 | 1,895 | 70,797 | 51,345 | 920,433 | ||||||||||||||||||
|
“D” Significant risk
|
362,832 | 327,854 | 1,683 | 18,241 | 83,509 | 794,119 | ||||||||||||||||||
|
“E” Unrecoverable
|
259,359 | 156,393 | 6,455 | 37,993 | 31,796 | 491,996 | ||||||||||||||||||
|
Total loans and financial leases
|
Ps. | 40,545,544 | Ps. | 19,735,885 | Ps. | 284,167 | Ps. | 4,218,377 | Ps. | 5,163,767 | Ps. | 69,947,740 | ||||||||||||
As of December 31, 2010
|
Classification
|
Commercial
|
Consumer
|
Microcredit
|
Mortgage
|
Financial leases
|
Total
|
||||||||||||||||||
|
“A” Normal risk
|
Ps. | 31,578,219 | Ps. | 15,496,996 | Ps. | 232,660 | Ps. | 3,555,196 | Ps. | 3,263,095 | Ps. | 54,126,166 | ||||||||||||
|
“B” Acceptable risk
|
1,333,690 | 440,233 | 3,825 | 143,180 | 305,287 | 2,226,215 | ||||||||||||||||||
|
“C” Appreciable risk
|
503,021 | 209,856 | 2,067 | 98,704 | 51,290 | 864,938 | ||||||||||||||||||
|
“D” Significant risk
|
486,776 | 372,265 | 2,065 | 42,414 | 102,300 | 1,005,820 | ||||||||||||||||||
|
“E” Unrecoverable
|
256,395 | 105,866 | 9,489 | 4,828 | 23,909 | 400,487 | ||||||||||||||||||
|
Total loans and financial leases
|
Ps. | 34,158,101 | Ps. | 16,625,216 | Ps. | 250,106 | Ps. | 3,844,322 | Ps. | 3,745,881 | Ps. | 58,623,626 | ||||||||||||
As of December 31, 2011 and 2010, the total amount of BAC Credomatic loans used as guarantees for financial obligations was Ps. 793,753 and Ps. 455,047 respectively.
The following table represents a summary of troubled loans that have been restructured:
|
2011
|
2010
|
|||||||
|
Ordinary restructurings
|
Ps. | 1,129,243 | Ps. | 1,119,984 | ||||
|
Extraordinary restructurings
|
11,399 | 352 | ||||||
|
Under Law 550
|
196,891 | 197,825 | ||||||
|
Under Law 617
|
281,879 | 357,062 | ||||||
|
Creditor agreement proceedings
|
40,206 | 983 | ||||||
|
Interest and other receivables items
|
34,534 | 32,715 | ||||||
|
Under Law 1116
|
16,992 | 2,263 | ||||||
|
Restructured loans
|
1,711,144 | 1,711,184 | ||||||
|
Allowances for loan losses
|
(443,080 | ) | (470,374 | ) | ||||
|
Restructured loans, net
|
Ps. | 1,268,064 | Ps. | 1,240,810 | ||||
GRUPO AVAL ACCIONES Y VALORES S.A. AND ITS SUBSIDIARIES
NOTES TO THE CONSOLIDATED FINANCIAL STATEMENTS
FOR THE YEARS ENDED DECEMBER 31, 2011, 2010 AND 2009
(
Stated in millions of Colombian pesos and U.S. dollars)
Allowance for loan and financial lease losses
The following table sets forth an analysis of the activity in the allowance for loan and financial lease losses:
|
2011
|
2010
|
2009
|
||||||||||
|
Balance at beginning of year
|
Ps. | 2,183,886 | Ps. | 1,881,074 | Ps. | 1,625,752 | ||||||
|
Balance at beginning of period (Acquisition)
|
1,665 | 186,260 | - | |||||||||
|
Allowance for financial leasing reclassification
|
84 | - | - | |||||||||
|
Provision for loan losses
|
1,965,305 | 1,921,867 | 1,855,591 | |||||||||
|
Charge-offs
|
(676,696 | ) | (677,558 | ) | (558,238 | ) | ||||||
|
Effect of changes in foreign exchange rate
|
10,049 | 38,107 | (802 | ) | ||||||||
|
Reclassification – Securitization
|
(9,667 | ) | (4,344 | ) | (6,906 | ) | ||||||
|
Reversals of provisions
|
(1,168,126 | ) | (1,161,520 | ) | ( 1,034,323 | ) | ||||||
|
Balance at end of year
|
Ps. | 2,306,500 | Ps. | 2,183,886 | Ps. | 1,881,074 | ||||||
Recoveries of charge-offs loans are recorded separately in the consolidated statements of income.
|
(6)
|
ACCRUED INTEREST RECEIVABLE ON LOANS AND FINANCIAL LEASES AND ACCOUNTS RECEIVABLE, NET
|
Accrued interest receivable on loans and financial leases and accounts receivable, net as of December 31, 2011 and 2010 consisted of the following:
|
2011
|
2010
|
|||||||
|
Accrued interest receivable on loans and financial leases
|
Ps. | 644,676 | Ps. | 503,570 | ||||
|
Allowance for accrued interest losses
|
(61,156 | ) | (55,357 | ) | ||||
|
Total interest accrued on loans and financial leases, net
|
583,520 | 448,213 | ||||||
|
Accounts receivable:
|
||||||||
|
Payments on behalf of customers
|
200,637 | 174,454 | ||||||
|
Commissions and fees
|
56,913 | 53,948 | ||||||
|
Governmental institutions (*)
|
221,691 | 310,295 | ||||||
|
Advances to contractors and suppliers
|
541,190 | 204,421 | ||||||
|
Receivable from customers
|
74,301 | 73,666 | ||||||
|
Participation in a joint venture
|
- | 86,582 | ||||||
|
Advance in commitment to purchase
|
27,751 | 22,057 | ||||||
|
Dividends
|
26,298 | 17,600 | ||||||
|
Warehouse services
|
32,488 | 34,290 | ||||||
|
Insurance claims
|
5,553 | 19,022 | ||||||
|
Taxes
|
17,630 | 20,003 | ||||||
|
Sale of services and goods
|
172,096 | 49,426 | ||||||
|
Other receivables
|
346,401 | 367,826 | ||||||
|
Total accounts receivable
|
1,722,949 | 1,433,590 | ||||||
|
Allowance for accounts receivable losses
|
(110,046 | ) | (96,300 | ) | ||||
|
Total accounts receivable, net
|
1,612,903 | 1,337,290 | ||||||
|
Total accrued interest receivable on loans and financial leases and accounts receivable, net
|
Ps. | 2,196,423 | Ps. | 1,785,503 | ||||
GRUPO AVAL ACCIONES Y VALORES S.A. AND ITS SUBSIDIARIES
NOTES TO THE CONSOLIDATED FINANCIAL STATEMENTS
FOR THE YEARS ENDED DECEMBER 31, 2011, 2010 AND 2009
(
Stated in millions of Colombian pesos and U.S. dollars)
|
(*)
|
Balance owed by the Colombian Government related to investments made by Grupo Aval in road concessions that were not subsequently renewed by the grantor and that, based on previously signed agreements by both parties, will be fully reimbursed to Grupo Aval in 2012 including interest.
|
The changes in allowance for accrued interest receivable on loans and financial leases and accounts receivable were as follows:
|
2011
|
2010
|
2009
|
||||||||||
|
Balance at beginning of year
|
Ps. | 151,657 | Ps. | 176,565 | Ps. | 121,316 | ||||||
|
BAC Credomatic’s acquisition
|
- | 3,456 | - | |||||||||
|
Provision for uncollectible amounts
|
155,818 | 151,034 | 246,923 | |||||||||
|
Charge-offs
|
(61,814 | ) | (81,516 | ) | (84,379 | ) | ||||||
|
Recovery of provisions
|
(78,077 | ) | (97,231 | ) | (107,288 | ) | ||||||
|
Transfers to securitization
|
(83 | ) | (9,117 | ) | - | |||||||
|
Effect of differences in exchange rates
|
3,701 | 8,466 | (7 | ) | ||||||||
|
Balance at end of year
|
Ps. | 171,202 | Ps. | 151,657 | Ps. | 176,565 | ||||||
|
(7)
|
BANKERS’ ACCEPTANCES, SPOT TRANSACTIONS AND DERIVATIVES
|
Grupo Aval’s rights and obligations from bankers’ acceptances, spot transactions and derivatives as of December 31, 2011 and 2010 were as follows:
|
2011
|
2010
|
|||||||
|
Bankers’ acceptances
|
||||||||
|
Current
|
Ps. | 116,632 | Ps. | 57,021 | ||||
|
Total bankers’ acceptances
|
116,632 | 57,021 | ||||||
|
Derivatives at fair value
|
||||||||
|
Spot transactions, net
|
||||||||
|
Foreign exchange rights contracts-purchased
|
106,235 | 44,004 | ||||||
|
Foreign exchange rights contracts-sold
|
- | 9,583 | ||||||
|
Investment securities rights purchased (peso-denominated)
|
(62,565 | ) | 505 | |||||
|
Total rights
|
43,670 | 54,092 | ||||||
|
Foreign exchange commitments contracts sold
|
(43,629 | ) | (44,101 | ) | ||||
|
Investment securities commitments-purchased (peso-denominated)
|
- | (10,118 | ) | |||||
|
Total obligations
|
(43,629 | ) | (54,219 | ) | ||||
|
Total spot transactions, net
|
41 | (127 | ) | |||||
|
Forward contracts
|
||||||||
|
Foreign exchange rights contracts purchased
|
5,026,342 | 2,958,450 | ||||||
|
Foreign exchange rights contracts sold
|
2,096,695 | 1,615,972 | ||||||
|
Investment securities rights-purchased (peso-denominated)
|
29,570 | 403,988 | ||||||
|
Investment securities rights-sold (peso-denominated)
|
455,222 | 1,140,862 | ||||||
|
Total rights
|
7,607,829 | 6,119,272 | ||||||
|
Foreign exchange commitments contracts purchased
|
(2,077,563 | ) | (2,869,155 | ) | ||||
|
Foreign exchange commitments contracts sold
|
(4,837,296 | ) | (1,555,506 | ) | ||||
|
Investment securities commitments purchased (peso-denominated)
|
(29,357 | ) | (390,395 | ) | ||||
|
Investment securities commitments sold (peso-denominated)
|
(453,291 | ) | (1,131,921 | ) | ||||
|
Total obligations
|
(7,397,507 | ) | (5,946,977 | ) | ||||
|
Total forward contracts, net
|
210,322 | 172,295 | ||||||
GRUPO AVAL ACCIONES Y VALORES S.A. AND ITS SUBSIDIARIES
NOTES TO THE CONSOLIDATED FINANCIAL STATEMENTS
FOR THE YEARS ENDED DECEMBER 31, 2011, 2010 AND 2009
(
Stated in millions of Colombian pesos and U.S. dollars)
|
Futures contracts
|
||||||||
|
Foreign exchange rights contracts sold
|
514,272 | 73,096 | ||||||
|
Total rights
|
514,272 | 73,096 | ||||||
|
Foreign exchange commitments contracts sold
|
(514,162 | ) | (72,743 | ) | ||||
|
Total obligations
|
(514,162 | ) | (72,743 | ) | ||||
|
Total future contracts
|
110 | 353 | ||||||
|
Swaps
|
||||||||
|
Foreign exchange right contracts
|
389,789 | 374,263 | ||||||
|
Interest rate rights contracts
|
656,335 | 435,936 | ||||||
|
Foreign exchange commitments contracts
|
(351,203 | ) | (308,894 | ) | ||||
|
Interest rate commitments contracts
|
(643,536 | ) | (429,797 | ) | ||||
|
Total swaps, net
|
51,385 | 71,508 | ||||||
|
Options
|
||||||||
|
Foreign exchange call options
|
38,698 | 4,952 | ||||||
|
Foreign exchange put options
|
1,621 | 879 | ||||||
|
Total options, net
|
40,319
|
5,831
|
||||||
|
Total bankers’ acceptances, spot transactions and derivatives
|
Ps. | 418,809 | Ps. | 306,881 | ||||
|
(8)
|
PROPERTY, PLANT AND EQUIPMENT, NET
|
Property, plant and equipment as of December 31, 2011 and 2010 consisted of the following:
|
2011
|
2010
|
|||||||
|
Land (1)
|
Ps. | 335,241 | Ps. | 312,193 | ||||
|
Buildings
|
978,389 | 945,182 | ||||||
|
Furniture, equipment and fixtures
|
576,035 | 519,182 | ||||||
|
Computer equipment
|
727,495 | 696,132 | ||||||
|
Vehicles
|
66,863 | 73,625 | ||||||
|
Construction in progress (2)
|
36,478 | 26,893 | ||||||
|
Machinery and equipment
|
281,738 | 300,133 | ||||||
|
Equipment in transit (2)
|
234,798 | 160,912 | ||||||
|
Total
|
3,237,037 | 3,034,252 | ||||||
|
Less accumulated depreciation
|
(1,471,022 | ) | (1,377,355 | ) | ||||
|
Allowance for impairment
|
(4,706 | ) | (13,223 | ) | ||||
|
Property, plant and equipment, net
|
Ps. | 1,761,309 | Ps. | 1,643,674 | ||||
|
(1)
|
Not a depreciable asset.
|
|
(2)
|
These assets begin to depreciate when the constructions are completed and/or the assets are ready for use.
|
Property, plant and equipment depreciation expense for the years ended December 31, 2011, 2010 and 2009, amounted to Ps. 185,765, Ps. 120,923 and Ps. 107,698, respectively.
GRUPO AVAL ACCIONES Y VALORES S.A. AND ITS SUBSIDIARIES
NOTES TO THE CONSOLIDATED FINANCIAL STATEMENTS
FOR THE YEARS ENDED DECEMBER 31, 2011, 2010 AND 2009
(
Stated in millions of Colombian pesos and U.S. dollars)
|
(9)
|
OPERATING LEASES, NET
|
Operating leases where the Grupo Aval’s banking subsidiaries act as lessors as of December 31, 2011 and 2010 consisted of the following:
|
2011
|
2010
|
|||||||
|
Machinery and equipment
|
Ps. | 78,229 | Ps. | 71,987 | ||||
|
Vehicles
|
29,195 | 9,964 | ||||||
|
Furniture, equipment and fixtures
|
77,869 | 60,451 | ||||||
|
Computer equipment
|
329,922 | 287,093 | ||||||
|
Total
|
515,215 | 429,495 | ||||||
|
Less accumulated depreciation
|
(187,180 | ) | (161,910 | ) | ||||
|
Allowance for impairment
|
(4,786 | ) | (3,710 | ) | ||||
|
Operating leases, net
|
Ps. | 323,249 | Ps. | 263,875 | ||||
Operating lease depreciation expense for the years ended December 31, 2011, 2010 and 2009 amounted to Ps. 90,905, Ps. 93,867 and Ps. 97,454, respectively.
|
(10)
|
FORECLOSED ASSETS, NET
|
Foreclosed assets as of December 31, 2011 and 2010 consisted of the following:
|
2011
|
2010
|
|||||||
|
Foreclosed assets:
|
||||||||
|
Real estate
|
Ps. | 214,620 | Ps. | 206,358 | ||||
|
Other assets
|
6,214 | 9,118 | ||||||
|
Total
|
220,834 | 215,476 | ||||||
|
Allowance
|
(143,073 | ) | (130,004 | ) | ||||
|
Total foreclosed assets, net
|
Ps. | 77,761 | Ps. | 85,472 | ||||
The changes in allowance for foreclosed assets were as follows:
|
2011
|
2010
|
2009
|
||||||||||
|
Balance at beginning of year
|
Ps. | 130,004 | Ps. | 123,524 | Ps. | 126,236 | ||||||
|
BAC Credomatic’s acquisition
|
- | 23,215 | - | |||||||||
|
Provision
|
36,533 | 12,974 | 22,189 | |||||||||
|
Charge-offs
|
(5,994 | ) | (184 | ) | (792 | ) | ||||||
|
Recovery of provisions
|
(25,103 | ) | (19,856 | ) | (23,650 | ) | ||||||
|
Reclassifications
|
(5,812 | ) | (6,512 | ) | (13 | ) | ||||||
|
Provision used on sales
|
(1,187 | ) | (2,749 | ) | - | |||||||
|
Effect of changes on foreign exchange rates
|
14,632 | (408 | ) | (446 | ) | |||||||
|
Balance at the end of year
|
Ps. | 143,073 | Ps. | 130,004 | Ps. | 123,524 | ||||||
GRUPO AVAL ACCIONES Y VALORES S.A. AND ITS SUBSIDIARIES
NOTES TO THE CONSOLIDATED FINANCIAL STATEMENTS
FOR THE YEARS ENDED DECEMBER 31, 2011, 2010 AND 2009
(
Stated in millions of Colombian pesos and U.S. dollars)
|
(11)
|
PREPAID EXPENSES AND DEFERRED CHARGES
|
Prepaid expenses and deferred charges as of December 31, 2011 and 2010 consisted of the following:
|
2011
|
2010
|
|||||||
|
Prepaid expenses:
|
||||||||
|
Insurance premiums
|
Ps. | 15,124 | Ps. | 9,605 | ||||
|
Interest
|
4,511 | 22,469 | ||||||
|
Leases
|
1,281 | 2,381 | ||||||
|
Equipment maintenance
|
2,340 | 2,404 | ||||||
|
Other
|
13,016 | 6,373 | ||||||
|
Total prepaid expenses
|
36,272 | 43,232 | ||||||
|
Deferred charges:
|
||||||||
|
Pre-operating and reorganization expenses
|
5,421 | 4,886 | ||||||
|
Remodeling expenses
|
17,016 | 55,352 | ||||||
|
Computer programs
|
78,691 | 59,465 | ||||||
|
Improvements on road constructions and inflation adjustments (1)
|
669,214 | 279.591 | ||||||
|
Leasehold improvements
|
47,003 | 15,108 | ||||||
|
Advertising
|
9,127 | 7,237 | ||||||
|
Deferred income tax asset (2)
|
132,667 | 116,845 | ||||||
|
Fees and commissions
|
43 | 77 | ||||||
|
Studies and projects
|
144,565 | 288,823 | ||||||
|
Equity tax (3)
|
587,516 | - | ||||||
|
Other (4)
|
228,669 | 50,044 | ||||||
|
Total deferred charges
|
1,919,932 | 877,428 | ||||||
|
Total prepaid expenses and deferred charges
|
Ps. | 1,956,204 | Ps. | 920,660 | ||||
|
(1)
|
In 1993, “Proyecto de Infrastructura S.A. Pisa”, entered into an agreement with “Departamento del Valle de Cauca”, for the construction, operation and maintenance of a public highway. According to the agreement “Proyecto de Infrastructura S.A. Pisa” would fund all the construction costs in exchange for the right to charge and collect a toll to the users of the highway for a period of about fourteen years.
|
In 1994, “Sociedad Concesionaria Vial de los Andes S.A.” entered into an agreement with “Instituto Nacional de Vías”, for the construction, operation and maintenance of a public highway. According to the agreement “Sociedad Concesionaria Vial de los Andes S.A.”, would fund all the construction costs in exchange for the right to charge and collect a toll to the users of the highway for a period of about fifteen years.
In 1995, “Concesiones CCFC S.A.”, entered into an agreement with “Instituto Nacional de Vías”, for the construction, operation and maintenance of a public highway. According to the agreement “Concesiones CCFC S.A.”, would fund all the construction costs in exchange for the right to charge and collect a toll to the users of the highway for a period of twenty years.
|
(2)
|
Deferred income tax assets relates to the following temporary differences:
|
|
2011
|
2010
|
|||||||
|
Deferred income tax asset
|
||||||||
|
Estimated liabilities
|
Ps. | 55,954 | Ps. | 61,086 | ||||
|
Bankers’ acceptances and derivatives
|
22,319 | 4,267 | ||||||
|
Deferred charges
|
1,802 | 1,143 | ||||||
|
Other
|
52,592 | 50,349 | ||||||
|
Total deferred income tax asset
|
Ps. | 132,667 | Ps. | 116,845 | ||||
GRUPO AVAL ACCIONES Y VALORES S.A. AND ITS SUBSIDIARIES
NOTES TO THE CONSOLIDATED FINANCIAL STATEMENTS
FOR THE YEARS ENDED DECEMBER 31, 2011, 2010 AND 2009
(
Stated in millions of Colombian pesos and U.S. dollars)
|
(3)
|
In December 30, 2009, the Congress of Colombia enacted Law No. 1370, which added a net worth tax on the wealth of corporate entities (hereinafter referred to as the “Equity Tax”). The Equity Tax accrued on January 1, 2011 amounted to Ps. 783,354 payable in four equal installments through 2014 (one per year). The tax rate to be paid by Grupo Aval and its subsidiaries, each on an unconsolidated basis, is 6.0% of their net fiscal worth as of January 1, 2011. As of December 31, 2011, Grupo Aval had a consolidated liability of Ps. 587,516, having paid Ps. 195,839 during 2011.
|
In accordance with Colombian Banking GAAP, the equity tax liability was recorded as a deferred charge and has been and will continue to be amortized on a straight monthly basis until 2014. Colombian Banking GAAP regulations allow companies to charge the amortized portion against the “equity inflation adjustments” line item in the shareholders’ equity account, but since most of the companies consolidated by Grupo Aval had already used up their “equity inflation adjustments” account, they charged the expense in the consolidated statement of income.
|
(4)
|
Includes Ps. 26,405 of Grupo Aval by deferred charges for advertising and propaganda that correspond to the issuance and placement of shares held during the period and that will be amortized over 24 months.
|
|
(12)
|
GOODWILL, NET
|
Goodwill, net as of December 31, 2011 and 2010 was as follows:
|
2011
|
2010
|
|||||||
|
Goodwill related to BAC Credomatic GEFC Inc. acquisition (recorded in Leasing Bogotá Panama)
|
Ps. | 2,017,279 | Ps. | 2,038,023 | ||||
|
Goodwill related to Megabanco acquisition (Recorded in Banco de Bogotá S.A.)
|
510,799 | 531,098 | ||||||
|
Goodwill related to Banco Popular and Banco Comercial AV Villas acquisitions (Recorded in Grupo Aval)
|
424,954 | 434,882 | ||||||
|
Goodwill related to Banco Aliadas and Banco Unión acquisitions (Recorded in Banco de Occidente S.A.)
|
25,720 | 27,080 | ||||||
|
Goodwill related to Intrex acquisition in Panamericana (recorded into Banco de Bogota trough Corficolombiana)
|
131,945 | - | ||||||
|
Goodwill related to Proyectos de Infraestructura and Hoteles Estelar’s acquisitions (Recorded into Banco de Bogotá S.A. through Corficolombiana.)
|
48 | 363 | ||||||
|
Total goodwill, net
|
Ps. | 3,110,745 | Ps. | 3,031,446 | ||||
The movements in goodwill were as follows:
|
2011
|
2010
|
2009
|
||||||||||
|
Balance at beginning of year
|
Ps. | 3,031,446 | Ps. | 1,020,143 | Ps. | 1,064,018 | ||||||
|
Goodwill acquired in business combination (1)
|
135,590 | 2,005,601 | - | |||||||||
|
Exchange difference
|
36,343 | 35,360 | - | |||||||||
|
Amortization expenses
|
(92,634 | ) | (28,620 | ) | (43,502 | ) | ||||||
|
Other related expenses (2)
|
- | (1,038 | ) | (373 | ) | |||||||
|
Balance at end of year
|
Ps. | 3,110,745 | Ps. | 3,031,446 | Ps. | 1,020,143 | ||||||
|
(1)
|
In 2011, goodwill originated in the acquisition of Concesionaria Pananamericana Ps. 21,672 and Intrex Investments INC Ps. 113,918. In December 2010 goodwill for the acquisition of BAC Credomatic was recorded of US$ 1,066,344, equivalent to Ps. 2,005,601.
|
|
(2)
|
Other related expenses mainly reflect a portion of Corficolombiana´s amortization expense that was registered as “other expense” in the consolidated statements of income for the year 2009 and 2010.
|
GRUPO AVAL ACCIONES Y VALORES S.A. AND ITS SUBSIDIARIES
NOTES TO THE CONSOLIDATED FINANCIAL STATEMENTS
FOR THE YEARS ENDED DECEMBER 31, 2011, 2010 AND 2009
(
Stated in millions of Colombian pesos and U.S. dollars)
Grupo Aval’s goodwill
Grupo Aval (parent company) records the amounts paid in excess of book value in the acquisition of shares, which mainly arose from the Banco Popular S.A. acquisition in the years 2008, 2006 and 2005. As of December 31, 2011 and 2010, the value of goodwill registered in Grupo Aval was Ps. 424,954 and Ps 434,882, respectively.
Banking subsidiaries’ goodwill
Banco de Bogotá S.A. and its subsidiaries acquired Megabanco on June, 2006, recording Goodwill by Ps. 613,294.
On December 2010 Banco de Bogotá registered goodwill for the acquisition of BAC Credomatic for US$ 1,066,344, equivalent to Ps. 2,005,601.
The following table shows the goodwill calculations in the BAC Credomatic acquisition as of November 30, 2010, as permitted by the Colombian Superintendency:
|
(in thousands of U.S. dollars as of November 30, 2010)
|
(equivalent in millions of Ps) (2)
|
|||||||||||||||
|
Purchase price
|
1,920,000 | 3,611,174 | ||||||||||||||
|
Carrying value of assets acquired minus liabilities assumed under US GAAP
|
902,699 | 1,697,814 | ||||||||||||||
|
Adjustments to COL GAAP:
|
||||||||||||||||
|
Loans origination fees (Note 30 f)
|
(3,103 | ) | (5,836 | ) | ||||||||||||
|
Allowance for loan losses (Note 30 e)
|
(20,220 | ) | (38,030 | ) | ||||||||||||
|
Reappraisal of assets (Note 30 d)
|
69,552 | 130,815 | ||||||||||||||
|
Fair value of loans (1)
|
(2,272 | ) | (4,273 | ) | ||||||||||||
|
Allowance for foreclosed assets (Note 30 e)
|
(6,558 | ) | (12,334 | ) | ||||||||||||
|
Pre-existing goodwill- business combination (Note 30 m)
|
(96,831 | ) | (182,122 | ) | ||||||||||||
|
Impairment of investments (Note 30 i)
|
(2,681 | ) | (5,042 | ) | ||||||||||||
|
Deferred income tax (Note 30 a)
|
12,413 | 23,347 | ||||||||||||||
|
Guarantees (Note 30 o)
|
657 | (49,043 | ) | 1,234 | (92,241 | ) | ||||||||||
|
Net assets acquired
|
853,656 | 1,605,573 | ||||||||||||||
|
Excess of purchase price over net assets acquired (Goodwill)
|
1,066,344 | 2,005,601 | ||||||||||||||
|
(1)
|
Under US GAAP, certain loans were recorded by BAC at fair value, Under COL GAAP, it is not permitted to fair value loans, and therefore, they were recorded at cost.
|
|
(2)
|
Translated using an exchange rate of Ps. 1,880.82 per USD, TRM as of November 30th, 2010.
|
Banco de Bogotá began amortizing the goodwill under the exponential method over a period of twenty years since the date of each acquisition. Goodwill is allocated among several business lines which are subject to impairment tests in which Grupo Aval compares its book value (including the assigned goodwill) to technical studies prepared annually by independent experts. At the end of each reporting period or when there is any indication of impairment (i.e. a reduction in its recoverable amount to below its carrying amount) any impairment is written off. As of December 31, 2011 and 2010, no impairment was recognized.
Banco de Occidente S.A. recorded goodwill when it acquired Banco Aliadas and Banco Unión Colombiano by Ps. 41,935.
Banco Popular S.A. and Banco Comercial AV Villas S.A., as of December 31, 2011, do not have goodwill registered in their financial statements.
GRUPO AVAL ACCIONES Y VALORES S.A. AND ITS SUBSIDIARIES
NOTES TO THE CONSOLIDATED FINANCIAL STATEMENTS
FOR THE YEARS ENDED DECEMBER 31, 2011, 2010 AND 2009
(
Stated in millions of Colombian pesos and U.S. dollars)
|
(13)
|
OTHER ASSETS, NET
|
Other assets as of December 31, 2011 and 2010 consisted of the following:
|
2011
|
2010
|
|||||||
|
Assets held for sale
|
Ps. | 402,472 | Ps. | 414,339 | ||||
|
Value added tax deductible and withholding taxes
|
38,692 | 34,529 | ||||||
|
Restricted deposits
|
109,115 | 122,012 | ||||||
|
Investment in trust
|
32,808 | 65,051 | ||||||
|
Prepaid taxes
|
65,507 | 49,266 | ||||||
|
Assets available for lease contracts
|
338,739 | 156,914 | ||||||
|
Joint ventures (1)
|
75,663 | 65,177 | ||||||
|
Other
|
67,689 | 68,705 | ||||||
|
Total
|
1,130,685 | 975,993 | ||||||
|
Less: Allowance for impairment
|
(58,075 | ) | (64,035 | ) | ||||
|
Total other assets, net
|
Ps. | 1,072,610 | Ps. | 911,958 | ||||
|
(1)
|
Include capitalized expenses related to a toll road operated by Corficolombiana.
|
|
(14)
|
REAPPRAISAL OF ASSETS
|
The following table describes reappraisals of assets as of December 31, 2011 and 2010:
|
2011
|
2010
|
|||||||
|
Reappraisal of property plant and equipment
|
Ps. | 2,126,951 | Ps. | 1,905,022 | ||||
|
Revaluation of investments
|
131,991 | 136,043 | ||||||
|
Reappraisal of other assets
|
10,759 | 21,429 | ||||||
|
Total reappraisal of assets
|
2,269,701 | 2,062,494 | ||||||
|
Less: Non-controlling interests
|
(1,250,140 | ) | (1,354,700 | ) | ||||
|
Total equity revaluations
|
Ps. | 1,019,561 | Ps. | 707,794 | ||||
The amount of reappraisal of assets attributable to non-controlling interests reflects third-party participation in Banco de Bogotá and its subsidiaries (including Corficolombiana and its subsidiaries), Banco de Occidente and its subsidiaries, Banco Popular and its subsidiaries and Banco Comercial AV Villas.
|
(15)
|
TIME DEPOSITS
|
Time deposits (classified per maturity at the issuance date) as of December 31, 2011 and 2010 were as follows:
|
2011
|
2010
|
|||||||
|
Less than six-months
|
Ps. | 6,940,221 | Ps. | 7,102,019 | ||||
|
Between six to twelve months
|
4,389,043 | 3,903,531 | ||||||
|
Between twelve and eighteen months
|
2,930,874 | 1,876,207 | ||||||
|
More than 18 months
|
8,370,355 | 5,733,270 | ||||||
|
Total certificates of time deposits (*)
|
Ps. | 22,630,493 | Ps. | 18,615,027 | ||||
(*) See level of cash reserves established by central banks in countries where Grupo Aval banking subsidiaries operate in Note 3.
GRUPO AVAL ACCIONES Y VALORES S.A. AND ITS SUBSIDIARIES
NOTES TO THE CONSOLIDATED FINANCIAL STATEMENTS
FOR THE YEARS ENDED DECEMBER 31, 2011, 2010 AND 2009
(
Stated in millions of Colombian pesos and U.S. dollars)
|
(16)
|
INTERBANK BORROWINGS AND OVERNIGHT FUNDS
|
Interbank borrowings and overnight funds as of December 31, 2011 and 2010 were as follows:
|
2011
|
2010
|
|||||||
|
Ordinary interbank funds purchased
|
Ps. | 594,116 | Ps. | 193,496 | ||||
|
Commitments of investment in simultaneous operations
|
1,936,713 | 1,520,059 | ||||||
|
Commitments of closed repo operations
|
593,857 | 558,757 | ||||||
|
Commitments of open repo operations
|
100,459 | 205,112 | ||||||
|
Total interbank and overnight funds
|
Ps. | 3,225,145 | Ps. | 2,477,424 | ||||
|
(17)
|
BORROWINGS FROM BANKS AND OTHERS
|
Borrowings from banks and others as of December 31, 2011 and 2010 were as follows:
|
Interest rates
|
2011
|
2010
|
|||||||
|
Banco de Comercio Exterior (“Bancoldex”) (*)
|
0.00% to 11.98%
|
Ps. | 1,224,976 | Ps. | 1,352,510 | ||||
|
Fondo para el Financiamiento del Sector Agropecuario (“FINAGRO”) (*)
|
0.01% to 7.23%
|
601,895 | 528,229 | ||||||
|
Financiera de Desarrollo Territorial (“FINDETER”) (*)
|
0.41% to 8.93%
|
1,075,625 | 758,273 | ||||||
|
Foreign Banks
|
0.28% to 12.17%
|
6,443,326 | 5,149,988 | ||||||
|
Other financial institutions
|
0.66% to 26.30%
|
647,809 | 1,251,005 | ||||||
|
Related parties (See note 27)
|
DTF+3%
|
1,444,120 | 1,451,176 | ||||||
|
Total borrowings from banks and others
|
Ps. | 11,437,751 | Ps. | 10,491,181 | |||||
|
(*)
|
The Colombian Government has established programs to promote the development of specific sectors of the economy, including foreign trade, agriculture, tourism and many other industries. These programs are managed by the Colombian Central Bank and various government entities such as
Banco de Comercio Exterior (
“Bancoldex”),
Fondo para el Financiamiento del Sector Agropecuario (
“FINAGRO”) and
Financiera de Desarrollo Territorial
(“FINDETER”).
|
Maturities of borrowings from banks and others as of December 31, 2011 were as follows:
|
2012
|
Ps. | 3,989,603 | ||
|
2013
|
1,128,666 | |||
|
2014
|
2,858,394 | |||
|
2015
|
796,042 | |||
|
2016
|
1,763,016 | |||
|
2017 and thereafter
|
902,030 | |||
|
Total borrowings from banks and others
|
Ps. | 11,437,751 |
GRUPO AVAL ACCIONES Y VALORES S.A. AND ITS SUBSIDIARIES
NOTES TO THE CONSOLIDATED FINANCIAL STATEMENTS
FOR THE YEARS ENDED DECEMBER 31, 2011, 2010 AND 2009
(
Stated in millions of Colombian pesos and U.S. dollars)
|
(18)
|
ACCOUNTS PAYABLE
|
Accounts payable as of December 31, 2011 and 2010 were as follows:
|
2011
|
2010
|
|||||||
|
Dividends payable (See note 23)
|
Ps. | 377,815 | Ps. | 467,457 | ||||
|
Suppliers
|
551,476 | 307,815 | ||||||
|
Contribution on financial transactions
|
31,995 | 21,017 | ||||||
|
Taxes (1)
|
915,168 | 303,686 | ||||||
|
Collections for third parties
|
152,826 | 216,201 | ||||||
|
Withholdings and labor contributions
|
48,977 | 47,564 | ||||||
|
Insurance (2)
|
236,604 | 191,196 | ||||||
|
Pending checks
|
45,235 | 50,615 | ||||||
|
Other
|
733,853 | 637,970 | ||||||
|
Total accounts payable
|
Ps. | 3,093,949 | Ps. | 2,243,521 | ||||
|
(1)
|
Includes Ps. 587,516 at December 31, 2011 associated with the Equity Tax. In December 30, 2009, the Congress of Colombia enacted Law No. 1370, which added a net worth tax on the wealth of corporate entities or Equity Tax. The Equity Tax accrued on January 1, 2011 amounted to Ps. 783,354 payable in four equal installments through 2014 (one per year). The tax rate to be paid by Grupo Aval and its subsidiaries, each on an unconsolidated basis, is 6.0% of their net fiscal worth as of January 1, 2011. As of December 31, 2011, Grupo Aval had a consolidated amount of Ps. 587,516, having paid Ps. 195,839 during 2011.
|
In accordance with Colombian Banking GAAP, the equity tax liability was recorded as a deferred charge and as an account payable. It has been and will continue to be amortized on a straight monthly basis until 2014. Colombian Banking GAAP regulations allow companies to charge the amortized portion against the “equity inflation adjustments” line item in the shareholders’ equity account, but since most of the companies consolidated by Grupo Aval had already used up their “equity inflation adjustments” account, they charged the expense in the consolidated statement of income
|
(2)
|
Includes BAC Credomatic insurance premium related to loans granted to its clients.
|
|
(19)
|
OTHER LIABILITIES
|
Other liabilities as of December 31, 2011 and 2010 were as follows:
|
2011
|
2010
|
|||||||
|
Consolidated severance and interest on severance
|
Ps. | 87,290 | Ps. | 77,912 | ||||
|
Accrued vacations
|
69,197 | 62,824 | ||||||
|
Other labor benefits
|
70,493 | 62,964 | ||||||
|
Unearned interest (1)
|
56,076 | 49,176 | ||||||
|
Unapplied payments from customers
|
296,738 | 147,937 | ||||||
|
Deferred income
|
7,228 | 32,233 | ||||||
|
Dormant deposits
|
25,562 | 25,812 | ||||||
|
Pension obligations (2)
|
298,994 | 280,581 | ||||||
|
Deferred income tax (3)
|
183,691 | 199,719 | ||||||
|
Additional road constructions (4)
|
- | 193,019 | ||||||
|
Interest
|
8,592 | 7,746 | ||||||
|
Joint ventures
|
21,106 | 16,603 | ||||||
|
Other
|
322,797 | 135,372 | ||||||
|
Total other liabilities
|
Ps. | 1,447,764 | Ps. | 1,291,898 | ||||
GRUPO AVAL ACCIONES Y VALORES S.A. AND ITS SUBSIDIARIES
NOTES TO THE CONSOLIDATED FINANCIAL STATEMENTS
FOR THE YEARS ENDED DECEMBER 31, 2011, 2010 AND 2009
(
Stated in millions of Colombian pesos and U.S. dollars)
|
(1)
|
Unearned interest primarily consists of prepayments of interest by customers.
|
|
(2)
|
The following table shows Grupo Aval’s banking subsidiaries pension obligations as of December 31, 2011 and 2010:
|
|
Pension liability
|
Deferred cost
|
Net pension liability
|
||||||||||
|
Balance at December 31, 2008
|
Ps. | 276,179 | Ps. | (14,342 | ) | Ps. | 261,837 | |||||
|
Adjustment per actuarial valuation
|
45,647 | (45,647 | ) | - | ||||||||
|
Benefits paid
|
(30,235 | ) | - | (30,235 | ) | |||||||
|
Pension expense
|
- | 46,959 | 46,959 | |||||||||
|
Balance at December 31, 2009
|
291,591 | (13,030 | ) | 278,561 | ||||||||
|
Adjustment per actuarial valuation (*)
|
86,949 | (86,949 | ) | - | ||||||||
|
Benefits paid
|
(30,544 | ) | - | (30,544 | ) | |||||||
|
Pension expense
|
- | 32,564 | 32,564 | |||||||||
|
Balance at December 31, 2010
|
347,996 | (67,415 | ) | 280,581 | ||||||||
|
Adjustment per actuarial valuation
|
51,586 | (51,586 | ) | - | ||||||||
|
Benefits paid
|
(32,662 | ) | - | (32,662 | ) | |||||||
|
Pension expense
|
- | 51,075 | 51,075 | |||||||||
|
Balance at December 31, 2011
|
Ps. | 366,920 | Ps. | (67.926 | ) | Ps. | 298,994 | |||||
|
(*)
|
Includes the changes in the mortality table, established by the Superintendency of Finance in 2010.
|
In compliance with Colombian law, the present value of the expected pension payments was determined on the basis of actuarial calculations. The significant assumptions used in the actuarial calculations were the following:
|
2011
|
2010
|
2009
|
|||
|
Discount rate
|
4.8 % to 8.7 %
|
4.5% to 7.7%
|
4.8% to 11.6%
|
||
|
Future pension increases
|
2.0 % to 6.5 %
|
3.2% to 4.5 %
|
6.5% to 7.7%
|
|
(3)
|
Deferred income tax liability relates to the following temporally differences:
|
|
2011
|
2010
|
|||||||
|
Deferred income tax liabilities
|
||||||||
|
Unrealized gain on investment securities
|
Ps. | 4,255 | Ps. | 6,514 | ||||
|
Property, plant and equipment
|
38,096 | 32,393 | ||||||
|
Unrealized gains on derivatives
|
5,522 | 44,174 | ||||||
|
Deferred charges
|
10,401 | 44,966 | ||||||
|
Pension plan
|
21,052 | 16,342 | ||||||
|
Allowance for loan losses
|
6,657 | 15,314 | ||||||
|
Accrued expenses
|
6,509 | 16,817 | ||||||
|
Other
|
91,199 | 23,199 | ||||||
|
Total deferred income tax liabilities
|
Ps. | 183,691 | Ps. | 199,719 | ||||
|
(4)
|
Balance owed by the Colombian Government related to investments made by Grupo Aval in road concessions that were not subsequently renewed by the grantor and based on agreements was fully paid.
|
GRUPO AVAL ACCIONES Y VALORES S.A. AND ITS SUBSIDIARIES
NOTES TO THE CONSOLIDATED FINANCIAL STATEMENTS
FOR THE YEARS ENDED DECEMBER 31, 2011, 2010 AND 2009
(
Stated in millions of Colombian pesos and U.S. dollars)
|
(20)
|
BONDS
|
Companies are authorized by the Superintendency of Finance to issue secured and unsecured bonds. As of December 2011 and 2010, the majority of the bonds issued by Grupo Aval and its subsidiaries are unsecured and are solely obligations of each issuer.
As of December 31, 2011 and 2010, bond issued were as follows:
|
ISSUER
|
ISSUANCE DATE
|
December 31, 2011
|
December 31, 2010
|
MATURITY
|
INTEREST RATE
|
|||||||||||
|
BAC Honduras
|
October 2009
|
Ps. |
14,163
|
Ps. |
15,194
|
October 2012
|
14.38% to 14.99%
|
|||||||||
|
November 2009
|
11,329
|
10,130
|
October 2012
|
14.38% to 14.99%
|
||||||||||||
|
25,492
|
25,324
|
|||||||||||||||
|
Banco de America Central
|
June 2006
|
-
|
5,742
|
June 2011
|
2,91%
|
|||||||||||
|
September 2006
|
-
|
2,871
|
September 2011
|
2,96%
|
||||||||||||
|
March 2007
|
19,427
|
19,140
|
March 2012
|
4,19%
|
||||||||||||
|
May 2007
|
19,427
|
19,140
|
May 2012
|
3,58%
|
||||||||||||
|
January 2008
|
19,427
|
19,140
|
January 2013
|
3.94% to 3.98%
|
||||||||||||
|
November 2008
|
29,141
|
28,710
|
November 2013
|
4,17%
|
||||||||||||
|
February 2009
|
29,141
|
28,710
|
February 2013
|
5,02%
|
||||||||||||
|
February 2006
|
-
|
7,655
|
February 2011
|
3.69%
|
||||||||||||
|
December 2010
|
-
|
20,466
|
January 2011
|
4.00%
|
||||||||||||
|
June 2011
|
23,170
|
-
|
January 2012
|
4.00%
|
||||||||||||
|
December 2011
|
7,771
|
-
|
December 2016
|
4.25%
|
||||||||||||
|
147,504
|
151,574
|
|||||||||||||||
|
Banco de Bogotá S.A.
|
April 2008 (*)
|
209,960
|
206,844
|
April 2015
|
IPC+7.00% to UVR+7.00% to DTF+3.00%
|
|||||||||||
|
February 2004
|
-
|
203,699
|
February 2011
|
IPC+6.49%toUVR+6.39%.a UVR+6.39%.
|
||||||||||||
|
February 2010 (*)
|
206,545
|
202,291
|
February 2017
|
IPC+5.33% to UVR+5.29% , IPC +5.45% to UVR +5.45%.
|
||||||||||||
|
November 2010
(1)
|
-
|
910,524
|
November 2011
|
3,00%
|
||||||||||||
|
December 2011 (2)
|
1,165,619
|
-
|
January 2017
|
5.00%
|
||||||||||||
|
1,582,124
|
1,523,358
|
|||||||||||||||
|
Banco de Occidente S.A.
|
August 2006 (*)
|
75,000
|
75,000
|
August 2013
|
DTF + 5.58%
|
|||||||||||
|
August 2007 (*)
|
80,000
|
80,000
|
August 2007
|
to
|
February 2015
|
DTF + 5.90%
|
||||||||||
|
August 2008
|
186,910
|
190,413
|
August 2011
|
to
|
August 2018
|
DTF + 2.70% to IPC + 7.00%
|
||||||||||
|
December 2006
|
-
|
8,730
|
December 2011
|
DTF+ 3.00%
|
||||||||||||
|
February 2004
|
-
|
80,000
|
February 2011
|
IPC + 6.19%
|
||||||||||||
|
June 2007
|
135,406
|
174,705
|
June 2011
|
to
|
June 2014
|
DTF + 2.90% to IPC + 6.60%
|
||||||||||
|
March 2009
|
236,439
|
368,000
|
March 2011
|
to
|
March 2019
|
DTF + 1.30% to DTF + 1.60% + IPC + 5.00% to IPC + 6.00%
|
||||||||||
|
May 2005 (*)
|
40,000
|
40,000
|
May 2012
|
IPC + 5.09%
|
||||||||||||
|
November 2010 to January 2011
|
550,000
|
359,550
|
November 2010
|
to
|
November 2015
|
IPC + 2.72% to DTF + 1.35% to IBR + 1.42%
|
||||||||||
|
October 2006 (*)
|
44,680
|
44,680
|
October 2013
|
IPC + 5.75%
|
||||||||||||
|
March 2011
|
400,000
|
-
|
March 2014
|
to
|
March 2016
|
IPC+2.49% + IPC+3.05%, 6.65%, 7.25%
|
||||||||||
|
September 2011
|
247,119
|
-
|
September 2014
|
to
|
September 2021
|
IPC + 4% to 4.50% TV, IBR + 1.80%
|
||||||||||
|
1,995,554
|
1,421,078
|
|||||||||||||||
GRUPO AVAL ACCIONES Y VALORES S.A. AND ITS SUBSIDIARIES
NOTES TO THE CONSOLIDATED FINANCIAL STATEMENTS
FOR THE YEARS ENDED DECEMBER 31, 2011, 2010 AND 2009
(
Stated in millions of Colombian pesos and U.S. dollars)
|
Banco Popular S.A.
|
October 2010
|
300,000
|
300,000
|
April 2012
|
to
|
October 2013
|
IBR + 1,10% MV to IPC+2,64%TV
|
|||||||||
|
June 2010
|
151,158
|
300,000
|
December 2011
|
to
|
June 2013
|
DTF+ 0,95%TV to 4,98%MV to IPC + 3,23%TV to IBR + 1,20% MV
|
||||||||||
|
February 2010
|
400,300
|
500,000
|
August 2012
|
to
|
February 2015
|
DTF + 1,10% TV to IPC + 3,30%TV to IBR + 1,44% MV
|
||||||||||
|
July 2008 (*)
|
100,000
|
100,000
|
July 2015
|
IPC + 7,70%TV
|
||||||||||||
|
September 2006 (*)
|
100,000
|
100,000
|
September 2013
|
IPC + 5,49%TV
|
||||||||||||
|
June 2004
|
-
|
100,000
|
June 2011
|
IPC + 7.00% TV
|
||||||||||||
|
August 2011
|
400,000
|
-
|
February 2013
|
to
|
August 2015
|
IPC + 7,00%TV
|
||||||||||
|
1,451,458
|
1,400,000
|
|||||||||||||||
|
Concesionaria Vial de los Andes S.A.
|
July 2007
|
47,700
|
47,698
|
July, 2012
|
to
|
July 2014
|
IPC + 5.50% to IPC + 5.70%
|
|||||||||
|
47,700
|
47,698
|
|||||||||||||||
|
BAC Credomatic Guatemala
|
April 2010
|
-
|
11,397
|
April 2011
|
to
|
May 2011
|
7,25% to 9,00%
|
|||||||||
|
August 2010
|
-
|
13,616
|
February2011
|
to
|
6,31% to 8,69%
|
|||||||||||
|
December 2010
|
-
|
2,870
|
June 2011
|
to
|
December 2011
|
5,25% to 8,69%
|
||||||||||
|
January 2010
|
-
|
9,456
|
January 2011
|
to
|
December 2011
|
5,13% to 8,69%
|
||||||||||
|
December 2009
|
-
|
1,491
|
January 2011
|
7.49% to 9.00%
|
||||||||||||
|
July 2010
|
-
|
16,005
|
January 2011
|
to
|
July 2011
|
6,31% to 8,69%
|
||||||||||
|
June 2010
|
-
|
14,753
|
May 2011
|
to
|
June 2011
|
7,25% to 8,92%
|
||||||||||
|
February 2010
|
-
|
10,704
|
January 2011
|
to
|
February 2011
|
7.49% to 9.00%
|
||||||||||
|
March 2010
|
-
|
11,278
|
February 2011
|
to
|
March 2011
|
7.25% to 9.15%
|
||||||||||
|
May 2010
|
-
|
8,354
|
May 2011
|
to
|
7,25% to 8,92%
|
|||||||||||
|
November 2010
|
-
|
7,925
|
February 2011
|
to
|
November 2011
|
5,25% to 8,50%
|
||||||||||
|
October 2010
|
-
|
5,354
|
April 2011
|
to
|
October 2011
|
5,13% to 8,69%
|
||||||||||
|
September 2010
|
-
|
12,977
|
February 2011
|
to
|
September 2011
|
6,31% to 8,69%
|
||||||||||
|
January 2011
|
11,365
|
-
|
January 2012
|
5.14% to 8.69%
|
||||||||||||
|
February 2011
|
10,989
|
February 2012
|
6.31% to 8.50%
|
|||||||||||||
|
March 2011
|
9,722
|
-
|
March 2012
|
6.31% to 8.69%
|
||||||||||||
|
April 2011
|
12,224
|
October 2011
|
to
|
April 2012
|
6.31% to 8.69%
|
|||||||||||
|
May 2011
|
11,866
|
-
|
November 2011
|
to
|
May 2012
|
6.31% to 8.50%
|
||||||||||
|
June 2011
|
16,191
|
November 2011
|
to
|
June 2012
|
4.89% to 8.69%
|
|||||||||||
|
July 2011
|
15,663
|
-
|
July 2012
|
4.65% to 8.25%
|
||||||||||||
|
August 2011
|
15,675
|
August 2012
|
4.75% to 8.25%
|
|||||||||||||
|
September 2011
|
18,471
|
-
|
September 2012
|
4.75% to 8.45%
|
||||||||||||
|
October 2011
|
15,790
|
October 2012
|
4.65% to 8.45%
|
|||||||||||||
|
November 2011
|
13,676
|
-
|
November 2012
|
4.65% to 8.30%
|
||||||||||||
|
December 2011
|
13,136
|
|
December 2012
|
4.65% to 8.22%
|
||||||||||||
|
164,768
|
126,180
|
|||||||||||||||
|
Grupo Aval Acciones y Valores S.A.
|
April 2005
|
94,700
|
94,700
|
April 2012 | IPC + 5.60% | |||||||||||
|
October 2005
|
100,000
|
200,000
|
October 2011
|
to
|
October 2015
|
IPC + 2.63% to IPC + 3.37%
|
||||||||||
|
December 2009
|
749,733
|
750,000
|
December 2014
|
to
|
December 2024
|
IPC + 3.69% to DTF + 1.14%
|
||||||||||
|
944,433
|
1,044,700
|
|||||||||||||||
|
Industrias Lenher S.A.
|
June 2000
(3)
|
1,053
|
1,058
|
June, 2010
|
Non-interest bearing
|
|||||||||||
|
1,053
|
1,058
|
|||||||||||||||
|
Leasing Corficolombiana S.A.
|
April 2005
|
-
|
281
|
April 2011
|
DTF+2.90%
|
|||||||||||
|
January 2005
|
10,117
|
6,310
|
January 2013
|
to
|
October 2014
|
6.91% to 8.70%
|
||||||||||
|
January 2009
|
116,032
|
112,817
|
March 2013
|
7.18%
|
||||||||||||
|
126,149
|
119,408
|
GRUPO AVAL ACCIONES Y VALORES S.A. AND ITS SUBSIDIARIES
NOTES TO THE CONSOLIDATED FINANCIAL STATEMENTS
FOR THE YEARS ENDED DECEMBER 31, 2011, 2010 AND 2009
(
Stated in millions of Colombian pesos and U.S. dollars)
|
Proyectos de Infraestructura S.A.
|
May 2009
|
80,000
|
80,000
|
May 2016
|
IPC + 6.59% to IPC + 6.90%
|
|||||||||||
|
October 2001
|
-
|
12,000
|
August 2011
|
IPC +8.50%
|
||||||||||||
|
80,000
|
92,000
|
|||||||||||||||
| Ps. |
6,566,235
|
Ps. |
5,952,378
|
|
(1)
|
Reflect Banco de Bogotá´s convertible bonds which were converted in 2011 at Ps. 47,000 (in pesos) per share.
|
|
(2)
|
On December 2011, Banco de Bogotá issued a five year bond of US$600 million in the international market under rule 144-A with a coupon of 5%, at 98.898% of its nominal value.
|
|
(3)
|
As part of its restructuring process, Industrias Lenher S.A. issued non-interest bearing convertible bonds for Ps. 13,464 in April 2002. These bonds were offered to Lenher´s creditors to cover all or part of the accounts receivable that they had with the company. All bondholders had the right to exchange their bonds into shares at any time; the amount outstanding of Ps. 1,053 reflects the portion of the issuance that has not yet been converted.
|
|
(*)
|
Subordinated Bonds.
|
In the table above “IBR” refers to the Colombian interbanking short-term borrowing rate.
Interest accrued for bonds for 2011, 2010 and 2009 amounted to Ps. 339,631, Ps. 278,118 y Ps. 253,399, respectively.
The scheduled maturities of bonds as of December 31, 2011 are as follows:
|
2012
|
Ps. | 1,030,037 | ||
|
2013
|
1,615,602 | |||
|
2014
|
717,423 | |||
|
2015
|
884,266 | |||
|
2016
|
671,250 | |||
|
2017 and thereafter
|
1,647,657 | |||
|
Total
|
Ps. | 6,566,235 |
|
(21)
|
ESTIMATED LIABILITIES
|
Estimated liabilities as of December 31, 2011 and 2010 consisted of the following:
|
2011
|
2010
|
|||||||
|
Labor obligations
|
Ps. | 27,798 | Ps. | 27,348 | ||||
|
Income tax payable
|
435,099 | 203,285 | ||||||
|
Trade tax and other
|
16,071 | 15,903 | ||||||
|
Contingencies, fines and other (1)
|
61,204 | 70,449 | ||||||
|
Other
|
315,089 | 279,887 | ||||||
|
Total estimated liabilities
|
Ps. | 855,261 | Ps. | 596,872 | ||||
|
(1)
|
Includes disputes and litigations which are considered probable (50% or higher) and for which the amount can be reasonably estimated. Additionally, a contingent liability for disputes or litigations must be recorded in the balance sheet when a court takes a position against Grupo Aval or any of its subsidiaries.
|
GRUPO AVAL ACCIONES Y VALORES S.A. AND ITS SUBSIDIARIES
NOTES TO THE CONSOLIDATED FINANCIAL STATEMENTS
FOR THE YEARS ENDED DECEMBER 31, 2011, 2010 AND 2009
(
Stated in millions of Colombian pesos and U.S. dollars)
Income tax
Consolidated income tax reporting is not permitted under Colombian tax regulations and, as a result, losses incurred by any consolidated subsidiary may not be used to offset taxable income from another consolidated subsidiary. For consolidated Colombian subsidiaries, the applicable tax rate in 2011, 2010 and 2009 was 33%, for BAC Credomatic and its subsidiaries, which operate in Central America, the applicable tax rate in 2011 was 0.0% to 35%. Other income tax matters in Colombia are as follows:
|
a
|
The basis for determining income tax may not be lower than 3% of the taxpayer’s net equity after certain adjustments on the last day of the immediately preceding fiscal year.
|
|
b.
|
A special deduction equal to 40.0%, through 2009, and 30.0%, since January 2010, of all investments made in fixed assets does not represent any taxable income for shareholders or partners. According to applicable legislation, fixed assets subject to this deduction must be depreciated for tax purposes using the straight-line method and are not entitled to any audit benefit even upon complying with provisions in the tax code. Should these assets cease to be used to produce income or are divested before the end of their useful lives, fiscal revenue is recorded on recovering the proportion of the deduction corresponding to the asset’s remaining useful life when sold or otherwise transferred. Senior management considers that the assets for which such deduction was obtained to be used as part of Grupo Aval’s banking subsidiary’s normal course of business and, therefore, shall not be sold off before the end of their useful life. For this reason no provision has been set up for any possible reimbursed deductions. The special deduction was suspended since 2011
|
Income tax expense from continuing operations under Colombian Banking GAAP for the years ended December 31, 2011, 2010 and 2009 was comprised of the following components:
|
2011
|
2010
|
2009
|
||||||||||
|
Current income tax expense
|
Ps. | 1,168,598 | Ps. | 794,194 | Ps. | 863,392 | ||||||
|
Deferred income tax (benefit) expense
|
(31,850 | ) | 36,795 | 902 | ||||||||
|
Total income tax expense
|
Ps. | 1,136,748 | Ps. | 830,989 | Ps. | 864,294 | ||||||
Deferred income tax expense for the years ended December 31, 2011, 2010 and 2009 was comprised by the changes of the following components detailed in the following table:
|
2011
|
2010
|
2009
|
||||||||||
|
Temporary differences on tax assets
|
||||||||||||
|
Bankers’ acceptances, spot transactions and derivatives
|
Ps. | 38,766 | Ps. | 4,267 | Ps. | - | ||||||
|
Estimated liabilities
|
(51,687 | ) | 1,600 | (24,666 | ) | |||||||
|
Deferred charges
|
(659 | ) | (855 | ) | (72 | ) | ||||||
|
Other
|
(2,243 | ) | (64,351 | ) | (556 | ) | ||||||
|
Total temporary differences on tax assets
|
(15,823 | ) | (59,339 | ) | ( 25,294 | ) | ||||||
|
Temporary differences on tax liabilities
|
||||||||||||
|
Unrealized gains on investment securities
|
27,541 | 3,904 | 1,048 | |||||||||
|
Property, plant and equipment
|
(15,608 | ) | 14,298 | (637 | ) | |||||||
|
Bankers` acceptances, spot transactions and derivatives
|
(38,652 | ) | 5,705 | 22,363 | ||||||||
|
Deferred charges
|
(43,053 | ) | 6,701 | 985 | ||||||||
|
Pension plan liabilities
|
4,710 | 11,920 | 1,018 | |||||||||
|
Allowance for loan losses
|
12,498 | 15,314 | - | |||||||||
|
Accrued expenses
|
(10,309 | ) | 16,817 | - | ||||||||
|
Other
|
46,846 | 21,655 | 1,419 | |||||||||
|
Total temporary differences on tax liabilities
|
(16,027 | ) | 96,314 | 26,196 | ||||||||
|
Net change in temporary differences (Total income tax (benefit) expense)
|
Ps. | ( 31,850 | ) | Ps. | 36,795 | Ps. | 902 | |||||
GRUPO AVAL ACCIONES Y VALORES S.A. AND ITS SUBSIDIARIES
NOTES TO THE CONSOLIDATED FINANCIAL STATEMENTS
FOR THE YEARS ENDED DECEMBER 31, 2011, 2010 AND 2009
(
Stated in millions of Colombian pesos and U.S. dollars)
Income taxes for the years ended December 31, 2011, 2010 and 2009 are subject to review by the tax authorities. Grupo Aval’s banking subsidiaries’ management and their legal advisors believe that no significant additional liabilities could arise from such a review.
The following table presents the tax losses carry-forward and excess of presumptive income over taxable income of Grupo Aval’s subsidiaries as of December 31, 2011:
|
Expiration date
|
Carryforward losses
|
Excess of presumptive income over taxable income
|
||||||
|
2012
|
7,132 | 1,777 | ||||||
|
2013
|
102 | 3,149 | ||||||
|
2014
|
197 | 31,450 | ||||||
|
2015
|
- | 48,193 | ||||||
|
2016
|
- | 54,937 | ||||||
|
No expiration date
|
112,754 | - | ||||||
|
Total
|
Ps. | 120,185 | Ps. | 139,506 | ||||
|
(22)
|
NON-CONTROLLING INTEREST
|
Non-controlling interest as of December 31, 2011 and 2010 was originated as follows:
|
2011
|
2010
|
|||||||
|
Banco de Bogotá
and its subsidiaries
|
Ps. | 4,031,852 | Ps. | 2,726,224 | ||||
|
Banco de Occidente
and its subsidiaries
|
561,147 | 540,499 | ||||||
|
Banco Comercial AV Villas
and its subsidiaries
|
192,125 | 168,806 | ||||||
|
Banco Popular
and its subsidiaries (*)
|
141,905 | 1,039,966 | ||||||
|
Total non-controlling interest
|
Ps. | 4,927,029 | Ps. | 4,475,495 | ||||
(*) On September 2011 Grupo Aval increased its ownership interests in Banco Popular by 63.07%, through the Escisión Process described before (see note 1 (c) for more details).
|
(23)
|
SHAREHOLDERS’ EQUITY
|
Authorized, issued and outstanding shares as of December 31, 2011, 2010 and 2009 consisted of the following:
|
2011
|
2010
|
2009
|
||||||||||
|
Authorized shares
|
120,000,000,000 | 120,000,000,000 | 120,000,000,000 | |||||||||
|
Subscribed fully paid shares
|
18,551,299,996 | 13,943,980,671 | 13,943,980,671 | |||||||||
|
Subscribed but pending to be paid shares
|
466,457 | 1,652 | 1,652 | |||||||||
|
Total outstanding shares
|
18,551,766,453 | 13,943,982,323 | 13,943,982,323 | |||||||||
|
The outstanding shares are as follows:
|
||||||||||||
|
Common voting shares (1)
|
13,806,691,240 | 13,943,982,323 | 13,943,982,323 | |||||||||
|
Preferred non-voting shares (2)
|
4,745,075,213 | - | - | |||||||||
GRUPO AVAL ACCIONES Y VALORES S.A. AND ITS SUBSIDIARIES
NOTES TO THE CONSOLIDATED FINANCIAL STATEMENTS
FOR THE YEARS ENDED DECEMBER 31, 2011, 2010 AND 2009
(
Stated in millions of Colombian pesos and U.S. dollars)
|
(1)
|
Since 2011, Grupo Aval allows its shareholders to convert their common shares into preferred shares. During 2011, 63 petitions were approved to convert 137,291,083 common shares into preferred shares.
|
|
(2)
|
On May 12, 2011, Grupo Aval completed an offering of 1,600,000,000 preferred shares, raising an aggregate amount of Ps 2.1 trillion (US$1.1 billion equivalent to Ps. 1,300 or US$0.72 per share (at the representative market rate at such date) before deducting brokerage commissions and discounts, and expenses of the offering. Additionally, 3,007,784,133 preferred shares were issued in connection with the Escicion agreement with Rendifin S.A., Inversiones Escorial S.A. and Popular Securities S.A. ´s shareholders (see note 1 (c) for more details).
|
Appropriated retained earnings
Appropriated retained earnings, as of December 31, 2011, 2010 and 2009 consisted of the following:
|
2011
|
2010
|
2009
|
||||||||||
|
Legal reserve
|
Ps. | 6,972 | Ps. | 6,972 | Ps. | 6,972 | ||||||
|
Statutory and voluntary reserves
|
2,325,058 | 1,923,354 | 1,259,053 | |||||||||
|
Total
|
Ps. | 2,332,030 | Ps. | 1,930,326 | Ps. | 1,266,025 | ||||||
Retained earnings
Legal reserves
In accordance with applicable legal requirements, Grupo Aval and its banking subsidiaries must create a legal reserve through the allocation of 10% of the liquid earnings of each fiscal period up to the amount of 50% of subscribed social capital. This reserve may be reduced to less than 50% of subscribed social capital for purposes of amortization loss of excess retained earnings. The legal reserve may not be reduced to less than the indicated percentage, except to cover losses in excess of undistributed earnings.
Statutory and voluntary reserves
Statutory and voluntary reserves are determined by the shareholders in their semi-annual meetings.
Equity inflation adjustments
Since January 1992 to December 2000, Grupo Aval and its consolidated banking subsidiaries’ financial statements were subject to inflation adjustments. The cumulative effect of such adjustments in non-monetary assets and liabilities is included in each of the adjusted accounts, and the adjustments on the equity accounts are included in the “equity inflation adjustments” line item. . According to Law 1111 of 2006, all entities subject of the “equity tax” are allowed to charge those taxes against the “equity inflation adjustments” and not charge them in the consolidated statements of income. During 2011, 2010 and 2009, the amount of this account decreased due to a payment of the “equity tax” mandated by law
Dividends declared
The consolidated financial statements are prepared for the presentation to the shareholders, but are not taken as a basis for the distribution of dividends or appropriation of profits. Dividends are distributed based on Grupo Aval’s unconsolidated financial statements.
Grupo Aval declares dividends on a semiannual basis. Dividends are declared and paid to shareholders based on the adjusted unconsolidated net income from the previous semester. The dividends were paid as follows:
GRUPO AVAL ACCIONES Y VALORES S.A. AND ITS SUBSIDIARIES
NOTES TO THE CONSOLIDATED FINANCIAL STATEMENTS
FOR THE YEARS ENDED DECEMBER 31, 2011, 2010 AND 2009
(
Stated in millions of Colombian pesos and U.S. dollars)
|
2012
|
2011
|
2010
|
|||||||||||||
|
Unconsolidated earnings from first semester
|
Ps. | - | Ps. | 582,658 | Ps. | 462,954 | |||||||||
|
Unconsolidated earnings from second semester
|
Ps. | - | Ps. | 667,562 | Ps. | 464,280 | |||||||||
|
Dividends in cash (in Colombian pesos)
|
Ps. 21.60 per ordinary and preferred shares payable in six installments of Ps. 3.60 per share since April 2012, based on second semester net income of 2011.
|
Ps. 19.50 per share payable in six installments of Ps. 3.25 per share since April 2011 based on second semester net income of 2010.
Ps 21.00 per share payable in six installments of Ps. 3.50 per share from October 2011, based on first semester net income of 2010.
|
Ps. 17.10 per share payable in six installments of Ps. 2.85 per share since April 2010, based on second semester net income of 2009.
Ps. 18.30 per share payable in six installments of Ps. 3.05 from October 2010, based on first semester net income of 2010.
|
||||||||||||
|
Common shares outstanding
|
13,806,691,240 | 13,943,982,323 | 13,943,982,323 | ||||||||||||
|
Preferred shares issued on April 2011
|
4,745,075,213 | 3,673,115,007 | - | ||||||||||||
|
Total dividends declared
|
Ps. | 702,509 | Ps. | 488,834 | |||||||||||
|
Dividends payable at December 31
|
Ps. | 377,815 | Ps. | 467,457 | |||||||||||
The amount of dividends payable at December 31 of each year is recorded as an account payable in the consolidated balance sheets.
|
(24)
|
MEMORANDUM ACCOUNTS
|
Memorandum accounts as of December 31, 2011 and 2010 are broken as follows:
| 2011 | 2010 | |||||||
|
Trusts:
|
||||||||
|
Investment funds and assets from third parties held in trusts
|
Ps. | 38,303,116 | Ps. | 38,489,292 | ||||
|
Commitments receivable:
|
||||||||
|
Securities transferred in repos and simultaneous transactions
|
2,856,345 | 1,849,390 | ||||||
|
Interests on loans
|
273,928 | 311,822 | ||||||
|
Rights in options
|
1,150,702 | 262,517 | ||||||
|
Lease rents receivable
|
7,330,035 | 4,551,827 | ||||||
|
Call options receivable
|
385,309 | 242,035 | ||||||
|
Other
|
1,148,760 | 638,129 | ||||||
|
Total commitments receivable
|
13,145,079 | 7,855,720 | ||||||
|
Commitments payable:
|
||||||||
|
Unused credit card limits
|
9,538,766 | 8,859,929 | ||||||
|
Civil demands against the bank
|
646,367 | 559,576 | ||||||
|
Issued and confirmed letters of credit
|
638,059 | 513,624 | ||||||
|
Unused lines of credit
|
2,807,012 | 2,734,299 | ||||||
|
Bank guarantees
|
1,906,647 | 1,718,111 | ||||||
|
Approved credits not disbursed
|
2,013,505 | 1,573,556 | ||||||
|
Other
|
2,190,532 | 741,988 | ||||||
|
Total commitments payable
|
19,740,888 | 16,701,083 | ||||||
|
Total commitments accounts:
|
32,885,967 | 24,556,803 | ||||||
GRUPO AVAL ACCIONES Y VALORES S.A. AND ITS SUBSIDIARIES
NOTES TO THE CONSOLIDATED FINANCIAL STATEMENTS
FOR THE YEARS ENDED DECEMBER 31, 2011, 2010 AND 2009
(
Stated in millions of Colombian pesos and U.S. dollars)
|
Memorandum accounts in favor:
|
||||||||
|
Tax value of assets
|
81,482,930 | 68,695,403 | ||||||
|
Assets and securities given in custody
|
6,312,275 | 6,965,264 | ||||||
|
Assets and securities given as a collateral
|
444,257 | 691,352 | ||||||
|
Trading investments in debt securities
|
3,354,678 | 3,676,762 | ||||||
|
Written-off assets
|
3,997,275 | 3,506,577 | ||||||
|
Investments held to maturity
|
3,019,305 | 2,948,339 | ||||||
|
Adjustments for inflation of assets
|
163,523 | 290,813 | ||||||
|
Investments available for the sale in debt securities
|
6,686,579 | 7,341,154 | ||||||
|
Amortized debt securities investment
|
1,829,104 | 1,622,752 | ||||||
|
Other
|
74,269,352 | 55,835,081 | ||||||
|
Total memorandum accounts in favor
|
181,559,278 | 151,573,497 | ||||||
|
Memorandum accounts against:
|
||||||||
|
Assets and securities received as collateral
|
47,129,540 | 40,240,499 | ||||||
|
Loans plus interest receivable on loans
|
70,229,105 | 58,794,241 | ||||||
|
Assets and securities received in custody
|
7,608,787 | 7,975,720 | ||||||
|
Tax value of shareholders’ equity
|
14,085,921 | 11,518,681 | ||||||
|
Adjustment for inflation of equity
|
10,947,042 | 5,501,792 | ||||||
|
Merchandise in owned warehouses
|
1,880,832 | 1,621,572 | ||||||
|
Other
|
9,317,114 | 6,945,561 | ||||||
|
Total memorandum accounts against
|
161,198,341 | 132,598,066 | ||||||
|
Total memorandum accounts
|
342,757,619 | 284,171,563 | ||||||
|
Total assets in trusts, commitment and memorandum accounts
|
Ps. | 413,946,702 | Ps. | 347,217,658 |
|
(25)
|
ADMINISTRATIVE AND OTHER EXPENSES
|
Administrative and other expenses for the years ended December 31, 2011, 2010 and 2009 consisted of the following:
|
2011
|
2010
|
2009
|
||||||||||
|
Professional fees
|
Ps. | 132,561 | Ps. | 91,289 | Ps. | 70,580 | ||||||
|
Taxes other than income
|
488,124 | 324,654 | 322,496 | |||||||||
|
Rent
|
183,931 | 130,617 | 126,023 | |||||||||
|
Contributions and membership fees
|
171,881 | 110,740 | 101,537 | |||||||||
|
Insurance
|
36,623 | 30,483 | 25,285 | |||||||||
|
Maintenance and repairs
|
190,448 | 155,987 | 94,306 | |||||||||
|
Amortization of deferred charges
|
181,881 | 117,705 | 87,967 | |||||||||
|
Cleaning and security services
|
113,653 | 73,296 | 69,807 | |||||||||
|
Temporary services
|
128,829 | 104,323 | 103,775 | |||||||||
|
Public relationship
|
172,971 | 124,706 | 126,004 | |||||||||
|
Utilities
|
203,253 | 154,553 | 145,191 | |||||||||
|
Transport services
|
122,789 | 101,884 | 97,340 | |||||||||
|
Operating costs of non-financial sector
|
21,238 | 18,639 | 21,528 | |||||||||
|
Others
|
328,597 | 278,210 | 283,429 | |||||||||
|
Total
|
Ps. | 2,476,779 | Ps. | 1,817,086 | Ps. | 1,675,268 | ||||||
GRUPO AVAL ACCIONES Y VALORES S.A. AND ITS SUBSIDIARIES
NOTES TO THE CONSOLIDATED FINANCIAL STATEMENTS
FOR THE YEARS ENDED DECEMBER 31, 2011, 2010 AND 2009
(
Stated in millions of Colombian pesos and U.S. dollars)
|
(26)
|
NON-OPERATING INCOME (EXPENSES)
|
The following table summarizes the components of non-operating income and expenses for the years ended December 31, 2011, 2010 and 2009 of Grupo Aval’s banking subsidiaries´:
|
Year ended December 31
|
||||||||||||
|
2011
|
2010
|
2009
|
||||||||||
|
Non-operating income:
|
||||||||||||
|
Gain on sale of foreclosed assets
|
Ps. | 20,687 | Ps. | 34,733 | Ps. | 6,540 | ||||||
|
Gain on sale of property, plant and equipment
|
23,388 | 19,777 | 17,214 | |||||||||
|
Recoveries of other provisions
|
165,987 | 211,569 | 208,532 | |||||||||
|
Other
|
110,678 | 98,476 | 135,101 | |||||||||
|
Total non-operating income
|
320,740 | 364,555 | 367,387 | |||||||||
|
Non-operating (expenses):
|
||||||||||||
|
Loss on sale of property, plant and equipment
|
(2,375 | ) | (258 | ) | (6,290 | ) | ||||||
|
Indemnities
|
(4,245 | ) | (2,452 | ) | (2,559 | ) | ||||||
|
Penalties
|
(14,095 | ) | (43,947 | ) | (74,154 | ) | ||||||
|
Others (1)
|
( 103,801 | ) | (140,964 | ) | ( 216,714 | ) | ||||||
|
Total non-operating (expenses)
|
(124,516 | ) | (187,621 | ) | ( 299,717 | ) | ||||||
|
Total non-operating income (expenses), net
|
Ps. | 196,224 | Ps. | 176,934 | Ps. | 67,670 | ||||||
|
(1)
|
Other non-operating expenses include, among other accounts “Other provisions” in 2011, 2010 and 2009 for Ps. 99,020, Ps. 22,464 and Ps. 69,254, part of which are recovered during the same year and included in the “recoveries of other provisions” account, as part of total Non-operating income.
|
|
(27)
|
RELATED PARTY TRANSACTIONS
|
Related parties are considered to be Grupo Aval’s main shareholders, members of the board of directors and related companies in which Grupo Aval holds an interest of 10% or more of total equity, or where it holds common transactions. It also considers investments in which Grupo Aval’s shareholders or members of the board of directors hold an interest of 10% or more of total equity. Grupo Aval’s banking subsidiaries have loans outstanding with, and deposits from, their Officers all reflecting current fair market conditions.
Shareholders
Significant balances and transactions with shareholders as of December 31, 2011 and 2010 were as follows:
|
2011
|
2010
|
|||||||
|
Borrowings from banks and other:
|
||||||||
|
Adminegocios y Cia. S.A.
|
Ps. | 343,704 | Ps. | 195,070 | ||||
|
Rendifin S.A.
|
789,716 | 985,106 | ||||||
|
Bienes y comercio S.A.
|
310,700 | 271,000 | ||||||
|
Total borrowings from banks and other
|
Ps. | 1,444,120 | Ps. | 1,451.176 | ||||
GRUPO AVAL ACCIONES Y VALORES S.A. AND ITS SUBSIDIARIES
NOTES TO THE CONSOLIDATED FINANCIAL STATEMENTS
FOR THE YEARS ENDED DECEMBER 31, 2011, 2010 AND 2009
(
Stated in millions of Colombian pesos and U.S. dollars)
These obligations have a five-year maturity and bear interest rate of DTF + 3.0%
|
2011
|
2010
|
|||||||
|
Accrued interest payable:
|
||||||||
|
Adminegocios y Cia. S.A.
|
Ps. | 3,750 | Ps. | 2,008 | ||||
|
Rendifin S.A.
|
8,096 | 6,780 | ||||||
|
Bienes y comercio S.A.
|
3,062 | 2,153 | ||||||
|
Total accrued interest payable
|
Ps. | 14,908 | Ps. | 10,941 | ||||
|
Accounts payable: (1)
|
||||||||
|
Adminegocios y Cia. S.A.
|
Ps. | 45,260 | Ps. | 39,441 | ||||
|
Rendifin S.A.
|
5,386 | 3,192 | ||||||
|
Actiunidos S.A.
|
35,986 | 25,069 | ||||||
|
Total accounts payable
|
Ps. | 86,632 | Ps. | 67,702 | ||||
|
(1)
|
Accounts payable includes dividends payable by Grupo Aval to Adminegocios y Cia. S.A. and Actiunidos S.A.
|
Grupo Aval’s financial obligation with related parties generated an interest expense for Ps. 100,094 and Ps. 23.050 for 2011 and 2010, respectively.
Members of the Board of Directors:
The balances of the transactions with members of the board of directors as of December 31, 2011 and 2010 were as follows:
|
2011
|
2010
|
|||||||
|
Fees
|
Ps. | 170 | Ps. | 167 | ||||
|
(28)
|
SUBSEQUENT EVENTS
|
February 1, 2012:
Grupo Aval through its subsidiary in the Cayman Islands, Grupo Aval Limited, issued five-year bonds for US$ 600 million in the international market pursuant to Rule 144A and Regulation S under the United States Securities Act of 1933 with a coupon of 5.25% at 99.458% of its nominal value.
|
(29)
|
PARENT COMPANY INFORMATION
|
Following are the condensed unconsolidated balance sheets of Grupo Aval Acciones y Valores S.A., at December 31, 2011 and 2010, related condensed unconsolidated statements of income and cash flows for the fiscal years ended December 31, 2011, 2010 and 2009 under Colombian Banking GAAP. Grupo Aval Acciones y Valores S.A. also prepares unconsolidated financial statements under Colombian GAAP, which differs in certain respects from Colombian Banking GAAP. The unconsolidated financial statements of Grupo Aval Acciones y Valores, S.A. are the basis for distribution of dividends.
GRUPO AVAL ACCIONES Y VALORES S.A. AND ITS SUBSIDIARIES
NOTES TO THE CONSOLIDATED FINANCIAL STATEMENTS
FOR THE YEARS ENDED DECEMBER 31, 2011, 2010 AND 2009
(
Stated in millions of Colombian pesos and U.S. dollars)
|
Condensed Unconsolidated Balance Sheets
|
2011
|
2010
|
||||||
|
Assets
|
||||||||
|
Cash and cash equivalents
|
Ps. | 1,589,888 | Ps. | 11,330 | ||||
|
Investment securities
|
- | 26,275 | ||||||
|
Investments in subsidiaries
|
17,268,697 | 16,903,814 | ||||||
|
Reappraisal of investments in subsidiaries
|
34,916 | 33,357 | ||||||
|
Other assets
|
666,130 | 546,507 | ||||||
|
Total assets
|
Ps. | 19,559,631 | Ps. | 17,521,283 | ||||
|
Liabilities and shareholders’ equity
|
||||||||
|
Borrowings from related parties
|
Ps. | 1,444,120 | Ps. | 1,451,176 | ||||
|
Accrued expenses and other liabilities
|
330,067 | 217,601 | ||||||
|
Bonds
|
944,700 | 1,044,700 | ||||||
|
Total liabilities
|
2,718,887 | 2,713,477 | ||||||
|
Shareholders’ equity
|
16,840,744 | 14,807,806 | ||||||
|
Total liabilities and shareholders’ equity
|
Ps. | 19,559,631 | Ps. | 17,521,283 | ||||
|
Condensed Unconsolidated Statements of Income
|
2011
|
2010
|
2009
|
|||||||||
|
Income
|
||||||||||||
|
Dividends received from subsidiaries
|
Ps. | 629,032 | Ps. | 492,543 | Ps. | 455,088 | ||||||
|
Interest on investment securities
|
60.857 | 13,116 | 7,669 | |||||||||
|
Other income
|
14.416 | 20,899 | 12,221 | |||||||||
|
Total income
|
704,305 | 526,558 | 474,978 | |||||||||
|
Expense
|
||||||||||||
|
Interest on borrowed funds
|
176,405 | 91,167 | 99,304 | |||||||||
|
Non- interest expense
|
103,966 | 49,549 | 52,737 | |||||||||
|
Total expense
|
280,371 | 140,716 | 152,041 | |||||||||
|
Income before income taxes
|
423,934 | 385,842 | 322,937 | |||||||||
|
Income tax expense
|
7,691 | 2,543 | 1,678 | |||||||||
|
Net income
|
Ps. | 416.243 | Ps. | 383,299 | Ps. | 321,259 | ||||||
|
Condensed Unconsolidated Statements of Cash flows
|
||||||||||||
|
2011
|
2010
|
2009
|
||||||||||
|
Net income
|
Ps. | 416,243 | Ps. | 383,299 | Ps. | 321,259 | ||||||
|
Adjustments to reconcile net income to net cash used by operating activities
|
(88,896 | ) | 22,296 | (56,698 | ) | |||||||
|
Net cash provided by operating activities
|
327,347 | 405,595 | 264,561 | |||||||||
|
Net cash (used in) provided by investing activities
|
(91,366 | ) | (1,387,698 | ) | 1,993 | |||||||
|
Net cash (used in) provided by financing activities
|
1,342,577 | 734,709 | (64,029 | ) | ||||||||
|
Increase (decrease) in cash and cash equivalents
|
1,578,558 | (247,394 | ) | 202,525 | ||||||||
|
Cash and cash equivalents at beginning of year
|
11,330 | 258,724 | 56,199 | |||||||||
|
Cash and cash equivalents at end of year
|
1,589,888 | 11,330 | 258,724 | |||||||||
|
Non cash transactions – acquisitions of non-controlling interest by issuance of preferred shares
|
Ps. | 948,871 | Ps. | - | Ps. | - | ||||||
GRUPO AVAL ACCIONES Y VALORES S.A. AND ITS SUBSIDIARIES
NOTES TO THE CONSOLIDATED FINANCIAL STATEMENTS
FOR THE YEARS ENDED DECEMBER 31, 2011, 2010 AND 2009
(
Stated in millions of Colombian pesos and U.S. dollars)
|
a)
|
Basis of presentation
|
The accompanying condensed unconsolidated financial statements have been prepared in accordance with Colombian Banking GAAP. Certain information and footnote disclosures normally included in financial statements prepared in accordance with Colombian Banking GAAP have been condensed or omitted.
Under Colombian Banking GAAP and for presentation purposes of Grupo Aval parent-only financial information, investments in subsidiaries are initially classified as available for sale and recognized at either their acquisition cost or daily market prices depending on their liquidity and marketability. On August 24, 2009, the Superintendency of Finance established the following stock valuation method:
|
1.
|
Listed equity securities, issued and traded in Colombia
|
Securities are valued daily based on prices published by authorized entities (i.e., the Colombian Stock Exchange). In the absence of a price calculated for the day on which these securities are appraised, the last known valuation price is to be used. In the case of a listed equity security not reporting any trades on the secondary market as of its issue date, and for which there is no indicated market price for its primary issue, it should be appraised based on the guidelines stipulated below.
|
2.
|
Non-listed equity securities, issued and traded in Colombia
|
Securities are valued based on acquisition cost which is later increased or decreased depending upon the investor’s percentage stake in all subsequent changes in the issuer’s shareholders’ equity. For this purpose, the issuer’s shareholders’ equity is calculated based on audited financial statements at the cut-off dates of June 30 and December 31 of each year. However, when more recent audited financial statements are released, those may be used. Entities have a maximum allowed time of three months, subsequent to the cut-off date of the financial statements, to update the valuations of their investments.
Depending on their liquidity levels, equity securities were valued as follows:
- High-liquidity equity securities: based on the last daily average trade-weighted price published by the Colombian Stock Exchange.
- Medium-liquidity equity securities: based on the average price published by the Colombian Stock Exchange, which corresponded to the average trade-weighted price for the last five days on which such securities were traded.
- Low-liquidity equity securities or those not listed on a stock exchange: based on the increase or decrease of an investor’s percentage stake in the issuers’ shareholders’ equity updated using the latest audited financial statements released by the issuer.'
The consolidated financial statements footnote disclosures contain supplemental information relating to the operations of the Company, as such, these financial statements should be read in conjunction with the notes to the consolidated financial statements of Grupo Aval.
Assets, liabilities, income and expenses items are recorded based on the currency of the primary economic environment in which each entity operates (“the functional currency”). For the Company the functional currency is the Colombian peso.
|
b)
|
Commitments and contingencies
|
In the normal course of business, certain subsidiaries of Grupo Aval are defendants in various tax and legal proceedings. Grupo Aval is not aware of any pending legal proceedings which could have a significant effect on its financial position or the results of its operations.
GRUPO AVAL ACCIONES Y VALORES S.A. AND ITS SUBSIDIARIES
NOTES TO THE CONSOLIDATED FINANCIAL STATEMENTS
FOR THE YEARS ENDED DECEMBER 31, 2011, 2010 AND 2009
(
Stated in millions of Colombian pesos and U.S. dollars)
|
c)
|
Investment in subsidiaries
|
Investment in subsidiaries at December 31 comprises the following:
|
2011
|
2010
|
|||||||||||||||||||||||
|
Subsidiary
|
Participation
|
Value per share (in pesos)
|
Value
|
Participation
|
Value per share (in pesos)
|
Value
|
||||||||||||||||||
|
Banco de Bogotá S.A.
|
64.44 | % | 49,000 | (1) | Ps. | 9,056,248 | 65.33 | % | 57,900 | (1) | Ps. | 9,010,702 | ||||||||||||
|
Banco de Occidente S.A. (3)
|
68.24 | % | 29,274 | (1) | 3,106,465 | 67.97 | % | 37,531 | (1) | 3,822,613 | ||||||||||||||
|
Banco Popular S.A. (4)
|
93.73 | % | 520 | (1) | 3,766,168 | 30.66 | % | 560 | (1) | 1,326,156 | ||||||||||||||
|
Banco Comercial AV Villas S.A.
|
79.85 | % | 24,525 | (1) | 1,224,004 | 79.85 | % | 21,316 | (1) | 1,299,796 | ||||||||||||||
|
Fondo de Pensiones y Cesantías Porvenir S.A.
|
20.00 | % | 6,068 | (2) | 89,146 | 20.00 | % | 5,262 | (2) | 70,463 | ||||||||||||||
|
Banco de Bogotá S.A. Convertible bonds (5)
|
- | 1,374,084 | ||||||||||||||||||||||
|
Banco Popular Escición
|
26,561 | - | ||||||||||||||||||||||
|
Rights under trust agreements
|
105 | - | ||||||||||||||||||||||
| Ps. | 17,268,697 | Ps. | 16,903,814 | |||||||||||||||||||||
|
(1)
|
Market value
|
|
(2)
|
Book value
|
|
(3)
|
On September 22, 2011, Banco de Occidente raised Ps 200,000 million (US$106 million) in an equity offering of 6,060,606 ordinary shares. Grupo Aval subscribed for Ps 149,639 million (US$80 million) of shares, and its ownership in Banco de Occidente increased slightly from 67.97% at December 31, 2010 to 68.24% at December 31, 2011.
|
|
(4)
|
On September 2011 Grupo Aval increased its ownership interests in Banco Popular by 63.07%, through the Escisión Process made with Rendifin S.A., Inversiones Escorial S.A. and Popular Securities S.A.
|
|
(5)
|
Bonds convertible into 29,205,151 shares of Banco de Bogotá.
|
|
d)
|
Bonds
|
Bonds at December 31 comprise the following:
|
Amounts outstanding
|
||||||||||||||
|
Issuance date
|
Tranches
|
Maturity
|
Coupon rate
|
2011
|
2010
|
|||||||||
|
December, 2009
|
Ps. | 105,500 |
December, 2014
|
CPI + 3.69%
|
Ps. | 105,500 | Ps. | 105,500 | ||||||
| 114,670 |
December, 2016
|
CPI + 4.49%
|
114,670 | 114,670 | ||||||||||
| 279,560 |
December, 2019
|
CPI + 4.84%
|
279,560 | 279,560 | ||||||||||
| 124,520 |
December, 2024
|
CPI + 5.20%
|
124,520 | 124,520 | ||||||||||
| 125,750 |
December, 2012
|
DTF + 1.14%
|
125,750 | 125,750 | ||||||||||
|
October, 2005
|
100,000 |
October, 2011
|
CPI + 2.63%
|
- | 100,000 | |||||||||
| 100,000 |
October, 2015
|
CPI + 3.37%
|
100,000 | 100,000 | ||||||||||
|
April, 2005
|
94,700 |
April, 2012
|
CPI + 5.60%
|
94,700 | 94,700 | |||||||||
|
Total bonds
|
Ps. | 944,700 | Ps. | 1,044,700 | ||||||||||
GRUPO AVAL ACCIONES Y VALORES S.A. AND ITS SUBSIDIARIES
NOTES TO THE CONSOLIDATED FINANCIAL STATEMENTS
FOR THE YEARS ENDED DECEMBER 31, 2011, 2010 AND 2009
(
Stated in millions of Colombian pesos and U.S. dollars)
The scheduled maturities of bonds as of December 31, 2011 are as follows:
|
2012
|
Ps. | 220,450 | ||
|
2013
|
- | |||
|
2014
|
105,500 | |||
|
2015
|
100,000 | |||
|
2016
|
114,670 | |||
|
2017 and thereafter
|
404,080 | |||
|
Total
|
Ps. | 944,700 |
|
(30)
|
DIFFERENCES BETWEEN COLOMBIAN ACCOUNTING PRINCIPLES FOR GRUPO AVAL AND SUPPLEMENTAL DISCLOSURE REQUIRED BY U.S. GAAP
|
Grupo Aval’s Consolidated Financial Statements have been prepared in accordance with Colombian Banking GAAP. See Note 2 to the Consolidated Financial Statements. These principles and regulations differ in certain significant respects from generally accepted accounting principles in the United States of America (“U.S. GAAP”). The principal differences between Colombian Banking GAAP and U.S. GAAP and the effect on consolidated net income and consolidated shareholders’ equity attributable to Grupo Aval are presented below, with an explanation of the adjustments.
Reconciliation of Consolidated Net Income:
The table below presents the reconciliation of consolidated net income per Colombian Banking GAAP to consolidated net income under U.S. GAAP attributable to Grupo Aval for the years ended December 31, 2011, 2010 and 2009:
| 2011(1) | 2010(1) | 2009 | ||||||||||
|
Net income attributable to controlling interest under Colombian Banking GAAP
|
Ps. | 1,291,226 | Ps. | 956,850 | Ps. | 1,065,377 | ||||||
|
Pre-1992 inflation adjustment to fixed assets (2)
|
(7,351 | ) | (10,043 | ) | (2,959 | ) | ||||||
|
Net income attributable to controlling interest under Colombian Banking GAAP after pre-1992 inflation adjustment
|
1,283,875 | 946,807 | 1,062,418 | |||||||||
|
U.S. GAAP adjustments:
|
||||||||||||
|
a) Income taxes:
|
||||||||||||
|
1)
Deferred income taxes
|
(21,286 | ) | (53,915 | ) | (76,431 | ) | ||||||
|
2)
Uncertainty in income taxes
|
(26,884 | ) | (8,446 | ) | (12,895 | ) | ||||||
|
b) Employee benefit plans
|
11,353 | (17,890 | ) | (5,003 | ) | |||||||
|
c) Fixed assets
|
22,695 | 34,594 | 36,397 | |||||||||
|
d) Reappraisal of assets
|
- | - | - | |||||||||
|
e) Allowance for loans, lease losses and foreclosed assets
|
40,565 | 64,264 | 60,302 | |||||||||
|
f) Loan origination fees and costs
|
9,302 | 30,833 | 6,800 | |||||||||
|
g) Interest recognition on non-accrual loans
|
(266 | ) | (2,447 | ) | (1,549 | ) | ||||||
|
h) Deferred charges and other assets:
|
||||||||||||
|
1)
Deferred charges
|
(23,351 | ) | (21,535 | ) | (12,373 | ) | ||||||
|
2)
Other assets
|
210 | 4,078 | 2,520 | |||||||||
|
i) Investment securities and derivatives:
|
||||||||||||
|
1)
Investment securities
|
(328,541 | ) | 323,986 | 24,741 | ||||||||
|
2)
Derivatives
|
(2,082 | ) | 1,168 | (2,122 | ) | |||||||
|
j) Investments in unaffiliated companies
|
123,535 | (364,690 | ) | (470,475 | ) | |||||||
|
k) Investments in affiliated companies
|
26,454 | (4,803 | ) | 11,175 | ||||||||
|
l) Lessor accounting
|
2,806 | (3,477 | ) | 2,239 | ||||||||
|
m) Business combinations
|
(66,161 | ) | (6,593 | ) | 32,466 | |||||||
|
n) Non-controlling interest
|
263,496 | 61,110 | 298,865 | |||||||||
|
o) Guarantees and contingencies
|
25,516 | (7,359 | ) | (427 | ) | |||||||
|
p) Equity tax
|
(483,741 | ) | (1,220 | ) | (10,842 | ) | ||||||
GRUPO AVAL ACCIONES Y VALORES S.A. AND ITS SUBSIDIARIES
NOTES TO THE CONSOLIDATED FINANCIAL STATEMENTS
FOR THE YEARS ENDED DECEMBER 31, 2011, 2010 AND 2009
(
Stated in millions of Colombian pesos and U.S. dollars)
| 2011(1) | 2010(1) | 2009 | ||||||||||
|
q) Securitizations
|
- | (6,382 | ) | (1,386 | ) | |||||||
|
r) Variable interest entities
|
(5,351 | ) | 35,823 | (23,820 | ) | |||||||
|
s) Consolidation
|
- | - | (2,274 | ) | ||||||||
|
t) Cumulative translation adjustment
|
33,198 | (38,587 | ) | 16,223 | ||||||||
|
Net income attributable to controlling interest under U.S. GAAP
|
885,342 | 965,319 | 934,549 | |||||||||
|
Net income attributable to non-controlling interest under U.S. GAAP
|
816,747 | 813,122 | 752,631 | |||||||||
|
Net income under U.S. GAAP
|
Ps. | 1,702,089 | Ps. | 1,778,441 | Ps. | 1,687,180 | ||||||
|
(1)
|
Includes the result for the year ended December 31, 2011 and one month period ended December 31, 2010 related with BAC Credomatic acquisition.
|
|
(2)
|
Inflation adjustment to fixed assets
|
Non-monetary assets (e.g., property, plant and equipment, equity investments, etc.) of Grupo Aval under Colombian Banking GAAP were adjusted for inflation based on the variation in the IPC for middle income-earners, on a prospective basis from January 1, 1992, to December 31, 2000, when under Colombian Banking GAAP the country was no longer considered a highly inflationary economy.
Colombia had been considered a highly inflationary country since the 1960’s, therefore, the adjustment is related to property, plant and equipment purchased before January 1, 1992. This adjustment recognizes the portion of inflation accumulated before this date, less the associated accumulated depreciation which would have been reported, with the purpose of presenting financial statements on a constant currency basis. The remaining accumulated pre-1992 inflation effect in fixed assets to be amortized in future years is not considered material.
|
ii)
|
Reconciliation of Consolidated Shareholders’ Equity:
|
The table below presents the reconciliation of the Consolidated Shareholders’ Equity per Colombian Banking GAAP to the Consolidated Shareholders’ Equity under U.S. GAAP attributable to Grupo Aval for the years ended December 31, 2011 and 2010:
| 2011 | 2010 | |||||||
|
Shareholders’ equity attributable to controlling interest under Colombian Banking GAAP
|
Ps. | 8,159,126 | Ps. | 4,554,555 | ||||
|
Pre-1992 inflation adjustment to fixed assets (1)
|
265,435 | 272,786 | ||||||
|
Shareholders’ equity attributable to controlling interest under Colombian Banking GAAP after pre-1992 inflation adjustment to fixed assets
|
8,424,561 | 4,827,341 | ||||||
|
U.S. GAAP Adjustments:
|
||||||||
|
a) Income taxes:
|
||||||||
|
1) Deferred income taxes
|
(257,723 | ) | (281,201 | ) | ||||
|
2) Uncertainty in income taxes
|
(59,233 | ) | (30,189 | ) | ||||
|
b) Employee benefit plans
|
(255,481 | ) | (247,120 | ) | ||||
|
c) Fixed assets
|
179,695 | 157,000 | ||||||
|
d) Reappraisal of assets
|
(1,019,561 | ) | (707,794 | ) | ||||
|
e) Allowance for loans, lease losses and foreclosed assets
|
452,707 | 412,142 | ||||||
|
f) Loan origination fees and costs
|
147,933 | 138,631 | ||||||
|
g) Interest recognition on non-accrual loans
|
11,307 | 11,573 | ||||||
|
h) Deferred charges and other assets:
|
||||||||
|
1) Deferred charges
|
(106,932 | ) | (83,581 | ) | ||||
|
2) Other assets
|
(9,477 | ) | (9,686 | ) | ||||
|
i) Investment securities and derivatives:
|
||||||||
|
1)
Investment securities
|
8,359 | 317,395 | ||||||
|
2) Derivatives
|
(2,351 | ) | (269 | ) | ||||
|
j) Investments in unaffiliated companies
|
25,546 | 91,553 | ||||||
|
k) Investments in affiliates companies
|
(207,492 | ) | 18,713 | |||||
|
l) Lessor accounting
|
8,535 | 5,729 | ||||||
|
m) Business combinations
|
(213,913 | ) | (178,326 | ) | ||||
|
n) Non-controlling interest
|
15,842 | (552,643 | ) | |||||
|
o) Guarantees and contingencies
|
21,996 | (5,679 | ) | |||||
GRUPO AVAL ACCIONES Y VALORES S.A. AND ITS SUBSIDIARIES
NOTES TO THE CONSOLIDATED FINANCIAL STATEMENTS
FOR THE YEARS ENDED DECEMBER 31, 2011, 2010 AND 2009
(
Stated in millions of Colombian pesos and U.S. dollars)
|
2011
|
2010 | |||||||
|
p) Equity tax
|
(477,368 | ) | - | |||||
|
q) Securitization
|
2 | 2 | ||||||
|
r) Variable interest entities
|
26,560 | 65,936 | ||||||
|
s) Consolidation
|
- | - | ||||||
|
t) Cumulative translation adjustment
|
3,194 | - | ||||||
|
u) Receivables for issuance of equity
|
(250,031 | ) | - | |||||
|
Controlling interest shareholders’ equity under U.S. GAAP
|
6,466,675 | 3,949,527 | ||||||
|
Non-controlling interest under U.S. GAAP
|
4,151,724 | 5,068,818 | ||||||
|
Total shareholders’ equity under U.S. GAAP
|
Ps. | 10,618,399 | Ps. | 9,018,345 | ||||
|
(1)
|
Inflation adjustment to fixed assets
|
Non-monetary assets (e.g., property, plant and equipment, equity investments, etc.) of Grupo Aval under Colombian Banking GAAP were adjusted for inflation based on the variation in the IPC for middle income-earners, on a prospective basis from January 1, 1992, to December 31, 2000, when under Colombian Banking GAAP the country was no longer considered a highly inflationary economy.
Colombia had been considered a highly inflationary country since the 1960’s, therefore, the adjustment is related to property, plant and equipment purchased before January 1, 1992. This adjustment recognizes the portion of inflation accumulated before this date, less the associated accumulated depreciation which would have been recorded, with the purpose of presenting financial statements on a constant currency basis. The remaining accumulated pre-1992 inflation effect in fixed assets to be amortized in future years is not considered material. The difference between the adjustment as of December 31, 2011, and 2010 is related to the depreciation and sale of certain assets.
|
iii)
|
Supplemental Condensed Consolidated Financial Statements under U.S. GAAP
|
iii) 1. Supplemental Condensed Consolidated Balance Sheets:
The following are the Condensed Consolidated Balance Sheets under U.S. GAAP as of December 31, 2011 and 2010:
|
2011
|
2010
|
|||||||
|
Assets
|
||||||||
|
Cash and cash equivalents (1)
|
Ps. | 8,771,593 | Ps. | 7,177,557 | ||||
|
Trading securities
|
3,980,419 | 3,992,652 | ||||||
|
Investment securities
|
13,488,810 | 15,413,224 | ||||||
|
Loans
|
68,067,042 | 57,784,588 | ||||||
|
Financial leases
|
6,392,754 | 4,014,995 | ||||||
|
Allowance for loans, financial leases and other receivables losses
|
(2,012,927 | ) | (2,012,372 | ) | ||||
|
Property, plant and equipment, net
|
1,867,326 | 2,027,243 | ||||||
|
Other assets, net
|
9,226,173 | 8,039,507 | ||||||
|
Total assets
|
Ps. | 109,781,190 | Ps. | 96,437,394 | ||||
|
Liabilities and shareholders’ equity
|
||||||||
|
Liabilities
|
||||||||
|
Deposits
|
Ps. | 71,017,425 | Ps. | 63,703,920 | ||||
|
Debt
|
19,785,587 | 16,599,320 | ||||||
|
Other liabilities
|
8,359,779 | 7,115,809 | ||||||
|
Total liabilities
|
99,162,791 | 87,419,049 | ||||||
|
Shareholders’ equity
|
||||||||
|
Controlling interest shareholders’ equity
|
6,466,675 | 3,949,527 | ||||||
|
Non-controlling interest
|
4,151,724 | 5,068,818 | ||||||
|
Total shareholders’ equity
|
10,618,399 | 9,018,345 | ||||||
|
Total liabilities and shareholders’ equity
|
Ps. | 109,781,190 | Ps. | 96,437,394 | ||||
GRUPO AVAL ACCIONES Y VALORES S.A. AND ITS SUBSIDIARIES
NOTES TO THE CONSOLIDATED FINANCIAL STATEMENTS
FOR THE YEARS ENDED DECEMBER 31, 2011, 2010 AND 2009
(
Stated in millions of Colombian pesos and U.S. dollars)
|
(1)
|
Under Colombian Banking GAAP, interbank loans and remittances of negotiated checks in transit are considered as cash equivalents. These loans and remittances do not meet the definition of cash equivalents under U.S. GAAP, and therefore were reclassified to the loan portfolio. This reclassification amounted to Ps. 2,928,356 and Ps. 2,506,334 as of December 31, 2011 and 2010, respectively. In addition, at December 31, 2011 and 2010 cash and cash equivalents includes Ps. 1,362 and Ps. 1,252 from VIEs consolidated under US GAAP, respectively.
|
iii) 2. Supplemental Condensed Consolidated Statements of Income:
The following are the Condensed Consolidated Statements of Income under U.S. GAAP for years ended December 31, 2011, 2010 and 2009:
| 2011 (1) | 2010 (1) | 2009 | ||||||||||
|
Total interest income
|
Ps. | 7,106,441 | Ps. | 5,036,536 | Ps. | 5,962,805 | ||||||
|
Total interest expense
|
(2,681,931 | ) | (1,913,799 | ) | (2,854,042 | ) | ||||||
|
Net interest income
|
4,424,510 | 3,122,737 | 3,108,763 | |||||||||
|
Provision for loans, leases and other receivables
|
(670,011 | ) | (613,959 | ) | (805,411 | ) | ||||||
|
Net interest income after provision of loans, leases and other receivables
|
3,754,499 | 2,508,778 | 2,303,352 | |||||||||
|
Income from investment portfolio (2)
|
1,155,012 | 1,090,360 | 1,211,712 | |||||||||
|
Other income
|
3,414,776 | 2,689,437 | 2,629,199 | |||||||||
|
Other expenses
|
(5,437,280 | ) | (3,616,784 | ) | (3,503,464 | ) | ||||||
|
Income before income taxes
|
2,887,007 | 2,671,791 | 2,640,799 | |||||||||
|
Income tax expense
|
(1,184,918 | ) | (893,350 | ) | (953,619 | ) | ||||||
|
Net income
|
1,702,089 | 1,778,441 | 1,687,180 | |||||||||
|
Net income attributable to non-controlling interest
|
(816,747 | ) | (813,122 | ) | (752,631 | ) | ||||||
|
Net income attributable to Grupo Aval’s shareholders
|
Ps. | 885,342 | Ps. | 965,319 | Ps. | 934,549 | ||||||
|
(1)
|
Include the results for year ended December 31, 2011 and a month period ended December 31, 2010 related to acquisition of BAC Credomatic effective December 9, 2010 (see Note 1).
|
|
(2)
|
Income from investment portfolio primarily includes valuation adjustments and gains (losses) realized on debt and equity securities that are accounted for as “available for sale,” gains (losses) on repurchase transactions (repos), gains (losses) realized on the sale of debt securities, and mark-to-market gains (losses) on trading securities portfolio.
|
GRUPO AVAL ACCIONES Y VALORES S.A. AND ITS SUBSIDIARIES
NOTES TO THE CONSOLIDATED FINANCIAL STATEMENTS
FOR THE YEARS ENDED DECEMBER 31, 2011, 2010 AND 2009
(
Stated in millions of Colombian pesos and U.S. dollars)
iii) 3. Supplemental Condensed Consolidated Statements of Cash Flows
The following are the Supplemental Condensed Consolidated Statements of Cash Flows under U.S. GAAP for years ended December 31, 2011, 2010 and 2009:
| 2011 (1) | 2010 (1) | 2009 | ||||||||||
|
Net income
|
Ps. | 1,702,089 | Ps. | 1,778,441 | Ps. | 1,687,180 | ||||||
|
Adjustments to reconcile net income to net cash used by operating activities
|
||||||||||||
| 1,649,176 | 516,727 | (1,904,430 | ) | |||||||||
|
Net cash (used in) provided by operating activities
|
3,351,265 | 2,295,168 | (217,250 | ) | ||||||||
|
Net cash used in investing activities
|
(12,661,350 | ) | (12,977,686 | ) | (4,763,439 | ) | ||||||
|
Net cash provided by financing activities
|
10,799,162 | 10,507,767 | 5,662,743 | |||||||||
|
Effect of exchange rate changes on cash and cash equivalents
|
104,959 | 33,331 | 23,217 | |||||||||
|
(Decrease) increase in cash and cash equivalents
|
1,594,036 | (141,420 | ) | 705,271 | ||||||||
|
Cash and cash equivalents at beginning of year
|
7,177,557 | 7,318,977 | 6,613,706 | |||||||||
|
Cash and cash equivalents at end of year
|
Ps. | 8,771,593 | Ps. | 7,177,557 | Ps. | 7,318,977 | ||||||
|
Non-cash transactions:
|
||||||||||||
|
Foreclosed assets
|
Ps. | 87,359 | Ps. | 48,132 | Ps. | 2,082 | ||||||
|
Bonds converted in shares
|
Ps. | 910,524 | Ps. | - | Ps. | - | ||||||
|
Acquisition of non-controlling interest in Banco Popular by
issuance of shares
|
Ps. | 797,118 | Ps. | - | Ps. | - | ||||||
|
(1)
|
Include the cash flows for year ended December 31, 2011 and a month period ended December 31, 2010 related to acquisition of BAC Credomatic effective December 9, 2010 (see Note 1).
|
GRUPO AVAL ACCIONES Y VALORES S.A. AND ITS SUBSIDIARIES
NOTES TO THE CONSOLIDATED FINANCIAL STATEMENTS
FOR THE YEARS ENDED DECEMBER 31, 2011, 2010 AND 2009
(
Stated in millions of Colombian pesos and U.S. dollars)
iii) 4. Supplemental Consolidated Statements of Shareholders’ Equity
The following are the Supplemental Condensed Consolidated Statements of Changes in Shareholders’ Equity under U.S. GAAP:
| 2011 | 2010 | |||||||
|
Controlling interest shareholders’ equity under U.S. GAAP
|
||||||||
|
Balance at the beginning of the year
|
Ps. | 3,949,527 | Ps. | 3,285,694 | ||||
|
Issuance of shares in cash
|
2,079,370 | - | ||||||
|
Issuance of shares to acquire non-controlling interest
|
797,118 | - | ||||||
|
Receivables for issuance of equity
|
(250,031 | ) | - | |||||
|
Net income
|
885,342 | 965,319 | ||||||
|
Dividends declared
|
(702,509 | ) | (488,834 | ) | ||||
|
Other comprehensive income
|
(292,142 | ) | 187,348 | |||||
|
Balance at the end of the year
|
6,466,675 | 3,949,527 | ||||||
|
Non-controlling interest under U.S. GAAP:
|
||||||||
|
Balance at beginning of year
|
5,068,818 | 3,751,190 | ||||||
|
Net income attributable to non-controlling interests
|
816,747 | 813,122 | ||||||
|
Other comprehensive income attributable to non-controlling interests
|
(456,028 | ) | 90,460 | |||||
|
Participation in Banco Popular sold to controlling interests (See note I n)
|
(797,118 | ) | - | |||||
|
Convertible bonds in shares in Banco de Bogotá
|
- | 886,264 | ||||||
|
Increase in paid capital in subsidiaries
|
131,586 | |||||||
|
Dividends paid and others, net
|
(612,281 | ) | (472,218 | ) | ||||
|
Balance at the end of the year
|
4,151,724 | 5,068,818 | ||||||
|
Total shareholders’ equity under U.S. GAAP
|
Ps. | 10,618,399 | Ps. | 9,018,345 | ||||
GRUPO AVAL ACCIONES Y VALORES S.A. AND ITS SUBSIDIARIES
NOTES TO THE CONSOLIDATED FINANCIAL STATEMENTS
FOR THE YEARS ENDED DECEMBER 31, 2011, 2010 AND 2009
(
Stated in millions of Colombian pesos and U.S. dollars)
iii) 5. Supplemental Consolidated Comprehensive Income:
The following are the Supplemental Consolidated Statements of Comprehensive Income under U.S. GAAP for years ended December 31, 2011, 2010 and 2009:
| 2011 | 2010 | 2009 | ||||||||||
|
Net income
|
Ps. | 1,702,089 | Ps. | 1,778,441 | Ps. | 1,687,180 | ||||||
|
Other comprehensive income (loss), net of deferred income tax:
|
||||||||||||
|
Unrealized gain or loss on securities available for sale (1)
|
(718,107 | ) | 251,124 | 639,417 | ||||||||
|
Pension plan and other benefits to employees
|
(13,208 | ) | 1,390 | (11,451 | ) | |||||||
|
Foreign currency translation adjustments
|
31,854 | 30,592 | (16,223 | ) | ||||||||
|
Derivatives – Hedge accounting (2)
|
(48,709 | ) | (5,298 | ) | - | |||||||
|
Other comprehensive (loss) income
|
(748,170 | ) | 277,808 | 611,743 | ||||||||
|
Total comprehensive income
|
953,919 | 2,056,249 | 2,298,923 | |||||||||
|
Net income attributable to non-controlling interest
|
(816,747 | ) | (813,122 | ) | (752,631 | ) | ||||||
|
Other comprehensive income attributable to non-controlling interest
|
456,028 | (90,460 | ) | (394,091 | ) | |||||||
|
Comprehensive income attributable to non-controlling interest
|
(360,719 | ) | (903,582 | ) | (1,146,722 | ) | ||||||
|
Comprehensive income attributable to Grupo Aval
|
Ps. | 593,200 | Ps. | 1,152,667 | Ps. | 1,152,201 | ||||||
|
(1)
|
See changes in unrealized gain (losses) in the Section i) investment securities and derivatives.
|
|
(2)
|
Cumulative translation adjustment is presented net of Ps. (48,709) and (5,298) as part of the hedge of net investments in foreign operations made during the year ended December 31, 2011 and 2010, respectively. See Note 30.t)
|
A detail of the changes during the period in Accumulated Other Comprehensive Income (loss), including the related income tax effects, is presented below:
| 2011 | ||||||||||||
|
Before - tax
amount
|
Tax (expense)
benefit
|
Net-of-tax
amount
|
||||||||||
|
Unrealized loss on securities available for sale
|
Ps. | (756,365 | ) | Ps. | 38,258 | Ps. | (718,107 | ) | ||||
|
Addition (Reduction) pension liability
|
(19,714 | ) | 6,506 | (13,208 | ) | |||||||
|
Derivatives – Hedge accounting
|
(48,709 | ) | - | (48,709 | ) | |||||||
|
Cumulative translation adjustment
|
31,854 | - | 31,854 | |||||||||
|
Accumulated other comprehensive income
|
Ps. | ( 792,934 | ) | Ps. | 44,764 | Ps. | (748,170 | ) | ||||
|
2010
|
||||||||||||
|
Before - tax
Amount
|
Tax (expense)
Benefit
|
Net-of-tax
amount
|
||||||||||
|
Unrealized gain on securities available for sale
|
Ps. | 237,516 | Ps. | 13,608 | Ps. | 251,124 | ||||||
|
Additional pension liability
|
2,074 | (684 | ) | 1,390 | ||||||||
|
Derivative – hedge accounting
|
(5,298 | ) | - | (5,298 | ) | |||||||
|
Cumulative translation adjustment
|
30,562 | - | 30,592 | |||||||||
|
Accumulated other comprehensive income (loss)
|
Ps. | 264,854 | Ps. | 12,924 | Ps. | 277,808 | ||||||
| 2009 | ||||||||||||
|
Before - tax
Amount
|
Tax (expense)
Benefit
|
Net-of-tax
amount
|
||||||||||
|
Unrealized loss on securities available for sale
|
Ps. | 708,690 | Ps. | (69,273 | ) | Ps. | 639,417 | |||||
|
Additional pension liability
|
(17,091 | ) | 5,640 | (11,451 | ) | |||||||
|
Cumulative translation adjustment
|
(16,223 | ) | - | (16,223 | ) | |||||||
|
Accumulated other comprehensive income (loss)
|
Ps. | 675,376 | Ps. | (63,633 | ) | Ps. | 611,743 | |||||
GRUPO AVAL ACCIONES Y VALORES S.A. AND ITS SUBSIDIARIES
NOTES TO THE CONSOLIDATED FINANCIAL STATEMENTS
FOR THE YEARS ENDED DECEMBER 31, 2011, 2010 AND 2009
(
Stated in millions of Colombian pesos and U.S. dollars)
The following table relates to the accumulated unrealized gain on securities available for sale:
| 2011 | 2010 | 2009 | ||||||||||||||||||||||||||||||||||
|
Before - tax
amount
|
Tax (expense)
benefit
|
Net-of-tax
amount
|
Before - tax
amount
|
Tax (expense)
benefit
|
Net-of-tax
amount
|
Before - tax
amount
|
Tax (expense)
benefit
|
Net-of-tax
amount
|
||||||||||||||||||||||||||||
|
Unrealized taxable net gain on securities available for sale
|
Ps. | 28,452 | Ps. | (9,389 | ) | Ps. | 19,063 | Ps. | 144,385 | Ps. | (47,647 | ) | Ps. | 96,738 | Ps. | 185,621 | Ps. | (61,255 | ) | Ps. | 124,366 | |||||||||||||||
|
Unrealized non-taxable net gain on securities available for sale
|
324,874 | - | 324,874 | 965,306 | - | 965,306 | 686,554 | - | 686,554 | |||||||||||||||||||||||||||
|
Accumulated other comprehensive income
|
Ps. | 353,326 | (1) | Ps. | ( 9,389 | ) | Ps. | 343,937 | Ps. | 1,109,691 | (1) | Ps. | (47,647 | ) | Ps. | 1,062,044 | Ps. | 872,175 | Ps. | ( 61,255 | ) | Ps. | 810,920 | |||||||||||||
|
(1)
|
See changes in unrealized gain (losses) in the Section i) investment securities and derivatives
|
Components of Accumulated Other Comprehensive Income for the years ended at December 31, 2011, 2010 and 2009 are comprised of the following:
|
Unrealized
gains
on
securities net
of taxes
|
Additional
minimum
pension
liability
|
Cumulative
translation
adjustment(*)
|
Less: Accumulated
other
comprehensive
income attributable to non-controlling
interests
|
Total accumulated
other
comprehensive
income attributable
to Grupo Aval
|
||||||||||||||||
|
Beginning balance 2008
|
Ps. | 171,503 | Ps. | (78,314 | ) | Ps. | 27,801 | Ps. | 41,237 | Ps. | 79,753 | |||||||||
|
Current-period change
|
639,417 | (11,451 | ) | (16,223 | ) | 394,091 | 217,652 | |||||||||||||
|
Ending balance 2009
|
810,920 | (89,765 | ) | 11,578 | 435,328 | 297,405 | ||||||||||||||
|
Current-period change
|
251,124 | 1,390 | 25,294 | 90,460 | 187,348 | |||||||||||||||
|
Ending balance 2010
|
1,062,044 | (88,375 | ) | 36,872 | 525,788 | 484,750 | ||||||||||||||
|
Current-period change (1)
|
(718,107 | ) | (13,208 | ) | (16,855 | ) | (456,028 | ) | (292,142 | ) | ||||||||||
|
Ending balance 2011
|
Ps. | 343,937 | Ps. | (101,583 | ) | Ps. | 20,017 | Ps. | 69,760 | Ps. | 192,611 | |||||||||
(*) Cumulative translation adjustment is presented net of Ps. (54,007) and (5,298) as part of the hedge of net investments in foreign operations made during the year ended December 31, 2011 and 2010, respectively. See Note 30.t)
|
iv)
|
Summary of significant differences and required U.S. GAAP disclosures
|
|
a)
|
Income taxes:
|
|
1)
|
Deferred income taxes
|
Under Colombian Banking GAAP, deferred income taxes are generally recognized for timing differences, except for differences related to the amortization of carry-forward losses and the excess of minimum presumptive income tax.
Under U.S. GAAP, specifically ASC 740, deferred tax assets or liabilities must be recorded for all temporary differences between the financial and tax bases of assets and liabilities. Deferred tax assets and liabilities are included in the financial
GRUPO AVAL ACCIONES Y VALORES S.A. AND ITS SUBSIDIARIES
NOTES TO THE CONSOLIDATED FINANCIAL STATEMENTS
FOR THE YEARS ENDED DECEMBER 31, 2011, 2010 AND 2009
(
Stated in millions of Colombian pesos and U.S. dollars)
statements at currently enacted income tax rates applicable to the period in which the deferred tax assets and liabilities are expected to be realized and settled as prescribed in ASC 740 “Income taxes”. A valuation allowance is provided for deferred tax assets to the extent that it is more likely than not that they will not be realized. During 2011, 2010 and 2009, Grupo Aval calculated deferred income taxes based on the tax benefits received upon the acquisition of certain property and equipment in accordance to ASC 740-10-25-51.
Income tax expense from continuing operations under U.S. GAAP for the years ended at December 31, 2011, 2010 and 2009 is comprised of the following:
| 2011 | 2010 | 2009 | ||||||||||
|
Current income tax expense
|
Ps. | 1,195,482 | Ps. | 802,640 | Ps. | 876,287 | ||||||
|
Deferred income tax (benefit) expense
|
(10,564 | ) | 90,710 | 77,332 | ||||||||
|
Total
|
Ps. | 1,184,918 | Ps. | 893,350 | Ps. | 953,619 | ||||||
For the years ended December 31, 2011, 2010 and 2009, Grupo Aval recorded Ps. (44,764), Ps. (12,924) and Ps. 63,633, respectively of deferred income tax (benefit) expense in Other Comprehensive Income. Income tax expenses in the Colombian jurisdiction represented 8,7% of the total amounts reported by the Group.
Temporary differences between the amounts reported in the Consolidated Financial Statements and the tax bases for assets and liabilities result in deferred taxes. Deferred tax assets and liabilities at December 31, 2011 and 2010 were as follows:
| 2011 | 2010 | |||||||
|
Deferred tax assets:
|
||||||||
|
Accrual of employee benefits
|
Ps. | 50,005 | Ps. | 61,428 | ||||
|
Fixed assets
|
71,446 | 39,896 | ||||||
|
Carryforward losses and excess of minimum presumptive income tax
|
113,356 | 141,616 | ||||||
|
Accrued expenses
|
80,390 | 87,336 | ||||||
|
Additional tax deduction on the acquisition of property, plant and equipment
|
55,894 | 55,015 | ||||||
|
Foreclosed assets
|
1,405 | - | ||||||
|
Trust Assets
|
13,352 | - | ||||||
|
Other
|
5,680 | 135 | ||||||
|
Total gross deferred tax assets
|
391,528 | 385,426 | ||||||
|
Less valuation allowance
|
(60,354 | ) | (47,888 | ) | ||||
|
Net deferred tax assets
|
331,174 | 337,538 | ||||||
|
Deferred tax liabilities:
|
||||||||
|
Allowance for loans, leases and other receivables
|
(173,685 | ) | (207,265 | ) | ||||
|
Derivatives
|
(15,199 | ) | (4,313 | ) | ||||
|
Fair value of assets acquired in business combination
|
(73,385 | ) | (71,779 | ) | ||||
|
Intangible assets and deferred charges, net
|
(36,034 | ) | (21,587 | ) | ||||
|
Investment securities
|
(18,121 | ) | (19,840 | ) | ||||
|
Unrealized gain on investment securities
|
(24,886 | ) | (97,288 | ) | ||||
|
Inflation adjustments
|
(470 | ) | (576 | ) | ||||
|
Foreclosed assets
|
- | (7,808 | ) | |||||
|
Total deferred liabilities
|
(341,780 | ) | (430,456 | ) | ||||
|
Net deferred tax (liability) under U.S. GAAP
|
Ps. | (10,606 | ) | Ps. | (92,918 | ) | ||
GRUPO AVAL ACCIONES Y VALORES S.A. AND ITS SUBSIDIARIES
NOTES TO THE CONSOLIDATED FINANCIAL STATEMENTS
FOR THE YEARS ENDED DECEMBER 31, 2011, 2010 AND 2009
(
Stated in millions of Colombian pesos and U.S. dollars)
Under Colombian tax law, certain acquisitions of property plant and equipment have an additional deduction over the total depreciation of such assets, equivalent to 30% for property plant and equipment purchased from 2004 through 2006, 40% from 2007 through 2009 and 30% during 2010. For 2011, this additional deduction was eliminated. This additional deduction is recognized in the income tax return on the year when such assets are purchased. Under Colombian Banking GAAP, there is an immediate recognition in the income statement of such deduction through the current income tax expense.
Under U.S. GAAP, specifically ASC 740-10-25, the tax effect of asset purchases that are not business combinations in which the amount paid differs from the tax basis of the asset shall not result in immediate income statement recognition. The simultaneous equations method shall be used to record the assigned value of the asset and the related deferred tax asset. Therefore, for the purpose of this reconciliation, the initial book value of such deduction calculated according to ASC 740-10-25 is recorded as deferred tax asset decreasing the book value of such assets. Thereafter, the deductions taken to current income tax expense for Colombian Banking GAAP are reversed which decreases the corresponding deferred tax asset under U.S. GAAP.
In assessing the realizability of deferred tax assets, management considers whether it is more likely than not that some portion or all of the deferred tax assets will not be realized. The ultimate realization of deferred tax assets depends upon the generation of future taxable income during the periods in which those temporary differences become deductible. Management considers the scheduled reversal over an entity level of deferred tax liabilities, projected future taxable income and tax planning strategies in making this assessment. Based upon the level of historical taxable income and projections for future taxable income over the periods which the deferred tax assets are deductible, management believes that Grupo Aval will not recover a portion of its future net operating tax loss carryforward with taxable income. Therefore, a valuation allowance was provided against this amount for a total of Ps. 60,354 and Ps. 47,888 as of December 31, 2011 and 2010, respectively. The amount of the deferred tax asset considered realizable, however, could be reduced in the near term if estimates of future taxable income during the carry-forward period are not achieved.
The U.S. GAAP adjustments shown in the shareholders’ equity reconciliation for deferred income taxes of Ps. (257,723) and Ps. (281,201) in 2011 and 2010, respectively, are determined as the difference between the U.S. GAAP net deferred tax (liability) asset balances for both 2011 and 2010 and the Colombian Banking GAAP net deferred tax liability balances for the corresponding years; both adjusted for the cumulative effects derived from the amortization of the deferred tax assets recognized upon the acquisition of the underlying property and equipment pursuant to ASC 740-10-25-51 and the impact of the deferred tax assumed from the BAC Credomatic acquisition, as shown in the following table:
| 2011 | 2010 | |||||||
|
Net deferred tax (liability) under U.S. GAAP
|
Ps. | (10,606 | ) | Ps. | (92,918 | ) | ||
|
Reclassification from property, plant and equipment of gross additional tax deduction according to ASC 740-10-25
|
(351,334 | ) | (317,387 | ) | ||||
|
Deferred income tax from acquisition of BAC Credomatic
|
53,193 | 46,230 | ||||||
|
Net deferred tax liability under Colombian Banking GAAP
|
51,024 | 82,874 | ||||||
|
Difference to be recognized under U.S. GAAP shareholders´ equity
|
Ps. | (257,723 | ) | Ps. | (281,201 | ) | ||
The activity of the difference to be recognized under U.S. GAAP shareholders´ equity during 2011 and 2010 was as follows:
| 2011 | 2010 | 2009 | ||||||||||
|
Balance at the beginning of the year
|
Ps. | (281,201 | ) | Ps. | (217,170 | ) | Ps. | (77,106 | ) | |||
|
Adjustment to reconciliation of consolidated net income
|
(21,286 | ) | (53,915 | ) | (76,431 | ) | ||||||
|
BAC acquisition
|
- | (23,040 | ) | - | ||||||||
|
Decrease (increase) in Other Comprehensive Income
|
44,764 | 12,924 | (63,633 | ) | ||||||||
|
Balance at the end of the year
|
Ps. | (257,723 | ) | Ps. | (281,201 | ) | Ps. | (217,170 | ) | |||
GRUPO AVAL ACCIONES Y VALORES S.A. AND ITS SUBSIDIARIES
NOTES TO THE CONSOLIDATED FINANCIAL STATEMENTS
FOR THE YEARS ENDED DECEMBER 31, 2011, 2010 AND 2009
(
Stated in millions of Colombian pesos and U.S. dollars)
The statutory income tax rate was 33.0% for year 2011, 2010 and 2009 which differs from the 41.04%, 33.43% and 36.11% effective tax rates for years 2011, 2010 and 2009, respectively, due to the following permanent differences which reconcile the statutory income tax with the income tax expense:
| 2011 | 2010 | 2009 | ||||||||||
|
Income before income tax under U.S. GAAP
|
Ps. | 2,887,007 | Ps. | 2,671,791 | Ps. | 2,640,799 | ||||||
|
Income tax as per statutory rate
|
Ps. | 952,712 | Ps. | 881,691 | Ps. | 871,464 | ||||||
|
Tax effect on non-deductible expenses
|
||||||||||||
|
Non deductible expenses (1)
|
85,861 | 127,465 | 105,037 | |||||||||
|
Translation adjustment
|
- | 12,734 | 5,354 | |||||||||
|
Equity Tax
|
212,349 | - | - | |||||||||
|
Others
|
- | 2,854 | 23,853 | |||||||||
|
Total tax effect on non-deductible
|
298,210 | 143,053 | 134,244 | |||||||||
|
Tax effect on non- taxable income (2)
|
||||||||||||
|
Securities income recorded by equity method
|
(41,894 | ) | (24,697 | ) | (36,830 | ) | ||||||
|
Profit on investment securities sold
|
(5,836 | ) | (36,370 | ) | - | |||||||
|
Dividends received
|
(6,863 | ) | (54,897 | ) | (9,081 | ) | ||||||
|
Recovery of profits
|
(18,704 | ) | (22,652 | ) | (2,281 | ) | ||||||
|
Others
|
(5,173 | ) | (20,312 | ) | (6,472 | ) | ||||||
|
Total effect on non-taxable income
|
(78,470 | ) | (158,928 | ) | (54,664 | ) | ||||||
|
Increase in the valuation allowance
|
12,466 | 27,534 | 2,575 | |||||||||
|
Income tax expense
|
Ps. | 1,184,918 | Ps. | 893,350 | Ps. | 953,619 | ||||||
|
(1)
|
Nondeductible expenses include allowance over assets, local taxes and other expenses that are not deductible for tax purposes.
|
|
(2)
|
For years ended December 31, 2011, 2010 and 2009, non-taxable income includes off-shore subsidiaries’ income, dividend income, gain on sales of securities, interest income over mortgage securities, and reversal of accruals.
|
|
1)
|
ASC 740-10 “Uncertainty in income taxes”
|
Provisions contained in ASC 740 – 10 with regard to uncertainty in income taxes, prescribe a comprehensive model for the recognition, measurement, financial statement presentation and disclosure of uncertain tax positions taken or expected to be taken in a tax return. The amount of uncertain tax positions identified at December 31, 2011, 2010 and 2009, respectively, would affect the effective tax rate, if recognized. Grupo Aval has no uncertain tax positions related to any other countries.
The total amount of uncertain tax positions in 2011, 2010 and 2009 were as follows:
| 2011 | 2010 | 2009 | ||||||||||
|
Uncertain tax positions, opening balance
|
Ps. | 23,858 | Ps. | 18,867 | Ps. | 8,335 | ||||||
|
Gross increases - current-period tax positions
|
19,628 | 4,991 | 10,532 | |||||||||
|
Reclassification from guarantees liabilities
|
1,049 | - | - | |||||||||
|
Uncertain tax positions ending balance
|
Ps. | 44,535 | Ps. | 23,858 | Ps. | 18,867 | ||||||
|
Interest and penalties
|
13,587 | 6,331 | 2,876 | |||||||||
|
Reclassification from guarantees liabilities
|
1,111 | - | - | |||||||||
|
Difference to be recognized under U.S. GAAP shareholders´ equity
|
59,233 | 30,189 | 21,743 | |||||||||
|
Assumed liabilities on BAC Credomatic acquisition*
|
26,081 | 15,712 | - | |||||||||
|
Total
|
Ps. | 85,314 | Ps. | 45,901 | Ps. | 21,743 | ||||||
|
*
|
As of December 31, 2011 and 2010, Ps. 22,588 and Ps. 14,099 related to taxes and Ps. 3,492 and Ps. 1,613 related to interests and penalties, respectively.
|
GRUPO AVAL ACCIONES Y VALORES S.A. AND ITS SUBSIDIARIES
NOTES TO THE CONSOLIDATED FINANCIAL STATEMENTS
FOR THE YEARS ENDED DECEMBER 31, 2011, 2010 AND 2009
(
Stated in millions of Colombian pesos and U.S. dollars)
Included in the balance of total uncertain tax positions at December 31, 2011, are potential benefits of Ps. 66,074 and Ps. 17,080 of interest and penalties, that if recognized, would affect the effective tax rate on income from continuing operations.
Grupo Aval is not aware of positions for which it is reasonably possible that the total amounts of uncertain tax positions will be significantly increased or decreased within the next 12 months of the reporting date.
The open tax years of the major companies of Grupo Aval are as follows:
|
Company
|
Open tax year
|
|
|
Banco de Bogotá S. A.
|
2011 to 2008
|
|
|
Banco Comercial AV Villas S. A.
|
2011 to 2005 and 2003
|
|
|
Banco Popular S. A.
|
2011 to 2009 and 2006
|
|
|
Banco de Occidente S. A.
|
2011 to 2009
|
|
|
Grupo Aval Acciones y Valores S. A.
|
2011 to 2008 and 2006
|
|
b)
|
Employee benefit plans:
|
The following tables provide the components of the net periodic benefit costs charged to the consolidated Statement of Income:
|
Pension plans
|
Other benefits
|
|||||||||||||||||||||||
|
2011
|
2010
|
2009
|
2011
|
2010
|
2009
|
|||||||||||||||||||
|
Components of net periodic benefit cost
|
||||||||||||||||||||||||
|
Service cost
|
Ps. | 19 | Ps. | 18 | Ps. | 27 | Ps. | 27,964 | Ps. | 21,065 | Ps. | 22,290 | ||||||||||||
|
Interest cost
|
27,476 | 27,892 | 34,314 | 20,874 | 22,963 | 25,861 | ||||||||||||||||||
|
Amortization of net transition obligation
|
5,965 | 5,979 | 5,978 | 1,976 | 1,821 | 1,821 | ||||||||||||||||||
|
Amortization of net actuarial (gain) or loss
|
(1,940 | ) | 9,594 | 2,254 | (2,618 | ) | (2,282 | ) | 1,456 | |||||||||||||||
|
Net periodic pension cost under U.S. GAAP
|
31,520 | 43,483 | 42,573 | 48,196 | 43,567 | 51,428 | ||||||||||||||||||
|
Net periodic pension cost under Colombian Banking GAAP
|
(51,076 | ) | (34,630 | ) | (46,845 | ) | (39,993 | ) | (34,530 | ) | (42,153 | ) | ||||||||||||
|
Difference recognized under U.S. GAAP
|
Ps. | ( 19,556 | ) | Ps. | 8,853 | Ps. | (4,272 | ) | Ps. | 8,203 | Ps. | 9,037 | Ps. | 9,275 | ||||||||||
The following table provides a reconciliation of the changes in the pension and other benefit obligations for the years ended December 31, 2010 and 2009, and a statement of funded status as of December 31, 2011 and 2010:
|
Pension plans
|
Other benefits
|
|||||||||||||||
|
2011
|
2010
|
2011
|
2010
|
|||||||||||||
|
Change in projected benefit obligation
|
||||||||||||||||
|
Unfunded benefit obligation at beginning of year
|
Ps. | 371,077 | Ps. | 361,507 | Ps. | 187,189 | Ps. | 179,999 | ||||||||
|
Service cost
|
19 | 18 | 27,964 | 21,065 | ||||||||||||
|
Interest cost
|
27,476 | 27,892 | 20,874 | 22,963 | ||||||||||||
|
Actuarial (gain)/loss, net
|
19,621 | 13,897 | 3,520 | (859 | ) | |||||||||||
|
Benefits paid
|
(32,425 | ) | (32,237 | ) | (38,338 | ) | (35,979 | ) | ||||||||
|
Unfunded benefit obligation at end of year
|
385,768 | 371,077 | 201,209 | 187,189 | ||||||||||||
|
Accrued benefit cost under Colombian Banking GAAP
|
(298,994 | ) | (280,581 | ) | (32,502 | ) | (30,565 | ) | ||||||||
|
Difference recognized under U.S. GAAP shareholders’ equity
|
Ps. | 86,774 | Ps. | 90,496 | Ps. | 168,707 | Ps. | 156,624 | ||||||||
GRUPO AVAL ACCIONES Y VALORES S.A. AND ITS SUBSIDIARIES
NOTES TO THE CONSOLIDATED FINANCIAL STATEMENTS
FOR THE YEARS ENDED DECEMBER 31, 2011, 2010 AND 2009
(
Stated in millions of Colombian pesos and U.S. dollars)
Pension Plan
The measurement for pension plan obligations differs from Colombian Banking GAAP to U.S. GAAP basically due to the fact that Colombian Banking GAAP requires a calculation of the estimated liability using the actuarial methodology mortality data and projection rates determined by law, including but not limited to, actuarial assumptions or increase rates. For U.S. GAAP purposes, actuarial valuation of pension plan are performed annually using the projected unit credit method in accordance with ASC 715 “Compensation- Retirement Benefits”, which requires the use of entity, as well as, market specific assumptions.
Other benefits
|
·
|
Under Colombian labor regulations, employees are entitled to receive one month’s salary for each year of service. This benefit is accumulated annually, transferred to a contribution pension fund and paid to the employees upon their termination or retirement from Grupo Aval. No differences are recognized for U.S. GAAP purposes. However, employees hired before 1990 are subject to a different regulation under which Grupo Aval has the obligation to pay the accumulated benefits upon their termination or retirement calculated based on the last salary of the employee and multiplied by the years of service rendered. Under Colombian Banking GAAP, this benefit is accrued on an annual basis not considering possible future obligations or increases in salaries. Under U.S. GAAP, these benefits are recognized using the projected unit credit method in accordance with ASC 715.
|
|
·
|
Under Colombian labor regulations, employers and employees are entitled to negotiate compensation other than benefit plans stated by the law by means of private agreements. Based on such agreements, Grupo Aval recognizes an additional premium to its employees for once and only at the moment of the retirement date. Calculation of the premium pension plan varies from Colombian Banking GAAP to U.S. GAAP because the latter is performed using the projected unit credit method, while under Colombian Banking GAAP benefits are recognized when paid.
|
|
·
|
Active Grupo Aval employees are entitled to a seniority bonus which depends on the number of years of service with Grupo Aval. Benefits are calculated as days of salary (between 15 and 180) and paid at the moment the employee has completed a specific period of service years. Calculation of the seniority bonus differs from Colombian Banking GAAP to U.S. GAAP because the latter applies requirements from ASC 710-10-25. Grupo Aval, for the purpose of this calculation, uses the projected unit credit method, while under Colombian Banking GAAP the seniority bonus is recognized when paid.
|
|
·
|
Some retirees pensioned by Grupo Aval receive payments related to medical treatment, hospitalization and surgical events. Calculations differ between Colombian Banking GAAP to U.S. GAAP because the latter is performed using the projected unit credit method, while under Colombian Banking GAAP benefits are recognized when paid.
|
Disclosure and calculation of differences under U.S. GAAP
|
Pension Plans
|
Other Benefits
|
|||||||||||||||||||||||
|
2011
|
2010
|
2009
|
2011
|
2010
|
2009
|
|||||||||||||||||||
|
Net amount recognized in the Consolidated Balance Sheet at December 31,
|
||||||||||||||||||||||||
|
Statement of Financial Position
|
||||||||||||||||||||||||
|
Current liabilities
|
Ps. | 32,643 | Ps. | 31,583 | Ps. | 29,978 | Ps. | 23,444 | Ps. | 32,704 | Ps. | 22,300 | ||||||||||||
|
Noncurrent liabilities
|
353,125 | 339,494 | 331,529 | 177,765 | 154,484 | 157,699 | ||||||||||||||||||
|
Amount recognized in financial position
|
Ps. | 385,768 | Ps. | 371,077 | Ps. | 361,507 | Ps. | 201,209 | Ps. | 187,188 | Ps. | 179,999 | ||||||||||||
|
Accumulated other comprehensive income
|
||||||||||||||||||||||||
|
Net actuarial gain
|
Ps. | 58,380 | Ps. | 36,816 | Ps. | 32,513 | Ps. | 16,796 | Ps. | 10,850 | Ps. | 9,427 | ||||||||||||
|
Net transition obligation
|
60,966 | 66,934 | 72,913 | 15,478 | 17,306 | 19,127 | ||||||||||||||||||
|
Total at December 31
|
119,346 | 103,750 | 105,426 | 32,274 | 28,156 | 28,554 | ||||||||||||||||||
|
Deferred income tax
|
(39,386 | ) | (34,238 | ) | (34,791 | ) | (10,651 | ) | (9,293 | ) | (9,424 | ) | ||||||||||||
|
Accumulated other comprehensive income
|
Ps. | 79.960 | Ps. | 69.512 | Ps. | 70,635 | Ps. | 21,623 | Ps. | 18,863 | Ps. | 19,130 | ||||||||||||
GRUPO AVAL ACCIONES Y VALORES S.A. AND ITS SUBSIDIARIES
NOTES TO THE CONSOLIDATED FINANCIAL STATEMENTS
FOR THE YEARS ENDED DECEMBER 31, 2011, 2010 AND 2009
(
Stated in millions of Colombian pesos and U.S. dollars)
Changes in the accumulated other comprehensive income before income tax during the years 2011, 2010 and 2009 are described as follows:
|
Pension Plans
|
Other Benefits
|
|||||||||||||||||||||||
|
2011
|
2010
|
2009
|
2011
|
2010
|
2009
|
|||||||||||||||||||
|
(Increase) decrease in
|
||||||||||||||||||||||||
|
accumulated other comprehensive income
|
||||||||||||||||||||||||
|
Recognized during year - transition obligation
|
Ps. | (5,965 | ) | Ps. | (5,979 | ) | Ps. | (5,978 | ) | Ps. | (1,976 | ) | Ps. | (1,821 | ) | Ps. | (1,821 | ) | ||||||
|
Recognized during year - net actuarial losses/(gains)
|
19,621 | (538 | ) | 22,035 | 3,476 | (2,133 | ) | 6,566 | ||||||||||||||||
|
Occurring during year - net actuarial (losses)/gains
|
1,940 | 4,843 | (2,254 | ) | 2,618 | 3,554 | (1,456 | ) | ||||||||||||||||
|
Accumulated other comprehensive income before income tax
|
Ps. | 15,596 | Ps. | (1,674 | ) | Ps. | 13,803 | Ps. | 4,118 | Ps. | (400 | ) | Ps. | 3,289 | ||||||||||
The effect of a one-percentage-point increase and the effect of a one-percentage-point decrease in the assumed health care cost trend rates on the aggregate of the service and interest cost components of net periodic postretirement health care benefit costs and the accumulated postretirement benefit obligation for health care benefits. Measuring the sensitivity of the accumulated postretirement benefit obligation and the combined service and interest cost components to a change in the assumed health care cost trend rates requires remeasuring the accumulated postretirement benefit obligation as of the beginning and end of the year.
Assumed health care cost trend rates have an effect on the amounts reported for the health care planes. One percentage point change in assumed health care cost trend rates would have the following effects:
|
1% Percentage Point
|
||||||||
|
Increase
|
Decrease
|
|||||||
|
Total of service and interest cost
|
Ps. | 39,698 | Ps. | 42,294 | ||||
|
Total projected benefit obligation
|
Ps. | 409,799 | Ps. | 469,094 | ||||
Grupo Aval expects the following amounts in other comprehensive income to be recognized as components of net periodic pension cost related with the pension plan and other benefits during 2012:
|
Net transition obligation
|
Ps. | 8,228 | ||
|
Net gain
|
(4,704 | ) | ||
|
Total
|
Ps. | 3,524 |
The economic assumptions adopted (shown below in nominal terms) are used in determining the actuarial present value of pension obligation and the projected pension obligations for the plan years:
|
Pension Plans
|
Other Benefits
|
|||||||||||||||
|
2011
|
2010
|
2011
|
2010
|
|||||||||||||
|
Discount rate
|
7.39 | % | 7.67 | % | 7.39 | % | 7.67 | % | ||||||||
|
Rate of compensation increases
|
3.26 | % | 3.53 | % | 3.26 | % | 3.53 | % | ||||||||
|
Rate of pension increases
|
3.26 | % | 3.53 | % | 3.26 | % | 3.53 | % | ||||||||
GRUPO AVAL ACCIONES Y VALORES S.A. AND ITS SUBSIDIARIES
NOTES TO THE CONSOLIDATED FINANCIAL STATEMENTS
FOR THE YEARS ENDED DECEMBER 31, 2011, 2010 AND 2009
(
Stated in millions of Colombian pesos and U.S. dollars)
Estimated Future Benefit Payments
The benefit payments, which reflect expected future service, as appropriate, are expected to be paid as follows:
|
Pension Benefits
|
Other Benefits
|
|||||||
|
2012
|
Ps. | 32,643 | Ps. | 23,444 | ||||
|
2013
|
31,452 | 19,686 | ||||||
|
2014
|
29,957 | 17,560 | ||||||
|
2015
|
28,377 | 16,458 | ||||||
|
2016
|
26,680 | 16,140 | ||||||
|
Years 2017 – 2021
|
91,441 | 92,849 | ||||||
|
c)
|
Fixed assets:
|
The following table shows the adjustments for each item:
|
Net income
|
Shareholders’ equity
|
|||||||||||||||||||
|
2011
|
2010
|
2009
|
2011
|
2010
|
||||||||||||||||
|
Reversal of depreciation recorded under Colombian Banking GAAP on property, plant and equipment acquired with income tax benefits
|
Ps. | 17,744 | Ps. | 34,379 | Ps. | 36,332 | Ps. | 158,434 | Ps. | 151,160 | ||||||||||
|
Impairment of fixed assets
|
- | (4,895 | ) | (1,234 | ) | - | (10,288 | ) | ||||||||||||
|
Reversal of provisions under Colombian Banking GAAP
|
4,951 | 5,110 | 1,299 | 21,261 | 16,128 | |||||||||||||||
|
Total
|
Ps. | 22,695 | Ps. | 34,594 | Ps. | 36,397 | Ps. | 179,695 | Ps. | 157,000 | ||||||||||
Depreciation adjustment on property, plant and equipment purchased with income tax benefits
Under Colombia tax law, certain acquisitions of property plant and equipment have an additional deduction over the total depreciation of such assets, recognized in the income tax return on the year when such assets are purchased. Under U.S. GAAP, specifically ASC 740-10-25, the tax effect of asset purchases that are not business combinations in which the amount paid differs from the tax basis of the asset does not result in immediate income statement recognition and, thus, is recorded as a deferred tax asset, which results in a decrease in the book value of such assets.
This adjustment relates to the lower amount of depreciation expense of certain property, plant and equipment to be recognized for U.S. GAAP purposes, due to the fact that the book value of these assets, is lower than the amount presented under Colombian Banking GAAP based on the recognition under U.S. GAAP of the related deferred tax asset on additional tax deductions (See literal a)(1) above). During 2011, this deduction was discontinued by the authorities.
Impairment of fixed assets and reversals of provisions recorded under Colombian Banking GAAP
Under Colombian Banking GAAP, technical appraisals for property, plant and equipment are performed every three years. If the value from the appraisal is lower than the carrying value, the difference is recorded as an allowance in the consolidated balance sheet with the corresponding debit entry to equity. Reversal of the allowance is permitted for subsequent recoveries of the appraised asset.
GRUPO AVAL ACCIONES Y VALORES S.A. AND ITS SUBSIDIARIES
NOTES TO THE CONSOLIDATED FINANCIAL STATEMENTS
FOR THE YEARS ENDED DECEMBER 31, 2011, 2010 AND 2009
(
Stated in millions of Colombian pesos and U.S. dollars)
Under U.S. GAAP, in accordance with ASC 360-10, Property, Plant, and Equipment, “Impairment or Disposal of Long-Lived Assets” an impairment test for a long-lived asset must be performed whenever events or changes in circumstances indicate that the carrying amount of an asset may not be recoverable. Impairment is recognized only if the carrying amount of a long-lived asset is not recoverable and exceeds its fair value. The carrying amount of a long-lived asset is not recoverable if it exceeds the sum of the undiscounted cash flows expected to result from the use and eventual disposition of the asset. An impairment loss shall be measured as the amount by which the carrying amount of a long-lived asset exceeds its fair value. Reversal of impairment is not permitted for subsequent recoveries in the fair value of the asset.
Under U.S. GAAP and based on triggering events and subsequent calculations following the above-mentioned guidance, Grupo Aval recorded impairments in long-lived assets in 2010 and 2009. This adjustment relates to the timing differences since while under Colombian Banking GAAP impairment is reviewed every three years, impairment under U.S. GAAP is based on triggering events.
|
d)
|
Reappraisal of assets:
|
In accordance with Colombian Banking GAAP, reappraisals of a portion of Grupo Aval’s property, plant and equipment, equity investments and other non-monetary assets are made periodically. The surplus between the appraisal and the book value of the asset is recorded in the balance sheet of each individual company of Grupo Aval under the asset caption “reappraisal of assets” and the shareholders’ equity under the caption “Equity Surplus: reappraisals of assets”. Technical appraisals for PP&E are performed every three years. In the consolidation process, the portion of equity surplus from reappraisal of assets acquired in business combination is eliminated while the portion related with the “reappraisal of assets” remains in the balance sheet until the asset is sold. Another portion of “Equity Surplus of Reappraisal of Assets” from subsidiaries not wholly owned for Colombian Banking GAAP is reclassified as part of the non controlling interest liability.
Under U.S. GAAP, such reappraisals of assets are not allowed and, therefore, are reversed for the purpose of this U.S. GAAP reconciliation. This adjustment does not have impact on the reconciliation of the Statement of Income because under Colombian Banking GAAP, reappraisals are not amortized. The total effect of this adjustment decreases the shareholders´ equity under Colombian Banking GAAP by Ps. 1,019,561 and Ps. 707,794 as of December 31, 2011 and 2010, respectively.
|
e)
|
Allowance for loan, lease losses and foreclosed asset:
|
As established by the Superintendency of Finance, the methodology for evaluating loans and financial leases under Colombian Banking GAAP is based on their inherent risk characteristics and serves as a basis for recording provisions based on loss percentage estimates. Under Colombian Banking GAAP, the loan loss allowance is determined and monitored on an ongoing basis, and is established through periodic provisions charged to the Statement of Income. For microcredit and mortgage loans, there are no models for provisioning such loans; therefore, the Superintendency of Finance has established certain percentages of provision according with the risk category established based on its past due days and a general additional provision of 1% of the total of these loans.
Under Colombian regulations to restructure troubled loans, financial entities should comply with certain local legal requirements. Once in compliance, troubled loans that have been restructured are assigned a risk category in the same way that the other loans and the allowance are established according to each type of credit and risk category assigned. Recoveries of provisions previously recognized are not permitted until the customer complies with the restructured terms, with the exception of certain loans with the guarantees granted by the National Government.
GRUPO AVAL ACCIONES Y VALORES S.A. AND ITS SUBSIDIARIES
NOTES TO THE CONSOLIDATED FINANCIAL STATEMENTS
FOR THE YEARS ENDED DECEMBER 31, 2011, 2010 AND 2009
(
Stated in millions of Colombian pesos and U.S. dollars)
ASC 310 Subsequent measurement analysis
For U.S. GAAP, management uses a systematic methodology to establish the amount of allowance for loan losses and the resultant provisions for loan losses it considers appropriate to provide for probable inherent losses in the portfolio.
This estimate is subject to a greater degree of uncertainty as a result of current economic conditions. As future events and their effects cannot be determined with precision, actual results could differ significantly from the estimate.
The allowance consists of specific, historical, and subjective components. The methodology includes the following elements:
|
–
|
A periodic detailed analysis of the loan portfolio
|
|
–
|
A systematic loan grading system
|
|
–
|
A periodic review of the summary of the allowance for loan loss balance
|
|
–
|
Identification of loans to be evaluated on an individual basis for impairment under ASC Section 310-10-35, “Subsequent Measurement” of ASC Topic 310, “Receivables”
|
|
–
|
Consideration of internal factors such as our size, organizational structure, loan portfolio structure, loan administration procedures, past due and delinquency trends, and historical loss experience
|
|
–
|
Consideration of risks inherent in different kinds of lending
|
|
–
|
Consideration of external factors such as local, regional, and national economic factors
|
Loans are considered impaired when, based on current information and events, it is probable that the banking subsidiaries will be unable to collect all amounts due according to the contractual terms of the original loan agreement, including contractual interest payments. When a loan has been identified as impaired, the amount of impairment is measured using cash flow of expected repayments discounted using the loan’s contractual interest rate or at the fair value of the underlying collateral less estimated selling costs when it is determined that the source of repayment is the liquidation of the underlying collateral.
ASC 450 Loss Contingency Analysis
To calculate the allowance required for smaller-balance impaired loans and all performing loans, Grupo Aval performs an analysis of historical losses from our consumer and performing commercial loan portfolios in order to estimate losses for U.S. GAAP purposes resulting from loan losses that had been incurred in such loan portfolios at the balance sheet date, but which had not been individually identified. Loss estimates are analyzed by loan type and thus for homogeneous groups of clients. Historical loss rates used in the process are updated to incorporate the most recent data reflecting current economic conditions, industry performance trends, geographic or obligor concentrations within each portfolio segment, and any other pertinent information that may affect the estimation of the allowance for loan losses. Many factors can affect Grupo Aval’s estimates of allowance for loan losses, including volatility of default probability, migrations and estimated loss severity.
Loans are charged-off when deemed uncollectible. Recoveries of previously charged-off loans are recorded by increasing the allowance.
In addition, for U.S. GAAP purposes, Grupo Aval maintains a provision for credit losses on off-balance sheet credit instruments, including commitments to extend credit, guarantees granted, standby letters of credit and other financial instruments. This provision is recorded as a liability. Grupo Aval follows the same methodology described for allowance for loans losses, including an estimated probability of drawdown by the borrower.
GRUPO AVAL ACCIONES Y VALORES S.A. AND ITS SUBSIDIARIES
NOTES TO THE CONSOLIDATED FINANCIAL STATEMENTS
FOR THE YEARS ENDED DECEMBER 31, 2011, 2010 AND 2009
(
Stated in millions of Colombian pesos and U.S. dollars)
The following summarizes the allowance for loan and lease losses and foreclosed assets under Colombian Banking GAAP and U.S. GAAP:
| 2011 | 2010 | |||||||
|
Allowance for loans losses, financial leases losses and other receivables under Colombian Banking GAAP:
|
||||||||
|
Allowance for loans and financial lease losses
|
Ps. | (2,306,500 | ) | Ps. | (2,183,886 | ) | ||
|
Allowance for accrued interest and other receivables
|
(171,202 | ) | (151,657 | ) | ||||
| (2,477,702 | ) | (2,335,543 | ) | |||||
|
U.S. GAAP adjustments:
|
||||||||
|
Acquisition of BAC Credomatic – reversal of allowances recorded under Colombian Banking GAAP
|
131,410 | 131,410 | ||||||
|
Difference recognized in shareholders’ equity under U.S. GAAP
|
372,456 | 345,504 | ||||||
|
Allowance for certain variable interest entities (See iv)r)
|
(39,091 | ) | (153,743 | ) | ||||
|
Allowance for loans losses, financial leases losses and other receivables under U.S. GAAP
|
(2,012,927 | ) | (2,012,372 | ) | ||||
|
Allowance for foreclosed assets under Colombian Banking GAAP
|
(143,073 | ) | (130,004 | ) | ||||
|
Difference recognized in shareholders’ equity under U.S. GAAP
|
80,250 | 66,638 | ||||||
|
Allowance for certain variable interest entities (See iv)r)
|
(28,187 | ) | (48,672 | ) | ||||
|
Allowance for foreclosed assets under U.S. GAAP
|
(91,010 | ) | (112,038 | ) | ||||
|
Total difference recognized in shareholders’ equity under U.S. GAAP
|
Ps. | 452,706 | Ps. | 412,142 | ||||
The following table summarizes the U.S. GAAP allowance adjustment for loan, financial lease, loans and foreclosed assets to the consolidated income statement:
|
2011
|
2010
|
2009
|
||||||||||
|
Loan and lease losses
|
Ps. | (1,943 | ) | Ps. | 137,617 | Ps. | 60,072 | |||||
|
Accounts receivables
|
1,293 | 1,070 | (457 | ) | ||||||||
|
Non-performing loans securitization
|
(373 | ) | 880 | 668 | ||||||||
|
Foreclosed assets
|
13,613 | 16,774 | 5,682 | |||||||||
|
Adjustment for VIES
|
27,975 | (44,793 | ) | (6,689 | ) | |||||||
|
Business combination
|
- | (51,196 | ) | - | ||||||||
|
Securitization
|
- | 3,912 | 1,026 | |||||||||
| Ps. | 40,565 | Ps. | 64,264 | Ps. | 60,302 | |||||||
An analysis of the activity in the allowance for loans and financial lease losses under U.S. GAAP for the years ended December 31, 2011, 2010 and 2009 is as follows:
| 2011 | 2010 | 2009 | ||||||||||
|
Allowance at the beginning of the year
|
Ps. | (2,012,372 | ) | Ps. | (2,001,951 | ) | Ps. | (1,755,937 | ) | |||
|
Provisions recorded during the year
|
(670,011 | ) | (613,959 | ) | (805,411 | ) | ||||||
|
Charge-offs
|
850,704 | 759,074 | 642,616 | |||||||||
|
Foreign exchange difference
|
(13,750 | ) | (46,573 | ) | (809 | ) | ||||||
|
Recovery of charge-offs
|
(167,498 | ) | (108,963 | ) | (75,504 | ) | ||||||
|
Reclassifications
|
- | - | (6,906 | ) | ||||||||
|
Allowance at the end of the year
|
Ps. | (2,012,927 | ) | Ps. | (2,012,372 | ) | Ps. | ( 2,001,951 | ) | |||
GRUPO AVAL ACCIONES Y VALORES S.A. AND ITS SUBSIDIARIES
NOTES TO THE CONSOLIDATED FINANCIAL STATEMENTS
FOR THE YEARS ENDED DECEMBER 31, 2011, 2010 AND 2009
(
Stated in millions of Colombian pesos and U.S. dollars)
The average recorded in impaired loans were approximately Ps. 1,427,733 and Ps. 1,184,270 for the years ended December 31, 2011 and 2010, respectively, and the related allowance for loan losses in respect of impaired loans totaled Ps. 261,535, Ps. 242,408 and Ps. 217,289 for the years ended 2011, 2010 and 2009, respectively.
The interest income that would have been recorded for impaired loans in accordance with the original contractual terms amounted to Ps. 259,207, Ps. 133,822 and Ps. 230,309 for the year ended 2011, 2010 and 2009, respectively.
For the years ended December 31, 2011, 2010 and 2009, Grupo Aval recognized interest income of approximately Ps. 74,953, Ps. 254,216, Ps. 293,476, respectively, on such impaired loans.
Foreclosed assets
In accordance with Colombian Banking GAAP, foreclosed assets are recognized at fair value and should be sold within two years from the date of foreclosure. During the first year following the date of foreclosure of a real estate asset, a provision equal to 30% of the carrying value of the asset at the time of receipt is recognized in the Consolidated Statement of Income in proportional monthly installments. This provision increases by an additional 30% in proportional monthly installments within the second year following date of foreclosure of the asset. Once the legal term for sale has expired an authorization for extension is required by the Superintendency of Finance. If the authorization is not granted, a provision equal to 80% of the carrying value of the asset should be recognized. If extension is granted, the remaining 20% of the provision should be recognized by the end of the extension period.
For foreclosed assets that are not real estate, the provision is equal to 35% of the carrying value of the asset at the time of foreclosure and should be constituted in proportional monthly installments within the first year following the receipt. This provision should be increased by an additional 35% within the second year. Once the legal term for sale has expired without authorization for extension, the provision should be increased up to 100%. If extension is granted, the remaining 30% of the provision should be recognized by the end of the extension period.
Under U.S. GAAP ASC 310-40, foreclosed assets shall be classified as assets “held-for-sale” and recognized at the lower of its carrying amounts at foreclosure or fair value less the cost to sell, in the period in which all of the following criteria are met: (a) management, having the authority to approve the action, commits to a plan to sell the asset; (b) the asset is available for immediate sale in its present condition subject only to terms that are usual and customary for sales of such assets; (c) an active program to locate a buyer and other actions required to complete the plan to sell the asset have been initiated; (d) the sale of the asset is probable, and transfer of the asset is expected to qualify for recognition as a completed sale, within one year; (e) the asset is being actively marketed for sale at a price that is reasonable in relation to its current fair value; and (f) actions required to complete the plan indicate that it is unlikely that significant changes to the plan will be made or that the plan will be withdrawn. If at any time the criteria in the paragraph above are no longer met, a long-lived asset classified as held for sale is reclassified as in use.
Therefore, the foreclosed assets population under analysis is the same under both Colombian Banking GAAP and U.S. GAAP the adjustment reflects the reversal of a portion of the provisions recorded under Colombian Banking GAAP to adjust the value of the asset to the lower of its carrying amount at the date of foreclosure or fair value less costs to sell.
GRUPO AVAL ACCIONES Y VALORES S.A. AND ITS SUBSIDIARIES
NOTES TO THE CONSOLIDATED FINANCIAL STATEMENTS
FOR THE YEARS ENDED DECEMBER 31, 2011, 2010 AND 2009
(
Stated in millions of Colombian pesos and U.S. dollars)
Additional disclosures under ASU 2010-20
Disclosures about Trouble Debt restructuring are not included in the tables below since those are effective for annual periods beginning after June 15, 2011 as stated in ASU 2011-02.
The following summarizes each class of financing receivable and the allowance for loan losses under Colombian Banking GAAP and U.S. GAAP as of December 31, 2011 and 2010:
Loan Portfolio Breakdown - by type of loan as of 31 December 2011
|
Commercial
|
Consumer
|
Residential
mortgage
|
Microcredit
|
Financial
Leasing
|
Total
|
|||||||||||||||||||
|
Loans and financial leases portfolio recorded under Colombian Banking GAAP
|
Ps. | 40,545,544 | Ps. | 19,735,885 | Ps. | 4,218,377 | Ps. | 284,167 | Ps. | 5,163,767 | Ps. | 69,947,740 | ||||||||||||
|
U.S. GAAP adjustments and reclassifications:
|
||||||||||||||||||||||||
|
Leasing operations
|
119 | - | - | - | 331,027 | 331,146 | ||||||||||||||||||
|
Adjustments related to consolidation of VIEs
|
45,520 | 12,524 | 23,297 | - | - | 81,341 | ||||||||||||||||||
|
Payments of behalf of customers
|
58,326 | 136,774 | 521 | 577 | 4,441 | 200,639 | ||||||||||||||||||
|
Loan origination costs
|
37,406 | 98,129 | 3,898 | 1,287 | 7,014 | 147,734 | ||||||||||||||||||
|
Suspension of accruals
|
117 | 9,621 | 1,281 | 1,066 | (778 | ) | 11,307 | |||||||||||||||||
|
Business combination
|
- | - | (98,676 | ) | - | - | (98,676 | ) | ||||||||||||||||
|
Loans to finance preferred shares
|
- | (250,031 | ) | - | - | - | (250,031 | ) | ||||||||||||||||
|
Interest received in advance
|
(33,335 | ) | (17,930 | ) | (1,842 | ) | (27 | ) | (2,942 | ) | (56,076 | ) | ||||||||||||
|
Loan installments pending application
|
(156,063 | ) | (139,567 | ) | (1,030 | ) | (79 | ) | - | (296,739 | ) | |||||||||||||
|
Reclassifications under U.S. GAAP
|
3,295,385 | 224,711 | 25,613 | 5,477 | 890,225 | 4,441,411 | ||||||||||||||||||
|
Gross loans and financial leases portfolio under U.S. GAAP
|
43,793,019 | 19,810,116 | 4,171,439 | 292,468 | 6,392,754 | 74,459,796 | ||||||||||||||||||
|
Allowance for loan and financial lease losses:
|
||||||||||||||||||||||||
|
Principal – Colombian Banking GAAP
|
(1,070,507 | ) | (799,555 | ) | (48,117 | ) | (10,701 | ) | (377,620 | ) | (2,306,500 | ) | ||||||||||||
|
Interest – Colombian Banking GAAP
|
(33,715 | ) | (21,867 | ) | (1,656 | ) | (581 | ) | (3,337 | ) | (61,156 | ) | ||||||||||||
|
U.S. GAAP adjustments:
|
||||||||||||||||||||||||
|
Other concepts– Col GAAP
|
- | (110,046 | ) | - | - | - | (110,046 | ) | ||||||||||||||||
|
Reduction allowance for loans, Lease losses for U.S. GAAP purposes
|
167,761 | 186,290 | 4,735 | (2,028 | ) | 38,749 | 395,507 | |||||||||||||||||
|
Adjustment related to consolidation of VIEs
|
(40,028 | ) | (12,524 | ) | (9,590 | ) | - | - | (62,142 | ) | ||||||||||||||
|
Acquisition of BAC Credomatic – reversal of allowances recorded under Colombian Banking GAAP
|
131,410 | - | - | - | - | 131,410 | ||||||||||||||||||
|
Allowance for loan and financial lease losses under U.S. GAAP
|
(845,079 | ) | (757,702 | ) | (54,628 | ) | (13,310 | ) | (342,208 | ) | (2,012,927 | ) | ||||||||||||
|
Net book value under U.S. GAAP
|
Ps. | 42,947,940 | Ps. | 19,052,414 | Ps. | 4,116,811 | Ps. | 279,158 | Ps. | 6,050,546 | Ps. | 72,446,869 | ||||||||||||
GRUPO AVAL ACCIONES Y VALORES S.A. AND ITS SUBSIDIARIES
NOTES TO THE CONSOLIDATED FINANCIAL STATEMENTS
FOR THE YEARS ENDED DECEMBER 31, 2011, 2010 AND 2009
(
Stated in millions of Colombian pesos and U.S. dollars)
Loan Portfolio Breakdown - by type of loan as of 31 December 2010
|
Commercial
|
Consumer
|
Residential
mortgage
|
Microcredit
|
Financial
Leasing
|
Total
|
|||||||||||||||||||
|
Loans and financial leases portfolio recorded under Colombian Banking GAAP
|
Ps. | 34,158,101 | Ps. | 16,625,216 | Ps. | 3,844,322 | Ps. | 250,106 | Ps. | 3,745,881 | Ps. | 58,623,626 | ||||||||||||
|
U.S. GAAP adjustments and reclassifications:
|
||||||||||||||||||||||||
|
Leasing operations
|
- | - | - | - | 269,114 | 269,114 | ||||||||||||||||||
|
Adjustments related to consolidation of VIEs
|
266,207 | - | 31,970 | - | - | 298,177 | ||||||||||||||||||
|
Payments on behalf of customers
|
62,126 | 111,169 | 610 | 549 | - | 174,454 | ||||||||||||||||||
|
Loan origination costs
|
62,256 | 70,735 | 3,578 | 2,062 | - | 138,631 | ||||||||||||||||||
|
Interest received in advance
|
(22,801 | ) | (5,577 | ) | (3,195 | ) | (27 | ) | - | (31,600 | ) | |||||||||||||
|
Loan installments pending application
|
(39,459 | ) | (106,752 | ) | (1,655 | ) | (71 | ) | - | (147,937 | ) | |||||||||||||
|
Reclassifications under U.S. GAAP
|
2,283,688 | 178,185 | 7,389 | 5,856 | - | 2,475,118 | ||||||||||||||||||
|
Gross loan and financial leases portfolio under U.S. GAAP
|
36,770,118 | 16,872,976 | 3,883,019 | 258,475 | 4,014,995 | 61,799,583 | ||||||||||||||||||
|
Allowance for loan and financial lease losses:
|
||||||||||||||||||||||||
|
Principal – Colombian Banking GAAP
|
(1,128,390 | ) | (895,743 | ) | (22,578 | ) | (13,588 | ) | (123,587 | ) | (2,183,886 | ) | ||||||||||||
|
Interest – Colombian Banking GAAP
|
(26,290 | ) | (23,344 | ) | (1,891 | ) | (1,239 | ) | (2,593 | ) | (55,357 | ) | ||||||||||||
|
U.S. GAAP adjustments:
|
||||||||||||||||||||||||
|
Other concepts– Col GAAP
|
(48,229 | ) | (42,202 | ) | (1,132 | ) | (1,395 | ) | (3,342 | ) | (96,300 | ) | ||||||||||||
|
Reduction allowance for loans, Lease losses for U.S. GAAP purposes
|
200,995 | 97,285 | 6,295 | 2,296 | 38,633 | 345,504 | ||||||||||||||||||
|
Adjustment related to consolidation of VIEs
|
(153,743 | ) | - | - | - | - | (153,743 | ) | ||||||||||||||||
|
Acquisition of BAC Credomatic – reversal of allowances recorded under Colombian Banking GAAP
|
131,410 | - | - | - | - | 131,410 | ||||||||||||||||||
|
Allowance for loan and financial lease losses under U.S. GAAP
|
(1,024,247 | ) | (864,004 | ) | (19,306 | ) | (13,926 | ) | (90,889 | ) | (2,012,372 | ) | ||||||||||||
|
Net book value under U.S. GAAP
|
Ps. | 35,745,871 | Ps. | 16,008,972 | Ps. | 3,863,713 | Ps. | 244,549 | Ps. | 3,924,106 | Ps. | 59,787,211 | ||||||||||||
These reclassifications are mainly related to interbank loans which are recorded as cash equivalents under Colombian Banking GAAP. Under U.S. GAAP, these loans do not meet the definition of cash equivalents, and therefore are recorded and presented as loans in the consolidated condensed balance sheet.
GRUPO AVAL ACCIONES Y VALORES S.A. AND ITS SUBSIDIARIES
NOTES TO THE CONSOLIDATED FINANCIAL STATEMENTS
FOR THE YEARS ENDED DECEMBER 31, 2011, 2010 AND 2009
(
Stated in millions of Colombian pesos and U.S. dollars)
Loans and asset quality
The following tables are presented for each class of financing receivable, and provide additional information about Grupo Aval’s credit risks and the adequacy of our allowance for credit losses.
Allowance for loan losses
The following table sets forth the allocation of the allowance by loan category as of December 31, 2011 and 2010:
Allowance for Loan Losses and Outstanding Gross Loan Portfolio at 31 December 2011 and for the year then ended
|
Commercial
|
Consumer
|
Residential
mortgage
|
Leasing
transactions
|
Microcredit
|
Total
|
|||||||||||||||||||||||||||
|
Credit
Card
|
Automobiles
|
Personal
Loans
|
||||||||||||||||||||||||||||||
|
Allowance for loan losses under U.S. GAAP:
|
||||||||||||||||||||||||||||||||
|
Evaluated individually for impairment
|
Ps. | 246,149 | Ps. | - | Ps. | - | Ps. | 10 | Ps. | - | Ps. | 15,376 | Ps. | - | Ps. | 261,535 | ||||||||||||||||
|
Collectively evaluated for impairment
|
598,930 | 148,598 | 57,474 | 551,620 | 54,628 | 326,832 | 13,310 | 1,751,392 | ||||||||||||||||||||||||
|
Total allowance for loan losses under U.S. GAAP
|
Ps. | 845,079 | Ps. | 148,598 | Ps. | 57,474 | Ps. | 551,630 | Ps. | 54,628 | Ps. | 342,208 | Ps. | 13,310 | Ps. | 2,012,927 | ||||||||||||||||
|
Gross Loan Portfolio under U.S. GAAP:
|
||||||||||||||||||||||||||||||||
|
Ending balance: individually evaluated for impairment
|
27,190,339 | (1) | - | - | 40 | - | 86,408 | - | 27,276,787 | |||||||||||||||||||||||
|
Ending balance evaluated collectively for impairment
|
16,602,680 | 4,595,410 | 1,435,668 | 13,778,998 | 4,171,439 | 6,306,346 | 292,468 | 47,183,009 | ||||||||||||||||||||||||
|
Total Gross Loan Portfolio under U.S. GAAP:
|
Ps. | 4 3,793,019 | Ps. | 4,595,410 | Ps. | 1,435,668 | Ps. | 13,779,038 | Ps. | 4 ,171,439 | Ps. | 6 ,392,754 |
Ps
292,468
|
Ps. | 74,459,796 | |||||||||||||||||
GRUPO AVAL ACCIONES Y VALORES S.A. AND ITS SUBSIDIARIES
NOTES TO THE CONSOLIDATED FINANCIAL STATEMENTS
FOR THE YEARS ENDED DECEMBER 31, 2011, 2010 AND 2009
(
Stated in millions of Colombian pesos and U.S. dollars)
Allowance for Loan Losses and Outstanding Gross Loan Portfolio at 31 December 2010 and for the year then ended
|
Commercial
|
Consumer
|
Residential
mortgage
|
Leasing
transactions
|
Microcredit
|
General
|
Total
|
||||||||||||||||||||||||||||||
|
Credit
Card
|
Automobiles
|
Personal
Loans
|
||||||||||||||||||||||||||||||||||
|
Allowance for loan losses under U.S. GAAP:
|
||||||||||||||||||||||||||||||||||||
|
Evaluated individually for impairment
|
Ps. | 225,917 | Ps. | - | Ps. | - | Ps. | - | Ps. | - | Ps. | 16,491 | Ps. | - | Ps. | - | Ps. | 242,408 | ||||||||||||||||||
|
Collectively evaluated for impairment
|
798,330 | 250,532 | 88,742 | 524,730 | 19,306 | 74,398 | 13,926 | - | 1,769,964 | |||||||||||||||||||||||||||
|
Total allowance for loan losses under U.S. GAAP
|
Ps. | 1,024,247 | Ps. | 250,532 | Ps. | 88,742 | Ps. | 524,730 | Ps. | 19,306 | Ps. | 90,889 | Ps. | 13,926 | Ps. | - | Ps. | 2,012,372 | ||||||||||||||||||
|
Gross Loan Portfolio under U.S. GAAP:
|
||||||||||||||||||||||||||||||||||||
|
Ending balance: individually evaluated for impairment
|
24,133,525 | (1) | - | - | - | - | 2,071,062 | - | - | 26,204,587 | ||||||||||||||||||||||||||
|
Ending balance evaluated collectively for impairment
|
12,636,593 | 1,672,764 | 1,467,539 | 13,732,673 | 3,883,019 | 1,943,933 | 258,475 | - | 35,594,996 | |||||||||||||||||||||||||||
|
Total Gross Loan Portfolio under U.S. GAAP:
|
Ps. | 36,770,118 | Ps. | 1,672,764 | Ps. | 1,467,539 | Ps. | 13,732,673 | Ps. | 3,883,019 | Ps. | 4,014,995 | Ps. | 258,475 | Ps. | - | Ps. | 61,799,583 | ||||||||||||||||||
|
(1)
|
Loans individually evaluated for impairment that they do not considered impaired, additionally are evaluated collectively for impairment according to historical losses experience adjusted to reflecting current economic conditions.
|
GRUPO AVAL ACCIONES Y VALORES S.A. AND ITS SUBSIDIARIES
NOTES TO THE CONSOLIDATED FINANCIAL STATEMENTS
FOR THE YEARS ENDED DECEMBER 31, 2011, 2010 AND 2009
(
Stated in millions of Colombian pesos and U.S. dollars)
Past due loans
The table below sets forth information about Grupo Aval’s past due loans as of December 31, 2011 and 2010:
Analysis of Loan Portfolio by tenor of payment default as of 31 December 2011
|
Between 31
and 60 days
|
Between 61
and 90 days
|
Over 90
days
|
Total Past
Due
|
Current loan
portfolio
|
Total loan
Portfolio
|
|||||||||||||||||||
|
Commercial
|
||||||||||||||||||||||||
|
Commercial - Real Estate
|
Ps. | 86,545 | Ps. | 9,665 | Ps. | 408,049 | Ps. | 504,259 | Ps. | 38,073,222 | Ps. | 38,577,481 | ||||||||||||
|
Commercial Real Estate – Construction
|
1,315 | 1,352 | 14,178 | 16,845 | 647,126 | 663,971 | ||||||||||||||||||
|
Commercial Real Estate - Other
|
8,621 | 8,741 | 45,445 | 62,807 | 4,488,760 | 4,551,567 | ||||||||||||||||||
|
Total Commercial
|
96,481 | 19,758 | 467,672 | 583,911 | 43,209,108 | 43,793,019 | ||||||||||||||||||
|
Consumer
|
||||||||||||||||||||||||
|
Consumer - Credit Card
|
98,714 | 20,799 | 86,555 | 206,068 | 4,389,341 | 4,595,409 | ||||||||||||||||||
|
Consumer – Automobile
|
22,788 | 12,136 | 32,448 | 67,372 | 1,368,296 | 1,435,668 | ||||||||||||||||||
|
Consumer – Personal loans
|
73,505 | 82,463 | 271,542 | 427,511 | 13,351,528 | 13,779,039 | ||||||||||||||||||
|
Total consumer
|
195,007 | 115,398 | 390,545 | 700,951 | 19,109,165 | 19,810,116 | ||||||||||||||||||
|
Residential mortgages
|
26,539 | 35,458 | 153,402 | 215,399 | 3,956,040 | 4,171,439 | ||||||||||||||||||
|
Leasing transactions
|
35,340 | 27,102 | 64,883 | 123,325 | 6,265,429 | 6,392,754 | ||||||||||||||||||
|
Microcredit
|
3,924 | 1,949 | 8,437 | 14,310 | 278,158 | 292,468 | ||||||||||||||||||
|
Total
|
Ps. | 357,291 | Ps. | 199,665 | Ps. | 1,084,939 | Ps. | 1 ,637,896 | Ps. | 72,817,900 | Ps. | 74,459,796 | ||||||||||||
Analysis of Loan Portfolio by tenor of payment default as of 31 December 2010
|
Between 31
and 60 days
|
Between 61
and 90 days
|
Over 90
days
|
Total Past
Due
|
Current loan
portfolio
|
Total loan
Portfolio
|
|||||||||||||||||||
|
Commercial
|
||||||||||||||||||||||||
|
Commercial - Real Estate
|
Ps. | 65,090 | Ps. | 38,638 | Ps. | 263,646 | Ps. | 367,374 | Ps. | 34,951,413 | Ps. | 35,318,787 | ||||||||||||
|
Commercial Real Estate – Construction
|
1,065 | 972 | 31,478 | 33,515 | 1,309,496 | 1,343,011 | ||||||||||||||||||
|
Commercial Real Estate - Other
|
2,353 | 2,843 | 5,295 | 10,491 | 97,829 | 108,320 | ||||||||||||||||||
|
Total commercial
|
68,508 | 42,453 | 300,419 | 411,380 | 36,358,738 | 36,770,118 | ||||||||||||||||||
|
Consumer
|
||||||||||||||||||||||||
|
Consumer - Credit Card
|
17,647 | 10,192 | 55,442 | 83,281 | 1,589,483 | 1,672,764 | ||||||||||||||||||
|
Consumer – Automobile
|
20,830 | 8,518 | 37,719 | 67,067 | 1,400,472 | 1,467,539 | ||||||||||||||||||
|
Consumer – Personal loans
|
97,228 | 52,539 | 212,053 | 361,820 | 13,370,853 | 13,732,673 | ||||||||||||||||||
|
Total consumer
|
135,705 | 71,249 | 305,214 | 512,168 | 16,360,808 | 16,872,976 | ||||||||||||||||||
|
Residential mortgages
|
29,036 | 27,527 | 53,084 | 109,647 | 3,773,372 | 3,883,019 | ||||||||||||||||||
|
Leasing transactions
|
24,642 | 12,403 | 68,055 | 105,100 | 3,909,895 | 4,014,995 | ||||||||||||||||||
|
Microcredit
|
3,460 | 1,801 | 11,094 | 16,355 | 242,120 | 258,475 | ||||||||||||||||||
|
Total
|
Ps. | 261,351 | Ps. | 155,433 | Ps. | 737,866 | Ps. | 1,154,650 | Ps. | 60,644,933 | Ps. | 61,799,583 | ||||||||||||
GRUPO AVAL ACCIONES Y VALORES S.A. AND ITS SUBSIDIARIES
NOTES TO THE CONSOLIDATED FINANCIAL STATEMENTS
FOR THE YEARS ENDED DECEMBER 31, 2011, 2010 AND 2009
(
Stated in millions of Colombian pesos and U.S. dollars)
Credit quality indicators
The following table illustrates credit risks by category and internally assigned grades as of December 31, 2011 and 2010:
Loan Portfolio Quality Ratios as of the closing of 31 December 2011
|
Exposure in the form of Commercial Loan Portfolio
|
|||||||||||||||||
|
Loan Portfolio Risk Profile by Credit Rating
|
|||||||||||||||||
|
Commercial
|
Commercial financial leasing
|
||||||||||||||||
|
2011
|
2010
|
2011
|
2010
|
||||||||||||||
|
A
|
Ps. | 41,151,332 | Ps. | 34,163,945 | Ps. | 5,929,522 | Ps. | 2,612,214 | |||||||||
| B | 1,438,243 | 1,453,524 | 261,730 | 266,066 | |||||||||||||
| C | 532,302 | 516,471 | 57,923 | 27,771 | |||||||||||||
| D | 373,104 | 520,842 | 98,736 | 91,884 | |||||||||||||
| E | 298,038 | 115,336 | 36,554 | 19,575 | |||||||||||||
|
Total
|
Ps. | 43,793,019 | Ps. | 36,770,118 | Ps. | 6,384,465 | Ps. | 3,017,510 | |||||||||
Exposure in the form of Residential mortgage Loan Portfolio
Loan Portfolio Risk Profile by Credit Rating
|
Housing Mortgages
|
||||||||
|
2011
|
2010
|
|||||||
|
Rating
|
||||||||
| A | Ps. | 3,908,926 | Ps. | 3,727,192 | ||||
| B | 121,819 | 80,887 | ||||||
| C | 72,338 | 48,417 | ||||||
| D | 18,805 | 8,866 | ||||||
| E | 49,551 | 17,657 | ||||||
|
Total
|
Ps. | 4,171,439 | Ps. | 3,883,019 | ||||
Consumer
|
Credit Card
|
Automobile
|
Personal loans
|
Total
consumer
|
Consumer financial
leasing
|
Microcredit
|
|||||||||||||||||||
|
2011
|
||||||||||||||||||||||||
|
Performing (up to 90 days)
|
Ps. | 4,508,855 | Ps. | 1,403,220 | Ps. | 13,507,496 | Ps. | 19,419,571 | Ps. | 7,190 | Ps. | 283,939 | ||||||||||||
|
Non-performing (over 90 days)
|
86,555 | 32,448 | 271,542 | 390,545 | 1,099 | 8,529 | ||||||||||||||||||
|
Total
|
Ps. | 4,595,410 | Ps. | 1,435,668 | Ps. | 13,779,038 | Ps. | 19,810,116 | Ps. | 8,289 | Ps. | 292,468 | ||||||||||||
Consumer
|
Credit Card
|
Automobile
|
Personal loans
|
Total
consumer
|
Consumer financial
leasing
|
Microcredit
|
|||||||||||||||||||
|
2010
|
||||||||||||||||||||||||
|
Performing (up to 90 days)
|
Ps. | 1,617,322 | Ps. | 1,429,820 | Ps. | 13,520,620 | Ps. | 16,567,762 | Ps. | 985,240 | Ps. | 247,381 | ||||||||||||
|
Non-performing (over 90 days)
|
55,442 | 37,719 | 212,053 | 305,214 | 12,245 | 11,094 | ||||||||||||||||||
|
Total
|
Ps. | 1,672,764 | Ps. | 1,467,539 | Ps. | 13,732,673 | Ps. | 16,872,976 | Ps. | 997,485 | Ps. | 258,475 | ||||||||||||
Internally assigned grades are described in the “loans and financial leases” section of this document.
GRUPO AVAL ACCIONES Y VALORES S.A. AND ITS SUBSIDIARIES
NOTES TO THE CONSOLIDATED FINANCIAL STATEMENTS
FOR THE YEARS ENDED DECEMBER 31, 2011, 2010 AND 2009
(
Stated in millions of Colombian pesos and U.S. dollars)
Impaired loans
The following table presents loans individually evaluated and considered impaired with the corresponding allowance for loan losses as of December 31, 2011 and 2010:
| 2011 | ||||||||||||||||||||
|
Gross book
value
|
Outstanding
principal
|
Loan loss
reserve
|
Average book value for the period ending December
31, 2011
|
Recognized interest
income
|
||||||||||||||||
|
Commercial
|
Ps. | 1,522,177 | Ps. | 1,487,973 | Ps. | 248,673 | Ps. | 1,345,750 | Ps. | 68,257 | ||||||||||
|
Leasing
|
86,447 | 85,886 | 12,862 | 81,983 | 6,696 | |||||||||||||||
|
Total
|
Ps. | 1,608,624 | Ps. | 1,573,859 | Ps. | 261,535 | Ps. | 1,427,733 | Ps. | 74,953 | ||||||||||
| 2010 | ||||||||||||||||
|
Gross book
value
|
Outstanding
principal
|
Loan loss
reserve
|
Average book value for the period ending
December 31, 2010
|
|||||||||||||
|
Commercial
|
Ps. | 1,144,461 | Ps. | 1,119,479 | Ps. | 225,917 | Ps. | 1,099,180 | ||||||||
|
Leasing
|
123,055 | 121,420 | 16,491 | 85,090 | ||||||||||||
|
Total
|
Ps. | 1,267,516 | Ps. | 1,240,899 | Ps. | 242,408 | Ps. | 1,184,270 | ||||||||
As of December 31, 2011 there were not loans individually evaluated and considered impaired without provision reserves.
Non-performing loans
The following table summarizes the amount of non-performing loans by loan category, as of December 31, 2011 and 2010:
|
2011
|
2010
|
|||||||
|
Commercial
|
||||||||
|
Commercial - Real state
|
Ps. | 408,049 | Ps. | 263,646 | ||||
|
Construction
|
14,178 | 31,478 | ||||||
|
Other
|
45,445 | 5,295 | ||||||
|
Consumer
|
||||||||
|
Consumer -Credit card
|
86,555 | 55,442 | ||||||
|
Consumer – Automobiles
|
32,448 | 37,719 | ||||||
|
Consumer – Personal loans
|
271,542 | 212,053 | ||||||
|
Residential mortgage
|
||||||||
|
Normal (Prime)
|
153,402 | 50,854 | ||||||
|
Subnormal (Subprime)
|
- | 2,230 | ||||||
|
Leasing transactions
|
64,883 | 68,055 | ||||||
|
Microcredit
|
8,437 | 11,094 | ||||||
|
Total
|
Ps. | 1,084,939 | Ps. | 737,866 | ||||
GRUPO AVAL ACCIONES Y VALORES S.A. AND ITS SUBSIDIARIES
NOTES TO THE CONSOLIDATED FINANCIAL STATEMENTS
FOR THE YEARS ENDED DECEMBER 31, 2011, 2010 AND 2009
(
Stated in millions of Colombian pesos and U.S. dollars)
|
f)
|
Loan origination fees and costs:
|
Under Colombian Banking GAAP, Grupo Aval recognizes in the income statement, loan origination fees, lines of credit and letters of credit, when collected and records related direct costs when incurred.
Under U.S. GAAP, specifically ASC 310-20-50 “Accounting for Non-Refundable Fees and Costs Associated with Origination or Acquiring Loans and Initial Direct Costs of Leases”, loan origination fees and certain direct loan origination costs that are required to be recognized as a yield adjustment over the life of the related loans are recognized by the interest method, except for certain loan agreements, such as revolving lines of credit and credit cards, which are recognized in the Consolidated Statement of Income on a straight-line basis over the life of the product. For certain consumer loans with a history of prepayment the amortization period was adjusted according to that history. The total effect of this adjustment increases the shareholders´ equity under U.S. GAAP by Ps. 147,933 and Ps. 138,631 as of December 31, 2011 and 2010, respectively. The increase in the adjustment for the year ended December 31, 2011, 2010 and 2009 mainly relates to (i) an increase in loans granted during the year which represents an adjustment for U.S. GAAP purposes in the consolidated statement of income of Ps. 9,302, Ps. 30,833 and Ps. 6,800, respectively.
|
g)
|
Interest recognition on non-accrual loans:
|
For Colombian Banking GAAP purposes, Grupo Aval established that interest ceases to be accrued in the consolidated Statement of Income and begins to be recorded in Memorandum Accounts until effective payment is collected, after a loan is in arrears for more than a certain time:
|
Type of loan and financial lease
|
Arrears in excess of:
|
|
|
Residential mortgage
|
60 days
|
|
|
Consumer
|
60 days
|
|
|
Microcredit
|
30 days
|
|
|
Commercial
|
90 days
|
For this reconciliation to U.S. GAAP, Grupo Aval discontinues accrual of interest income once a loan becomes more than 90 days past due in accordance with managements estimations about the recoverability of such interest costs, which is also aligned to customary practices for U.S. banks.
|
h)
|
Deferred charges and other assets:
|
For Colombian Banking GAAP purposes, Grupo Aval has deferred certain expenses and other charges, including among others, remodeling, pre-operating expenses, and certain costs of studies and projects including administrative projects, improvement of internal processes related to clients, multiple services and benchmark analysis. These charges are expensed as incurred under U.S. GAAP. The increase in the U.S. GAAP adjustment at December 31, 2011 as compared to 2010 is mainly related to an increase in remodeling expenses incurred during 2011 (see Note 11).
Debt issuance costs are amortized, using the effective interest method, over the life of the related debt by which the costs were incurred under Colombian Banking GAAP and U.S. GAAP.
GRUPO AVAL ACCIONES Y VALORES S.A. AND ITS SUBSIDIARIES
NOTES TO THE CONSOLIDATED FINANCIAL STATEMENTS
FOR THE YEARS ENDED DECEMBER 31, 2011, 2010 AND 2009
(
Stated in millions of Colombian pesos and U.S. dollars)
|
i)
|
Investment securities and derivatives:
|
1) Investment securities
The table below provides details regarding the differences in investment securities between Colombian Banking GAAP and U.S. GAAP:
|
Net income
|
Shareholders´ equity
|
|||||||||||||||||||
|
2011
|
2010
|
2009
|
2011
|
2010
|
||||||||||||||||
|
Differences in classification of held to maturity investments and fair value adjustment (a)
|
Ps. | 1,690 | Ps. | 2,361 | Ps. | 5,245 | Ps. | 3,716 | Ps. | (5,817 | ) | |||||||||
|
Impairment on investments (b)
|
(2,900 | ) | - | 471 | 4,643 | 8,172 | ||||||||||||||
|
Cautionary provisions (b)
|
(315,040 | ) | 315,040 | - | - | 315,040 | ||||||||||||||
|
Foreign exchange differences on available for sale investments (c)
|
(12,291 | ) | 6,585 | 19,025 | - | - | ||||||||||||||
| Ps. | ( 328,541 | ) | Ps. | 323,986 | Ps. | 24,741 | Ps. | 8,359 | Ps. | 317,395 | ||||||||||
|
(a)
|
These adjustments relate to investments in debt securities, equity securities with readily determinable fair value and derivative instruments:
|
Under U.S. GAAP and Colombian Banking GAAP, investment securities are classified and measured in a similar manner, except for the following:
Certain investment securities, classified as held to maturity under Colombian Banking GAAP, are presented under U.S. GAAP as “available for sale” with an adjustment in the related fair value against OCI.
Under Colombian Banking GAAP, the Superintendency of Finance allows recognition at amortized cost of certain investment securities classified as trading or available for sale. Under U.S. GAAP, all debt securities classified as trading or available for sale are recorded at fair value determined according to ASC 820-10 requirements.
In addition under Colombian banking GAAP available for sale securities must be held classified in the category for at least one year, while U.S. GAAP has no such requirement.
|
(b)
|
Impairment on investments and cautionary provisions
|
Impairment on investments
Under Colombian Banking GAAP, in the case of the impairment of securities, Grupo Aval follows the requirements of the Superintendency of Finance. Based on such guidance, a credit risk qualification analysis is performed for both debt and equity securities, based on this analysis a credit risk rating will be assigned to each investment, setting mandatory provisions depending on the credit risk level determined for the investment.
Under U.S. GAAP, a decline in the estimated fair market value of held to maturity or available for sale debt or equity securities compared with the amortized cost is charged to earnings for the year management considers that this decrease is other than temporary. Management evaluates securities for other than temporary impairment at each balance sheet date or sooner when conditions require such evaluation. Factors considered in determining whether impairment is other than temporary include: (1) the length of time and the extent to which the fair value has been less than cost; (2) the financial condition and the near term prospects of the issuer; and (3) the intent and ability of Grupo Aval to hold the investment for a period of time sufficient to allow full recovery in fair value.
GRUPO AVAL ACCIONES Y VALORES S.A. AND ITS SUBSIDIARIES
NOTES TO THE CONSOLIDATED FINANCIAL STATEMENTS
FOR THE YEARS ENDED DECEMBER 31, 2011, 2010 AND 2009
(
Stated in millions of Colombian pesos and U.S. dollars)
For debt securities, when an entity does not intend to sell an impaired debt security, and it is more likely than not it will be required to sell the security prior to recovery, the entity must determine whether it will recover its amortized cost basis. If it concludes it will not, a credit loss exists and the resulting Other Than Temporary Impairment is separated into the amount representing the credit loss, which is recognized in earnings, and the amount related to all other factors, which is recognized in Other Comprehensive Income (OCI).
The guidance requires that the total Other Than Temporary Impairment (difference between the fair value and the amortized cost of the security) be presented in the Consolidated Statement of Income with an offset in a separate line item for any amount of the total Other Than Temporary Impairment that is recognized in other comprehensive income. Therefore, based on the analysis performed, under U.S. GAAP, Other Than Temporary Impairment has been recognized for available for sale equity securities.
Therefore, the U.S. GAAP adjustment refers to the reversal of mandatory provisions set by the Superintendency of Finance. See additional disclosures on unrealized loss position for more than and less than twelve months.
Cautionary provisions
During 2011, the prudent provision or Ps 245,138 million was fully reversed based on two circumstances: (i) On February of 2011, Promigas was reclassified from medium to low marketability and, as a result, Corficolombiana booked a loss of Ps 122,000 million, according to Colombian Banking GAAP, to offset such loss, the Company reversed an equal amount of the prudent provision established during the previous year; (ii) During 2011 Corficolombiana assessed its investment in Promigas as strategic, and as such, it reclassified it as “Available for Sale” under Colombian Banking GAAP which means that the volatility in the price of its shares affected the equity directly as opposed to the income statement. In addition, Corficolombiana had already recognized a negative impact of $187,836 in its equity associated to its investment in EEB, no further impairment in this investment is expected to occur. Having these two events occurring during 2011, Corficolombiana decided to reverse the remaining portion of the cautionary provision in December 2011, related to investment such as Empresa de Energia de Bogotá, and Sociedad de Inversiones en Energía (“SIE"), considering that the risk associated with fluctuations of the price of its investments was no longer material.
GRUPO AVAL ACCIONES Y VALORES S.A. AND ITS SUBSIDIARIES
NOTES TO THE CONSOLIDATED FINANCIAL STATEMENTS
FOR THE YEARS ENDED DECEMBER 31, 2011, 2010 AND 2009
(
Stated in millions of Colombian pesos and U.S. dollars)
|
(c)
|
Foreign exchange differences on available for sale investments
|
Under Colombian Banking GAAP, fluctuations in fair value resulting from changes in foreign currency exchange rates on available for sale debt securities are reflected in the Consolidated Statements of Income. In accordance with U.S. GAAP, based on ASC 320-10 and ASC 830-20, changes in the fair value of available for sale debt securities as a result of changes in foreign currency exchange rates are reflected in shareholders’ equity. The U.S. GAAP adjustment reflects reclassifications of these effects from net income to shareholders´ equity.
Additional disclosures for investment securities
The following tables are included with the purpose of providing ASC 320-10 complementary disclosure requirements of investment securities:
As of December 31, 2011
Available for sale securities
|
Cost
Basis
|
Unrealized
Gains
|
Unrealized
losses
|
Fair value
|
|||||||||||||
|
Debt securities
|
||||||||||||||||
|
Securities issued or secured by Colombian Government
|
Ps. | 7,422,316 | Ps. | 64,263 | Ps. | (33,505 | ) | Ps. | 7,453,074 | |||||||
|
Securities issued or secured by Colombian government entities
|
128,481 | 1,350 | (2,018 | ) | 127,813 | |||||||||||
|
Securities issued or secured by other financial entities
|
774,141 | 1,583 | (1,511 | ) | 774,213 | |||||||||||
|
Securities issued or secured by foreign governments
|
851,877 | 117 | (159 | ) | 851,835 | |||||||||||
|
Other
|
499,495 | 4,579 | (5,503 | ) | 498,571 | |||||||||||
| 9,676,310 | 71,892 | (42,696 | ) | 9,705,506 | ||||||||||||
|
Equity securities*
|
||||||||||||||||
|
Bolsa de Valores de Colombia S.A.
|
12,136 | 10,784 | - | 22,920 | ||||||||||||
|
Empresa de Energía de Bogotá S.A. E.S.P.
|
218,028 | 166,374 | - | 384,402 | ||||||||||||
|
Bladex S.A
|
165 | 26 | - | 191 | ||||||||||||
|
Gas Natural S.A. E.S.P.
|
29,225 | 47,886 | - | 77,111 | ||||||||||||
|
Mineros S.A.
|
50,258 | 37,647 | - | 87,905 | ||||||||||||
|
Mastercard INT
|
74 | 827 | - | 901 | ||||||||||||
|
Proenergía Internacional S.A.
|
52,279 | 60,586 | - | 112,865 | ||||||||||||
| 362,165 | 324,130 | - | 686,295 | |||||||||||||
|
Total investments available for sale and unrealized gains (losses ) in other comprehensive income
|
Ps. | 10,038,475 | Ps. | 396,022 | Ps. | (42,696 | ) | Ps. | 10,391,801 | |||||||
GRUPO AVAL ACCIONES Y VALORES S.A. AND ITS SUBSIDIARIES
NOTES TO THE CONSOLIDATED FINANCIAL STATEMENTS
FOR THE YEARS ENDED DECEMBER 31, 2011, 2010 AND 2009
(
Stated in millions of Colombian pesos and U.S. dollars)
Held-to-maturity securities
|
Gross
|
Gross
|
|||||||||||||||
|
Cost
Basis
|
unrealized
gains
|
unrealized
losses
|
Fair value
|
|||||||||||||
|
Securities issued or secured by Colombian Government
|
Ps. | 817,510 | Ps. | 595 | Ps. | (48,000 | ) | Ps. | 770,105 | |||||||
|
Securities issued or secured by Colombian Government entities
|
2,252,168 | 56 | (40,654 | ) | 2,211,570 | |||||||||||
|
Securities issued or secured by other financial entities
|
9,964 | 376 | - | 10,340 | ||||||||||||
|
Securities issued or secured by foreign governments
|
9,841 | - | - | 9,841 | ||||||||||||
|
Other
|
7,526 | 242 | - | 7,768 | ||||||||||||
|
|
Ps. | 3,097,009 | Ps. | 1,269 | Ps. | ( 88,654 | ) | Ps. | 3,009,624 | |||||||
As of December 31, 2010
Available for sale securities
|
Cost
basis
|
Unrealized
Gains
|
Unrealized
losses
|
Fair value
|
|||||||||||||
|
Debt securities
|
||||||||||||||||
|
Securities issued or secured by Colombian
Government
|
Ps. | 7,775,102 | Ps. | 182,998 | Ps. | (50,303 | ) | Ps. | 7,907,797 | |||||||
|
Securities issued or secured by Colombian
Government entities
|
141,661 | 1,483 | (1,817 | ) | 141,327 | |||||||||||
|
Securities issued or secured by other
financial entities
|
637,184 | 3,264 | (3,181 | ) | 637,267 | |||||||||||
|
Securities issued or secured by foreign governments
|
1,017,102 | 5,484 | (5,719 | ) | 1,016,867 | |||||||||||
|
Other
|
764,551 | 11,984 | (6,717 | ) | 769,818 | |||||||||||
| 10,335,600 | 205,213 | (67,737 | ) | 10,473,076 | ||||||||||||
|
Equity securities
|
||||||||||||||||
|
Bolsa de Valores de Colombia S.A.
|
15,431 | 36,132 | - | 51,563 | ||||||||||||
|
Empresa de Energía de Bogotá S.A. E.S.P.
|
225,827 | 345,051 | - | 570,878 | ||||||||||||
|
Gas Natural S.A. E.S.P.
|
29,226 | 33,732 | - | 62,958 | ||||||||||||
|
Mineros S.A.
|
50,258 | 93,387 | - | 143,645 | ||||||||||||
|
Proenergía Internacional S.A.
|
54,250 | 59,943 | - | 114,193 | ||||||||||||
|
Promigás S.A. E.S.P.*
|
402,650 | 252,648 | - | 655,298 | ||||||||||||
|
Sociedad de Inversiones en Energía S.A.
|
56,402 | 151,322 | - | 207,724 | ||||||||||||
| 834,044 | 972,215 | - | 1,806,259 | |||||||||||||
|
Total investments available for sale and unrealized gains (losses ) in other comprehensive income
|
Ps. | 11,169,644 | Ps. | 1,177,428 | Ps. | ( 67,737 | ) | Ps. | 12,279,335 | |||||||
*See note iv k below for the impacts of the revised accounting treatment of the investment in Promigas S.A.
GRUPO AVAL ACCIONES Y VALORES S.A. AND ITS SUBSIDIARIES
NOTES TO THE CONSOLIDATED FINANCIAL STATEMENTS
FOR THE YEARS ENDED DECEMBER 31, 2011, 2010 AND 2009
(
Stated in millions of Colombian pesos and U.S. dollars)
Held-to-maturity securities
|
Cost
basis
|
Unrealized
gains
|
Unrealized
losses
|
Fair value
|
|||||||||||||
|
Securities issued or secured by Colombian Government
|
Ps. | 980,878 | Ps. | 1,335 | Ps. | (68,068 | ) | Ps. | 914,145 | |||||||
|
Securities issued or secured by Colombian Government entities
|
2,106,787 | 256 | (31,391 | ) | 2,075,652 | |||||||||||
|
Securities issued or secured by other financial entities
|
6,807 | 10 | - | 6,817 | ||||||||||||
|
Securities issued or secured by foreign governments
|
9,931 | 1 | (1 | ) | 9,931 | |||||||||||
|
Other
|
29,486 | 1,100 | - | 30,586 | ||||||||||||
|
|
Ps. | 3,133,889 | Ps. | 2,702 | Ps. | (99,460 | ) | Ps. | 3,037,131 | |||||||
The scheduled maturities of debt securities at December 31, 2011 were as follows:
|
Available for sale
|
Held to maturity
|
|||||||||||||||
|
Amortized cost
|
Fair value
|
Amortized cost
|
Fair value
|
|||||||||||||
|
Due in one year or less
|
Ps. | 1,024,407 | Ps. | 1,023,428 | Ps. | 2,365,020 | Ps. | 2,326,657 | ||||||||
|
Due from one year to five years
|
5,750,819 | 5,780,042 | 723,228 | 674,100 | ||||||||||||
|
Due from five years to ten years
|
2,681,565 | 2,677,489 | 8,761 | 8,867 | ||||||||||||
|
Due more than ten years
|
219,519 | 224,547 | - | - | ||||||||||||
|
Total
|
Ps. | 9,676,310 | Ps. | 9,705,506 | Ps. | 3,097,009 | Ps. | 3,009,624 | ||||||||
Unrealized Losses Disclosure
The following table presents debt securities classified as available for sale and held to maturity that have been in a continuous unrealized losses position as of December 31, 2011 and 2010 are:
|
Unrealized losses as of December 31, 2011
|
Cost basis
|
Unrealized loss
|
Fair value
|
|||||||||
|
Available for sale - Debt securities less than 12 months
|
||||||||||||
|
Securities issued or secured by Colombian Government
|
Ps. | 784,828 | Ps. | (7,510 | ) | Ps. | 777,318 | |||||
|
Securities issued or secured by government entities
|
3,233 | (8 | ) | 3,225 | ||||||||
|
Securities issued or secured by other financial entities
|
77,785 | (506 | ) | 77,279 | ||||||||
|
Securities issued or secured by foreign governments
|
48,685 | (156 | ) | 48,529 | ||||||||
|
Other
|
125,634 | (1,796 | ) | 123,838 | ||||||||
| 1,040,165 | (9,976 | ) | 1,030,189 | |||||||||
|
Available for sale - Debt securities more than 12 months
|
||||||||||||
|
Securities issued or secured by Colombian Government
|
2,327,753 | (25,995 | ) | 2,301,758 | ||||||||
|
Securities issued or secured by government entities
|
55,009 | (2,010 | ) | 52,999 | ||||||||
|
Securities issued or secured by other financial entities
|
84,052 | (1,005 | ) | 83,047 | ||||||||
|
Securities issued or secured by foreign governments
|
2,283 | (3 | ) | 2,280 | ||||||||
|
Other
|
197,093 | (3,707 | ) | 193,386 | ||||||||
| 2,666,190 | (32,720 | ) | 2,633,470 | |||||||||
|
Total securities available for sale
|
3,706,355 | (42,696 | ) | 3,663,659 | ||||||||
|
Securities held to maturity less than 12 months
|
||||||||||||
|
Securities issued or secured by Colombian Government
|
74,644 | (1,153 | ) | 73,491 | ||||||||
|
Securities issued or secured by government entities
|
1,946,642 | (32,199 | ) | 1,914,440 | ||||||||
|
Securities issued or secured by other financial entities
|
543 | - | 543 | |||||||||
|
Securities issued or secured by foreign government
|
5,956 | - | 5,956 | |||||||||
|
Others
|
44 | - | 44 | |||||||||
| 2,027,829 | (33,352 | ) | 1,994,474 | |||||||||
|
Securities held to maturity more than 12 months
|
||||||||||||
|
Securities issued or secured by Colombian Government
|
693,812 | (46,847 | ) | 646,965 | ||||||||
|
Securities issued or secured by government entities
|
302,952 | (8,455 | ) | 294,497 | ||||||||
| 996,764 | (55,302 | ) | 941,462 | |||||||||
|
Total securities held to maturity
|
Ps. | 3,024,593 | Ps. | (88,654 | ) | Ps. | 2,935,936 | |||||
|
Total investments with unrealized losses
|
Ps. | 6,730,948 | Ps. | (131,350 | ) | Ps. | 6,599,595 | |||||
|
Total investments with unrealized losses more than 12 months
|
Ps. | 3,662,954 | Ps. | (88,022 | ) | Ps. | 3,574,932 | |||||
GRUPO AVAL ACCIONES Y VALORES S.A. AND ITS SUBSIDIARIES
NOTES TO THE CONSOLIDATED FINANCIAL STATEMENTS
FOR THE YEARS ENDED DECEMBER 31, 2011, 2010 AND 2009
(
Stated in millions of Colombian pesos and U.S. dollars)
|
Unrealized losses as of December 31, 2010
|
Cost basis
|
Unrealized
loss
|
Fair value
|
|||||||||
|
Available for sale - Debt securities less than 12 months
|
||||||||||||
|
Securities issued or secured by Colombian Government
|
Ps. | 2,332,677 | Ps. | (47,585 | ) | Ps. | 2,285,092 | |||||
|
Securities issued or secured by government entities
|
46,449 | (542 | ) | 45,907 | ||||||||
|
Securities issued or secured by other financial entities
|
392,763 | (2,840 | ) | 389,923 | ||||||||
|
Securities issued or secured by foreign governments
|
597,023 | (3,401 | ) | 593,622 | ||||||||
|
Other
|
369,812 | (5,889 | ) | 363,923 | ||||||||
| 3,738,724 | (60,257 | ) | 3,678,467 | |||||||||
|
Available for sale - Debt securities more than 12 months
|
||||||||||||
|
Securities issued or secured by Colombian Government
|
144,525 | (2,718 | ) | 141,807 | ||||||||
|
Securities issued or secured by government entities
|
27,763 | (1,275 | ) | 26,488 | ||||||||
|
Securities issued or secured by other financial entities
|
10,938 | (940 | ) | 9,998 | ||||||||
|
Securities issued or secured by foreign governments
|
28,654 | (2,318 | ) | 26,336 | ||||||||
|
Other
|
29,491 | (229 | ) | 29,262 | ||||||||
| 241,371 | (7,480 | ) | 233,891 | |||||||||
|
Total securities available for sale
|
3,980,095 | (67,737 | ) | 3,912,358 | ||||||||
|
Securities held to maturity less than 12 months
|
||||||||||||
|
Securities issued or secured by Colombian Government
|
59,682 | (240 | ) | 59,442 | ||||||||
|
Securities issued or secured by government entities
|
1,750,882 | (21,893 | ) | 1,728,989 | ||||||||
|
Securities issued or secured by foreign governments
|
6,015 | (1 | ) | 6,014 | ||||||||
| 1,816,579 | (22,134 | ) | 1,794,445 | |||||||||
|
Securities held to maturity more than 12 months
|
||||||||||||
|
Securities issued or secured by Colombian Government
|
876,677 | (67,828 | ) | 808,849 | ||||||||
|
Securities issued or secured by government entities
|
314,268 | (9,498 | ) | 304,770 | ||||||||
| 1,190,945 | (77,326 | ) | 1,113,619 | |||||||||
|
Total securities held to maturity
|
Ps. | 3,007,524 | Ps. | (99,460 | ) | Ps. | 2,908,064 | |||||
|
Total investments with unrealized losses
|
Ps. | 6,987,619 | Ps. | (167,197 | ) | Ps. | 6,820,422 | |||||
|
Total investments with unrealized losses more than 12 months
|
Ps. | 1,432,316 | Ps. | (84,806 | ) | Ps. | 1,347,509 | |||||
The amount of realized gain or (loss) on trading securities included in earnings during 2011, 2010 and 2009 was Ps. 273,258, Ps. 214,246 and Ps. 15,336, respectively.
The amount of realized gain or (loss) on available for sale included in earnings during 2011, 2010 and 2009 was Ps. 252,824, Ps. (145,709) and Ps. (392,775) , respectively.
As of December 31, 2011 losses with more than twelve months amounted to Ps. 88,022 are represented primarily by mandatory securities issued or secured by the Colombian Government. Grupo Aval considers this decline in fair value as temporary, due to the fluctuations in the interest rates; however, those events do not affect the issuer´s creditworthiness. Grupo Aval has the ability and intent to hold these securities for a period of time sufficient to recover all unrealized losses. Accordingly, Grupo Aval has not recognized any other-than temporary impairment for these securities. These securities pay a fixed interest rate and have an average maturity less than five years.
GRUPO AVAL ACCIONES Y VALORES S.A. AND ITS SUBSIDIARIES
NOTES TO THE CONSOLIDATED FINANCIAL STATEMENTS
FOR THE YEARS ENDED DECEMBER 31, 2011, 2010 AND 2009
(
Stated in millions of Colombian pesos and U.S. dollars)
2) Derivatives
Fair value of derivative instruments
Under Colombian Banking GAAP, the fair value of derivative instruments is similar to U.S. GAAP, specifically ASC 820, except for the fact that Colombian Banking GAAP does not consider in the determination of fair values own credit risk, counterparty risk and consideration of collateral in addition to any prior mentioned difference.
In addition, since January 1, 2010 and following new rules established by the Superintendency of Finance to measure the fair value of derivative instruments under Colombian Banking GAAP, any day one gain or losses derived from the new valuation requirements on Swaps are deferred and amortized during the life of the instrument. For U.S. GAAP purposes, such deferrals are reversed through the consolidated income statement as these derivative instruments were classified as trading under U.S. GAAP.
The impact of the abovementioned differences in shareholders´ equity as of December 31, 2011 and 2010 consisted of Ps. (2,351) and Ps. (269) decrease, respectively, and the impact in the consolidated statements of income for the year ended December 31, 2011, 2010 and 2009 was Ps. (2,082), Ps. 1,168 and Ps. (2,122), respectively.
Hedge of a Net Investment in a Foreign Operation
Grupo Aval did designate foreign exchange forwards and foreign currency denominated debt to hedge the foreign exchange risk associated with Grupo Aval’s investments in non-Colombian Peso functional currency subsidiaries; in the case of the designated forwards, these are entered into for a short term period and as they do expire, new forwards are again entered into (known as “rolling hedge” strategy), as to preserve the portion of the net equity investment in term of Colombian Pesos if the USD depreciates against Grupo Aval’s functional currency. See Note 30 t), for differences between Colombian Banking GAAP and US GAAP in relation to hedge accounting.
Additional disclosures for derivatives
The tables below is included in accordance with ASC 820-10 disclosures requirements and present the financial position of the derivatives contracts recorded to the caption “other assets” and “other liabilities” as of December 31, 2011 and 2010 and their gain and loss recognized in the Consolidated Statement of Income:
|
Asset
|
||||||||||||||||||||||||
|
As of December
|
2011
|
2010
|
||||||||||||||||||||||
|
Notional
amount
|
Fair Value
|
Average maturity
(days)
|
Notional
Amount
|
Fair Value
|
Average maturity
(days)
|
|||||||||||||||||||
|
Interest rate contracts (1)
|
Ps. | 1,355,788 | Ps. | 18,582 | 551 | Ps. | 218,245 | Ps. | 5,851 | 702 | ||||||||||||||
|
Foreign exchange contracts (1)
|
10,552,445 | 281,677 | 155 | 4,180,176 | 244,563 | 199 | ||||||||||||||||||
|
Total
|
Ps. | 11,908,233 | Ps. | 300,259 | Ps. | 4,398,421 | Ps. | 250,414 | ||||||||||||||||
|
Liability
|
||||||||||||||||||||||||
|
Interest rate contracts (2)
|
Ps. | (1,870,988 | ) | Ps. | (39,462 | ) | 527 | Ps. | (1,006,236 | ) | Ps. | (22,088 | ) | 1,268 | ||||||||||
|
Foreign exchange contracts (2)
|
(11,493,289 | ) | (306,896 | ) | 176 | (4,255,714 | ) | (228,076 | ) | 201 | ||||||||||||||
|
Total
|
Ps. | ( 13,364,277 | ) | Ps. | ( 346,358 | ) | Ps. | ( 5,261,950 | ) | Ps. | (250,164 | ) | ||||||||||||
|
(1)
|
Presented in the balance sheet within “Other assets”.
|
|
(2)
|
Presented in the balance sheet within “Other liabilities”.
|
GRUPO AVAL ACCIONES Y VALORES S.A. AND ITS SUBSIDIARIES
NOTES TO THE CONSOLIDATED FINANCIAL STATEMENTS
FOR THE YEARS ENDED DECEMBER 31, 2011, 2010 AND 2009
(
Stated in millions of Colombian pesos and U.S. dollars)
The following table presents the gain or (loss) from derivatives not designated as hedging instruments:
|
2011
|
2010
|
2009
|
||||||||||
|
Location of Gain or
(loss) recognized in income
on derivative
|
Amount of gain or (loss)
recognized in income on
derivative
|
Amount of gain or (loss)
recognized in income on
derivative
|
Amount of gain or (loss)
recognized in income on
derivative
|
|||||||||
|
Income from fair value adjustment and interest
|
Ps. | 3,826,809 | Ps. | 4,801,021 | Ps. | 1,439,125 | ||||||
|
Loss from fair value adjustment in foreign currency
|
(3,782,861 | ) | (4,706,960 | ) | (1,153,719 | ) | ||||||
| Ps. | 43,948 | Ps. | 94,061 | Ps. | 285,406 | |||||||
The following table presents the derivatives notional amounts as of December, 31:
| 2011 | 2010 | |||||||
|
Derivatives not designated as hedging
instruments under ASC 815
|
||||||||
|
Interest rate contracts
|
Ps. | 3,226,777 | Ps. | 520,695 | ||||
|
Foreign exchange contracts
|
20,760,855 | 10,585,838 | ||||||
| Ps. | 23,987,632 | Ps. | 11,106,533 | |||||
| 2011 | 2010 | |||||||
|
Derivatives designated as hedging instrument
|
||||||||
|
Foreign exchange contracts to sell
|
Ps. | (1,284,878 | ) | Ps. | 2,773 | |||
| Ps. | (1,284,878 | ) | Ps. | 2,773 | ||||
Embedded derivatives
Unlike Colombian Banking GAAP, U.S. GAAP requires the separation of embedded derivatives from the host contract with the embedded derivatives carried at fair value if the economic characteristics of the derivative are not clearly and closely related to the economic characteristics of the host contract. As of December 31, 2011 and 2010, no embedded derivatives requiring bifurcation have been detected by Grupo Aval.
|
j)
|
Investments in unaffiliated companies:
|
Under Colombian Banking GAAP, these investments are initially recognized at cost and subsequently measured depending on the liquidity of the security and the market of reference where it is traded in Colombia or other countries than Colombia. Equity securities listed, issued and traded in Colombia are mainly valued on a daily basis using prices published by authorized entities (i.e., the Colombian Stock Exchange). Equity securities non-listed, issued and traded in Colombia are valued based on acquisition cost which is later increased or decreased depending upon the investor’s percentage stake in all subsequent changes in the issuer’s shareholders’ equity. For this purpose, the issuer’s shareholders’ equity is calculated based on audited financial statements at the cut-off dates of June 30 and December 31 of each year.
Prior to August 24, 2009, equity securities were valued based on a liquidity-weighted stock index, calculated by the Colombian Stock Exchange, applicable on each of the dates on which such valuations were conducted. Depending on their liquidity levels, equity securities were valued as follows:
High-liquidity equity securities: based on the last daily average trade-weighted price published by the Colombian Stock Exchange.
GRUPO AVAL ACCIONES Y VALORES S.A. AND ITS SUBSIDIARIES
NOTES TO THE CONSOLIDATED FINANCIAL STATEMENTS
FOR THE YEARS ENDED DECEMBER 31, 2011, 2010 AND 2009
(
Stated in millions of Colombian pesos and U.S. dollars)
Medium-liquidity equity securities: based on the average price published by the Colombian Stock Exchange, which corresponded to the average trade-weighted price for the last five days on which such securities were traded.
Low-liquidity equity securities or those not listed on a stock exchange: based on the increase or decrease of an investor’s percentage stake in the issuers’ shareholders’ equity updated using the latest audited financial statements released by the issuer.
Under U.S. GAAP, investments where an investor does not have significant influence over the investee’s operations are accounted for at fair value if their fair value is readily determinable. The U.S. GAAP adjustment reflects on shareholders’ equity the difference between fair value under U.S. GAAP and the equity method of accounting recognized under Colombian Banking GAAP as well as differences in the fair value under Colombian Banking and U.S. GAAP. Depending on the classification under U.S. GAAP, trading or available for sale, the adjustment will remain in shareholders’ equity or be reclassified to the income statement as necessary.
Certain reclassifications made under Colombian Banking GAAP purposes from available for sale to trading described in Note 4 were reversed for U.S. GAAP purposes.
The U.S. GAAP adjustment on the consolidated statements of income for the years ended December 31, 2011 and 2010 relates to the following unaffiliated companies:
|
Equity securities
|
2011
|
2010
|
2009
|
|||||||||
|
Promigas S.A.
|
Ps. | - | Ps. | 8,187 | Ps. | (260,835 | ) | |||||
|
Empresa de Energía de Bogotá S. A.
|
- | (197,876 | ) | (170,220 | ) | |||||||
|
Gas natural S.A.E.S.P.
|
- | - | (25,683 | ) | ||||||||
|
Proenergía Internacional S.A.
|
(65,203 | ) | - | |||||||||
|
Sociedad de Inversiones en Energía S.A.(*)
|
188,738 | (188,738 | ) | - | ||||||||
|
Tableros y Maderas de Caldas S. A.(*)
|
- | 13,737 | (13,737 | ) | ||||||||
|
Total
|
Ps. | 123,535 | Ps. | ( 364,690 | ) | Ps. | (470,475 | ) | ||||
(*) During 2011 and 2010 the investment in SIE and Tablemac, respectively, were sold and the adjustment recorded were reversed against income.
The U.S. GAAP adjustment on shareholders´ equity relates to the following unaffiliated companies:
| 2011 | 2010 | |||||||||||||||||||||||
|
Equity securities
|
Amount under Colombian Banking
GAAP
|
U.S. GAAP
adjustments
|
Amount under U.S.
GAAP
|
Amount under Colombian Banking
GAAP
|
U.S. GAAP
adjustments
|
Amount under U.S.
GAAP
|
||||||||||||||||||
|
Promigas S.A. (1)
|
Ps. | - | Ps. | - | Ps. | - | Ps. | 655,298 | Ps. | - | Ps. | 655,298 | ||||||||||||
|
Empresa de Energía de Bogotá S. A.
|
384,402 | - | 384,402 | 570,878 | - | 570,878 | ||||||||||||||||||
|
Gas Natural S. A. E.S.P.
|
53,480 | 23,631 | 77,111 | 53,481 | 9,477 | 62,958 | ||||||||||||||||||
|
Sociedad de Inversiones en Energía S.A.(*)
|
- | - | - | 207,724 | - | 207,724 | ||||||||||||||||||
|
Mineros S. A.(*)
|
87,905 | - | 87,905 | 143,645 | - | 143,645 | ||||||||||||||||||
|
Proenergia Internacional S. A.
|
117,482 | (4,617 | ) | 112,865 | 54,250 | 59,943 | 114,193 | |||||||||||||||||
|
Bladex S.A.
|
191 | - | 191 | - | - | - | ||||||||||||||||||
|
Mastercard INT
|
74 | 827 | 901 | - | - | - | ||||||||||||||||||
|
Bolsa de Valores de Colombia S. A.
|
17,215 | 5,705 | 22,920 | 29,430 | 22,133 | 51,563 | ||||||||||||||||||
|
Total
|
Ps. | 660,749 | Ps. | 25,546 | Ps. | 686,295 | Ps. | 1,714,706 | Ps. | 91,553 | Ps. | 1,806,259 | ||||||||||||
|
(1)
|
See note iv k below.
|
|
(*)
|
During 2011 and 2010 the investment in SIE and Tablemac, respectively, were sold and the adjustment recorded were reversed against income.
|
GRUPO AVAL ACCIONES Y VALORES S.A. AND ITS SUBSIDIARIES
NOTES TO THE CONSOLIDATED FINANCIAL STATEMENTS
FOR THE YEARS ENDED DECEMBER 31, 2011, 2010 AND 2009
(
Stated in millions of Colombian pesos and U.S. dollars)
The following is the effect of the adjustment in the Statement of Income of non-affiliates companies:
|
2011
|
2010
|
2009
|
||||||||||
|
Balance at the beginning of the year
U.S. GAAP adjustment
|
Ps. | (91,553 | ) | Ps. | (223,365 | ) | Ps. | (24,480 | ) | |||
|
Adjustment recorded during the year to
statement of income
|
(123,535 | ) | 364,690 | 470,475 | ||||||||
|
Adjustment recorded to OCI under U.S. GAAP
(unrealized gains (losses) on available for
sale securities)
|
442,201 | (232,878 | ) | (669,360 | ) | |||||||
|
Reclassification to investment in affiliate
companies U.S. GAAP adjustment (1)
|
(252,659 | ) | - | - | ||||||||
|
Balance at the end of the year
|
Ps. | ( 25,546 | ) | Ps. | 91,553 | Ps. | 223,365 | |||||
|
(1)
|
Reclassification made due to increase of Grupo Aval in Promigas shareholders. See note i, k.
|
|
k)
|
Investments in affiliated companies:
|
This adjustment relates to investments in equity securities where Grupo Aval exercises significant influence over the investee’s operations.
Under Colombian Banking GAAP, investments in affiliated companies are recorded at its fair value similar to investments in unaffiliated companies, recording any effects derived from these adjustments on reappraisal of assets within the shareholders’ equity.
Under U.S. GAAP, these investments are recognized under the equity method of accounting determined, using the latest audited financial statements issued by the investees adjusted to U.S. GAAP with effect in the Consolidated Statement of Income or OCI for unrealized gains or losses.
On February 10, 2011, Corficolombiana, Empresa de Energia de Bogotá and two Colombian private investment funds, purchased from AEI three Special Purpose Vehicles located in Cayman Islands (AEI Promigas Holdings Ltd., AEI Promigas Ltd. and AEI Promigas Investments Ltd.) which together hold a 52.13% stake in Promigas SA ESP. Corficolombiana acquired 20.3% percent of the Special Purpose Vehicles. Corficolombiana and Investments Funds administrated by Porvenir, together with Corredores Asociados, an independent brokerage firm in Colombia, are also the investors in one of the private investment funds that participated in the transaction. Such private investment fund, which is independently directed by Corredores Asociados, acquired 47.9% of the Special Purpose Vehicles. The total purchase price of this transaction was US$ 792.8 million. Corficolombiana and Investments Funds administrated by Porvenir invested US$388.7 million and US$151.6 million in this transaction, respectively. Upon completion of the transaction, Corficolombiana had a 24.9% direct and indirect economic interest in Promigas. In addition, Corficolombiana and Investments Funds administrated by Porvenir together had a further 24.9% economic exposure to Promigas as a result of their respective holdings in the private investment fund
The pre-existing investment in Promigas and the investment in the special purpose entities under Colombian Banking GAAP are recorded as available for sale and the investment in the private fund as trading securities.
Due to the facts mentioned above, the pre-existing the 14.39% investment in Promigas, that was recorded for US GAAP purposes in previous years as available for sale with unrealized gains as part of the “other comprehensive income”, during 2011 was recognized under equity method prospectively with credit to the consolidated statement of income considering that its retroactive effects were considered immaterial. The respective U.S. GAAP adjustment accumulated in previous year under “investment in unaffiliated companies” caption, in 2011 was reclassified to this caption.
GRUPO AVAL ACCIONES Y VALORES S.A. AND ITS SUBSIDIARIES
NOTES TO THE CONSOLIDATED FINANCIAL STATEMENTS
FOR THE YEARS ENDED DECEMBER 31, 2011, 2010 AND 2009
(
Stated in millions of Colombian pesos and U.S. dollars)
The U.S. GAAP adjustment on the consolidated statements of income for the years ended December 31, 2011, 2010 and 2009 relates to the following affiliated companies:
|
2011
|
2010
|
December 31,2009
|
||||||||||
|
Equity securities
|
U.S. GAAP
adjustments
|
U.S. GAAP
adjustments
|
U.S. GAAP
adjustments
|
|||||||||
|
A.C.H. Colombia S.A.
|
Ps. | (566 | ) | Ps. | (1,496 | ) | Ps. | 1,030 | ||||
|
Aerocali S.A.
|
(486 | ) | (327 | ) | (296 | ) | ||||||
|
Colombiana de Extrusión S.A. Extrucol
|
(450 | ) | 254 | 93 | ||||||||
|
Compañía Aguas de Colombia
|
49 | 95 | 102 | |||||||||
|
Concesionaria Ruta del Sol SA
|
4,394 | - | - | |||||||||
|
Concesionaria Tibitoc S.A.
|
(1,990 | ) | (151 | ) | 1,510 | |||||||
|
Fidecomiso Meléndez
|
31 | 29 | 82 | |||||||||
|
Fondo Capital I Corredores Investment fund
|
(118,440 | ) | - | - | ||||||||
|
Promigas LTD
|
3,565 | - | - | |||||||||
|
Promigas Holdings LTD
|
3,998 | - | - | |||||||||
|
Promigas Invesments LTD
|
3,565 | - | - | |||||||||
|
Promigas S.A.
|
132,040 | - | - | |||||||||
|
Redeban Multicolor SA
|
12 | 724 | 773 | |||||||||
|
Sociedad Transportadora de Gas del Oriente S.A.
|
732 | (3,931 | ) | 1,505 | ||||||||
|
Sociedad Hotelera Cartagena de Indias
|
- | - | 6,776 | |||||||||
|
Total
|
Ps. | 26,454 | Ps. | (4,803 | ) | Ps. | 11,575 | |||||
The U.S. GAAP adjustment on shareholders´ equity relates to the following affiliated companies:
|
2011
|
2010
|
|||||||||||||||||||||||
|
Equity securities
|
Amount under Colombian Banking GAAP |
U.S. GAAP
adjustments
|
Amount under U.S. GAAP | Amount under Colombian Banking GAAP |
U.S. GAAP
adjustments
|
Amount under U.S. GAAP | ||||||||||||||||||
|
A.C.H. Colombia S.A.
|
Ps. | 2,032 | Ps. | 2,379 | Ps. | 4,411 | Ps. | 2,598 | Ps. | 2,379 | Ps. | 4,977 | ||||||||||||
|
Aerocali S.A.
|
2,474 | 2,223 | 4,697 | 2,474 | 2,709 | 5,183 | ||||||||||||||||||
|
Colombiana de Extrusión S.A. Extrucol
|
1,785 | 1,288 | 3,073 | 1,785 | 1,738 | 3,523 | ||||||||||||||||||
|
Compañía Aguas de Colombia
|
1,097 | 23 | 1,120 | 1,097 | (26 | ) | 1,071 | |||||||||||||||||
|
Concesionaria Ruta del Sol SA
|
41,534 | 4,809 | 46,343 | 15,487 | 155 | 15,642 | ||||||||||||||||||
|
Concesionaria Tibitoc S.A.
|
9,823 | 3,599 | 13,422 | 9,823 | 5,589 | 15,412 | ||||||||||||||||||
|
Fidecomiso Meléndez
|
14,825 | (256 | ) | 14,569 | 14,825 | (288 | ) | 14,537 | ||||||||||||||||
|
Fondo Capital I Corredores
Investment Fund
|
561,315 | (115,848 | ) | 445,467 | - | - | - | |||||||||||||||||
|
Promigas LTD
|
100,351 | 4,153 | 104,504 | - | - | - | ||||||||||||||||||
|
Promigas Holdings LTD
|
112,524 | 4,657 | 117,181 | - | - | - | ||||||||||||||||||
|
Promigas Invesments LTD
|
100,351 | 4,153 | 104,504 | - | - | - | ||||||||||||||||||
|
Promigas S.A.
|
533,165 | (119,916 | ) | 413,249 | - | - | - | |||||||||||||||||
|
Redeban Multicolor SA
|
4,552 | 1,244 | 5,796 | 4,552 | 7,187 | 11,739 | ||||||||||||||||||
|
Sociedad Transportadora de Gas del Oriente S.A.
|
- | - | - | 2,826 | (731 | ) | 2,095 | |||||||||||||||||
|
Total
|
Ps. | 1,485,828 | Ps. | ( 207,492 | ) | Ps. | 1,278,336 | Ps. | 55,467 | Ps. | 18,712 | Ps. | 74,179 | |||||||||||
GRUPO AVAL ACCIONES Y VALORES S.A. AND ITS SUBSIDIARIES
NOTES TO THE CONSOLIDATED FINANCIAL STATEMENTS
FOR THE YEARS ENDED DECEMBER 31, 2011, 2010 AND 2009
(
Stated in millions of Colombian pesos and U.S. dollars)
|
l)
|
Lessor accounting:
|
Under Colombian Banking GAAP, from the standpoint of the lessor, leases are classified as either financial or operating leases based on legal terms. Agreements with bargain purchase option are recognized as direct financial leases. Other agreements are recognized as operating leases. Assets provided through financial lease agreements are recorded as loans while assets provided through operating lease agreements are recorded as property, plant and equipment.
Under U.S. GAAP, leases are classified as either financial or operating leases based on the economic substance of the agreements using criteria established by ASC 840-10. Direct financing leases are carried at the aggregate of lease payments receivable plus estimated residual value of the leased property less unearned income.
The reconciliation adjustment relates to differences in the book value of certain operating lease agreements classified from the standpoint of the lessor, under Colombian Banking GAAP as a fixed asset in the balance sheet (cost less accumulated depreciation), which under U.S. GAAP, those leases are classified as direct leases, not recognizing the fixed assets posted under Colombian Banking GAAP and recording the corresponding account receivable.
This difference increases shareholders´ equity under U.S. GAAP by Ps. 8,535 and Ps. 5,729 in 2011 and 2010, respectively, and increases (decreases) the consolidated statements of income by Ps. 2,806, Ps. (3,477) and Ps. 2,239 in 2011, 2010 and 2009, respectively, due to the treatment from the U.S. GAAP standpoint.
The following lists the components of net investment in direct financial leases as of December 31, 2011 and 2010:
| 2011 | 2010 | |||||||
|
Total minimum lease payments to be received
|
Ps. | 7,379,684 | Ps. | 5,159,911 | ||||
|
Less: Amount representing estimated executory cost (such as taxes, maintenance, an insurance) including profit thereon, included total minimum lease payments
|
(1,172 | ) | (91,862 | ) | ||||
|
Minimum lease payments receivable
|
7,378,512 | 5,068,049 | ||||||
|
Estimated residual values of leased property (unguaranteed)
|
- | (2,807 | ) | |||||
|
Less: Unearned income
|
(985,758 | ) | (1,050,247 | ) | ||||
|
Net investment in direct financial leases
|
Ps. | 6,392,754 | Ps. | 4,014,995 | ||||
The following schedule shows the future minimum lease payments to be received on direct financial leases and operating leases for each of the next five years and thereafter.
|
Year Ended December 31, 2011
|
Financial leases
|
Operating leases
|
||||||
|
2012
|
Ps. | 2,211,640 | Ps. | 128 | ||||
|
2013
|
1,421,800 | 35 | ||||||
|
2014
|
1,096,311 | 35 | ||||||
|
2015
|
844,754 | 35 | ||||||
|
2016
|
675,619 | 27 | ||||||
|
2017 and thereafter
|
1,129,560 | - | ||||||
|
Total minimum future lease payments to be received
|
Ps. | 7,379,684 | Ps. | 260 | ||||
The total rental expense for all operating leases, except those with terms of a month or less that were not renewed, for 2011, 2010 and 2009 was Ps. 24,408, Ps. 27,204 and Ps. 24,579, respectively.
GRUPO AVAL ACCIONES Y VALORES S.A. AND ITS SUBSIDIARIES
NOTES TO THE CONSOLIDATED FINANCIAL STATEMENTS
FOR THE YEARS ENDED DECEMBER 31, 2011, 2010 AND 2009
(
Stated in millions of Colombian pesos and U.S. dollars)
|
m)
|
Business combinations
|
Purchase method of accounting
Under Colombian Banking GAAP and regarding all combinations accounted for prior to the acquisition of BAC Credomatic, the accounting for business combinations requires that the purchase price be allocated to the acquired assets and liabilities on the basis of their book values. The difference between the purchase price without including acquisition costs is recognized as goodwill. Goodwill is amortized for acquisitions made before 2006 over a 10-year period and for acquisitions effectively made after 2006, over a period of 20 years.
In 2010 and specifically regarding the BAC Credomatic’s acquisition, under Colombia Banking GAAP, the purchase price was allocated to the acquired assets mainly on the basis of their book value, although unlike prior years certain assets such as property plant and equipment were reappraised to fair value. Goodwill is being amortized in accordance to the applicable standards mentioned in Note 2(p). In addition, Grupo Aval recognized earnings of the acquired company as from the date of the acquisition.
U.S. GAAP requires that the purchase price be allocated to the identifiable assets acquired, including any intangibles assets and liabilities assumed, on the basis of their respective fair values. The difference between such amount and the purchase price is recognized as goodwill. Goodwill is not amortized but is subject to an annual impairment test.
The following is a detailed reconciliation of the adjustments between Colombian Banking GAAP and U.S. GAAP related to business combinations.
| 2011 | 2010 | |||||||
|
U.S. GAAP adjustment in goodwill (*)
|
Ps. | (233,841 | ) | Ps. | (296,954 | ) | ||
|
Purchase price allocated to intangible assets identified (2)
|
463,539 | 493,325 | ||||||
|
Fair value of other assets acquired and liabilities assumed (3)
|
(443,918 | ) | (374,985 | ) | ||||
|
Deferred income tax
|
307 | 288 | ||||||
|
|
Ps. | (213,913 | ) | Ps. | (178,326 | ) | ||
|
(*)
|
This adjustment represents the difference in the amount of goodwill under Colombian Banking GAAP, purchase price less book value of net assets acquired and related goodwill amortization, with U.S. GAAP which calculates goodwill as the purchase price less fair value of net assets acquired including intangible assets not recognized on books.
|
|
2011
|
2010
|
2009
|
||||||||||
|
Balance at the beginning of the year
U.S. GAAP adjustment
|
Ps. | 178,326 | Ps. | 132,911 | Ps. | 113,893 | ||||||
|
Adjustment recorded during the year to
statement of income (*)
|
66,161 | 6,593 | (32,466 | ) | ||||||||
|
Adjustment recorded to OCI under U.S. GAAP (Unrealized gains (losses) on available for sale securities
|
(36,769 | ) | (8,414 | ) | 51,484 | |||||||
|
Additional Paid in Capital (1)
|
6,195 | - | - | |||||||||
|
Adjustment recorded for BAC
|
- | 47,236 | - | |||||||||
|
Balance at the end of the year
|
Ps. | 213,913 | Ps. | 178,326 | Ps. | 132,911 | ||||||
|
(*)
|
The increase occurs in the variation of the fair value of investments acquired in the process of combination of business with Corfivalle were sold during the year.
|
GRUPO AVAL ACCIONES Y VALORES S.A. AND ITS SUBSIDIARIES
NOTES TO THE CONSOLIDATED FINANCIAL STATEMENTS
FOR THE YEARS ENDED DECEMBER 31, 2011, 2010 AND 2009
(
Stated in millions of Colombian pesos and U.S. dollars)
|
(1)
|
Goodwill
|
The details of goodwill under U.S. GAAP during the years ended December 31, 2011 and 2010 follow:
| 2011 | 2010 | |||||||
|
Balance at beginning of year
|
Ps. | 2,734,492 | Ps. | 986,648 | ||||
|
Additions related to the acquisition of BAC Credomatic
|
- | 1,718,522 | ||||||
|
Subsidiary acquired by Corficolombiana subsidiary (*)
|
131,465 | - | ||||||
|
Effects of foreign exchange rates
|
32,597 | 29,322 | ||||||
|
Adjustment to goodwill of BAC Credomatic
|
(21,650 | ) | - | |||||
|
Balance at end of year
|
2,876,904 | 2,734,492 | ||||||
|
Goodwill under Colombian Banking GAAP
|
3,110,745 | 3,031,446 | ||||||
|
Adjustment recorded under U.S. GAAP
|
Ps. | (233,841 | ) | Ps. | (296,954 | ) | ||
|
(*)
|
This amount represents the business combination of “Proyectos de infraestructura” in Colombia, subsidiary which operates in the non-financial sector. The process of purchase price allocation is being performed and it is expected to complete the appraisal and thus the allocation of amounts paid as soon as practically possible, but in no event later than one year after the date of acquisition.
|
Goodwill under U.S. GAAP, allocated by segments, as of December 31, 2011 and 2010 were:
| 2011 | 2010 | |||||||
|
Banco de Bogotá
|
Ps. | 2,642,749 | Ps. | 2,500,408 | ||||
|
Banco de Occidente
|
116,845 | 116,845 | ||||||
|
Banco Popular
|
117,310 | 117,239 | ||||||
|
Total Goodwill
|
Ps. | 2,876,904 | Ps. | 2,734,492 | ||||
Under U.S. GAAP, Grupo Aval tests goodwill for impairment at least annually using a two-step process that begins with an estimation of the fair value of a reporting unit. The first step is a screen for potential impairment and the second step measures the amount of impairment. Grupo Aval conducted qualitative impairment test of goodwill which indicated that there is not goodwill impairment for the years ended December 31, 2011, 2010 and 2009.
Additional disclosures for business combinations as required by ASC 805-10-50-2 (h)
On December 9, 2010, Leasing Bogota –Panama acquired 100% of preferred shares issued by BAC Credomatic GECF, Inc. (hereinafter “BAC”), a financial and banking group provider of a series of products and services for distribution in Central America. Through this acquisition, Banco de Bogotá, S. A. expands its operations outside Colombia. The consolidated results posted by BAC have been included in the financial statements since such date. The goodwill in the amount of US$913,709,140, equivalent to Ps. 1,718,522 under U.S. GAAP that resulted from such acquisition does primarily consist of the potential future business of BAC and the synergies and economies of scale expected from the combined operation of Leasing Bogota - Panamá and BAC. The premium value so acknowledged is nondeductible for tax purposes. The price paid for the acquisition was US$1,920 million, equivalent to Ps. 3,611,174, fully paid in cash.
GRUPO AVAL ACCIONES Y VALORES S.A. AND ITS SUBSIDIARIES
NOTES TO THE CONSOLIDATED FINANCIAL STATEMENTS
FOR THE YEARS ENDED DECEMBER 31, 2011, 2010 AND 2009
(
Stated in millions of Colombian pesos and U.S. dollars)
The following chart summarizes the amount paid for the acquisition of BAC and the value of assets acquired and liabilities assumed as of the date of acquisition:
|
Book value
as of
December 9, 2010
(US$)
|
Adjustments to
fair value
(US$)
|
Fair value as of
December 9, 2010
(US$)
|
Equivalent to million of
Colombian pesos
|
|||||||||||||
|
Purchase price
|
US$ 1,920,000,000
|
Ps. | 3,611,174 | |||||||||||||
|
Assets acquired and liabilities assumed
|
||||||||||||||||
|
Assets
|
||||||||||||||||
|
Cash and cash equivalents
|
US$ 1,743,312,897
|
US$ -
|
US$ 1,743,312,897
|
Ps. | 3,278,858 | |||||||||||
|
Term deposits
|
10,474,404 | - | 10,474,404 | 19,700 | ||||||||||||
|
Investments in Securities
|
491,612,673 | - | 491,612,673 | 924,635 | ||||||||||||
|
Loan Portfolio
|
5,323,504,175 | (135,268,946 | ) | 5,188,235,229 | 9,758,137 | |||||||||||
|
Properties and Equipment
|
179,009,299 | 66,783,116 | 245,792,415 | 462,291 | ||||||||||||
|
Intangible Assets
|
- | 206,600,000 | 206,600,000 | 388,577 | ||||||||||||
|
Assets held for sale
|
28,915,034 | (1,363,920 | ) | 27,551,114 | 51,819 | |||||||||||
|
Other Assets
|
235,606,751 | 48,260,353 | 283,867,104 | 533,903 | ||||||||||||
|
Total Assets Acquired
|
8,012,435,233 | 185,010,603 | 8,197,445,836 | 15,417,920 | ||||||||||||
|
Liabilities
|
||||||||||||||||
|
Deposits
|
5,643,240,740 | 15,747,329 | 5,658,988,069 | 10,643,538 | ||||||||||||
|
Obligations
|
1,091,347,445 | 5,878,085 | 1,097,225,530 | 2,063,684 | ||||||||||||
|
Other Liabilities
|
374,017,624 | 60,424,991 | 434,442,615 | 817,108 | ||||||||||||
|
Total Liabilities Assumed
|
7,108,605,809 | 82,050,405 | 7,190,656,214 | 13,524,330 | ||||||||||||
|
Non-controlled Participation
|
498,762 | - | 498,762 | 938 | ||||||||||||
|
Total Net Assets Acquired
|
US$
903,330,662
|
US$
102,960,198
|
US$ 1,006,290,860
|
Ps. | 1,892,652 | |||||||||||
|
Goodwill
|
913,709,140 | 1,718,522 | ||||||||||||||
|
Fair value of assets acquired and liabilities assumed
|
US$
1,920,000,000
|
Ps. | 3,611,174 | |||||||||||||
The fair value of assets acquired and liabilities assumed were based on information available on the date of acquisition. Grupo Aval considers that information provided constitutes a reasonable base for estimation of the fair value of assets acquired and liabilities assumed. During 2011 the appraisal of assets acquired and liabilities assumed and the allocation of amount paid was completed and as result a credit was made to good will by $21,650 with charge to intangible asset by $25,643 and a credit to other asset by $3,993.
The methods used for determination of the fair value of assets acquired and liabilities assumed are described below:
Loan portfolio
The fair value of loan portfolio was determined on the basis of discounted cash flows through utilization of net returns. The portfolio was segmented in sets of loans with similar characteristics, including, but not limited to, the type of loan, its currency of disbursement, applicable interest rate, collateral, amongst other factors. The estimated flows for each set of loans were prepared done the basis of the outstanding principal amount pending payment, the weighted average interest rate applicable, prepayments and the remaining weighted tenor for maturity. Forecasted cash flows were discounted at a market rate deemed appropriate for each specific group of loans under analysis. Market rates were established through utilization of observable market prices and internal pricing policies for extension of such loans.
Methods used for estimation of fair values are extremely sensitive to the assumptions and assessments made. Although it was the intention of the administration to use those assumptions and assessments that best reflect the loan portfolios acquired as well as current market conditions, a higher degree of subjectivity is nevertheless inherent to those values when compared to values determined in active markets.
GRUPO AVAL ACCIONES Y VALORES S.A. AND ITS SUBSIDIARIES
NOTES TO THE CONSOLIDATED FINANCIAL STATEMENTS
FOR THE YEARS ENDED DECEMBER 31, 2011, 2010 AND 2009
(
Stated in millions of Colombian pesos and U.S. dollars)
Securities
Securities are predominantly valued at the prices quoted by market. In the case of non-availability of a given price, the fair value is determined using the market price of a similar instrument. In the events in which the most significant elements of valuation are not directly observable in the market, the incumbent securities are valued through use of the best information available for determination of the fair value. Such information may be developed internally and does take into account the premiums that would be required by a market participant.
Relationship with depositors
The relationship with depositors (hereinafter “CDI”) is a measure of the value of sight deposits, savings deposits and monetary market deposits that are acquired through business combinations. The fair value of CDI was determined on the basis of the present value of cost savings attributable to financing received from depositors, as compared with an alternative financing source.
Relationship with customers
Relationship with credit cards, commercial customers and affiliated commerce establishments, measure the value of those relationships for the BAC Credomatic given the history of recurrent cash flows derived from current customers and the likelihood that those customers continue generating flows in the future. The reasonable value of intangible assets was established through use of the methodology of multi-period excess income, which basic assumption is that the fair value of a customer relationship may be determined on the basis of the present value of net future flows collected through the life of the underlying asset.
Trademarks and brands
A brand or trademark of high recognition in the market has considerable value for an entity. The determination of the fair value of trademarks and brands takes into consideration, amongst other factors, the royalty payment rate comparable for the industry and the total forecasted income flows to be generated by the banking business.
Assets held for sale
Assets held for sale include real estate properties acquired in lieu of payment of loans. Assets assigned were booked at their estimated fair value less the cost of their sale on the date of acquisition, through estimations conducted by the administration, on the basis of available appraisals or on the opinion of real estate brokers. Estimated sales cost are base on the divestiture experience of properties of similar nature and on regular market conditions for real estate transactions.
Deposit liabilities
Fair value used for sight and savings deposits is, by definition, equal to the amount payable at sight as of the date of acquisition. The fair value for fixed term deposits is estimated through utilization of the method of discounted cash flows using interest rates offered by similar banks operating in each country and each currency, applicable to the different groups of outstanding maturities. In those cases in which there are no available market interest rates for a particular maturity, rate extrapolation was conducted on the basis of available interest rates.
Deferred taxes
Deferred income taxes are those arising from differences between amounts registered in the financial statements and the amounts registered on the fiscal basis of assets acquired and liabilities assumed as a result of the acquisition.
GRUPO AVAL ACCIONES Y VALORES S.A. AND ITS SUBSIDIARIES
NOTES TO THE CONSOLIDATED FINANCIAL STATEMENTS
FOR THE YEARS ENDED DECEMBER 31, 2011, 2010 AND 2009
(
Stated in millions of Colombian pesos and U.S. dollars)
Debt instruments
The reasonable value of debt instruments was estimated through utilization of discounted cash flows. Contractual interest rates were compared to market interest rates on the date of valuation. Those debt instruments whose contractual interest rate were either above or below market rates were adjusted to reflect either a premium or a discount.
Other assets and liabilities
Due to the relative short term nature of both other assets and liabilities, it is considered that their book value fairly approaches their fair value.
The table below presents a condensed income statement data of BAC Credomatic for the year ended December 31 2011 and for a month period ended December 31, 2010 from the date of acquisition, which represents the U.S. GAAP results of BAC Credomatic since the acquisition date included in Grupo Aval’s consolidated income statement for the year ended December 31, 2011 and 2010.
|
Year ended
December 31, 2011
(unaudited)
|
One month period ended
December 31, 2010
(unaudited)
|
|||||||
|
Total interest income
|
Ps. | 1,340,876 | Ps. | 117,274 | ||||
|
Total interest expense
|
(315,400 | ) | (28,178 | ) | ||||
|
Net interest income
|
1,025,476 | 89,096 | ||||||
|
Total provisions, net
|
(153,448 | ) | (698 | ) | ||||
|
Net interest income after provisions
|
872,028 | 88,398 | ||||||
|
Income from investment portfolio
|
71,491 | 4,162 | ||||||
|
Total other income
|
667,891 | 69,638 | ||||||
|
Total operating expenses
|
(1,058,950 | ) | (115,321 | ) | ||||
|
Income before income tax expense
|
552,461 | 46,877 | ||||||
|
Income tax expense
|
(153,603 | ) | (8,127 | ) | ||||
|
Net income
|
398,857 | 38,750 | ||||||
|
Less: net income attributable to non controlling interest
|
(138,340 | ) | (13,449 | ) | ||||
|
Net income attributable to Grupo Aval’s shareholders
|
Ps. | 260,517 | Ps. | 25,301 | ||||
The table below presents the unaudited pro forma condensed consolidated income statement under U.S. GAAP for the year ended December 31, 2010 and 2009 which give effect to Grupo Aval’s acquisition of BAC Credomatic as if it had occurred on January 1, 2009.
The unaudited pro forma condensed consolidated income statement presented below is derived from the historical financial statements of BAC Credomatic and subsidiaries, prepared in accordance with U.S. GAAP, and from the condensed historical consolidated financial statements of Grupo Aval and subsidiaries. Grupo Aval has elected to present the pro forma information directly in U.S. GAAP.
The unaudited pro forma condensed consolidated income statement was prepared using the purchase method of accounting, as provided by U.S. GAAP ASC 805, “Business Combinations,” based on available information and assumptions that Grupo Aval believes to be reasonable. All pro forma adjustments are (1) directly attributable to the acquisition, (2) factually supportable and (3) expected to have a continuing impact.
Grupo Aval believes that the assumptions used to derive the unaudited pro forma condensed consolidated income statement are reasonable given the information available; however, such assumptions are subject to change and the effect of any such change could be material. The unaudited pro forma condensed consolidated income statement has been provided for information purposes only and is not necessarily indicative of the financial condition or results of operations that would have been achieved had the transaction actually been completed on the dates indicated and do not purport to be indicative of results of operations at any future date or for any future period.
GRUPO AVAL ACCIONES Y VALORES S.A. AND ITS SUBSIDIARIES
NOTES TO THE CONSOLIDATED FINANCIAL STATEMENTS
FOR THE YEARS ENDED DECEMBER 31, 2011, 2010 AND 2009
(
Stated in millions of Colombian pesos and U.S. dollars)
Unaudited Pro Forma Condensed Consolidated Income Statement for the year ended December 31, 2010 and 2009 are as follows:
|
December 31, 2010
|
December 31, 2009
|
|||||||
|
Total interest income
|
Ps. | 6,417,000 | Ps. | 7,698,400 | ||||
|
Total interest expense
|
(2,366,900 | ) | (3,556,600 | ) | ||||
|
Net interest income
|
4,050,100 | 4,141,800 | ||||||
|
Total provisions, net
|
(779,500 | ) | (1,075,100 | ) | ||||
|
Net interest income after provisions
|
3,270,600 | 3,066,700 | ||||||
|
Income from investment portfolio
|
1,128,900 | 659,300 | ||||||
|
Total other income
|
3,214,100 | 3,952,000 | ||||||
|
Total operating expenses
|
(4,579,300 | ) | (4,595,100 | ) | ||||
|
Income before income tax expense
|
3,034,300 | 3,082,900 | ||||||
|
Income tax expense
|
(1,019,300 | ) | (1,080,300 | ) | ||||
|
Net income
|
2,015,000 | 2,002,600 | ||||||
|
Less: net income attributable to noncontrolling interest
|
(895,100 | ) | (862,200 | ) | ||||
|
Net income attributable to Grupo Aval’s shareholders
|
Ps. | 1,119,900 | Ps. | 1,140,400 | ||||
|
(2)
|
Intangible Assets:
|
This adjustment represents the difference in the amount of intangible assets under Colombian Banking GAAP and U.S. GAAP. Colombian Banking GAAP does not require the recognition of intangible assets, while U.S. requires identification and valuation of intangibles in a business combination.
The changes of Grupo Aval’s intangible assets, net under U.S. GAAP for the years ended December 31, 2011 and 2010 were as follows:
| 2011 | 2010 | |||||||
|
Balance at beginning of year
|
Ps. | 493,325 | Ps. | 110,844 | ||||
|
Additions related to business combinations
|
- | 395,428 | ||||||
|
Adjustment to BAC Credomatic intangibles
|
25,643 | - | ||||||
|
Effect of foreign change rate
|
5,902 | - | ||||||
|
Amortization
|
(61,331 | ) | (12,948 | ) | ||||
|
Balance at end of year
|
Ps. | 463,539 | Ps. | 493,325 | ||||
Below is a detailed description of each intangible asset recognized.
Brands
Grupo Aval determines brand value through the royalty savings method (relief from royalties). This method measures the savings a company generates as a result of not having to pay for a license to use such brand. The value of the brands is equal to the sum of the net present value of the after-tax savings a company generates during the period in question as a result of not having to pay for the use of such a brand plus the net present value of the after-tax savings a company would generate in perpetuity after the last year of the period in question.
Core Deposit
Core deposit intangibles, defined as the premium paid to acquire the core deposits of an institution, was determined by using the alternative funding method, which estimates the net present value of the cost difference or “spread” between the cost of using the core deposit intangibles and the cost of an alternative source of funding under current market conditions.
GRUPO AVAL ACCIONES Y VALORES S.A. AND ITS SUBSIDIARIES
NOTES TO THE CONSOLIDATED FINANCIAL STATEMENTS
FOR THE YEARS ENDED DECEMBER 31, 2011, 2010 AND 2009
(
Stated in millions of Colombian pesos and U.S. dollars)
Customer relationships
Customer relationship is defined as the relationship that Grupo Aval has established with its customers through contracts. Customer relationship arise from contractual rights, thus are classified as intangible assets that meet the contractual-legal criterion.
Intangibles are calculated based on the expected gains to be received from these relationships for a specific period of time.
Intangible assets under U.S. GAAP were as follows:
|
December 31, 2011
|
||||||||||||
|
Gross carrying
amount
|
Accumulated
amortization
|
Net
|
||||||||||
|
Non-amortizable intangible assets
|
Ps. | 113,913 | Ps. | - | Ps. | 113,913 | ||||||
|
Amortizable intangible assets
|
453,944 | (104,318 | ) | 349,626 | ||||||||
| Ps. | 567,857 | Ps. | (104,318 | ) | Ps. | 463,539 | ||||||
|
December 31, 2010
|
||||||||||||
|
Gross carrying
amount
|
Accumulated
amortization
|
Net
|
||||||||||
|
Non-amortizable intangible assets
|
Ps. | 112,308 | Ps. | - | Ps. | 112,308 | ||||||
|
Amortizable intangible assets
|
423,710 | (42,693 | ) | 381,017 | ||||||||
| Ps. | 536,018 | Ps. | ( 42,693 | ) | Ps. | 493,325 | ||||||
The following table shows the intangible assets gross amount under U.S. GAAP, detailed with their respective useful lives:
|
Weighted average useful life
(
months
)
|
||||||||||||
|
2011
|
2010
|
|||||||||||
|
Brands
|
Ps. | 113,913 | Ps. | 112,308 | - | |||||||
|
Core deposits
|
188,699 | 182,136 | 192 | |||||||||
|
Customer relationships
|
244,652 | 221,286 | 178 | |||||||||
|
Other
|
20,593 | 20,288 | 60 | |||||||||
| Ps. | 567,857 | Ps. | 536,018 | |||||||||
Grupo Aval expects that the estimated aggregate amortization expense for intangible assets for the next five fiscal years to be as shown in the following table.
| Fiscal year ending December 31 | Aggregate amortization expense | |||
|
2012
|
Ps. | 46,714 | ||
|
2013
|
41,942 | |||
|
2014
|
37,874 | |||
|
2015
|
33,158 | |||
|
Total
|
Ps. | 159,688 | ||
GRUPO AVAL ACCIONES Y VALORES S.A. AND ITS SUBSIDIARIES
NOTES TO THE CONSOLIDATED FINANCIAL STATEMENTS
FOR THE YEARS ENDED DECEMBER 31, 2011, 2010 AND 2009
(
Stated in millions of Colombian pesos and U.S. dollars)
|
(3)
|
Fair value of other asset acquired and liabilities assumed
|
The following is the consolidated movement of fair value of assets acquired and (liabilities) assumed in business combination:
|
2010
|
Effect of foreign exchange rates
|
Amortization
|
2011
|
|||||||||||||
|
Investment securities
|
Ps. | (4,938 | ) | Ps. | - | Ps. | 1,051 | Ps. | (3,887 | ) | ||||||
|
Loan portfolio
|
(190,627 | ) | (2,806 | ) | 69,138 | (124,295 | ) | |||||||||
|
Allowance
|
160,307 | 2,405 | (121,462 | ) | 41,250 | |||||||||||
|
Fixed assets
|
253,175 | 1,692 | (55,250 | ) | 199,617 | |||||||||||
|
Other assets
|
69,834 | 1,088 | (23,277 | ) | 47,645 | |||||||||||
|
Reappraisal of assets
|
(440,084 | ) | (2,371 | ) | 16,155 | (426,300 | ) | |||||||||
|
Deposits
|
(34,638 | ) | (272 | ) | 25,099 | (9,811 | ) | |||||||||
|
Other liabilities
|
(123,751 | ) | (2,104 | ) | 21,982 | (103,873 | ) | |||||||||
|
Non controlling interest
|
(64,263 | ) | - | - | (64,263 | ) | ||||||||||
| Ps. | (374.985 | ) | Ps. | (2,368 | ) | Ps. | (66,564 | ) | Ps. | (443.917 | ) | |||||
|
2009
|
Additions
|
Amortization
|
2010
|
|||||||||||||
|
Investment securities
|
Ps. | (5,983 | ) | Ps. | - | Ps. | 1,045 | Ps. | (4,938 | ) | ||||||
|
Loan portfolio
|
- | (211,580 | ) | 20,953 | (190,627 | ) | ||||||||||
|
Allowance
|
- | 184,431 | (24,124 | ) | 160,307 | |||||||||||
|
Fixed assets
|
154,623 | 112,787 | (14,235 | ) | 253,175 | |||||||||||
|
Other assets
|
1,295 | 72,520 | (3,981 | ) | 69,834 | |||||||||||
|
Reappraisal of assets
|
(296,171 | ) | (142,138 | ) | (1,775 | ) | (440,084 | ) | ||||||||
|
Deposits
|
- | (34,638 | ) | - | (34,638 | ) | ||||||||||
|
Other liabilities
|
- | (123,751 | ) | - | (123,751 | ) | ||||||||||
|
Non controlling interest
|
(64,263 | ) | - | - | (64,263 | ) | ||||||||||
| Ps. | (210,499 | ) | Ps. | (142,369 | ) | Ps. | (22,117 | ) | Ps. | (374,985 | ) | |||||
Under Colombian Banking GAAP assets acquired and liabilities assumed are recorded at its carrying amount. Under U.S. GAAP, fair value adjustments are allocated to each acquired asset and liability and the differences between the fair value and book value of the depreciable assets are amortized during the estimated period of useful life.
|
n)
|
Non-controlling interest
|
Under Colombian Banking GAAP, the non-controlling interest is presented as a separate line within total liabilities and thus, does not comprise part of shareholders’ equity.
For U.S. GAAP purposes, as of January 1, 2009, Grupo Aval adopted ASC 810-10-65-65-1 which requires the non-controlling interest in subsidiaries to be classified as a separate component of shareholders’ equity in the consolidated financial statements. Additionally, consolidated net income and comprehensive income are reported with separate disclosures of the amounts attributable to the parent company and the non-controlling interest.
GRUPO AVAL ACCIONES Y VALORES S.A. AND ITS SUBSIDIARIES
NOTES TO THE CONSOLIDATED FINANCIAL STATEMENTS
FOR THE YEARS ENDED DECEMBER 31, 2011, 2010 AND 2009
(
Stated in millions of Colombian pesos and U.S. dollars)
The following is the reconciliation of non-controlling interests between Colombian Banking GAAP and U.S. GAAP:
| 2011 | 2010 | |||||||
|
Non-controlling interest under Colombian Banking GAAP
|
Ps. | 4,927,029 | Ps. | 4,475,495 | ||||
|
Adjustments incorporated under U.S. GAAP reconciliation:
|
||||||||
|
Non-controlling interest in reappraisal of assets (1)
|
(975,478 | ) | (982,267 | ) | ||||
|
Non-controlling interest participation in U.S. GAAP adjustments
|
(15,842 | ) | 552,643 | |||||
|
Business combination (2)
|
64,263 | 132,073 | ||||||
|
Changes in participation acquired by the controlling interest
|
151,752 | - | ||||||
|
Non-controlling interest in Mandatory Convertible Bonds in shares
|
- | 886,264 | ||||||
|
Non-controlling interest in variable interest entities
|
- | 4,610 | ||||||
| (775,305 | ) | 593,323 | ||||||
|
Non-controlling interest under U.S. GAAP
|
Ps. | 4,151,724 | Ps. | 5,068,818 | ||||
|
(1)
|
As explained in note (iv) (d) above, under Colombian Banking GAAP the surplus between the appraisal and the book value of the asset is recorded in the unconsolidated balance sheet under the asset caption “Reappraisal of assets” and the shareholders’ equity under the caption “Equity surplus: reappraisals of assets”. This adjustment relates to the reversal of the participation of the non-controlling interest in reappraisal of assets.
|
|
(2)
|
During 2005, Corporación Financiera del Valle “Corfivalle” (an entity not controlled by Grupo Aval) acquired the shares of Corporación Financiera Colombiana (a subsidiary of Grupo Aval) with an exchange of equity interest. With this transaction Grupo Aval acquired the control of “Corfivalle”, (transaction commonly referred to as reverse acquisition) which was recorded for U.S. GAAP reconciliation purposes according to ASC 323 (previously EITF 98-13), determining the fair value of the asset given, of the net assets acquired and the fair value of the non-controlling interest after the merger process.
|
As discussed in Note (1) c., Grupo Aval acquired during 2011 an additional 63.07% of Banco Popular through an interchange of a non-monetary transaction by Grupo Aval preferred shares’. This operation was recorded at its carrying amount, difference between Colombian banking GAAP and U.S. GAAP relates to the adjustments of the reconciliation between both principles.
Under Colombian Banking GAAP, the agreement whereby Grupo Aval assigned to Adminegocios & Cia. S.C.A its right to acquire up to 2,605,000 mandatorily convertible bonds issued by Banco de Bogotá by $118,450 is regarded as the sale of a stake of Banco de Bogotá by Grupo Aval, as a direct consequence of this transaction, Grupo Aval recognized a gain of Ps 61,222 and reduced its stake in Banco de Bogotá from 65,33% to 64,44%. Under US GAAP this agreement is considered, in substance, a loan in accordance with ASC 470 and thus no gain was recognized and Grupo Aval’s stake in Banco de Bogotá was not reduced.
|
o)
|
Guarantees and contingencies:
|
|
1)
|
Guarantees
|
Grupo Aval provides its clients with a variety of guarantees and similar arrangements, including stand-by letters of credit and bank guarantees.
Under Colombian Banking GAAP, at the inception of the guarantees, Grupo Aval recognizes in Memorandum Accounts the full guaranteed amount. Any premium received is recognized as collected in the Consolidated Statements of Income.
GRUPO AVAL ACCIONES Y VALORES S.A. AND ITS SUBSIDIARIES
NOTES TO THE CONSOLIDATED FINANCIAL STATEMENTS
FOR THE YEARS ENDED DECEMBER 31, 2011, 2010 AND 2009
(
Stated in millions of Colombian pesos and U.S. dollars)
Under U.S. GAAP, at the inception of a guarantee, Grupo Aval recognizes in its Consolidated Balance Sheet a liability for all guarantees granted. The liability recognized is the premium received or receivable which represents the fair value of the guarantee at its inception and it is subsequently amortized over the term of the guarantee.
The table below shows guarantees by expiration dates and maximum potential amount of future losses:
|
Expire within one year
|
Expire after one year
|
Total amount
outstanding
|
Maximum potential
amount of future losses
|
|||||||||||||||||||||||||||||
|
2011
|
2010
|
2011
|
2010
|
2011
|
2010
|
2011
|
2010
|
|||||||||||||||||||||||||
|
Financial standby letters of credit
|
Ps. | 1,281,702 | Ps. | 513,686 | Ps. | 193,926 | Ps. | 386 | Ps. | 1,475,629 | Ps. | 514,072 | Ps. | 1,475,629 | Ps. | 514,072 | ||||||||||||||||
|
Bank guarantees
|
757,267 | 1,139,141 | 358,882 | 579,212 | 1,069,243 | 1,718,354 | 1,069,243 | 1,718,354 | ||||||||||||||||||||||||
|
Total
|
Ps. | 2,038,969 | Ps. | 1,652,827 | Ps. | 552,808 | Ps. | 579,598 | Ps. | 2,544,872 | Ps. | 2,232,426 | Ps. | 2,544,872 | Ps. | 2,232,426 | ||||||||||||||||
|
Notional amount
|
Fair value
|
Notional amount
|
Fair value
|
|||||||||||||
|
2011
|
2010
|
|||||||||||||||
|
Financial standby letters of credit
|
Ps. | 1,475,629 | Ps. | 376 | Ps. | 514,072 | Ps. | 341 | ||||||||
|
Bank guarantees
|
1,069,243 | 12,734 | 1,718,354 | 1,039 | ||||||||||||
|
Total
|
Ps. | 2,544,872 | Ps. | 13,110 | Ps. | 2,232,426 | Ps. | 1,380 | ||||||||
|
2)
|
Contingencies
|
Under Colombian Banking GAAP, contingencies are recognized in the following events:
Information available prior to issuance of the financial statements indicates that it is probable (>50%) that an asset had been impaired or a liability had been incurred at the date of the financial statements; and the amount of loss can be reasonably estimated.
A provision for contingent event is recorded at the time judgment is issued against Grupo Aval, without reference to the evaluation of the provable final outcome.
For U.S. GAAP, ASC 450, “Accounting for Contingencies”, provides guidance for recording contingencies. Under ASC 450, there are three levels of assessment of contingent events – probable, reasonably possible and remote. The term “probable” in ASC 450 is defined as “the future event or events are likely to occur”. The term “reasonably possible” is defined as “the chance of the future event or events occurring is more than remote but less than likely”. In addition, the term “remote” is defined as “the chance of the future event or events occurring is slight”.
Under ASC 450, an estimated loss related to a contingent event is to be accrued by a charge to income if both of the following conditions are met:
Information available prior to issuance of the financial statements indicates that it is probable (>75%) that an asset had been impaired or a liability had been incurred at the date of the financial statements; and
The amount of loss can be reasonably estimated.
The amount recorded is an estimate of the amount of loss at the date of the financial statements. If the contingent event is evaluated to be reasonably possible, no provision for the contingent event may be made, but disclosure of the event is required.
GRUPO AVAL ACCIONES Y VALORES S.A. AND ITS SUBSIDIARIES
NOTES TO THE CONSOLIDATED FINANCIAL STATEMENTS
FOR THE YEARS ENDED DECEMBER 31, 2011, 2010 AND 2009
(
Stated in millions of Colombian pesos and U.S. dollars)
|
3)
|
Loyalty Programs
|
Grupo Aval’s Banking subsidiaries have programs of loyalty to its customers consisting in assigning points for purchases with credit cards and by the use of some financial services granted by their banks, the validity of the points ranges between 18 and 36 months and allows customers to exchange them for prizes such as miles, hotels and other articles.
Under U.S. GAAP recorded a liability for the value of the existing points which are earned and expected to be redeemed based on the statistics of redemption. The estimated cost per point includes the average cost of the awards. Periodic adjustments to this liability are recorded as other operating expenses on the Consolidated Statement of Income based on the award earned, awards redeemed, awards expired, changes in the cost base and changes in the award system. The liability is recorded under the accrued liabilities and provisions account in the Consolidated Balance Sheets.
|
Net Income
|
Shareholders’
equity
|
|||||||||||||||||||
|
2011
|
2010
|
2009
|
2011
|
2010
|
||||||||||||||||
|
Guarantees
|
1,093 | (2,350 | ) | (2,431 | ) | (1,581 | ) | (2,674 | ) | |||||||||||
|
Contingencies (*)
|
21,237 | 6,017 | 307 | 29,721 | 8,484 | |||||||||||||||
|
Loyalty programs
|
3,186 | (11,026 | ) | 1,697 | (6,144 | ) | (9,330 | ) | ||||||||||||
|
Reclassification to Uncertainty in income taxes
|
- | - | - | - | (2,159 | ) | ||||||||||||||
| 25,516 | (7,359 | ) | (427 | ) | 21,996 | (5,679 | ) | |||||||||||||
|
(*)
|
During 2011, Banco de Bogotá reversed provision that was no longer will be required
|
|
p)
|
Equity tax:
|
In accordance with Law 1111 of 2006, companies and individuals who possess liquid equity in excess of Ps. 3,000 were subject to a special equity tax during 2011. Under Colombian Banking GAAP, the equity tax was recorded against deferred charges and amortized on straight monthly basis between 2011 to 2014 with charge to the consolidated statement of income.
Under U.S. GAAP, tax expense derived from the equity tax is recorded directly on the Consolidated Statements of Income, discounted at its present value.
The adjustment to Shareholders´ Equity under U.S. GAAP by Ps. (477,368) and Ps. – as of December 31, 2011 and 2010, respectively, and in Consolidated Statements of Income of Ps. (483,741), Ps. (1,220) and Ps. (10,842) in 2011, 2010 and 2009, respectively.
|
q)
|
Securitizations:
|
Grupo Aval, through its subsidiary Banco Comercial AV Villas, securitizes performing and non-performing mortgage housing loans through third parties. These securitizations are a source of funding for Grupo Aval in addition to transferring the economic risk of the performing mortgage housing loans to third parties.
Under Colombian Banking GAAP, securitizations of performing and non-performing mortgage loans are recorded as sales and, therefore, securitized loans are removed from Grupo Aval’s balance sheet. Additionally, Grupo Aval recognizes in the Consolidated Statement of Income, at the moment of the operation, the difference between the book value of the securitized portfolio and the cash received in consideration.
GRUPO AVAL ACCIONES Y VALORES S.A. AND ITS SUBSIDIARIES
NOTES TO THE CONSOLIDATED FINANCIAL STATEMENTS
FOR THE YEARS ENDED DECEMBER 31, 2011, 2010 AND 2009
(
Stated in millions of Colombian pesos and U.S. dollars)
Before 2010 under U.S. GAAP, if the special purpose entity (SPE) activities were sufficiently restricted to meet certain accounting requirements in order to be considered a qualifying special-purpose entity (QSPE), the trust was not consolidated by the seller of the transferred assets. Additionally, under ASC 810, if trusts other than QSPEs met the definition of a variable interest entity (VIE), Grupo Aval banking subsidiaries evaluated whether the banks were the primary beneficiary of the trust and, if so, was required to consolidate it.
Under U.S. GAAP, since January 2010 when an entity transfers financial assets should evaluate them for consolidation under the newly adopted VIE consolidation guidance. The party that has the power to direct the activities of a variable interest entity (VIE) that most significantly impact the VIE’s economic performance and the obligation to absorb losses of the entity or the right to receive benefits from the entity that could potentially be significant to the VIE, is considered to have a controlling financial interest and, thus, is the primary beneficiary and should consolidate the VIE.
The table below presents a summary of the assets and liabilities and related net income in trust funds which have been included on Grupo Aval’s Consolidated Balance Sheet at December 31, 2011 and 2010, for U.S. GAAP purpose:
|
|
2011
|
2010
|
||||||
|
Total assets
|
Ps. | 2 | Ps. | 2 | ||||
|
Total liabilities
|
- | - | ||||||
|
Total shareholders’ equity
|
2 | 2 | ||||||
|
Total liabilities and shareholders´ equity
|
Ps. | 2 | Ps. | 2 | ||||
|
Net income
|
Ps. | - | Ps. | (6,382 | ) | |||
As of December 31, 2011 and 2010, total loans securitized amounted to Ps.- and Ps. -, respectively, which has an allowance by Ps. -, Ps. – and Ps. 5,488 for 2011, 2010 and 2009, respectively. Securitizations made during the year ended December 31, 2011 did not originate U.S. GAAP differences.
|
r)
|
Variable interest entities:
|
Under Colombian Banking GAAP, consolidation is appropriate when an entity holds the majority of voting rights of another entity.
Under U.S. GAAP, application of the majority voting interest requirement to certain types of entities may not identify the party with a controlling financial interest because that interest may be achieved through other arrangements. Although ASC 810-10-15-14 states that consolidated financial statements include subsidiaries in which Grupo Aval has a controlling financial interest, (i.e., a majority voting interest), U.S. GAAP also requires a company to consolidate a variable interest entity (“VIE”) if that company is a primary beneficiary that has the power to direct the activities of a variable interest entity that most significantly impact the entity's economic performance and has the power to direct the activities of a variable interest entity that most significantly impact the entity's economic performance and has the obligation to absorb losses of the entity that could potentially be significant to the variable interest entity or the right to receive benefits from the entity that could potentially be significant to the variable interest. Under Colombian Banking GAAP, no such concept as a variable interest entity exists.
The overall methodology for evaluating transactions and relationships under the VIE requirements includes the following two steps:
Determine whether the entity meets the criteria to qualify as a VIE; and
Determine whether Grupo Aval is the primary beneficiary of the VIE.
GRUPO AVAL ACCIONES Y VALORES S.A. AND ITS SUBSIDIARIES
NOTES TO THE CONSOLIDATED FINANCIAL STATEMENTS
FOR THE YEARS ENDED DECEMBER 31, 2011, 2010 AND 2009
(
Stated in millions of Colombian pesos and U.S. dollars)
In performing the first step, significant factors and judgments were considered in making the determination as to whether an entity is a VIE.
For each VIE identified, Grupo Aval performs the second step and evaluates whether it is the primary beneficiary of the VIE by considering the following significant factors and criteria:
Whether the Grupo Aval has the obligation to absorb losses of the entity that could potentially be significant to the variable interest entity;
Whether Grupo Aval has the right to receive benefits from the entity that could potentially be significant to the variable interest; and
Whether Grupo Aval has the power to direct the activities of the variable interest entity that most significantly impact the entity's economic performance has.
Grupo Aval’s management has identified the following VIEs in accordance with the variable interest model as prescribed in U.S. GAAP, and concluded that Grupo Aval itself should be regarded as primary beneficiary. The table below provides details regarding the nature, purpose, size, activities of the entity and nature of Grupo Aval’s involvement with each entity.
|
Entity
|
Nature
|
Purpose
|
Activities of the
entity
|
Nature of Grupo Aval’s involvement
with the entity
|
Total assets
|
|||||||||||
|
2011
|
2010
|
|||||||||||||||
|
Megabanco Foreclosed Assets Trust
|
Trust managed by Helm Fiduciaria
|
Sale of non- performing assets
|
Administration and sale of non performing assets
|
Primary beneficiary of expected losses and returns
|
Ps. | 5,791 | Ps. | 7,929 | ||||||||
|
Corficolombiana Banco de Bogotá A Trust
|
Trust managed by Fiduciaria Bogotá
|
Collection of non -performing loans
|
Administration and collection of non-performing loans
|
Primary beneficiary of expected losses and returns
|
499 | 4,676 | ||||||||||
|
Fiduciaria de Occidente
|
Primary beneficiary of expected losses and returns
|
15,730 | - | |||||||||||||
|
Foreclosed Assets & Mortgage Loans Trust
|
Securitization
of mortgage loans
|
Collection of non -performing loans
|
Administration and collection of non-performing loans
|
Primary beneficiary of expected losses and returns
|
- | 19,185 | ||||||||||
|
Mecanicos Asociados Cocelco
|
Electric energy contract
|
Supply of electric energy
|
Electric energy generation with gas
|
Primary beneficiary of expected losses and returns
|
- | 120,985 | ||||||||||
|
Total
|
Ps. | 22,020 | Ps. | 152,775 | ||||||||||||
In addition and due to the consolidation of certain VIEs, Grupo Aval recognized additional allowances under U.S. GAAP of Ps. 62,142 and Ps. 153,743 for 2011 and 2010, respectively.
The table below presents a summary of the assets and liabilities of VIEs under U.S. GAAP which have been consolidated on Grupo Aval’s Consolidated Balance Sheet at December 31, 2011 and 2010:
GRUPO AVAL ACCIONES Y VALORES S.A. AND ITS SUBSIDIARIES
NOTES TO THE CONSOLIDATED FINANCIAL STATEMENTS
FOR THE YEARS ENDED DECEMBER 31, 2011, 2010 AND 2009
(
Stated in millions of Colombian pesos and U.S. dollars)
| 2011 | 2010 | |||||||
|
Assets
|
||||||||
|
Loans and other receivables
|
Ps. | 81,341 | Ps. | 298,177 | ||||
|
Foreclosed assets
|
32,224 | 56,103 | ||||||
|
Allowance for loan losses of loans, and other receivables
|
(62,142 | ) | (153,743 | ) | ||||
|
Allowance for foreclosed assets
|
(28,188 | ) | (48,672 | ) | ||||
|
Other assets
|
(1,215 | ) | 910 | |||||
|
Total assets
|
Ps. | 22,020 | Ps. | 152,775 | ||||
|
Total liabilities
|
Ps. | 18,513 | Ps. | 82,229 | ||||
|
Total controlling interests shareholders equity
|
26,560 | 65,936 | ||||||
|
Total non-controlling interests (see note iv) n))
|
- | 4,610 | ||||||
|
Total shareholders’ equity
|
(23,053 | ) | 70,546 | |||||
|
Total liabilities and Shareholders’ equity
|
Ps. | 22,020 | Ps. | 223,321 | ||||
|
Net income Attributable to Grupo Aval
|
Ps. | ( 5,351 | ) | Ps. | 35,823 | |||
Grupo Aval’s maximum exposure to loss as a result of its involvement with VIEs was Ps. 26,560 and Ps. 65,936 at December 31, 2011 and 2010, respectively.
Grupo Aval did not provide any additional financial support to these or other VIEs during 2011. Further, Grupo Aval does not have any contractual commitments or obligations to provide additional financial support to these VIEs. Investors in debt securities issued by the securitization entities have no recourse to other assets of Grupo Aval.
|
s)
|
Consolidation
|
Under Colombian Banking GAAP, an entity is consolidated when it is owned, directly or indirectly, 50% or more of the outstanding voting shares, as well as company in which despite holding less than 50% of the outstanding voting shares, the holding company controls it, except for companies received as foreclosed assets held for sale. The majority interest in Inca Furehauf S.A. was received as a foreclosed asset by certain subsidiaries of Grupo Aval. In accordance to Colombian Banking GAAP, this entity was not consolidated and it was classified as foreclosed asset up to 2009, thereafter it was consolidated.
Under U.S. GAAP, Inca Furehauf S.A. is consolidated since Grupo Aval holds more than 50% interests and controls the investee. The effects of the consolidation of this entity is Ps. (2,274) for 2009 for the consolidated statement of income, for 2010 there is not effect since Furehauf S.A. was consolidated under Colombian Banking GAAP.
|
t)
|
Cumulative translation adjustment:
|
The following table presents the U.S. GAAP adjustment in the consolidated net income for the years ended December 31, 2011, 2010 and 2009 related to cumulative translation adjustments:
| 2011 | 2010 | 2009 | ||||||||||
|
Translation of financial statements (1)
|
Ps. | (43,144 | ) | Ps. | (43,885 | ) | Ps. | 16,223 | ||||
|
Hedge of Net Investment in Foreign Operations (2)
|
76,342 | 5,298 | - | |||||||||
|
Total U.S. GAAP income statement adjustment
|
Ps. | 33,198 | Ps. | (38,587 | ) | Ps. | 16,223 | |||||
(1) Translation of financial statements
For Colombian Banking GAAP purposes, translation adjustments originated in the statement of income accounts resulting from subsidiaries with a functional currency different from the reporting currency (Colombian pesos) are included in the consolidated statement of income.
GRUPO AVAL ACCIONES Y VALORES S.A. AND ITS SUBSIDIARIES
NOTES TO THE CONSOLIDATED FINANCIAL STATEMENTS
FOR THE YEARS ENDED DECEMBER 31, 2011, 2010 AND 2009
(
Stated in millions of Colombian pesos and U.S. dollars)
Under U.S. GAAP, according to ASC 830 and ASC 220, translation adjustments are presented as a component of shareholders’ equity within other comprehensive income.
(2) Hedge of Net Investment in Foreign Operations
In relation with the acquisition of BAC Credomatic and the related capital investment of Banco de Bogotá in Leasing Bogotá Panamá of Ps. 3,428,037 equivalent to US$ 1.76 billion (the “Hedged Item”) (see Note 1(b)), Grupo Aval Credit Risk Committee designated U.S. dollar forwards and U.S. dollar denominated debt as accounting hedges under U.S. GAAP, to hedge the exchange rate exposure of positions in U.S. dollars against the Colombian Peso. As of December 31, 2011, of the Ps. 3,428,037 investment in Leasing Bogotá Panamá, Ps. 1.66 billion represents the portion of the net investment being hedged through the aforementioned strategy.
The increase in 2010 is because of the effect of the foreign exchange hedge from the acquisition of BAC (one month was recognized), while 2011 includes the effect for twelve months.
Forwards
Since December 30, 2010, for both Colombian Banking GAAP and U.S. GAAP, U.S. dollar forward contracts were formally designated as hedging instruments over a portion of the net investment in Leasing Bogotá Panamá. As of December 31, 2011, the notional amounts of the U.S. dollar forwards amounted to U.S. $658 million which were used to hedge a corresponding portion of the foreign net investment. These forwards are entered into with other financial counterparties and do follow a documented “rolling hedge” strategy, by means of entering into new forwards simultaneously as those previously incepted do expire. This hedge strategy mitigates the risk that the USD depreciates against the Colombian Peso, which does creates a loss within the Cumulative Translation Adjustment reflected within the Other Comprehensive Income in Shareholders Equity.
As mentioned in Note 2(k), under Colombian Banking GAAP, changes in fair value of derivatives used as hedges of net investment in foreign operations, to the extent ineffective, are recorded as a component of stockholders’ equity. The effective portion of the hedge relationship is recorded in the income statement.
Under US GAAP, changes in the fair values of derivative and non-derivative financial instruments used as hedges of net investments in foreign operations are, to the extent ineffective, recorded in the income statement. However, in accordance with ASC 815-35-35-16 “Method based on Changes in Forward Exchanges Rates”, all changes in fair value relating solely to the foreign exchange rate portion of the hedge relationship are recorded in the foreign currency translation adjustment account within accumulated other comprehensive income (loss).
Foreign currency denominated debt
Under Colombian Banking GAAP, only derivative financial instruments can be designated as accounting hedges. Under U.S. GAAP (ASC 815 “Derivatives and Hedging”), entities may designate a non-derivative financial instrument that gives rise to a foreign currency transaction gain or loss, in accordance with ASC 830 “Foreign Currency Matters,” as a hedge of the foreign currency exposure of a net investment in a foreign operation.
On December 7, 2010, and only for U.S. GAAP purposes, the related U.S. dollar denominated debt incurred by Banco de Bogotá for capitalizing Leasing Bogotá Panamá was designated as an accounting hedge over a portion of the net investment in Leasing Bogotá Panamá. The initial borrowing was paid on December 20, 2011 and the hedge was replaced for a new borrowing of US$ 408,7 and the issuance of bonds in the international market through a Rule 144-A offering by US$591,3 million.
Therefore, while under U.S. GAAP exchange rate fluctuations derived from the U.S. dollar denominated debt designated as the hedging instrument are recorded in shareholders' equity in accordance with requirements for hedge accounting, under Colombian Banking GAAP no hedge accounting is applied and therefore any exchange rate fluctuation is recorded in the consolidated statement of income.
GRUPO AVAL ACCIONES Y VALORES S.A. AND ITS SUBSIDIARIES
NOTES TO THE CONSOLIDATED FINANCIAL STATEMENTS
FOR THE YEARS ENDED DECEMBER 31, 2011, 2010 AND 2009
(
Stated in millions of Colombian pesos and U.S. dollars)
Effectiveness test
As mentioned in Note 2(k), Colombian Banking GAAP requires entities to perform effectiveness tests on a monthly basis and for each reporting period retrospective and prospective, in order to assess whether the derivative used in its hedging transaction is expected to be and has been highly effective, in a range between 80% and 100%, in offsetting changes in the fair value of the hedged item. Colombian Banking GAAP does not require or recommends the application of any specific effectiveness test method for net investment hedges.
U.S. GAAP requires entities to perform effectiveness testing whenever earnings or financial statements are reported and at least every three months. For U.S. GAAP purposes, Grupo Aval documented the effectiveness of its hedge of its investment in Leasing Bogotá Panamá contemporaneously and its assessment is based on the beginning balance of the portion of net investment hedged at the inception of the hedge relationship. Since Banco de Bogotá´s investment in Leasing Bogotá Panamá will fluctuate during the year, Grupo Aval will evaluate the hedging relationship at least every three months or earlier depending on the maturity of the hedging instruments and the result of monthly effectiveness test. In addition, effectiveness range for U.S. GAAP is set between 80% and 125%, in offsetting changes in the fair value of the hedged item.
Effectiveness test - Forwards
For U.S. GAAP purposes, Grupo Aval follows the forward-rate method for the U.S. dollar forwards in order to test effectiveness.
For the U.S. dollar forwards designated as hedging instrument, any ineffectiveness could be generated between the hedging instrument and the hedged item if both have different notional amounts or different currencies. Grupo Aval will measure hedge ineffectiveness by comparing the change in the value of the actual derivative with the change in value of a hypothetical derivative with the same maturity.
Under Colombian Banking GAAP and as stated previously, there are no specific requirements regarding the application of a particular effectiveness test and therefore, Grupo Aval will follow also the forward-rate method.
Effectiveness test - Foreign currency denominated debt
For U.S. GAAP purposes, Grupo Aval follows the spot exchange rate method for the U.S. dollar denominated debt instrument in order to test effectiveness.
For the U.S. dollar denominated debt instrument designated as hedging instrument, the translation gain or loss that is recorded in the foreign currency translation adjustment account is based on the spot exchange rate between the functional currency of Leasing Bogotá S.A. Panamá and the investor’s functional currency. To the extent the notional amount of the hedging instrument exactly matches the hedged net investment and the underlying exchange rate of the derivative hedging instrument relates to the exchange rate between the functional currency of the net investment and the investor’s functional currency (or, in the case of a non-derivative debt instrument, such instrument is denominated in the functional currency of the net investment), no ineffectiveness is recorded in earnings.
U.S. GAAP adjustment for the year ended December 31, 2011
For the year ended December 31, 2011, Ps. 77,048 related to (i) foreign exchange differences of the U.S. dollar denominated debt and (ii) changes in the fair value of U.S. dollar forwards contracts, which were both recorded in the income statement for Colombian Banking GAAP purposes, were reclassified to the cumulative translation adjustment account within accumulated other comprehensive income (loss) for U.S. GAAP purposes.
GRUPO AVAL ACCIONES Y VALORES S.A. AND ITS SUBSIDIARIES
NOTES TO THE CONSOLIDATED FINANCIAL STATEMENTS
FOR THE YEARS ENDED DECEMBER 31, 2011, 2010 AND 2009
(
Stated in millions of Colombian pesos and U.S. dollars)
|
u)
|
Receivables for Issuance of Equity
|
During 2011 and in connection with its issuance of preferred shares, Grupo Aval provided to its clients, the option of financing the acquisition of the mentioned shares through credit facilities that ranged from 1 to 3 years. As part of the financing program, shares were pledged until the extinguishment of the liability by the creditor.
Under Colombian Banking GAAP, any issuance of shares payable in notes, is recognized directly as a increase in equity, debiting loans.
Under U.S. GAAP, in accordance to ASC 505-10-45, if notes received in exchange of an issuance of shares, are not convertible into cash in the short-term, it requires to offset notes and stock issued in the equity section. As of December 31, 2011, an adjustment of Ps. 250,031 was posted reducing equity to recognized notes received under U.S. GAAP.
|
v)
|
Earnings per share
|
Under Colombian Banking GAAP, earnings per share (“EPS”) are computed by dividing net income by the weighted-average number of common and preferred shares outstanding for each period presented.
U.S. GAAP requires dual presentation of basic and diluted EPS for entities with complex capital structures, as well as a reconciliation of the basic EPS computation to the diluted EPS computation. Basic EPS is calculated by dividing net income available to common shareholders by the weighted average number of common shares outstanding. Diluted EPS assumes the issuance of common shares for all dilutive potential common shares outstanding during the reporting period. For the years ended December 31, 2011, 2010 and 2009, Grupo Aval had a simple capital structure and there were no outstanding dilutive instruments. Therefore, there was no difference between basic or diluted EPS for these years.
Up to December 31, 2010, Grupo Aval only had common shares outstanding. During 2011, Grupo Aval issued non-voting preferred shares, which according to the local law has the right to receive a non-cumulative minimum preferential dividend equivalent of Ps. 1 per semester (one Colombian peso) and also participate in the same proportion that the common shares in the net income which will be distributed.
Based on the above, the following table of net income per share for years ended December 31, 2011, 2010 and 2009
in millions of pesos, except per share data
):
| 2011 | 2010 | 2009 | ||||||||||
|
U.S. GAAP consolidated net income
|
Ps. | 1,702,089 | Ps. | 1,778,441 | Ps. | 1,687,180 | ||||||
|
Less
: participation of non-controlling interest
|
(816,747 | ) | (813,122 | ) | (752,631 | ) | ||||||
|
Net income attributable to controlling interest
|
Ps. | 885,342 | Ps. | 965,319 | Ps. | 934,549 | ||||||
|
Weighted average number of shares
outstanding used in basic EPS calculation
|
16,306,613,443 | 13,943,980,671 | 13,935,966,116 | |||||||||
|
Basic and diluted earnings per share (U.S. GAAP):
|
||||||||||||
|
Net income per share attributable to controlling interest (pesos)
|
Ps. | 54.29 | (*) | Ps. | 69.23 | Ps. | 67.06 | |||||
(*)Our by-laws provide for two classes of shares: common shares and shares with a preferred dividend, liquidation preference and no voting power (except in limited, extraordinary circumstances). Holders of preferred shares are entitled to receive a minimum dividend after deducting losses affecting the capital, and deducting any amounts set aside for legal reserve, but before creating or accruing for any other reserve and before any declared dividends are paid to holders of common shares. Dividends to holders of common shares must be approved by the shareholders. If no dividends are declared, no holder of Grupo Aval’s preferred or common shares will be entitled to payment. The minimum dividend will be equal to Ps 1.00 in each calendar semester, so long as this value is higher than the dividend paid to the holders of common shares. If
GRUPO AVAL ACCIONES Y VALORES S.A. AND ITS SUBSIDIARIES
NOTES TO THE CONSOLIDATED FINANCIAL STATEMENTS
FOR THE YEARS ENDED DECEMBER 31, 2011, 2010 AND 2009
(
Stated in millions of Colombian pesos and U.S. dollars)
the minimum preferred dividend is not equal or higher than the per share dividend on the common shares, the minimum dividend will be equal to the dividend paid to the holders of common shares, if any.
As such, Grupo Aval’s non-voting, preferred shares do not meet the definition of preferred shares under US GAAP, which would normally have priority to receive dividends. In addition, preferred shares under US GAAP would have a minimum dividend - similar to the coupon on a bond- , for which unpaid dividends would accumulate to subsequent periods, characteristics that are not found in Grupo Aval’s non-voting preferred shares. For these reasons, under U.S. GAAP non-voting preferred shares issued by Grupo Aval are considered “Participating securities”. Due to the aforementioned considerations, net income per share for 2011 has been calculated dividing the net income attributable to controlling interest under U.S. GAAP by the combined weighted average of common and preferred shares for that year.
|
w)
|
Estimated Fair Value of Financial Instruments
|
Fair value of financial instruments
Effective January 1, 2008, Grupo Aval adopted ASC 820 - Fair Value Measurements (incorporated in ASC 820). Among other things, ASC 820 defines fair value, establishes a consistent framework for measuring fair value and expands disclosure for each major asset and liability category measured at fair value on either a recurring or non-recurring basis.
The framework for measuring fair value under Colombian Banking GAAP is consistent with ASC 820, except for considerations about own credit risk, counterparty risk and valuation of collaterals in the valuation of derivatives.
Fair-Value Hierarchy
ASC 820 establishes a fair value hierarchy that prioritizes the inputs to valuation techniques used to measure fair value. Observable inputs reflect market data obtained from independent sources, while unobservable inputs reflect Grupo Aval’s market assumptions. The three levels of the fair value hierarchy under ASC 820 are described below:
Level 1
- Unadjusted quoted prices in active markets that are accessible at the measurement date for identical, unrestricted assets or liabilities.
Level 2
- Inputs to the valuation methodology include quoted prices for similar assets and liabilities in active markets, and inputs that are observable for the asset or liability, either directly or indirectly, for substantially the full term of the asset or liability. Inputs include the following:
|
(a)
|
Quoted prices for similar assets or liabilities in active markets;
|
|
(b)
|
Quoted prices for identical or similar assets or liabilities in non-active markets;
|
|
(c)
|
Pricing models whose inputs are observable for substantially the full term of the asset or liability;
|
|
(d)
|
Pricing models whose inputs are derived principally from or corroborated by observable market data through correlation or other means.
|
Level 3
- Prices or valuation techniques that require inputs that are both significant to the fair value measurement and unobservable (i.e., supported by little or no market activity).
Grupo Aval considers relevant and observable market prices in its valuations where possible. The frequency of transactions, the size of the bid-ask spread and the amount of adjustment necessary when comparing similar transactions are all factors in determining the liquidity of markets and the relevance of observed prices in those markets.
Determination of Fair Value
Fair value is based upon quoted market prices, where available. If listed prices or quotes are not available, fair value is based upon internally developed models that use primarily market-based or independently-sourced market parameters, including interest rate yield curves, option volatilities and currency rates. Valuation adjustments may be made to ensure that financial instruments are recorded at fair value. These adjustments include, among others, amounts to reflect counterparty credit quality, liquidity and unobservable parameters that are applied consistently over time.
GRUPO AVAL ACCIONES Y VALORES S.A. AND ITS SUBSIDIARIES
NOTES TO THE CONSOLIDATED FINANCIAL STATEMENTS
FOR THE YEARS ENDED DECEMBER 31, 2011, 2010 AND 2009
(
Stated in millions of Colombian pesos and U.S. dollars)
The following section describes the valuation methodologies used by Grupo Aval, including an indication of the level in the fair-value hierarchy in which each instrument is generally classified. Where appropriate, the description includes details of the valuation models, the key inputs to those models, as well as any significant assumptions.
|
1.
|
Fair value measurement on a recurring and non-recurring basis (ASC 820)
|
Investment securities
|
a)
|
Debt securities:
|
When available, Grupo Aval uses quoted market prices to determine the fair value and such items are classified in Level 1 of the fair value hierarchy. For not-traded or over-the–counter securities, Grupo Aval generally determines fair value utilizing industry standard valuation models and standard techniques. These techniques include determination of expected future cash flows which are discounted using curves of the applicable currencies and interest.
Grupo Aval may also use quoted prices for recent trading activity of assets with similar characteristics to the security. If deem appropriate, Grupo Aval adjusts these values for liquidity risks using their own methodologies. These securities priced using such methods are generally classified as Level 2. However, when less liquidity exists for a security, a quoted price is stale or prices from independent sources vary, a security is generally classified as Level 3.
Derivatives
The fair values of derivative assets and liabilities traded in the over-the-counter market are determined using industry standard valuation models that require the use of multiple market inputs including interest rates, prices and indices to generate continuous yield and volatility factors. The majority of market inputs is actively quoted and can be validated through external sources, including brokers, market transactions and third-party pricing services. Estimation risk is greater for derivative asset and liability positions that are either option-based or have longer maturity dates where observable market inputs are less readily available or are unobservable, in which case, quantitative-based extrapolations of rate, price or index scenarios are used in determining fair values. The fair values of derivative assets and liabilities include adjustments for market liquidity, counterparty credit quality and other deal specific factors, where appropriate. Derivatives are classified in level 2 and level 3.
Credit Valuation Adjustment
Under Colombian Banking GAAP, the measurement of the fair value of derivatives does not include the credit valuation adjustment “CVA”. Under U.S. GAAP, beginning January 1, 2008 with the adoptions of ASC 820, Grupo Aval is measuring the effects of the credit risk of its counterparties and its own creditworthiness in determining fair value of the swap and forward derivatives.
On 31 December of 2011 and 2010, the total adjustment on CVA was Ps. (940) and Ps. (416), respectively.
Counterparty credit-risk adjustments are applied to derivatives when Grupo Aval’s position is an asset and its credit risk is incorporated when the position is a liability. Grupo Aval attempts to mitigate credit risk with third parties which are international banks by entering into master netting agreements. When assessing the impact of credit exposure, only the net counterparty exposure is considered at risk due to the offsetting of certain same-counterparty positions and the application of cash and other collateral. Grupo Aval generally calculates the asset’s credit risk adjustment for derivatives transacted with international financial institutions by incorporating indicative credit related pricing that is generally observable in the market such as Credit Default Swaps spreads (“CDS”). The credit-risk adjustment for derivatives transacted with non-public counterparties is calculated by incorporating unobservable credit data derived from internal credit qualifications to financial institutions and corporate companies located in Colombia.
GRUPO AVAL ACCIONES Y VALORES S.A. AND ITS SUBSIDIARIES
NOTES TO THE CONSOLIDATED FINANCIAL STATEMENTS
FOR THE YEARS ENDED DECEMBER 31, 2011, 2010 AND 2009
(
Stated in millions of Colombian pesos and U.S. dollars)
A hundred basis points reduction in our own credit spreads when determining the fair value of the liabilities associated with derivative contracts could result in an increase of the associated liability of approximately Ps. 704 in 2011 Ps. 608 in 2010 and Ps. 473 in 2009.
A hundred basis points increase in the counterparty credit spreads when determining the fair value of the assets associated with derivative contracts could result in a reduction of the associated asset of approximately Ps. 532 in 2011, Ps. 668 in 2010 and Ps. 383 in 2009.
Impaired loans measured at fair value
Grupo Aval measured certain impaired loans based on the fair values of the collateral less costs of sale. The fair values of the collateral were determined using internal valuation techniques. Grupo Aval may also use experts to validate the prices obtained using internal valuation techniques.
Asset-backed securities
Grupo Aval invests in asset-backed securities with underlying assets corresponding to mortgages issued by financial institutions. The asset-backed securities are denominated in local market as Titulos Inmobiliarios Participativos (and can be classified as available for sale securities). These asset-backed securities have different vintages and are generally classified as AAA by credit rating agencies. Grupo Aval does not expect significant changes in those ratings. Fair values were estimated using discounted cash flow models having as key economic assumptions estimates of prepayment rates, weighted-average lives of the securitized mortgage portfolio, probability of default and interest rate curves.
|
2.
|
Fair value disclosures
|
ASC 825 requires entities to disclose the fair value of financial instruments, both assets and liabilities recognized and not recognized in the statement of financial position, for which it is practicable to estimate fair value. Fair value disclosures are within the scope of ASC 820; therefore, Grupo Aval applies ASC 820 when performing fair value measurements for disclosure purposes. The financial instruments below are not recorded at fair value on a recurring and nonrecurring basis:
Short-term financial instruments
Short-term financial instruments are valued at their carrying amounts included in the Consolidated Balance Sheet, which are reasonable estimates of fair value due to the relatively short maturities. This approach was used for cash and cash equivalents, accrued interest receivable, customers’ acceptances, accounts receivable, accounts payable, accrued interest payable, and bank acceptances outstanding.
Deposits
The fair value of time deposits was estimated based on the discounted cash flow values determined using the current offering rate for the corresponding maturity as the discount rate. Fair value of deposits with undefined maturities represents the amount payable on demand as of the Balance Sheet date.
Interbank borrowings and borrowings from banks and others
Short-term interbank borrowings and borrowings from banks and others have been valued at their carrying amounts because of their relatively short-term nature. The long-term debts were determined based on the discounted value of cash flows using the rates currently offered for debt of similar remaining maturities and its own creditworthiness.
GRUPO AVAL ACCIONES Y VALORES S.A. AND ITS SUBSIDIARIES
NOTES TO THE CONSOLIDATED FINANCIAL STATEMENTS
FOR THE YEARS ENDED DECEMBER 31, 2011, 2010 AND 2009
(
Stated in millions of Colombian pesos and U.S. dollars)
Long-term debt
The fair value of long-term debt, which comprises bonds issued by Grupo Aval and its subsidiaries, was estimated substantially based on quoted market prices. Certain bonds which are not publicly traded were determined based on the discounted value of cash flows using the rates currently offered for debt of similar remaining maturities and its own creditworthiness.
Items Measured at Fair Value on a Recurring Basis
The following table presents, for each of the fair-value hierarchy levels, Grupo Aval’s assets and liabilities measured at fair value on a recurring basis at December 31, 2011 and 2010 based on the Consolidated Balance Sheets under Colombian Banking GAAP.
Fair value measurements at December 31, 2011
|
Level 1
|
Level 2
|
Level 3
|
Balance
|
|||||||||||||
|
Assets
|
||||||||||||||||
|
Trading securities
|
Ps. | 2,985,393 | Ps. | 994,965 | Ps. | 61 | Ps. | 3,980,419 | ||||||||
|
Investments securities
|
||||||||||||||||
|
Debt securities
|
9,187,464 | 462,765 | 55,277 | 9,705,506 | ||||||||||||
|
Equity securities
|
609,184 | 77,111 | - | 686,295 | ||||||||||||
|
Derivatives
|
- | 229,799 | 70,460 | 300,259 | ||||||||||||
|
Liabilities
|
||||||||||||||||
|
Derivatives
|
- | (346,358 | ) | - | (346,358 | ) | ||||||||||
|
Total
|
Ps. | 12,782,041 | Ps. | 1,418,282 | Ps. | 125,798 | Ps. | 14,326,121 | ||||||||
Fair value measurements at December 31, 2010
|
Level 1
|
Level 2
|
Level 3
|
Balance
|
|||||||||||||
|
Assets
|
||||||||||||||||
|
Trading securities
|
Ps. | 2,783,023 | Ps. | 1,182,363 | Ps. | 27,266 | Ps. | 3,992,652 | ||||||||
|
Investments securities
|
||||||||||||||||
|
Debt securities
|
9,355,290 | 1,047,998 | 69,788 | 10,473,076 | ||||||||||||
|
Equity securities
|
1,088,003 | 718,256 | - | 1,806,259 | ||||||||||||
|
Derivatives
|
- | 186,147 | 64,267 | 250,414 | ||||||||||||
|
Liabilities
|
||||||||||||||||
|
Derivatives
|
- | (250,164 | ) | - | (250,164 | ) | ||||||||||
|
Total
|
Ps. | 13,226,316 | Ps. | 2,884,600 | Ps. | 161,321 | Ps. | 16,272,237 | ||||||||
GRUPO AVAL ACCIONES Y VALORES S.A. AND ITS SUBSIDIARIES
NOTES TO THE CONSOLIDATED FINANCIAL STATEMENTS
FOR THE YEARS ENDED DECEMBER 31, 2011, 2010 AND 2009
(
Stated in millions of Colombian pesos and U.S. dollars)
The table below presents a roll forward for all assets and liabilities measured at fair value on a recurring basis using significant unobservable inputs (Level 3) during 2011:
|
2011
|
||||||||||||||||||||
|
Available for sale
|
Trading
|
Investment Securities
|
Derivatives contracts
|
Total
|
||||||||||||||||
|
Beginning balance
|
Ps. | 58,247 | Ps. | 122 | Ps. | - | Ps. | 64,268 | Ps. | 122,637 | ||||||||||
|
Transfer into level 3
|
- | - | 8,554 | - | 8,554 | |||||||||||||||
|
Transfer out of level 3
|
- | - | - | - | - | |||||||||||||||
|
Total Gains or Losses
|
601 | - | - | - | 601 | |||||||||||||||
|
Included in earnings (or changes in net assets)
|
- | (6 | ) | - | (1,763 | ) | (1,768 | ) | ||||||||||||
|
Included in other comprehensive income
|
- | (1,144 | ) | - | (1,144 | ) | ||||||||||||||
|
Purchases, issuances, sales and settlements:
|
- | - | ||||||||||||||||||
|
Purchases
|
- | - | - | 50,898 | 50,898 | |||||||||||||||
|
Issuances
|
- | - | - | - | - | |||||||||||||||
|
Sales
|
- | - | - | (42,943 | ) | (42,943 | ) | |||||||||||||
|
Settlements
|
- | - | - | - | - | |||||||||||||||
|
Prepaids
|
- | (56 | ) | - | - | (56 | ) | |||||||||||||
|
Ending Balance
|
Ps. | 58,848 | Ps. | 61 | Ps. | 7,410 | Ps. | 70,460 | Ps. | 136,779 | ||||||||||
The following methods and assumptions were used to estimate the fair value of each class of financial instruments.
Investment securities
: Equity securities classified as trading and available for sale are measured at fair value using market quotes and margins of similar assets. The methodology used is based on the present value of future cash flows considering the facial features of each title, for which the discount rates are constructed from curves of prices of similar assets in an active market, such as:
– Curved zero coupon TES UVR
– Reference curve Bloomberg for banks of rating BBB (C883 Composite)
– Curve IRS (Interest Rate Swap) USD LIBOR
– Curve CDS (Credit Default Swap) of the Republic of Colombia
Forwards
. Grupo AVAL ranked as level 3 financial derivatives traded on the OTC market (forward currency, on Interest Rate Swaps “IRS” and swaps on rate of Cross Currency Swap “CCS”) with customers in the real sector (manufacturing), that require the addition of no observable market inputs for the determining of the “CVA” Credit Value Adjustment. Those inputs are, the administrative costs for the placement of credits portfolio, Except that the curves of interest rates and exchange rates, are observable in the market.
|
Trading
securities
|
Available for
sale securities
|
Derivatives
|
||||||||||
|
Balance as of January 1, 2010
|
Ps. | 24,569 | Ps. | 28,356 | Ps. | 40,540 | ||||||
|
Total gain or losses (realized / unrealized):
|
||||||||||||
|
Included in earnings
|
2,727 | (2,208 | ) | 72,031 | ||||||||
|
Included in other comprehensive income
|
- | - | - | |||||||||
|
Purchase, issuance and settlements
|
(30 | ) | 43,640 | (48,304 | ) | |||||||
|
Balance as of December 31, 2010
|
Ps. | 27,266 | Ps. | 69,788 | Ps. | 64,267 | ||||||
GRUPO AVAL ACCIONES Y VALORES S.A. AND ITS SUBSIDIARIES
NOTES TO THE CONSOLIDATED FINANCIAL STATEMENTS
FOR THE YEARS ENDED DECEMBER 31, 2011, 2010 AND 2009
(
Stated in millions of Colombian pesos and U.S. dollars)
Trading securities and available for sale changes in the fair value level 3 are included in the consolidated statement of income as part of income from investment portfolio and changes of fair value of derivatives level 3 are included in the consolidated statement of income as part of the other income.
Items Measured at Fair Value on a Nonrecurring Basis
In February 2008, the FASB issued Staff Position No. 157-2, “Effective Date of FASB Statement No. 157” (ASC 820, or “FAS 157-2”). FSP FAS 157-2 delayed the effective date of ASC 820 for non-financial assets and liabilities, except for items that are recognized or disclosed at fair value in the Consolidated Financial Statements on a recurring basis. The provisions of FSP FAS 157-2 are adopted by Grupo Aval from the fiscal year beginning on January 1, 2009. This guidance established the authoritative definition of fair value by setting out a framework for measuring fair value and expanding the required disclosures about fair value measurement.
ASC 825 Disclosures
The table below presents the disclosures required by ASC 825 for all financial instruments assets and liabilities based on the Supplemental Condensed Consolidated Balance Sheets under U.S. GAAP and comparing amounts presented to fair values calculated for U.S. GAAP purposes under ASC 820:
|
December 31, 2011
|
December 31, 2010
|
|||||||||||||||
|
Book value under U.S. GAAP
|
Estimated
fair value
|
Book value under
U.S. GAAP
|
Estimated
fair value
|
|||||||||||||
|
Financial assets:
|
||||||||||||||||
|
Cash and due from banks
|
Ps. | 8,771,593 | Ps. | 8,781,960 | Ps. | 7,334,254 | Ps. | 7,334,254 | ||||||||
|
Investment securities, net
|
17,469,229 | 17,383,056 | 19,174,937 | 19,204,308 | ||||||||||||
|
Loans, net
|
68,317,073 | 72,577,585 | 52,693,859 | 58,617,294 | ||||||||||||
|
Derivatives and bankers’ acceptances outstanding, net
|
416,457 | 418,809 | - | - | ||||||||||||
|
Financial liabilities:
|
||||||||||||||||
|
Deposits
|
71,017,425 | 71,090,349 | 63,669,282 | 63,716,797 | ||||||||||||
|
Interbank borrowings and overnight funds
|
3,225,145 | 3,225,146 | 2,477,424 | 2,477,424 | ||||||||||||
|
Derivative and bankers’ acceptances outstanding, net
|
469,413 | 469,413 | 2,416 | 2,686 | ||||||||||||
|
Borrowings from banks and other
|
11,438,327 | 11,506,594 | 10,491,181 | 10,490,661 | ||||||||||||
|
Bonds
|
6,566,235 | 6,799,195 | 5,952,378 | 6,722,108 | ||||||||||||
|
x)
|
Related party transactions:
|
We currently engage in, and expect from time to time in the future to engage in, financial and commercial transactions with “related parties” (within the meaning of the SEC rules). Unless otherwise indicated below, such transactions are conducted on an arm’s-length basis in the ordinary course of business, on terms that would apply to transactions with third parties.
GRUPO AVAL ACCIONES Y VALORES S.A. AND ITS SUBSIDIARIES
NOTES TO THE CONSOLIDATED FINANCIAL STATEMENTS
FOR THE YEARS ENDED DECEMBER 31, 2011, 2010 AND 2009
(
Stated in millions of Colombian pesos and U.S. dollars)
Loans or deposits involving related parties
The following chart presents outstanding amounts of related party transactions involving loans or deposits between Grupo Aval and its consolidated subsidiaries, on one hand, and each of the following individuals and entities.
|
Transactions between Grupo Aval and its subsidiaries, and
|
||||||||||||||||
|
Grupo Aval’s directors and key management and their affiliate (1)
|
Close family members of Mr. Sarmiento Angulo and their affiliates
|
Mr. Sarmiento Gutiérrez and his affiliates
|
Mr. Sarmiento Angulo and his affiliates
|
|||||||||||||
|
At December 31, 2011
|
||||||||||||||||
|
Outstanding loans (2)
|
Ps. | 11,310 | Ps. | 42,212 | Ps. | 26 | Ps. | 1,067,000 | ||||||||
|
Deposits (3)
|
10,165 | 9,332 | 182 | 3,548,000 | ||||||||||||
|
At December 31, 2010
|
||||||||||||||||
|
Outstanding loans (2)
|
Ps. | 7,000 | Ps. | 22,500 | Ps. | 100 | Ps. | 1,094,000 | ||||||||
|
Deposits (3)
|
8,800 | 6,100 | 600 | 3,327,000 | ||||||||||||
|
(1)
|
Excludes Mr. Sarmiento Angulo and Mr. Sarmiento Gutiérrez and their affiliates. Key management includes executive officers of Grupo Aval as well as each of the presidents of our banks, Porvenir and Corficolombiana.
|
|
(2)
|
Includes loans approved but not yet disbursed. All outstanding loans are made in the ordinary course of business, and on terms and conditions not materially different from those available to the general public, including interest and collateral. See below “—Loans granted to related parties by our banking subsidiaries.”
|
|
(3)
|
All deposits, including time deposits and investment portfolios, of all related parties held with us are made in the ordinary course of business, held at market rates and on terms and conditions not materially different from those available to the general public.
|
For information on related party transactions in accordance with Colombian disclosure rules, see note 27 to these audited consolidated financial statements. Required Colombian disclosures as to related party transactions differ from those required by the SEC. For the purposes of note 27 to these audited consolidated financial statements, “related parties” includes the principal shareholders of Grupo Aval, members of the board of directors, individuals who are legal representatives of Grupo Aval and companies in which Grupo Aval, its principal shareholders or board members have a direct equity interest of at least 10.0%. For the purposes of this section, and as required by SEC rules, “related parties” includes enterprises that control, or are under common control with Grupo Aval, associates, individuals owning directly or indirectly an interest in the voting power that gives them significant influence over Grupo Aval, close family members, key management personnel (including directors and senior management) and any enterprises in which a substantial interest in the voting power is owned, directly or indirectly, by any of the persons listed above. We determine beneficial ownership under SEC rules.
Certain members of our board of directors and key management own shares of Grupo Aval which, other than in the case of Mr. Sarmiento Angulo, were acquired in the open market and represent less than 0.1% of our total outstanding shares. On May 12, 2011, Grupo Aval concluded the Preferred Shares Local Offering in which it sold 1,600 million preferred shares, raising an aggregate amount of Ps 2.1 trillion (US$1.1 billion at the representative market rate on such date), before deducting brokerage commissions and discounts, and transaction expenses. In connection with our Preferred Shares Local Offering, certain members of our board of directors and key management acquired preferred shares under the same conditions granted to the general public. We do not, and have not, offered or granted any share options to any of our directors or employees.
GRUPO AVAL ACCIONES Y VALORES S.A. AND ITS SUBSIDIARIES
NOTES TO THE CONSOLIDATED FINANCIAL STATEMENTS
FOR THE YEARS ENDED DECEMBER 31, 2011, 2010 AND 2009
(
Stated in millions of Colombian pesos and U.S. dollars)
Loans granted to Grupo Aval and its subsidiaries by shareholders of Grupo Aval and their affiliates
Certain shareholders of Grupo Aval and their affiliates have granted loans to Grupo Aval and its subsidiaries on an arm’s-length basis. All loans are unsecured and have a five-year term, with a two-year grace period. The following are the outstanding loans granted to Grupo Aval by shareholders of Grupo Aval and their respective affiliates at April 25, 2012:
|
o
|
Loans granted by Bienes y Comercio S.A., a company beneficially owned by Mr. Sarmiento Angulo, to Grupo Aval between February 2010 and February 2012, with a total outstanding amount of Ps 166.7 billion (US$85.8 million) at April 25, 2012 at an interest rate of DTF + 3.0% per annum; and
|
|
o
|
Loans granted by Adminegocios & Cía. S.C.A., an entity beneficially owned by Mr. Sarmiento Angulo, to Grupo Aval on February 2012, with a total outstanding amount of Ps 8.3 billion (US$4.3 million) at April 25, 2012, at an interest rate of DTF + 3.0% per annum.
|
The following loans were granted between October 1, 2010 and December 31, 2010 by companies beneficially owned by Mr. Sarmiento Angulo to Grupo Aval in part to fund the acquisition of 13,726,421 mandatorily convertible bonds issued by Banco de Bogotá (convertible into 29,205,152 shares of Banco de Bogotá). The proceeds of the convertible bond issuance were used to finance the BAC Credomatic acquisition. All loans were granted on an arm’s-length basis, are unsecured and have a five-year term, with a two-year grace period, as follows:
|
o
|
Loans granted by Rendifin S.A. to Grupo Aval with a total outstanding amount of Ps 789.7 billion (US$406.5 million) at an interest rate of DTF + 3.0% per annum; and
|
|
o
|
Loans granted by Bienes y Comercio S.A. with a total outstanding amount of Ps 189.0 billion (US$97.3 million) at an interest rate of DTF + 3.0% per annum.
|
The total amount of loans outstanding from companies beneficially owned by Mr. Sarmiento Angulo at April 25, 2012 is Ps 1,153.8 billion (US$593.9 million).
Loans granted to related parties by our banking subsidiaries
Key management of Grupo Aval and our banks, and their respective affiliates, who meet our credit eligibility requirements may subscribe to loans in the ordinary course of business, on market terms and conditions available to the general public.
All outstanding loans with our related parties are made in the ordinary course of business and on terms and conditions, including interest rates and collateral, not materially different from those available to the general public and did not involve more than the normal risk of collectability or present other unfavorable features.
In connection with our Preferred Shares Local Offering, certain members of our board of directors and key management were granted loans by our banking subsidiaries for the purpose of acquiring Grupo Aval preferred shares. These loans were granted at market rates and on terms and conditions not materially different from those available to other purchasers of Grupo Aval shares.
GRUPO AVAL ACCIONES Y VALORES S.A. AND ITS SUBSIDIARIES
NOTES TO THE CONSOLIDATED FINANCIAL STATEMENTS
FOR THE YEARS ENDED DECEMBER 31, 2011, 2010 AND 2009
(
Stated in millions of Colombian pesos and U.S. dollars)
Other transactions with Mr. Sarmiento Angulo and his affiliates
Beneficial ownership in our banking subsidiaries
In addition to his beneficial ownership in Grupo Aval, Mr. Sarmiento Angulo beneficially owns at the date of this annual report 9.6% of Banco de Bogotá, 13.3% of Banco de Occidente, 15.4% of Banco AV Villas and 0.7% of Banco Popular.
Except as stated above, Mr. Sarmiento Angulo does not have any other beneficial ownership in our banking subsidiaries.
Banco Popular share ownership reorganization
Immediately prior to the completion of the First Banco Popular Share Ownership Transaction on June 23, 2011, Grupo Aval directly owned 2,368,686,432 shares (or 30.66%) of the share capital of Banco Popular, while Rendifin S.A., Popular Securities S.A. and Inversiones Escorial S.A. (companies beneficially owned by Mr. Sarmiento Angulo) owned 4,872,610,306 (or 63.07%) of the share capital of Banco Popular.
On January 31, 2011, Grupo Aval entered into the First Banco Popular Share Ownership Reorganization Transaction through an agreement with Rendifin S.A. to acquire through escisión 43.47% of Banco Popular’s outstanding shares held by Rendifin S.A. in exchange for 2,073,115,004 of our preferred shares at a ratio of 1.62 Banco Popular share per Grupo Aval preferred share. We completed this transaction on June 23, 2011 and increased our direct ownership in Banco Popular to 74.17% and issued 2,073,115,004 preferred shares to the shareholders of Rendifin S.A.
On April 29, 2011, we entered into the Second Banco Popular Share Ownership Reorganization Transaction through a second agreement with Popular Securities S.A. and Inversiones Escorial S.A. to acquire an additional 19.60% of Banco Popular in exchange for 934,669,126 preferred shares at the same ratio of 1.62 Banco Popular share per Grupo Aval preferred share, which increased our ownership interest in Banco Popular to 93.73%. The Second Banco Popular Share Ownership Reorganization Transaction closed on September 20, 2011.
The independent investment bank Rothschild de Mexico S.A. de C.V. issued a fairness opinion on January 6, 2011, stating that the exchange ratio of 1.62 Banco Popular shares to one Grupo Aval preferred share was reasonable to Grupo Aval shareholders.
Grupo Aval had previously controlled Banco Popular through a shareholders’ agreement with Rendifin S.A. Pursuant to this agreement, Rendifin had granted Grupo Aval irrevocable power to represent Rendifin’s shares in Banco Popular. The agreement provided that all economic rights to the Banco Popular shares would continue to be vested in Rendifin. The agreement terminated on June 23, 2011 because Grupo Aval came to own more than 50% of the issued and outstanding shares of Banco Popular. Prior to termination, Grupo Aval received, as compensation for its services, a monthly fee in the amount of Ps 116,072,351, which was linked to the CPI.
Insurance services
Seguros de Vida Alfa S.A., or “Vida Alfa,” a life insurance affiliate of Mr. Sarmiento Angulo, provides insurance required by law, as well as annuities, relating to the mandatory pension funds managed by Porvenir. The insurance provider is selected by Porvenir through a competitive bidding process once every four years. Premiums under this insurance policy are deducted by Porvenir from the individual customers’ account and transferred to Vida Alfa on behalf of the individual customer.
GRUPO AVAL ACCIONES Y VALORES S.A. AND ITS SUBSIDIARIES
NOTES TO THE CONSOLIDATED FINANCIAL STATEMENTS
FOR THE YEARS ENDED DECEMBER 31, 2011, 2010 AND 2009
(
Stated in millions of Colombian pesos and U.S. dollars)
The table below presents the insurance premiums paid for the periods indicated.
|
Period
|
Amount
|
|||
|
(in Ps billions)
|
||||
|
For the three-month period ended March 31, 2012
|
72.8 | |||
|
For the year ended December 31:
|
||||
|
2011
|
285.7 | |||
|
2010
|
252.7 | |||
Vida Alfa also provides:
|
o
|
life insurance, as sole provider and as co-insurer with non-affiliated insurers (pursuant to a competitive bidding process), for individual borrowers of our banking subsidiaries to cover the risk of non-payment upon death. Premiums are paid by the borrowers; and
|
|
o
|
workers compensation for all employees of Grupo Aval and its subsidiaries.
|
Seguros Alfa S.A., or “Alfa,” a property and casualty insurance affiliate of Mr. Sarmiento Angulo, provides fire and earthquake insurance for mortgage loans granted by certain of our banks. In addition, Alfa provides surety bonds and property insurance for our subsidiaries. Our banking subsidiaries also provide insurance products affiliated with Vida Alfa and Alfa through their bancassurance lines. These transactions are conducted on an arm’s-length basis in the ordinary course of business. Alfa has in the past, but not currently, provided bankers’ blanket bond coverage to our subsidiaries, reinsured under prevailing market conditions, and surety bonds for Corficolombiana’s toll-road concessions. The amounts relating to those transactions are immaterial.
Put/call agreement between Grupo Aval and Adminegocios & Cia. S.C.A., an entity controlled by Mr. Sarmiento Angulo and a direct shareholder of Grupo Aval
On November 24, 2010, Grupo Aval and Adminegocios & Cia. S.C.A., an entity controlled by Mr. Sarmiento Angulo, our controlling shareholder, entered into an agreement whereby Grupo Aval assigned to Adminegocios & Cia. S.C.A. its right to acquire up to 2,605,000 mandatorily convertible bonds issued by Banco de Bogotá (convertible into 5,542,553 shares of Banco de Bogotá). Under the put/call agreement, we have an option to purchase from Adminegocios & Cia. S.C.A., and they have the right to sell, 2,605,000 convertible bonds (or the underlying shares, if converted). In either case, the purchase price we will have to pay Adminegocios & Cia. S.C.A. is the subscription price paid by Adminegocios & Cia. S.C.A. at the time of acquiring the mandatorily convertible bonds issued by Banco de Bogotá plus a premium of 6.5% per annum up to the date of acquisition. The options expire two years from December 2, 2010, the date of first subscription of the mandatorily convertible bonds. With the 2,605,000 convertible bonds assigned by us, Adminegocios & Cia. S.C.A. acquired a total of 4,249,965 convertible bonds from Banco de Bogotá. The mandatorily convertible bonds were acquired by Adminegocios & Cia. S.C.A. in order to finance the BAC Credomatic acquisition. We expect to exercise our option before it expires.
On March 1, 2011, Adminegocios & Cia. S.C.A. converted all of its 4,249,965 mandatorily convertible bonds holding into 9,042,478 common shares of Banco de Bogotá.
We expect to acquire (on the same pricing terms as the put/call agreement and simultaneously with the exercise of our option under such agreement) 3,499,925 shares of Banco de Bogotá from Adminegocios & Cia. S.C.A., in addition to the 5,542,553 shares of Banco de Bogotá subject to the option in the put/call agreement.
GRUPO AVAL ACCIONES Y VALORES S.A. AND ITS SUBSIDIARIES
NOTES TO THE CONSOLIDATED FINANCIAL STATEMENTS
FOR THE YEARS ENDED DECEMBER 31, 2011, 2010 AND 2009
(
Stated in millions of Colombian pesos and U.S. dollars)
Other
The following companies are beneficially owned by Mr. Sarmiento Angulo and may continue to provide services to us and our subsidiaries for amounts that are immaterial: Construcciones Planificadas S.A. (office renovations), Vigía S.A. (security services) and Corporación Publicitaria de Colombia S.A. (advertising).
|
y)
|
Segments Disclosure:
|
Grupo Aval’s businesses are organized into four operating segments: Banco de Bogotá, Banco de Occidente, Banco Popular and Banco Comercial AV Villas, each of which operates several lines of businesses and regularly reports its consolidated results of operations to our president and board of directors. Each of our four banks is represented on our board of directors by its respective president, and our banks’ presidents are compensated on the basis of the consolidated results of operations of each respective bank under their management.
Grupo Aval’s president allocates resources, sets budgets and targets, and assesses the performance of Grupo Aval’s business on the basis of its four consolidated bank operating segments. Grupo Aval’s president and board of directors analyze group performance and allocate resources on the basis of the banks’ financial reports and financial statements.
Grupo Aval does not have any individual external customer which represents 10% or more of the enterprise’s revenues. Over 90% of the operations carried out by Grupo Aval are performed inside Colombia.
Following is a brief description of our four operating segments:
Banco de Bogotá
, founded in 1870, Banco de Bogotá is a full-service bank with nationwide coverage and a comprehensive portfolio of services and products. Banco de Bogotá serves high-income individual customers directly and low- and medium-income individual customers through a dedicated distribution network. This bank controls (1) AFP Porvenir, the pension and severance fund management business in Colombia; (2) Corficolombiana, a merchant bank that primarily invests in strategic sectors of the Colombian economy, including infrastructure, energy, and finance, and also provides treasury, investment banking, and private banking services and (3) BAC Credomatic, a Central American bank specialized in consumer banking products.
Banco de Occidente
is a full-service bank with presence throughout the southwest region of Colombia. It serves enterprise customers with a focus on large- and medium-sized companies, and consumers with medium- to high-income levels. Banco de Occidente offers a comprehensive services and products portfolio and has a financial leasing business.
Banco Popular.
Processes payroll loans and provides financial solutions to government entities throughout Colombia. Banco Popular achieves returns on its consumer loan portfolio due to its access to payroll deductions for repayment of loans, which results in consumer loans with a substantially lower-risk profile.
Banco Comercial AV Villas
focuses on consumer and mortgage businesses, serving its clients through a nationwide service-point network and a mobile banking platform. Over the past decade, Banco AV Villas has evolved from being a lender exclusively focused on mortgages to a diversified full-service low- and middle-income consumer bank. Banco AV Villas’ risk management systems provide the bank with real-time and in-depth credit quality analyses that allow the bank to approve consumer loans on an accelerated basis.
GRUPO AVAL ACCIONES Y VALORES S.A. AND ITS SUBSIDIARIES
NOTES TO THE CONSOLIDATED FINANCIAL STATEMENTS
FOR THE YEARS ENDED DECEMBER 31, 2011, 2010 AND 2009
(
Stated in millions of Colombian pesos and U.S. dollars)
The following presents information on reported operating segments profit or loss, and segment assets:
| 2011 | ||||||||||||||||||||||||||||
|
Banco de Bogotá
|
Banco de
Occidente
|
Banco AV
Villas
|
Banco
Popular
|
Grupo Aval
|
Eliminations
|
Grupo Aval
|
||||||||||||||||||||||
|
Total interest income
|
Ps. | 4,395,932 | Ps. | 1,592,691 | Ps. | 717,558 | Ps. | 1,403,237 | Ps. | 60,857 | Ps. | (19,446 | ) | Ps. | 8,150,829 | |||||||||||||
|
Total interest expense
|
(1,459,232 | ) | (525,466 | ) | (168,972 | ) | (417,818 | ) | (176,405 | ) | 65,961 | (2,681,932 | ) | |||||||||||||||
|
Net interest income
|
2,936,700 | 1,067,225 | 548,586 | 985,419 | (115,548 | ) | 46,515 | 5,468,897 | ||||||||||||||||||||
|
Total provisions, net
|
(139,037 | ) | (176,606 | ) | (33,413 | ) | (67,253 | ) | (6 | ) | - | (416,315 | ) | |||||||||||||||
|
Total fees and other services income
|
2,010,593 | 307,726 | 198,688 | 182,906 | 23,891 | (51,051 | ) | 2,672,753 | ||||||||||||||||||||
|
Fees and other services
expenses
|
(253,836 | ) | (109,193 | ) | (47,506 | ) | (32,225 | ) | (5,593 | ) | 9,965 | (438,388 | ) | |||||||||||||||
|
Total other operating income
|
758,146 | 314,330 | 3,384 | 51,825 | 629,051 | (798,744 | ) | 957,992 | ||||||||||||||||||||
|
Total operating expenses
|
(2,967,952 | ) | (846,264 | ) | (435,971 | ) | (623,209 | ) | (106,361 | ) | 46,810 | (4,932,947 | ) | |||||||||||||||
|
Total non-operating income (expense), net
|
68,490 | 15,490 | 7,063 | 57,189 | (1,500 | ) | 49,493 | 196,225 | ||||||||||||||||||||
|
Income tax expense
|
(737,201 | ) | (139,013 | ) | (75,379 | ) | (177,464 | ) | (7,691 | ) | - | (1,136,748 | ) | |||||||||||||||
|
Income before non-
controlling interest
|
1,675,903 | 433,695 | 165,452 | 377,188 | 416,243 | (697,012 | ) | 2,371,469 | ||||||||||||||||||||
|
Non-controlling interest
|
(530,190 | ) | (1,586 | ) | (227 | ) | (4,984 | ) | - | (543,256 | ) | (1,080,243 | ) | |||||||||||||||
|
Net income attributable to Grupo Aval shareholders
|
Ps. | 1,145,713 | Ps. | 432,109 | Ps. | 165,225 | Ps. | 372,204 | Ps. | 416,243 | Ps. | (1,240,268 | ) | Ps. | 1,291,226 | |||||||||||||
|
Loans and financial leases:
|
||||||||||||||||||||||||||||
|
Commercial loans
|
Ps. | 25,434,322 | Ps. | 8,619,557 | Ps. | 2,118,986 | Ps. | 4,407,652 | Ps. | - | Ps. | (34,973 | ) | Ps. | 40,545,544 | |||||||||||||
|
Consumer loans
|
9,282,067 | 2,805,912 | 2,235,975 | 5,411,931 | - | - | 19,735,885 | |||||||||||||||||||||
|
Microcredit loans
|
240,657 | - | 22,744 | 20,766 | - | - | 284,167 | |||||||||||||||||||||
|
Mortgage loans
|
3,444,650 | 33 | 680,894 | 92,800 | - | - | 4,218,377 | |||||||||||||||||||||
|
Financial leases
|
1,633,330 | 3,288,282 | - | 264,183 | - | (22,028 | ) | 5,163,767 | ||||||||||||||||||||
|
Allowance for loan and financial lease losses
|
(1,099,353 | ) | (574,188 | ) | (243,684 | ) | (389,275 | ) | - | - | (2,306,500 | ) | ||||||||||||||||
|
Total loans and financial leases, net
|
Ps. | 38,935,673 | Ps. | 14,139,596 | Ps. | 4,814,915 | Ps. | 9,808,057 | Ps. | - | Ps. | (57,001 | ) | Ps. | 67,641,240 | |||||||||||||
|
Total assets
|
Ps. | 68,809,602 | Ps. | 22,180,088 | Ps. | 7,618,247 | Ps. | 14,251,434 | Ps. | 13,972,578 | Ps. | (15,330,082 | ) | Ps. | 111,501,867 | |||||||||||||
| 2010 | ||||||||||||||||||||||||||||
|
Banco de
Bogotá
|
Banco de
Occidente
|
Banco AV
Villas
|
Banco Popular
|
Grupo Aval
|
Eliminations
|
Grupo Aval
|
||||||||||||||||||||||
|
Total interest income
|
Ps. | 3,345,606 | Ps. | 1,403,869 | Ps. | 683,123 | Ps. | 1,276,173 | Ps. | 13,116 | Ps. | (179,290 | ) | Ps. | 6,542,597 | |||||||||||||
|
Total interest expense
|
(902,129 | ) | (457,217 | ) | (142,795 | ) | (325,277 | ) | (91,167 | ) | 4,786 | (1,913,799 | ) | |||||||||||||||
|
Net interest income
|
2,443,477 | 946,652 | 540,328 | 950,896 | (78,051 | ) | (174,504 | ) | 4,628,798 | |||||||||||||||||||
|
Total provisions, net
|
(610,612 | ) | (192,312 | ) | (122,425 | ) | (101,575 | ) | (20 | ) | - | (1,026,944 | ) | |||||||||||||||
|
Total fees and other services Income
|
1,328,222 | 294,111 | 184,451 | 174,077 | - | - | 1,980,861 | |||||||||||||||||||||
|
Fees and other services expenses
|
(173,159 | ) | (107,503 | ) | (43,940 | ) | (37,951 | ) | (588 | ) | - | (363,141 | ) | |||||||||||||||
|
Total other operating income
|
582,380 | 316,679 | 9,729 | 42,021 | 497,490 | (662,786 | ) | 785,513 | ||||||||||||||||||||
|
Total operating expenses
|
(1,757,924 | ) | (764,427 | ) | (389,791 | ) | (558,279 | ) | (49,529 | ) | - | (3,519,950 | ) | |||||||||||||||
|
Total non-operating income (expense), net
|
95,957 | 21,383 | 16,175 | 53,029 | 16,540 | (26,150 | ) | 176,934 | ||||||||||||||||||||
|
Income tax expense
|
(510,001 | ) | (126,192 | ) | (49,860 | ) | (156,771 | ) | (2,543 | ) | 14,378 | (830,989 | ) | |||||||||||||||
|
Income before non-controlling interest
|
1,398,340 | 388,391 | 144,667 | 365,447 | 383,299 | (849,062 | ) | 1,831,082 | ||||||||||||||||||||
|
Non-controlling interest
|
(483,392 | ) | (2,009 | ) | (373 | ) | (3,805 | ) | - | (384,653 | ) | (874,232 | ) | |||||||||||||||
|
Net income attributable to Grupo Aval shareholders
|
Ps. | 914,948 | Ps. | 386,382 | Ps. | 144,294 | Ps. | 361,642 | Ps. | 383,299 | Ps. | (1,233,715 | ) | Ps. | 956,850 | |||||||||||||
|
Loans and financial leases:
|
||||||||||||||||||||||||||||
|
Commercial loans
|
Ps. | 21,520,942 | Ps. | 7,025,986 | Ps. | 1,867,487 | Ps. | 3,747,755 | Ps. | - | Ps. | (4,069 | ) | Ps. | 34,158,101 | |||||||||||||
|
Consumer loans
|
7,712,275 | 2,297,714 | 1,964,699 | 4,650,528 | - | - | 16,625,216 | |||||||||||||||||||||
|
Microcredit loans
|
198,479 | - | 23,787 | 27,840 | - | - | 250,106 | |||||||||||||||||||||
|
Mortgage loans
|
3,144,529 | 11,217 | 587,098 | 101,478 | - | - | 3,844,322 | |||||||||||||||||||||
|
Financial leases
|
972,315 | 2,549,060 | - | 224,506 | - | - | 3,745,881 | |||||||||||||||||||||
|
Allowance for loan and
financial lease losses
|
(1,030,727 | ) | (536,829 | ) | (255,547 | ) | (360,783 | ) | - | - | (2,183,886 | ) | ||||||||||||||||
|
Total loans and financial leases, net
|
Ps. | 32,517,813 | Ps. | 11,347,148 | Ps. | 4,187,524 | Ps. | 8,391,324 | Ps. | - | Ps. | (4,069 | ) | Ps. | 56,439,740 | |||||||||||||
|
Total assets
|
Ps. | 59,346,616 | Ps. | 18,638,263 | Ps. | 6,956,784 | Ps. | 12,723,287 | Ps. | 4,242,925 | Ps. | (5,598,594 | ) | Ps. | 96,309,279 | |||||||||||||
GRUPO AVAL ACCIONES Y VALORES S.A. AND ITS SUBSIDIARIES
NOTES TO THE CONSOLIDATED FINANCIAL STATEMENTS
FOR THE YEARS ENDED DECEMBER 31, 2011, 2010 AND 2009
(
Stated in millions of Colombian pesos and U.S. dollars)
| 2009 | ||||||||||||||||||||||||||||
|
Banco de Bogotá
|
Banco de
Occidente
|
Banco AV
Villas
|
Banco
Popular
|
Grupo Aval
|
Eliminations
|
Grupo Aval
|
||||||||||||||||||||||
|
Total interest income
|
Ps. | 3,614,068 | Ps. | 1,821,694 | Ps. | 789,089 | Ps. | 1,453,073 | Ps. | 7,669 | Ps. | (5,583 | ) | Ps. | 7,680,010 | |||||||||||||
|
Total interest expense
|
(1,297,099 | ) | (731,968 | ) | (217,027 | ) | (514,227 | ) | (99,304 | ) | 5,583 | (2,854,042 | ) | |||||||||||||||
|
Net interest income
|
2,316,969 | 1,089,726 | 572,062 | 938,846 | (91,635 | ) | - | 4,825,968 | ||||||||||||||||||||
|
Total provisions, net
|
(347,806 | ) | (257,310 | ) | (188,002 | ) | (94,484 | ) | (1 | ) | - | (887,603 | ) | |||||||||||||||
|
Total fees and other services income
|
1,226,857 | 275,544 | 178,921 | 182,563 | - | (2,584 | ) | 1,861,301 | ||||||||||||||||||||
|
Fees and other services expenses
|
(151,215 | ) | (58,970 | ) | (35,598 | ) | (39,330 | ) | (1,245 | ) | 8,528 | (277,830 | ) | |||||||||||||||
|
Total other operating income
|
492,058 | 281,967 | 4,263 | 29,367 | 455,088 | (578,684 | ) | 684,059 | ||||||||||||||||||||
|
Total operating expenses
|
(1,585,307 | ) | (764,743 | ) | (377,765 | ) | (536,514 | ) | (51,491 | ) | 23,422 | (3,292,398 | ) | |||||||||||||||
|
Total non-operating income (expense), net
|
78,044 | 12,783 | 12,615 | (42,321 | ) | 12,221 | (5,672 | ) | 67,670 | |||||||||||||||||||
|
Income tax expense
|
(522,710 | ) | (152,016 | ) | (55,378 | ) | (132,512 | ) | (1,678 | ) | - | (864,294 | ) | |||||||||||||||
|
Income before non-
controlling interest
|
1,506,890 | 426,981 | 111,118 | 305,615 | 321,259 | (554,990 | ) | 2,116,873 | ||||||||||||||||||||
|
Non-controlling interest
|
(551,083 | ) | (44,880 | ) | (431 | ) | (2,051 | ) | - | (453,051 | ) | (1,051,496 | ) | |||||||||||||||
|
Net income attributable
to Grupo Aval
shareholders
|
Ps. | 955,807 | Ps. | 382,101 | Ps. | 110,687 | Ps. | 303,564 | Ps. | 321,259 |
Ps
(1,008,041)
|
Ps. | 1,065,377 | |||||||||||||||
|
Loans and financial leases:
|
||||||||||||||||||||||||||||
|
Commercial loans
|
Ps. | 15,378,246 | Ps. | 6,392,352 | Ps. | 1,742,890 | Ps. | 2,674,376 | Ps. | - | Ps. | (48,579 | ) | Ps. | 26,139,285 | |||||||||||||
|
Consumer loans
|
3,350,169 | 2,105,461 | 1,736,402 | 4,203,817 | - | - | 11,395,849 | |||||||||||||||||||||
|
Microcredit loans
|
212,958 | - | 32,232 | 40,844 | - | - | 286,034 | |||||||||||||||||||||
|
Mortgage loans
|
52,322 | 11,888 | 682,412 | 118,811 | - | - | 865,433 | |||||||||||||||||||||
|
Financial leases
|
682,305 | 2,336,686 | - | 191,069 | - | - | 3,210,060 | |||||||||||||||||||||
|
Allowance for loan and financial lease losses
|
(765,467 | ) | (560,269 | ) | (216,131 | ) | (339,207 | ) | - | - | (1,881,074 | ) | ||||||||||||||||
|
Total loans and financial leases, net
|
Ps. | 18,910,533 | Ps. | 10,286,118 | Ps. | 3,977,805 | Ps. | 6,889,710 | Ps. | - | Ps. | (48,579 | ) | Ps. | 40,015,587 | |||||||||||||
|
Total assets
|
Ps. | 36,475,228 | Ps. | 18,073,802 | Ps. | 6,050,333 | Ps. | 11,149,907 | Ps. | 8,609,186 | Ps. | (9,365,342 | ) | Ps. | 70,993,114 | |||||||||||||
GRUPO AVAL ACCIONES Y VALORES S.A. AND ITS SUBSIDIARIES
NOTES TO THE CONSOLIDATED FINANCIAL STATEMENTS
FOR THE YEARS ENDED DECEMBER 31, 2011, 2010 AND 2009
(
Stated in millions of Colombian pesos and U.S. dollars)
The following summarizes the Grupo Aval’s revenues and long-lived assets attributable to Colombia and other foreign countries:
|
2011
|
2010
|
|||||||||||||||
|
Revenues
|
Long-term assets (1)
|
Revenues
|
Long-term assets (1)
|
|||||||||||||
|
Geographic Information
|
||||||||||||||||
|
Colombia
|
Ps. | 9,396,063 | Ps. | 1,470,338 | Ps. | 9,271,644 | Ps. | 1,341,583 | ||||||||
|
Central America and Caribbean
|
2,706,252 | 368,732 | 401,882 | 387,563 | ||||||||||||
|
Total, net
|
Ps. | 12,102,315 | Ps. | 1,839,070 | Ps. | 9,673,526 | Ps. | 1,729,146 | ||||||||
(1) Included foreclosed assets, net, and property, plant and equipment, net.
|
z)
|
Recent U.S. GAAP Pronouncements
|
In January 2010, the FASB issued Update No. 2010-02, “Accounting and Reporting for Decreases in Ownership of a Subsidiary—a Scope Clarification” (“2010-02”), an update of ASC 810 “Consolidation.” The objective of ASU 2010-02 is to address implementation issues related to changes in ownership provisions. This ASU clarifies that the scope of the decreases in ownership provisions within ASC Topic 810-10 and related guidance applies to decreases in ownership of a subsidiary or group of assets that is a business or nonprofit, a subsidiary that is transferred to an equity method investee or joint venture and an exchange of a group of assets that constitutes a business or nonprofit activity to a non-controlling interest including an equity method investee or a joint venture. The effect of the adoption of this standard did not have any material impact on Grupo Aval’s financial position, results of operations or operating cash flows.
On March 5, 2010, the FASB issued Accounting Standards Update 2010-11, “Scope Exception Related to Embedded Credit Derivatives,” to clarify and amend the accounting for credit derivatives embedded in beneficial interests in securitized financial assets. Currently, certain credit derivative features embedded in beneficial interests in securitized financial assets are not accounted for as derivatives. The new guidance eliminates the scope exception for embedded credit derivatives (except for those that are created solely by subordination) and provides new guidance on the evaluation to be performed. Bifurcation and separate recognition may be required for certain beneficial interests that are currently not accounted for at fair value through earnings. The new guidance became effective the first day of the first fiscal quarter beginning after June 15, 2010 (e.g., the first day of the third quarter of 2010 for calendar year-end companies), with early adoption permitted. At adoption, a company may make a one-time election to apply the fair value option on an instrument-by-instrument basis for any beneficial interest in securitized financial assets. As of December 31, 2011, Grupo Aval has not identified any embedded credit derivatives requiring disclosure.
ASU 2010-06, “Fair Value Measurements and Disclosures (Topic 820): Improving Disclosures about Fair Value Measurements” was issued in January 2010 to add additional disclosures about the different classes of assets and liabilities measured at fair value, the valuation techniques and inputs used, the activity in Level 3 fair value measurements and the transfers between Levels 1, 2 and 3. Those aspects of this disclosure standard required at December 31, 2011 did not have a material impact on the Company’s consolidated financial statements, but affected disclosure presented elsewhere herein. The disclosure about purchases, sales, issuances and settlements in the rollforward of activity in level 3 fair value measurements were deferred until fiscal years beginning after December 15, 2010 and did not significantly affect the Company’s consolidated financial statements at December 31, 2011.
In July 2010, the FASB issued ASU No. 2010-20, “Receivables (Topic 310): Disclosures about the Credit Quality of Financing Receivables and the Allowance for Credit Losses.” ASU 2010-20 is intended to provide additional information to assist users of financial statement in assessing an entity’s credit risk exposures and evaluating the adequacy of its allowance for credit losses. The disclosures as of the end of a reporting period are effective for interim and annual reporting periods ending on or after December 15, 2010. The disclosures about activity that occurs during a reporting period are effective for interim and annual reporting periods beginning on or after December 15, 2010. The amendments in ASU 2010-20 encourage, but do not require, comparative disclosures for earlier reporting periods that ended before initial adoption.
GRUPO AVAL ACCIONES Y VALORES S.A. AND ITS SUBSIDIARIES
NOTES TO THE CONSOLIDATED FINANCIAL STATEMENTS
FOR THE YEARS ENDED DECEMBER 31, 2011, 2010 AND 2009
(
Stated in millions of Colombian pesos and U.S. dollars)
However, an entity should provide comparative disclosures for those reporting periods ending after initial adoption. The adoption of this guidance did not have a material impact on the Company’s financial statements.
In August 2010, the FASB issued ASU 2010-21, “Accounting for Technical Amendments to Various SEC Rules and Schedules.” This ASU amends Release No. 33-9026: Technical Amendments to Rules, Forms, Schedules, and Codification of Financial Reporting Policies and did not have a significant impact on the Company’s financial statements, at December 31, 2011.
In August 2010, the FASB issued ASU 2010-22, “Technical Corrections to SEC Paragraphs – An announcement made by the staff of the U.S. Securities and Exchange Commission.” This ASU amends various SEC paragraphs based on external comments received and the issuance of SAB 112, which amends or rescinds portions of certain SAB topics and did not have a significant impact on the Company’s financial statements, at December 31, 2011.
In December 2010, the FASB issued ASU 2010-28, “When to Perform Step 2 of the Intangibles-Goodwill and Others,” to provide guidance on when to perform Step 2 of the goodwill impairment test for reporting units with zero or negative carrying amounts. This amendment to ASC 350 is effective for annual reporting periods beginning after December 15, 2010 for public companies. Transition requirements specify that companies must perform the Step 2 test on adoption for reporting units with a zero or negative carrying amount for which qualitative factors exist that indicate it is more likely than not that a goodwill impairment exists. Any resulting impairment charge would be recorded through a cumulative-effect adjustment to beginning retained earnings. This amendment did not have a material impact on the Company, at December 31, 2011.
In January 2011, the FASB issued ASU 2011-01, “Deferral of the Effective Date of Disclosures about Troubled Debt Restructurings in Update No. 2010-20.” This ASU temporarily delays the effective date of the disclosures about troubled debt restructurings in Update 2010-20 for public entities. The delay was intended to allow the FASB time to complete its deliberations on what constitutes a troubled debt restructuring, and was resolved with the issuance of ASU 2011-02.
In April 2011, the FASB issued ASU 2011-02, Receivables (Topic 310), “A Creditor’s Determination of Whether a Restructuring Is a Troubled Debt Restructuring.” The amendments in this update provide additional guidance and clarification to help creditors determine whether a creditor has granted a concession and whether a debtor is experiencing financial difficulties for purposes of determining whether a restructuring constitutes a troubled debt restructuring. The amendments in this update became effective for the first interim or annual reporting period beginning on or after June 15, 2011, and they should be applied retrospectively to the beginning annual period of adoption. As a result of these amendments, an entity may identify receivables that are newly considered impaired. For purposes of measuring impairment of those receivables, an entity should apply the amendments prospectively for the first interim or annual period beginning on or after June 15, 2011. The adoption of this guidance did not have a material impact on the Company’s financial statements.
ASU 2011-03 concerns the improvement of accounting-for-repurchase agreements (repos) and other agreements that both entitle and obligate a transferor to repurchase or redeem financial assets before their maturity by amending the criteria for determining effective control of collateral. The guidance is effective for fiscal quarters and years beginning on or after December 15, 2011. Grupo Aval does not expect any significant effect from the adoption of this new standard.
In May 2011, the FASB issued ASU 2011-04, “Amendments to Achieve Common Fair Value Measurement and Disclosure Requirements in U.S. GAAP and IFRS.” The amendments in this update result in common fair value measurement and disclosure requirements in U.S. GAAP and IFRS. Consequently, the amendments change the wording used to describe many of the requirements in U.S. GAAP for measuring fair value and for disclosing information about fair value measurements. The amendments in this update are to be applied prospectively. For public entities, the amendments are effective during interim and annual periods beginning after December 15, 2011. For nonpublic entities, the amendments are effective for annual periods beginning after December 15, 2011. Early application by public entities is not permitted. This ASU is not expected to have a significant impact on the Company’s financial statements.
In June 2011, the FASB issued ASU 2011-05, “Presentation of Comprehensive Income.” The amendments in this update improve the comparability, clarity, consistency and transparency of financial reporting and increase the prominence of items reported in other comprehensive income. To increase the prominence of items reported in other comprehensive income and to facilitate convergence of U.S. GAAP and IFRS, the option to present components of other comprehensive income as part of the statement of changes in stockholders’ equity was eliminated. The amendments require that all non-owner changes in
GRUPO AVAL ACCIONES Y VALORES S.A. AND ITS SUBSIDIARIES
NOTES TO THE CONSOLIDATED FINANCIAL STATEMENTS
FOR THE YEARS ENDED DECEMBER 31, 2011, 2010 AND 2009
(
Stated in millions of Colombian pesos and U.S. dollars)
stockholders’ equity be presented either in a single continuous statement of comprehensive income or in two separate but consecutive statements. In the two-statement approach, the first statement should present total net income and its components should be followed consecutively by a second statement that should present total other comprehensive income, the components of other comprehensive income and the total of comprehensive income. All entities that report items of comprehensive income, in any period presented, will be affected by the changes in this update. For public entities, the amendments are effective for fiscal years, and interim periods within those years, beginning after December 15, 2011. For nonpublic entities, the amendments are effective for fiscal years ending after December 15, 2012, and interim and annual periods thereafter. The amendments in this update should be applied retrospectively and early adoption is permitted. This ASU is not expected to have a significant impact on the Company’s financial statements.
In September 2011, the FASB issued ASU 2011-08, “Intangibles – Goodwill and Other Topics (Topic 350), Testing Goodwill for Impairment.” The objective of this update is to simplify how entities, both public and nonpublic, test goodwill for impairment. The amendments in the update permit an entity to first assess qualitative factors to determine whether it is more likely than not that the fair value of a reporting unit is less than its carrying amount as a basis for determining whether it is necessary to perform the two-step goodwill impairment test described in Topic 350. The more-likely-than-not threshold is defined as having a likelihood of more than 50 percent. Under the amendments in this update, an entity is not required to calculate the fair value of a reporting unit unless the entity determines that it is more likely than not that its fair value is less than its carrying amount. The amendments in this update apply to all entities, both public and nonpublic, that have goodwill reported in their financial statements. The amendments are effective for interim and annual goodwill impairment tests performed for fiscal years beginning after December 15, 2011. Early adoption is permitted, including for annual and interim goodwill impairment tests performed as of a date before September 15, 2011, if an entity’s financial statements for the most recent annual or interim period have not yet been issued or, for nonpublic entities, have not yet been made available for issuance. This ASU is not expected to have a significant impact on the Company’s financial statements.
In December 2011, FASB issued ASU 2011-12, “Deferral of the Effective Date for Amendments to the Presentation of Reclassifications of Items Out of Accumulated Other Comprehensive Income in Accounting Standards Update No. 2011-05” to effectively defer only those changes in Update 2011-05 that relate to the presentation of reclassification adjustments out of accumulated other comprehensive income. The amendments will be temporary to allow the Board time to redeliberate the presentation requirements for reclassifications out of accumulated other comprehensive income for annual and interim financial statements for public, private, and non-profit entities All other requirements in Update 2011-05 are not affected by this Update, including the requirement to report comprehensive income either in a single continuous financial statement or in two separate but consecutive financial statements. Public entities should apply these requirements for fiscal years, and interim periods within those years, beginning after December 15, 2011.
F-138
TABLE OF CONTENTS
Part IItem 1. Identity Of Directors, Senior Management and AdvisersItem 2. Offer Statistics and Expected TimetableItem 3. Key InformationItem 4. Information on The CompanyItem 4A. Unresolved Staff CommentsItem 5. Operating and Financial Review and ProspectsItem 6. Directors, Senior Management and EmployeesItem 7. Major Shareholders and Related Party TransactionsItem 8. Financial InformationItem 9. The Offer and ListingItem 10. Additional InformationItem 7. Major Shareholders and Related Party Transactions B. Related Party TransactionsItem 11. Quantitative and Qualitative Disclosures About RiskItem 12. Description Of Securities Other Than Equity SecuritiesPart IIItem 13. Defaults, Dividend Arrearages and DelinquenciesItem 14. Material Modifications To The Rights Of Security Holders and Use Of ProceedsItem 15. Controls and ProceduresItem 16. [reserved]Item 16A. Audit Committee Financial ExpertItem 16B. Code Of EthicsItem 16C. Principal Accountant Fees and ServicesItem 16D. Exemptions From The Listing Standards For Audit CommitteesItem 16E. Purchases Of Equity Securities By The Issuer and Affiliated PurchasersItem 16F. Change in Registrant S Certifying AccountantItem 16G. Corporate GovernanceItem 16H. Mine Safety DisclosurePart IIIItem 17. Financial StatementsItem 18. Financial StatementsItem 19. Exhibits