UNITED STATES
SECURITIES AND EXCHANGE COMMISSION
Washington, D.C. 20549
FORM 20-F
(Mark One)
|
|
☐
REGISTRATION STATEMENT PURSUANT TO SECTION 12(b) OR (g) OF THE SECURITIES EXCHANGE ACT OF 1934
|
OR
|
|
☒
ANNUAL REPORT PURSUANT TO SECTION 13 OR 15(d) OF THE SECURITIES EXCHANGE ACT OF 1934
|
|
|
for the fiscal year ended December 31, 2014
|
|
|
OR
|
|
|
☐
TRANSITION REPORT PURSUANT TO SECTION 13 OR 15(d) OF THE SECURITIES EXCHANGE ACT OF 1934
|
|
|
For the transition period from ________________ to ________________
|
OR
|
|
☐
SHELL COMPANY REPORT PURSUANT TO SECTION 13 OR 15(d) OF THE SECURITIES EXCHANGE ACT OF 1934
|
|
|
Date of event requiring this shell company report
|
|
Commission file number: 000-54290
|
GRUPO AVAL ACCIONES Y VALORES S.A.
(Exact name of Registrant as specified in its charter)
Republic of Colombia
(Jurisdiction of incorporation)
Carrera 13 No. 26A - 47
Bogotá D.C., Colombia
(Address of principal executive offices)
Jorge Adrián Rincón
Chief Legal Counsel
Grupo Aval Acciones y Valores S.A.
Carrera 13 No. 2
6A
- 47
Bogotá D.C., Colombia
Phone: (+57 1) 241-9700
E-mail: jrincon@grupoaval.com
(Name, Telephone, E-mail and/or Facsimile number and Address of Company Contact Person)
Copies to:
Nicholas A. Kronfeld, Esq.
Davis Polk & Wardwell LLP
450 Lexington Avenue
New York, NY 10017
Phone: (212) 450-4000
Securities registered or to be registered pursuant to Section 12(b) of the Act:
None
(Title of Class)
Securities registered or to be registered pursuant to Section 12(g) of the Act:
|
Title of each class
|
Name of each exchange on which registered
|
|
|
American Depositary Shares, each representing 20 preferred shares, par value Ps 1.00 per preferred share
|
New York Stock Exchange
|
|
|
Preferred Shares, par value Ps 1.00 per preferred share
|
New York Stock Exchange*
|
* Grupo Aval Acciones y Valores S.A.’s preferred shares are not listed for trading, but are only listed in connection with the registration of the American Depositary Shares, pursuant to the requirements of the New York Stock Exchange.
Securities for which there is a reporting obligation pursuant to Section 15(d) of the Act:
None
(Title of Class)
Indicate the number of outstanding shares of each of the issuer’s classes of capital stock or common stock as of the close of business covered by the annual report.
Preferred shares: 6,906,060,170
Indicate by check mark if the registrant is a well-known seasoned issuer, as defined in Rule 405 of the Securities Act.
☒
Yes
☐
No
If this report is an annual or transition report, indicate by check mark if the registrant is not required to file reports pursuant to Section 13 or 15(d) of the Securities Exchange Act of 1934.
☐
Yes
☒
No
Indicate by check mark whether the registrant (1) has filed all reports required to be filed by Section 13 or 15(d) of the Securities Exchange Act of 1934 during the preceding 12 months (or for such shorter period that the registrant was required to file such reports), and (2) has been subject to such filing requirements for the past 90 days.
☒
Yes
☐
No
Indicate by check mark whether the registrant has submitted electronically and posted on its corporate Web site, if any, every Interactive Data File required to be submitted and posted pursuant to Rule 405 of Regulation S-T during the preceding 12 months (or for such shorter period that the registrant was required to submit and post such files).
☐
Yes
☐
No
Indicate by check mark whether the registrant is a large accelerated filer, an accelerated filer, or a non-accelerated filer. See definition of “accelerated filer and large accelerated filer” in Rule 12b-2 of the Exchange Act. (Check one):
|
Large accelerated filer
☒
|
Accelerated filer
☐
|
Non-accelerated filer
☐
|
Indicate by check mark which basis of accounting the registrant has used to prepare the financial statements included in this filing:
|
U.S. GAAP
☐
|
International Financial Reporting Standards as issued by the International Accounting Standards Board
☐
|
Other
☒
|
If “Other” has been checked in response to the previous question indicate by check mark which financial statement item the registrant has elected to follow.
☐
Item 17
☒
Item 18
If this is an annual report, indicate by check mark whether the registrant is a shell company (as defined in Rule 12b-2 of the Exchange Act).
☐
Yes
☒
No
Page
| 1 | ||
| 5 | ||
| 6 | ||
| 6 | ||
|
6
|
||
|
6
|
||
|
6
|
||
| 6 | ||
|
6
|
||
|
6
|
||
| 6 | ||
|
6
|
||
|
15
|
||
|
15
|
||
|
15
|
||
| 39 | ||
|
39
|
||
|
48
|
||
|
174
|
||
|
174
|
||
| 175 | ||
| 175 | ||
|
175
|
||
| 290 | ||
|
290
|
||
|
296
|
||
|
297
|
||
|
299
|
||
|
299
|
||
| 301 | ||
|
301
|
||
|
302
|
||
|
305
|
||
| 305 | ||
|
305
|
||
|
306
|
||
| 306 | ||
|
306
|
||
|
306
|
||
|
307
|
||
|
309
|
||
|
309
|
||
|
309
|
||
| 309 | ||
|
309
|
||
|
309
|
||
|
317
|
||
|
317
|
||
|
317
|
||
|
322
|
||
|
326
|
||
|
326
|
||
|
326
|
||
| 326 | ||
| 342 | ||
|
342
|
||
|
342
|
||
|
342
|
||
|
342
|
||
| 344 | ||
| 344 | ||
|
344
|
||
|
344
|
||
| 344 | ||
|
344
|
||
|
344
|
||
|
344
|
||
|
344
|
||
|
344
|
||
| 345 | ||
|
345
|
||
|
345
|
||
|
346
|
||
|
346
|
||
| 346 | ||
| 346 | ||
| 346 | ||
| 346 | ||
| 347 | ||
|
347
|
||
|
348
|
||
| 348 | ||
| 349 | ||
|
350
|
||
|
350
|
||
|
350
|
||
|
350
|
||
| Signatures | 351 | |
| Index to Consolidated Financial Statements | F-1 | |
All references herein to “peso,” “pesos,” “Colombian pesos” or “Ps” refer to the lawful currency of Colombia.
All references to “U.S. dollars,” “dollars” or “U.S.$” are to United States dollars. See “Item 3. Key information—A. Selected financial and operating data—Exchange rates” for
information regarding exchange rates for the Colombian currency. This annual report translates certain peso amounts
into U.S. dollars at specified rates solely for the convenience of the reader. The conversion of amounts expressed in
pesos as of a specified date at the then prevailing exchange rate may result in presentation of U.S. dollar amounts
that differ from U.S. dollar amounts that would have been obtained by converting pesos as of another specified
date. Unless otherwise noted in this annual report, all such peso amounts for figures at and for the year ended
December 31, 2014 have been translated at the
rate of Ps 2,392.46 per U.S.$1.00, which was the representative market rate calculated on December 31, 2014. The
representative market rate is computed and certified by the Superintendency of Finance on a daily basis and
represents the weighted average of the buy/sell foreign exchange rates negotiated on the previous day by certain
financial institutions authorized to engage in foreign exchange transactions. Such conversion should not be
construed as a representation that the peso amounts correspond to, or have been or could be converted into, U.S.
dollars at that rate or any other rate. On April 22, 2015, the representative market rate was Ps 2,469.03 per
U.S.$1.00.
Definitions
In this annual report, unless the context otherwise requires, the terms:
|
|
·
|
“Grupo Aval,” “we,” “us,” “our” and “our company” mean Grupo Aval Acciones y Valores S.A. and its consolidated subsidiaries;
|
|
|
·
|
“banks” and “our banking subsidiaries” mean Banco de Bogotá S.A., Banco de Occidente S.A., Banco Popular S.A. and Banco Comercial AV Villas S.A., and their respective consolidated subsidiaries;
|
|
|
·
|
“Banco de Bogotá” means Banco de Bogotá S.A. and its consolidated subsidiaries;
|
|
|
·
|
“Banco de Occidente” means Banco de Occidente S.A. and its consolidated subsidiaries;
|
|
|
·
|
“Banco Popular” means Banco Popular S.A. and its consolidated subsidiaries;
|
|
|
·
|
“Banco AV Villas” means Banco Comercial AV Villas S.A. and its consolidated subsidiary;
|
|
|
·
|
“BAC Credomatic” or “BAC” means BAC Credomatic Inc. and its consolidated subsidiaries;
|
|
|
·
|
“Banco BAC de Panamá” means Banco BAC de Panamá, S.A., and its consolidated subsidiaries, formerly known as Banco Bilbao Vizcaya Argentaria (Panamá) or “BBVA Panamá”;
|
|
|
·
|
“Corficolombiana” means Corporación Financiera Colombiana S.A. and its consolidated subsidiaries;
|
|
|
·
|
“Grupo Financiero Reformador” or “Grupo Reformador” means Grupo Financiero Reformador de Guatemala and its consolidated subsidiaries;
|
|
|
·
|
“Horizonte” means AFP Horizonte Sociedad Administradora de Fondos de Pensiones y de Cesantías S.A., formerly known as BBVA Horizonte Sociedad Administradora de Fondos de Pensiones y de Cesantías S.A.;
|
|
|
·
|
“LB Panamá” means Leasing Bogotá S.A., Panamá and its consolidated subsidiaries; and
|
|
|
·
|
“Porvenir” means Sociedad Administradora de Fondos de Pensiones y Cesantías Porvenir S.A. and its consolidated subsidiary.
|
The term “Superintendency of Finance” means the Colombian Superintendency of Finance (
Superintendencia Financiera de Colombia
), a supervisory authority ascribed to the Colombian Ministry of Finance and Public Credit (
Ministerio de Hacienda y Crédito Público
), or the “Ministry of Finance,” holding the inspection, supervision and
control authority over the persons involved in financial activities, securities markets, insurance and any other operations related to the management, use or investment of resources collected from the public.
Unless noted otherwise, references in this annual report to “beneficial ownership” are calculated pursuant to the definition ascribed by the U.S. Securities and Exchange Commission, or the “SEC,” in Form 20-F for foreign private issuers. In Form 20-F, the term “beneficial owner” of securities refers to any person who, even if not the record owner of the securities, has or shares the underlying benefits of ownership. These benefits include the power to direct the voting or the disposition of the securities or to receive the economic benefit of ownership of the securities. A person also is considered to be the “beneficial owner” of securities that the person has the right to acquire within 60 days by option or other agreement. Beneficial owners include persons who hold their securities through one or more trustees, brokers, agents, legal representatives or other intermediaries, or through companies in which they have a “controlling interest,” which means the direct or indirect power to direct the management and policies of the entity.
Financial statements
We are an issuer in Colombia of securities registered with the National Registry of Shares and Issuers, and in this capacity, we are subject to oversight by the Superintendency of Finance. We are not a financial institution in Colombia. We are required to comply with corporate governance and periodic reporting requirements to which all issuers are subject, but are not supervised or regulated as a financial institution or as a holding company of banking subsidiaries and, thus, are not required to comply with the capital adequacy regulations applicable to banks and other financial institutions. All of our banking subsidiaries (Banco de Bogotá, Banco de Occidente, Banco Popular, Banco AV Villas, and their respective financial subsidiaries, including Porvenir and Corficolombiana) are entities under the direct comprehensive supervision of, and subject to inspection and surveillance as financial institutions by, the Superintendency of Finance and, in the case of BAC Credomatic, subject to inspection and surveillance as a financial institution by the relevant regulatory authorities in each country where BAC Credomatic operates.
Our consolidated financial statements at December 31, 2014 and 2013 and for each of the years ended December 31, 2014, 2013 and 2012 have been audited, as stated in the report appearing herein, by KPMG Ltda., and are included in this annual report and referred to as our audited consolidated financial statements. We have prepared the consolidated financial statements included herein in accordance with the regulations of the Superintendency of Finance applicable to financial institutions (Resolution 3600 of 1988 and External Circular 100 of 1995) and, on issues not addressed by these regulations, generally accepted accounting principles prescribed by the Superintendency of Finance for banks operating in Colombia, consistently applied, together with such regulations, on the filing date (which we refer to in this annual report, collectively, as “Colombian Banking GAAP”).
Although we are not regulated as a financial institution, we present our consolidated financial statements under Colombian Banking GAAP in this annual report because we believe that presentation on that basis most appropriately reflects our activities as a holding company of a group of banks and other financial institutions. Our audited consolidated financial statements have not been reviewed or approved by the Superintendency of Finance; however, consolidated financial statements for each six-month period, prepared on the basis of Colombian Banking GAAP for each of our subsidiaries (which are the basis for our own consolidated financial statements) are submitted to the Superintendency of Finance for their review on a semi-annual basis. The Colombian Banking GAAP consolidated financial statements included in this annual report differ from the consolidated financial statements published by Grupo Aval in Colombia, which are prepared under Colombian GAAP.
Because we are not regulated as a financial institution in Colombia, we are required to prepare our consolidated financial statements for publication in Colombia under Colombian GAAP applicable to companies that are not financial institutions (Decree 2649 of 1993 and Circular No. 100-000006 of the Superintendency of Companies (
Superintendencia de Sociedades
) and former Superintendency of Securities (
Superintendencia de Valores
), currently the Superintendency of Finance) No. 011 of 2005, which differs in certain respects from Colombian Banking GAAP. These Colombian GAAP financial statements are presented semi-annually to our shareholders for approval, are reviewed and published by the Superintendency of Finance and are available in Spanish to the general public on our website. Please see
“Item 10. Additional Information––F. Dividends and paying agents—Dividend policy of Grupo Aval”
for a discussion of the main differences between Colombian Banking GAAP and Colombian GAAP. We do not file consolidated financial statements prepared on the basis of Colombian Banking GAAP with the Superintendency of Finance. However, we also from time to time publish semi-annual or quarterly financial data for subsequent periods on a Colombian Banking GAAP basis.
Colombian Banking GAAP differs in certain significant respects from generally accepted accounting principles in the United States, or “U.S. GAAP”. Note 30 to our audited consolidated financial statements provides a description of the principal differences between Colombian Banking GAAP and U.S. GAAP as they relate to our audited consolidated financial statements and provides a reconciliation of net income and shareholders’ equity for the years and at the dates indicated herein. Unless otherwise indicated, all financial information of our company included in this annual report is stated on a consolidated basis prepared under Colombian Banking GAAP.
LB Panamá segment
On December 9, 2010, we acquired BAC Credomatic through LB Panamá, a Central American banking group. See “Item 4. Information on the Company—B. Business overview—BAC Credomatic.”
LB Panamá’s financial information is prepared in accordance with Colombian Banking GAAP and primarily reflects BAC Credomatic’s consolidated results since December 2010 (including Grupo Financiero Reformador and Banco BAC de Panamá (merged into BAC International Bank, Inc. on December 9, 2014) since December 2013). As of December 31, 2014, LB Panamá’s unconsolidated balance sheet carried goodwill of Ps 3,031.3 billion (U.S.$1,267 million) resulting from the direct acquisitions the company made of BAC Credomatic and Banco BAC de Panamá (merged into BAC International Bank, Inc.). LB Panamá’s unconsolidated balance sheet also includes Ps 2,527.2 billion (U.S.$1,056 million) of indebtedness, including Ps 646.0 billion (U.S.$270 million) incurred to fund a portion of our acquisition of BAC Credomatic and Ps 1,881.2 billion (U.S.$786 million) of additional indebtedness, of which Ps 589.3 billion (U.S.$246 million) is owed to Grupo Aval Limited and Ps 1,291.9 billion (U.S.$540 million) is owed to Deutsche Bank. As of December 31, 2014, LB Panamá had a fixed income portfolio of Ps 1,757.8 billion (U.S.$735 million) comprised mainly of investment grade bonds issued by Latin American sovereign and corporate issuers, acquired pursuant to Banco de Bogotá’s investment guidelines.
Financial information for the year ended December 31, 2014 reflects the consolidation of Grupo Financiero Reformador and Banco BAC de Panamá (merged into BAC International Bank, Inc.), which were acquired in December 2013. As a result, financial information for the year ended December 31, 2014 and for the year ended December 31, 2013 are not fully comparable with prior periods.
Market share and other information
We obtained the market and competitive position data, including market forecasts, used throughout this annual report from market research, publicly available information and industry publications. We have presented this data on the basis of information from third-party sources that we believe are reliable, including, among others, the International Monetary Fund, or “IMF,” the Superintendency of Finance, the Colombian Stock Exchange, the Colombian National Bureau of Statistics (
Departamento Administrativo Nacional de Estadística
), or “DANE,” and the World Bank Development Indicators. Industry and government publications, including those referenced herein, generally state that the information presented has been obtained from sources believed to be reliable, but that the accuracy and completeness of such information is not guaranteed. Unless otherwise indicated, gross domestic product, or “GDP,” figures with respect to Colombia in this annual report are based on the 2005 base year data series published by DANE. Although we have no reason to believe that any of this information or these reports are inaccurate in any material respect, we have not independently verified the competitive position, market share, market size, market growth or other data provided by third parties or by industry or other publications. We do not make any representation or warranty as to the accuracy of such information.
Except where otherwise indicated, our balance sheet and statement of income data included in this annual report reflects consolidated Colombian Banking GAAP information, while comparative disclosures of our financial and operating performance against that of our competitors are based on unconsolidated information prepared on the basis of Colombian Banking GAAP reported to the Superintendency of Finance. Our banking subsidiaries report unconsolidated financial data to the Superintendency of Finance; however, Grupo Aval, as a holding company, is not required to report such data. Unless otherwise indicated or the context otherwise requires, market share and other data comparing our performance to that of our competitors reflects the unconsolidated results of our banking subsidiaries, Porvenir, Corficolombiana and BAC Credomatic. “Grupo Aval aggregate” data throughout this annual report reflects the sum of the unconsolidated financial statements of our four Colombian banking subsidiaries (Banco de Bogotá, Banco de Occidente, Banco Popular and Banco AV Villas) as reported to the Superintendency of Finance. These unconsolidated financial statements do not reflect the consolidation of subsidiaries such as Corficolombiana, Porvenir or LB Panamá, are not intended to reflect the consolidated financial results of Grupo
Aval and are not necessarily indicative of the results for any other future interim period. Except where otherwise indicated, financial and market share data pertaining to BAC Credomatic has been prepared in accordance with U.S. GAAP. Information regarding our competitors that is presented on a consolidated basis is based on the financial statements of each bank publicly available on their respective websites. All calculations on an unconsolidated basis are made based on publicly available information filed with the Superintendency of Finance.
Banks, financing companies and finance corporations are deemed credit institutions by the Superintendency of Finance and are the principal institutions authorized to accept deposits and make loans in Colombia. Banks undertake traditional deposit-taking and lending activities. Financing companies place funds in circulation by means of active credit operations, with the purpose of fostering the sale of goods and services, including the development of leasing operations. Finance corporations invest directly in the economy and thus are the only credit institutions that may invest in non-financial sectors. Banks are permitted to invest in finance corporations. See “Item 4. Information on the Company—B. Business overview—Supervision and regulation.” In Colombia, we operate four banks, one financing company and one finance corporation, and our market share is determined by comparing our banks to other banks reporting their results to the Superintendency of Finance. However, if financing companies and finance corporations are included in the calculation of market share data, our market shares would generally be lower than in a bank-only comparison, and the gaps between our market shares and those of our competitors would be smaller, but our market leadership in most market categories would be unaffected.
We consider our principal competitors in Colombia to be Bancolombia S.A., or “Bancolombia,” Banco Davivienda S.A., or “Davivienda,” and Banco Bilbao Vizcaya Argentaria Colombia S.A., or “BBVA Colombia,” which are the three leading banking groups in Colombia after Grupo Aval.
The principal competitors of Porvenir, our pension and severance fund administrator, include Administradora de Fondos de Pensiones y Cesantías Protección S.A., or “Protección,” Colfondos S.A. Pensiones y Cesantías, or “Colfondos” and Skandia Administradora de Fondos de Pensiones y Cesantías S.A., or “Skandia.” We have included in this annual report competitive market position data for Porvenir as compared to these principal competitors. Corficolombiana, our merchant bank, is a financial corporation, and its competitors include Banca de Inversión Bancolombia S.A., J.P. Morgan Corporación Financiera S.A., BNP Paribas Colombia Corporación Financiera S.A. and Itaú BBA Colombia S.A. Corporación Financiera.
Our principal competitors in Costa Rica, El Salvador, Guatemala, Honduras, Nicaragua and Panamá include Banco Industrial, Scotiabank, G&T Continental, Citibank and Bancolombia (which in October 2013 acquired (i) a 40% interest in Grupo Agromercantil Holding S.A., the parent Company of Banco Agromercantil in Guatemala, and (ii) a 100% interest in the ordinary voting shares in Banistmo (formerly HSBC Bank (Panamá) S.A. in Panamá)).
We include certain ratios in this annual report which we believe provide investors with important information regarding our operations, such as return on average shareholders’ equity, or “ROAE,” return on average assets, or “ROAA,” net interest margin, and operational efficiency and asset quality indicators, among others. In addition, certain of these ratios are also used in this annual report to compare us to our principal competitors.
Other conventions
Certain figures included in this annual report have been subject to rounding adjustments. Accordingly, figures shown as totals in certain tables may not be an arithmetic summation of the figures that precede them. References to “billions” in this annual report are to 1,000,000,000s and to “trillions” are to 1,000,000,000,000s.
“Minority interest” and “non-controlling interest” both refer to the participation of minority shareholders in Grupo Aval or our subsidiaries, as applicable.
“Central American acquisitions” refers to the acquisitions by Banco de Bogotá of (i) a 98.92% equity interest in Banco BAC de Panamá on December 19, 2013 through its subsidiary LB Panamá and (ii) 100.00% equity interest in Grupo Financiero Reformador de Guatemala on December 23, 2013 through its indirect subsidiary Credomatic International Corporation (a subsidiary of LB Panamá). On December 9, 2014, Banco BAC de Panamá was merged into BAC International Bank, Inc.
This annual report contains estimates and forward-looking statements, principally in “Item 3. Key information—D. Risk factors,” “Item 5. Operating and financial review and prospects” and “Item 4. Information on the Company—B. Business overview.” Some of the matters discussed concerning our operations and financial performance include estimates and forward-looking statements within the meaning of the Securities Act and the U.S. Securities Exchange Act of 1934, as amended, or the “Exchange Act.”
Our estimates and forward-looking statements are mainly based on our current expectations and estimates on projections of future events and trends, which affect or may affect our businesses and results of operations. Although we believe that these estimates and forward-looking statements are based upon reasonable assumptions, they are subject to several risks and uncertainties and are made in light of information currently available to us. Our estimates and forward-looking statements may be influenced by the following factors, among others:
|
|
·
|
changes in Colombian, Central American, regional and international business and economic, political or other conditions;
|
|
|
·
|
developments affecting Colombian, Central American and international capital and financial markets;
|
|
|
·
|
government regulation and tax matters and developments affecting our company and industry;
|
|
|
·
|
increases in defaults by our customers;
|
|
|
·
|
increases in goodwill impairment losses;
|
|
|
·
|
decreases in deposits, customer loss or revenue loss;
|
|
|
·
|
increases in provisions for contingent liabilities;
|
|
|
·
|
our ability to sustain or improve our financial performance;
|
|
|
·
|
increases in inflation rates, particularly in Colombia and in jurisdictions we operate in Central America;
|
|
|
·
|
the level of financial products and credit penetration in Colombia and Central America;
|
|
|
·
|
changes in interest rates which may, among other effects, adversely affect margins and the valuation of our treasury portfolio;
|
|
|
·
|
decreases in the spread between investment yields and implied interest rates in annuities;
|
|
|
·
|
movements in exchange rates;
|
|
|
·
|
competition in the banking and financial services, credit card services, insurance, asset management, pension fund administration and related industries;
|
|
|
·
|
adequacy of risk management procedures and credit, market and other risks of lending and investment activities;
|
|
|
·
|
decreases in our level of capitalization;
|
|
|
·
|
changes in market values of Colombian and Central American securities, particularly Colombian government securities;
|
|
|
·
|
adverse legal or regulatory disputes or proceedings;
|
|
|
·
|
successful integration and future performance of acquired businesses or assets;
|
|
|
·
|
internal security issues affecting countries where we operate and natural disasters;
|
|
|
·
|
loss of key members of our senior management; and
|
|
|
·
|
other risk factors as set forth under ““Item 3. Key information—D. Risk factors.”
|
The words “believe,” “may,” “will,” “estimate,” “continue,” “anticipate,” “intend,” “expect” and similar words are intended to identify estimates and forward-looking statements. Estimates and forward-looking statements speak only at the date they were made, and we undertake no obligation to update or to review any estimate and/or forward-looking statement because of new information, future events or other factors. Estimates and forward-looking statements involve risks and uncertainties and are not guarantees of future performance. Our future results may differ materially from those expressed in these estimates and forward-looking statements. In light of the risks and uncertainties described above, the estimates and forward-looking statements discussed in this annual report might not occur and our future results and our performance may differ materially from those expressed in these forward-looking statements due to, including, but not limited to, the factors mentioned above. Because of these uncertainties, you should not make any investment decision based on these estimates and forward-looking statements.
|
Directors and senior management
|
Not applicable.
|
Advisers
|
Not applicable.
|
Auditors
|
Not applicable.
|
Offer statistics
|
Not applicable.
|
Method and expected timetable
|
Not applicable.
|
Selected financial data
|
The following financial data of Grupo Aval at December 31, 2014 and 2013 and for the years ended December 31, 2014, 2013 and 2012 have been derived from our audited consolidated financial statements prepared in accordance with Colombian Banking GAAP that are included in this annual report. The selected financial data at December 31, 2011 and 2010 and for the year ended December 31, 2010 have been derived from our audited consolidated financial statements prepared in accordance with Colombian Banking GAAP that are not included in this annual report. Our historical results are not necessarily indicative of results to be expected for future periods.
This financial data should be read in conjunction with our audited consolidated financial statements and the related notes, “Presentation of financial and other information” and “Item 5. Operating and financial review and prospects” included in this annual report.
Statement of income data
|
Grupo Aval
|
||||||||||||||||||||||||
|
For the year ended December 31,
|
||||||||||||||||||||||||
|
2014
|
2014
|
2013
|
2012
|
2011
|
2010
|
|||||||||||||||||||
|
(in U.S.$ millions, unless otherwise indicated)
(1)
|
(in Ps billions, except share and per share data)
|
|||||||||||||||||||||||
|
Colombian Banking GAAP
|
||||||||||||||||||||||||
|
Operating income:
|
||||||||||||||||||||||||
|
Net interest income
|
3,159.1 | 7,558.1 | 6,981.0 | 6,310.3 | 5,468.9 | 4,628.8 | ||||||||||||||||||
|
Provisions for loan and financial lease losses, accrued interest and other receivables, net
|
(700.1 | ) | (1,675.0 | ) | (1,417.4 | ) | (1,041.8 | ) | (874.9 | ) | (820.3 | ) | ||||||||||||
|
Recovery of charged-off assets
|
79.1 | 189.2 | 148.2 | 142.7 | 167.5 | 109.0 | ||||||||||||||||||
|
Provision (recovery) for investment securities, foreclosed assets and other assets
|
(21.9 | ) | (52.4 | ) | (25.0 | ) | (18.2 | ) | 291.1 | (315.6 | ) | |||||||||||||
|
Total (provisions) reversals, net
|
(642.9 | ) | (1,538.2 | ) | (1,294.2 | ) | (917.3 | ) | (416.3 | ) | (1,026.9 | ) | ||||||||||||
|
Total fees and other services income, net
|
1,322.0 | 3,162.8 | 2,814.4 | 2,382.0 | 2,234.4 | 1,617.7 | ||||||||||||||||||
|
Total other operating income
|
470.4 | 1,125.4 | 1,317.4 | 885.7 | 958.0 | 785.5 | ||||||||||||||||||
|
Total operating income
|
4,308.5 | 10,308.0 | 9,818.5 | 8,660.6 | 8,244.9 | 6,005.1 | ||||||||||||||||||
|
Total operating expenses
|
(2,749.6 | ) | (6,578.2 | ) | (6,028.1 | ) | (5,299.5 | ) | (4,932.9 | ) | (3,520.0 | ) | ||||||||||||
|
Net operating income
|
1,559.0 | 3,729.8 | 3,790.4 | 3,361.1 | 3,312.0 | 2,485.1 | ||||||||||||||||||
|
Non-operating income (expense):
|
||||||||||||||||||||||||
|
Other income
|
228.7 | 547.1 | 453.4 | 618.5 | 320.7 | 364.6 | ||||||||||||||||||
|
Other expense
|
(118.7 | ) | (284.0 | ) | (217.2 | ) | (170.4 | ) | (124.5 | ) | (187.6 | ) | ||||||||||||
|
Total non-operating income (expense), net
|
110.0 | 263.1 | 236.1 | 448.1 | 196.2 | 176.9 | ||||||||||||||||||
|
Income before income tax expense and non-controlling interest
|
1,669.0 | 3,992.9 | 4,026.6 | 3,809.2 | 3,508.2 | 2,662.1 | ||||||||||||||||||
|
Income tax expense
|
(605.7 | ) | (1,449.0 | ) | (1,414.7 | ) | (1,371.7 | ) | (1,136.7 | ) | (831.0 | ) | ||||||||||||
|
Income before non-controlling interest
|
1,063.3 | 2,543.9 | 2,611.9 | 2,437.4 | 2,371.5 | 1,831.1 | ||||||||||||||||||
|
Non-controlling interest
|
(365.8 | ) | (875.2 | ) | (1,011.4 | ) | (911.1 | ) | (1,080.2 | ) | (874.2 | ) | ||||||||||||
|
Net income attributable to Grupo Aval shareholders
|
697.5 | 1,668.7 | 1,600.5 | 1,526.4 | 1,291.2 | 956.9 | ||||||||||||||||||
|
Earnings per 1,000 shares (basic and diluted earnings):
|
||||||||||||||||||||||||
|
Common and preferred shares (in pesos)
|
79,850.9 | 86,013.9 | 82,277.2 | 79,184.3 | 68,621.0 | |||||||||||||||||||
|
Common and preferred shares (in U.S.
dollars) (1)
|
33.4 | 36.0 | 34.4 | 33.1 | 28.7 | |||||||||||||||||||
|
Dividends and interest on capital per 1,000 shares (2):
|
||||||||||||||||||||||||
|
Common and preferred shares (in pesos)
|
61,733.7 | 55,632.9 | 49,200.0 | 48,465.3 | 37,800.0 | |||||||||||||||||||
|
Common and preferred shares (in U.S.
dollars) (1)
|
25.8 | 23.3 | 20.6 | 20.3 | 15.8 | |||||||||||||||||||
|
Weighted average number of common and preferred fully paid shares outstanding (basic and diluted):
|
||||||||||||||||||||||||
|
Outstanding shares (in thousands)
|
20,897,356.4 | 18,607,487.3 | 18,551,766.5 | 16,306,613.4 | 13,943,980.7 | |||||||||||||||||||
|
U.S. GAAP (3)
|
||||||||||||||||||||||||
|
Provision for loans, leases and other receivables
|
(1,389.6 | ) | (1,113.5 | ) | (971.7 | ) | (670.0 | ) | (614.0 | ) | ||||||||||||||
|
Net income attributable to controlling interest under U.S. GAAP
|
1,854.9 | 1,632.5 | 1,564.5 | 885.3 | 965.3 | |||||||||||||||||||
|
Basic and diluted net income per 1,000 shares
|
||||||||||||||||||||||||
|
Outstanding shares (pesos)
|
88,762.4 | 87,731.9 | 84,330.3 | 54,293.4 | 69,228.4 | |||||||||||||||||||
|
Outstanding shares (U.S. dollars) (1)
|
37.1 | 36.7 | 35.2 | 22.7 | 28.9 | |||||||||||||||||||
|
(1)
|
Translated for convenience only using the representative market rate as computed and certified by the Superintendency of Finance at December 31, 2014 of Ps 2,392.46 per U.S.$1.00.
|
|
(2)
|
Dividends are declared semi-annually in March (for the six-month period ended December 31 of the previous year) and September (for the six-month period ended June 30 of the current year) of each year. We do not declare dividends on a quarterly basis.
|
|
(3)
|
See note 30 to our audited consolidated financial statements included in this annual report for reconciliations to U.S. GAAP.
|
Balance sheet data
|
Grupo Aval
|
||||||||||||||||||||||||
|
At December 31,
|
||||||||||||||||||||||||
|
2014
|
2014
|
2013
|
2012
|
2011
|
2010
|
|||||||||||||||||||
|
(in U.S.$ millions, except per share data)
(1)
|
(in Ps billions, except per share data)
|
|||||||||||||||||||||||
|
Colombian Banking GAAP
|
||||||||||||||||||||||||
|
Assets:
|
||||||||||||||||||||||||
|
Total cash and cash equivalents
|
7,813.5 | 18,693.5 | 16,096.6 | 13,398.9 | 11,698.6 | 9,682.6 | ||||||||||||||||||
|
Total investment securities, net
|
11,950.5 | 28,591.0 | 27,298.6 | 23,295.8 | 18,975.2 | 19,174.9 | ||||||||||||||||||
|
Total loans and financial leases, net
|
45,702.9 | 109,342.4 | 93,440.8 | 77,483.8 | 67,641.2 | 56,439.7 | ||||||||||||||||||
|
Total interest accrued on loans and financial leases, net
|
347.2 | 830.7 | 735.2 | 716.0 | 583.5 | 448.2 | ||||||||||||||||||
|
Bankers’ acceptances, spot transactions and derivatives
|
509.5 | 1,218.9 | 411.9 | 454.3 | 418.8 | 306.9 | ||||||||||||||||||
|
Accounts receivable, net
|
881.6 | 2,109.2 | 1,765.6 | 1,800.9 | 1,612.9 | 1,337.3 | ||||||||||||||||||
|
Property, plant and equipment, net
|
951.3 | 2,276.0 | 2,044.8 | 1,794.9 | 1,761.3 | 1,643.7 | ||||||||||||||||||
|
Operating leases, net
|
170.1 | 406.8 | 439.2 | 375.7 | 323.2 | 263.9 | ||||||||||||||||||
|
Foreclosed assets, net
|
56.1 | 134.1 | 109.2 | 92.0 | 77.8 | 85.5 | ||||||||||||||||||
|
Prepaid expenses and deferred charges
|
1,181.6 | 2,827.0 | 2,239.7 | 1,961.7 | 1,956.2 | 920.7 | ||||||||||||||||||
|
Goodwill, net (2)
|
2,351.8 | 5,626.7 | 4,968.0 | 2,842.5 | 3,110.7 | 3,031.4 | ||||||||||||||||||
|
Other assets, net
|
709.9 | 1,698.3 | 1,323.9 | 1,128.6 | 1,072.6 | 912.0 | ||||||||||||||||||
|
Reappraisal of assets
|
1,613.4 | 3,860.0 | 3,413.7 | 2,317.8 | 2,269.7 | 2,062.5 | ||||||||||||||||||
|
Total assets
|
74,239.4 | 177,614.7 | 154,287.4 | 127,663.0 | 111,501.9 | 96,309.3 | ||||||||||||||||||
|
Liabilities:
|
||||||||||||||||||||||||
|
Total deposits
|
47,813.6 | 114,392.2 | 101,190.4 | 81,463.3 | 71,007.6 | 63,669.3 | ||||||||||||||||||
|
Bankers’ acceptances and derivatives financial instruments
|
832.6 | 1,992.1 | 447.3 | 410.0 | 469.0 | 309.3 | ||||||||||||||||||
|
Interbank borrowings and overnight funds
|
1,918.3 | 4,589.5 | 5,123.6 | 5,156.5 | 3,225.1 | 2,477.4 | ||||||||||||||||||
|
Borrowings from banks and others
|
6,083.7 | 14,555.1 | 11,954.1 | 10,380.9 | 11,437.8 | 10,491.2 | ||||||||||||||||||
|
Accounts payable
|
1,184.6 | 2,834.0 | 2,867.7 | 3,005.3 | 3,093.9 | 2,243.5 | ||||||||||||||||||
|
Accrued interest payable
|
261.3 | 625.2 | 509.2 | 474.8 | 313.0 | 247.4 | ||||||||||||||||||
|
Other liabilities
|
1,263.4 | 3,022.6 | 2,221.7 | 1,700.6 | 1,447.8 | 1,291.9 | ||||||||||||||||||
|
Long-term debt (bonds)
|
5,241.9 | 12,541.0 | 11,179.7 | 9,769.0 | 6,566.2 | 5,952.4 | ||||||||||||||||||
|
Estimated liabilities
|
250.0 | 598.2 | 593.3 | 811.7 | 855.3 | 596.9 | ||||||||||||||||||
|
Non-controlling interest
|
3,079.8 | 7,368.2 | 6,472.2 | 5,407.7 | 4,927.0 | 4,475.5 | ||||||||||||||||||
|
Total liabilities
|
67,929.3 | 162,518.0 | 142,559.2 | 118,579.9 | 103,342.7 | 91,754.7 | ||||||||||||||||||
|
Shareholders’ equity:
|
||||||||||||||||||||||||
|
Subscribed and paid-in capital:
|
||||||||||||||||||||||||
|
Common
and preferred
shares
|
9.3 | 22.3 | 20.2 | 18.6 | 18.6 | 13.9 | ||||||||||||||||||
|
Additional paid-in capital
|
3,554.8 | 8,504.7 | 5,784.5 | 3,671.7 | 3,671.1 | 647.4 | ||||||||||||||||||
|
Retained earnings:
|
||||||||||||||||||||||||
|
Appropriated
|
1,658.5 | 3,967.9 | 3,574.8 | 2,911.3 | 2,332.0 | 1,930.3 | ||||||||||||||||||
|
Unappropriated
|
355.0 | 849.4 | 765.6 | 804.9 | 669.0 | 483.3 | ||||||||||||||||||
|
Equity surplus:
|
||||||||||||||||||||||||
|
Equity inflation adjustments
|
272.6 | 652.1 | 652.2 | 654.6 | 741.9 | 742.1 | ||||||||||||||||||
|
Unrealized gains (losses) on investment securities available for sale
|
(227.4 | ) | (543.9 | ) | (523.6 | ) | 78.2 | (293.0 | ) | 29.7 | ||||||||||||||
|
Reappraisal of assets
|
687.2 | 1,644.1 | 1,454.5 | 943.8 | 1,019.6 | 707.8 | ||||||||||||||||||
|
Total shareholders’ equity (2)
|
6,310.1 | 15,096.6 | 11,728.2 | 9,083.1 | 8,159.1 | 4,554.6 | ||||||||||||||||||
|
Total liabilities and shareholders’ equity
|
74,239.4 | 177,614.7 | 154,287.4 | 127,663.0 | 111,501.9 | 96,309.3 | ||||||||||||||||||
|
U.S. GAAP (3)
|
||||||||||||||||||||||||
|
Loans
|
45,547.2 | 108,969.8 | 93,924.4 | 78,333.3 | 68,067.0 | 57,784.6 | ||||||||||||||||||
|
Financial leases
|
3,624.7 | 8,672.0 | 8,103.4 | 7,650.7 | 6,392.8 | 4,015.0 | ||||||||||||||||||
|
Total loans and financial leases
|
49,171.9 | 117,641.8 | 102,027.8 | 85,984.0 | 74.459.8 | 61,799.6 | ||||||||||||||||||
|
Allowance for loans, lease losses and other receivables losses
|
(1,209.8 | ) | (2,894.5 | ) | (2,615.7 | ) | (2,350.4 | ) | (2,012.9 | ) | (2,012.4 | ) | ||||||||||||
|
Total loans and financial leases, net
|
47,962.1 | 114,747.3 | 99,412.0 | 83,633.6 | 72,446.9 | 59,787.2 | ||||||||||||||||||
|
Controlling interest shareholders’ equity under U.S. GAAP
|
5,331.8 | 12,756.0 | 9,536.5 | 7,426.2 | 6,466.7 | 3,949.5 | ||||||||||||||||||
|
Controlling interest shareholders’ equity under U.S. GAAP per 1,000 shares (U.S. dollars and Ps)
|
255,140.0 | 610,412.1 | 512,510.6 | 400,297.5 | 396,567.6 | 283,242.4 | ||||||||||||||||||
|
(1)
|
Translated for convenience only using the representative market rate as computed and certified by the Superintendency of Finance at December 31, 2014 of Ps 2,392.46 per U.S.$1.00.
|
|
(2)
|
Goodwill attributable to Grupo Aval’s shareholders was Ps 4,133.3 billion and Ps 3,617.4 billion at December 31, 2014 and 2013, respectively. Our attributable tangible equity (calculated as total shareholders’ equity minus goodwill attributable to Grupo Aval) was Ps 10,963.3 billion and Ps 8,110.8 billion at December 31, 2014 and 2013, respectively.
|
|
(3)
|
See note 30 to our audited consolidated financial statements included in this annual report for reconciliations to U.S. GAAP.
|
Other financial and operating data
|
Grupo Aval
|
||||||||||||||||||||
|
At and for the year ended December 31,
|
||||||||||||||||||||
|
Colombian Banking GAAP
|
2014
|
2013
|
2012
|
2011
|
2010
|
|||||||||||||||
|
(in percentages, unless otherwise indicated)
|
||||||||||||||||||||
|
Profitability ratios:
|
||||||||||||||||||||
|
Net interest margin (1)
|
5.8 | 6.2 | 6.5 | 6.5 | 7.2 | |||||||||||||||
|
ROAA (2)
|
1.5 | 1.9 | 2.0 | 2.3 | 2.2 | |||||||||||||||
|
ROAE (3)
|
12.4 | 17.1 | 17.7 | 20.3 | 22.2 | |||||||||||||||
|
Efficiency ratio:
|
||||||||||||||||||||
|
Operating expenses before depreciation and amortization / total operating income before net provisions (4)
|
51.0 | 50.4 | 51.3 | 52.7 | 46.6 | |||||||||||||||
|
Capital ratios:
|
||||||||||||||||||||
|
Period-end shareholders’ equity and non-controlling interest as a percentage of period-end total assets
|
12.6 | 11.8 | 11.4 | 11.7 | 9.4 | |||||||||||||||
|
Tangible equity ratio (5)
|
9.8 | 8.9 | 9.3 | 9.2 | 6.4 | |||||||||||||||
|
Credit quality data:
|
||||||||||||||||||||
|
Non-performing loans as a percentage of total loans (6)
|
1.9 | 1.8 | 1.6 | 1.6 | 1.9 | |||||||||||||||
|
Delinquency ratio past due more than 30 days
|
2.6 | 2.4 | 2.3 | 2.2 | 2.7 | |||||||||||||||
|
“C,” “D” and “E” loans as a percentage of total loans (7)
|
4.0 | 3.5 | 3.3 | 3.2 | 3.9 | |||||||||||||||
|
Allowance for loans as a percentage of non-performing loans
|
163.1 | 179.3 | 194.3 | 200.6 | 194.0 | |||||||||||||||
|
Allowance for loans as a percentage of past due loans
|
117.1 | 133.3 | 139.2 | 150.0 | 139.1 | |||||||||||||||
|
Allowance for loans as a percentage of “C,” “D” and “E” loans
|
74.9 | 90.4 | 95.6 | 103.8 | 96.2 | |||||||||||||||
|
Allowance for loans as a percentage of total loans
|
3.0 | 3.2 | 3.2 | 3.3 | 3.7 | |||||||||||||||
|
Operational data (in units):
|
||||||||||||||||||||
|
Number of customers of the banks (8)
|
12,950,374 | 11,661,279 | 10,345,695 | 9,596,694 | 8,700,266 | |||||||||||||||
|
Number of employees
|
74,211 | 66,865 | 59,406 | 54,463 | 53,485 | |||||||||||||||
|
Number of branches (9)
|
1,769 | 1,721 | 1,545 | 1,491 | 1,438 | |||||||||||||||
|
Number of ATMs (9)
|
5,429 | 5,179 | 4,328 | 3,835 | 3,518 | |||||||||||||||
|
(1)
|
Net interest margin is calculated as net interest income divided by total average interest-earning assets.
|
|
(2)
|
For the years ended December 31, ROAA is calculated as income before non-controlling interest divided by average assets (the sum of total assets at December 31 of the fiscal year and total assets at December 31 of the previous fiscal year, divided by two). For the year ended December 31, 2010, BAC Credomatic’s results are included in 1/12 of our 2010 income but in 1/2 of our average assets due to the consolidation of BAC Credomatic financial data in Grupo Aval’s financial statements from December 1, 2010. Excluding BAC Credomatic’s assets from the calculation, results in an adjusted Grupo Aval ROAA of 2.5%.
|
|
|
If average assets were calculated using monthly consolidated information, rather than the average at the beginning and end of an annual period, our ROAA would be: 1.6%, 1.9%, 2.1%, 2.3% and 2.4% for the periods ended December 31, 2014, 2013, 2012, 2011 and 2010, respectively.
|
|
(3)
|
For the years ended December 31, ROAE is calculated as net income divided by average shareholders’ equity (shareholders’ equity at the end of the period plus shareholder’ equity at the end of the prior period, divided by two), ROAE for the year ended December 31, 2014, is adjusted to exclude the Ps 2.1 trillion raised through the issuance of 1,626,520,862 shares at December 31, 2013 during the Common Share Rights Offering. If the Common Share Rights Offering is not excluded, ROAE for Grupo Aval would have been 15.4%.
|
|
|
If average shareholders’ equity were calculated using monthly consolidated information, rather than the average at the beginning and end of such period, our ROAE would be as follows: 13.0%, 17.3%, 17.8%, 23.8% and 23.3% for the periods ended December 31, 2014, 2013, 2012, 2011 and 2010, respectively. There was no significant effect to shareholders’ equity at December 31, 2010 resulting from the BAC Credomatic transaction.
|
|
(4)
|
See “—Non-GAAP measures reconciliation.”
|
|
(5)
|
Tangible equity ratio is calculated as shareholders’ equity plus non-controlling interest minus goodwill, divided by total assets minus goodwill. See “—Non-GAAP measures reconciliation.”
|
|
(6)
|
Non-performing loans, include microcredit loans that are past due more than 30 days, mortgage and consumer loans that are past due more than 60 days and commercial loans that are past due more than 90 days. Each category includes financial leases. See “Item 4. Information on the Company—B. Business overview—Selected statistical data—Loan portfolio—Risk categories.”
|
|
(7)
|
See “Item 4. Information on the Company—B. Business overview—Selected statistical data—Loan portfolio—Risk categories.”
|
|
(8)
|
Reflects aggregated customers of our banking subsidiaries. Customers of more than one of our banking subsidiaries and BAC Credomatic are counted separately for each banking subsidiary.
|
|
(9)
|
Reflects aggregated number of branches or ATMs of our banking subsidiaries and BAC Credomatic, as applicable, located throughout Colombia and Central America.
|
Non-GAAP measures reconciliation
The tables in this section and elsewhere in this annual report provide the calculation of certain measures and a reconciliation of non-GAAP and other measures to GAAP measures. For a reconciliation of certain capitalization ratios described in “Item 5. Operating and Financial Review and Prospects—B. Liquidity and capital resources,” see “Item 4. Information on the Company—B. Business overview—Supervision and regulation—Capital adequacy requirements.” The non-GAAP financial measures as determined and measured by us, should also not be compared to similarly titled measures reported by other companies. Other companies may report such measures differently.
ROAA and ROAE
We believe ROAA, which is calculated as net income before non-controlling interest divided by average assets, provides a more meaningful measure of return on assets than a calculation based on net income over average assets because, although non-controlling interests affect the amount of reported net income attributable to Grupo Aval’s shareholders, they do not affect the profitability of assets. We believe ROAE, which is calculated as net income divided by average shareholders’ equity, provides a meaningful measure of the return generated for our shareholders.
The following table sets forth ROAA and ROAE for each of our banking subsidiaries, Porvenir, Corficolombiana, LB Panamá, Grupo Aval consolidated, and those of our principal competitors, using period-end averages, for the periods listed below.
ROAE for Banco de Bogotá for the year ended December 31, 2014 has been adjusted to exclude the effect of the equity capitalizations in the amount of Ps 1,500 billion, as this capitalization took place towards the end of the year and had no material impact on Banco de Bogotá’s income statement for 2014.
ROAA and ROAE for Banco de Occidente for the year ended December 31, 2014 have been adjusted to exclude the positive effect from the net gain of Ps 729.8 billion associated with the reclassification of its investment in Corficolombiana from its available for sale portfolio to its trading portfolio, and with the sale of part of these shares to Grupo Aval.
ROAE for Banco de Bogotá, LB Panamá and Grupo Aval for the year ended December 31, 2013 has been adjusted to exclude the effect of the equity capitalizations in the amounts of Ps 1,300 billion, Ps 963 billion and Ps 2,114 billion, respectively, effected in December 2013, as the capitalizations took place towards the end of the year and had no material impact on our income statement for 2013.
|
Year ended December 31,
|
||||||||||||
|
2014
|
2013
|
2012
|
||||||||||
|
(in Ps billions, except percentages)
|
||||||||||||
|
Banco de Bogotá:
|
||||||||||||
|
Average assets(1)
|
109,518 | 90,588 | 74,658 | |||||||||
|
Average equity(2)(3)
|
10,300 | 8,200 | 7,324 | |||||||||
|
Net income
|
1,389 | 1,400 | 1,326 | |||||||||
|
Net income divided by average assets
|
1.3 | % | 1.5 | % | 1.8 | % | ||||||
|
Non-controlling interest
|
502 | 546 | 426 | |||||||||
|
ROAA(1)
|
1.7 | % | 2.1 | % | 2.3 | % | ||||||
|
ROAE(2)(3)
|
13.5 | % | 17.1 | % | 18.1 | % | ||||||
|
Non-controlling interest divided by income before non-controlling interest
|
26.5 | % | 28.1 | % | 24.3 | % | ||||||
|
Banco de Occidente:
|
||||||||||||
|
Average assets(1)
|
30,781 | 26,934 | 23,509 | |||||||||
|
Average equity(2)
|
3,885 | 3,613 | 3,236 | |||||||||
|
Net income(4)
|
466 | 428 | 520 | |||||||||
|
Net income divided by average assets
|
1.5 | % | 1.6 | % | 2.2 | % | ||||||
|
Non-controlling interest
|
2 | 1 | 2 | |||||||||
|
ROAA(1)
|
1.5 | % | 1.6 | % | 2.2 | % | ||||||
|
ROAE(2)
|
12.0 | % | 11.9 | % | 16.1 | % | ||||||
|
Non-controlling interest divided by income before non-controlling interest
|
0.3 | % | 0.3 | % | 0.4 | % | ||||||
|
Banco Popular:
|
||||||||||||
|
Average assets(1)
|
16,886 | 15,920 | 14,690 | |||||||||
|
Average equity(2)
|
2,528 | 2,297 | 2,024 | |||||||||
|
Net income
|
366 | 396 | 378 | |||||||||
|
Net income divided by average assets
|
2.2 | % | 2.5 | % | 2.6 | % | ||||||
|
Non-controlling interest
|
1 | 2 | 4 | |||||||||
|
ROAA(1)
|
2.2 | % | 2.5 | % | 2.6 | % | ||||||
|
ROAE(2)
|
14.5 | % | 17.3 | % | 18.7 | % | ||||||
|
Non-controlling interest divided by income before non-controlling interest
|
0.2 | % | 0.6 | % | 1.0 | % | ||||||
|
Banco AV Villas:
|
||||||||||||
|
Average assets(1)
|
10,340 | 9,315 | 8,269 | |||||||||
|
Average equity(2)
|
1,230 | 1,154 | 1,033 | |||||||||
|
Net income
|
195 | 186 | 172 | |||||||||
|
Net income divided by average assets
|
1.9 | % | 2.0 | % | 2.1 | % | ||||||
|
Non-controlling interest
|
0 | 0 | 0 | |||||||||
|
ROAA(1)
|
1.9 | % | 2.0 | % | 2.1 | % | ||||||
|
ROAE(2)
|
15.9 | % | 16.1 | % | 16.7 | % | ||||||
|
Non-controlling interest divided by income before non-controlling interest
|
0.2 | % | 0.0 | % | 0.1 | % | ||||||
|
Porvenir:
|
||||||||||||
|
Average assets(1)
|
1,772 | 1,281 | 859 | |||||||||
|
Average equity(2)
|
1,206 | 965 | 710 | |||||||||
|
Net income
|
282 | 202 | 214 | |||||||||
|
Net income divided by average assets
|
15.9 | % | 15.7 | % | 24.9 | % | ||||||
|
Non-controlling interest
|
1 | 7 | 0 | |||||||||
|
ROAA(1)
|
16.0 | % | 16.3 | % | 24.9 | % | ||||||
|
ROAE(2)
|
23.4 | % | 20.9 | % | 30.1 | % | ||||||
|
Non-controlling interest divided by income before non-controlling interest
|
0.2 | % | 3.2 | % | 0.1 | % | ||||||
|
Corficolombiana:
|
||||||||||||
|
Average assets(1)
|
13,033 | 13,565 | 11,675 | |||||||||
|
Average equity(2)
|
4,280 | 3,523 | 2,974 | |||||||||
|
Net income
|
421 | 539 | 304 | |||||||||
|
Net income divided by average assets
|
3.2 | % | 4.0 | % | 2.6 | % | ||||||
|
Non-controlling interest
|
86 | 93 | 98 | |||||||||
|
ROAA(1)
|
3.9 | % | 4.7 | % | 3.4 | % | ||||||
|
ROAE(2)
|
9.8 | % | 15.3 | % | 10.2 | % | ||||||
|
Non-controlling interest divided by income before non-controlling interest
|
17.0 | % | 14.8 | % | 24.4 | % | ||||||
|
Year ended December 31,
|
||||||||||||
|
2014
|
2013
|
2012
|
||||||||||
|
(in Ps billions, except percentages)
|
||||||||||||
|
LB Panamá:
|
||||||||||||
|
Average assets(1)
|
40,662 | 28,825 | 21,134 | |||||||||
|
Average equity(2)(3)
|
6,031 | 3,809 | 3,453 | |||||||||
|
Net income
|
502 | 481 | 427 | |||||||||
|
Net income divided by average assets
|
1.2 | % | 1.7 | % | 2.0 | % | ||||||
|
Non-controlling interest
|
1 | 0 | 0 | |||||||||
|
ROAA(1)
|
1.2 | % | 1.7 | % | 2.0 | % | ||||||
|
ROAE(2)(3)
|
8.3 | % | 12.6 | % | 12.4 | % | ||||||
|
Non-controlling interest divided by income before non-controlling interest
|
0.2 | % | 0.0 | % | 0.0 | % | ||||||
|
Grupo Aval consolidated:
|
||||||||||||
|
Average assets(1)
|
165,951 | 140,975 | 119,582 | |||||||||
|
Average equity(2)(3)
|
13,412 | 9,348 | 8,621 | |||||||||
|
Net income
|
1,669 | 1,601 | 1,526 | |||||||||
|
Net income divided by average assets
|
1.0 | % | 1.1 | % | 1.3 | % | ||||||
|
Non-controlling interest
|
875 | 1,011 | 911 | |||||||||
|
ROAA(1)
|
1.5 | % | 1.9 | % | 2.0 | % | ||||||
|
ROAE(2)(3)
|
12.4 | % | 17.1 | % | 17.7 | % | ||||||
|
Non-controlling interest divided by income before non-controlling interest
|
34.4 | % | 38.7 | % | 37.4 | % | ||||||
|
Bancolombia:
|
||||||||||||
|
Average assets(1)
|
139,771 | 114,366 | 91,690 | |||||||||
|
Average equity(2)
|
14,655 | 12,050 | 10,300 | |||||||||
|
Net income
|
1,879 | 1,515 | 1,702 | |||||||||
|
Net income divided by average assets
|
1.3 | % | 1.3 | % | 1.9 | % | ||||||
|
Non-controlling interest
|
(0 | ) | 17 | 6 | ||||||||
|
ROAA(1)
|
1.3 | % | 1.3 | % | 1.9 | % | ||||||
|
ROAE(2)
|
12.8 | % | 12.6 | % | 16.5 | % | ||||||
|
Non-controlling interest divided by income before non-controlling interest
|
0.0 | % | 1.1 | % | 0.3 | % | ||||||
|
Davivienda:
|
||||||||||||
|
Average assets(1)
|
61,923 | 51,748 | 41,890 | |||||||||
|
Average equity(2)
|
6,518 | 5,695 | 5,063 | |||||||||
|
Net income
|
1,060 | 851 | 696 | |||||||||
|
Net income divided by average assets
|
1.7 | % | 1.6 | % | 1.7 | % | ||||||
|
Non-controlling interest
|
6 | 6 | 8 | |||||||||
|
ROAA(1)
|
1.7 | % | 1.7 | % | 1.7 | % | ||||||
|
ROAE(2)
|
16.3 | % | 14.9 | % | 13.7 | % | ||||||
|
Non-controlling interest divided by income before non-controlling interest
|
0.6 | % | 0.7 | % | 1.1 | % | ||||||
|
BBVA Colombia:
|
||||||||||||
|
Average assets(1)
|
38,205 | 32,706 | 28,324 | |||||||||
|
Average equity(2)
|
3,368 | 3,049 | 2,711 | |||||||||
|
Net income
|
504 | 524 | 454 | |||||||||
|
Net income divided by average assets
|
1.3 | % | 1.6 | % | 1.6 | % | ||||||
|
Non-controlling interest
|
1 | 1 | 2 | |||||||||
|
ROAA(1)
|
1.3 | % | 1.6 | % | 1.6 | % | ||||||
|
ROAE(2)
|
15.0 | % | 17.2 | % | 16.7 | % | ||||||
|
Non-controlling interest divided by income before non-controlling interest
|
0.2 | % | 0.2 | % | 0.3 | % | ||||||
Source: Company calculations based on Grupo Aval’s, each banking subsidiary’s and our principal competitors’ consolidated financial statements for the period indicated (financial statements of our principal competitors are publicly available on their respective websites).
|
(1)
|
For methodology used to calculate ROAA, see note (2) to the table under “Item 3. Key Information—A. Selected financial data—Other financial and operating data.”
|
|
(2)
|
For methodology used to calculate ROAE, see note (3) to the table under “Item 3. Key Information—A. Selected financial data—Other financial and operating data.”
|
|
(3)
|
Average equity for 2014 adjusted to exclude the effect of the equity capitalizations of Banco de Bogotá for Ps 1,500 billion. If this item were not excluded, ROAE for Banco de Bogotá would be 12.6%. Average equity for 2013 adjusted to exclude the effect of the equity capitalizations of Banco de Bogotá, LB Panamá and Grupo Aval for Ps 1,300 billion, Ps 963 billion and Ps 2,114 billion, respectively, in
|
|
|
December 2013 as the capitalization took place towards the end of the year and had no material impact on our income statement. If these items are not excluded, ROAE for Banco de Bogotá, LB Panamá and Grupo Aval would be 15.8%, 11.2% and 15.4%, respectively.
|
|
(4)
|
Banco de Occidente’s net income for 2014 is adjusted to exclude the positive effect from the net gain of Ps 729.8 billion associated with the reclassification of its investment in Corficolombiana from its available for sale portfolio to its trading portfolio, and with the sale of part of these shares to Grupo Aval. If this item were not excluded, ROAA and ROAE for Banco de Occidente would be 3.9% and 30.8%, respectively.
|
The following table sets forth ROAA and ROAE using monthly consolidated information for average assets and average equity for Grupo Aval for the indicated periods.
|
Year ended December 31,
|
||||||||||||
|
2014
|
2013
|
2012
|
||||||||||
|
(in Ps billions, except percentages)
|
||||||||||||
|
Grupo Aval (consolidated):
|
||||||||||||
|
Average assets(1)
|
163,474 | 136,495 | 118,210 | |||||||||
|
Average equity(2)(3)
|
12,853 | 9,250 | 8,580 | |||||||||
|
Net income
|
1,669 | 1,601 | 1,526 | |||||||||
|
Net income divided by average assets
|
1.0 | % | 1.2 | % | 1.3 | % | ||||||
|
Non-controlling interest
|
875 | 1,011 | 911 | |||||||||
|
ROAA(1)
|
1.6 | % | 1.9 | % | 2.1 | % | ||||||
|
ROAE(2)(3)
|
13.0 | % | 17.3 | % | 17.8 | % | ||||||
|
Non-controlling interest divided by income before non-controlling interest
|
34.4 | % | 38.7 | % | 37.4 | % | ||||||
|
(1)
|
For methodology used to calculate ROAA, see note (2) to the table under “Item 3. Key Information—A. Selected financial data—Other financial and operating data.”
|
|
(2)
|
For methodology used to calculate ROAE, see note (3) to the table under “Item 3. Key Information—A. Selected financial data—Other financial and operating data.”
|
|
(3)
|
Adjusted to exclude the effect of the equity capitalization of Grupo Aval of Ps 2,114 billion in December 2013 as the capitalization took place towards the end of the year and had no material impact on our income statement. If the monthly average equity for 2013 is not adjusted to exclude this effect, the monthly average equity would be Ps 9,413 billion and the ROAE at December 31, 2013 would be 17.0%.
|
The following table sets forth ROAA and ROAE using monthly consolidated information for average assets and average equity for our bank subsidiaries for the year ended December 31, 2014.
|
Year ended December 31, 2014
|
||||||||||||||||
|
Banco de Bogotá
|
Banco de Occidente
|
Banco Popular
|
Banco AV Villas
|
|||||||||||||
|
(in Ps billions, except percentages)
|
||||||||||||||||
|
Average assets (1)
|
107,025 | 30,646 | 17,440 | 10,416 | ||||||||||||
|
Average equity (2)
|
10,255 | 3,883 | 2,532 | 1,230 | ||||||||||||
|
Net income(3)
|
1,389 | 466 | 366 | 195 | ||||||||||||
|
Net income divided by average assets
|
1.3 | % | 1.5 | % | 2.1 | % | 1.9 | % | ||||||||
|
Non-controlling interest
|
502 | 2 | 1 | 0 | ||||||||||||
|
ROAA(1)
|
1.8 | % | 1.5 | % | 2.1 | % | 1.9 | % | ||||||||
|
ROAE(2)
|
13.5 | % | 12.0 | % | 14.4 | % | 15.9 | % | ||||||||
|
Non-controlling interest divided by income before non-controlling interest
|
26.5 | % | 0.3 | % | 0.2 | % | 0.2 | % | ||||||||
|
(1)
|
For methodology used to calculate ROAA, see note (2) to the table under “Item 3. Key Information—A. Selected financial data—Other financial and operating data.”
|
|
(2)
|
For methodology used to calculate ROAE, see note (3) to the table under “Item 3. Key Information—A. Selected financial data—Other financial and operating data.”
|
|
(3)
|
Banco de Occidente’s net income for 2014 is adjusted to exclude the positive effect from the net gain of Ps 729.8 billion associated with the reclassification of its investment in Corficolombiana from its available for sale portfolio to its trading portfolio, and with the sale of part of these shares to Grupo Aval. If this item were not excluded, ROAA and ROAE for Banco de Occidente would be 3.9% and 30.8%, respectively.
|
Efficiency ratio
We believe that the efficiency ratio, which is calculated as operating expenses before depreciation and amortization divided by operating income before net provisions, provides investors with important information regarding our operational efficiency.
The following table sets forth the efficiency ratio of our banking subsidiaries, Grupo Aval consolidated and our principal competitors at December 31, 2014.
| At December 31, 2014 | ||||||||||||||||||||||||||||||||
|
Banco de Bogotá
|
Banco de Occidente | Banco Popular | Banco AV Villas | Grupo Aval consolidated | Bancolombia | Davivienda | BBVA Colombia | |||||||||||||||||||||||||
|
(in Ps billions)
|
||||||||||||||||||||||||||||||||
|
Total operating expenses
|
4,233 | 1,113 | 710 | 488 | 6,578 | 5,562 | 2,695 | 1,358 | ||||||||||||||||||||||||
|
Depreciation
|
160 | 172 | 26 | 17 | 374 | 537 | 61 | 61 | ||||||||||||||||||||||||
|
Goodwill amortization
|
132 | 2 | – | – | 167 | 398 | 80 | 162 | ||||||||||||||||||||||||
|
Operating expenses before depreciation and amortization
|
3,941 | 939 | 684 | 471 | 6,038 | 4,628 | 2,554 | 1,134 | ||||||||||||||||||||||||
|
Total operating income(2)
|
6,945 | 1,715 | 1,213 | 765 | 10,308 | 8,089 | 3,949 | – | ||||||||||||||||||||||||
|
Provisions, net
|
988 | 368 | 69 | 114 | 1,538 | 1,405 | 809 | – | ||||||||||||||||||||||||
|
Operating income before provisions
|
7,932 | 2,083 | 1,283 | 879 | 11,846 | 9,494 | 4,758 | 2,506 | ||||||||||||||||||||||||
|
Efficiency ratio (1)
|
49.7 | % | 45.1 | % | 53.3 | % | 53.6 | % | 51.0 | % | 48.7 | % | 53.7 | % | 45.3 | % | ||||||||||||||||
Source: Company calculations based on Grupo Aval’s, each banking subsidiary’s and our principal competitors’ consolidated financial statements for the period indicated (financial statements of our principal competitors are publicly available on their websites).
|
(1)
|
Efficiency ratio is calculated as operating expenses before depreciation and amortization divided by operating income before net provisions.
|
|
(2)
|
Banco de Occidente’s total operating income for 2014 is adjusted to exclude the positive effect from the net gain of Ps 729.8 billion associated with the reclassification of its investment in Corficolombiana from its available for sale portfolio to its trading portfolio, and with the sale of part of these shares to Grupo Aval. If this item were not excluded, the efficiency ratio for Banco de Occidente would be 33.4%.
|
Tangible equity ratio
The following table sets forth the tangible equity ratio of our subsidiaries, Grupo Aval aggregate, Grupo Aval on a consolidated basis and our principal competitors on a consolidated basis at December 31, 2014.
| At December 31, 2014 | ||||||||||||||||||||||||||||||||||||
| Grupo Aval entities | ||||||||||||||||||||||||||||||||||||
| Banco de Bogotá | Banco de Occidente | Banco Popular | Banco AV Villas | Grupo Aval aggregate | Grupo Aval consolidated | Bancolombia | Davivienda | BBVA Colombia | ||||||||||||||||||||||||||||
|
(in Ps billions,
except
percentages)
|
||||||||||||||||||||||||||||||||||||
|
Shareholders’ equity
|
12,203 | 4,003 | 2,626 | 1,284 | 20,116 | 15,097 | 16,817 | 6,977 | 3,496 | |||||||||||||||||||||||||||
|
Non-controlling interest
|
3,857 | 14 | 67 | 4 | 3,942 | 7,368 | 494 | 64 | 6 | |||||||||||||||||||||||||||
|
Total assets
|
118,367 | 32,531 | 17,059 | 10,971 | 178,928 | 177,615 | 148,725 | 67,471 | 41,536 | |||||||||||||||||||||||||||
|
Shareholders’ equity + Non-controlling interest / Assets
|
13.6 | % | 12.3 | % | 15.8 | % | 11.7 | % | 13.4 | % | 12.6 | % | 11.6 | % | 10.4 | % | 8.4 | % | ||||||||||||||||||
|
Goodwill
|
4,661 | 21 | – | – | 4,683 | 5,627 | 3,971 | 1,550 | 72 | |||||||||||||||||||||||||||
|
Shareholders’ equity + Non-controlling interest – Goodwill
|
11,399 | 3,996 | 2,693 | 1,289 | 19,376 | 16,838 | 13,341 | 5,491 | 3,429 | |||||||||||||||||||||||||||
|
Total assets – Goodwill
|
113,705 | 32,510 | 17,059 | 10,971 | 174,246 | 171,988 | 144,754 | 65,921 | 41,464 | |||||||||||||||||||||||||||
|
Tangible equity
ratio (1)
|
10.0 | % | 12.3 | % | 15.8 | % | 11.7 | % | 11.1 | % | 9.8 | % | 9.2 | % | 8.3 | % | 8.3 | % | ||||||||||||||||||
Source: Company calculations based on Grupo Aval’s, each banking subsidiary’s and our principal competitors’ consolidated financial statements for the period indicated (financial statements of our principal competitors are publicly available on their websites).
|
(1)
|
Tangible equity ratio is calculated as shareholders’ equity plus non-controlling interest minus goodwill, divided by total assets minus goodwill.
|
Exchange rates
The Colombian foreign exchange system allows the purchase and sale of foreign currency and the international transfer of pesos by any person or legal entity, regardless of the amount, subject to certain regulatory procedures.
The Superintendency of Finance calculates the representative market rate based on the weighted averages of the buy/sell foreign exchange rates quoted daily by certain financial institutions, including certain of our banking subsidiaries, for the purchase and sale of U.S. dollars. On April 22, 2015, the representative market rate was Ps 2,469.03 per U.S.$1.00, and on December 31, 2014, the representative market rate was Ps 2,392.46 per U.S.$1.00. The Federal Reserve Bank of New York does not report a noon buying rate for pesos/U.S. dollar.
The following table presents the monthly high and low representative market rate during the months indicated.
|
Recent exchange rates of pesos per U.S. dollar
|
Low
|
High
|
||||||
|
Month:
|
||||||||
|
November 2014
|
2,061.92 | 2,206.19 | ||||||
|
December 2014
|
2,206.19 | 2,446.35 | ||||||
|
January 2015
|
2,361.54 | 2,452.11 | ||||||
|
February 2015
|
2,371.31 | 2,500.59 | ||||||
|
March 2015
|
2,496.99 | 2,677.97 | ||||||
|
April 2015 (through April 22, 2015)
|
2,469.03 | 2,598.36 | ||||||
Source: Superintendency of Finance.
The following table presents the average pesos/U.S. dollar representative market rate for each of the five most recent years, calculated by using the average of the exchange rates on the last day of each month during the period, and the representative year-end market rate for each of the five most recent years.
|
Pesos/U.S.$1.00
representative market rate
|
Average
|
Year-end
|
||||||
|
Period:
|
||||||||
|
2010
|
1,902.50 | 1,913.98 | ||||||
|
2011
|
1,854.02 | 1,942.70 | ||||||
|
2012
|
1,798.72 | 1,768.23 | ||||||
|
2013
|
1,879.53 | 1,926.83 | ||||||
|
2014
|
2,017.85 | 2,392.46 | ||||||
Source: Superintendency of Finance.
Exchange rate fluctuation will affect the U.S. dollar value of any distributions we make with respect to our shares of preferred stock. See “—D. Risk factors—Risks relating to our preferred shares and ADSs.”
|
Capitalization and indebtedness
|
Not applicable.
|
Reasons for the offer and use of proceeds
|
Not applicable.
|
Risk factors
|
Our business, financial condition and results of operations could be materially and adversely affected if any of the risks described below occur. As a result, the market price of our preferred shares or our American Depositary Shares, or ADSs, could decline, and you could lose all or part of your investment. We may face additional risks and uncertainties that are not presently known to us, or that we currently deem immaterial, which may also impair our business.
Risks relating to Colombia and other countries in which we operate
Adverse economic and political conditions in Colombia and other countries in which we operate, including the Central American region, may have an adverse effect on our results of operations and financial condition.
Our principal subsidiaries in Colombia are financial institutions (four commercial banks, a pension and severance fund administrator and a merchant bank), and a substantial majority of our operations, properties and customers are located in Colombia. As a consequence, our results of operations and financial condition are materially affected by economic and political conditions in Colombia.
Colombia is subject to economic, political and other uncertainties, including changes in monetary, exchange control and trade policies that could affect the overall business environment in Colombia, which would, in turn,
affect our results of operations and financial condition. For example, the Colombian Central Bank could sharply raise or lower interest rates, which could negatively affect our net interest income and asset quality and also restrict our growth. Extreme variations in exchange rates could also negatively affect the foreign currency positions of our borrowers. Any of these events could have an adverse effect on our results of operations and financial condition.
Decreases in the growth rate of the Colombian economy, periods of negative growth, or material increases in inflation or interest rates could result in lower demand for, or affect the pricing of, our services and products. Because a large percentage of the costs and expenses of our subsidiaries is fixed, we may not be able to reduce costs and expenses upon the occurrence of any of these events, in which case our profitability could be affected.
In the case of our pension and severance fund management business, economic conditions may affect the businesses and financial capacity of employers, which may result in a drop in employee-contributor head counts or decrease the ability of employers to create new jobs or increase employee incomes.
BAC Credomatic’s and our recent Central American acquisitions’ results of operations and financial condition depend on economic, political and social conditions in the countries where they operate, primarily in Central America. The political, economic and social environments in such countries are affected by many different factors, including significant governmental influence over local economies, substantial fluctuations in economic growth, high levels of inflation, exchange rate movements, exchange controls or restrictions on expatriation of earnings, high domestic interest rates, drug trafficking and other forms of organized crime, wage and price controls, changes in tax policies, imposition of trade barriers, and unexpected changes in regulation. The results of operations and financial condition of our Central American operations could be affected by changes in economic and other policies of each country’s government, which have exercised and continue to exercise substantial influence over many aspects of the private sector, and by other social and political developments in each such country. During the past several decades, El Salvador, Guatemala, Honduras, Nicaragua and Panamá have experienced civil strife and political instability that have included a succession of regimes with differing economic policies and programs. Previous governments have imposed, among other measures, controls on prices, exchange rates, local and foreign investment and international trade, and restricted the ability of companies to dismiss employees, expropriated private sector assets and prohibited the remittance of profits to foreign investors.
Adverse economic, political and social developments in Central America may adversely affect demand for banking services and create uncertainty regarding our operating environment, which could have a material adverse effect on BAC Credomatic and, consequently, on our company. In addition, changes in political administrations may result in changes in governmental policy, which could affect BAC Credomatic and, consequently, our business.
The Colombian and Central American economies remain vulnerable to external shocks.
A significant decline in economic growth of any of Colombia’s or Central America’s major trading partners—in particular, the United States, China, Ecuador and Venezuela—could have a material adverse effect on each country’s balance of trade and economic growth. In addition, a “contagion” effect, where an entire region or class of investments becomes less attractive to, or subject to outflows of funds by, international investors could negatively affect Colombia or Central American countries. Lower economic growth than expected may result in asset quality deterioration and could negatively affect our business.
Pension funds, such as those managed by Porvenir, are global investors and thus are affected by regional and global economic factors. Lower economic growth of Colombia’s major trading partners or a contagion effect in the region or globally may lead to lower pension fund returns, which may in turn result in decreases in assets under management and impair our business, results of operations or financial condition. In recent years, pension fund returns have been subject to increased volatility in international financial markets. Foreign investments represented 20.1%, 13.6% and 13.5% of Porvenir’s total assets under management at December 31, 2014, 2013 and 2012, respectively.
The global economic and financial crisis, which began in 2008 in the U.S. financial system and spread to different economic sectors and countries around the world, has had negative effects on the Colombian economy and the economies of Central American countries. During 2009, major economies throughout the world contracted, which, in turn, affected the Colombian and Central American economies. Although there have recently been signs of recovery in the global economy, this recovery may be fragile and may reflect temporary benefits from government stimulus programs that may not be sustained.
Even though exports from Colombia have grown at an accelerated rate in recent years, fluctuations in commodity prices pose a significant challenge to their sustainability. In particular, the oil industry remains an important determinant of the country’s economic growth. Substantial or extended declines in international oil prices may have an adverse effect on the overall performance of the Colombian economy and could have an adverse impact on the results of operations and financial condition of oil industry companies, which could have an adverse impact on our loans to oil industry companies. Unemployment continues to be high in Colombia compared to other economies in Latin America. Furthermore, recent political and economic actions in the Latin American region, including actions taken by the Argentine and Venezuelan governments, may negatively affect international investor perception of the region. We cannot assure you that the growth achieved by the Colombian economy over the past decade will continue in future periods. A reversal of the rate of growth of the Colombian economy, a slowdown in the growth of customer demand, an increase in market competition, or changes in governmental regulations, could adversely affect the rate of growth of our loan portfolio and our risk index and, accordingly, increase our required allowances for loan losses. All of these conditions could lead to a general decrease in demand for borrowings.
The long-term effects of the global economic and financial crisis on the international financial system remain uncertain. In addition, the effect on consumer confidence of any actual or perceived deterioration of household incomes in the Colombian or Central American economies may have a material adverse effect on our results of operations and financial condition.
Colombia has experienced and continues to experience internal security issues that have had or could have a negative effect on the Colombian economy.
Colombia has experienced and continues to experience internal security issues, primarily due to the activities of guerrilla groups such as the Revolutionary Armed Forces of Colombia (
Fuerzas Armadas Revolucionarias de Colombia
), or “FARC,” paramilitary groups and drug cartels. In remote regions of the country with minimal governmental presence, these groups have exerted influence over the local population and funded their activities by protecting, and rendering services to drug traffickers. Even though the Colombian government’s policies have reduced guerilla and criminal activity, particularly in the form of terrorist attacks, homicides, kidnappings and extortion, such activity persists in Colombia, and possible escalation of such activity and the effects associated with them have had and may have in the future a negative effect on the Colombian economy and on us, including our customers, employees, results of operations and financial condition. The Colombian government commenced peace talks with the FARC in August 2012, which are still ongoing. Despite these efforts, drug-related crime and guerilla and paramilitary activities may have a negative impact on the Colombian economy in the future. Our business or financial condition could be adversely affected by rapidly changing economic or social conditions, including the Colombian government’s response to current peace negotiations which may result in legislation that increases our tax burden, or that of other Colombian companies.
Political and economic instability in the region may affect the Colombian economy and, consequently, our results of operations and financial condition.
Some of Colombia’s neighboring countries and principal trading partners, particularly Venezuela, have experienced and continue to experience periods of political and economic instability. Moreover, diplomatic relations with Venezuela and Ecuador have from time to time been tense and affected by events surrounding the Colombian armed forces’ confrontations with the FARC throughout Colombia, particularly on Colombia’s borders with each of Venezuela and Ecuador.
On November 19, 2012, the International Court of Justice placed a sizeable area of the Caribbean Sea within Nicaragua’s exclusive economic zone, that until then had been deemed by Colombia as part of its own exclusive economic zone. A worsening of diplomatic relations between Colombia and Nicaragua involving the disputed waters could result in the Nicaraguan government taking measures, or a reaction among the Nicaraguan public, which would be detrimental to Colombian-owned interests in that country, including those owned by us through BAC Credomatic.
Further economic and political instability in Colombia’s main trading partners or any future deterioration in relations with Venezuela, Ecuador, Nicaragua and other countries in the region may result in the closing of borders, the imposition of trade barriers and a breakdown of diplomatic ties, or a negative effect on Colombia’s trade balance, economy and general security situation, which may adversely affect our results of operations and financial condition.
Government policies and actions as well as judicial decisions in Colombia could significantly affect the local economy and, as a result, our results of operations and financial condition.
Our results of operations and financial condition may be adversely affected by changes in Colombian governmental policies and actions, and judicial decisions, involving a broad range of matters, including interest rates, exchange rates, exchange controls, inflation rates, taxation, banking and pension fund regulations and other political or economic developments affecting Colombia. The Colombian government has historically exercised substantial influence over the economy, and its policies are likely to continue to have a significant effect on Colombian companies, including us. The president of Colombia has considerable power to determine governmental policies and actions relating to the economy, and may adopt policies that could negatively affect us. Future governmental policies and actions, or judicial decisions, could adversely affect our results of operations or financial condition.
New or higher taxes resulting from changes in tax regulations or the interpretation thereof could adversely affect our results of operations and financial condition.
New tax laws and regulations, and uncertainties with respect to future tax policies, pose risks to us. In recent years, Colombian tax authorities have imposed additional taxes in a variety of areas, such as taxes on financial transactions and taxes to fund Colombia’s war against terrorism and taxes to fund the post-conflict related to the peace negotiations with FARC. Changes in tax-related laws and regulations, and interpretations thereof, can affect tax burdens by increasing tax rates and fees, creating new taxes, limiting tax deductions, and eliminating tax-based incentives and non-taxed income. In addition, tax authorities or courts may interpret tax regulations differently than we do, which could result in tax litigation and associated costs and penalties. In order to avoid double taxation, our Colombian subsidiaries usually distribute dividends from profits that have already been subject to income tax. These dividends are usually not taxable for Grupo Aval in Colombia, and dividends paid by Grupo Aval to its shareholders in Colombia from these sources of income also are usually not taxable, in each case provided that such profits have been taxed at the subsidiary level. This tax treatment may not be maintained in the future, and any change could have a material adverse effect on our results of operations and financial condition.
Currently, according to Article 36-1 of the Colombian Tax Code, capital gains obtained in a sale of shares listed on the Colombian Stock Exchange are not subject to income tax in Colombia, provided that the shares sold by the same beneficial owner during each fiscal year do not represent more than 10% of the issued and outstanding shares of the listed company. The Colombian government may implement changes in the tax rules applicable to the sale of the offered securities which may adversely affect our shareholders or holders of ADSs.
ADSs do not have the same tax benefits as equity investments in Colombia. Although ADSs represent our preferred shares, they are subject to a different tax regulatory regime. Accordingly, the tax benefits applicable in Colombia to equity investments, in particular those relating to dividends and profits from sale, are not applicable to ADSs.
The Colombian government publicly announced that a new tax reform may be required and approved in 2015 to take effect in 2016, on top of the one approved in December 2014, in order to obtain additional funds and close potential deficits, especially considering the more challenging medium-term outlook for the oil sector. The new tax reform may extend the Equity Tax, a tax on the net worth of corporate entities. This eventual new tax reform may result in higher levels of taxation than we currently expect which can significantly affect our results of operations or financial condition.
Colombian tax haven regulation could adversely affect our results of operations and financial condition.
Pursuant to Decree 2193 of 2013, a number of jurisdictions, including countries in which our banking subsidiaries operate, were either declared tax havens for Colombian tax purposes or temporarily excluded from such list subject to the completion of tax information exchange treaties within a short timeframe. As a result, some of our clients with financial products offered by our banking subsidiaries in such countries may experience, among other effects, an increase in their withholding tax rates, transfer pricing regulation and information disclosure requirements which could have a negative impact on our business, financial condition and results of operations.
Natural disasters could disrupt our businesses and affect our results of operations and financial condition.
We are exposed to natural disasters, such as earthquakes, volcanic eruptions, tornadoes, tropical storms and hurricanes. Heavy rains or abnormally low rainfall in Colombia, attributable in part to the La Niña and El Niño weather patterns, have resulted in severe flooding and mudslides and prolonged droughts in the past. These are recurring weather phenomena that may contribute to flooding, mudslides, droughts or other natural disasters on an equal or greater scale in the future. In the event of a natural disaster, our disaster recovery plans may prove to be ineffective, which could have a material adverse effect on our ability to conduct our businesses, particularly if such an occurrence affects computer-based data processing, transmission, storage and retrieval systems or destroys customer or other data. In addition, if a significant number of our employees and senior managers were unavailable because of a natural disaster, our ability to conduct our businesses could be compromised. Natural disasters or similar events could also result in substantial volatility in our results of operations for any fiscal quarter or year.
Risks relating to our businesses and industry
Risks relating to our banking business
A decline in asset quality, including the loan portfolios of our bank subsidiaries, may have an adverse effect on our results of operations and financial condition.
Changes in the financial condition or credit profiles of customers of our banking subsidiaries and increases in inflation or interest rates could have a negative effect on the quality of our banks’ loan portfolios, potentially requiring them to increase loan loss provisions or resulting in reduced profitability. In particular, the percentage of non-performing loans may increase in the future as a result of factors beyond our control, such as economic conditions and political events affecting Colombia generally or specific sectors of the economy.
A substantial number of our banks’ customers are individuals and small and medium sized enterprises, or “SMEs,” and these customers are potentially more susceptible to downturns in the economy than large corporations and high-income individuals. For example, unemployment directly affects the ability of individuals to obtain and repay consumer and residential mortgage loans. Consequently, our banking subsidiaries may experience higher levels of non-performing loans, which could result in increased loan loss provisions due to defaults by, or deterioration in the credit profiles of, individual borrowers. Non-performing loans and resulting loan losses may increase materially in the future and adversely affect our results of operations and financial condition.
Existing loan loss allowances may not be adequate to cover any increases in non-performing loans or deterioration in the credit quality of loan portfolios. As a result, our banking subsidiaries may be required to increase loan loss provisions, which may adversely affect our results of operations and financial condition.
In addition, there is no precise method for predicting loan and credit losses, such that loan loss allowances may not be sufficient to cover actual losses. If we and our banking subsidiaries are unable to manage the level of non-performing or other poor credit quality loans, our results of operations and financial condition would be materially and adversely affected.
The loan portfolios of our banking subsidiaries have grown substantially in recent years. See “Item 4. Information on the Company—B. Business overview—Selected statistical data.” As default rates generally increase with the age of loans, the level of non-performing loans may lag behind the rate of growth in loans but may increase when growth slows or the loan portfolios become more mature. As a result, historic loan loss experience may not necessarily be indicative of future loan loss experience.
Our banking subsidiaries may be unable to realize on collateral or guarantees securing loans, which may adversely affect their results of operations and financial condition.
Our banking subsidiaries make loans that are secured by collateral, including real estate and other assets that are generally located in Colombia and the countries where we operate. The value of collateral may significantly fluctuate or decline due to factors beyond the control of our subsidiaries, including, for example, prevailing economic and political conditions in the relevant jurisdiction. At December 31, 2014, 38.3% of total past due loans (including our foreign operations) were secured. An economic slowdown may lead to a downturn in the Colombian or Central American real estate markets, which may, in turn, result in declines in the value of real estate securing loans to levels below the principal balances of these loans. Any decline in the value of the collateral securing these
loans may result in reduced recoveries from collateral realization and have an adverse effect on our results of operations and financial condition. We may also not have sufficiently recent information on the value of collateral, which may result in an inaccurate assessment for impairment losses of our loans secured by such collateral. If this were to occur, we may need to make additional provisions to cover actual impairment losses of our loans, which may materially and adversely affect our results of operations and financial condition.
Our banking subsidiaries also make loans on the basis of guarantees from relatives, affiliates or associated persons of their principal borrowers. To the extent that guarantors encounter financial difficulties due to economic conditions, personal or business circumstances, or otherwise, the ability of our banks to enforce such guarantees may be impaired.
In addition, our banking subsidiaries may face difficulties in enforcing their rights as secured creditors against borrowers, collateral or guarantees. In particular, timing delays and procedural problems in realizing against collateral, as well as a debtor-protective judicial interpretations of the law, may make it difficult to foreclose on collateral, realize against guarantees or enforce judgments in our favor, which could materially and adversely affect our results of operations and financial condition.
Colombian insolvency laws may limit the ability of our banking subsidiaries to collect on monetary obligations and enforce rights against collateral or under guarantees.
Colombian insolvency laws provide that creditors of an insolvent debtor in default are prohibited from initiating collection proceedings outside the bankruptcy or reorganization process of such debtor. In addition, all collection proceedings outstanding at the beginning of the bankruptcy or reorganization process must be suspended and any creditors are prevented from enforcing their rights against the collateral and other assets of the debtor.
Once a non-merchant individual has ceased paying his or her debts, that individual can initiate a voluntary insolvency proceeding before a notary public or mediator to reach an out-of-court agreement with creditors. The terms of any agreement reached with a group (two or more) of creditors that represent more than 50% of the total amount of the claims will be mandatorily applicable to all relevant creditors. The insolvency law also provides for increased debtor protections, including an automatic stay for a maximum of 90 days. A perception that loans to individuals may be difficult or impossible to recover could cause our banking subsidiaries to enhance credit requirements and result in decreased lending to individuals by making access to credit more expensive. In addition, increased difficulties in enforcing debt and other monetary obligations due to Colombian insolvency laws could have an adverse effect on our results of operations and financial condition.
Any failure of risk management processes, including credit and market risk, could materially and adversely affect our banking businesses, results of operations and financial condition.
Credit risk is a principal risk inherent in the business of our banks. Although we have group-wide risk management guidelines, each bank is responsible for managing its own risk. Each bank’s policies and procedures, which are designed to identify, monitor and manage risk, may prove to be insufficient. Furthermore, our banks may not be able to upgrade risk management systems on a timely basis. For example, our banks’ risk management systems utilize an internal credit rating system to assess the risk profile of each customer. As this process involves detailed analyses of the customer’s credit risk, taking into account quantitative and qualitative factors, it is necessarily subject to human error. Due to limitations in the availability of information and the developing information infrastructure in Colombia, our assessment of credit risk associated with a particular customer may not be based on complete, accurate or reliable information. Personnel of our banking subsidiaries may fail to detect risks before they occur, or may not effectively implement their risk management systems, which may increase exposure to credit risk. As a result, any failure by our banking subsidiaries to effectively implement or consistently follow or refine risk management systems may result in higher risk exposures for our banking subsidiaries, which could materially and adversely affect our results of operations and financial condition.
Declines in the value of our banks’ sovereign debt portfolios could have an adverse effect on our results of operations.
Our banks’ portfolio of securities primarily consists of sovereign bonds, mainly securities issued or guaranteed by the Colombian government. LB Panamá’s securities portfolios primarily consist of securities issued by corporate and sovereign issuers. We are exposed to significant credit, market and liquidity risks associated with sovereign
debt. At December 31, 2014 and 2013, debt securities represented 13.8% and 15.3%, respectively, of our consolidated total assets; approximately 56.7% and 60.4%, respectively, of these securities were issued or backed by the Colombian government, and 6.0% and 5.2% of these securities were issued or backed by Central American governments during each period. A significant decline in the value of these government securities could materially and adversely affect our debt securities portfolio and, consequently, our financial condition and results of operations. See “Item 4. Information on the Company—B. Business overview—Supervision and regulation—Mandatory investments.”
We are subject to market risk in our banking business.
Our bank subsidiaries are directly and indirectly affected by changes in market conditions. Market risk, or the risk that the value of assets and liabilities or revenues will be adversely affected by variation in market conditions, is inherent in the products and instruments associated with our operations, including loans, deposits, securities, bonds, long-term debt, short-term borrowings, proprietary trading in assets and liabilities and derivatives. Changes in market conditions that may affect our financial condition and results of operations include fluctuations in interest and currency exchange rates, securities prices, changes in the implied volatility of interest rates and foreign exchange rates, among others.
We are subject to counterparty risk in our banking business.
Our banks and, to a lesser extent, Porvenir, Corficolombiana and our international banking operations, are exposed to counterparty risks in addition to credit risks associated with lending activities. Counterparty risk may arise from, for example, investing in securities of third parties, entering into derivative contracts under which counterparties have obligations to make payments to us, or executing securities, futures, currency or commodity trades from proprietary trading activities that fail to settle at the required time due to non-delivery by the counterparty or systems failure by clearing agents, exchanges, clearing houses or other financial intermediaries. These risks could materially and adversely affect our results of operations and financial condition.
Our banks are subject to market and operational risks associated with derivatives transactions.
Our banks and, to a lesser extent, Porvenir, Corficolombiana and our international banking operations, enter into derivatives transactions primarily for hedging purposes and, on a limited basis, on behalf of customers. They are subject to market and operational risks, including basis risk (the risk of loss associated with variations in the spread between the asset yield and the funding and/or hedge cost) and credit or default risk (the risk of insolvency or other inability of a counterparty to perform its obligations to us).
Market practices and documentation for derivatives transactions in Colombia and the countries where we operate, may differ from those in other countries. For example, documentation may not incorporate terms and conditions of derivatives transactions as commonly understood in other countries. In addition, the execution and performance of these transactions depend on our banks’ ability to develop adequate control and administration systems, and to hire and retain qualified personnel. Moreover, our banks’ ability to monitor and analyze these transactions depends on their information technology systems. These factors may further increase risks associated with derivatives transactions and could materially and adversely affect our results of operations and financial condition.
Our banking subsidiaries are subject to liquidity risk, which may result in increases to funding costs.
The principal sources of funding for our banking subsidiaries are savings deposits, time deposits and checking accounts, which together represented 69.5% and 70.2% of consolidated total liabilities at December 31, 2014 and 2013, respectively. Because our banking subsidiaries rely primarily on short-term deposits for funding, a sudden or unexpected shortage of funds in the banking systems in which we operate and overnight money markets may prevent our banking subsidiaries from meeting their obligations or obtaining necessary funding without incurring higher costs or selling certain assets at prices below prevailing market values, which could materially and adversely affect our results of operations and financial condition.
Default by one or more of our largest borrowers could adversely affect our results of operations and financial condition.
The aggregate outstanding loans to our banks’ ten largest borrowers represented 5.7% of our consolidated total loan portfolio at December 31, 2014. Default on loans by one or more of these borrowers may adversely affect our results of operations and financial condition.
Downgrades in our long-term credit ratings or in the credit ratings of our banking subsidiaries would increase the cost of, or impair access to, funding.
Our credit ratings and those of our banking subsidiaries are an important component of our and our banking subsidiaries’ ability to obtain funding. Our banking subsidiaries’ ability to compete successfully in the marketplace for deposits depends on various factors, including their financial stability as reflected by their credit ratings. A downgrade in credit ratings may adversely affect perception of their financial stability and ability to raise deposits. Adverse changes in credit ratings could also increase the cost of funding in the capital markets or borrowing funds for our and our subsidiaries’ operations. In addition, lenders and counterparties in derivatives transactions are sensitive to the risk of a ratings downgrade. Any downgrade in our credit ratings or in any of our banking subsidiaries’ credit ratings could materially and adversely affect our results of operations and financial condition.
Our banking subsidiaries’ loan portfolios are subject to risk of prepayment, which may result in reinvestment of assets on less profitable terms.
The loan portfolios of our banking subsidiaries are subject to prepayment risk, which results from the ability of a borrower to pay a loan prior to maturity. Generally, in a declining interest rate environment, prepayment activity increases with the effect of reducing weighted average lives of interest-earning assets and adversely affecting results. Prepayment risk also has an adverse effect on credit card and collateralized mortgage obligations, since prepayments could shorten the weighted average life of these portfolios, which may result in a mismatch in funding or in reinvestment at lower yields.
The credit card industry is highly competitive and entails significant risks, including the possibility of overindebtedness of customers, which could have a material adverse effect on us.
The credit card business is subject to a number of risks and uncertainties, including the possibility of overindebtedness of our customers, despite our focus on low-risk, middle- and high-income customers.
The credit card industry is characterized by higher consumer default than other segments of the credit markets, and defaults are highly related to macroeconomic indicators that are beyond our control. Part of our current growth strategy is to increase volume and number of cards in the credit card portfolio, at the same or a higher rate than the market, which may increase our exposure to risk in our loan portfolio. If Colombian and Central American economic growth slows or declines, or if we fail to effectively analyze the creditworthiness of our customers (including by targeting certain sectors), we may be faced with unexpected losses that could have an adverse effect on our results of operations and financial condition.
Changes in banking laws and regulations in Colombia and the other countries in which we operate could adversely affect our consolidated results.
Banking and financial services laws and regulations are subject to ongoing review and revision, including changes in response to global regulatory trends and, more recently, the global economic and financial crisis. As a result, governments have been actively considering new banking laws and regulations, and reviewing and revising existing laws and regulations, particularly in relation to capital adequacy and accounting standards. In addition, various international developments, such as the adoption of risk-based capital, leverage and liquidity standards by the Basel Committee on Banking Supervision in December 2010, known as “Basel III,” will continue to impact us in the coming years. To prepare for the implementation of the Basel III accords in Colombia, the Ministry of Finance, in consultation with the Superintendency of Finance, effected an internal review of regulations applicable to financial institutions. Decree 1771 of 2012 was issued as a result of this review, amending certain capital adequacy requirements for Colombian credit institutions set forth in Decree 2555 of 2010. Although Decree 1771 of 2012 maintained the requirement for a credit institution’s technical capital to be at least 9.0% of that institution’s total risk-weighted assets, it also introduced a new measure of “core solvency” for Common Equity Tier 1, which requires higher quality capital and is set at a minimum of 4.5% of risk-weighted assets. The adoption of new laws or
regulations, or changes in the interpretations or enforcement of existing laws or regulations, may have an adverse effect on our results of operations and financial condition.
Moreover, Congress passed Law No. 1735 of 2014, a Colombian government legislative initiative to create a new type of financial institution that will have the sole purpose of offering electronic deposits and payments (
Sociedades Especializadas en Depósitos y Pagos Electrónicos
or “SEDPEs”) in order to promote financial inclusion. In order to begin operations, SEDPEs will require further regulation from the Ministry of Finance with respect to different aspects, such as prudential regulation and know your customer requirements. Initiation of SEDPEs’ activities may create a new competitive environment that could adversely affect our consolidated results.
In Panamá, Accord No. 004-2013 (which came into effect on June 30, 2014) introduced a new reserve in addition to the loan-loss provisioning requirements already in place for credit card risk. This new reserve is calculated quarterly and applied over performing loan portfolios with a maximum of 2.5% and a minimum of 1.25% over the risk-weighted assets that have been rated as “normal” under applicable regulations, and subject to certain exceptions, cannot be lower than the amount of the previous quarter.
During recent years, legislators in Central America have unsuccessfully attempted to enact regulation to impose maximum interest rates for all or certain types of loans. Although the scope of these legislative initiatives has varied, these initiatives have primarily focused on personal loans and, particularly, on credit card loans. However, these bills have not been successful, with the exception of El Salvador’s Law Against Usury enacted in January 2013. The enactment of any of these bills or similar regulations in the countries where we operate could have an adverse effect on the results of the operations and financial condition in such jurisdiction.
Additionally, as part of a legislative effort to narrow the current fiscal deficit, in 2014 the Salvadorian congress enacted Decree No. 764 contemplating certain tax reforms that include the introduction of a new withholding tax of 0.25% or “2.5 per 1000” on financial transactions made by check or wire transfer and on cash transactions made through the Salvadorian financial system in excess of U.S.$5,000 on a single or monthly aggregate basis. Even though Decree No. 764 exempted certain financial transactions, this new withholding tax, which has been effective since September 2014, could adversely impact the results of our banking, credit card and brokerage operations in El Salvador.
Regulatory actions may result in fines, penalties, and restrictions that could materially and adversely affect our businesses and financial performance.
Our Colombian banks, as well as Porvenir, Corficolombiana and our international banking operations, are subject to regulation and supervision by Colombian financial authorities. These regulatory authorities have broad powers to adopt regulations and other requirements affecting or restricting virtually all aspects of our subsidiaries’ organization and operations, including, for example, the imposition of anti-money laundering measures and the authority to regulate the terms and conditions of credit that can be applied by Colombian banks. Failure to comply with applicable regulations could subject our banking subsidiaries to fines or sanctions or even revocation of licenses or permits to operate their businesses. In the event that any of these subsidiaries encounters significant financial problems, is in danger of insolvency or becomes insolvent, or is otherwise not deemed to be viable, the financial authorities would have broad powers to intervene in their management and operations, including by suspending or removing management and, in extreme circumstances, putting our banks, Porvenir, Corficolombiana and our international banking operations, into conservatorship or receivership or taking control of our banks, Porvenir, Corficolombiana and our international banking operations. Grupo Aval is required, as an issuer of securities in Colombia, to submit information to the Superintendency of Finance and comply with corporate governance requirements; however, we are not regulated as a financial institution or as a bank holding company, and we are not required to comply with capital adequacy regulations applicable to banks and other financial institutions. We may, however, become subject to more stringent regulation in the event that our status as a non-financial entity is not maintained by Colombian authorities in the future.
We may face legal and other challenges to maximizing revenue from credit card fees and other fees from customers.
As part of their credit card business, our bank subsidiaries face pressures related to the fees and commissions charged to merchants (merchant discounts) and the pricing of bank interchange fees charged by issuer banks to acquiring banks. Banks and card processors in Colombia have been subject to administrative investigations
regarding the fees and commissions that are charged to the merchants by the acquiring banks and in respect to the banking interchange fees.
In the past, the Superintendency of Industry and Commerce (
Superintendencia de Industria y Comercio
) has conducted investigations on the practices of the
Asociación Gremial de Instituciones Financieras Credibanco
(the Visa franchisee in Colombia) and
Redeban Multicolor S.A.
(the
MasterCard
franchisee in Colombia), the entities used by most Colombian banks to manage the credit card system in Colombia, relating to alleged price fixing schemes among Colombian banks relating to fees and commissions charged to merchants. The Superintendency of Industry and Commerce has also conducted investigations into certain Colombian banks in the past, including our Colombian banking subsidiaries, for alleged price fixing of bank interchange fees charged during the period from May 2007 to October 2008.
Although we have not been subject to any fine or penalty as a result of these investigations, it is possible that similar investigations may be carried out by the relevant authorities in the future, which may result in lower fees charged to merchants and bank interchange fees, and/or lead to changes in commercial strategies that may adversely affect our results of operations and financial condition. We may also be subject to financial penalties in connection with such future investigations. In addition, fees charged for other banking services may continue to be reduced in the future as a result of regulatory measures and/or pressure from retailers and interest groups.
Failure to protect personal information could adversely affect our reputation and our business.
Our banks manage and hold confidential personal information of customers in the normal course of their banking operations. Although our banks have procedures and controls to safeguard personal information in our possession, unauthorized disclosures or unauthorized access to privileged information, fraud or interfering with regular banking and other services could subject our banks and us to legal actions, administrative sanctions and damages. Any failure to protect personal information could result in reputational damage and have an adverse effect on our results of operations and financial condition.
In the future, we may be subject to supervision as a bank holding company.
The Colombian government has announced for the past four years that it is considering presenting to the Colombian Congress a bill to submit controlling entities of financial institutions to banking supervision and oversight (
Ley de Conglomerados
). In this regard, the Superintendency of Finance has initiated an internal review in order to develop a new model of cross-border consolidated supervision based on four pillars: (i) integrated risk management, (ii) prudential requirements, (iii) cooperation and information exchange and (iv) protocols for cross-border crises. Although we are not aware of the content of such future regulations, in the future, we may be subject to banking supervision and oversight as the controlling entity of our banking subsidiaries.
Risks relating to our merchant banking business
Difficult market conditions can adversely affect Corficolombiana’s business.
Corficolombiana may be adversely affected by lower than expected returns on investments, reduced opportunities to realize value from investments, and failure to find suitable investments so as to deploy capital effectively. During periods of difficult market conditions (which may span across one or more industries, sectors or geographies), portfolio companies may experience adverse operating performance, decreased revenues, financial losses, difficulty in obtaining access to financing or increased funding costs. Negative financial performance of portfolio companies may materially and adversely affect Corficolombiana’s results of operations and cash flow. If the operating performance of those portfolio companies (as well as valuation multiples) does not improve following any such downturn or other portfolio companies experience adverse operating performance, Corficolombiana may be forced to sell those assets at values that are less than projected or even at a loss. Portfolio companies may also have difficulties expanding their businesses and operations or meeting debt service and other obligations as they become due. Furthermore, negative market conditions could potentially result in a portfolio company entering bankruptcy proceedings, thereby potentially resulting in a complete loss of the investment. Although market conditions have recently shown some signs of improvement, economic and market conditions may not continue to improve. Even if such conditions do improve broadly and significantly over the long term, adverse conditions and/or other events in particular sectors may cause our performance to suffer further.
Corficolombiana’s due diligence process for evaluating prospective investments may not identify all risks or ensure investment returns.
Before making investments, Corficolombiana conducts due diligence that it deems reasonable and appropriate based on the facts and circumstances applicable to each investment. When conducting due diligence, it may be required to evaluate important and complex business, financial, tax, accounting, environmental and legal issues. Outside consultants, legal advisors, accountants and investment banks may be involved in the due diligence process to varying degrees depending on the type of investment, but we may be unable to engage these third parties in a timely manner, or at all. Nevertheless, the due diligence investigation carried out by Corficolombiana with respect to any investment opportunity may not reveal or highlight all relevant risks of such investment opportunity. Moreover, such an investigation will not necessarily result in the investment being successful.
A significant part of Corficolombiana’s investments are in relatively illiquid assets, and Corficolombiana may fail to realize any profits from these investments for a considerable period of time or lose some or all of the principal amount of these investments.
At December 31, 2014, 46.7% of Corficolombiana’s investments were in securities of privately held companies. There are often no readily ascertainable market prices for such securities. As a result, there may be limited or no marketability for these investments, and they may decline in value while Corficolombiana is seeking to dispose of them. Because there is significant uncertainty as to the valuation of illiquid investments, the stated values of such investments may not necessarily reflect the values that could actually be realized by Corficolombiana. In addition, in some cases, Corficolombiana may be prevented by contract from selling such securities for a period of time. Corficolombiana’s ability to dispose of investments may also be dependent on factors beyond its control. Thus, it is possible that investments in privately held companies may only be disposed of over a substantial length of time, if at all, exposing the investment returns to risks of declines in market prices during the intended disposition period. Accordingly, under certain conditions, Corficolombiana may be forced to either sell securities at lower prices than it had expected to realize or defer—potentially for a considerable period of time—sales that it had planned to make.
Corficolombiana makes minority investments in companies that it does not control.
Corficolombiana’s investments include non-controlling equity interests, and it may also dispose of a portion of its majority equity investments in portfolio companies over time in a manner that results in Corficolombiana retaining minority investments. Those investments will be subject to the risk that the company in which the investment is made may make business, financial or management decisions with which we do not agree. Similarly, the majority stakeholders or the management of the company may take risks or otherwise act in a manner contrary to our interests. If any of the foregoing were to occur, the values of these investments could decrease or we may not be able to dispose of them, which would adversely affect Corficolombiana’s results of operations and financial condition.
Corficolombiana’s new investment projects depend on its ability to access financing.
Corficolombiana may directly, or through its operating subsidiaries, enter into new investment projects such as infrastructure projects such as the toll-road fourth generation concession “Conexión Pacifico 1,” that require significant financing. Corficolombiana or its operating subsidiaries may experience difficulties in accessing debt and equity financing resources required to fund such projects and/or may obtain them at higher costs and/or lower tenure than initially expected. As a result, Corficolombiana’s investment objectives may attain lower returns due to higher financing costs, delays in the investment schedule or any eventual stoppage of the investment project, which could also result in the payment of penalties to its counterparties, including the government entities in the case of development of new highways and toll-roads. If Corficolombiana is unable to obtain adequate financing on terms satisfactory to it, its ability to continue to grow or support its business and respond to business challenges could be significantly limited.
Most of Corficolombiana’s investments are concentrated in five industries.
At December 31, 2014, 97.8% of Corficolombiana’s investment portfolio was concentrated in the energy and gas, infrastructure, agribusiness, hotels division and financial services. During periods of difficult market conditions or slowdowns in these sectors, Corficolombiana may experience decreased revenues, difficulty in obtaining access to financing and increased funding costs.
Risks relating to our pension and severance fund management business
Porvenir operates in a highly regulated market, which limits its flexibility to manage its businesses.
Porvenir’s operations are regulated by Law 100 of 1993, the Organic Statute of the Financial System (
Estatuto Orgánico del Sistema Financiero
), or “EOSF,” issued by the Ministry of Finance, Decree 2555 of 2010 and regulations issued by the Superintendency of Finance and, to the extent applicable, Colombian Corporation Law. These regulations limit the range of assets in which pension fund administrators, or “AFPs,” can invest and also set investment limits. In addition, each AFP is legally required to provide a minimum return on investment for each of its pension and severance funds. This minimum return is determined pursuant to specified formulas established in Decree 2555 of 2010, which vary according to the type of fund. If a fund’s return for any month is lower than the minimum return, the AFP must cover the difference within a period of five days. To do so, the AFP must first apply funds from a stabilization reserve (a portion of the AFP’s capital invested in the fund equal to 1% of the value of each pension fund under management). If the stabilization reserve is insufficient to cover the difference, the AFP must provide resources from its own capital. If the AFP does not have enough resources to cover the difference, the Superintendency of Finance may order the capitalization of the AFP. If, notwithstanding the above, an AFP fails to observe either the minimum return or the stabilization reserve requirements or fails to comply with the order of capitalization, the Superintendency of Finance may take possession (
tomar posesión
) of the AFP, in which case the Colombian Deposit Insurance Fund (
Fondo de Garantías de Instituciones Financieras
), or “FOGAFIN,” must supply funds to cover the shortfall. Although Porvenir has never failed to meet the minimum requirements, failure to do so could require us to increase our investment in Porvenir, seek capital from alternative sources or forfeit our investment, or lead to the dissolution of the AFP and the transfer of the fund to another AFP. If Porvenir is unable to fulfill the minimum return or the stabilization reserve requirements, or if new laws or decrees impose more onerous requirements, Porvenir’s business may be materially adversely affected.
On December 6, 2013, the Executive Branch issued Decree 2837 of 2013 to establish a group of financial experts to discuss and review the minimum return definition methodology. The group is led by the Minister of Finance and includes the Financial Superintendent, a representative of the Central Bank, the Director of the Unit of Financial Regulation and five financial experts appointed by the Ministry of Finance. Although we are uncertain about the way in which the minimum return definition methodology will be changed, more onerous requirements may be imposed on Porvenir, which may materially adversely affect its business, financial condition and results of operations. In addition, there are regulatory limitations on the commissions that Porvenir may charge for its services. For example, Porvenir may only retain 300 basis points of the 16.0% (up to 17.0% for employees meeting a certain salary threshold) of the base contribution to a mandatory pension fund, a portion of which (currently 160 basis points) we are required to pay to an insurer for life and disability coverage of the subject employee contributor. The percentage we pay for this insurance may increase or decrease depending on market conditions and other factors. Life and mortality rate tables have been adopted in Colombia and became effective on October 1, 2010 as provided under Resolution 1555 of 2010. These tables account for longer life expectancy trends, which may result in an increase in the amount we pay for insurance and may affect our results of operations.
In 2009, the regulatory system began to shift from an obligatory pension system to a multi-funds system, allowing pension funds to be more specifically tailored to the individual needs of customers according to their risk profiles. The Colombian government has announced that it is considering presenting to the Colombian Congress a bill to amend current pension fund regulation to improve access to coverage, reduce inequality, and consolidate the financial sustainability of the system. The future regulation may not provide a favorable business environment and may adversely affect our results of operations and the financial condition of our pension and severance fund management business.
A significant amount of debt securities in pension and severance funds managed by our pension and severance fund businesses are issued or guaranteed by the Colombian government.
Our pension and severance fund management business, like our banks and other participants in the banking industry, is subject to the risk of loss in value of sovereign debt securities. For example, at December 31, 2014, total debt securities held by Porvenir represented 60.5% of the total assets of the funds managed by Porvenir, and 62.8% of total debt securities were issued or backed by the Colombian government. A significant decline in the value of the securities issued or guaranteed by the Colombian government could adversely affect the debt securities portfolio of our pension and severance fund management business and, consequently, our pension and severance fund management business’s results of operations and financial condition.
Other risks relating to our businesses
We are subject to fluctuations in interest rates and other market risks, which may materially and adversely affect our results of operations and financial condition.
Market risk refers to the probability of variations in income or in the market value of assets and liabilities due to changes in markets, including variations in market rates of interest and foreign currency exchange rates. Changes in interest rates affect the following areas, among others, of our banks’ businesses: net interest income, the volume of loans originated, market value of securities holdings, asset quality, and gains from sales of loans and securities. We do not manage market risk on a group-wide basis and are not subject to regulation or supervision of market risk on a group-wide basis.
Changes in short-term interest rates may affect interest margins quickly and, therefore, net interest income, which is the most important component of our revenue. Increases in interest rates may reduce the volume of loans originated by our banking subsidiaries. Sustained high interest rates may discourage customers from borrowing and may result in increased delinquencies in outstanding loans and deterioration in the quality of assets. Increases in interest rates may reduce the value of our assets, including the financial assets of our banks, the assets managed by Porvenir and the investments of Corficolombiana. Our banking subsidiaries hold a substantial portfolio of loans and debt securities that have both fixed and floating interest rates. In addition, we may incur costs (which, in turn, will affect our results of operations) if our banking subsidiaries implement strategies to reduce future interest rate exposure. Increases in interest rates may reduce gains or require our banking subsidiaries to record losses on sales of their loans or securities.
High interest rates have historically been common in many countries in Latin America. We have regional exposure to fluctuations in interest rates. If there are significant increases in such rates in any of the countries in which BAC Credomatic operates, our operating margins may be adversely affected and our results of operations may experience significant adverse consequences.
We face exposure to fluctuations in the rate of exchange between local currencies and the U.S. dollar, particularly in light of the fact that the currencies in countries where we and BAC Credomatic operate have historically experienced significant devaluations and depreciations. The types of instruments exposed to foreign exchange rate risk include, for example, investments in foreign subsidiaries, foreign currency-denominated loans and securities, foreign currency-denominated debt and various foreign exchange derivative instruments whose values fluctuate with changes in the level or volatility of currency exchange rates or foreign interest rates.
We may be adversely affected by fluctuations between the value of the Colombian peso or other local currencies where we operate, and the U.S. dollar as a result of U.S. dollar-denominated indebtedness.
We are subject to the negative impacts on our income statement and/or balance sheet derived from fluctuations, in particular, against the U.S. dollar, where most of our foreign long-term debt is denominated, and the Colombian peso, and between the US dollar and each of the currencies in our Central American operations, as 30.2% of our average consolidated assets for the year ended December 31, 2014 and 33.8% of our average consolidated liabilities for the year ended December 31, 2014 are foreign currency-denominated.
On a consolidated basis, we and our subsidiaries have U.S.$3.0 billion (Ps 7.2 trillion) of long-term debt denominated in U.S. dollars as of December 31, 2014 which we have used in part to finance our Central American acquisitions. Fluctuations in the exchange rate between the Colombian peso and the U.S. dollar may affect the value of this debt on our balance sheet and cause us to recognize gains or losses on our income statement. Any substantial increase in the U.S. dollar relative to the Colombian peso could affect our results of operations and our ability to meet our future payment obligations.
A substantial portion of BAC Credomatic’s earnings, assets and liabilities are in Costa Rican colones, Guatemalan quetzals, Honduran lempiras, Nicaraguan cordobas, Panamanian balboas and U.S. dollars. As a result, we are subject to risks relating to foreign currency exchange rate fluctuations between these currencies and pesos. Nevertheless, as described in “Item 4. Information on the Company—B. Business overview—BAC Credomatic—Foreign exchange rate risk related to BAC Credomatic,” BAC Credomatic maintains a U.S. dollar net asset position, which is intended to hedge at least 60% of its shareholders’ equity against the possible devaluations and depreciations of each of these local currencies.
We are subject to trading risks with respect to our trading activities.
Our banking subsidiaries, Corficolombiana, Porvenir and our other subsidiaries engage in proprietary trading, and we derive a portion of our profits from such trading activities. As a result, any reduction in trading income could adversely affect our results of operations and financial condition. Our trading income is volatile and dependent on numerous factors beyond our control, including, among others, market trading activity, interest rates, exchange rates and general market volatility. A significant decline in our trading income, or large trading losses, could adversely affect our results of operations and financial condition.
Declines in the market price for securities could result in our recording impairment losses as well as increased unrealized losses on other securities. Losses in the Colombian equity markets could result in further losses from impairment or sale of these securities. Any significant increases in exposure to any of these non-traditional risks, or a significant increase in credit risk or bankruptcy of any of the counterparties, could materially and adversely affect our results of operations and financial condition.
Colombian law imposes limitations on interest rates, and future additional restrictions on interest rates or banking fees could negatively affect our profitability.
The Colombian Commercial Code limits the amount of interest our Colombian subsidiaries may be charged on commercial transactions, including transactions of our banking subsidiaries. In the future, regulations in Colombia could impose increased limitations regarding interest rates or banking fees. Law 1430 of December 2010 authorizes the Colombian government to impose or place limits on tariffs and fees charged by banks and other financial institutions where the government has determined that there is insufficient competition in a relevant market. Additionally, the law requires the Superintendency of Finance to implement a monitoring scheme of the tariffs and fees charged by the financial institutions in their relevant markets and to report the results of this evaluation semi-annually to the Colombian government. The Colombian government issued Decree 4809 of 2011, which (1) requires banks to provide each of their clients with statements of all fees charged to such clients on an annual basis, (2) sets a limit on the fees that banks may charge to their clients for withdrawals from automated teller machines of other banks and (3) establishes that transactions through the internet may not cost more than those made through other channels. Accordingly, the Superintendency of Finance has issued External Circular 012 of 2012, setting the rules and principles that must be followed by banking and financial institutions at the time of establishing, publishing and promoting their tariffs and fees. A significant portion of our banks’ revenues and operating cash flow is generated by credit services and any such increased limitations would materially and adversely affect our results of operations and financial condition.
The Colombian Central Bank may impose requirements on the ability of Colombian residents, including us, to obtain loans denominated in foreign currency.
Under Colombian exchange control requirements, the Colombian Central Bank may impose certain mandatory deposit requirements in connection with foreign currency-denominated loans obtained by Colombian residents, including us. Most recently, when the Colombian peso appreciated against foreign currencies in 2008, such mandatory deposit requirement was set at 40% of the amounts to be disbursed under any credit facility denominated in a foreign currency. Future measures or requirements imposed by the Colombian Central Bank, such as mandatory deposit requirements, may adversely affect our and our clients’ ability to obtain loans in foreign currency.
We face uncertainty regarding consumer protection laws.
Law 1328 of 2009, also referred to as the “financial reform law,” created a new customer protection regime with respect to financial institutions. The financial reform law provides a bill of rights for consumers of financial services and products, including the right to receive clear, complete and reliable information about the services and products offered by financial institutions. The law also contains specific obligations for financial institutions, including a duty to maintain a financial ombudsman in charge of consumer protection and procedures regulating the responsibilities and functions of the ombudsman, a duty to create a financial consumer attention center pursuant to terms set by the Superintendency of Finance, an obligation to provide services and products under the same conditions offered to the general public, and a prohibition on the inclusion of predatory or abusive clauses in contracts with consumers. Any violation of this law and its implementing regulations by our banking subsidiaries could result in monetary or administrative sanctions or restrictions on our operations.
Decree 4809 of 2011 regulates certain fees charged by Colombian financial institutions. The most salient of these regulations include a cap of 20
Unidades de Valor Real
or “UVR” (an inflation indexed unit) for ATM fees charged to clients for transactions conducted through ATMs owned by a third party, the requirement that ATM fees be disclosed to clients with the possibility to opt out of the transaction before it takes place, and the prohibition of charging higher fees for internet transactions than for non-internet transactions as well as charging fees for failed internet transactions. These restrictions could affect the profitability of our business by decreasing our fee income.
Additionally, Law 1555 of 2012 or “Law 1555,” allows consumers of financial services to prepay obligations denominated in pesos owed to financial institutions, without incurring any penalty. The law also requires that financial institutions disclose the possibility of such prepayment to borrowers prior to the extension of any loan. Although this law does not apply to loans having a balance that exceeds 880 times the legal monthly minimum wages, nor to financial obligations acquired prior to its effective date (July 9, 2012), its implementation may substantially affect our banking business profits.
Our businesses face constitutional actions, class actions and other legal actions involving claims for significant monetary awards against financial institutions, which may affect our businesses.
Under the Colombian Constitution, individuals may initiate constitutional actions (
acciones populares
), or class actions (
acciones de grupo
), to protect their collective or class rights, respectively. Individuals may also initiate constitutional actions for the protection of their fundamental rights. These actions are known as tutelage actions. Colombian financial institutions, including our banking subsidiaries, have been, and continue to be, subject to these actions with regard to fees, financial services, mortgage lending and interest rates, the outcomes of which are uncertain. In addition, the number of such actions could increase in the future and could significantly affect our businesses.
Acquisitions and strategic partnerships may not perform in accordance with expectations, may fail to receive required regulatory approvals or may disrupt our operations and adversely affect our credit rating and profitability.
A component of our strategy is to identify and pursue growth-enhancing strategic opportunities. As part of that strategy, we have acquired interests in various financial institutions in recent years. We regularly evaluate strategic acquisitions and alliances, inside and outside of Colombia. Strategic acquisitions and alliances could expose us to risks with which we have limited or no experience, as in the case of any significant acquisition outside of Colombia. In addition, potential acquisitions in Colombia and elsewhere may be subject to regulatory approval. We may be unsuccessful in obtaining any such approval or we may not obtain approvals on terms that are optimal for us—particularly in view of our subsidiaries’ and our combined significant market share in the Colombian banking industry.
We must necessarily base any assessment of potential acquisitions and alliances on assumptions with respect to operations, profitability and other matters that may subsequently prove to be incorrect. Future acquisitions and alliances, as well as other investments, may not produce anticipated synergies or perform in accordance with our expectations and could adversely affect our operations and profitability. In addition, new demands on our existing organization and personnel resulting from the integration of new acquisitions, including our recent acquisitions of Horizonte, Grupo Reformador and Banco BAC de Panamá (merged into BAC International Bank, Inc. on December 9, 2014), could disrupt our operations and adversely affect our operations and profitability.
We may not be able to manage our growth successfully.
We have been expanding the scope of our operations over the past few years and we expect that this expansion will continue. As we continue to grow, we must improve our operational, technical and managerial knowledge and compliance systems in order to effectively manage our operations across the expanded group. Failure to successfully integrate, monitor and manage expanded operations could have a material adverse effect on our reputation and financial results. Our future growth will also depend on our access to internal and external financing sources. We may be unable to access such financing on commercially acceptable terms or at all.
We are subject to operational risks.
Our business depends on the ability of our banking subsidiaries to process large numbers of transactions efficiently and accurately. Operational risks and losses can result from fraud, employee error, failure to properly
document transactions or to obtain proper internal authorization, failure to comply with regulatory requirements, breaches of conduct of business rules, equipment failures, natural disasters or the failure of external systems, among others. Our, and our banking subsidiaries’ currently adopted procedures may not be effective in controlling each of the operational risks faced by our banking subsidiaries.
Failure of our information systems could materially and adversely affect the effectiveness of our risk management and internal control processes as well as our results of operations and financial condition.
We and our subsidiaries are highly dependent on the ability to collect and process, on a timely basis, a large amount of financial and other information, and services and products, at a time when transaction processes have become more complex with increasing volumes. A partial or complete failure of any of these systems could materially and adversely affect our decision-making process, risk management and internal control systems as well as our ability to respond on a timely basis to changing market conditions.
In addition, our and our subsidiaries’ ability to remain competitive will depend in part on their ability to upgrade their information technology infrastructure on a timely and cost-effective basis. We and our subsidiaries must continually make significant investments and improvements in their information technology infrastructure in order to ensure the proper functioning of financial control, accounting and other data collection and processing systems and to remain competitive. In addition, as our banking subsidiaries continue to open new branches, they will need to improve their information technology infrastructure, including maintaining and upgrading their software and hardware systems and their back-office operations. We and our subsidiaries are currently in the process of sequentially replacing certain of our core banking systems on a bank by bank basis to converge in time to a common technology platform. If there are technological impediments, unforeseen complications, errors or breakdowns in implementing new systems, our business, financial condition or results of operations may be adversely affected.
We are subject to cyber security threats.
We and our subsidiaries also rely on information systems to operate websites, process transactions, respond to customer inquiries on a timely basis and maintain cost-efficient operations. We and our subsidiaries may experience operational problems with their information systems as a result of system failures, viruses, computer “hackers” or other causes. While we have not experienced a material breach of cyber security, we cannot assure you that we will not experience any such breach in the future, and any material disruption or slowdown of our or our subsidiaries’ systems could cause information, including data related to customer requests, to be lost or to be delivered to our customers with delays or errors, which could reduce demand for their services and products and could materially and adversely affect our results of operations and financial condition.
Our policies and procedures may not be able to detect money laundering and other illegal or improper activities fully or on a timely basis, which could expose us to fines and other liabilities.
We and our subsidiaries are required to comply with applicable anti-money laundering laws, anti-terrorism financing laws and other regulations. These laws and regulations require us, among other things, to adopt and enforce “know your customer” policies and procedures and to report suspicious or large transactions to the applicable regulatory authorities. While we and our financial institutions have adopted policies and procedures aimed at detecting and preventing the use of banking networks for money laundering activities and by terrorists and terrorist-related organizations and individuals generally, such policies and procedures have in some cases only been recently adopted and may not completely eliminate instances where they may be used by other parties to engage in money laundering and other illegal or improper activities. If we or any of our subsidiaries fail to fully comply with applicable laws and regulations, the relevant government authorities to which they report have the power and authority to impose fines and other penalties. In addition, our businesses and reputation could suffer if customers use our financial institutions for money laundering or illegal or improper purposes.
Competition and consolidation in the Colombian and Central American banking and financial industry could adversely affect our market position.
We operate in a competitive market. Since the 1990s, when the Colombian financial system was deregulated, there has been an ongoing process of consolidation that has included foreign bank participants entering the Colombian market. We expect that consolidation will lead to the creation of larger local financial institutions,
including additional foreign banks, presenting the risk that we could lose a portion of our market share in the industry, adversely affecting our results of operations.
Various banking institutions, which have recently been incorporated in Colombia, target the microcredit and small and medium enterprises segments. These institutions include Banco de las Microfinanzas-Bancamía S.A., Banco WWB S.A. and Banco Coomeva S.A. In addition, JP Morgan Corporación Financiera S.A., BNP Paribas Colombia Corporación Financiera S.A. and Itaú BBA Colombia S.A. Corporación Financiera, which are local subsidiaries of international financial institutions, have entered the market targeting corporate clients. Recently, Banco Santander filed a petition with the Superintendency of Finance to obtain a bank license in order to incorporate a new bank aimed primarily toward corporate clients. The businesses of these new credit institutions may affect our market position in the individual, small and medium enterprises and merchant banking segments. To a lesser extent, we also face competition from non-bank competitors, such as brokerage companies, department stores (for some credit products), leasing and factoring companies, mutual fund and pension fund management companies and insurance companies.
In addition, the pace of consolidation in the Colombian and Central American financial services industry has increased, which may also increase competition in the markets where we operate. See “Item 4. Information on the Company—B. Business overview—Industry.”
Our ability to maintain our competitive position depends mainly on our ability to anticipate and fulfill the needs of new and current customers through the development of innovative services and products, and our ability to offer adequate services and strengthen our customer base through cross-selling. Our businesses will be adversely affected if we are unable to retain current customers and attract new ones.
Our efforts to offer new services and products may not succeed if product or market opportunities develop more slowly than expected or if the profitability of these opportunities is undermined by competitive pressures. As we expand the range of our products and services, some of which may be at an early stage of development in the Colombian and Central American market, we will be exposed to new and potentially increasingly complex risks and development expenses. Our employees and our risk management systems may not be adequate to handle such risks. In addition, the cost of developing products that are not launched is likely to affect our results of operations. Any or all of these factors, individually or collectively, could have a material adverse effect on us.
We depend on our chairman, our president and our senior management, and the loss of their services could have an adverse effect on our business.
We are highly dependent on our founder and chairman, Mr. Sarmiento Angulo (82 years old), our president, Mr. Sarmiento Gutiérrez (53 years old), and members of our senior management teams at both the group and subsidiary levels, all of whom possess considerable experience and expertise and have strong relationships with customers, participants of the Colombian business.
Our president has been responsible for our day-to-day management over the last 15 years and has acted as president of companies controlled by Mr. Sarmiento Angulo for the past 25 years. Mr. Sarmiento Gutiérrez, who became president of Grupo Aval in 2000, and our chairman are responsible for the overall strategic direction of the group.
In addition, our senior managers at each subsidiary are responsible for implementing strategies and for the day-to-day operations of the companies they run. Although Grupo Aval does not require that its employees mandatorily retire at a certain age, the presidents of some of our banks (who have an average tenure of 25 years with these banks and have fulfilled their pension requirements) and other members of the senior management are not obliged to remain employed with us.
The loss of the services of any of these members of our, or our subsidiaries’ senior management, in particular of our chairman, or our president, could have an adverse effect on our business. Accordingly, our success is dependent on appropriately managing the risks related to executing a succession plan for our chairman, our president and our senior management on a timely basis.
We are subject to reputational risk, and our reputation also is closely tied to that of our founder and chairman, Mr. Sarmiento Angulo, our president, Mr. Sarmiento Gutiérrez, and that of our subsidiaries.
Damage to our reputation may limit our ability to attract customers, employees and investors. Harm to our reputation can arise from employee misconduct, legal and regulatory requirements, ethical issues, allegations of money laundering, and failing to deliver minimum standards of service and quality, among others. In particular, our success has been attributable, in part, to the high esteem in which Mr. Sarmiento Angulo, Mr. Sarmiento Gutiérrez and our subsidiaries are held in Colombia. Reputation plays an integral role in our business operations, which are based on customer confidence and trust. If the public image or reputation of Mr. Sarmiento Angulo, Mr. Sarmiento Gutiérrez, Grupo Aval or any of our subsidiaries is damaged as a result of adverse publicity or otherwise, business relationships with customers of the entire group may deteriorate, which would adversely affect our results of operations and financial condition. Any perceived or real difficulties experienced by any one of our subsidiaries would harm the reputation of Grupo Aval as a whole, which would also have an adverse effect on our results of operations and financial condition.
We are controlled by Mr. Sarmiento Angulo, whose interests could differ from the interests of preferred shareholders and ADS holders.
Mr. Sarmiento Angulo beneficially owns 96.4% of our common shares outstanding and 43.7% of our preferred shares outstanding, as of April 22, 2015, and, accordingly, controls our group. See “Item 7. Major Shareholders and Related Party Transactions—A. Major shareholders.” The preferred shares do not have any voting rights and thus will not affect such control of our group. Mr. Sarmiento Angulo will continue to have the right to control decisions, regardless of how our minority shareholders may vote on these issues and regardless of the interests of such shareholders, including holders of ADSs and underlying preferred shares. In addition, as of April 22, 2015, Mr. Sarmiento Angulo beneficially owns interests in certain of our subsidiaries through entities other than Grupo Aval: 8.3% of Banco de Bogotá, 13.3% of Banco de Occidente, 15.5% of Banco AV Villas, 0.8% of Banco Popular and 0.3% of Corficolombiana.
Circumstances may occur in which Mr. Sarmiento Angulo may have an interest in pursuing transactions that, in his judgment, enhance the value of his several investments in the banking sector. These transactions may not necessarily be in Grupo Aval’s interest or that of its shareholders even if holders of the ADSs or the underlying preferred shares disagree. Due to his control, Mr. Sarmiento Angulo has, and will have, the power to:
|
|
·
|
elect a majority of our directors and appoint our executive officers, set our management policies and exercise overall control over our company and subsidiaries;
|
|
|
·
|
agree to sell or otherwise transfer his controlling stake in our company; and
|
|
|
·
|
determine the outcome of substantially all actions requiring shareholder approval, including transactions with related parties, corporate reorganizations, acquisitions and dispositions of assets, and dividends.
|
In addition, the concentration of ownership may have the effect of delaying, preventing or deterring a change of control of our company, could deprive our shareholders of an opportunity to receive a premium for the ADSs or underlying preferred shares as part of a sale of our company and might ultimately affect the market price of the ADSs and the underlying preferred shares.
We may engage in additional transactions with our controlling shareholder in the future.
In the future we may engage, as we have done in the past, in business and financial transactions with our controlling shareholder and other shareholders that may present conflicts of interest between our company and these shareholders. For example, we may incur indebtedness, or acquire shares in Banco de Bogotá, Banco de Occidente, Banco Popular and Banco AV Villas that are not owned by us from entities that are beneficially owned by Mr. Sarmiento Angulo. While we believe that these transactions will be carried out on an arm’s-length basis, commercial and financial transactions between us and our controlling shareholder could create the potential for, or could result in, conflicts of interests between us and our other shareholders. To the extent that the price we pay for any assets acquired from our controlling shareholder exceeds the market value of such assets or is not as productive a use of our cash as other uses, our results of operations and financial condition could be adversely affected.
Certain risks relating to our Central American operations
We may be unsuccessful in addressing the challenges and risks presented by our operations in countries outside Colombia.
We conduct banking businesses outside our historical home market of Colombia primarily through BAC Credomatic. Our Central America operations may involve risks to which we have not previously been exposed. Some of these operations are in countries that may present different or greater risks than those in Colombia, including, for example, in terms of competition. BAC Credomatic has, in particular, a significant consumer finance business, including credit card operations, in the Central American countries in which it operates. At December 31, 2014, BAC Credomatic’s consumer loan portfolio totaled U.S.$4.5 billion (including mortgages, vehicles and other personal loans), which represented 39.1% of BAC Credomatic’s total loan portfolio, and U.S.$2.2 billion in credit card loans, which represented 19.0% of BAC Credomatic’s total loan portfolio. We have limited experience conducting credit card and consumer finance businesses in countries outside Colombia. Accordingly, we may not be successful in managing credit card and consumer finance operations outside of our traditional domestic market. We may face delays in payments by customers and higher delinquency rates in these countries, which could necessitate higher provisions for loan losses and, consequently, have a negative effect on our financial performance.
In addition, we may not be able to realize all of the anticipated benefits from our Central American acquisitions. Achieving such benefits will depend, to a large extent, on our ability to run a business outside Colombia. Any failure to do so could adversely affect our margins, results of operations and financial condition.
We depend on BAC Credomatic’s current senior management, and the loss of their services could have a material adverse effect on BAC Credomatic’s business.
We have retained the current senior management of BAC Credomatic, who have worked on average over 15 years at BAC Credomatic, and most of whom pre-date GE Capital’s 2005 investment in BAC Credomatic. The loss of services of any of BAC Credomatic’s senior officers could have an adverse effect on BAC Credomatic’s business.
Changes in credit card regulations may adversely affect BAC Credomatic’s business.
The credit card business is an important business segment for BAC Credomatic, representing 19.0% and 18.5% of its total loan portfolio at December 31, 2014 and 2013, respectively, the adoption of new laws and regulations or the revision of the current regulatory regime for credit cards in any of the jurisdictions in which BAC Credomatic operates may have an adverse effect on BAC Credomatic’s results of operations and financial condition.
BAC Credomatic and our Central American operations are subject to significant compliance risks in connection with a multi-jurisdictional regulatory regime.
BAC Credomatic businesses are subject to regulation under Bahamian, Costa Rican, Guatemalan, Grand Cayman, Honduran, Mexican, Nicaraguan, Panamanian, Salvadoran and U.S. federal, state and other foreign laws, regulations and policies. BAC Credomatic thus is subject to a multi-jurisdictional regulatory regime, with which we have had little or no experience, and, accordingly, following the acquisition of BAC Credomatic, we are subject to increased compliance risks. In addition, any changes to the regulatory regime of one of the Central American countries may lead to corresponding changes to the regulatory regime of other countries in the region. BAC Credomatic’s businesses are regularly reviewed or investigated by regulators, which could lead to enforcement actions, fines and penalties or the assertion of private litigation claims and damages.
We are subject to the consequences of consolidated supervision due to regulatory asymmetries.
Regulation of financial institutions varies across the different Central American jurisdictions in which we operate. These differences are particularly pronounced in the assessment of credit risk and investments. These asymmetries may affect the expected results of our operations in each jurisdiction, and as a consequence could adversely affect our consolidated results of operations in Central America.
Risks relating to our preferred shares and ADSs
Exchange rate volatility may adversely affect the Colombian economy, the market price of the ADSs and the dividends payable to holders of the ADSs.
Pursuant to Colombian law, the Colombian Central Bank has the power to intervene in the exchange market in order to consolidate or dispose of international reserves, as well as to control any volatility in the exchange rate, acting through a variety of mechanisms, including discretionary ones. During recent years, the Colombian Central Bank has employed a floating exchange rate system with periodic interventions. From time to time, there have been significant fluctuations in the exchange rate between the Colombian peso and the U.S. dollar. For example, the peso depreciated 24.2% against the U.S. dollar in 2014, 9.0% in 2013, appreciated 9.0% in 2012, depreciated 1.5% in 2011 and appreciated 6.4% in 2010. Unforeseen events in international markets, fluctuations in interest rates, changes in capital flows, political developments or inflation rates may cause exchange rate instability that could, in turn, depress the value of the Colombian peso, thereby decreasing the U.S. dollar value of the dividends paid to holders of the ADSs.
Restrictions on purchasing our preferred shares may affect the market liquidity of our preferred shares and ADSs.
Under Colombian securities regulations, as a general rule, any transaction involving the sale of publicly traded shares of any Colombian company, including any sale of our preferred shares for the equivalent of 66,000 Unidades de Valor Real, or “UVRs” (approximately U.S.$5,932), or more, must be effected through the Colombian Stock Exchange. UVR is a Colombian inflation-adjusted monetary index calculated by the board of directors of the Colombian Central Bank and generally used for pricing home-mortgage loans (one UVR = Ps 215.03 (U.S.$0.09) at December 31, 2014). Any transfer of preferred shares underlying the ADSs may be required to be sold through the Colombian Stock Exchange, which could limit their liquidity or affect their market price.
The relative illiquidity of the Colombian securities markets may impair the ability of preferred shareholders and holders of ADSs to sell preferred shares underlying the ADSs.
Our preferred shares have been listed since February 1, 2011 on the Colombian Stock Exchange, which is relatively small and illiquid compared to securities exchanges in major financial centers. In addition, a small number of issuers represents a disproportionately large percentage of the market capitalization and trading volume on the Colombian Stock Exchange. A liquid trading market for the preferred shares or ADSs may not develop on the Colombian Stock Exchange or New York Stock Exchange, respectively. A limited trading market could impair the ability of a holder of preferred shares or ADSs to sell preferred shares (in the case of an ADS holder, obtained upon withdrawal of such shares from the ADR facility) on the Colombian Stock Exchange in the amount and at the price and time desired by such holder, and could increase the volatility of the market price of the preferred shares and the ADSs.
An active market for our preferred shares and the ADSs may not continue to develop or be maintained and the market price of our preferred shares and the ADSs may fluctuate in response to numerous factors.
Prior to our initial public offering in the United States, there was no market for our ADSs. A public market for the preferred shares currently exists in Colombia. Although our ADSs have traded on the NYSE since September 23, 2014 and our preferred shares were listed on the Colombian Stock Exchange on February 1, 2011, an active public market for the ADSs or preferred shares may not continue to develop or be maintained.
The market price of the ADSs and preferred shares may fluctuate significantly in response to numerous factors, many of which are beyond our control, including actual or anticipated fluctuations in our operating results, economic downturns, political events in Colombia, Central America or other jurisdictions where we operate, developments affecting the banking industry, changes in financial estimates by securities analysts or our failure to perform in line with such estimates, departures of key personnel, and sales of our preferred shares in the future, including by our banking subsidiaries who may have to sell our preferred shares obtained from investors who entered into loans with them to acquire our preferred shares in our offering of 1,600 million preferred shares on May 12, 2011, or the “Preferred Shares Local Offering.” Furthermore, common shares may be converted into preferred shares on a 1-1 basis provided that our preferred shares do not exceed 50% of our total subscribed share capital. Preferred shares are available for deposit into the ADS Program.
Our banking subsidiaries extended a total of Ps 654.3 billion (U.S.$363.8 million at the representative market rate on May 12, 2011) of credit disbursed through 14,533 loans to finance the acquisition of preferred shares in the Preferred Shares Local Offering of which 172 loans representing Ps 169.6 billion (U.S.$70.9 million) were outstanding at December 31, 2014. The final loan will mature in 2021. Depending on the characteristics of the borrower, our banking subsidiaries may have required collateral, which may have included a pledge of the preferred shares that were subject to the financing. Such a pledge would permit our banking subsidiaries through a court procedure to seek the sale of the preferred shares if the borrower defaults. Our banking subsidiaries had, on an aggregate basis, pledges over 86,970,478 preferred shares related to loans made to third parties at December 31, 2014. All the loans are full-recourse loans. Under the terms of the pledges, each borrower is limited from selling the pledged shares until the loan is repaid. Under Colombian law, our banking subsidiaries must seek to sell any repossessed shares as banks are not permitted to hold shares issued by their parent. If changes in general economic conditions or other factors cause these borrowers to default on their loans, our subsidiaries will have to sell our preferred shares into the market, or alternatively, upon repayment of the loans, these borrowers will not be restricted from selling such shares in the market. As a result, the market price of our preferred shares and ADSs may decline.
Holders of ADSs and underlying preferred shares may face difficulties in protecting their interests because we are subject to different corporate rules and regulations than those available in other jurisdictions, and our preferred shareholders have limited rights.
Holders of ADSs will not be direct shareholders of our company and will be unable to enforce the rights of shareholders under our by-laws and Colombian law. Under Colombian law, holders of our preferred shares may have fewer rights than shareholders of a corporation incorporated in the United States. Even if a holder of ADSs surrenders its ADSs and becomes a direct shareholder, a holder of our preferred shares under Colombian law may have fewer alternatives to protect its interests relative to actions by our board of directors or executive officers, and these alternatives may be less well-defined than under the laws of those other jurisdictions.
The Colombian securities markets are not as highly regulated or supervised as the U.S. securities markets or the markets in some other jurisdictions. In addition, rules and policies against self-dealing or for preserving shareholder interests may be less well-defined and enforced in Colombia than in the United States and certain other countries, which may put holders of our preferred shares and the ADSs at a potential disadvantage. Corporate disclosures also may be less complete or informative than for a public company in the United States or in certain other countries.
Our by-laws contain an arbitration clause that provides for the exclusive jurisdiction of an arbitral tribunal to be seated at the Bogotá Chamber of Commerce. The arbitration provision provides that any conflict arising among shareholders, or between shareholders and Grupo Aval, in connection with the by-laws must be resolved by an arbitral tribunal. In addition, holders of the ADSs and our preferred shares are not entitled to vote for the election of directors or to influence our management policies. Under our by-laws and Colombian law, holders of preferred shares (and, consequently, holders of ADSs) have no voting rights in respect of preferred shares, other than in limited circumstances.
Our ability to pay dividends on the ADSs or underlying preferred shares may be limited by Colombian law and because we are a holding company dependent on dividends from subsidiaries.
Under Colombian law, a company may only distribute dividends to the extent such distribution is fully supported by accurate financial statements demonstrating the financial condition of the company. Any dividends distributed in violation of this provision may not be reclaimed from shareholders who received such payments in good faith, and any subsequent distribution of profits may be suspended. In addition, dividends may not be distributed until losses from previous fiscal years have been absorbed. Dividends must be approved at the ordinary annual shareholders’ meeting upon the recommendation of the board of directors.
Our ability to pay dividends on the preferred shares represented by ADSs will be contingent upon the financial condition of our subsidiaries. Any of our banking subsidiaries may be restricted from paying dividends to us if such subsidiary does not meet its required regulatory capital ratios or does not have sufficient retained earnings. In addition, we conduct substantially all of our operations through subsidiaries and are dependent on dividends from our subsidiaries to meet our obligations.
Holders of ADSs may encounter difficulties in the exercise of dividend rights and in the limited voting rights of our preferred shares.
Holders of ADSs may encounter difficulties in exercising rights with respect to the preferred shares underlying ADSs. If we make a distribution to holders of underlying shares in the form of securities, the depositary is allowed, in its discretion, to sell those securities on behalf of ADS holders and instead distribute the net proceeds to the ADS holders. Also, under some circumstances, you may not be able to exercise your limited voting rights by giving instructions to the depositary.
Our status as a foreign private issuer allows us to follow alternate standards to the corporate governance standards of the NYSE, which may limit the protections afforded to investors.
We are a “foreign private issuer” within the meaning of the NYSE corporate governance standards. Under the NYSE rules, a foreign private issuer may elect to comply with the practices of its home country and not to comply with certain corporate governance requirements applicable to U.S. companies with securities listed on the NYSE. We currently follow Colombian practices concerning corporate governance and intend to continue to do so. Accordingly, you will not have the same protections afforded to shareholders of companies that are subject to all NYSE corporate governance requirements. For example, Colombian law requires that at least 25% of our board of directors consist of “independent” directors within the meaning of Colombian law, whereas NYSE rules generally require that a majority of a domestic U.S. company’s board consist of “independent” directors within the meaning of NYSE rules. In addition, NYSE rules require non-executive directors of domestic U.S. listed companies to meet on a regular basis without management being present. There is no similar requirement under Colombian law, and our non-executive directors do not meet formally without management present. See “Item 6. Director, Senior Management and Employees—C. Board Practices—Principal differences between Colombian and U.S. corporate governance practices.”
Preemptive rights may not be available to holders of preferred shares or ADSs.
Colombian law and our by-laws require that, whenever we issue new common shares, we must offer the holders of common shares the right to subscribe a number of shares of such class sufficient to maintain their existing percentage ownership of our aggregate share capital. On the other hand, holders of preferred shares, including holders of ADSs, are entitled to preemptive rights only when so declared at a meeting of holders of our common shares. Our common shareholders may decide not to provide for such preemptive rights. Also, U.S. holders of ADSs may not be able to exercise their preemptive rights through JPMorgan Chase Bank, N.A., which acts as ADR depositary for our ADR facility, unless a registration statement under the Securities Act is effective with respect to such rights or an exemption from the registration requirement thereunder is available. Although we are not obligated to do so, we will consider at the time of any preemptive rights offering the costs and potential liabilities associated with any such registration statement, the benefits to us from enabling the holders of the ADSs to exercise those rights and any other factors deemed appropriate at the time, and will then make a decision as to whether to file a registration statement. Accordingly, we might decide not to file a registration statement in some cases.
If holders of ADSs are unable to exercise these rights because a registration statement has not been filed and no exemption from the registration requirement under the Securities Act is available, the ADR depositary may attempt to sell the holders’ preemptive rights and distribute the net proceeds from that sale, if any, to such holders, provided that, the meeting of holders of our common shares decides that holders of preferred shares are entitled to preemptive rights. The ADR depositary, after consultation with us, will have discretion as to the procedure for making preemptive rights available to the holders of ADSs, disposing of such rights and making any proceeds available to such holders. If by the terms of any preemptive rights offering or for any other reason the ADR depositary is unable or chooses not to make those rights available to any holder of ADSs, and if it is unable or for any reason chooses not to sell those rights, the depositary may allow the rights to lapse.
Whenever the rights are sold by the ADR depositary or such rights lapse, or if the common shareholders’ meeting does not grant preemptive rights to the holders of preferred shares, the equity interests of the holders of ADSs will be proportionately diluted.
Our ability to make payments on the ADSs may be adversely affected if we become unable to convert Colombian pesos to U.S. dollars or to transfer U.S. dollars abroad.
The Colombian government does not currently restrict the ability of Colombian persons or entities to convert Colombian pesos to U.S. dollars. However, the government may impose foreign exchange controls on dividend payments and remittances of interest and principal if the foreign currency reserves of the Central Bank fall below a level equal to the value of three months of imports into Colombia. Colombian law also allows the imposition of a deposit requirement with the Central Bank in connection with any foreign exchange transaction that may increase the cost of foreign exchange transactions or limit the amount of such transactions for a particular time. No such foreign exchange controls are currently applicable. Nevertheless, such restrictions may be imposed in the future, and any such restrictions could prevent, restrict or increase the price of our access to U.S. dollars, which we need to pay our foreign currency-denominated obligations.
We will be traded on more than one market and this may result in price variations; in addition, investors may not be able to easily move shares for trading between such markets.
Our preferred shares have traded on the Colombian Stock Exchange since February 2011 and on the NYSE since September 23, 2014. Trading in our ADSs or preferred shares on these markets will take place in different currencies (U.S. dollars on the NYSE and pesos on the Colombian Stock Exchange), and at different times (resulting from different time zones, different trading days and different public holidays in the United States and Colombia). The trading prices of our shares on these two markets may differ due to these and other factors. Any decrease in the price of our preferred shares on the Colombian Stock Exchange could cause a decrease in the trading price of our ADSs on the NYSE. Investors could seek to sell or buy our shares to take advantage of any price differences between the markets through a practice referred to as arbitrage. Any arbitrage activity could create unexpected volatility in both our share prices on one exchange, and the shares available for trading on the other exchange. In addition, holders of ADSs will not be immediately able to surrender their ADSs and withdraw the underlying preferred shares for trading on the other market without effecting necessary procedures with the depositary. This could result in time delays and additional cost for holders of ADSs.
If holders of ADSs surrender their ADSs and withdraw preferred shares they may face adverse Colombian tax consequences.
Although Colombian tax law does not specifically refer to the tax consequences applicable to an ADS holder withdrawing the underlying preferred shares, we believe, based on the advice of our Colombian counsel, that such a transaction should not result in a taxable event under Colombian law in the case of non-resident entities and non-resident individuals given the nature of the transaction. Nevertheless, this issue is not free from doubt, and the Colombian tax authorities may have a different interpretation of the law and may assess taxes on the conversion of ADSs into preferred shares based upon the difference between the market value of the preferred shares and the adjusted tax basis of the ADSs. Furthermore, an investor who surrenders ADSs and withdraws preferred shares will be subject to income taxes on any gain associated with the sale of such preferred shares.
Banking regulations, accounting standards and corporate disclosure applicable to us differ from those in the United States and other countries.
Colombian banking regulations may differ in material respects from regulations applicable to banks in other countries, including those in the United States. For example, in Colombia, we are not subject to regulations applicable to financial institutions, although our banking subsidiaries, Corficolombiana, Porvenir and certain of our other subsidiaries are subject to such regulations. In addition, capital adequacy requirements for banks under Colombian regulations differ from those under U.S. regulations and may differ from those of other countries.
Although we are required to prepare our financial statements in accordance with Colombian GAAP, we also prepare our audited consolidated financial statements included in this annual report in accordance with Colombian Banking GAAP, which differs in significant respects from U.S. GAAP and International Financial Reporting Standards, or “IFRS,” as issued by the International Accounting Standards Board, or “IASB.” As a result, the financial statements of Colombian companies, such as ours, may differ from those of companies in other countries.
Until
December 31, 2014
we had to prepare our financial statements in accordance with Colombian Banking GAAP, which differs in certain significant respects from IFRS. Following the adoption of IFRS
beginning on
January 1, 2015
, our results of operations may differ significantly from previous amounts reported under Colombian Banking GAAP in our total shareholders’ equity and net income.
In 2009, the Colombian Congress passed Law 1314 and in 2012, the Colombian government enacted Decree 2784, which established the implementation of IFRS in Colombia. Colombian authorities proposed a schedule for the implementation of IFRS pursuant to which financial entities and Colombian issuers of securities in the public market such as Grupo Aval (i) had to prepare an opening transition balance sheet beginning on January 1, 2014 in accordance with IFRS, and (ii) will commence to prepare financial statements in accordance with IFRS no later than December 31, 2015 for the periods commencing on January 1, 2015.
Furthermore, through Decrees 1851 of August 29, 2013 and 3023 of December 27, 2013, the Colombian government decided to implement a partial application of IFRS with respect to the separate (unconsolidated) financial statements of financial entities and in the case of the consolidated financial statements of companies in Colombia—including financial entities—the Colombian government implemented a version of IFRS that differs in certain aspects from IFRS as currently issued by the IASB. In addition to the foregoing, on December 23, 2014, the Congress of Colombia enacted Law No. 1739, which added a new net worth tax on the wealth of corporate entities, or “Wealth Tax”, pursuant to which companies in Colombia were authorized to record this tax affecting available equity reserves which differs from accounting treatment under IFRS as currently issued by the IASB.
Considering the above and current SEC regulations, if for the purpose of this annual report, we decided to implement IFRS, as currently issued by the IASB, we would no longer be required to include a reconciliation note of equity and income under U.S. GAAP in our consolidated financial statements. However, if for the purpose of this annual report, we decided to implement IFRS as applicable under Colombian regulations, we would still be required to continue to include a U.S. GAAP reconciliation note in our consolidated financial statements.
Adoption of IFRS, as applicable under Colombian regulations, is expected to have relevant effects on our accounting for some items of our consolidated financial statements as of December 31, 2015 for the periods commencing
on January 1, 2015, and thereafter such as: (i) investments in fix income securities, (ii) allowances for losses on loans, (iii) taxes, (vi) cumulative translation adjustments, (v) reappraisal of assets and (vi) business combinations, (vii) loan origination fees and costs and (viii) employee benefit plans.
If we had implemented IFRS,
as applicable under Colombian regulations,
on January 1, 2014, our net income and our shareholders’ equity for the year ended December 31, 2014 would have moderately differed from our net income and our shareholders’ equity as reported under Colombian Banking GAAP. In particular, we would have experienced a moderate decrease in our shareholders’ equity as of that date.
In addition, presentation of certain information in our
consolidated financial results is expected to change, particularly in aspects such as: (i) non-controlling interest presented within equity, (ii) statement of other comprehensive income and (iii) income from non-financial sector.
Furthermore, our implementation of IFRS is expected to generate risk and investments derived from the impact on information technology, accounting reporting, internal control, credit risk assessment of the clients of our banking subsidiaries and other operational processes.
Judgments of Colombian courts with respect to our common and preferred shares will be payable only in pesos.
If proceedings are brought in Colombian courts seeking to enforce the rights of holders of our preferred shares, we will not be required to discharge our obligations in a currency other than Colombian pesos. Under Colombian law, an obligation in Colombia to pay amounts denominated in a currency other than Colombian pesos may only be satisfied in Colombian currency at the exchange rate, as determined by the Colombian Central Bank and published by the Superintendency of Finance, also known as
Tasa Representativa del Mercado
, in effect on the date the judgment is obtained, and such amounts are then adjusted to reflect exchange rate variations through the effective payment date. The then-prevailing exchange rate may not afford non-Colombian investors with full compensation for any claim arising out of or related to our obligations under the preferred shares, or indirectly, the ADSs.
U.S. investors in our preferred shares or the ADSs may find it difficult or impossible to enforce service of process and enforcement of judgments against us and our officers and directors.
We are incorporated under the laws of Colombia, and all of our subsidiaries are incorporated in jurisdictions outside the United States. In addition, our executive offices are located outside of the United States. All of our directors and officers reside outside of the United States, and all or a substantial portion of our assets and the assets of most of our officers and directors are, and will most likely continue to be, located outside of the United States. As a result, it may be difficult or impossible for U.S. investors to serve legal process within the United States upon us or
any of these persons or to enforce a judgment against us for civil liabilities in U.S. courts. In addition, you should not assume that courts in the countries where we or our subsidiaries are incorporated or where our or our subsidiaries’ assets are located (1) would enforce judgments of U.S. courts obtained in actions against us or our subsidiaries based upon the civil liability provisions of applicable U.S. federal and state securities laws or (2) would enforce, in original actions, liabilities against us or our subsidiaries based on those laws.
There is also substantial doubt that the courts of Colombia would enter judgment in original actions brought in those courts predicated on U.S. federal or state securities laws. We have been advised by our Colombian counsel that there is no legal basis for original actions to be brought against us or our directors and executive officers in a Colombian court predicated solely upon the provisions of the U.S. federal or state securities laws. In addition, certain remedies available under provisions of the U.S. securities laws may not be admitted or enforced by Colombian courts.
Grupo Aval’s by-laws contain an arbitration provision that provides for the exclusive jurisdiction of an arbitral tribunal to be seated at the Bogotá Chamber of Commerce. The arbitration provision provides that any conflict arising among shareholders, or between shareholders and Grupo Aval, in connection with the by-laws must be resolved by the arbitral tribunal. See “Item 4. Information on the Company—B. Business overview—Service of process and enforcement of judgments.”
|
History and development of the company
|
Our company
We are Colombia’s largest banking group based on total assets, and for the period from 2010 to 2014, we have been the most profitable among our principal competitors in the Colombian market based on an average of ROAE and an average of ROAA (calculated as the average of the ROAEs and ROAAs for each of the five most recent fiscal years). We are also the largest banking group in Central America based on total assets as of December 31, 2014. We provide a comprehensive range of financial services and products ranging from traditional banking services, such as making loans and taking deposits, to pension and severance fund management.
Colombian operations
Our operations in Colombia currently consist of four commercial banks (Banco de Bogotá, Banco de Occidente, Banco Popular and Banco AV Villas), the largest pension and severance fund manager (Porvenir) and the largest merchant bank (Corficolombiana). We acquired 99.99% of the outstanding shares of Horizonte on April 18, 2013 and, on December 31, 2013, we completed the merger of Horizonte into Porvenir. The merger of Horizonte into Porvenir positions us as the market leader in the management of mandatory pension funds and severance funds in Colombia. See “—B Business overview—Competition—Pension and severance fund management – Porvenir.” Our
Red de Grupo Aval
(Grupo Aval network) is the largest combined network of ATMs and branches in Colombia and has been a key element of our competitive positioning in the Colombian market, with 1,418 branches and 3,791 ATMs at December 31, 2014. Customers of any of our banks may access Grupo Aval’s other bank branches to carry out basic banking transactions throughout our
Red de Grupo Aval
(Grupo Aval network).
Under our multi-brand strategy, each of our banks focuses on particular types of customers, geographic regions and products. Our banks are encouraged to compete among themselves and with other market participants, while operating within central strategic guidelines established by our management. We believe that this strategy has contributed to our strong financial performance and allowed us to provide an integrated service network to our customers. Underlying Grupo Aval’s competitive strengths are group-level policies focused on comprehensive brand management, strategic planning, general procurement, risk management, convergence of technologies and cost controls that we believe promote best practices, realization of synergies and efficiency across our subsidiaries.
The following tables show our ROAA, ROAE and efficiency ratio and that of our Colombian banking subsidiaries and principal competitors on a consolidated basis, and Colombian market share information.
|
At and for the year ended December 31, 2014
|
||||||||||||||||||||||||||||||||
|
Grupo Aval entities
|
||||||||||||||||||||||||||||||||
|
Banco de Bogotá
|
Banco de Occidente
|
Banco Popular
|
Banco AV Villas
|
Consolidated
(1)
|
Bancolombia
|
Davivienda
|
BBVA Colombia
|
|||||||||||||||||||||||||
|
(in percentages)
|
||||||||||||||||||||||||||||||||
|
ROAA(2)
|
1.7 | 1.5 | 2.2 | 1.9 | 1.5 | 1.3 | 1.7 | 1.3 | ||||||||||||||||||||||||
|
ROAE(3)
|
13.5 | 12.0 | 14.5 | 15.9 | 12.4 | 12.8 | 16.3 | 15.0 | ||||||||||||||||||||||||
|
Efficiency ratio (4)
|
49.7 | 45.1 | 53.3 | 53.6 | 51.0 | 48.7 | 53.7 | 45.3 | ||||||||||||||||||||||||
|
Colombian market share:
|
||||||||||||||||||||||||||||||||
|
Net income
|
19.0 | 15.1 | 4.8 | 2.5 | 41.4 | 16.8 | 12.6 | 6.1 | ||||||||||||||||||||||||
|
Deposits
|
14.6 | 7.2 | 3.7 | 3.0 | 28.5 | 20.2 | 11.9 | 11.4 | ||||||||||||||||||||||||
|
Gross loans and financial leases
|
13.7 | 6.9 | 4.3 | 2.3 | 27.2 | 23.1 | 13.5 | 10.2 | ||||||||||||||||||||||||
|
Assets
|
15.1 | 6.9 | 3.8 | 2.5 | 28.3 | 22.6 | 12.4 | 9.4 | ||||||||||||||||||||||||
|
Branches
|
13.1 | 3.8 | 4.3 | 5.2 | 26.3 | 14.8 | 10.8 | 8.7 | ||||||||||||||||||||||||
|
ATMs
|
12.0 | 2.3 | 8.1 | 3.9 | 26.3 | 27.2 | 11.5 | 8.4 | ||||||||||||||||||||||||
Source: Company calculations for ROAA, ROAE and efficiency ratio for competitors are based on each entity’s respective financial statements that are publicly available on their websites. Colombian market share information is based on unconsolidated data filed with the Superintendency of Finance, except for figures relating to Grupo Aval’s branches and ATMs, which are derived from Company data. Colombian market share data for Grupo Aval is based on aggregate figures. For market share information on each of our banking subsidiaries see “—B. Business overview—Our operations.”
|
(1)
|
ROAA, ROAE and efficiency ratio reflect ratios of Grupo Aval calculated on a consolidated basis. Market share information is calculated on an aggregated basis.
|
|
(2)
|
For methodology used to calculate ROAA, see note (2) to the table under “Item 3. Key Information—A. Selected financial data—Other financial and operating data.”
|
|
(3)
|
For methodology used to calculate ROAE, see note (3) to the table under “Item 3. Key Information—A. Selected financial data—Other financial and operating data.”
|
|
(4)
|
For methodology used to calculate efficiency ratio, see note (1) to the table under “Item 3. Key Information—A. Selected financial data—Non-GAAP measures reconciliation—Efficiency ratio.”
|
Central American operations
Through our BAC Credomatic operations, we are the largest banking group in Central America based on consolidated assets. We have a leading Central American presence with operations that are complementary to our Colombian businesses and a leading position in the consumer and credit card banking businesses in the region.
We have operations in six Central American countries (Costa Rica, El Salvador, Guatemala, Honduras, Nicaragua and Panamá) and Mexico. We are one of the leading credit card issuers and merchant-acquiring franchises in Central America and have the only network that processes all major credit card brands in the region.
Through a network of 635 points of contact (including 351 full-service branches, 40 in-store branches, 216 on-site branches and 28 auto/drive-thru branches) and 1,638 ATMs at December 31, 2014, BAC Credomatic has more than 3.2 million customers and serves a region with a population of approximately 44.5 million, providing significant opportunity for growth in financial services. Our Central American operations represented 26.0% of our assets at December 31, 2014.
Since acquiring BAC Credomatic in December 2010, we have implemented some of our best practices from our Colombian operations, improving its efficiency ratio from 65.7% in 2010 to 57.1% in 2014. In addition (calculated under its U.S. GAAP financials), net income attributable to shareholders improved from Ps 362.0 billion (U.S.$151 million) in 2010 to Ps 721.5 billion (U.S.$302 million) in 2014. BAC Credomatic’s ROAE was 17.4% and its ROAA was 1.9% in 2010 compared to an ROAE of 19.3% and an ROAA of 2.1% in 2014.
We believe we can further improve our performance in Central America and continue to improve BAC Credomatic’s efficiency ratio. The efficiency ratio for our Colombian operations was 49.3% for the year ended December 31, 2014. We also believe we can leverage Grupo Aval’s expertise to increase BAC Credomatic’s share in corporate lending within Central America.
The following table shows market shares and other metrics of our Central American operations and that of our principal competitors in Central America, excluding Panamá.
|
At December 31, 2014
|
||||||||||||||||||||||||
|
Grupo Aval Central
America (1)
|
Banco Industrial
|
Scotiabank Central America
|
G&T Continental
|
Citibank Central America
|
Bancolombia Central America
|
|||||||||||||||||||
|
(in percentages)
|
||||||||||||||||||||||||
|
Central American market share:
|
||||||||||||||||||||||||
|
Deposits
|
11.1 | 10.3 | 3.9 | 7.5 | 3.5 | 6.8 | ||||||||||||||||||
|
Loans and financial leases
|
12.6 | 9.5 | 5.1 | 5.9 | 3.4 | 7.6 | ||||||||||||||||||
|
Shareholders’ equity
|
12.5 | 8.3 | 4.6 | 5.5 | 5.2 | 8.1 | ||||||||||||||||||
|
Net income
|
17.4 | 13.3 | 2.9 | 6.8 | 2.2 | 8.8 | ||||||||||||||||||
Source: Calculated based on data aggregated from the local superintendencies of Costa Rica, El Salvador, Guatemala, Honduras and Nicaragua. Market share data is determined based on the sum of each bank’s operations in the above-mentioned countries. This comparison excludes Panamá due to the difficulty of separating international from local businesses of Panamanian banks. Including both of these businesses, our market shares in deposits and loans and financial leases in Panamá are 5.8% and 5.6%, respectively, at December 31, 2014.
(1) Reflects LB Panamá operations including BAC Credomatic.
Our business strengths
We believe that we have achieved our leading positions in the Colombian and Central American financial services industry through the following competitive strengths.
Largest banking and financial services operator in most financial sectors in Colombia
We are the largest participant in most sectors of the Colombian banking market, with market-leading shares of 30.0% of commercial loans and 27.9% of consumer loans, at December 31, 2014. We also have the largest market share of deposits, 28.5%, at December 31, 2014. Our
Red de Grupo Aval
(Grupo Aval network) is the largest combined ATM and branch network in the country and has been a key element of our competitive positioning in the Colombian market. At December 31, 2014, our ATMs and branches represented 26.3% of both total ATMs and branches in Colombia. Porvenir is a market leader in funds under management with a market share of 44.2% in mandatory fund management and 49.7% in severance fund management, respectively, both at December 31, 2014. In addition, Porvenir has the highest percentage of net income, 47.6%, among the main market participants in Colombia for the six-month period ended December 31, 2014. Corficolombiana, our merchant bank, is the largest financial corporation in Colombia.
Leading banking operations in Central America
BAC Credomatic is the leading financial group in Central America with a record of strong financial performance. Its ROAE (calculated under its U.S. GAAP financials) was 23.4% for the year ended December 31, 2012, 22.3% for the year ended December 31, 2013 and 19.3% for the year ended December 31, 2014. BAC Credomatic is a full-service financial institution with one of the leading card-issuing and acquiring businesses in the region. Its Credomatic brand has key alliances with major credit card networks, such as
Visa
,
MasterCard
,
American Express
and
Diners Club
, and has the only network in the region that processes all major credit card brands. BAC Credomatic’s customer base and distribution network are sizable in comparison with our Colombian banks. BAC Credomatic’s market share in terms of gross loans varies in the different countries as follows, as of December 31, 2014: 13.1% in Costa Rica, 11.5% in El Salvador, 9.7% in Guatemala, 13.7% in Honduras, 26.2% in Nicaragua and 5.6% in Panamá. We expanded our operations in Central America with the acquisitions of BBVA Panamá (merged into BAC International Bank, Inc.) and Grupo Reformador during 2013.
Strong track record of profitability and growth
We believe that our leading position in the Colombian market, cross-bank synergies, economies of scale, low-cost funding and operating efficiencies have helped us achieve stable profits. Our average ROAE of 17.9% and
average ROAA of 2.0% for the 2010 to December 31, 2014 period (calculated as the average of the ROAEs and ROAAs for each of the five most recent fiscal years) have been the highest among our principal competitors in the Colombian market. Our consolidated net interest margin (net interest income divided by total average interest-earning assets) has ranged from 7.2% at December 31, 2010 to 5.8% at December 31, 2014. We believe that the average ROAA and ROAE for the 2010 to December 31, 2014 period have outperformed those of our competitors mainly due to strong yields on loans (from the diversified loan portfolio provided by our multi-brand banking subsidiaries), significant yields from our investment portfolio, a low-cost funding structure, appropriate net provisions and better efficiency ratios. Our total assets have grown at a CAGR of 16.5% from December 31, 2010 to December 31, 2014. During the same period, our total deposits have grown at a CAGR of 15.8%. We have accomplished our growth through organic expansion and strategic acquisitions.
Diversified and competitive sources of funding
We have access to diverse sources of funding, including deposits and debt securities placed in Colombian and international capital and credit markets, which results in a competitive cost of funding for our operations. At December 31, 2014, our market share of total deposits in Colombia was 28.5%, supported by a 36.0% market share in checking accounts and a 27.0% market share in savings accounts. Deposits represented 78.1% of our total funding at December 31, 2014 compared to 77.0% at December 31, 2010, which provides us with a stable and cost-effective funding base.
As a result of our efforts to broaden our funding base, we increased our funding from Ps 82.6 trillion (U.S.$34.5 billion) at December 31, 2010 to Ps 146.4 trillion (U.S.$61.2 billion) at December 31, 2014. On May 12, 2011, we completed an offering of preferred shares, raising Ps 2.1 trillion (U.S.$1.1 billion at the date of issuance) in gross proceeds. On February 1, 2012, we successfully completed our inaugural international bond offering of U.S.$600 million (Ps 1,083.6 billion at the date of the issuance) of 5.25% Senior Notes due 2017 and on September 26, 2012 we issued U.S.$1.0 billion (Ps 1.8 trillion at the date of the issuance) of 4.75% Senior Notes due 2022 in the international markets. Between December 16, 2013 and January 17, 2014, we issued an aggregate of 1,855,176,646 common shares, pursuant to a preemptive rights offering, raising Ps 2.4 trillion (U.S.$1.3 billion). We issued an aggregate of 1,874,074,060 preferred shares, in the form of 93,703,703 ADSs in our initial public offering of ADSs, raising U.S.$1.3 billion, (Ps 2.4 trillion). We believe that our funding base supports our initiatives to expand our businesses.
Sound risk management
We believe we have asset quality that is superior to our principal competitors. Our aggregate ratio of loans past due more than 30 days over total loans was 2.6% at December 31, 2014, the lowest among our principal competitors on an unconsolidated basis. Bancolombia’s ratio was 2.8%, Davivienda’s was 3.5% and BBVA Colombia’s was 2.7% at December 31, 2014. We have maintained our relative consolidated asset quality, as evidenced by our ratio of nonperforming loans to total loans of 1.9% at December 31, 2014 and our ratio of charge-offs to average outstanding loans of 1.3% at December 31, 2014. In addition, we believe that our reputation as a banking group that pursues conservative policies has allowed us to consistently retain and attract new customers. Each of our banking subsidiaries has a comprehensive risk management system, which we view as fundamental to their long-term stability and viability, which enables them to identify risks and resolve potential problems on a timely basis. In addition, we have established upward loan reporting processes, and our risk management staff meets on a weekly basis to discuss the loan portfolio, risks, opportunities and developments in the industry.
Each of our banks and Grupo Aval on an aggregate basis are well-capitalized above the minimum capital adequacy mandatory ratios as calculated under Colombian capital adequacy regulations.
Multi-brand business model
Our differentiated multi-brand business model builds on the individual strengths of our banking subsidiaries and the market-wide recognition of their brands. Each of our banks has developed a focus on particular and, to a degree, overlapping market sectors, geographic regions, services and products. We believe that this specialization has contributed to the individual success of our banks and the diversity of Grupo Aval as a whole. Our banking subsidiaries in Colombia operate as four independent banks that are encouraged to compete among themselves and with other market participants, while operating within central guidelines established by us in the areas of internal control, credit risk management, brand management, strategic planning, general procurement and information
technology. These guidelines, together with group support services, are designed to allow each bank to achieve economies of scale and benefit from cross-bank synergies and group-wide best practices without inhibiting individual competition and the decision-making abilities of each bank’s management. We may, in the future, consider merging one or more of our subsidiaries in our group or additional business we may acquire if meaningful improvements in efficiencies, revenue or other benefits could be achieved.
Focus on group-wide best practices
We apply group-wide best practices to all of our operating subsidiaries. These practices are designed to encourage a consistent approach with respect to effective risk management, efficient use of capital, cost control, brand management, general procurement and integration of information technology. We believe that these practices have helped us achieve economies of scale and synergies to reduce operating and administrative costs. For the year ended December 31, 2014, we had a consolidated efficiency ratio of 51.0%, and our banking subsidiaries had efficiency ratios ranging from 45.1% (Banco de Occidente) to 53.6% (Banco AV Villas).
Experienced management teams
Our qualified and experienced management teams, both at the group and operating subsidiary levels, have played a key role in guiding our growth. Our chairman, Mr. Sarmiento Angulo, has over 55 years of business experience, including 40 years in the banking and related financial services industry. Our president, Mr. Luis Carlos Sarmiento Gutiérrez, has over 20 years of experience in the banking and related financial services industry and over 30 years of business experience as an executive in Colombia and the United States. We believe that the strength of our management at all levels has enabled us to become Colombia’s largest banking group, and we have been its most profitable based on our average of ROAE and average of ROAA, for the 2010 to December 31, 2014 period (calculated as the average of the ROAEs and ROAAs for each of the five most recent fiscal years and the year ended December 31, 2014), among our principal competitors in the Colombian market. Our and each of our operating subsidiaries’ management teams are dedicated to formulating and executing business strategies through a culture of excellence, innovation and cooperation, which has served as our guiding vision throughout the various acquisitions and initiatives undertaken by Grupo Aval.
Our strategy
Our overall objectives are to build upon our competitive strengths to pursue opportunities for growth and to enhance our long-term financial performance. To achieve these objectives, we intend to pursue a strategy with the following key elements:
Further penetrate the Colombian market
We believe that Colombia offers significant opportunities to expand our business because of the country’s strong economic fundamentals and low penetration rates for banking and other financial services and products, as compared to other countries in the region. For example, according to the 2013 World Bank Development Indicators, domestic credit to the private sector accounted for 50.2% of GDP in Colombia as compared to 105.9% for Chile and 70.7% for Brazil, in each case, as of December 31, 2013. See “—Industry—Colombia—Credit volumes.” Furthermore, according to the Colombian Central Bank, Colombia’s GDP expanded 4.3% in 2013 and 4.6% in 2014. We anticipate that demand for financial services and products will increase across all customer sectors. As Colombia’s leading banking group, and drawing upon our distinctive multi-brand business model, we believe that we are well-positioned to take advantage of this significant growth potential.
We believe we offer the most comprehensive range of banking services and products in Colombia, and we continually seek to expand these offerings to meet evolving customer needs and enhance our profitability. We believe we can capture additional revenue by improving our market share in segments and products where we have not historically focused in the past (for example, credit cards in Colombia, mortgages and payrolls). In addition, we are also expanding our cross-selling efforts to our over 9.7 million banking clients and our over 10.1 million pension fund clients in Colombia.
Furthermore, we are currently implementing initiatives to increase our non-interest income, which consists primarily of net fee income. Net fee income accounted for 26.7% of our consolidated total operating income before net provisions for the year ended December 31, 2014. We believe we can expand the contribution of non-interest income to our profitability in future periods by, for example, expanding our offering of bancassurance (i.e., bank-
offered third-party insurance products) through our distribution networks and credit card fee income through an increase in credit card loan volume across all of our banks.
We are also studying initiatives to develop cost-effective channels, such as mobile banking (Transfer Aval) and risk management tools to extend our banking services to under-penetrated segments of the Colombian population that have a low use or that do not currently use banking services. We are also implementing initiatives to encourage the migration of some banking transactions from branches to lower cost channels such as
Corresponsales Bancarios
and digital channels.
Further penetrate the Central American market
We plan to continue executing our multi-brand business model and maintain the BAC Credomatic brand. We intend to capitalize on the expansion of the Central American market as we believe that BAC Credomatic and our recent Central American acquisitions will offer us significant opportunities for organic and acquisition growth in financial services in this region. In order to improve operational efficiency and increase market share in key sectors, we intend to continue to share our group-wide commercial and operational standards and best practices with BAC Credomatic, while capitalizing on its regional expertise, brand recognition, customer base, and financial services and products, such as credit card issuance and merchant-acquiring businesses. We believe we can continue improving BAC Credomatic’s efficiency ratio, which for the year ended December 31, 2014 was 57.1%, compared to 49.0% for Grupo Aval’s Colombian operations, by implementing our best practices at BAC Credomatic.
We expect that our recent Central American acquisitions will enable BAC Credomatic’s franchise to grow in Panamá and Guatemala, benefiting from expected GDP growth in each of those markets and increased banking penetration, supported by the creation of further synergies.
Continue capitalizing on synergies and improving efficiencies
We believe that there is additional room to create synergies among our subsidiaries and leverage their combined strength without affecting our multi-brand business model. Through areas such as our vice presidencies of Shared Services and of Strategy we intend to continue identifying and working on group-wide projects, mainly in information technology, service channels (branches, ATMs, digital channels) and implementation of commercial and operational best practices. We will continue to seek economies of scale by fostering procurement of goods and services for multiple subsidiaries, which we believe have contributed to improvements in our efficiency ratios. As another example, we are executing a plan to sequentially replace the core banking systems in our subsidiaries to converge in time to a common platform.
Pursue other selected acquisitions and increase our controlling interests in our subsidiaries
We have a proven track record of identifying, acquiring and integrating interests in companies we believe have strategic value to us. We are interested in expanding our businesses in Colombia and Central America and into other regions. We will continue to seek opportunities to further expand into new geographies and will evaluate potential acquisition targets that would enable us to grow and consolidate our franchise through the services and products we offer and the markets we can access. We actively consider additional strategic investments, alliances and acquisitions, principally in Colombia, Central America and other selected Latin American countries, which may materialize, if we believe they will be both strategic and accretive to our existing businesses. We may also continue acquiring additional shares to increase our controlling interests in certain of our banking subsidiaries. During 2014, we increased our beneficial ownership of the outstanding share capital of Banco de Bogotá by 0.2% to 67.8% and of Banco de Occidente by 0.1% to 72.2% through purchase of shares in the open market. In December 2014, we further increased our ownership in Banco de Bogotá by 0.9% to 68.7% through the Banco de Bogotá capitalization process in connection with the issuance of preemptive shares. During 2013 we expanded our operations in Central America with the acquisitions of BBVA Panamá (now merged into BAC International Bank, Inc.) and Grupo Reformador.
Oversight
As the holding company of the group, we closely monitor the performance of our banking subsidiaries. We actively participate in developing each banking subsidiary’s long-term business plan, and we require each of our banking subsidiaries to present to us a yearly budget and profitability targets. We develop our own independent profitability targets for each banking subsidiary before discussing and recommending any changes thereto with its management team. In addition, we make recommendations for setting the compensation of management in each of
our banking subsidiaries annually, and link incentive compensation to achieving budget goals and other financial and strategic performance targets.
Our banking subsidiaries are required to report their financial performance to us on a regular basis, including daily summaries and monthly detailed information. We monitor the performance of our banks against their respective budgets and the performance of our competitors. This systematic control process is complemented by ad-hoc analyses of key operational drivers, such as the loan portfolio quality of each banking subsidiary relative to the others and our competitors. When a banking subsidiary deviates from its plan or when weaknesses are identified, we meet with the respective bank’s management to discuss remedial measures and a course of action. Similarly, when a banking subsidiary finds itself in a new or unfamiliar situation, such as the mortgage and financial crisis of 1999, we provide guidance. Our senior management and management of the banking subsidiaries meet at least twice a month to discuss strategy, opportunities and current operations.
Our internal control department regularly audits our banks, Porvenir, Corficolombiana and BAC Credomatic, as well as their operating subsidiaries, to provide objective assurance to our management and board of directors regarding the effectiveness of our subsidiaries’ financial reporting and control mechanisms as well as to monitor compliance with our best practices and guidelines. Our internal control department also plays an integral part in our corporate governance. When our internal control department discovers deviations from our best practices and guidelines, we recommend remedial measures and enhance our monitoring of the respective entity.
Strategic focus
From time to time, our banks explore merger and acquisition opportunities and, as part of its equity portfolio management activities, Corficolombiana makes investments in strategic sectors. Through areas such as our vice presidency of strategy, we provide support to our banking subsidiary management teams in identifying opportunities, negotiating favorable outcomes and implementing acquisitions. We independently assess a prospective target’s strategic fit with the acquiring banking subsidiary and within our group as a whole. In addition, we explore new business initiatives and often recommend new product lines and services to our banks, such as bancassurance, and provide assistance to our banks in evaluating, negotiating and implementing acquisitions such as Banco de Bogotá’s acquisition of Megabanco and Banco de Occidente’s acquisition of Banco Unión and the acquisition of Horizonte. Our acquisitions of BAC Credomatic, BBVA Panamá (merged into BAC International Bank, Inc.) and Grupo Reformador reflect our approach to identifying and pursuing growth opportunities outside of our existing portfolio.
Credit risk management
Although each banking subsidiary is responsible for its credit decisions and risk management, we oversee the implementation of appropriate risk management controls at our banks and have established upward loan reporting processes. Our risk management staff meets on a weekly basis to discuss our subsidiaries’ loan portfolio, developments in the industry, risks and opportunities. For potential loan transactions that would result in an aggregated exposure to a single issuer exceeding Ps 30 billion on a consolidated basis at the group level, our risk management staff will evaluate the transaction and will often make recommendations with respect to the structure of the loan (such as guarantees, interest rates, commissions and covenants). We also coordinate loan syndication among our banks to effectively leverage the combined equity of our banks and manage any risk issues. For a discussion of our risk management guidelines, see “Item 11. Quantitative and Qualitative Disclosures About Risk—Risk management.”
Marketing
Our centralized marketing strategy pursues two main objectives: to increase the competitiveness of our banks and to strengthen our corporate image. To achieve these objectives, we negotiate with third parties for the provision of certain marketing services and to design and implement advertising campaigns for the launch of new services and products. We have set up marketing guidelines and pursue communications that increase the exposure of our brands and those of our subsidiaries. Our service efforts are aimed at achieving customer and shareholder satisfaction.
Network integration
Each banking subsidiary is responsible for its information technology systems and distribution network; however, we seek to maximize the effectiveness of our distribution network and the levels of customer service and
customer retention across all our banks through our
Red de Grupo Aval
(Grupo Aval network), which connects all of our banks’ networks. Our network allows each of our banking subsidiaries’ customers to access basic banking services at any ATM or branch office in any of our banks. Although each banking subsidiary maintains its own information technology system, Grupo Aval works to identify potential synergies and assists in the implementation of technology and products developed at the Grupo Aval level within our banks, and the standardization of technology and processes across our banks. For example, we are developing a new technology model based on service-oriented architecture for our institutions. For a discussion of our current technology projects, see “—B. Business overview—Other corporate information—Technology.”
Our markets
Colombia
The majority of our operations are located in Colombia, representing
79.3
% and
75.4
% of our net income and gross loan portfolio, respectively, and in the six countries in Central America, representing
20.7
% and
24.6
% of our net income and gross loan portfolio, respectively, in each case for and at the year ended December 31, 2014.
We believe that Colombia’s financial system presents significant growth potential given its favorable economic conditions and low penetration rate for banking and financial services compared to other countries in the Latin American region such as Brazil and Chile. According to data from the IMF, at December 31, 2014, Colombia’s population and economy were the third and fourth largest in Latin America, respectively. According to DANE, in 2014 Colombia’s population was approximately 47.7 million people and its nominal GDP was Ps 756.1 trillion (U.S.$377.9 billion). Colombia’s nominal GDP per capita increased from Ps 7.93 million in 2005 (U.S.$3,417 using the average exchange rate for that year) to Ps 15.86 million in 2014 (U.S.$7,930 using the average exchange rate for that year).
During the ten-year period ended December 31, 2014, Colombia outperformed the average GDP growth rate for Latin America by 1.2 percentage points, while reducing the country’s dependency on foreign financing as reflected in the country’s external debt to GDP ratio of 24.2% at December 31, 2013 and 26.8% at December 31, 2014. According to IMF data, Colombia has achieved GDP growth every year during the last half century (other than 1999). Unlike other emerging Latin American countries, Colombia has regularly met all principal and interest payments on external debt and has avoided hyperinflation, maintaining a single-digit inflation rate for the ten years ended December 31, 2013 and also throughout all of 2014. According to the Central Bank of Colombia, or the “Colombian Central Bank,” Colombia’s annual inflation rate for 2013 was 1.9%, the lowest rate since 1954 and down from 2.4% for 2012. Annual inflation for 2014 was 3.7% as of December 31, 2014. These economic fundamentals, together with Colombia’s record as a stable democracy, account for Colombia’s relative strength during the recent global economic and financial crisis.
During the ten-year period ended December 31, 2014, according to the Superintendency of Finance, Colombia’s financial system grew at a compounded annual growth rate, or “CAGR”, of 13.3% in terms of loan balances outstanding and 10.6% in terms of deposits, on an inflation-adjusted basis, compared to 4.7% for the country’s GDP during the same ten-year period ended December 31, 2014. Despite this recent growth, Colombia’s bank-loans-to GDP ratio remains relatively low, with an approximate 37.9% ratio at December 31, 2014, according to the Superintendency of Finance. Using the ratio of domestic credit to the private sector to GDP, provided by the World Bank, Colombia stands at 50.2% compared to 105.9% for Chile, 70.7% for Brazil, 31.4% for Peru and 30.6% for Mexico at December 31, 2013, the most recent date for which such data is available.
Central America
We view Central America as a strategic region that meets our expansion criteria. At December 31, 2014, Central America had a total population of approximately
45.4
million, making it the fourth largest market in Latin America by population. At the same date, Central America posted a combined GDP of U.S.$
208.9
billion, ranking the region as the sixth largest economy in Latin America. According to the IMF, Central America’s GDP grew 4.0% in 2014, below the growth rate for Colombia of 4.6%, and is expected to grow at an annual average rate of 4.3% between 2015 and 2017, compared to Colombia’s expected average growth rate of 3.7% during the same period. In terms of banking penetration, Central America had a ratio of domestic credit to the private sector to GDP of 48% as of December 31, 2013, mainly driven by Panamá’s 70.7% ratio. This indicator for the other countries in the Central American region ranges from 28.8% to 55.2%, which we believe positions the financial sector to outperform GDP
growth. We also see the additional penetration of credit cards in the population as an important growth opportunity in Central America.
Our history
Grupo Aval was created by our chairman, Mr. Sarmiento Angulo, to consolidate his interests in the Colombian financial sector. The milestones in the history of Grupo Aval are the following:
|
|
·
|
Mr. Sarmiento Angulo established a real estate development firm in Bogotá in 1956, and in 1959 founded Organización Luis Carlos Sarmiento Angulo, which developed low- and middle-income housing neighborhoods in Bogotá in the 1960s and 1970s;
|
|
|
·
|
In 1971, Mr. Sarmiento Angulo acquired a majority stake in Banco de Occidente, and in 1972 founded Corporación de Ahorro y Vivienda Las Villas to focus on low- and middle-income mortgage financing;
|
|
|
·
|
In 1981, Mr. Sarmiento Angulo purchased a minority stake in Banco de Bogotá, and in 1988 he acquired a majority stake and control, consolidating a major participation in the banking system. Banco de Bogotá acquired a substantial majority of, and absorbed, Banco del Comercio in 1992;
|
|
|
·
|
In 1991, Banco de Bogotá and Banco de Occidente founded Porvenir as a severance fund manager, and following the creation in 1993 of the private pension fund system in Colombia, expanded the business to include pension fund management in 1994;
|
|
|
·
|
Banco Popular was acquired in 1996 from the Colombian government through a privatization process;
|
|
|
·
|
In 1997, Mr. Sarmiento Angulo acquired Corporación de Ahorro y Vivienda Ahorramas which was later merged with Corporación de Ahorro y Vivienda Las Villas in 2000 and became Banco AV Villas in 2002;
|
|
|
·
|
In 1998, Mr. Sarmiento Angulo contributed a majority of his direct and indirect holdings in the financial institutions to Grupo Aval. The
Red de Grupo Aval
(Grupo Aval network) was also established in 1998 to provide an integrated service network of branches and ATMs;
|
|
|
·
|
In 1999, we conducted our initial public equity offering in Colombia and listed our common shares on the Colombian Stock Exchange under the ticker symbol “GRUPOAVAL” raising Ps 62.5 billion (U.S.$35.3 million) in gross proceeds. Grupo Aval’s initial public offering was the first large-scale equity offering of a Colombian company to the general public, which allowed several thousand investors to become our shareholders;
|
|
|
·
|
Corficolombiana, which was founded in 1959 as an affiliate of Banco de Bogotá, acquired and merged with several merchant banks between 1997 and 1999, including Corfitolima, Corfiprogreso, Corfes, Corfiboyacá, Corfisantander, Corfiandes and Indufinanciera. In 2005, Corfivalle, also a merchant bank merged with Corficolombiana;
|
|
|
·
|
In 2007, we conducted our second public offering of common shares pursuant to a preemptive rights offering in Colombia, raising Ps 372.0 billion (U.S.$210.4 million) in gross proceeds;
|
|
|
·
|
On December 9, 2010, we acquired BAC Credomatic from GE Consumer Finance Central Holdings Corp. and General Electric Capital Corporation;
|
|
|
·
|
In 2011, we registered our preferred shares with the SEC;
|
|
|
·
|
In 2011, we concluded our first offering of our preferred shares pursuant to a preemptive rights offering in Colombia, raising Ps 2.1 trillion (U.S.$1.1 billion) in gross proceeds;
|
|
|
·
|
In February 2012, we completed our first international bond offering, issuing Ps 1,083.6 billion (U.S.$600 million) at the date of the issuance of our 5.25% Senior Notes due 2017;
|
|
|
·
|
In September 2012, we completed our second international bond offering, issuing Ps 1,795.7 billion (U.S.$1.0 billion) at the date of the issuance of our 4.75% Senior Notes due 2022;
|
|
|
·
|
On April 18, 2013, we acquired Horizonte and on December 31, 2013, we completed the merger of Horizonte into Porvenir;
|
|
|
·
|
On December 19, 2013 and December 23, 2013, we expanded our Central America operations with the acquisitions of BBVA Panamá (merged into BAC International Bank, Inc.) and Grupo Reformador, respectively;
|
|
|
·
|
On January 17, 2014, we completed our third public offering of common shares pursuant to a preemptive rights offering of 1,855,176,646 common shares, or the “Common Share Rights Offering,” raising Ps 2.4 trillion (U.S.$1.3 billion); and
|
|
|
·
|
In September 2014, we completed a SEC-registered initial public offering in the United States of 93,703,703 American Depositary Shares, or ADSs, each representing 20 preferred shares, including 12,222,222 ADSs sold to the underwriters to cover over-allotments. We raised U.S.$1.3 billion in gross proceeds. Our ADSs began to trade on the New York Stock Exchange, or NYSE, under the symbol “AVAL” on September 23, 2014.
|
Grupo Aval Acciones y Valores S.A. is a
sociedad anónima
, incorporated under the laws of Colombia on January 7, 1994 under the name Administraciones Bancarias S.A. On April 18, 1997, the company changed its name to Sociedad A.B. S.A., and on January 8, 1998, to Grupo Aval Acciones y Valores S.A.
|
Business overview
|
Our operations
We conduct our operations through our four banks (Banco de Bogotá, Banco de Occidente, Banco Popular and Banco AV Villas), a pension and severance fund manager (Porvenir), our merchant bank (Corficolombiana) and our Central American banking group (BAC Credomatic).

Source: Company data at December 31, 2014.
|
(1)
|
Porvenir, Corficolombiana and BAC Credomatic are subsidiaries of Banco de Bogotá, whose financial data is consolidated into Banco de Bogotá’s results. Ownership percentages shown include direct and indirect participation.
|
|
(2)
|
This acquisition was completed on December 9, 2010. BAC Credomatic’s results of operations prior to December 1, 2010 are not included in the results of operations that are described in this annual report.
|
|
(3)
|
Mr. Sarmiento Angulo beneficially owned 8.3% of Banco de Bogotá, 13.3% of Banco de Occidente, 0.8% of Banco Popular, 15.5% of Banco AV Villas and 0.3% of Corficolombiana, at April 22, 2015.
|
|
(4)
|
On December 17, 2014, Grupo Aval acquired from Banco de Occidente a 9.3% direct interest in Corficolombiana through the purchase of 20,008,260 common shares.
|
We believe that each of our banks, as well as Porvenir, Corficolombiana and BAC Credomatic have a strong reputation in the market within their individual sectors. Each of our banks and Corficolombiana are publicly-traded on the Colombian Stock Exchange, and the remaining shares in these companies that are not beneficially owned by Mr. Sarmiento Angulo are held by minority shareholders.
Colombian Banking Operations
Banco de Bogotá
, founded in 1870, is Colombia’s oldest financial institution and the largest bank in Colombia based on net income for the year ended December 31, 2014. Banco de Bogotá had market shares of 14.6% of deposits and 13.7% of loans at December 31, 2014. It is also the largest financial institution within our group by assets and the largest contributor to our net income before income tax expense and non-controlling interest. Banco de Bogotá is a full-service bank with nationwide coverage in Colombia and a comprehensive portfolio of services and products, distributed through a network of 704 branches and 1,737 ATMs. While Banco de Bogotá serves all segments in the market through differentiated service and product offerings, it is particularly focused on commercial lending with a market share of 18.2% of commercial loans at December 31, 2014.
Banco de Occidente
is the fifth largest bank in Colombia, based on assets and loans at December 31, 2014. It focuses on enterprise customers, state-owned entities and retail customers and has a leading presence in the southwest region of Colombia. Banco de Occidente has the second largest market share in Colombia, with 25.0% at December 31, 2014, in the financial leasing business, the second largest market share, with 18.0% at December 31, 2014, in the vehicle financing business, and the third largest market share, with 11.5% at December 31, 2014, in checking accounts, given its strong presence in corporate and public sector clients.
Banco Popular
is the pioneer of, and the market leader in, payroll loans and is a leading provider of financial solutions to government entities throughout Colombia. Banco Popular achieved strong returns on its consumer loan portfolio due to its access to payroll deductions for repayment of loans, which results in consumer loans with a substantially lower-risk profile (consumer past-due loans of 2.5% compared to a banking system average of 4.3% at December 31, 2014).
Banco AV
Villas
is a consumer-focused bank, which targets mid-income segments of the population and serves its clients through a nationwide service-point network and an advanced mobile banking platform. It is also Grupo Aval’s most active bank in terms of usage of non-traditional channels (mobile banking, banking correspondents and virtual branches). Over the past decade, Banco AV Villas has evolved from being a lender exclusively focused on mortgages to a diversified consumer bank. Banco AV Villas’ risk management systems provide it with real-time and in-depth credit quality analyses that allow the bank to approve consumer loans on an accelerated basis.
Pension and Severance Fund Management Administration
Porvenir
is the leading private pension and severance fund management business in Colombia, based on funds under management, with a 43.0% market share of assets under management at December 31, 2014. Pension funds provide individual savings for retirement, while severance funds provide temporary income to employees who become unemployed. Porvenir has experienced a 15.9% CAGR in net income in the 2010 to 2014 period. Porvenir is the most profitable and efficient pension and severance fund manager in Colombia, with an ROAE of 27.1% for 2011, 30.1% for 2012, 20.9% for 2013 and 23.4% for the year ended December 31, 2014. Porvenir completed the merger by absorption of Horizonte, a recently acquired pension and severance fund management business in Colombia, on December 31, 2013.
Merchant Banking
Corficolombiana
is the largest merchant bank in Colombia based on total assets at December 31, 2014. Corficolombiana focuses on four main lines of business: (1) equity investments in strategic sectors of the Colombian economy, including, in particular, financial services, infrastructure, energy and gas, agribusiness and hospitality; (2) investment banking, including services relating to capital markets, mergers and acquisitions and project finance transactions; (3) treasury operations; and (4) leasing, fiduciary and private banking. Corficolombiana’s ROAE was 10.2% for 2012, 15.3% for 2013 and 9.8% for the year ended December 31, 2014.
Central American Operations
BAC Credomatic is the leading Central American banking group with operations in Costa Rica, El Salvador, Guatemala, Honduras, Nicaragua, Panamá and Mexico. BAC Credomatic is a full-service financial institution with one of the leading credit card issuance and merchant-acquiring franchises in Central America. It has achieved processing volumes of U.S.$13,867 million for the year ended December 31, 2014 and U.S.$12,604 million for the years ended December 31, 2013, in the merchant acquiring business, which compares favorably to processing volumes of other leading Latin American issuers. BAC Credomatic’s ROAE (calculated under its U.S. GAAP financial statements) was 21.8% in 2011, 23.4% in 2012, 22.3% in 2013 and 19.3% for the year ended December 31, 2014. On December 19, 2013, Banco de Bogotá acquired BBVA Panamá through its subsidiary, LB Panamá, for U.S.$505 million (Ps 982.5 billion at the date of the transaction). On December 23, 2013, BAC Credomatic acquired Grupo Reformador through its subsidiary, Credomatic International Corporation for U.S.$421 million (Ps 815.0 billion at the date of the transaction). On December 9, 2014, Banco BAC de Panamá’s operations were merged with BAC International Bank, Inc.
Competition
We operate in a competitive market. Our principal competitors in Colombia are Bancolombia, Davivienda, and BBVA Colombia, which are the three leading banking groups in Colombia following Grupo Aval.
We are the market leader in Colombia in terms of market share of deposits, loans and our distribution network. Despite the expansion and contraction of recent economic cycles, our banks have been among the most profitable in the banking system measured by ROAE. Recently, we have outperformed one or more of our principal competitors under key operational metrics such as the ratio of loans past due more than 30 days over gross loan portfolio and operational efficiency. We believe that these results have been achieved due to our banks’ historically strong franchises, results-oriented philosophy and the Grupo Aval multi-brand business model. These features have also allowed our banks to increase their deposit and loan portfolio market share organically over time, and during times of contraction, our strong balance sheets have allowed for inorganic growth through acquisitions.
Since December 31, 2000 through December 31, 2014, we have increased our market share by 5.9% in deposits and 4.7% in loans. Acquisitions have accounted for 3.3% of the increase in deposit market share and 4.1% of the increase in loan market share.
Except where otherwise indicated, the balance sheet and statement of income data for each of our banking subsidiaries included in this annual report reflects its consolidated Colombian Banking GAAP information, while comparative disclosures of the financial and operating performance of our banking subsidiaries and that of our competitors are based on unconsolidated information prepared on the basis of Colombian Banking GAAP reported to the Superintendency of Finance. Our banking subsidiaries report unconsolidated financial data to the Superintendency of Finance; however, Grupo Aval, as a holding company, is not required to report such data. Unless otherwise indicated or the context otherwise requires, market share and other data comparing our performance and that of our competitors reflects the unconsolidated results of our banking subsidiaries.
Banks, financing companies and finance corporations are deemed credit institutions under Colombian banking regulations, and are the principal institutions authorized to accept deposits and make loans in Colombia. Banks undertake traditional deposit-taking and lending activities. Financing companies place funds in circulation by means of active credit operations, with the purpose of fostering the sale of goods and services, including the development of leasing operations. Finance corporations invest directly in the economy and thus are the only vehicle through which a bank may invest in non-financial sectors. See “—Supervision and regulation.” We operate four banks, one financing company and one finance corporation, and our market share is determined by comparing our banks to
other banks reporting their results to the Superintendency of Finance; however, if market share data including financing companies and finance corporations is considered, our market shares would generally be lower than in a bank-only comparison and the gaps between our market shares and those of our competitors would be smaller, but our market leadership in most market categories would be unaffected.
In addition to our market-leading banking business, we are the market leader in the pension and severance fund management market through Porvenir. Porvenir also has the largest share of individual customers and funds under management in the severance fund and mandatory pension fund markets.
Corficolombiana is the largest finance corporation in Colombia, with the largest equity portfolio primarily invested in five sectors of the Colombian economy: energy and gas, infrastructure, agribusiness, hotels division and financial services. Corficolombiana complements its core investment management business with treasury and investment banking operations.
Market share and other data from unconsolidated financial information
The following market share and other data comparing us and our banking subsidiaries to our competitors is based on information derived from unconsolidated financial information reported to the Superintendency of Finance by commercial banks based on Colombian Banking GAAP.
Deposits
We have the largest market share of total deposits, with an aggregate of 28.5% of all deposits in Colombia at December 31, 2014. Our principal competitor banks—Bancolombia, Davivienda and BBVA Colombia—had market shares of 20.2%, 11.9%, and 11.4%, respectively, at December 31, 2014. At December 31, 2014, we had increased our market share of total deposits by 5.9% since 2000.
The following graph presents the market share of deposits in Colombia for the period from 2010 to December 31, 2014.
Market share by deposits

Source: Company calculations based on information published by the Superintendency of Finance.
(1) Grupo Aval figures reflect aggregated amounts of our banking subsidiaries.
The following table presents a breakdown of market share of deposits by type of deposit at December 31, 2014.
|
At December 31, 2014
|
||||||||||||||||||||
|
Grupo Aval
aggregate
(1)
|
Bancolombia
|
Davivienda
|
BBVA Colombia
|
Rest of the Colombian market
|
||||||||||||||||
|
(in percentages)
|
||||||||||||||||||||
|
Checking accounts
|
36.0 | 23.7 | 10.2 | 9.9 | 20.2 | |||||||||||||||
|
Savings accounts
|
27.0 | 23.1 | 12.5 | 11.9 | 25.5 | |||||||||||||||
|
Time deposits
|
28.3 | 14.6 | 12.6 | 12.1 | 32.5 | |||||||||||||||
|
Other deposits(2)
|
12.3 | 13.3 | 4.7 | 4.9 | 64.7 | |||||||||||||||
|
Total deposits
|
28.5 | 20.2 | 11.9 | 11.4 | 28.1 | |||||||||||||||
Source: Company calculations based on information published by the Superintendency of Finance.
|
(1)
|
Grupo Aval figures reflect aggregated amounts of our banking subsidiaries.
|
|
(2)
|
Other deposits consist of correspondent bank deposits, cashier checks and collection services.
|
At December 31, 2014, deposits represented a larger share of our total funding than that of most of our principal competitor banks, and we had a higher concentration of checking accounts, which are generally the lowest cost source of funds. The table below presents the total funding mix of the market at December 31, 2014.
|
At December 31, 2014
|
||||||||||||||||||||
|
Grupo Aval
aggregate
(1)
|
Bancolombia
|
Davivienda
|
BBVA Colombia
|
Rest of the Colombian market
|
||||||||||||||||
|
(in percentages)
|
||||||||||||||||||||
|
Funding:
|
||||||||||||||||||||
|
Deposits
|
82.7 | 72.3 | 74.0 | 89.9 | 77.2 | |||||||||||||||
|
Other funding
|
17.3 | 27.7 | 26.0 | 10.1 | 22.8 | |||||||||||||||
|
Total funding
|
100.0 | 100.0 | 100.0 | 100.0 | 100.0 | |||||||||||||||
|
Deposits:
|
||||||||||||||||||||
|
Checking accounts
|
22.1 | 20.5 | 15.1 | 15.2 | 12.6 | |||||||||||||||
|
Savings accounts
|
45.6 | 54.9 | 50.7 | 50.2 | 43.8 | |||||||||||||||
|
Time deposits
|
30.9 | 22.5 | 32.9 | 33.1 | 36.1 | |||||||||||||||
|
Other deposits
|
1.4 | 2.1 | 1.3 | 1.4 | 7.5 | |||||||||||||||
|
Total deposits
|
100.0 | 100.0 | 100.0 | 100.0 | 100.0 | |||||||||||||||
|
Average funding rate:
|
||||||||||||||||||||
|
Average deposit rate
|
2.9 | 2.2 | 2.7 | 3.3 | 2.8 | |||||||||||||||
|
Average other funding rate
|
4.6 | 4.6 | 5.0 | 5.1 | 4.7 | |||||||||||||||
|
Average total funding rate
|
3.2 | 2.8 | 3.3 | 3.4 | 3.2 | |||||||||||||||
Source: Company calculations based on information published by the Superintendency of Finance.
|
(1)
|
Grupo Aval figures reflect aggregated amounts of our banking subsidiaries.
|
Loans
We have the largest market share of loans, with an aggregate of 27.2% of all loans at December 31, 2014. Our principal competitors banks—Bancolombia, Davivienda and BBVA Colombia—had market shares of 23.1%, 13.5% and 10.2%, respectively. At December 31, 2014, we had increased our market share of loans by 4.7% since 2000.
The following graph presents the market share of loans in Colombia for the period from 2010 to December 31, 2014.
Market share by loans
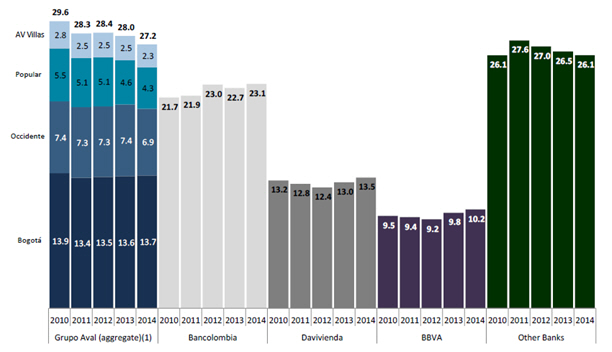
Source: Company calculations based on information published by the Superintendency of Finance.
|
(1)
|
Grupo Aval figures reflect aggregated amounts of our banking subsidiaries.
|
The following table presents a breakdown of the market share of loans by category at December 31, 2014.
|
At December 31, 2014
|
||||||||||||||||||||
|
Grupo Aval
aggregate
(1)
|
Bancolombia
|
Davivienda
|
BBVA Colombia
|
Rest of the Colombian market
|
||||||||||||||||
|
(in percentages)
|
||||||||||||||||||||
|
Commercial
|
30.0 | 30.6 | 12.1 | 7.1 | 20.2 | |||||||||||||||
|
Consumer
|
27.9 | 13.7 | 13.8 | 12.2 | 32.4 | |||||||||||||||
|
Microcredit
|
4.1 | 5.8 | 1.1 | 0.0 | 89.0 | |||||||||||||||
|
Mortgages
|
9.6 | 25.8 | 16.2 | 23.1 | 25.2 | |||||||||||||||
|
Financial leases
|
36.9 | 1.0 | 26.7 | 13.2 | 22.2 | |||||||||||||||
|
Total
|
27.2 | 23.1 | 13.5 | 10.2 | 26.1 | |||||||||||||||
Source:
Company calculations based on information published by the Superintendency of Finance.
|
(1)
|
Grupo Aval figures reflect aggregated amounts of our banking subsidiaries.
|
Our banks have been strategically focused on developing commercial and consumer loans, including credit card and payroll loans, increasing their exposure to mortgage loans, which remains low relative to our competitors.
The following table presents the distribution by loan category of the market at December 31, 2014.
|
At December 31, 2014
|
||||||||||||||||||||
|
Grupo Aval
aggregate
(1)
|
Bancolombia
|
Davivienda
|
BBVA Colombia
|
Rest of the Colombian market
|
||||||||||||||||
|
(in percentages)
|
||||||||||||||||||||
|
Commercial
|
60.4 | 72.2 | 49.1 | 38.2 | 42.3 | |||||||||||||||
|
Consumer
|
28.1 | 16.2 | 28.0 | 32.8 | 34.0 | |||||||||||||||
|
Microcredit
|
0.4 | 0.7 | 0.2 | 0.0 | 9.6 | |||||||||||||||
|
Mortgages
|
3.4 | 10.6 | 11.4 | 21.6 | 9.2 | |||||||||||||||
|
Financial leases
|
7.7 | 0.2 | 11.3 | 7.4 | 4.9 | |||||||||||||||
|
Total
|
100.0 | 100.0 | 100.0 | 100.0 | 100.0 | |||||||||||||||
Source:
Company calculations based on information published by the Superintendency of Finance.
|
(1)
|
Grupo Aval figures reflect aggregated amounts of our banking subsidiaries.
|
Loan Portfolio Quality
We believe that the credit quality of our loan portfolio compares favorably with that of our principal competitors. The following table presents credit quality metrics for our loan portfolio at the dates indicated.
|
Loans past due more than 30 days / gross loan portfolio
|
Loans rated C, D or E / gross loan portfolio
|
Gross provision expense / gross loan portfolio
(2)(3)
|
Allowance / loans past due more than 30 days
|
|||||||||||||||||||||||||||||
|
At December 31,
|
At December 31,
|
At December 31,
|
At December 31,
|
|||||||||||||||||||||||||||||
|
2014
|
2013
|
2014
|
2013
|
2014
|
2013
|
2014
|
2013
|
|||||||||||||||||||||||||
|
(in percentages)
|
||||||||||||||||||||||||||||||||
|
Banco de Bogotá
|
2.3 | 2.2 | 3.3 | 3.5 | 3.0 | 3.2 | 131.5 | 152.5 | ||||||||||||||||||||||||
|
Banco de Occidente
|
3.1 | 2.5 | 4.0 | 3.3 | 3.9 | 3.7 | 123.3 | 146.9 | ||||||||||||||||||||||||
|
Banco Popular
|
2.1 | 2.1 | 2.7 | 2.5 | 2.3 | 2.9 | 159.6 | 175.9 | ||||||||||||||||||||||||
|
Banco AV Villas
|
3.8 | 3.8 | 3.3 | 3.2 | 4.6 | 5.0 | 117.8 | 118.2 | ||||||||||||||||||||||||
|
Grupo Aval aggregate(1)
|
2.6 | 2.4 | 3.4 | 3.3 | 3.3 | 3.4 | 131.0 | 149.4 | ||||||||||||||||||||||||
|
Bancolombia
|
2.8 | 2.7 | 3.4 | 3.9 | 3.2 | 3.5 | 163.9 | 175.5 | ||||||||||||||||||||||||
|
Davivienda
|
3.5 | 3.5 | 2.9 | 3.1 | 3.6 | 4.4 | 118.9 | 124.6 | ||||||||||||||||||||||||
|
BBVA Colombia
|
2.7 | 2.6 | 2.5 | 2.4 | 2.8 | 3.1 | 123.6 | 127.7 | ||||||||||||||||||||||||
|
Rest of the Colombian market
|
4.3 | 4.3 | 5.1 | 5.1 | 4.5 | 5.3 | 131.7 | 136.0 | ||||||||||||||||||||||||
Source:
Company calculations based on information published by the Superintendency of Finance.
|
(1)
|
Grupo Aval figures reflect aggregated amounts of our banking subsidiaries.
|
|
(2)
|
When calculated as net provision expense / gross loan portfolio, the ratios for the year ended December 31, 2013 would be 1.4% for Banco de Bogotá, 1.7% for Banco de Occidente, 0.6% for Banco Popular, 2.2% for Banco AV Villas, 1.4% for Grupo Aval aggregate, 1.6% for Bancolombia, 2.5% for Davivienda, 1.3% for BBVA and 3.0% for the rest of the Colombian market.
|
|
(3)
|
When calculated as net provision expense / gross loan portfolio, the ratios for the year ended December 31, 2014 would be 1.4% for Banco de Bogotá, 1.8% for Banco de Occidente, 0.6% for Banco Popular, 2.1% for Banco AV Villas, 1.4% for Grupo Aval aggregate, 1.6% for Bancolombia, 2.1% for Davivienda, 1.4% for BBVA and 2.4% for the rest of the Colombian market.
|
Branches and ATM Network
Through our banking subsidiaries, we have the largest combined banking network in Colombia, with 1,418 branches and 3,791 ATMs at December 31, 2014. The following table presents the distribution of branches and ATMs across the market at December 31, 2014.
|
At December 31, 2014
|
||||||||||||||||
|
Branches
|
ATMs
|
|||||||||||||||
|
# of branches
|
Market share %
|
# of ATMs
|
Market share %
|
|||||||||||||
|
Grupo Aval aggregate(1)
|
1,418 | 26.3 | 3,791 | 26.3 | ||||||||||||
|
Bancolombia
|
800 | 14.8 | 3,918 | 27.2 | ||||||||||||
|
Davivienda
|
583 | 10.8 | 1,655 | 11.5 | ||||||||||||
|
BBVA Colombia
|
467 | 8.7 | 1,209 | 8.4 | ||||||||||||
|
Rest of the Colombian market
|
2,125 | 39.4 | 3,851 | 26.7 | ||||||||||||
|
Source:
|
Company calculations based on information published by the Superintendency of Finance, except for information for Grupo Aval which reflects aggregate data obtained from our banking subsidiaries.
|
|
(1)
|
Grupo Aval figures reflect aggregated amounts of our banking subsidiaries.
|
Competition and other data from consolidated financial information
The following information on Grupo Aval and our subsidiaries is based on consolidated financial information at and for the years ended December 31, 2014, 2013 and 2012. Competition and other data that compare us and our subsidiaries to Bancolombia, our main competitor, is readily obtained given that Bancolombia also prepares and publishes detailed consolidated financial information. Our other principal competitors, Davivienda and BBVA Colombia, publish financial information with a lower degree of detail; therefore, we only refer to these competitors where applicable based on publicly available information.
Profitability
We are one of the most profitable banking groups in Colombia based on ROAE, as compared to our principal competitors, at and for the years ended December 31, 2014, 2013 and 2012.
ROAE
The following table presents the ROAE for each of our banks, Grupo Aval, and our principal competitors for the periods indicated.
|
Year ended December 31,
|
||||||||||||
|
2014
|
2013
|
2012
|
||||||||||
|
(in percentages)
|
||||||||||||
|
ROAE(1)
|
||||||||||||
|
Banco de Bogotá
|
13.5 | 17.1 | 18.1 | |||||||||
|
Banco de Occidente
|
12.0 | 11.9 | 16.1 | |||||||||
|
Banco Popular
|
14.5 | 17.3 | 18.7 | |||||||||
|
Banco AV Villas
|
15.9 | 16.1 | 16.7 | |||||||||
|
Grupo Aval
|
12.4 | 17.1 | 17.7 | |||||||||
|
Bancolombia
|
12.8 | 12.6 | 16.5 | |||||||||
|
Davivienda
|
16.3 | 14.9 | 13.7 | |||||||||
|
BBVA Colombia
|
15.0 | 17.2 | 16.7 | |||||||||
|
Source:
|
Company calculations based on publicly available consolidated financial statements of Grupo Aval and each bank for the periods indicated.
|
|
(1)
|
For methodology used to calculate ROAE, see note 3 to the table under “Item 3. Key Information—A. Selected financial data—Other financial and operating data.”
|
ROAA
The following table presents the ROAA for each of our banks, Grupo Aval and our principal competitors, for the periods indicated.
|
Year ended December 31,
|
||||||||||||
|
2014
|
2013
|
2012
|
||||||||||
|
(in percentages)
|
||||||||||||
|
ROAA(1)
|
||||||||||||
|
Banco de Bogotá
|
1.7 | 2.1 | 2.3 | |||||||||
|
Banco de Occidente
|
1.5 | 1.6 | 2.2 | |||||||||
|
Banco Popular
|
2.2 | 2.5 | 2.6 | |||||||||
|
Banco AV Villas
|
1.9 | 2.0 | 2.1 | |||||||||
|
Grupo Aval
|
1.5 | 1.9 | 2.0 | |||||||||
|
Bancolombia
|
1.3 | 1.3 | 1.9 | |||||||||
|
Davivienda
|
1.7 | 1.7 | 1.7 | |||||||||
|
BBVA Colombia
|
1.3 | 1.6 | 1.6 | |||||||||
|
Source:
|
Company calculations based on publicly available consolidated financial statements of Grupo Aval and each bank for the periods indicated.
|
|
(1)
|
For methodology used to calculate ROAA, see note (2) to the table under “Item 3. Key Information—A. Selected financial data—Other financial and operating data.”
|
Regulatory capital
Banks in Colombia are required to have regulatory capital of at least 9.0% of risk-weighted assets plus a risk premium calculated pursuant to the rules of the Superintendency of Finance. For a description of these requirements, see “—Supervision and regulation—Capital adequacy requirements.”
The table below presents our capitalization (on an aggregate basis), the capitalization of our banking subsidiaries, and the capitalization of our principal competitors at December 31, 2014. Grupo Aval is not subject to capital requirements other than those that apply to its subsidiaries; therefore, we believe that our capitalization on an aggregate basis provides a more meaningful measure than our regulatory capital adequacy.
|
At December 31, 2014
|
||||||||||||||||||||||||||||||||
|
Grupo Aval entities
|
||||||||||||||||||||||||||||||||
|
Banco de Bogotá
|
Banco de Occidente
|
Banco Popular
|
Banco
AV
Villas
|
Aggregate
(3)
|
Bancolombia
|
Davivienda
|
BBVA
Colombia
(4)
|
|||||||||||||||||||||||||
|
(in percentages)
|
||||||||||||||||||||||||||||||||
|
Consolidated:
|
||||||||||||||||||||||||||||||||
|
Primary capital (Tier I)(1)
|
8.0 | 8.9 | 10.5 | 11.6 | 8.6 | 7.7 | 6.2 | 7.2 | ||||||||||||||||||||||||
|
Secondary capital
(Tier II)(2)
|
3.5 | 2.9 | 1.6 | 1.0 | 3.1 | 5.6 | 4.7 | 3.7 | ||||||||||||||||||||||||
|
Total consolidated capitalization
|
11.5 | 11.8 | 12.2 | 12.6 | 11.7 | 13.3 | 10.9 | 10.8 | ||||||||||||||||||||||||
|
Source:
|
Company calculations based on consolidated financial statements of each bank for the period indicated (financial statements of our principal competitors are publicly available on their websites).
|
|
(1)
|
Includes primary capital and reserves. See “—Supervision and regulation—Capital adequacy requirements.”
|
|
(2)
|
Includes primarily subordinated debt and unrealized gains on certain assets, including real estate. See “—Supervision and regulation—Capital adequacy requirements.”
|
|
(3)
|
Grupo Aval figures reflect aggregated regulatory capital of our banking subsidiaries.
|
|
(4)
|
Information for BBVA Colombia is based on unconsolidated figures.
|
Capitalization ratios
The following table presents consolidated capitalization ratios for our Colombian banking subsidiaries, Grupo Aval and our principal competitors at December 31, 2014. For a description of capital adequacy ratios, including how such ratios are calculated under capital adequacy regulations, see “—Supervision and regulation—Capital adequacy requirements.”
| At December 31, 2014 | ||||||||||||||||||||||||||||||||||||
| Grupo Aval entities | ||||||||||||||||||||||||||||||||||||
| Colombian Banking GAAP | Banco de Bogotá | Banco de Occidente | Banco Popular | Banco AV Villas | Grupo Aval aggregate (1) | Grupo Aval consolidated | Bancolombia | Davivienda | BBVA Colombia | |||||||||||||||||||||||||||
|
(in percentages)
|
||||||||||||||||||||||||||||||||||||
|
Tangible equity ratio(2)
|
10.0 | 12.3 | 15.8 | 11.7 | 11.1 | 9.8 | 9.2 | 8.3 | 8.3 | |||||||||||||||||||||||||||
|
Tier 1 ratio(3)
|
8.0 | 8.9 | 10.5 | 11.6 | 8.6 | – | 7.7 | 6.2 | 7.2 | |||||||||||||||||||||||||||
|
Solvency ratio(4)
|
11.5 | 11.8 | 12.2 | 12.6 | 11.7 | – | 13.3 | 10.9 | 10.8 | |||||||||||||||||||||||||||
|
Source:
|
Company calculations for competitors based on each entity’s respective financial statements for the period indicated that are publicly available on their websites.
|
|
(1)
|
Reflects the summation of calculated amounts for each line item for each of our banking subsidiaries.
|
|
(2)
|
Tangible equity ratio is calculated as total shareholders’ equity plus minority interest minus goodwill, divided by total assets minus goodwill. See “—Selected financial and operating data—Non-GAAP measures reconciliation.”
|
|
(3)
|
Tier 1 ratio is calculated as primary capital divided by risk-weighted assets. Tier 1 ratio for BBVA Colombia is based on unconsolidated figures as consolidated figures are not publicly available.
|
|
(4)
|
Solvency ratio is calculated as technical capital divided by risk-weighted assets. For a definition of technical capital, see “—Supervision and regulation—Capital adequacy requirements.” The solvency ratio for Grupo Aval is calculated as the sum of technical capital of our banking subsidiaries on a consolidated basis divided by the sum of risk-weighted assets of our banking subsidiaries on a consolidated basis.
|
Operational efficiency
Efficiency ratio is calculated as operating expense minus depreciation and goodwill amortization divided by total operating income plus total net provisions.
The following table presents efficiency ratios for our banks, Grupo Aval, Bancolombia, Davivienda and BBVA Colombia for the periods indicated.
|
Year ended December 31,
|
||||||||||||
|
2014
|
2013
|
2012
|
||||||||||
|
Banco de Bogotá
|
49.7 | 49.0 | 49.6 | |||||||||
|
Banco de Occidente
|
45.1 | 45.6 | 43.5 | |||||||||
|
Banco Popular
|
53.3 | 53.1 | 51.5 | |||||||||
|
Banco AV Villas
|
53.6 | 51.6 | 55.8 | |||||||||
|
Grupo Aval
|
51.0 | 50.4 | 51.3 | |||||||||
|
Bancolombia
|
48.7 | 53.2 | 51.3 | |||||||||
|
Davivienda
|
53.7 | 53.1 | 49.1 | |||||||||
|
BBVA Colombia
|
45.3 | 45.1 | 48.3 | |||||||||
|
Source:
|
Company calculations based on each bank’s respective consolidated financial statements for the period indicated. Efficiency ratio is calculated as operating expenses less depreciation and goodwill amortization, divided by the sum of total operating income and total net provisions. See “Item 3. Key information—A. Selected financial and operating data—Non-GAAP measures reconciliation.”
|
Loan portfolio quality
We believe that the credit quality of our loan portfolio compares favorably with that of our principal competitor. The following table presents credit quality metrics for the loan portfolio of our banks and for Bancolombia at December 31, 2014 and 2013.
|
At December 31,
|
||||||||||||||||||||||||||||||||
|
Loans past due more than 30 days / gross loan portfolio
|
Loans rated C, D or E / gross loan portfolio
|
Gross provision expense / gross loan portfolio
(2)
|
Allowance / loans past due more than 30 days
|
|||||||||||||||||||||||||||||
|
2014
|
2013
|
2014
|
2013
|
2014
|
2013
|
2014
|
2013
|
|||||||||||||||||||||||||
|
(in percentages)
|
||||||||||||||||||||||||||||||||
|
Banco de Bogotá
|
2.4 | 2.3 | 4.4 | 3.9 | 2.3 | 2.4 | 107.9 | 123.3 | ||||||||||||||||||||||||
|
Banco de Occidente
|
3.0 | 2.4 | 4.0 | 3.2 | 3.8 | 3.7 | 123.0 | 146.9 | ||||||||||||||||||||||||
|
Banco Popular
|
2.1 | 2.1 | 2.6 | 2.5 | 2.2 | 2.9 | 159.9 | 176.1 | ||||||||||||||||||||||||
|
Banco AV Villas
|
3.8 | 3.8 | 3.3 | 3.2 | 4.6 | 5.0 | 117.8 | 118.2 | ||||||||||||||||||||||||
|
Grupo Aval aggregate (1)
|
2.6 | 2.4 | 4.0 | 3.5 | 2.7 | 2.9 | 117.1 | 133.3 | ||||||||||||||||||||||||
|
Bancolombia
|
2.9 | 2.9 | 4.0 | 4.1 | – | 3.0 | 154.5 | 156.5 | ||||||||||||||||||||||||
|
Source:
|
Company calculations based on publicly available consolidated financial statements of Grupo Aval and each bank for the periods indicated. Comparative data is not available for Davivienda and BBVA Colombia.
|
|
(1)
|
When calculated as net provision expense / gross loan portfolio, the ratios for the year ended December 31, 2014 would be 1.3% for Banco de Bogotá, 1.8% for Banco de Occidente, 0.6% for Banco Popular, 2.1% for Banco AV Villas and 1.4% for Grupo Aval.
|
|
(2)
|
When calculated as net provision expense / gross loan portfolio, the ratios for the year ended December 31, 2013 would be 1.3% for Banco de Bogotá, 1.7% for Banco de Occidente, 0.6% for Banco Popular, 2.2% for Banco AV Villas and 1.4% for Grupo Aval and 1.5% for Bancolombia.
|
Pension and severance fund management – Porvenir
Porvenir is the leading pension fund administrator in Colombia in terms of funds under management and has the largest share of earnings in the pension and severance fund management market in Colombia. Porvenir’s principal competitors are other pension fund administrators, including Protección, Colfondos and Skandia. On April 18, 2013, we acquired Horizonte, and on December 31, 2013, Horizonte was merged by absorption into Porvenir. Porvenir is the largest private pension fund administrator in Colombia in terms of funds under management as of December 31, 2014.
Porvenir also has the largest share of individual customers of mandatory pension funds and assets under management. It also has had a higher ROAE than the average of the AFPs in Colombia in 2012, 2013 and 2014.
The following table presents the market shares of the main market participants with respect to assets under management and individual customers of mandatory pension funds at December 31, 2014, and net income for the year ended December 31, 2014.
|
At and for the year ended December 31, 2014
|
||||||||||||||||
|
Porvenir
|
Protección
|
Colfondos
|
Skandia
|
|||||||||||||
|
(in percentages)
|
||||||||||||||||
|
Individual customers to pension funds:
|
||||||||||||||||
|
Mandatory
|
53.9 | 31.3 | 14.0 | 0.8 | ||||||||||||
|
Severance
|
55.2 | 33.2 | 11.0 | 0.6 | ||||||||||||
|
Voluntary
|
30.3 | 48.3 | 7.5 | 13.9 | ||||||||||||
|
Funds under management:
|
||||||||||||||||
|
Mandatory
|
44.2 | 36.4 | 13.9 | 5.4 | ||||||||||||
|
Severance
|
49.7 | 37.7 | 10.3 | 2.3 | ||||||||||||
|
Voluntary
|
23.4 | 39.7 | 5.5 | 31.5 | ||||||||||||
|
Total
|
43.0 | 36.7 | 13.2 | 7.2 | ||||||||||||
|
Net income:
|
47.6 | 35.0 | 8.0 | 9.3 | ||||||||||||
|
Source:
|
Information published by the Superintendency of Finance. Information does not include data from third-party pension liability funds, which do not comprise a material portion of the market.
|
Merchant banking—Corficolombiana
Corficolombiana was the largest merchant bank in Colombia in terms of assets and equity at December 31, 2014. Corficolombiana faces competition from local and global banks focused on merchant and investment banking. Bancolombia, through its subsidiary Banca de Inversión Bancolombia S.A., is Corficolombiana’s largest local competitor. On an international level, Corficolombiana faces competition from global banks with local investment banking operations. In addition, as an equity investor, Corficolombiana faces competition from other equity investors such as hedge funds, private equity firms and others.
The following table presents the market shares of Corficolombiana and its principal competitors by assets, liabilities and equity at the dates indicated.
|
Assets
|
Liabilities
|
Equity
|
||||||||||||||||||||||||||||||||||
|
At December 31,
|
At December 31,
|
At December 31,
|
||||||||||||||||||||||||||||||||||
|
2014
|
2013
|
2012
|
2014
|
2013
|
2012
|
2014
|
2013
|
2012
|
||||||||||||||||||||||||||||
|
(in percentages)
|
||||||||||||||||||||||||||||||||||||
|
Corficolombiana
|
80.2 | 87.8 | 86.6 | 84.6 | 97.1 | 96.1 | 77.3 | 76.1 | 70.7 | |||||||||||||||||||||||||||
|
Banca de Inversión Bancolombia S.A.
|
5.4 | 4.0 | 4.2 | 0.3 | 0.1 | 0.3 | 8.8 | 8.9 | 10.7 | |||||||||||||||||||||||||||
|
J.P. Morgan Corporación Financiera S.A.
|
6.9 | 3.9 | 5.0 | 7.5 | 1.6 | 3.0 | 6.5 | 6.8 | 8.3 | |||||||||||||||||||||||||||
|
BNP Paribas Colombia Corporación Financiera S.A.(1)
|
3.6 | 1.0 | 0.9 | 6.5 | 0.3 | 0.2 | 1.7 | 1.9 | 2.2 | |||||||||||||||||||||||||||
|
Itaú BBA Colombia S.A.(2)
|
3.8 | 3.3 | 3.3 | 1.1 | 0.8 | 0.3 | 5.7 | 6.4 | 8.1 | |||||||||||||||||||||||||||
|
Source:
|
Information published by the Superintendency of Finance.
|
|
(1)
|
BNP Paribas Corporación Financiera S.A. was incorporated in 2011.
|
|
(2)
|
Itaú BBA Colombia S.A. was incorporated in 2012.
|
Colombian banking business overview
Our differentiated multi-brand business model builds on the individual strengths of our banks and the wide recognition of their brands. Each of our banks has developed over time a focus on particular and, to a degree, overlapping market sectors, geographic regions and services and products. As a group, we are present in all banking businesses in Colombia, as shown in the following chart.

Through the subsidiaries of our banks, we also offer fiduciary, bonded warehousing and brokerage transactions, and provide deposit and lending operations in foreign currencies. Through Corficolombiana, we operate as a merchant and investment bank, and, through Porvenir, we participate in pension and severance fund management.
Enterprise customers
Our banks provide services and products to public and private sector customers. Our banks segment their enterprise customers into separate categories based principally on their annual revenues. We believe that these customer classifications, which are specific to each bank, allow our entities to tailor their services and products to the needs of each customer classification sector.
At December 31, 2014, our banks had an aggregate of 269,500 enterprise customers, which may include customer overlap among our banks, a decrease of 12.2% over 306,800 enterprise customers at December 31, 2013. The decrease in enterprise customers was due to a change in the classification of customers in Banco de Bogotá and approximately 64,000 customers were reclassified from small business to individual customers.
The following table presents the number of enterprise customers that our banks served at the dates indicated.
|
Grupo Aval
|
||||||||||||||||||||
|
Banco de Bogotá
|
Banco de Occidente
|
Banco Popular
|
Banco AV Villas
|
Grupo Aval
aggregate
(1)
|
||||||||||||||||
|
(in thousands)
|
||||||||||||||||||||
|
Total enterprise customers, as of:
|
||||||||||||||||||||
|
December 31, 2014
|
163.4 | 71.2 | 7.9 | 27.0 | 269.5 | |||||||||||||||
|
December 31, 2013
|
206.0 | 67.2 | 8.3 | 25.3 | 306.8 | |||||||||||||||
|
(1)
|
Reflects aggregated amounts of our banking subsidiaries.
|
Individual customers
Our banks provide services and products to individuals throughout Colombia. Our banks classify their individual banking customers into separate categories based principally on income.
At December 31, 2014, our banks had a total of approximately 9,471,200 individual customers, an increase of 14.0% over approximately 8,308,000 individual customers at December 31, 2013. Customers of more than one of our banking subsidiaries are counted separately for each banking subsidiary. The increase in individual customers was due to a change in the classification of customers in Banco de Bogotá and approximately 64,000 customers were reclassified from small business to individual customers.
The following table presents the number of individual customers that our banks served at the dates indicated.
|
Grupo Aval
|
||||||||||||||||||||
|
Banco de Bogotá
|
Banco de Occidente
|
Banco Popular
|
Banco AV Villas
|
Grupo Aval
aggregate
(1)
|
||||||||||||||||
|
(in thousands)
|
||||||||||||||||||||
|
Total individual customers, as of:
|
||||||||||||||||||||
|
December 31, 2014
|
4,783.6 | 571.7 | 2,806.2 | 1,309.7 | 9,471.2 | |||||||||||||||
|
December 31, 2013
|
3,888.6 | 504.9 | 2,667.5 | 1,247.0 | 8,308.0 | |||||||||||||||
|
(1)
|
Reflects aggregated amounts of our banking subsidiaries.
|
Lending activities
In accordance with Superintendency of Finance guidelines, we classify our banks’ loans into the following categories: commercial, consumer, microcredit, mortgages and financial leasing.
The following table presents our loan portfolio at December 31, 2014.
|
At December 31, 2014
|
||||||||||||||||||||||||
|
Grupo Aval entities
|
||||||||||||||||||||||||
|
Banco de
Bogotá(4)
|
Banco de Occidente
|
Banco Popular
|
Banco AV Villas
|
Grupo Aval
aggregate
(2)
|
Grupo Aval
consolidated
(3)(4)
|
|||||||||||||||||||
|
(in Ps billions)
|
||||||||||||||||||||||||
|
Commercial
|
42,837.9 | 11,491.1 | 5,853.6 | 2,599.7 | 62,782.3 | 62,764.8 | ||||||||||||||||||
|
Consumer
|
17,863.0 | 5,278.7 | 6,782.7 | 3,241.9 | 33,166.4 | 33,166.4 | ||||||||||||||||||
|
Microcredit(1)
|
333.4 | – | 12.2 | 6.2 | 351.8 | 351.8 | ||||||||||||||||||
|
Mortgages
|
7,411.8 | 134.3 | 189.7 | 1,298.9 | 9,034.7 | 9,034.7 | ||||||||||||||||||
|
Financial leasing
|
2,894.4 | 4,325.1 | 233.9 | – | 7,453.4 | 7,438.4 | ||||||||||||||||||
|
Total
|
71,340.5 | 21,229.3 | 13,072.0 | 7,146.8 | 112,788.6 | 112,756.1 | ||||||||||||||||||
|
(1)
|
Microcredit loans are issued for the purpose of encouraging the activities of small businesses and are subject to the following requirements: the maximum amount to be lent is equal to 25 times the minimum wage (
salario mínimo mensual legal vigente
) without the balance of one single borrower exceeding such amount at any time, and the main source of payment for the corresponding obligation shall be the revenues obtained from the activities of the borrower’s micro business. The borrower’s outstanding indebtedness may not exceed 120 times the minimum wage.
|
|
(2)
|
Reflects aggregated amounts of our banking subsidiaries.
|
|
(3)
|
Includes eliminations for intercompany or intra-group operations between Grupo Aval subsidiaries.
|
|
(4)
|
Reflects Banco de Bogotá consolidated figures which include Central American operations and accounted for Ps 27,753.9 billion of the total loan portfolio (Ps 11,201.3 billion in commercial loans, Ps 9,900.1 billion in consumer loans, Ps 6,129.1 billion in mortgage loans and 523.4 billion in financial leases) at December 31, 2014.
|
As of December 31, 2014, the aggregate outstanding loans to our banks’ ten largest borrowers, our 11th to 50th largest borrowers and our 51st to 160th largest borrowers, represented 5.7%, 6.8% and 7.5%, respectively, of our consolidated total loan portfolio.
Commercial loans
Our commercial loan portfolio consists of general purpose loans (loans with a maturity of over one year), working capital loans (loans with a maturity of up to one year), loans funded by development banks, corporate credit cards and overdraft loans. Loans funded by development banks are loans granted to customers and focused on specific economic sectors and are funded by national or international government or government-related institutions.
The following table presents our commercial loan portfolio at December 31, 2014.
|
At December 31, 2014
|
||||||||||||||||||||||||
|
Grupo Aval entities
|
Grupo Aval
consolidated
(2)(3)
|
|||||||||||||||||||||||
|
Banco de
Bogotá(3)
|
Banco de Occidente
|
Banco Popular
|
Banco AV Villas
|
Grupo Aval
aggregate
(1)(3)
|
||||||||||||||||||||
|
(in Ps billions)
|
||||||||||||||||||||||||
|
General purpose loans
|
30,333.1 | 8,465.1 | 5,201.6 | 2,560.7 | 46,560.5 | 46,543.0 | ||||||||||||||||||
|
Loans funded by development banks
|
1,191.9 | 461.1 | 289.4 | 31.7 | 1,974.0 | 1,974.0 | ||||||||||||||||||
|
Working capital loans
|
10,685.5 | 2,428.9 | 353.9 | 0.2 | 13,468.6 | 13,468.6 | ||||||||||||||||||
|
Credit cards
|
302.5 | 74.9 | 2.7 | 1.3 | 381.4 | 381.4 | ||||||||||||||||||
|
Overdrafts
|
325.0 | 61.0 | 6.1 | 5.7 | 397.8 | 397.8 | ||||||||||||||||||
|
Total
|
42,837.9 | 11,491.1 | 5,853.6 | 2,599.7 | 62,782.3 | 62,764.8 | ||||||||||||||||||
|
(1)
|
Reflects aggregated amounts of our banking subsidiaries.
|
|
(2)
|
Includes eliminations for intercompany or intra-group operations between Grupo Aval subsidiaries.
|
|
(3)
|
Reflects Banco de Bogotá consolidated figures which include Central American operations and accounted for Ps 11,201.3 billion of commercial loans.
|
Consumer loans
Our consumer loan portfolio consists of personal loans, automobile and other vehicle loans, credit cards, overdrafts, loans funded by development banks and general purpose loans. Our personal loans consist primarily of payroll loans. A payroll loan is a short- or medium-term loan, where payments are deducted directly from an employer’s salary.
The following table presents our consumer loan portfolio at December 31, 2014.
|
At December 31, 2014
|
||||||||||||||||||||||||
|
Grupo Aval entities
|
Grupo Aval
consolidated
(2)(4)
|
|||||||||||||||||||||||
|
Banco de
Bogotá(4)
|
Banco de Occidente
|
Banco Popular
|
Banco AV Villas
|
Grupo Aval
aggregate
(1)(4)
|
||||||||||||||||||||
|
(in Ps billions)
|
||||||||||||||||||||||||
|
Personal loans
|
8,290.0 | 2,442.9 | 6,630.2 | 2,757.6 | 20,120.8 | 20,120.8 | ||||||||||||||||||
|
Automobile and other vehicle loans
|
2,292.2 | 1,678.2 | 18.9 | 66.9 | 4,056.2 | 4,056.2 | ||||||||||||||||||
|
Credit cards
|
7,212.0 | 994.0 | 127.3 | 415.7 | 8,749.0 | 8,749.0 | ||||||||||||||||||
|
Overdrafts
|
68.9 | 8.4 | 1.0 | 1.7 | 80.0 | 80.0 | ||||||||||||||||||
|
Loans funded by development banks
|
0.0 | 0.0 | 0.1 | 0.0 | 0.1 | 0.1 | ||||||||||||||||||
|
General purpose loans
|
0.0 | 155.2 | 5.2 | 0.0 | 160.4 | 160.4 | ||||||||||||||||||
|
Working capital loans
|
0.0 | 0.0 | 0.0 | 0.0 | – | 0.0 | ||||||||||||||||||
|
Total(3)
|
17,863.0 | 5,278.7 | 6,782.7 | 3,241.9 | 33,166.4 | 33,166.4 | ||||||||||||||||||
|
(1)
|
Reflects aggregated amounts of our banking subsidiaries.
|
|
(2)
|
Includes eliminations for intercompany or intra-group operations between Grupo Aval subsidiaries.
|
|
(3)
|
Includes microcredit loans.
|
|
(4)
|
Reflects Banco de Bogotá consolidated figures which include Central American operations and accounted for Ps 9,900.1 billion of consumer loans.
|
Mortgages
Banco AV Villas has been our principal provider of loans to customers for the purchase of real estate secured by mortgages, and Banco de Bogotá is increasing its presence in this business. We have implemented strict underwriting standards: we do not offer mortgage loans in amounts greater than 70% of the value of the property to be purchased, and all of our mortgage loans have maturities of between five and fifteen years. The average maturity at December 31, 2014 was 134 months. Borrowers must also meet certain minimum income levels, and payments may not exceed 30% of the borrower’s monthly income. As a result, our average loan-to-value ratio was 42.8% at December 31, 2014.
Financial leases
Pursuant to Law 1328 of 2009, also referred to as the “financial reform law,” commercial banks are permitted to offer leasing products. In 2010, to take advantage of our banks’ lower cost of funding, wider distribution network and centralized administration, we merged the majority of our leasing subsidiaries with our banks. Prior to 2010, our banks offered leasing products through independent subsidiaries.
The following table presents our leasing portfolio at December 31, 2014.
|
Grupo Aval entities
|
||||||||||||||||||||||||
|
Banco de Bogotá
|
Banco de Occidente
|
Banco Popular
|
Banco AV
Villas
|
Grupo Aval
Aggregate
(1)(3)
|
Grupo Aval
Consolidated
(2)(3)
|
|||||||||||||||||||
|
(in Ps billions)
|
||||||||||||||||||||||||
|
Commercial leases
|
2,785.7 | 4,315.4 | 228.9 | – | 7,329.9 | 7,315.0 | ||||||||||||||||||
|
Consumer leases
|
108.7 | 9.7 | 5.0 | – | 123.5 | 123.5 | ||||||||||||||||||
|
Total
|
2,894.4 | 4,325.1 | 233.9 | – | 7,453.4 | 7,438.4 | ||||||||||||||||||
|
(1)
|
Reflects aggregated amounts of our banking subsidiaries.
|
|
(2)
|
Includes eliminations for intercompany or intra-group operations between Grupo Aval subsidiaries.
|
|
(3)
|
Reflects Banco de Bogotá consolidated figures which include Central American operations and accounted for Ps 523.4 billion of financial leases.
|
Credit cards
We provide credit card services to our bank customers in Colombia through the Visa and MasterCard networks. The following table presents the number of active issued credit cards of our banks in Colombia at the dates indicated.
|
Active Issued Credit Cards
|
||||||||
|
Bank
|
December 31,
2014
|
December 31,
2013
|
||||||
|
Banco de Bogotá
|
898,595 | 839,332 | ||||||
|
Banco de Occidente
|
512,366 | 468,177 | ||||||
|
Banco Popular
|
81,367 | 69,357 | ||||||
|
Banco AV Villas
|
326,961 | 300,403 | ||||||
|
Total Colombian active issued credit cards(1)
|
1,819,289 | 1,677,269 | ||||||
|
(1)
|
BAC Credomatic had approximately 1,535,616 credit card accounts in Central America at December 31, 2014. See “—BAC Credomatic operations—Lending activities—Credit cards.”
|
Deposit-taking activities
Deposits
Our banks offer traditional deposit services and products, including checking accounts, savings accounts, time deposits and other deposits. Checking accounts typically bear very low or no interest. Checking accounts and savings accounts are payable on demand, although a significant portion of these accounts tend to be stable in amount over time. Time deposits typically have a maturity up to 12 months and earn interest at a fixed rate.
The following table presents our deposits by product type at the dates indicated.
|
At December 31,
|
||||||||||||||||||||||||||||||||||||||||||||||||
|
Banco de Bogotá
|
Banco de Occidente
|
Banco Popular
|
Banco AV Villas
|
Aggregate
(1)
|
Consolidated
(3)(4)
|
|||||||||||||||||||||||||||||||||||||||||||
|
2014
|
2013
|
2014
|
2013
|
2014
|
2013
|
2014
|
2013
|
2014
|
2013
|
2014
|
2013
|
|||||||||||||||||||||||||||||||||||||
|
(in Ps billions)
|
||||||||||||||||||||||||||||||||||||||||||||||||
|
Checking accounts
|
20,276.0 | 16,591.1 | 6,255.1 | 5,899.4 | 1,329.1 | 1,546.6 | 975.9 | 868.2 | 28,836.1 | 24,905.2 | 28,790.8 | 24,883.7 | ||||||||||||||||||||||||||||||||||||
|
Savings accounts
|
21,571.2 | 22,201.6 | 9,358.9 | 8,466.3 | 7,236.3 | 8,405.6 | 4,561.3 | 4,395.1 | 42,727.8 | 43,468.6 | 42,283.1 | 42,479.6 | ||||||||||||||||||||||||||||||||||||
|
Time deposits (CDs)
|
31,495.6 | 24,682.1 | 7,380.2 | 5,256.0 | 1,907.9 | 1,160.0 | 2,821.9 | 2,252.7 | 43,605.6 | 33,350.8 | 41,858.6 | 32,739.2 | ||||||||||||||||||||||||||||||||||||
|
Other deposits
|
960.0 | 619.0 | 329.8 | 278.1 | 88.6 | 105.0 | 81.7 | 86.1 | 1,460.0 | 1,088.2 | 1,459.8 | 1,087.9 | ||||||||||||||||||||||||||||||||||||
|
Total(2)
|
74,302.8 | 64,093.8 | 23,324.0 | 19,899.8 | 10,561.9 | 11,217.1 | 8,440.7 | 7,602.0 | 116,629.4 | 102,812.7 | 114,392.2 | 101,190.4 | ||||||||||||||||||||||||||||||||||||
|
(1)
|
Reflects aggregated amounts of our banking subsidiaries.
|
|
(2)
|
Interbank deposits have been excluded.
|
|
(3)
|
Includes eliminations for intercompany or intra-group operations between Grupo Aval subsidiaries.
|
|
(4)
|
Reflects Banco de Bogotá consolidated figures which include Central American operations and accounted for Ps 27,514.6 billion and Ps 21,198.2 billion of total deposits at December 31, 2014 and 2013, respectively.
|
Treasury operations
Our banks’ treasury departments are responsible for managing their proprietary trading activities, liquidity and distribution of treasury services and products to customers and are focused on fixed-income securities, foreign exchange transactions and derivatives. Our banks’ proprietary trading activities include fixed income trading, derivatives and foreign exchange operations. We do not have any proprietary trading activities in equities and each of our banks have implemented trading activities policies. Our banks also accept deposits from financial institutions as part of their treasury operations. These deposits are represented by certificates of interbank deposit, or “CDIs,” and earn interest at the interbank deposit rate. Banco de Bogotá and Banco de Occidente have active treasury operations, while Banco Popular and Banco AV Villas have smaller treasury operations.
Distribution
Our banks provide services and products to their customers through our network. Each of our banks manages its own distribution network. In 1998, we created the Red de Grupo Aval (Grupo Aval network) which allows customers of any of our banks to make transfers, payments and undertake other basic banking functions in the networks of our other banks, through traditional channels and electronic networks, with results posting in real time to the accountholder’s bank with no additional fees.
Red de Grupo Aval
(Grupo Aval network) services vary for each channel.
The following chart shows the distribution channels of our network in Colombia.
|
Distribution Channel
|
Description
|
|
|
Full-service branches
|
We had 1,418 full-service branches at December 31, 2014.
Red de Grupo Aval
(Grupo Aval network) service points across our banks allow our bank customers to perform check cashing, deposits, savings account withdrawals, loan and credit card payments, transfers and advances at any of our branches.
|
|
|
ATMs and electronic service points
|
We had 3,791 ATMs and 359 other electronic service points (non-cash dispensing teller machines) at December 31, 2014. Through our ATMs and electronic service points, all of our bank customers can, among other services, consult their balances, execute loan and credit card payments, transfers and advances, and pay for certain third-party services where we have a payment collection agreement in place (such as utility service companies).
|
|
|
Payment collection centers (
Centros de pagos)
|
We had 115 payment collection centers at December 31, 2014, which allow our customers to pay for certain third-party services where we have a payment collection agreement in place (such as utility service companies).
|
|
|
Banking correspondents (
Corresponsales bancarios
)
|
We had 33,708 banking correspondents at December 31, 2014. Our banks enter into agreements with various third parties, including convenience store owners, to provide all of our bank customers with certain services which can include checking and savings account withdrawals, account balance consultation, loan and credit card payments, transfers and advances, and payments for certain third-party services where we have a payment collection agreement in place with such third-party (such as utility service companies).
|
|
|
Automated telephone banking, mobile banking and online banking
|
Through our banks’ websites, mobile banking services and automated telephone banking, customers may pay loan and credit card balances, make transfers between accounts and make payments for collection agreements originated in any of our banks. In addition, for customers who have bank accounts with one or more of our banks, our website (www.grupoaval.com) allows for simultaneous consultation of balances and transactions from a single portal.
|
The following map presents our banks’ points of service across the principal regions of Colombia, at December 31, 2013 and 2014.

Source: Grupo Aval
|
Note:
|
Other points of service include banking correspondents including our Red Cerca operations, (
corresponsales
bancarios
) or “CBs,” electronic service points (
agilizadores electrónicos
) and payment collection centers (
centros de pago
). During 2013, Banco AV Villas closed 5,755 non-operational banking correspondents following a strategic optimization review to improve efficiencies. Since December 2013, Banco AV Villas has a new network of banking correspondents named “Full Carga” which can be located at drugstores, small neighborhood stores, cybercafés, among others. As of December 31, 2014, there were 8,420. At December 31, 2014, Banco de Bogotá and Banco de Occidente had opened 8,088 and 8,109 new banking correspondents through new banking contracts with Movil Red and Baloto, respectively.
|
The following table presents transaction volumes through our branches and ATMs at the dates indicated.
|
Transactions at
December 31,
|
% Total Transactions at
December 31,
|
|||||||||||||||
|
Grupo Aval
|
2014
|
2013
|
2014
|
2013
|
||||||||||||
|
(in thousands)
|
||||||||||||||||
|
Branches
|
301,700 | 268,728 | 34.4 | 34.5 | ||||||||||||
|
ATMs
|
170,890 | 142,425 | 19.5 | 18.3 | ||||||||||||
|
Other
|
59,967 | 61,296 | 6.8 | 7.9 | ||||||||||||
|
Total service points
|
532,557 | 472,450 | 60.7 | 60.6 | ||||||||||||
In addition, the following table presents transaction volumes for online banking, mobile banking and automated telephone banking channels which, pursuant to our growth strategy, are expected to grow on an annual basis relative to total transactions, at December 31, 2014 and 2013.
|
Transactions at
December 31,
|
% of Total Transactions at
December 31,
|
|||||||||||||||
|
Grupo Aval
|
2014
|
2013
|
2014
|
2013
|
||||||||||||
|
(in thousands)
|
||||||||||||||||
|
Online banking
|
330,852 | 293,593 | 37.7 | 37.7 | ||||||||||||
|
Mobile banking
|
4,074 | 2,624 | 0.5 | 0.3 | ||||||||||||
|
Automated telephone banking
|
9,869 | 10,893 | 1.1 | 1.4 | ||||||||||||
|
Total
|
344,796 | 307,110 | 39.3 | 39.4 | ||||||||||||
In 2014, a total of 35.7 million messages were sent through our mobile phone banking system, an increase of approximately 19.8% as compared to 29.8 million messages in 2013.
Our call centers provide our customers with assistance relating to bank services and products, information updates, service-related complaints, payment or account linkages, and credit card blockage. Our call centers are also used for telemarketing, collection of past-due loans and customer loyalty initiatives. In 2014, the number of inbound calls to our call centers was approximately 11.7 million and the number of outbound calls was approximately 26.3 million. In 2013, the number of inbound calls to our call centers was approximately 12.5 million and the number of outbound calls was approximately 24.5 million.
Banco de Bogotá
Banco de Bogotá is Colombia’s oldest financial institution and the largest bank in the country based on net income for the year ended December 31, 2014, and had a market share of 14.6% of deposits and 13.7% of loans at December 31, 2014.
At and for the year ended December 31, 2014, Banco de Bogotá had total assets of Ps 118,366.6 billion and net income of Ps 1,388.6 billion.
Banco de Bogotá is a full-service bank with nationwide coverage and a comprehensive portfolio of services and products, distributed through a network of 704 branches and 1,737 ATMs in Colombia at December 31, 2014. While Banco de Bogotá serves all market segments, it has a leading presence in commercial loans historically, with a particular focus on large corporations and a market share of 18.2% of commercial loans at December 31, 2014. Following its 2006 acquisition of Megabanco, Banco de Bogotá expanded its consumer banking business and now has a market share of 9.6% of consumer loans in Colombia as of December 31, 2014. Banco de Bogotá’s ROAE of 13.5% for the year ended December 31, 2014 and efficiency ratio of 49.7% for the year ended December 31, 2014 make it one of the most profitable and efficient banks in Colombia.
Ownership
The following table presents the share ownership structure of Banco de Bogotá at December 31, 2014.
|
Banco de Bogotá Ownership
|
||||
|
(in percentages)
|
||||
|
Grupo Aval
|
68.7 | |||
|
Mr. Sarmiento Angulo (additional beneficial ownership)
|
8.3 | |||
|
Subtotal
|
77.0 | |||
|
Other investors(1)
|
16.9 | |||
|
General public
|
6.1 | |||
|
Total
|
100.0 | |||
|
(1)
|
Based on publicly available information, we have identified a group of investors who have maintained ownership of record of at least one percent in Banco de Bogotá over a significant period of time.
|
History
Founded in 1870, Banco de Bogotá is the oldest and second largest financial institution in Colombia. In 1922, it opened its first branch outside of Bogotá. Throughout the 1920s, Banco de Bogotá’s network outside Bogotá
expanded, due in part to a series of acquisitions. In 1967, Banco de Bogotá opened its first office in Panamá; in 1974, it opened a branch office in New York City; and in 1977, it founded Banco de Bogotá Trust Company (subsequently sold). In 1980, Banco de Bogotá Trust Company established Banco de Bogotá International Corporation, an affiliate in Miami, Florida. The New York City branch office and the Miami affiliate were subsequently converted into agencies. Banco de Bogotá was reorganized in 1988 following the acquisition of a majority ownership interest by Mr. Sarmiento Angulo, Grupo Aval’s chairman and majority shareholder, earlier that year. Porvenir was formed in 1991 and began its operations as a severance fund manager. In 1992, Banco de Bogotá completed a merger with Bancomercio. In 1998, Mr. Sarmiento Angulo contributed a majority of his Banco de Bogotá ownership interest to Grupo Aval. In 2006, Banco de Bogotá acquired and merged with Megabanco, which expanded its services for lower income consumers. In May 2010, Banco de Bogotá completed the merger of its wholly-owned subsidiary, LB Panamá, which allows it to perform leasing operations. In December 2010, Banco de Bogotá acquired BAC Credomatic. In December 2011, Banco de Bogotá completed its first international bond offering raising U.S.$600 million (Ps 1,161.4 billion at the date of issuance). In February 2013, Banco de Bogotá completed its second international bond offering raising U.S.$500 million (Ps 892.7 at the date of the issuance) in subordinated notes.
On December 19, 2013, through LB Panamá, Banco de Bogotá acquired 98.92% of BBVA Panamá. On December 9, 2014 Banco BAC de Panamá´s operation was merged with BAC International Bank, Inc. As of November 30, 2014 Banco BAC de Panamá had total assets of U.S.$1,750.4 million, total net loans of U.S.$1,258.9 million and shareholder’s equity of U.S.$214.4 million.
On December 23, 2013, through Credomatic International Corporation (a subsidiary of BAC), Banco de Bogotá acquired 100% of Grupo Financiero Reformador de Guatemala (whose subsidiaries are Banco Reformador and Transcom Bank (Barbados) Limited). Grupo Reformador has 107 branches and 95 ATMs in Guatemala. Grupo Reformador had total assets of U.S.$1,514.4 million, total net loans of U.S.$993.2 million and shareholders’ equity of U.S.$173.4 million at December 31, 2014.
These acquisitions were funded through (i) an equity injection of U.S.$500 million from Banco de Bogotá to LB Panamá, (ii) a U.S.$282 million securitization of certain credit card inflows by BAC Credomatic due November 2020, and (iii) a short term loan of U.S.$250 million from Citibank N.A. expiring on November 29, 2014, which was replaced on April 16, 2014 with part of the net proceeds of a U.S.$350 million securitization of certain of BAC Credomatic’s credit card inflows, due October 2021.
The figures in the paragraph above are presented under U.S. GAAP.
On December 18, 2013 Banco de Bogotá issued 20,634,919 common shares equivalent to Ps 1,300.0 billion (U.S.$543.4 million), pursuant to a preemptive rights offering.
On December 31, 2013, Horizonte was merged with Porvenir which resulted in Porvenir becoming the largest Pension and Severance Fund Administrator in Colombia.
On November 12, 2014 Banco de Bogotá issued 23,809,523 common shares equivalent to Ps 1,500.0 billion (U.S.$627.0 million), pursuant to a preemptive rights offering.
Corficolombiana was founded in 1959 as an affiliate of Banco de Bogotá. Since 1997, it has acquired and merged with seven financial institutions in Colombia. In 2005, Corficolombiana completed its most recent merger, with Corfivalle, which resulted in Corficolombiana becoming the largest financial corporation in the country based on total assets. Following this merger, Corficolombiana transferred its loan portfolio to Banco de Bogotá to focus on its investment business.
Business overview and operations
In addition to deposits and loans, Banco de Bogotá offers its enterprise customers a broad range of services and products focused on cash management, collection solutions and payment solutions, namely tax and customs services, consignment services, online and bar code collection, web services, credit card collection, electronic collection, automatic debit, third-party electronic payments, programmed service payments, social security payments and prepaid cards. Banco de Bogotá also performs various services in connection with customers’ import/export activities, including general purpose loans, foreign exchange services, documentation services and guarantees. For
individual customers, it offers general purpose loans, auto financing, payroll loans, credit cards and different deposit and basic treasury products.
The following chart presents Banco de Bogotá’s principal subsidiaries as of December 31, 2014.

Source: Banco de Bogotá data at December 31, 2014.
|
(1)
|
The remaining shares of Casa de Bolsa are held 38.9% by Corficolombiana, 7.9% by Banco de Occidente, 25.8% by Banco Popular, 3.1% by other related individuals or entities and 1.5% by other shareholders.
|
|
(2)
|
The ownership in Porvenir includes the shares that Banco de Bogotá owns directly (36.5%) and indirectly through Fiduciaria Bogotá S.A., or “Fidubogotá,” a subsidiary of Banco de Bogotá (10.4%). The remaining shares of Porvenir are held by Grupo Aval (20.0%) and Banco de Occidente and its subsidiaries (33.1%).
|
|
(3)
|
The remaining shares of Corficolombiana are 9.3% owned by Grupo Aval, 10.3% by Grupo Aval entities, 3.4% by funds managed by Porvenir, 4.8% by other investors who have maintained ownership of record of at least one percent in Corficolombiana over a significant period of time, 33.7% by the general public, and 0.3% beneficially owned by Mr. Sarmiento Angulo.
|
|
(4)
|
On December 19, 2013, through LB Panamá, Banco de Bogotá acquired 98.92% of BBVA Panamá. On December 9, 2014 Banco BAC de Panamá´s operation was merged with BAC International Bank. On December 23, 2013, through Credomatic International Corporation (a subsidiary of BAC), Banco de Bogotá acquired 100% of Grupo Reformador.
|
Enterprise customers
Banco de Bogotá’s enterprise customers are classified as follows: very large corporations, with annual incomes in excess of Ps 50 billion; large corporations, with annual incomes of between Ps 8 billion and Ps 50 billion; public sector customers and cooperative institutions; small and medium size
enterprises, with revenues
of between Ps 0.5 billion and Ps 8 billion; and very small businesses, with revenues under Ps 0.5 billion. Banco de Bogotá’s primary focus is on very large corporations, large corporations, public sector customers and cooperative institutions, which represented 61.6% of its total loan portfolio at December 31, 2014 on an unconsolidated basis.
At December 31, 2014, Banco de Bogotá had a total of approximately 163,400 enterprise customers, a decrease of 20.7% over the approximately 206,000 enterprise customers at December 31, 2013 on an unconsolidated basis. The decrease in enterprise customers was due to a change in the classification of customers and approximately 64,000 customers were reclassified from small business to individual customers.
The following table presents the number of Banco de Bogotá’s enterprise customers at the dates indicated on an unconsolidated basis.
|
At December 31,
|
||||||||
|
2014
|
2013
|
|||||||
|
(in thousands)
|
||||||||
|
Very large corporations, large corporations and public sector customers and cooperative institutions
|
14.7 | 9.4 | ||||||
|
Small and medium size enterprises
|
29.2 | 28.6 | ||||||
|
Very small businesses
|
55.2 | 114.3 | ||||||
|
Other(1)
|
64.3 | 53.9 | ||||||
|
Total
|
163.4 | 206.0 | ||||||
|
(1)
|
Includes education institutes, civic associations, museums, sports leagues, religious institutions and others.
|
Individual customers
Banco de Bogotá’s individual customers are classified as follows: preferential customers, with annual incomes in excess of ten times the annual minimum wage of Ps 7,392,000; high net worth customers, with annual incomes of between six and ten times the minimum wage; individual customers, with annual incomes of between two and six times the minimum wage; and low-income customers, with annual incomes of under two times the minimum wage. Banco de Bogotá’s individual customer strategy is to focus on preferential customers, who represented 3.6% of the total customer base and 9.0% of its loan portfolio at December 31, 2014 on an unconsolidated basis.
At December 31, 2014, the bank had a total of approximately 4,783,600 individual customers, an increase of 23.0% over the approximately 3,888,600 individual customers at December 31, 2013 on an unconsolidated basis. The increase in individual customers was due to a change in the classification of customers and approximately 64,000 customers were reclassified from small business to individual customers.
|
2014
|
2013
|
|||||||
|
(in thousands)
|
||||||||
|
Preferential individual customers
|
179.6 | 154.0 | ||||||
|
Other individual customers
|
4,604.0 | 3,734.6 | ||||||
|
Total
|
4,783.6 | 3,888.6 | ||||||
Lending activities
The following table presents Banco de Bogotá’s loan portfolio at the dates indicated.
|
At December 31,
(1)
|
Change, December 31,
2014 vs.
December 31, 2013
|
|||||||||||||||
|
2014
|
2013
|
# |
%
|
|||||||||||||
|
(in Ps billions)
|
||||||||||||||||
|
Commercial
|
42,837.9 | 36,210.7 | 6,627.2 | 18.3 | ||||||||||||
|
Consumer
|
17,863.0 | 13,939.8 | 3,923.3 | 28.1 | ||||||||||||
|
Microcredit
|
333.4 | 316.3 | 17.1 | 5.4 | ||||||||||||
|
Mortgages
|
7,411.8 | 5,392.1 | 2,019.7 | 37.5 | ||||||||||||
|
Financial leases
|
2,894.4 | 2,362.9 | 531.4 | 22.5 | ||||||||||||
|
Total
|
71,340.5 | 58,221.8 | 13,118.7 | 22.5 | ||||||||||||
|
(1)
|
Reflects Banco de Bogotá consolidated figures which include Central American operations (BAC Credomatic, Grupo Reformador and Banco BAC de Panamá) which in 2013 accounted for Ps 20,654.2 billion of the total loan portfolio (Ps 8,512.3 billion in commercial loans, Ps 7,130.8 billion in consumer loans, Ps 4,640.2 billion in mortgage loans and Ps 370.8 billion in financial leases). As of December 31, 2014, Central American operations accounted for Ps 27,753.9 billion of the total loan portfolio (Ps 11,201.3 billion in commercial loans, Ps 9,900.1 billion in consumer loans, Ps 6,129.1 billion in mortgage loans and 523.4 billion in financial leases).
|
Commercial loans
Banco de Bogotá’s commercial loan portfolio consists of general purpose loans, loans funded by development banks, working capital loans, credit cards and overdrafts.
The following table presents Banco de Bogotá’s commercial loan portfolio at the dates indicated.
|
At December 31,
(1)
|
Change, December 31, 2014 vs. December 31, 2013
|
|||||||||||||||
|
2014
|
2013
|
# |
%
|
|||||||||||||
|
(in Ps billions)
|
||||||||||||||||
|
General purpose loans
|
30,333.1 | 24,666.1 | 5,667.0 | 23.0 | ||||||||||||
|
Loans funded by development banks
|
1,191.9 | 950.7 | 241.2 | 25.4 | ||||||||||||
|
Working capital loans
|
10,685.5 | 10,073.8 | 611.6 | 6.1 | ||||||||||||
|
Credit cards
|
302.5 | 240.4 | 62.1 | 25.8 | ||||||||||||
|
Overdrafts
|
325.0 | 279.7 | 45.3 | 16.2 | ||||||||||||
|
Total
|
42,837.9 | 36,210.7 | 6,627.2 | 18.3 | ||||||||||||
|
(1)
|
Reflects Banco de Bogotá consolidated figures which include Central American operations (BAC Credomatic, Grupo Reformador and Banco BAC de Panamá) which in 2013 accounted for Ps 8,512.3 billion in commercial loans. As of December 31, 2014, Central American operations accounted for Ps 11,201.3 billion.
|
Consumer loans
Banco de Bogotá’s consumer loan portfolio consists of personal loans, automobile and other vehicle loans, credit cards and overdrafts.
The following table presents Banco de Bogotá’s consumer loan portfolio at the dates indicated.
|
At December 31,
(1)
|
Change, December 31, 2014 vs. December 31, 2013
|
|||||||||||||||
|
2014
|
2013
|
# |
%
|
|||||||||||||
|
(in Ps billions)
|
||||||||||||||||
|
Credit cards
|
7,212.0 | 5,516.3 | 1,695.7 | 30.7 | ||||||||||||
|
Personal loans
|
8,290.0 | 6,630.6 | 1,659.5 | 25.0 | ||||||||||||
|
Automobile and other vehicle loans
|
2,292.2 | 1,734.3 | 557.8 | 32.2 | ||||||||||||
|
Overdrafts
|
68.9 | 58.6 | 10.3 | 17.5 | ||||||||||||
|
Working capital loans
|
0.0 | 0.0 | 0.0 | 0.0 | ||||||||||||
|
Total
|
17,863.0 | 13,939.8 | 3,923.3 | 28.1 | ||||||||||||
|
(1)
|
Reflects Banco de Bogotá consolidated figures which include Central American operations (BAC Credomatic, Grupo Reformador and Banco BAC de Panamá) which in 2013 accounted for Ps 7,130.8 billion in consumer loans. As of December 31, 2014, Central American operations accounted for Ps 9,900.1 billion.
|
Mortgage loans
Banco de Bogotá had Ps 7,411.8 billion and Ps 5,392.1 billion of mortgage loans at December 31, 2014 and December 31, 2013, respectively, on a consolidated basis.
Central American operations accounted for Ps 6,129.1 billion and Ps 4,640.2 billion of total mortgage loans at December 31, 2014 and December 31, 2013, respectively, while its Colombian operation accounted for Ps 1,282.7 billion and Ps 751.9 billion of total mortgage loans at December 31, 2014 and December 31, 2013, respectively.
Financial leases
Banco de Bogotá had Ps 2,894.4 billion and Ps 2,362.9 billion of financial leasing assets at December 31, 2014 and December 31, 2013, respectively, on a consolidated basis.
Leasing Corficolombiana, Corficolombiana’s leasing subsidiary, had Ps 513.1 billion and Ps 524.5 billion of financial leasing assets at December 31, 2014 and December 31, 2013, respectively and Ps 9.5 billion and Ps 14.4 billion of net income for the years ended December 31, 2014 and 2013, respectively. Corficolombiana is a subsidiary of Banco de Bogotá.
Deposit-taking activities
Banco de Bogotá offers customers checking accounts, savings accounts, time deposits (CDs) and other deposits as described in the table below.
The following table presents a breakdown of Banco de Bogotá’s deposits by product type at the dates indicated.
|
At December 31,
(1)
|
Change, December 31, 2014 vs. December 31, 2013
|
|||||||||||||||
|
2014
|
2013
|
# |
%
|
|||||||||||||
|
(in Ps billions)
|
||||||||||||||||
|
Checking accounts
|
20,276.0 | 16,591.1 | 3,684.9 | 22.2 | ||||||||||||
|
Savings accounts
|
21,571.2 | 22,201.6 | (630.3 | ) | (2.8 | ) | ||||||||||
|
Time deposits
|
31,495.6 | 24,682.1 | 6,813.5 | 27.6 | ||||||||||||
|
Other deposits
|
960.0 | 619.0 | 340.9 | 55.1 | ||||||||||||
|
Total
|
74,302.8 | 64,093.8 | 10,209.0 | 15.9 | ||||||||||||
|
(1)
|
Reflects Banco de Bogotá consolidated figures which include Central American operations (BAC Credomatic, Grupo Reformador and Banco BAC de Panamá) which in 2013 accounted for Ps 21,198.2 billion of total deposits. As of December 31, 2014, Central American operations accounted for Ps 27,514.6 billion.
|
Treasury operations
Banco de Bogotá’s treasury operations are focused on fixed-income securities, foreign exchange transactions and derivatives. Derivatives transactions include basic coverage such as forwards, options and swaps.
Since 2008, Banco de Bogotá is active in the Colombian futures market, with futures operations in securities and exchange rate indexes.
For additional information, see “Item 5. Operating and financial review and prospects—B. Liquidity and capital resources—Funding.”
Distribution
The following map presents Banco de Bogotá’s points of service across the principal regions of Colombia at December 31, 2013 and 2014.

Source: Banco de Bogotá Colombian operations.
|
Note:
|
Other points of service include CBs, electronic service points (
agilizadores electrónicos
) and collection centers (
centros de pago
). At December 31, 2014, Banco de Bogotá had opened 8,088 new banking correspondents through a new banking contract with Movil Red.
|
Banco de Bogotá has network concentration of approximately 64.2% in Colombia’s central region, of which Bogotá represents approximately 45.6%. Banco de Bogotá has market share of approximately 13.1% of branches and approximately 12.0% of ATMs at December 31, 2014.
The following table presents transaction volumes through Banco de Bogotá’s physical distribution channels in Colombia at the dates indicated.
|
Transactions at
December 31,
|
% of total transactions at
December 31,
|
|||||||||||||||
|
Banco de Bogotá
|
2014
|
2013
|
2014
|
2013
|
||||||||||||
|
(in thousands
)
|
||||||||||||||||
|
Branches
|
158,907 | 143,877 | 44.1 | 43.3 | ||||||||||||
|
ATMs
|
74,933 | 49,653 | 20.8 | 15.0 | ||||||||||||
|
Other
|
4,766 | 10,785 | 1.3 | 3.2 | ||||||||||||
|
Total
|
238,606 | 204,315 | 66.3 | 61.5 | ||||||||||||
The following table presents transaction volume for online banking, mobile banking and automated telephone banking channels in Colombia at the dates indicated.
|
Transactions at
December 31,
|
% of total transactions at
December 31,
|
|||||||||||||||
|
Banco de Bogotá
|
2014
|
2013
|
2014
|
2013
|
||||||||||||
|
(in thousands)
|
||||||||||||||||
|
Online banking
|
114,614 | 121,182 | 31.8 | 36.5 | ||||||||||||
|
Mobile banking
|
1,845 | 856 | 0.5 | 0.3 | ||||||||||||
|
Automated telephone banking
|
5,031 | 5,676 | 1.4 | 1.7 | ||||||||||||
|
Total
|
121,490 | 127,714 | 33.7 | 38.5 | ||||||||||||
Other services and products
In addition to the banking services and products offered pursuant to its strategy, Banco de Bogotá also offers the following other services and products:
|
|
·
|
fiduciary services including portfolio management, collateral and payment services for project finance, and real estate escrow services through its 95.0% direct ownership interest in Fidubogotá, the second largest fiduciary in Colombia as measured by net income and the second largest as measured by assets under management at December 31, 2014;
|
|
|
·
|
merchandise storage and deposit, customs agency, cargo management and merchandise distribution, through its subsidiary Almaviva;
|
|
|
·
|
brokerage services, fund management, portfolio management, securities management and capital markets consulting services through its 22.8% direct ownership interest in Casa de Bolsa;
|
|
|
·
|
pension fund administration through Porvenir, by which Banco de Bogotá is the most important pension fund administrator in Colombia, as measured by number of customers, assets under management, and net income at December 31, 2014;
|
|
|
·
|
Central American banking operations through BAC Credomatic; and
|
|
|
·
|
investment banking, treasury and private banking services through Corficolombiana, the largest merchant bank and financial corporation in Colombia as measured by assets. Private banking services have also been provided directly by Banco de Bogotá since 2003.
|
In 2009, through its bancassurance line, Banco de Bogotá began offering unemployment insurance for its loans, through which the insurer provides coverage for the first six months of missed payments. Since 2012, Banco de Bogotá began offering mortgage loans through its points of service in Colombia. Banco de Bogotá intends to expand its bancassurance offerings and mortgage loans over the next few years.
Banco de Occidente
Banco de Occidente is the fifth largest bank in Colombia, with market shares of 7.2% of deposits and 6.9% of loans at December 31, 2014.
Banco de Occidente focuses on enterprise customers, state-owned entities and retail customers and has a diversified revenue stream. For the year ended December 31, 2014, its loan portfolio was distributed as follows: approximately 26.2% in consumer and auto lending; approximately 54.0% in corporate and public sector lending; and approximately 19.8% in SMEs. Banco de Occidente had market shares of 6.7% of commercial loans and 6.3% of consumer loans at December 31, 2014.
Banco de Occidente has had an average market share of approximately 12.5% of checking accounts for the five-year period ended December 31, 2014. Additional areas of focus for future growth include low-risk consumer loan services and products such as payroll loans and loans to government agencies. Banco de Occidente’s ROAE was approximately 14.5% for the five-year period ended December 31, 2014.
Ownership
The following table presents the share ownership structure of Banco de Occidente at December 31, 2014.
|
Banco de Occidente Ownership
|
||||
|
(in percentages)
|
||||
|
Grupo Aval
|
72.2 | |||
|
Mr. Sarmiento Angulo (additional beneficial ownership)
|
13.3 | |||
|
Subtotal
|
85.5 | |||
|
Other investors(1)
|
5.9 | |||
|
General public
|
8.6 | |||
|
Total
|
100.0 | |||
|
(1)
|
Based on publicly available information, we have identified a group of investors who have maintained ownership of record of at least one percent in Banco de Occidente over a significant period of time.
|
History
Founded in 1965 in Cali, Colombia, Banco de Occidente was acquired by Mr. Sarmiento Angulo in 1971. In 1976, Banco de Occidente launched the “Credencial” credit card, which was initially conceived and operated as an independent credit card system but which now operates under the Visa and MasterCard franchises.
Banco de Occidente (Panamá) was established in 1982. Fiduciaria de Occidente was founded in 1991 and provides financial services focused in the southwest of Colombia. Banco de Occidente acquired and merged Banco Aliadas and Banco Unión into its operations in 2005 and 2006, seeking to strengthen its automobile finance and high-end consumer loan business, as well as to expand to other regions of Colombia.
Through open market transactions, our direct ownership in Banco de Occidente increased to 72.2% at December 31, 2014, compared to 68.2% at December 31, 2012.
Business overview and operations
Banco de Occidente offers a comprehensive services and product portfolio, including a broad range of loan and leasing services and products, including auto financing. It serves enterprise customers with a focus on large- and medium-sized companies, and consumers with medium- to high-income levels. Banco de Occidente also offers its customers an extensive range of services focused on collection and payment solutions, such as: tax payment and customs services, consignment services, online and bar code collection, web services, credit card collection, electronic collection, automatic debit, third-party electronic payments, programmed service payments, social security payments and prepaid cards. Banco de Occidente also performs various services in connection with customers’ import/export activities, including foreign exchange services, documentation services and guarantees.
The following chart presents Banco de Occidente’s principal subsidiaries at December 31, 2014.

Source: Company data at December 31, 2014.
|
(1)
|
Remaining shares not held by Banco de Occidente are held 35.0% by Fiduciaria de Occidente and 19.9% by Corficolombiana.
|
Enterprise customers
Banco de Occidente’s enterprise customers are classified as follows: very large corporations, with annual incomes in excess of Ps 250 billion; large corporations, with annual incomes of between Ps 20 billion and Ps 250 billion; small businesses, with annual incomes of between Ps 0.7 billion and Ps 20 billion; and public sector institutions. Banco de Occidente’s focus is on very large and large corporations, which represented approximately 50.5% of its loan portfolio at December 31, 2014.
At December 31, 2014, Banco de Occidente had approximately 71,200 enterprise customers, an increase of approximately 6.0% over the approximately 67,200 enterprise customers at December 31, 2013.
The following table presents Banco de Occidente’s enterprise customers at the dates indicated.
|
At December 31,
|
||||||||
|
2014
|
2013
|
|||||||
|
(in thousands)
|
||||||||
|
Very large corporations
|
1.9 | 2.6 | ||||||
|
Large corporations
|
19.2 | 18.3 | ||||||
|
Small businesses
|
48.3 | 44.8 | ||||||
|
Public sector institutions
|
1.7 | 1.4 | ||||||
|
Total
|
71.2 | 67.2 | ||||||
Individual customers
Banco de Occidente’s individual customers are classified as follows: preferential customers, with annual income in excess of 43 times the annual minimum wage of Ps 7,732,200; high net worth individuals, with annual income of between 5.6 and 43 times the annual minimum wage; mass-market and microfinance individuals, with annual income of between 1.0 and 5.6 times the annual minimum wage; and microfinance businesses, with annual incomes of under Ps 0.5 billion. Banco de Occidente’s individual customer strategy is to focus on high net worth individuals.
At December 31, 2014, Banco de Occidente had a total of approximately 571,700 individual customers, an increase of approximately 13.2% over the approximately 504,900 individual customers at December 31, 2013.
The following table presents the number of individual customers that Banco de Occidente served at the dates indicated.
|
At December 31,
|
||||||||
|
2014
|
2013
|
|||||||
|
Preferential customers
|
5.2 | 4.3 | ||||||
|
High net worth individuals
|
146.0 | 133.7 | ||||||
|
Mass-market, microfinance individuals and microfinance businesses
|
420.5 | 366.9 | ||||||
|
Total
|
571.7 | 504.9 | ||||||
Lending activities
The following table presents Banco de Occidente’s loan portfolio at the dates indicated.
|
At December 31,
|
Change, December 31, 2014 vs. December 31, 2013
|
|||||||||||||||
|
2014
|
2013
|
# |
%
|
|||||||||||||
|
(in Ps billions)
|
||||||||||||||||
|
Commercial
|
11,491.1 | 10,904.9 | 586.2 | 5.4 | ||||||||||||
|
Consumer
|
5,278.7 | 4,327.1 | 951.6 | 22.0 | ||||||||||||
|
Microcredit
|
– | – | – | – | ||||||||||||
|
Mortgages
|
134.3 | 32.1 | 102.1 | 317.8 | ||||||||||||
|
Financial leases
|
4,325.1 | 4,383.5 | (58.4 | ) | (1.3 | ) | ||||||||||
|
Total
|
21,229.3 | 19,647.7 | 1,581.6 | 8.0 | ||||||||||||
Commercial loans
Banco de Occidente’s commercial loan portfolio consists of general purpose loans, loans funded by development banks, working capital loans, credit cards and overdrafts.
The following table presents Banco de Occidente’s commercial loan portfolio at the dates indicated.
|
At December 31,
|
Change, December 31, 2014 vs. December 31, 2013
|
|||||||||||||||
|
2014
|
2013
|
# |
%
|
|||||||||||||
|
(in Ps billions)
|
||||||||||||||||
|
General purpose loans
|
8,465.1 | 7,863.4 | 601.7 | 7.7 | ||||||||||||
|
Loans funded by development banks
|
461.1 | 408.7 | 52.4 | 12.8 | ||||||||||||
|
Working capital loans
|
2,428.9 | 2,510.1 | (81.1 | ) | (3.2 | ) | ||||||||||
|
Credit cards
|
74.9 | 70.7 | 4.3 | 6.1 | ||||||||||||
|
Overdrafts
|
61.0 | 52.0 | 9.0 | 17.3 | ||||||||||||
|
Total
|
11,491.1 | 10,904.9 | 586.2 | 5.4 | ||||||||||||
Consumer loans
Banco de Occidente’s consumer loan portfolio consists of personal loans, automobile and other vehicle loans, credit cards, overdrafts, general purpose loans and other loans.
The following table presents Banco de Occidente’s consumer loan portfolio at the dates indicated.
|
At December 31,
|
Change, December 31, 2014 vs. December 31, 2013
|
|||||||||||||||
|
2014
|
2013
|
# |
%
|
|||||||||||||
|
(in Ps billions)
|
||||||||||||||||
|
Credit cards
|
994.0 | 815.0 | 179.0 | 22.0 | ||||||||||||
|
Personal loans
|
2,442.9 | 1,884.9 | 558.0 | 29.6 | ||||||||||||
|
Automobile and other vehicle loans
|
1,678.2 | 1,470.8 | 207.5 | 14.1 | ||||||||||||
|
Overdrafts
|
8.4 | 9.6 | (1.2 | ) | (12.5 | ) | ||||||||||
|
General purpose loans and other loans
|
155.2 | 146.8 | 8.4 | 5.7 | ||||||||||||
|
Total
|
5,278.7 | 4,327.1 | 951.6 | 22.0 | ||||||||||||
Financial leases
Leasing de Occidente S.A., which was formerly Banco de Occidente’s leasing subsidiary until June 2010 (when it was merged with Banco de Occidente), was the second largest leasing business in Colombia as measured by assets at the date of the merger.
To take advantage of Banco de Occidente’s lower cost of funding, wider distribution network and centralized administration, Leasing de Occidente was merged with Banco de Occidente, and Banco de Occidente now directly offers leasing products. Banco de Occidente had Ps 4,325.1 billion of financial leases at December 31, 2014, a decrease of 1.3% over the Ps 4,383.5 billion of loan leases at December 31, 2013.
Deposit-taking activities
Banco de Occidente has a relatively low cost of funds as a result of its relatively high proportion of deposits held in checking accounts. At December 31, 2014, 28.0% of Banco de Occidente’s deposits were held by customers in checking accounts, as compared to a national banking system average of approximately 17.5% at November 30, 2014.
Banco de Occidente offers checking accounts, savings accounts, time deposits and other deposits as described in the table below. The following table presents a breakdown of Banco de Occidente’s deposits by product type at the dates indicated.
|
At December 31,
|
Change, December 31, 2014 vs. December 31, 2013
|
|||||||||||||||
|
2014
|
2013
|
# |
%
|
|||||||||||||
|
(in Ps billions)
|
||||||||||||||||
|
Checking accounts
|
6,255.1 | 5,899.4 | 355.6 | 6.0 | ||||||||||||
|
Savings accounts
|
9,358.9 | 8,466.3 | 892.6 | 10.5 | ||||||||||||
|
Time deposits
|
7,380.2 | 5,256.0 | 2,124.2 | 40.4 | ||||||||||||
|
Other deposits(1)
|
329.8 | 278.1 | 51.7 | 18.6 | ||||||||||||
|
Total
|
23,324.0 | 19,899.8 | 3,424.1 | 17.2 | ||||||||||||
|
(1)
|
Includes active account portfolios, payroll accounts, funds held in trust, banks and correspondents, special deposits and temporary deposits held in connection with collection services agreements.
|
Treasury operations
Banco de Occidente’s treasury operations are focused on fixed-income securities, foreign exchange transactions and derivatives. With respect to its derivatives operations, Banco de Occidente mainly provides foreign exchange coverage to its customers and seeks interest rate and foreign exchange coverage for its own assets, especially strategic assets denominated in foreign currency and permanent investments in subsidiaries.
For additional information, see “Item 5. Operating and financial review and prospects—B. Liquidity and capital resources—Funding.”
Distribution
The following map presents Banco de Occidente’s points of service across the principal regions of Colombia, at December 31, 2013 and 2014.
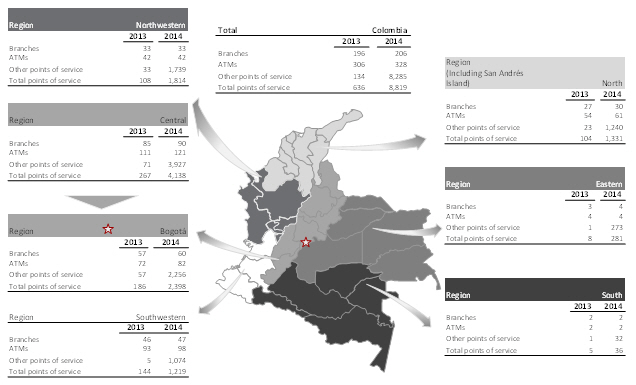
Source: Banco de Occidente
|
Note:
|
Other points of service include CBs, electronic service points (
agilizadores electrónicos
) and collection centers (
centros de pago
). At December 31, 2014, Banco de Occidente had opened 8,109 new banking correspondents through a new banking contract with Baloto.
|
Banco de Occidente had a network concentration of approximately 46.9% in Colombia’s central region and approximately 27.2% in Bogotá at December 31, 2014. Banco de Occidente is also active in the southwestern region of Colombia, in which approximately 13.8% of its distribution network is located. Banco de Occidente had approximately 3.8% market share of branches at December 31, 2014 and approximately 2.3% market share of ATMs at December 31, 2014.
The following table presents transaction volumes through Banco de Occidente’s physical distribution channels at the dates indicated.
|
Transactions at December 31
|
% of total transactions
at December 31,
|
|||||||||||||||
|
Banco de Occidente
|
2014
|
2013
|
2014
|
2013
|
||||||||||||
|
(in thousands)
|
||||||||||||||||
|
Branches
|
41,217 | 42,338 | 21.9 | 27.9 | ||||||||||||
|
ATMs
|
9,694 | 7,181 | 5.1 | 4.7 | ||||||||||||
|
Other
|
37,217 | 33,433 | 19.7 | 22.1 | ||||||||||||
|
Total
|
88,128 | 82,952 | 46.8 | 54.7 | ||||||||||||
The following table presents transaction volume for online banking, mobile banking and automated telephone banking channels at the dates indicated.
|
Transactions at December 31,
|
% of total transactions
at December 31,
|
|||||||||||||||
|
Banco de Occidente
|
2014
|
2013
|
2014
|
2013
|
||||||||||||
|
(in thousands)
|
||||||||||||||||
|
Online banking
|
97,848 | 66,269 | 51.9 | 43.7 | ||||||||||||
|
Mobile banking
|
575 | 220 | 0.3 | 0.1 | ||||||||||||
|
Automated telephone banking
|
1,912 | 2,127 | 1.0 | 1.4 | ||||||||||||
|
Total
|
100,335 | 68,616 | 53.2 | 45.3 | ||||||||||||
Other services and products
In addition to the banking services and products offered pursuant to its strategy, Banco de Occidente also offers the following services:
|
|
·
|
fiduciary services, including portfolio management, trust management and fiduciary guarantees through its 95% ownership interest in Fiduciaria de Occidente S.A., the fourth largest fiduciary in Colombia as measured by net income and the fifth largest measured by assets under management at December 31, 2014; and
|
|
|
·
|
deposits and loans in foreign currencies through its 95% ownership interest in Banco de Occidente (Panamá) and U.S. dollar and Euro deposits, loans and credit cards through Occidental Bank (Barbados) Limited.
|
In 2009, through its bancassurance line, Banco de Occidente began offering unemployment insurance for its loans, where the insurer provides coverage for the first six months of missed payments. In 2011, Banco de Occidente transformed the bancassurance line into a division entrusted with creating additional insurance options for the bank’s customers and developing a marketing strategy that uses diverse channels. The bank expanded its offering of unemployment insurance to other credit-related products, such as financing large vehicles and motorcycles. It also launched an individual insurance portfolio that includes coverage for certain cancers, other serious illnesses and personal accidents. The bank sells insurance products through its own sales force and telemarketing. Banco de Occidente intends to expand its bancassurance offerings through the “customer journey” strategy, which consists of delivering a personalized portfolio that complements the financial product offering with insurance products that target the customer’s specific insurance needs (for example, unemployment benefits, insurance for auto loans, and other such products).
Banco Popular
Banco Popular is the eighth largest bank in Colombia, with a market share of 3.7% of deposits and 4.3% of loans at December 31, 2014. Banco Popular operates primarily in the consumer and public sector businesses, with operations across all regions of Colombia. Banco Popular is a premier provider of financial solutions to government entities nationwide with a particular strength in public sector deposits and loans, and a significant part of its portfolio consists of payroll loans to public sector employees.
Banco Popular achieved improved returns on its consumer loan portfolio due to its access to payroll deductions for repayment of loans, which has resulted in consumer loans with a substantially lower-risk profile for consumer loans (consumer past-due loans of 2.5% compared to a banking system average of 4.3% at December 31, 2014). At December 31, 2014, Banco Popular had total assets of Ps 17,059.3 billion, 230 branches, and net income of Ps 365.7 billion for the year ended December 31, 2014.
Banco Popular’s focus on consumer loans and institutional customers generates a mix of broad and stable sources of revenues, which contributed to its status as one of the most profitable bank among our principal competitors in 2014, with an ROAE of 14.5%.
Banco Popular’s strategy for the future is based on four pillars: (1) preserve its participation in payroll loans; (2) diversify product offering; (3) further penetrating the medium-size business sector (companies with annual incomes
of between Ps 2 billion and Ps 40 billion); (4) maintaining dynamic credit origination with Grupo Aval’s other banking subsidiaries; and (5) continuing to optimize its funding sources, taking advantage of currently low interest rates and longer tenor for the issuance of bonds in Colombia. Banco Popular had issued mortgages in the past, but they represent less than 1% of Banco Popular’s loan book. Banco Popular does not target this segment actively.
Ownership
The following table presents the share ownership structure of Banco Popular at December 31, 2014.
|
Banco Popular Ownership
|
||||
|
(in percentages)
|
||||
|
Grupo Aval
|
93.7 | |||
|
Mr. Sarmiento Angulo (additional beneficial ownership)
|
0.8 | |||
|
Subtotal
|
94.5 | |||
|
Ownership by funds managed by Porvenir
|
1.2 | |||
|
Other investors and general public(1)
|
4.3 | |||
|
Total
|
100.0 | |||
|
(1)
|
Includes the remaining interest of the Colombian government following privatization.
|
History
Banco Popular was founded in 1950 as a government-owned entity. It was privatized in 1996 through the sale of approximately 82% of its stock to Popular Investment S.A., an entity beneficially owned by Mr. Sarmiento Angulo. Banco Popular was not integrated into Grupo Aval in 1998 because, among other reasons, at the time Banco Popular had not achieved the same standards of operation as the other Grupo Aval entities and because of contractual limitations set forth in the credit agreements used to finance the acquisition of Banco Popular.
Between 2005 and 2006, Grupo Aval acquired approximately 19% of the shares of Banco Popular through the Colombian Stock Exchange from entities beneficially owned by Mr. Sarmiento Angulo, and in 2006 we assumed control of Banco Popular through a shareholders’ agreement with the majority shareholder Rendifin S.A. (successor to Popular Investments S.A. and beneficially owned by Mr. Sarmiento Angulo). In 2008, Grupo Aval acquired an additional 12% interest in Banco Popular from the Colombian government and other official entities.
In 2011, Grupo Aval increased its ownership to 93.7% pursuant to two
escisiones
with Rendifin S.A., Popular Securities S.A. and Inversiones Escorial S.A., each of which is beneficially owned by Mr. Sarmiento Angulo.
Business overview and operations
Banco Popular is a consumer bank with a broad product portfolio, including a broad range of loan and leasing services and products aimed at specific customer sectors, as described below.
The following chart presents Banco Popular’s principal subsidiaries at December 31, 2014.

Source: Company data at December 31, 2014.
|
(1)
|
The remaining 28.9% shares of Alpopular are held by Corferias (an entity owned mainly by the Bogotá Chamber of Commerce).
|
Enterprise customers
Banco Popular’s enterprise customers are classified as follows: very large corporations, with incomes in excess of Ps 120 billion; large corporations, with revenues of between Ps 40 billion and Ps 120 billion; medium-size business customers, with revenues of between Ps 2 billion and Ps 40 billion; and public sector entities.
At December 31, 2014, Banco Popular had a total of approximately 7,900 corporate and public sector customers, a decrease of approximately 4.8% over approximately 8,300 corporate and public sector customers at December 31, 2013. The following table presents the number of Banco Popular’s enterprise customers at the dates indicated.
|
At December 31,
|
||||||||
|
2014
|
2013
|
|||||||
|
(in thousands)
|
||||||||
|
Very large corporations
|
0.8 | 0.8 | ||||||
|
Large corporations
|
0.7 | 0.6 | ||||||
|
Medium-size businesses
|
4.0 | 4.4 | ||||||
|
Public sector entities
|
1.2 | 1.3 | ||||||
|
Other
|
1.2 | 1.2 | ||||||
|
Total
|
7.9 | 8.3 | ||||||
Individual customers
Banco Popular classifies as individual mass-market customers all the individual or corporate customers with an income under Ps 2.0 billion. At December 31, 2014, approximately 50.5% of Banco Popular’s total loan portfolio consisted of payroll loans, which Banco Popular believes allow it to obtain higher returns with less risk of default.
At December 31, 2014, Banco Popular had a total of approximately 2,806,200 individual mass-market customers, an increase of approximately 5.2% over approximately 2,667,500 individual customers at December 31, 2013.
Lending activities
The following table presents Banco Popular’s loan portfolio at the dates indicated.
|
At December 31,
|
Change, December 31, 2014 vs. December 31, 2013
|
|||||||||||||||
|
2014
|
2013
|
# |
%
|
|||||||||||||
|
(in Ps billions)
|
||||||||||||||||
|
Commercial
|
5,853.6 | 5,201.9 | 651.7 | 12.5 | ||||||||||||
|
Consumer
|
6,782.7 | 6,509.1 | 273.5 | 4.2 | ||||||||||||
|
Microcredit
|
12.2 | 13.8 | (1.7 | ) | (12.1 | ) | ||||||||||
|
Mortgages
|
189.7 | 99.9 | 89.8 | 89.9 | ||||||||||||
|
Financial leases
|
233.9 | 266.0 | (32.1 | ) | (12.1 | ) | ||||||||||
|
Total
|
13,072.0 | 12,090.8 | 981.3 | 8.1 | ||||||||||||
Commercial loans
Banco Popular’s commercial loan portfolio consists of general purpose loans, loans funded by development banks, working capital loans, credit cards and overdrafts.
The following table presents Banco Popular’s commercial loan portfolio at the dates indicated.
|
At December 31,
|
Change December 31, 2014 vs. December 31, 2013
|
|||||||||||||||
|
2014
|
2013
|
# |
%
|
|||||||||||||
|
(in Ps billions)
|
||||||||||||||||
|
General purpose loans
|
5,201.6 | 4,528.9 | 672.7 | 14.9 | ||||||||||||
|
Loans funded by development banks
|
289.4 | 245.3 | 44.1 | 18.0 | ||||||||||||
|
Working capital loans
|
353.9 | 417.4 | (63.5 | ) | (15.2 | ) | ||||||||||
|
Credit cards
|
2.7 | 2.6 | 0.0 | 1.2 | ||||||||||||
|
Overdrafts
|
6.1 | 7.8 | (1.7 | ) | (21.8 | ) | ||||||||||
|
Total
|
5,853.6 | 5,201.9 | 651.6 | 12.5 | ||||||||||||
Consumer loans
Banco Popular’s consumer loan portfolio consists of personal loans, automobile and vehicle loans, credit cards, overdrafts and general purpose loans.
The following table presents Banco Popular’s consumer loan portfolio at the dates indicated.
|
At December 31,
|
Change, December 31, 2014 vs. December 31, 2013
|
|||||||||||||||
|
2014
|
2013
|
# |
%
|
|||||||||||||
|
(in Ps billions)
|
||||||||||||||||
|
Personal loans(1)
|
6,630.2 | 6,380.5 | 249.8 | 3.9 | ||||||||||||
|
Automobile and vehicle loans
|
18.9 | 24.2 | (5.3 | ) | (21.7 | ) | ||||||||||
|
Credit cards
|
127.3 | 98.3 | 29.0 | 29.5 | ||||||||||||
|
Overdrafts
|
1.0 | 1.2 | (0.2 | ) | (16.0 | ) | ||||||||||
|
General purpose loans
|
5.2 | 4.8 | 0.4 | 8.4 | ||||||||||||
|
Loans funded by development banks
|
0.1 | 0.2 | (0.2 | ) | (67.2 | ) | ||||||||||
|
Total
|
6,782.7 | 6,509.1 | 273.5 | 4.2 | ||||||||||||
|
(1)
|
Payroll loans represented 99.5% of personal loans at December 31, 2014.
|
Financial leases
Banco Popular had Ps 233,9 billion of financial leases at December 31, 2014.
Deposit-taking activities
Banco Popular generates a substantial portion of its deposits through agreements with customers pursuant to which they agree to maintain a certain level of deposits in checking and/or savings accounts in exchange for the performance of services, primarily payment and collection services. These deposits totaled Ps 5,690.2 billion, representing approximately 53.9% of total deposits, at December 31, 2014.
Banco Popular offers customers checking accounts, savings accounts and time deposits.
The following table presents a breakdown of Banco Popular’s deposits by product type at the dates indicated.
|
At December 31,
|
Change, December 31, 2014 vs. December 31, 2013
|
|||||||||||||||
|
2014
|
2013
|
# |
%
|
|||||||||||||
|
(in Ps billions)
|
||||||||||||||||
|
Checking accounts
|
1,329.1 | 1,546.6 | (217.4 | ) | (14.1 | ) | ||||||||||
|
Savings accounts
|
7,236.3 | 8,405.6 | (1,169.3 | ) | (13.9 | ) | ||||||||||
|
Time deposits
|
1,907.9 | 1,160.0 | 748.0 | 64.5 | ||||||||||||
|
Other deposits
|
88.6 | 105.0 | (16.4 | ) | (15.6 | ) | ||||||||||
|
Total
|
10,561.9 | 11,217.1 | (655.2 | ) | (5.8 | ) | ||||||||||
For additional information, see “Item 5. Operating and financial review and prospects—B. Liquidity and capital resources—Funding.”
Distribution
The following map presents Banco Popular’s points of service across the principal regions of Colombia at December 31, 2013 and 2014.

Source: Banco Popular
Note: Other points of service include CBs, electronic service points (
agilizadores electrónicos
) and collection centers (
centros de pago
).
Banco Popular had a network concentration of approximately 50.5% in Colombia’s central region and approximately 27.6% in Bogotá at December 31, 2014. Banco Popular had a market share of approximately 4.3% of branches and a market share of approximately 8.1% of ATMs at December 31, 2014.
The following table presents transaction volumes through Banco Popular’s physical distribution channels at the dates indicated.
|
Transactions at
December 31,
|
% of total transactions at
December 31,
|
|||||||||||||||
|
Banco Popular
|
2014
|
2013
|
2014
|
2013
|
||||||||||||
|
(in thousands)
|
||||||||||||||||
|
Branches
|
49,922 | 37,799 | 35.4 | 32.4 | ||||||||||||
|
ATMs
|
52,842 | 50,443 | 37.4 | 43.2 | ||||||||||||
|
Other
|
4,403 | 3,892 | 3.1 | 3.3 | ||||||||||||
|
Total
|
107,167 | 92,134 | 75.9 | 78.9 | ||||||||||||
The following table presents transaction volume for online banking and automated telephone banking channels at the dates indicated.
|
Transactions at
December 31,
|
% of total transactions at
December 31,
|
|||||||||||||||
|
Banco Popular
|
2014
|
2013
|
2014
|
2013
|
||||||||||||
|
(in thousands)
|
||||||||||||||||
|
Online banking
|
31,459 | 21,887 | 22.3 | 18.7 | ||||||||||||
|
Automated telephone banking
|
2,484 | 2,712 | 1.8 | 2.3 | ||||||||||||
|
Total
|
33,943 | 24,599 | 24.1 | 21.1 | ||||||||||||
Other services and products
In addition to the banking services and products offered pursuant to its strategy, Banco Popular also offers the following services and products:
|
|
·
|
fiduciary services, including portfolio management and trust management through its 94.9% ownership interest in Fiduciaria Popular S.A.;
|
|
|
·
|
merchandise and document storage and deposit, customs agency, cargo management, surety bond, merchandise distribution and other related services through its 71.1% ownership interest in Alpopular Almacén General de Depósito S.A.; and
|
|
|
·
|
collection, payment, consignment, investment and foreign exchange services.
|
In 2009, through its bancassurance line, Banco Popular began offering unemployment insurance for its loans, where the insurer provides coverage for the first six months of missed payments. Since 2012, Banco Popular expanded its insurance offerings to consumer loans and credit cards. Banco Popular intends to expand its bancassurance offerings over the next few years through the “customer journey” strategy, which consists of delivering a personalized portfolio that complements the financial product offering with insurance products that target the customer’s specific insurance needs (for example, unemployment benefits, auto insurance in auto loans, and other such products).
Banco AV Villas
Banco AV Villas has evolved from being a traditional mortgage lender to a diversified full-service consumer bank targeting middle- and low-income customers. It is our most active bank in usage of non-traditional distribution channels (mobile banking, banking correspondents and virtual branches). Banco AV Villas has a broad service network throughout central and northern Colombia, including Bogotá. Banco AV Villas had a market share of 3.0% of deposits, 2.3% of loans, 3.9% of consumer loans and 4.5% of mortgages at December 31, 2014.
At December 31, 2014, Banco AV Villas had total assets of Ps 10,971.0 billion and 278 bank branches. Net income was Ps 195.4 billion for the year ended December 31, 2014. Banco AV Villas’ ROAE was 15.9% for the year ended December 31, 2014. Banco AV Villas’ efficiency ratio was 53.6% for the year ended December 31, 2014.
In the consumer segment, Banco AV Villas focuses on high-margin services and products such as general purpose loans, payroll loans and credit cards, as well as its traditional line of mortgages. It serves customers through a recently expanded sales force and through its traditional retail network, entrepreneurial business centers and instant credit offices, known as “OCIs,” where credit applicants receive the outcome of their credit application within two hours. Banco AV Villas also seeks to continue to expand in the small and medium size corporate segment. In order to increase transaction volume through electronic channels and improve efficiency, Banco AV Villas has developed projects, such as the Nearby Network (Red Cerca), that will allow it to increase coverage by banking correspondents and offer a wide array of services to individuals and small and medium size businesses through its mobile banking platform.
Ownership
The following table presents the share ownership structure of Banco AV Villas at December 31, 2014.
|
Banco AV Villas ownership (includes common and preferred shares)
|
||||
|
(in percentages)
|
||||
|
Grupo Aval(1)
|
79.9 | |||
|
Mr. Sarmiento Angulo (additional beneficial ownership)
|
15.5 | |||
|
Subtotal
|
95.4 | |||
|
General public
|
4.6 | |||
|
Total
|
100.0 | |||
|
(1)
|
Includes 0.1% of preferred shares.
|
History
Corporación de Ahorro y Vivienda Las Villas (predecessor entity to Banco AV Villas) was established by Mr. Sarmiento Angulo in 1972 to finance real estate housing developments. Throughout the 1970s, 1980s and the first half of the 1990s, Corporación de Ahorro y Vivienda Las Villas was a major participant in the mortgage business, particularly in low-to-middle-income residential neighborhoods. This preeminence in the mortgage business led to the brand’s positioning and the high level of recognition that it still holds. In 2000, Corporación de Ahorro y Vivienda Las Villas was merged with Corporación de Ahorro y Vivienda Ahorramás, which Grupo Aval acquired in 1997, and in 2002 the merged entity was transformed into a bank under the name Banco AV Villas following a Ps 30.0 billion capital injection by Grupo Aval to weather the Colombian mortgage crisis of the late 1990s. Since that time, the bank’s business focus has been on commercial banking for individuals and small and medium size businesses as well as on a smaller mortgage business.
Business overview and operations
The following chart shows Banco AV Villas’ main equity investment at December 31, 2014.

Source: Company data at December 31, 2014.
|
(1)
|
The remaining 60% of A Toda Hora S.A. is owned by Banco de Bogotá, Banco de Occidente and Banco Popular.
|
A Toda Hora S.A., or “ATH,” is a wholly-owned indirect subsidiary of Grupo Aval and is the administrator of Grupo Aval’s ATMs and the transactional services that flow through the
Red de Grupo Aval
(Grupo Aval network), such as internet, e-banking, electronic service points and payment spots, in which Banco AV Villas has a 40% interest. At December 31, 2014, ATH managed approximately 68.0% of
Red de Grupo Aval’s
3,791 ATMs.
Enterprise customers
Banco AV Villas’ enterprise customers are classified as follows: enterprise customers, incomes of at least Ps 20 billion; government and institutional customers; small and medium size businesses, with revenues between Ps 1 billion and Ps 20 billion; micro-businesses, with revenues under Ps 1 billion; and mortgages.
At December 31, 2014, Banco AV Villas had a total of approximately 27,000 enterprise customers, an increase of 6.7% over the approximately 25,300 enterprise customers at December 31, 2013. Banco AV Villas’ focus is on micro-businesses and SME enterprise customers. The following table presents Banco AV Villas’ enterprise customers at the dates indicated.
|
At December 31,
|
||||||||
|
2014
|
2013
|
|||||||
|
(in thousands)
|
||||||||
|
Enterprise
|
1.0 | 1.0 | ||||||
|
Governmental and institutional
|
0.7 | 0.7 | ||||||
|
Small and medium size businesses
|
4.5 | 4.2 | ||||||
|
Micro-businesses
|
20.7 | 19.5 | ||||||
|
Other
|
0.0 | 0.1 | ||||||
|
Total
|
27.0 | 25.3 | ||||||
Individual customers
Banco AV Villas’ individual customers are classified as follows: preferential customers, with annual income in excess of six times the annual minimum wage, or Ps 7,732,000, and other individual customers, with annual incomes lower than six times the annual minimum wage. Individual customers represented approximately 6.1 % of Banco AV Villas’ loan portfolio at December 31, 2014. Approximately 21.9% of Banco AV Villas individual customer’s loan portfolio consists of payroll loans.
At December 31, 2014, Banco AV Villas had a total of approximately 1,309,700 individual customers, an increase of 5.0% over the approximately 1,247,000 individual customers at December 31, 2013. The following table presents the number of individual customers that Banco AV Villas served at the dates indicated.
|
At December 31,
|
||||||||
|
2014
|
2013
|
|||||||
|
(in thousands)
|
||||||||
|
Preferential customers
|
107.1 | 106.1 | ||||||
|
Other individual customers
|
1,202.6 | 1,140.9 | ||||||
|
Total
|
1,309.7 | 1,247.0 | ||||||
Lending activities
The following table presents Banco AV Villas’ loan portfolio at the dates indicated.
|
At December 31,
|
Change, December 31, 2014 vs. December 31, 2013
|
|||||||||||||||
|
2014
|
2013
|
# |
%
|
|||||||||||||
|
(in Ps billions)
|
||||||||||||||||
|
Commercial
|
2,599.7 | 2,555.0 | 44.7 | 1.7 | ||||||||||||
|
Consumer
|
3,241.9 | 3,025.2 | 216.7 | 7.2 | ||||||||||||
|
Microcredit
|
6.2 | 11.7 | (5.5 | ) | (46.9 | ) | ||||||||||
|
Mortgages
|
1,298.9 | 996.0 | 302.9 | 30.4 | ||||||||||||
|
Leasing
|
– | – | – | – | ||||||||||||
|
Total
|
7,146.8 | 6,588.0 | 558.8 | 8.5 | ||||||||||||
Commercial loans
Banco AV Villas’ commercial loan portfolio consists of general purpose loans, loans funded by development banks, credit cards and overdrafts.
The following table presents Banco AV Villas’ commercial loan portfolio at the dates indicated.
|
At December 31,
|
Change, December 31, 2014 vs. December 31, 2013
|
|||||||||||||||
|
2014
|
2013
|
# |
%
|
|||||||||||||
|
(in Ps billions)
|
||||||||||||||||
|
General purpose loans
|
2,560.7 | 2,491.4 | 69.3 | 2.8 | ||||||||||||
|
Loans funded by development banks
|
31.7 | 53.8 | (22.1 | ) | (41.1 | ) | ||||||||||
|
Credit cards
|
1.3 | 1.6 | (0.3 | ) | (16.8 | ) | ||||||||||
|
Overdrafts
|
5.7 | 8.2 | (2.4 | ) | (29.8 | ) | ||||||||||
|
Working capital loans
|
0.2 | – | 0.2 | – | ||||||||||||
|
Total
|
2,599.7 | 2,555.0 | 44.7 | 1.7 | ||||||||||||
Consumer loans
Banco AV Villas’ consumer loan portfolio consists of personal loans, credit cards and overdrafts.
The following table presents Banco AV Villas’ consumer loan portfolio at the dates indicated.
|
At December 31,
|
Change, December 31, 2014 vs. December 31, 2013
|
|||||||||||||||
|
2014
|
2013
|
# |
%
|
|||||||||||||
|
(in Ps billions)
|
||||||||||||||||
|
Personal loans
|
2,757.6 | 2,627.1 | 130.4 | 5.0 | ||||||||||||
|
Credit cards
|
415.7 | 368.3 | 47.4 | 12.9 | ||||||||||||
|
Automobile and vehicle loans
|
66.9 | 27.9 | 39.0 | 140.1 | ||||||||||||
|
Overdrafts
|
1.7 | 1.9 | (0.2 | ) | (9.9 | ) | ||||||||||
|
Total
|
3,241.9 | 3,025.2 | 216.7 | 7.2 | ||||||||||||
Mortgages
Banco AV Villas is the principal bank in Grupo Aval that currently offers mortgage loans with strict underwriting standards: Banco AV Villas does not offer mortgage loans in amounts greater than 70.0% of the value of the property to be purchased, and all of our mortgage loans have maturities of between 5 and 20 years. The average maturity at December 31, 2014 was 134 months. Borrowers must also meet certain minimum income levels, and payments may not exceed 30% of the borrower
’
s monthly income. As a result, its average loan-to-value ratio was 42.8% at December 31, 2014. Banco AV Villas
’
mortgage portfolio consisted of Ps 1,298.9 billion at December 31, 2014, a 30.4% increase from Ps 996.0 billion at December 31, 2013.
Deposit-taking activities
Banco AV Villas offers customers checking accounts, savings accounts, time deposits and other deposits consisting primarily of transactional accounts. Banco AV Villas’ average savings account rate, one of the lowest in the market, is explained by a significant retail network and a low concentration of corporate and government accounts. At December 31, 2014, the average savings account rate was 2.0% for Banco AV Villas and 2.6% for the market as a whole.
The following table presents a breakdown of Banco AV Villas’ deposits by product type at the dates indicated.
|
At December 31,
|
Change, December 31, 2014 vs. December 31, 2013
|
|||||||||||||||
|
2014
|
2013
|
# |
%
|
|||||||||||||
|
(in Ps billions)
|
||||||||||||||||
|
Checking accounts
|
975.9 | 868.2 | 107.8 | 12.4 | ||||||||||||
|
Savings accounts
|
4,561.3 | 4,395.1 | 166.2 | 3.8 | ||||||||||||
|
Time deposits
|
2,821.9 | 2,252.7 | 569.2 | 25.3 | ||||||||||||
|
Other deposits
|
81.6 | 86.1 | (4.4 | ) | (5.1 | ) | ||||||||||
|
Total
|
8,440.7 | 7,602.0 | 838.7 | 11.0 | ||||||||||||
For additional information, see “Item 5. Operating and financial review and prospects—B. Liquidity and capital resources—Funding.”
Distribution
The following map presents Banco AV Villas’ points of service across the principal regions of Colombia at December 31, 2013 and 2014.
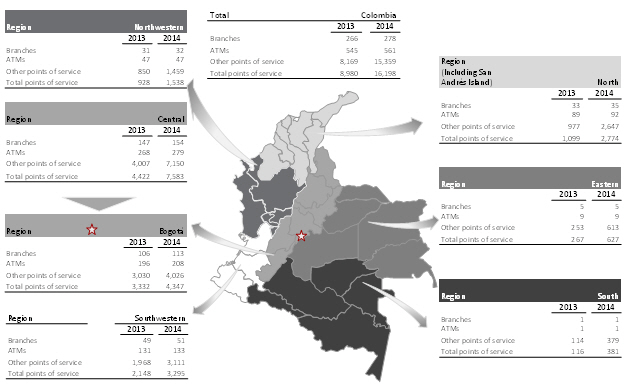
Source: Banco AV Villas.
Note: During 2013, Banco AV Villas closed 5,755 non-operational banking correspondents following a strategic optimization review to improve efficiencies. Since December 2013, Banco AV Villas has a new network of banking correspondents named “Full Carga” which can be located at drugstores, small neighborhood stores, cybercafés, among others. As of December 31, 2013, there were 549 and as of December 31, 2014, there were 8,420.
Banco AV Villas had a network concentration of approximately 46.8% in Colombia’s central region and approximately 26.8% in Bogotá at December 31, 2014. Banco AV Villas had approximately 20.3% of its network in the southwestern region at December 31, 2014. Banco AV Villas had a market share of approximately 5.2% of branches and a market share of approximately 3.9% of ATMs at December 31, 2014. The following table presents transaction volume through Banco AV Villas’ physical distribution channels at the dates indicated.
The following table presents transaction volume through Banco AV Villas’ physical distribution channels at the dates indicated.
|
Transactions
|
% of total transactions
|
|||||||||||||||
|
At December 31,
|
At December 31,
|
|||||||||||||||
|
Banco AV Villas
|
2014
|
2013
|
2014
|
2013
|
||||||||||||
|
(in thousands)
|
||||||||||||||||
|
Branches
|
51,654 | 44,714 | 27.5 | 24.9 | ||||||||||||
|
ATMs
|
33,420 | 35,149 | 17.8 | 19.6 | ||||||||||||
|
Other
|
13,581 | 13,186 | 7.2 | 7.4 | ||||||||||||
|
Total
|
98,655 | 93,049 | 52.6 | 51.9 | ||||||||||||
The following table presents transaction volume for online banking, mobile banking and automated telephone banking channels at the dates indicated.
|
Transactions
|
% of total transactions
|
|||||||||||||||
|
At December 31,
|
At December 31,
|
|||||||||||||||
|
Banco AV Villas
|
2014
|
2013
|
2014
|
2013
|
||||||||||||
|
(in thousands)
|
||||||||||||||||
|
Online banking
|
86,931 | 84,256 | 46.3 | 47.0 | ||||||||||||
|
Mobile banking
|
1,665 | 1,548 | 0.9 | 0.9 | ||||||||||||
|
Automated telephone banking
|
442 | 378 | 0.2 | 0.2 | ||||||||||||
|
Total
|
89,028 | 86,181 | 47.4 | 48.1 | ||||||||||||
Other services and products
In addition to the banking services and products offered pursuant to its strategy, Banco AV Villas offers payment and collection services, as well as foreign exchange services.
In 2009, through its bancassurance line, Banco AV Villas began offering unemployment insurance for its loans, where the insurer provides coverage for the first nine months of missed payments. In 2011, Banco AV Villas began marketing to its customers voluntary insurance related to credit and debit card risks. This insurance protects clients in many circumstances, such as fraud, theft, unauthorized payments, critical illness, accidental death and unemployment. Banco AV Villas’ strategy also includes the structuring of additional products aimed at insured customers such as the “customer journey” strategy, which consists of delivering a personalized portfolio that complements the financial product offering with insurance products that target the customer’s specific insurance needs (for example, unemployment benefits, auto insurance in auto loans, and other such products).
Porvenir
Porvenir is the leading private AFP in Colombia, with a market share of 53.9% of mandatory pension fund individual customers and 55.2% of severance plan individual customers at December 31, 2014. See “—Competition—Pension and severance fund management – Porvenir.” Porvenir also provides voluntary pension funds and manages third-party sponsored pension funds. Pension funds provide individual savings for retirement, and severance funds provide temporary income to employees who lose their jobs. Through Gestión & Contacto, Porvenir manages pension-related information systems designed to provide employees with efficient payment solutions.
At December 31, 2014, Porvenir had Ps 95.3 trillion in total assets under management, of which Ps 68.3 trillion was managed under the mandatory pension fund, Ps 3.8 trillion was managed under the severance fund, Ps 2.9 trillion was managed under the voluntary pension fund and Ps 20.3 trillion was managed as a third-party sponsored pension liability fund.
Porvenir had shareholders’ equity of Ps 1.3 trillion at December 31, 2014, and net income of Ps 282.3 billion for the year ended December 31, 2014. Since its inception, Porvenir has been the leader in the Colombian private pension and severance fund markets.
Porvenir’s strengths include the following:
|
|
·
|
Porvenir is the most profitable AFP in Colombia, with an ROAE of 23.4% and 20.9% at December 31, 2014 and December 31, 2013, respectively;
|
|
|
·
|
Porvenir has the largest and, we believe, most effective sales force in the industry with a nationwide presence. At the same time, it is the most efficient AFP in Colombia, with an efficiency ratio of 40.4% for the year ended December 31, 2014; and
|
|
|
·
|
Porvenir has access to Grupo Aval’s banking network. This advantage is particularly relevant in the severance market, as Grupo Aval’s banks provide financing to employers to comply with legally imposed annual severance allowance liabilities for their employees. In addition, the banks of Grupo Aval provide collection services for all of the funds administered by Porvenir.
|
On April 18, 2013, Porvenir, together with Grupo Aval and other Grupo Aval entities acquired Horizonte for U.S.$541.4 million (Ps 999.6 billion as of the date of the acquisition).
On December 31, 2013, a merger by absorption was completed between Horizonte and Porvenir, in which Porvenir acted as the absorbing entity.
Ownership
The following table presents the share ownership structure of Porvenir at December 31, 2014.
|
Porvenir ownership %
|
||||
|
Banco de Bogotá
|
36.5 | |||
|
Banco de Occidente
|
24.2 | |||
|
Grupo Aval
|
20.0 | |||
|
Fidubogotá(1)
|
10.4 | |||
|
Fiduciaria de Occidente(2)
|
8.9 | |||
|
Total
|
100.0 | |||
|
(1)
|
Fidubogotá is 95.0% owned by Banco de Bogotá. Of the remaining 5.0%, 3.6% is owned by Corporación Banco de Bogotá and 1.4% by Rendifin S.A., an affiliate of Mr. Sarmiento Angulo.
|
|
(2)
|
Fiduciaria de Occidente is 95.0% owned by Banco de Occidente. Of the remaining 5.0%, 4.4% is owned by Corficolombiana and 0.6% by Occidental Bank Barbados.
|
History
Porvenir was formed in 1991 and began its operations as a leading severance fund manager with nationwide operations. The pension fund system in Colombia has been historically administered by the Colombian Institute of Social Security (now Colpensiones) and was a government-sponsored defined public benefit plan. In 1993, however, a system of defined individual contributions was introduced, to be administered by private pension companies under the supervision of the Superintendency of Finance. In contrast to the “pay as you go” system, this new system was characterized by being funded by the savings of each individual customer. This system has grown significantly to become the principal pension fund system in Colombia. As a result of the market shift, private pension companies have become important participants in the local capital markets.
In 1994, Porvenir commenced operations under this new regime and rapidly became the leader in mandatory pension fund plans. At that time, Porvenir’s ownership was divided between Grupo Aval’s banks, which held a majority interest, and Provida, the largest AFP in Chile. In 2003, Porvenir founded an AFP in the Dominican Republic in association with local banks, which it sold in the same year to one of Provida’s related companies. At the same time Provida’s participation in Porvenir was bought by Grupo Aval entities.
In 2009, the regulatory system changed the mandatory pension system from a single fund for all affiliates to a multi-fund system (following examples in Chile, Mexico and Peru), which will continue to be implemented through 2012, allowing individuals to select from among funds with different risk profiles. This shift represented a milestone
in the Colombian pension fund industry and allows for more flexibility and greater opportunities for AFPs in Colombia.
On December 31, 2013, Porvenir completed the merger by absorption of Horizonte, a recently acquired pension and severance fund management business in Colombia. Horizonte, on a standalone basis, was the third largest operator in the market based on assets under management as of December 31, 2014.
The following chart shows Porvenir’s principal subsidiary at December 31, 2014.

Source: Company data at December 31, 2014.
Business overview
The Ministry of Finance limits the range of assets in which AFPs can invest and also sets concentration limits. In addition, each AFP is required by law to provide a minimum return on investment for each of its mandatory pension and severance funds. This minimum return is determined pursuant to certain formulas established by means of Decree 2555 of 2010, which vary pursuant to the type of fund. Prior to the multi-fund scheme, the minimum return was calculated on a 36-month time horizon for mandatory pension funds and 24-month time horizon for severance funds. With the introduction of the multi-fund scheme, a new risk profile system came into effect which differentiates conservative, moderate and aggressive risk portfolios for individual clients of severance and mandatory pension funds. To adjust the minimum return of mandatory pension funds to the new risk profile portfolios, the time horizon for the minimum return will change from 36 months to a range of 36 to 60 months, depending on the risk profile of each portfolio. For severance funds, the long-term portfolio will continue to have a 24-month time horizon, and the short-term portfolio will have a three-month time horizon.
If a fund’s cumulative return for any month is lower than the minimum return, the AFP must supplement the necessary amount to cover the difference within a period of five days. To do so, the AFP must first apply funds from its “stabilization reserve,” which is a portion of the AFP’s capital invested in the fund administered by the AFP and which must represent at least 1.00% of the value of that fund. If the stabilization reserve is insufficient to cover the difference, the AFP must provide resources from its remaining capital. If the AFP does not have enough resources to cover the difference, the Superintendency of Finance may order the capitalization of the AFP. If, notwithstanding the above, an AFP fails to observe either the minimum return or the stabilization requirements or the order of capitalization, the Superintendency of Finance may take possession (
tomar posesión
) of the AFP, in which case FOGAFIN, the Colombian deposit insurance fund, is required to supply funds to cover the shortfall. In that event, the AFP may be dissolved and the fund transferred to another AFP. See “Item 3. Key Information—D. Risk Factors—Risks relating to our businesses and industry—Risks relating to our pension and severance fund management business.”
For the year ended December 31, 2014, 64.4% of Porvenir’s revenues were derived from mandatory pension funds, 13.3% from severance funds, 7.4% from voluntary pension funds and 1.3% from third-party sponsored pension liability funds. Porvenir derived the remaining 13.6% of its revenues from a combination of its own investment portfolio, stabilization reserves and other income.
Mandatory pension funds
Mandatory pension funds are independent trusts formed by contributions made by individual customers to the social security pension system.
At December 31, 2014, mandatory pension funds represented 71.6% of Porvenir’s assets under management and constituted its main line of business.
Contributions to these pension funds are mandatory for all employees in Colombia and are jointly funded by the employer and the employee. The base contribution rate is 16.0% (up to 18.0% for employees meeting a certain salary threshold) of an employee’s base salary, whereby the employer contributes 75.0% and the employee 25.0% of the base contribution rate. Contributions are paid on a monthly basis. Of the 16.0%-18.0% total contribution, 11.5% goes to the individual customer’s fund. The AFP retains 300 basis points (3.0%) as compensation, of which Porvenir currently pays 185 basis points (1.85%) to an insurer for life and disability coverage, to which it is required by law to subscribe. The percentage that Porvenir pays for this insurance may increase or decrease depending on market conditions and other factors. The remainder is distributed between the National Solidarity Fund (
Fondo de Solidaridad Pensional
), depending on the employee’s salary (up to 2.0%), and the National Minimum Pension Warranty Fund (
Fondo de Garantía de Pensión Mínima
) (at 1.5%). The following chart presents this breakdown.
Breakdown of contributions for mandatory pension funds

|
(1)
|
Porvenir currently pays 1.85% of this 3.00% compensation for life and disability insurance coverage.
|
Porvenir earns revenues related only to an individual customer’s monthly contributions and does not charge a fee for the balance that is managed for its active customers. Inactive customers are charged a fee, calculated based on the monthly fund returns.
Employees may freely select their mandatory pension fund, a private AFP of their choice or the government-sponsored defined public benefit plan, administered by Colpensiones, and can change plans after meeting minimum tenure requirements of five years to switch from the public fund to a private plan, and six months to switch between private fund providers. Whenever an employee changes from one AFP to another, his/her entire savings balance at the fund is transferred to the pension fund administered by the new AFP.
Mandatory pension funds cannot be withdrawn prematurely, and they generally expand over the individual’s working years. Porvenir is the market leader in the mandatory pension’s area, with Ps 68.3 trillion of assets under management and 6.8 million individual customers at December 31, 2014. Since March 22, 2011, pension fund managers in Colombia must offer three types of mandatory funds under the new multi-fund regulatory system from which individual customers may choose. These funds are:
|
|
·
|
Conservative fund:
for individual customers with a low financial risk profile, or who are close to reaching retirement. The fund attempts to have the best possible return with low risk exposure. The maximum limit of equity securities is 20% of the fund’s value;
|
|
|
·
|
Moderate fund:
for individual customers with a medium financial risk profile, or in the middle of their working lives. The fund attempts to have the best possible return with a medium risk exposure. The maximum limit of equity securities is 45% of the fund’s value; and
|
|
|
·
|
Higher risk fund:
for individual customers with a high financial risk profile, or in the beginning of their working lives. The fund attempts to have the best possible return with higher risk exposure. The maximum limit of equity securities is 70% of the fund’s value.
|
Severance funds
Severance funds are independent trusts formed by the accumulated severance payment allowance required by Colombian labor law. The severance payment allowance is a social benefit inuring to employees for which employers are responsible under an employment agreement. The allowance consists of the payment of one month’s salary per year of service and pro rata amounts for fractions of a year. This amount is deposited directly with the AFP by the employer.
Severance accounts represented 3.9% of Porvenir’s assets under management at December 31, 2014.
Under Law 1328 of 2009, severance funds are divided into two portfolios, one for a long-term administration and a second for a short-term administration of the resources. Severance funds tend to be withdrawn fully over the 12 months following their deposit. Long-term growth comes from returns on these funds accumulated over the year. Porvenir and all other AFPs in Colombia charge a fee (per year for assets under management) of 1.0% for amounts in the mandatory investments short-term portfolio and 3.0% in the long-term portfolio. Until 2009, AFPs charged a flat fee of 4.0%. Employees may choose a different AFP to manage their severance fund payments from the AFP chosen to manage those of their mandatory pension fund.
Porvenir is the market leader in the severance area, with Ps 3.8 trillion of assets under management and 3.2 million customers at December 31, 2014.
Voluntary pension funds
Voluntary pension funds are independent trusts formed by contributions from their participants and/or sponsors and their respective yields, for the purposes of complying with one or several voluntary retirement or disability pension plans.
Voluntary pension funds represented 3.1% of Porvenir’s assets under management at December 31, 2014.
All contributors to voluntary pension funds can invest their funds in one or more portfolios with different objectives, durations and risk profiles.
Porvenir earns annual management commissions for assets under management that range between 1.0% and 4.0%, depending on the balance of the customer and the selected portfolios (lower commissions for liquidity portfolios and higher commissions for more complex portfolios). At December 31, 2014, Porvenir had Ps 2.9 trillion of voluntary pension assets under management and approximately 167 thousand voluntary pension fund individual customers.
Third-party sponsored pension liability funds
Third-party sponsored pension liability funds represent approximately 21.3% of Porvenir’s assets under management at December 31, 2014. Third-party sponsored pension liability funds are made up of deposits from different institutions (both private and publicly owned) that require a professional institution to manage a fund that is usually created to finance particular pension regimes (i.e., pensions that are paid by the employer; before 1994, companies were allowed to establish their own internal pension systems).
Third-party sponsored pension liability funds in some cases have a minimum guaranteed return pursuant to their terms. Porvenir had Ps 20.3 trillion of such assets under management at December 31, 2014, mostly under contracts of five years. The most important of these contracts is with FONPET which is subject to renewal upon expiration in November 2017. Porvenir retains a percentage of the yearly returns of each third-party sponsored pension liability fund, and in some cases, a portion of assets under management.
Porvenir’s investments
Porvenir is required to own at least 1.00% of the funds it manages that are subject to a minimum return, known as the stabilization reserve. This stabilization reserve represents 61.3% of Porvenir’s proprietary investments. In addition, Porvenir holds voluntary investments. Revenues related to Porvenir’s stabilization reserve and its proprietary portfolio represented 10.2% and 3.4% of the total revenues of the company at December 31, 2014 and December 31, 2013, respectively.
Distribution
Porvenir attracts new individual customers mainly through its large direct sales force (approximately 1,307 individuals) who report to six regional sales managers located in Bogotá, Antioquia, Cali, the Central region, the Coast region and the North region. At December 31, 2014, Porvenir has 54 offices, 16 service modules, 60 electronic service centers and 5 business service centers. It maintains a presence in all regions of Colombia through its service agreements with Grupo Aval’s banks.
Corficolombiana
Corficolombiana is the largest merchant bank in Colombia based on total assets at December 31, 2014. Corficolombiana focuses on four main lines of business: (1) equity investments in strategic sectors of the Colombian economy, including, in particular, financial services, infrastructure, energy and gas, agribusiness and hospitality; (2) investment banking, including services relating to capital markets, mergers and acquisitions and project finance transactions; (3) treasury operations; and (4) leasing, fiduciary and private banking.
Corficolombiana had total consolidated assets and shareholders’ equity of Ps 12,004.8 billion and Ps 4,533.2 billion, respectively, at December 31, 2014 and net income of Ps 420.9 billion for the year ended December 31, 2014.
The following table presents the share ownership structure of Corficolombiana at December 31, 2014.
|
(in percentages)
|
Corficolombiana ownership (includes common and preferred shares)
|
|||
|
Banco de Bogotá
|
38.2 | |||
|
Grupo Aval (1)
|
9.3 | |||
|
Banco Popular
|
5.7 | |||
|
Banco Occidente
|
4.6 | |||
|
Mr. Sarmiento Angulo (Additional beneficial ownership)
|
0.3 | |||
|
Subtotal
|
58.2 | |||
|
Ownership by funds managed by Porvenir
|
3.4 | |||
|
Other investors(2)
|
4.8 | |||
|
General public
|
33.7 | |||
|
Total
|
100.0 | |||
|
(1)
|
On December 17, 2014, Grupo Aval acquired from Banco de Occidente a 9.3% direct interest in Corficolombiana through the purchase of 20,008,260 common shares.
|
|
(2)
|
Based on publicly available information, we have identified a group of investors who have maintained positions of at least one percent in Corficolombiana over a significant period of time.
|
Corficolombiana’s business model is based on three premises: (1) investing in businesses in strategic sectors of the Colombian economy; (2) distributing cash flows generated by its equity investment portfolio to its shareholders; and (3) acting as an investment fund and financial advisor that is listed on the Colombian Stock Exchange and regulated by the Superintendency of Finance. Corficolombiana’s equity investment strategy is to acquire and hold majority or substantial stakes in strategic businesses. These investments enable Corficolombiana to exert significant influence or control over these businesses’ operations and to promote revenue growth, operational efficiencies and optimization of the capital structures. Corficolombiana endeavors to achieve a balance between companies with potential to generate cash and companies with capacity to create value.
Corficolombiana’s funding strategy seeks to minimize liquidity risk by funding equity investments using its own equity, principally retained earnings. It has not sought to raise equity capital from its shareholders in the last five years. Between January 1, 2009 and December 31, 2014, the book value of Corficolombiana’s equity investment portfolio increased by 187.3% (on a consolidated basis and 155.8% on an unconsolidated basis) and its shareholders’ equity increased by 127.5% (on a consolidated basis and 135.0% on an unconsolidated basis). At December 31, 2014, the gross book value of Corficolombiana’s investment portfolio before provisions totaled Ps 4.112,1 billion on a consolidated basis (and Ps 5.312,4 billion on an unconsolidated basis) and its shareholders’ equity totaled Ps 4.533,2 billion (on a consolidated basis).
Corficolombiana is regulated as a finance corporation by the Superintendency of Finance. Under Colombian law, a finance corporation is permitted to hold equity ownership positions in both financial and non-financial companies, unlike banks, which may only invest in financial companies. See “—Supervision and regulation.”
History
Corficolombiana was founded in 1959 as an affiliate of Banco de Bogotá. Since 1997, it has acquired and merged with seven financial institutions. In 2005, Corficolombiana completed its most recent merger, with Corfivalle S.A., which resulted in Corficolombiana becoming the largest merchant bank in the country.
Following this merger, Corficolombiana transferred its loan portfolio to Banco de Bogotá in order to focus on its merchant banking businesses.
Equity investment portfolio
Corficolombiana primarily invests in five sectors of the Colombian economy: infrastructure; energy and gas; financial services; hotels; and agribusiness. It generally seeks to invest in businesses with leading market positions, strong cash flows and growth potential.
The following charts provide information concerning Corficolombiana’s investments in sectors of the Colombian economy at December 31, 2014, and for the year ended December 31, 2014, as the case may be.
|
Sector breakdown by book value of
investments(1) at December 31, 2014
|
Sector breakdown by earnings(2)
for the year ended December 31, 2014
|
|

|
|
(1)
|
After provisions, fiduciary rights not included.
|
|
(2)
|
Corresponds to the sum of the net income of each of the investments, adjusted to reflect the ownership interest of Corficolombiana. Preliminary figures for certain companies.
|
Corficolombiana has a track record of growth in its equity investment portfolio as measured by its book value evolution. Future growth will depend, in large part, on the identification of new investments and growth in the economic sectors in which it invests. During 2014, Corficolombiana, either directly or through its affiliates, made at least one new investment in each of its key sectors except for financial services and believes that it will have opportunities for further investments in each such sector in the coming years.
Corficolombiana’s infrastructure investments are concentrated in highway concession projects, a sector in which it is a leading private investor in Colombia. Among other investments, it has controlling ownership positions in six highway concession projects, consisting of the 85.6 kilometer highway between Bogotá and Villavicencio, the 57.0 kilometer highway between Buga, Tuluá and La Paila (subsequently extended by 20.1 kilometers to La Victoria), the 111 kilometer highway between Los Alpes and Villeta, Chuguacal and Cambao, the 38.3 kilometer highway between Fontibón and Los Alpes and 2 projects awarded to Corficolombiana during 2014 (details below). Corficolombiana also has a noncontrolling interest of the 528 kilometer highway between Puerto Salgar and San Roque. On June 3, 2014, Corficolombiana, through its subsidiary Episol, was awarded the toll-road concession “Conexión Pacifico 1” by the National Infrastructure Agency (
Agencia Nacional de Infraestructura—ANI
) of the Colombian Government. This concession is part of the 4 G (“
Cuarta Generación
”) program led by the Colombian Government. Corficolombiana, through Episol, has a 60% share of the project. The toll-road concession involves the construction, operation and maintenance of a 53.8 kilometer double carriageway in the Antioquia Region, and it is the first part of the highway that will connect this zone of the country with the Colombian Pacific Coast. On December 5, 2014, Corficolombiana, through its subsidiary Episol, was awarded the toll-road concession “Mulaló-Loboguerrero” by the National Infrastructure Agency (
Agencia Nacional de Infraestructura—ANI
) of the Colombian Government. This concession is also part of the 4G (“
Cuarta Generación
”) program. Corficolombiana, through Episol, has a 60% share of the project. The toll-road concession involves the construction, operation and maintenance of a 31.8 kilometer single carriageway in the Valle del Cauca Region, and it is the part of the highway that connects this zone of the country with the Colombian Pacific Coast. Corficolombiana’s infrastructure investments totaled Ps 453.3 billion after provisions at December 31, 2014 (on an unconsolidated basis).
Corficolombiana’s main investments in the energy and gas sector include a minority stake in the second largest natural gas pipeline company in Colombia (Promigas), an electricity and gas conglomerate (Empresa de Energía de Bogotá, or “EEB”) and a majority stake in a gas distribution company in northern Peru (Gas Comprimido del Perú S.A. (Gascop)). Corficolombiana’s energy and gas investments totaled Ps 3,798.2 billion after provisions at December 31, 2014 (on an unconsolidated basis).
On February 10, 2011, Corficolombiana, EEB and two Colombian private investment funds purchased from AEI three special purpose vehicles located in the Cayman Islands (AEI Promigas Holdings Ltd., AEI Promigas Ltd. and AEI Promigas Investments Ltd.), which together held a 52.13% stake in Promigas.
Corficolombiana acquired 20.3% of the special purpose vehicles. Corficolombiana and Porvenir, together with Corredores Asociados, an independent brokerage firm in Colombia, were also the investors in one of the private investment funds that participated in the transaction. Such private investment fund, which is independently directed by Corredores Asociados, acquired 47.9% of the special purpose vehicles.
The total purchase price of this transaction was U.S.$792.8 million (Ps 1,499.6 billion at the date of the transaction). Corficolombiana and Porvenir invested U.S.$388.7 million (Ps 735.2 billion at the date of the transaction) and U.S.$151.6 million (Ps 286.8 billion at the date of the transaction) in this transaction, respectively. Upon completion of the transaction, Corficolombiana had a 24.9% direct and indirect economic interest in Promigas. In addition, Corficolombiana and Porvenir together had a further 24.9% economic exposure to Promigas as a result of their respective holdings in the private investment fund.
During 2012, Corficolombiana took the following steps to restructure its ownership in, and increase its participation in the outstanding share capital of Promigas:
On June 5, 2012, the 10.58% indirect economic interest held by Corficolombiana in Promigas was transferred to CFC Limited, a wholly-owned subsidiary of Corficolombiana through an
escisión
. Following that step, CFC Limited merged with CFC Gas Holding SAS, a Colombian wholly-owned subsidiary of Corficolombiana.
On July 31, 2012, Corficolombiana launched a tender offer (
oferta pública de adquisición
) for the purchase of up to 75.03%, or 99,726,875, of outstanding common shares in Promigas at a purchase price of Ps 25,000 per share. The tender offer closed on September 12, 2012 with the purchase of 1,281,993 shares for a total consideration of Ps 32.0 billion.
On November 9, 2012, Corficolombiana launched a second tender offer (
oferta pública de adquisición
) for the purchase of up to 20%, or 26,582,956, of outstanding common shares in Promigas at a purchase price of Ps 25,500 per share. The tender offer closed on November 23, 2012 with the purchase of 24,886,569 shares for a total consideration of Ps 634.6 billion.
Corficolombiana’s principal investments in agribusiness are centered on forestry and woodworking as well as the production of palm oil, rubber, rice and cotton. These investments include a controlling stake in Organización Pajonales and minority stakes in Pizano and Unipalma. Investments in this sector totaled Ps 443.9 billion after provisions at December 31, 2014 (on an unconsolidated basis).
Corficolombiana also has investments in the hospitality sector. These include majority stakes in Hoteles Estelar de Colombia S.A. and Promotora y Comercializadora Turística Santamar S.A., which totaled Ps 246.5 billion after provisions at December 31, 2014 (on an unconsolidated basis).
In the financial-services sector, Corficolombiana offers leasing, trust, brokerage and offshore banking services to third-party customers through three subsidiaries: Leasing Corficolombiana S.A., Fiduciaria Corficolombiana S.A. and Banco Corficolombiana (Panamá) S.A. Corficolombiana’s investments in these three subsidiaries totaled Ps 192.0 billion at December 31, 2014 (on an unconsolidated basis and after provisions).
Investment banking, treasury and private banking businesses
Corficolombiana’s investment banking group provides advice to third-party clients in the Colombian market covering a broad range of transactions, including, among others, capital markets, mergers and acquisitions, project finance and private banking. Corficolombiana has helped to shape the participation of the private sector in infrastructure projects, to develop the domestic capital markets and to expand the resources and operations of local companies in the region. In 2014, Corficolombiana’s investment bank helped secure financing and coordinate projects for its clients totaling Ps 3,473.7 billion.
Corficolombiana’s treasury operations are a leading participant in Colombian capital markets, both in sovereign and corporate debt securities and foreign currency denominated securities. It is also an active participant in the derivatives market, and an active market maker for Colombian sovereign debt securities. At December 31, 2014, Corficolombiana had total fixed income assets of Ps 1,873.1 billion (on a consolidated basis).
Corficolombiana’s private banking business provides high net worth customers and companies with a wide range of investment services and products. The private banking operations had Ps 1,607.4 billion in assets under management for its customers at December 31, 2014.
Central American operations
On December 9, 2010, we acquired all of the outstanding shares of BAC Credomatic Inc. (formerly known as BAC Credomatic GECF Inc.), a company incorporated under the laws of the British Virgin Islands, pursuant to a stock purchase agreement with GE Consumer Finance Central Holdings Corp. and General Electric Capital Corporation (collectively, GE Capital) for U.S.$1.92 billion (Ps 3.6 trillion at the closing date of the transaction).
The BAC Credomatic acquisition provided us with a leading Central American presence with operations that are complementary to our businesses and with the opportunity to enter primarily the consumer and credit card banking businesses in the region. BAC Credomatic is the leading Central American banking group with operations in Costa Rica, El Salvador, Guatemala, Honduras, Nicaragua and Panamá. BAC Credomatic maintains a credit card-issuing operation in Mexico, a small merchant and card processing center in the state of Florida and offshore subsidiaries in the Bahamas and the Cayman Islands.
On December 19, 2013, Banco de Bogotá acquired BBVA Panamá through its subsidiary, LB Panamá, for U.S.$505 million (Ps 982.5 billion at the date of the transaction). On December 9, 2014, Banco BAC de Panamá´s operation was merged with BAC International Bank, Inc.
On December 23, 2013, BAC Credomatic acquired Grupo Reformador through its subsidiary, Credomatic International Corporation for U.S.$421 million (Ps 815.0 billion at the date of the transaction). These acquisitions were funded through (i) an equity injection of U.S.$500 million from Banco de Bogotá to LB Panamá,(ii) a U.S.$282 million securitization of certain credit card inflows by BAC Credomatic due November 2020, and (iii) a short term loan of U.S.$250 million from Citibank N.A. expiring on November 29, 2014, which was replaced on April 16, 2014 with part of the net proceeds of a U.S.$350 million securitization of certain of BAC Credomatic’s credit card inflows, due October 2021.
A substantial portion of BAC Credomatic’s earnings, assets and liabilities is denominated in foreign currencies different from U.S. dollars. As a result, BAC Credomatic is subject to risks relating to foreign currency exchange rate fluctuations. See “Item 3. Key Information—D. Risk factors—Risks relating to our businesses and industry—Other risks relating to our businesses—We are subject to fluctuations in interest rates and other market risks, which may materially and adversely affect our results of operations and financial condition.”
To mitigate this risk, BAC Credomatic seeks to maintain a U.S. dollar net asset position (long U.S. dollar position) which is intended to hedge 100% (and in no case less than 60%) of its shareholders’ equity against possible devaluations of each of the local currencies in the countries where it operates against the U.S. dollar. See “—BAC Credomatic operations—Foreign exchange rate risk related to BAC Credomatic.”
Central American operations overview
BAC Credomatic is the leading financial group in Central America with a record of strong financial performance. BAC Credomatic is a full-service financial institution with one of the leading credit card-issuance and merchant-acquiring businesses in the region. BAC Credomatic offers commercial and retail banking, brokerage, insurance, pension fund management and other financial services. Its coverage extends throughout Central America with operations in Costa Rica, El Salvador, Guatemala, Honduras, Nicaragua and Panamá, as well as Mexico (with a small credit card-issuing operation) and the state of Florida (with a merchant and card processing center). It also has a presence in the Bahamas, Barbados and the Cayman Islands. Its Credomatic brand has key alliances with major credit card networks, such as
Visa
,
MasterCard
,
American Express
and
Diners Club
.
The table below shows BAC Credomatic financial data on a country-by-country basis at and for the year ended December 31, 2014.
|
At and for year ended December 31, 2014
|
||||||||||||||||||||||||
|
Net income
(3)
|
Loans
(3)
|
Deposits
(3)
|
||||||||||||||||||||||
|
(in U.S.$ millions except percentages)
|
||||||||||||||||||||||||
|
Costa Rica
|
144.9 | 48.1 | % | 3,020.0 | 26.1 | % | 2,728.9 | 24.0 | % | |||||||||||||||
|
El Salvador
|
33.0 | 11.0 | % | 1,201.2 | 10.4 | % | 1,153.4 | 10.1 | % | |||||||||||||||
|
Guatemala
|
68.9 | 22.9 | % | 2,043.7 | 17.7 | % | 2,095.1 | 18.4 | % | |||||||||||||||
|
Honduras
|
50.8 | 16.8 | % | 1,264.8 | 10.9 | % | 1,199.9 | 10.6 | % | |||||||||||||||
|
Nicaragua
|
46.5 | 15.4 | % | 954.7 | 8.3 | % | 1,097.6 | 9.7 | % | |||||||||||||||
|
Panamá(1)
|
(0.7 | ) | -0.2 | % | 3,118.1 | 27.0 | % | 2,989.8 | 26.3 | % | ||||||||||||||
|
Mexico
|
(7.8 | ) | -2.6 | % | 54.0 | 0.5 | % | - | - | |||||||||||||||
|
Regional offshore operations(2)
|
24.1 | 8.0 | % | 139.3 | 1.2 | % | 250.7 | 2.2 | % | |||||||||||||||
|
Corporate and eliminations
|
(58.3 | ) | -19.3 | % | (244.7 | ) | -2.1 | % | (142.2 | ) | -1.3 | % | ||||||||||||
|
Consolidated
|
301.6 | 100.0 | % | 11,551.1 | 100.0 | % | 11,373.3 | 100.0 | % | |||||||||||||||
Source: Consolidated financial statements of BAC Credomatic’s subsidiaries.
|
(1)
|
Panamá loans include operations from BAC Credomatic’s Panamá subsidiaries and certain intercompany adjustments.
|
|
(2)
|
Includes BAC Bahamas Bank Ltd. and BAC International Bank (Grand Cayman).
|
The table below presents BAC Credomatic’s market share of total loans and deposits in each of its main markets at December 31, 2014.
|
At December 31, 2014
|
||||||||
|
Loans
|
Deposits
|
|||||||
|
Costa Rica(1)
|
13.1 | % | 10.9 | % | ||||
|
El Salvador
|
11.5 | % | 12.0 | % | ||||
|
Guatemala
|
9.7 | % | 8.1 | % | ||||
|
Honduras
|
13.7 | % | 12.5 | % | ||||
|
Nicaragua
|
26.2 | % | 24.6 | % | ||||
|
Panamá
|
5.6 | % | 5.8 | % | ||||
Source: Superintendency of banks of each country and company calculations. Percentage of total loans and deposits is based on banking operations in each country, as reported to the local financial regulator, which excludes certain credit card data and offshore operations.
|
(1)
|
Percentage calculation for Costa Rica includes state-owned banks (Banco Nacional de Costa Rica, Banco de Costa Rica, Banco Popular and Banco Crédito Agrícola de Cartago), which at December 31, 2014 and December 31, 2013 had a 61.5% and 62.5% market share by loans, respectively, and a 66.8% and 67.9% market share by deposits, respectively.
|
History
BAC Credomatic has been providing financial services in the Central American region since 1952, when Banco de America (a predecessor entity) was founded in Nicaragua. In 1974, BAC Credomatic (at the time, Credomatic) began its credit card operations in Central America through Credomatic and launched its payment systems network. In 1985, BAC Credomatic entered the banking business in Costa Rica. As part of its regional expansion strategy, in 2007 BAC Credomatic acquired Banco Mercantil in Honduras, Propemi in El Salvador, and Corporación Financiera Miravalles in Costa Rica.
In June 2005, GE Capital acquired 49.99% of the capital stock of BAC Credomatic from entities affiliated with Mr. Carlos Pellas, or the minority shareholder who owned a conglomerate of financial, industrial and commercial companies in Central America. In June 2009, GE Capital increased its ownership stake in BAC Credomatic to 75%. In July 2010, GE Capital and Grupo Aval reached an agreement to sell 100% of BAC Credomatic to Banco de Bogotá. The acquisition was completed on December 9, 2010. Immediately prior to closing the transaction, GE Capital acquired the remaining 25.0% of BAC Credomatic’s share capital that it did not own from the minority shareholder.
As with our approach in our acquisitions in Colombia, we have retained a majority of BAC Credomatic’s senior management. These executives have an average of 15 years’ experience at BAC Credomatic and primarily pre-date GE Capital’s 2005 investment in BAC Credomatic. We plan to continue executing our multi-brand business model and maintain the BAC Credomatic brand.
In December 2013, Banco de Bogotá acquired BBVA Panamá through its subsidiary, LB Panamá, for U.S.$505 million (Ps 982.5 billion at the date of the transaction). On December 9, 2014 Banco BAC de Panamá´s operation was merged with BAC International Bank, Inc.
In December 2013, BAC Credomatic acquired Grupo Reformador in Guatemala through its subsidiary, Credomatic International Corporation for U.S.$421 million (Ps 815.0 billion at the date of the transaction).
BAC Credomatic operations
BAC Credomatic provides banking, credit card and other financial services mainly in Costa Rica, El Salvador, Guatemala, Honduras, Nicaragua and Panamá. The BAC Credomatic brand is widely recognized in Central America, a region that is comparable to Colombia, with significant growth potential in financial services. At December 31, 2014, BAC Credomatic had assets of U.S.$17.4 billion, loans at book value of U.S.$11.6 billion, deposits of U.S.$11.4 billion and shareholders’ equity of U.S.$2.2 billion. For the year ended December 31, 2014, BAC Credomatic had reported net income of U.S.$301.6 million, respectively. BAC Credomatic, served more than 3.2 million customers through 635 points of contact, including 351 full-service branches, 40 in-store branches offering teller services in retail stores, 216 on-site branches offering full banking services for corporate employees, and 28 auto/drive-thru branches throughout Central America at December 31, 2014 and a single technological platform that allows online transactions between countries in the region.
We believe that BAC Credomatic has a leading presence in the credit card-issuing business and a significant presence in the acquiring market in Central America. At December 31, 2014, BAC Credomatic had approximately 3.3 million credit card and debit card accounts, of which approximately 1.8 million were debit card accounts and approximately 1.5 million were credit card accounts. Through its merchant acquiring business, BAC Credomatic’s processing volume amounted to U.S.$13,867 million for the year ended December 31, 2014, representing an increase of U.S.$1,263 million, or 10.0%, from U.S.$12,604 million for the year ended December 31, 2013, mainly driven by a strong performance in Costa Rica, Guatemala and Honduras.
BAC Credomatic offers a wide range of products and integrated financial solutions to its clients throughout the region. BAC Credomatic operates across two main integrated business lines, offering credit card and banking services to its customers.
The following chart shows BAC Credomatic’s principal subsidiaries at December 31, 2014.
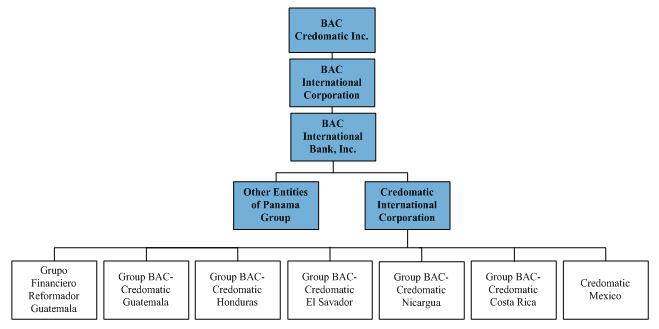
Lending activities
The following tables show BAC Credomatic’s gross loan portfolio at the dates indicated. BAC Credomatic’s loan portfolio consists of credit card loans, commercial loans, mortgage loans, automobile and vehicle loans and personal loans.
|
At December 31,
|
||||||||
|
2014
|
2013
|
|||||||
|
(in U.S.$ millions)
|
||||||||
|
Credit card loans
|
2,195 | 1,973 | ||||||
|
Commercial loans(1)(2)
|
4,841 | 4,553 | ||||||
|
Mortgage loans(3)
|
2,563 | 2,406 | ||||||
|
Automobile and vehicle loans
|
684 | 620 | ||||||
|
Other personal loans
|
1,268 | 1,135 | ||||||
|
Total
|
11,551 | 10,687 | ||||||
Source: BAC Credomatic.
|
(1)
|
Represents loans to businesses.
|
|
(2)
|
At December 31, 2014 and 2013, commercial loans include only commercial leasing and commercial overdraw; consumer leasing and consumer overdraw are included in “Other personal loans.”
|
|
(3)
|
Includes loans measured at fair value.
|
We believe that BAC Credomatic’s customer knowledge, coupled with a centralized risk-management structure, has resulted in a high quality loan portfolio, with an average 90 days and more past due loan ratio of 1.1% from 2010 to 2014.
Credit cards
BAC Credomatic has a leading presence in the credit card-issuing business and a significant presence in the merchant acquiring business in the region. Through its Credomatic brand, BAC Credomatic offers its customers a wide variety of credit and debit cards including
Visa
,
MasterCard
,
American Express
and
Diners Club
, and is the only network that processes all major brands in the region. Additionally, BAC Credomatic and its customers benefit from co-branding agreements with major airlines (such as American Airlines and AviancaTACA) and major supermarkets (such as Pricesmart and Wal-Mart) present in the region. BAC Credomatic has been a member of
Visa
and
MasterCard
for more than 20 years, issuing both national and international credit cards. Moreover, BAC Credomatic is currently the exclusive credit card issuer and merchant acquirer of
American Express
in the Central American region, with the exception of Panamá.
Card-issuing
BAC Credomatic has a leading presence in the Central American card-issuing market, at December 31, 2014, BAC Credomatic had approximately 3.3 million credit card and debit card accounts, of which 1.8 million were debit card accounts and 1.5 million were credit card accounts. From December 31, 2005 to December 31, 2014, BAC Credomatic’s credit card accounts grew at a CAGR of 8.5% and its debit card accounts grew at a CAGR of approximately 17.6%. The following table shows the number of credit card and debit card accounts at the dates indicated.
|
At December 31,
|
||||||||
|
2014
|
2013
|
|||||||
|
(in thousands)
|
||||||||
|
Credit cards
|
1,536 | 1,321 | ||||||
|
Debit cards
|
1,792 | 1,564 | ||||||
|
Total
|
3,327 | 2,885 | ||||||
Source: BAC Credomatic.
For the year ended December 31, 2014, BAC Credomatic’s billed volume was U.S.$7,975 million, a 11.1% increase over the U.S.$7,178 million billed volume for the year ended December 31, 2013.
|
At December 31,
|
||||||||
|
2014
|
2013
|
|||||||
|
(in U.S.$ millions)
|
||||||||
|
Credit cards
|
6,640 | 5,985 | ||||||
|
Debit cards
|
1,336 | 1,193 | ||||||
|
Total
|
7,975 | 7,178 | ||||||
Source: BAC Credomatic.
In its card-issuing business, BAC Credomatic has a strong presence in the premier and high-end customer segments in Central America. BAC Credomatic’s Platinum credit card clients averaged yearly expenditures in 2014 of U.S.$12,741 and represented approximately 16.3% of BAC Credomatic’s total credit card portfolio, and its Gold credit card clients averaged yearly expenditures in 2014 of U.S.$4,841 and represented approximately 23.8% of BAC Credomatic’s total credit card portfolio. BAC Credomatic’s Classic credit card clients who averaged yearly expenditures in 2014 of U.S.$1,814 represented 54.7% of BAC Credomatic’s credit card portfolio while other clients represented the remaining 5.2%.
At December 31, 2014, BAC Credomatic’s credit card portfolio totaled U.S.$2.2 billion which represents a 11.3% increase from U.S.$2.0 billion at December 31, 2013, growing at a 13.4% CAGR from U.S.$0.7 billion in December 31, 2005. At this same date, 77.3% of BAC Credomatic’s credit card portfolio was distributed across Costa Rica, El Salvador, Guatemala and Panamá. The remaining 22.7% was distributed among Honduras, Nicaragua and Mexico. The following table shows the credit card portfolio breakdown by country at the dates presented.
|
At December 31,
|
||||||||||||||||
|
2014
|
2013
|
|||||||||||||||
|
(in U.S.$ millions, except percentages)
|
||||||||||||||||
|
Costa Rica
|
704 | 32.1 | % | 677 | 34.3 | % | ||||||||||
|
El Salvador
|
312 | 14.2 | % | 285 | 14.4 | % | ||||||||||
|
Guatemala
|
369 | 16.8 | % | 315 | 16.0 | % | ||||||||||
|
Honduras
|
290 | 13.2 | % | 257 | 13.0 | % | ||||||||||
|
Nicaragua
|
106 | 4.8 | % | 99 | 5.0 | % | ||||||||||
|
Panamá
|
313 | 14.3 | % | 278 | 14.1 | % | ||||||||||
|
Mexico
|
54 | 2.5 | % | 62 | 3.1 | % | ||||||||||
|
Off-shore
|
48 | 2.2 | % | – | – | |||||||||||
|
Total
|
2,195 | 100.0 | % | 1,973 | 100.0 | % | ||||||||||
Source: Consolidated financial statements of BAC Credomatic’s subsidiaries.
For the past three years, BAC Credomatic has maintained a stable credit card portfolio quality. Of its total credit card portfolio, BAC Credomatic’s 90 days and more past due loans represented 2.4% at December 31, 2014, 2.2% at December 31, 2013 and 1.6% at December 31, 2012.
Merchant acquiring
BAC Credomatic, has a significant presence in Central America’s merchant acquiring business, achieving processing volumes of U.S.$13,867 million, U.S.$12,604 million and U.S.$10,996 million for the years ended December 31, 2014, 2013 and 2012, respectively. This performance compares favorably to processing volumes of other leading Latin American issuers at December 2014. From December 31, 2005 to December 31, 2014, BAC Credomatic’s processing volume grew at a CAGR of 14.3%.
The table set forth below shows the processing volume for the period presented.
|
At December 31,
|
||||||||
|
2014
|
2013
|
|||||||
|
(in U.S.$ millions)
|
||||||||
|
Local
|
11,193 | 10,217 | ||||||
|
International
|
2,675 | 2,387 | ||||||
|
Total
|
13,867 | 12,604 | ||||||
Source: BAC Credomatic.
BAC Credomatic’s processing volume for the year ended December 31, 2014 of U.S.$13,867 million represented an increase of U.S.$1,263 million, or 10%, from U.S.$12,604 million for the previous year. This increase is primarily due to a recovery in the economic activity compared to 2013.
BAC Credomatic has the only network in Central America that processes all the major brands including Visa, MasterCard, American Express and Diners Club. Furthermore, BAC Credomatic has exclusive card-issuing and merchant acquiring agreements with American Express for the Central American region, with the exception of Panamá.
At December 31, 2014, BAC Credomatic serviced approximately 319,306 merchant locations, with 96% of credit card authorizations processed electronically through its 245,119 point-of-sale devices.
Banking
BAC Credomatic’s commercial and consumer banking divisions offer traditional banking services and products. In some jurisdictions, BAC Credomatic also offers pension plan administration, investment fund advice, financial advisory, leasing, private banking and insurance services to its customers. Through its network and deep customer knowledge, BAC Credomatic is able to effectively offer services and solutions to its customers in addition to instant payment processing and funds transfers within the BAC Credomatic regional network.
Commercial banking
BAC Credomatic offers traditional commercial banking services and products. At December 31, 2014, 75.3% of BAC Credomatic’s commercial loan portfolio was distributed across Costa Rica, El Salvador, Guatemala and Panamá. The remaining 24.7% was distributed among Honduras, Nicaragua, and regional offshore operations. The following table displays BAC Credomatic’s commercial loan portfolio by country at the dates presented.
|
At December 31,
|
||||||||||||||||
|
2014
|
2013
|
|||||||||||||||
|
(in U.S.$ millions, except percentages)
|
||||||||||||||||
|
Costa Rica
|
961 | 19.9 | % | 804 | 17.7 | % | ||||||||||
|
El Salvador
|
385 | 8.0 | % | 368 | 8.1 | % | ||||||||||
|
Guatemala
|
1,158 | 23.9 | % | 1,163 | 25.5 | % | ||||||||||
|
Honduras
|
618 | 12.8 | % | 590 | 13.0 | % | ||||||||||
|
Nicaragua
|
533 | 11.0 | % | 487 | 10.7 | % | ||||||||||
|
Panamá(1)
|
1,143 | 23.6 | % | 1,109 | 24.4 | % | ||||||||||
|
Regional offshore operations(2)
|
64 | 1.3 | % | 32 | 0.7 | % | ||||||||||
|
Eliminations
|
(21 | ) | -0.4 | % | – | – | ||||||||||
|
Total
(3)
|
4,841 | 100.0 | % | 4,553 | 100.0 | % | ||||||||||
Source: BAC Credomatic.
|
(1)
|
Panamá loans include our operations from BAC Credomatic’s Panamá subsidiaries and certain BAC Credomatic intercompany adjustments.
|
|
(2)
|
Includes BAC Bahamas Bank Ltd. and BAC International Bank (Grand Cayman).
|
|
(3)
|
At December 31, 2014 and 2013, commercial loans include only commercial leasing and commercial overdraw; consumer leasing and consumer overdraw are included in consumer loans.
|
BAC Credomatic has managed its commercial portfolio risk conservatively, maintaining high quality and coverage metrics. The following table displays BAC Credomatic’s commercial loan portfolio 90 days and more past due loan ratio, as well as its 90 days and more past due loan coverage ratio at the dates presented.
|
At December 31,
|
||||||||
|
2014
|
2013
|
|||||||
|
(in percentages)
|
||||||||
|
90 days and more past due loan ratio
|
0.6 | 0.5 | ||||||
|
90 days and more past due loan coverage ratio
|
125.3 | 151.3 | ||||||
Source: BAC Credomatic.
BAC Credomatic also offers investment products, supplier and payroll ePayments, Ameritransfer (online transfer of funds among deposit accounts in BAC Credomatic’s network), online banking and foreign exchange services as part of its commercial banking platform in the region. At December 31, 2014, BAC Credomatic had more than 100,000 enterprise customers, divided into three main sectors: (1) corporate, consisting of companies with over U.S.$250,000 in deposits, more than 100 employees and loans over U.S.$1,000,000, which represented 86.1% of total commercial loans; (2) midsize companies, composed of companies with deposits of U.S.$50,000 to U.S.$250,000, between 51 to 100 employees and loans between U.S.$300,000 to U.S.$1,000,000, which represented 8.5% of total commercial loans; and (3) small companies, consisting of companies with deposits of less than U.S.$50,000, fewer than 50 employees and loans under U.S.$300,000, which represented 5.4% of total commercial loans.
BAC Credomatic’s electronic transfer and payment capabilities allow corporate clients to instantly transfer funds between different commercial and consumer accounts, provided that all parties have a BAC Credomatic account. BAC Credomatic recorded over U.S.$39.5 billion in electronic payments in 2014.
Electronic transfers originate mainly from: (1) merchant deposit transfer payments (instant electronic payments to merchants); (2) Ameritransfer (online transfer of funds across the region); (3) supplier ePayments (instant
electronic payments from merchants to suppliers); and (4) payroll ePayments (payroll payments from companies to employees). The following table breaks down BAC Credomatic’s electronic transfers by product for the dates presented, excluding Banco BAC de Panamá and Grupo Reformador.
|
At December 31,
|
||||||||
|
2014
|
2013
|
|||||||
|
(in U.S.$ billions)
|
||||||||
|
Merchant deposit transfers
|
13.9 | 12.6 | ||||||
|
Ameritransfer
|
6.1 | 5.6 | ||||||
|
Payroll ePayments
|
5.2 | 4.5 | ||||||
|
Supplier ePayments
|
14.3 | 11.0 | ||||||
|
Total
|
39.5 | 33.7 | ||||||
Source: BAC Credomatic.
Consumer banking
At December 31, 2014, as a proportion of BAC Credomatic’s total consumer loan portfolio, mortgage loans represented 56.8%, automobile and vehicle loans represented 15.1% and other personal loans represented 28.1%. Approximately 84.2% of the total consumer loan portfolio had a maturity greater than five years. At December 31, 2014, consumer loans amounted to U.S.$4.5 billion, a 8.5% increase over U.S.$4.2 billion at December 31, 2013. At December 31, 2014, 89.4% of BAC Credomatic’s consumer loan portfolio was distributed across Costa Rica, El Salvador, Guatemala and Panamá. The remaining 10.6% was distributed among Honduras, Nicaragua and regional offshore operations. The following table displays BAC Credomatic’s consumer loan portfolio by country at the dates presented.
|
At December 31,
|
||||||||||||||||
|
2014
|
2013
|
|||||||||||||||
|
(in U.S.$ millions, except percentages)
|
||||||||||||||||
|
Costa Rica(1)
|
1,355 | 30.0 | % | 1,188 | 28.6 | % | ||||||||||
|
El Salvador
|
504 | 11.2 | % | 415 | 10.0 | % | ||||||||||
|
Guatemala
|
517 | 11.4 | % | 490 | 11.8 | % | ||||||||||
|
Honduras
|
357 | 7.9 | % | 342 | 8.2 | % | ||||||||||
|
Nicaragua
|
316 | 7.0 | % | 276 | 6.6 | % | ||||||||||
|
Panamá(2)
|
1,662 | 36.8 | % | 1,656 | 39.8 | % | ||||||||||
|
Regional offshore operations(3)
|
27 | 0.6 | % | 25 | 0.6 | % | ||||||||||
|
Eliminations
|
(223 | ) | -4.9 | % | (231 | ) | -5.5 | % | ||||||||
|
Total
(4)
|
4,515 | 100.0 | % | 4,162 | 100.0 | % | ||||||||||
Source: BAC Credomatic.
|
(1)
|
Includes loans measured at fair value.
|
|
(2)
|
Loans include operations of BAC Credomatic’s Panamá subsidiaries and certain BAC Credomatic intercompany adjustments.
|
|
(3)
|
Includes BAC Bahamas Bank Ltd. and BAC International Bank (Grand Cayman).
|
|
(4)
|
At December 31, 2014 and 2013, consumer loans include consumer leasing and consumer overdraw.
|
At December 31, 2014, BAC Credomatic’s mortgage loans had an individual average mortgage loan balance of U.S.$61,779, with an average loan-to-value ratio of 58.0%. Given that BAC Credomatic’s mortgage loan portfolio has no significant exposure to the higher risk sectors such as vacation homes or second-home mortgages, it maintains a 90 days and more past due loan ratio of 1.4% and a coverage of 90 days and more past due loans of 23.8%. The following table displays BAC Credomatic’s mortgage loan portfolio 90 days and more past due loan ratio, as well as its 90 days and more past due loan coverage ratio at the dates presented.
|
At December 31,
|
||||||||
|
2014
|
2013
|
|||||||
|
(in percentages)
|
||||||||
|
90 days and more past due loan ratio
|
1.4 | 1.5 | ||||||
|
90 days and more past due loan coverage ratio
|
23.8 | 25.6 | ||||||
Source: BAC Credomatic.
At December 31, 2014, BAC Credomatic’s automobile and vehicle loan portfolio had an individual average loan balance of U.S.$11,922, maintaining a 90 days and more past due loan ratio of 0.3%. The following table displays BAC Credomatic’s auto loan portfolio 90 days and more past due loan ratio, as well as its 90 days and more past due loan coverage ratio at the dates presented.
|
At December 31,
|
||||||||
|
2014
|
2013
|
|||||||
|
(in percentages)
|
||||||||
|
90 days and more past due loan ratio
|
0.3 | 0.3 | ||||||
|
90 days and more past due loan coverage ratio
|
116.3 | 107.5 | ||||||
Source: BAC Credomatic.
BAC Credomatic’s personal loan portfolio includes individual loans, retirement linked loans, payroll loans and consumer finance loans. At December 31, 2014, BAC Credomatic’s personal loan portfolio had an individual average loan balance of U.S.$10,438, and a 90 days and more past due loan ratio of 0.7%. The following table displays BAC Credomatic’s personal loan portfolio 90 days and more past due loan ratio, as well as its 90 days and more past due loan coverage ratio at the dates presented.
|
At December 31,
|
||||||||
|
2014
|
2013
|
|||||||
|
(in percentages)
|
||||||||
|
90 days and more past due loan ratio
|
0.7 | 1.2 | ||||||
|
90 days and more past due loan coverage ratio
|
186.5 | 211.3 | ||||||
Source: BAC Credomatic.
Deposit activities
The following table shows BAC Credomatic’s deposit breakdown at the dates indicated. At December 31, 2014, 37% of BAC Credomatic’s deposit base was represented by demand deposits. Total deposits increased by 4.3% from December 31, 2013 to December 31, 2014. From December 31, 2005 to December 31, 2014, the CAGR of total deposits has been 19.7%.
|
At December 31,
|
||||||||
|
2014
|
2013
|
|||||||
|
(in U.S.$ millions)
|
||||||||
|
Demand deposits
|
4,224 | 3,967 | ||||||
|
Savings deposits
|
2,217 | 2,047 | ||||||
|
Time deposits
|
4,933 | 4,894 | ||||||
|
Total
|
11,373 | 10,908 | ||||||
Source: BAC Credomatic.
Distribution network
BAC Credomatic serves its customers throughout Central America with a diversified distribution network that includes branches, kiosks (non-cash machines which provide online banking capabilities as well as a full keyboard),
ATMs, a standardized online banking platform, call centers, and mobile phone banking. Additionally, BAC Credomatic’s strong point-of-sale presence in 319,306 merchant locations in Central America at December 31, 2014 allows clients to perform various transactions, including purchases, using credit or debit cards, payments of credit card balances and loyalty program services.
BAC Credomatic serves its clients through multiple channels to cover the needs of different customer segments across the region.
The following map shows BAC Credomatic’s branch distribution at December 31, 2013 and 2014.

____________________
Source: BAC Credomatic at December 31, 2014.
At December 31, 2014, BAC Credomatic had a network of 1,638 ATMs in the region. BAC Credomatic was the first bank in Central America to offer deposit capabilities with instant credit balance through its ATMs. Additionally, BAC Credomatic has 255 self-service kiosks.
BAC Credomatic deployed the first mobile banking platform in Central America and expects to benefit from further regional penetration. BAC Credomatic’s mobile banking system is SMS-enabled and it has several smart phone applications under development.
Foreign exchange rate risk related to BAC Credomatic
Because of the BAC Credomatic acquisition and our other Central American acquisitions, Grupo Aval is exposed to changes in the values of current holdings and future cash flows denominated in other currencies. The types of instruments exposed to foreign exchange rate risk include, for example, investments in foreign subsidiaries, foreign currency-denominated loans and securities, foreign currency-denominated debt and various foreign exchange derivative instruments whose values fluctuate with changes in the level or volatility of currency exchange rates or foreign interest rates. Hedging instruments used to mitigate this risk include currency swaps, amounting to U.S.$-0.9 million (notional value of U.S.$23.1 million) and deposits.
The foreign exchange rate risk associated with this U.S. dollar-denominated liability is hedged with the net investment that Grupo Aval maintains in BAC Credomatic. The difference between the U.S. dollar-denominated debt and the net investment in BAC Credomatic (including any goodwill associated with the acquisition) may result in a net U.S. dollar asset position which Grupo Aval, through Banco de Bogotá and LB Panamá may hedge with forward contracts.
In accordance with its market risk policies, BAC Credomatic maintains a U.S. dollar net asset position (long U.S. dollar position) which is intended to hedge 100% (and in no case less than 60%) of its shareholders’ equity against possible devaluations of each of the local currencies in the countries where it operates against the U.S. dollar.
Other corporate information
Technology
We invest in new technology and the renewal of equipment and infrastructure in order to serve customers effectively, improve our profitability and grow our business. We believe that proper management of technology is key to the efficient management of our business. Our technology architecture focuses on our customers and supports our business model.
Our banking subsidiaries and their consolidated operations currently maintain their own technological infrastructure and software. We believe that this technology provides us with an opportunity to seek potential additional synergies as we implement our overall technology model: assisting with the standardization and implementation of systems developed in our subsidiaries and sister banks.
One of our most successful initiatives to date has been the coordination of banking branches and electronic channels within our Colombian banks through ATH, the administrator of our ATMs and the transactional services that flow through the
Red de Grupo Aval
(Grupo Aval network). Although these electronic channels have been fully implemented, we plan to continue to enhance their operations with new technology, especially through internet and mobile banking. Additionally, ATH coordinates connectivity between branches, technical support, webpages and transactional Internet, mobile banking, banking correspondence and payments and collections.
Our principal projects currently consist of the following:
|
|
·
|
Technological architecture: We are pursuing a new technology model, which we expect will deploy new applications in different fields of business, seek to increase efficiency and enhance the competitive advantages of our entities; and
|
|
|
·
|
Basic software activity: We are focusing on the standardization of some processes throughout our entities, such as Core Banking, ERP, MDM and mobile banking solutions.
|
We incurred Ps 927.5 billion of capital expenditures relating to information technology for the year ended December 31, 2014.
Intellectual property
We register and monitor our brands and trademarks in Colombia and abroad according to the importance of such brands and trademarks to our and our subsidiaries’ merchandising and commercial strategy. Certain of Grupo Aval’s brands and trademarks are registered in Argentina, Bolivia, Brazil, Chile, Colombia, Costa Rica, Ecuador, Guatemala, México, Nicaragua, Panamá, Paraguay, Peru, United States, Uruguay and Venezuela.
Corporate social responsibility
We coordinate with several corporate social responsibility initiatives our banks that help us maintain the strength of our image and reputation with respect to all our stakeholders.
We participate in community education and professional training programs for micro and small enterprises, and we engage in microfinance, social inclusion, cultural, sporting, human rights awareness and health projects for low-income populations throughout Colombia.
We consistently seek to improve our environmental footprint by, for example, sponsoring the “Planeta Azul” prize for the best water-conservation project, and by promoting the use of electronic means over paper.
Banco de Bogotá owns a program named “Educación Financiera para la Vida” with the objective of providing knowledge and tools for financial consumers to promote a more responsible use of financial instruments. Banco AV
Villas also holds a special program in partnership with “Fundación Colombia Emprendedora” focused on teaching financial education to children.
We follow corporate human resources policies that seek employee well-being in areas such as hiring, promotion and work-related development and training. In 2014 and 2013, we spent approximately Ps 9.8 billion and Ps 5.3 billion in corporate social responsibility initiatives, respectively.
Selected statistical data
The following information is included for analytical purposes and should be read in conjunction with our consolidated financial statements included in this annual report as well as “Operating and financial review and prospects.” This information has been presented based on our financial records, which are prepared in accordance with Colombian Banking GAAP and do not reflect adjustments necessary to present the information in accordance with U.S. GAAP. The selected statistical data of Grupo Aval at December 31, 2014 and 2013 and for the years ended December 31, 2014, 2013 and 2012 have been derived from our audited annual consolidated financial statements prepared in accordance with Colombian Banking GAAP that are included in this annual report. The selected financial data at December 31, 2011 and 2010 and for the year ended December 31, 2010 have been derived from our audited consolidated financial statements prepared in accordance with Colombian Banking GAAP that are not included in this annual report. As permitted by the Superintendency of Finance, Grupo Aval began consolidating BAC Credomatic’s results from December 1, 2010 in its consolidated financial statements. Prior to our acquisition of BAC Credomatic, Grupo Aval had limited operations outside of Colombia. Accordingly, we are providing disclosure on our foreign operations commencing the fiscal year ended December 31, 2010. On April 18, 2013, we acquired Horizonte and began consolidating its information into our financial statements on our balance sheet. We also began consolidating Grupo Financiero Reformador and Banco BAC de Panama (formerly BBVA Panama) into our balance sheet at December 31, 2013. As a result, information for our 2014 results is not fully comparable with prior years.
Distribution of assets, liabilities and shareholders’ equity, interest rates and interest differential
|
|
·
|
Average balances have been calculated as follows: first, for each month, the actual month-end balances were established, second, the average balance for each period is calculated as the average of these month-end balances over a 13-month period for the years ended December 31, 2014, 2013 and 2012.
|
|
|
·
|
We stop accruing interest on loans after they are past due by more than a certain number of days depending on the type of loan. See “—Loan portfolio—Suspension of accruals.” For purposes of the presentation in the following tables, non-performing loans have been treated as non- interest-earning assets.
|
|
|
·
|
Under Colombian Banking GAAP, interest on investment securities includes accrued interest on debt instruments, valuation adjustments and gains (losses) realized on debt and equity securities that are accounted for as “available for sale,” gains (losses) on repurchase transactions (repos), gains (losses) realized on the sale of debt securities, and mark-to-market gains (losses) on our trading securities portfolio.
|
Average balance sheet
For the years ended December 31, 2014, 2013 and 2012, the following table presents:
|
|
·
|
average balances calculated using actual month-end balances for our assets and liabilities (based on non-consolidated monthly amounts for a 13-month period and the last day of the prior year, adjusted for consolidation by the addition or subtraction of, as applicable, average balances for the three respective semi-annual periods);
|
|
|
·
|
interest income earned on assets and interest paid on liabilities; and
|
|
|
·
|
average yield and interest rate for our interest-earning assets and interest-bearing liabilities, respectively.
|
The interest rate subtotals are based on the weighted average of the average peso-denominated and foreign currency-denominated (principally U.S. dollars) balances.
|
Average balance sheet and income from interest-earning assets for the years ended December 31,
|
||||||||||||||||||||||||||||||||||||
|
2014
|
2013
|
2012
|
||||||||||||||||||||||||||||||||||
|
Average balance
|
Interest income earned
|
Average yield
|
Average balance
|
Interest income earned
|
Average yield
|
Average balance
|
Interest income earned
|
Average yield
|
||||||||||||||||||||||||||||
|
(in Ps billions, except percentages)
|
||||||||||||||||||||||||||||||||||||
|
Assets
|
||||||||||||||||||||||||||||||||||||
|
Interest-earning assets
|
||||||||||||||||||||||||||||||||||||
|
Interbank and overnight funds
|
||||||||||||||||||||||||||||||||||||
|
Domestic
|
||||||||||||||||||||||||||||||||||||
|
Peso-denominated
|
1,274.6 | 154.9 | 12.1 | % | 1,347.8 | 110.9 | 8.2 | % | 1,451.4 | 167.9 | 11.6 | % | ||||||||||||||||||||||||
|
Foreign currency-denominated
|
402.2 | 6.8 | 1.7 | % | 661.3 | 48.8 | 7.4 | % | 839.0 | 10.6 | 1.3 | % | ||||||||||||||||||||||||
|
Total domestic
|
1,676.9 | 161.7 | 9.6 | % | 2,009.2 | 159.7 | 7.9 | % | 2,290.4 | 178.6 | 7.8 | % | ||||||||||||||||||||||||
|
Foreign
|
753.5 | 34.6 | 4.6 | % | 770.5 | 30.5 | 4.0 | % | 801.8 | 28.3 | 3.5 | % | ||||||||||||||||||||||||
|
Total
|
2,430.4 | 196.3 | 8.1 | % | 2,779.7 | 190.1 | 6.8 | % | 3,092.3 | 206.8 | 6.7 | % | ||||||||||||||||||||||||
|
Investment securities (1)
|
||||||||||||||||||||||||||||||||||||
|
Domestic
|
||||||||||||||||||||||||||||||||||||
|
Peso-denominated
|
21,261.2 | 992.7 | 4.7 | % | 19,343.8 | 1,077.0 | 5.6 | % | 16,559.8 | 1,145.6 | 6.9 | % | ||||||||||||||||||||||||
|
Foreign currency-denominated
|
2,853.4 | 112.1 | 3.9 | % | 2,310.9 | 62.0 | 2.7 | % | 3,101.4 | 87.4 | 2.8 | % | ||||||||||||||||||||||||
|
Total domestic
|
24,114.6 | 1,104.8 | 4.6 | % | 21,654.7 | 1,139.0 | 5.3 | % | 19,661.2 | 1,233.0 | 6.3 | % | ||||||||||||||||||||||||
|
Foreign
|
4,018.5 | 224.2 | 5.6 | % | 3,319.9 | 167.9 | 5.1 | % | 1,802.1 | 66.0 | 3.7 | % | ||||||||||||||||||||||||
|
Total
|
28,133.1 | 1,328.9 | 4.7 | % | 24,974.6 | 1,306.9 | 5.2 | % | 21,463.3 | 1,299.0 | 6.1 | % | ||||||||||||||||||||||||
|
Loans and financial
leases (2)
|
||||||||||||||||||||||||||||||||||||
|
Domestic
|
||||||||||||||||||||||||||||||||||||
|
Peso-denominated
|
71,126.4 | 7,698.8 | 10.8 | % | 63,179.1 | 7,310.5 | 11.6 | % | 56,742.4 | 7,052.0 | 12.4 | % | ||||||||||||||||||||||||
|
Foreign currency-denominated
|
7,761.7 | 219.6 | 2.8 | % | 6,433.3 | 184.0 | 2.9 | % | 4,850.8 | 170.2 | 3.5 | % | ||||||||||||||||||||||||
|
Total domestic
|
78,888.2 | 7,918.4 | 10.0 | % | 69,612.5 | 7,494.4 | 10.8 | % | 61,593.2 | 7,222.2 | 11.7 | % | ||||||||||||||||||||||||
|
Foreign
|
21,625.1 | 2,442.8 | 11.3 | % | 14,337.7 | 1,791.9 | 12.5 | % | 11,465.8 | 1,476.9 | 12.9 | % | ||||||||||||||||||||||||
|
Total
|
100,513.2 | 10,361.2 | 10.3 | % | 83,950.2 | 9,286.3 | 11.1 | % | 73,059.0 | 8,699.2 | 11.9 | % | ||||||||||||||||||||||||
|
Total interest-earning assets
|
||||||||||||||||||||||||||||||||||||
|
Domestic
|
||||||||||||||||||||||||||||||||||||
|
Peso-denominated
|
93,662.2 | 8,846.4 | 9.4 | % | 83,870.7 | 8,498.3 | 10.1 | % | 74,753.6 | 8,365.6 | 11.2 | % | ||||||||||||||||||||||||
|
Foreign currency-denominated
|
11,017.4 | 338.5 | 3.1 | % | 9,405.6 | 294.8 | 3.1 | % | 8,791.2 | 268.2 | 3.1 | % | ||||||||||||||||||||||||
|
Total domestic
|
104,679.6 | 9,184.8 | 8.8 | % | 93,276.3 | 8,793.1 | 9.4 | % | 83,544.8 | 8,633.8 | 10.3 | % | ||||||||||||||||||||||||
|
Foreign
|
26,397.1 | 2,701.6 | 10.2 | % | 18,428.1 | 1,990.3 | 10.8 | % | 14,069.7 | 1,571.2 | 11.2 | % | ||||||||||||||||||||||||
|
Total interest-earning assets
|
131,076.7 | 11,886.5 | 9.1 | % | 111,704.4 | 10,783.4 | 9.7 | % | 97,614.5 | 10,205.0 | 10.5 | % | ||||||||||||||||||||||||
|
Non-interest-earning assets
|
||||||||||||||||||||||||||||||||||||
|
Cash and due from banks
|
||||||||||||||||||||||||||||||||||||
|
Domestic
|
||||||||||||||||||||||||||||||||||||
|
Peso-denominated
|
7,551.0 | – | – | 5,955.2 | – | – | 3,821.4 | – | – | |||||||||||||||||||||||||||
|
Foreign currency-denominated
|
1,795.9 | – | – | 1,088.0 | – | – | 1,265.9 | – | – | |||||||||||||||||||||||||||
|
Total domestic
|
9,347.0 | – | – | 7,043.2 | – | – | 5,087.3 | – | – | |||||||||||||||||||||||||||
|
Foreign
|
5,848.6 | – | – | 3,649.9 | – | – | 2,931.1 | – | – | |||||||||||||||||||||||||||
|
Total
|
15,195.6 | – | – | 10,693.1 | – | – | 8,018.4 | – | – | |||||||||||||||||||||||||||
|
Allowance for loan and financial lease losses
|
||||||||||||||||||||||||||||||||||||
|
Domestic
|
||||||||||||||||||||||||||||||||||||
|
Peso-denominated
|
(2,739.9 | ) | – | – | (2,492.4 | ) | – | – | (2,192.4 | ) | – | – | ||||||||||||||||||||||||
|
Foreign currency-denominated
|
(33.1 | ) | – | – | (26.8 | ) | – | – | (16.6 | ) | – | – | ||||||||||||||||||||||||
|
Total domestic
|
(2,773.0 | ) | – | – | (2,519.2 | ) | – | – | (2,209.0 | ) | – | – | ||||||||||||||||||||||||
|
Foreign
|
(426.0 | ) | – | – | (265.2 | ) | – | – | (199.9 | ) | – | – | ||||||||||||||||||||||||
|
Total
|
(3,199.0 | ) | – | – | (2,784.4 | ) | – | – | (2,408.9 | ) | – | – | ||||||||||||||||||||||||
|
Average balance sheet and income from interest-earning assets for the years ended December 31,
|
||||||||||||||||||||||||||||||||||||
|
2014
|
2013
|
2012
|
||||||||||||||||||||||||||||||||||
|
Average balance
|
Interest income earned
|
Average yield
|
Average balance
|
Interest income earned
|
Average yield
|
Average balance
|
Interest income earned
|
Average yield
|
||||||||||||||||||||||||||||
|
(in Ps billions, except percentages)
|
||||||||||||||||||||||||||||||||||||
|
Non-performing past due loans (3)
|
||||||||||||||||||||||||||||||||||||
|
Domestic
|
||||||||||||||||||||||||||||||||||||
|
Peso-denominated
|
1,500.2 | – | – | 1,226.3 | – | – | 991.3 | – | – | |||||||||||||||||||||||||||
|
Foreign currency-denominated
|
5.5 | – | – | 5.9 | – | – | 4.3 | – | – | |||||||||||||||||||||||||||
|
Total domestic
|
1,505.7 | – | – | 1,232.2 | – | – | 995.6 | – | – | |||||||||||||||||||||||||||
|
Foreign
|
411.5 | – | – | 243.8 | – | – | 236.6 | – | – | |||||||||||||||||||||||||||
|
Total
|
1,917.2 | – | – | 1,476.0 | – | – | 1,232.2 | – | – | |||||||||||||||||||||||||||
|
Bankers’ acceptances, spot transactions and derivatives
|
||||||||||||||||||||||||||||||||||||
|
Domestic
|
||||||||||||||||||||||||||||||||||||
|
Peso-denominated
|
1,193.3 | – | – | 139.7 | – | – | 3,997.6 | – | – | |||||||||||||||||||||||||||
|
Foreign currency-denominated
|
(616.2 | ) | – | – | 234.6 | – | – | (3,626.6 | ) | – | – | |||||||||||||||||||||||||
|
Total domestic
|
577.1 | – | – | 374.3 | – | – | 370.9 | – | – | |||||||||||||||||||||||||||
|
Foreign
|
38.8 | – | – | 15.8 | – | – | 14.6 | – | – | |||||||||||||||||||||||||||
|
Total
|
615.9 | – | – | 390.1 | – | – | 385.5 | – | – | |||||||||||||||||||||||||||
|
Accounts receivable, net
|
||||||||||||||||||||||||||||||||||||
|
Domestic
|
||||||||||||||||||||||||||||||||||||
|
Peso-denominated
|
2,132.2 | – | – | 2,001.2 | – | – | 1,488.1 | – | – | |||||||||||||||||||||||||||
|
Foreign currency-denominated
|
54.4 | – | – | 237.7 | – | – | 66.9 | – | – | |||||||||||||||||||||||||||
|
Total domestic
|
2,186.6 | – | – | 2,238.9 | – | – | 1,555.0 | – | – | |||||||||||||||||||||||||||
|
Foreign
|
411.9 | – | – | 326.1 | – | – | 259.1 | – | – | |||||||||||||||||||||||||||
|
Total
|
2,598.5 | – | – | 2,565.0 | – | – | 1,814.0 | – | – | |||||||||||||||||||||||||||
|
Foreclosed assets, net
|
||||||||||||||||||||||||||||||||||||
|
Domestic
|
||||||||||||||||||||||||||||||||||||
|
Peso-denominated
|
58.8 | – | – | 63.5 | – | – | 57.6 | – | – | |||||||||||||||||||||||||||
|
Foreign currency-denominated
|
- | – | – | – | – | – | – | – | – | |||||||||||||||||||||||||||
|
Total domestic
|
58.8 | – | – | 63.5 | – | – | 57.6 | – | – | |||||||||||||||||||||||||||
|
Foreign
|
56.8 | – | – | 22.5 | – | – | 25.2 | – | – | |||||||||||||||||||||||||||
|
Total
|
115.7 | – | – | 86.0 | – | – | 82.8 | – | – | |||||||||||||||||||||||||||
|
Property, plant and equipment, net
|
||||||||||||||||||||||||||||||||||||
|
Domestic
|
||||||||||||||||||||||||||||||||||||
|
Peso-denominated
|
2,025.7 | – | – | 1,873.4 | – | – | 1,816.2 | – | – | |||||||||||||||||||||||||||
|
Foreign currency-denominated
|
80.0 | – | – | 72.2 | – | – | 35.6 | – | – | |||||||||||||||||||||||||||
|
Total domestic
|
2,105.7 | – | – | 1,945.6 | – | – | 1,851.8 | – | – | |||||||||||||||||||||||||||
|
Foreign
|
451.6 | – | – | 333.8 | – | – | 298.7 | – | – | |||||||||||||||||||||||||||
|
Total
|
2,557.4 | – | – | 2,279.4 | – | – | 2,150.5 | – | – | |||||||||||||||||||||||||||
|
Other assets net
|
||||||||||||||||||||||||||||||||||||
|
Domestic
|
||||||||||||||||||||||||||||||||||||
|
Peso-denominated
|
8,660.1 | – | – | 7,632.6 | – | – | 6,730.8 | – | – | |||||||||||||||||||||||||||
|
Foreign currency-denominated
|
177.4 | – | – | 81.4 | – | – | 362.3 | – | – | |||||||||||||||||||||||||||
|
Total domestic
|
8,837.5 | – | – | 7,714.0 | – | – | 7,093.2 | – | – | |||||||||||||||||||||||||||
|
Foreign
|
3,758.8 | – | – | 2,371.5 | – | – | 2,227.7 | – | – | |||||||||||||||||||||||||||
|
Total
|
12,596.3 | – | – | 10,085.5 | – | – | 9,320.8 | – | – | |||||||||||||||||||||||||||
|
Total non-interest-earning assets
|
||||||||||||||||||||||||||||||||||||
|
Domestic
|
||||||||||||||||||||||||||||||||||||
|
Peso-denominated
|
20,381.4 | – | – | 16,399.4 | – | – | 16,710.6 | – | – | |||||||||||||||||||||||||||
|
Foreign currency-denominated
|
1,463.9 | – | – | 1,693.1 | – | – | (1,908.3 | ) | – | – | ||||||||||||||||||||||||||
|
Total domestic
|
21,845.3 | – | – | 18,092.6 | – | – | 14,802.4 | – | – | |||||||||||||||||||||||||||
|
Foreign
|
10,552.2 | – | – | 6,698.1 | – | – | 5,793.1 | – | – | |||||||||||||||||||||||||||
|
Total non-interest-earning assets
|
32,397.5 | – | – | 24,790.7 | – | – | 20,595.4 | – | – | |||||||||||||||||||||||||||
|
Total interest and non-interest-earning assets
|
||||||||||||||||||||||||||||||||||||
|
Domestic
|
||||||||||||||||||||||||||||||||||||
|
Peso-denominated
|
114,043.7 | 8,846.4 | 7.8 | % | 100,270.2 | 8,498.3 | 8.5 | % | 91,464.2 | 8,365.6 | 9.1 | % | ||||||||||||||||||||||||
|
Foreign currency-denominated
|
12,481.3 | 338.5 | 2.7 | % | 11,098.7 | 294.8 | 2.7 | % | 6,883.0 | 268.2 | 3.9 | % | ||||||||||||||||||||||||
|
Total domestic
|
126,525.0 | 9,184.8 | 7.3 | % | 111,368.9 | 8,793.1 | 7.9 | % | 98,347.2 | 8,633.8 | 8.8 | % | ||||||||||||||||||||||||
|
Foreign
|
36,949.2 | 2,701.6 | 7.3 | % | 25,126.3 | 1,990.3 | 7.9 | % | 19,862.8 | 1,571.2 | 7.9 | % | ||||||||||||||||||||||||
|
Total assets
|
163,474.2 | 11,886.5 | 7.3 | % | 136,495.1 | 10,783.4 | 7.9 | % | 118,210.0 | 10,205.0 | 8.6 | % | ||||||||||||||||||||||||
|
Average balance sheet and income from interest–bearing liabilities for years ended December 31,
|
||||||||||||||||||||||||||||||||||||
|
2014
|
2013
|
2012
|
||||||||||||||||||||||||||||||||||
|
Average balance
|
Interest expense paid
|
Average interest rate
|
Average balance
|
Interest expense paid
|
Average interest rate
|
Average balance
|
Interest expense paid
|
Average interest rate
|
||||||||||||||||||||||||||||
|
(in Ps billions, except percentages)
|
||||||||||||||||||||||||||||||||||||
|
Liabilities and shareholders’ equity
|
||||||||||||||||||||||||||||||||||||
|
Interest-bearing liabilities
|
||||||||||||||||||||||||||||||||||||
|
Checking accounts
|
||||||||||||||||||||||||||||||||||||
|
Domestic
|
||||||||||||||||||||||||||||||||||||
|
Peso-denominated
|
4,620.1 | 120.3 | 2.6 | % | 3,766.3 | 111.9 | 3.0 | % | 2,737.3 | 123.8 | 4.5 | % | ||||||||||||||||||||||||
|
Foreign currency-denominated
|
309.7 | 1.8 | 0.6 | % | 267.6 | 0.7 | 0.3 | % | 868.9 | 5.2 | 0.6 | % | ||||||||||||||||||||||||
|
Total domestic
|
4,929.8 | 122.1 | 2.5 | % | 4,033.9 | 112.6 | 2.8 | % | 3,606.2 | 129.0 | 3.6 | % | ||||||||||||||||||||||||
|
Foreign
|
6,315.2 | 47.1 | 0.7 | % | 4,837.6 | 35.4 | 0.7 | % | 4,305.6 | 30.2 | 0.7 | % | ||||||||||||||||||||||||
|
Total
|
11,244.9 | 169.2 | 1.5 | % | 8,871.6 | 148.0 | 1.7 | % | 7,911.8 | 159.2 | 2.0 | % | ||||||||||||||||||||||||
|
Savings deposits
|
||||||||||||||||||||||||||||||||||||
|
Domestic
|
||||||||||||||||||||||||||||||||||||
|
Peso-denominated
|
40,167.9 | 1,229.9 | 3.1 | % | 33,975.5 | 1,054.0 | 3.1 | % | 26,489.8 | 1,059.3 | 4.0 | % | ||||||||||||||||||||||||
|
Foreign currency-denominated
|
199.9 | 0.8 | 0.4 | % | 359.2 | 2.5 | 0.7 | % | 470.5 | 3.4 | 0.7 | % | ||||||||||||||||||||||||
|
Total domestic
|
40,367.8 | 1,230.7 | 3.0 | % | 34,334.8 | 1,056.5 | 3.1 | % | 26,960.3 | 1,062.8 | 3.9 | % | ||||||||||||||||||||||||
|
Foreign
|
4,237.7 | 53.6 | 1.3 | % | 2,983.8 | 36.6 | 1.2 | % | 2,463.4 | 31.3 | 1.3 | % | ||||||||||||||||||||||||
|
Total
|
44,605.4 | 1,284.3 | 2.9 | % | 37,318.6 | 1,093.0 | 2.9 | % | 29,423.8 | 1,094.0 | 3.7 | % | ||||||||||||||||||||||||
|
Time deposits
|
||||||||||||||||||||||||||||||||||||
|
Domestic
|
||||||||||||||||||||||||||||||||||||
|
Peso-denominated
|
21,506.7 | 1,070.8 | 5.0 | % | 19,270.3 | 1,009.0 | 5.2 | % | 17,718.2 | 1,108.1 | 6.3 | % | ||||||||||||||||||||||||
|
Foreign currency-denominated
|
5,129.1 | 90.5 | 1.8 | % | 3,956.1 | 74.0 | 1.9 | % | 3,495.3 | 73.4 | 2.1 | % | ||||||||||||||||||||||||
|
Total domestic
|
26,635.7 | 1,161.2 | 4.4 | % | 23,226.4 | 1,083.0 | 4.7 | % | 21,213.5 | 1,181.5 | 5.6 | % | ||||||||||||||||||||||||
|
Foreign
|
9,802.1 | 471.7 | 4.8 | % | 5,845.6 | 300.8 | 5.1 | % | 4,628.7 | 214.5 | 4.6 | % | ||||||||||||||||||||||||
|
Total
|
36,437.8 | 1,633.0 | 4.5 | % | 29,072.1 | 1,383.8 | 4.8 | % | 25,842.3 | 1,396.1 | 5.4 | % | ||||||||||||||||||||||||
|
Interbank borrowings and overnight funds (4)
|
||||||||||||||||||||||||||||||||||||
|
Domestic
|
||||||||||||||||||||||||||||||||||||
|
Peso-denominated
|
5,513.7 | 175.2 | 3.2 | % | 5,263.0 | 146.1 | 2.8 | % | 4,878.1 | 219.5 | 4.5 | % | ||||||||||||||||||||||||
|
Foreign currency-denominated
|
334.1 | 3.6 | 1.1 | % | 254.3 | 10.8 | 4.3 | % | 302.9 | 2.9 | 1.0 | % | ||||||||||||||||||||||||
|
Total domestic
|
5,847.8 | 178.9 | 3.1 | % | 5,517.2 | 157.0 | 2.8 | % | 5,181.0 | 222.4 | 4.3 | % | ||||||||||||||||||||||||
|
Foreign
|
109.1 | 6.0 | 5.5 | % | 71.2 | 3.8 | 5.4 | % | 88.7 | 5.9 | 6.7 | % | ||||||||||||||||||||||||
|
Total
|
5,956.9 | 184.9 | 3.1 | % | 5,588.4 | 160.8 | 2.9 | % | 5,269.7 | 228.3 | 4.3 | % | ||||||||||||||||||||||||
|
Average balance sheet and income from interest–bearing liabilities for years ended December 31,
|
||||||||||||||||||||||||||||||||||||
|
2014
|
2013
|
2012
|
||||||||||||||||||||||||||||||||||
|
Average balance
|
Interest expense paid
|
Average interest rate
|
Average balance
|
Interest expense paid
|
Average interest rate
|
Average balance
|
Interest expense paid
|
Average interest rate
|
||||||||||||||||||||||||||||
|
(in Ps billions, except percentages)
|
||||||||||||||||||||||||||||||||||||
|
Borrowings from banks and others (5)
|
||||||||||||||||||||||||||||||||||||
|
Domestic
|
||||||||||||||||||||||||||||||||||||
|
Peso-denominated
|
2,853.8 | 133.4 | 4.7 | % | 4,129.0 | 227.7 | 5.5 | % | 3,899.2 | 298.0 | 7.6 | % | ||||||||||||||||||||||||
|
Foreign currency-denominated
|
2,946.9 | 14.3 | 0.5 | % | 2,346.6 | 30.6 | 1.3 | % | 2,864.9 | 53.9 | 1.9 | % | ||||||||||||||||||||||||
|
Total domestic
|
5,800.7 | 147.7 | 2.5 | % | 6,475.6 | 258.3 | 4.0 | % | 6,764.1 | 351.9 | 5.2 | % | ||||||||||||||||||||||||
|
Foreign
|
6,481.3 | 251.1 | 3.9 | % | 3,900.3 | 137.3 | 3.5 | % | 3,201.0 | 121.5 | 3.8 | % | ||||||||||||||||||||||||
|
Total
|
12,282.0 | 398.8 | 3.2 | % | 10,376.0 | 395.6 | 3.8 | % | 9,965.1 | 473.4 | 4.8 | % | ||||||||||||||||||||||||
|
Bonds
|
||||||||||||||||||||||||||||||||||||
|
Domestic
|
||||||||||||||||||||||||||||||||||||
|
Peso-denominated
|
5,462.7 | 348.5 | 6.4 | % | 5,709.0 | 343.7 | 6.0 | % | 5,403.1 | 393.7 | 7.3 | % | ||||||||||||||||||||||||
|
Foreign currency-denominated
|
5,306.7 | 267.9 | 5.0 | % | 4,837.3 | 245.6 | 5.1 | % | 2,550.1 | 129.5 | 5.1 | % | ||||||||||||||||||||||||
|
Total domestic
|
10,769.3 | 616.5 | 5.7 | % | 10,546.3 | 589.3 | 5.6 | % | 7,953.2 | 523.2 | 6.6 | % | ||||||||||||||||||||||||
|
Foreign
|
626.3 | 41.7 | 6.7 | % | 466.7 | 31.9 | 6.8 | % | 316.6 | 20.5 | 6.5 | % | ||||||||||||||||||||||||
|
Total
|
11,395.6 | 658.2 | 5.8 | % | 11,013.0 | 621.1 | 5.6 | % | 8,269.8 | 543.7 | 6.6 | % | ||||||||||||||||||||||||
|
Total interest-bearing liabilities
|
||||||||||||||||||||||||||||||||||||
|
Domestic
|
||||||||||||||||||||||||||||||||||||
|
Peso-denominated
|
80,124.9 | 3,078.2 | 3.8 | % | 72,113.1 | 2,892.5 | 4.0 | % | 61,125.7 | 3,202.3 | 5.2 | % | ||||||||||||||||||||||||
|
Foreign currency-denominated
|
14,226.3 | 378.9 | 2.7 | % | 12,021.2 | 364.1 | 3.0 | % | 10,552.7 | 268.4 | 2.5 | % | ||||||||||||||||||||||||
|
Total domestic
|
94,351.1 | 3,457.1 | 3.7 | % | 84,134.3 | 3,256.6 | 3.9 | % | 71,678.4 | 3,470.7 | 4.8 | % | ||||||||||||||||||||||||
|
Foreign
|
27,571.6 | 871.3 | 3.2 | % | 18,105.3 | 545.8 | 3.0 | % | 15,004.0 | 423.9 | 2.8 | % | ||||||||||||||||||||||||
|
Total
|
121,922.7 | 4,328.4 | 3.6 | % | 102,239.6 | 3,802.4 | 3.7 | % | 86,682.4 | 3,894.7 | 4.5 | % | ||||||||||||||||||||||||
|
Total non-interest-bearing liabilities and shareholders’ equity
|
41,551.4 | – | – | 34,255.5 | – | – | 31,527.6 | – | – | |||||||||||||||||||||||||||
|
Total liabilities and shareholders’ equity
|
163,474.2 | 4,328.4 | 2.6 | % | 136,495.1 | 3,802.4 | 2.8 | % | 118,210.0 | 3,894.7 | 3.3 | % | ||||||||||||||||||||||||
|
(1)
|
Includes available for sale securities, in which yields are based on historical cost balances.
|
|
(2)
|
Includes an immaterial amount of interest earned on loans rated “C,” “D” and “E.”
|
|
(3)
|
Loans past due more than 90 days for commercial loans, more than 60 days for consumer loans, more than 30 days for microcredit loans, more than 60 days for mortgages, more than 90 days for commercial financial leases and more than 60 days for consumer financial leases. See “—Loan portfolio—Risk categories.”
|
|
(4)
|
Reflects operations involving: common short-term interbank funds, repurchase transactions (repos), simultaneous operations and transactions involving the temporary transfer of securities.
|
|
(5)
|
Reflects loans made by other financial institutions including development banks and international correspondent banks.
|
Changes in net interest income and expenses – volume and rate analysis
The following tables allocate by currency of denomination, changes in our net interest income to changes in average volume, changes in nominal rates and the net change caused by changes in both average volume and nominal rates the year ended December 31, 2014 compared to the year ended December 31, 2013, and the year ended December 31, 2013 compared to the year ended December 31, 2012. Volume and rate variances have been calculated based on variances in average balances over the period and changes in nominal interest rates on average interest-earning assets and average interest-bearing liabilities. Net changes attributable to changes in both volume and interest rate have been allocated to changes in volume.
|
2014 – 2013
Increase (decrease)
due to changes in
|
2013 – 2012
Increase (decrease)
due to changes in
|
|||||||||||||||||||||||
|
Volume
|
Rate
|
Net change
|
Volume
|
Rate
|
Net change
|
|||||||||||||||||||
|
(in Ps billions)
|
||||||||||||||||||||||||
|
Interest-earning assets
|
||||||||||||||||||||||||
|
Interbank and overnight funds
|
||||||||||||||||||||||||
|
Domestic
|
||||||||||||||||||||||||
|
Peso-denominated
|
(8.9 | ) | 52.9 | 44.0 | (8.5 | ) | (48.5 | ) | (57.0 | ) | ||||||||||||||
|
Foreign currency-denominated
|
(4.4 | ) | (37.6 | ) | (42.0 | ) | (13.1 | ) | 51.3 | 38.1 | ||||||||||||||
|
Total domestic
|
(13.3 | ) | 15.3 | 2.0 | (21.6 | ) | 2.7 | (18.9 | ) | |||||||||||||||
|
Investment securities
|
||||||||||||||||||||||||
|
Domestic
|
||||||||||||||||||||||||
|
Peso-denominated
|
89.5 | (173.8 | ) | (84.3 | ) | 155.0 | (223.6 | ) | (68.6 | ) | ||||||||||||||
|
Foreign currency-denominated
|
21.3 | 28.8 | 50.1 | (21.2 | ) | (4.2 | ) | (25.4 | ) | |||||||||||||||
|
Total domestic
|
110.8 | (145.1 | ) | (34.3 | ) | 133.8 | (227.8 | ) | (94.0 | ) | ||||||||||||||
|
Loans and financial leases (1)
|
||||||||||||||||||||||||
|
Domestic
|
||||||||||||||||||||||||
|
Peso-denominated
|
860.2 | (471.8 | ) | 388.4 | 744.8 | (486.4 | ) | 258.4 | ||||||||||||||||
|
Foreign currency-denominated
|
37.6 | (2.0 | ) | 35.6 | 45.3 | (31.5 | ) | 13.8 | ||||||||||||||||
|
Total domestic
|
897.8 | (473.8 | ) | 424.0 | 790.1 | (517.9 | ) | 272.2 | ||||||||||||||||
|
Total interest-earning assets
|
||||||||||||||||||||||||
|
Domestic
|
||||||||||||||||||||||||
|
Peso-denominated
|
940.9 | (592.8 | ) | 348.0 | 891.3 | (758.5 | ) | 132.8 | ||||||||||||||||
|
Foreign currency-denominated
|
54.5 | (10.8 | ) | 43.7 | 10.9 | 15.6 | 26.5 | |||||||||||||||||
|
Total domestic
|
995.4 | (603.6 | ) | 391.7 | 902.2 | (742.9 | ) | 159.3 | ||||||||||||||||
|
Foreign
|
– | – | 711.3 | – | – | 419.1 | ||||||||||||||||||
|
Total interest-earning assets
|
1,772.3 | (669.2 | ) | 1,103.1 | 1,333.1 | (754.7 | ) | 578.4 | ||||||||||||||||
|
2014 – 2013
Increase (decrease)
due to changes in
|
2013 – 2012
Increase (decrease)
due to changes in
|
|||||||||||||||||||||||
|
Volume
|
Rate
|
Net change
|
Volume
|
Rate
|
Net change
|
|||||||||||||||||||
|
(in Ps billions)
|
||||||||||||||||||||||||
|
Interest-bearing liabilities
|
||||||||||||||||||||||||
|
Checking accounts
|
||||||||||||||||||||||||
|
Domestic
|
||||||||||||||||||||||||
|
Peso-denominated
|
22.2 | (13.8 | ) | 8.4 | 30.6 | (42.4 | ) | (11.8 | ) | |||||||||||||||
|
Foreign currency-denominated
|
0.2 | 0.9 | 1.1 | (1.5 | ) | (3.0 | ) | (4.6 | ) | |||||||||||||||
|
Total
domestic
|
22.5 | (13.0 | ) | 9.5 | 29.1 | (45.5 | ) | (16.4 | ) | |||||||||||||||
|
Savings deposits
|
||||||||||||||||||||||||
|
Domestic
|
||||||||||||||||||||||||
|
Peso-denominated
|
189.6 | (13.6 | ) | 176.0 | 232.2 | (237.6 | ) | (5.4 | ) | |||||||||||||||
|
Foreign currency-denominated
|
(0.6 | ) | (1.1 | ) | (1.7 | ) | (0.8 | ) | (0.1 | ) | (0.9 | ) | ||||||||||||
|
Total domestic
|
189.0 | (14.7 | ) | 174.2 | 231.4 | (237.7 | ) | (6.3 | ) | |||||||||||||||
|
Time deposits
|
||||||||||||||||||||||||
|
Domestic
|
||||||||||||||||||||||||
|
Peso-denominated
|
111.3 | (49.6 | ) | 61.8 | 81.3 | (180.4 | ) | (99.1 | ) | |||||||||||||||
|
Foreign currency-denominated
|
20.7 | (4.2 | ) | 16.5 | 8.6 | (8.1 | ) | 0.6 | ||||||||||||||||
|
Total
domestic
|
132.0 | (53.8 | ) | 78.3 | 89.9 | (188.4 | ) | (98.5 | ) | |||||||||||||||
|
2014 – 2013
Increase (decrease)
due to changes in
|
2013 – 2012
Increase (decrease)
due to changes in
|
|||||||||||||||||||||||
|
Volume
|
Rate
|
Net change
|
Volume
|
Rate
|
Net change
|
|||||||||||||||||||
|
(in Ps billions)
|
||||||||||||||||||||||||
|
Interbank borrowings and overnight funds
|
||||||||||||||||||||||||
|
Domestic
|
||||||||||||||||||||||||
|
Peso-denominated
|
8.0 | 21.1 | 29.1 | 10.7 | (84.0 | ) | (73.3 | ) | ||||||||||||||||
|
Foreign currency-denominated
|
0.9 | (8.1 | ) | (7.2 | ) | (2.1 | ) | 10.0 | 7.9 | |||||||||||||||
|
Total
domestic
|
8.8 | 13.1 | 21.9 | 8.6 | (74.0 | ) | (65.4 | ) | ||||||||||||||||
|
Borrowings from banks and others
|
||||||||||||||||||||||||
|
Domestic
|
||||||||||||||||||||||||
|
Peso-denominated
|
(59.6 | ) | (34.8 | ) | (94.3 | ) | 12.7 | (82.9 | ) | (70.2 | ) | |||||||||||||
|
Foreign currency-denominated
|
2.9 | (19.2 | ) | (16.3 | ) | (6.8 | ) | (16.6 | ) | (23.3 | ) | |||||||||||||
|
Total
domestic
|
(56.7 | ) | (54.0 | ) | (110.7 | ) | 5.9 | (99.5 | ) | (93.5 | ) | |||||||||||||
|
Long-term debt (bonds)
|
||||||||||||||||||||||||
|
Domestic
|
||||||||||||||||||||||||
|
Peso-denominated
|
(15.7 | ) | 20.5 | 4.8 | 18.4 | (68.3 | ) | (49.9 | ) | |||||||||||||||
|
Foreign currency-denominated
|
23.7 | (1.3 | ) | 22.4 | 116.1 | (0.1 | ) | 116.0 | ||||||||||||||||
|
Total
domestic
|
8.0 | 19.2 | 27.2 | 134.5 | (68.4 | ) | 66.1 | |||||||||||||||||
|
Total interest-bearing liabilities
|
||||||||||||||||||||||||
|
Domestic
|
||||||||||||||||||||||||
|
Peso-denominated
|
255.8 | (70.2 | ) | 185.7 | 385.8 | (695.7 | ) | (309.8 | ) | |||||||||||||||
|
Foreign currency-denominated
|
47.8 | (33.0 | ) | 14.8 | 113.6 | (17.9 | ) | 95.7 | ||||||||||||||||
|
Total
domestic
|
303.6 | (103.2 | ) | 200.5 | 499.4 | (713.6 | ) | (214.1 | ) | |||||||||||||||
|
Foreign
|
– | – | 325.5 | – | – | 121.9 | ||||||||||||||||||
|
Total
interest-bearing liabilities
|
598.6 | (72.6 | ) | 526.0 | 583.7 | (675.9 | ) | (92.3 | ) | |||||||||||||||
|
(1)
|
Includes an immaterial amount of interest earned on loans rated “C,” “D” and “E.”
|
Interest-earning assets – net interest margin and spread
The following table presents average balances of interest-earning assets as well as our yields on our average interest-earning assets, net interest earned, net interest margin and interest spread for the years ended December 31, 2014, 2013 and 2012.
|
For the year ended December 31,
|
||||||||||||
|
2014
|
2013
|
2012
|
||||||||||
|
(in Ps billions, except percentages)
|
||||||||||||
|
Interbank and overnight funds
|
||||||||||||
|
Domestic
|
||||||||||||
|
Peso-denominated
|
1,274.6 | 1,347.8 | 1,451.4 | |||||||||
|
Foreign currency-denominated
|
402.2 | 661.3 | 839.0 | |||||||||
|
Total Domestic
|
1,676.9 | 2,009.2 | 2,290.4 | |||||||||
|
Foreign
|
753.5 | 770.5 | 801.8 | |||||||||
|
Total
|
2,430.4 | 2,779.7 | 3,092.3 | |||||||||
|
Investment securities
|
||||||||||||
|
Domestic
|
||||||||||||
|
Peso-denominated
|
21,261.2 | 19,343.8 | 16,559.8 | |||||||||
|
Foreign currency-denominated
|
2,853.4 | 2,310.9 | 3,101.4 | |||||||||
|
Total Domestic
|
24,114.6 | 21,654.7 | 19,661.2 | |||||||||
|
Foreign
|
4,018.5 | 3,319.9 | 1,802.1 | |||||||||
|
Total
|
28,133.1 | 24,974.6 | 21,463.3 | |||||||||
|
Loans and financial leases (1)
|
||||||||||||
|
Domestic
|
||||||||||||
|
Peso-denominated
|
71,126.4 | 63,179.1 | 56,742.4 | |||||||||
|
Foreign currency-denominated
|
7,761.7 | 6,433.3 | 4,850.8 | |||||||||
|
Total Domestic
|
78,888.2 | 69,612.5 | 61,593.2 | |||||||||
|
Foreign
|
21,625.1 | 14,337.7 | 11,465.8 | |||||||||
|
Total
|
100,513.2 | 83,950.2 | 73,059.0 | |||||||||
|
For the year ended December 31,
|
||||||||||||
|
2014
|
2013
|
2012
|
||||||||||
|
(in Ps billions, except percentages)
|
||||||||||||
|
Total average interest-earning assets
|
||||||||||||
|
Domestic
|
||||||||||||
|
Peso-denominated
|
93,662.2 | 83,870.7 | 74,753.6 | |||||||||
|
Foreign currency-denominated
|
11,017.4 | 9,405.6 | 8,791.2 | |||||||||
|
Total Domestic
|
104,679.6 | 93,276.3 | 83,544.8 | |||||||||
|
Foreign
|
26,397.1 | 18,428.1 | 14,069.7 | |||||||||
|
Total
|
131,076.7 | 111,704.4 | 97,614.5 | |||||||||
|
Net interest earned (2)
|
||||||||||||
|
Domestic
|
||||||||||||
|
Peso-denominated
|
5,768.2 | 5,605.9 | 5,163.3 | |||||||||
|
Foreign currency-denominated
|
(40.4 | ) | (69.4 | ) | (0.2 | ) | ||||||
|
Total Domestic
|
5,727.8 | 5,536.5 | 5,163.0 | |||||||||
|
Foreign
|
1,830.3 | 1,444.5 | 1,147.3 | |||||||||
|
Total
|
7,558.1 | 6,981.0 | 6,310.3 | |||||||||
|
Average yield on interest-earning assets
|
||||||||||||
|
Domestic
|
||||||||||||
|
Peso-denominated
|
9.4 | % | 10.1 | % | 11.2 | % | ||||||
|
Foreign currency-denominated
|
3.1 | % | 3.1 | % | 3.1 | % | ||||||
|
Total Domestic
|
8.8 | % | 9.4 | % | 10.3 | % | ||||||
|
Foreign
|
10.2 | % | 10.8 | % | 11.2 | % | ||||||
|
Total
|
9.1 | % | 9.7 | % | 10.5 | % | ||||||
|
Net interest margin (3)
|
||||||||||||
|
Domestic
|
||||||||||||
|
Peso-denominated
|
6.2 | % | 6.7 | % | 6.9 | % | ||||||
|
Foreign currency-denominated
|
(0.4 | )% | (0.7 | )% | – | |||||||
|
Total Domestic
|
5.5 | % | 5.9 | % | 6.2 | % | ||||||
|
Foreign
|
6.9 | % | 7.8 | % | 8.2 | % | ||||||
|
Total
|
5.8 | % | 6.2 | % | 6.5 | % | ||||||
|
Interest spread on loans and financial leases (4)
|
||||||||||||
|
Domestic
|
||||||||||||
|
Peso-denominated
|
7.0 | % | 7.6 | % | 7.2 | % | ||||||
|
Foreign currency-denominated
|
0.2 | % | (0.2 | )% | 1.0 | % | ||||||
|
Total Domestic
|
6.4 | % | 6.9 | % | 6.9 | % | ||||||
|
Foreign
|
8.1 | % | 9.5 | % | 10.1 | % | ||||||
|
Total
|
6.8 | % | 7.3 | % | 7.4 | % | ||||||
|
Interest spread on total interest-earning assets (5)
|
||||||||||||
|
Domestic
|
||||||||||||
|
Peso-denominated
|
5.6 | % | 6.1 | % | 6.0 | % | ||||||
|
Foreign currency-denominated
|
0.4 | % | 0.1 | % | 0.5 | % | ||||||
|
Total Domestic
|
5.1 | % | 5.6 | % | 5.5 | % | ||||||
|
Foreign
|
7.1 | % | 7.8 | % | 8.3 | % | ||||||
|
Total
|
5.5 | % | 5.9 | % | 6.0 | % | ||||||
|
(1)
|
Includes immaterial amount of interest earned on loans rated “C,” “D” and “E” for each year presented.
|
|
(2)
|
Net interest earned is calculated as interest income less interest paid and includes accrued interest, valuation adjustments and gains (losses) realized on debt and equity securities that are accounted for as “available for sale,” gains (losses) on repurchase transactions (repos), gains (losses) realized on the sale of debt securities, and mark-to-market gains (losses) on trading securities portfolio.
|
|
(3)
|
Net interest margin is calculated as net interest income divided by total average interest-earning assets, determined based on monthly ending balances during the applicable period.
|
|
(4)
|
Interest spread on loans and financial leases is calculated as the difference between the average yield on interest-earning loans and financial leases and the average rate paid on interest-bearing liabilities.
|
|
(5)
|
Interest spread on total interest-earning assets is calculated as the difference between the average yield on interest-earning assets and the average rate paid on interest-bearing liabilities.
|
Investment portfolio
We acquire and hold fixed income debt and equity securities for liquidity and other strategic purposes, or when required by law. In recent years, credit institutions, including our banking subsidiaries, have been required to hold certain debt securities issued by the Colombian government or government-related entities. Central Bank regulations require credit institutions to make investments in agricultural development bonds (
Títulos de Desarrollo Agropecuario
), or “TDAs,” issued by the Agricultural Sector Financing Fund (
Fondo para el Financiamiento del Sector Agropecuario
), or “Finagro.” Finagro is a development bank affiliated with the Ministry of Agriculture and finances the production and marketing activities of the agricultural and livestock sector. These securities yield below-market interest rates. The amount of these mandatory investments are calculated as a percentage of short-term deposits. Additionally our banking subsidiaries still maintain mandatory investments in reduction bonds (
Títulos de Reducción de Deuda
) issued by the Republic of Colombia. Under government discretion, authorities may extend the scope of current regulations or require additional disbursements on current or new mandatory investments. See “—Mandatory investments.”
The Superintendency of Finance requires investments to be classified as “trading,” “available for sale” or “held to maturity.” Trading investments are investments acquired primarily to obtain profits from fluctuations in short-term prices and are recorded at fair value. The difference between current and previous fair value is added to, or subtracted from, the value of the investment and credited or charged to earnings. “Available for sale” investments are those investments that we intend, and are able, to hold for at least six months and are recorded on the balance sheet at fair value with changes to the values of these securities recorded in a separate equity account labeled as “unrealized gains and losses”; when a portion of the gains or losses is realized, such amount is transferred to the consolidated income statement. “Held to maturity” investments are investments acquired and that we intend, and are able, to hold until maturity, and are recorded at amortized cost.
In accordance with Chapter 1 of Circular 100 of 1995 issued by the Superintendency of Finance, investments in debt securities are fully reviewed for impairment in June and December and partially reviewed every three months, by considering factors such as related solvency, market conditions, currency exchange rate and country risks. Investments in securities with certain ratings by external rating agencies recognized by the Superintendency of Finance cannot be recorded on our balance sheet for an amount higher than specified percentages of the face value, net of amortizations recorded at the valuation date, as follows:
|
Long-term classification
|
Maximum face value (%)
|
|||
|
BB+, BB, BB-
|
90 | |||
|
B+, B, B-
|
70 | |||
|
CCC
|
50 | |||
|
DD, EE
|
– | |||
|
Short-term classification
|
Maximum face value (%)
|
|||
|
3
|
90 | |||
|
4
|
50 | |||
|
5 and 6
|
– | |||
Debt securities issued or guaranteed by the Republic of Colombia in domestic or international capital markets, as well as those issued by the Colombian Central Bank and those issued or guaranteed by FOGAFIN, are not subject to this adjustment.
The following table presents the book value of our investments in debt securities and equity securities, net of allowance for investment securities losses, at the dates indicated.
|
At December 31,
|
||||||||||||
|
2014
|
2013
|
2012
|
||||||||||
|
(in Ps billions)
|
||||||||||||
|
Debt securities
|
||||||||||||
|
Peso-denominated
|
||||||||||||
|
Securities issued or secured by the Republic of Colombia (1)
|
12,869.8 | 13,525.5 | 10,930.9 | |||||||||
|
Securities issued or secured by the Colombian Central Bank
|
– | – | – | |||||||||
|
Securities issued or secured by other Colombian government entities
|
2,462.3 | 2,650.8 | 2,408.4 | |||||||||
|
Securities issued or secured by other financial entities (2)
|
592.3 | 555.2 | 387.1 | |||||||||
|
Other securities (3)
|
233.0 | 265.9 | 442.7 | |||||||||
|
Total peso-denominated
|
16,157.3 | 16,997.4 | 14,169.0 | |||||||||
|
Foreign currency-denominated
|
||||||||||||
|
Securities issued or secured by the Republic of Colombia (1)
|
1,043.2 | 718.5 | 537.4 | |||||||||
|
Securities issued or secured by other Colombian government entities
|
326.7 | 252.6 | 221.7 | |||||||||
|
Securities issued by foreign governments
|
1,593.5 | 1,327.7 | 1,069.9 | |||||||||
|
Securities issued or secured by other financial entities (2)
|
4,044.3 | 3,085.5 | 2,425.9 | |||||||||
|
Other securities (3)
|
1,359.7 | 1,190.3 | 1,290.1 | |||||||||
|
Total foreign currency-denominated
|
8,367.5 | 6,574.7 | 5,545.0 | |||||||||
|
Total debt securities, net
|
24,524.8 | 23,572.1 | 19,714.0 | |||||||||
|
Equity securities, net
|
4,066.2 | 3,726.5 | 3,581.8 | |||||||||
|
Total investment securities, net
|
28,591.0 | 27,298.6 | 23,295.8 | |||||||||
|
(1)
|
Includes Colombian Government-issued treasuries (
Títulos de Tesorería
), or “TESs.”
|
|
(2)
|
Reflects investments made in debt securities issued by private financial entities.
|
|
(3)
|
Reflects investments made in debt securities issued by multilateral institutions and non-financial companies.
|
At December 31, 2014, 2013 and 2012, we held securities issued by foreign governments and in the principal amounts, as follows.
|
At
December 31,
|
Issuer
|
Investment amount – book value
|
Investment amount – book value
|
|||||||
|
(in Ps billions)
|
(in U.S.$ thousands)
|
|||||||||
|
2014
|
||||||||||
|
Brazil
|
28.7 | 11,991 | ||||||||
|
Costa Rica
|
565.7 | 236,471 | ||||||||
|
Mexico
|
33.0 | 13,793 | ||||||||
|
Panama
|
379.6 | 158,668 | ||||||||
|
United States of America
|
50.9 | 21,277 | ||||||||
|
El Salvador
|
49.7 | 20,764 | ||||||||
|
Guatemala
|
126.6 | 52,904 | ||||||||
|
Nicaragua
|
1.7 | 702 | ||||||||
|
Peru
|
12.5 | 5,240 | ||||||||
|
Honduras
|
345.1 | 144,261 | ||||||||
|
Total 2014
|
1,593.5 | 666,071 | ||||||||
|
2013
|
||||||||||
|
Brazil
|
23.3 | 12,090 | ||||||||
|
Costa Rica
|
450.5 | 233,788 | ||||||||
|
Mexico
|
24.0 | 12,464 | ||||||||
|
Panama
|
141.0 | 73,161 | ||||||||
|
United States of America
|
40.9 | 21,223 | ||||||||
|
El Salvador
|
115.4 | 59,893 | ||||||||
|
Guatemala
|
291.8 | 151,418 | ||||||||
|
Barbados
|
4.3 | 2,246 | ||||||||
|
Nicaragua
|
1.9 | 991 | ||||||||
|
Peru
|
19.8 | 10,257 | ||||||||
|
Honduras
|
214.9 | 111,553 | ||||||||
|
Total 2013
|
1,327.8 | 689,085 | ||||||||
|
2012
|
||||||||||
|
Brazil
|
20.4 | 11,525 | ||||||||
|
Costa Rica
|
572.2 | 323,600 | ||||||||
|
Mexico
|
9.4 | 5,307 | ||||||||
|
Panama
|
204.4 | 115,613 | ||||||||
|
United States of America
|
14.7 | 8,334 | ||||||||
|
El Salvador
|
47.8 | 27,046 | ||||||||
|
Chile
|
9.6 | 5,439 | ||||||||
|
Guatemala
|
61.7 | 34,897 | ||||||||
|
Nicaragua
|
1.8 | 1,024 | ||||||||
|
Honduras
|
127.9 | 72,305 | ||||||||
|
Total 2012
|
1,069.9 | 605,090 | ||||||||
Investment securities portfolio maturity
The following table summarizes the maturities and weighted average nominal yields of our debt investment securities at December 31, 2014 issued by governments or government entities.
|
At December 31, 2014
|
||||||||||||||||||||||||||||||||||||||||
|
Maturity less than
1 year
|
Maturity between 1 and 5 years
|
Maturity between 5 and 10 years
|
Maturity more than 10 years
|
Total
|
||||||||||||||||||||||||||||||||||||
|
Balance (1)
|
Yield % (2)
|
Balance (1)
|
Yield % (2)
|
Balance (1)
|
Yield % (2)
|
Balance (1)
|
Yield % (2)
|
Balance (1)
|
Yield % (2)
|
|||||||||||||||||||||||||||||||
|
(in Ps billions, except yields)
|
||||||||||||||||||||||||||||||||||||||||
|
Debt securities
|
||||||||||||||||||||||||||||||||||||||||
|
Peso-denominated
|
||||||||||||||||||||||||||||||||||||||||
|
Securities issued or secured by the Colombian Government
|
1,590.4 | 4.8 | 5,160.6 | 5.3 | 5,615.2 | 6.8 | 503.6 | 7.6 | 12,869.8 | 6.0 | ||||||||||||||||||||||||||||||
|
Securities issued or secured by the Colombian Central Bank
|
– | – | – | – | – | – | – | – | – | – | ||||||||||||||||||||||||||||||
|
Securities issued or secured by Colombian government entities
|
2,410.9 | 2.3 | 5.4 | 6.4 | 46.0 | 7.3 | – | – | 2,462.3 | 2.4 | ||||||||||||||||||||||||||||||
|
Securities issued or secured by other financial entities
|
108.6 | 6.8 | 473.6 | 5.7 | 10.1 | 7.1 | – | – | 592.3 | 6.0 | ||||||||||||||||||||||||||||||
|
Other securities
|
0.9 | 3.3 | 22.0 | 5.4 | 178.6 | 5.8 | 31.4 | 11.0 | 233.0 | 6.5 | ||||||||||||||||||||||||||||||
|
Total peso-denominated
|
4,110.8 | 3.4 | 5,661.6 | 5.4 | 5,849.9 | 6.8 | 535.0 | 7.8 | 16,157.3 | 5.5 | ||||||||||||||||||||||||||||||
|
Foreign currency-denominated
|
||||||||||||||||||||||||||||||||||||||||
|
Securities issued or secured by the Colombian Government
|
– | – | 990.1 | 2.2 | 53.0 | 3.5 | – | – | 1,043.2 | 2.3 | ||||||||||||||||||||||||||||||
|
Securities issued or secured by Colombian government entities
|
– | – | 82.8 | 3.8 | 243.9 | 4.9 | – | – | 326.7 | 4.7 | ||||||||||||||||||||||||||||||
|
Securities issued by foreign governments
|
467.9 | 4.4 | 830.5 | 7.4 | 287.1 | 5.4 | 8.1 | 6.0 | 1,593.5 | 6.1 | ||||||||||||||||||||||||||||||
|
Securities issued or secured by other financial entities
|
1,551.5 | 2.0 | 1,687.0 | 4.2 | 805.8 | 4.5 | – | – | 4,044.3 | 3.4 | ||||||||||||||||||||||||||||||
|
Other securities
|
64.4 | 1.7 | 201.3 | 4.5 | 1,094.0 | 5.4 | 0.0 | 4.4 | 1,359.7 | 5.1 | ||||||||||||||||||||||||||||||
|
Total foreign currency-denominated
|
2,083.8 | 2.5 | 3,791.6 | 4.4 | 2,483.9 | 5.0 | 8.1 | 6.0 | 8,367.5 | 4.1 | ||||||||||||||||||||||||||||||
|
Total debt securities, net
|
6,194.6 | – | 9,453.2 | – | 8,333.8 | – | 543.1 | – | 24,524.8 | – | ||||||||||||||||||||||||||||||
|
Equity securities, net
|
– | – | – | – | – | – | – | – | 4,066.2 | – | ||||||||||||||||||||||||||||||
|
Total investment securities, net
|
– | – | – | – | – | – | – | – | 28,591.0 | – | ||||||||||||||||||||||||||||||
|
(1)
|
Amounts for debt securities are net of allowances for decline in value, which amounted to Ps 318 million at December 31, 2014. Amounts for equity securities are net of allowances, which amounted to Ps 4.144 million at December 31, 2014.
|
|
(2)
|
Yield was calculated using the internal rate of return, or “IRR,” at December 31, 2014.
|
At December 31, 2014, we had the following investments in securities of issuers that exceeded 10% of our shareholders’ equity.
|
December 31, 2014
|
||||||||||
|
Issuer
|
Book value
|
Market value
|
||||||||
|
(in Ps billions)
|
||||||||||
|
Securities issued or secured by the Colombian Central government
|
Ministry of Finance
|
13,805.5 | 13,803.1 | |||||||
|
Securities issued or secured by Colombian government entities
|
Finagro
|
2,391.3 | 2,372.6 | |||||||
|
Securities issued by other financial entities
|
Titularizadora Colombiana S.A. (1)
|
201.4 | 201.0 | |||||||
|
Total
|
16,398.3 | 16,376.7 | ||||||||
|
(1)
|
Titularizadora Colombiana S.A. is a corporation that focuses on mortgage loan securitization and is owned by International Finance Corporation, an affiliate of the World Bank, and certain Colombian mortgage lenders.
|
Loan portfolio
The following table presents our loan portfolio classified into commercial, consumer, microcredit, financial leases and mortgage loans for the periods indicated.
|
At December 31,
|
||||||||||||||||||||
|
2014
|
2013
|
2012
|
2011
|
2010
|
||||||||||||||||
| (in Ps billions) | ||||||||||||||||||||
|
Domestic
|
||||||||||||||||||||
|
Commercial
|
||||||||||||||||||||
|
General purpose loans (1)
|
39,751.2 | 35,442.9 | 29,971.2 | 25,969.1 | 22,503.6 | |||||||||||||||
|
Loans funded by development banks
|
1,974.0 | 1,658.4 | 1,661.9 | 1,871.4 | 1,634.2 | |||||||||||||||
|
Working capital loans
|
9,285.2 | 8,773.8 | 9,149.6 | 8,562.4 | 6,611.1 | |||||||||||||||
|
Credit cards
|
381.4 | 315.3 | 242.6 | 183.5 | 161.4 | |||||||||||||||
|
Overdrafts
|
171.7 | 152.9 | 194.9 | 185.3 | 115.3 | |||||||||||||||
|
Total commercial
|
51,563.5 | 46,343.3 | 41,220.2 | 36,771.7 | 31,025.5 | |||||||||||||||
|
Consumer
|
||||||||||||||||||||
|
Credit cards
|
3,499.2 | 2,983.3 | 2,289.7 | 1,735.3 | 1,462.1 | |||||||||||||||
|
Personal loans
|
17,047.4 | 15,357.2 | 14,202.8 | 11,822.2 | 9,697.2 | |||||||||||||||
|
Automobile and vehicle loans
|
2,516.2 | 2,133.2 | 1,935.3 | 1,706.8 | 1,493.3 | |||||||||||||||
|
Overdrafts
|
43.0 | 44.9 | 53.6 | 53.2 | 47.7 | |||||||||||||||
|
Loans funded by development banks
|
0.1 | 0.2 | 0.2 | 0.2 | – | |||||||||||||||
|
General purpose loans
|
160.4 | 151.6 | 157.9 | 160.0 | 151.2 | |||||||||||||||
|
Working capital loans
|
– | – | 1.4 | – | – | |||||||||||||||
|
Total consumer
|
23,266.3 | 20,670.5 | 18,640.8 | 15,477.7 | 12,851.5 | |||||||||||||||
|
Microcredit
|
351.8 | 341.9 | 290.9 | 284.2 | 250.1 | |||||||||||||||
|
Mortgages
|
2,905.6 | 1,879.9 | 1,073.3 | 834.6 | 755.3 | |||||||||||||||
|
Financial leases
|
6,915.0 | 6,624.1 | 6,223.9 | 4,917.8 | 3,541.3 | |||||||||||||||
|
Total domestic
|
85,002.1 | 75,859.7 | 67,449.2 | 58,285.9 | 48,423.8 | |||||||||||||||
|
Foreign
|
||||||||||||||||||||
|
Commercial
|
||||||||||||||||||||
|
General purpose loans (1)
|
6,791.8 | 4,090.0 | 2,285.6 | 2,168.9 | 1,945.3 | |||||||||||||||
|
Loans funded by development banks
|
– | – | – | – | – | |||||||||||||||
|
Working capital loans
|
4,183.3 | 4,227.5 | 1,959.3 | 1,549.4 | 1,133.9 | |||||||||||||||
|
Credit cards
|
– | – | – | – | – | |||||||||||||||
|
Overdrafts
|
226.2 | 194.8 | 49.1 | 55.5 | 53.3 | |||||||||||||||
|
Total commercial
|
11,201.3 | 8,512.3 | 4,294.0 | 3,773.8 | 3,132.6 | |||||||||||||||
|
At December 31,
|
||||||||||||||||||||
|
2014
|
2013
|
2012
|
2011
|
2010
|
||||||||||||||||
|
(in Ps billions)
|
||||||||||||||||||||
|
Consumer
|
||||||||||||||||||||
|
Credit cards
|
5,249.8 | 3,814.6 | 3,066.8 | 2,714.5 | 2,466.3 | |||||||||||||||
|
Personal loans
|
3,073.4 | 2,165.9 | 757.3 | 675.0 | 545.8 | |||||||||||||||
|
Automobile and vehicle loans
|
1,540.0 | 1,123.9 | 892.8 | 856.9 | 726.7 | |||||||||||||||
|
Overdrafts
|
37.0 | 26.4 | 22.4 | 11.7 | – | |||||||||||||||
|
Loans funded by development banks
|
– | – | – | – | – | |||||||||||||||
|
General purpose loans
|
– | – | – | – | – | |||||||||||||||
|
Working capital loans
|
– | – | – | – | 35.0 | |||||||||||||||
|
Total consumer
|
9,900.1 | 7,130.8 | 4,739.4 | 4,258.2 | 3,773.7 | |||||||||||||||
|
Microcredit
|
– | – | – | – | – | |||||||||||||||
|
Mortgages
|
6,129.1 | 4,640.2 | 3,275.0 | 3,383.8 | 3,089.0 | |||||||||||||||
|
Financial leases
|
523.4 | 370.8 | 271.8 | 246.0 | 204.6 | |||||||||||||||
|
Total foreign
|
27,753.9 | 20,654.2 | 12,580.2 | 11,661.8 | 10,199.9 | |||||||||||||||
|
Total portfolio
|
112,756.1 | 96,513.8 | 80,029.4 | 69,947.7 | 58,623.6 | |||||||||||||||
|
Allowance for loan portfolio
|
(3,413.7 | ) | (3,073.0 | ) | (2,545.6 | ) | (2,306.5 | ) | (2,183.9 | ) | ||||||||||
|
Total portfolio, net
|
109,342.4 | 93,440.8 | 77,483.8 | 67,641.2 | 56,439.7 | |||||||||||||||
|
(1)
|
General purpose commercial loans primarily include short-term loans
(créditos de tesorería
), trade finance loans, project finance loans and loans for capital expenditures.
|
We classify our loan portfolio into the following categories:
|
|
·
|
Commercial loans
: Commercial loans are granted to companies or individuals to carry out economic activities.
|
|
|
·
|
Consumer loans
: Consumer loans are granted to individuals for the purchase of consumer goods or to pay for non-commercial or non-business services.
|
|
|
·
|
Microcredit loans
: Microcredit loans are issued for the purpose of encouraging the activities of small businesses and are subject to the following requirements: the maximum amount to be lent is equal to 25 times the minimum wage (
salario mínimo mensual legal vigente
), or “SMMLV,” without the balance of one single borrower exceeding such amount at any time, and the main source of payment for the corresponding obligation shall be the revenues obtained from the activities of the borrower’s micro business. The borrower’s outstanding indebtedness may not exceed 120 times the SMMLV.
|
|
|
·
|
Mortgages
: Mortgages are loans granted to individuals for the purchase of new or used housing or to build a home, all in accordance with Law 546 of 1999. These loans include loans that are denominated in UVR or Colombian pesos, are guaranteed by a senior mortgage on the property and that are financed with a total repayment term of five to 30 years.
|
|
|
·
|
Financial leases
: Financial leases are transactions involving the transfer under a lease agreement of property where financing is provided in exchange for rental payments that are paid over a period of time; the lessee has an option to purchase the property at the end of such period.
|
Maturity and interest rate sensitivity of loans and financial leases
The following table presents the maturities of our loan portfolio at December 31, 2014.
|
At December 31, 2014
|
||||||||||||||||
|
Due in one
year or less
|
Due from
one to five
years
|
Due after
five years
|
Total
|
|||||||||||||
|
(in Ps billions)
|
||||||||||||||||
|
Domestic
|
||||||||||||||||
|
Commercial
|
||||||||||||||||
|
General purpose loans
|
18,202.2 | 16,404.1 | 5,144.9 | 39,751.2 | ||||||||||||
|
Loans funded by development banks
|
649.6 | 976.3 | 348.2 | 1,974.0 | ||||||||||||
|
Working capital loans
|
8,132.2 | 870.5 | 282.5 | 9,285.2 | ||||||||||||
|
Credit cards
|
234.5 | 145.5 | 1.4 | 381.4 | ||||||||||||
|
Overdrafts
|
171.7 | – | – | 171.7 | ||||||||||||
|
Total commercial
|
27,390.1 | 18,396.4 | 5,777.0 | 51,563.5 | ||||||||||||
|
Consumer
|
||||||||||||||||
|
Credit cards
|
2,167.2 | 1,299.9 | 32.1 | 3,499.2 | ||||||||||||
|
Personal loans
|
4,585.5 | 10,877.6 | 1,584.3 | 17,047.4 | ||||||||||||
|
Automobile and vehicle loans
|
664.3 | 1,714.6 | 137.3 | 2,516.2 | ||||||||||||
|
Overdrafts
|
43.0 | – | – | 43.0 | ||||||||||||
|
Loans funded by development banks
|
– | – | – | 0.1 | ||||||||||||
|
General purpose loans
|
74.8 | 84.6 | 0.9 | 160.4 | ||||||||||||
|
Working capital loans
|
– | – | – | – | ||||||||||||
|
Total consumer
|
7,534.8 | 13,976.8 | 1,754.7 | 23,266.3 | ||||||||||||
|
Microcredit
|
169.2 | 182.3 | 0.3 | 351.8 | ||||||||||||
|
Mortgages
|
296.9 | 828.0 | 1,780.6 | 2,905.6 | ||||||||||||
|
Financial leases
|
1,880.1 | 3,584.4 | 1,450.5 | 6,915.0 | ||||||||||||
|
Total domestic portfolio
|
37,271.1 | 36,967.9 | 10,763.1 | 85,002.1 | ||||||||||||
|
Foreign
|
||||||||||||||||
|
Commercial
|
||||||||||||||||
|
General purpose loans
|
1,284.1 | 2,040.6 | 3,467.2 | 6,791.8 | ||||||||||||
|
Loans funded by development banks
|
– | – | – | – | ||||||||||||
|
Working capital loans
|
3,762.1 | 355.3 | 65.9 | 4,183.3 | ||||||||||||
|
Credit cards
|
– | – | – | – | ||||||||||||
|
Overdrafts
|
220.7 | 5.5 | – | 226.2 | ||||||||||||
|
Total commercial
|
5,266.9 | 2,401.3 | 3,533.1 | 11,201.3 | ||||||||||||
|
Consumer
|
||||||||||||||||
|
Credit cards
|
5,102.8 | 129.0 | 18.0 | 5,249.8 | ||||||||||||
|
Personal loans
|
92.0 | 587.7 | 2,393.7 | 3,073.4 | ||||||||||||
|
Automobile and vehicle loans
|
21.4 | 808.2 | 710.4 | 1,540.0 | ||||||||||||
|
Overdrafts
|
37.0 | – | – | 37.0 | ||||||||||||
|
Loans funded by development banks
|
– | – | – | – | ||||||||||||
|
General purpose loans
|
– | – | – | – | ||||||||||||
|
Working capital loans
|
– | – | – | – | ||||||||||||
|
Total consumer
|
5,253.2 | 1,524.8 | 3,122.1 | 9,900.1 | ||||||||||||
|
Microcredit
|
– | – | – | – | ||||||||||||
|
Mortgages
|
8.1 | 116.3 | 6,004.7 | 6,129.1 | ||||||||||||
|
Financial leases
|
19.9 | 396.0 | 107.5 | 523.4 | ||||||||||||
|
Total foreign portfolio
|
10,548.1 | 4,438.4 | 12,767.4 | 27,753.9 | ||||||||||||
|
Total loan portfolio
|
47,819.2 | 41,406.3 | 23,530.5 | 112,756.1 | ||||||||||||
The following table presents the interest rate sensitivity of our loan portfolio due after one year and within one year or less at December 31, 2014.
|
At December 31, 2014
|
||||
|
(in Ps billions)
|
||||
|
Loans with maturity of one year or less
|
||||
|
Variable rate:
|
||||
|
Domestic
|
27,585.0 | |||
|
Foreign
|
746.5 | |||
|
Total
|
28,331.5 | |||
|
Fixed rate:
|
||||
|
Domestic
|
9,686.1 | |||
|
Foreign
|
9,801.6 | |||
|
Total
|
19,487.7 | |||
|
Total loans with maturity of one year or less
|
47,819.2 | |||
|
Loans with maturity of more than one year
|
||||
|
Variable rate:
|
||||
|
Domestic
|
29,101.4 | |||
|
Foreign
|
4,995.8 | |||
|
Total
|
34,097.1 | |||
|
Fixed rate:
|
||||
|
Domestic
|
18,629.6 | |||
|
Foreign
|
12,210.1 | |||
|
Total
|
30,839.8 | |||
|
Total loans with maturity of more than one year
|
64,936.9 | |||
|
Total loan portfolio
|
112,756.1 | |||
Loan portfolio by economic activity
The following table summarizes our loan portfolio, at the dates indicated, by the principal activity of the borrower using the International Standard Industrial Classification of All Economic Activities. Where we have not assigned a code to a borrower, classification of the relevant loan has been made based on the purpose of the loan as described by the borrower.
|
At December 31,
|
||||||||||||||||||||||||||||||||||||||||
|
2014
|
%
|
2013
|
%
|
2012
|
%
|
2011
|
%
|
2010
|
%
|
|||||||||||||||||||||||||||||||
|
(in Ps billions, except percentages)
|
||||||||||||||||||||||||||||||||||||||||
|
Agricultural
|
3,130.4 | 2.8 | 2,817.2 | 2.9 | 2,050.6 | 2.6 | 1,835.2 | 2.6 | 1,286.2 | 2.2 | ||||||||||||||||||||||||||||||
|
Mining products and oil
|
2,378.1 | 2.1 | 2,198.4 | 2.3 | 1,747.2 | 2.2 | 2,861.2 | 4.1 | 1,369.7 | 2.3 | ||||||||||||||||||||||||||||||
|
Food, beverage and tobacco
|
4,611.6 | 4.1 | 4,239.4 | 4.4 | 2,755.3 | 3.4 | 2,055.9 | 2.9 | 1,866.1 | 3.2 | ||||||||||||||||||||||||||||||
|
Chemical production
|
4,607.7 | 4.1 | 3,872.3 | 4.0 | 3,744.1 | 4.7 | 1,673.7 | 2.4 | 1,405.0 | 2.4 | ||||||||||||||||||||||||||||||
|
Other industrial and manufacturing products
|
3,625.0 | 3.2 | 3,424.4 | 3.5 | 3,173.6 | 4.0 | 4,501.1 | 6.4 | 4,211.3 | 7.2 | ||||||||||||||||||||||||||||||
|
Government
|
2,595.0 | 2.3 | 2,669.8 | 2.8 | 2,332.0 | 2.9 | 2,234.1 | 3.2 | 1,877.2 | 3.2 | ||||||||||||||||||||||||||||||
|
Construction
|
7,991.2 | 7.1 | 7,072.2 | 7.3 | 5,885.8 | 7.4 | 4,519.1 | 6.5 | 2,681.6 | 4.6 | ||||||||||||||||||||||||||||||
|
Trade and tourism
|
1,546.5 | 1.4 | 1,198.9 | 1.2 | 992.5 | 1.2 | 840.4 | 1.2 | 698.7 | 1.2 | ||||||||||||||||||||||||||||||
|
Transportation and communications
|
6,137.7 | 5.4 | 5,509.7 | 5.7 | 5,271.4 | 6.6 | 3,906.1 | 5.6 | 2,925.3 | 5.0 | ||||||||||||||||||||||||||||||
|
Public services
|
4,313.4 | 3.8 | 3,194.4 | 3.3 | 3,016.5 | 3.8 | 3,362.6 | 4.8 | 3,229.6 | 5.5 | ||||||||||||||||||||||||||||||
|
Consumer services(1)
|
45,163.3 | 40.1 | 37,144.1 | 38.5 | 27,804.3 | 34.7 | 22,908.8 | 32.8 | 18,190.5 | 31.0 | ||||||||||||||||||||||||||||||
|
Commercial services(2)
|
24,157.1 | 21.4 | 20,366.6 | 21.1 | 20,024.3 | 25.0 | 17,814.4 | 25.5 | 13,902.4 | 23.7 | ||||||||||||||||||||||||||||||
|
Other(3)
|
2,499.0 | 2.2 | 2,806.3 | 2.9 | 1,231.7 | 1.5 | 1,435.2 | 2.1 | 4,980.0 | 8.5 | ||||||||||||||||||||||||||||||
|
Total loan portfolio
|
112,756.1 | 100.0 | 96,513.8 | 100.0 | 80,029.4 | 100.0 | 69,947.7 | 100.0 | 58,623.6 | 100.0 | ||||||||||||||||||||||||||||||
|
(1)
|
Consumer services include loans to individuals, such as consumer loans (credit cards, vehicle, personal and others) and mortgage loans.
|
|
(2)
|
Commercial services include wholesale trade and retail, consulting and business support services, health and social services, moneylending and other activities.
|
|
(3)
|
In 2010, the Superintendency of Finance implemented the revised International Standard Industrial Classification of All Economic Activities as published by the United Nations in 2008 which updated the loans base by economic activity and also contributed to the increase in loans recorded under “Other” as of December 2010.
|
Credit categories
The following table presents our loan portfolio, for the purpose of credit risk evaluation, categorized in accordance with the regulations of the Superintendency of Finance, in effect at the relevant dates.
|
Loan portfolio by type of loan
|
||||||||||||||||||||
|
At December 31,
|
||||||||||||||||||||
|
2014
|
2013
|
2012
|
2011
|
2010
|
||||||||||||||||
|
(in Ps billions)
|
||||||||||||||||||||
|
Domestic
|
||||||||||||||||||||
|
Commercial loans
|
51,563.5 | 46,343.3 | 41,220.2 | 36,771.7 | 31,025.5 | |||||||||||||||
|
Consumer loans
|
23,266.3 | 20,670.5 | 18,640.8 | 15,477.7 | 12,851.5 | |||||||||||||||
|
Microcredit loans
|
351.8 | 341.9 | 290.9 | 284.2 | 250.1 | |||||||||||||||
|
Mortgages
|
2,905.6 | 1,879.9 | 1,073.3 | 834.6 | 755.3 | |||||||||||||||
|
Financial leases
|
6,915.0 | 6,624.1 | 6,223.9 | 4,917.8 | 3,541.3 | |||||||||||||||
|
Total domestic loan portfolio
|
85,002.1 | 75,859.7 | 67,449.2 | 58,285.9 | 48,423.8 | |||||||||||||||
|
Allowance for loans and financial lease losses
|
(2,881.2 | ) | (2,653.0 | ) | (2,332.8 | ) | (2,093.0 | ) | (1,977.6 | ) | ||||||||||
|
Total domestic loan portfolio, net
|
82,120.9 | 73,206.7 | 65,116.3 | 56,192.9 | 46,446.2 | |||||||||||||||
|
Loan portfolio by type of loan
|
||||||||||||||||||||
|
At December 31,
|
||||||||||||||||||||
|
2014
|
2013
|
2012
|
2011
|
2010
|
||||||||||||||||
|
(in Ps billions)
|
||||||||||||||||||||
|
Foreign
|
||||||||||||||||||||
|
Commercial loans
|
11,201.3 | 8,512.3 | 4,294.0 | 3,773.8 | 3,132.6 | |||||||||||||||
|
Consumer loans
|
9,900.1 | 7,130.8 | 4,739.4 | 4,258.2 | 3,773.7 | |||||||||||||||
|
Microcredit loans
|
– | – | – | – | – | |||||||||||||||
|
Mortgages
|
6,129.1 | 4,640.2 | 3,275.0 | 3,383.8 | 3,089.0 | |||||||||||||||
|
Financial leases
|
523.4 | 370.8 | 271.8 | 246.0 | 204.6 | |||||||||||||||
|
Total foreign loan portfolio
|
27,753.9 | 20,654.2 | 12,580.2 | 11,661.8 | 10,199.9 | |||||||||||||||
|
Allowance for loans and financial lease losses
|
(532.5 | ) | (420.1 | ) | (212.7 | ) | (213.5 | ) | (206.3 | ) | ||||||||||
|
Total foreign loan portfolio, net
|
27,221.5 | 20,234.1 | 12,367.5 | 11,448.3 | 9,993.6 | |||||||||||||||
|
Total loan portfolio, net
|
109,342.4 | 93,440.8 | 77,483.8 | 67,641.2 | 56,439.7 | |||||||||||||||
Risk categories
The Superintendency of Finance prescribes the minimum risk classifications for loans and financial leases. Management at each of our bank subsidiaries assigns loans and financial leases to these classifications on the basis of models developed by management and reviewed by the Superintendency of Finance. These models incorporate both subjective and objective criteria. See note 2(i) to our audited consolidated financial statements.
Category A — “
Normal risk
”: Loans and financial leases in this category are appropriately serviced. The debtor’s financial statements or its projected cash flows, as well as all other credit information available to us, reflect adequate paying capacity.
Category B — “
Acceptable risk, above normal
”: Loans and financial leases in this category are acceptably serviced and guaranty-protected, but there are weaknesses which may potentially affect, on a transitory or permanent basis, the debtor’s paying capacity or its projected cash flows, to the extent that, if not timely corrected, would affect the normal collection of credit or contracts.
Category C — “
Appreciable risk
”: Loans and financial leases in this category have debtors with insufficient paying capacity or relate to projects with insufficient cash flow, which may compromise the normal collection of the obligations.
Category D — “
Significant risk
”: Loans and financial leases in this category have the same deficiencies as loans in category C, but to a larger extent; consequently, the probability of collection is highly doubtful.
Category E — “
Risk of non-recoverability
”: Loans and financial leases in this category are deemed uncollectible.
The following tables present the breakdown of our loan portfolio by risk classification in effect at December 31 of each year.
|
At December 31,
|
||||||||||||||||||||||||||||||||||||||||
|
2014
|
%
|
2013
|
%
|
2012
|
%
|
2011
|
%
|
2010
|
%
|
|||||||||||||||||||||||||||||||
|
(in Ps billions, except percentages)
|
||||||||||||||||||||||||||||||||||||||||
|
Domestic
|
||||||||||||||||||||||||||||||||||||||||
|
“A” Normal risk
|
80,136.6 | 94.3 | 71,502.4 | 94.3 | 63,505.4 | 94.2 | 54,599.9 | 93.7 | 44,718.3 | 92.3 | ||||||||||||||||||||||||||||||
|
“B” Acceptable risk, above normal
|
2,006.3 | 2.4 | 1,916.3 | 2.5 | 1,834.6 | 2.7 | 1,867.8 | 3.2 | 1,817.1 | 3.8 | ||||||||||||||||||||||||||||||
|
“C” Appreciable risk
|
1,260.9 | 1.5 | 990.7 | 1.3 | 863.3 | 1.3 | 700.9 | 1.2 | 645.3 | 1.3 | ||||||||||||||||||||||||||||||
|
“D” Significant risk
|
1,077.5 | 1.3 | 931.4 | 1.2 | 837.9 | 1.2 | 710.7 | 1.2 | 894.9 | 1.8 | ||||||||||||||||||||||||||||||
|
“E” Risk of non-recoverability
|
520.9 | 0.6 | 518.9 | 0.7 | 408.0 | 0.6 | 406.6 | 0.7 | 348.2 | 0.7 | ||||||||||||||||||||||||||||||
|
Total domestic loan portfolio
|
85,002.1 | 100.0 | 75,859.7 | 100.0 | 67,449.2 | 100.0 | 58,285.9 | 100.0 | 48,423.8 | 100.0 | ||||||||||||||||||||||||||||||
|
Loan portfolio classified as “C,” “D” and ”E” as a percentage of total loan portfolio
|
3.4 | 3.2 | 3.1 | 3.1 | 3.9 | |||||||||||||||||||||||||||||||||||
|
At December 31,
|
||||||||||||||||||||||||||||||||||||||||
|
2014
|
%
|
2013
|
%
|
2012
|
%
|
2011
|
%
|
2010
|
%
|
|||||||||||||||||||||||||||||||
|
(in Ps billions, except percentages)
|
||||||||||||||||||||||||||||||||||||||||
|
Foreign
|
||||||||||||||||||||||||||||||||||||||||
|
“A” Normal risk
|
25,049.1 | 90.3 | 18,963.7 | 91.8 | 11,753.7 | 93.4 | 11,051.4 | 94.8 | 9,407.9 | 92.2 | ||||||||||||||||||||||||||||||
|
“B” Acceptable risk, above normal
|
1,006.2 | 3.6 | 733.4 | 3.6 | 272.4 | 2.2 | 222.1 | 1.9 | 409.1 | 4.0 | ||||||||||||||||||||||||||||||
|
“C” Appreciable risk
|
1,343.6 | 4.8 | 712.6 | 3.5 | 430.6 | 3.4 | 219.5 | 1.9 | 219.7 | 2.2 | ||||||||||||||||||||||||||||||
|
“D” Significant risk
|
217.0 | 0.8 | 125.1 | 0.6 | 75.5 | 0.6 | 83.4 | 0.7 | 110.9 | 1.1 | ||||||||||||||||||||||||||||||
|
“E” Risk of non-recoverability
|
137.9 | 0.5 | 119.3 | 0.6 | 47.9 | 0.4 | 85.4 | 0.7 | 52.3 | 0.5 | ||||||||||||||||||||||||||||||
|
Total foreign loan portfolio
|
27,753.9 | 100.0 | 20,654.2 | 100.0 | 12,580.2 | 100.0 | 11,661.8 | 100.0 | 10,199.9 | 100.0 | ||||||||||||||||||||||||||||||
|
Loan portfolio classified as “C,” “D” and ”E” as a percentage of total loan portfolio
|
6.1 | 4.6 | 4.4 | 3.2 | 3.8 | |||||||||||||||||||||||||||||||||||
|
Total loan portfolio
|
112,756.1 | 100.0 | 96,513.8 | 100.0 | 80,029.4 | 100.0 | 69,947.7 | 100.0 | 58,623.6 | 100.0 | ||||||||||||||||||||||||||||||
Suspension of accruals
The Superintendency of Finance mandates that interest, UVRs, lease payments and other items of income cease to be accrued in our statement of income and begin to be recorded in memorandum accounts until any payment is collected, once a loan or financial lease is in arrears for more than 90 days for commercial loans or financial leases, 60 days for mortgage and consumer loans or financial leases and 30 days for microcredit loans.
Interest paid on non-accrued loans is recorded as “interest on loans” on our statement of income.
The following table presents the breakdown of our past due loans by type of loan in accordance with the criteria of the Superintendency of Finance in effect at December 31 of each year.
|
At December 31,
|
||||||||||||||||||||||||||||||||||||||||
|
2014
|
%
|
2013
|
%
|
2012
|
%
|
2011
|
%
|
2010
|
%
|
|||||||||||||||||||||||||||||||
|
(in Ps billions, except percentages)
|
||||||||||||||||||||||||||||||||||||||||
|
Domestic
|
||||||||||||||||||||||||||||||||||||||||
|
Performing past due loans: (1)
|
||||||||||||||||||||||||||||||||||||||||
|
Commercial loans past due from 31 to 90 days
|
204.6 | 9.3 | 125.7 | 7.1 | 128.1 | 8.4 | 85.7 | 7.1 | 121.2 | 9.6 | ||||||||||||||||||||||||||||||
|
Consumer loans past due from 31 to 60 days
|
275.0 | 12.5 | 234.7 | 13.3 | 233.0 | 15.3 | 143.4 | 11.9 | 134.3 | 10.7 | ||||||||||||||||||||||||||||||
|
Microcredit loans past due up to 30 days
|
0.2 | – | 0.3 | – | 0.4 | – | 0.6 | – | 0.6 | – | ||||||||||||||||||||||||||||||
|
Mortgage loans past due from 31 to 60 days
|
24.9 | 1.1 | 20.3 | 1.2 | 18.5 | 1.2 | 22.8 | 1.9 | 29.0 | 2.3 | ||||||||||||||||||||||||||||||
|
Financial leases past due from 31 to 60/90 days (2)
|
86.6 | 3.9 | 58.1 | 3.3 | 63.0 | 4.1 | 72.5 | 6.0 | 40.2 | 3.2 | ||||||||||||||||||||||||||||||
|
Total domestic performing past due loan portfolio
|
591.3 | 26.9 | 439.1 | 24.9 | 443.0 | 29.0 | 324.9 | 27.0 | 325.3 | 25.9 | ||||||||||||||||||||||||||||||
|
Non-performing past due loans:
|
||||||||||||||||||||||||||||||||||||||||
|
Commercial loans past due more than 90 days
|
679.3 | 30.9 | 500.0 | 28.3 | 410.9 | 26.9 | 347.7 | 28.8 | 417.6 | 33.3 | ||||||||||||||||||||||||||||||
|
Consumer loans past due more than 60 days
|
680.5 | 30.9 | 641.8 | 36.4 | 511.2 | 33.5 | 398.0 | 33.0 | 368.6 | 29.3 | ||||||||||||||||||||||||||||||
|
Microcredit loans past due more than 30 days
|
37.3 | 1.7 | 32.2 | 1.8 | 32.2 | 2.1 | 12.6 | 1.0 | 15.5 | 1.2 | ||||||||||||||||||||||||||||||
|
Mortgage loans past due more than 60 days
|
61.0 | 2.8 | 41.0 | 2.3 | 45.2 | 3.0 | 46.8 | 3.9 | 51.2 | 4.1 | ||||||||||||||||||||||||||||||
|
Financial leases past due more than 60/90 days
|
150.8 | 6.9 | 110.6 | 6.3 | 85.2 | 5.6 | 75.4 | 6.3 | 77.6 | 6.2 | ||||||||||||||||||||||||||||||
|
Total domestic non-performing past due loan portfolio
|
1,609.0 | 73.1 | 1,325.6 | 75.1 | 1,084.6 | 71.0 | 880.5 | 73.0 | 930.4 | 74.1 | ||||||||||||||||||||||||||||||
|
Total domestic past due loan portfolio
|
2,200.3 | 100.0 | 1,764.7 | 100.0 | 1,527.5 | 100.0 | 1,205.5 | 100.0 | 1,255.8 | 100.0 | ||||||||||||||||||||||||||||||
|
Total non-performing past due loan portfolio
|
1,609.0 | – | 1,325.6 | – | 1,084.6 | – | 880.5 | – | 930.4 | – | ||||||||||||||||||||||||||||||
|
Foreclosed assets
|
207.2 | – | 189.9 | – | 190.9 | – | 161.8 | – | 148.1 | – | ||||||||||||||||||||||||||||||
|
Other accounts receivable more than 180 days past due
|
45.9 | – | 40.0 | – | 33.2 | – | 31.8 | – | 40.8 | – | ||||||||||||||||||||||||||||||
|
Total domestic non-performing assets
|
1,862.1 | – | 1,555.5 | – | 1,308.7 | – | 1,074.1 | – | 1,119.3 | – | ||||||||||||||||||||||||||||||
|
Allowance for loan and financial lease losses
|
2,881.2 | – | 2,653.0 | – | 2,332.8 | – | 2,093.0 | – | 1,977.6 | – | ||||||||||||||||||||||||||||||
|
Allowance for estimated losses on foreclosed assets
|
147.9 | – | 128.2 | – | 120.9 | – | 113.6 | – | 105.8 | – | ||||||||||||||||||||||||||||||
|
Allowance for accounts receivable and accrued interest losses
|
96.4 | – | 84.4 | – | 77.2 | – | 57.2 | – | 55.4 | – | ||||||||||||||||||||||||||||||
|
Loans and financial leases at least 31 days past due as a percentage of total loans
|
2.6 | % | – | 2.3 | % | – | 2.3 | % | – | 2.1 | % | – | 2.6 | % | – | |||||||||||||||||||||||||
|
At December 31,
|
||||||||||||||||||||||||||||||||||||||||
|
2014
|
%
|
2013
|
%
|
2012
|
%
|
2011
|
%
|
2010
|
%
|
|||||||||||||||||||||||||||||||
|
(in Ps billions, except percentages)
|
||||||||||||||||||||||||||||||||||||||||
|
Allowance for loan and financial lease losses as a percentage of loans at least 31 days past due
|
130.9 | % | – | 150.3 | % | – | 152.7 | % | – | 173.6 | % | – | 157.5 | % | – | |||||||||||||||||||||||||
|
Allowance for loan and financial lease losses as a percentage of loans classified as “C,” “D” and “E”
|
100.8 | % | – | 108.7 | % | – | 110.6 | % | – | 114.1 | % | – | 104.7 | % | – | |||||||||||||||||||||||||
|
Percentage of performing loans and financial leases to total loans and financial leases
|
98.1 | % | – | 98.3 | % | – | 98.4 | % | – | 98.5 | % | – | 98.1 | % | – | |||||||||||||||||||||||||
|
Foreign
|
||||||||||||||||||||||||||||||||||||||||
|
Performing past due loans: (1)
|
||||||||||||||||||||||||||||||||||||||||
|
Commercial loans past due from 31 days to 90 days
|
95.5 | 13.4 | 47.9 | 8.9 | 22.6 | 7.5 | 14.4 | 4.3 | 8.6 | 2.7 | ||||||||||||||||||||||||||||||
|
Consumer loans past due loans from 31 days to 60 days
|
133.9 | 18.7 | 102.8 | 19.0 | 51.4 | 17.1 | 46.4 | 14.0 | 70.8 | 22.6 | ||||||||||||||||||||||||||||||
|
Microcredit loans past due up to 30 days
|
– | – | – | – | – | – | – | – | – | – | ||||||||||||||||||||||||||||||
|
Mortgage loans past due from 31 days to 60 days
|
– | – | – | – | – | – | – | – | 38.4 | 12.2 | ||||||||||||||||||||||||||||||
|
Financial leases past due from 31 days to 60/90 days (2)
|
1.3 | 0.2 | 1.4 | 0.3 | 0.8 | 0.3 | 1.5 | 0.5 | 1.1 | 0.3 | ||||||||||||||||||||||||||||||
|
Total foreign performing past due loan portfolio
|
230.8 | 32.3 | 152.1 | 28.1 | 74.9 | 24.9 | 62.4 | 18.8 | 118.9 | 37.9 | ||||||||||||||||||||||||||||||
|
Non-performing past due loans:
|
||||||||||||||||||||||||||||||||||||||||
|
Commercial loans past due more than 90 days
|
65.2 | 9.1 | 44.0 | 8.2 | 51.3 | 17.1 | 80.0 | 24.1 | 50.6 | 16.1 | ||||||||||||||||||||||||||||||
|
Consumer loans past due more than 60 days
|
239.1 | 33.5 | 174.8 | 32.4 | 93.9 | 31.2 | 86.9 | 26.2 | 89.7 | 28.6 | ||||||||||||||||||||||||||||||
|
Microcredit loans past due more than 30 days
|
– | – | – | – | – | – | – | – | – | – | ||||||||||||||||||||||||||||||
|
Mortgage loans past due more than 60 days
|
177.9 | 24.9 | 168.6 | 31.2 | 80.2 | 26.6 | 100.1 | 30.2 | 54.2 | 17.3 | ||||||||||||||||||||||||||||||
|
Financial leases past due more than 60/90 days
|
1.7 | 0.2 | 0.8 | 0.1 | 0.6 | 0.2 | 2.3 | 0.7 | 0.5 | 0.2 | ||||||||||||||||||||||||||||||
|
Total foreign non-performing past due loan portfolio
|
483.9 | 67.7 | 388.2 | 71.9 | 225.9 | 75.1 | 269.4 | 81.2 | 195.0 | 62.1 | ||||||||||||||||||||||||||||||
|
Total foreign past due loan portfolio
|
714.6 | 100.0 | 540.3 | 100.0 | 300.8 | 100.0 | 331.8 | 100.0 | 313.9 | 100.0 | ||||||||||||||||||||||||||||||
|
Total non-performing past due loan portfolio
|
483.9 | – | 388.2 | – | 225.9 | – | 269.4 | – | 195.0 | – | ||||||||||||||||||||||||||||||
|
Foreclosed assets
|
138.6 | – | 88.1 | – | 43.2 | – | 61.8 | – | 67.4 | – | ||||||||||||||||||||||||||||||
|
Other accounts receivable more than 180 days past due
|
– | – | – | – | – | – | – | – | – | – | ||||||||||||||||||||||||||||||
|
Total foreign non-performing assets
|
622.4 | – | 476.3 | – | 269.1 | – | 331.2 | – | 262.4 | – | ||||||||||||||||||||||||||||||
|
At December 31,
|
||||||||||||||||||||||||||||||||||||||||
|
2014
|
%
|
2013
|
%
|
2012
|
%
|
2011
|
%
|
2010
|
%
|
|||||||||||||||||||||||||||||||
|
(in Ps billions, except percentages)
|
||||||||||||||||||||||||||||||||||||||||
|
Allowance for loan and financial lease losses
|
532.5 | – | 420.1 | – | 212.7 | – | 213.5 | – | 206.3 | – | ||||||||||||||||||||||||||||||
|
Allowance for estimated losses on foreclosed assets
|
63.7 | – | 40.5 | – | 21.2 | – | 29.5 | – | 24.2 | – | ||||||||||||||||||||||||||||||
|
Allowance for accounts receivable and accrued interest losses
|
– | – | – | – | – | – | – | – | – | – | ||||||||||||||||||||||||||||||
|
Loans and financial leases at least 31 days past due as a percentage of total loans
|
2.6 | % | – | 2.6 | % | – | 2.4 | % | – | 2.8 | % | – | 3.1 | % | – | |||||||||||||||||||||||||
|
Allowance for loan and financial lease losses as a percentage of loans at least 31 days past due
|
74.5 | % | – | 77.8 | % | – | 70.7 | % | – | 64.3 | % | – | 65.7 | % | – | |||||||||||||||||||||||||
|
Allowance for loan and financial lease losses as a percentage of loans classified as “C,” “D” and “E”
|
31.3 | % | – | 43.9 | % | – | 38.4 | % | – | 55.0 | % | – | 53.9 | % | – | |||||||||||||||||||||||||
|
Percentage of performing loans and financial leases to total loans and financial leases
|
98.3 | % | – | 98.1 | % | – | 98.2 | % | – | 97.2 | % | – | 98.1 | % | – | |||||||||||||||||||||||||
|
(1)
|
Performing past due loans are loans upon which interest has not been received for the periods indicated; however, we continue to recognize income. Once interest is unpaid on accrual loans for greater than the number of days specified in the respective line item above, the loan is classified as non-performing.
|
|
(2)
|
Includes commercial and consumer financial leases.
|
The following table presents the breakdown of our non-performing past due loans by type of loan in accordance with the criteria of the Superintendency of Finance for domestic and foreign loans at the periods indicated.
|
At December 31,
|
||||||||||||||||||||
|
2014
|
2013
|
2012
|
2011
|
2010
|
||||||||||||||||
|
(in Ps billions)
|
||||||||||||||||||||
|
Domestic
|
||||||||||||||||||||
|
Non-performing past due loans:
|
||||||||||||||||||||
|
Commercial loans past due more than 90 days
|
679.3 | 500.0 | 410.2 | 347.7 | 417.6 | |||||||||||||||
|
Consumer loans past due more than 60 days
|
680.5 | 641.8 | 511.2 | 398.0 | 368.6 | |||||||||||||||
|
Microcredit loans past due more than 30 days
|
37.3 | 32.2 | 32.2 | 12.6 | 15.5 | |||||||||||||||
|
Mortgage loans past due more than 60 days
|
61.0 | 41.0 | 45.2 | 46.8 | 51.2 | |||||||||||||||
|
Financial leases past due more than 60 days
|
150.8 | 110.6 | 85.2 | 75.4 | 77.6 | |||||||||||||||
|
Total domestic non-performing past due loan portfolio
|
1,609.0 | 1,325.6 | 1,083.9 | 880.5 | 930.4 | |||||||||||||||
|
Foreign
|
||||||||||||||||||||
|
Non-performing past due loans:
|
||||||||||||||||||||
|
Commercial loans past due more than 90 days
|
65.2 | 44.0 | 51.9 | 80.0 | 50.6 | |||||||||||||||
|
Consumer loans past due more than 60 days
|
239.1 | 174.8 | 93.9 | 86.9 | 89.7 | |||||||||||||||
|
Microcredit loans past due more than 30 days
|
– | – | – | – | – | |||||||||||||||
|
Mortgage loans past due more than 60 days
|
177.9 | 168.6 | 80.2 | 100.1 | 54.2 | |||||||||||||||
|
Financial leases past due more than 60/90 days
|
1.7 | 0.8 | 0.6 | 2.3 | 0.5 | |||||||||||||||
|
Total foreign non-performing past due loan portfolio
|
483.9 | 388.2 | 226.5 | 269.4 | 195.0 | |||||||||||||||
|
Total domestic and foreign non-performing past due loan portfolio
|
2,092.8 | 1,713.8 | 1,310.5 | 1,149.9 | 1,125.5 | |||||||||||||||
The following table presents our past due loan portfolio by type of loan.
|
At December 31,
|
||||||||||||||||||||||||||||||||||||||||
|
2014
|
%
|
2013
|
%
|
2012
|
%
|
2011
|
%
|
2010
|
%
|
|||||||||||||||||||||||||||||||
|
(in Ps billions, except percentages)
|
||||||||||||||||||||||||||||||||||||||||
|
Commercial
|
||||||||||||||||||||||||||||||||||||||||
|
General purpose loans
|
789.6 | 27.1 | 494.5 | 21.5 | 442.9 | 24.2 | 384.3 | 25.0 | 453.7 | 28.9 | ||||||||||||||||||||||||||||||
|
Loans funded by development banks
|
52.7 | 1.8 | 42.4 | 1.8 | 41.2 | 2.3 | 31.1 | 2.0 | 42.4 | 2.7 | ||||||||||||||||||||||||||||||
|
Working capital loans
|
138.7 | 4.8 | 141.3 | 6.1 | 64.5 | 3.5 | 48.4 | 3.2 | 76.1 | 4.8 | ||||||||||||||||||||||||||||||
|
Credit cards
|
37.4 | 1.3 | 22.3 | 1.0 | 15.4 | 0.8 | 12.6 | 0.8 | 15.7 | 1.0 | ||||||||||||||||||||||||||||||
|
Overdrafts
|
26.2 | 0.9 | 17.2 | 0.7 | 48.9 | 2.7 | 51.5 | 3.3 | 10.0 | 0.6 | ||||||||||||||||||||||||||||||
|
Total commercial
|
1,044.6 | 35.8 | 717.6 | 31.1 | 612.9 | 33.5 | 527.9 | 34.3 | 597.9 | 38.1 | ||||||||||||||||||||||||||||||
|
Consumer
|
||||||||||||||||||||||||||||||||||||||||
|
Credit cards
|
498.0 | 17.1 | 353.9 | 15.4 | 243.1 | 13.3 | 202.2 | 13.2 | 219.4 | 14.0 | ||||||||||||||||||||||||||||||
|
Personal loans
|
676.4 | 23.2 | 657.4 | 28.5 | 511.5 | 28.0 | 371.3 | 24.2 | 346.3 | 22.1 | ||||||||||||||||||||||||||||||
|
Automobile and vehicle loans
|
141.1 | 4.8 | 131.2 | 5.7 | 115.9 | 6.3 | 87.1 | 5.7 | 79.0 | 5.0 | ||||||||||||||||||||||||||||||
|
Overdrafts
|
7.3 | 0.2 | 6.2 | 0.3 | 12.2 | 0.7 | 8.6 | 0.6 | 6.9 | 0.4 | ||||||||||||||||||||||||||||||
|
Loans funded by development banks
|
– | – | 0.1 | – | 0.1 | – | 0.1 | – | – | – | ||||||||||||||||||||||||||||||
|
General purpose loans
|
5.8 | 0.2 | 5.2 | 0.2 | 6.8 | 0.4 | 5.5 | 0.4 | 5.9 | 0.4 | ||||||||||||||||||||||||||||||
|
Working capital loans
|
– | – | – | – | – | – | – | – | 5.9 | 0.4 | ||||||||||||||||||||||||||||||
|
Total consumer
|
1,328.6 | 45.6 | 1,154.0 | 50.1 | 889.4 | 48.6 | 674.7 | 43.9 | 663.4 | 42.3 | ||||||||||||||||||||||||||||||
|
Microcredit
|
37.5 | 1.3 | 32.5 | 1.4 | 32.6 | 1.8 | 13.2 | 0.9 | 16.1 | 1.0 | ||||||||||||||||||||||||||||||
|
Mortgages
|
263.8 | 9.1 | 229.9 | 10.0 | 143.9 | 7.9 | 169.7 | 11.0 | 172.8 | 11.0 | ||||||||||||||||||||||||||||||
|
Financial leases
|
240.5 | 8.2 | 170.9 | 7.4 | 149.5 | 8.2 | 151.8 | 9.9 | 119.4 | 7.6 | ||||||||||||||||||||||||||||||
|
Total past due loan portfolio
|
2,914.9 | 100.0 | 2,305.0 | 100.0 | 1,828.3 | 100.0 | 1,537.3 | 100.0 | 1,569.7 | 100.0 | ||||||||||||||||||||||||||||||
The following table presents information with respect to our secured and unsecured loan portfolios at least 31 days past due.
|
At December 31,
|
||||||||||||||||||||||||||||||||||||||||
|
2014
|
%
|
2013
|
%
|
2012
|
%
|
2011
|
%
|
2010
|
%
|
|||||||||||||||||||||||||||||||
|
(in Ps billions, except percentages)
|
||||||||||||||||||||||||||||||||||||||||
|
Secured
|
||||||||||||||||||||||||||||||||||||||||
|
Past due 31 to 360 days
|
||||||||||||||||||||||||||||||||||||||||
|
Commercial
|
331.6 | 0.3 | 214.8 | 0.2 | 197.5 | 0.3 | 143.9 | 0.2 | 165.3 | 0.3 | ||||||||||||||||||||||||||||||
|
Consumer
|
155.5 | 0.1 | 137.8 | 0.1 | 114.0 | 0.1 | 83.7 | 0.1 | 100.1 | 0.2 | ||||||||||||||||||||||||||||||
|
Microcredit
|
26.3 | – | 21.1 | – | 21.0 | 0.0 | 7.7 | – | 5.4 | – | ||||||||||||||||||||||||||||||
|
Mortgages
|
209.2 | 0.2 | 186.6 | 0.2 | 124.3 | 0.2 | 143.6 | 0.2 | 149.7 | 0.3 | ||||||||||||||||||||||||||||||
|
Financial leases
|
201.4 | 0.2 | 141.2 | 0.2 | 114.7 | 0.1 | 115.9 | 0.2 | 83.8 | 0.1 | ||||||||||||||||||||||||||||||
|
Total 31 to 360 days
|
924.1 | 0.8 | 701.5 | 0.8 | 571.5 | 0.7 | 494.8 | 0.7 | 504.3 | 0.9 | ||||||||||||||||||||||||||||||
|
Total past due more than 360 days
|
193.6 | 0.2 | 155.6 | 0.2 | 115.9 | 0.1 | 135.4 | 0.2 | 126.9 | 0.2 | ||||||||||||||||||||||||||||||
|
Total current
|
34,891.4 | 31.9 | 30,399.6 | 32.5 | 25,754.3 | 33.2 | 22,374.1 | 33.1 | 20,383.2 | 36.1 | ||||||||||||||||||||||||||||||
|
Total secured loan portfolio
|
36,009.1 | 32.9 | 31,256.7 | 33.5 | 26,441.7 | 34.1 | 23,004.3 | 34.0 | 21,014.4 | 37.2 | ||||||||||||||||||||||||||||||
|
Unsecured(1)
|
||||||||||||||||||||||||||||||||||||||||
|
Past due 31 to 360 days
|
||||||||||||||||||||||||||||||||||||||||
|
Commercial
|
394.5 | 0.4 | 277.9 | 0.3 | 198.4 | 0.3 | 187.8 | 0.3 | 231.9 | 0.4 | ||||||||||||||||||||||||||||||
|
Consumer
|
1,109.9 | 1.0 | 951.9 | 1.0 | 712.3 | 0.9 | 529.1 | 0.8 | 512.1 | 0.9 | ||||||||||||||||||||||||||||||
|
Microcredit
|
9.0 | – | 9.6 | – | 10.6 | – | 4.5 | – | 5.3 | – | ||||||||||||||||||||||||||||||
|
Mortgages
|
– | – | – | – | – | – | – | – | – | – | ||||||||||||||||||||||||||||||
|
Financial leases
|
– | – | – | – | – | – | – | – | – | – | ||||||||||||||||||||||||||||||
|
Total 31 to 360 days
|
1,513.5 | 1.4 | 1,239.4 | 1.3 | 921.2 | 1.2 | 721.3 | 1.1 | 749.2 | 1.3 | ||||||||||||||||||||||||||||||
|
Total past due more than 360 days
|
283.7 | 0.3 | 208.5 | 0.2 | 219.7 | 0.3 | 185.8 | 0.3 | 189.2 | 0.3 | ||||||||||||||||||||||||||||||
|
Total current
|
74,949.7 | 68.5 | 63,809.2 | 68.3 | 52,446.7 | 67.7 | 46,036.4 | 68.1 | 36,670.8 | 65.0 | ||||||||||||||||||||||||||||||
|
Total unsecured loan portfolio
|
76,747.0 | 70.2 | 65,257.1 | 69.8 | 53,587.6 | 69.2 | 46,943.5 | 69.4 | 37,609.2 | 66.6 | ||||||||||||||||||||||||||||||
|
Total loan portfolio, gross
|
112,756.1 | 103.1 | 96,513.8 | 103.3 | 80,029.4 | 103.3 | 69,947.7 | 103.4 | 58,623.6 | 103.9 | ||||||||||||||||||||||||||||||
|
Allowances
|
(3,413.7 | ) | (3.1 | ) | (3,073.0 | ) | (3.3 | ) | (2,545.6 | ) | (3.3 | ) | (2,306.5 | ) | (3.4 | ) | (2,183.9 | ) | (3.9 | ) | ||||||||||||||||||||
|
Total loan portfolio, net
|
109,342.4 | 100.0 | 93,440.8 | 100.0 | 77,483.8 | 100.0 | 67,641.2 | 100.0 | 56,439.7 | 100.0 | ||||||||||||||||||||||||||||||
|
(1)
|
Includes loans with personal guarantees.
|
Non-accrual, non-performing loans, performing loans, and performing troubled debt restructured loans
Non-accrual loans
The following table presents loans accounted for on a non-accrual basis classified into domestic and foreign loans, the gross interest income that would have been recorded in the relevant period if the loans had been current in accordance with their original terms and had been outstanding throughout the period or since origination, and the amount of interest income on those loans that was included in net income for that period.
|
At and for the year ended December 31, 2014
|
||||||||||||
|
Amount of loans
|
Gross interest income
|
Interest income included in net income for the period
|
||||||||||
|
(in Ps billions)
|
||||||||||||
|
Domestic
|
1,609.0 | 257.3 | 145.6 | |||||||||
|
Foreign
|
483.9 | 43.4 | – | |||||||||
|
Total non-accrual loan portfolio (1)
|
2,092.8 | 300.7 | 145.6 | |||||||||
|
(1)
|
Restructured loans are loans that have been modified due to an impairment of the conditions of the beneficiary.
|
Non-performing troubled debt restructured loans
The following table presents our non-performing troubled debt restructured loans classified into domestic and foreign loans, the gross interest income that would have been recorded in the relevant period if the loans had been current in accordance with their original terms and had been outstanding throughout the period or since origination, and the amount of interest income on those loans that was included in net income for that period.
|
At and for the year ended December 31, 2014
|
||||||||||||
|
Amount of loans
|
Gross interest income
|
Interest income included in net income for the period
|
||||||||||
|
(in Ps billions)
|
||||||||||||
|
Domestic
|
817.9 | 101.1 | 71.9 | |||||||||
|
Foreign
|
71.3 | 8.9 | – | |||||||||
|
Total non-performing troubled debt restructured loan portfolio (1)
|
889.2 | 110.0 | 71.9 | |||||||||
|
(1)
|
Restructured loans are loans that have been modified due to an impairment of the conditions of the beneficiary.
|
Performing troubled debt restructured loans
The following table presents our performing troubled debt restructured loan portfolio classified into domestic and foreign loans, the gross interest income that would have been recorded in the period that ended if the loans had been current in accordance with their original terms and had been outstanding throughout the period or since origination and the amount of interest income on those loans that was included in net income for the period.
|
At and for the year ended December 31, 2014
|
||||||||||||
|
Amount of loans
|
Gross interest income
|
Interest income included in net income for the period
|
||||||||||
|
(in Ps billions)
|
||||||||||||
|
Domestic
|
996.5 | 90.8 | 87.2 | |||||||||
|
Foreign
|
303.4 | 41.6 | 40.6 | |||||||||
|
Total performing troubled debt restructured loan portfolio
|
1,299.9 | 132.4 | 127.7 | |||||||||
The following table presents a summary of our troubled debt restructured loan portfolio, classified into domestic and foreign loans, accounted for on a performing basis in accordance with the criteria of the Superintendency of Finance in effect at the end of each period.
|
At December 31,
|
||||||||||||||||||||
|
2014
|
2013
|
2012
|
2011
|
2010
|
||||||||||||||||
|
(in Ps billions)
|
||||||||||||||||||||
|
Domestic
|
996.5 | 903.2 | 919.3 | 613.3 | 703.6 | |||||||||||||||
|
Foreign
|
303.4 | 243.3 | 134.4 | 122.0 | 182.4 | |||||||||||||||
|
Total performing troubled debt restructured loan portfolio(1)
|
1,299.9 | 1,146.5 | 1,053.7 | 735.2 | 886.0 | |||||||||||||||
|
(1)
|
Restructured loans are loans that have been modified due to an impairment of the conditions of the beneficiary.
|
Movements in allowances for credit losses
Allowance for loan and financial lease losses
We record allowance for loan and financial lease losses in accordance with regulations established by the Superintendency of Finance. For further information regarding the regulation and methodologies for the calculation of such allowances, see note 2(i) to our audited consolidated financial statements.
The following table presents the changes in the allowance for loan and financial lease losses during the periods indicated.
|
Year ended December 31,
|
||||||||||||||||||||
|
2014
|
2013
|
2012
|
2011
|
2010
|
||||||||||||||||
|
(in Ps billions)
|
||||||||||||||||||||
|
Domestic
|
||||||||||||||||||||
|
Balance at beginning of period
|
2,653.0 | 2,332.8 | 2,093.0 | 1,977.6 | 1,881.1 | |||||||||||||||
|
Increase in allowance through business combinations
|
– | – | 11.6 | 1.7 | 1.8 | |||||||||||||||
|
Allowance for financial leasing reclassification
|
– | – | – | 0.1 | – | |||||||||||||||
|
Provisions for loan losses
|
2,711.9 | 2,544.8 | 2,092.9 | 1,794.8 | 1,927.1 | |||||||||||||||
|
Charge-offs
|
(992.5 | ) | (755.1 | ) | (586.4 | ) | (511.6 | ) | (660.1 | ) | ||||||||||
|
Effect of difference in exchange rate
|
8.7 | 1.5 | (1.2 | ) | (0.8 | ) | (0.6 | ) | ||||||||||||
|
Reclassification – securitization
|
4.9 | (0.3 | ) | (1.0 | ) | (9.7 | ) | (8.4 | ) | |||||||||||
|
Reversals of provisions
|
(1,504.8 | ) | (1,470.8 | ) | (1,276.1 | ) | (1,159.0 | ) | (1,163.4 | ) | ||||||||||
|
Balance at end of year (domestic)
|
2,881.2 | 2,653.0 | 2,332.8 | 2,093.0 | 1,977.6 | |||||||||||||||
|
Year ended December 31,
|
||||||||||||||||||||
|
2014
|
2013
|
2012
|
2011
|
2010
|
||||||||||||||||
|
(in Ps billions)
|
||||||||||||||||||||
|
Foreign
|
||||||||||||||||||||
|
Balance at beginning of period
|
420.1 | 212.7 | 213.5 | 206.3 | – | |||||||||||||||
|
Increase in allowance through business combinations(1)
|
– | 120.1 | – | – | 184.4 | |||||||||||||||
|
Allowance for financial leasing reclassification
|
– | – | – | – | – | |||||||||||||||
|
Provisions for loan losses
|
376.4 | 255.3 | 170.7 | 170.5 | 1.0 | |||||||||||||||
|
Charge-offs
|
(312.4 | ) | (175.1 | ) | (126.7 | ) | (165.1 | ) | (17.5 | ) | ||||||||||
|
Effect of difference in exchange rate
|
99.0 | 22.7 | (20.6 | ) | 10.8 | 38.7 | ||||||||||||||
|
Reclassification – securitization
|
– | – | – | – | – | |||||||||||||||
|
Reversals of provisions
|
(50.7 | ) | (15.6 | ) | (24.1 | ) | (9.1 | ) | (0.3 | ) | ||||||||||
|
Balance at end of year (foreign)
|
532.5 | 420.1 | 212.7 | 213.5 | 206.3 | |||||||||||||||
|
Balance at end of year total (2)
|
3,413.7 | 3,073.0 | 2,545.6 | 2,306.5 | 2,183.9 | |||||||||||||||
|
(1)
|
In 2013 it reflects the Central American acquisitions and in 2010 it reflects the acquisition of BAC Credomatic.
|
|
(2)
|
The allowance balance for accrued interest receivable, which is not included in this item, amounted to Ps 96.4 billion, Ps 84.4 billion, Ps 77.2 billion, Ps 61.2 billion and Ps 55.4 billion for the years ended December 31, 2014, 2013, 2012, 2011, 2010, respectively.
|
Recoveries of charged-off loans are recorded on the statement of income of our bank subsidiaries under “recovery of charged-off assets” and are not included in provisions for loan losses.
The following table presents the allocation of our allowance for loan losses by category of loan and financial lease losses.
|
At December 31,
|
||||||||||||||||||||
|
2014
|
2013
|
2012
|
2011
|
2010
|
||||||||||||||||
|
(in Ps billions)
|
||||||||||||||||||||
|
Domestic
|
||||||||||||||||||||
|
Commercial
|
1,311.0 | 1,218.9 | 1,100.6 | 1,117.3 | 1,138.3 | |||||||||||||||
|
Consumer
|
1,239.1 | 1,154.1 | 991.2 | 780.3 | 658.6 | |||||||||||||||
|
Microcredit
|
27.8 | 24.1 | 21.6 | 10.3 | 13.1 | |||||||||||||||
|
Mortgages
|
41.7 | 24.7 | 18.9 | 16.3 | 15.6 | |||||||||||||||
|
Financial leases
|
229.4 | 209.7 | 187.7 | 158.6 | 142.9 | |||||||||||||||
|
General (1)
|
32.2 | 21.5 | 12.7 | 10.2 | 9.1 | |||||||||||||||
|
Total domestic
|
2,881.2 | 2,653.0 | 2,332.8 | 2,093.0 | 1,977.6 | |||||||||||||||
|
Foreign
|
||||||||||||||||||||
|
Commercial
|
147.2 | 136.9 | 64.4 | 63.8 | 77.4 | |||||||||||||||
|
Consumer
|
363.4 | 248.8 | 133.7 | 122.3 | 104.0 | |||||||||||||||
|
Microcredit
|
– | – | – | – | – | |||||||||||||||
|
Mortgages
|
18.7 | 31.9 | 12.9 | 24.7 | 23.5 | |||||||||||||||
|
Financial leases
|
3.1 | 2.5 | 1.8 | 2.7 | 1.4 | |||||||||||||||
|
General (1)
|
– | – | – | – | – | |||||||||||||||
|
Total foreign
|
532.5 | 420.1 | 212.7 | 213.5 | 206.3 | |||||||||||||||
|
Total allowance for loan and financial lease losses
|
3,413.7 | 3,073.0 | 2,545.6 | 2,306.5 | 2,183.9 | |||||||||||||||
|
(1)
|
Our banking subsidiaries adopted the Commercial Reference Model (July 2007) and the Consumer Reference Model (July 2008) issued by the Superintendency of Finance. Notwithstanding the elimination of the general allowance for loan losses dictated by these models, this did not result in a decrease in the total amount of allowances, as allowances for individual loans increased. At December 31, 2010, the general allowance includes an amount equal to 1.0% of gross mortgage and microcredit loans in Colombia and general allowances in other jurisdictions.
|
The following table presents the allocation of our allowance for loans and financial lease losses by type of loan.
|
At December 31,
|
||||||||||||||||||||||||||||||||||||||||
|
2014
|
%
|
2013
|
%
|
2012
|
%
|
2011
|
%
|
2010
|
%
|
|||||||||||||||||||||||||||||||
|
(in Ps billions, except percentages)
|
||||||||||||||||||||||||||||||||||||||||
|
Domestic
|
||||||||||||||||||||||||||||||||||||||||
|
Commercial
|
||||||||||||||||||||||||||||||||||||||||
|
General purpose loans
|
1,027.0 | 30.1 | 932.4 | 30.3 | 840.0 | 33.0 | 883.0 | 38.3 | 906.2 | 41.5 | ||||||||||||||||||||||||||||||
|
Loans funded by development banks
|
57.6 | 1.7 | 56.6 | 1.8 | 50.4 | 2.0 | 54.5 | 2.4 | 57.8 | 2.6 | ||||||||||||||||||||||||||||||
|
Working capital loans
|
183.6 | 5.4 | 196.4 | 6.4 | 182.9 | 7.2 | 156.9 | 6.8 | 149.8 | 6.9 | ||||||||||||||||||||||||||||||
|
Credit cards
|
32.6 | 1.0 | 23.0 | 0.7 | 16.7 | 0.7 | 13.7 | 0.6 | 16.0 | 0.7 | ||||||||||||||||||||||||||||||
|
Overdrafts
|
10.1 | 0.3 | 10.6 | 0.3 | 10.6 | 0.4 | 9.1 | 0.4 | 8.6 | 0.4 | ||||||||||||||||||||||||||||||
|
Total commercial
|
1,311.0 | 38.4 | 1,218.9 | 39.7 | 1,100.6 | 43.2 | 1,117.3 | 48.4 | 1,138.3 | 52.1 | ||||||||||||||||||||||||||||||
|
Consumer
|
||||||||||||||||||||||||||||||||||||||||
|
Credit cards
|
236.3 | 6.9 | 193.7 | 6.3 | 148.0 | 5.8 | 111.6 | 4.8 | 90.7 | 4.2 | ||||||||||||||||||||||||||||||
|
Personal loans
|
884.0 | 25.9 | 844.7 | 27.5 | 741.1 | 29.1 | 585.4 | 25.4 | 488.0 | 22.3 | ||||||||||||||||||||||||||||||
|
Automobile and vehicle loans
|
102.9 | 3.0 | 100.2 | 3.3 | 85.8 | 3.4 | 68.3 | 3.0 | 65.7 | 3.0 | ||||||||||||||||||||||||||||||
|
Overdrafts
|
5.4 | 0.2 | 5.1 | 0.2 | 5.2 | 0.2 | 5.6 | 0.2 | 5.3 | 0.2 | ||||||||||||||||||||||||||||||
|
Loans funded by development banks
|
0.1 | – | 0.1 | – | 0.1 | – | – | – | – | – | ||||||||||||||||||||||||||||||
|
General purpose loans
|
10.4 | 0.3 | 10.3 | 0.3 | 11.0 | 0.4 | 9.3 | 0.4 | 8.9 | 0.4 | ||||||||||||||||||||||||||||||
|
Working capital loans
|
– | – | – | – | 0.1 | – | – | – | – | – | ||||||||||||||||||||||||||||||
|
Total consumer
|
1,239.1 | 36.3 | 1,154.1 | 37.6 | 991.2 | 38.9 | 780.3 | 33.8 | 658.6 | 30.2 | ||||||||||||||||||||||||||||||
|
Microcredit
|
27.8 | 0.8 | 24.1 | 0.8 | 21.6 | 0.8 | 10.3 | 0.4 | 13.1 | 0.6 | ||||||||||||||||||||||||||||||
|
Mortgages
|
41.7 | 1.2 | 24.7 | 0.8 | 18.9 | 0.7 | 16.3 | 0.7 | 15.6 | 0.7 | ||||||||||||||||||||||||||||||
|
Financial leases
|
229.4 | 6.7 | 209.7 | 6.8 | 187.7 | 7.4 | 158.6 | 6.9 | 142.9 | 6.5 | ||||||||||||||||||||||||||||||
|
General
|
32.2 | 0.9 | 21.5 | 0.7 | 12.7 | 0.5 | 10.3 | 0.4 | 9.1 | 0.4 | ||||||||||||||||||||||||||||||
|
Total domestic
|
2,881.2 | 84.4 | 2,653.0 | 86.3 | 2,332.8 | 91.6 | 2,093.0 | 90.7 | 1,977.6 | 90.6 | ||||||||||||||||||||||||||||||
|
Foreign
|
||||||||||||||||||||||||||||||||||||||||
|
Commercial
|
||||||||||||||||||||||||||||||||||||||||
|
General purpose loans
|
80.9 | 2.4 | 75.8 | 2.5 | 47.9 | 1.9 | 50.1 | 2.2 | 62.6 | 2.9 | ||||||||||||||||||||||||||||||
|
Loans funded by development banks
|
– | – | – | – | – | – | – | – | – | – | ||||||||||||||||||||||||||||||
|
Working capital loans
|
62.3 | 1.8 | 56.4 | 1.8 | 14.4 | 0.6 | 12.7 | 0.6 | 9.1 | 0.4 | ||||||||||||||||||||||||||||||
|
Credit cards
|
– | – | – | – | – | – | – | – | – | – | ||||||||||||||||||||||||||||||
|
Overdrafts
|
4.0 | 0.1 | 4.7 | 0.2 | 2.0 | 0.1 | 1.0 | – | 5.7 | 0.3 | ||||||||||||||||||||||||||||||
|
Total commercial
|
147.2 | 4.3 | 136.9 | 4.5 | 64.4 | 2.5 | 63.8 | 2.8 | 77.4 | 3.5 | ||||||||||||||||||||||||||||||
|
Consumer
|
– | |||||||||||||||||||||||||||||||||||||||
|
Credit cards
|
260.3 | 7.6 | 166.0 | 5.4 | 117.9 | 4.6 | 107.4 | 4.7 | 94.6 | 4.3 | ||||||||||||||||||||||||||||||
|
Personal loans
|
88.1 | 2.6 | 72.0 | 2.3 | 8.0 | 0.3 | 7.4 | 0.3 | 4.1 | 0.2 | ||||||||||||||||||||||||||||||
|
Automobile and vehicle loans
|
10.7 | 0.3 | 7.5 | 0.2 | 3.8 | 0.1 | 5.4 | 0.2 | 5.3 | 0.2 | ||||||||||||||||||||||||||||||
|
Overdrafts
|
4.3 | 0.1 | 3.4 | 0.1 | 4.0 | 0.2 | 2.1 | 0.1 | – | – | ||||||||||||||||||||||||||||||
|
Loans funded by development banks
|
– | – | – | – | – | – | – | – | – | – | ||||||||||||||||||||||||||||||
|
General purpose loans
|
– | – | – | – | – | – | – | – | – | – | ||||||||||||||||||||||||||||||
|
Working capital loans
|
– | – | – | – | – | – | – | – | – | – | ||||||||||||||||||||||||||||||
|
Total consumer
|
363.4 | 10.6 | 248.8 | 8.1 | 133.7 | 5.3 | 122.3 | 5.3 | 104.0 | 4.8 | ||||||||||||||||||||||||||||||
|
Microcredit
|
– | – | – | – | – | – | – | – | – | – | ||||||||||||||||||||||||||||||
|
Mortgages
|
18.7 | 0.5 | 31.9 | 1.0 | 12.9 | 0.5 | 24.7 | 1.1 | 23.5 | 1.1 | ||||||||||||||||||||||||||||||
|
Financial leases
|
3.1 | 0.1 | 2.5 | 0.1 | 1.8 | 0.1 | 2.7 | 0.1 | 1.4 | 0.1 | ||||||||||||||||||||||||||||||
|
General
|
– | – | – | – | – | – | – | – | – | – | ||||||||||||||||||||||||||||||
|
Total foreign
|
532.5 | 15.6 | 420.1 | 13.7 | 212.7 | 8.4 | 213.5 | 9.3 | 206.3 | 9.4 | ||||||||||||||||||||||||||||||
|
Total allowance for loan and financial lease losses
|
3,413.7 | 100.0 | 3,073.0 | 100.0 | 2,545.6 | 100.0 | 2,306.5 | 100.0 | 2,183.9 | 100.0 | ||||||||||||||||||||||||||||||
Charge-offs
The following table presents the allocation of our charge-offs by type of loan for the years indicated.
|
Year ended December 31,
|
||||||||||||||||||||
|
2014
|
2013
|
2012
|
2011
|
2010
|
||||||||||||||||
|
(in Ps billions)
|
||||||||||||||||||||
|
Domestic
|
||||||||||||||||||||
|
Commercial and consumer
|
||||||||||||||||||||
|
General purpose loans
|
128.1 | 93.8 | 106.4 | 138.0 | 166.7 | |||||||||||||||
|
Loans funded by development banks
|
7.8 | 6.5 | 4.6 | 5.5 | 8.8 | |||||||||||||||
|
Working capital loans
|
24.2 | 18.8 | 5.1 | 31.1 | 34.7 | |||||||||||||||
|
Credit cards
|
205.8 | 153.6 | 108.7 | 73.0 | 80.3 | |||||||||||||||
|
Personal loans
|
499.7 | 389.9 | 283.4 | 193.5 | 257.7 | |||||||||||||||
|
Automobile and vehicle loans
|
59.9 | 47.3 | 36.0 | 37.5 | 50.6 | |||||||||||||||
|
Overdrafts
|
8.4 | 6.4 | 7.6 | 6.7 | 12.4 | |||||||||||||||
|
Total commercial and consumer
|
933.8 | 716.3 | 551.6 | 485.2 | 611.2 | |||||||||||||||
|
Microcredit
|
27.3 | 20.0 | 12.6 | 11.6 | 12.0 | |||||||||||||||
|
Mortgages and other
|
0.5 | 0.1 | 0.4 | 0.6 | 11.4 | |||||||||||||||
|
Financial leases
|
30.8 | 18.8 | 21.7 | 14.2 | 25.5 | |||||||||||||||
|
Total domestic
|
992.5 | 755.1 | 586.4 | 511.6 | 660.1 | |||||||||||||||
|
Foreign
|
||||||||||||||||||||
|
Commercial and consumer
|
||||||||||||||||||||
|
General purpose loans
|
15.8 | 0.8 | 6.3 | 17.6 | 1.8 | |||||||||||||||
|
Loans funded by development banks
|
– | – | – | – | – | |||||||||||||||
|
Working capital loans
|
4.6 | 0.5 | 2.5 | 6.2 | 1.1 | |||||||||||||||
|
Credit cards
|
220.7 | 146.6 | 97.9 | 117.4 | 12.8 | |||||||||||||||
|
Personal loans
|
40.5 | 12.7 | 6.2 | 7.4 | 0.7 | |||||||||||||||
|
Automobile and vehicle loans
|
5.6 | 2.4 | 1.9 | 2.8 | 0.4 | |||||||||||||||
|
Overdrafts
|
9.6 | 7.6 | 5.0 | 5.0 | – | |||||||||||||||
|
Total commercial and consumer
|
296.8 | 170.7 | 119.9 | 156.5 | 16.8 | |||||||||||||||
|
Microcredit
|
– | – | – | – | – | |||||||||||||||
|
Mortgages and other
|
15.2 | 4.5 | 5.5 | 8.1 | 0.2 | |||||||||||||||
|
Financial leases
|
0.5 | (0.1 | ) | 1.3 | 0.5 | 0.5 | ||||||||||||||
|
Total foreign
|
312.4 | 175.1 | 126.7 | 165.1 | 17.5 | |||||||||||||||
|
Total charge-offs
|
1,304.9 | 930.2 | 713.2 | 676.7 | 677.6 | |||||||||||||||
The ratio of charge-offs to average outstanding loans for the periods indicated was as follows.
|
Year ended December 31,
|
||||||||||||
|
2014
|
2013
|
2012
|
||||||||||
|
(in percentages)
|
||||||||||||
|
Ratio of charge-offs to average outstanding loans
|
1.3 | % | 1.1 | % | 1.0 | % | ||||||
Loans are subject to charge-offs when all possible collection mechanisms have been exhausted and when they are one hundred percent (100%) provisioned.
Charge-offs do not, however, eliminate the obligation of our banking subsidiaries to continue to engage in collection efforts to accomplish recovery. The board of directors of each of our banks is the only administrative body with legal authority to approve charge-offs of transactions deemed uncollectible. The recovery of charged-off loans is accounted for as income in our consolidated statement of income.
Potential problem loans
In order to carefully monitor the credit risk associated with clients, we have established a committee that meets monthly to identify potential problem loans, which are then included on a watch list. In general, these are loans due by clients that could face difficulties complying with their repayment obligations, but who otherwise have had a good payment history. These potential difficulties could be related to factors such as a decline in economic activity, financial weakness or any other event that could affect the client’s business. Our banks also monitor the credit risk associated with these clients.
Potential problem loans are primarily those classified as “B” under the Superintendency of Finance’s credit classification and provisioning guidelines. See “Item 11. Quantitative and Qualitative Disclosures About Risk—Risk management—Credit classification and provisioning.” At December 31, 2014, Ps 3,012.4 billion, or 2.7%, of our subsidiaries’ total loan were classified as potential problem loans under these guidelines.
Separately, we also monitor loans granted by our banks to a single borrower where we have an aggregate exposure of Ps 2.0 billion or greater.
Cross-border outstanding loans and investments
We do not have any cross-border outstanding loans and investments to a borrower in any country that exceeded 0.75% of our total assets. The following table presents information with respect to our cross-border outstanding loans and investments at December 31, 2014, 2013 and 2012. See “—Loan portfolio” above for a description of cross-border outstanding by type of foreign borrower.
|
At December 31,
|
||||||||||||
|
2014
|
2013
|
2012
|
||||||||||
|
(in Ps billions)
|
||||||||||||
|
Loans
|
||||||||||||
|
Commercial
|
||||||||||||
|
Costa Rica
|
2,069.8 | 1,413.5 | 1,081.9 | |||||||||
|
El Salvador
|
938.4 | 726.6 | 540.7 | |||||||||
|
Guatemala
|
2,777.8 | 2,294.5 | 466.4 | |||||||||
|
Honduras
|
1,504.4 | 1,154.5 | 910.3 | |||||||||
|
Nicaragua
|
1,292.9 | 956.8 | 778.3 | |||||||||
|
Panama
|
2,658.3 | 1,990.9 | 545.0 | |||||||||
|
Consumer
|
||||||||||||
|
Costa Rica
|
820.3 | 569.6 | 457.9 | |||||||||
|
El Salvador
|
556.1 | 285.9 | 210.8 | |||||||||
|
Guatemala
|
378.5 | 261.5 | 99.6 | |||||||||
|
Honduras
|
295.4 | 211.5 | 134.1 | |||||||||
|
Nicaragua
|
485.5 | 320.2 | 172.3 | |||||||||
|
Panama
|
2,114.5 | 1,660.6 | 597.9 | |||||||||
|
At December 31,
|
||||||||||||
|
2014
|
2013
|
2012
|
||||||||||
|
(in Ps billions)
|
||||||||||||
|
Financial Leases
|
||||||||||||
|
Costa Rica
|
401.1 | 288.9 | 222.3 | |||||||||
|
El Salvador
|
13.4 | 13.3 | 13.7 | |||||||||
|
Guatemala
|
6.8 | 6.4 | 0.1 | |||||||||
|
Honduras
|
1.5 | 1.2 | 0.7 | |||||||||
|
Nicaragua
|
5.6 | 4.6 | 2.4 | |||||||||
|
Panama
|
95.1 | 56.4 | 32.7 | |||||||||
|
Mortgages
|
||||||||||||
|
Costa Rica
|
2,332.6 | 1,654.9 | 1,280.0 | |||||||||
|
El Salvador
|
648.5 | 510.4 | 468.1 | |||||||||
|
Guatemala
|
857.9 | 686.9 | 461.3 | |||||||||
|
Honduras
|
558.8 | 447.6 | 436.6 | |||||||||
|
Nicaragua
|
269.8 | 211.4 | 170.2 | |||||||||
|
Panama
|
1,461.6 | 1,129.0 | 458.9 | |||||||||
|
Credit Cards
|
||||||||||||
|
Costa Rica
|
1,683.6 | 1,305.0 | 990.3 | |||||||||
|
El Salvador
|
746.0 | 548.8 | 427.0 | |||||||||
|
Guatemala
|
883.7 | 608.3 | 440.7 | |||||||||
|
Honduras
|
690.9 | 495.3 | 464.2 | |||||||||
|
Nicaragua
|
254.0 | 190.0 | 208.1 | |||||||||
|
Panama
|
862.5 | 516.9 | 418.9 | |||||||||
|
Total per country
|
||||||||||||
|
Costa Rica
|
7,307.4 | 5,231.9 | 4,032.5 | |||||||||
|
El Salvador
|
2,902.3 | 2,085.0 | 1,660.2 | |||||||||
|
Guatemala
|
4,904.6 | 3,857.6 | 1,468.2 | |||||||||
|
Honduras
|
3,051.0 | 2,310.1 | 1,946.0 | |||||||||
|
Nicaragua
|
2,307.8 | 1,683.0 | 1,331.2 | |||||||||
|
Panama
|
7,192.0 | 5,382.3 | 2,053.3 | |||||||||
|
Investments
|
||||||||||||
|
Australia
|
– | 0.6 | 3.9 | |||||||||
|
Brazil
|
1,212.9 | 890.8 | 498.5 | |||||||||
|
British Virgin Islands
|
– | – | 46.9 | |||||||||
|
Barbados
|
– | 4.3 | – | |||||||||
|
Canada
|
6.3 | 9.0 | 2.2 | |||||||||
|
Cayman Islands
|
73.1 | 53.2 | 383.1 | |||||||||
|
Chile
|
452.7 | 345.6 | 322.9 | |||||||||
|
Costa Rica
|
1,027.8 | 755.1 | 712.8 | |||||||||
|
El Salvador
|
49.9 | 117.9 | 59.1 | |||||||||
|
France
|
20.1 | 1.3 | 5.3 | |||||||||
|
Germany
|
7.3 | 24.0 | 10.5 | |||||||||
|
Guatemala
|
418.6 | 462.5 | 218.8 | |||||||||
|
Honduras
|
415.1 | 261.9 | 374.8 | |||||||||
|
Ireland
|
2.5 | 2.0 | – | |||||||||
|
Luxembourg
|
– | 1.2 | – | |||||||||
|
Mexico
|
201.6 | 132.3 | 116.6 | |||||||||
|
Netherlands
|
– | – | 23.2 | |||||||||
|
Nicaragua
|
5.4 | 4.8 | 11.3 | |||||||||
|
Panama
|
591.6 | 333.0 | 393.8 | |||||||||
|
Peru
|
570.2 | 483.2 | 287.0 | |||||||||
|
Spain
|
28.5 | 12.1 | 5.3 | |||||||||
|
United Kingdom
|
38.6 | 15.7 | 10.7 | |||||||||
|
United States of America
|
842.5 | 749.0 | 497.3 | |||||||||
|
BAC San José Liquid Fund (
BAC San José Fondo Líquido – Riesgo País Mixto
)
|
43.0 | 27.4 | 5.0 | |||||||||
|
Multilateral – Bank Information Center (
Centro de Información sobre la Banca
)
|
– | – | – | |||||||||
|
Inversiones Bursatiles Credom. Riesgo País Mixto
|
2.4 | 1.9 | – | |||||||||
|
Multilateral – Bladex (
Foreign Trade Bank of Latin America
)
|
127.3 | 78.8 | – | |||||||||
|
Multilateral – Andean Development Corporation (
Corporación Andina de Fomento
)
|
28.5 | 2.0 | 3.7 | |||||||||
|
Multilateral – Central American Bank for Economic Integration
|
5.3 | 39.2 | 56.4 | |||||||||
|
Total investments
|
6,170.9 | 4,808.8 | 4,142.3 | |||||||||
Deposits
The principal components of our deposits are customer demand (checking and saving accounts) and time deposits. Our retail customers are the principal source of our demand and time deposits. The following table presents the composition of our deposits at December 31, 2014, 2013 and 2012.
|
At December 31,
|
||||||||||||
|
2014
|
2013
|
2012
|
||||||||||
|
(in Ps billions)
|
||||||||||||
|
Domestic
|
||||||||||||
|
Interest-bearing deposits:
|
||||||||||||
|
Checking accounts
|
5,297.5 | 4,344.7 | 3,809.5 | |||||||||
|
Time deposits
|
30,060.9 | 23,308.2 | 21,868.2 | |||||||||
|
Savings deposits
|
36,980.1 | 38,536.2 | 30,976.5 | |||||||||
|
Total
|
72,338.5 | 66,189.1 | 56,654.1 | |||||||||
|
Non-interest-bearing deposits:
|
||||||||||||
|
Checking accounts
|
13,394.6 | 12,907.7 | 11,011.1 | |||||||||
|
Other deposits (1)
|
1,144.6 | 895.4 | 730.0 | |||||||||
|
Total
|
14,539.1 | 13,803.1 | 11,741.1 | |||||||||
|
Total domestic deposits
|
86,877.7 | 79,992.2 | 68,395.2 | |||||||||
|
At December 31,
|
||||||||||||
|
2014
|
2013
|
2012
|
||||||||||
|
(in Ps billions)
|
||||||||||||
|
Foreign
|
||||||||||||
|
Interest-bearing deposits:
|
||||||||||||
|
Checking accounts
|
7,894.7 | 5,983.4 | 4,440.1 | |||||||||
|
Time deposits
|
11,797.7 | 9,431.1 | 4,996.8 | |||||||||
|
Savings deposits
|
5,302.9 | 3,943.4 | 2,569.5 | |||||||||
|
Total
|
24,995.3 | 19,357.8 | 12,006.4 | |||||||||
|
Non-interest-bearing deposits:
|
||||||||||||
|
Checking accounts
|
2,204.0 | 1,647.9 | 841.7 | |||||||||
|
Other deposits (1)
|
315.2 | 192.5 | 220.0 | |||||||||
|
Total
|
2,519.2 | 1,840.4 | 1,061.7 | |||||||||
|
Total foreign deposits
|
27,514.5 | 21,198.2 | 13,068.1 | |||||||||
|
Total deposits
|
114,392.2 | 101,190.4 | 81,463.3 | |||||||||
|
(1)
|
Consists of deposits from correspondent banks, cashier checks and collection services.
|
The following table presents time deposits, by amount and maturity at December 31, 2014.
|
At December 31, 2014
|
||||||||||||
|
Peso-denominated
|
Foreign currency-denominated
|
Total
|
||||||||||
|
(in Ps billions)
|
||||||||||||
|
Domestic
|
||||||||||||
|
Up to 3 months
|
7,264.4 | 2,964.3 | 10,228.8 | |||||||||
|
From 3 to 6 months
|
2,645.7 | 1,160.3 | 3,806.0 | |||||||||
|
From 6 to 12 months
|
3,953.6 | 1,384.0 | 5,337.6 | |||||||||
|
More than 12 months
|
6,971.0 | 361.0 | 7,331.9 | |||||||||
|
Time deposits less than U.S.$100,000 (1)
|
3,147.4 | 209.2 | 3,356.6 | |||||||||
|
Total domestic
|
23,982.0 | 6,078.8 | 30,060.9 | |||||||||
|
Foreign (2)
|
– | 11,797.7 | 11,797.7 | |||||||||
|
Total
|
23,982.0 | 17,876.6 | 41,858.6 | |||||||||
|
(1)
|
U.S.$100,000 is the equivalent of Ps 239,246,000 (translated at the representative market rate of Ps 2,392.46 to U.S.$1.00 at December 31, 2014).
|
|
(2)
|
Represents operations outside of Colombia.
|
Return on equity and assets
The following table presents certain selected financial ratios for the periods indicated.
|
At December 31,
|
||||||||||||
|
2014
|
2013
|
2012
|
||||||||||
|
(in percentages)
|
||||||||||||
|
ROAA
: Return on average assets (1)
|
1.5 | 1.9 | 2.0 | |||||||||
|
ROAE
: Return on average shareholders’ equity (2)
|
12.4 | 17.1 | 17.7 | |||||||||
|
Average shareholders’ equity as a percentage of average total assets
|
7.9 | 6.9 | 7.3 | |||||||||
|
Period-end shareholders’ equity and non-controlling interest as a percentage of period-end total assets
|
12.6 | 11.8 | 11.4 | |||||||||
|
Dividend payout ratio (3)
|
77.3 | 64.7 | 59.8 | |||||||||
Source: Company calculations based on Grupo Aval data.
|
(1)
|
For methodology used to calculate ROAA, see note (2) to the table under “Item 3. Key Information—A. Selected financial data—Other financial and operating data.”
|
|
(2)
|
For methodology used to calculate ROAE, see note (3) to the table under “Item 3. Key Information—A. Selected financial data—Other financial and operating data.”
|
|
(3)
|
Dividend payout ratio (dividends declared on both common and preferred shares, divided by net income).
|
Short-term borrowings
The following table presents our short-term borrowings, consisting of interbank and overnight funds, for the periods indicated.
|
At December 31,
|
||||||||||||||||||||||||
|
2014
|
2013
|
2012
|
||||||||||||||||||||||
|
Amount
|
Nominal weighted average
rate
|
Amount
|
Nominal weighted average
rate
|
Amount
|
Nominal weighted average
rate
|
|||||||||||||||||||
|
(in Ps billions, except percentages)
|
||||||||||||||||||||||||
|
Short-term borrowings
|
||||||||||||||||||||||||
|
Interbank borrowings and overnight funds
|
||||||||||||||||||||||||
|
End of period
|
4,589.5 | – | 5,123.6 | – | 5,156.5 | – | ||||||||||||||||||
|
Average during period
|
5,956.9 | 3.1 | % | 5,588.4 | 2.9 | % | 5,269.7 | 4.3 | % | |||||||||||||||
|
Maximum amount of borrowing at any month-end
|
7,176.0 | – | 7,004.7 | – | 8,323.7 | – | ||||||||||||||||||
|
Interest paid during the period
|
184.9 | – | 160.8 | – | 228.3 | – | ||||||||||||||||||
Industry
Colombia
Prior to the 1990s, Colombia’s financial system consisted of a large number of specialized entities, which focused on specific areas of finance and the majority of which were separately regulated. However, following the enactment of a series of laws promoting the deregulation of the financial system, including the enactment of Law 45 of 1990, Law 35 of 1993 and Decree 663 of 1993, as amended, and EOSF, the financial system transformed from a system consisting of several smaller financial institutions providing a limited set of services to a system consisting of several large financial conglomerates with multiple capabilities within the same organization.
The economic crisis of the late 1990s affected most countries in Latin America, including Colombia. Many financial companies were acquired by large commercial banks, while others were nationalized or liquidated. In the aftermath of the crisis and partly as a result of it, the foundation for the current Colombian financial system was developed with the establishment of solid regulatory principles and strengthened financial groups operating under a single regulatory framework.
In recent years, the financial system in Colombia has continued to consolidate, leading to relatively high merger and acquisition activity since 2005, particularly between 2005 and 2012, including the merger of Corporación Nacional de Ahorro y Vivienda S.A. (Conavi), Corporación Financiera Nacional y Suramericana S.A., or “Corfinsura,” and Bancolombia; the acquisition of Banco Aliadas S.A. by Banco de Occidente; the merger of Banco Tequendama S.A. and Banco GNB Sudameris S.A.; the merger of Banco Colmena S.A. and Banco Caja Social S.A. to form BCSC S.A.; the acquisition of Bansuperior S.A. by Davivienda; the acquisition of Banco Granahorrar S.A. by BBVA Colombia; and the acquisition of Banco Unión Colombiano S.A. by Banco de Occidente. Also, during 2006, Banco de Bogotá acquired Megabanco and Davivienda acquired Gran Banco—Bancafé S.A. In 2007, Bancolombia acquired Banagrícola in El Salvador, and in 2008, ABN AMRO Bank Colombia S.A. became Royal Bank of Scotland (Colombia) S.A. following the acquisition of ABN AMRO Bank NV by a consortium led by Royal Bank of Scotland, Fortis and Banco Santander S.A. Also, in 2008, General Electric Money purchased a 49.7% stake in Banco Colpatria. In 2010, Scotiabank acquired Royal Bank of Scotland (Colombia) S.A., and five financing companies merged with their respective commercial banks (BBVA Leasing S.A., Leasing Popular S.A., Leasing de Occidente S.A., Leasing Bogotá S.A. and Helm Leasing S.A.). In 2011, Scotiabank agreed to acquire a 51% stake in Banco Colpatria and Banco Santander S.A. agreed to sell Banco Santander Colombia S.A. to Corpbanca S.A., a Chilean financial services company. Banco WWB S.A., Banco Coomeva S.A., Banco Finandina S.A., Banco Falabella S.A. and Banco Pichincha S.A. entered the banking market in Colombia. In 2012, HSBC agreed to sell HSBC Colombia S.A. to Banco GNB Sudameris S.A., Corpbanca agreed to buy Helm Bank S.A. and BTG Pactual acquired Bolsa y Renta. Also in 2012, Banco Santander, having sold-off its wholesale banking operations to Corpbanca the year before, filed a petition with the Superintendency of Finance to obtain a license for a new bank aimed mainly at corporate clients. In 2013, Banco Davivienda agreed to acquire Corredores Asociados, Colombia’s largest brokerage firm, while in 2014 Brazil’s Itaú Unibanco agreed to acquire a majority stake in Chile’s Corpbanca, both of which, have local operations in Colombia. Various banking institutions, which have recently been incorporated in Colombia, target specific segments such as the microcredit and small and medium enterprises segments and corporate banking or commercial banking. These institutions include Banco de las Microfinanzas-Bancamía S.A., Banco WWB S.A. and Banco Coomeva S.A., as well as three new financial corporations, JP Morgan Corporación Financiera S.A., BNP Paribas Colombia Corporación Financiera S.A. and Itaú BBA Colombia S.A., which are local subsidiaries of international financial institutions. The business of these new credit institutions may affect our market position in the individual, small and medium enterprises and merchant banking segments.
While the Colombian government has been promoting consolidation and expansion of the scope of activities of Colombian financial institutions, it has simultaneously been strengthening corporate governance, risk management and supervision. See “
—
Supervision and regulation.”
Colombian Banking System During the Recent Global Economic and Financial Crisis
Following the bankruptcy of Lehman Brothers in September 2008, international financial markets faced extraordinary levels of volatility. Colombia’s real GDP remained positive during the financial crisis. The Colombian financial system was comparatively less vulnerable to the effects of the global economic and financial crisis due to a combination of factors, including high capitalization ratios, lack of exposure to complex financial products such as credit default swaps and collateralized debt obligations, and a strong foundation of domestic deposits with little dependence on capital markets or external funding (approximately 3% of liabilities were denominated in foreign currency). Overall, the Colombian banking system benefited from these factors and from the Colombian Central Bank’s ability to adopt a countercyclical monetary policy. In the aftermath of the global crisis, the system’s profitability measures remained stable.
Recent Growth of Financial Sector
From a macroeconomic perspective, the Colombian financial sector has been one of the primary engines of economic growth in the country in recent years. According to DANE, GDP of the financial sector comprising financial intermediation, insurance and other related services, grew at a CAGR of 8.2% in the five-year period ended December 31, 2014 in real terms, 3.4 percentage points above that of annual growth of total GDP during the same period. Economic stability, improvements in security conditions, increased employment rates and enhanced purchasing power on the part of the Colombian population have contributed to an increase in the penetration of financial services. According to DANE, Colombian real GDP per capita grew by 19.4% in the five-year period ended December 31, 2014. As the economy recovered, Colombia’s annual average unemployment rate decreased to 10.4% in 2012, 9.6% in 2013 and 9.1% in 2014. At the same time, deposits in the banking system grew 69.5% in real terms and 96.3% in nominal terms during the five-year period ended December 31, 2014 as adjusted to include deposit growth of the five financing companies that merged with commercial banks during 2010 (BBVA Leasing S.A., Leasing Popular S.A., Leasing de Occidente S.A., Leasing Bogotá S.A. and Helm Leasing S.A.), and the three financing companies and the cooperative bank that converted to commercial banks during 2011 (Banco Pichincha S.A., Banco Falabella S.A., Banco Finandina S.A. and Bancoomeva S.A.).
The following charts present the sector evolution and annual growth of total GDP and GDP of the financial sector for the periods indicated.

Source: DANE (“Index 2001=100” refers to a value of 100 on December 31, 2001 for the quarterly GDP in constant pesos of 2005). GDP of the financial sector refers to services of financial intermediation, insurance and other related services, as defined by DANE, including the Colombian Central Bank, commercial banks, finance corporations, financing companies, trust funds (
fondos fiduciarios
), cooperatives, employee funds (
fondos de empleados
), special state-owned institutions (such as Banco de Comercio Exterior (Bancoldex), Financiera de Desarrollo Territorial S.A., or “Findeter,” and Financiera Energética Nacional (FEN), among others), insurance companies, insurance brokerage firms, brokerage firms, trust companies, pension and severance fund management companies, and guaranty funds, among others. Previously, this data was calculated using the GDP series of 2000 as base year, which was discontinued by DANE in 2010 and replaced by the GDP series of 2005 as base year.
Credit Volumes
Credit volumes in Colombia have grown steadily since 2004. Despite this increase in lending, the Colombian market still has a relatively low credit penetration rate as compared to that of other developed and emerging market countries. The following chart presents domestic credit to the private sector as a percentage of GDP of specified countries at December 31, 2013.
Domestic Credit to private sector / GDP

Source: World Bank Development Indicators. Data at December 31, 2013. Domestic credit to private sector refers to financial resources provided to the private sector, which may include, among others, loans, purchases of non-equity securities, and trade credits and other accounts receivable, that establish a claim for repayment. For some countries these claims include credit to public enterprises.
Domestic credit to the private sector as a percentage of GDP, as defined by the World Bank Development Indicators, refers to financial resources provided to the private sector, such as through loans, purchases of non-equity securities, and trade credits and other accounts receivable, that establish a claim for repayment. This metric encompasses a broad range of entities that provide credit, and is not limited to banking institutions. It is widely used for comparison purposes across countries due to its reliability and homogeneity. The World Bank Development Indicators cover 214 countries from 1960 to 2013.
Credit provided exclusively by banking institutions is used to refer to bank intermediation, as it is the main business of Grupo Aval’s banking subsidiaries. Specifically, when referring to bank credit penetration, bank credit refers to gross loans and leasing operations provided by commercial banks in Colombia, according to data from the Superintendency of Finance, and GDP refers to nominal GDP in pesos, according to data from DANE. We believe these metrics, and the calculation resulting therefrom, reflect more appropriately Colombia’s domestic credit-to-GDP situation and render 37.1% and 37.9% ratios for the periods ended December 31, 2013 and December 31, 2014, respectively.
The Colombian bank credit market consists of the extension of loans to individuals and corporations through four main business lines: commercial, consumer, microcredit and mortgage. According to the Superintendency of Finance, at December 31, 2014, a total of Ps 304.6 trillion (U.S.$129.9 billion) of gross loans granted by Colombian banks were outstanding, of which 60.1% were commercial loans, 27.4% were consumer loans, 9.5% were mortgages and 2.8% were microcredit loans.
Gross bank loans in the Colombian banking sector as a percentage of GDP also increased in the past five years from 25.6% in the year ended December 31, 2009 to 37.9% at December 31, 2014. The following chart presents bank credit as a percentage of GDP over the past twenty years.
* As of December 31, 2014
Source: Company estimates, based on DANE and Superintendency of Finance. Data shown starts in 1995 in order to capture the negative effect that the economic crisis of the late 1990s had on bank credit penetration. GDP series used are those of 2005 as the base year, and nominal GDP prior to 2000 is calculated by applying reported nominal growth to the 2005 series. Previously, these ratios were calculated using the GDP series of 2000 as base year, which was discontinued by DANE in 2010 and replaced by the GDP series of 2005 as base year.
Although loan quality and loan loss coverage ratios deteriorated between 2007 and mid-2009 as a result of the economic slowdown preceding the global crisis, overall loan quality and coverage ratios have improved significantly during the last ten years in Colombia. The following charts illustrate this trend and present non-performing loans as a percentage of total loans and the loan loss coverage ratio from December 2002 to December 2014.

|
| Source: Superintendency of Finance |
Source: Superintendency of Finance. Past due loans refers to loans overdue more than 30 days, as defined by the Superintendency of Finance. Loan loss coverage ratio refers to loan loss allowances divided by past due loans.
Colombia’s banking system is well capitalized under regulations applicable at such date, with an average risk-based capital ratio of 15.1% at December 31, 2014, as reported and calculated by the Superintendency of Finance, significantly above the minimum regulatory requirement of 9%. The capital-to-total assets ratio and the risk-based capital ratio have increased since 2005: the former currently exceeds that of comparable countries in Latin America, while the latter is above that of Chile and Peru. The following charts present regulatory capital as a percentage of risk-weighted assets, and shareholders’ equity as a percentage of total assets from 2007 to 2014 for the banking sector in Brazil, Colombia, Chile, Peru and Mexico.

Source: IMF for non-Colombian countries and Superintendency of Finance for Colombia. For non-Colombian countries, shareholders’ equity refers to equity and regulatory capital refers to bank regulatory capital, as reported by the IMF’s Financial Soundness Indicators, October 2014. According to the IMF, capital is measured as total capital and reserves as reported in the sectorial balance sheet for cross-border consolidated data; Tier I capital can also be used (this definition of capital is also used by the IMF for calculating the ratio of return on equity). For Colombia, shareholders’ equity refers to that of commercial banks, and regulatory capital to risk-weighted assets refers to the risk-based capital ratio of commercial banks as defined and reported by the Superintendency of Finance. As of August 2013, the definition of risk-based capital ratio in Colombia was modified by Decree 1771 of 2012, resulting in a decline in such ratio in Colombia compared to figures reported prior to that month. The latest available data for shareholder’s equity to total assets for Brazil, Chile and Peru is as of June 30, 2014; and for Mexico is as of July 31, 2014. The latest available data for regulatory capital to risk-weighted assets for Brazil and Peru is as of June 30, 2014; for Chile is as of May 31, 2014; and for Mexico is as of July 31, 2014. Data shown for Colombia is as of December 31, 2014.
At the same time, the profitability of the financial sector improved significantly during the first half of the decade starting in 2000 and remained relatively stable in the second half of the decade, including during the global
economic and financial crisis. The following charts present ROAA and ROAE for the Colombian financial sector from December 2002 to December 2014.

Source: Company estimates, based on Superintendency of Finance. ROAA refers to 12-month profits divided by the average of assets in the current month and in the same month of the prior year. Similarly, ROAE refers to 12-month profits divided by the average of shareholders’ equity in the current month and in the same month of the prior year.
The following charts present ROAA and ROAE from 2007 to 2014 for the banking sector in Brazil, Colombia, Chile, Peru and Mexico.

Source: IMF’s Financial Soundness Indicators, October 2014, for Brazil, Chile, Peru and Mexico; and company estimates based on Superintendency of Finance for Colombia. The latest available data for Brazil, Chile and Peru is as of June 30, 2014; and for Mexico is as of July 31, 2014. Latest available data for Colombia is as of December 31, 2014.
Main Market Participants
According to the Superintendency of Finance, at December 31, 2014, the principal participants in the Colombian financial system were the Colombian Central Bank, 22 commercial banks (fourteen domestic banks, seven subsidiaries of foreign institutions and one bank owned by the Colombian government), 21 financing companies and five finance corporations. In addition, trust companies, cooperatives, insurance companies, insurance brokerage firms, bonded warehouses, special state-owned institutions that provide credit to specific segments of the population who generally lack normal access to commercial and retail banking, and pension and severance pay funds also participate. For a description of the roles of these entities, see “—Supervision and regulation—Regulatory framework for Colombian financial institutions.” For information about our competitive position, see “—Competition.”
Our principal competitors are Bancolombia, Davivienda and BBVA Colombia, which are the three leading banking groups in Colombia after Grupo Aval. International players active in the Colombian market include CorpBanca Colombia S.A., Banco Bilbao Vizcaya Argentaria Colombia, S.A., and Citibank-Colombia S.A.
Recent Developments in the Colombian Stock Market
Colombia’s stock market was one of the top performers worldwide following the global economic and financial crisis of 2008. The Colombian Stock Market Index (
Índice General de la Bolsa de Colombia
), or “IGBC,” decreased 11.0% in 2014, decreased 11.2% in 2013, increased 16.2% in 2012, decreased 18.3% in 2011, and increased 33.6% in 2010 and 53.5% in 2009, after falling 29.3% in 2008. Since November 2013 the new benchmark index for the Colombian Stock Market is the “COLCAP” (
Índice de Capitalización Colombiano
), which decreased 5.8% in 2014. Colombia’s stock market capitalization stood at Ps 364.1 trillion (U.S.$153.1 billion) at December 31, 2014. Simultaneously, the daily average trading volume in the stock market decreased to Ps 165.4 billion (U.S.$69.12 million) during 2014, from Ps 167.5 billion (U.S.$89.7 million) during 2013, a decrease of 1.3%, after decreasing 11% in 2013 from Ps 188.2 billion (U.S.$104.7 million) during 2012, and after increasing 15.8% in 2012 from Ps 162.6 billion (U.S.$87.9 million) during 2011.
The increase in trading volumes and elevated returns in recent years had been mainly driven by the following factors: (1) the counter-cyclical monetary policy conducted by Colombia’s Central Bank, which cut its overnight lending rate by 700 basis points to 3.0% from December 2008 until April 2010 (the lowest level ever recorded), increased it moderately by 225 basis points to 5.25% from February 2011 until June 2012, decreased it again by 200 basis points to 3.25% from July 2012 until March 2013, and increased it one more time by 125 basis points to 4.5% from April 2014 to August 2014; (2) a sharp decline in global risk aversion since March 2009 through the end of 2010, and during the second half of 2012 and the first months of 2013, and then again since March 2014 until August 2014; (3) expectations of a strong recovery in local economic activity since the second half of 2009, which intensified during 2010 and 2011 due to the release of positive economic data suggesting a stronger recovery than initially expected by local authorities and analysts, and then again a stronger recovery than expected following the economic slowdown of the second half of 2012 and the first quarter of 2013; and (4) a limited supply of local stock market securities to match a fast-growing demand. Despite stronger domestic economic activity, the worsening of the European sovereign debt crisis in 2011 had a significant adverse impact on equity markets worldwide including Colombian markets. However, the intervention announced by the European Central Bank at the end of 2011 (long-term financing operations for up to three years) and in September of 2012 (unlimited purchases of European sovereign debt, contingent to governments requesting a formal financial assistance program), and the implementation of a third round of large-scale asset purchases announced by the U.S. Federal Reserve Bank, assisted in stabilizing financial markets, which prompted a strong rally in local equity markets during the first quarter of 2012 and the second half of 2012, following sharp falls during the second quarter of that year. However, the Colombian stock market was affected throughout 2013 due to the domestic slowdown that became more apparent by the start of that year and by the U.S. Federal Reserve’s signaling of its intention to gradually scale back its asset purchases by the end of 2013. The stock market recovered from March 2014 to August 2014 as risk aversion waned following a short-lived emerging markets crisis at the start of that year. However, since September 2014, the Colombian stock market, which is highly concentrated in the oil sector, has been hit by a historic drop of more than 50 percent in oil prices.
Some of the main participants in the local stock market are the private pension and severance fund managers, individual investors and brokerage firms (
Sociedades Comisionistas de Bolsa
). Private pension and severance funds managed a portfolio of Ps 77.8 trillion (U.S.$32.5 billion) in equity securities, of which Ps 40.41 trillion (U.S.$18.2 billion) corresponded to the local stock market at December 31, 2014; equity securities represented 46.1% of total assets under management at December 31, 2014. The share of equity securities in private pension funds’ portfolios has increased substantially in recent years from an average of 27.8% in 2008, 32.2% in 2009 and 43.0% in 2010, to 44.1% in 2011, 44.2% in 2012, 43.2% in 2013 and 45.0% at December 31, 2014.
Private Pension Fund System
A private pension fund system came into operation in Colombia in 1994, and during the last decade the scope of permissible activity by pension funds has expanded. The pension system consists of a government-sponsored defined public benefit plan, or “RPM,” currently administered by the Colombian Pension Service, Colpensiones, (previously administered by the Colombian Institute of Social Security), and a defined contribution or individual savings system, or “RAIS,” administered by private pension fund administrators under the supervision of the Superintendency of Finance. Since its creation, RAIS has experienced significant growth and is now the principal pension system in Colombia (12.5 million of individual customers in RAIS, compared to 6.1 million in RPM, at December 31, 2014). We operate in the pension fund management markets of RAIS through Porvenir (which merged with Horizonte on December 31, 2013). For information about Porvenir’s competitive position, see “—
Competition.” At December 31, 2014, there were four private pension and severance funds managing a total of Ps 176.1 trillion (U.S.$73.6 billion) in assets, consisting of Ps 154.3 trillion (U.S.$64.5 billion) in mandatory pension fund assets; Ps 14.2 trillion (U.S.$5.9 billion) in voluntary pension funds’ assets; and 7.6 trillion (U.S.$3.2 billion) in severance assets. For information about the main participants in the Colombian RAIS pension sector and our market share and position in the pension fund market, see “—Competition.”
Colombia has high-growth potential in the individual savings pension regime due to (1) the low average age of individual customers (33 years); (2) the current penetration levels of pension plans (approximately 85.23% of the employed population at December 31, 2014 participated in either a government-sponsored or a private pension scheme); and (3) the recent trend of individual customers investing in private pension funds, such as Porvenir, instead of the government-sponsored alternative (individual customers in RAIS increased from 8.6 million in 2008 to 8.7 million in 2009, 9.3 million in 2010, 10.0 million in 2011, 10.8 million in 2012, 11.7 million in 2013, and 12.5 million as of December 31, 2014, while individual customers in RPM increased from 6.2 million in 2008 before leveling off at 6.4 million in 2009, 2010 and 2011, at 6.5 million in 2012 and 2013, and at 6.0 in 2014).
Central America
We consider the Central American region to comprise Costa Rica, El Salvador, Guatemala, Honduras, Nicaragua and Panamá. Central America presents a market with similar characteristics to that of Colombia and with growth potential in financial services.
At December 31, 2014, Central America had a total estimated population of approximately 45.4 million, making it the fourth largest market in Latin America by population after Brazil (population of 202.8 million), Mexico (population of 119.7 million) and Colombia (population of 47.7 million) as reported by the IMF. At December 31, 2014, Central America posted an estimated combined GDP of U.S.$208.9 billion, ranking as the sixth largest economy in Latin America after Brazil (nominal GDP of U.S.$2,353 billion), Mexico (nominal GDP of U.S.$1,282.7 billion), Argentina (nominal GDP of U.S.$540.2 billion), Colombia (nominal GDP of U.S.$384.9 billion), and Chile (nominal GDP of U.S.$258.0 billion). According to the IMF, Central America’s GDP grew 4.0% in 2014, below the growth rate for Colombia of 4.6%, and is expected to grow at an annual average rate of 4.3% between 2015 and 2017, compared to Colombia’s expected average growth rate of 3.7% during the same period.
The following table presents population and historical and projected GDP growth data for Central America.
|
Costa Rica
|
El Salvador
|
Guatemala
|
Honduras
|
Nicaragua
|
Panamá
|
Total Central
America (1)
|
||||||||||||||||||||||
|
2014 population (millions) estimated
|
4.8 | 6.4 | 15.9 | 8.3 | 6.2 | 3.9 | 45.4 | |||||||||||||||||||||
|
2014 nominal GDP (U.S.$ billions)
|
48.1 | 25.3 | 60.4 | 19.5 | 11.7 | 43.8 | 208.9 | |||||||||||||||||||||
|
2014 nominal GDP per capita (U.S.$)
|
10,083 | 3,988 | 3,807 | 2,361 | 1,881 | 11,147 | 6,660 | |||||||||||||||||||||
|
CAGR real GDP 2004-2014
|
4.5 | % | 1.8 | % | 3.6 | % | 4.0 | % | 3.8 | % | 8.4 | % | 4.4 | % | ||||||||||||||
|
GDP growth 2015 expected
|
3.8 | % | 2.5 | % | 4.0 | % | 3.3 | % | 4.6 | % | 6.1 | % | 4.2 | % | ||||||||||||||
|
GDP growth 2016 expected
|
4.4 | % | 2.6 | % | 3.9 | % | 3.4 | % | 4.3 | % | 6.4 | % | 4.4 | % | ||||||||||||||
|
GDP growth 2017 expected
|
4.5 | % | 2.6 | % | 3.9 | % | 3.6 | % | 4.0 | % | 6.7 | % | 4.5 | % | ||||||||||||||
Source: GDP and population figures based on the World Economic Outlook, April 2015, published by the IMF.
|
(1)
|
Reflects a GDP-weighted average of Costa Rica, El Salvador, Guatemala, Honduras, Nicaragua and Panamá.
|
During the last several years, countries in the Central American region have increased their efforts to promote fiscal prudence and foreign investment. Countries such as Costa Rica, El Salvador, Guatemala, Honduras and Nicaragua have signed agreements with the IMF under which governments receive credit, subject to adopting fiscal discipline in their economic policies.
Panamá, capitalizing on its geographical advantage and the Panamá Canal, a main continental connecting route, continues to be an important logistical hub and center for commerce and services within the region. In this context, the expansion of the Panamá Canal, scheduled to be completed in 2015, is expected to positively affect the growth rate of the economy and strengthen Panamá’s attractiveness within the region for foreign direct investment.
The Central American region offers a stable market that is expected to further converge towards an integrated economy as a result of the ongoing implementation of free-trade agreements. DR-CAFTA, gradually eliminates barriers to trade and investment among Costa Rica, the Dominican Republic, El Salvador, Guatemala, Honduras, Nicaragua and the United States. The agreement allows the Central American region to access markets in the United States and establishes common regulatory standards among these countries. DR-CAFTA covers most types of trade and commercial exchange between these countries and the United States.
Central American Financial Services Sector
Central America’s financial system has gone through two major phases of consolidation. In the early 2000s, local banks began expanding operations in their own markets through aggressive acquisition strategies, creating local financial groups. Notable examples include Grupo Financiero Cuscatlán’s acquisition of Lloyds TSB Group Plc’s operations in the region in 2004 and Banco de la Producción, S.A. (BANPRO)’s acquisition of Banco Caley Dagnall S.A. from Banco Agrícola S.A. in Nicaragua in March 2005. Following this period of internal consolidation and encouraged by the stability and growth prospects of the region, international banking groups began entering the region in 2004 through acquisitions in various jurisdictions, such as The Bank of Nova Scotia’s acquisition of El Salvador’s Banco de Comercio de El Salvador, S.A. in 2004, Costa Rica’s Banco Interfin S.A. in 2006, and Guatemala’s Banco de Antigua S.A. in 2008; GE Capital’s acquisition of a 49.99% stake in BAC Credomatic in 2005; Citigroup, Inc.’s merger of its Central American operations with Grupo Financiero Cuscatlán and Grupo Financiero Uno S.A. in 2006; and Grupo Financiero HSBC, S.A. de C.V.’s acquisition of Primer Banco del Istmo, S.A. (Banistmo) and Banco Salvadoreño, S.A. (Bancosal) in 2007. Other regional financial institutions have also acquired banks in Central America: Grupo Bancolombia acquired El Salvador’s Banco Agrícola in 2006 and 40% of Guatemala’s Banco Agromercantil in 2012, and Honduras’ Banco Industrial S.A. acquired Banco del País S.A. in 2007. Davivienda purchased the affiliates of HSBC in Costa Rica, El Salvador and Honduras and GNB Sudameris completed the purchase of the subsidiaries of HSBC in Perú, Paraguay and Uruguay in 2012. In 2010 Banco de Bogotá acquired 100% of BAC Credomatic and in 2012 Banco Davivienda agreed to acquire HSBC’s operations in Costa Rica, El Salvador and Honduras. In October 2013, Bancolombia acquired HSBC Bank S.A. Panamá and we have recently expanded our operations in Central America with the acquisition of BBVA Panamá (now known as Banco BAC de Panamá) and Grupo Reformador in December 2013.
The chart below sets forth domestic credit to private sector as a percentage of GDP for Central America and selected countries.
Domestic Credit to Private Sector / GDP

Source: World Bank Development Indicators. Data at December 31, 2013.
Supervision and regulation
Colombian Banking Regulators
Pursuant to the Colombian Constitution, the Colombian Congress has the power to prescribe the general legal framework within which the government and other authorities may regulate the financial system. The Colombian
Constitution also permits the Colombian Congress to authorize government intervention in the economy by statute. The agencies vested with the authority to regulate the financial system are the board of directors of the Colombian Central Bank, the Colombian Ministry of Finance, the Superintendency of Finance, the Superintendency of Industry and Commerce and the Securities Market Self-Regulatory Organization.
Central Bank
The Colombian Central Bank exercises the customary functions of a central bank, including price stabilization, legal currency issuance, regulation of currency circulation, credit and exchange rate monitoring and administration of international reserves. Its board of directors is the regulatory authority for monetary, currency exchange and credit policies, and is responsible for the direction and execution of the Colombian Central Bank duties. The Colombian Central Bank also acts as a last resort lender to financial institutions.
Pursuant to the Colombian Constitution, the Colombian Central Bank is autonomous and independent from the government in the formulation of monetary policy and currency exchange and credit policies. Specifically, the Constitution provides administrative, technical, budgetary and legal autonomy for the Colombian Central Bank and its board of directors with respect to monetary, credit and foreign exchange matters. The Colombian Central Bank reports to the Colombian Congress. Its board of directors has seven members, one of whom is the Minister of Finance and Public Credit, one member is the General Manager of the Colombian Central Bank, and the other five members, who are full-time employees, are appointed by the President of Colombia for four-year terms that can be extended.
Ministry of Finance
The Ministry of Finance designs, coordinates, regulates and executes economic policy, seeking to create an optimal administration of public finances for the economic and social development of the country. The Ministry of Finance regulates all aspects of finance, securities and insurance activities, pursuant to powers conferred by the Colombian Constitution. As part of its duties, the Ministry of Finance issues decrees related mainly to financial, taxation, customs, public credit and budgetary matters that may affect banking transactions in Colombia. In particular, the Ministry of Finance is responsible for regulations relating to financial institutions’ capital adequacy, risk limitations, authorized transactions, disclosure of information and accounting.
According to Decree 4172 of 2011, the “
Unidad Administrativa Especial, Unidad de Proyección Normativa y Estudios de Regulación Financiera
,” an independent unit of the Ministry of Finance is responsible for preparing and drafting any new financial regulation to be issued by the Ministry of Finance.
Superintendency of Finance
The Superintendency of Finance was created as a result of the merger between the Superintendency of Banking and the Superintendency of Securities in 2005. All of the powers and responsibilities of the former Superintendency of Banking and Superintendency of Securities were assigned to the newly created Superintendency of Finance.
The Superintendency of Finance is a technical entity affiliated with the Ministry of Finance that acts as the inspection, supervision and control authority of persons involved in financial, insurance and securities exchange activities, and any other operations related to the management, use or investment of resources collected from the public. The Superintendency of Finance is responsible for supervising the Colombian financial system with the purpose of preserving its stability and trustworthiness, as well as promoting, organizing and developing the Colombian securities market and protecting the users of financial and insurance services and investors in general.
Financial institutions must obtain the authorization of the Superintendency of Finance before commencing operations. In addition, all public offering of securities require the prior approval of the Superintendency of Finance.
Violations of the financial system rules and regulations are subject to administrative, and in some cases, criminal sanctions. The Superintendency of Finance may inspect Colombian financial institutions on a discretionary basis and has the authority to impose sanctions including admonitions, fines, removals, or administrative takeovers on such institutions and their directors and officers for violations of Colombian laws or regulations, or such financial institutions’ by-laws.
The Superintendency of Finance exerts its supervisory powers over the financial sector on a consolidated and comprehensive basis. The consolidated supervision extends to all financial institutions including banks operating in Colombia and their subsidiaries abroad, in the latter case to the extent permitted by the laws of the respective country of incorporation. For these purposes, the Superintendency of Finance has executed several memorandums of understanding with foreign financial sector regulators, including the Superintendency of Banks of Panamá, the Superintendency of the Financial System of El Salvador, the Superintendency of Banks and other Financial Institutions of Nicaragua, the Superintendency of Banks of Guatemala, and the National Commission of Banks and Insurance of Honduras. Additionally, the Superintendency of Finance is currently negotiating the execution of additional memorandums of understanding with other financial regulators to promote an exchange of information and enhance its consolidated and comprehensive supervision.
According to Decree 2555 of 2010 and External Circular 100 of 1995, or the “Basic Accounting Circular,” as amended, and in order to facilitate the Superintendency of Finance’s supervision, financial institutions are required to consolidate the results of operations of all of their subsidiaries in order to present consolidated financial statements of the controlling entity and its subsidiaries, consolidated solvency ratios and capital adequacy requirements of the group. As Grupo Aval is not regulated as a financial institution or as a holding company of banking subsidiaries, it is not required to comply with these requirements; however, all of its financial subsidiaries are required to comply.
The Superintendency of Finance may also conduct onsite inspections of Colombian financial institutions and even of their subsidiaries located abroad, in the latter case, subject to the applicable laws of the subsidiary’s country of incorporation.
According to Article 48 of Decree 2080 of 2000 (as amended by Decree 4800 of 2010), when granting authorizations relating to foreign investment transactions by shareholders of Colombian financial institutions to invest in foreign financial entities, the Superintendency of Finance must take into account the possibility of exercising comprehensive and consolidated supervision. In addition, according to Law 1328 of 2009 and former Decree 4032 of 2010 (as assembled into Decree 2555 of 2010): (1) direct capital investments by Colombian financial institutions in foreign financial, brokerage or insurance companies, branches or agencies, require the prior authorization by the Superintendency of Finance, and (2) indirect capital investment (i.e., through a subsidiary) in foreign financial, brokerage or insurance companies, branches or agencies, require the prior authorization by the Superintendency of Finance if: (a) the initial investments equal or exceed 10% of the investor’s paid-in capital, (b) additional investments equal or exceed 5% of the investor’s paid-in capital or (c) the financial regulatory authority of the country where the investments is to be made has not executed a memorandum of understanding with the Superintendency of Finance. Other indirect investments do not require the approval of the Superintendency of Finance but must be reported to such entity prior to the respective investment.
As an issuer of securities traded on the Colombian Stock Exchange, Grupo Aval is subject to the control of the Superintendency of Finance. Additionally, Grupo Aval’s financial and stock brokerage subsidiaries located in Colombia (including banks, finance corporations, financing companies, trust companies, managers of pensions and severance payment funds, bonded warehouses and stock brokerage firms) are each subject to the regulatory supervision of the Superintendency of Finance. The level of supervision and regulation is different, though, taking into account that Grupo Aval is not a financial institution. Grupo Aval is subject to supervision (
control
) as an issuer of securities in the public market, while financial institutions and stock brokerage firms are subject to inspection and surveillance (
inspección y vigilancia
).
FOGAFIN
FOGAFIN was created in 1985 pursuant to Law 117. The primary function of FOGAFIN is to administer the deposit insurance system, with the objective of guaranteeing the deposits and savings held by the general public in Colombian financial institutions. See “—Troubled financial institutions – Deposit insurance.” The other primary purposes for which FOGAFIN was formed were to support the banking industry, to facilitate the privatization of financial institutions by the Colombian government, and to liquidate financial institutions under receivership.
FOGAFIN has tools and mechanisms that enable it to administer and temporarily take equity stakes in troubled financial institutions in order to allow it to determine whether a financial institution is viable or requires liquidation.
Securities Market Self-Regulatory Organization
Self-regulation in the capital markets was formally introduced in Colombia by Law 964 of 2005, and the securities market self-regulatory organization (
Autoregulador del Mercado de Valores
), or “SRO,” was created in June 2006.
The SRO is a private entity that has the power to supervise, sanction and regulate the entities subject to self-regulation (i.e., including securities intermediaries and any entity that voluntarily submits itself to self-regulation).
The SRO’s supervisory powers entitle it to review compliance with applicable laws and regulations and impose sanctions in the case of violations. The SRO may also propose regulation aimed at various matters, including conflicts of interest and improving the integrity and quality of the capital markets.
Superintendency of Industry and Commerce
According to Law 1340 of 2009, the Superintendency of Industry and Commerce is the competent national authority for all antitrust matters in every sector of the economy, including the financial sector.
As such, the Superintendency of Industry and Commerce is responsible for advancing administrative investigations of antitrust violations of financial and non-financial corporations, and has the power to impose corresponding sanctions.
The Superintendency of Industry and Commerce is responsible for approving economic mergers, acquisitions and integrations between and among enterprises, except for mergers, acquisitions or integrations between financial entities. However, pursuant to Law 1340 of 2009, the Superintendency of Finance is the authority responsible for approving mergers, acquisitions and integrations between financial institutions. For such approvals, the Superintendency of Finance must obtain a prior written opinion by the Superintendency of Industry and Commerce.
Regulatory Framework for Colombian Financial Institutions
Basic Framework: Decree 663 of 1993
The basic regulatory framework for the operations of the Colombian financial sector is set forth in the EOSF, as amended by Laws 510 of 1999, 546 of 1999, 795 of 2003, 964 of 2005 and 1328 of 2009. Decree 2555 of 2010 as well as in Resolution 8 of 2000 (exchange control regulation statute) and Resolution 4 of 2006 issued by the board of directors of the Colombian Central Bank.
The EOSF defines the structure of the Colombian financial system and establishes various business entities, including (1) credit institutions (which are further categorized into banks, finance corporations, financing companies and finance cooperatives), (2) financial services entities, (3) capitalization corporations, (4) insurance companies and (5) insurance intermediaries.
The EOSF also provides that no financial, banking or credit institution may operate in Colombia without the prior approval of the Superintendency of Finance. Subject to prior approval of the Superintendency of Finance, foreign banks may operate in Colombia through their subsidiaries established and incorporated in Colombia. Under Law 1328 of 2009, foreign banks, as of July 15, 2013, are permitted to operate through their “branches” and are not obligated to incorporate a Colombian subsidiary. Operations through these branches will be subject to prior approval by the Superintendency of Finance and among others, branches have to meet the same minimum capital requirements as independent entities do.
The main role of banks, finance corporations and financing companies is to receive deposits. Banks place funds back into circulation by means of loans or any active credit operation; finance corporations place funds into circulation by means of active credit operations or investments, with the purpose of promoting the creation or expansion of enterprises; and financing companies place funds back into circulation by means of active credit operations, with the purpose of fostering the sale of consumer goods and services including leasing operations.
Each credit institution must be separately authorized before it may develop and provide financial services. Furthermore, the activities of credit institutions are subject to limitations and restrictions, including limitations and restrictions relating to the extension of credit, risk concentration, investments, conditional operations, foreign
currency loans and negotiations, and the administration of third-party funds. One of the principal restrictions on financial activities is that banks may not acquire or hold products, merchandise, shares of corporations, income bonds, or other similar securities, except (1) when the bank has received those goods or securities as collateral for loans it has made or (2) with respect to shares, when they are issued by companies where banks are permitted to hold investments (mainly financial affiliates). Banks are also subject to other limitations, including limitations on lending activities.
Modifications to Framework
Laws 510 of 1999, 546 of 1999, 795 of 2003 and 1328 of 2009 have substantially modified the control, regulation and surveillance powers of the Superintendency of Finance. In addition, Law 510 of 1999 and Law 1328 of 2009 streamlined the procedures and powers for FOGAFIN.
The main purpose of Law 510 of 1999 was to increase the solvency and stability of Colombia’s financial institutions by establishing rules regarding their incorporation, as well as the permitted investments of credit institutions, insurance companies and investment companies. Law 546 of 1999 was enacted in order to regulate the system of long-term home loans.
Law 795 of 2003 was enacted with the purpose of broadening the scope of activities to be performed by financial institutions and to update Colombian regulations with the latest principles of the Basel Committee at that time. Law 795 of 2003 also increased the minimum capital requirements needed to incorporate a financial institution (see “—Minimum capital requirements”) and authorized the Superintendency of Finance to take precautionary measures with respect to financial institutions whose capital falls below certain thresholds. For example, in order to avoid a temporary taking of possession by the Superintendency of Finance, troubled financial institutions must submit a restructuring program to the Superintendency of Finance.
Law 1328 of 2009 provided a new set of rights and responsibilities for customers of the financial system and a set of obligations for financial institutions, in order to minimize disputes. This law also broadened the scope of permitted business activities by regulated entities: following its adoption, banks were allowed to operate leasing businesses under certain circumstances and to extend loans to third parties so that borrowers may acquire control of other companies.
In order to implement and enforce the provisions related to Colombia’s financial system, the Superintendency of Finance has issued periodic circulars and resolutions. The External Circular 007 of 1996, as amended, consolidates all of the rules and regulations applicable to financial institutions, including rules and regulations relating to the management, operations, investments, lending activities and money laundering prevention activities of financial institutions. The Basic Accounting Circular, consolidates all of the regulations applicable to the accounting and financial rules of financial institutions. Furthermore, the Basic Accounting Circular regulates the assessment of credit institutions’ investments, risk management, financial statements, information disclosure and inter-banking credits.
Violations of Laws 510 of 1999, 546 of 1999, 795 of 2003 or 1328 of 2009, as well as of specific provisions of Decree 663 of 1993 and their relevant regulations, are subject to administrative sanctions and, in some cases, criminal sanctions.
To prepare for the implementation of the Basel III accords in Colombia, the Ministry of Finance, in consultation with the Superintendency of Finance, has initiated an internal review of regulations applicable to financial institutions. Although it is expected that the Ministry of Finance will review all such regulations, to date it has focused its review on:
|
|
·
|
the cyclical and countercyclical effects of changes in the financial environment: the Ministry of Finance has appointed a special committee to track financial developments, which is currently evaluating macroprudential instruments based on the Basel III accord, and
|
|
|
·
|
the need for further adjustments to manage liquidity risk: the Ministry of Finance is currently reviewing the links and interactions between different market agents for how this could affect the liquidity of financial institutions.
|
Key Interest Rates
Colombian commercial banks, finance corporations and financing companies are required to report data to the Colombian Central Bank on a weekly basis regarding the total volume (in pesos) of certificates of deposit issued during the prior week and the average interest rates paid for certificates of deposit with maturities of 90 days. Based on such reports, the Colombian Central Bank calculates the DTF rate, which is published at the beginning of the following week for use in calculating interest rates payable by financial institutions. The DTF rate is the weighted average interest rate paid by commercial banks, finance corporations and financing companies for certificates of deposit with maturities of 90 days. For the week of December 31, 2014, the DTF rate was 4.34%, as reported by the Superintendency of Finance.
The Colombian Central Bank also calculates the interbank rate (
Interés Bancario de Referencia
), or “IBR,” which acts as a reference of overnight and one-month interbank loans, based on quotations submitted each business day by eight participating banks to the Colombian Central Bank. Using a weighted average of the quotations submitted, the Colombian Central Bank calculates the overnight IBR each business day. The one-month IBR is calculated each Tuesday.
Article 884 of the Colombian Commercial Code provides for a limit on the amount of interest that may be charged in commercial transactions. The limit is 1.5 times the current banking interest rate (
Interés Bancario Corriente
), calculated as the average of the interest ordinarily charged by banks within a set period of time. The current banking interest rate is certified by the Superintendency of Finance.
Capital Adequacy Requirements
On August 24, 2012, the Colombian government enacted Decree 1771 of 2012 which amended certain capital adequacy requirements for Colombian credit institutions set forth in Decree 2555 of 2010. Decree 1771 of 2012 maintains the requirement for a credit institution’s technical capital to be at least 9.0% of that institution’s total risk-weighted assets.
Since August 1, 2013, technical capital has consisted of the sum of basic capital (
patrimonio básico
), or primary capital (Tier I), and secondary capital (
patrimonio adicional
), or secondary capital (Tier II); however, primary capital (Tier I) will also consist of the sum of ordinary basic capital (
patrimonio básico ordinario
), or Common Equity Tier I, and a new category of additional basic capital (
patrimonio básico adicional
), or Additional Tier I.
In addition, Decree 1771 of 2012 introduced a new measure of “core solvency” for Common Equity Tier 1, which requires higher quality capital and is set at a minimum of 4.5% of risk-weighted assets.
The items that are considered in the definition of Technical Capital as set forth in Decree 2555 of 2010, as amended are described below.
Ordinary Basic Capital
|
|
·
|
Outstanding and paid-in capital stock classified as Ordinary Basic Capital by the Superintendency of Finance subject to the conditions set forth in the regulation.
|
|
|
·
|
Legal reserves.
|
|
|
·
|
Shares held as a guarantee by FOGAFIN when the entity is in compliance with a recovery program aimed at bringing the financial entity back into compliance with capital adequacy requirements.
|
|
|
·
|
The value of paid-in stock dividends when the relevant class of stock has been classified as part of the Ordinary Basic Capital by the Superintendency of Finance.
|
|
|
·
|
Non-controlling interests, subject to the conditions set forth in the regulations.
|
|
|
·
|
Capital surplus.
|
|
|
·
|
Irrevocable donations.
|
|
|
·
|
The total value of the cumulative translation adjustment account.
|
|
|
·
|
Capital stock paid in prior to its issuance by the entity, provided however, that the stock remains unissued for a maximum term of four (4) months. After such time frame, it will no longer be considered as comprising the technical capital.
|
|
|
·
|
Subordinated bonds held by FOGAFIN when they comply with certain requirements stated in the regulations.
|
|
|
·
|
Any other financial instrument issued by the entity and held by FOGAFIN, when the subscription is intended to strengthen the financial condition of the financial entity.
|
|
|
·
|
Any other financial instrument issued by the entity and held by FOGAFIN, when the subscription is intended to strengthen the financial condition of the financial entity.
|
Deductions from Ordinary Basic Capital
|
|
·
|
Any prior or current period losses.
|
|
|
·
|
Direct and indirect investments in shares, mandatory convertible bonds, subordinated bonds that may be convertible into shares or subordinated debt instruments issued by other Colombian or foreign financial institutions (excluding subsidiaries), including cumulative translation adjustments and excluding appraisals, subject to the conditions set forth in the regulation.
|
|
|
·
|
Deferred income taxes, if positive.
|
|
|
·
|
Intangible assets registered after August 23, 2012.
|
|
|
·
|
Reacquired stock, subject to the conditions set forth in the regulations.
|
|
|
·
|
Unamortized amount of the actuarial calculation of the pension obligations of the entity.
|
Additional Basic Capital
|
|
·
|
Outstanding and paid-in capital stock classified as Additional Basic Capital by the Superintendency of Finance subject to the conditions set forth in the regulation.
|
|
|
·
|
The value of paid-in stock dividends when the relevant class of stock has been classified as part of the Additional Basic Capital by the Superintendency of Finance.
|
|
|
·
|
Non-controlling interests, subject to the conditions set forth in the regulation.
|
Additional Capital
|
|
·
|
Fifty percent (50%) of the reappraisal or unrealized profits derived from investments in equity and debt instruments with high or medium trading volumes, subject to conditions set forth in the regulation.
|
|
|
·
|
Mandatory convertible bonds effectively subscribed and paid, subject to the conditions set forth in the regulation.
|
|
|
·
|
Subordinated payment obligations that the Superintendency of Finance classifies as part of the Additional Capital.
|
|
|
·
|
Current period profits, in the amount that the shareholders irrevocably resolve to capitalize or assign to increase the legal reserves once the fiscal year is ended, subject to approval by the Superintendency of Finance.
|
|
|
·
|
Voluntary reserves (
reservas ocasionales
), up to an amount no greater than ten percent (10%) of the technical capital of the entity.
|
|
|
·
|
Non-controlling interests, subject to the conditions set forth in the regulation.
|
|
|
·
|
Fifty percent (50%) of the tax reserve, as defined by law.
|
|
|
·
|
Thirty percent (30%) of the reappraisal or unrealized profits derived from investments in equity instruments with low or non-existing trading volumes, or not listed in trading platforms, subject to an appraisal by an independent expert, according to the regulations expected to be issued by the Superintendency of Finance, and to conditions set forth in the regulation.
|
|
|
·
|
The value of the general provisions made by the financial entity, in an amount no greater than 1.25% of the risk-weighted assets.
|
Banco de Bogotá
The following tables set forth our reported consolidated capital adequacy information at December 31, 2014 and 2013 as calculated under the Current Definition of Technical Capital.
|
At December 31,
|
||||||||
|
2014
|
2013
|
|||||||
|
(in Ps billions)
|
||||||||
|
Subscribed capital
|
3 | 3 | ||||||
|
Reserves and profits
|
9,226 | 7,154 | ||||||
|
Non-controlling interests
|
938 | 787 | ||||||
|
Unconsolidated financial sector investments
|
(56 | ) | (60 | ) | ||||
|
Less/more others
|
||||||||
|
Goodwill
|
(1,810 | ) | (1,492 | ) | ||||
|
Unamortized pension liabilities
|
(13 | ) | (14 | ) | ||||
|
Others
|
(169 | ) | – | |||||
|
Primary capital (Tier I)
|
8,119 | 6,376 | ||||||
|
Reserves and profits
|
697 | 684 | ||||||
|
Non-controlling interests
|
993 | 951 | ||||||
|
Unrealized gains/losses on securities available for sale(1)
|
(94 | ) | (94 | ) | ||||
|
Valuations
|
90 | 0 | ||||||
|
Subordinated bonds
|
1,845 | 1,588 | ||||||
|
Less
:
|
||||||||
|
Devaluations
|
0 | – | ||||||
|
Less/more others
|
16 | 11 | ||||||
|
Computed secondary capital (Tier II)
|
3,549 | 3,140 | ||||||
|
Technical capital
|
11,668 | 9,516 | ||||||
|
Risk-weighted assets
|
92,347 | 76,081 | ||||||
|
Value at risk
|
812 | 796 | ||||||
|
Regulatory value at risk(2)
|
9,028 | 8,839 | ||||||
|
Risk-weighted assets including regulatory value at risk
|
101,374 | 84,921 | ||||||
|
Primary capital (Tier I) to risk-weighted assets including regulatory value at risk
|
8.0 | % | 7.5 | % | ||||
|
Secondary capital (Tier II) to risk-weighted assets including regulatory value at risk
|
3.5 | % | 3.7 | % | ||||
|
Solvency ratio(3)
|
11.5 | % | 11.2 | % | ||||
|
(1)
|
Unrealized gains/losses on securities available for sale do not flow through the statement of income until such securities are disposed of and the gain or loss is realized.
|
|
(2)
|
Regulatory value at risk consists of value at risk multiplied by (100/9) as required by the Superintendency of Finance. See “—Capital adequacy requirements.”
|
|
(3)
|
Solvency ratio is calculated as technical capital to risk-weighted assets including regulatory value at risk.
|
The increase in technical capital for Banco de Bogotá is mainly driven by the Ps 1,500.0 billion Common Share Rights Offering that took place during the last quarter of 2014.
Banco de Occidente
|
At December 31,
|
||||||||
|
2014
|
2013
|
|||||||
|
(in Ps billions)
|
||||||||
|
Subscribed capital
|
5 | 5 | ||||||
|
Reserves and profits
|
2,435 | 2,228 | ||||||
|
Non-controlling interests
|
7 | 7 | ||||||
|
Unconsolidated financial sector investments
|
(4 | ) | (3 | ) | ||||
|
Less/more others
|
||||||||
|
Goodwill
|
– | – | ||||||
|
Unamortized pension liabilities
|
– | – | ||||||
|
Others
|
– | – | ||||||
|
Primary capital (Tier I)
|
2,443 | 2,236 | ||||||
|
Reserves and profits
|
373 | 148 | ||||||
|
Non-controlling interests
|
3 | 1 | ||||||
|
Unrealized gains/losses on securities available for sale(1)
|
(19 | ) | 347 | |||||
|
Valuations
|
39 | 26 | ||||||
|
Subordinated bonds
|
400 | 416 | ||||||
|
Less:
|
||||||||
|
Devaluations
|
(0 | ) | – | |||||
|
Less/more others
|
1 | 0 | ||||||
|
Computed secondary capital (Tier II)
|
798 | 938 | ||||||
|
Technical capital
|
3,241 | 3,174 | ||||||
|
Risk-weighted assets
|
24,852 | 23,349 | ||||||
|
Value at risk
|
245 | 114 | ||||||
|
Regulatory value at risk(2)
|
2,718 | 1,269 | ||||||
|
Risk-weighted assets including regulatory value at risk
|
27,570 | 24,618 | ||||||
|
Primary capital (Tier I) to risk-weighted assets including regulatory value at risk
|
8.9 | % | 9.1 | % | ||||
|
Secondary capital (Tier II) to risk-weighted assets including regulatory value at risk
|
2.9 | % | 3.8 | % | ||||
|
Solvency ratio(3)
|
11.8 | % | 12.9 | % | ||||
|
(1)
|
Unrealized gains/losses on securities available for sale do not flow through the statement of income until such securities are disposed of and the gain or loss is realized.
|
|
(2)
|
Regulatory value at risk consists of value at risk multiplied by (100/9) as required by the Superintendency of Finance. See “—Capital adequacy requirements.”
|
|
(3)
|
Solvency ratio is calculated as technical capital to risk-weighted assets including regulatory value at risk.
|
The decrease in Banco de Occidente’s solvency ratio is mainly driven by an increase in the regulatory value at risk and a decrease in Tier II capital due to a lower value of unrealized gains on securities available for sale.
Banco Popular
|
At December 31,
|
||||||||
|
2014
|
2013
|
|||||||
|
(in Ps billions)
|
||||||||
|
Subscribed capital
|
77 | 77 | ||||||
|
Reserves and profits
|
1,586 | 1,393 | ||||||
|
Non-controlling interests
|
13 | 12 | ||||||
|
Unconsolidated financial sector investments
|
(1 | ) | (2 | ) | ||||
|
At December 31,
|
||||||||
|
2014
|
2013
|
|||||||
|
(in Ps billions)
|
||||||||
|
Less/more others
|
||||||||
|
Goodwill
|
– | – | ||||||
|
Unamortized pension liabilities
|
(42 | ) | (44 | ) | ||||
|
Others
|
(8 | ) | (16 | ) | ||||
|
Primary capital (Tier I)
|
1,625 | 1,420 | ||||||
|
Reserves and profits
|
93 | 6 | ||||||
|
Non-controlling interests
|
1 | 0 | ||||||
|
Unrealized gains/losses on securities available for sale(1)
|
130 | 139 | ||||||
|
Valuations
|
3 | 2 | ||||||
|
Subordinated bonds
|
21 | 43 | ||||||
|
Less
:
|
||||||||
|
Devaluations
|
(0 | ) | – | |||||
|
Less/more others
|
1 | 1 | ||||||
|
Computed secondary capital (Tier II)
|
249 | 191 | ||||||
|
Technical capital
|
1,873 | 1,611 | ||||||
|
Risk-weighted assets
|
13,935 | 12,986 | ||||||
|
Value at risk
|
133 | 176 | ||||||
|
Regulatory value at risk(2)
|
1,481 | 1,959 | ||||||
|
Risk-weighted assets including regulatory value at risk
|
15,416 | 14,945 | ||||||
|
Primary capital (Tier I) to risk-weighted assets including regulatory value at risk
|
10.5 | % | 9.5 | % | ||||
|
Secondary capital (Tier II) to risk-weighted assets including regulatory value at risk
|
1.6 | % | 1.3 | % | ||||
|
Solvency ratio(3)
|
12.2 | % | 10.8 | % | ||||
|
(1)
|
Unrealized gains/losses on securities available for sale do not flow through the statement of income until such securities are disposed of and the gain or loss is realized.
|
|
(2)
|
Regulatory value at risk consists of value at risk multiplied by (100/9) as required by the Superintendency of Finance. See “—Capital adequacy requirements.”
|
|
(3)
|
Solvency ratio is calculated as technical capital to risk-weighted assets including regulatory value at risk.
|
Banco AV Villas
|
At December 31,
|
||||||||
|
2014
|
2013
|
|||||||
|
(in Ps billions)
|
||||||||
|
Subscribed capital
|
22 | 22 | ||||||
|
Reserves and profits
|
877 | 765 | ||||||
|
Non-controlling interests
|
– | 4 | ||||||
|
Unconsolidated financial sector investments
|
(17 | ) | (11 | ) | ||||
|
Less/more others
|
||||||||
|
Goodwill
|
– | – | ||||||
|
Unamortized pension liabilities
|
– | 0 | ||||||
|
Others
|
(6 | ) | (7 | ) | ||||
|
Primary capital (Tier I)
|
877 | 774 | ||||||
|
Reserves and profits
|
81 | 81 | ||||||
|
Non-controlling interests
|
– | – | ||||||
|
Unrealized gains/losses on securities available for sale(1)
|
(17 | ) | (10 | ) | ||||
|
Valuations
|
0 | 0 | ||||||
|
Subordinated bonds
|
– | – | ||||||
|
At December 31,
|
||||||||
|
2014
|
2013
|
|||||||
|
(in Ps billions)
|
||||||||
|
Less
:
|
||||||||
|
Devaluations
|
– | – | ||||||
|
Less/more others
|
13 | 10 | ||||||
|
Computed secondary capital (Tier II)
|
77 | 81 | ||||||
|
Technical capital
|
955 | 855 | ||||||
|
Risk-weighted assets
|
6,819 | 6,390 | ||||||
|
Value at risk
|
68 | 77 | ||||||
|
Regulatory value at risk(2)
|
758 | 859 | ||||||
|
Risk-weighted assets including regulatory value at risk
|
7,577 | 7,249 | ||||||
|
Primary capital (Tier I) to risk-weighted assets including regulatory value at risk
|
11.6 | % | 10.7 | % | ||||
|
Secondary capital (Tier II) to risk-weighted assets including regulatory value at risk
|
1.0 | % | 1.1 | % | ||||
|
Solvency ratio(3)
|
12.6 | % | 11.8 | % | ||||
|
(1)
|
Unrealized gains/losses on securities available for sale do not flow through the statement of income until such securities are disposed of and the gain or loss is realized.
|
|
(2)
|
Regulatory value at risk consists of value at risk multiplied by (100/9) as required by the Superintendency of Finance. See “—Capital adequacy requirements.”
|
|
(3)
|
Solvency ratio is calculated as technical capital to risk-weighted assets including regulatory value at risk.
|
Grupo Aval Aggregate
The following table sets forth aggregate capital adequacy information for Grupo Aval at December 31, 2014 and 2013.
|
At December 31,
|
||||||||
|
2014
|
2013
|
|||||||
|
(in Ps billions)
|
||||||||
|
Subscribed capital
|
107 | 107 | ||||||
|
Reserves and profits
|
14,125 | 11,541 | ||||||
|
Non-controlling interests
|
959 | 809 | ||||||
|
Unconsolidated financial sector investments
|
(78 | ) | (76 | ) | ||||
|
Less/more others
|
||||||||
|
Goodwill
|
(1,810 | ) | (1,492 | ) | ||||
|
Unamortized pension liabilities
|
(55 | ) | (59 | ) | ||||
|
Others
|
(183 | ) | (23 | ) | ||||
|
Primary capital (Tier I)
|
13,065 | 10,807 | ||||||
|
Reserves and profits
|
1,244 | 919 | ||||||
|
Non-controlling interests
|
997 | 953 | ||||||
|
Unrealized gains/losses on securities available for sale(1)
|
1 | 383 | ||||||
|
Valuations
|
133 | 28 | ||||||
|
Subordinated bonds
|
2,266 | 2,046 | ||||||
|
Less:
|
||||||||
|
Devaluations
|
(0 | ) | – | |||||
|
Less/more others
|
32 | 21 | ||||||
|
Computed secondary capital (Tier II)
|
4,673 | 4,350 | ||||||
|
Technical capital
|
17,738 | 15,157 | ||||||
|
Risk-weighted assets
|
137,952 | 118,806 | ||||||
|
Value at risk
|
1,259 | 1,163 | ||||||
|
Regulatory value at risk(2)
|
13,985 | 12,927 | ||||||
|
Risk-weighted assets including regulatory value at risk
|
151,938 | 131,733 | ||||||
|
Primary capital (Tier I) to risk-weighted assets including regulatory value at risk
|
8.6 | % | 8.2 | % | ||||
|
Secondary capital (Tier II) to risk-weighted assets including regulatory value at risk
|
3.1 | % | 3.3 | % | ||||
|
Solvency ratio(3)
|
11.7 | % | 11.5 | % | ||||
|
(1)
|
Unrealized gains/losses on securities available for sale do not flow through the statement of income until such securities are disposed of and the gain or loss is realized.
|
|
(2)
|
Regulatory value at risk consists of value at risk multiplied by (100/9) as required by the Superintendency of Finance. See “—Capital adequacy requirements.”
|
|
(3)
|
Solvency ratio is calculated as technical capital to risk-weighted assets including regulatory value at risk.
|
At December 31, 2014, our banks’ technical capital ratios were 11.5% (Banco de Bogotá), 11.8% (Banco de Occidente), 12.2% (Banco Popular) and 12.6% (Banco AV Villas) exceeding on average the requirement of the Colombian government and the Superintendency of Finance by 300 basis points.
The basic accounting circular contains provisions relating to liquidity risk, interest rate risk, foreign exchange rate risk and market risk. Colombian banks are required to calculate a value at risk, or “VaR,” based on a methodology provided by the Superintendency of Finance. VaR is used in assessing a banks’ solvency. Future
changes in VaR requirements could have a material impact on our operations in the future. See “Item 5. Operating and financial review and prospects—B. Liquidity and capital resources—Liquidity Risk.”
Grupo Aval’s combined loan portfolio, net of provisions, accounted for 79.3% of our risk-weighted assets at December 31, 2014. The provisions corresponding to each of our banks’ operations is determined by measuring credit risk. For this purpose, credit extensions are rated according to their risk level (A, B, C, D or E); the Superintendency of Finance has established minimum provision levels for each rating.
Mandatory Investments
Colombian banking institutions are required to invest in agricultural development bonds (
Títulos de Desarrollo Agropecuario
, or “TDAs”) issued by Finagro, a government entity, according to External Resolution 3 of 2000 of the Colombian Central Bank, as amended by External Resolution 6 of 2008 and External Resolution 15 of 2012. The Colombian Central Bank requires that each bank maintains a total investment in these bonds equal to 5.8% of its checking and savings deposits, plus 4.4% of its time deposits with a maturity of up to 18 months. Finagro may issue two different types of agricultural development bonds, Class A with an interest rate of four percentage points below the DTF rate (DTF-4) and Class B with an interest rate of two percentage points below the DTF rate (DTF-2). If the DTF interest rate falls to 4% or less, the profitability of the Class A TDAs will be 0%, and if the DTF rate falls to 2% or less, the profitability of the Class B TDAs will be 0%. Banks are required to invest 37% of the total mandatory investment in Class A TDAs and 63% in Class B TDAs.
Until 2006, banking institutions were required to invest in debt reduction bonds (
Títulos de Reducción de Deuda
), issued by the Colombian government. These bonds are no longer a mandatory investment but are still outstanding in the portfolios of bank institutions until maturity.
Under government discretion, authorities may extend the scope of current regulations or require additional disbursements on current or new types of mandatory investments.
Minimum Capital Requirements
Article 80 of Decree 663 of 1993, as amended by Law 795 of 2003, establishes minimum incorporation capital requirements for different financial institutions. When a financial institution fails to comply with the minimum required capital after a cure period granted by law, the Superintendency of Finance may intervene, causing the financial institution to be liquidated, merged with another institution or its corporate form may be converted into another category of financial institution, notwithstanding the fact that the institution may be subject to fines imposed by the Superintendency of Finance.
The minimum incorporation capital requirement for banks on an unconsolidated basis for 2012 was Ps 73.7 billion. Through the date hereof, all of our banks have consistently satisfied this incorporation capital requirement.
Capital Investment Limit
All investments in subsidiaries and other authorized capital investments, other than those carried out in order to fulfill legal provisions, may not exceed 100% of the total aggregate of the capital, equity reserves and the equity reappraisal account of the respective bank, financial corporation or financing company, excluding unadjusted fixed assets and including deductions for accumulated losses.
Foreign Currency Position Requirements
According to External Resolution 4 of 2007 issued by the Board of Directors of the Colombian Central Bank, as amended by External Resolution 12 of 2007, External Resolutions 3 and 13 of 2008, 1 and 7 of 2009 and 3 of 2011, a financial institution’s foreign currency position is the difference between such institution’s foreign currency-denominated assets and liabilities (including any off-balance sheet items), realized or contingent, including those that may be sold in Colombian legal currency.
Resolution 4 of 2007 (as amended by Resolution 3 of 2008) of the Board of Directors of the Colombian Central Bank provides mandatory guidelines for foreign currency positions of financial institutions, including the following:
|
|
·
|
the average of a bank’s foreign currency position for three business days cannot exceed the equivalent in foreign currency of 20.0% of the bank’s technical capital. Currency exchange intermediaries such as Banco de Bogotá are permitted to hold a three business days’ average negative foreign currency position not exceeding the equivalent in foreign currency of 5.0% of its technical capital (with penalties being payable after the first business day). At December 31, 2014, Banco de Bogotá, Banco de Occidente, Banco Popular and Banco AV Villas had unconsolidated foreign currency positions of U.S.$(34.4) million, U.S.$4.2 million, U.S.$1.2 million and U.S.$3.0 million, respectively, which fell within these regulatory guidelines;
|
|
|
·
|
foreign currency position in cash is defined as the difference between all foreign currency-denominated assets and liabilities. A bank’s three business days’ average foreign currency position in cash cannot exceed 50.0% of the bank’s technical capital. In accordance with Resolution 4 of 2007 (as amended by Resolution 3 of 2008) of the Board of Directors of the Colombian Central Bank, the three-day average shall be calculated on a daily basis and the foreign currency position in cash cannot be negative. At December 31, 2014, Banco de Bogotá, Banco de Occidente, Banco Popular and Banco AV Villas had unconsolidated foreign currency positions in cash of U.S.$88.0 million, U.S.$2.1 million, U.S.$2.1 million and U.S.$0.2 million, respectively, which fell within these regulatory guidelines; and
|
|
|
·
|
gross position of leverage, defined as (1) the value of term contracts denominated in foreign currency, plus (2) the value of transactions denominated in foreign currency to be settled in cash within one or more days, and (3) the value of the exchange rate risk exposure associated with exchange rate options and derivatives. Resolution 4 of 2007 (as amended by Resolution 3 of 2011) of the Board of Directors of the Colombian Central Bank establishes that the average of a bank’s gross position of leverage for three business days cannot exceed 550.0% of the technical capital of such bank. In calculating the gross position of leverage, Resolution 3 of 2011 of the Board of Directors of the Colombian Central Bank excludes any foreign exchange transactions that intermediaries of the FX Market perform as local suppliers of liquidity of foreign currency using the Systems of Compensation and Liquidation of Currencies when there is a breach of payment by a participant. At December 31, 2014, Banco de Bogotá, Banco de Occidente, Banco Popular and Banco AV Villas had an unconsolidated gross position of leverage of U.S.$7,119.7 million, U.S.$2,469.6 million, U.S.$1.0 million and U.S.$0.0 million, respectively, which fell within these regulatory guidelines.
|
Lending Limits
Pursuant to applicable Colombian regulation, commercial banks cannot lend to a single person, directly or indirectly, a sum greater than 10% of their Tier 1 Capital (
Patrimonio Técnico
) if the only security for such operation is the borrower’s equity. Nevertheless, commercial banks can lend to a single person an amount equivalent to 25% of their Tier 1 Capital (
Patrimonio Técnico
), as long as such loan is secured by eligible collateral and sufficient to secure a risk exceeding 5% of such equity.
Notwithstanding the general rule set above regarding the lending limit of 10%, Decree 816 of 2014 was issued to promote the financing of fourth generation road concessions (
concesiones de cuarta generación
), and establishes that commercial banks can lend to a single borrower who is pursuing a fourth generation concession, a sum up to 25% of our Tier 1 Capital (
Patrimonio Técnico
).
Fourth generation concessions is a governmental program issued under the current administration of President Santos, through which the government plans to execute the construction of road infrastructure projects in association with private entities.
At December 31, 2014, pursuant to Decree 2555 of 2010, our banks were subject to the following lending limits for unsecured and secured loans: Banco de Bogotá’s lending limit per borrower on an unconsolidated basis was Ps 1,214.7 billion for unsecured loans and Ps 3,036.8 billion for secured loans. Banco de Occidente’s lending limit per borrower on an unconsolidated basis was Ps 325.6 billion for unsecured loans and Ps 814.1 billion for secured loans. Banco AV Villas’ lending limit per borrower on an unconsolidated basis was Ps 95.6 billion for unsecured loans and Ps 238.9 billion for secured loans. Banco Popular’s lending limit per borrower on an unconsolidated basis was Ps 187.8 billion for unsecured loans and Ps 469.4 billion for secured loans.
Reserve Requirements
Commercial banks are required by the Board of Directors of the Colombian Central Bank to satisfy reserve requirements with respect to deposits and other cash demands. These reserves are held by the Colombian Central Bank in the form of cash deposits. According to Resolution 11 of 2008, the reserve requirements for Colombian banks are measured bi-weekly and the amounts depend on the class of deposits.
The reserves of credit institutions range between zero and 11.0%. For example, credit institutions must maintain reserves of 11.0% for checking accounts and savings deposits, reserves of 4.5% for term deposits with a maturity of less than 540 days, and no reserves for term deposits with a maturity of more than 540 days.
Credit institutions may maintain these reserves in their accounts at the Colombian Central Bank.
Foreign Currency Loans
Colombian residents may only obtain foreign currency loans from foreign entities or, in certain cases, foreign individuals that obtain a code from the Colombian Central Bank. Such code may be requested from the foreign exchange intermediary by the resident that wishes to obtain a loan from foreign entities or foreign individuals. Foreign currency loans must be either channeled through foreign exchange intermediaries (such as Colombian financial institutions) or deposited in offshore compensation accounts (i.e., specially designated accounts at foreign banks held by Colombian residents and registered before the Colombian Central Bank).
Under regulations issued by the Colombian Central Bank, every Colombian resident and institution borrowing funds in foreign currency is generally required to post with the Colombian Central Bank non-interest—bearing deposits for a specified term; however the percentage of the required deposit is currently zero. No such deposits would be required for foreign currency loans aimed at financing Colombian investments abroad or for short-term exportation loans (provided the loan is disbursed against the funds of Banco de Comercio Exterior—Bancoldex).
In addition, pursuant to Law 9 of 1991, the Board of Directors of the Colombian Central Bank is entitled to impose conditions and limitations on the incurrence of foreign currency indebtedness in order to avoid pressure in the foreign exchange market.
Law 1607 has established that loans obtained abroad by banks incorporated under the laws of Colombia are not considered national source income for income tax purposes.
Restrictions on Foreign Investment in Colombia
Colombia’s foreign investment statute regulates the manner in which non-residents are permitted to invest in Colombia and participate in the Colombian securities market. Among other requirements, Colombian law requires foreign investors to register certain foreign exchange transactions with the Colombian Central Bank and obtain authorization for certain types of investments. Certain foreign exchange transactions, including those between residents and non-residents, must be made through authorized foreign exchange intermediaries.
Non-residents are permitted to hold portfolio investments in Colombia, through either a registered stock brokerage firm, a trust company or an investment firm. Investors would only be allowed to transfer dividends abroad after the foreign investment registration procedure with the Colombian Central Bank has been completed. The failure of a non-resident investor to report or register foreign exchange transactions with the Colombian Central Bank relating to investments in Colombia on a timely basis may prevent the investor from remitting dividends, or an investigation that may result in a fine, may be commenced.
Allowance For Loan Losses
The Superintendency of Finance has issued guidelines relating to allowances for loan losses in the Basic Accounting Circular, as amended, which refer to the adoption of the SARC, by credit institutions.
As previously mentioned, the SARC system adopted by each credit institution must contain policies and procedures defining the manner in which the institution assesses, evaluates, classifies, grades, controls and covers credit risk. Management must adopt policies and procedures to ensure adequate risk management in connection with the establishment of allowances and of lending and continuous monitoring standards.
Under the current model of allowances for loan losses, loans must be classified and graded in five different categories, from “A” to “E” as established by the Superintendency of Finance. Loans classified in category “A” are considered “normal” or “ordinary,” with a regular credit risk. Loans classified in category “B” are those considered to have an acceptable risk. In category “C,” institutions must include loans with an appreciable risk, while in category “D,” loans with a significant or material credit risk. Finally, loans that are not able to be recovered, or that have a reduced chance of being recovered, must be classified in category “E.” Each bank must follow this system.
The Superintendency of Finance’s guidelines specify the criteria for classifying loans, including type of loan (i.e., commercial, consumer, mortgage or microcredit loans), age of loan, term of default and variation of the credit risk of the debtor (by determining repayment capability and payment record). Credit institutions are also required to apply specific allowances to particular categories of loans, which are calculated as a percentage of the outstanding balance.
For mortgage loans and microcredit loans a general allowance for loan losses of 1% of the principal amount must be established for each mortgage and microcredit loan.
In addition to the general allowance, individual allowances for loan losses must be established.
The following table presents the minimum individual allowance for mortgage loan losses, as established by the Superintendency of Finance.
|
Credit category
|
Percentage of allowance over the guaranteed portion of the loan
|
Percentage of allowance over the non-guaranteed portion of the loan
|
||||||
|
A
|
1.0 | 1.0 | ||||||
|
B
|
3.2 | 100.0 | ||||||
|
C
|
10.0 | 100.0 | ||||||
|
D
|
20.0 | 100.0 | ||||||
|
E
|
30.0 | 100.0 | ||||||
The following table presents the minimum individual allowance for microcredit loan losses.
|
Credit grade
|
Minimum Allowance Percentage(1)
|
Minimum Allowance Percentage(2)
|
||||||
|
A
|
0.0 | 1.0 | ||||||
|
B
|
1.0 | 2.2 | ||||||
|
C
|
20.0 | 0.0 | ||||||
|
D
|
50.0 | 0.0 | ||||||
|
E
|
100.0 | 0.0 | ||||||
|
(1)
|
Allowance percentage that will be applied over the balance due on the loan, after discounting the value of acceptable guarantees, taking into account the rules provided in Annex 1 of Chapter II of Basic Accounting Circular.
|
|
(2)
|
Allowance percentage that will be applied over the balance due on the loan, without discounting the value of acceptable guarantees.
|
In any case, the minimum individual allowance for credit losses corresponds to the sum of:
1. The allowance percentage applicable to the balance due, net of the value of acceptable guarantees; and
2. The allowance percentage applicable to the entire balance due on the loan. See note 2(i) to our audited annual consolidated financial statements.
In the case of consumer and commercial loans, Annex 3 to Chapter II of the Basic Accounting Circular (as amended by External Circular No. 22 of 2008) issued by the Superintendency of Finance, establishes that financial
institutions which provide consumer and commercial loans may prepare internal lending models which classify and qualify all consumer and commercial loans granted by said entity, in order to constitute non-performing loan allowances (that includes countercyclical parameters) reflecting the classification and qualification set in the model.
Under this regulation, each financial institution may submit its own internal models for the review (and non-objection opinion) of the Superintendency of Finance. However, if an entity does not submit such internal models or if they are objected to by the Superintendency of Finance, the reference models contained in the Basic Accounting Circular must be applied to their lending activities.
Title II, Book I of Part II of Decree 2555 of 2010, provides that a financial institution may not lend, individually or in the aggregate, to a single borrower an amount in excess of 10% of such institution’s technical capital, or 25% if amounts above 5% are secured by collateral in accordance with the financial institution’s guidelines.
Pursuant to Title VI, Book 36 of Part II of Decree 2555 of 2010, a bank may not make a loan to any shareholder that holds directly more than 10% of its share capital for one year after such shareholder reaches the 10% threshold. In no event may a loan to a shareholder holding, directly or indirectly, 20% or more of a bank’s share capital exceed 20% of a bank’s technical capital. In addition, no loan to a single financial institution may exceed 30% of a bank’s technical capital, with the exception of loans funded by Colombian development banks for which no limit exists.
If a financial institution exceeds these limits, the Superintendency of Finance may impose a fine equal to up to twice the amount by which any such loan exceeded the limit and, in some cases, there may be criminal sanctions.
No concentration limits apply to Grupo Aval on a consolidated basis.
Decree 2555 of 2010 sets a maximum limit for risk concentrated in one single party, equivalent to 30% of a bank’s technical capital, the calculation of which includes loans, leasing operations and equity and debt investments.
The Colombian Central Bank also has the authority to establish maximum limits on the interest rates that commercial banks and other financial institutions may charge on loans.
Public Tender Offer Rules
Pursuant to Colombian law, the acquisition of the beneficial ownership of 25.0% or more of the outstanding shares with voting rights of a listed company, or the purchase of 5.0% or more of the outstanding shares with voting rights by a shareholder or group shareholders beneficially owning 25.0% or more of such outstanding shares of a listed company, should be made pursuant to the public tender offer rules. The preferred shares offered hereby are not shares with voting rights for purposes of this requirement.
Under Article 6.15.2.1.1 of Decree 2555 of 2010, any entity or group of entities ultimately representing the same beneficial owner, directly or through one or more intermediaries, may only become the beneficial owner of more than 25.0% of the outstanding shares with voting rights of a company that is publicly traded in Colombia by making a tender offer directed at all holders of such shares of that company, following the procedures established by the Superintendency of Finance.
Moreover, any beneficial owner of more than 25.0% of the outstanding shares with voting rights of a company who wants to acquire additional shares of the company representing more than 5.0% of the company’s outstanding shares with voting rights may only do so by making a tender offer directed at all holders of such company’s shares, following the procedures established by the Colombian government.
These requirements do not need to be met in certain circumstances described in Article 6.15.2.1.2 of Decree 2555 of 2010, including: (1) if the purchase is approved by 100% of the holders of the outstanding shares of the company, (2) if the purchaser acquires the percentages indicated above through an offer in a privatization process, (3) if the company reacquires its own shares or (4) if the company issues voting shares.
Sales of Publicly Traded Stock
Any transaction involving the sale of publicly traded stock of any Colombian company, including any sale of our preferred shares for the peso equivalent of 66,000 UVRs (approximately U.S.$5,932) or more must be effected
through the Colombian Stock Exchange. At December 31, 2014, one UVR equaled Ps 215.03 and 66,000 UVRs equal Ps 14,192,198.
Intervention Powers of the Superintendency of Finance – Bankruptcy Considerations
Pursuant to Colombian banking regulations, the Superintendency of Finance has the power to intervene in the operations of a bank in order to prevent it from, or to control and reduce the effects of, a bank failure.
The Superintendency of Finance may intervene in a bank’s business (1) prior to the liquidation of the bank, by taking precautionary measures in order to prevent the bank from being taken over by the Superintendency of Finance, or (2) to take possession of the bank to either administer the bank or order its liquidation, depending on the severity of the situation.
The purpose of taking possession is to allow the Superintendency of Finance to decide (1) whether the entity should be liquidated, (2) whether it is possible to place it in a position to continue doing business in the ordinary course, or (3) whether other measures may be adopted to secure better conditions so that depositors, creditors and investors may obtain the full or partial payment of their credits.
If the Superintendency of Finance takes possession of a bank, FOGAFIN must appoint a special agent (who must be accepted by the Superintendency of Finance) to administer the affairs of the bank during such process and until the bank is ordered to be liquidated or the entity is reestablished to continue doing business in the ordinary course.
During the period of the Superintendency of Finance’s possession (which period ends when the liquidation process begins), Colombian banking laws prevent any creditor of the bank from (1) initiating any procedure for the collection of any amount owed by the bank, (2) enforcing any judicial decision rendered against the bank to secure payment of any of its obligations, (3) placing a lien or attachment on any of the assets of the bank to secure payment of any of its obligations, or (4) making any payment, advance or compensation or assuming any obligation on behalf of the bank, with the funds or assets that may belong to it and are held by third parties, except for payments that are made by way of set-off between regulated entities of the Colombian financial and insurance systems.
In the event that the bank is liquidated, the Superintendency of Finance must, among other measures, provide that all term obligations of the bank are due and payable at the date when the order to liquidate becomes effective.
During the liquidation process bank deposits and other types of saving instruments will be excluded from the liquidation process and, claims of creditors, as a general rule, rank as follows: (i) the first class of credits includes the court expenses incurred in the interest of all creditors, wages and other obligations related with employment contracts and tax authorities’ credits regarding national and local taxes; (ii) the second class of credits comprises the credits secured by a security interest on movable assets; (iii) the third class of credits includes the credits secured by real estate collateral, such as mortgages; (iv) the fourth class of credits contains some other credits of the tax authorities against the debtor that are not included in the first class of credits and credits of suppliers of raw materials and input to the debtor; and (v) finally, the fifth class of credits includes all other credits without any priority or privilege; provided however, that among credits of the fifth class, subordinated credits shall be ranked junior to the external liabilities (
pasivos externos
) senior only to capital stock. Each category of creditors will collect in the order indicated above, whereby distributions in one category will be subject to completing full distribution in the prior category.
Troubled Financial Institutions – Deposit Insurance
Subject to specific limitations, FOGAFIN is authorized to provide equity and/or secured loans to troubled financial institutions and to insure deposits of commercial banks and certain other financial institutions. In 1998 and 1999, to address the adverse effects of the economic crisis, certain regulations were adopted, among others, Law 546 of 1999 (
Ley de Vivienda
) and Law 550 of 1999 (
Ley de Reactivación Económica
).
To protect the customers of commercial banks and certain financial institutions, Resolution No. 1 of 1988 of FOGAFIN, as amended by Resolutions 1, 3 and 4 of 2012, requires mandatory deposit insurance. Under this resolution, banks must pay an annual premium of 0.3% of total funds received on savings accounts, checking accounts, certificates of deposit, special savings deposits, mortgage bonds, special accounts, bank collection services
and electronic deposits. If a bank is liquidated, the deposit insurance will cover the funds deposited by an individual or corporation with such bank, up to a maximum of Ps 20 million, regardless of the number of accounts held.
Anti-Money Laundering Provisions
The regulatory framework to prevent and control money laundering is contained in, among others, the EOSF Chapter 11 of Title I of External Circular 007 of 1996, as amended, issued by the Superintendency of Finance, as well as Law 599 of 2000 (the Colombian Criminal Code).
Colombian laws adopt the latest guidelines related to anti-money laundering and other terrorist activities established by the Financial Action Task Force on Money Laundering, or “FATF.” Colombia, as a member of the GAFI-SUD (a FATF-style regional body) follows all of FATF’s 40 recommendations and eight special recommendations.
Anti-money laundering provisions have been complemented with provisions aimed at deterring terrorism financing. For that purpose, by means of Circular 26 of 2008, the Superintendency of Finance has issued regulations requiring the implementation by financial institutions of a system of controls for money laundering and terrorism financing.
The requirements include “know your customer” rules and procedures to protect financial institutions from being used directly by shareholders and executives in money laundering activities, for channeling funds for terrorist activities, or for the concealment of assets from such activities; these rules and procedures set forth detailed instructions for monitoring these risks.
Chapter 13 of Title I of External Circular 007 of 1996, as amended, issued by the Superintendency of Finance and applicable to issuers of securities in the capital markets, provides rules and guidelines regarding the prevention of money laundering and terrorism financing.
Finally, the Colombian Criminal Code introduced criminal rules and regulations to prevent, control, detect, eliminate and prosecute all matters related to financing terrorism and money laundering. The criminal rules and regulations cover the omission of reports on cash transactions, mobilization or storage of cash, and the lack of controls.
Pension Fund Solvency Measures
On July 19, 2012, Decree 1548 of 2012 which amends Decree 2555 of 2010, introduces a new measure of solvency for pension fund administrators, which sets technical capital (
patrimonio técnico
) at a total of 9% of exposure to operational risk. “Exposure to operational risk” is defined as the product of multiplying 100/9 by the sum of:
|
|
·
|
16% of fee income from mandatory pension funds;
|
|
|
·
|
16% of fee income from severance funds;
|
|
|
·
|
0% of fee income from voluntary pension funds; and
|
|
|
·
|
1/48 of all other funds managed by pension fund administrators.
|
Furthermore, Decree 1895 of September 11, 2012 includes 13% of the fee income from the administration of funds belonging to FONPET to the sum that must be multiplied by 100/9 to determine a pension fund administrator’s “Exposure to operational risk.”
We expect the changes introduced by Decree 1548 of 2012 and Decree 1895 of 2012 to permit the release of approximately Ps 100 billion of capital of Porvenir, which pursuant to Decree 1548 of 2012 must be offset by Porvenir’s stabilization reserves (the stabilization reserve is equivalent to 1.00% of the funds it manages).
Insolvency Law
On July 12, 2012, the Colombian Congress enacted Law 1564, which provides insolvency protection for non-merchant individuals. Under the new insolvency regulation, which came into effect on October 1, 2012, once a non-merchant individual has ceased paying his or her debts, that individual can initiate a voluntary insolvency proceeding before a notary public or mediator to reach an agreement with his or her creditors. The terms of any agreement reached with two or more creditors that represent more than 50% of the total amount of the claims against such individual will be mandatorily applicable to all relevant creditors. The law also provides for increased debtor protections, including an automatic stay for a maximum of 90 days.
Prepayment of Credit Operations Without Penalty
On July 9, 2012, the Colombian Congress enacted Law 1555, allowing consumers of financial services to prepay obligations denominated in pesos owed to financial institutions, without incurring any penalty. Law 1555 also requires that financial institutions disclose the possibility of such prepayment to borrowers prior to the extension of any loan.
Law 1555 does not apply to (i) mortgage loans, for which prepayment is always allowed according to Law 546 of 1999, (ii) loans having a balance that exceeds 880 times the legal monthly minimum wages, or (iii) to financial obligations acquired prior to its effective date (July 9, 2012), (ii) and (iii) for which prepayment will continue to be governed by the relevant contractual provisions, or absent an agreement by the parties, by the laws in force at the time when the relevant agreement was executed.
Data Protection Law
On October 17, 2012, Law 1581 of 2012 introduced a new data protection regime that applies to any person that administers databases in Colombia, and this Law was regulated on June 27, 2013 by Decree 1377 of 2013 and Decree 886 of 2014. Although it does not apply in its entirety to financial institutions, it provides a set of principles (legality, freedom, truth or quality, transparency, access, confidentiality, etc.) that apply to us in the administration of our databases. Additionally, there is a general prohibition of transferring personal data to other countries that do not provide adequate levels of data protection according to the standards set by the Superintendency of Industry and Commerce. This prohibition does not apply to transfers of data that are inherent to banking and securities activities under the applicable law.
Regulation on Liens Over Movable Assets
On August 20, 2013, the Colombian Congress enacted Law 1676 with the purpose of increasing the public access to credit by providing a new regulation on liens over movable assets. Law 1676 introduced substantial modifications to Colombian regulation on liens over movable assets, including: (a) the creation of a single unified lien public registry, (b) the ability for creditors to directly foreclose on the secured assets for a value determined in an appraisal conducted by an independent expert appointed by the Superintendency of Companies, (c) the ability for creditors to enforce the security upon insolvency of the debtor, provided that the movable assets are not essential for the continuing of business of the insolvent debtor, and (d) an upgrade of priority upon liquidation.
Regulation on Payroll Loans
On April 27, 2012, the Colombian Congress enacted Law 1527, as amended by Law 1607 of 2012, which consolidated the then existing regulatory framework on payroll deduction loans. Under Law 1527, payroll loans are secured by an irrevocable order or authorization from the clients to their respective employers or to the entity that pays their salary or other financial benefits arising from their employment to directly pay the loan. As opposed to the prior regulatory regime, employers may currently freely determine the financial institution granting the relevant financial product or service. Likewise, Law 1527 provides that the employer is jointly and severally liable for the employee’s payment obligation.
2012 Tax Reform
On December 26, 2012, the Colombian Congress enacted Law 1607, introducing a series of reforms to the Colombian tax system, which came into effect in 2013. Law 1607 created a new income tax, denominated income tax for equality, or “CREE,” levied on the fiscal year’s gross revenues (excluding windfall amounts) less returns,
rebates, and discounts; certain types of income; costs; certain deductions; and income exempt under the Andean Pact. The CREE tax rate was at 9% for the years 2013, 2014 and 2015, after which, the rate will fall to 8%. The CREE tax was levied on Colombian corporations and legal entities that have the obligation to file an income tax return in Colombia, such as us and our subsidiaries, as well as on foreign entities that have the obligation to file an income tax return in Colombia. Additionally, Law 1607 reduced the general income tax rate from 33% to 25% for companies incorporated in Colombia and for the domestic source income earned by their branches and permanent establishments in Colombia.
Law 1607 also generally established tax-free treatment of corporate reorganizations providing for cash and in-kind capital contributions when they are made in exchange for shares or interests in Colombian corporations provided that they comply with the requirements set forth in the applicable regulations and that the shareholders and the company receiving the contribution state their intention that no tax be levied on the transaction on the terms and conditions set forth in Law 1607 in the relevant contribution documentation. Law 1607 also established tax rules for the transfer of assets located in Colombia, as a result of a merger or a spin-off process involving foreign entities, providing that this type of transaction is considered a disposition for tax purposes, subject to income tax or to capital gains tax, as the case may be. However, this rule may not apply when the value of the assets located in Colombia does not represent more than 20% of the total value of the assets held by the group to which the foreign entities belong, in accordance with the consolidated financial statements of the parent company.
Law 1607 further established rules concerning the tax basis of assets and capital stock and amended prior rules to determine when dividends or share participations are not subject to tax, and also provided for a transition to IFRS. It also introduced a series of changes to the VAT rates, which positively affect our business and the business of our subsidiaries, by lowering the VAT rate from 16% to 0% on the purchase and sale of foreign currency as well as on financial derivatives and has a less favorable effect by establishing a 16% VAT rate for leasing agreements, compared to the 10% rate in force before the reform, generating higher costs for these operations.
Other reforms concerning financial institutions included the introduction of amendments to taxes on foreign capital investment portfolio income. Law 1607 also provided that indebtedness obtained abroad by financial cooperatives, commercial finance companies, as well as certain government-owned finance agencies such as Bancoldex, Finagro and Findeter, does not generate income for Colombian tax purposes and is not deemed to be held in Colombia, as was already the case for banks and financial corporations. Furthermore, this law set forth that the returns generated by the stabilization reserve maintained by pension fund managers would be exempted from income tax, with a positive impact for Porvenir, taking into account that the stabilization reserve is equivalent to 1.00% of the funds it manages.
Finally, some rules designed for individual taxpayers, for example, the imposition of more burdensome conditions for obtaining tax deductions for contributions made to the voluntary pension funds and to the savings accounts for the promotion of construction, may also have a significant effect on the business of financial institutions. See “Item 3. Key information—A. Selected financial and operating data—Risk factors—Risks relating to Colombia and other countries in which we operate—New or higher taxes resulting from changes in tax regulations or the interpretation thereof could adversely affect our results of operations and financial condition.”
2014 Tax Reform
On December 23, 2014, the Congress of Colombia enacted Law No. 1739, which added a new net worth tax on the wealth of corporate entities, or the “Wealth Tax”, and an extra charge on the CREE. The Wealth Tax is legally different from the Equity Tax added in Law No. 1370, which was set to expire at the end of 2014 as mentioned above. Law No. 1379 introduced modifications to various aspects of tax regulation in Colombia and introduced, among other things, the following regulations:
|
|
·
|
A Wealth Tax
(Impuesto a la Riqueza)
calculated over the net assets under accounting fiscal basis. During 2015, 2016 and 2017 in the case of companies resident in Colombia and 2015, 2016, 2017 and 2018 in the case of Colombian individuals, this
Impuesto a la Riqueza
, or Wealth Tax, will be calculated over net equity as determined on January 1 of each of the respective years (subject to certain exclusions such as equity investments) according to tax accounting bases computed in accordance with the following rates:
|
|
Rates for companies are as follows (Pesos)
|
||||
|
Net Equity
|
Applicable Rate
|
|||
|
Over
|
Not Over
|
2015
|
2016
|
2017
|
|
>0
|
< 2,000,000,000
|
0.20%
|
0.15%
|
0.05%
|
|
>= 2,000,000,000
|
< 3,000,000,000
|
0.35%
|
0.25%
|
0.10%
|
|
>= 3,000,000,000
|
< 5,000,000,000
|
0.75%
|
0.50%
|
0.20%
|
|
>= 5,000,000,000
|
and above
|
1.15%
|
1.00%
|
0.40%
|
|
Rates for individuals are as follows (Pesos)
|
||
|
Net Equity
|
Applicable Rate
|
|
|
Over
|
Not Over
|
(2015 through 2018)
|
|
>0
|
< 2,000,000,000
|
0.125%
|
|
>= 2,000,000,000
|
< 3,000,000,000
|
0.35%
|
|
>= 3,000,000,000
|
< 5,000,000,000
|
0.75%
|
|
>= 5,000,000,000
|
and above
|
1.50%
|
If the net fiscal assets in 2016, 2017 and 2018 are greater than the net fiscal assets as of January 1, 2015, the taxable basis will be the lesser of the net fiscal assets as of January 1, 2015 (adjusted upwards by 25% of the inflationary index for the prior year) and the net fiscal assets as of January 1 of the respective taxable year.
If the net fiscal assets in any year, beginning in 2016, are lower than the net fiscal assets as of January 1, 2015, the taxable basis will be the greater of the net fiscal assets as of January 1, 2015 (adjusted downwards by 25% of the inflationary index for the prior year) and the net fiscal assets as of January 1 of the respective taxable year.
For accounting purposes in Colombia, this new tax obligation can be recorded against retained earnings instead of net income for the respective year. Accordingly, Grupo Aval has recorded this tax obligation against retained earnings.
|
|
·
|
Income Tax.
Until December 31, 2014, companies in Colombia had to pay an income tax of 25%, and an additional 9% tax called the income tax for equality, or CREE, for a total income tax of 34%. This CREE tax has been modified by Law No. 1739 to include the following annual surcharges:
|
|
Rates for companies are as follows (Pesos)
|
|||||
|
Net Equity
|
Applicable Rate
|
||||
|
Over
|
Not Over
|
2015
|
2016
|
2017
|
2018
|
|
>0
|
< 8,000,000,000
|
0%
|
0%
|
0%
|
0%
|
|
>= 8,000,000,000
|
and above
|
5%
|
6%
|
8%
|
9%
|
As a result of the foregoing and subject to certain deduction, the CREE tax will be increased to a total of 14% for 2015, 15% for 2016, 17% for 2017 and 18% for 2018.
Regulatory Framework for Non-Financial Subsidiaries
All of our Colombian subsidiaries listed in note 1 to our annual audited consolidated financial statements that are not part of the financial sector are governed by the laws and regulations of the Colombian Civil Code and the Colombian Code of Commerce, as well as any regulations issued by the Colombian Superintendency of Industry and Commerce and the Superintendency of Corporations or any other type of special regulations that may be applicable to corporations, and the commercial and industrial activities carried out by these subsidiaries.
Panamanian Regulation
BAC International Bank, Inc. operates as a full service bank in Panamá with a general license to offer banking services to residents of Panamá and abroad.
The Panamanian financial system is regulated by the Superintendency of Banks of Panamá (
Superintendencia de Bancos de Panamá
), or “SBP,” which is in charge of regulating and overseeing all areas of banking, including
solvency, liquidity, credit limits, risk management, financial reporting, accounting standards and anti-money laundering policies.
The SBP requires Panamanian banks to maintain certain minimum capital ratios. Banks’ capital adequacy ratios must be held at a minimum of 8%, measured as a percentage of adjusted capital to risk-weighted assets. The SBP also requires the establishment of a regulatory reserve at a minimum of 1.5% and maximum of 2.5% of total non-qualified risk weighted credit risk exposures. The SBP also limits banks’ concentration risk within a particular economic interest group and for related parties, to 25% of its regulatory capital.
Additionally, the ratio of assets to local deposits and the liquidity ratio are limited to 85% and 30%, respectively.
The SBP could perform one audit per year, requires consolidated financial statements and capital adequacy reports on a quarterly basis, reviews financial statements on a semi-annual basis and audits financial statements annually within 90 days of the fiscal year end close.
Guatemalan Regulation
Grupo BAC-Credomatic Guatemala is subject to the regulations of the Central Bank of Guatemala (Banco de Guatemala) and the Superintendency of Banks of Guatemala (
Superintendencia de Bancos de Guatemala
). Their areas of oversight include capital adequacy, lending limits, concentration limits, liquidity, exchange rate risk, disclosure of financial statements, accounting standards, anti-money laundering and counter-terrorism financing.
Guatemalan banks must maintain certain minimum ratios as required by the local regulator. Capital adequacy ratios must be held at a minimum of 10%, measured as a percentage of adjusted capital to risk-weighted assets, and the liquidity gap must be less than 60%. Concentration risk within a particular economic interest group and for transactions with related parties is limited to 30% of regulatory capital, and no more than 15% of regulatory capital can be concentrated in a single person or entity, whether private or public. Transactions with the Central Bank of Guatemala and the Ministry of Finance are excluded from those concentration limits.
Grupo BAC-Credomatic Guatemala submits periodic reports to the Superintendency of Banks. In addition, the Superintendency of Banks maintains an office within Grupo BAC-Credomatic Guatemala and continuously audits the different areas of the bank. This is a common practice held by the regulator with all Guatemalan banks.
The offshore operations of Grupo BAC-Credomatic Guatemala are also regulated by the Superintendency of Banks of Guatemala as well as the banking authority of Panamá. BAC Bank Inc. is an offshore subsidiary of BAC-Credomatic Guatemala, it is domiciled in Panamá and is regulated by the Superintendency of Banks of Panamá. Furthermore, the recently acquired Transcom Bank (Barbados) Limited is also subject to the regulations of the Central Bank of Barbados.
Additionally, as an issuer of debt securities, Credomatic de Guatemala, S. A. is subject to certain regulatory requirements, including disclosure of financial statements to the market and the obligation to be rated by an independent rating agency. BAC Valores Guatemala, S. A., as a brokerage house, is regulated by the Securities Exchange of Guatemala.
Costa Rican Regulation
Banco BAC San José S.A., is regulated by the General Superintendency of Financial Institutions (
Superintendencia General de Entidades Financieras
), or “SUGEF,” and the Costa Rican Central Bank (
Banco Central de Costa Rica
). Their areas of oversight include capital adequacy, related party lending, limits to credit to a single economic group, external auditors, financial statements disclosure, loan loss reserves, risk management, corporate governance and anti-money laundering.
Costa Rican banks are required to maintain certain minimum ratios: banks’ capital adequacy ratios—”C.A.R.”—(measured as a percentage of adjusted capital to risk-weighted assets) must be held at a minimum of 10% for them to be qualified as “Normal;” however, the “Normality” qualification is subdivided into three levels: (i) ”Normality 1” requires a C.A.R. of at least 14%; (ii) “Normality 2” requires a C.A.R. of between 12% and 14%; and (iii) “Normality 3” requires a C.A.R. of 10% to 12%. Moreover, the bank’s average rating score must be held at a total score of at least 1.75. The average rating score is calculated using the CAMELS score for quantitative rating
and, a “qualitative rating” based on the examination and evaluation of certain aspects of the bank’s management. The CAMELS score is measured based on capital adequacy, asset quality, management quality, earnings, liquidity, and sensitivity to market risk and represents 80% of the total score, correspondingly, the qualitative rating takes into account an assessment of the bank’s planning, policies and procedures, human resources administration, control systems, management information systems and information technology, and it represents 20% of the total score. Exchange rate risk is also regulated, and is limited to 10% of the bank’s net position in foreign currency. Additionally, concentration risk within a particular economic interest group and for related parties is each limited to 20%.
SUGEF performs audits and receives periodic reports on a continuous basis. In addition, the brokerage house and the mutual funds management company are regulated by the General Superintendency of Securities (
Superintendencia General de Valores
), and the pension fund administration company is regulated by the General Superintendency of Pensions (
Superintendencia de Pensiones
), and the insurance broker company is regulated by the General Superintendency of Insurance (
Superintendencia General de Seguros
).
Honduran Regulation
Banco de America Central S.A. (Honduras) is regulated by the National Banking and Insurance Commission (
Comisión Nacional de Bancos y Seguros
), or the “Commission,” and the Honduran Central Bank (
Banco Central de Honduras
). Their areas of oversight include capital adequacy, loss loan reserve, accounting standards, external auditors, foreign exchange, related party lending, limits to credit to a single economic group, corporate governance and anti-money laundering.
Honduran banks are required to maintain certain minimum capital adequacy ratios, as fixed by the Commission. Currently, the capital adequacy ratio must be held at a minimum of 10%, measured as a percentage of adjusted capital to risk-weighted assets; however, while the issuance of corporate bonds (
bonos mercado
) of Banco de América Central S.A. (Honduras) remains outstanding, the bank is subject to a minimum capital adequacy ratio. Additionally, no more than 20% can be concentrated in a single person or legal entity; moreover, concentration risk within a particular economic interest group and for transactions with related parties is limited to 20% and 30%, respectively; although, in the first case, the percentage can be increased to up to 30%. The Commission has also established prudential guidelines with the goal of safeguarding the liquidity of the financial institutions system. The Commission requires periodic reports covering various topics, to be submitted daily, weekly, bi-weekly, monthly and annually. Furthermore, the Commission, via the Superintendency of Banks, performs audits including an annual evaluation of the bank’s risk management.
El Salvadorian Regulation
Banco de America Central S.A. (El Salvador) is regulated by El Salvador Central Bank (
Banco Central de Reserva de El Salvador
) and the Financial System Superintendency of El Salvador (
Superintendencia del Sistema Financiero
). Their areas of oversight include capital adequacy, liquidity, related party transactions, external auditors, risk management, financial information disclosure, investments, accounting standards and anti-money laundering. Salvadorian banks are required to maintain certain minimum ratios. Capital adequacy ratios must be held to a minimum of 12%, measured as a percentage of adjusted capital to the sum of the weighted assets, net of depreciation, reserves, and write-off provisions. Concentration risk is also limited by the superintendency within a particular economic interest group and for transactions with related parties to 25% of the Bank’s Equity Fund (
Fondo Patrimonial
) and 5% of Bank’s paid-in capital plus its capital reserves (
Capital Pagado más Reservas de Capital
), respectively. Additionally, the local superintendency performs periodic audits across multiple areas of the bank and requires an average of 17 periodic reports to be submitted on a weekly, monthly and/or quarterly basis.
Banco de America Central, S.A. as an issuer of debt securities and Inversiones Bursátiles Credomatic, S.A. de C.V., Casa de Corredores de Bolsa as a securities broker, are also subject to the regulations of securities’ market, via the Financial System Superintendency of El Salvador and El Salvador Central Bank.
Nicaraguan Regulation
Banco de America Central S.A., Nicaragua is regulated by the Banking and Other Financial Institutions Superintendency (
Superintendencia de Bancos y de Otras Instituciones Financieras
). The banking authorities have issued prudential guidelines in the areas of capital adequacy, related party lending, concentration risk, risk
management, relationship with external auditors, financial information disclosure, anti-money laundering and terrorism financing prevention, among others.
Nicaraguan banks are required to maintain certain minimum ratios: capital adequacy ratios must be held at a minimum of 10%, measured as a percentage of adjusted capital to risk-weighted assets. Liquidity gap models are also applied, which limit the liquidity gaps within a period of 0-30 days to be no more than one time the bank’s equity base and within the period of 0-90 days to be no more than two times the equity base. Likewise, the banks have legal reserve requirements to guarantee liquidity buffers. The Superintendency of Banks also regulates limited concentration risk within a particular economic interest group and for related parties, to 30%. The Superintendency of Banks requires a minimum of one audit per year and approximately 36 periodic reports are required on a daily, weekly, monthly, quarterly, semi-annual and/or annual basis.
Service of process and enforcement of judgments
Grupo Aval is incorporated under the laws of Colombia. All of our directors and officers reside outside the United States. Substantially all of our assets are located outside the United States, primarily in Colombia. As a result, it may not be possible, or it may be difficult, for you to effect service of process upon us or these other persons within the United States or to obtain recognition and enforcement of judgments obtained in U.S. courts against us or them, including those predicated upon the civil liability provisions of the U.S. federal securities laws or otherwise.
The Colombian Supreme Court will determine whether to recognize a U.S. judgment predicated on the U.S. securities laws through a procedural system known under Colombian law as “exequatur.” Enforcement of U.S. judgments may require a separate court procedure in Colombia.
The Colombian Supreme Court will recognize a foreign judgment, without reconsideration of the merits, only if the judgment satisfies the requirements of Articles 693, 694 and 695 of Colombia’s Code of Civil Procedure (and following the entry into force of Law 1,564 of 2012 (
Código General del Proceso
), of Articles 605, 606 and 607 of such law), provided that the all parties affected by the judgment were summoned in the exequatur proceedings in accordance with applicable rules. The Code of Civil Procedure and Law 1,564 of 2012 provide that the foreign judgment will be recognized if:
|
|
·
|
a treaty or convention exists between Colombia and the country where the judgment was granted relating to the recognition and enforcement of foreign judgments or, in the absence of such treaty or convention, there is reciprocity in the recognition of foreign judgments between the courts of the relevant jurisdiction and the courts of Colombia;
|
|
|
·
|
the foreign judgment does not refer to “in rem” rights vested in assets that were located in Colombia at the time the suit was filed in the foreign court which issued the judgment;
|
|
|
·
|
the foreign judgment does not contravene or conflict with Colombian laws relating to public order (i.e. provision considered to be international public policy) other than those governing judicial procedures;
|
|
|
·
|
the foreign judgment, is final and not subject to appeal in accordance with the laws of the country in which it was obtained. The copy of the judgment provided to the Colombian Supreme Court must be authenticated and legalized by a Colombian Consul and translated into Spanish by an authorized translator, duly registered at the Ministry of Foreign Affairs;
|
|
|
·
|
the foreign judgment does not refer to any matter upon which Colombian courts have exclusive jurisdiction;
|
|
|
·
|
no proceedings are pending in Colombia with respect to the same cause of action, and no final judgment has been awarded in any proceeding in Colombia on the same subject matter and between the same parties;
|
|
|
·
|
in the proceedings commenced in the foreign court that issued the judgment, the defendant was served properly in accordance with the applicable laws in such jurisdiction, and was given a reasonable opportunity to defend itself against the action; and
|
|
|
·
|
the Colombian Supreme Court has granted exequatur upon the foreign judgment.
|
The United States and Colombia do not have a bilateral treaty providing for automatic reciprocal recognition and enforcement of judgments in civil and commercial matters. The Colombian Supreme Court, which is the only Colombian court that can recognize foreign judgments, has generally accepted that reciprocity exists when it has been proven that either a U.S. court has recognized a Colombian judgment or that a U.S. court would recognize a foreign judgment, including a judgment issued by a Colombian court. However, the Colombian legal system is not based on precedents and exequatur decisions are made on a case-by-case basis.
We have appointed Banco de Bogotá S.A., New York Agency as our authorized agent upon whom process may be served in any action instituted in any U.S. federal or state court having subject matter jurisdiction in the Borough of Manhattan in New York, New York, arising out of or based upon the ADSs or the underwriting agreement related to the ADSs.
Notwithstanding the foregoing, we cannot assure you that a Colombian court would recognize or enforce a U.S. based judgment with respect to the preferred shares or ADSs based on U.S. securities laws. We have been advised by our Colombian counsel that there is no legal basis for a Colombian court to exert jurisdiction over original actions to be brought against us or our directors and executive officers predicated solely upon the provisions of the U.S. securities laws. In addition, certain remedies available under provisions of the U.S. securities laws may not be admitted or enforced by Colombian courts.
Grupo Aval’s articles of incorporation and by-laws contain an arbitration clause that provides for the exclusive jurisdiction of an arbitral tribunal to be seated in Bogotá, D.C., Colombia. The arbitration provision provides that any conflict arising among shareholders, or between shareholders and Grupo Aval in connection with the by-laws, must be resolved by an arbitral tribunal.
|
Organizational structure
|
Our operations
We conduct our operations through our four banks (Banco de Bogotá, Banco de Occidente, Banco Popular and Banco AV Villas), a pension and severance fund manager (Porvenir), our merchant bank (Corficolombiana) and our Central American banking group, BAC Credomatic. On April 18, 2013, we acquired Horizonte, another pension and severance fund manager. On December 31, 2013, we completed the merger by absorption of Horizonte into Porvenir. The merger of Horizonte into Porvenir positions us as the market leader in mandatory pension funds management and severance funds management. In December 2013, we completed the acquisitions of BBVA Panamá (merged into BAC International Bank, Inc.) and Grupo Financiero Reformador de Guatemala. For more information on our organizational structure, please see the chart presented in “Item 4. Information on the Company—B. Business overview—Our operations”.
|
Property, plants and equipment
|
Properties
Grupo Aval does not directly own any properties at December 31, 2014. We have listed below the property holdings of each of our banking subsidiaries, Porvenir, Corficolombiana and BAC Credomatic at December 31, 2014.
|
Value of properties
|
||||||||||||||||
|
Number of properties
|
Book value
|
Reappraisal
|
Total
|
|||||||||||||
|
(Ps billions)
|
||||||||||||||||
|
Banco de Bogotá
|
451 | 193.0 | 673.1 | 866.1 | ||||||||||||
|
Banco de Occidente
|
172 | 96.9 | 311.2 | 408.1 | ||||||||||||
|
Banco Popular
|
212 | 115.2 | 364.0 | 479.2 | ||||||||||||
|
Banco AV Villas
|
132 | 66.8 | 208.0 | 274.8 | ||||||||||||
|
Corficolombiana
|
90 | 3.8 | 29.6 | 33.4 | ||||||||||||
|
Porvenir
|
141 | 76.8 | 44.1 | 120.9 | ||||||||||||
|
BAC Credomatic (1)
|
136 | 268.8 | 244.7 | 513.5 | ||||||||||||
|
Total
|
1,334 | 821.4 | 1,874.6 | 2,696.0 | ||||||||||||
|
(1)
|
Includes Grupo Financiero Reformador and Banco BAC de Panamá (now merged into BAC International Bank, Inc).
|
Not applicable.
|
Operating results
|
The following discussion of our financial condition and results of operations should be read in conjunction with our audited consolidated financial statements at December 31, 2014 and 2013 and for the years ended December 31, 2014, 2013 and 2012, and the related notes thereto, and with the other financial information included in this annual report. The preparation of the financial statements requires the adoption of assumptions and estimates that affect the amounts recorded as assets, liabilities, revenue and expenses in the years and periods addressed and are subject to certain risks and uncertainties. Our future results may vary substantially from those indicated because of various factors that affect our business, including, among others, those identified under “Forward-Looking Statements” and “Item 3. Key Information—D. Risk factors” and other factors discussed in this annual report. Our audited consolidated financial statements at December 31, 2014 and 2013 and for the years ended December 31, 2014, 2013 and 2012 included in this annual report have been prepared in accordance with Colombian Banking GAAP.
Principal factors affecting our financial condition and results of operations
Colombian Economic Conditions
The Colombian economy has expanded in recent years, driven by strong growth in areas including capital investment, domestic consumption and exports. Colombian GDP grew at a CAGR of 4.8% in the five-year period up to the fourth quarter of 2014. Our operations are concentrated in Colombia, such that our results are linked to the country’s economic performance. Following the global financial crisis, GDP growth reached a peak of 6.6% in 2011, but business and consumer confidence deteriorated moderately due to global concerns related to the European debt crisis and GDP growth slowed down to 4.0% in 2012.
For 2013, the Colombian Central Bank’s GDP growth forecast initially was in a range of 2.5% to 4.5%, with 4.0% growth as the most likely scenario. With annual inflation rate dropping to 1.83% by February 2013, below the target range of 2.0% to 4.0% and the lowest since 1955, the Central Bank cut its policy rate by 50 basis points to 3.25% in March 2013, completing 100 basis points since December 2012 when the policy rate was 4.25%. In April 2013, the Central Bank revised its 2013 GDP growth forecast upwards to a range of 3.0% to 5.0% with 4.3% growth as the most likely scenario, while inflation began to pick up gradually. However, during the summer of 2013, the U.S. Federal Reserve signaled its intention to gradually scale back its asset purchases (quantitative easing) by the end of the year, which resulted in a significant tightening of global financial conditions; this situation weakened the short-term economic outlook, especially for developing economies. At the same time, the Colombian economy was affected by a major nationwide strike, led by farmers, truckers and miners, which lasted one month. In July 2013, the Central Bank again revised its 2013 GDP growth forecast downwards to a range of 3.0% to 4.5%, with 4.0% growth as the most likely scenario. Nonetheless, the recovery of the local economy was already well underway, led by consumer spending and construction. The economy expanded 4.9% in 2013, exceeding the Central Bank’s central forecast.
The economy continued strengthening throughout the first half of 2014, with annual growth accelerating to 5.5% compared to the first half of 2013. As a result, the Central Bank’s GDP growth forecast for that year was
revised upwards from a range of 3.3% to 5.3%, with 4.3% growth as the most likely scenario, to a range of 4.2% to 5.8%, with 5.0% growth as the most likely scenario. However, growth expectations for the second half of the year and for 2015 deteriorated due to the sharp decline in oil prices since August 2014. Oil accounts for more than half of Colombian exports, therefore the economy is likely to experience a large negative terms-of-trade shock in the following quarters. GDP grew 4.2% in the third quarter of 2014 as compared to the third quarter of 2013. Consequently, the Central Bank decided to revise its 2014 GDP growth forecast downwards in January 2015 to a range of 4.5% to 5%, with 4.8% growth as the most likely scenario, which ended up being slightly higher than the official final growth figure of 4.6%. For 2015, the Central Bank is expecting the economy to expand between 2% and 4%, with 3.6% growth as the most likely scenario.
Clients of our banking subsidiaries include companies of the oil sector such as producers, pipeline operators and suppliers. Even though oil sector companies represent a minor portion of our overall loan portfolio, substantial or extended declines in international oil prices may cause a deterioration in the delinquency ratios of the loans granted to some of these clients.
The Colombian government publicly announced that a new tax reform may be required in 2015, on top of the one approved in December 2014, in order to obtain additional funds and close potential deficits, especially considering the more challenging medium-term outlook for the oil sector. This eventual new tax reform may result in higher levels of taxation that can significantly affect our results of operations or financial condition.
Labor Markets
During the twelve months ended December 31, 2014, the Colombian unemployment rate decreased to an annual average of 9.1% from 9.6% at December 31, 2013, according to DANE. This was the lowest rate recorded for a calendar year since the publication of employment statistics in 2001. The participation rate (i.e., economically active population divided by working age population), a measure of labor supply, remained unchanged at an annual average of 65% at December 31, 2014, compared to the same period ended in December 31, 2013; while the employment rate (i.e., employed population divided by working age population), a measure of labor demand, rose to historic highs, increasing to an annual average of 58.4% at December 31, 2014 from 58% at December 31, 2013. The high and stable employment rate is derived primarily from increased employment in the trade, construction, services and manufacturing sectors, while formal employment has recently increased substantially due to the reduction of labor costs enacted in the 2012 tax reform.
Interest Rates
Since the implementation of an inflation-targeting regime in 1999, the Colombian Central Bank has reduced its overnight lending rate from 26.0% in 1999 to 6.0% at the end of 2005, and to 3.0% at the end of 2010. It increased moderately to 4.75% at December 31, 2011 and to 5.25% at June 30, 2012, and decreased again to 4.25% at December 31, 2012 and 3.25% at December 31, 2013. Most recently, the Central Bank increased it to 4.5% from April 2014 to August 2014, and it remained unchanged throughout the rest of 2014.
A significant portion of our banking subsidiaries’ assets are linked to the DTF rate; accordingly, changes in the DTF rate affect our banking subsidiaries’ net interest income. As the economy recovered and the output gap began to close, the Colombian Central Bank increased its interest rate throughout 2011, starting in February of that year, and through to the first quarter of 2012. As the economy began to slow down more than expected, due to the intensification of the economic crisis in Europe during 2012, the Colombian Central Bank decreased the interest rate by 100 basis points during the second half of that year, lowering it to 4.25% at December 31, 2012. Additional cuts of 100 basis points took place during 2013, bringing the policy rate to 3.25% at December 31, 2013. The policy rate has increased by 125 basis points since then, to 4.5% at August 29, 2014, as the rate of inflation increased during the first half of 2014 towards the Central Bank’s 3% target, and as the recovery of economic activity consolidated. It has remained unchanged at 4.50% since then, as inflation continued to accelerate while the economic outlook for 2015 deteriorated due to the collapse in oil prices. The average DTF rate was 4.21% during 2011, 5.35% during 2012, 4.24% during 2013 and 4.07% during 2014. It is expected that in 2015, the average DTF rate will be somewhat higher to the 2014 average, as monetary policy is expected to remain unchanged through most of the year, although some moderate easing cannot be ruled out in the second half of 2015
.
Inflation
Lower interest rates and stable inflation generally lead to increased consumer confidence and increased consumer demand for credit. Colombian Central Bank independence, and the adoption of an inflation-targeting regime and a free-floating fees since in 1999, have contributed to declining inflation rates and increased price stability in Colombia. The inflation rate increased to 3.2% in 2010 and to 3.7% in 2011, both within the Colombian Central Bank’s target band of 2.0% to 4.0%, before falling to 2.4% for 2012 and to 1.9% for 2013, the lowest annual rate since 1954, mainly due to the effects of a series of regulatory and supply shocks during the preceding 12 months. Inflation accelerated to 3.66% at December 31, 2014 as the effects of these shocks waned, coupled with stronger domestic demand throughout the first three quarters of 2014, and as the local currency depreciated substantially in the fourth quarter due to the large decline in oil prices. However, although the Colombian Central Bank estimates that inflation may stay in the upper bound of its target range during most of 2015, it has stated that most of the upward corrections were widely anticipated and that the effects of currency depreciation are expected to be temporary, while the slowdown of economic activity should help bring down inflation near the 3% target rate by the end of the year. The Colombian Central Bank’s preemptive approach with respect to monetary policy has resulted in a decrease in inflation expectations, which currently are within its long-term inflation target.
Credit Volumes
Credit volumes in Colombia have grown since 2005, mainly driven by the above-mentioned factors, including lower inflation rates, decreasing interest rates and consistent economic growth. In 2010, the pace of bank credit volume growth gradually increased, along with a moderate recovery of economic activity and fueled by historic low interest rates. At December 31, 2010, year-over-year bank credit volume growth was 14.6% (including credit volume growth of five financing companies that merged with commercial banks during the previous 12 months, as reported by the Superintendency of Finance), while at December 31, 2011 growth was 22.1% (including three financing companies and one cooperative bank that converted to commercial banks during the previous 12 months, as reported by the Superintendency of Finance) and 20.5% when adjusted to include securitized mortgage loan data, as reported by Titularizadora Colombiana S.A. At December 31, 2012, bank credit volume growth was 15.6% and 14.9% when adjusted for securitized mortgage loan data, as reported by Titularizadora Colombiana S.A. At December 31, 2013, bank credit volume growth was 13.8% and 12.8% when adjusted for securitized mortgage loan data, as reported by Titularizadora Colombiana S.A. At December 31, 2014, bank credit volume growth was 15.5% and 15.2% when adjusted for securitized mortgage loan data. We believe that Colombia offers significant opportunities to expand our business due to the country’s strong economic fundamentals and low penetration rates of domestic credit to the private sector as a percentage of GDP for banking and other financial services and products in 2013 of 50.2% as compared to 70.7% for Brazil, 105.9% for Chile and 31.4% for Peru, as reported in the World Bank Development Indicators.
At December 31, 2012, Colombia’s bank loans-to-GDP ratio was 34.8%. At December 31, 2013, that ratio was 37.3% and
at December 31, 2014
it was 37.9%. See “Item 4. Information on the Company—B. Business Overview—Industry—Colombia—Credit volumes.”
Reserve Requirements
The Colombian Central Bank’s reserve requirements significantly affect our banking subsidiaries’ results of operations. The raising or lowering of these requirements directly affects our banking subsidiaries’ results by increasing or decreasing the funds available for lending.
Colombian banks are required to maintain a determined level of reserves depending on the volume and mix of their deposits. These are reflected in the line item “cash and cash equivalents” on our consolidated balance sheet. During 2008, this level of cash reserves, referred to as the general minimum deposit requirement, was first increased by the Colombian Central Bank from 8.3% to 11.5% for checking accounts and savings deposits and from 2.5% to 6.0% for time deposits. On October 24, 2008, it was decreased to 11.0% for checking accounts and savings deposits and 4.5% for time deposits. The reserve requirements have not changed since October 2008.
In May 2007, as a cautionary measure, the Colombian Central Bank forced banks to maintain, in addition to the general minimum deposit requirement, a marginal minimum deposit requirement of approximately 13% of total deposits that exceeded the level that each bank had at May 7, 2007. This marginal minimum deposit requirement (27% for current accounts, 12.5% for savings deposits and 5% for time deposits) was a temporary measure aimed at
decreasing the level of liquidity in the market and was eliminated by the Colombian Central Bank in mid-2008. Reserve requirements have remained stable since late 2008; the Colombian Central Bank, however, has the power to modify these requirements.
Tax Policies
Changes in Colombian tax policies can significantly affect our results of operations. Given the moderate scope for countercyclical fiscal policy during the global economic downturn, the consolidated public sector deficit expanded to 3.3% of GDP in 2010, and the deficit of the Colombian government expanded to 3.9% of GDP in 2010.
The Colombian government initially expected that the final fiscal deficit figures for 2011 would remain high, partly due to the relief and reconstruction efforts following the worst floods to hit the country in recent history, and that the figures would start falling in 2012. In spite of these predictions, the final figures for 2011 were far better than expected, with the consolidated public sector deficit shrinking to 2.0% of GDP and the Colombian government’s deficit also shrinking to 2.8% of GDP. In 2012, fiscal figures continued to improve, with the balance of the consolidated public sector posting a surplus of 0.3% of GDP, while the government deficit decreased to 2.3% of GDP. In 2013, the government adopted a countercyclical fiscal policy in response to the economic slowdown that began in 2012, leading to a moderate deterioration of its fiscal accounts, with the balance of the consolidated public sector posting a deficit of 0.9% of GDP, while the government deficit expanded to 2.4% of GDP, after accounting for the tax reform that was enacted in December 2012, or Law 1607, which had a relatively neutral fiscal effect on that year’s budget. For 2014, the Colombian government estimated a consolidated public sector deficit of 1.6% of GDP and a government deficit of 2.4% of GDP, while for 2015 the government deficit is expected to widen to 2.8% of GDP due to a decline in oil-related revenues and a slowdown in economic activity.
In order to address weaknesses in fiscal accounts, the Colombian government enacted several laws to strengthen the fiscal regulatory regime, along with reforms on taxes and oil and mining royalties. The improvement in the fiscal regulatory regime requires expenses to grow in line with revenues and savings from excess oil revenues, with the goal of reducing Colombian government public debt to below 30% of GDP by 2020. There can be no assurance that this goal will be achieved.
On December 30, 2009, the Congress of Colombia enacted Law No. 1370, which added a net worth tax on the wealth of corporate entities, or the “Equity Tax”. The Equity Tax accrued on January 1, 2011 amounted to Ps 783.4 billion payable in eight equal installments through 2014. Grupo Aval paid the last installment of this Equity Tax in September 2014, therefore, as of December 31, 2014, there was no remaining consolidated liability associated with the Equity Tax enacted in 2009.
On December 23, 2014, the Congress of Colombia enacted Law No. 1739, which added a new net worth tax on the wealth of corporate entities, or the “Wealth Tax”, and an extra charge on the income tax for equality, or “CREE”. The Wealth Tax is legally different from the Equity Tax added in Law No. 1370, which was set to expire at the end of 2014 as mentioned above. Law No. 1379 introduced modifications to various aspects of tax regulation in Colombia and introduced, among other things, the following regulations:
|
|
·
|
A Wealth Tax
(Impuesto a la Riqueza)
calculated over the net assets under accounting fiscal basis. During 2015, 2016 and 2017 in the case of companies and 2015, 2016, 2017 and 2018 in the case of individuals, this
Impuesto a la Riqueza
, or Wealth Tax, will be calculated over net equity as determined on January 1 of each of the respective years (subject to certain exclusions such as equity investments) according to tax accounting bases computed in accordance with the following rates:
|
|
Rates for companies are as follows (Pesos)
|
||||
|
Net Equity
|
Applicable Rate
|
|||
|
Over
|
Not Over
|
2015
|
2016
|
2017
|
|
>0
|
< 2,000,000,000
|
0.20%
|
0.15%
|
0.05%
|
|
>= 2,000,000,000
|
< 3,000,000,000
|
0.35%
|
0.25%
|
0.10%
|
|
>= 3,000,000,000
|
< 5,000,000,000
|
0.75%
|
0.50%
|
0.20%
|
|
>= 5,000,000,000
|
and above
|
1.15%
|
1.00%
|
0.40%
|
|
Rates for individuals are as follows (Pesos)
|
||
|
Net Equity
|
Applicable Rate
|
|
|
Over
|
Not Over
|
(2015 through 2018)
|
|
>0
|
< 2,000,000,000
|
0.125%
|
|
>= 2,000,000,000
|
< 3,000,000,000
|
0.35%
|
|
>= 3,000,000,000
|
< 5,000,000,000
|
0.75%
|
|
>= 5,000,000,000
|
and above
|
1.50%
|
If the net fiscal assets in 2016, 2017 and 2018 are greater than the net fiscal assets as of January 1, 2015, the taxable basis will be the lesser of net fiscal assets as of January 1, 2015 (adjusted upwards by 25% of the inflationary index for the prior year) and net fiscal assets as of January 1 of the respective taxable year.
If the net fiscal assets in any year, beginning on 2016, are lower than the net fiscal assets as of January 1, 2015, the taxable basis will be the greater of net fiscal assets as of January 1, 2015 (adjusted downwards by 25% of the inflationary index for the prior year) and net fiscal assets as of January 1 of the respective taxable year.
For accounting purposes in Colombia, this new tax obligation can be recorded against retained earnings instead of net income for the respective year. Accordingly, Grupo Aval has recorded this tax obligation against retained earnings.
|
|
·
|
Income Tax.
Until December 31, 2014, companies in Colombia had to pay an income tax of 25%, and an additional tax named income tax for equality, or CREE, of 9% for a total income tax of 34%. This CREE tax has been modified by Law No. 1739 to include the following annual surcharges:
|
|
Rates for companies are as follows (Pesos)
|
|||||
|
Net Equity
|
Applicable Rate
|
||||
|
Over
|
Not Over
|
2015
|
2016
|
2017
|
2018
|
|
>0
|
< 8,000,000,000
|
0%
|
0%
|
0%
|
0%
|
|
>= 8,000,000,000
|
and above
|
5%
|
6%
|
8%
|
9%
|
As a result of the foregoing and subject to certain deduction, the CREE tax will be increased to a total of 14% for 2015, 15% for 2016, 17% for 2017 and 18% for 2018.
Central American Economic Conditions
According to the IMF, for the year ended December 31, 2014, Central America posted an estimated combined GDP of U.S.$208.9 billion, ranking as the sixth largest economy in Latin America after Brazil (nominal GDP of U.S.$2,353 billion), Mexico (nominal GDP of U.S.$1,282.7 billion), Argentina (nominal GDP of U.S.$540.2 billion), Colombia (nominal GDP of U.S.$384.9 billion), and Chile (nominal GDP of U.S.$258 billion).
Because BAC’s and our other Central American businesses’ operations are concentrated in Central America, their results are linked to the region’s economic performance. According to the IMF, Central America’s GDP grew 4.0% in 2014, below the growth rate for Colombia of 4.6%, and is expected to grow at an annual average rate of 4.3% between 2015 and 2017, compared to Colombia’s expected average growth rate of 3.7% during the same period.
During the last several years, countries in Central America have increased their efforts to promote fiscal prudence and foreign investment. Countries such as Costa Rica, El Salvador, Guatemala and Nicaragua have signed agreements with the IMF under which their respective governments receive credit, subject to adopting fiscal discipline in their economic policies.
We believe that Central America offers a stable market that is expected to further converge toward an integrated economy as a result of the ongoing implementation of free trade agreements. The United States-Dominican Republic-Central America Free Trade Agreement, or “DR-CAFTA,” gradually eliminates barriers to trade and investment among Costa Rica, the Dominican Republic, El Salvador, Guatemala, Honduras, Nicaragua and the
United States. The agreement allows Central American countries access to markets in the United States and establishes common regulatory standards among these countries. DR-CAFTA covers most types of trade and commercial exchange between these countries and the United States.
Critical Accounting Policies Under Colombian Banking GAAP
Our principal accounting policies are described in note 2 to our audited consolidated financial statements included in this annual report. The following discussion describes those policies, under Colombian Banking GAAP, that require the most significant management judgments and estimates. These accounting estimates require management to make assumptions about matters that are highly uncertain and affect the reported amount of assets and liabilities at the date of the financial statements and the reported amounts of revenues and expenses during the reporting period. In each case, if management had made other estimates, or if changes in these estimates occur from period to period, our results of operations and financial condition could be materially affected. For a discussion of critical accounting policies under U.S. GAAP, see “—Critical accounting policies under U.S. GAAP.”
Management bases its estimates and judgments on historical experience and on factors that are believed to be reasonable under current circumstances. Actual results may differ from these estimates if actual experience differs from our assumptions or our assumptions change. Judgments or changes in assumptions are submitted to the audit committee of the board of directors and/or to our regulatory authorities and are disclosed in the notes to our consolidated financial statements.
Loan Loss Allowances and Provisions
We perform qualitative and quantitative analysis to assign a risk category to individual assets, under the rules issued by the Superintendency of Finance. The qualitative loan analysis involves an evaluation of specific factors to determine potential deficiencies that may affect the borrower’s payment capacity. For the quantitative evaluation, we first determine whether the loan has become due and then classify the loan according to the number of days past due. The Superintendency of Finance requires our banks to maintain minimum allowance levels for each category of credit risk and each type of loan.
Commercial and consumer loans are provisioned according to models developed by the Superintendency of Finance, which take into consideration the number of days the loans are past due. The allowance for these loans calculated in these models is determined by considering the “expected loss.” The expected loss for these loans is determined by multiplying the exposure to default of the loan by its “probability of default” (likelihood of a borrower defaulting on an obligation within the next 12 months) and its “loss given default” (an estimate of the amount the Bank would expect to lose in the event a borrower defaults). For purposes of calculating “loss given default,” loans collateralized are appraised by independent third parties. These appraisals may differ from the appraisals that would be calculated when the collateral finally would be recorded. Both the probability of default and the loss given default values are provided by the Superintendency of Finance depending on each category of credit risk and each type of loan. Furthermore, portfolios for which the Superintendency of Finance does not provide a standard model, specifically mortgage and microcredit loans, have a general allowance equal to 1.0% of the gross portfolio value in addition to specific provisions mandated according to the individual loans’ risk category.
We consider the accounting estimates used in this evaluation to be part of our critical accounting policies because: (1) we make qualitative judgments and assumptions regarding the quality of our loan portfolio to determine allowances and provisions; (2) our methods are dependent on the existence and magnitude of certain factors, which do not necessarily indicate future losses; and (3) we apply a discount percentage to each loan (based on its assigned risk category) that may not accurately reflect the future probability of loss.
Contingent Liabilities
Contingent liabilities arise from the normal conduct of our business activities and include liabilities for judicial, regulatory and arbitration proceedings, and tax and other claims. We record contingent liabilities, pursuant to Article 52 of Decree 2649 of 1993, to cover certain of our liabilities including those pertaining to damage claims from third parties based on professional responsibility, torts, labor law, breach of contract and others for which the contingency for loss is probable and its value can be reasonably quantified.
Article 52 of Decree 2649 of 1993 establishes that provisions should be recorded to cover estimated liabilities and contingencies of probable losses and to decrease the restated value of assets when necessary, as required in
accordance with accounting standards. The provisions must be justifiable, quantifiable and reliable. A contingency is a condition, situation or set of circumstances that exist, which involve questions regarding a potential gain or loss by an economic entity, and which will be resolved when one or more future events occur or fail to occur.
Lawyers and actuaries assist us and our banks in evaluating probabilities and estimating amounts which are recorded and updated at the end of each period.
We consider the estimates used in assessing contingent liabilities to be part of our critical accounting policies because of the high level of judgment that is necessary to assess the probability of their occurrence. Our judgment may not necessarily coincide with the outcome of the proceedings.
Pension Plan
Under Decree 2984 of 2009, we are required to bring our non-contributory defined benefit pension plans from an underfunded to a funded status by 2029 according to the actuarial calculation, by crediting liabilities created for this specific purpose. By means of Resolution 1555 of July 30, 2010, the Superintendency of Finance replaced the mortality charts used to prepare the actuarial computation and determined that the effect of this change may be recognized gradually. At December 31, 2014, the underfunded level totaled Ps 370.0 billion (Banco de Bogotá amounted to Ps 121.5 billion, Banco de Occidente to Ps 3.4 billion and Banco Popular to Ps 245.1 billion). From that year on, the plans must be kept fully funded. Under Grupo Aval’s non-contributory defined benefit pension plan, benefits are based on length of service and level of compensation.
We consider the accounting estimates related to our and our subsidiaries’ pension plans to be part of our critical accounting policies as the amounts contributed to the plans involve certain assumptions and determinations made by our actuaries relating to, among others, adjustments to pensions and salaries, variations to the employee base and the employees’ partners, and discount rates for the pension liability adjustments. Key assumptions include weighted averages of past inflation rates, mortality rates, and average rates of return of certificates of deposit. Most of these parameters are provided by Colombian regulations and governmental institutions.
Recognition and Measurement of Financial Instruments at Fair Value
Under Colombian Banking GAAP, the fair value of a financial instrument is defined as the estimated amount at which the instrument could be exchanged in a current transaction between willing and independent parties.
Some of our assets are carried at fair value for Colombian Banking GAAP purposes, including equity and debt securities with quotations available or quoted prices for similar assets, aside from our merchant banking investments, derivatives and customers’ acceptances. The majority of our assets reported at fair value are based on quoted market prices, which provide the best indication of fair value, or quoted market prices for similar assets.
For our remaining assets, if quoted market prices or quoted market prices for similar assets are not available, we calculate their fair value by discounting the expected cash flows using market interest rates which take into account the credit quality and duration of the investment or by utilizing internally developed valuation techniques. In particular, management is involved in estimating future cash flows, based on variable terms of the instruments and the inherent credit risk, and in defining the applicable interest rate to discount those cash flows. Our fixed rate investments in this category are insignificant in value; however, we have material equity investments in this category, principally our equity investments through our merchant bank, Corficolombiana.
We consider the determination of fair value for such assets to be part of our critical accounting policies because of the high degree of judgment and assumptions involved in developing the high level of estimation and assumptions that must be made.
Impairment Evaluation of Investment Securities
Securities are classified according to a methodology defined by Grupo Aval’s banking subsidiaries and approved by the Superintendency of Finance. The securities are categorized as “A” except for when there is a risk associated with them, in which case they are rated from “B” to “E.” For securities rated from “B” to “E,” the Superintendency of Finance has established a certain level of provision for each category.
We consider the determination of the impairment of investments to be part of our critical accounting policies because of the high degree of judgment and assumptions involved in developing and applying valuation methodologies.
Goodwill Recognized Upon Business Combinations
We test goodwill recognized upon business combinations for impairment at least annually using a two-step process beginning with an estimation of the fair value of a reporting unit. First, we screen for potential impairment, and, second, we measure the amount of impairment, if any. However, if certain criteria are met, the requirement to test goodwill for impairment annually may be satisfied without a remeasurement of the fair value of a reporting unit. Fair value is determined by management by reference to market value, if available, or by pricing models or with the assistance of a qualified evaluator. The latter two options require management to use estimates and make assumptions, which management considers reasonable and supportable in the existing market environment and commensurate with the risk profile of the valued assets. The valuation models used to determine the fair value of these companies and the intangibles are sensitive to changes in the assumptions. Adverse changes in any of these factors could lead us to record a goodwill or intangible impairment charge.
The Superintendency of Finance stipulates how to value, where to register and how to amortize goodwill. According to the Superintendency of Finance rules, goodwill is defined as the difference between the amount of capital paid in an acquisition of a business and the book value of equity of the acquired entity. Goodwill is created only after the acquiring company achieves control of the acquired entity. In addition, the regulator requires financial entities to calculate amortization of goodwill using the exponential method. Consistent with Colombian Banking GAAP we also perform impairment tests using the discounted cash flow methodology. The amortization of goodwill shown in our consolidated financial statements is the larger of these two amounts.
Recent Colombian Banking GAAP Pronouncements
In July 2009, the Colombian Congress approved Law 1314 of 2009. This law regulates the accounting, reporting and information assurance principles and standards that are generally accepted in Colombia and describes the procedure by which said principles and standards are to be issued by the oversight authorities. This law is expected to adapt the current generally accepted accounting principles in Colombia with IFRS. In accordance with the aforementioned law, on December 28, 2012, the Colombian government issued Decree 2784 pursuant to which these standards will have to be implemented by year 2015. According to Decree 2784 of 2012, these regulations are effective for annual and interim fiscal years beginning after December 31, 2014. Therefore, Colombian companies (i) had to prepare an opening balance sheet as of January 1, 2014, and (ii) will have to prepare consolidated financial statements in full compliance with IFRS accounting principles no later than December 31, 2015. Colombian authorities have proposed a schedule intended to determine the steps for implementing IFRS accounting principles in Colombia.
Currently, Grupo Aval, as a holding company, prepares its financial statements in accordance with Colombian Banking GAAP, which differs in certain significant respects from IFRS. Following the adoption of IFRS, our results of operations and financial position may differ significantly from previous amounts reported under Colombian Banking GAAP in our total shareholders’ equity and net income.
On December 27, 2013, the Ministry of Finance issued Decree 3023, which updated the technical regulatory framework for financial reporting to be applied in Colombia to implement IFRS standards issued by the IASB to December 31, 2012.
On November 11, 2014, the Ministry of Finance issued Decree 2267, Complementary to Decree 1851 of 2012, which exempted banks and certain other financial institutions from applying IAS 39 and IFRS 9 with respect to loan portfolios and their impairment, and classification and valuation of investment securities in the preparation of separate (unconsolidated) financial statements; as a result, for these assets, our financial subsidiaries in Colombia will continue applying current standards issued by the Superintendency of Finance. This exception will not be available in the preparation of our or our Colombian financial subsidiaries’ consolidated financial statements.
On December 9, 2014, the Superintendency of Finance issued Circular Externa 034, adjusting its instructions related to the classification, valuation and accounting of investment securities as a result of the exceptions
introduced by Decree 2267 of November 11, 2014, described above. This Circular Externa includes, among other things, the following:
|
|
·
|
Financial institutions, when preparing their unconsolidated financial statements, will continue using the three category model for classification and valuation of securities:
Negotiable
,
Held to Maturity
and
Available for Sale
. In the case of investments
Available for Sale
, as from January 1, 2015, their classification, reclassification to other categories or sale, must be made in accordance with the business model established by each entity.
|
|
|
·
|
Investments in controlled companies are registered beginning on January 1, 2015 under the equity method and investments in associated companies and joint ventures shall be recorded in accordance with IAS 27 and IAS 28.
|
Compliance with Circular Externa 034 was originally applicable to financial institutions but was extended to also apply to the separate financial statements of issuers of securities that, such as in the case of Grupo Aval, comply with the double condition of (1) being subject to the exclusive oversight of the Superintendency of Finance and (2) are controlling companies of financial entities under supervision of the Superintendency of Finance.
On December 9, 2014, Superintendency of Finance issued Circular Externa 033, which modified the Charts of accounts for Financial Information (
Catálogo Único de Información Financiera
) of the financial companies in Colombia based on the Decree 2267 of November 11, 2014. The new chart of accounts must be applied by financial entities beginning on January 1, 2015.
On December 12, 2014, the Superintendency of Finance issued Circular Externa 036, providing instructions related to the treatment of differences generated between Colombian Banking GAAP and IFRS resulting from the first time adoption of IFRS, as follows:
|
|
·
|
if the differences resulting from the first time adoption of IFRS generate a net gain, recorded in stockholders’ equity, this net gain cannot be used to absorb losses, effect capitalization processes or distribution of profits. This balance can only be transferred to undistributed retained earnings when the underlying assets that they originated are disposed in transactions with non-related parties. Additionally, these differences cannot be considered for the purpose of calculating compliance with capital solvency regulations.
|
|
|
·
|
In the event that the application of IFRS for the first time generates negative net differences, such negative differences must be deducted in calculating the minimum regulatory capital required to operate financial institutions.
|
|
|
·
|
Exception for non-application, in the unconsolidated financial statements of IAS 39 and IFRS 9, of the classification and valuation of investments in entities such as Grupo Aval, which control financial institutions.
|
As a result of the above rules, Grupo Aval has preliminarily prepared a provisional unconsolidated and consolidated opening balance sheet as of January 1, 2014, which had to be submitted to the Superintendency of Finance and which continues to be analyzed and modified. The opening balance sheet will be finalized when Grupo Aval prepares its first unconsolidated and consolidated financial statements under IFRS adopted in Colombia as of June 30, 2015 in accordance with its statutory financial statements.
Results of operations
Sources of income
We generate revenue through several sources. Our main source of income is the net interest income that our banking subsidiaries earn by taking deposits from customers at certain rates and lending them to customers at higher rates.
We also derive income from trading activities as follows: (1) interest and dividends from investments in fixed income and equity securities; (2) investment gains from fixed income, equity and derivative positions; and (3) the spread on derivatives transactions entered into by our banking subsidiaries to hedge market risk exposure.
In addition, we earn fee and commission income from the different banking and financial services our banking subsidiaries provide, including fiduciary activities, leasing services, payment and collection services, credit and debit cards, and insurance.
On December 9, 2010, we acquired BAC Credomatic, a Central American banking group. See “Item 4. Information on the Company—B. Business—Central American operations.”
LB Panamá’s financial information is prepared in accordance with Colombian Banking GAAP and primarily reflects BAC Credomatic’s consolidated results since December 2010 (including Grupo Financiero Reformador and Banco BAC de Panamá (merged into BAC International Bank, Inc. on December 9, 2014) since December 2013). As of December 31, 2014, LB Panamá’s unconsolidated balance sheet carried goodwill of Ps 3,031.3 billion (U.S.$1,267 million) resulting from the direct acquisitions the company made of BAC Credomatic and Banco BAC de Panamá (merged into BAC International Bank, Inc.). LB Panamá’s unconsolidated balance sheet also includes Ps 2,527.2 billion (U.S.$1,056 million) of indebtedness, including Ps 646.0 billion (U.S.$270 million) incurred to fund a portion of our acquisition of BAC Credomatic and Ps 1,881.2 billion (U.S.$786 million) of additional indebtedness, of which Ps 589.3 billion (U.S.$246 million) is owed to Grupo Aval Limited and Ps 1,291.9 billion (U.S.$540 million) is owed to Deutsche Bank. As of December 31, 2014, LB Panamá had a fixed income portfolio of Ps 1,757.8 billion (U.S.$735 million) comprised mainly of investment grade bonds issued by Latin American sovereign and corporate issuers, acquired pursuant to Banco de Bogotá’s investment guidelines.
Results of Operations for the Year Ended December 31, 2014 Compared to the Year Ended December 31, 2013
The following tables present our consolidated results of operations for the year ended December 31, 2014, as compared to the year ended December 31, 2013, broken down among our four banking subsidiaries, adjusted to reflect our wholly owned finance subsidiaries and intercompany eliminations, and our contribution as the holding company.
Because the acquisitions of Grupo Financiero Reformador and BBVA Panamá took place during December 2013, the income statement for 2013 does not include the results from these businesses. The year ended December 31, 2014 is the first period that incorporates results for those businesses.
|
For
the year ended
December 31, 2014
|
||||||||||||||||||||||||
|
Banco de Bogotá
|
Banco de Occidente
|
Banco Popular
|
Banco AV Villas
|
Grupo Aval, its wholly owned finance subsidiaries and eliminations
|
Grupo Aval consolidated
|
|||||||||||||||||||
|
(in Ps billions)
|
||||||||||||||||||||||||
|
Total interest income
|
7,123.3 | 3,005.1 | 1,585. 3 | 929.8 | (757.0 | ) 1 | 11,886.5 | |||||||||||||||||
|
Total interest expense
|
(2,661.3 | ) | (842.5 | ) | (505.5 | ) | (231.5 | ) | (87.6 | ) | (4,328.4 | ) | ||||||||||||
|
Net interest income
|
4,462.0 | 2,162.6 | 1,079.8 | 698.3 | (844.7 | ) | 7,558.1 | |||||||||||||||||
|
Total (provisions) /reversals, net
|
(987.6 | ) | (367.8 | ) | (69.1 | ) | (113.7 | ) | (0.0 | ) | (1,538.2 | ) | ||||||||||||
|
Total fees and other services income, net
|
2,594.1 | 258.5 | 143.5 | 172.5 | (5.8 | ) | 3,162.8 | |||||||||||||||||
|
Total other operating income
|
876.0 | 391.8 | 59.3 | 8.0 | (209.8 | ) | 1,125.4 | |||||||||||||||||
|
Total operating income
|
6,944.5 | 2,445.2 | 1,213.5 | 765.1 | (1,060.3 | ) | 10,308.0 | |||||||||||||||||
|
Total operating expenses
|
(4,232.8 | ) | (1,113.0 | ) | (710.4 | ) | (487.6 | ) | (34.3 | ) | (6,578.2 | ) | ||||||||||||
|
Net operating income
|
2,711.8 | 1,332.2 | 503.1 | 277.4 | (1,094.6 | ) | 3,729.8 | |||||||||||||||||
|
Total non-operating income (expense), net
|
172.1 | 28.0 | 48.0 | 12.9 | 2.1 | 263.1 | ||||||||||||||||||
|
Income before income tax expense and non-controlling interest
|
2,883.8 | 1,360.2 | 551.1 | 290.3 | (1,092.5 | ) | 3,992.9 | |||||||||||||||||
|
Income tax expense
|
(993.5 | ) | (163.1 | ) | (184.6 | ) | (94.6 | ) | (13.3 | ) | (1,449.0 | ) | ||||||||||||
|
Income before non-controlling interest
|
1,890.3 | 1,197.1 | 366.5 | 195.7 | (1,105.7 | ) | 2,543.9 | |||||||||||||||||
|
Non-controlling interest
|
(501.7 | ) | (1.5 | ) | (0.8 | ) | (0.3 | ) | (370.8 | ) | (875.2 | ) | ||||||||||||
|
Net income attributable to shareholders
|
1,388.6 | 1,195.5 | 365.7 | 195.4 | (1,476.6 | ) | 1,668.7 | |||||||||||||||||
|
(1)
|
Includes the elimination of Banco de Occidente´s gain on the reclassification of its stake in Corficolombiana (see “—Segment results of operations for the year ended December 31, 2014 compared to the year ended December 31, 2013—Banco de Occidente”)
|
|
For the year ended December 31, 2013
|
||||||||||||||||||||||||
|
Banco de Bogotá
|
Banco de Occidente
|
Banco Popular
|
Banco AV Villas
|
Grupo Aval, its wholly owned finance subsidiaries and eliminations
|
Grupo Aval consolidated
|
|||||||||||||||||||
|
(in Ps billions)
|
||||||||||||||||||||||||
|
Total interest income
|
6,225.6 | 2,050.6 | 1,564.9 | 946.6 | (4.4 | ) | 10,783.4 | |||||||||||||||||
|
Total interest expense
|
(2,242.4 | ) | (722.5 | ) | (458.7 | ) | (223.0 | ) | (155.8 | ) | (3,802.4 | ) | ||||||||||||
|
Net interest income
|
3,983.2 | 1,328.1 | 1,106.2 | 723.6 | (160.2 | ) | 6,981.0 | |||||||||||||||||
|
Total provisions, net
|
(773.9 | ) | (320.9 | ) | (66.1 | ) | (133.3 | ) | – | (1,294.2 | ) | |||||||||||||
|
Total fees and other services income, net
|
2,254.3 | 254.7 | 147.6 | 165.6 | (7.8 | ) | 2,814.4 | |||||||||||||||||
|
Total other operating income
|
1,036.7 | 320.8 | 44.0 | 6.0 | (90.1 | ) | 1,317.4 | |||||||||||||||||
|
Total operating income
|
6,500.3 | 1,582.7 | 1,231.7 | 761.8 | (258.0 | ) | 9,818.5 | |||||||||||||||||
|
Total operating expenses
|
(3,780.1 | ) | (1,010.1 | ) | (715.9 | ) | (482.6 | ) | (39.4 | ) | (6,028.1 | ) | ||||||||||||
|
Net operating income
|
2,720.2 | 572.6 | 515.8 | 279.2 | (297.5 | ) | 3,790.4 | |||||||||||||||||
|
Total non-operating income (expense), net
|
171.2 | 12.3 | 93.4 | 3.2 | (43.9 | ) | 236.1 | |||||||||||||||||
|
Income before income tax expense and non-controlling interest
|
2,891.4 | 584.8 | 609.2 | 282.5 | (341.4 | ) | 4,026.6 | |||||||||||||||||
|
Income tax expense
|
(944.9 | ) | (155.5 | ) | (210.6 | ) | (96.4 | ) | (7.4 | ) | (1,414.7 | ) | ||||||||||||
|
Income before non-controlling interest
|
1,946.5 | 429.4 | 398.6 | 186.1 | (348.7 | ) | 2,611.9 | |||||||||||||||||
|
Non-controlling interest
|
(546.5 | ) | (1.2 | ) | (2.3 | ) | (0.0 | ) | (461.3 | ) | (1,011.4 | ) | ||||||||||||
|
Net income attributable to shareholders
|
1,400.0 | 428.2 | 396.3 | 186.1 | (810.1 | ) | 1,600.5 | |||||||||||||||||
|
Grupo Aval
|
||||||||
|
Change, December 2014 vs.
December 2013
|
||||||||
|
(in Ps billions)
|
%
|
|||||||
|
Total interest income
|
1,103.1 | 10.2 | ||||||
|
Total interest expense
|
526.0 | 13.8 | ||||||
|
Net interest income
|
577.1 | 8.3 | ||||||
|
Total provisions (reversals), net
|
244.0 | 18.9 | ||||||
|
Total fees and other services income, net
|
348.4 | 12.4 | ||||||
|
Total other operating income
|
(192.0 | ) | (14.6 | ) | ||||
|
Total operating income
|
489.5 | 5.0 | ||||||
|
Total operating expenses
|
550.1 | 9.1 | ||||||
|
Net operating income
|
(60.6 | ) | (1.6 | ) | ||||
|
Total non-operating income (expense), net
|
27.0 | 11.4 | ||||||
|
Income before income tax expense and non-controlling interest
|
(33.7 | ) | (0.8 | ) | ||||
|
Income tax expense
|
34.3 | 2.4 | ||||||
|
Income before non-controlling interest
|
(68.0 | ) | (2.6 | ) | ||||
|
Non-controlling interest
|
(136.2 | ) | (13.5 | ) | ||||
|
Net income attributable to shareholders
|
68.2 | 4.3 | ||||||
“Grupo Aval, its wholly owned finance subsidiaries and eliminations” principally comprises the following:
|
|
·
|
interest expense, which primarily reflects the cost of the bonds we have issued both in the Colombian and in the international markets at the holding company level and our wholly owned foreign financial subsidiary, Grupo Aval Limited;
|
|
|
·
|
operating results of our wholly owned foreign financial subsidiary Grupo Aval International Limited;
|
|
|
·
|
total other operating income, which reflects the elimination of intercompany dividends;
|
|
|
·
|
total operating expenses, which reflect expenses at the holding company level, net of eliminations of intercompany operating expenses; and
|
|
|
·
|
non-controlling interest, net of applicable intercompany consolidation eliminations.
|
For further information, see “Segments Disclosure” described in note 30—iv. Summary of significant differences and required U.S. GAAP disclosures—(x). Summary of significant differences and required U.S. GAAP disclosures to our audited consolidated financial statements included in this prospectus.
Grupo Aval
Overview
Our net income attributable to shareholders for the year ended December 31, 2014, as compared to the year ended December 31, 2013, increased by 4.3%, or Ps 68.2 billion, to Ps 1,668.7 billion. The increase net income attributable to shareholders was driven by:
(i) a Ps 577.1 billion increase in net interest income mainly due to a 17.3% increase in the average balance of total interest-earning assets, partially offset by a decrease in net interest margin from 6.2% to 5.8%, driven by a decreasing rate environment in Colombia which affected the average yield of our loan portfolio;
(ii) an increase in total fees and other services income, net, of Ps 348.4 billion, or 12.4%, principally due to an increase in fees from commissions from banking services, credit card merchant fees, pension fund administration fees and fees from fiduciary activities;
(iii) a decrease in non-controlling interest of Ps 136.2 billion, or 13.5%, primarily attributable to: (a) a decrease in net income from Corficolombiana, Banco de Bogotá and Banco Popular for the year ended December 31, 2014 as compared to the same period of 2013, and (b) an increase in Grupo Aval’s ownership in Banco de Bogotá (from 67.6% in December 31, 2013 to 68.7% on December 31, 2014) and in the direct and indirect ownership in Corficolombiana (from 40.9% in December 31, 2013 to 44.3% on December 31, 2014);
(iv) and an increase in non-operating income of Ps 27.0 billion driven by higher income from the sale of property plant and equipment.
The results presented above were offset by:
(i) an increase in total operating expenses of Ps 550.1 billion, or 9.1%, driven mainly by a Ps 224.4 billion increase in administrative and other expenses, a Ps 202.1 billion increase in salaries and employee
benefits, a Ps 54.8 billion increase in depreciation expense and a Ps 52.9 billion increase in goodwill amortization;
(ii) an increase in total net provision expense of Ps 244.0 billion, or 18.9%, mainly due to higher provision expense from Banco de Bogotá and Banco de Occidente driven by (a) the increase in the average balance of total gross loans and financial leases in both banks and (b) a deterioration in in the delinquency ratios from both banks mainly associated with oil related companies;
(iii) a decrease in total other operating income of Ps 192.0 billion principally due to (a) a Ps 111.1 billion decrease in income from the non-financial sector, which includes the net operating income result of non-financial companies consolidated by Banco de Bogotá (see “—Segment results of operations for the year ended December 31, 2014 compared to the year ended December 31, 2013—Banco de Bogotá”); (b) a Ps 63.2 billion decrease in gains on sales of investments in equity securities, since the result in 2013 included gain derived from Corficolombiana’s sale of some of its equity investments; and (c) a Ps 23.4 billion decrease in income from net foreign exchange and derivative operations mainly driven by two non-recurring foreign exchange events that took place during the year ended December 31, 2014 resulting from a Ps 50.8 billion net loss at Grupo Aval Limited associated to the subscription of shares in Banco de Bogotá’s equity issuance during December 2013, which opened a U.S. dollar to Colombian peso position by acquiring the peso denominated shares U.S. dollar denominated liabilities, offset in part by a Ps 29.3 billion net gain resulting from the ADR issuance of Grupo Aval, which occurred between September and October of 2014, as the issuance was made in U.S. dollars and then converted into Colombian pesos;
(iv) and finally an increase in income tax expense of Ps 34.3 billion, or 2.4%.
The following discussion describes the principal drivers of our consolidated results of operations for the years ended December 31, 2014 and 2013. Further detail is provided in the discussions of the results of operations for each of our banking subsidiaries, LB Panamá, Porvenir and Corficolombiana.
Net interest income
|
Year ended December 31,
|
Change, December 2014 vs. December 2013
|
|||||||||||||||
|
2014
|
2013
|
# |
%
|
|||||||||||||
|
(in Ps billions)
|
||||||||||||||||
|
Interest income:
|
||||||||||||||||
|
Interest on loans
|
9,674.8 | 8,606.0 | 1,068.8 | 12.4 | ||||||||||||
|
Interest on investment securities
|
1,328.9 | 1,306.9 | 22.0 | 1.7 | ||||||||||||
|
Interbank and overnight funds
|
196.3 | 190.1 | 6.2 | 3.2 | ||||||||||||
|
Financial leases
|
686.4 | 680.4 | 6.1 | 0.9 | ||||||||||||
|
Total interest income
|
11,886.5 | 10,783.4 | 1,103.1 | 10.2 | ||||||||||||
|
Interest expense:
|
||||||||||||||||
|
Checking accounts
|
(169.2 | ) | (148.0 | ) | 21.2 | 14.3 | ||||||||||
|
Time deposits
|
(1,633.0 | ) | (1,383.8 | ) | 249.2 | 18.0 | ||||||||||
|
Savings deposits
|
(1,284.3 | ) | (1,093.0 | ) | 191.3 | 17.5 | ||||||||||
|
Total interest expense on deposits
|
(3,086.5 | ) | (2,624.8 | ) | 461.7 | 17.6 | ||||||||||
|
Borrowings from banks and others
|
(398.8 | ) | (395.6 | ) | 3.1 | 0.8 | ||||||||||
|
Interbank and overnight funds (expenses)
|
(184.9 | ) | (160.8 | ) | 24.1 | 15.0 | ||||||||||
|
Long-term debt (bonds)
|
(658.2 | ) | (621.1 | ) | 37.0 | 6.0 | ||||||||||
|
Total interest expense
|
(4,328.4 | ) | (3,802.4 | ) | 526.0 | 13.8 | ||||||||||
|
Net interest income
|
7,558.1 | 6,981.0 | 577.1 | 8.3 | ||||||||||||
Our net interest income increased by 8.3%, or Ps 577.1 billion, to Ps 7,558.1 billion for the year ended December 31, 2014, reflecting a Ps 1,103.1 billion, or 10.2%, increase in interest income partially offset by a Ps 526.0 billion, or 13.8%, increase in total interest expense.
Interest income on loans and financial leases increased by 11.6%, or Ps 1,074.9 billion, from Ps 9,286.3 billion for the year ended December 31, 2013 to Ps 10,361.2 billion for the year ended December 31, 2014. This increase was achieved through a 19.7%, or Ps 16,563.1 billion, increase in the average balance of interest-earning loans and
financial leases (driven by a combination of organic growth, inorganic growth from the Central American acquisitions and the impact of the devaluation of the peso), partially offset by a decrease in the average yield earned on loans and financial leases of 75 basis points from 11.1% to 10.3%, which reflected (i) a competitive and decreasing interest-rate environment in Colombia, where the average DTF rate decreased from 4.24% for the year ended December 31, 2013 to 4.07% for the year ended December 31, 2014 (the DTF rate is the 90-day time deposit benchmark interest rate in Colombia and the rate most commonly used by Colombian banks to index the majority of their domestic interest-earning assets and interest-bearing liabilities), and (ii) a slight change in the mix in the loan and financial leases portfolio from December 31, 2013 to December 31, 2014 in favor of commercial loans mainly due to the effect of the Central American acquisitions.
Grupo Aval’s average balance of loans and financial leases, excluding LB Panamá’s operations, increased by 13.3%, or Ps 9,275.7 billion, to Ps 78,888.2 billion for the year ended December 31, 2014, which is consistent with growth in the Colombian economy and the financial services sector. Our balance of commercial loans in Colombia (including financial leases) increased by Ps 5,511.1 billion, or 10.4%, our balance of consumer loans increased by Ps 2,595.8 billion, or 12.6%, and our balance of mortgage loans increased by Ps 1,025.6 billion, or 54.6%, due to the fact that our local banks continued their focus on boosting their mortgage loan book. LB Panamá’s average balance of loans and financial leases, in turn, increased by 50.8% (driven by a combination of inorganic growth from the Central American acquisitions, organic growth in local currency and impact of the devaluation of the peso), or Ps 7,287.4 billion, to Ps 21,625.1 billion. LB Panamá’s commercial loans (including financial leases) increased by Ps 2,841.5 billion, or 32.0%, its consumer loans increased by Ps 2,769.3 billion, or 38.8% and its mortgage loans increased by Ps 1,488.9 billion, or 32.1%. Excluding the effect of devaluation, LB Panamá’s commercial loans (including financial leases), consumer loans and its mortgage loans would have increased by 6.3%, 11.8% and 6.4% in the year ended December 31, 2014, respectively.
The yield of the loans and financial leases portfolio of our Colombian operations decreased by 73 basis points from 10.8% for the year ended December 31, 2013 to 10.0% for the year ended December 31, 2014, and the yield for LB Panamá’s operations decreased from 12.5% to 11.3%. The change in the average yield for LB Panamá was primarily the result of a change in the mix in the loan and financial leases portfolio as the Central American acquisitions carried a higher component of commercial loans than BAC Credomatic’s traditional loan portfolio.
Interest income from investment securities increased by Ps 22.0 billion to Ps 1,328.9 billion for the year ended December 31, 2014. The increase in income was driven by a 12.6% increase in the average balance of investment securities from Ps 24,972.6 billion for the year ended December 31, 2013 to Ps 28,133.1 billion for the year ended December 31, 2014, offset in part by a decrease in the average yield from 5.2% for the year ended December 31, 2013 to 4.7% for the year ended December 31, 2014. As of December 31, 2013 and 2014 the fixed income portfolio represented 86.3% and 85.8% of our total investment securities, respectively.
Under Colombian Banking GAAP, interest income from investment securities includes accrued interest on debt instruments, valuation adjustments and gains (losses) realized on debt and equity securities that are accounted for as “available for sale,” gains (losses) on repurchase transactions (i.e., repos), gains (losses) realized on the sale of debt securities, and mark-to-market gains (losses) on the trading securities portfolio.
Interest income from our fixed income portfolio increased by 5.0%, or Ps 57.6 billion, to Ps 1,200.9 billion for the year ended December 31, 2014 (accounting for 90.4% of interest income from investment securities). The increase in interest income from our fixed income portfolio was mainly driven an increase in the average balance of our fixed income portfolio. This increase was partially offset by a decrease in the average yield mainly driven by (i) an increase in fixed income securities rates in Colombia during 2014 due to an increase in the interest rate on the Colombian Treasury Bond due 2024, which is a benchmark for tracking the movement of fixed income rates; and (ii) a strategic decision to rebalance the fixed income portfolio reducing the trading portion of the portfolio, while increasing the available for sale portion of the portfolio. As per local accounting standards only the trading portfolio´s changes in value are shown in the income statement. As of December 31, 2013, 25.8% of the fixed-income portfolio was classified as trading but as of December 31, 2014 this percentage decreased to 14.1%. As a consequence, a smaller portion of the valuation changes were reflected income statement during the year ended December 31, 2014 than in the same period of 2013.
The income yielded by Grupo Aval’s equity securities portfolio for the year ended December 31, 2014 totaled Ps 128.0 billion (equivalent to 9.6% of our total income from investment securities) as compared to Ps 163.6 billion for the year ended December 31, 2013 (equivalent to 12.5% of our total income from investment securities). This
Ps 35.6 billion decrease was mainly explained by a net negative result of movements in valuation of our non-consolidated equity investments (see “—Segment results of operations for the year ended December 31, 2014 compared to the year ended December 31, 2013—Banco de Bogotá—Banco de Bogotá subsidiary analysis—Corficolombiana”).
Interest income from interbank and overnight funds increased by Ps 6.2 billion to Ps 196.3 billion for the year ended December 31, 2014 as a result of an increase in the average yield from 6.8% to 8.1%, offset in part by a 12.6% decrease in the average balance.
Total interest expense increased by Ps 526.0 billion, or 13.8%, to Ps 4,328.4 billion for the year ended December 31, 2014 mainly driven by a Ps 19,683.1 billion, or 19.3%, increase in the average balance of interest-bearing liabilities (due to organic growth, inorganic growth from the Central American acquisitions and the impact of the devaluation of the peso), offset in part by a decrease of 17 basis points in the average cost of funds from 3.7% for the year ended December 31, 2013 to 3.6% for the year ended December 31, 2014. Total interest expense for our interest-bearing deposits Ps 461.7 billion, or 17.6%, to Ps 3,086.5 billion for the year ended December 31, 2014 mainly driven by a Ps 17,026.0 billion, or 22.6%, increase in the average balance of interest-bearing deposits, offset in part by a decrease of 14 basis points in the average cost of funds from 3.5% for the year ended December 31, 2013 to 3.3% for the year ended December 31, 2014. The decreases in the average rate for both our interest-bearing liabilities and our interest-bearing deposits were mainly driven by a decreasing interest rate environment in Colombia in which the average DTF also decreased by 17 basis points during the same period.
Total interest expense for our operations, excluding LB Panamá, increased by Ps 200.5 billion, or 6.2%, to Ps 3,457.1 billion, driven by a 12.1%, or Ps 10,216.9 billion, increase in the average balance of interest-bearing liabilities, partially offset by a 21 basis points decrease in the average cost of funds from 3.9% for the year ended December 31, 2013 to 3.7% for the year ended December 31, 2014. Total interest expense for LB Panamá’s operations, net of intercompany eliminations, increased by Ps 325.5 billion, or 59.6%, to Ps 871.3 billion, driven by a 52.3%, or Ps 9,466.3 billion, increase in the average balance of total interest-bearing liabilities (driven by a combination of inorganic growth from the Central American acquisitions, organic growth and the impact of the devaluation of the peso) and an increase in the average cost of funds from 3.0% for the year ended December 31, 2013 to 3.2% for the year ended December 31, 2014. Excluding the impact of the devaluation of the peso, the average balance of total interest-bearing liabilities increased by 41.8% in the year ended December 31, 2014.
On a consolidated basis, interest paid on time deposits increased by 18.0%, or Ps 249.2 billion, to Ps 1,633.0 billion, reflecting a Ps 7,365.8 billion, or 25.3%, increase in their average balance to Ps 36,437.8 billion, which resulted in a Ps 304.5 billion increase in interest expense. This increase was partially offset by a 28 basis points decrease in the average rate paid from 4.8% to 4.5%, which resulted in a Ps 55.3 billion decrease in interest expense.
Interest paid on savings deposits increased by Ps 191.3 billion, or 17.5%, to Ps 1,284.3 billion, reflecting a Ps 7,286.9 billion, or 19.5%, increase in the average balance of savings deposits to Ps 44,605.4 billion, which contributed to a Ps 203.0 billion increase in interest expense, offset in part by a 5 basis points decrease in the average interest rate paid from 2.93% to 2.88%, which contributed to a Ps 11.7 billion decrease in interest expense.
Interest paid on interest-bearing checking accounts increased by Ps 21.2 billion, or 14.3%, to Ps 169.2 billion reflecting a Ps 2,373.4 billion, or 26.8%, increase in their average balance to Ps 11,244.9 billion, which resulted in a Ps 33.4 billion increase in interest expense, partially offset by a 16 basis points decrease in their average cost from 1.7% to 1.5%, which contributed to a Ps 12.3 billion decrease in interest expense.
Within the sources of funding other than deposits, interest paid for long-term debt (bonds) increased by Ps 37.0 billion to Ps 658.2 billion for the year ended December 31, 2014, due to a Ps 382.6 billion increase in the average balance and a 14 basis points increase in the average rate paid from 5.6% to 5.8%. Interest paid for interbank and overnight funds increased by Ps 24.1 billion to Ps 184.9 billion for the year ended December 31, 2014, driven by a 23 basis points increase in the average interest rate of interbank and overnight funds from 2.9% to 3.1% and a Ps 368.5 billion increase in the average balance. Interest paid on borrowings from banks and others increased by Ps 3.1 billion to Ps 398.8 billion for the year ended December 31, 2014 due to a Ps 1,906.0 billion increase in the average balance, offset in part by a 57 basis points decrease in the average interest rate paid from 3.8% to 3.2%.
Our average interest-earning assets increased by 17.3% to Ps 131,076.7 billion for the year ended December 31, 2014, from Ps 111,704.4 billion for the year ended December 31, 2013, while our average interest-bearing liabilities
increased by 19.3% to Ps 121,922.7 billion for the year ended December 31, 2014 from Ps 102,239.6 billion for the year ended December 31, 2013, which resulted in a slight decrease in the ratio of average interest-earning assets to average interest-bearing liabilities from 1.09x as of December 31, 2013 to 1.08x as of December 31, 2014.
The average yield earned on our interest-earning assets decreased from 9.7% for the year ended December 31, 2013 to 9.1% for the year ended December 31, 2014, mainly driven by the decrease in the yields earned on our loans and financial leases portfolio and in our investment securities portfolio. The average cost of our interest-bearing liabilities decreased from 3.7% for the year ended December 31, 2013 to 3.6% for the year ended December 31, 2014, mainly driven by the decrease in the average cost of total deposits from 3.5% to 3.3%. The spread between the average yield on loans and financial leases and the average cost of total deposits decreased from 7.6% for the year ended December 31, 2013 to 7.0% for the year ended December 31, 2014. LB Panamá’s spread between the average rate on loans and financial leases and the average rate paid on deposits decreased from 9.8% to 8.5% during 2013, mainly due to the change in the mix of the loans and financial leases portfolio (see “—Segment results of operations for the year ended December 31, 2014 compared to the year ended December 31, 2013—Banco de Bogotá—Banco de Bogotá subsidiary analysis—LB Panamá—Net interest income”).
Finally, and because of what was described above, our net interest margin decreased from 6.2% for the year ended December 31, 2013 to 5.8% for the year ended December 31, 2014.
Provisions
Our total net provision expense increased by Ps 244.0 billion, or 18.9%, to Ps 1,538.2 billion for the year ended December 31, 2014. This increase was mainly attributable to an increase in net provision expense for loans and financial leases of Ps 219.3 billion, or 16.7%, to Ps 1,532.9 billion for the year ended December 31, 2014, a Ps 38.3 billion increase in net provisions for accrued interest and other receivables to Ps 142.1 billion for the year ended December 31, 2014 and a Ps 27.4 billion increase in net provision expense for foreclosed assets and other assets to Ps 52.4 billion for the year ended December 31, 2014. These increases were partially offset by a Ps 41.1 billion increase in the recovery of charged-off assets to Ps 189.2 billion for the year ended December 31, 2014.
The increase in net provision expense for loans and financial leases was mainly driven by an increase in net provision expense in Banco de Bogotá of Ps 173.7 billion, Banco de Occidente Ps 43.7 billion, and Banco Popular Ps 3.1 billion, driven by an increase in the balance of loans and financial leases and a slight deterioration in credit quality (further explained in “—Segment results of operations for the year ended December 31, 2014 compared to the year ended December 31, 2013—Banco de Bogotá—Provisions”; in “—Segment results of operations for the year ended December 31, 2014 compared to the year ended December 31, 2013—Banco de Occidente—Provisions”; and in “—Segment results of operations for the year ended December 31, 2014 compared to the year ended December 31, 2013—Banco Popular—Provisions”).
Our delinquency ratio, measured as loans at least 31 days past due as a percentage of total gross loans, increased from 2.4% as of December 31, 2013 to 2.6% as of December 31, 2014, and our delinquency ratio, measured as loans classified as C, D and E as a percentage of total gross loans, increased from 3.5% as of December 31, 2013 to 4.0% as of December 31, 2014. Our ratio of net provisions for loans and financial leases losses to average loans and financial leases remained basically unchanged at 1.5% for both the year ended December 31, 2013 and the year ended December 31, 2014.
The increase in our delinquency ratio, measured as loans classified as C, D and E as a percentage of total gross loans, was mainly driven by the adoption of Colombian Banking GAAP risk and scoring models by Banco BAC de Panamá and Banco Reformador in December 2014, which resulted in an increase in the delinquency ratio for LB Panamá’s operation from 4.6% for the year ended December 31, 2013 to 6.1% for the year ended December 31, 2014. The delinquency ratio for our operations, excluding LB Panamá’s operation, increased from 3.2% for the year ended December 31, 2013 to 3.4% for the year ended December 31, 2014.
Our delinquency ratio, measured as loans at least 31 days past due as a percentage of total gross loans, increased due to an increase in our total loans and financial leases more than 31 days past due from Ps 2,305.0 billion to Ps 2,914.9 billion, reflecting a Ps 610.0 billion, or 26.5%, increase. This increase was the result of a Ps 326.9 billion increase in our commercial past due loans, a Ps 174.6 billion increase in our consumer past due loans, a Ps 69.5 billion increase in our past due financial leases, and a Ps 33.9 billion increase in our mortgage past due loans. Our delinquency ratio for our commercial loans, which represent 55.7% of our total gross loans as of December 31,
2014, increased from 1.3% to 1.7% mainly driven by a deterioration of our Colombian portfolio, our delinquency ratio for our consumer loans, which represent 29.4% of total gross loans as of December 31, 2014, decreased from 4.2% to 4.0%; our delinquency ratio for our mortgages, which represent 8.0% of our total gross loans as of December 31, 2014, decreased from 3.5% to 2.9%; and our delinquency ratio for our financial leases, which represent 6.6% of our total gross loans as of December 31, 2014, increased from 2.4% to 3.2% mainly driven by a deterioration of our Colombian portfolio. The deterioration in the delinquency ratios for our commercial loans and our financial leases from our Colombian portfolio was mainly associated with oil related companies. On a consolidated basis, 2.1% of our total loan portfolio corresponds to mining products and oil.
Excluding LB Panamá, our total loans and financial leases more than 30 days past due increased from Ps 1,764.7 billion to Ps 2,200.3 billion, reflecting a Ps 435.6 billion, or 24.7%, increase. This increase was the result of a Ps 258.1 billion increase in our commercial past due loans, a Ps 79.1 billion increase in our consumer past due loans, a Ps 68.7 billion increase in our past due financial leases, and a Ps 24.7 billion increase in our mortgage past due loans. In our Colombian operations, the delinquency ratio for our commercial loans, which represent 60.7% of our total gross loans as of December 31, 2014, increased from 1.4% to 1.7%; our delinquency ratio for our consumer loans, which represent 27.4% of total gross loans as of December 31, 2014, decreased from 4.2% to 4.1%; our delinquency ratio for our financial leases, which represent 8.1% of our total gross loans as of December 31, 2014, increased from 2.5% to 3.4%; and our delinquency ratio for our mortgages, which represent 3.4% of our total gross loans as of December 31, 2014, decreased from 3.3% to 3.0%. As mentioned above, the deterioration in the delinquency ratios for our commercial loans and our financial leases was mainly associated with oil related companies.
Total loans and financial leases more than 30 days past due for LB Panamá’s operation increased from Ps 540.3 billion to Ps 714.6 billion, reflecting a Ps 174.4 billion, or 32.3%, increase driven by the impact of the recent acquisitions. This increase was the result of a Ps 95.5 billion increase in consumer past due loans, a Ps 68.8 billion increase in commercial past due loans and a Ps 9.3 billion increase in mortgage past due loans. The delinquency ratio for commercial loans, which represent 40.4% of total gross loans as of December 31, 2014, increased from 1.1% to 1.4% as the risk profile of the central American acquisitions was of a lesser quality than BAC Credomatic´s. The delinquency ratio for consumer loans, which represent 35.7% of LB Panamá’s total gross loans as of December 31, 2014, decreased from 3.9% to 3.8%, and the delinquency ratio for mortgages, which represent 22.1% of LB Panamá’s total gross loans as of December 31, 2014, decreased from 3.6% to 2.9%.
The delinquency ratio for Banco de Bogotá increased slightly from 2.3% to 2.4%, the delinquency ratio for Banco de Occidente increased from 2.4% to 3.0%, the delinquency ratios for Banco Popular and Banco AV Villas remained unchanged at 2.1% and 3.8%, respectively. Banco AV Villas continues to show the highest delinquency ratio, which reflects a higher exposure to mortgage and traditional consumer loans. While Banco AV Villas’ mortgage and consumer loans represent 63.5% of total loans, Banco de Occidente and Banco de Bogotá’s exposure to such loans represent 35.4% and 25.5% of total loans, respectively. Although Banco Popular’s mortgage and consumer loans represent 53.3% of total loans, most of its consumer loans are payroll loans and thus have a low delinquency ratio.
Banco de Occidente’s delinquency ratio was the most deteriorated as its commercial loan and financial lease portfolio have a higher exposure to oil related companies.
For the year ended December 31, 2014, charge-offs increased by Ps 374.7 billion to Ps 1,304.9 billion. Our ratio of charge-offs to average loans increased by 19 basis points from 1.1% to 1.3%. The increase in charge-offs was mainly driven by an increase in the charge-offs from our consumer portfolio. The ratio of charge-offs to average loans, excluding LB Panamá’s operation, increased from 1.1% to 1.2%, while the ratio increased from 1.2% to 1.4% for LB Panamá’s operation.
Our allowance for loan and financial leases losses increased by Ps 340.6 billion to Ps 3,413.7 at December 31, 2014. Our coverage ratio (defined as our allowance for loans and financial leases losses to loans and financial leases at least 31 days past due) was 117.1% at December 31, 2014.
Net provision expense for accrued interest and other receivables increased by Ps 38.3 billion to Ps 142.1 billion driven by a Ps 40.5 billion increase from Banco de Bogotá and its consolidated subsidiaries (further explained in “—Segment results of operations for the year ended December 31, 2014 compared to the year ended December 31, 2013—Banco de Bogotá”).
Net provision expense for foreclosed assets and other assets increased by Ps 27.4 billion to Ps 52.4 billion driven a Ps 20.3 billion increase in Banco de Bogotá, a Ps 4.8 billion increase in Banco de Occidente and a Ps 3.7 billion increase in Banco AV Villas (further explained in “—Segment results of operations for the year ended December 31, 2014 compared to the year ended December 31, 2013—Banco de Bogotá”; “—Segment results of operations for the year ended December 31, 2014 compared to the year ended December 31, 2013—Banco de Occidente” and “—Segment results of operations for the year ended December 31, 2014 compared to the year ended December 31, 2013—Banco AV Villas”).
The recovery of charged-off assets increased by Ps 41.1 billion to Ps 189.2 billion for the year ended December 31, 2014. The ratio of recovery of charged-off assets to average loans and financial leases remained unchanged at 0.2% for both the years ended December 31, 2013 and 2014.
Total fees and other services income, net
|
Year ended December 31,
|
Change, December 2014 vs. December 2013
|
|||||||||||||||
|
2014
|
2013
|
# |
%
|
|||||||||||||
|
(in Ps billions)
|
||||||||||||||||
|
Fees and other services income:
|
||||||||||||||||
|
Commissions from banking services
|
1,794.0 | 1,546.0 | 248.0 | 16.0 | ||||||||||||
|
Branch network services
|
31.0 | 27.9 | 3.2 | 11.5 | ||||||||||||
|
Credit card merchant fees
|
459.8 | 414.0 | 45.8 | 11.1 | ||||||||||||
|
Checking fees
|
66.1 | 66.5 | (0.4 | ) | (0.7 | ) | ||||||||||
|
Warehouse services
|
194.4 | 188.5 | 5.9 | 3.1 | ||||||||||||
|
Fiduciary activities
|
217.1 | 204.6 | 12.6 | 6.1 | ||||||||||||
|
Pension plan administration
|
754.1 | 722.2 | 31.9 | 4.4 | ||||||||||||
|
Other
|
220.9 | 190.0 | 30.8 | 16.2 | ||||||||||||
|
Total fees and other services income
|
3,737.4 | 3,359.6 | 377.8 | 11.2 | ||||||||||||
|
Fees and other services expenses
|
(574.7 | ) | (545.3 | ) | 29.4 | 5.4 | ||||||||||
|
Total fees and other services income, net
|
3,162.8 | 2,814.4 | 348.4 | 12.4 | ||||||||||||
Total fees and other services income, net, increased by 12.4% to Ps 3,162.8 billion for the year ended December 31, 2014 as compared to the same period in 2013 due to a Ps 377.8 billion increase in total fees and other services income offset in part by a Ps 29.4 billion increase in fees and other services expense. Of the Ps 348.4 billion increase in total fees and other services income, net, Ps 193.9 billion is explained by LB Panamá and Ps 154.5 billion is explained by Grupo Aval’s operation excluding LB Panamá.
Of the Ps 193.9 billion increase in total fees and other services income, net for LB Panamá, Ps 52.0 billion, or 26.8%, was attributable to an increase in the average exchange rate used to translate LB Panamá’s financial statements from U.S. dollars to Colombian pesos. The average exchange rate increased from Ps 1,879.53 per U.S.$1.00 for 2013 to Ps 2,017.85 per U.S.$1.00 for the 2014 financial statements. In the absence of the impact of this increase in the average exchange rate, LB Panamá’s total fees and other services income, net would have increased by 17.7%, or Ps 142.0 billion. This Ps 142.0 billion increase was driven by a Ps 130.0 billion increase in commissions from banking services, a Ps 8.4 billion increase in other fees and a Ps 4.1 billion increase in credit card and merchant fees. These increases were driven by the organic and inorganic growth of the business.
The Ps 154.5 billion increase in total fees and other services income, net for Grupo Aval’s operation excluding LB Panamá was mainly driven by (i) a 8.0%, or Ps 81.1 billion, increase in commissions from banking services, (ii) a 4.9% or Ps 34.4 billion increase in fees from pension plan administration (as further explained in “—Segment results of operations for the year ended December 31, 2014 compared to the year ended December 31, 2013—Banco de Bogotá subsidiary analysis—Porvenir”), (iii) an increase of Ps 26.9 billion, or 13.8%, in fees from credit card and merchant fees, mainly driven by an increase in the number of credit cards issued, (iv) an increase of Ps 17.7, or 14.2%, in other fee income, (v) an increase in fees from fiduciary activities of Ps 12.6 billion, or 6.1%, mainly as a result of better operating performance from Grupo Aval’s fiduciary subsidiaries, and (vi) an increase in fees from warehouse services of Ps 5.9 billion, or 3.1%, mainly as a result of better operating performance from Grupo Aval’s warehouse subsidiaries. These increases were partially offset by a Ps 26.8 billion, or 5.8%, increase in fees and other services expenses.
Other operating income
|
Year ended December 31,
|
Change, December 2014 vs. December 2013
|
|||||||||||||||
|
2014
|
2013
|
# |
%
|
|||||||||||||
|
(in Ps billions)
|
||||||||||||||||
|
Foreign exchange gains (losses), net
|
1,283.9 | 344.6 | 939.3 | 272.6 | ||||||||||||
|
Gains (losses) on derivative operations, net
|
(1,002.2 | ) | (39.4 | ) | (962.8 | ) | 2,441.4 | |||||||||
|
Gains on sales of investments in equity securities, net
|
33.2 | 96.4 | (63.2 | ) | (65.5 | ) | ||||||||||
|
Income from non-financial sector, net
|
329.5 | 440.5 | (111.1 | ) | (25.2 | ) | ||||||||||
|
Dividend income
|
298.5 | 326.4 | (28.0 | ) | (8.6 | ) | ||||||||||
|
Other
|
182.5 | 148.9 | 33.6 | 22.6 | ||||||||||||
|
Total other operating income
|
1,125.4 | 1,317.4 | (192.0 | ) | (14.6 | ) | ||||||||||
Total other operating income decreased by 14.6%, or Ps 192.0 billion, to Ps 1,125.4 billion for the year ended December 31, 2014. This decrease was primarily due to a Ps 111.1 billion decrease in income from the non-financial sector, which reflected the net operating income result of non-financial companies consolidated by Banco de Bogotá. Ps 83.4 billion of such decrease resulted from a change in the presentation of Megalínea’s results (Megalínea is a services and technology outsourcing company of Banco de Bogotá) as in 2013 its operating expenses were recorded in the operating expense line item, while in 2014 they were recorded as an expense on the income from non-financial sector, net line item. Income from the non-financial companies of Corficolombiana’s consolidated companies decreased by Ps 24.5 billion, mainly driven by a lower net operating income from Epiandes (Ps 95.3 billion) as 2013 was the last year in which deferred revenues related to government payments associated with the reduction of the term of the concession were recorded, offset in part by higher net operating income from Episol (38.5 billion), Hoteles Estelar (Ps 12.6 billion), Pisa (Ps 9.3 billion), Valora (Ps 4.8 billion), Lehner (Ps 3.1 billion), and Gas Comprimido del Perú (Ps 2.4 billion) (further explained in “—Banco de Bogotá subsidiary analysis—Corficolombiana”).
Also contributing to the decrease in other operating income was a Ps 63.2 billion decrease in gains on sales of investments in equity securities to Ps 33.2 billion for the year ended December 31, 2014, since the result in 2013 included a Ps 89.3 billion gain derived from Corficolombiana’s sale of 3.6% of its ownership interest in Banco de Occidente in 2013, and reflects the recognition of a gain on the valuation recorded by Corficolombiana in 2010, which was in turn eliminated at the Grupo Aval level as it consolidates Banco de Occidente’s results. As Corficolombiana sold the shares of Banco de Occidente in open market transactions, the historical elimination is reversed and thus the gain is recorded.
Dividend income decreased Ps 28.0 billion from Ps 326.4 billion for the year ended December 31, 2013 to Ps 298.5 billion for the year ended December 31, 2014, mainly driven by a Ps 79.5 billion decrease in dividend income from Promigas during the year ended December 31, 2014, offset in part by a Ps 45.9 billion increase in dividend income from EEB, a Ps 3.9 billion increase in in dividend income from Gas Natural and a Ps 3.2 billion increase in dividend income from Aerocali (further explained in “—Banco de Bogotá subsidiary analysis—Corficolombiana”). The decrease in the dividend income from Promigas occurred since in 2013 Corficolombiana benefited from the management’s decision of changing from yearly assemblies to bi-yearly assemblies. As such, during 2013 Promigas declared dividends for the full year of 2012 and the first half of 2013. In contrast, during 2014, Promigas declared dividends for the second half of 2013 and the first half of 2014.
Income from net foreign exchange and derivative operations decreased by Ps 23.4 billion from 305.2 billion for the year ended December 31, 2013 to Ps 281.7 billion for the year ended December 31, 2014, driven by the aforementioned two non-recurring foreign exchange events at Grupo Aval. See “—Results of Operations for the Year Ended December 31, 2014 Compared to the Year Ended December 31, 2013—Grupo Aval.”
Partially offsetting these decreases was a 22.6%, or Ps 33.6 billion, increase in other operating income to Ps 182.5 billion for the year ended December 31, 2014. This increase was mainly driven by a 21.2%, or Ps 31.8 billion, increase in other operating income from Banco de Occidente due to higher income from operating leases.
Operating expenses
|
Year ended December 31,
|
Change, December 2014 vs. December 2013
|
|||||||||||||||
|
2014
|
2013
|
# |
%
|
|||||||||||||
|
(in Ps billions)
|
||||||||||||||||
|
Salaries and employee benefits
|
(2,380.8 | ) | (2,178.8 | ) | 202.1 | 9.3 | ||||||||||
|
Bonus plan payments
|
(113.1 | ) | (122.2 | ) | (9.1 | ) | (7.4 | ) | ||||||||
|
Termination payments
|
(29.4 | ) | (19.3 | ) | 10.1 | 52.2 | ||||||||||
|
Administrative and other expenses
|
(3,277.7 | ) | (3,053.3 | ) | 224.4 | 7.3 | ||||||||||
|
Deposit security, net
|
(225.5 | ) | (215.2 | ) | 10.3 | 4.8 | ||||||||||
|
Charitable and other donation expenses
|
(11.3 | ) | (6.6 | ) | 4.6 | 69.4 | ||||||||||
|
Depreciation
|
(373.8 | ) | (318.9 | ) | 54.8 | 17.2 | ||||||||||
|
Goodwill amortization
|
(166.7 | ) | (113.7 | ) | 52.9 | 46.6 | ||||||||||
|
Total operating expenses
|
(6,578.2 | ) | (6,028.1 | ) | 550.1 | 9.1 | ||||||||||
Total operating expenses increased by 9.1%, or Ps 550.1 billion, to Ps 6,578.2 billion in the year ended December 31, 2014. Of the Ps 550.1 billion increase in total operating expense, Ps 418.3 billion is explained by LB Panamá and Ps 131.8 billion is explained by Grupo Aval’s operation excluding LB Panamá.
Of the Ps 418.3 billion increase in total operating expense from LB Panamá, Ps 94.9 billion, or 22.7%, was attributable to an increase in the average exchange rate used to translate LB Panamá’s financial statements from U.S. dollars to Colombian pesos. The average exchange rate increased from Ps 1,879.53 per U.S.$1.00 for 2013 to Ps 2,017.85 per U.S.$1.00 for the 2014 financial statements. In the absence of the impact of this increase in the average exchange rate, LB Panamá’s operating expenses would have increased by 22.2%, or Ps 323.5 billion. This Ps 323.5 billion increase was driven by a Ps 150.5 billion increase in salaries and employee benefits and a Ps 121.7 billion increase in administrative and other expenses principally driven by the organic and inorganic growth of the business. Also contributing to the increase in operating expenses were a Ps 35.3 billion increase in goodwill amortizations, associated to Central American acquisitions, and a Ps 10.8 billion increase in depreciation expense.
The Ps 131.8 billion increase in total operating expense for Grupo Aval’s operation excluding LB Panamá was mainly driven by a 2.5%, or Ps 62.9 billion, increase in administrative and other expenses, and a 0.7% or Ps 10.9 billion increase in salaries and employee benefits. These increases are associated with the organic growth of the business and its personnel.
Other factors contributing to the increase in total operating expenses for Grupo Aval’s operation excluding LB Panamá were: (i) a Ps 40.0 billion increase in depreciation expense mainly from leasing operations and computer equipment; and (ii) a Ps 13.6 billion increase in goodwill amortization expense associated with the acquisitions of Horizonte and the acquisitions of additional ownership interests by Grupo Aval in Banco de Bogotá and Banco de Occidente.
While our efficiency ratio calculated as operating expenses before depreciation and amortization divided by operating income before provision expense deteriorated from 50.4% for the year ended December 31, 2013 to 51.0% for the year ended December 31, 2014, the ratio of operating expenses before depreciation and amortization as a percentage of average assets improved from 4.1% for the year ended December 31, 2013 to 3.7% for the year ended December 31, 2014.
Non-operating income
Total net non-operating income for the year ended December 31, 2014 was Ps 263.1 billion, which represents a Ps 27.0 billion increase from total net non-operating income of Ps 236.1 billion for the year ended December 31, 2013. This increase was mainly driven by an increase in total non-operating income from Banco de Occidente and Banco AV Villas (further explained in “—Segment results of operations for the year ended December 31, 2014 compared to the year ended December 31, 2013—Banco de Occidente” and “—Segment results of operations for the year ended December 31, 2014 compared to the year ended December 31, 2013—Banco AV Villas”).
Income tax expense
Our income tax expense increased by 2.4% to Ps 1,449.0 billion for the year ended December 31, 2014. Our effective tax rate increased from 35.1% for the year ended December 31, 2013 to 36.3% for the year ended December 31, 2014 as a result of an increase in the effective tax rates of LB Panamá and Corficolombiana (further explained in “—Banco de Bogotá subsidiary analysis—Leasing Bogotá Panamá” and in “—Banco de Bogotá subsidiary analysis—Corficolombiana”).
Non-controlling interest
The value of our non-controlling interest decreased by 13.5% from Ps 1,011.4 billion for the year ended December 31, 2013 to Ps 875.2 billion for the year ended December 31, 2014. This decrease was mainly explained by a decrease in net income from Corficolombiana, Banco de Bogotá and Banco Popular for the year ended December 31, 2014 as compared to the same period of 2013. Also contributing to the decrease in non-controlling interest was an increase in Grupo Aval’s direct ownership in Banco de Bogotá (from 67.6% in December 31, 2013 to 68.7% on December 31, 2014) and in the direct and indirect ownership in Corficolombiana (from 40.9% in December 31, 2013 to 44.3% on December 31, 2014). Our ratio of non-controlling interest to net income before non-controlling interest decreased from 38.7% to 34.4% from the year ended December 31, 2013 to the year ended December 31, 2014.
Results of Operations for the Year Ended December 31, 2013 Compared to the Year Ended December 31, 2012
The following tables present our consolidated results of operations for the year ended December 31, 2013, as compared to the year ended December 31, 2012, broken down among our four banking subsidiaries, adjusted to reflect our wholly owned finance subsidiaries and intercompany eliminations, and our contribution as the holding company.
|
For the year ended December 31, 2013
|
||||||||||||||||||||||||
|
Banco de Bogotá
|
Banco de Occidente
|
Banco Popular
|
Banco AV Villas
|
Grupo Aval, its wholly owned finance subsidiaries and eliminations
|
Grupo Aval consolidated
|
|||||||||||||||||||
|
(in Ps billions)
|
||||||||||||||||||||||||
|
Total interest income
|
6,225.6 | 2,050.6 | 1,564.9 | 946.6 | (4.4 | ) | 10,783.4 | |||||||||||||||||
|
Total interest expense
|
(2,242.4 | ) | (722.5 | ) | (458.7 | ) | (223.0 | ) | (155.8 | ) | (3,802.4 | ) | ||||||||||||
|
Net interest income
|
3,983.2 | 1,328.1 | 1,106.2 | 723.6 | (160.2 | ) | 6,981.0 | |||||||||||||||||
|
Total (provisions) /reversals, net
|
(773.9 | ) | (320.9 | ) | (66.1 | ) | (133.3 | ) | – | (1,294.2 | ) | |||||||||||||
|
Total fees and other services income, net
|
2,254.3 | 254.7 | 147.6 | 165.6 | (7.8 | ) | 2,814.4 | |||||||||||||||||
|
Total other operating income
|
1,036.7 | 320.8 | 44.0 | 6.0 | (90.1 | ) | 1,317.4 | |||||||||||||||||
|
Total operating income
|
6,500.3 | 1,582.7 | 1,231.7 | 761.8 | (258.0 | ) | 9,818.5 | |||||||||||||||||
|
Total operating expenses
|
(3,780.1 | ) | (1,010.1 | ) | (715.9 | ) | (482.6 | ) | (39.4 | ) | (6,028.1 | ) | ||||||||||||
|
Net operating income
|
2,720.2 | 572.6 | 515.8 | 279.2 | (297.5 | ) | 3,790.4 | |||||||||||||||||
|
Total non-operating income (expense), net
|
171.2 | 12.3 | 93.4 | 3.2 | (43.9 | ) | 236.1 | |||||||||||||||||
|
Income before income tax expense and non-controlling interest
|
2,891.4 | 584.8 | 609.2 | 282.5 | (341.4 | ) | 4,026.6 | |||||||||||||||||
|
Income tax expense
|
(944.9 | ) | (155.5 | ) | (210.6 | ) | (96.4 | ) | (7.4 | ) | (1,414.7 | ) | ||||||||||||
|
Income before non-controlling interest
|
1,946.5 | 429.4 | 398.6 | 186.1 | (348.7 | ) | 2,611.9 | |||||||||||||||||
|
Non-controlling interest
|
(546.5 | ) | (1.2 | ) | (2.3 | ) | (0.0 | ) | (461.3 | ) | (1,011.4 | ) | ||||||||||||
|
Net income attributable to shareholders
|
1,400.0 | 428.2 | 396.3 | 186.1 | (810.1 | ) | 1,600.5 | |||||||||||||||||
|
For the year ended December 31, 2012
|
||||||||||||||||||||||||
|
Banco de Bogotá
|
Banco de Occidente
|
Banco Popular
|
Banco AV Villas
|
Grupo Aval, its wholly owned finance subsidiaries and eliminations
|
Grupo Aval consolidated
|
|||||||||||||||||||
|
(in Ps billions)
|
||||||||||||||||||||||||
|
Total interest income
|
5,698.5 | 2,028.6 | 1,613.2 | 868.5 | (3.8 | ) | 10,205.0 | |||||||||||||||||
|
Total interest expense
|
(2,188.8 | ) | (745.5 | ) | (554.9 | ) | (254.2 | ) | (151.3 | ) | (3,894.7 | ) | ||||||||||||
|
Net interest income
|
3,509.7 | 1,283.2 | 1,058.3 | 614.3 | (155.2 | ) | 6,310.3 | |||||||||||||||||
|
Total provisions, net
|
(515.1 | ) | (223.6 | ) | (90.7 | ) | (88.0 | ) | (0.0 | ) | (917.3 | ) | ||||||||||||
|
Total fees and other services income, net
|
1,883.7 | 229.0 | 145.0 | 159.4 | (35.1 | ) | 2,382.0 | |||||||||||||||||
|
Total other operating income
|
676.3 | 332.7 | 48.9 | 4.2 | (176.5 | ) | 885.7 | |||||||||||||||||
|
Total operating income
|
5,554.6 | 1,621.3 | 1,161.6 | 690.0 | (366.8 | ) | 8,660.6 | |||||||||||||||||
|
Total operating expenses
|
(3,198.6 | ) | (937.2 | ) | (669.2 | ) | (455.7 | ) | (38.7 | ) | (5,299.5 | ) | ||||||||||||
|
Net operating income
|
2,356.0 | 684.0 | 492.4 | 234.3 | (405.5 | ) | 3,361.1 | |||||||||||||||||
|
Total non-operating income (expense), net
|
314.9 | 12.9 | 77.1 | 16.2 | 26.9 | 448.1 | ||||||||||||||||||
|
Income before income tax expense and non-controlling interest
|
2,670.9 | 697.0 | 569.5 | 250.5 | (378.6 | ) | 3,809.2 | |||||||||||||||||
|
Income tax expense
|
(919.3 | ) | (174.7 | ) | (187.7 | ) | (78.0 | ) | (12.1 | ) | (1,371.7 | ) | ||||||||||||
|
Income before non-controlling interest
|
1,751.6 | 522.3 | 381.8 | 172.5 | (390.7 | ) | 2,437.4 | |||||||||||||||||
|
Non-controlling interest
|
(425.6 | ) | (2.0 | ) | (3.8 | ) | (0.2 | ) | (479.5 | ) | (911.1 | ) | ||||||||||||
|
Net income attributable to shareholders
|
1,326.0 | 520.3 | 377.9 | 172.3 | (870.2 | ) | 1,526.4 | |||||||||||||||||
|
Grupo Aval
|
||||||||
|
Change, December 2013 vs. December 2012
|
||||||||
|
(in Ps billions)
|
%
|
|||||||
|
Total interest income
|
578.4 | 5.7 | ||||||
|
Total interest expense
|
(92.3 | ) | (2.4 | ) | ||||
|
Net interest income
|
670.7 | 10.6 | ||||||
|
Total provisions (reversals), net
|
376.9 | 41.1 | ||||||
|
Total fees and other services income, net
|
432.3 | 18.1 | ||||||
|
Total other operating income
|
431.7 | 48.7 | ||||||
|
Total operating income
|
1,157.9 | 13.4 | ||||||
|
Total operating expenses
|
728.6 | 13.7 | ||||||
|
Net operating income
|
429.3 | 12.8 | ||||||
|
Total non-operating income (expense), net
|
(211.9 | ) | (47.3 | ) | ||||
|
Income before income tax expense and non-controlling interest
|
217.4 | 5.7 | ||||||
|
Income tax expense
|
42.9 | 3.1 | ||||||
|
Income before non-controlling interest
|
174.4 | 7.2 | ||||||
|
Non-controlling interest
|
100.3 | 11.0 | ||||||
|
Net income attributable to shareholders
|
74.1 | 4.9 | ||||||
“Grupo Aval, its wholly owned finance subsidiaries and eliminations” principally comprises the following:
|
|
·
|
interest expense, which primarily reflects the cost of the bonds we have issued both in the Colombian and in the international markets at the holding company level and our wholly owned foreign financial subsidiary, Grupo Aval Limited;
|
|
|
·
|
operating results of our wholly owned foreign financial subsidiary Grupo Aval International Limited;
|
|
|
·
|
total other operating income, which reflects the elimination of intercompany dividends;
|
|
|
·
|
total operating expenses, which reflect expenses at the holding company level, net of eliminations of intercompany operating expenses; and
|
|
|
·
|
non-controlling interest, net of applicable intercompany consolidation eliminations.
|
For further information, see “Segments Disclosure” described in note 30—iv. Summary of significant differences and required U.S. GAAP disclosures—(x) to our audited consolidated financial statements included in this prospectus.
Grupo Aval
Overview
Our net income attributable to shareholders for the year ended December 31, 2013, as compared to the year ended December 31, 2012, increased by 4.9%, or Ps 74.1 billion, to Ps 1,600.5 billion, primarily due to:
|
|
(i)
|
an increase of Ps 670.7 billion in net interest income mainly due to a 14.4% increase in the average balance of total interest-earning assets, partially offset by a slight decrease in net interest margin from 6.5% to 6.2%, which was consistent with the decreasing rate environment in Colombia;
|
|
|
(ii)
|
an increase in total fees and other services income, net, of Ps 432.3 billion (Horizonte’s operation accounted for Ps 170.2 billion of the increase in total fees and other services income), or 18.1%, principally due to an increase in fees from pension fund administration, commissions from banking services and credit card merchant fees; and
|
|
|
(iii)
|
an increase in total other operating income of Ps 431.7 billion principally due to income from Banco de Bogotá and its consolidated subsidiaries (see “—Segment results of operations for the year ended December 31, 2013 compared to the year ended December 31, 2012—Banco de Bogotá—Banco de Bogotá subsidiary analysis—Corficolombiana”).
|
These effects were partially offset by:
|
|
(i)
|
an increase in total operating expenses of Ps 728.6 billion (Horizonte’s operation accounted for Ps 130.2 billion of this increase), or 13.7%;
|
|
|
(ii)
|
an increase in total net provisions of Ps 376.9 billion, or 41.1%, mainly due to higher provisions for loans and financial leases in 2013 than in 2012;
|
|
|
(iii)
|
a decrease of Ps 211.9 billion, or 47.3%, in total non-operating income, primarily due to lower income from Banco de Bogotá and its consolidated subsidiaries (see “—Segment results of operations for the year ended December 31, 2013 compared to the year ended December 31, 2012—Banco de Bogotá—Banco de Bogotá subsidiary analysis—Corficolombiana”) and to a consolidation adjustment in Grupo Aval associated with Banco de Bogotá’s investment in Corficolombiana;
|
|
|
(iv)
|
an increase in non-controlling interest of Ps 100.3 billion, or 11.0%, primarily attributable to Corficolombiana’s increase in net income for the period (see “—Segment results of operations for the year ended December 31, 2013 compared to the year ended December 31, 2012—Banco de Bogotá—Banco de Bogotá subsidiary analysis—Corficolombiana”); and
|
|
|
(v)
|
an increase in income tax expense of Ps 42.9 billion, or 3.1%.
|
The Central American acquisitions that closed in December 2013 had minimal impact on Grupo Aval’s balance sheet, as they accounted for only 4.3% (2.0% for Grupo Reformador and 2.3% for Banco BAC de Panamá) of Grupo Aval’s consolidated assets as of December 31, 2013, and had no material effect on the income statement as each of their results for the month ended December 31, 2013 were recorded as retained earnings on Grupo Aval’s balance sheet.
Horizonte was acquired on April 18, 2013 and merged with Porvenir on December 31, 2013 (for further details see “Item 4. Information on the Company—A. History and development of the company—Our company”). This acquisition impacted the total fees and other services income, net, and the total operating expenses line items.
The following discussion describes the principal drivers of our consolidated results of operations for the years ended December 31, 2013 and 2012. Further detail is provided in the discussions of the results of operations for each of our banking subsidiaries, LB Panamá, Porvenir and Corficolombiana.
Net Interest Income
|
Year ended December 31,
|
Change, December 2013 vs. December 2012
|
|||||||||||||||
|
2013
|
2012
|
# |
%
|
|||||||||||||
|
(in Ps billions)
|
||||||||||||||||
|
Interest income:
|
||||||||||||||||
|
Interest on loans
|
8,606.0 | 8,046.0 | 560.0 | 7.0 | ||||||||||||
|
Interest on investment securities
|
1,306.9 | 1,299.0 | 8.0 | 0.6 | ||||||||||||
|
Interbank and overnight funds
|
190.1 | 206.8 | (16.7 | ) | (8.1 | ) | ||||||||||
|
Financial leases
|
680.4 | 653.2 | 27.2 | 4.2 | ||||||||||||
|
Total interest income
|
10,783.4 | 10,205.0 | 578.4 | 5.7 | ||||||||||||
|
Interest expense:
|
||||||||||||||||
|
Checking accounts
|
(148.0 | ) | (159.2 | ) | (11.2 | ) | (7.1 | ) | ||||||||
|
Time deposits
|
(1,383.8 | ) | (1,396.1 | ) | (12.3 | ) | (0.9 | ) | ||||||||
|
Savings deposits
|
(1,093.0 | ) | (1,094.0 | ) | (1.0 | ) | (0.1 | ) | ||||||||
|
Total interest expense on deposits
|
(2,624.8 | ) | (2,649.3 | ) | (24.5 | ) | (0.9 | ) | ||||||||
|
Borrowings from banks and others
|
(395.6 | ) | (473.4 | ) | (77.7 | ) | (16.4 | ) | ||||||||
|
Interbank and overnight funds (expenses)
|
(160.8 | ) | (228.3 | ) | (67.5 | ) | (29.6 | ) | ||||||||
|
Long-term debt (bonds)
|
(621.1 | ) | (543.7 | ) | 77.4 | 14.2 | ||||||||||
|
Total interest expense
|
(3,802.4 | ) | (3,894.7 | ) | (92.3 | ) | (2.4 | ) | ||||||||
|
Net interest income
|
6,981.0 | 6,310.3 | 670.7 | 10.6 | ||||||||||||
Our net interest income increased by 10.6%, or Ps 670.7 billion, to Ps 6,981.0 billion for the year ended December 31, 2013, reflecting a Ps 587.2 billion increase in interest income from loans and financial leases and a Ps 92.3 billion decrease in total interest expense.
The Ps 587.2 billion, or 6.7%, increase in interest on loans and financial leases in 2013 was achieved through a 14.9%, or Ps 10,891.2 billion, increase in the average balance of interest-earning loans and financial leases, partially offset by a decrease in the average yield earned on loans and financial leases of 85 basis points from 11.9% to 11.1%, primarily reflecting a decreasing interest-rate environment in Colombia, where the average DTF rate decreased by 111 basis points from 5.35% for the year ended December 31, 2012 to 4.24% for the year ended December 31, 2013. The DTF rate is the 90-day time deposit benchmark interest rate in Colombia and the rate most commonly used by Colombian banks to index the majority of their domestic interest-earning assets and interest-bearing liabilities.
Grupo Aval’s average balance of interest-earning loans and financial leases, excluding LB Panamá’s operations, increased by 13.0%, or Ps 8,019.3 billion, to Ps 69,612.5 billion during 2013, which is consistent with growth in the Colombian economy and the financial services sector. Our year-end balance of commercial loans in Colombia (including financial leases) increased by Ps 5,523.3 billion, or 11.6%, our year-end balance of consumer loans increased by Ps 2,029.7 billion, or 10.9%, and our year-end balance of mortgage loans increased by Ps 806.6 billion, or 75.2%, due to the fact Banco de Bogotá and Banco de Occidente re-launched their mortgage loan strategy during 2013. LB Panamá’s average balance of interest-earning loans and financial leases, in turn, increased by 25.0%, or Ps 2,871.9 billion, to Ps 14,337.7 billion. Excluding the Central American acquisitions, LB Panamá’s year-end commercial loans (including financial leases) increased by Ps 1,343.7 billion, or 29.4% during 2013, and its year-end consumer loans increased by Ps 1,358.7 billion, or 28.7%. The yield of the loans and financial leases portfolio of our Colombian operations decreased by 96 basis points from 11.7% for the year ended December 31, 2012 to 10.8% for the year ended December 31, 2013, reflecting the decreasing interest rate environment described above, and the yield for LB Panamá’s operations decreased from 12.9% to 12.5%. The change in the average yield for LB
Panamá was primarily the result of a change in the mix in the loans and financial leases portfolio, excluding the Central American acquisitions, as commercial loans (including financial leases) as a proportion of total gross loans increased from 36.3% as of December 31, 2012 to 37.3% as of December 31, 2013. Consumer and mortgage loans as an aggregate proportion of total gross loans, and which in comparison to commercial loans have a higher yield, decreased from 63.7% as of December 31, 2012 to 62.7% as of December 31, 2013.
Also contributing to the increase in total interest income was a Ps 8.0 billion increase in interest income from investment securities to Ps 1,306.9 billion for the year ended December 31, 2013. Under Colombian Banking GAAP, interest income from investment securities includes accrued interest on debt instruments, valuation adjustments and gains (losses) realized on debt and equity securities that are accounted for as “available for sale,” gains (losses) on repurchase transactions (i.e., repos), gains (losses) realized on the sale of debt securities, and mark-to-market gains (losses) on the trading securities portfolio.
Interest income from our fixed income portfolio decreased by 5.6% to Ps 1,143.3 billion for the year ended December 31, 2013 (accounting for 87.5% of interest income from investment securities). The decrease in interest income from our fixed income portfolio was driven by a decrease in the average yield earned that resulted from an increase in rates payable on fixed income securities in Colombia during the second and third quarters of 2013, by 26 and 137 basis points, respectively, due to an increase in the interest rate on the 10-year Colombian Treasury Bond, which is a benchmark for tracking the movement of fixed income rates. The decrease in the average yield earned was partially offset by an increase in the average balance of our fixed income portfolio. The balance of our net fixed income portfolio increased by Ps 3,858.1 billion (Ps 2,828.4 in peso denominated investments and Ps 1,029.7 billion in foreign currency denominated investments), or 19.6%, to Ps 23,572.1 billion for the year ended December 31, 2013. The decrease in income from our fixed income portfolio was mainly attributable to Banco de Occidente and Banco Popular, as income from their respective consolidated fixed income portfolios decreased by Ps 49.0 billion and Ps 25.1 billion for the year ended December 31, 2013 (further explained in “—Segment results of operations for the year ended December 31, 2013 compared to the year ended December 31, 2012—Banco de Occidente—Net interest income” and in “—Segment results of operations for the year ended December 31, 2013 compared to the year ended December 31, 2012—Banco Popular—Net interest income”).
The income yielded by Grupo Aval’s equity securities portfolio for the year ended December 31, 2013 totaled Ps 163.6 billion (equivalent to 12.5% of our total income from investment securities) as compared to Ps 88.1 billion for the year ended December 31, 2012 (equivalent to 6.8% of our total income from investment securities). This Ps 75.6 billion increase was mainly explained by a positive net result of movements in income valuation of Corficolombiana’s investments for the year ended December 31, 2013, partially offset by a negative net result of movements in income valuation of Porvenir’s mandatory investments for the year ended December 31, 2013 (further explained in “—Segment results of operations for the year ended December 31, 2013 compared to the year ended December 31, 2012—Banco de Bogotá subsidiary analysis—Corficolombiana—Net interest income” and in “—Segment results of operations for the year ended December 31, 2013 compared to the year ended December 31, 2012—Banco de Bogotá subsidiary analysis—Porvenir—Net interest income”).
Interest income from interbank and overnight funds decreased by Ps 16.7 billion to Ps 190.1 billion for the year ended December 31, 2013 as a result of a 10.1% decrease in the average balance, offset in part by an increase in the average yield from 6.7% to 6.8%.
Total interest expense decreased by Ps 92.3 billion, or 2.4%, to Ps 3,802.4 billion for the year ended December 31, 2013 mainly due to a decrease of 77 basis points in the average cost of funds from 4.5% for the year ended December 31, 2012 to 3.7% for the year ended December 31, 2013, consistent with a decreasing interest rate environment in Colombia, partially offset by a Ps 15,557.3 billion, or 17.9%, increase in the average balance of interest-bearing liabilities. Total interest expense for our operations, excluding LB Panamá, decreased by Ps 214.1 billion, or 6.2%, to Ps 3,256.6 billion, driven by a 97 basis points decrease in the average cost of funds from 4.8% for the year ended December 31, 2012 to 3.9% for the year ended December 31, 2013, offset in part by a Ps 12,455.9 billion increase in the average balance of interest-bearing liabilities. Total interest expense for LB Panamá’s operations, net of intercompany eliminations, increased by Ps 121.9 billion, or 28.7%, to Ps 545.8 billion, driven by a Ps 3,101.3 billion increase in the average balance of total interest-bearing liabilities and a 19 basis points increase in the average cost of funds from 2.8% during the year ended December 31, 2012 to 3.0% during the year ended December 31, 2013. The increase in the average cost of funding for LB Panamá’s operations was mainly driven by a change in LB Panamá’s funding mix (further explained in “—Segment results of operations for the year
ended December 31, 2013 compared to the year ended December 31, 2012—Banco de Bogotá—Banco de Bogotá subsidiary analysis”).
Interest paid on time deposits decreased by Ps 12.3 billion, or 0.9%, to Ps 1,383.8 billion, reflecting a 64 basis points decrease in the average interest rate paid from 5.4% to 4.8%, which contributed to a Ps 157.7 billion decrease in interest expense offset in part by a Ps 3,229.8 billion, or 12.5%, increase in the average balance of time deposits to Ps 29,072.1 billion, which contributed to a Ps 145.4 billion increase in interest expense.
Interest paid on interest-bearing checking accounts decreased by Ps 11.2 billion to Ps 148.0 billion, reflecting a 34 basis points decrease in their average cost from 2.0% to 1.7%, which contributed to a Ps 41.3 billion decrease in interest expense, partially offset by a Ps 959.8 billion, or 12.1%, increase in their average balance to Ps 8,871.6 billion, which resulted in a Ps 30.1 billion increase in interest expense.
Interest paid on savings deposits slightly decreased by Ps 1.0 billion to Ps 1,093.0 billion, reflecting a 79 basis points decrease in the average rate paid from 3.7% to 2.9%, which resulted in a Ps 238.0 billion decrease in interest expense. This increase was almost entirely offset by a Ps 7,894.8 billion, or 26.8%, increase in their average balance to Ps 37,318.6 billion, which resulted in a Ps 237.0 billion increase in interest expense.
Growth in the average balance of deposits was the result of higher funding requirements for the growth of the loans and financial leases portfolio of Grupo Aval consolidated.
Within the sources of funding other than deposits, interest paid on borrowings from banks and others decreased by Ps 77.7 billion to Ps 395.6 billion for the year ended December 31, 2013 due to a 94 basis points decrease in the average interest rate paid from 4.8% to 3.8%, offset in part by a Ps 410.9 billion increase in the average balance. Interest paid for interbank and overnight funds decreased by Ps 67.5 billion to Ps 160.8 billion for the year ended December 31, 2013, driven by a 145 basis points decrease in the average interest rate of interbank and overnight funds from 4.3% to 2.9%, partially offset by a Ps 318.8 billion increase in the average balance. Interest paid for long-term debt (bonds) increased by Ps 77.4 billion to Ps 621.1 billion for the year ended December 31, 2013, due to a Ps 2,743.2 billion increase in the average balance, offset in part by a 93 basis points decrease in the average rate paid from 6.6% to 5.6%.
Our average interest-earning assets increased by 14.4% to Ps 111,704.4 billion in the year ended December 31, 2013 from Ps 97,614.5 billion in the year ended December 31, 2012, while our average interest-bearing liabilities increased by 17.9% to Ps 102,239.6 billion in the year ended December 31, 2013 from Ps 86,682.4 billion in the year ended December 31, 2012, which resulted in a slight decrease in the ratio of average interest-earning assets to average interest-bearing liabilities from 1.13x as of December 31, 2012 to 1.09x as of December 31, 2013.
The average yield earned on our interest-earning assets decreased from 10.5% for the year ended December 31, 2012 to 9.7% for the year ended December 31, 2013, mainly driven by the decrease in the yields earned on our loans and financial leases portfolio and in our investment securities portfolio. The average cost of our interest-bearing liabilities decreased from 4.5% for the year ended December 31, 2012 to 3.7% for the year ended December 31, 2013, mainly driven by the decrease in the average cost of total deposits, which decreased from 4.2% to 3.5%. The spread between the average yield on loans and financial leases and the average cost of total deposits slightly decreased from 7.7% for the year ended December 31, 2012 to 7.6% for the year ended December 31, 2013 as our liabilities repriced faster than our loans and financial leases because of the competitive landscape in Colombia. LB Panamá’s spread between the average rate on loans and financial leases and the average rate paid on deposits decreased from 10.5% to 9.8% during 2013, mainly due to the change in the mix of the loans and financial leases portfolio (see “—Segment results of operations for the year ended December 31, 2013 compared to the year ended December 31, 2012—Banco de Bogotá—Banco de Bogotá subsidiary analysis—LB Panamá—Net interest income”).
Finally, our net interest margin decreased from 6.5% for the year ended December 31, 2012 to 6.2% for the year ended December 31, 2013.
Provisions
Our total net provisions increased by Ps 376.9 billion, or 41.1%, to Ps 1,294.2 billion for the year ended December 31, 2013. This increase was mainly attributable to higher net provisions for loans and financial leases, which increased by Ps 350.2 billion, or 36.4%, to Ps 1,313.6 billion for the year ended December 31, 2013. This
increase was driven by (i) an increase in the balance of loans and financial leases, particularly in consumer loans and mortgage loans which, by regulation, require more provisions; and (ii) a deterioration in the credit quality of our consumer loans portfolio. The Central American acquisitions had no relevant impact on our net provision expense.
Our delinquency ratio, measured as loans at least 30 days past due as a percentage of total gross loans, slightly increased from 2.3% as of December 31, 2012 to 2.4% as of December 31, 2013 (excluding the Central American acquisitions, it remained basically unchanged at 2.3% for both the years ended December 31, 2012 and 2013) and our ratio of net provisions for loans and financial leases losses to average loans and financial leases increased from 1.3% for the year ended December 31, 2012 to 1.5% for the year ended December 31, 2013 (10 basis points below our five year average of 1.6%).
Excluding the Central American acquisitions, our total loans and financial leases more than 30 days past due increased from Ps 1,828.3 billion to Ps 2,113.4 billion, reflecting a Ps 285.1 billion, or 15.6%, increase. This increase was the result of a Ps 217.7 billion, or 24.5% increase in our consumer past due loans, a Ps 48.8 billion, or 8.0% increase in our commercial past due loans, a Ps 21.4 billion, or 14.3% increase in our past due financial leases, and a Ps 2.7 billion, or 1.9% decrease in our mortgage past due loans. Our delinquency ratio for our commercial loans, which represent 56.6% of our total gross loans as of December 31, 2013, remained unchanged at 1.3% as of December 31, 2012 and 2013; our delinquency ratio for our consumer loans, which represent 29.2% of total gross loans as of December 31, 2013, increased from 3.8% to 4.1%; our delinquency ratio for our financial leases, which represent 7.6% of our total gross loans as of December 31, 2013, increased from 2.3% to 2.4%; our delinquency ratio for our mortgages, which represent 6.2% of our total gross loans as of December 31, 2013, decreased from 3.3% to 2.5%.
The delinquency ratio for Banco de Bogotá increased slightly from 2.1% to 2.3% (2.1% excluding the Central American acquisitions), the delinquency ratio for Banco de Occidente decreased slightly from 2.5% to 2.4%, the delinquency ratio for Banco Popular remained unchanged at 2.1%, and the delinquency ratio for Banco AV Villas increased slightly from 3.7% to 3.8%. Banco AV Villas continues to show the highest delinquency ratio, which reflects a higher exposure to mortgage and traditional consumer loans. While Banco AV Villas’ mortgage and consumer loans represent 61.0% of total loans, Banco de Occidente and Banco de Bogotá’s exposure to such loans represent 22.2% and 33.2% of total loans, respectively. Although Banco Popular’s mortgage and consumer loans represent 54.7% of total loans, most of its consumer loans are payroll loans and thus have a low delinquency ratio.
For the year ended December 31, 2013, charge-offs increased by Ps 217.0 billion to Ps 930.1 billion. Our ratio of charge-offs to average loans increased by 13 basis points from 1.0% to 1.1%. The 1.1% ratio for 2013 was below our five year average of 1.2%.
Our allowance for loan and financial leases losses increased by Ps 527.5 billion to Ps 3,073.0 at December 31, 2013 (Ps 120.1 billion of this increase corresponds to the allowance for loans and financial lease losses from our Central American acquisitions, with the remainder principally due to higher new provisions). Our coverage ratio (defined as our allowance for loans and financial leases losses to loans and financial leases at least 31 days past due) remained strong at 133.3% at December 31, 2013 versus 139.2% at December 31, 2012.
Net provisions for accrued interest and other receivables (which includes accrued interest from past due performing loans) increased by Ps 25.4 billion to Ps 103.8 billion, and the recovery of charged-off assets increased by Ps 5.5 billion to Ps 148.2 billion for the year ended December 31, 2013.
Total Fees and Other Services Income, Net
|
Year ended December 31,
|
Change, December 2013 vs. December 2012
|
|||||||||||||||
|
2013
|
2012
|
# |
%
|
|||||||||||||
|
(in Ps billions)
|
||||||||||||||||
|
Fees and other services income:
|
||||||||||||||||
|
Commissions from banking services
|
1,546.0 | 1,377.6 | 168.5 | 12.2 | ||||||||||||
|
Branch network services
|
27.9 | 27.4 | 0.4 | 1.5 | ||||||||||||
|
Credit card merchant fees
|
414.0 | 355.9 | 58.0 | 16.3 | ||||||||||||
|
Checking fees
|
66.5 | 71.9 | (5.4 | ) | (7.5 | ) | ||||||||||
|
Warehouse services
|
188.5 | 174.7 | 13.8 | 7.9 | ||||||||||||
|
Fiduciary activities
|
204.6 | 178.4 | 26.1 | 14.6 | ||||||||||||
|
Pension plan administration(1)
|
722.2 | 486.5 | 235.6 | 48.4 | ||||||||||||
|
Other
|
190.0 | 171.6 | 18.5 | 10.8 | ||||||||||||
|
Total fees and other services income
|
3,359.6 | 2,844.2 | 515.5 | 18.1 | ||||||||||||
|
Fees and other services expenses(1)
|
(545.3 | ) | (462.1 | ) | 83.1 | 18.0 | ||||||||||
|
Total fees and other services income, net
|
2,814.4 | 2,382.0 | 432.3 | 18.1 | ||||||||||||
|
(1)
|
Horizonte’s operations accounted for Ps 204.5 billion in income from pension plan administration fees and Ps 34.3 billion in total fees and other service expenses.
|
Total fees and other services income, net, increased by 18.1% to Ps 2,814.4 billion for the year ended December 31, 2013 as compared to the same period in 2012. Horizonte’s operations accounted for Ps 170.2 billion of this increase (Ps 204.5 billion in pension plan administration fees netted by Ps 34.3 billion in fees and other services expense).
Excluding Horizonte’s impact, total fees and other services income, net, increased by 11.0%, or Ps 262.1 billion, to Ps 2,644.1 billion for the year ended December 31, 2013. The main drivers of the increase in fees and other services income were (i) an increase of Ps 168.5 billion, or 12.2%, to Ps 1,546.0 billion in fees from commissions from banking services, (ii) an increase of Ps 58.0 billion, or 16.3%, to Ps 414.0 billion in fees from credit card and merchant fees, mainly driven by an increase in the number of credit cards, (iii) an increase of Ps 31.1 billion, or 6.4%, to Ps 517.6 billion in fees from pension plan administration (as further explained in “—Segment results of operations for the year ended December 31, 2013 compared to the year ended December 31, 2012—Banco de Bogotá subsidiary analysis—Porvenir”), (iv) an increase in fees from fiduciary activities of Ps 26.1 billion, or 14.6%, to Ps 204.6 billion mainly as a result of better operating performance from Grupo Aval’s fiduciary subsidiaries, and (v) an increase in fees from warehouse services of Ps 13.8 billion, or 7.9%, to Ps 188.5 billion mainly as a result of better operating performance from Grupo Aval’s warehouse subsidiaries.
Other Operating Income
|
Year ended December 31,
|
Change, December 2013 vs. December 2012
|
|||||||||||||||
|
2013
|
2012
|
# |
%
|
|||||||||||||
|
(in Ps billions)
|
||||||||||||||||
|
Foreign exchange gains (losses), net
|
344.6 | (35.0 | ) | 379.6 | 1,084.0 | |||||||||||
|
Gains (losses) on derivative operations, net
|
(39.4 | ) | 214.9 | (254.4 | ) | (118.3 | ) | |||||||||
|
Gains on sales of investments in equity securities, net
|
96.4 | 10.7 | 85.7 | 800.5 | ||||||||||||
|
Income from non-financial sector, net
|
440.5 | 386.0 | 54.6 | 14.1 | ||||||||||||
|
Dividend income
|
326.4 | 98.9 | 227.5 | 229.9 | ||||||||||||
|
Other
|
148.9 | 210.1 | (61.3 | ) | (29.2 | ) | ||||||||||
|
Total other operating income
|
1,317.4 | 885.7 | 431.7 | 48.7 | ||||||||||||
Total other operating income increased by 48.7%, or Ps 431.7 billion, to Ps 1,317.4 billion for the year ended December 31, 2013. This increase was primarily due to a Ps 227.5 billion increase in dividend income from Ps 98.9 billion for the year ended December 31, 2012 to Ps 326.4 billion for the year ended December 31, 2013, mainly driven by a Ps 272.0 billion increase in dividend income from Promigas S.A.E.S.P, or “Promigas,” during 2013, offset in part by a Ps 58.5 billion decrease in dividends received from CFC Limited and CFC Gas Holding SAS, each of which holds interests in Promigas but did not declare dividends in 2013 (further explained in “—Segment results of operations for the year ended December 31, 2013 compared to the year ended December 31, 2012—Banco de Bogotá—Banco de Bogotá subsidiary analysis—Corficolombiana”).
Also contributing to the increase in other operating income was a Ps 125.2 billion increase in net foreign exchange and derivative operations to Ps 305.2 billion for the year ended December 31, 2013. This increase was
explained by higher income from net foreign exchange and derivative operations in Banco de Bogotá and its consolidated subsidiaries (further explained in “—Segment results of operations for the year ended December 31, 2013 compared to the year ended December 31, 2012—Banco de Bogotá—Banco de Bogotá subsidiary analysis”).
The Ps 85.7 billion increase in gains on sales of investments in equity securities to Ps 96.4 billion for the year ended December 31, 2013 was due to a Ps 89.3 billion gain derived from Corficolombiana’s sale of 3.6% of its ownership interest in Banco de Occidente in 2013, and reflects the recognition of a gain on the valuation recorded by Corficolombiana in 2010, which was in turn eliminated at the Grupo Aval level as it consolidates Banco de Occidente’s results. As Corficolombiana sold the shares of Banco de Occidente in open market transactions, the historical elimination is reversed and thus the gain is recorded.
Income from the non-financial sector, which reflected the net operating income result of non-financial companies consolidated by Corficolombiana, increased by Ps 54.6 billion driven by higher net operating income from Corficolombiana’s toll road concession companies, which include Estudios Proyectos e Inversiones de los Andes, S.A., or “Epiandes,” (Ps 29.7 billion), Episol (Ps 27.4 billion) and Proyectos de Infraestructura S.A., or “Pisa,” (Ps 8.3 billion) (further explained in “—Segment results of operations for the year ended December 31, 2013 compared to the year ended December 31, 2012—Banco de Bogotá—Banco de Bogotá subsidiary analysis—Corficolombiana”).
Partially offsetting these increases was a Ps 61.3 billion decrease in other operating income to Ps 148.9 billion for the year ended December 31, 2013 mainly driven by lower income from joint venture from Grupo Aval’s fiduciary subsidiaries for the year ended December 31, 2013.
Operating Expenses
|
Year ended December 31,
|
Change, December 2013 vs. December 2012
|
|||||||||||||||
|
2013
|
2012
|
# |
%
|
|||||||||||||
|
(in Ps billions)
|
||||||||||||||||
|
Salaries and employee benefits
|
(2,178.8 | ) | (1,927.5 | ) | 251.2 | 13.0 | ||||||||||
|
Bonus plan payments
|
(122.2 | ) | (95.1 | ) | 27.1 | 28.5 | ||||||||||
|
Termination payments
|
(19.3 | ) | (21.5 | ) | (2.2 | ) | (10.3 | ) | ||||||||
|
Administrative and other expenses
|
(3,053.3 | ) | (2,667.6 | ) | 385.7 | 14.5 | ||||||||||
|
Deposit security, net
|
(215.2 | ) | (185.3 | ) | 29.9 | 16.2 | ||||||||||
|
Charitable and other donation expenses
|
(6.6 | ) | (12.7 | ) | (6.1 | ) | (47.8 | ) | ||||||||
|
Depreciation
|
(318.9 | ) | (296.6 | ) | 22.3 | 7.5 | ||||||||||
|
Goodwill amortization
|
(113.7 | ) | (93.1 | ) | 20.6 | 22.1 | ||||||||||
|
Total operating expenses
|
(6,028.1 | ) | (5,299.5 | ) | 728.6 | 13.7 | ||||||||||
|
Horizonte
|
Grupo Aval Excluding Horizonte
|
|||||||||||||||||||
|
Year ended December 31,
|
Year ended
December 31,
|
Change, December 2013 vs. December 2012
|
||||||||||||||||||
|
2013
|
2013
|
2012
|
# |
%
|
||||||||||||||||
|
(in Ps billions)
|
||||||||||||||||||||
|
Salaries and employee benefits
|
(45.6 | ) | (2,133.2 | ) | (1,927.5 | ) | 205.6 | 10.7 | ||||||||||||
|
Bonus plan payments
|
(12.2 | ) | (110.0 | ) | (95.1 | ) | 15.0 | 15.7 | ||||||||||||
|
Termination payments
|
(0.3 | ) | (19.0 | ) | (21.5 | ) | (2.5 | ) | (11.7 | ) | ||||||||||
|
Administrative and other expenses
|
(68.7 | ) | (2,984.7 | ) | (2,667.6 | ) | 317.0 | 11.9 | ||||||||||||
|
Deposit security, net
|
– | (215.2 | ) | (185.3 | ) | 29.9 | 16.2 | |||||||||||||
|
Charitable and other donation expenses
|
(0.9 | ) | (5.8 | ) | (12.7 | ) | (7.0 | ) | (54.8 | ) | ||||||||||
|
Depreciation
|
(2.5 | ) | (316.4 | ) | (296.6 | ) | 19.8 | 6.7 | ||||||||||||
|
Goodwill amortization
|
– | (113.7 | ) | (93.1 | ) | 20.6 | 22.1 | |||||||||||||
|
Total operating expenses
|
(130.2 | ) | (5,897.9 | ) | (5,299.5 | ) | 598.4 | 11.3 | ||||||||||||
Total operating expenses increased by 13.7%, or Ps 728.6 billion, to Ps 6,028.1 billion in the year ended December 31, 2013. Horizonte’s operations accounted for Ps 130.2 billion, or 17.9%, of this increase.
Excluding Horizonte’s impact, total operating expenses for the year ended December 31, 2013 increased by 11.3%, or Ps 598.4 billion, to Ps 5,897.9 billion. This increase was primarily due to a Ps 317.0 billion, or 11.9%, rise in administrative and other expenses, a Ps 205.6 billion, or 10.7%, increase in salaries and employee benefits, and a Ps 15.0 billion, or 15.7%, increase in bonus plan payments. These increases are associated with the organic growth of the business and its personnel. Between December 31, 2012 and December 31, 2013, the number of people employed by Grupo Aval and its consolidated subsidiaries increased by 4,830, or 8.1%, from 59,406 to 64,236 (excluding the Central American acquisitions).
Other factors contributing to the increase in our total operating expenses, excluding Horizonte, were: (i) a Ps 29.9 billion increase in deposit security expense (FOGAFIN) driven by an increase in our consolidated average balance of deposits; (ii) a Ps 20.6 billion increase in goodwill amortization expense associated with the Horizonte acquisition and the acquisitions of additional ownership interests by Grupo Aval in Banco de Bogotá and Banco de Occidente in 2013; and (iii) a Ps 19.8 billion increase in depreciation expense mainly from leasing operations and computer equipment.
Our efficiency ratio improved from 51.3% to 50.4% as a result of the 14.0% increase in our total operating expenses before depreciation and amortization and the 16.0% increase in our operating income before net provisions. The ratio of operating expenses before depreciation and amortization as a percentage of average assets improved from 4.2% for the year ended December 31, 2012 to 4.1% for the year ended December 31, 2013. Excluding Horizonte, our efficiency ratio improved from 51.3% to 50.0%.
Non-Operating Income
Total net non-operating income for the year ended December 31, 2013 was Ps 236.1 billion, which represents a Ps 211.9 billion decrease from total net non-operating income of Ps 448.1 billion for the year ended December 31, 2012. The higher total net non-operating income in 2012 was in part due to non-recurring income from leaseback operations by Hoteles Estelar S.A., or “Hoteles Estelar,” and Pizano, S.A., or “Pizano,” and higher income from Corficolombiana’s highway concession projects in Episol (further explained in “—Segment results of operations for the year ended December 31, 2013 compared to the year ended December 31, 2012—Banco de Bogotá—Banco de Bogotá subsidiary analysis—Corficolombiana”) and by a consolidation adjustment in Grupo Aval associated with Banco de Bogotá’s investment in Corficolombiana in 2013.
Income Tax Expense
Income before income tax expense and non-controlling interest increased by Ps 217.4 billion, or 5.7%, from Ps 3,809.2 billion for the year ended December 31, 2012 to Ps 4,026.6 billion for the year ended December 31, 2013. Our income tax expense increased by 3.1% to Ps 1,414.7 billion for the year ended December 31, 2013. Our effective tax rate decreased from 36.0% for the year ended December 31, 2012 to 35.1% for the year ended December 31, 2013 as a result of a decrease in the effective tax rates of Corficolombiana and LB Panamá.
Non-Controlling Interest
The value of our non-controlling interest increased by 11.0% from Ps 911.1 billion for the year ended December 31, 2012 to Ps 1,011.4 billion for the year ended December 31, 2013. This increase was mainly explained by Corficolombiana’s higher net income in 2013 as compared to 2012. Our ratio of non-controlling interest to net income before non-controlling interest increased from 37.4% to 38.7% from the year ended December 31, 2012 to the year ended December 31, 2013 as we have a 40.9% interest in, and consolidate, Corficolombiana. As a result of this consolidated accounting, higher net income at Corficolombiana results in a higher non-controlling interest.
Segment Results of Operations for the Year Ended December 31, 2014 Compared to the Year Ended December 31, 2013
Banco de Bogotá
Overview
Banco de Bogotá’s net income attributable to shareholders for the year ended December 31, 2014 slightly decreased by 0.8%, or Ps 11.4 billion, to Ps 1,388.6 billion compared to the year ended December 31, 2013. Despite an increase in total operating income of 6.8%, or Ps 444.2 billion, to Ps 6,944.5 billion, total operating expenses increased by 12.0%, or Ps 452.7 billion, making net operating income decrease by 0.3%, or Ps 8.5 billion. Furthermore, income tax expense increased by 5.1%, or Ps 48.6 billion. As a result of the above, income before non-controlling interest decreased by 2.9%, or Ps 56.2 billion, and net income attributable to shareholders decreased by 0.8%, or Ps 11.4 billion.
Because the acquisitions of Grupo Financiero Reformador and BBVA Panamá took place during December 2013, the income statement for 2013 does not include the results from these businesses. The year ended December 31, 2014 is the first period that incorporates results for those businesses.
The following discussion describes the principal drivers of Banco de Bogotá’s consolidated results of operations for the year ended December 31, 2014 compared to the year ended December 31, 2013. Further detail is provided in the discussion of the results of operations for LB Panamá, Porvenir and Corficolombiana.
|
Banco de Bogotá consolidated
|
||||||||||||||||
|
Year ended
December 31,
|
Change, December 2014 vs.
December 2013
|
|||||||||||||||
|
2014
|
2013
|
# |
%
|
|||||||||||||
|
(in Ps billions)
|
||||||||||||||||
|
Total interest income
|
7,123.3 | 6,225.6 | 897.7 | 14.4 | ||||||||||||
|
Total interest expense
|
(2,661.3 | ) | (2,242.4 | ) | 418.8 | 18.7 | ||||||||||
|
Net interest income
|
4,462.0 | 3,983.2 | 478.9 | 12.0 | ||||||||||||
|
Total (provisions)/reversals, net
|
(987.6 | ) | (773.9 | ) | 213.7 | 27.6 | ||||||||||
|
Total fees and other services income, net
|
2,594.1 | 2,254.3 | 339.8 | 15.1 | ||||||||||||
|
Total other operating income
|
876.0 | 1,036.7 | (160.7 | ) | (15.5 | ) | ||||||||||
|
Total operating income
|
6,944.5 | 6,500.3 | 444.2 | 6.8 | ||||||||||||
|
Total operating expenses
|
(4,232.8 | ) | (3,780.1 | ) | 452.7 | 12.0 | ||||||||||
|
Net operating income
|
2,711.8 | 2,720.2 | (8.5 | ) | (0.3 | ) | ||||||||||
|
Total non-operating income (expense), net
|
172.1 | 171.2 | 0.9 | 0.5 | ||||||||||||
|
Income before income tax expense and non-controlling interest
|
2,883.8 | 2,891.4 | (7.6 | ) | (0.3 | ) | ||||||||||
|
Income tax expense
|
(993.5 | ) | (944.9 | ) | 48.6 | 5.1 | ||||||||||
|
Income before non-controlling interest
|
1,890.3 | 1,946.5 | (56.2 | ) | (2.9 | ) | ||||||||||
|
Non-controlling interest
|
(501.7 | ) | (546.5 | ) | (44.8 | ) | (8.2 | ) | ||||||||
|
Net income attributable to shareholders
|
1,388.6 | 1,400.0 | (11.4 | ) | (0.8 | ) | ||||||||||
Net interest income
|
Year ended
December 31,
|
Change, December 2014 vs.
December 2013
|
|||||||||||||||
|
2014
|
2013
|
# |
%
|
|||||||||||||
|
(in Ps billions)
|
||||||||||||||||
|
Interest income:
|
||||||||||||||||
|
Interest on loans
|
5,904.2 | 4,962.0 | 942.2 | 19.0 | ||||||||||||
|
Interest on investment securities
|
839.1 | 904.8 | (65.7 | ) | (7.3 | ) | ||||||||||
|
Interbank and overnight funds
|
144.1 | 135.9 | 8.2 | 6.0 | ||||||||||||
|
Financial leases
|
235.9 | 222.9 | 13.0 | 5.8 | ||||||||||||
|
Total interest income
|
7,123.3 | 6,225.6 | 897.7 | 14.4 | ||||||||||||
|
Interest expense:
|
||||||||||||||||
|
Checking accounts
|
(149.3 | ) | (127.6 | ) | 21.7 | 17.0 | ||||||||||
|
Time deposits
|
(1,171.8 | ) | (958.9 | ) | 212.9 | 22.2 | ||||||||||
|
Savings deposits
|
(588.0 | ) | (546.6 | ) | 41.4 | 7.6 | ||||||||||
|
Total interest expense from deposits
|
(1,909.1 | ) | (1,633.1 | ) | 276.0 | 16.9 | ||||||||||
|
Borrowing from banks and others
|
(413.7 | ) | (318.5 | ) | 95.2 | 29.9 | ||||||||||
|
Interbank and overnight funds (expenses)
|
(147.4 | ) | (121.8 | ) | 25.6 | 21.0 | ||||||||||
|
Long-term debt (bonds)
|
(191.0 | ) | (169.0 | ) | 22.1 | 13.1 | ||||||||||
|
Total interest expense
|
(2,661.3 | ) | (2,242.4 | ) | 418.8 | 18.7 | ||||||||||
|
Net interest income
|
4,462.0 | 3,983.2 | 478.9 | 12.0 | ||||||||||||
Banco de Bogotá’s net interest income increased by 12.0%, or Ps 478.9 billion, from Ps 3,983.2 billion for the year ended December 31, 2013 to Ps 4,462.0 billion for the year ended December 31, 2014. This increase was due to a 14.4%, or Ps 897.7 billion, increase in total interest income partially offset by an increase of 18.7%, or Ps 418.8 billion, in total interest expense.
Total interest income increased by 14.4%, or Ps 897.7 billion, from Ps 6,225.6 billion in the year ended December 31, 2013 to Ps 7,123.3 billion in the year ended December 31, 2014, mainly due to an increase in interest income from loans and financial leases, which rose by 18.4%, or Ps 955.2 billion, to Ps 6,140.1 billion in the year ended December 31, 2014, and an increase in interest income from interbank and overnight funds of Ps 8.2 billion to Ps 144.1 billion. These increases were offset in part by a decrease in interest income from investment securities of 7.3%, or Ps 65.7 billion, to Ps 839.1 billion.
Total interest income for Banco de Bogotá, excluding LB Panamá’s operations, increased by 4.8%, or Ps 205.0 billion, driven by a Ps 304.3 billion increase in interest income from loans and financial leases and a Ps 4.0 billion increase in interest income from interbank and overnight funds, partially offset by a Ps 103.4 billion decrease in interest income from investment securities. The average balance of total interest-earning assets increased by Ps 5,609.2 billion from Ps 49,695.4 billion for the year ended December 31, 2013 to Ps 55,304.6 billion for the year ended December 31, 2014, resulting in a Ps 489.7 billion increase in interest income, while the average yield of total interest-earning assets decreased from 8.5% for the year ended December 31, 2013 to 8.0% for the year ended December 31, 2014, which resulted in a Ps 284.7 billion decrease in interest income. The decrease in the average yield was mainly due to a decline in the average yield on loans and financial leases and in the average yield from investment securities.
Total interest income for LB Panamá’s operations increased by Ps 692.7 billion, driven by a Ps 7,969.8 billion increase in the average balance of total interest-earning assets from Ps 18,428.3 billion for the year ended December 31, 2013 to Ps 26,398.1 billion for the year ended December 31, 2014, resulting in a Ps 857.0 billion increase in interest income, offset in part by a decrease in the average yield of total interest-earning assets from 10.8% for the year ended December 31, 2013 to 10.1% for the year ended December 31, 2014, which resulted in a Ps 164.3 billion decrease in interest income. The decrease in the average yield was mainly attributable to a change in the mix in the loan portfolio as the Central American acquisitions carried a higher commercial and mortgage portfolio than BAC Credomatic’s loan portfolio mix.
As a result of the above, the average yield of total interest-earning assets for Banco de Bogotá’s consolidated operation decreased from 9.1% to 8.7%.
The increase in interest income from loans and financial leases of Ps 955.2 billion was a result of an increase of Ps 12,780.8 billion, or 26.2%, in the average balance of loans and financial leases from Ps 48,791.9 billion for the year ended December 31, 2013 to Ps 61,572.7 billion for the year ended December 31, 2014 (driven by a combination of organic growth, inorganic growth from the Central American acquisitions and the impact of the devaluation of the peso), which resulted in an increase of Ps 1,248.7 billion in interest income, partially offset by a decrease in the average yield on loans and financial leases from 10.6% for the year ended December 31, 2013 to 10.0% for the year ended December 31, 2014, which resulted in a Ps 293.5 billion decrease in interest income. The
balance of commercial loans (including financial leases), consumer loans and mortgage loans increased by Ps 7,158.7 billion, or 18.6%, Ps 3,923.3 billion, or 28.1%, and Ps 2,019.7 billion, or 37.5%, respectively.
Banco de Bogotá’s average yield on loans and financial leases, excluding LB Panamá’s operations, decreased from 9.8% for the year ended December 31, 2013 to 9.3% for the year ended December 31, 2014, in line with (i) a decreasing rate environment in Colombia where the average DTF rate decreased from 4.24% for the year ended December 31, 2013 to 4.07% for the year ended December 31, 2014 and (ii) the competitive landscape in Colombia. The average yield on loans and financial leases for LB Panamá’s operations decreased from 12.5% for the year ended December 31, 2013 to 11.3% for the year ended December 31, 2014, due to the change in the mix in the loan and financial leases portfolio from December 31, 2013 to December 31, 2014 described above.
The Ps 65.7 billion, or 7.3%, decrease in interest income from investment securities to Ps 839.1 billion was a result of a decrease in the average yield from 5.3% for the year ended December 31, 2013 to 4.6% for the year ended December 31, 2014, which resulted in a Ps 115.0 billion decrease in interest income from investment securities. Partially offsetting this decrease was a 5.9% increase in the average volume of investment securities from Ps 17,049.1 billion for the year ended December 31, 2013 to Ps 18,062.2 billion for the year ended December 31, 2014, resulting in a Ps 49.3 billion increase in interest income.
Interest income from equity investments from Banco de Bogotá’s operations decreased by Ps 45.7 billion to Ps 115.1 billion, mainly as a result of Corficolombiana’s lower income from its equity investment portfolios, offset in part by an increase in income from Porvenir’s mandatory investment portfolio (further explained in “—Banco de Bogotá subsidiary analysis—Corficolombiana—Net interest income”, “—Banco de Bogotá subsidiary analysis—LB Panamá—Net interest income” and in “—Banco de Bogotá subsidiary analysis—Porvenir—Net interest income”).
Interest income derived from the fixed income portfolio of Banco de Bogotá’s operations decreased by Ps 20.0 billion, driven by a Ps 96.8 billion decrease in interest income from the fixed income portfolio for Banco de Bogotá’s unconsolidated operation driven by (i) an increase in fixed income securities rates in Colombia during 2014 as evidenced by a 60 basis points increase in the interest rate on the Colombian Treasury Bond due 2024, which is a benchmark for tracking the movement of fixed income rates; and (ii) a strategic decision taken towards decreasing volatility in the income statement. In order to decrease such volatility, during 2014, a higher percentage of the fixed income portfolio was classified as available for sale rather than trading, reducing trading profits. Partially offsetting this decrease were increases of Ps 36.9 billion, Ps 22.8 billion and a Ps 11.4 billion in interest income from the fixed income portfolios of LB Panamá, Corficolombiana and Porvenir, respectively (further explained in “—Banco de Bogotá subsidiary analysis—LB Panamá—Net interest income” “—Banco de Bogotá subsidiary analysis—Corficolombiana—Net interest income” and in “—Banco de Bogotá subsidiary analysis—Porvenir—Net interest income”).
Total interest expense at Banco de Bogotá increased by Ps 418.8 billion, or 18.7%, from Ps 2,242.4 billion in the year ended December 31, 2013 to Ps 2,661.3 billion in the year ended December 31, 2014, as a result of a Ps 212.9 billion increase in interest paid in time deposits, a Ps 95.2 billion increase in interest paid for borrowings from banks and others, a Ps 41.4 billion increase in interest paid for savings deposits, a Ps 25.6 billion increase in interest paid for interbank and overnight funds, a Ps 22.1 billion increase in interest paid for long-term debt, and a Ps 21.7 billion increase in interest paid for interest-bearing checking accounts.
The Ps 418.8 billion increase in total interest expense is explained by a Ps 15,509.0 billion, or 24.2%, increase in the average balance of total interest-bearing liabilities from Ps 64,001.2 billion for the year ended December 31, 2013 to Ps 79,510.2 billion for the year ended December 31, 2014, resulting in a Ps 477.4 billion increase in interest expense, partially offset by a decrease of 16 basis points in the average cost of funding from 3.5% paid during the year ended December 31, 2013 to 3.3% paid during the year ended December 31, 2014, which resulted in a Ps 58.6 billion decrease in interest expense. Total interest expense for Banco de Bogotá’s interest-bearing deposits increased by Ps 276.0 billion, or 16.9%, to Ps 1,909.1 billion for the year ended December 31, 2014 mainly driven by a Ps 11,983.5 billion, or 25.2%, increase in the average balance of interest-bearing deposits, offset in part by a decrease of 23 basis points in the average cost of funds from 3.4% for the year ended December 31, 2013 to 3.2% for the year ended December 31, 2014.
Total interest expense for Banco de Bogotá, excluding LB Panamá’s operations, increased by Ps 117.5 billion, driven by a Ps 6,614.1 billion, or 14.9%, increase in the average balance of total interest-bearing liabilities from Ps 44,444.3 billion for the year ended December 31, 2013 to Ps 51,058.4 billion for the year ended December 31,
2014, resulting in a Ps 186.3 billion increase in interest expense, offset in part by 25 basis points decrease in the average cost of funding, consistent with the decreasing rate environment in Colombia, from 3.7% paid during the year ended December 31, 2013 to 3.4% paid during the year ended December 31, 2014, which resulted in a Ps 68.9 billion decrease in interest expense. Total interest expense for LB Panamá’s operations increased by Ps 301.3 billion, explained by a Ps 8,894.9 billion increase in the average balance of total interest-bearing liabilities, from Ps 19,556.9 billion for the year ended December 31, 2013 to Ps 28,451.8 billion for the year ended December 31, 2014, resulting in a Ps 283.8 billion increase in interest expense. Also contributing to the increase in interest expense was a slight increase in the average cost of funding from 3.1% paid during the year ended December 31, 2013 to 3.2% paid during the year ended December 31, 2014, which resulted in a Ps 17.6 billion increase in interest expense. The increase in the average balance of LB Panamá’s total interest-bearing liabilities was driven by driven by a combination of organic growth, inorganic growth from the Central American acquisitions and the impact of the devaluation of the peso.
The Ps 212.9 billion increase in interest paid for time deposits resulted from an increase in the average balance of time deposits partially offset by a decrease in the average rate paid on these funds. The Ps 6,368.1 billion, or 30.6%, increase in the average balance of time deposits from Ps 20,795.6 billion for the year ended December 31, 2013 to Ps 27,163.7 billion for the year ended December 31, 2014, resulting in a Ps 249.9 billion increase in interest expense. The Ps 6,368.1 billion increase in the average balance was due to a Ps 3,956.5 billion increase in the average balance of LB Panamá’s operation, driven by a combination of inorganic growth from the Central American acquisitions, organic growth and the impact of the devaluation of the peso, and a Ps 2,411.6 billion increase in the average balance of Banco de Bogota’s operation excluding LB Panamá. The decrease of 30 basis points in the average interest rate, decreasing from 4.6% paid during the year ended December 31, 2013 to 4.3% paid during the year ended December 31, 2014, resulted in Ps 37.0 billion decrease in interest expense.
The Ps 95.2 billion increase in interest paid for borrowings from banks and others resulted mainly from an increase in the average balance of borrowings from banks and others as the average interest rate paid remained practically unchanged. The Ps 2,694.7 billion, or 30.1%, increase in the average balance of such borrowings from Ps 8,943.4 billion for the year ended December 31, 2013 to Ps 11,638.1 billion for the year ended December 31, 2014. The Ps 2,694.7 billion increase in the average balance was due to a Ps 2,009.6 billion increase in the average balance of LB Panamá’s operation, driven by a combination organic growth, inorganic growth from the Central American acquisitions and the impact of the devaluation of the peso, and a Ps 685.1 billion increase in the average balance of Banco de Bogota’s operation excluding LB Panamá. The average interest rate paid remained basically unchanged at 3.6% for both the years ended December 31, 2013 and 2014.
The Ps 41.4 billion increase in interest paid for savings deposits resulted from an increase in the average balance of savings deposits partially offset by a decrease in the average rate paid on those funds. The Ps 3,171.3 billion increase in the average volume of savings deposits from Ps 19,143.6 billion for the year ended December 31, 2013 to Ps 22,314.8 billion for the year ended December 31, 2014, resulting in a Ps 75.2 billion increase in interest expense. The Ps 3,171.3 billion increase in the average balance was due to a Ps 1,917.4 billion increase in the average balance of Banco de Bogota’s operation excluding LB Panamá and a Ps 1,253.9 billion increase in the average balance of LB Panamá’s operation, driven by a combination of inorganic growth from the Central American acquisitions, organic growth and the impact of the devaluation of the peso. The increase in the average balance was partially offset by a 22 basis points decrease in the average interest rate paid from 2.9% for the year ended December 31, 2013 to 2.6% for the year ended December 31, 2014, which resulted in a Ps 33.8 billion decrease in interest expense.
The Ps 25.6 billion increase in interest paid for interbank and overnight funds resulted from a Ps 442.0 billion increase in the average balance of interbank borrowings and overnight funds from Ps 4,492.6 billion for the year ended December 31, 2013 to Ps 4,934.6 billion for the year ended December 31, 2014, which resulted in a Ps 12.9 billion increase in interest expense and an increase in the average interest rate from 2.7% paid during the year ended December 31, 2013 to 3.0% paid during the year ended December 31, 2014, resulting in a Ps 12.7 billion increase in interest expense.
The Ps 22.1 billion increase in interest paid for long-term debt resulted mainly from an increase in the average volume of long-term debt from Ps 2,970.5 billion for the year ended December 31, 2013 to Ps 3,359.3 billion for the year ended December 31, 2014, which resulted in Ps 21.2 billion increase in interest expense. The average interest rate paid for long-term debt remained basically unchanged at 5.7% for both the year ended December 31, 2013 and the year ended December 31, 2014, resulting in Ps 0.9 billion increase in interest expense.
Finally, the Ps 21.7 billion increase in interest paid for intrest-beraring checking accounts resulted from a Ps 2,444.2 billion increase in the average volume of checking accounts from Ps 7,655.5 billion for the year ended December 31, 2013 to Ps 10,099.7 billion for the year ended December 31, 2014, which resulted in a Ps 29.9 billion increase in interest expense. The Ps 2,444.2 billion increase in the average balance was due to a Ps 1,477.5 billion increase in the average balance of LB Panamá’s operation, driven by a combination of inorganic growth from the Central American acquisitions, organic growth and the impact of the devaluation of the peso, and a Ps 966.7 billion increase in the average balance of Banco de Bogota’s operation excluding LB Panamá. Partially offsetting these increases was a decrease of 19 basis points in the average interest rate paid from 1.7% for the year ended December 31, 2013 to 1.5% for the year ended December 31, 2014, resulting in a Ps 8.2 billion decrease in interest expense.
Banco de Bogotá’s average total interest-earning assets increased by 19.9% for the year ended December 31, 2014 compared to the year ended December 31, 2013, while net interest income increased by 12.0%. The above resulted in a contraction in net interest margin (calculated as net interest income divided by total average interest-earning assets) from 5.8% for the year ended December 31, 2013 to 5.5% for the year ended December 31, 2014. Showing a similar tendency, the spread between the yield earned on loans and financial leases and the rate paid on deposits decreased from 7.2% for the year ended December 31, 2013 to 6.8% for the year ended December 31, 2014.
The decrease in the net interest margin was mainly driven by the aforementioned declines in the yield on loans and in the yield on investment securities, offset in part by the decrease in the average rate paid on interest-bearing liabilities. The decrease in the interest spread between the average rate on loans and financial leases and the average rate paid on deposits was primarily driven by the decline in the yield on loans, partially offset by a decrease in the average rate paid on deposits.
Provisions
Total net provisions increased by Ps 213.7 billion to Ps 987.6 billion in the year ended December 31, 2014, driven primarily by a Ps 173.7 billion increase in net provisions for losses on loans and financial leases from Ps 758.3 billion for the year ended December 31, 2013 to Ps 932.0 billion for the year ended December 31, 2014. This increase was driven by (i) an increase in the balance of loans and financial leases, particularly for consumer loans which, by regulation, require more provisions; and (ii) a slight deterioration in credit quality as Banco de Bogotá’s delinquency ratio (measured as loans at least 30 days past due as a percentage of total gross loans) increased to 2.4% as of December 31, 2014 versus 2.3% as of December 31, 2013. The ratio of net provisions for loan and financial lease losses to average loan and financial leases remained basically unchanged at 1.5% for both the year ended December 31, 2013 and the year ended December 31, 2014.
Banco de Bogotá’s charge-offs increased by Ps 303.3 billion from Ps 517.4 billion for the year ended December 31, 2013 to Ps 820.7 billion for the year ended December 31, 2014. Its ratio of charge-offs to average balance of loans and financial leases ratio increased from 1.0% for the year ended December 31, 2013 to 1.3% for the year ended December 31, 2014. The increase in charge-offs was mainly driven by the impact from the Central American acquisitions.
Banco de Bogotá’s allowance for loans and financial leases increased by Ps 217.5 billion to Ps 1,856.0 billion at December 31, 2014. Banco de Bogotá’s coverage ratio over its at least 30 days past due loans was 107.9% at December 31, 2014 Banco de Bogotá’s coverage ratio, excluding LB Panamá’s operation, was 131.6% at December 31, 2014 and LB Panamá’s coverage ratio was 74.5% at December 31, 2014.
Also contributing to the increase in total net provisions was a Ps 40.5 billion increase in net provisions for accrued interest and other receivables to a net expense of Ps 98.8 billion for the year ended December 31, 2014. This increase was mainly driven by a Ps 25.3 billion increase in net provisions for accrued interest and other receivables from Porvenir, a Ps 6.5 billion increase in net provisions for accrued interest and other receivables from Corficolombiana, a Ps 5.9 billion increase in net provisions for accrued interest and other receivables from Banco de Bogotá’s unconsolidated operation, and a Ps 1.9 billion increase in net provisions for accrued interest and other receivables from LB Panamá.
Net provision expense for foreclosed assets and other assets increased by Ps 20.3 billion, resulting in a net expense of Ps 36.5 billion for the year ended December 31, 2014, up from Ps 16.2 billion for the year ended
December 31, 2013. This increase was mainly driven by Ps 10.9 billion increase in net provision expense for foreclosed assets and other assets from LB Panamá and a Ps 7.3 billion increase in net provision expense for foreclosed assets and other assets from Banco de Bogotá’s unconsolidated operation.
The recovery of charged-off assets increased from the year ended December 31, 2013 to the year ended December 31, 2014 by Ps 20.7 billion to Ps 79.7 billion. This increase was driven by a Ps 16.3 billion increase in the recoveries from Banco de Bogotá’s unconsolidated operation and a Ps 3.2 billion increase in the recoveries from LB Panamá.
Total fees and other services income
|
Year ended
December 31,
|
Change, December 2014 vs.
December 2013
|
|||||||||||||||
|
2014
|
2013
|
# |
%
|
|||||||||||||
|
(in Ps billions)
|
||||||||||||||||
|
Fees and other services income:
|
||||||||||||||||
|
Commissions from banking services
|
1,356.0 | 1,126.3 | 229.7 | 20.4 | ||||||||||||
|
Branch network services
|
31.0 | 27.9 | 3.2 | 11.5 | ||||||||||||
|
Credit card merchant fees
|
326.7 | 293.2 | 33.6 | 11.5 | ||||||||||||
|
Checking fees
|
34.7 | 34.8 | (0.1 | ) | (0.3 | ) | ||||||||||
|
Warehouse services
|
135.7 | 129.8 | 5.9 | 4.5 | ||||||||||||
|
Fiduciary activities
|
154.5 | 142.1 | 12.5 | 8.8 | ||||||||||||
|
Pension plan administration
|
753.3 | 721.5 | 31.8 | 4.4 | ||||||||||||
|
Other
|
112.6 | 91.0 | 21.6 | 23.8 | ||||||||||||
|
Total fees and other services income
|
2,904.7 | 2,566.5 | 338.2 | 13.2 | ||||||||||||
|
Fees and other services expenses
|
(310.6 | ) | (312.2 | ) | (1.6 | ) | (0.5 | ) | ||||||||
|
Total fees and other services income, net
|
2,594.1 | 2,254.3 | 339.8 | 15.1 | ||||||||||||
Total fees and other services income, net, increased by 15.1% to Ps 2,594.1 billion for the year ended December 31, 2014 as compared to the same period in 2013, due to a Ps 338.2 billion increase in total fees and other services income and a Ps 1.6 billion decrease in fees and other services expense. Of the Ps 339.8 billion increase in total fees and other services income, net, Ps 193.9 billion is explained by LB Panamá and Ps 145.8 billion is explained by Banco de Bogotá’s operation excluding LB Panamá.
Of the Ps 193.9 billion increase in total fees and other services income, net for LB Panamá, Ps 52.0 billion, or 26.8%, was attributable to an increase in the average exchange rate used to translate LB Panamá’s financial statements from U.S. dollars to Colombian pesos. The average exchange rate increased from Ps 1,879.53 per U.S.$1.00 for 2013 to Ps 2,017.85 per U.S.$1.00 for the 2014 financial statements. In the absence of the impact of this increase in the average exchange rate, LB Panamá’s total fees and other services income, net would have increased by 17.7%, or Ps 142.0 billion. This Ps 142.0 billion increase was driven by a Ps 130.0 billion increase in commissions from banking services, a Ps 8.4 billion increase in other fees and a Ps 4.1 billion increase in credit card and merchant fees. These increases were driven by the organic and inorganic growth of the business.
The Ps 145.8 billion increase in total fees and other services income, net for Banco de Bogota’s operation excluding LB Panamá, was mainly driven by (i) a Ps 62.8 billion, increase in commissions from banking services, (ii) a Ps 34.4 billion increase in fees from pension plan administration (as further explained in “—Segment results of operations for the year ended December 31, 2014 compared to the year ended December 31, 2013—Banco de Bogotá subsidiary analysis—Porvenir”), (iii) an increase of Ps 14.6 billion in fees from credit card and merchant fees, mainly driven by an increase in the number of credit cards issued, (iv) an increase in fees from fiduciary activities of Ps 12.5 billion mainly as a result of better operating performance from Banco de Bogotá’s fiduciary subsidiaries, (v) an increase of Ps 8.5 in other fee income and (vi) an increase in fees from warehouse services of Ps 5.9 billion mainly as a result of better operating performance from Banco de Bogotá’s warehouse subsidiary.
Other operating income
|
Year ended
December 31,
|
Change, December 2014 vs.
December 2013
|
|||||||||||||||
|
2014
|
2013
|
# |
%
|
|||||||||||||
|
(in Ps billions)
|
||||||||||||||||
|
Foreign exchange gains (losses), net
|
1,135.2 | 312.9 | 822.2 | 262.8 | ||||||||||||
|
Gains (losses) on derivative operations, net
|
(884.1 | ) | (42.0 | ) | (842.1 | ) | (2,003.9 | ) | ||||||||
|
Gains on sales of investments in equity securities, net
|
(0.4 | ) | 7.1 | (7.5 | ) | (105.5 | ) | |||||||||
|
Income from non-financial sector, net (1)
|
327.8 | 436.4 | (108.6 | ) | (24.9 | ) | ||||||||||
|
Dividend income
|
284.5 | 310.1 | (25.6 | ) | (8.3 | ) | ||||||||||
|
Other
|
13.1 | 12.2 | 0.9 | 7.3 | ||||||||||||
|
Other operating income
|
876.0 | 1,036.7 | (160.7 | ) | (15.5 | ) | ||||||||||
|
(1)
|
Income from non-financial sector, net, reflects the operating results of Corficolombiana in its consolidated investments in companies not related to the financial sector such as Epiandes, Hoteles Estelar, Organización Pajonales (formerly known as Compañía Agropecuaria e Industrial Pajonales S.A.), or “Organización Pajonales,” Pizano, Unipalma, Valora and Lehner, among others. This result is net of operating and administrative expenses of Ps 1,475.3 billion for the year ended December 31, 2014 and Ps 1,211.3 billion for the year ended December 31, 2013. For a description of these investments, see “Item 4. Information on the Company—B. Business overview—Corficolombiana—Equity investment portfolio.”
|
Total other operating income decreased by 15.5%, or Ps 160.7 billion, to Ps 876.0 billion in the year ended December 31, 2014, mainly due to a Ps 108.6 billion decrease in income from the non-financial sector, which includes the net operating income result of non-financial companies consolidated by Banco de Bogotá. Ps 83.4 billion of such decrease resulted from a change in Megalínea’s results (Megalínea is a services and technology outsourcing company of Banco de Bogotá) as in 2013 its operating expenses were recorded in the operating expenses line items, in 2014 they were recorded as an expense on the income from non-financial sector, net line item. Income from the non-financial companies of Corficolombiana’s consolidated companies decreased by Ps 24.5 billion, mainly driven by lower net operating income from Epiandes (Ps 95.3 billion), offset in part by higher net operating income from Episol (38.5 billion), Hoteles Estelar (Ps 12.6 billion), Pisa (Ps 9.3 billion), Valora (Ps 4.8 billion), Lehner (Ps 3.1 billion), and Gas Comprimido del Perú (Ps 2.4 billion) (further explained in “—Banco de Bogotá subsidiary analysis—Corficolombiana”).
Also contributing to the decrease in other operating income was a Ps 25.6 billion decrease in dividend income from Ps 310.1 billion for the year ended December 31, 2013 to Ps 284.5 billion for the year ended December 31, 2014. This decrease was driven by a Ps 79.5 billion decrease in dividend income from Promigas during the year ended December 31, 2014, offset in part by a Ps 45.9 billion increase in dividend income from EEB, a Ps 3.9 billion increase in in dividend income from Gas Natural and a Ps 3.2 billion increase in dividend income from Aerocali. The decrease in dividend income from Promigas occurred since in 2013 Corficolombiana benefited from the management’s decision of changing from yearly assemblies to bi-yearly assemblies. As such, during 2013 Promigas declared dividends for the full year of 2012 and the first half of 2013. In contrast, during 2014, Promigas declared dividends for the second half of 2013 and the first half of 2014.
Income from net foreign exchange and derivative operations decreased by Ps 19.8 billion to Ps 251.1 billion for the year ended December 31, 2014, mainly driven by a Ps 16.4 billion decrease in Porvenir. Gains on sales of investments in equity securities decreased by Ps 7.5 billion due to the sale of some of Corficolombiana’s investments, such as Banco de Occidente, during 2013.
Operating expenses
|
Year ended
December 31,
|
Change, December 2014 vs.
December 2013
|
|||||||||||||||
|
2014
|
2013
|
# |
%
|
|||||||||||||
|
(in Ps billions)
|
||||||||||||||||
|
Salaries and employee benefits
|
(1,589.3 | ) | (1,387.6 | ) | 201.7 | 14.5 | ||||||||||
|
Bonus plan payments
|
(78.0 | ) | (92.8 | ) | (14.9 | ) | (16.0 | ) | ||||||||
|
Termination payments
|
(22.0 | ) | (14.8 | ) | 7.1 | 48.1 | ||||||||||
|
Administrative and other expenses
|
(2,128.2 | ) | (1,948.1 | ) | 180.0 | 9.2 | ||||||||||
|
Deposit security, net
|
(119.2 | ) | (115.7 | ) | 3.5 | 3.0 | ||||||||||
|
Charitable and other donation expenses
|
(4.1 | ) | (4.0 | ) | 0.1 | 2.9 | ||||||||||
|
Depreciation
|
(159.9 | ) | (131.1 | ) | 28.8 | 22.0 | ||||||||||
|
Goodwill amortization
|
(132.2 | ) | (85.9 | ) | 46.3 | 53.9 | ||||||||||
|
Total operating expenses
|
(4,232.8 | ) | (3,780.1 | ) | 452.7 | 12.0 | ||||||||||
Total operating expenses increased by 12.0%, or Ps 452.7 billion, to Ps 4,232.8 billion in the year ended December 31, 2014.
Of the Ps 452.7 billion increase in total operating expense, Ps 418.3 billion is explained by LB Panamá and Ps 34.4 billion is explained by Banco de Bogotá’s operation excluding LB Panamá.
Of the Ps 418.3 billion increase in total operating expense, Ps 111.2 billion was attributable to an increase in the average exchange rate used to translate LB Panamá’s financial statements from U.S. dollars to Colombian pesos. The average exchange rate increased from Ps 1,879.53 per U.S.$1.00 for 2013 to Ps 2,017.85 per U.S.$1.00 for the 2014 financial statements. In the absence of the impact of this increase in the average exchange rate, LB Panamá’s operating expenses would have increased by 22.6%, or Ps 307.1 billion.
The Ps 307.1 billion increase was driven by a Ps 143.2 billion increase in salaries and employee benefits, a Ps 115.3 billion increase in administrative and other expenses principally driven by the organic and inorganic growth of the business. Also contributing to the increase in operating expenses was a Ps 33.4 billion increase in goodwill amortizations, associated to Central American acquisitions, and a Ps 10.3 billion increase in depreciation expense.
While Banco de Bogotá’s efficiency ratio calculated as operating expenses before depreciation and amortization divided by operating income before provision expense deteriorated from 49.0% for the year ended December 31, 2013 to 49.7% for the year ended December 31, 2014, the ratio of operating expenses before depreciation and amortization as a percentage of average assets improved from 4.1% for the year ended December 31, 2013 to 3.7% for the year ended December 31, 2014.
Non-operating income (expense)
Total non-operating income (expense) slightly increased by Ps 0.9 billion from Ps 171.2 billion in the year ended December 31, 2013 to Ps 172.1 billion in the year ended December 31, 2014.
Income tax expense
Income tax expense increased by Ps 48.6 billion, or 5.1%, to Ps 993.5 billion for the year ended December 31, 2014, driven by a Ps 58.7 billion and a Ps 25.8 billion increases in income tax expense from LB Panamá and Porvenir, respectively, offset in part by a Ps 27.8 billion and a Ps 9.7 billion decreases in income tax expense from Corficolombiana and Banco de Bogotá’s unconsolidated operation, respectively. Banco de Bogotá’s effective tax rate increased from 32.7% for the year ended December 31, 2013 to 34.5% for the year ended December 31, 2014. The increase in the effective tax rate was mainly driven by increases in the effective tax rates of LB Panamá and Corficolombiana (further explained in “—Banco de Bogotá subsidiary analysis—Leasing Bogotá Panamá” and in “—Banco de Bogotá subsidiary analysis—Corficolombiana”).
Non-controlling interest
Banco de Bogotá’s non-controlling interest decreased by Ps 44.8 billion, or 8.2%, to Ps 501.7 billion in the year ended December 31, 2014 compared with the year ended December 31, 2013. The decrease in non-controlling interest was primarily a result of lower net income from Corficolombiana’s operations in the year ended December 31, 2014 as compared to the same period of 2013, as further described in “—Banco de Bogotá subsidiary
analysis—Corficolombiana.” The ratio of minority interest to net income before minority interest decreased from 28.1% for the year ended December 31, 2013 to 26.5% for the year ended December 31, 2014. Given the fact that Banco de Bogotá holds a 38.2% stake in Corficolombiana and consolidates its financials into its operations, a lower net income at the Corficolombiana level generates a lower minority interest expense at Banco de Bogotá.
Banco de Bogotá Subsidiary Analysis
Banco de Bogotá’s results of operations are significantly affected by the results of operations of its subsidiaries, Corficolombiana, Porvenir and LB Panamá. In order to fully disclose the effect of these subsidiaries on Banco de Bogotá, the following is an analysis of the results of operations of each of Corficolombiana, Porvenir and LB Panamá in the year ended December 31, 2014 compared to the year ended December 31, 2013.
Corficolombiana
Net income
|
Year ended December 31,
|
Change, December 2014 vs. December 2013
|
|||||||||||||||
|
|
2014
|
2013
|
# |
%
|
||||||||||||
|
(in Ps billions)
|
||||||||||||||||
|
Total interest income
|
378.3 | 469.8 | (91.6 | ) | (19.5 | ) | ||||||||||
|
Total interest expense
|
(311.8 | ) | (307.2 | ) | 4.6 | 1.5 | ||||||||||
|
Net interest income
|
66.4 | 162.6 | (96.2 | ) | (59.1 | ) | ||||||||||
|
Total (provisions)/reversals, net
|
(14.1 | ) | (0.9 | ) | 13.2 | 1,427.9 | ||||||||||
|
Total fees and other services income, net
|
51.9 | 42.1 | 9.8 | 23.3 | ||||||||||||
|
Total other operating income
|
731.9 | 783.0 | (51.1 | ) | (6.5 | ) | ||||||||||
|
Total operating income
|
836.2 | 986.8 | (150.6 | ) | (15.3 | ) | ||||||||||
|
Total operating expenses
|
(168.5 | ) | (156.8 | ) | 11.6 | 7.4 | ||||||||||
|
Net operating income
|
667.7 | 830.0 | (162.3 | ) | (19.6 | ) | ||||||||||
|
Total non-operating income (expense), net
|
17.0 | 8.0 | 9.0 | 113.0 | ||||||||||||
|
Income before income tax expense and non-controlling interest
|
684.7 | 837.9 | (153.3 | ) | (18.3 | ) | ||||||||||
|
Income tax expense
|
(177.6 | ) | (205.4 | ) | (27.8 | ) | (13.5 | ) | ||||||||
|
Income before non-controlling interest
|
507.1 | 632.5 | (125.5 | ) | (19.8 | ) | ||||||||||
|
Non-controlling interest
|
(86.2 | ) | (93.5 | ) | (7.3 | ) | (7.8 | ) | ||||||||
|
Net income attributable to shareholders
|
420.9 | 539.0 | (118.2 | ) | (21.9 | ) | ||||||||||
Corficolombiana’s net income decreased by 21.9% to Ps 420.9 billion for the year ended December 31, 2014 when compared to the year ended December 31, 2013. The most significant drivers of the decrease in net income were a decrease in net interest income driven by a decrease in income from investment securities, a decrease in other operating income due to lower dividend income and income from non-financial sector, an increase in total provisions, net, and an increase in total operating expenses. Partially offsetting these was a decrease in income tax expense, an increase in fees and other service income, an increase total non-operating income, and a decrease in non-controlling interest.
Net interest income
|
Year ended December 31,
|
Change, December 2014 vs. December 2013
|
|||||||||||||||
|
2014
|
2013
|
# |
%
|
|||||||||||||
|
(in Ps billions)
|
||||||||||||||||
|
Interest income:
|
||||||||||||||||
|
Interest on loans
|
34.8 | 25.5 | 9.3 | 36.5 | ||||||||||||
|
Interest on investment securities
|
237.0 | 333.5 | (96.5 | ) | (28.9 | ) | ||||||||||
|
Interbank and overnight funds
|
52.2 | 49.9 | 2.3 | 4.7 | ||||||||||||
|
Financial leases
|
54.3 | 61.0 | (6.7 | ) | (11.0 | ) | ||||||||||
|
Total interest income
|
378.3 | 469.8 | (91.6 | ) | (19.5 | ) | ||||||||||
|
Interest expense:
|
||||||||||||||||
|
Checking accounts
|
(0.5 | ) | – | 0.5 | – | |||||||||||
|
Time deposits
|
(152.5 | ) | (152.2 | ) | 0.3 | 0.2 | ||||||||||
|
Savings deposits
|
(25.0 | ) | (18.0 | ) | 6.9 | 38.4 | ||||||||||
|
Total interest expense from deposits
|
(177.9 | ) | (170.2 | ) | 7.7 | 4.5 | ||||||||||
|
Borrowing from banks and others
|
(43.2 | ) | (44.8 | ) | (1.7 | ) | (3.7 | ) | ||||||||
|
Interbank and overnight funds (expenses)
|
(90.7 | ) | (88.9 | ) | 1.8 | 2.1 | ||||||||||
|
Long-term debt (bonds)
|
– | (3.3 | ) | (3.3 | ) | (100.0 | ) | |||||||||
|
Total interest expense
|
(311.8 | ) | (307.2 | ) | 4.6 | 1.5 | ||||||||||
|
Net interest income
|
66.4 | 162.6 | (96.2 | ) | (59.1 | ) | ||||||||||
Net interest income decreased by Ps 96.2 billion to Ps 66.4 billion for the year ended December 31, 2014 compared to the year ended December 31, 2013. Total interest income, which consists of income from loans, investment securities, interbank and overnight funds and financial leases, decreased by Ps 91.6 billion to Ps 378.3 billion for the year ended December 31, 2014. This decrease was mainly driven by a Ps 96.5 billion decrease in income on investment securities from Ps 333.5 billion for the year ended December 31, 2013 to Ps 237.0 billion for the year ended December 31, 2014 and a Ps 4.6 billion increase in total interest expense. Partially offsetting these was a Ps 2.6 billion increase in interest income from loans and financial leases from Ps 86.5 billion for the year ended December 31, 2013 to Ps 89.1 billion for the year ended December 31, 2014 and a Ps 2.3 billion increase in interest income from interbank and overnight funds to Ps 52.2 billion for the year ended December 31, 2014.
The Ps 96.5 billion decrease in interest income from investment securities was driven by a Ps 119.3 billion decrease in interest income from Corficolombiana’s equity securities portfolio offset in part by a Ps 22.8 billion increase in interest income from the its debt securities portfolio. The decrease in interest income from the equity securities portfolio of Ps 119.3 billion to Ps 37.4 billion for the year ended December 31, 2014 was mainly driven by decreases of Ps 75.4 billion, Ps 37.7 billion and Ps 14.1 billion in the valuation gains generated by Corficolombiana’s investments in a private investment fund managed by Corredores Asociados (
Fondo de Capital Privado Corredores Capital 1
or “FCP”), in Banco de Occidente and in Mineros, respectively.
The Ps 75.4 billion decrease in the valuation gains generated by the private investment fund was mainly driven by the fact that during 2013 the increase in the price of Promigas’ price per share in the Colombian Stock Exchange (Ps 3,225 to Ps 4,771) was higher than the increase during 2014 (Ps 4,771 to Ps 5,399).
The Ps 37.7 billion decrease in the valuation gains generated by Corficolombiana’s investment in Banco de Occidente was driven by the fact that during 2013 Corficolombiana sold, through open market transactions, the majority of its stake in in Banco de Occidente and thus, while in 2013 it recorded a Ps 38.2 billion gain on this investment, it only recorded a Ps 0.5 billion gain in 2014.
The Ps 14.1 billion decrease in the valuation gains generated by Corficolombiana’s investment in Mineros was driven by a higher decrease in Mineros’ price per share in the Colombian Stock Exchange during 2014 as compared to the decrease in price during 2013.
These decreases were partially offset by a Ps 5.4 billion increase in the valuation gains generated by Corficolombiana’s investment in Fondo de Hidrocarburos de Colombia
and a Ps 2.4 billion increase in the valuation gains generated by Corficolombiana’s investments in other companies.
The Ps 22.8 billion increase in interest income from the debt securities portfolio to Ps 199.6 billion for the year ended December 31, 2014 was mainly driven by an increase in the yield earned by debt securities.
Interest income from loans and financial leases increased by Ps 2.6 billion from Ps 86.5 billion for the year ended December 31, 2013 to Ps 89.1 billion for the year ended December 31, 2014. This increase was driven by a Ps 61.7 billion increase in the average balance of loans and financial leases to Ps 832.7 billion for the year ended December 31, 2014, which resulted in a Ps 6.2 billion increase in interest income from loans and financial leases.
Partially offsetting this increase was a decrease in the average yield of loans and financial leases from 11.2% for the year ended December 31, 2013 to 10.7% for the year ended December 31, 2014, which resulted in a Ps 3.5 billion decrease in interest income from loans and financial leases. The decrease in the yield was a result of (i) a decreasing rate environment in Colombia where the average DTF rate decreased from 4.24% for the year ended December 31, 2013 to 4.07% for the year ended December 31, 2014 and (ii) the competitive landscape in Colombia.
Interest income from interbank and overnight funds increased by Ps 2.3 billion to Ps 52.2 billion for the year ended December 31, 2014 as compared to the same period of 2013. The increase in interest income was driven by an increase in the average yield on interbank and overnight funds from 7.0% for the year ended December 31, 2013 to 7.9% for the year ended December 31, 2014, which resulted in Ps 19.8 billion increase in interest income. Partially offsetting this increase was a decrease in the average balance of interbank and overnight funds from Ps 707.6 billion for the year ended December 31, 2013 to Ps 659.6 billion for the year ended December 31, 2014, resulting in a Ps 17.4 billion decrease in interest income.
Also contributing to the decrease in net interest income was an increase in total interest expense of 1.5%, or Ps 4.6 billion, from Ps 307.2 billion for the year ended December 31, 2013 to Ps 311.8 billion for the year ended December 31, 2014. The increase in total interest expense is attributable to an increase in interest expense on total deposits of Ps 7.7 billion and an increase in interest expense on interbank and overnight funds of Ps 1.8 billion, offset in part by a decrease in interest expense on long-term debt of Ps 3.3 billion and a decrease in interest expense on borrowing from banks and other of Ps 1.7 billion.
Provisions
Corficolombiana’s net provisions increased by Ps 13.2 billion from a Ps 0.9 billion net expense for the year ended December 31, 2013 to a Ps 14.1 billion net expense for the year ended December 31, 2014. The increase in net provisions was mainly driven by a Ps 9.4 billion increase in net provision expense for loans and financial leases and a Ps 6.5 billion increase in net provision expense for accrued interest and other receivables, partially offset by a Ps 1.4 billion decrease net provisions for foreclosed assets and other assets and a Ps 1.3 billion increase in the recovery of charged-off assets.
The increase in net provision expense for loans and financial leases was mainly driven (i) the increase in the average balance of loans and financial leases and (ii) a deterioration in the quality of the loans and financial leases portfolio. Corficolombiana’s delinquency ratio, measured as loans at least 30 days past due as percentage of total loans, increased from 1.7% as of December 31, 2013 to 3.9% as of December 31, 2014.
The Ps 6.5 billion increase in net provision expense for accrued interest and other receivables, mainly driven by lower reversals of provisions during the year ended December 31, 2014 as compared to the same period of 2013.
Total fees and other services income
|
Year ended December 31,
|
Change, December 2014 vs. December 2013
|
|||||||||||||||
|
2014
|
2013
|
# |
%
|
|||||||||||||
|
(in Ps billions)
|
||||||||||||||||
|
Fees and other services income:
|
||||||||||||||||
|
Commissions from banking services
|
2.7 | 2.6 | 0.1 | 3.5 | ||||||||||||
|
Fiduciary activities
|
37.9 | 35.8 | 2.0 | 5.7 | ||||||||||||
|
Other
|
19.2 | 11.3 | 7.9 | 69.6 | ||||||||||||
|
Total fees and other services income
|
59.8 | 49.8 | 10.0 | 20.1 | ||||||||||||
|
Fees and other services expenses
|
(7.8 | ) | (7.7 | ) | 0.2 | 2.5 | ||||||||||
|
Total fees and other services income, net
|
51.9 | 42.1 | 9.8 | 23.3 | ||||||||||||
Net fee and other services income increased by 23.3%, or Ps 9.8 billion, from Ps 42.1 billion for the year ended December 31, 2013 to Ps 51.9 billion for the year ended December 31, 2014. This increase in total fees and other services income, net is mainly attributable to a Ps 7.9 billion increase in other fees and other service income, which includes fees from investment banking, and a Ps 2.0 billion increase income from fiduciary activities.
Other operating income
|
Year ended December 31,
|
Change, December 2014 vs. December 2013
|
|||||||||||||||
|
|
2014
|
2013
|
# |
%
|
||||||||||||
|
|
(in Ps billions)
|
|||||||||||||||
|
Foreign exchange gains (losses), net
|
111.8 | 20.6 | 91.2 | 443.4 | ||||||||||||
|
Gains on derivative operations, net
|
(92.0 | ) | (1.0 | ) | (91.0 | ) | 8,693.5 | |||||||||
|
Gains on sales of investments in equity securities, net
|
0.0 | 6.4 | (6.4 | ) | (99.7 | ) | ||||||||||
|
Income from non-financial sector, net
|
419.4 | 443.9 | (24.5 | ) | (5.5 | ) | ||||||||||
|
Dividend income
|
281.7 | 308.3 | (26.6 | ) | (8.6 | ) | ||||||||||
|
Other
|
11.0 | 4.8 | 6.2 | 130.2 | ||||||||||||
|
Total other operating income
|
731.9 | 783.0 | (51.1 | ) | (6.5 | ) | ||||||||||
Total other operating income decreased by 6.5%, or Ps 51.1 billion, from Ps 783.0 billion for the year ended December 31, 2013 to Ps 731.9 billion for the year ended December 31, 2014. The decrease was mainly driven by a Ps 26.6 billion decrease in dividend income and a Ps 24.5 billion decrease in income from non-financial sector investments.
The Ps 26.6 billion decrease in dividend income was mainly the result of a Ps 79.5 billion decrease in dividend income from Promigas from Ps 274.5 billion for the year ended December 31, 2013 to Ps 195.0 billion for the year December 31, 2014. This decrease was driven by a change in the dividend distribution schedule from an annual basis (active in March 2013 when dividends were declared) to a six-month basis (active in September 2013 and March 2014 when dividends were declared). Due to this change dividend income from Promigas in 2013 includes a full year dividend distribution on March 2013 and one half year dividend distribution on September 2013, while in 2014 it includes two half year dividend distribution on March and September 2014.
Partially offsetting this decrease was a Ps 45.9 billion increase in dividend from EEB (Empresa de Energía de Bogotá), a Ps 3.9 billion increase in in dividend income from Gas Natural and a Ps 3.2 billion increase in dividend income from Aerocali.
Income from non-financial sector investments, which reflects the operating performance of the non-financial subsidiaries consolidated by Corficolombiana, decreased by Ps 24.5 billion mainly driven by a Ps 95.3 billion decrease in the operating income from Epiandes (a toll road company) because 2013 was the last year in which deferred revenues related to government payments associated with the reduction of the term of the concession were recorded. This decrease was partially offset by a Ps 38.5 billion increase in the operating income from Episol (a toll road company) due to higher income from Ruta del Sol, Ps 12.6 billion increase in the operating income from Hoteles Estelar (a hotel chain company), a Ps 9.3 billion increase in the operating income from Pisa (a toll road company), a Ps 4.8 billion increase in the operating income from Valora (a real estate development company), a Ps 3.1 billion increase in the operating income from Lehner (a company in process of liquidation), and a Ps 2.4 billion increase in the operating income from Gas Comprimido del Perú (a gas company in Peru).
Operating expenses
|
Year ended December 31,
|
Change, December 2014 vs. December 2013
|
|||||||||||||||
|
|
2014
|
2013
|
# |
%
|
||||||||||||
|
|
(in Ps billions)
|
|||||||||||||||
|
Salaries and employee benefits
|
(58.4 | ) | (56.3 | ) | 2.1 | 3.7 | ||||||||||
|
Bonus plan payments
|
(2.7 | ) | (2.4 | ) | 0.2 | 9.6 | ||||||||||
|
Termination payments
|
(0.2 | ) | (0.3 | ) | (0.0 | ) | (13.2 | ) | ||||||||
|
Administrative and other expenses
|
(86.0 | ) | (81.8 | ) | 4.3 | 5.2 | ||||||||||
|
Deposit security, net
|
(10.0 | ) | (9.4 | ) | 0.6 | 6.3 | ||||||||||
|
Charitable and other donation expenses
|
(0.4 | ) | (0.7 | ) | (0.3 | ) | (40.9 | ) | ||||||||
|
Depreciation
|
(10.8 | ) | (6.0 | ) | 4.8 | 80.4 | ||||||||||
|
Goodwill amortization
|
– | – | – | – | ||||||||||||
|
Total operating expenses
|
(168.5 | ) | (156.8 | ) | 11.6 | 7.4 | ||||||||||
Corficolombiana’s total operating expenses increased by Ps 11.6 billion, or 7.4%, from Ps 156.8 billion for the year ended December 31, 2013 to Ps 168.5 billion for the year ended December 31, 2014. This increase was mainly driven by a Ps 4.8 billion increase in depreciation expense, a Ps 4.3 billion increase in administrative and other expenses, and a Ps 2.1 billion increase in salaries and employee benefits. Corficolombiana’s efficiency ratio deteriorated from 15.3% for the year ended December 31, 2013 to 18.5% for the year ended December 31, 2014 driven by the decrease in net interest income and in other operating income. The ratio of operating expense before depreciation and amortization as a percentage of average assets improved from 1.2% for the year ended December 31, 2013 to 1.1% for the year ended December 31, 2014.
Non-operating income
Total non-operating income increased by Ps 9.0 billion to Ps 17.0 billion for the year ended December 31, 2014 as compared to the same period of 2013. This increase was driven by higher income from the sale of properties, plant and equipment.
Income tax expense
Income tax expense decreased by Ps 27.8 billion to Ps 177.6 billion for the year ended December 31, 2014 mainly driven by a decrease in income before income tax expense and non-controlling interest. Corficolombiana’s effective tax rate, calculated before non-controlling interest, increased from 24.5% for the year ended December 31, 2013 to 25.9% for the year ended December 31, 2014. The change in the effective tax rate results from Corficolombiana and certain of its subsidiaries paying taxes on a presumptive income basis which means that, despite reporting losses or low gains before taxes, the companies pay taxes based on a percentage of their equity. For the year ended December 31, 2014 some of Corficolombiana’s subsidiaries had lower operating results as compared to the same period of 2013, resulting in an increase in the effective tax rate.
Non-controlling interest
Non-controlling interest decreased by Ps 7.3 billion to Ps 86.2 billion for the year ended December 31, 2014 from Ps 93.5 billion for the year ended December 31, 2013. This decrease was driven by a decrease in net income from some of Corficolombiana’s consolidated subsidiaries, mainly Epiandes and Hoteles Estelar, which contributed decreases in non-controlling interest of Ps 13.8 billion and Ps 12.7 billion, respectively. Partially offsetting these decreases was an increase in net income from certain other Corficolombiana consolidated subsidiaries, such as Pizano and Lehner, which resulted in increases in non-controlling interest of Ps 13.7 billion and Ps 5.8 billion, respectively.
Porvenir
Porvenir generates income primarily from fees on its customers’ pension contributions, which consist predominantly of monthly mandatory contributions. It also generates net interest income, composed almost entirely of investment income from the appreciation of Porvenir’s proprietary trading portfolio, which can be divided into two components: (1) income from its stabilization reserve, which is the legally required proprietary stake (1% of assets under management) in its funds that are subject to a minimum return guarantee; and (2) income from Porvenir’s investment portfolio, which includes income from fixed income securities and money market instruments. As a result, Porvenir’s revenue is mainly affected by the number of contributors, the salaries of contributors, any changes in applicable fee rates and the rate of return of its assets under management.
Net income
|
Year ended December 31,
|
Change, December 2014 vs. December 2013
|
|||||||||||||||
|
2014
|
2013
|
# |
%
|
|||||||||||||
|
(in Ps billions)
|
||||||||||||||||
|
Total interest income
|
101.8 | 23.8 | 78.0 | 328.5 | ||||||||||||
|
Total interest expense
|
(20.9 | ) | (13.8 | ) | 7.1 | 51.5 | ||||||||||
|
Net interest income
|
80.9 | 10.0 | 71.0 | 711.8 | ||||||||||||
|
Total (provisions) / reversals, net
|
(35.1 | ) | (4.5 | ) | 30.6 | 674.1 | ||||||||||
|
Total fees and other services income, net
|
650.7 | 611.4 | 39.3 | 6.4 | ||||||||||||
|
Total other operating income
|
30.9 | 39.5 | (8.7 | ) | (21.9 | ) | ||||||||||
|
Total operating income
|
727.3 | 656.3 | 71.0 | 10.8 | ||||||||||||
|
Total operating expenses
|
(328.5 | ) | (367.1 | ) | (38.6 | ) | (10.5 | ) | ||||||||
|
Net operating income
|
398.8 | 289.2 | 109.6 | 37.9 | ||||||||||||
|
Total non-operating income (expense), net
|
14.6 | 23.8 | (9.2 | ) | (38.6 | ) | ||||||||||
|
Income before income tax expense and non-controlling interest
|
413.4 | 313.0 | 100.4 | 32.1 | ||||||||||||
|
Income tax expense
|
(130.5 | ) | (104.8 | ) | 25.8 | 24.6 | ||||||||||
|
Income before non-controlling interest
|
282.9 | 208.3 | 74.6 | 35.8 | ||||||||||||
|
Non-controlling interest
|
(0.6 | ) | (6.6 | ) | (6.1 | ) | (91.6 | ) | ||||||||
|
Net income attributable to shareholders
|
282.3 | 201.6 | 80.7 | 40.0 | ||||||||||||
Net income for Porvenir increased by Ps 80.7 billion for the year ended December 31, 2014 to Ps 282.3 billion as compared to Ps 201.6 billion for the year ended December 31, 2013. This increase was driven by an increase in net interest income, an increase in total fees and other services income, net, a decrease in operating expenses, and a decrease in non-controlling interest. Partially offsetting these were an increase in total provisions, an increase in income tax expense, a decrease in total non-operating income and a decrease in total other operating income.
Net interest income
Net interest income increased by Ps 71.0 billion to Ps 80.9 billion for the year ended December 31, 2014 as compared to Ps 10.0 billion for the year ended December 31, 2013, which was mainly driven by a Ps 78.0 billion increase in income from investment securities and overnight funds. This increase in investment securities and overnight funds, in line with market trends, was primarily due to an increase in the rate of return of Porvenir’s mandatory investment in its stability reserve as prevailing market conditions during the year ended December 31, 2014 were more favorable due to local and global equity and fixed income market conditions than those prevailing during the year ended December 31, 2013. Porvenir’s rate of return on its investment portfolio increased from 2.1% for the year ended December 31, 2013 to 8.3% for the year ended December 31, 2014. Partially offsetting the increase in interest income was a Ps 7.1 billion increase in interest expense associated with a Ps 440.2 billion (U.S.$184 million) loan entered into by Porvenir to fund part of Horizonte’s acquisition.
Provisions
Porvenir’s net provisions increased by Ps 30.6 billion from a Ps 4.5 billion net expense for the year ended December 31, 2013 to a Ps 35.1 billion net expense for the year ended December 31, 2014. The increase in net provisions was mainly driven by an increase in accounts receivable from other pension funds managers associated to customers that change from one pension funds manager to another.
Total fees and other services income
Total net fees and other services income consists primarily of commissions earned on the administration of mandatory pension funds, severance funds, voluntary pension funds and third-party liability pension funds. Porvenir’s total net fees and other services income increased by Ps 39.3 billion, or 6.4%, to Ps 650.7 billion for the year ended December 31, 2014 as compared to Ps 611.4 billion for the year ended December 31, 2013.
Pension plan administration fees increased by Ps 34.4 billion to Ps 739.8 billion for the year ended December 31, 2014. This increase was primarily driven by a Ps 29.7 billion, or 6.0%, increase in fee income from the administration of mandatory pension funds due to an increase in the number of affiliate customers from 6.2 million as of December 31, 2013 to 6.8 million as of December 31, 2014.
Fee income from severance fund management increased by Ps 8.4 billion from Ps 105.4 billion for the year ended December 31, 2013 to Ps 113.7 billion for the year ended December 31, 2014. This increase was mainly due to an increase in the balance of assets under management in the severance funds.
Partially offsetting these increases were a Ps 5.3 billion decrease in revenues received from the administration of third-party liability pension funds from Ps 16.4 billion for the year ended December 31, 2013 to Ps 11.1 billion for the year ended December 31, 2014 and a Ps 0.7 billion decrease in fee income associated with the management of voluntary pension funds from Ps 64.2 billion for the year ended December 31, 2013 to Ps 63.5 billion for the year ended December 31, 2014
Fees and other service expenses decreased by Ps 4.1 billion, from Ps 94.7 billion for the year ended December 31, 2013 to Ps 90.7 billion for the year ended December 31, 2014.
Operating expenses
|
Year ended December 31,
|
Change, December 2014 vs. December 2013
|
|||||||||||||||
|
2014
|
2013
|
# |
%
|
|||||||||||||
|
(in Ps billions)
|
||||||||||||||||
|
Salaries and employee benefits
|
(112.0 | ) | (125.7 | ) | (13.8 | ) | (10.9 | ) | ||||||||
|
Bonus plan payments
|
(3.0 | ) | (16.2 | ) | (13.2 | ) | (81.3 | ) | ||||||||
|
Termination payments
|
(0.8 | ) | (0.4 | ) | 0.5 | 123.2 | ||||||||||
|
Administrative and other expenses
|
(191.9 | ) | (207.7 | ) | (15.8 | ) | (7.6 | ) | ||||||||
|
Deposit security, net
|
– | (0.1 | ) | (0.1 | ) | (100.0 | ) | |||||||||
|
Charitable and other donation expenses
|
(0.4 | ) | (1.3 | ) | (0.9 | ) | (66.9 | ) | ||||||||
|
Depreciation
|
(11.2 | ) | (9.5 | ) | 1.7 | 17.5 | ||||||||||
|
Goodwill amortization
|
(9.1 | ) | (6.1 | ) | 3.0 | 48.4 | ||||||||||
|
Total operating expenses
|
(328.5 | ) | (367.1 | ) | (38.6 | ) | (10.5 | ) | ||||||||
Porvenir’s total operating expenses decreased for the year ended December 31, 2014 by 10.5%, or Ps 38.6 billion, to Ps 328.5 billion primarily due to a Ps 15.8 billion decrease in administrative and other expenses, a Ps 13.8 billion decrease in salaries and employee benefits and a Ps 13.2 billion decrease in bonus plan payments. These decreases were mainly attributable to efficiencies resulting from the integration of Porvenir and Horizonte’s operations. Partially offsetting these decreases were a Ps 3.0 billion increase in goodwill amortization and a Ps 1.7 billion increase in depreciation expense. Porvenir’s efficiency ratio improved from 53.2% for the year ended December 31, 2013 to 40.4% for the year ended December 31, 2014.
Other operating income
Total other operating income decreased by Ps 8.7 billion for the year ended December 31, 2014 to Ps 30.9 billion from Ps 39.5 billion for the year ended December 31, 2013. This decrease was primarily due to a Ps 16.4 billion decrease in gains from foreign exchange and derivative operations offset in part by a Ps 7.8 billion increase in other operating income (which reflects income from Gestión & Contacto a subsidiary consolidated by Porvenir).
Non-operating income (expense, net)
Total non-operating income (expense), net includes provisions, gains on sale of property, administrative authority fines, and labor demand penalties. Total non-operating income (expense), net decreased by Ps 9.2 billion for the year ended December 31, 2014 from Ps 23.8 billion for the year ended December 31, 2013 to Ps 14.6 billion.
Income tax expense
Income tax expense increased by 24.6% to Ps 130.5 billion for the year ended December 31, 2014. This increase was driven primarily by a 32.1% increase in income before income tax expense and non-controlling interest. Porvenir’s effective tax rate, calculated before non-controlling interest, decreased from 33.5% for the year ended December 31, 2013 to 31.6% for the year ended December 31, 2014.
Non-controlling interest
Non-controlling interest decreased by Ps 6.1 billion to Ps 0.6 billion for the year ended December 31, 2014 as compared to Ps 6.6 billion for the year ended December 31, 2013. Non-controlling interest recorded for the year ended December 31, 2013 reflected the portion of Horizonte’s net income owned by third parties prior to Porvenir
merging its operations with Horizonte. Because Horizonte was merged into Porvenir on December 31, 2013, no non-controlling interest will be recorded for Horizonte.
LB Panamá
|
Year ended December 31,
|
Change, December 2014 vs. December 2013
|
|||||||||||||||
|
2014
|
2013
|
# |
%
|
|||||||||||||
|
(in Ps billions)
|
||||||||||||||||
|
Total interest income
|
2,676.5 | 1,983.8 | 692.7 | 34.9 | ||||||||||||
|
Total interest expense
|
(907.7 | ) | (606.4 | ) | 301.3 | 49.7 | ||||||||||
|
Net interest income
|
1,768.7 | 1,377.4 | 391.3 | 28.4 | ||||||||||||
|
Total (provisions) / reversals, net
|
(340.0 | ) | (244.2 | ) | 95.8 | 39.2 | ||||||||||
|
Total fees and other services income, net
|
944.5 | 750.6 | 193.9 | 25.8 | ||||||||||||
|
Total other operating income
|
105.9 | 113.8 | (8.0 | ) | (7.0 | ) | ||||||||||
|
Total operating income
|
2,479.1 | 1,997.6 | 481.5 | 24.1 | ||||||||||||
|
Total operating expenses
|
(1,778.7 | ) | (1,360.4 | ) | 418.3 | 30.8 | ||||||||||
|
Net operating income
|
700.4 | 637.2 | 63.2 | 9.9 | ||||||||||||
|
Total non-operating income (expense), net
|
25.7 | 7.9 | 17.8 | 225.4 | ||||||||||||
|
Income before income tax expense and non-controlling interest
|
726.1 | 645.1 | 81.0 | 12.6 | ||||||||||||
|
Income tax expense
|
(223.0 | ) | (164.2 | ) | 58.7 | 35.7 | ||||||||||
|
Income before non-controlling interest
|
503.1 | 480.9 | 22.3 | 4.6 | ||||||||||||
|
Non-controlling interest
|
(1.1 | ) | (0.1 | ) | 1.1 | 1,590.2 | ||||||||||
|
Net income attributable to shareholders
|
502.0 | 480.8 | 21.2 | 4.4 | ||||||||||||
LB Panamá’s financial information is prepared in accordance with Colombian Banking GAAP and primarily reflects (i) BAC Credomatic’s consolidated results since December 2010 (including Grupo Financiero Reformador and Banco BAC de Panamá, merged into BAC International Bank, Inc. on December 14, 2013, since December 2013). As of December 31, 2014, LB Panamá’s unconsolidated balance sheet carried goodwill of Ps 3,031.3 billion (U.S.$ 1,267 million) resulting from the direct acquisitions the company made of BAC Credomatic and Banco BAC de Panamá. LB Panamá’s unconsolidated balance sheet also includes Ps 2,527.2 billion (U.S.$1,056 million) of indebtedness, including Ps 646.0 billion (U.S.$270 million) incurred to fund a portion of our acquisition of BAC Credomatic and Ps 1,881.2 billion (U.S.$786 million) of additional indebtedness, of which Ps 589.3 billion (U.S.$246 million) is owed to Grupo Aval Limited and Ps 1,291.9 billion (U.S.$540 million) is owed to Deutsche Bank. As of December 31, 2014, LB Panamá had a fixed income portfolio of Ps 1,757.8 billion (U.S.$735 million) comprised mainly of investment grade bonds issued by Latin American sovereign and corporate issuers, acquired pursuant to Banco de Bogotá’s investment guidelines.
Because the acquisitions of Grupo Financiero Reformador and BBVA Panamá took place during December 2013, the income statement for 2013 does not include the results from these businesses. The results from of Grupo Financiero Reformador and Banco BAC de Panamá were consolidated into LB Panamá’s income statement for the first time during 2014.
LB Panamá’s net income attributable to shareholders for the year ended December 31, 2014 increased by 4.4%, or Ps 21.2 billion, to Ps 502.0 billion. This increase was mainly driven by an increase in net interest income, an increase in total fees and other services income, net, and an increase in total non-operating income. These increases were partially offset by an increase in total operating expenses, an increases in total provisions, net, an increase in income tax expense, and a decrease in total other operating income.
Net interest income
|
Year ended December 31,
|
Change, December 2014 vs. December 2013
|
|||||||||||||||
|
2014
|
2013
|
# |
%
|
|||||||||||||
|
(in Ps billions)
|
||||||||||||||||
|
Interest income:
|
||||||||||||||||
|
Interest on loans
|
2,411.0 | 1,764.4 | 646.6 | 36.7 | ||||||||||||
|
Interest on investment securities
|
199.0 | 161.4 | 37.7 | 23.3 | ||||||||||||
|
Interbank and overnight funds
|
34.6 | 30.5 | 4.2 | 13.7 | ||||||||||||
|
Financial leases
|
31.8 | 27.6 | 4.2 | 15.3 | ||||||||||||
|
Total interest income
|
2,676.5 | 1,983.8 | 692.7 | 34.9 | ||||||||||||
|
Interest expense:
|
||||||||||||||||
|
Checking accounts
|
(47.1 | ) | (35.4 | ) | 11.7 | 33.0 | ||||||||||
|
Time deposits
|
(467.3 | ) | (297.7 | ) | 169.6 | 57.0 | ||||||||||
|
Savings deposits
|
(58.0 | ) | (39.7 | ) | 18.3 | 46.2 | ||||||||||
|
Total interest expense from deposits
|
(572.4 | ) | (372.8 | ) | 199.7 | 53.6 | ||||||||||
|
Borrowing from banks and others
|
(287.6 | ) | (197.9 | ) | 89.7 | 45.3 | ||||||||||
|
Interbank and overnight funds (expenses)
|
(6.0 | ) | (3.9 | ) | 2.1 | 54.7 | ||||||||||
|
Long-term debt (bonds)
|
(41.7 | ) | (31.9 | ) | 9.8 | 30.9 | ||||||||||
|
Total interest expense
|
(907.7 | ) | (606.4 | ) | 301.3 | 49.7 | ||||||||||
|
Net interest income
|
1,768.7 | 1,377.4 | 391.3 | 28.4 | ||||||||||||
LB Panamá’s net interest income increased by 28.4%, or Ps 391.3 billion, from Ps 1,377.4 billion for the year ended December 31, 2014 to Ps 1,768.7 billion for the year ended December 31, 2014. This increase was primarily driven by a Ps 692.7 billion increase in total interest income, of which Ps 650.9 billion was attributable to an increase in interest income from loans and financial leases. The increase in total interest income was partially offset by a Ps 301.3 billion increase in total interest expense.
Interest income from loans and financial leases increased by 36.3%, or Ps 650.9 billion, to Ps 2,442.8 billion for the year ended December 31, 2014. LB Panamá’s average loans and financial lease portfolio grew by 50.8%, or Ps 7,287.4 billion, to Ps 21,625.1 billion for the year ended December 31, 2014, resulting in a Ps 823.2 billion increase in interest income from loans and financial leases. The increase in the average loan and financial leases portfolio was principally driven by a combination of inorganic growth from the Central American acquisitions, organic growth and the impact of the devaluation of the peso. Partially offsetting this increase in interest income was the decrease in average yield on loans and financial leases from 12.5% for the year ended December 31, 2013 to 11.3% for the year ended December 31, 2014, which resulted in a Ps 172.3 billion decrease in interest income from loans and financial leases. The change in the average yield was the result of a change in the mix in the loan and financial lease portfolio as the Central American acquisitions consist of a greater portion of commercial loans (including financial leases) compared to BAC Credomatic’s loan portfolio.
Interest income from investment securities increased by Ps 37.7 billion to Ps 199.0 billion for the year ended December 31, 2014. This increase was mainly driven by an increase in the average volume of the investment portfolio of Ps 699.4 billion from Ps 3,320.1 billion for the year ended December 31, 2013, to Ps 4,019.5 billion for the year ended December 31, 2014, resulting in a Ps 34.6 billion increase in interest income. The increase in the average volume of the investment portfolio was driven by a combination of organic growth, inorganic growth from the Central American acquisitions and the impact of the devaluation of the peso. Also contributing to the increase in income from investment securities was an increase in the average yield of the investment portfolio from 4.9% for the year ended December 31, 2013 to 5.0% for the year ended December 31, 2014, which resulted in a Ps 3.0 billion increase in interest income from investment securities.
Interest income from interbank and overnight funds increased by Ps 4.2 billion from Ps 30.5 billion for the year ended December 31, 2013 to Ps 34.6 billion for the year ended December 31, 2014. The increase in interest income from interbank and overnight funds was mainly driven by an increase in the average rate earned on interbank and overnight funds from 4.0% for the year ended December 31, 2013 to 4.6% for the year ended December 31, 2014, which resulted in a Ps 4.9 billion increase in interest income. This increase was offset in part by a decrease in the average balance of interbank and overnight funds from Ps 770.5 billion for the year ended December 31, 2013 to Ps 753.5 for the year ended December 31, 2014, resulting in a Ps 0.8 billion decrease in interest income.
The average yield earned on interest earning assets decreased from 10.8% for the year ended December 31, 2013 to 10.1% for the year ended December 31, 2014, as a result of the decrease in the average yield on loans and financial leases associated with the change in the mix of the loan portfolio.
Total interest expense increased by Ps 301.3 billion to Ps 907.7 billion for the year ended December 31, 2014, mainly driven by a Ps 8,894.9 billion, or 45.5%, increase in the average balance of interest-beraing liabilities and by an increase of 9 basis points in the average cost of funds from 3.1% for the year ended December 31, 2013 to 3.2% for the year ended December 31, 2014. Total interest expense for interest-bearing deposits increased by Ps 199.7 billion to Ps 572.4 billion for the year ended December 31, 2014 mainly driven by a Ps 6,687.9 billion, or 48.9%, increase in the average balance of interest-bearing deposits and by an 8 basis points increase in the average cost of funds from 2.7% for the year ended December 31, 2013 to 2.8% for the year ended December 31, 2014.
The Ps 301.3 billion increase in interest expense was mainly driven by a Ps 169.6 billion increase in interest expense on time deposits, a Ps 89.7 billion increase in interest expense on borrowings from banks and others, a Ps 18.3 billion increase in interest expense on savings deposits, a Ps 11.7 billion increase in interest expense on interest-bearing checking accounts, a Ps 9.8 billion increase in interest expense on long-term debt, and a Ps 2.1 billion increase in interest expense on interbank and overnight funds.
The Ps 169.6 billion increase in interest expense on time deposits was mainly driven by a Ps 3,956.5 billion increase in the average balance of time deposits from Ps 5,845.6 billion for the year ended December 31, 2013 to Ps 9,802.1 billion for the year ended December 31, 2014, which resulted in an increase of Ps 188.6 billion in interest expense. The increase in the average balance of time deposits was driven by a combination of inorganic growth from the Central American acquisitions, organic growth and the impact of the devaluation of the peso. Partially offsetting this increase was a decrease in the average interest rate paid from 5.1% for the year ended December 31, 2013 to 4.8% for the year ended December 31, 2014, resulting in a Ps 19.0 billion decrease in interest expense.
The increase in interest expense on borrowings from banks and others of Ps 89.7 billion was driven by a Ps 2,009.6 billion increase in the average balance from Ps 5,351.9 billion to Ps 7,361.5 billion, which resulted in a Ps 78.5 billion increase in interest expense. The increase in the average balance of borrowings from banks and others was mainly driven by a combination of organic growth, inorganic growth from the Central American acquisitions and the impact of the devaluation of the peso. Also contributing to the increase in interest expense was an increase in the average interest rate paid from 3.7% for the year ended December 31, 2013 to 3.9% for the year ended December 31, 2014, the increase in the cost of these funds resulted in a Ps 11.2 billion increase in interest expense.
The Ps 18.3 billion increase in interest expense on savings deposits was driven by a Ps 1,253.9 billion increase in the average balance of these funds from Ps 2,983.8 billion for the year ended December 31, 2013 to Ps 4,237.7 billion for the year ended December 31, 2014, which contributed an increase of Ps 17.2 billion in interest expense. The increase in the average balance of savings deposits was driven by a combination of inorganic growth from the Central American acquisitions, organic growth and the impact of the devaluation of the peso. Also contributing to the increase in interest expense was an increase in the average interest rate paid which rose from 1.3% for the year ended December 31, 2013 to 1.4% for the year ended December 31, 2014 resulting in a Ps 1.2 billion increase in interest expense.
The increase in interest expense on interest-bearing checking accounts of Ps 11.7 billion was driven by a Ps 1,477.5 billion increase in the average balance of checking accounts from Ps 4,837.6 billion to Ps 6,315.2 billion, which contributed a Ps 11.0 billion increase in interest expense. The increase in the average balance of checking accounts was driven by a combination of inorganic growth from the Central American acquisitions, organic growth and the impact of the devaluation of the peso. Also contributing to the increase in interest expense on checking accounts was a slight increase in the average interest rate paid from 0.73% for the year ended December 31, 2013 to 0.75% for the year ended December 31, 2014 resulting in a Ps 0.7 billion increase in interest expense.
The Ps 9.8 billion increase in interest expense on long-term debt was driven by a Ps 159.6 billion increase in the average balance of long-term debt from Ps 466.7 billion to Ps 626.3 billion, resulting in a Ps 10.6 billion increase in interest expense. Partially offsetting this increase was a decrease in the average interest rate paid from 6.8% for the year ended December 31, 2013 to 6.7% for the year ended December 31, 2014, which resulted in a Ps 0.8 billion decrease in interest expense.
The increase in interest expense from interbank and overnight funds of Ps 2.1 billion was driven by a Ps 37.9 billion increase in the average balance of interbank and overnight funds to Ps 109.1 billion for the year ended December 31, 2014, resulting in a Ps 2.1 billion increase in interest expense, and by an increase in the average interest rate paid from 5.4% for the year ended December 31, 2013 to 5.5% for the year ended December 31, 2014, which resulted in a Ps 0.1 billion increase in interest expense.
The average rate paid on LB Panamá’s total interest-bearing liabilities slightly increased from 3.1% for the year ended December 31, 2013 to 3.2% for the year ended December 31, 2014.
Average total interest earning assets in LB Panamá increased by 43.2% or Ps 7,969.8 billion for the year ended December 31, 2014 compared to the year ended December 31, 2013 due to both organic and inorganic growth, while net interest income increased by 28.4%. This resulted in a contraction of the net interest margin from 7.5% for the year ended December 31, 2013 to 6.7% for the year ended December 31, 2014. In line with this trend, the interest spread between the average rate on loans and financial leases and the average rate paid on deposits decreased from 9.8% to 8.5%.
Both the decrease in net interest margin and the decrease in the spread between the average yield earned on loans and financial leases and the average rate paid on deposits were mainly driven by the decrease in the yield of the loan and financial lease portfolio.
Provisions
Total net provision expense of LB Panamá increased by Ps 95.8 billion to Ps 340.0 billion for the year ended December 31, 2014, driven primarily by a Ps 86.1 billion increase in net provisions for loans and financial leases and a Ps 10.9 billion increase in net provisions for foreclosed assets and other assets.
The Ps 95.8 billion increase in net provision expense for loan and financial lease losses was mainly driven by (i) the effects of the acquisitions of Grupo Reformador and BBVA Panamá in December 2013; (ii) the organic growth of BAC Credomatic’s Operation and (iii) the impact of the devaluation of the peso. LB Panamá’s delinquency ratio, measured as loans at least 30 days past due as a percentage of total loans, remained basically unchanged at 2.6% for both December 31, 2013 and December 31, 2014. The ratio of net provisions for loans and financial lease to average loans and financial leases decreased from 1.6% for the year ended December 31, 2013 to 1.5% for the year ended December 31, 2014.
Charge-offs increased from Ps 175.1 billion for the year ended December 31, 2013 to Ps 312.4 billion for the year ended December 31, 2014. LB Panamá’s ratio of charge-offs to average loans and financial leases increased from 1.2% for the year ended December 31, 2013 to 1.4% for the year ended December 31, 2014. LB Panamá’s allowance for loan and financial lease losses increased by Ps 112.4 billion from Ps 420.1 billion as of December 31, 2013 to Ps 532.5 billion as of December 31, 2014. LB Panamá’s coverage ratio over its past due loans was 74.5% as of December 31, 2014. The increase in charge-offs was mainly driven by the impact from the Central American acquisitions.
Net provisions for foreclosed assets and other assets increased by Ps 10.9 billion to a net expense of Ps 16.6 billion for the year ended December 31, 2014 from a net expense of Ps 5.6 billion for the year ended December 31, 2013.
Net provisions for accrued interest and other receivables increased by Ps 1.9 billion to a net expense of Ps 2.4 billion for the year ended December 31, 2014 from a net expense of Ps 0.4 billion for the year ended December 31, 2013.
The recovery of charged-off assets increased by Ps 3.2 billion to Ps 4.6 billion for the year ended December 31, 2014 from Ps 1.4 billion for the year ended December 31, 2013.
Total fees and other services income
|
Year ended December 31,
|
Change, December 2014 vs. December 2013
|
|||||||||||||||
|
2014
|
2013
|
# |
%
|
|||||||||||||
|
(in Ps billions)
|
||||||||||||||||
|
Fees and other services income:
|
||||||||||||||||
|
Commissions from banking services
|
695.3 | 528.4 | 167.0 | 31.6 | ||||||||||||
|
Branch network services
|
– | – | – | – | ||||||||||||
|
Credit card merchant fees
|
238.5 | 219.6 | 18.9 | 8.6 | ||||||||||||
|
Checking fees
|
– | – | – | – | ||||||||||||
|
Warehouse services
|
– | – | – | – | ||||||||||||
|
Fiduciary activities
|
– | – | – | – | ||||||||||||
|
Pension plan administration
|
13.6 | 16.1 | (2.5 | ) | (15.7 | ) | ||||||||||
|
Other
|
79.3 | 66.2 | 13.2 | 19.9 | ||||||||||||
|
Total fees and other services income
|
1,026.7 | 830.2 | 196.5 | 23.7 | ||||||||||||
|
Fees and other services expenses
|
(82.2 | ) | (79.6 | ) | 2.6 | 3.2 | ||||||||||
|
Total fees and other services income, net
|
944.5 | 750.6 | 193.9 | 25.8 | ||||||||||||
Total net fees and other services income increased by 25.8%, or Ps 193.9 billion, to Ps 944.5 billion for the year ended December 31, 2014.
Of the Ps 193.9 billion increase in total net fees and other services income, Ps 52.0 billion, or 26.8%, was attributable to an increase in the average exchange rate used to translate LB Panamá’s financial statements from U.S. dollars to Colombian pesos. The average exchange rate increased from Ps 1,879.53 per U.S.$1.00 for 2013 to Ps 2,017.85 per U.S.$1.00 for the 2014 financial statements. In the absence of the impact of this increase in the average exchange rate, LB Panamá’s total net fees and other services income would have increased by 17.7%, or Ps 142.0 billion.
This Ps 142.0 billion increase was driven by a Ps 130.0 billion increase in commissions from banking services, a Ps 8.4 billion increase in other fees and a Ps 4.1 billion increase in credit card and merchant fees. These increases were driven by the organic and inorganic growth of the business.
Other operating income
|
Year ended December 31,
|
Change, December 2014 vs. December 2013
|
|||||||||||||||
|
2014
|
2013
|
# |
%
|
|||||||||||||
|
(in Ps billions)
|
||||||||||||||||
|
Foreign exchange gains (losses), net
|
102.6 | 110.1 | (7.6 | ) | (6.9 | ) | ||||||||||
|
Gains on derivative operations, net
|
3.0 | 3.5 | (0.5 | ) | (14.6 | ) | ||||||||||
|
Gains on sales of investments in equity securities, net
|
– | – | – | – | ||||||||||||
|
Income from non-financial sector, net
|
– | – | – | – | ||||||||||||
|
Dividend income
|
– | – | – | – | ||||||||||||
|
Other
|
0.3 | 0.2 | 0.1 | 64.3 | ||||||||||||
|
Other operating income
|
105.9 | 113.8 | (8.0 | ) | (7.0 | ) | ||||||||||
Total other operating income decreased by Ps 8.0 billion to Ps 105.9 billion for the year ended December 31, 2014 due primarily to a Ps 8.1 billion decrease in gains from foreign exchange and derivative operations. In the ordinary course of business, LB Panamá enters into forward contracts and other derivatives transactions in foreign currency almost entirely for hedging purposes and on behalf of its clients.
Operating expenses
|
Year ended December 31,
|
Change, December 2014 vs. December 2013
|
|||||||||||||||
|
2014
|
2013
|
# |
%
|
|||||||||||||
|
(in Ps billions)
|
||||||||||||||||
|
Salaries and employee benefits
|
(767.5 | ) | (576.3 | ) | 191.2 | 33.2 | ||||||||||
|
Bonus plan payments
|
(63.9 | ) | (66.6 | ) | (2.7 | ) | (4.1 | ) | ||||||||
|
Termination payments
|
(20.0 | ) | (13.5 | ) | 6.6 | 48.8 | ||||||||||
|
Administrative and other expenses
|
(739.0 | ) | (577.5 | ) | 161.5 | 28.0 | ||||||||||
|
Deposit security, net
|
(16.9 | ) | (10.6 | ) | 6.3 | 59.8 | ||||||||||
|
Charitable and other donation expenses
|
(3.2 | ) | (1.9 | ) | 1.3 | 68.1 | ||||||||||
|
Depreciation
|
(72.2 | ) | (57.4 | ) | 14.8 | 25.9 | ||||||||||
|
Goodwill amortization
|
(95.9 | ) | (56.6 | ) | 39.4 | 69.6 | ||||||||||
|
Total operating expenses
|
(1,778.7 | ) | (1,360.4 | ) | 418.3 | 30.8 | ||||||||||
Total operating expenses increased by 30.8%, or Ps 418.3 billion, to Ps 1,778.7 billion for the year ended December 31, 2014.
Of the Ps 418.3 billion increase in total operating expense, Ps 94.9 billion was attributable to an increase in the average exchange rate used to translate LB Panamá’s financial statements from U.S. dollars to Colombian pesos. The average exchange rate increased from Ps 1,879.53 per U.S.$1.00 for 2013 to Ps 2,017.85 per U.S.$1.00 for the 2014 financial statements. In the absence of the impact of this increase in the average exchange rate, LB Panamá’s operating expenses would have increased by 22.2%, or Ps 323.5 billion.
The Ps 323.5 billion increase was driven by a Ps 150.5 billion increase in salaries and employee benefits, a Ps 121.7 billion increase in administrative and other expenses principally driven by the organic and inorganic growth of the business. Also contributing to the increase in operating expenses was a Ps 35.3 billion increase in goodwill amortizations, associated to Central American acquisitions, and a Ps 10.8 billion increase in depreciation expense.
Despite a deterioration of LB Panamá’s efficiency ratio calculated as operating expenses before depreciation and amortization divided by operating income before net provision expense from 55.6% for the year ended December 31, 2013 to 57.1% for the year ended December 31, 2014, the ratio of operating expenses before depreciation and amortization as a percentage of average assets improved from 4.9% for the year ended December 31, 2013 to 4.3% for the year ended December 31, 2014.
Non-operating income (expense)
Total net non-operating income (expense) increased by Ps 17.8 billion to Ps 25.7 billion for the year ended December 31, 2014 from Ps 7.9 for the year ended December 31, 2013. This increase was mainly due to the translation effect from the income statement from U.S. dollars to Colombian pesos driven by the depreciation of the Colombian peso during 2014.
Income tax expense
Income tax expense for LB Panamá increased Ps 58.7 billion, to Ps 223.0 billion for the year ended December 31, 2014. LB Panamá’s effective tax rate, calculated before non-controlling interest, increased from 25.5% for the year ended December 31, 2013 to 30.7% for the year ended December 31, 2014. The increase in the effective tax rate was mainly driven by an increase in goodwill amortization derived from the Central American acquisitions, which is a non-deductable expense.
Banco de Occidente
Net income
Banco de Occidente’s net income for the year ended December 31, 2014 was positively affected by a net gain of 729.8 billion associated with the reclassification of its investment in Corficolombiana from its available for sale
portfolio to its trading portfolio, and with the sale of part of these shares to Grupo Aval. On December 17, 2014, Grupo Aval acquired from Banco de Occidente a 9.3% direct interest in Corficolombiana through the purchase of 20,008,260 common shares at a purchase price of Ps 38,459 per share. This price corresponds to the weighted average trading price of such shares on the Colombian Stock Exchange during the week immediately prior to this purchase. This positive effect is not reflected in Grupo Aval’s consolidated financials as both Banco de Occidente and Corficolombiana are consolidated on a book value basis.
|
Year ended December 31,
|
Change, December 2014 vs. December 2013
|
|||||||||||||||
|
2014
|
2013
|
# |
%
|
|||||||||||||
|
(in Ps billions)
|
||||||||||||||||
|
Total interest income
|
3,005.1 | 2,050.6 | 954.4 | 46.5 | ||||||||||||
|
Total interest expense
|
(842.5 | ) | (722.5 | ) | 120.0 | 16.6 | ||||||||||
|
Net interest income
|
2,162.6 | 1,328.1 | 834.5 | 62.8 | ||||||||||||
|
Total (provisions) / reversals, net
|
(367.8 | ) | (320.9 | ) | 46.9 | 14.6 | ||||||||||
|
Total fees and other services income, net
|
258.5 | 254.7 | 3.8 | 1.5 | ||||||||||||
|
Total other operating income
|
391.8 | 320.8 | 71.1 | 22.2 | ||||||||||||
|
Total operating income
|
2,445.2 | 1,582.7 | 862.5 | 54.5 | ||||||||||||
|
Total operating expenses
|
(1,113.0 | ) | (1,010.1 | ) | 102.9 | 10.2 | ||||||||||
|
Net operating income
|
1,332.2 | 572.6 | 759.6 | 132.7 | ||||||||||||
|
Total non-operating income (expense), net
|
28.0 | 12.3 | 15.7 | 128.4 | ||||||||||||
|
Income before income tax expense and non-controlling interest
|
1,360.2 | 584.8 | 775.3 | 132.6 | ||||||||||||
|
Income tax expense
|
(163.1 | ) | (155.5 | ) | 7.6 | 4.9 | ||||||||||
|
Income before non-controlling interest
|
1,197.1 | 429.4 | 767.7 | 178.8 | ||||||||||||
|
Non-controlling interest
|
(1.5 | ) | (1.2 | ) | 0.3 | 25.3 | ||||||||||
|
Net income attributable to shareholders
|
1,195.5 | 428.2 | 767.4 | 179.2 | ||||||||||||
|
Corficolombiana’s
effect
|
Banco de Occidente excluding
Corficolombiana’s effect in 2014
|
|||||||||||||||||||
|
Year ended December 31,
|
Year ended
December 31,
|
Change, December 2014 vs. December 2013
|
||||||||||||||||||
|
2014
|
2014
|
2013
|
# |
%
|
||||||||||||||||
|
(in Ps billions)
|
||||||||||||||||||||
|
Total interest income
|
720.9 | 2,284.2 | 2,050.6 | 233.6 | 11.4 | |||||||||||||||
|
Total interest expense
|
- | (842.5 | ) | (722.5 | ) | 120.0 | 16.6 | |||||||||||||
|
Net interest income
|
720.9 | 1,441.7 | 1,328.1 | 113.6 | 8.6 | |||||||||||||||
|
Total (provisions) / reversals, net
|
- | (367.8 | ) | (320.9 | ) | 46.9 | 14.6 | |||||||||||||
|
Total fees and other services income, net
|
- | 258.5 | 254.7 | 3.8 | 1.5 | |||||||||||||||
|
Total other operating income
|
9.0 | 382.9 | 320.8 | 62.1 | 19.4 | |||||||||||||||
|
Total operating income
|
729.8 | 1,715.4 | 1,582.7 | 132.7 | 8.4 | |||||||||||||||
|
Total operating expenses
|
- | (1,113.0 | ) | (1,010.1 | ) | 102.9 | 10.2 | |||||||||||||
|
Net operating income
|
729.8 | 602.3 | 572.6 | 29.7 | 5.2 | |||||||||||||||
|
Total non-operating income (expense), net
|
- | 28.0 | 12.3 | 15.7 | 128.4 | |||||||||||||||
|
Income before income tax expense and non-controlling interest
|
729.8 | 630.3 | 584.8 | 45.5 | 7.8 | |||||||||||||||
|
Income tax expense
|
- | (163.1 | ) | (155.5 | ) | 7.6 | 4.9 | |||||||||||||
|
Income before non-controlling interest
|
729.8 | 467.3 | 429.4 | 37.9 | 8.8 | |||||||||||||||
|
Non-controlling interest
|
- | (1.5 | ) | (1.2 | ) | 0.3 | 25.3 | |||||||||||||
|
Net income attributable to shareholders
|
729.8 | 465.7 | 428.2 | 37.6 | 8.8 | |||||||||||||||
Banco de Occidente, excluding the Corficolombiana effect
In order to fully reflect the ongoing business of Banco de Occidente, the discussion and analysis of results that follows excludes the non-recurring Corficolombiana effect.
Net interest income
|
Banco de Occidente excluding
Corficolombiana’s effect in 2014
|
||||||||||||||||
|
Year ended December 31,
|
Change, December 2014 vs. December 2013
|
|||||||||||||||
|
2014
|
2013
|
# |
%
|
|||||||||||||
|
(in Ps billions)
|
||||||||||||||||
|
Interest income:
|
||||||||||||||||
|
Interest on loans
|
1,585.9 | 1,458.3 | 127.6 | 8.8 | ||||||||||||
|
Interest on investment securities
|
227.1 | 125.1 | 101.9 | 81.5 | ||||||||||||
|
Interbank and overnight funds
|
43.8 | 41.5 | 2.3 | 5.5 | ||||||||||||
|
Financial leases
|
427.4 | 425.7 | 1.7 | 0.4 | ||||||||||||
|
Total interest income
|
2,284.2 | 2,050.6 | 233.6 | 11.4 | ||||||||||||
|
Interest expense:
|
||||||||||||||||
|
Checking accounts
|
(13.9 | ) | (10.8 | ) | 3.1 | 28.3 | ||||||||||
|
Time deposits
|
(281.3 | ) | (237.1 | ) | 44.1 | 18.6 | ||||||||||
|
Savings deposits
|
(342.9 | ) | (241.1 | ) | 101.8 | 42.2 | ||||||||||
|
Total interest expense from deposits
|
(638.0 | ) | (489.0 | ) | 149.0 | 30.5 | ||||||||||
|
Borrowing from banks and others
|
(49.3 | ) | (59.8 | ) | (10.6 | ) | (17.7 | ) | ||||||||
|
Interbank and overnight funds (expenses)
|
(7.2 | ) | (17.1 | ) | (9.9 | ) | (57.8 | ) | ||||||||
|
Long-term debt (bonds)
|
(148.0 | ) | (156.5 | ) | (8.6 | ) | (5.5 | ) | ||||||||
|
Total interest expense
|
(842.5 | ) | (722.5 | ) | 120.0 | 16.6 | ||||||||||
|
Net interest income
|
1,441.7 | 1,328.1 | 113.6 | 8.6 | ||||||||||||
Banco de Occidente’s net interest income grew by 8.6%, or Ps 113.6 billion, from Ps 1,328.1 billion for the year ended December 31, 2013 to Ps 1,441.7 billion for the year ended December 31, 2014. This increase was driven primarily by a Ps 233.6 billion increase in total interest income offset in part by a Ps 120.0 billion increase in total interest expense.
Interest income from loans and financial leases increased by 6.9%, or Ps 129.3 billion, to Ps 2,013.4 billion for the year ended December 31, 2014 compared to the same period of 2013. Banco de Occidente’s average loans and financial lease portfolio grew by 13.6%, or Ps 2,397.3 billion, to Ps 20,056.0 billion, resulting in a Ps 232.0 billion increase in interest income from loans and financial leases. The balance of commercial loans (including financial leases) and consumer loans increased by Ps 527.8 billion and Ps 951.6 billion, respectively between December 31, 2013 and December 31, 2014. Partially offsetting the increase in interest income from loans and financial leases, derived from a higher average loan and financial lease portfolio, was the decrease in their average yield from 10.7% for the year ended December 31, 2013 to 10.0% for the year ended December 31, 2014, which resulted in a Ps 102.6 billion decrease in interest income from loans and financial leases. The decrease in the yield was a result of (i) a decreasing rate environment in Colombia where the average DTF rate decreased from 4.24% for the year ended December 31, 2013 to 4.07% for the year ended December 31, 2014 and (ii) the competitive landscape in Colombia.
Interest income from investment securities increased by Ps 101.9 billion to Ps 227.1 billion for the year ended December 31, 2014. The fixed income portfolio generated Ps 203.8 billion, or 89.8% of Banco de Occidente’s earnings on investment securities for the year ended December 31, 2014, while the equity portfolio generated Ps 23.3 billion, or 10.2% of earnings from investment securities. The Ps 101.9 billion increase was driven by (i) an increase in the average yield earned on investment securities from 2.5% for the year ended December 31, 2013 to 3.6% for the same period in 2014, which resulted in a Ps 52.5 billion increase interest income, and (ii) an increase in the average balance of the investment portfolio of Ps 1,338.7 billion, or 26.5%, to Ps 6,381.8 billion for the year ended December 31, 2014, resulting in a Ps 49.4 billion increase in interest income.
The average yield earned on interest earning assets decreased from 8.9% for the year ended December 31, 2013 to 8.5% for the year ended December 31, 2014, primarily as a result of the decline in the yield from the loans and financial leases portfolio described above.
Total interest expense increased by Ps 120.0 billion to Ps 842.5 billion for the year ended December 31, 2014, mainly driven by a Ps 3,337.8 billion, or 18.2%, increase in the average balance of interest-beraing liabilities, offset in part by a 5 basis points decrease in the average cost of funds from 3.94% for the year ended December 31, 2013 to 3.89% for the year ended December 31, 2014. Total interest expense for interest-bearing deposits increased by Ps 149.0 billion to Ps 638.0 billion for the year ended December 31, 2014 mainly driven by a Ps 3,846.9 billion, or 28.2%, increase in the average balance of interest-bearing deposits and by a 6 basis points increase in the average cost of funds from 3.58% for the year ended December 31, 2013 to 3.64% for the year ended December 31, 2014.
The 16.6%, or Ps 120.0 billion, increase in total interest expense to Ps 842.5 billion for the year ended December 31, 2014 was mainly driven by a Ps 149.0 billion increase in interest expense from deposits (Ps 101.8 billion in interest expense on savings deposits, Ps 44.1 billion in interest expense on time deposits and Ps 3.1 billion interest expense on interest-bearing checking accounts) associated with a Ps 3,846.9 billion increase in the average balance of deposits. Partially offsetting these increases in interest expense were a Ps 10.6 billion decrease in interest expense on borrowings from banks and others, a Ps 9.9 billion decrease in interest expense on interbank and overnight funds and a Ps 8.6 billion decrease in interest expense on long-term debt.
The increase in interest expense on savings deposits of Ps 101.8 billion was driven by an increase in the average balance of savings deposits from Ps 7,703.6 billion for the year ended December 31, 2013 to Ps 9,876.0 billion for the year ended December 31, 2014, which resulted in a Ps 75.8 billion increase in interest expense. Also contributing to the increase in interest expense was an increase in the average interest rate paid on savings deposits from 3.1% for the year ended December 31, 2013 to 3.5% for the year ended December 31, 2014, resulting in Ps 26.0 billion increase in interest expense.
The Ps 44.1 billion increase in interest expense on time deposits was driven by an increase in the average balance of time deposits from Ps 5,100.3 billion for the year ended December 31, 2013 to Ps 6,383.8 billion for the year ended December 31, 2014 contributing with an increase of Ps 57.0 billion in interest expense. Partially offsetting this increase in interest expense was a decrease in the average interest rate paid on time deposits from 4.6% for the year ended December 31, 2013 to 4.4% for the year ended December 31, 2014. This decrease in the rate paid was consistent with a decreasing interest-rate environment and resulted in a Ps 12.8 billion decrease in interest expense.
The increase in interest expense on interest-bearing checking accounts of Ps 3.1 billion was driven primarily by a Ps 391.1 billion increase in the average balance of checking accounts to Ps 1,248.4 billion for the year ended December 31, 2014, which resulted in a Ps 4.3 billion increase in interest expense. This decrease was offset in part by a decrease in the average interest rate paid on checking accounts, consistent with the decreasing interest-rate environment, from 1.3% for the year ended December 31, 2013 to 1.1% for the year ended December 31, 2014 which resulted in a Ps 1.3 billion decrease in interest expense.
The Ps 10.6 billion decrease in interest expense from borrowings from banks and others was driven by a decrease in the average balance from Ps 1,696.8 billion for the year ended December 31, 2013 to Ps 1,594.0 billion for the year ended December 31, 2014, resulting in a Ps 6.0 billion decrease in interest expense. Also contributing to the decrease in interest expense was a decrease in the average rate paid from 3.5% for the year ended December 31, 2013 to 3.1% for the year ended December 31, 2014. This decrease in the rate paid was consistent with a decreasing interest-rate environment and resulted in a Ps 4.6 billion decrease in interest expense.
The decrease in interest expense from interbank and overnight funds of Ps 9.9 billion was driven by a decrease in the average balance of interbank and overnight funds to Ps 246.0 billion for the year ended December 31, 2014, which resulted in a Ps 5.9 billion decrease in interest expense. Also contributing to the decrease in interest expense was a decrease in the average interest rate paid, partially related to the decreasing interest-rate environment, from 4.2% for the year ended December 31, 2013 to 2.9% for the year ended December 31, 2014 which resulted in a Ps 3.9 billion decrease in interest expense.
The Ps 8.6 billion decrease in interest expense from long-term debt was driven by a decrease in the average balance from Ps 2,560.9 billion for the year ended December 31, 2013 to Ps 2,314.4 billion for the year ended
December 31, 2014, resulting in a Ps 15.8 billion decrease in interest expense. This decrease was partially offset by an increase in the average rate paid on long-term debt from 6.1% for the year ended December 31, 2013 to 6.4% for the year ended December 31, 2014. This increase in the rate paid resulted in a Ps 7.2 billion increase in interest expense.
The average rate paid on interest-bearing liabilities slightly decreased from 3.94% for the year ended December 31, 2013 to 3.89% for the year ended December 31, 2014.
The average total interest earning assets for the year ended December 31, 2014 increased by 16.0% or Ps 3,703.3 billion compared to the year ended December 31, 2013, and net interest income between the same periods increased by 8.6%, resulting in a contraction in the net interest margin from 5.7% for the year ended December 31, 2013 to 5.4% for the year ended December 31, 2014. The interest spread between the average rate on loans and financial leases and the average rate paid on deposits showed a similar tendency decreasing from 7.1% for the year ended December 31, 2013 to 6.4% for the year ended December 31, 2014.
Both the decrease in net interest margin and the decrease in the spread between the average yield earned on loans and financial leases and the average rate paid on deposits were mainly driven by the decrease in the yield of the loan and financial lease portfolio.
Provisions
Total net provisions increased by Ps 46.9 billion to Ps 367.8 billion for the year ended December 31, 2014 versus the year ended December 31, 2013. This increase was mainly driven by a Ps 43.7 billion increase in net provisions for loans and financial leases to Ps 376.4 billion.
The Ps 43.7 billion increase in the net provision for loan and financial lease losses was driven by (i) a 13.8% increase in the average balance of total gross loans and financial leases and (ii) a deterioration in Banco de Occidente’s delinquency ratio, measured as loans at least 30 days past due as a percentage of total gross loans, from 2.4% as of December 31, 2013 to 3.0% as of December 31, 2014. The deterioration in the delinquency ratio was driven by a deterioration in the delinquency ratios of the commercial loan portfolio (from 1.4% as of December 31, 2013 to 2.2% as of December 31, 2014) and the financial lease portfolio (from 3.1% as of December 31, 2013 to 4.2% as of December 31, 2014). The deteriorations of the commercial loan portfolio and the financial lease portfolio were associated with oil related companies, among others. Charge-offs increased from Ps 243.4 billion for the year ended December 31, 2013 to Ps 281.9 billion for the year ended December 31, 2014. Banco de Occidente’s ratio of charge-offs to average balance of loans and financial leases remained substantially unchanged at 1.4% for both the years ended December 31, 2013 and 2014. Since charge-offs were only a fraction of net provisions for loans and financial leases, the total allowance for loans and financial lease losses increased from Ps 700.4 billion as of December 31, 2013 to Ps 796.5 billion as of December 31, 2014. As of December 31, 2014 Banco de Occidente’s coverage ratio for its past due loans was 123.0%.
The recovery of charged-off assets increased by Ps 9.7 billion to Ps 60.0 billion for the year ended December 31, 2014. The ratio of recovered charged-off assets to average loans and financial leases was 0.3% for both the years ended December 31, 2013 and 2014.
Total fees and other services income, net
|
Banco de Occidente excluding
Corficolombiana’s effect in 2014
|
||||||||||||||||
|
Year ended December 31,
|
Change, December 2014 vs. December 2013
|
|||||||||||||||
|
2014
|
2013
|
# |
%
|
|||||||||||||
|
(in Ps billions)
|
||||||||||||||||
|
Fees and other services income:
|
||||||||||||||||
|
Commissions from banking services
|
203.2 | 189.4 | 13.8 | 7.3 | ||||||||||||
|
Branch network services
|
– | – | – | – | ||||||||||||
|
Credit card merchant fees
|
108.2 | 98.0 | 10.2 | 10.4 | ||||||||||||
|
Checking fees
|
20.6 | 20.8 | (0.2 | ) | (0.9 | ) | ||||||||||
|
Warehouse services
|
– | – | – | – | ||||||||||||
|
Fiduciary activities
|
48.4 | 48.4 | 0.1 | 0.1 | ||||||||||||
|
Pension plan administration
|
– | – | – | – | ||||||||||||
|
Other
|
36.4 | 33.5 | 2.9 | 8.6 | ||||||||||||
|
Total fees and other services income
|
416.8 | 390.1 | 26.7 | 6.9 | ||||||||||||
|
Fees and other services expenses
|
(158.3 | ) | (135.4 | ) | 22.9 | 16.9 | ||||||||||
|
Total fees and other services income, net
|
258.5 | 254.7 | 3.8 | 1.5 | ||||||||||||
Total fees and other services income, net increased by 1.5%, or Ps 3.8 billion, to Ps 258.5 billion for the year ended December 31, 2014. This increase was primarily due to a Ps 13.8 billion increase in commissions from banking services to Ps 203.2 billion, mainly as a result of Banco de Occidente’s organic growth and higher commissions charged on different products such as management fees, a Ps 10.2 billion increase in credit card merchant fess to Ps 108.2 billion and a Ps 2.9 billion increase in other fees. Partially offsetting these increases was the Ps 22.9 billion increase in fees and other services expenses to Ps 158.3 billion.
Other operating income
|
Banco de Occidente excluding
Corficolombiana’s effect in 2014
|
||||||||||||||||
|
Year ended December 31,
|
Change, December 2014 vs. December 2013
|
|||||||||||||||
|
2014
|
2013
|
# |
%
|
|||||||||||||
|
(in Ps billions)
|
||||||||||||||||
|
Foreign exchange gains (losses), net
|
79.1 | 22.5 | 56.6 | (251.7 | ) | |||||||||||
|
Gains on derivative operations, net
|
(34.5 | ) | 3.3 | (37.8 | ) | (1,139.6 | ) | |||||||||
|
Gains on sales of investments in equity securities, net
|
(0.1 | ) | – | (0.1 | ) | – | ||||||||||
|
Income from non-financial sector, net
|
2.6 | 1.5 | 1.1 | 71.6 | ||||||||||||
|
Dividend income
|
153.6 | 143.1 | 10.5 | 7.3 | ||||||||||||
|
Other
|
182.1 | 150.3 | 31.8 | 21.2 | ||||||||||||
|
Other operating income
|
382.9 | 320.8 | 62.1 | 19.4 | ||||||||||||
Total other operating income increased by 19.4%, or Ps 62.1 billion, to Ps 382.9 billion for the year ended December 31, 2014. This increase was primarily a result of a Ps 31.8 billion increase in other operating income, due to higher income from operating leases, a Ps 18.8 billion increase in gains from foreign exchange and derivative operations and a Ps 10.5 billion increase in dividend income.
Operating expenses
|
Banco de Occidente excluding
Corficolombiana’s effect in 2014
|
||||||||||||||||
|
Year ended December 31,
|
Change, December 2014 vs. December 2013
|
|||||||||||||||
|
2014
|
2013
|
# |
%
|
|||||||||||||
|
(in Ps billions)
|
||||||||||||||||
|
Salaries and employee benefits
|
(351.8 | ) | (344.8 | ) | 7.0 | 2.0 | ||||||||||
|
Bonus plan payments
|
(25.3 | ) | (23.5 | ) | 1.8 | 7.7 | ||||||||||
|
Termination payments
|
(6.1 | ) | (3.3 | ) | 2.8 | 83.3 | ||||||||||
|
Administrative and other expenses
|
(502.0 | ) | (448.4 | ) | 53.5 | 11.9 | ||||||||||
|
Deposit security, net
|
(53.6 | ) | (46.7 | ) | 6.9 | 14.8 | ||||||||||
|
Charitable and other donation expenses
|
(0.6 | ) | (0.7 | ) | (0.1 | ) | (17.0 | ) | ||||||||
|
Depreciation
|
(171.9 | ) | (141.0 | ) | 30.9 | 21.9 | ||||||||||
|
Goodwill amortization
|
(1.7 | ) | (1.5 | ) | 0.1 | 7.0 | ||||||||||
|
Total operating expenses
|
(1,113.0 | ) | (1,010.1 | ) | 102.9 | 10.2 | ||||||||||
Total operating expenses increased by 10.2%, or Ps 102.9 billion, to Ps 1,113.0 billion for the year ended December 31, 2014 and total operating expense before depreciation and amortization increased by 8.3%, or Ps 72.0 billion, to Ps 939.5 billion for the year ended December 31, 2014. The Ps 102.9 billion increase in total operating expense was primarily due to a Ps 53.5 billion increase in administrative and other expenses, to Ps 502.0 billion, principally driven by the organic growth of the business and particularly as a result of Banco de Occidente’s larger loan and financial lease portfolio. Depreciation expense increased by Ps 30.9 billion to Ps 171.9 billion as a result of higher depreciation expense from operating leases. Deposit security expense, net (representing Colombian mandatory deposit insurance) increased by Ps 6.9 billion, due to an increase in the average balance of deposits.
Salaries and employee benefits increased by Ps 7.0 billion or 2.0% to Ps 351.8 billion, which was mainly explained by an increase in headcount from 11,652 at December 31, 2013 to 14,562 at December 31, 2014.
Banco de Occidente’s efficiency, measured as a cost-to-income ratio, improved from 45.6% for the year ended December 31, 2013 to 45.1% for the year ended December 31, 2014. The ratio of operating expenses before depreciation and amortization as a percentage of average assets also improved from 3.3% for the year ended December 31, 2013 to 3.1% for the year ended December 31, 2014.
Non-operating income (expense)
Total non-operating income (expense) includes gains (losses) from the sale of foreclosed assets, property, plant and equipment and other assets. Total non-operating income increased by Ps 15.7 billion to Ps 28.0 billion for the year ended December 31, 2014, from a total net non-operating income of Ps 12.3 billion for the year ended December 31, 2013. This increase was mainly driven by a Ps 10.8 billion increase in non-operating income and a Ps 5.0 billion decrease in non-operating expense.
Income tax expense
Income tax expense for Banco de Occidente increased by Ps 7.6 billion to Ps 163.1 billion for the year ended December 31, 2014. This increase was due to a higher income before income tax expense and non-controlling interest.
Banco de Occidente’s effective tax rate, calculated before non-controlling interest, improved from 26.6% for the year ended December 31, 2013 to 25.9% from the year ended December 31, 2014.
Non-controlling interest
Banco de Occidente’s non-controlling interest increased by Ps 0.3 billion to Ps 1.5 billion for the year ended December 31, 2014. Non-controlling interest is not a significant contributor to net income for Banco de Occidente, responsible for only 0.3% of net income before non-controlling interest, excluding the positive effect from Corficolombiana, for the year ended December 31, 2014.
Banco Popular
Net income
|
Year ended December 31,
|
Change, December 2014 vs. December 2013
|
|||||||||||||||
|
2014
|
2013
|
# |
%
|
|||||||||||||
|
(in Ps billions)
|
||||||||||||||||
|
Total interest income
|
1,585.3 | 1,564.9 | 20.4 | 1.3 | ||||||||||||
|
Total interest expense
|
(505.5 | ) | (458.7 | ) | 46.8 | 10.2 | ||||||||||
|
Net interest income
|
1,079.8 | 1,106.2 | (26.4 | ) | (2.4 | ) | ||||||||||
|
Total (provisions) / reversals, net
|
(69.1 | ) | (66.1 | ) | 3.0 | 4.5 | ||||||||||
|
Total fees and other services income, net
|
143.5 | 147.6 | (4.0 | ) | (2.7 | ) | ||||||||||
|
Total other operating income
|
59.3 | 44.0 | 15.2 | 34.5 | ||||||||||||
|
Total operating income
|
1,213.5 | 1,231.7 | (18.2 | ) | (1.5 | ) | ||||||||||
|
Total operating expenses
|
(710.4 | ) | (715.9 | ) | (5.5 | ) | (0.8 | ) | ||||||||
|
Net operating income
|
503.1 | 515.8 | (12.8 | ) | (2.5 | ) | ||||||||||
|
Total non-operating income (expense), net
|
48.0 | 93.4 | (45.4 | ) | (48.6 | ) | ||||||||||
|
Income before income tax expense and non-controlling interest
|
551.1 | 609.2 | (58.2 | ) | (9.5 | ) | ||||||||||
|
Income tax expense
|
(184.6 | ) | (210.6 | ) | (26.1 | ) | (12.4 | ) | ||||||||
|
Income before non-controlling interest
|
366.5 | 398.6 | (32.1 | ) | (8.1 | ) | ||||||||||
|
Non-controlling interest
|
(0.8 | ) | (2.3 | ) | (1.5 | ) | (64.8 | ) | ||||||||
|
Net income attributable to shareholders
|
365.7 | 396.3 | (30.6 | ) | (7.7 | ) | ||||||||||
Banco Popular’s net income attributable to shareholders decreased by 7.7% to Ps 365.7 billion for the year ended December 31, 2014. The decrease in net income was attributable to a decrease in total operating income and a decrease in total non-operating income. The above results were partially offset by a decrease in income tax expense, a decrease in total operating expenses and a decrease in non-controlling interest.
Net interest income
|
Year ended December 31,
|
Change, December 2014 vs. December 2013
|
|||||||||||||||
|
2014
|
2013
|
# |
%
|
|||||||||||||
|
(in Ps billions)
|
||||||||||||||||
|
Interest income:
|
||||||||||||||||
|
Interest on loans
|
1,389.2 | 1,400.8 | (11.7 | ) | (0.8 | ) | ||||||||||
|
Interest on investment securities
|
159.4 | 116.3 | 43.2 | 37.1 | ||||||||||||
|
Interbank and overnight funds
|
11.6 | 14.1 | (2.4 | ) | (17.3 | ) | ||||||||||
|
Financial leases
|
25.1 | 33.7 | (8.6 | ) | (25.6 | ) | ||||||||||
|
Total interest income
|
1,585.3 | 1,564.9 | 20.4 | 1.3 | ||||||||||||
|
Interest expense:
|
||||||||||||||||
|
Checking accounts
|
(4.7 | ) | (7.5 | ) | (2.8 | ) | (37.4 | ) | ||||||||
|
Time deposits
|
(73.8 | ) | (86.4 | ) | (12.5 | ) | (14.5 | ) | ||||||||
|
Savings deposits
|
(296.4 | ) | (245.1 | ) | 51.3 | 20.9 | ||||||||||
|
Total interest expense from deposits
|
(374.9 | ) | (339.0 | ) | 35.9 | 10.6 | ||||||||||
|
Borrowing from banks and others
|
(5.2 | ) | (9.3 | ) | (4.1 | ) | (44.4 | ) | ||||||||
|
Interbank and overnight funds (expenses)
|
(9.4 | ) | (3.8 | ) | 5.6 | 145.2 | ||||||||||
|
Long-term debt (bonds)
|
(116.0 | ) | (106.5 | ) | 9.5 | 8.9 | ||||||||||
|
Total interest expense
|
(505.5 | ) | (458.7 | ) | 46.8 | 10.2 | ||||||||||
|
Net interest income
|
1,079.8 | 1,106.2 | (26.4 | ) | (2.4 | ) | ||||||||||
Banco Popular’s net interest income decreased by 2.4%, or Ps 26.4 billion, from Ps 1,106.2 billion for the year ended December 31, 2013 to Ps 1,079.8 billion for the year ended December 31, 2014. This decrease was driven
primarily by a Ps 46.8 billion increase in total interest expense offset in part by a Ps 20.4 billion increase in total interest income.
Despite a 7.5%, or Ps 857.2 billion, increase in Banco Popular’s average interest earning loans and financial leases portfolio to Ps 12,336.6 billion for the year ended December 31, 2014, which resulted in a Ps 99.1 billion increase in interest income, total interest income from loans and financial leases decreased by 1.4%, or Ps 20.3 billion, to Ps 1,414.3 billion for the year ended December 31, 2014 due to a decrease in the average yield of loans and financial leases from 12.5% for the year ended December 31, 2013 to 11.5% for the year ended December 31, 2014, which resulted in a Ps 119.3 billion decrease in interest income from loans and financial leases. The decrease in the yield was a result of (i) a decreasing rate environment in Colombia where the average DTF rate decreased from 4.24% for the year ended December 31, 2013 to 4.07% for the year ended December 31, 2014 and (ii) a highly competitive landscape in Colombia, particularly aggressive in payroll loans.
Interest income from investment securities increased by 37.1%, or Ps 43.2 billion, to Ps 159.4 billion for the year ended December 31, 2014 driven by (i) a 21.2% increase in the average balance of investment securities from Ps 2,453.6 billion for the year ended December 31, 2013 to Ps 2,973.4 billion for the year ended December 31, 2014, which resulted in Ps 27.9 billion increase in interest income and, (ii) an increase in the average yield earned on investment securities from 4.7% for the year ended December 31, 2013 to 5.4% for the year ended December 31, 2014, resulting in a Ps 15.3 billion increase in interest income.
The fixed income portfolio generated Ps 156.8 billion of interest income from investment securities, accounting for 98.3% of Banco Popular’s interest income from investment securities, while the equity portfolio generated Ps 2.7 billion of interest income from investment securities, accounting for 1.7% of Banco Popular’s interest income from investment securities.
Interest income from interbank and overnight funds decreased by Ps 2.4 billion to Ps 11.6 billion for the year ended December 31, 2014 mainly driven by a decrease in the average balance of interbank and overnight funds from Ps 136.4 billion as of December 31, 2013 to Ps 115.6 billion as of December 31, 2014.
Driven by the decrease in the yield of the loan and financial lease portfolio, the average yield from interest earning assets decreased from 11.1% for the year ended December 31, 2013 to 10.3% for the year ended December 31, 2014.
Total interest expense increased by Ps 46.8 billion to Ps 505.5 billion for the year ended December 31, 2014, mainly driven by a Ps 1,324.9 billion, or 11.9%, increase in the average balance of interest-beraing liabilities, offset in part by a 6 basis points decrease in the average cost of funds from 4.13% for the year ended December 31, 2013 to 4.07% for the year ended December 31, 2014. Total interest expense for interest-bearing deposits increased by Ps 35.9 billion to Ps 374.9 billion for the year ended December 31, 2014 mainly driven by a Ps 1,223.5 billion, or 13.6%, increase in the average balance of interest-bearing deposits, offset in part by a 10 basis points decrease in the average cost of funds from 3.77% for the year ended December 31, 2013 to 3.67% for the year ended December 31, 2014.
The Ps 46.8 billion increase in total interest expense was mainly explained by a Ps 51.3 billion increase in interest expense on savings deposits, a Ps 9.5 billion increase in interest expense on long-term debt and a Ps 5.6 billion increase in interest expense on interbank and overnight funds. These increases were partially offset by a Ps 12.5 billion decrease in interest expense on time deposits, a Ps 4.1 billion decrease in interest expense on borrowings from banks and others and a Ps 2.8 billion decrease in interest expense on interest-bearing checking accounts.
The increase in interest expense on savings deposits of Ps 51.3 billion was mainly due to a 19.9% or Ps 1,429.9 billion increase in the average balance of these funds from Ps 7,180.5 billion for the year ended December 31, 2013 to Ps 8,610.4 billion for the year ended December 31, 2014, which resulted in a Ps 49.2 billion increase in interest expense. Also contributing to the increase in interest expense was a slight increase in the average interest rate paid on savings deposits from 3.41% for the year ended December 31, 2013 to 3.44% for the year ended December 31, 2014, resulting in a Ps 2.0 billion increase in interest expense.
The Ps 9.5 billion increase in interest expense on long-term debt was driven by an increase in the average rate paid for long-term debt which increased from 5.8% for the year ended December 31, 2013 to 6.0% for the year
ended December 31, 2014, which resulted in Ps 5.1 billion increase in interest expense. Also contributing to the increase in interest expense was an increase in the average balance of these funds from Ps 1,845.9 billion for the year ended December 31, 2013 to Ps 1,918.2 billion for the year ended December 31, 2014, which resulted in an increase of Ps 4.4 billion in interest expense.
The increase in interest expense on interbank and overnight funds of Ps 5.6 billion was mainly driven by a Ps 79.8 billion increase in the average balance of this funds from Ps 19.5 billion for the year ended December 31, 2013 to Ps 99.2 billion for the year ended December 31, 2014, which resulted in a Ps 7.7 billion increase in interest expense. Partially offsetting this increase was a decrease in the average interest rate paid on those funds from 19.7% for the year ended December 31, 2013 to 9.5% for the year ended December 31, 2014, which resulted in Ps 2.2 billion decrease in interest expense.
The Ps 12.5 billion decrease in interest expense on time deposits was driven by a 12.0% decrease in the average balance of time deposits from Ps 1,622.2 billion for the year ended December 31, 2013 to Ps 1,427.7 billion for the year ended December 31, 2014, which resulted in a decrease of Ps 10.1 billion in interest expense, and a decrease in the average interest rate paid on those deposits from 5.3% for the year ended December 31, 2013 to 5.2% for the year ended December 31, 2014. The decrease in the cost of these funds resulted in a decrease of Ps 2.5 billion in interest expense and was mainly a result of the above-mentioned decreasing DTF rate environment.
The decrease in interest expense on borrowings from banks and others of Ps 4.1 billion was driven by a decrease in the average balance of these funds from Ps 235.8 billion for the year ended December 31, 2013 to Ps 185.1 billion for the year ended December 31, 2014, which resulted in a decrease of Ps 2.0 billion in interest expense, and by a decrease in the average interest rate paid on borrowings from banks and others from 4.0% for the year ended December 31, 2013 to 2.8% for the year ended December 31, 2014, resulting in a Ps 2.2 billion decrease in interest expense. The decrease in the interest rate paid was, as in the case of the time deposits, consistent with a decreasing interest-rate environment.
The Ps 2.8 billion decrease in interest expense on interest-bearing checking accounts was driven by a decrease in the average rate paid for checking accounts from 3.8% for the year ended December 31, 2013 to 2.5% for the year ended December 31, 2014. The decrease in the interest rate paid was also consistent with the decreasing interest-rate environment and resulted in a Ps 2.5 billion decrease in interest expense. Also contributing to this decrease was a Ps 11.8 billion decrease in the average balance of these funds from Ps 200.4 billion for the year ended December 31, 2013 to Ps 188.5 billion for the year ended December 31, 2014, which resulted in an decrease of Ps 0.3 billion in interest expense.
The average rate paid on interest-bearing liabilities slightly decreased from 4.13% for the year ended December 31, 2013 to 4.07% for the year ended December 31, 2014.
Average total interest earning assets for the year ended December 31, 2014 increased by 9.6% or Ps 1,356.3 billion to Ps 15,425.6 billion compared to the year ended December 31, 2013, while net interest income decreased between the same periods by 2.4%, as a result, net interest margin for the year ended December 31, 2014 was 7.0% decreasing from 7.9% for the year ended December 31, 2013. Interest spread between the average yield earned on loans and financial leases and the average rate paid on deposits also decreased from 8.7% for the year ended December 31, 2013 to 7.8% for the year ended December 31, 2014.
Both the decrease in net interest margin and the decrease in the spread between the average yield earned on loans and financial leases and the average rate paid on deposits were mainly driven by the decrease in the yield of the loan and financial lease portfolio.
Provisions
Total net provisions increased by Ps 3.0 billion to Ps 69.1 billion for the year ended December 31, 2014 versus the same period of 2013, driven primarily by a Ps 3.1 billion increase in net provisions for loans and financial leases. The increase in the net provision for loan and financial lease losses was mostly attributable to the increase of the loan and financial lease portfolio. Banco Popular’s delinquency ratio, measured as loans at least 30 days past due as a percentage of total gross loans, remained basically unchanged at 2.1% for both December 31, 2013 and December 31, 2014. The ratio of net provisions for loans and financial leases losses to average loans and financial leases was 0.6% for both the year ended December 31, 2013 and the year ended December 31, 2014.
Charge-offs increased from Ps 65.8 billion for the year ended December 31, 2013 to Ps 71.1 billion for the year ended December 31, 2014. Banco Popular’s ratio of charge-offs to average loans and financial leases remained basically unchanged at 0.6% for both the year ended December 31, 2013 and the year ended December 31, 2014. As of December 31, 2014 Banco Popular’s coverage over its past due loans was 159.9%.
Net provisions for accrued interest and other receivables increased by Ps 0.7 billion to a net expense of Ps 3.7 billion for the year ended December 31, 2014 from a net expense of Ps 3.0 billion for the year ended December 31, 2013 due to a combination of a higher provision expense of Ps 0.9 billion and higher reversals of provisions of Ps 0.2 billion.
Net provisions for foreclosed assets and other assets decreases by Ps 1.3 billion from a net expense of Ps 4.5 billion for the year ended December 31, 2013 to a net expense of Ps 3.2 billion for the year ended December 31, 2014.
The recovery of charged-off assets slightly decreased by Ps 0.5 billion from Ps 16.0 billon for the year ended December 31, 2013 to Ps 15.4 billion for the year ended December 31, 2014.
Total fees and other services income, net
|
Year ended December 31,
|
Change, December 2014 vs. December 2013
|
|||||||||||||||
|
2014
|
2013
|
# |
%
|
|||||||||||||
|
(in Ps billions)
|
||||||||||||||||
|
Fees and other services income:
|
||||||||||||||||
|
Commissions from banking services
|
93.5 | 94.3 | (0.8 | ) | (0.9 | ) | ||||||||||
|
Branch network services
|
– | – | – | – | ||||||||||||
|
Credit card merchant fees
|
7.4 | 6.8 | 0.5 | 7.7 | ||||||||||||
|
Checking fees
|
2.9 | 3.2 | (0.3 | ) | (9.2 | ) | ||||||||||
|
Warehouse services
|
59.9 | 59.7 | 0.1 | 0.2 | ||||||||||||
|
Fiduciary activities
|
14.2 | 14.2 | 0.0 | 0.3 | ||||||||||||
|
Pension plan administration
|
0.7 | 0.7 | 0.1 | 9.3 | ||||||||||||
|
Other
|
7.6 | 8.4 | (0.8 | ) | (9.7 | ) | ||||||||||
|
Total fees and other services income
|
186.2 | 187.4 | (1.2 | ) | (0.6 | ) | ||||||||||
|
Fees and other services expenses
|
(42.7 | ) | (39.8 | ) | 2.9 | 7.2 | ||||||||||
|
Total fees and other services income, net
|
143.5 | 147.6 | (4.0 | ) | (2.7 | ) | ||||||||||
Total fees and other services income, net decreased by 2.7%, or Ps 4.0 billion, to Ps 143.5 billion for the year ended December 31, 2014. This decrease was primarily due to a Ps 2.9 billion increase in in total fees and other services expenses to Ps 42.7 billion, a Ps 0.8 billion decrease in commissions from banking services to Ps 93.5 billion and a Ps 0.8 billion decrease in other fees to Ps 7.6 billion. Partially offsetting these decreases was a Ps 0.5 billion increase in credit card and merchant bank fees to Ps 7.4 billion.
Other operating income
|
Year ended December 31,
|
Change, December 2014 vs. December 2013
|
|||||||||||||||
|
2014
|
2013
|
# |
%
|
|||||||||||||
|
(in Ps billions)
|
||||||||||||||||
|
Foreign exchange gains (losses), net
|
4.2 | 2.7 | 1.5 | 55.5 | ||||||||||||
|
Gains on derivative operations, net
|
(1.3 | ) | (0.2 | ) | (1.1 | ) | (444.2 | ) | ||||||||
|
Gains on sales of investments in equity securities, net
|
– | – | – | – | ||||||||||||
|
Income from non-financial sector, net
|
(0.8 | ) | 2.7 | (3.5 | ) | (131.8 | ) | |||||||||
|
Dividend income
|
41.7 | 33.3 | 8.4 | 25.3 | ||||||||||||
|
Other
|
15.5 | 5.6 | 9.9 | 174.9 | ||||||||||||
|
Other operating income
|
59.3 | 44.0 | 15.2 | 34.5 | ||||||||||||
Total other operating income increased by Ps 15.2 billion, to Ps 59.3 billion for the year ended December 31, 2014. This increase was primarily a result of a Ps 9.9 billion increase in other income and a Ps 8.4 billion increase in dividend income, partially offset by a Ps 3.5 billion decrease in income from non-financial sector.
The Ps 9.9 billion increase in other income was mainly driven by an increase in operating income from Banco Popular’s subsidiary Alpopular (a logistic services company). The Ps 8.4 billion increase in dividend income was mainly driven by higher dividends received from Banco Popular’s investment in Corficolombiana during the year ended December 31, 2014 than during the year ended December 31, 2013.
Operating expenses
|
Year ended December 31,
|
Change, December 2014 vs. December 2013
|
|||||||||||||||
|
2014
|
2013
|
# |
%
|
|||||||||||||
|
(in Ps billions)
|
||||||||||||||||
|
Salaries and employee benefits
|
(254.6 | ) | (263.8 | ) | (9.2 | ) | (3.5 | ) | ||||||||
|
Bonus plan payments
|
(7.5 | ) | (4.1 | ) | 3.3 | 80.7 | ||||||||||
|
Termination payments
|
(0.9 | ) | (0.7 | ) | 0.3 | 41.9 | ||||||||||
|
Administrative and other expenses
|
(388.1 | ) | (388.1 | ) | (0.0 | ) | (0.0 | ) | ||||||||
|
Deposit security, net
|
(31.2 | ) | (31.5 | ) | (0.3 | ) | (0.8 | ) | ||||||||
|
Charitable and other donation expenses
|
(1.7 | ) | (1.4 | ) | 0.3 | 18.1 | ||||||||||
|
Depreciation
|
(26.4 | ) | (26.3 | ) | 0.2 | 0.6 | ||||||||||
|
Goodwill amortization
|
– | – | – | – | ||||||||||||
|
Total operating expenses
|
(710.4 | ) | (715.9 | ) | (5.5 | ) | (0.8 | ) | ||||||||
Total operating expenses decreased by Ps 5.5 billion to Ps 710.4 billion for the year ended December 31, 2014 versus the year ended December 31, 2013, due to an effort from management to control expenses. The decrease in total operating expense was mainly driven by a Ps 9.2 billion decrease in salaries and employee benefits to Ps 254.6 billion, despite an increase in headcount from 6,709 at December 31, 2013 to 7,118 at December 31, 2014. Partially offsetting this decrease was a Ps 3.3 billion increase in bonus plan payments to Ps 7.5 billion for the year ended December 31, 2014.
Banco Popular’s efficiency ratio slightly deteriorated, on a cost to income basis, from 53.1% for the year ended December 31, 2013 to 53.3% for the year ended December 31, 2014 as operating income before provisions grew at a slower pace than operating expenses. The ratio of operating expenses before depreciation and amortization as a percentage of average assets improved from 4.3% for the year ended December 31, 2013 to 3.9% for the year ended December 31, 2014.
Non-operating income (expense)
Total net non-operating income (expense) decreased by Ps 45.4 billion to Ps 48.0 billion for the year ended December 31, 2014, principally driven by a Ps 54.5 billion decrease in recoveries as this line item the year ended December 31, 2013 included higher recoveries derived from an update in the calculation of the bank’s actuarial models.
Income tax expense
Income tax expense for Banco Popular decreased by Ps 26.1 billion to Ps 184.6 billion for the year ended December 31, 2014, primarily due to lower income before income tax expense and non-controlling interest. Banco Popular’s effective tax rate, calculated before non-controlling interest, decreased from 34.6% for the year ended December 31, 2013 to 33.5% for the year ended December 31, 2014.
Non-controlling interest
Banco Popular’s non-controlling interest decreased by Ps 1.5 billion to Ps 0.8 billion for the year ended December 31, 2014. Non-controlling interest is not a significant contributor to net income for Banco Popular, responsible for only 0.2% of net income before non-controlling interest for the year ended December 31, 2014.
Banco AV Villas
Net income
|
Year ended December 31,
|
Change, December 2014 vs. December 2013
|
|||||||||||||||
|
2014
|
2013
|
# |
%
|
|||||||||||||
|
(in Ps billions)
|
||||||||||||||||
|
Total interest income
|
929.8 | 946.6 | (16.8 | ) | (1.8 | ) | ||||||||||
|
Total interest expense
|
(231.5 | ) | (223.0 | ) | 8.5 | 3.8 | ||||||||||
|
Net interest income
|
698.3 | 723.6 | (25.3 | ) | (3.5 | ) | ||||||||||
|
Total (provisions) / reversals, net
|
(113.7 | ) | (133.3 | ) | (19.6 | ) | (14.7 | ) | ||||||||
|
Total fees and other services income, net
|
172.5 | 165.6 | 6.9 | 4.2 | ||||||||||||
|
Total other operating income
|
8.0 | 6.0 | 2.0 | 33.8 | ||||||||||||
|
Total operating income
|
765.1 | 761.8 | 3.2 | 0.4 | ||||||||||||
|
Total operating expenses
|
(487.6 | ) | (482.6 | ) | 5.1 | 1.0 | ||||||||||
|
Net operating income
|
277.4 | 279.2 | (1.8 | ) | (0.7 | ) | ||||||||||
|
Total non-operating income (expense), net
|
12.9 | 3.2 | 9.7 | 299.8 | ||||||||||||
|
Income before income tax expense and non-controlling interest
|
290.3 | 282.5 | 7.8 | 2.8 | ||||||||||||
|
Income tax expense
|
(94.6 | ) | (96.4 | ) | (1.7 | ) | (1.8 | ) | ||||||||
|
Income before non-controlling interest
|
195.7 | 186.1 | 9.6 | 5.1 | ||||||||||||
|
Non-controlling interest
|
(0.3 | ) | (0.0 | ) | 0.3 | 2,723.2 | ||||||||||
|
Net income attributable to shareholders
|
195.4 | 186.1 | 9.3 | 5.0 | ||||||||||||
Banco AV Villas’ net income attributable to shareholders increased by 5.0%, or Ps 9.3 billion, to Ps 195.4 billion for the year ended December 31, 2014 as compared to the year ended December 31, 2013. This increase was primarily due to a Ps 3.2 billion increase in total operating income, a Ps 9.7 billion increase in non-operating income and a Ps 1.7 billion decrease in income tax expense. These results were partially offset by a Ps 5.1 billion increase in total operating expenses and a 0.3 billion increase in non-controlling interest.
Net interest income
|
Year ended December 31,
|
Change, December 2014 vs. December 2013
|
|||||||||||||||
|
2014
|
2013
|
# |
%
|
|||||||||||||
|
(in Ps billions)
|
||||||||||||||||
|
Interest income:
|
||||||||||||||||
|
Interest on loans
|
802.8 | 785.7 | 17.1 | 2.2 | ||||||||||||
|
Interest on investment securities
|
121.8 | 156.8 | (34.9 | ) | (22.3 | ) | ||||||||||
|
Interbank and overnight funds
|
5.2 | 4.1 | 1.1 | 26.3 | ||||||||||||
|
Financial leases
|
– | – | – | – | ||||||||||||
|
Total interest income
|
929.8 | 946.6 | (16.8 | ) | (1.8 | ) | ||||||||||
|
Interest expense:
|
||||||||||||||||
|
Checking accounts
|
(1.3 | ) | (2.1 | ) | (0.8 | ) | (37.2 | ) | ||||||||
|
Time deposits
|
(116.7 | ) | (112.4 | ) | 4.3 | 3.8 | ||||||||||
|
Savings deposits
|
(87.4 | ) | (84.8 | ) | 2.7 | 3.1 | ||||||||||
|
Total interest expense from deposits
|
(205.4 | ) | (199.3 | ) | 6.2 | 3.1 | ||||||||||
|
Borrowing from banks and others
|
(3.0 | ) | (4.0 | ) | (0.9 | ) | (23.5 | ) | ||||||||
|
Interbank and overnight funds (expenses)
|
(23.0 | ) | (19.8 | ) | 3.2 | 16.3 | ||||||||||
|
Long-term debt (bonds)
|
– | – | – | – | ||||||||||||
|
Total interest expense
|
(231.5 | ) | (223.0 | ) | 8.5 | 3.8 | ||||||||||
|
Net interest income
|
698.3 | 723.6 | (25.3 | ) | (3.5 | ) | ||||||||||
Banco AV Villas’ net interest income decreased by 3.5%, or Ps 25.3 billion, from Ps 723.6 billion for the year ended December 31, 2013 to Ps 698.3 billion for the year ended December 31, 2014. This decrease was driven by a Ps 16.8 billion decrease in total interest income and a Ps 8.5 billion increase in total interest expense.
The decrease in interest income occurred despite a 2.2%, or Ps 17.1 billion, increase in interest earned on loans and a 26.3%, or Ps 1.1 billion, increase interest on interbank and overnight funds. Despite these increases, interest income decreased due to a 22.3%, or Ps 34.9 billion, decrease in income from investment securities.
Interest earned on loans increased by 2.2%, or Ps 17.1 billion, to Ps 802.8 billion for the year ended December 31, 2014 as compared to the year ended December 31, 2013. The increase was mainly driven by (i) a 10.4%, or Ps 632.3 billion, increase in Banco AV Villas’ average interest bearing loan portfolio to Ps 6,689.6 billion as of December 31, 2014, which resulted in an increase of Ps 75.9 billion in interest income on loans, and (ii) a decrease in the average yield on loans from 13.0% for the year ended December 31, 2013 to 12.0% for the year ended December 31, 2014, which resulted in a Ps 58.8 billion decrease in interest income. The decrease in the yield was a result of both a decreasing rate environment in Colombia where the average DTF rate decreased from 4.24% for the year ended December 31, 2013 to 4.07% for the year ended December 31, 2014 and a strong competitive landscape in Colombia, particularly in consumer loans.
Interest income from investment securities decreased by 22.3%, or Ps 34.9 billion, to Ps 121.8 billion for the year ended December 31, 2014 as compared to the year ended December 31, 2013. The fixed income portfolio generated Ps 121.7 billion, or 99.9%, of Banco AV Villas’ earnings on investment securities for the year ended December 31, 2014 while the equity portfolio generated Ps 0.2 billion, or 0.1%, of total earnings from investment securities. The decrease in interest income from investment securities was a result of (i) an increase in fixed income securities rates in Colombia during 2014 due to an increase in the interest rate on the Colombian Treasury Bond due 2024, which is a benchmark for tracking the movement of fixed income rates; and (ii) the bank’s decision to rebalance the fixed income portfolio reducing the trading portion, while increasing the available for sale portion. As per local accounting standards only the trading portfolio´s changes in value are shown in the income statement. As of December 31, 2013, 39.2% of the fixed-income portfolio was classified as trading but as of December 31, 2014 this percentage decreased to 6.3%. As a consequence, a smaller portion of the valuation changes was reflected in the income statement during the year ended December 31, 2014 compared to the same period in 2013. The yield on investment securities decreased from 7.3% for the year ended December 31, 2013 to 5.1% for the year ended December 31, 2014.
As a result of the decline in the yield on loans and the yield on investment securities, the average yield earned on interest earning assets decreased from 11.4% for the year ended December 31, 2013 to 10.1% for the year ended December 31, 2014.
Total interest expense increased by Ps 8.5 billion to Ps 231.5 billion for the year ended December 31, 2014, mainly driven by a Ps 784.9 billion, or 10.7%, increase in the average balance of interest-beraing liabilities, offset in part by a 19 basis points decrease in the average cost of funds from 3.0% for the year ended December 31, 2013 to 2.8% for the year ended December 31, 2014. Total interest expense for interest-bearing deposits increased by Ps 6.2 billion to Ps 205.4 billion for the year ended December 31, 2014 mainly driven by a Ps 701.2 billion, or 10.6%, increase in the average balance of interest-bearing deposits, offset in part by a 21 basis points decrease in the average cost of funds from 3.0% for the year ended December 31, 2013 to 2.8% for the year ended December 31, 2014.
The Ps 8.5 billion increase in total interest expense was mainly driven by a Ps 4.3 billion increase in interest expense on time deposits, a Ps 3.2 billion increase in interest expense on interbank and overnight funds and a Ps 2.7 billion increase in interest expense on savings deposits. Partially offsetting these increases was a Ps 0.9 billion decrease in interest expense on borrowings from banks and others and a Ps 0.8 billion decrease in interest expense on interest-bearing checking accounts.
The Ps 4.3 billion increase in interest expense on time deposits was mainly driven by an 11.1%, or Ps 264.9 billion, increase in the average balance of time deposits which resulted in a Ps 11.7 billion increase in interest expense. Partially offsetting this increase in interest expense was a decrease in the average interest rate paid on time deposits from 4.7% for the year ended December 31, 2013 to 4.4% for the year ended December 31, 2014. The decrease in the cost of these funds, which resulted in a Ps 7.4 billion decrease in interest expense from time deposits,
was mainly a result of the decrease in the average DTF rate from 4.24% for the year ended December 31, 2013 to 4.07% for the year ended December 31, 2014.
The increase in interest expense on interbank and overnight funds of Ps 3.2 billion was driven by an increase in the average interest rate paid on interbank and overnight funds from 2.9% for the year ended December 31, 2013 to 3.4% for the year ended December 31, 2014, which resulted in a Ps 3.1 billion increase in interest expense. Also contributing to the increase in interest expense was an increase in the average balance of interbank and overnight funds of 0.6%, or Ps 4.3 billion, which resulted in a Ps 0.1 billion increase in interest expense.
The Ps 2.7 billion increase in interest expense on saving deposits was driven by an increase in the average balance of saving deposits of 11.3%, or Ps 452.6 billion, which resulted in a Ps 8.9 billion increase in interest expense. This increase in interest expense was partially offset by a decrease in the average interest rate paid on saving deposits from 2.1% for the year ended December 31, 2013 to 2.0% for the year ended December 31, 2014, which resulted in a Ps 6.2 billion decrease in interest expense. As in the case of time deposits, the decrease in the cost of saving deposits was driven by a decreasing interest rate environment.
The decrease in interest expense on borrowings from banks and others of Ps 0.9 billion was driven by a decrease in the average interest rate paid from 5.0% for the year ended December 31, 2013 to 1.9% for the year ended December 31, 2014, which resulted in a Ps 2.5 billion decrease in interest expense. Partially offsetting this decrease in interest expense was a Ps 79.4 billion increase in the average balance of borrowings from banks and others, which resulted in a Ps 1.5 billion increase in interest expense.
The Ps 0.8 billion decrease in interest expense on interest-bearing checking accounts was driven by a decrease in the average interest rate paid from 1.0% for the year ended December 31, 2013 to 0.7% for the year ended December 31, 2014 and by a 8.1%, or Ps 16.3 billion, decrease in the average balance of checking accounts. The decrease in the average interest rate paid and in the average balance resulted in a Ps 0.7 billion and a Ps 0.1 billion decrease in interest expense, respectively.
The average rate paid on interest-bearing liabilities decreased from 3.0% for the year ended December 31, 2013 to 2.8% for the year ended December 31, 2014, which was consistent with the above-mentioned decreasing rate environment.
Average total interest earning assets for the year ended December 31, 2014 increased by 10.6%, or Ps 882.5 billion as compared to the year ended December 31, 2013, while net interest income decreased by 3.5% in the same period, which resulted in a decrease in the net interest margin from 8.7% for the year ended December 31, 2013 to 7.6% for the year ended December 31, 2014. The interest spread between the average rate on loans and financial leases and the average rate paid on deposits decreased from 9.9% for the year ended December 31, 2013 to 9.2% for the year ended December 31, 2014.
The decrease in the net interest margin was mainly driven by the aforementioned declines in the yield on loans and in the yield on investment securities, offset in part by the decrease in the average rate paid on interest-bearing liabilities. The decrease in the interest spread between the average rate on loans and financial leases and the average rate paid on deposits was primarily driven by the decline in the yield on loans, partially offset by a decrease in the average rate paid on deposits.
Provisions
Total net provisions decreased Ps 19.6 billion from Ps 133.3 billion for the year ended December 31, 2013 to Ps 113.7 billion for the year ended December 31, 2014. This decrease was primarily driven by a Ps 11.1 billion increase in the recovery of charged-off assets, a Ps 11.0 billion decrease in net provisions for accrued interest and other receivables and a Ps 1.1 billion decrease in net provisions for loan losses, offset in part by a Ps 3.7 billion increase in net provisions for foreclosed assets and other assets.
The Ps 1.1 billion decrease in net provisions for loan losses was attributable to a better quality of the loan portfolio during for 2014 versus 2013, which in turn implied lower requirements of provision expense. Banco AV Villas’ delinquency ratio (measured as loans at least 30 days past due as a percentage of total gross loans) decreased from 3.80% as of December 31, 2013 to 3.76% as of December 31, 2014. Both the delinquency ratios for the consumer loan portfolio and the mortgage loan portfolio decreased from 5.3% to 5.1% from December 2013 to December 2014.
Charge-offs increased from Ps 103.6 billion for the year ended December 31, 2013 to Ps 131.2 billion for the year ended December 31, 2014 and the ratio of charge-offs to average loans slightly increased from 1.7% for the year ended December 31, 2013 to 1.9% for the year ended December 31, 2014. Since Banco AV Villas’ net provisions for loan and financial lease losses increased, in absolute terms, more than charge-offs, the allowance for loan losses increased from Ps 295.6 billion as of December 31, 2013 to Ps 316.7 billion as of December 31, 2014. As of December 31, 2014 Banco AV Villas’ coverage over its past due loans was 117.8%.
The recovery of charged-off assets increased between the year ended December 31, 2013 and the year ended December 31, 2014 by Ps 11.1 billion to Ps 34.1 billion. The ratio of recovered charged-off assets to average loans slightly increased from 0.4% for the year ended December 31, 2013 to 0.5% for the year ended December 31, 2014.
Net provisions for accrued interest and other receivables decreased by Ps 11.0 billion to a net recovery of Ps 3.3 billion for the year ended December 31, 2014 due to higher reversal of provisions during the year ended December 31, 2014 as compared to the same period of 2013, associated to a Ps 8.2 billion recovery of provisions for accrued interest from investments.
Net provisions for foreclosed assets and other assets increased by Ps 3.7 billion to a net expense of Ps 4.4 billion for the year ended December 31, 2014 mainly due to a higher provision expense on investment securities.
Total fees and other services income, net
|
Year ended December 31,
|
Change, December 2014 vs. December 2013
|
|||||||||||||||
|
2014
|
2013
|
# |
%
|
|||||||||||||
|
(in Ps billions)
|
||||||||||||||||
|
Fees and other services income:
|
||||||||||||||||
|
Commissions from banking services
|
158.7 | 150.1 | 8.6 | 5.7 | ||||||||||||
|
Branch network services
|
– | – | – | – | ||||||||||||
|
Credit card merchant fees
|
17.9 | 16.3 | 1.6 | 9.6 | ||||||||||||
|
Checking fees
|
7.8 | 7.7 | 0.2 | 2.1 | ||||||||||||
|
Warehouse services
|
– | – | – | – | ||||||||||||
|
Fiduciary activities
|
– | – | – | – | ||||||||||||
|
Pension plan administration
|
– | – | – | – | ||||||||||||
|
Other
|
64.5 | 58.2 | 6.3 | 10.8 | ||||||||||||
|
Total fees and other services income
|
249.0 | 232.3 | 16.6 | 7.2 | ||||||||||||
|
Fees and other services expenses
|
(76.5 | ) | (66.7 | ) | 9.7 | 14.6 | ||||||||||
|
Total fees and other services income, net
|
172.5 | 165.6 | 6.9 | 4.2 | ||||||||||||
Total fees and other services income, net increased by 4.2%, or Ps 6.9 billion, to Ps 172.5 billion for the year ended December 31, 2014. This was primarily due to a Ps 8.6 billion increase in commissions from banking services, a Ps 6.3 billion increase in other fees which includes fees received from disbursing social security payments and a Ps 1.6 billion increase in credit card and merchant fees. This increase was partially offset by a Ps 9.7 billion increase in fees and other services expenses.
Other operating income
|
Year ended December 31,
|
Change, December 2014 vs. December 2013
|
|||||||||||||||
|
2014
|
2013
|
# |
%
|
|||||||||||||
|
(in Ps billions)
|
||||||||||||||||
|
Foreign exchange gains (losses), net
|
2.0 | 1.4 | 0.6 | (43.9 | ) | |||||||||||
|
Gains on derivative operations, net
|
2.4 | (0.5 | ) | 2.9 | (592.3 | ) | ||||||||||
|
Gains on sales of investments in equity securities, net
|
– | – | – | – | ||||||||||||
|
Income from non-financial sector, net
|
– | – | – | – | ||||||||||||
|
Dividend income
|
3.1 | 5.1 | (2.0 | ) | (39.2 | ) | ||||||||||
|
Other
|
0.5 | 0.0 | 0.5 | 11,298.9 | ||||||||||||
|
Other operating income
|
8.0 | 6.0 | 2.0 | 33.8 | ||||||||||||
Total other operating income increased by Ps 2.0 billion to Ps 8.0 billion for the year ended December 31, 2014. This increase was mainly driven by a Ps 3.5 billion increase in net foreign exchange and derivative operations offset in part by a Ps 2.0 billion decrease in dividend income. The decrease in dividend income was mainly due to lower dividends received from Banco AV Villas’ investment in Redeban, a clearing house in Colombia, during the year ended December 31, 2014 as compared to the same period in 2013.
Operating expenses
|
Year ended December 31,
|
Change, December 2014 vs. December 2013
|
|||||||||||||||
|
2014
|
2013
|
# |
%
|
|||||||||||||
|
(in Ps billions)
|
||||||||||||||||
|
Salaries and employee benefits
|
(161.1 | ) | (157.6 | ) | 3.5 | 2.2 | ||||||||||
|
Bonus plan payments
|
(1.5 | ) | (1.7 | ) | (0.2 | ) | (9.9 | ) | ||||||||
|
Termination payments
|
(0.4 | ) | (0.5 | ) | (0.1 | ) | (20.9 | ) | ||||||||
|
Administrative and other expenses
|
(285.8 | ) | (280.7 | ) | 5.1 | 1.8 | ||||||||||
|
Deposit security, net
|
(21.5 | ) | (21.3 | ) | 0.2 | 0.8 | ||||||||||
|
Charitable and other donation expenses
|
(0.7 | ) | (0.5 | ) | 0.2 | 41.1 | ||||||||||
|
Depreciation
|
(16.7 | ) | (20.3 | ) | (3.6 | ) | (18.0 | ) | ||||||||
|
Goodwill amortization
|
– | – | – | – | ||||||||||||
|
Total operating expenses
|
(487.6 | ) | (482.6 | ) | 5.1 | 1.0 | ||||||||||
Total operating expenses for the year ended December 31, 2014 increased by 1.0% or Ps 5.1 billion to Ps 487.6 billion. Administrative and other expenses increased by Ps 5.1 billion to Ps 285.8 billion and salaries and employee benefits increased by Ps 3.5 billion, or 2.2%, to Ps 161.1 billion, partially explained by the growth in the number of Banco AV Villas’ employees from 6,517 on December 31, 2013 to 6,947 on December 31, 2014. Partially offsetting these increases was a Ps 3.6 billion decrease in depreciation expense during the year ended December 31, 2014 as compared to the same period in 2013.
Because Banco AV Villas’ total operating expenses before depreciation and goodwill amortization increased by 1.9%, while its operating income before net provisions decreased by 1.8% driven by the decrease in net income, Banco AV Villas’ efficiency ratio deteriorated at December 31, 2014 as compared to December 31, 2013 from 51.6% to 53.6%. The ratio of operating expenses before depreciation and goodwill amortization as a percentage of average assets improved from 5.0% for the year ended December 31, 2013 to 4.5% for the year ended December 31, 2014.
Non-operating income (expense)
Total non-operating income (expense) increased by Ps 9.7 billion to Ps 12.9 billion for the year ended December 31, 2014. This increase was mainly driven by (i) Ps 4.2 billion of income resulting from the dissolution of two trust managing mortgage loans and mortgage foreclosed assets, and (ii) a Ps 3.8 billion increase in recoveries from previous periods expenses.
Income tax expense
Income tax expense decreased by 1.8%, or Ps 1.7 billion, to Ps 94.6 billion for the year ended December 31, 2014. Banco AV Villas’ effective tax rate decreased from 34.1% for the year ended December 31, 2013 to 32.6% for the year ended December 31, 2014.
Non-controlling interest
Banco AV Villas’ non-controlling interest, responsible for only 0.2% of its net income before non-controlling interest for the year ended December 31, 2014, increased from Ps 0.01 billion for the year ended December 31, 2013 to Ps 0.29 billion for the year ended December 31, 2014. Banco AV Villas’ non-controlling interest reflects other Grupo Aval banks’ ownership in A Toda Hora S.A. by other subsidiaries of Grupo Aval.
Segment Results of Operations for the Year Ended December 31, 2013 Compared to the Year Ended December 31, 2012
Banco de Bogotá
Overview
Banco de Bogotá’s net income attributable to its shareholders for the year ended December 31, 2013 increased by 5.6%, or Ps 74.0 billion, to Ps 1,400.0 billion compared to the year ended December 31, 2012. This increase reflects an increase of Ps 473.5 billion in net interest income, an increase of Ps 370.6 billion in total net fees and other service income, net (Horizonte’s operations accounted for Ps 170.2 billion of this increase), and a Ps 360.4 billion increase in total other operating income. These increases were offset in part by a Ps 581.4 billion increase in total operating expenses (Horizonte’s operations accounted for Ps 130.2 billion of this increase), an increase of Ps 258.8 billion in total net provisions, a decrease of Ps 143.8 billion in total non-operating income, an increase of Ps 120.9 billion in non-controlling interest, and an increase of Ps 25.6 billion in income tax expense.
In December 2013, Banco de Bogotá closed two acquisitions in Central America. These acquisitions had a minimal impact on Banco de Bogotá’s balance sheet, as they accounted for only 6.7% (3.1% for Grupo Reformador and 3.6% for BBVA Panamá) of Banco de Bogotá’s consolidated assets as of December 31, 2013, and had no effect on Banco de Bogotá’s income statement as each of their results of operations for the month of December 2013 were recorded as retained earnings on Banco de Bogotá’s balance sheet.
Horizonte was acquired on April 18, 2013 and merged with Porvenir on December 31, 2013 (for further details see “Item 4. Information on the Company—A. History and development of the company—Our company”). This acquisition impacted the total fees and other services income, net, and the total operating expenses line items.
The following discussion describes the principal drivers of Banco de Bogotá’s consolidated results of operations for the year ended December 31, 2013 versus the year ended December 31, 2012. Further detail is provided in the discussion of the results of operations for LB Panamá, Porvenir and Corficolombiana.
|
Banco de Bogotá consolidated
|
||||||||||||||||
|
Year ended December 31,
|
Change, December 2013 vs. December 2012
|
|||||||||||||||
|
2013
|
2012
|
# |
%
|
|||||||||||||
|
(in Ps billions)
|
||||||||||||||||
|
Total interest income
|
6,225.6 | 5,698.5 | 527.1 | 9.3 | ||||||||||||
|
Total interest expense
|
(2,242.4 | ) | (2,188.8 | ) | 53.6 | 2.4 | ||||||||||
|
Net interest income
|
3,983.2 | 3,509.7 | 473.5 | 13.5 | ||||||||||||
|
Total (provisions)/reversals, net
|
(773.9 | ) | (515.1 | ) | 258.8 | 50.3 | ||||||||||
|
Total fees and other services income, net
|
2,254.3 | 1,883.7 | 370.6 | 19.7 | ||||||||||||
|
Total other operating income
|
1,036.7 | 676.3 | 360.4 | 53.3 | ||||||||||||
|
Total operating income
|
6,500.3 | 5,554.6 | 945.7 | 17.0 | ||||||||||||
|
Total operating expenses
|
(3,780.1 | ) | (3,198.6 | ) | 581.4 | 18.2 | ||||||||||
|
Net operating income
|
2,720.2 | 2,356.0 | 364.2 | 15.5 | ||||||||||||
|
Total non-operating income (expense), net
|
171.2 | 314.9 | (143.8 | ) | (45.6 | ) | ||||||||||
|
Income before income tax expense and non-controlling interest
|
2,891.4 | 2,670.9 | 220.5 | 8.3 | ||||||||||||
|
Income tax expense
|
(944.9 | ) | (919.3 | ) | 25.6 | 2.8 | ||||||||||
|
Income before non-controlling interest
|
1,946.5 | 1,751.6 | 194.9 | 11.1 | ||||||||||||
|
Non-controlling interest
|
(546.5 | ) | (425.6 | ) | 120.9 | 28.4 | ||||||||||
|
Net income attributable to shareholders
|
1,400.0 | 1,326.0 | 74.0 | 5.6 | ||||||||||||
Net Interest Income
|
Year ended December 31,
|
Change, December 2013 vs. December 2012
|
|||||||||||||||
|
2013
|
2012
|
# |
%
|
|||||||||||||
|
(in Ps billions)
|
||||||||||||||||
|
Interest income:
|
||||||||||||||||
|
Interest on loans
|
4,962.0 | 4,503.6 | 458.4 | 10.2 | ||||||||||||
|
Interest on investment securities
|
904.8 | 850.9 | 53.9 | 6.3 | ||||||||||||
|
Interbank and overnight funds
|
135.9 | 138.4 | (2.5 | ) | (1.8 | ) | ||||||||||
|
Financial leases
|
222.9 | 205.5 | 17.4 | 8.4 | ||||||||||||
|
Total interest income
|
6,225.6 | 5,698.5 | 527.1 | 9.3 | ||||||||||||
|
Interest expense:
|
||||||||||||||||
|
Checking accounts
|
(127.6 | ) | (123.3 | ) | 4.3 | 3.5 | ||||||||||
|
Time deposits
|
(958.9 | ) | (935.7 | ) | 23.3 | 2.5 | ||||||||||
|
Savings deposits
|
(546.6 | ) | (572.5 | ) | (25.9 | ) | (4.5 | ) | ||||||||
|
Total interest expense from deposits
|
(1,633.1 | ) | (1,631.4 | ) | 1.7 | 0.1 | ||||||||||
|
Borrowing from banks and others
|
(318.5 | ) | (262.7 | ) | 55.8 | 21.2 | ||||||||||
|
Interbank and overnight funds (expenses)
|
(121.8 | ) | (170.2 | ) | (48.4 | ) | (28.4 | ) | ||||||||
|
Long-term debt (bonds)
|
(169.0 | ) | (124.4 | ) | 44.5 | 35.8 | ||||||||||
|
Total interest expense
|
(2,242.4 | ) | (2,188.8 | ) | 53.6 | 2.4 | ||||||||||
|
Net interest income
|
3,983.2 | 3,509.7 | 473.5 | 13.5 | ||||||||||||
Banco de Bogotá’s net interest income increased by 13.5%, or Ps 473.5 billion, from Ps 3,509.7 billion in 2012 to Ps 3,983.2 billion in 2013. This increase is due to a 9.3%, or Ps 527.1 billion, increase in total interest income, partially offset by an increase of 2.4%, or Ps 53.6 billion, in total interest expense.
Total interest income increased by 9.3%, or Ps 527.1 billion, from Ps 5,698.5 billion in the year ended December 31, 2012 to Ps 6,225.6 billion in year ended December 31, 2013, mainly due to (i) an increase in interest income from loans and financial leases, which rose by Ps 475.7 billion to Ps 5,184.9 billion in the year ended December 31, 2013, (ii) an increase in interest income from investment securities of Ps 53.9 billion to Ps 904.8 billion, and (iii) a decrease in interest income from interbank and overnight funds of Ps 2.5 billion to Ps 135.9 billion. Total interest income for Banco de Bogotá, excluding LB Panamá’s operations, increased by Ps 114.6 billion, driven by a Ps 6,006.6 billion increase in the average balance of total interest-earning assets from Ps 43,688.8 billion for the year ended December 31, 2012 to Ps 49,695.4 billion for the year ended December 31, 2013, resulting in a Ps 472.4 billion increase in interest income, offset in part by a 91 basis points decrease in the average yield of total interest-earning assets from 9.4% for the year ended December 31, 2012 to 8.5% for the year ended December 31, 2013, which resulted in a Ps 357.8 billion decrease in interest income. Total interest income for LB Panamá’s operations increased by Ps 412.5 billion, driven by a Ps 4,358.6 billion increase in the average balance of total interest-earning assets from Ps 14,069.7 billion for the year ended December 31, 2012 to Ps 18,428.3 billion for the year ended December 31, 2013, resulting in a Ps 431.5 billion increase in interest income, offset in part by a 40 basis points decrease in the average yield of total interest-earning assets from 11.2% for the year ended December 31, 2012 to 10.8% for the year ended December 31, 2013, which resulted in a Ps 18.9 billion decrease in interest income. The average yield of total interest-earning assets for Banco de Bogotá’s consolidated operation decreased from 9.9% to 9.1%.
The increase in interest income from loans and financial leases of Ps 475.7 billion was a result of an increase of Ps 7,310.7 billion, or 17.6%, in the average balance of interest-earning loans and financial leases from Ps 41,481.2 billion as of December 31, 2012 to Ps 48,791.9 billion as of December 31, 2013, which resulted in an increase of Ps 763.9 billion in interest income, partially offset by a decrease in the average yield on loans and financial leases from 11.4% for the year ended December 31, 2012 to 10.6% for the year ended December 31, 2013, which resulted in a Ps 288.2 billion decrease in interest income. The year-end balance of commercial loans, consumer loans and mortgage loans increased by Ps 4,515.2 billion, or 15.7%, Ps 2,045.1 billion, or 18.8%, and Ps 1,153.2 billion, or 33.4%, respectively, excluding the Central American acquisitions (including the Central American acquisitions, our year-end loans and financial leases would have increased by an additional 10.6%). The increase in the year-end balance of loans and financial leases was driven primarily by economic growth in Colombia and Central America. Banco de Bogotá’s average yield on loans and financial leases, excluding LB Panamá’s operations, decreased from
10.8% for the year ended December 31, 2012 to 9.8% for the year ended December 31, 2013, in line with a decreasing interest rate environment where the average DTF rate decreased by 111 basis points from 5.35% for the year ended December 31, 2012 to 4.24% for the year ended December 31, 2013. The average yield on loans and financial leases for LB Panamá’s operations decreased from 12.9% for the year ended December 31, 2012 to 12.5% for the year ended December 31, 2013, due to a change in the mix in the loan and financial leases portfolio from 2012 to 2013 in favor of commercial loans (further explained in “—Banco de Bogotá subsidiary analysis—LB Panamá—Net interest income”).
The increase in interest income from investment securities of Ps 53.9 billion, or 6.3%, to Ps 904.8 billion was a result of a 20.5% increase in the average volume of investment securities from Ps 14,151.8 billion for the year ended December 31, 2012 to Ps 17,049.1 billion for the year ended December 31, 2013, primarily at LB Panamá, resulting in Ps 142.9 billion increase in interest income from investment securities, offset in part by a decrease in the average yield from 6.0% to 5.3% which resulted in a Ps 89.0 billion decrease in interest income from investment securities.
Interest income derived from the fixed income portfolio of Banco de Bogotá’s operations decreased by 1.9%, or Ps 14.2 billion, driven by an increase in the treasury yield curve experienced in Colombia, for the same reasons described in “—Results of operations for the year ended December 31, 2013 compared to the year ended December 31, 2012—Grupo Aval.” Interest income from equity investments from Banco de Bogotá’s operations increased by Ps 68.1 billion to Ps 160.9 billion, mainly as a result of Corficolombiana’s higher income from its equity investment portfolio, offset in part by a decrease in income from Porvenir’s mandatory investment portfolio (further explained in “—Banco de Bogotá subsidiary analysis—Corficolombiana—Net interest income” and in “—Banco de Bogotá subsidiary analysis—Porvenir—Net interest income”).
Total interest expense at Banco de Bogotá increased by Ps 53.6 billion, or 2.4%, from Ps 2,188.8 billion in the year ended December 31, 2012 to Ps 2,242.4 billion in the year ended December 31, 2013, as a result of a Ps 55.8 billion increase in interest paid for borrowings and banks and others, a Ps 44.5 billion increase in interest paid for long-term debt, a Ps 23.3 billion increase in interest paid in time deposits, and a Ps 4.3 billion increase in interest paid for checking accounts, offset in part by a Ps 48.4 billion decrease in interest paid for interbank and overnight funds and a Ps 25.9 billion decrease in interest paid for savings deposits.
The Ps 53.6 billion increase in total interest expense is explained by a Ps 10,154.9 billion, or 18.9%, increase in the average balance of total interest-bearing liabilities from Ps 53,846.3 billion for the year ended December 31, 2012 to Ps 64,001.2 billion for the year ended December 31, 2013, resulting in a Ps 368.5 billion increase in interest expense, partially offset by a decrease of 56 basis points in the average cost of funding, in line with a decreasing rate environment, from 4.1% paid during the year ended December 31, 2012 to 3.5% paid during the year ended December 31, 2013, which resulted in a Ps 314.9 billion decrease in interest expense. Total interest expense for Banco de Bogotá, excluding LB Panamá’s operations, decreased by Ps 128.8 billion, driven by a decrease of 86 basis points in the average cost of funding from 4.5% paid during the year ended December 31, 2012 to 3.7% paid during the year ended December 31, 2013, which resulted in a Ps 348.5 billion decrease in interest expense, offset in part by a Ps 5,602.0 billion, or 14.4%, increase in the average balance of total interest-bearing liabilities from Ps 38,842.3 billion for the year ended December 31, 2012 to Ps 44,444.3 billion for the year ended December 31, 2013, resulting in a Ps 219.7 billion increase in interest expense. Total interest expense for LB Panamá’s operations increased by Ps 182.4 billion, explained by a Ps 4,552.9 billion increase in the average balance of total interest-bearing liabilities, from Ps 15,004.0 billion for the year ended December 31, 2012 to Ps 19,556.9 billion for the year ended December 31, 2013, resulting in a Ps 161.6 billion increase in interest expense and an increase of 27 basis points in the average cost of funding from 2.8% paid during the year ended December 31, 2012 to 3.1% paid during the year ended December 31, 2013, which resulted in a Ps 20.8 billion increase in interest expense. The increase in the average cost of funding for LB Panamá’s operations was driven by (i) an increase in the proportion of borrowings from banks and others, which have a higher cost, to total funding while the proportion of total deposits, which have a lower cost, to total funding decreased; and (ii) an increase in the average cost of deposit, due to a change in the deposit mix as the proportion of time deposits, which have a higher cost, to total deposits increased while the proportion of checking accounts, which have a lower cost, to total deposits decreased.
The Ps 55.8 billion increase in interest paid for borrowings from banks and others resulted from a Ps 1,956.5 billion, or 28.0%, increase in the average balance from Ps 6,986.8 billion for the year ended December 31, 2012 to Ps 8,943.4 billion for the year ended December 31, 2013, resulting in Ps 66.6 billion increase in interest expense. This increase was partially offset by a decrease of 20 basis points in the average interest rate from 3.8% paid during
the year ended December 31, 2012 to 3.6% paid during the year ended December 31, 2013, which resulted in a Ps 10.8 billion decrease in interest expense.
The Ps 44.5 billion increase in interest paid for long-term debt resulted from an increase in the average volume of long-term debt from Ps 2,065.4 billion for the year ended December 31, 2012 to Ps 2,970.5 billion for the year ended December 31, 2013, driven by the U.S.$500 million issuance (Ps 892.7 billion at the date of the issuance) of subordinated notes in February 2013, which resulted in Ps 50.6 billion increase in interest expense. Partially offsetting this increase was a decrease of 34 basis points in the average interest rate paid from 6.0% for the year ended December 31, 2012 to 5.7% for the year ended December 31, 2013, resulting in Ps 6.1 billion decrease in interest expense.
The Ps 23.3 billion increase in interest paid for time deposits resulted from a Ps 2,969.3 billion, or 16.7%, increase in the average balance of time deposits from Ps 17,826.4 billion for the year ended December 31, 2012 to Ps 20,795.6 billion for the year ended December 31, 2013, resulting in a Ps 122.0 billion increase in interest expense, offset in part by a decrease of 64 basis points in the average interest rate, decreasing from 5.2% paid during the year ended December 31, 2012 to 4.6% paid during the year ended December 31, 2013, which resulted in Ps 98.8 billion decrease in interest expense.
The Ps 4.3 billion increase in interest paid for checking accounts resulted from a Ps 687.5 billion increase in the average volume of checking accounts from Ps 6,968.1 billion for the year ended December 31, 2012 to Ps 7,655.5 billion for the year ended December 31, 2013, which resulted in a Ps 26.3 billion increase in interest expense. Partially offsetting this increase was a decrease of 10 basis points in the average interest rate paid from 1.8% for the year ended December 31, 2012 to 1.7% for the year ended December 31, 2013, resulting in a Ps 22.0 billion decrease in interest expense.
The Ps 48.4 billion decrease in interest paid for interbank and overnight funds resulted from a decrease of 141 basis points in the average interest rate from 4.1% paid during the year ended December 31, 2012 to 2.7% paid during the year ended December 31, 2013, resulting in a Ps 58.0 billion decrease in interest expense, offset in part by a Ps 363.4 billion increase in the average balance of interbank borrowings and overnight funds from Ps 4,129.1 billion for the year ended December 31, 2012 to Ps 4,492.6 billion for the year ended December 31, 2013, which resulted in a Ps 9.6 billion increase in interest expense.
Finally, the Ps 25.9 billion decrease in interest paid for savings deposits resulted from a 75 basis points decrease in the average interest rate paid from 3.6% for year ended December 31, 2012 to 2.9% for the year ended December 31, 2013, which resulted in a Ps 119.2 billion decrease in interest expense, partially offset by a Ps 3,273.2 billion increase in the average volume of savings deposits from Ps 15,870.4 billion for the year ended December 31, 2012 to Ps 19,143.6 billion for the year ended December 31, 2013, resulting in a Ps 93.3 billion increase in interest expense.
Banco de Bogotá’s average total interest-earning assets increased by 17.9% for the year ended December 31, 2013 compared to the year ended December 31, 2012, while net interest income increased by 13.5%. This resulted in a contraction in net interest margin (calculated as net interest income divided by total average interest-earning assets) from 6.1% for the year ended December 31, 2012 to 5.8% for the year ended December 31, 2013, which was in line with the decreasing interest rate environment as interest-earning assets reprice faster than interest-bearing liabilities. Showing a similar tendency, the spread between the yield earned on loans and financial leases and the rate paid on deposits decreased from 7.3% for the year ended December 31, 2012 to 7.2% for the year ended December 31, 2013.
Provisions
Total net provisions increased by Ps 258.8 billion to Ps 773.9 billion in the year ended December 31, 2013, driven primarily by a Ps 239.4 billion increase in net provisions for losses on loans and financial leases from Ps 519.0 billion for the year ended December 31, 2012 to Ps 758.3 billion for the year ended December 31, 2013. This increase was driven by (i) an increase in the balance of loans and financial leases, particularly for consumer loans which, by regulation, require more provisions; and (ii) a slight deterioration in credit quality as Banco de Bogotá’s delinquency ratio (measured as loans at least 30 days past due as a percentage of total gross loans) increased to 2.3% as of December 31, 2013 versus 2.1% as of December 31, 2012 (2.1% as of December 31, 2013 versus 2.1% as of December 31, 2012, excluding the Central American acquisitions). The increase in the
delinquency ratio was due to a higher growth in consumer loans (which typically experience higher delinquency levels) as compared to commercial loans, and a deterioration in the credit quality of the consumer loan portfolio. The ratio of net provisions for loan and financial lease losses to average loan and financial leases increased from 1.2% for the year ended December 31, 2012 to 1.5% for the year ended December 31, 2013 (slightly higher than the five year average of 1.4%).
Banco de Bogotá’s charge-offs increased by Ps 162.1 billion from Ps 355.3 billion for the year ended December 31, 2012 to Ps 517.4 billion for the year ended December 31, 2013. Its annualized ratio of charge-offs to average balance of loans and financial leases ratio increased from 0.8% for the year ended December 31, 2012 to 1.0% for the year ended December 31, 2013 (in line with the five year average of 1.0%).
Banco de Bogotá’s allowance for loans and financial leases increased by Ps 385.5 billion (Ps 120.1 billion of this increase corresponds to the allowance for loans and financial lease losses from Grupo Reformador and Banco BAC de Panamá) to Ps 1,638.4 billion at December 31, 2013, and its coverage ratio over past due loans remained strong at 123.3% at December 31, 2013. The coverage ratio at December 31, 2012 was 132.2%. Banco de Bogotá’s coverage ratio for 2013, excluding the Central American acquisitions, was 133.5%.
Also contributing to the increase in total net provisions was the Ps 21.9 billion increase in net provisions for accrued interest and other receivables, resulting in a net expense of Ps 58.2 billion as of December 31, 2013 from Ps 36.3 billion as of December 31, 2012. This increase was mainly driven by higher gross provision expense in 2013 than in 2012, driven primarily by an increase in the average balance of accrued interest and other receivables.
Provision expense for foreclosed assets and other assets increased by Ps 8.6 billion, primarily as a result of a Ps 16.0 billion decrease in recovery of provisions for foreclosed assets and other assets, offset in part by a Ps 7.4 billion decrease in gross provision expense.
The recovery of charged-off assets increased from the year ended December 31, 2012 to the year ended December 31, 2013 by Ps 11.0 billion to Ps 58.9 billion.
Total Fees and Other Services Income
|
Year ended December 31,
|
Change, December 2013 vs. December 2012
|
|||||||||||||||
|
2013
|
2012
|
# |
%
|
|||||||||||||
|
(in Ps billions)
|
||||||||||||||||
|
Fees and other services income:
|
||||||||||||||||
|
Commissions from banking services
|
1,126.3 | 1,014.7 | 111.7 | 11.0 | ||||||||||||
|
Branch network services
|
27.9 | 27.4 | 0.4 | 1.5 | ||||||||||||
|
Credit card merchant fees
|
293.2 | 254.8 | 38.4 | 15.1 | ||||||||||||
|
Checking fees
|
34.8 | 38.3 | (3.4 | ) | (9.0 | ) | ||||||||||
|
Warehouse services
|
129.8 | 113.5 | 16.2 | 14.3 | ||||||||||||
|
Fiduciary activities
|
142.1 | 118.7 | 23.4 | 19.7 | ||||||||||||
|
Pension plan administration(1)
|
721.5 | 485.9 | 235.6 | 48.5 | ||||||||||||
|
Other
|
91.0 | 92.4 | (1.4 | ) | (1.5 | ) | ||||||||||
|
Total fees and other services income
|
2,566.5 | 2,145.6 | 420.8 | 19.6 | ||||||||||||
|
Fees and other services expenses(1)
|
(312.2 | ) | (261.9 | ) | 50.3 | 19.2 | ||||||||||
|
Total fees and other services income, net
|
2,254.3 | 1,883.7 | 370.6 | 19.7 | ||||||||||||
|
(1)
|
Horizonte’s operations accounted for Ps 204.5 billion in income from pension plan administration fees and Ps 34.3 billion in total fees and other service expenses.
|
Total fees and other services income, net, increased by 19.7%, or Ps 370.6 billion, to Ps 2,254.3 billion in the year ended December 31, 2013. Horizonte’s operations accounted for 45.9%, or Ps 170.2 billion, of this increase (Ps 204.5 billion in pension plan administration fees netted by Ps 34.3 billion in total fees and other services expense).
Excluding the impact from Horizonte, total fees and other services income, net, increased by 10.6%, or Ps 200.4 billion, to Ps 2,084.0 billion in the year ended December 31, 2013 primarily as a result of a Ps 111.7 billion increase
in fee income derived from commissions from banking services, a Ps 38.4 billion increase in credit card merchant fees, a Ps 31.1 billion increase in pension plan administration fees, a Ps 23.4 billion increase in fiduciary activities, and a Ps 16.2 billion increase in warehouse services.
The Ps 111.7 billion increase in commissions from banking services and the Ps 38.4 billion increase in credit card merchant fees from the year ended December 31, 2012 to the year ended December 31, 2013 were in line with the organic growth of the loan portfolio and deposits. LB Panamá accounted for Ps 57.9 billion, or 51.8%, and Ps 24.9 billion, or 64.9%, of the increase in commissions from banking services and credit card merchant fees, respectively (further explained in “—Banco de Bogotá subsidiary analysis—LB Panamá—Total fees and other services income”), and Banco de Bogotá’s operations in Colombia accounted for the rest.
The Ps 31.1 billion increase in pension plan administration fees was mainly a result of higher fee income generated by Porvenir consisting of commissions earned on the administration of mandatory pension funds (which increased by Ps 45.8 billion to Ps 346.4 billion in the year ended December 31, 2013), severance funds (which increased by Ps 6.1 billion to Ps 72.1 billion in the year ended December 31, 2013) and voluntary pension funds (which increased by Ps 5.5 billion to Ps 53.7 billion in the year ended December 31, 2012), partially offset by a decrease in commissions earned on the administration of third-party liability pension funds (which decreased by Ps 24.9 billion to Ps 13.7 billion in the year ended December 31, 2013) and in other administration fees (which decreased by Ps 5.9 billion to Ps 15.1 billion in the year ended December 31, 2013) as further explained in “—Banco de Bogotá subsidiary analysis—Porvenir—Total fees and other services.”
The Ps 23.4 billion increase in fees from fiduciary activities and the Ps 16.2 billion increase in fees from warehouse services correspond to higher fees from the operations of Fiduciaria de Bogotá and Almaviva, respectively.
Other Operating Income
|
Year ended December 31,
|
Change, December 2013 vs. December 2012
|
|||||||||||||||
|
2013
|
2012
|
# |
%
|
|||||||||||||
|
(in Ps billions)
|
||||||||||||||||
|
Foreign exchange gains (losses), net
|
312.9 | (40.5 | ) | 353.5 | (872.0 | ) | ||||||||||
|
Gains (losses) on derivative operations, net
|
(42.0 | ) | 178.7 | (220.7 | ) | (123.5 | ) | |||||||||
|
Gains on sales of investments in equity securities, net
|
7.1 | 7.4 | (0.3 | ) | (3.8 | ) | ||||||||||
|
Income from non-financial sector, net(1)
|
436.4 | 379.3 | 57.1 | 15.0 | ||||||||||||
|
Dividend income
|
310.1 | 103.8 | 206.4 | 198.9 | ||||||||||||
|
Other
|
12.2 | 47.7 | (35.5 | ) | (74.5 | ) | ||||||||||
|
Other operating income
|
1,036.7 | 676.3 | 360.4 | 53.3 | ||||||||||||
|
(1)
|
Income from non-financial sector, net, reflects the operating results of Corficolombiana in its consolidated investments in companies not related to the financial sector such as Epiandes, Hoteles Estelar, Organización Pajonales, Pizano, Unipalma, Valora and Lehner, among others. This result is net of operating and administrative expenses of Ps 1,145.4 billion in 2013 and Ps 1,118.9 billion in 2012. For a description of these investments, see “Item 4. Information on the Company—B. Business overview—Corficolombiana—Equity investment portfolio.”
|
Total other operating income increased by 53.3%, or Ps 360.4 billion, to Ps 1,036.7 billion in the year ended December 31, 2013, mainly due to a Ps 206.4 billion increase in dividend income from Ps 103.8 billion for the year ended December 31, 2012 to Ps 310.1 billion for the year ended December 31, 2013 that was driven by a Ps 272.0 billion increase in dividend income from Promigas during 2013, offset in part by a Ps 58.5 billion decrease in dividends received from CFC Limited and CFC Gas Holding SAS (further explained in “—Banco de Bogotá subsidiary analysis—Corficolombiana”).
Also contributing to the increase in other operating income was a Ps 132.7 billion increase in net foreign exchange and derivative operations to Ps 270.9 billion for the year ended December 31, 2013. Banco de Bogotá assumes trading positions on foreign exchange for its own benefit and those of its clients. This increase was mainly driven by (i) a Ps 66.7 billion increase in net foreign exchange and derivative operations in Corficolombiana due to non-recurring losses in foreign exchange gains associated with previously held dollar denominated investments
during 2012 and net gains in 2013 related to the peso appreciation (further explained in “—Banco de Bogotá subsidiary analysis—Corficolombiana”); and (ii) a Ps 64.5 billion increase in net foreign exchange and derivative operations from Banco de Bogotá’s unconsolidated operations also related to the peso appreciation.
The Ps 57.1 billion increase in income from the non-financial sector, which reflected the net operating income result of non-financial companies consolidated by Corficolombiana, was mainly driven by higher net operating income from Corficolombiana’s toll road concession companies, which include Epiandes (Ps 29.7 billion), Episol (Ps 27.4 billion) and Pisa (Ps 8.3 billion) (further explained in “—Banco de Bogotá subsidiary analysis—Corficolombiana”).
Partially offsetting this increase was a Ps 35.5 billion decrease in other operating income mainly due to lower income from joint venture asset servicing by its fiduciary subsidiaries for the year ended December 31, 2013, driven by a decrease in the commissions charged by FONPET.
Operating Expenses
|
Year ended December 31,
|
Change, December 2013 vs. December 2012
|
|||||||||||||||
|
2013
|
2012
|
# |
%
|
|||||||||||||
|
(in Ps billions)
|
||||||||||||||||
|
Salaries and employee benefits
|
(1,387.6 | ) | (1,166.8 | ) | 220.9 | 18.9 | ||||||||||
|
Bonus plan payments
|
(92.8 | ) | (67.6 | ) | 25.3 | 37.4 | ||||||||||
|
Termination payments
|
(14.8 | ) | (17.9 | ) | (3.1 | ) | (17.3 | ) | ||||||||
|
Administrative and other expenses
|
(1,948.1 | ) | (1,645.5 | ) | 302.7 | 18.4 | ||||||||||
|
Deposit security, net
|
(115.7 | ) | (101.1 | ) | 14.6 | 14.4 | ||||||||||
|
Charitable and other donation expenses
|
(4.0 | ) | (8.7 | ) | (4.8 | ) | (54.7 | ) | ||||||||
|
Depreciation
|
(131.1 | ) | (117.1 | ) | 14.0 | 11.9 | ||||||||||
|
Goodwill amortization
|
(85.9 | ) | (74.0 | ) | 11.9 | 16.2 | ||||||||||
|
Total operating expenses
|
(3,780.1 | ) | (3,198.6 | ) | 581.4 | 18.2 | ||||||||||
|
Horizonte
|
Banco de Bogotá excluding Horizonte
|
|||||||||||||||||||
|
Year ended December 31,
2013
|
Year ended
December 31,
|
Change, December 2013 vs. December 2012
|
||||||||||||||||||
|
2013
|
2012
|
# |
%
|
|||||||||||||||||
|
(in Ps billions)
|
||||||||||||||||||||
|
Salaries and employee benefits
|
(45.6 | ) | (1,342.0 | ) | (1,166.8 | ) | 175.2 | 15.0 | ||||||||||||
|
Bonus plan payments
|
(12.2 | ) | (80.7 | ) | (67.6 | ) | 13.1 | 19.4 | ||||||||||||
|
Termination payments
|
(0.3 | ) | (14.5 | ) | (17.9 | ) | (3.4 | ) | (18.9 | ) | ||||||||||
|
Administrative and other expenses
|
(68.7 | ) | (1,879.5 | ) | (1,645.5 | ) | 234.0 | 14.2 | ||||||||||||
|
Deposit security, net
|
– | (115.7 | ) | (101.1 | ) | 14.6 | 14.4 | |||||||||||||
|
Charitable and other donation expenses
|
(0.9 | ) | (3.1 | ) | (8.7 | ) | (5.7 | ) | (64.9 | ) | ||||||||||
|
Depreciation
|
(2.5 | ) | (128.5 | ) | (117.1 | ) | 11.4 | 9.8 | ||||||||||||
|
Goodwill amortization
|
– | (85.9 | ) | (74.0 | ) | 11.9 | 16.2 | |||||||||||||
|
Total operating expenses
|
(130.2 | ) | (3,649.9 | ) | (3,198.6 | ) | 451.3 | 14.1 | ||||||||||||
Total operating expenses increased by 18.2%, or Ps 581.4 billion, to Ps 3,780.1 billion in the year ended December 31, 2013. Horizonte’s operation accounted for Ps 130.2 billion of this increase.
Total operating expenses for Banco de Bogotá, excluding Horizonte, increased by 14.1%, or Ps 451.3 billion, to Ps 3,649.9 billion in the year ended December 31, 2013. This increase primarily reflected a Ps 234.0 billion increase in administrative and other expenses, a Ps 175.2 billion increase in salaries and employee benefits, and a Ps 13.1 billion increase in bonus plan payments. These increases are associated with the organic growth of the business and its personnel. Between December 31, 2012 and December 31, 2013, headcount increased by 3,712 people, which represents an increase of 10.5% (excluding Horizonte) from 35,508 in 2012 to 39,220 in 2013 and is in line with the growth experienced in 2013.
Also contributing to the increase in total operating expenses for Banco de Bogotá’s operations, excluding Horizonte, were: (i) a Ps 14.6 billion increase in deposit security expense (representing Colombian mandatory deposit insurance) driven by an increase in the average balance of deposits, (ii) a Ps 11.9 billion increase goodwill amortization expense associated with the Horizonte acquisition, and (iii) a Ps 11.4 billion increase in depreciation expense.
Banco de Bogotá’s efficiency ratio improved from 49.6% for the year ended December 31, 2012 to 49.0% for the year ended December 31, 2013, and the ratio of annualized operating expenses before depreciation and amortization as a percentage of average assets remained unchanged at 4.1%. Banco de Bogotá’s efficiency ratio excluding Horizonte improved from 49.6% for the year ended December 31, 2012 to 48.4% for the year ended December 31, 2013.
Non-Operating Income (Expense)
Total non-operating income (expense) decreased by Ps 143.8 billion from Ps 314.9 billion in the year ended December 31, 2012 to Ps 171.2 billion in the year ended December 31, 2013. The higher result in 2012 was related to non-recurring income related to leaseback transactions completed by Hoteles Estelar and Pizano and higher income from toll road concession projects in Episol (further explained in “—Banco de Bogotá subsidiary analysis—Corficolombiana”).
Income Tax Expense
Income before income tax expense and non-controlling interest increased 8.3% from Ps 2,670.9 billion for the year ended December 31, 2012 to Ps 2,891.4 billion for the year ended December 31, 2013. Income tax expense increased by 2.8% to Ps 944.9 billion for the year ended December 31, 2013, resulting in a decrease of Banco de Bogotá’s effective tax rate from 34.4% for the year ended December 31, 2012 to 32.7% for the year ended December 31, 2013. The decrease in the effective tax rate was driven by decreases in the effective tax rates of Corficolombiana and LB Panamá.
Non-Controlling Interest
Banco de Bogotá’s non-controlling interest increased by Ps 120.9 billion, or 28.4%, to Ps 546.5 billion in the year ended December 31, 2013 compared with the year ended December 31, 2012. The increase in non-controlling interest was primarily a result of higher net income from Corficolombiana’s operations in 2013 as compared to 2012, as further described in “—Banco de Bogotá subsidiary analysis—Corficolombiana.” The ratio of minority interest to net income before minority interest increased from 24.3% for the year ended December 31, 2012 to 28.1% for the year ended December 31, 2013, as Banco de Bogotá holds 38.2% of Corficolombiana and consolidates it into its operations. As a result, higher net income at Corficolombiana generates a higher minority interest at Banco de Bogotá.
Banco de Bogotá Subsidiary Analysis
Banco de Bogotá’s results of operations are significantly affected by the results of operations of its subsidiaries, Corficolombiana, Porvenir and LB Panamá. In order to fully disclose the effect of these subsidiaries on Banco de Bogotá, the following is an analysis of the results of operations of each of Corficolombiana, Porvenir and LB Panamá in the year ended December 31, 2013 compared to the year ended December 31, 2012.
Corficolombiana
Net Income
|
Year ended December 31,
|
Change, December 2013 vs. December 2012
|
|||||||||||||||
|
2013
|
2012
|
# |
%
|
|||||||||||||
|
(in Ps billions)
|
||||||||||||||||
|
Total interest income
|
469.8 | 454.5 | 15.3 | 3.4 | ||||||||||||
|
Total interest expense
|
(307.2 | ) | (375.9 | ) | (68.8 | ) | (18.3 | ) | ||||||||
|
Net interest income
|
162.6 | 78.6 | 84.1 | 107.0 | ||||||||||||
|
Total (provisions)/reversals, net
|
(0.9 | ) | 2.4 | 3.3 | (138.7 | ) | ||||||||||
|
Total fees and other services income, net
|
42.1 | 44.1 | (2.0 | ) | (4.4 | ) | ||||||||||
|
Total other operating income
|
783.0 | 450.9 | 332.0 | 73.6 | ||||||||||||
|
Total operating income
|
986.8 | 576.0 | 410.8 | 71.3 | ||||||||||||
|
Total operating expenses
|
(156.8 | ) | (143.3 | ) | 13.5 | 9.4 | ||||||||||
|
Net operating income
|
830.0 | 432.6 | 397.3 | 91.8 | ||||||||||||
|
Total non-operating income (expense), net
|
8.0 | 144.8 | (136.9 | ) | (94.5 | ) | ||||||||||
|
Income before income tax expense and non-controlling interest
|
837.9 | 577.5 | 260.5 | 45.1 | ||||||||||||
|
Income tax expense
|
(205.4 | ) | (175.1 | ) | 30.3 | 17.3 | ||||||||||
|
Income before non-controlling interest
|
632.5 | 402.4 | 230.2 | 57.2 | ||||||||||||
|
Non-controlling interest
|
(93.5 | ) | (98.1 | ) | (4.6 | ) | (4.7 | ) | ||||||||
|
Net income attributable to shareholders
|
539.0 | 304.3 | 234.7 | 77.1 | ||||||||||||
Corficolombiana’s net income increased by 77.1% to Ps 539.0 billion in the year ended December 31, 2013 when compared to the year ended December 31, 2012. The most significant drivers of the increase in net income were an increase of Ps 332.0 billion in total other operating income from Ps 450.9 billion for the year ended December 31, 2012 to Ps 783.0 billion for the year ended December 31, 2013, due to higher dividend income, higher income from net foreign exchange and derivative operations and higher income from non-financial sector, and a Ps 84.1 billion increase in net interest income from Ps 78.6 billion for the year ended December 31, 2012 to Ps 162.6 billion for the year ended December 31, 2013. These increases were partially offset by a Ps 136.9 billion decrease in total non-operating income, net to Ps 8.0 billion for the year ended December 31, 2013, an increase in income tax expense of Ps 30.3 billion to Ps 205.4 billion for the year ended December 31, 2013, and an increase in total operating expenses of Ps 13.5 billion to Ps 156.8 billion for the year ended December 31, 2013.
Net Interest Income
|
Year ended December 31,
|
Change, December 2013 vs. December 2012
|
|||||||||||||||
|
2013
|
2012
|
# |
%
|
|||||||||||||
|
(in Ps billions)
|
||||||||||||||||
|
Interest income:
|
||||||||||||||||
|
Interest on loans
|
25.5 | 21.0 | 4.4 | 21.1 | ||||||||||||
|
Interest on investment securities
|
333.5 | 307.6 | 25.9 | 8.4 | ||||||||||||
|
Interbank and overnight funds
|
49.9 | 57.8 | (7.9 | ) | (13.7 | ) | ||||||||||
|
Financial leases
|
61.0 | 68.1 | (7.2 | ) | (10.5 | ) | ||||||||||
|
Total interest income
|
469.8 | 454.5 | 15.3 | 3.4 | ||||||||||||
|
Interest expense:
|
||||||||||||||||
|
Time deposits
|
(152.2 | ) | (168.4 | ) | (16.2 | ) | (9.6 | ) | ||||||||
|
Savings deposits
|
(18.0 | ) | (18.3 | ) | (0.3 | ) | (1.4 | ) | ||||||||
|
Total interest expense on deposits
|
(170.2 | ) | (186.6 | ) | (16.4 | ) | (8.8 | ) | ||||||||
|
Borrowing from banks and others
|
(44.8 | ) | (56.8 | ) | (12.0 | ) | (21.0 | ) | ||||||||
|
Interbank and overnight funds (expenses)
|
(88.9 | ) | (123.4 | ) | (34.6 | ) | (28.0 | ) | ||||||||
|
Long-term debt (bonds)
|
(3.3 | ) | (9.1 | ) | (5.8 | ) | (63.9 | ) | ||||||||
|
Total interest expense
|
(307.2 | ) | (375.9 | ) | (68.8 | ) | (18.3 | ) | ||||||||
|
Net interest income
|
162.6 | 78.6 | 84.1 | 107.0 | ||||||||||||
Net interest income increased by Ps 84.1 billion, or 107.0%, to Ps 162.6 billion in the year ended December 31, 2013 compared to the year ended December 31, 2012. Total interest income, which consists of income from loans, investment securities, interbank and overnight funds and financial leases, increased by 3.4% or Ps 15.3 billion to Ps 469.8 billion in the year ended December 31, 2013. This increase was mainly driven by a Ps 25.9 billion increase in income on investment securities from Ps 307.6 billion in the year ended December 31, 2012 to Ps 333.5 billion in the year ended December 31, 2013, offset in part by a Ps 2.7 billion decrease in interest income from loans and
financial leases from Ps 89.2 billion in the year ended December 31, 2012 to Ps 86.5 billion in the year ended December 31, 2013, and a Ps 7.9 billion decrease in interest income from interbank and overnight funds to Ps 49.9 billion for the year ended December 31, 2013. Also contributing to the increase in total interest income was a decrease of Ps 68.8 billion in total interest expense. The decrease in total interest expense was mainly driven by a decrease in the average rate paid on funding from 5.1% for the year ended December 31, 2012 to 4.0% for the year ended December 31, 2013, which was consistent with the decreasing interest rate environment in Colombia where the average DTF rate decreased from 5.35% for the year ended December 31, 2012 to 4.24% for the year ended December 31, 2013.
Interest income from investment securities increased by Ps 25.9 billion to Ps 333.5 billion for the year ended December 31, 2013. Corficolombiana’s average investment portfolio increased by Ps 211.0 billion, contributing Ps 22.6 billion of the increase in interest income from investment securities. Also contributing to the increase in income from investment securities was the increase in the average yield on investment securities from 4.7% for the year ended December 31, 2012 to 5.0% for the year ended December 31, 2013, which resulted in a Ps 3.3 billion increase in interest income from investment securities.
Of the total Ps 333.5 billion interest income on investment securities recorded in the year ended December 31, 2013, Corficolombiana’s debt securities portfolio generated Ps 176.8 billion, reflecting a Ps 96.5 billion decrease from the Ps 273.3 billion recorded in the year ended December 31, 2012. The decrease in income from the debt securities portfolio was driven by an increase in fixed income securities rates experienced in Colombia during the second and third quarters of 2013, partially offset by an increase in the balance of the debt securities portfolio.
Corficolombiana’s equity securities portfolio generated Ps 156.7 billion in income in the year ended December 31, 2013, reflecting a Ps 122.4 billion increase from the Ps 34.3 billion yielded in the year ended December 31, 2012. The increase in income from the equity portfolio was primarily driven by the fact that during 2013 Corficolombiana’s investment in a private investment fund managed by Corredores Asociados (
Fondo de Capital Privado Corredores Capital 1
) generated a Ps 125.4 billion gain while in 2012 it generated a loss of Ps 1.2 billion. The gain reported in 2013 was mainly driven by an increase in the fund’s valuation of its investment in Promigas, as Promigas’ price per share in the Colombian Stock Exchange increased from Ps 25,608 as of December 31, 2012 to an equivalent price of Ps 40,014 as of December 31, 2013. The loss generated during the year ended December 31, 2012 was mainly driven by a decrease in the funds’ valuation of its investment in Promigas, as Promigas’ price per share in the Colombian Stock Exchange decreased from Ps 26,784 as of December 31, 2011 to Ps 25,608 as of December 31, 2012.
Interest income from loans and financial leases decreased by Ps 2.7 billion from Ps 89.2 billion for the year ended December 31, 2012 to Ps 86.5 billion for the year ended December 31, 2013. This decrease was driven by a 94 basis points decrease in the average yield of loans and financial leases, consistent with the decreasing rate environment in Colombia, from 12.2% for the year ended December 31, 2012 to 11.2% for the year ended December 31, 2013, which resulted in a Ps 6.6 billion decrease in interest from loans and financial leases. Partially offsetting this decrease was a Ps 37.5 billion increase in the average balance of loans and financial leases to Ps 771.1 billion for the year ended December 31, 2013, which resulted in a Ps 3.9 billion increase in interest income from loans and financial leases.
Also contributing to the Ps 15.3 billion increase in total interest income was a decrease in total interest expense of Ps 68.8 billion from Ps 375.9 billion in the year ended December 31, 2012 to Ps 307.2 billion in the year ended December 31, 2013. The decrease in total interest expense is attributable to a decrease in interest paid for interbank and overnight funds of Ps 34.6 billion, a decrease in interest paid for time deposits of Ps 16.2 billion, a decrease in interest paid for borrowing from banks and other of Ps 12.0 billion, and a decrease in interest paid for long-term debt of Ps 5.8 billion.
The decrease in total interest expense was mainly driven by a 113 basis points decrease in the average rate paid on interest-bearing liabilities, which was consistent with a 111 basis points decrease in the average DTF rate between the year ended 2012 and the year ended 2013 and resulted in a Ps 85.5 billion decrease in interest expense. Partially offsetting the decrease in the average yield was a Ps 351.6 billion increase in the average balance of interest-bearing liabilities, which resulted in a Ps 16.7 billion increase in interest expense. The increase in the average balance of interest-bearing liabilities was driven by a Ps 174.5 billion increase in the average balance of time deposits, a Ps 151.7 billion increase in the average balance of interbank and overnight funds and a Ps 116.7
billion increase in the average balance of savings deposits, offset in part by Ps 88.3 billion decrease in the average balance of long-term debt outstanding.
Provisions
Corficolombiana’s net provisions increased by Ps 3.3 billion from a Ps 2.4 billion net reversal in the year ended December 31, 2012 to a Ps 0.9 billion net expense in the year ended December 31, 2013. The increase in net provisions was mainly driven by a Ps 5.9 billion increase in net provision expense for accrued interest and other receivables, mainly driven by lower reversals of provisions in 2013 as compared to 2012. Also contributing to the increase in net provisions was a Ps 1.8 billion decrease in the recovery of charged-off assets. Partially offsetting these increases was a Ps 4.1 billion decrease in net provision expense for foreclosed assets and other assets, driven by higher recoveries of Ps 2.9 billion and lower gross provisions of Ps 1.2 billion, and a Ps 0.4 billion decrease in net provision expense for loans and financial leases.
Total Fees and Other Services Income
|
Year ended December 31,
|
Change, December 2013 vs. December 2012
|
|||||||||||||||
|
2013
|
2012
|
# |
%
|
|||||||||||||
|
(in Ps billions)
|
||||||||||||||||
|
Fees and other services income:
|
||||||||||||||||
|
Commissions from banking services
|
2.6 | 0.8 | 1.9 | 240.1 | ||||||||||||
|
Fiduciary activities
|
35.8 | 34.7 | 1.1 | 3.3 | ||||||||||||
|
Other
|
11.3 | 15.7 | (4.4 | ) | (27.9 | ) | ||||||||||
|
Total fees and other services income
|
49.8 | 51.2 | (1.4 | ) | (2.7 | ) | ||||||||||
|
Fees and other services expenses
|
(7.7 | ) | (7.1 | ) | 0.6 | 7.9 | ||||||||||
|
Total fees and other services income, net
|
42.1 | 44.1 | (2.0 | ) | (4.4 | ) | ||||||||||
Net fee and other services income showed a slight decrease from Ps 44.1 billion for the year ended December 31, 2012 to Ps 42.1 billion for the year ended December 31, 2013. The Ps 2.0 billion decrease in total fees and other services income, net is mainly attributable to a decrease in other fees and other service income of Ps 4.4 billion and a Ps 0.6 billion increase in fee and other services expense, partially offset by an increase of Ps 1.9 billion in commissions from banking services and an increase of Ps 1.1 billion in income fees from fiduciary activities.
The decrease in other fees and other service income was mainly driven by a decrease in commissions from investment banking services.
Other Operating Income
|
Year ended December 31,
|
Change, December 2013 vs. December 2012
|
|||||||||||||||
|
2013
|
2012
|
# |
%
|
|||||||||||||
|
(in Ps billions)
|
||||||||||||||||
|
Foreign exchange gains (losses), net
|
20.6 | (27.8 | ) | 48.4 | (174.1 | ) | ||||||||||
|
Gains on derivative operations, net
|
(1.0 | ) | (19.4 | ) | 18.4 | (94.6 | ) | |||||||||
|
Gains on sales of investments in equity securities, net
|
6.4 | 6.1 | 0.3 | 4.6 | ||||||||||||
|
Income from non-financial sector, net
|
443.9 | 379.4 | 64.5 | 17.0 | ||||||||||||
|
Dividend income
|
308.3 | 102.5 | 205.8 | 200.8 | ||||||||||||
|
Other
|
4.8 | 10.1 | (5.3 | ) | (52.7 | ) | ||||||||||
|
Total other operating income
|
783.0 | 450.9 | 332.0 | 73.6 | ||||||||||||
Total other operating income increased by 73.6%, or Ps 332.0 billion, from Ps 450.9 billion for the year ended December 31, 2012 to Ps 783.0 billion for the year ended December 31, 2013. The increase was mainly driven by a Ps 205.8 billion increase in dividend income, a Ps 66.7 billion increase in net foreign exchange and derivative operations and a Ps 64.5 billion increase in income from non-financial sector investments.
The Ps 205.8 billion increase in dividend income was mainly the result of a Ps 272.0 billion increase in dividend income from Promigas, since due to low liquidity levels and a negative revaluation balance, Corficolombiana was not able to record the dividend income it received from Promigas during 2012. The reason for the negative revaluation balance associated with this investment in 2012 was the decline in its share price from Ps 31,428 per share on March 31, 2011 to Ps 27,984 per share on March 31, 2012, dates on which dividends were declared. The dividend income received in 2012 by Corficolombiana from Promigas was recorded on the balance sheet. The increase in 2013 dividend income was offset by: (i) a decrease in dividend income from CFC Limited and CFC Gas Holding SAS of Ps 19.7 billion and Ps 38.8 billion, respectively. During 2013, Corficolombiana did not record any dividend income from CFC Limited nor from CFC Gas Holdings while in 2012 it did, and (ii) a decrease in dividend income from Banco de Occidente from Ps 8.6 billion for the year ended December 31, 2012 to Ps 2.2 billion for the year ended December 31, 2013. This decrease was driven by the decrease in Corficolombiana’s ownership in Banco de Occidente from 4.0% in 2012 to 0.4% in 2013.
The increase in net foreign exchange and derivative operations from a net loss of Ps 47.2 billion during the year ended 2012 to a net gain of Ps 19.5 billion was explained by non-recurring losses in foreign exchange gains associated with Corficolombiana’s previously held dollar denominated investments in AEI Promigas Holdings Ltd., AEI Promigas Ltd. and AEI Promigas Investments Ltd. in 2012. In 2013, net gains are related to the peso appreciation from Ps 1,768.23 per U.S.$1.00 in 2012 to Ps 1,926.83 per U.S.$1.00 in 2013.
Income from non-financial sector investments increased by Ps 64.5 billion due to an increase in the operating performance of the non-financial subsidiaries consolidated by Corficolombiana, mainly from its toll road companies, which include Epiandes (which increased Ps 29.7 billion), Episol (which increased Ps 27.4 billion) and Pisa (which increased Ps 8.3 billion).
Operating Expenses
|
Year ended December 31,
|
Change, December 2013 vs. December 2012
|
|||||||||||||||
|
2013
|
2012
|
# |
%
|
|||||||||||||
|
(in Ps billions)
|
||||||||||||||||
|
Salaries and employee benefits
|
(56.3 | ) | (52.1 | ) | 4.2 | 8.1 | ||||||||||
|
Bonus plan payments
|
(2.4 | ) | (3.9 | ) | (1.5 | ) | (38.4 | ) | ||||||||
|
Termination payments
|
(0.3 | ) | (0.4 | ) | (0.2 | ) | (35.4 | ) | ||||||||
|
Administrative and other expenses
|
(81.8 | ) | (73.0 | ) | 8.7 | 11.9 | ||||||||||
|
Deposit security, net
|
(9.4 | ) | (8.8 | ) | 0.6 | 6.8 | ||||||||||
|
Charitable and other donation expenses
|
(0.7 | ) | (0.6 | ) | 0.0 | 7.2 | ||||||||||
|
Depreciation
|
(6.0 | ) | (4.4 | ) | 1.6 | 37.1 | ||||||||||
|
Goodwill amortization
|
– | 0.0 | (0.0 | ) | (100.0 | ) | ||||||||||
|
Total operating expenses
|
(156.8 | ) | (143.3 | ) | 13.5 | 9.4 | ||||||||||
Corficolombiana’s total operating expenses increased by Ps 13.5 billion or 9.4% from Ps 143.3 billion for the year ended December 31, 2012 to Ps 156.8 billion for the year ended December 31, 2013. This increase was mainly driven by a Ps 8.7 billion increase in administrative and other expenses due to the organic growth of the business. Also contributing to the increase in total operating expense was a Ps 4.2 billion increase in salaries and employee benefits driven by an increase in the number of employees from 881 in December 31, 2012 to 904 in December 31, 2013. On a per employee basis, salaries and employee benefits increased by 5.3%. Corficolombiana’s efficiency ratio improved from 24.2% for the year ended December 31, 2012 to 15.3% for the year ended December 31, 2013.
Non-Operating Income
Total non-operating income decreased by Ps 136.9 billion in the year ended December 31, 2013 as in the previous year three events impacted favorably this line item: (i) a non-recurring Ps 87.2 billion income registered in 2012 by Hoteles Estelar associated with leaseback operations of Hotel La Fontana Bogotá and Hotel Intercontinental Cali to a trust company for securitization; (ii) a Ps 22.4 billion income recorded in 2012 by Pizano due to non-recurring income associated with two leaseback operations on their manufacturing plants Tablex II and Tablex III; and (iii) a Ps 22.1 billion of income recorded in 2012 by Episol due to higher income from its highway concession projects.
Income Tax Expense
Income tax expense increased by Ps 30.3 billion to Ps 205.4 billion for the year ended December 31, 2013 mainly driven by higher income before income tax expense and non-controlling interest. Corficolombiana’s effective tax rate, calculated before non-controlling interest, decreased from 30.3% for the year ended December 31, 2012 to 24.5% for the year ended December 31, 2013. The change in the effective tax rate results from Corficolombiana and certain of its subsidiaries paying taxes on a presumptive income basis which means that, despite reporting losses or low gains before taxes, the companies pay taxes based on a percentage of their equity. In 2012, some of Corficolombiana’s subsidiaries had lower operating results. In 2013, their performance improved and contributed higher income. This resulted in a decrease in the effective tax rate.
Non-Controlling Interest
Non-controlling interest decreased by Ps 4.6 billion to Ps 93.5 billion in the year ended December 31, 2013 from Ps 98.1 billion in the year ended December 31, 2012. This decrease was driven by a decrease in net income from some of Corficolombiana’s consolidated subsidiaries, mainly Pizano, Hoteles Estelar and Unipalma, which contributed decreases in non-controlling interest of Ps 13.9 billion, Ps 11.6 billion and Ps 2.8 billion, respectively. Partially offsetting these decreases was an increase in net income from certain other Corficolombiana consolidated subsidiaries, such as Epiandes, Episol and Lehner, which resulted in increases in non-controlling interest of Ps 9.8 billion, Ps 8.2 billion and Ps 5.2 billion, respectively.
Porvenir
Porvenir generates income primarily from fees on its customers’ pension contributions, which consist predominantly of monthly mandatory contributions. It also generates net interest income, composed almost entirely of investment income from the appreciation of Porvenir’s proprietary trading portfolio, which can be divided into two components: (1) income from its stabilization reserve, which is the legally required proprietary stake (1% of assets under management) in its funds that are subject to a minimum return guarantee; and (2) income from Porvenir’s investment portfolio, which includes income from fixed income securities and money market instruments. As a result, Porvenir’s revenue is mainly affected by the number of contributors, the salaries of contributors, any changes in applicable fee rates and the rate of return of its assets under management.
The following table presents Porvenir’s consolidated results excluding Horizonte’s results. “Porvenir excluding Horizonte” is the result of subtracting “Horizonte and consolidation adjustments” from “Porvenir including Horizonte and consolidation adjustments.” Grupo Aval acquired Horizonte on April 18, 2013 and Porvenir began consolidating its results from that date. Horizonte was merged with Porvenir on December 31, 2013.
Net Income
|
Porvenir excluding Horizonte
|
||||||||||||||||
|
Year ended December 31,
|
Change, December 2013 vs. December 2012
|
|||||||||||||||
|
2013
|
2012
|
# |
%
|
|||||||||||||
|
(in Ps billions)
|
||||||||||||||||
|
Total interest income
|
14.7 | 74.5 | (59.8 | ) | (80.3 | ) | ||||||||||
|
Total interest expense
|
(13.8 | ) | (2.0 | ) | 11.8 | 601.4 | ||||||||||
|
Net interest income
|
0.9 | 72.5 | (71.6 | ) | (98.8 | ) | ||||||||||
|
Total (provisions) / reversals, net
|
(1.2 | ) | (2.1 | ) | (0.9 | ) | (41.6 | ) | ||||||||
|
Total fees and other services income, net
|
441.1 | 422.4 | 18.7 | 4.4 | ||||||||||||
|
Total other operating income
|
39.5 | 26.3 | 13.2 | 50.4 | ||||||||||||
|
Total operating income
|
480.3 | 519.1 | (38.8 | ) | (7.5 | ) | ||||||||||
|
Total operating expenses
|
(236.9 | ) | (209.7 | ) | 27.2 | 13.0 | ||||||||||
|
Net operating income
|
243.4 | 309.4 | (66.0 | ) | (21.3 | ) | ||||||||||
|
Total non-operating income (expense), net
|
23.3 | 11.5 | 11.8 | 102.7 | ||||||||||||
|
Income before income tax expense and non-controlling interest
|
266.7 | 320.9 | (54.2 | ) | (16.9 | ) | ||||||||||
|
Income tax expense
|
(89.2 | ) | (106.6 | ) | (17.3 | ) | (16.3 | ) | ||||||||
|
Income before non-controlling interest
|
177.4 | 214.3 | (36.9 | ) | (17.2 | ) | ||||||||||
|
Non-controlling interest
|
(0.4 | ) | (0.3 | ) | 0.1 | 48.8 | ||||||||||
|
Net income
attributable
to shareholders
|
177.0 | 214.0 | (37.0 | ) | (17.3 | ) | ||||||||||
|
Horizonte and consolidation adjustments
|
Porvenir including Horizonte and consolidation adjustments
|
|||||||||||||||||||
|
Year ended December 31, 2013
|
Year ended
December 31,
|
Change, December 2013 vs. December 2012
|
||||||||||||||||||
|
2013
|
2012
|
# |
%
|
|||||||||||||||||
|
(in Ps billions)
|
||||||||||||||||||||
|
Total interest income
|
9.1 | 23.8 | 74.5 | (50.7 | ) | (68.1 | ) | |||||||||||||
|
Total interest expense
|
– | (13.8 | ) | (2.0 | ) | 11.8 | 601.4 | |||||||||||||
|
Net interest income
|
9.1 | 10.0 | 72.5 | (62.6 | ) | (86.3 | ) | |||||||||||||
|
Total provisions, net
|
(3.3 | ) | (4.5 | ) | (2.1 | ) | 2.5 | 118.8 | ||||||||||||
|
Total fees and other services income, net
|
170.2 | 611.4 | 422.4 | 189.0 | 44.7 | |||||||||||||||
|
Total other operating income
|
– | 39.5 | 26.3 | 13.2 | 50.4 | |||||||||||||||
|
Total operating income
|
176.0 | 656.3 | 519.1 | 137.2 | 26.4 | |||||||||||||||
|
Total operating expenses
|
(130.2 | ) | (367.1 | ) | (209.7 | ) | 157.4 | 75.0 | ||||||||||||
|
Net operating income
|
45.8 | 289.2 | 309.4 | (20.2 | ) | (6.5 | ) | |||||||||||||
|
Total non-operating income (expense), net
|
0.6 | 23.8 | 11.5 | 12.3 | 107.5 | |||||||||||||||
|
Income before income tax expense and non-controlling interest
|
46.4 | 313.0 | 320.9 | (7.9 | ) | (2.4 | ) | |||||||||||||
|
Income tax expense
|
(15.5 | ) | (104.8 | ) | (106.6 | ) | (1.8 | ) | (1.7 | ) | ||||||||||
|
Income before non-controlling interest
|
30.9 | 208.3 | 214.3 | (6.0 | ) | (2.8 | ) | |||||||||||||
|
Non-controlling interest
|
(6.2 | ) | (6.6 | ) | (0.3 | ) | 6.4 | 2,279.5 | ||||||||||||
|
Net income attributable to shareholders
|
24.6 | 201.6 | 214.0 | (12.4 | ) | (5.8 | ) | |||||||||||||
Net income for Porvenir’s operations excluding Horizonte decreased by Ps 37.0 billion for the year ended December 31, 2013 to Ps 177.0 billion as compared to Ps 214.0 billion for the year ended December 31, 2012. Despite (i) an increase of Ps 18.7 billion in total fees and other services income, net, including an increase in pension plan administration fees, (ii) a decrease of Ps 17.3 billion in income tax expense, (iii) an increase of Ps 13.2 billion in total other operating income, and (iii) a Ps 11.8 billion increase in total non-operating income (expense), net, net income attributable to shareholders decreased due to a Ps 71.6 billion decrease in net interest income and a Ps 27.2 billion increase in total operating expenses.
Horizonte, net of consolidation adjustments, accounted for an additional Ps 24.6 billion in net income attributable to shareholders for the year ended December 31, 2013.
Net income attributable to shareholders of Porvenir, including Horizonte, decreased by Ps 12.4 billion for the year ended December 31, 2013 to Ps 201.6 billion versus the Ps 214.0 billion for the year ended December 31, 2012.
Net Interest Income
Net interest income for Porvenir’s operations, excluding Horizonte, decreased by Ps 71.6 billion to Ps 0.9 billion in the year ended December 31, 2013 as compared to the Ps 72.5 billion for the year ended December 31, 2012. This decrease, in line with market trends, was primarily due to a decrease in the rate of return of Porvenir’s mandatory investment in its stability reserve as prevailing market conditions during 2013 were depressed due to local and global equity and fixed income market conditions. Porvenir’s rate of return on its investment portfolio, excluding Horizonte, decreased from 9.5% in the year ended December 31, 2012 to 2.2% in the year ended December 31, 2013. Also contributing to the decrease in interest income was a Ps 11.8 billion increase in interest
expense associated with the Ps 354.5 billion (U.S.$184 million) loan entered into by Porvenir with Grupo Aval Limited to fund part of Horizonte’s acquisition.
Horizonte, net of consolidation adjustments, accounted for an additional Ps 9.1 billion in net interest income.
Net interest income for Porvenir including Horizonte decreased by Ps 62.6 billion for the year ended December 31, 2013 to Ps 10.0 billion versus the Ps 72.5 billion for the year ended December 31, 2012.
Total Fees and Other Services Income
Total net fees and other services income consists primarily of commissions earned on the administration of mandatory pension funds, severance funds, voluntary pension funds and third-party liability pension funds. Porvenir’s total net fees and other services income, excluding Horizonte, increased by Ps 18.7 billion, or 4.4%, to Ps 441.1 billion in the year ended December 31, 2013 as compared to the Ps 422.4 for the year ended December 31, 2012.
Pension plan administration fees, for Porvenir’s operations excluding Horizonte, increased by Ps 26.5 billion to Ps 500.9 billion for the year ended December 31, 2013. This increase was primarily driven by a Ps 45.8 billion, or 15.2%, increase in fee income from the administration of mandatory pension funds due to a 14.5% increase in the number of affiliate customers from 3.6 million for the year ended December 31, 2012 to 4.1 million for the year ended December 31, 2013.
Fee income from severance fund management for Porvenir’s operations excluding Horizonte increased by Ps 6.1 billion from Ps 65.9 billion in the year ended December 31, 2012 to Ps 72.1 billion in the year ended December 31, 2013. This increase was mainly due to an increase in the balance of assets under management in the severance fund, which increased by 4.6% in the year ended December 31, 2013 as compared to the year ended December 31, 2012.
Also contributing to the increase in fee income for Porvenir’s operation excluding Horizonte was a Ps 5.5 billion increase in revenue associated with the management of voluntary pension funds from Ps 48.1 billion in the year ended December 31, 2012 to Ps 53.7 billion in the year ended December 31, 2013.
The above-mentioned increases were partially offset by a Ps 24.9 billion decrease in revenues received from the administration of third-party liability pension funds for Porvenir’s operations (excluding Horizonte) from Ps 38.6 billion in the year ended December 31, 2012 to Ps 13.7 billion in the year ended December 31, 2013. This decrease was mainly due to lower income from joint venture asset servicing driven by a decrease in the commissions charged by FONPET. The above-mentioned increases were also partially offset by a Ps 5.9 billion decrease in other fees associated with pension fund administration, such as non-contributor affiliate fees and transfer fees for Porvenir’s operation (excluding Horizonte), from Ps 21.0 billion for the year ended December 31, 2012 to Ps 15.1 billion for the year ended December 31, 2013. Non-contributor affiliate fees are charged on interest income generated by the managed funds. Because returns on funds were lower in 2013 than in 2012, the fees charged were lower in 2013 than in 2012.
Fees and other service expenses for Porvenir’s operation excluding Horizonte increased by Ps 6.0 billion, from Ps 54.4 billion for the year ended December 31, 2012 to Ps 60.4 billion for the year ended December 31, 2013 mainly due to fees associated with Horizonte’s acquisition.
Horizonte, net of consolidation adjustments, accounted for an additional Ps 170.2 billion in total fees and other services income, net (Ps 204.5 billion in pension plan administration fees and Ps 34.3 billion in fees and other services expense).
Total fees and other services income, net for Porvenir, including Horizonte, increased by Ps 189.0 billion for the year ended December 31, 2013 to Ps 611.4 billion as compared to the Ps 422.4 billion for the year ended December 31, 2012.
Operating Expenses
|
Porvenir excluding Horizonte
|
||||||||||||||||
|
Year ended December 31,
|
Change, December 2013 vs. December 2012
|
|||||||||||||||
|
2013
|
2012
|
# |
%
|
|||||||||||||
|
(in Ps billions)
|
||||||||||||||||
|
Salaries and employee benefits
|
(80.1 | ) | (84.1 | ) | (4.0 | ) | (4.7 | ) | ||||||||
|
Bonus plan payments
|
(4.0 | ) | (1.7 | ) | 2.3 | 139.1 | ||||||||||
|
Termination payments
|
(0.1 | ) | (0.0 | ) | 0.0 | 140.9 | ||||||||||
|
Administrative and other expenses
|
(139.1 | ) | (115.9 | ) | 23.2 | 20.0 | ||||||||||
|
Deposit security, net
|
(0.1 | ) | – | 0.1 | – | |||||||||||
|
Charitable and other donation expenses
|
(0.4 | ) | (0.6 | ) | (0.1 | ) | (23.5 | ) | ||||||||
|
Depreciation
|
(7.0 | ) | (7.5 | ) | (0.5 | ) | (6.5 | ) | ||||||||
|
Goodwill amortization
|
(6.1 | ) | – | 6.1 | – | |||||||||||
|
Total operating expenses
|
(236.9 | ) | (209.7 | ) | 27.2 | 13.0 | ||||||||||
|
Horizonte and consolidation adjustments
|
Porvenir including Horizonte and
consolidation adjustments
|
|||||||||||||||||||
|
Year ended December 31, 2013
|
Year ended December 31,
|
Change, December 2013 vs. December 2012
|
||||||||||||||||||
|
2013
|
2012
|
# |
%
|
|||||||||||||||||
|
(in Ps billions)
|
||||||||||||||||||||
|
Salaries and employee benefits
|
(45.6 | ) | (125.7 | ) | (84.1 | ) | 41.7 | 49.5 | ||||||||||||
|
Bonus plan payments
|
(12.2 | ) | (16.2 | ) | (1.7 | ) | 14.5 | 860.9 | ||||||||||||
|
Termination payments
|
(0.3 | ) | (0.4 | ) | (0.0 | ) | 0.3 | 1,115.7 | ||||||||||||
|
Administrative and other expenses
|
(68.7 | ) | (207.7 | ) | (115.9 | ) | 91.9 | 79.3 | ||||||||||||
|
Deposit security, net
|
– | – | – | 0.1 | – | |||||||||||||||
|
Charitable and other donation expenses
|
(0.9 | ) | (1.3 | ) | (0.6 | ) | 0.8 | 134.1 | ||||||||||||
|
Depreciation
|
(2.5 | ) | (9.5 | ) | (7.5 | ) | 2.0 | 27.3 | ||||||||||||
|
Goodwill amortization
|
– | (6.1 | ) | – | 6.1 | – | ||||||||||||||
|
Total operating expenses
|
(130.2 | ) | (367.1 | ) | (209.7 | ) | 157.4 | 75.0 | ||||||||||||
Porvenir’s total operating expenses, excluding Horizonte, increased in the year ended December 31, 2013 by 13.0%, or Ps 27.2 billion, to Ps 236.9 billion primarily due to a Ps 23.2 billion increase in administrative and other expenses of which Ps 19.7 billion are attributable to expenses associated with the Horizonte acquisition and Ps 7.9 billion corresponds to higher expenses at Gestión & Contacto S.A., or Gestión & Contacto, a subsidiary consolidated into Porvenir’s results. Also contributing to the increase in total operating expenses was a Ps 6.1 billion increase in goodwill amortization and a Ps 2.3 billion increase in bonus plan payments—both associated with the Horizonte’s acquisition. Partially offsetting these increases was a Ps 4.0 billion decrease in salaries and employee benefits. Porvenir’s efficiency ratio, excluding Horizonte, for the year ended December 31, 2013 deteriorated in comparison to the same period in 2012, from 38.8% to 46.5%.
Horizonte, net of consolidation adjustments, accounted for an additional Ps 130.2 billion in total operating expenses.
Total operating expenses for Porvenir including Horizonte increased by Ps 157.4 billion for the year ended December 31, 2013 to Ps 367.1 billion as compared to Ps 209.7 billion for the year ended December 31, 2012.
Other Operating Income
Total other operating income for Porvenir’s operations, excluding Horizonte, increased by Ps 13.2 billion for the year ended December 31, 2013 to Ps 39.5 billion from Ps 26.3 billion in the year ended December 31, 2012. This increase was primarily due to higher income from Gestión & Contacto a subsidiary consolidated by Porvenir. Horizonte, net of consolidation adjustments, had no impact in this line item.
Non-Operating Income (Expense, Net)
Total non-operating income (expense), net includes provisions, gains on sale of property, administrative authority fines, and labor demand penalties. Total non-operating income (expense), net for Porvenir, excluding Horizonte, increased by Ps 11.8 billion in the year ended December 31, 2013 from Ps 11.5 billion in the year ended December 31, 2012 to Ps 23.3 billion. This increase was mainly driven by higher reversal of provisions during 2013 as compared to 2012.
Horizonte, net of consolidation adjustments, accounted for an additional Ps 0.6 billion in non-operating income (expense), net.
Total non-operating income (expense), net for Porvenir, including Horizonte, increased by Ps 12.3 billion for the year ended December 31, 2013 to Ps 23.8 billion versus the Ps 11.5 billion for the year ended December 31, 2012.
Income Tax Expense
Income tax expense for Porvenir, excluding Horizonte, decreased by 16.3% to Ps 89.2 billion for the year ended December 31, 2013. This decrease was driven primarily by a 16.9% decrease in income before income tax expense and non-controlling interest. Porvenir’s effective tax rate, calculated before non-controlling interest, slightly increased from 33.2% for the year ended December 31, 2012 to 33.5% for the year ended December 31, 2013.
Horizonte, net of consolidation adjustments, accounted for an additional Ps 15.5 billion in income tax expense.
Income tax expense for Porvenir including Horizonte decreased by Ps 1.8 billion for the year ended December 31, 2013 to Ps 104.8 billion as compared to the Ps 106.6 billion for the year ended December 31, 2012. The effective tax rate for Porvenir including Horizonte slightly increases from 33.2% for the year ended December 31, 2012 to 33.5% for the year ended December 31, 2013.
Non-Controlling Interest
Non-controlling interest increased by Ps 6.4 billion for the year ended December 31, 2013 as compared to the year ended December 31, 2012. This increase reflects the portion of net income owned by third parties prior to Porvenir merging its operations with Horizonte.
LB Panamá
|
Year ended December 31,
|
Change, December 2013 vs. December 2012
|
|||||||||||||||
|
2013
|
2012
|
# |
%
|
|||||||||||||
|
(in Ps billions)
|
||||||||||||||||
|
Total interest income
|
1,983.7 | 1,571.2 | 412.5 | 26.3 | ||||||||||||
|
Total interest expense
|
(606.3 | ) | (423.9 | ) | 182.4 | 43.0 | ||||||||||
|
Net interest income
|
1,377.4 | 1,147.3 | 230.1 | 20.1 | ||||||||||||
|
Total (provisions) / reversals, net
|
(244.2 | ) | (146.9 | ) | 97.4 | 66.3 | ||||||||||
|
Total fees and other services income, net
|
750.6 | 673.7 | 76.9 | 11.4 | ||||||||||||
|
Total other operating income
|
113.8 | 110.5 | 3.3 | 3.0 | ||||||||||||
|
Total operating income
|
1,997.6 | 1,784.6 | 213.0 | 11.9 | ||||||||||||
|
Total operating expenses
|
(1,360.4 | ) | (1,208.5 | ) | 151.8 | 12.6 | ||||||||||
|
Net operating income
|
637.2 | 576.0 | 61.2 | 10.6 | ||||||||||||
|
Total non-operating income (expense), net
|
7.9 | 20.5 | (12.6 | ) | (61.4 | ) | ||||||||||
|
Income before income tax expense and non-controlling interest
|
645.1 | 596.5 | 48.6 | 8.2 | ||||||||||||
|
Income tax expense
|
(164.2 | ) | (169.4 | ) | (5.2 | ) | (3.1 | ) | ||||||||
|
Income before non-controlling interest
|
480.9 | 427.1 | 53.8 | 12.6 | ||||||||||||
|
Non-controlling interest
|
(0.1 | ) | (0.1 | ) | (0.0 | ) | (15.9 | ) | ||||||||
|
Net income attributable to shareholders
|
480.8 | 427.0 | 53.8 | 12.6 | ||||||||||||
LB Panamá’s financial information is prepared in accordance with Colombian Banking GAAP and primarily reflects (i) BAC Credomatic’s consolidated results since December 2010 (and Grupo Financiero Reformador since December 2013), and (ii) the acquisition of BBVA Panamá (now merged into BAC International Bank, Inc) in December 2013. As of December 31, 2013, LB Panamá’s balance sheet carried goodwill of Ps 2,500.5 billion (U.S.$1,298 million) resulting from the direct acquisitions the company made of BAC Credomatic and Banco BAC de Panamá. LB Panamá’s balance sheet also includes Ps 2,056.7 billion (U.S.$1,067 million) of indebtedness, including Ps 520.2 billion (U.S.$270 million) incurred to fund a portion of our acquisition of BAC Credomatic and Ps 1,536.5 billion (U.S.$797 million) of additional indebtedness, of which Ps 496.0 billion (U.S.$257 million) is owed to Grupo Aval Limited and Ps 1,040.5 billion (U.S.$540 million) to Deutsche Bank, compared to total indebtedness of LB Panamá of Ps 2,245.7 billion (U.S.$1,270 million) as of December 31, 2012. As of December 31, 2013, LB Panamá had a fixed income portfolio of Ps 1,387.8 billion (U.S.$720 million) comprised mainly of investment grade bonds issued by Latin American sovereign and corporate issuers, acquired pursuant to Banco de Bogotá’s investment guidelines.
The Central American acquisitions closed in December 2013 and only impacted LB Panamá’s balance sheet and had no effect on the income statement as each of their results of operations for the month of December 2013 were recorded as retained earnings in LB Panamá’s balance sheet.
LB Panamá’s net income attributable to its shareholders for the year ended December 31, 2013 increased by 12.6%, or Ps 53.8 billion, to Ps 480.8 billion primarily due to an increase in net interest income, an increase in total fees and income from services, net, a decrease in income tax expense, and an increase in total other operating income. Partially offsetting these positive trends was an increase in total operating expenses, an increase in total net provisions and a decrease in total non-operating income.
Net Interest Income
|
Year ended December 31,
|
Change, December 2013 vs. December 2012
|
|||||||||||||||
|
2013
|
2012
|
# |
%
|
|||||||||||||
|
(in Ps billions)
|
||||||||||||||||
|
Interest income:
|
||||||||||||||||
|
Interest on loans
|
1,764.3 | 1,455.4 | 308.9 | 21.2 | ||||||||||||
|
Interest on investment securities
|
161.4 | 66.0 | 95.4 | 144.6 | ||||||||||||
|
Interbank and overnight funds
|
30.5 | 28.3 | 2.2 | 7.7 | ||||||||||||
|
Financial leases
|
27.6 | 21.5 | 6.1 | 28.4 | ||||||||||||
|
Total interest income
|
1,983.7 | 1,571.2 | 412.5 | 26.3 | ||||||||||||
|
Interest expense:
|
||||||||||||||||
|
Checking accounts
|
(35.4 | ) | (30.2 | ) | 5.2 | 17.1 | ||||||||||
|
Time deposits
|
(297.7 | ) | (214.5 | ) | 83.2 | 38.8 | ||||||||||
|
Savings deposits
|
(39.7 | ) | (31.3 | ) | 8.4 | 26.9 | ||||||||||
|
Total interest expense from deposits
|
(372.8 | ) | (276.0 | ) | 96.8 | 35.1 | ||||||||||
|
Borrowing from banks and others
|
(197.9 | ) | (121.5 | ) | 76.3 | 62.8 | ||||||||||
|
Interbank and overnight funds (expenses)
|
(3.8 | ) | (5.9 | ) | (2.1 | ) | (34.9 | ) | ||||||||
|
Long-term debt (bonds)
|
(31.9 | ) | (20.5 | ) | 11.4 | 55.4 | ||||||||||
|
Total interest expense
|
(606.3 | ) | (423.9 | ) | 182.4 | 43.0 | ||||||||||
|
Net interest income
|
1,377.4 | 1,147.3 | 230.1 | 20.1 | ||||||||||||
LB Panamá’s net interest income increased by 20.1%, or Ps 230.1 billion, from Ps 1,147.3 billion in the year ended December 31, 2012 to Ps 1,377.4 billion in the year ended December 31, 2013. This increase was primarily driven by a Ps 412.5 billion increase in total interest income, of which Ps 315.0 billion was attributable to an increase in interest income from loans and financial leases and Ps 95.4 billion was attributable to an increase in interest income from investment securities. The increase in total interest income was partially offset by a Ps 182.4 billion increase in total interest expense.
Interest income from loans and financial leases increased by 21.3%, or Ps 315.0 billion, to Ps 1,791.9 billion for the year ended December 31, 2013. LB Panamá’s average loans and financial leases portfolio grew by 25.0%, or Ps 2,871.9 billion, to Ps 14,337.7 billion for the year ended December 31, 2013, resulting in a Ps 358.9 billion
increase in interest income from loans and financial leases. Partially offsetting this increase in interest income was the decrease in average yield on loans and financial leases from 12.9% for the year ended December 31, 2012 to 12.5% for the year ended December 31, 2013, which resulted in a Ps 44.0 billion decrease in interest income from loans and financial leases. The change in the average yield was the result of a change in the mix in the loan and financial leases portfolio (excluding recent acquisitions) as commercial loans (including financial leases) as a proportion of total gross loans increased from 36.3% as of December 31, 2012 to 37.3% as of December 31, 2013. Consumer and mortgage loans as an aggregate proportion of total gross loans, and which in comparison to commercial loans have a higher yield, decreased from 63.7% as of December 31, 2012 to 62.7% as of December 31, 2013.
Interest income from investment securities increased by Ps 95.4 billion to Ps 161.4 billion for the year ended December 31, 2013. This increase was the result of the combined effect of an increase in the average volume of the investment portfolio of Ps 1,518.0 billion from Ps 1,802.1 billion for the year ended December 31, 2012, to Ps 3,320.1 billion for the year ended December 31, 2013, resulting in a Ps 73.8 billion increase in interest income and an increase in the average yield of the investment portfolio from 3.7% in 2012 to 4.9% in 2013, which resulted in a Ps 21.6 billion increase in interest income from investment securities. The increase in the average volume of the investment portfolio is due to the fact that the investment grade fixed income portfolio was created in the fourth quarter of 2012 and therefore had a limited effect on the average balance and interest income earned for the year ended December 31, 2012, whereas it impacted the average balance and interest income earned for the full year ended December 31, 2013. The fixed income portfolio generated Ps 162.1 billion of interest income from investment securities. This result was Ps 101.1 billion higher than the Ps 61.0 billion of interest income generated by fixed income securities for the year ended December 31, 2012. LB Panamá’s equity portfolio generated a loss of Ps 0.7 billion for the year ended December 31, 2013 versus a Ps 5.0 billion gain for the year ended December 31, 2012.
Interest income from interbank and overnight funds increased by Ps 2.2 billion from Ps 28.3 billion for the year ended December 31, 2012 to Ps 30.5 billion for the year ended December 31, 2013. The increase in interest income from interbank and overnight funds was mainly driven by an increase in the average rate earned on interbank and overnight funds from 3.5% for the year ended December 31, 2012 to 4.0% for the year ended December 31, 2013.
Nonetheless, primarily as a result of the decrease in the average yield on the loan and financial leases portfolio, the average yield earned on interest-earning assets decreased from 11.2% for the year ended December 31, 2012 to 10.8% for the year ended December 31, 2013.
Total interest expense increased by Ps 182.4 billion to Ps 606.3 billion for the year ended December 31, 2013 as compared to the year ended December 31, 2012. This increase was mainly driven by a Ps 83.2 billion increase in interest expense on time deposits, a Ps 76.3 billion increase in interest expense on borrowings from banks and others, a Ps 11.4 billion increase in interest expense on long-term debt, and a Ps 8.4 billion increase in interest expense on savings deposits.
The Ps 83.2 billion increase in interest expense on time deposits was driven by an increase in the average balance of time deposits from Ps 4,628.7 billion for the year ended December 31, 2012 to Ps 5,845.6 billion for the year ended December 31, 2013, which resulted in an increase of Ps 62.0 billion in interest expense, and by an increase in the average interest rate paid which rose from 4.6% for the year ended December 31, 2012 to 5.1% for the year ended December 31, 2013 resulting in a Ps 21.2 billion increase in interest expense.
The increase in interest expense on borrowings from banks and others of Ps 76.3 billion was driven by an increase in the average balance from Ps 3,201.0 billion to Ps 5,351.9 billion, which resulted in a Ps 79.5 billion increase in interest expense. Partially offsetting this increase was a decrease in the average interest rate paid from 3.8% for the year ended December 31, 2012 to 3.7% for the year ended December 31, 2013, the decrease in the cost of these funds resulted in a Ps 3.2 billion decrease in interest expense.
The Ps 11.4 billion increase in interest expense on long-term debt was driven by an increase in the average balance of long-term debt from Ps 316.6 billion for the year ended December 31, 2012 to Ps 466.7 billion for the year ended December 31, 2013, which contributed an increase of Ps 10.2 billion in interest expense, and by an increase in the average interest rate paid which rose from 6.5% for the year ended December 31, 2012 to 6.8% for the year ended December 31, 2013 resulting in a Ps 1.1 billion increase in interest expense.
The increase in interest expense on savings deposits of Ps 8.4 billion was driven by an increase in the average balance of savings deposits from Ps 2,463.4 billion to Ps 2,983.8 billion, which contributed a Ps 6.9 billion increase in interest expense, and by an increase in the average interest rate paid which rose from 1.27% for the year ended December 31, 2012 to 1.33% for the year ended December 31, 2013 resulting in a Ps 1.5 billion increase in interest expense.
The average rate paid on LB Panamá’s total interest-bearing liabilities increased from 2.8% for the year ended December 31, 2012 to 3.1% for the year ended December 31, 2013.
Average total interest-earning assets in LB Panamá increased by 31.0% or Ps 4,358.6 billion for the year ended December 31, 2013 compared to the year ended December 31, 2012, while net interest income increased by 20.1%. This resulted in a contraction of the net interest margin from 8.2% for the year ended December 31, 2012 to 7.5% for the year ended December 31, 2013. In line with the results, the interest spread between the average rate on loans and financial leases and the average rate paid on deposits decreased from 10.5% to 9.8%. The decrease in spread is mainly due to the change in the mix of the loan and financial leases portfolio described above.
Provisions
Total net provision expense of LB Panamá increased by Ps 97.4 billion to Ps 244.2 billion for the year ended December 31, 2013, driven primarily by a Ps 93.0 billion increase in net provisions for loans and financial leases to Ps 239.6 billion as of December 31, 2013.
The increase in the net provision expense for loan and financial lease losses was explained by an increase in gross provisions of Ps 84.5 billion to Ps 255.3 billion for the year ended December 31, 2013, resulting from an increase in the average balance of the loan and financial leases portfolio and to an increase in LB Panamá’s past due consumer loans.
LB Panamá’s past due loans and financial leases increased by 79.6% between December 31, 2012 and December 31, 2013, while total gross loans increased by 64.2%. Excluding recent acquisitions, LB Panamá’s past due loans and financial leases increased by 15.9% between December 31, 2012 and December 31, 2013, while total gross loans increased by 26.1%. LB Panamá’s delinquency ratio increased from 2.4% as of December 31, 2012 to 2.6% as of December 31, 2013, primarily as a result of the effects of the acquisitions of Grupo Reformador and BBVA Panamá in December 2013. If the Central American acquisitions were excluded, LB Panamá’s delinquency ratio improved to 2.2% as of December 31, 2013.
Charge-offs increased from Ps 126.7 billion for the year ended December 31, 2012 to Ps 175.1 billion for the year ended December 31, 2013. LB Panamá’s ratio of charge-offs to average loans and financial leases increased from 1.1% for the year ended December 31, 2012 to 1.2% for the year ended December 31, 2013. LB Panamá’s allowance for loan and financial lease losses increased by Ps 207.3 billion from Ps 212.7 billion as of December 31, 2012 to Ps 420.1 billion as of December 31, 2013, Ps 120.1 billion of this increase corresponds to the allowance for loans and financial lease losses attributable to Grupo Reformador and BBVA Panamá. LB Panamá’s coverage ratio over its past due loans increased from 70.7% as of December 31, 2012 to 77.8% as of December 31, 2013.
Net provisions for foreclosed assets and other assets increased by Ps 5.1 billion to a net expense of Ps 5.6 billion as of December 31, 2013 from a net expense of Ps 0.5 billion as of December 31, 2012. This increase was mainly driven by lower reversals of provisions.
Net provisions for accrued interest and other receivables decreased by Ps 1.4 billion to a net expense of Ps 0.4 billion as of December 31, 2013 from a net expense of Ps 1.8 billion as of December 31, 2012.
The recovery of charged-off assets decreased between the years ended December 31, 2012 and the year ended December 31, 2013 by Ps 0.6 billion to Ps 1.4 billion.
Total Fees and Other Services Income
|
Year ended December 31,
|
Change, December 2013 vs. December 2012
|
|||||||||||||||
|
2013
|
2012
|
# |
%
|
|||||||||||||
|
(in Ps billions)
|
||||||||||||||||
|
Fees and other services income:
|
||||||||||||||||
|
Commissions from banking services
|
528.4 | 470.5 | 57.9 | 12.3 | ||||||||||||
|
Branch network services
|
– | – | – | – | ||||||||||||
|
Credit card merchant fees
|
219.6 | 194.7 | 24.9 | 12.8 | ||||||||||||
|
Checking fees
|
– | – | – | – | ||||||||||||
|
Warehouse services
|
– | – | – | – | ||||||||||||
|
Fiduciary activities
|
– | – | – | – | ||||||||||||
|
Pension plan administration
|
16.1 | 11.5 | 4.5 | 39.3 | ||||||||||||
|
Other
|
66.2 | 57.2 | 8.9 | 15.6 | ||||||||||||
|
Total fees and other services income
|
830.2 | 734.0 | 96.2 | 13.1 | ||||||||||||
|
Fees and other services expenses
|
(79.6 | ) | (60.3 | ) | 19.3 | 32.0 | ||||||||||
|
Total fees and other services income, net
|
750.6 | 673.7 | 76.9 | 11.4 | ||||||||||||
Total net fees and other services income increased by 11.4%, or Ps 76.9 billion, to Ps 750.6 billion in the year ended December 31, 2013. Total fees and other services income increased by Ps 96.2 billion mainly as a result of higher commissions from banking services of Ps 57.9 billion, higher credit card merchant fees of Ps 24.9 billion, higher other fees of Ps 8.9 billion, and higher pension plan administration fees of Ps 4.5 billion. These were partially offset by a Ps 19.3 billion increase in fees and other service expenses. The increase in commissions from banking services and in credit card merchant fees was consistent with the growth in LB Panamá’s business prior to the Central American acquisitions.
Other Operating Income
|
Year ended
December 31,
|
Change,
December 2013
vs. December 2012
|
|||||||||||||||
|
2013
|
2012
|
# |
%
|
|||||||||||||
|
(in Ps billions)
|
||||||||||||||||
|
Foreign exchange gains (losses), net
|
110.1 | 113.6 | (3.4 | ) | (3.0 | ) | ||||||||||
|
Gains on derivative operations, net
|
3.5 | (3.3 | ) | 6.8 | 207.1 | |||||||||||
|
Gains on sales of investments in equity securities, net
|
– | – | – | – | ||||||||||||
|
Income from non-financial sector, net
|
– | – | – | – | ||||||||||||
|
Dividend income
|
– | – | – | – | ||||||||||||
|
Other
|
0.2 | 0.2 | (0.0 | ) | (10.0 | ) | ||||||||||
|
Other operating income
|
113.8 | 110.5 | 3.3 | 3.0 | ||||||||||||
Total other operating income increased by Ps 3.3 billion to Ps 113.8 billion in the year ended December 31, 2013 due primarily to a Ps 3.4 billion increase in foreign exchange gains. In the ordinary course of business, LB Panamá enters into forward contracts and other derivatives transactions in foreign currency almost entirely for hedging purposes and on behalf of its clients.
Operating Expenses
|
Year ended
December 31,
|
Change,
December 2013
vs. December 2012
|
|||||||||||||||
|
2013
|
2012
|
# |
%
|
|||||||||||||
|
(in Ps billions)
|
||||||||||||||||
|
Salaries and employee benefits
|
(576.3 | ) | (484.4 | ) | 91.9 | 19.0 | ||||||||||
|
Bonus plan payments
|
(66.6 | ) | (54.5 | ) | 12.1 | 22.2 | ||||||||||
|
Termination payments
|
(13.5 | ) | (16.3 | ) | (2.8 | ) | (17.3 | ) | ||||||||
|
Administrative and other expenses
|
(577.5 | ) | (536.0 | ) | 41.6 | 7.8 | ||||||||||
|
Deposit security, net
|
(10.6 | ) | (8.9 | ) | 1.7 | 18.6 | ||||||||||
|
Charitable and other donation expenses
|
(1.9 | ) | (2.1 | ) | (0.2 | ) | (9.3 | ) | ||||||||
|
Depreciation
|
(57.4 | ) | (54.1 | ) | 3.3 | 6.1 | ||||||||||
|
Goodwill amortization
|
(56.6 | ) | (52.3 | ) | 4.3 | 8.2 | ||||||||||
|
Total operating expenses
|
(1,360.4 | ) | (1,208.5 | ) | 151.8 | 12.6 | ||||||||||
Total operating expenses increased by 12.6%, or Ps 151.8 billion, to Ps 1,360.4 billion for the year ended December 31, 2013. The increase is mainly due to a Ps 91.9 billion increase to Ps 576.3 billion in salaries and employee benefits mainly as a result of an increase from 16,669 in the number of employees during 2012 to 18,463 (excluding Grupo Reformador and Banco BAC de Panamá) during 2013. Also contributing to the increase in operating expenses was a Ps 41.6 billion increase to Ps 577.5 billion in administrative and other expenses principally driven by the organic growth of the business and managing LB Panamá’s resulting larger loan portfolio, a Ps 12.1 billion increase in bonus plan payments, a Ps 4.3 billion increase in goodwill amortizations and a Ps 3.3 billion increase in depreciation expense. LB Panamá’s efficiency ratio for the year ended December 31, 2013 was 55.6%, improving from the 57.1% ratio for the year ended December 31, 2012.
Non-Operating Income (Expense)
Total net non-operating income (expense) decreased by Ps 12.6 billion to a net income of Ps 7.9 billion for the year ended December 31, 2013. This decrease was mainly driven by the recording in 2012 of a reversal of a provision for deferred taxes resulting from the reconciliation of U.S. GAAP to Colombian Banking GAAP accounting standards.
Income Tax Expense
Income tax expense for LB Panamá decreased by 3.1%, or Ps 5.2 billion, to Ps 164.2 billion for the year ended December 31, 2013. LB Panamá’s effective tax rate, calculated before non-controlling interest, decreased from 28.4% for the year ended December 31, 2012 to 25.5% for the year ended December 31, 2013. The decrease in the effective tax rate was mainly explained by the receipt of higher dividends from off-shore entities, which have a lower tax rate than other LB Panamá subsidiaries, in 2013 than in 2012.
Non-Controlling Interest
LB Panamá’s non-controlling interest is not material. It totaled Ps 0.07 billion for the year ended December 31, 2013.
Banco de Occidente
Net Income
|
Year ended
December 31,
|
Change,
December 2013
vs. December 2012
|
|||||||||||||||
|
2013
|
2012
|
# |
%
|
|||||||||||||
|
(in Ps billions)
|
||||||||||||||||
|
Total interest income
|
2,050.6 | 2,028.6 | 22.0 | 1.1 | ||||||||||||
|
Total interest expense
|
(722.5 | ) | (745.5 | ) | (23.0 | ) | (3.1 | ) | ||||||||
|
Net interest income
|
1,328.1 | 1,283.2 | 45.0 | 3.5 | ||||||||||||
|
Total (provisions) / reversals, net
|
(320.9 | ) | (223.6 | ) | 97.3 | 43.5 | ||||||||||
|
Total fees and other services income, net
|
254.7 | 229.0 | 25.7 | 11.2 | ||||||||||||
|
Total other operating income
|
320.8 | 332.7 | (12.0 | ) | (3.6 | ) | ||||||||||
|
Total operating income
|
1,582.7 | 1,621.3 | (38.6 | ) | (2.4 | ) | ||||||||||
|
Total operating expenses
|
(1,010.1 | ) | (937.2 | ) | 72.9 | 7.8 | ||||||||||
|
Net operating income
|
572.6 | 684.0 | (111.4 | ) | (16.3 | ) | ||||||||||
|
Total non-operating income (expense), net
|
12.3 | 12.9 | (0.7 | ) | (5.3 | ) | ||||||||||
|
Income before income tax expense and non-controlling interest
|
584.8 | 697.0 | (112.1 | ) | (16.1 | ) | ||||||||||
|
Income tax expense
|
(155.5 | ) | (174.7 | ) | (19.2 | ) | (11.0 | ) | ||||||||
|
Income before non-controlling interest
|
429.4 | 522.3 | (92.9 | ) | (17.8 | ) | ||||||||||
|
Non-controlling interest
|
(1.2 | ) | (2.0 | ) | (0.7 | ) | (37.4 | ) | ||||||||
|
Net income attributable to shareholders
|
428.2 | 520.3 | (92.1 | ) | (17.7 | ) | ||||||||||
Banco de Occidente’s net income attributable to its shareholders decreased by 17.7%, or Ps 92.1 billion, to Ps 428.2 billion for the year ended December 31, 2013. Despite an increase of Ps 45.0 billion or 3.5% in net interest income and an increase of Ps 25.7 billion or 11.2% in total fees and other services income, net, net income attributable to shareholders decreased due to an increase in total net provisions and an increase in total operating expenses.
Net Interest Income
|
Year ended
December 31,
|
Change,
December 2013
vs. December 2012
|
|||||||||||||||
|
2013
|
2012
|
# |
%
|
|||||||||||||
|
(in Ps billions)
|
||||||||||||||||
|
Interest income:
|
||||||||||||||||
|
Interest on loans
|
1,458.3 | 1,395.6 | 62.7 | 4.5 | ||||||||||||
|
Interest on investment securities
|
125.1 | 174.1 | (49.0 | ) | (28.1 | ) | ||||||||||
|
Interbank and overnight funds
|
41.5 | 45.7 | (4.3 | ) | (9.3 | ) | ||||||||||
|
Financial leases
|
425.7 | 413.1 | 12.6 | 3.0 | ||||||||||||
|
Total interest income
|
2,050.6 | 2,028.6 | 22.0 | 1.1 | ||||||||||||
|
Interest expense:
|
||||||||||||||||
|
Checking accounts
|
(10.8 | ) | (9.7 | ) | 1.1 | 10.9 | ||||||||||
|
Time deposits
|
(237.1 | ) | (206.9 | ) | 30.3 | 14.6 | ||||||||||
|
Savings deposits
|
(241.1 | ) | (268.2 | ) | (27.1 | ) | (10.1 | ) | ||||||||
|
Total interest expense from deposits
|
(489.0 | ) | (484.8 | ) | 4.2 | 0.9 | ||||||||||
|
Borrowing from banks and others
|
(59.8 | ) | (76.2 | ) | (16.3 | ) | (21.4 | ) | ||||||||
|
Interbank and overnight funds (expenses)
|
(17.1 | ) | (22.0 | ) | (4.9 | ) | (22.1 | ) | ||||||||
|
Long-term debt (bonds)
|
(156.5 | ) | (162.5 | ) | (6.0 | ) | (3.7 | ) | ||||||||
|
Total interest expense
|
(722.5 | ) | (745.5 | ) | (23.0 | ) | (3.1 | ) | ||||||||
|
Net interest income
|
1,328.1 | 1,283.2 | 45.0 | 3.5 | ||||||||||||
Banco de Occidente’s net interest income grew by 3.5%, or Ps 45.0 billion, from Ps 1,283.2 billion for the year ended December 31, 2012 to Ps 1,328.1 billion for the year ended December 31, 2013. This increase was driven primarily by a Ps 22.0 billion increase in total interest income and a Ps 23.0 billion decrease in total interest expense.
Interest income from loans and financial leases increased by 4.2%, or Ps 75.3 billion, to Ps 1,884.0 billion for the year ended December 31, 2013 compared to 2012. Banco de Occidente’s average loans and financial leases portfolio grew by 14.6%, or Ps 2,252.0 billion, to Ps 17,658.7 billion, resulting in a Ps 222.3 billion increase in interest income from loans and financial leases. The year-end balance of commercial loans (including financial leases) and consumer loans increased by Ps 1,784.3 billion and Ps 834.7 billion, respectively. Partially offsetting this increase in interest income from loans and financial leases was the decrease in their average yield from 11.7% for the year ended December 31, 2012 to 10.7% for the year ended December 31, 2013, which resulted in a Ps 147.1 billion decrease in interest income from loans and financial leases. The decrease in yields was a result of a
decreasing rate environment where the average DTF rate decreased from 5.35% for the year ended December 31, 2012 to 4.24% for the year ended December 31, 2013.
Interest income from investment securities decreased by Ps 49.0 billion to Ps 125.1 billion for the year ended December 31, 2013. The fixed income portfolio generated Ps 124.7 billion, or 99.6% of Banco de Occidente’s earnings on investment securities for the year ended December 31, 2013, while the equity portfolio generated Ps 0.4 billion, or 0.4% of earnings from investment securities, in line with historical results. The Ps 49.0 billion decrease was explained by a decrease in the average yield earned on investment securities from 4.3% for the year ended December 31, 2012 to 2.5% for the same period in 2013. This decrease in the average yield was driven by an increase in fixed income securities’ rates experienced in Colombia during the second and third quarters of 2013. Partially offsetting this decrease in yields was an increase in the average balance of the investment portfolio of Ps 970.5 billion, or 23.8%, to Ps 5,043.1 billion for the year ended December 31, 2013.
The average yield earned on interest-earning assets decreased from 10.1% for the year ended December 31, 2012 to 8.9% for the year ended December 31, 2013, primarily as a result of the declines in interest income from the fixed income portfolio described above.
The 3.1%, or Ps 23.0 billion, decrease in total interest expense to Ps 722.5 billion for the year ended December 31, 2013 was mainly driven by a Ps 27.1 billion decrease in interest expense on savings deposits, a Ps 16.3 billion decrease in interest expense on borrowings from banks and others, a Ps 6.0 billion decrease in interest expense on long-term debt, and a Ps 4.9 billion decrease in interest expense on interbank and overnight funds. Partially offsetting these decreases was a Ps 30.3 billion increase in interest expense on time deposits.
The decrease in interest expense on savings deposits of Ps 27.1 billion was driven by a decrease in the average interest rate paid on those deposits decreasing from 4.2% for the year ended December 31, 2012 to 3.1% for the year ended December 31, 2013. The 107 basis points decrease in the average interest rate contributed to a decrease of Ps 67.7 billion in interest expense and was consistent with the decrease in the average DTF rate described above. Partially offsetting this decrease was an increase in the average balance of savings deposits from Ps 6,387.8 billion for the year ended December 31, 2012 to Ps 7,703.6 billion for the year ended December 31, 2013, which resulted in a Ps 40.6 billion increase in interest expense.
The Ps 16.3 billion decrease in interest expense on borrowings from banks and others was driven by a decrease in the average interest rate paid from 5.0% for the year ended December 31, 2012 to 3.5% for the year ended December 31, 2013. This decrease in costs was, as in the case of savings deposits, consistent with a decreasing interest-rate environment and resulted in a Ps 26.6 billion decrease in interest expense. Partially offsetting this decrease in interest expense was an increase in the average balance of borrowings from banks and others from Ps 1,520.5 billion for the year ended December 31, 2012 to Ps 1,696.8 billion for the year ended December 31, 2013 contributing an increase of Ps 10.3 billion in interest expense.
The decrease in interest expense on long-term debt of Ps 6.0 billion was driven primarily by a decrease in the average interest rate paid, consistent with the decreasing interest-rate environment, from 7.5% for the year ended December 31, 2012 to 6.1% for the year ended December 31, 2013 which resulted in a Ps 30.2 billion decrease in interest expense. This decrease was offset in part by an 18.3%, or Ps 396.9 billion, increase in the average balance of long-term debt to Ps 2,560.9 billion for the year ended December 31, 2013, which resulted in a Ps 24.3 billion increase in interest expense.
The Ps 4.9 billion decrease in interest expense from interbank and overnight funds was driven by a decrease in the average balance from Ps 533.2 billion for the year ended December 31, 2012 to Ps 405.8 billion for the year ended December 31, 2013.
The increase in interest expense from time deposits of Ps 30.3 billion was driven by an increase in the average balance from Ps 3,943.8 billion for the year ended December 31, 2012 to Ps 5,100.3 billion for the year ended December 31, 2013 contributing an increase of Ps 56.2 billion in interest expense. Partially offsetting this increase was a decrease in the average interest rate paid, consistent with the decreasing interest-rate environment, from 5.2% for the year ended December 31, 2012 to 4.6% for the year ended December 31, 2013 which resulted in a Ps 25.9 billion decrease in interest expense.
The average rate paid on interest-bearing liabilities decreased from 4.9% for the year ended December 31, 2012 to 3.9% for the year ended December 31, 2013.
The average total interest-earning assets for the year ended December 31, 2013 compared to the year ended December 31, 2012 increased by 15.6% or Ps 3,118.0 billion, and net interest income between the same periods increased by 3.5%, resulting in a decrease in the net interest margin from 6.4% for the year ended December 31, 2012 to 5.7% for the year ended December 31, 2013. The interest spread between the average rate on loans and financial leases and the average rate paid on deposits slightly decreased from 7.3% in 2012 to 7.1% in 2013.
Provisions
Total net provisions increased by Ps 97.3 billion to Ps 320.9 billion for the year ended December 31, 2013, driven by a Ps 96.5 billion increase in net provisions for loans and financial leases to Ps 332.7 billion, a Ps 4.1 billion increase in net provisions for accrued interest and other receivables, and a Ps 1.6 billion decrease in recovery of charged-off assets, partially offset by a Ps 5.0 billion decrease in net provisions for foreclosed assets and other assets.
The Ps 96.5 billion increase in the net provision for loan and financial lease losses was driven by (i) an increase in the volume of loans and financial leases, and (ii) an increase in non-performing loans, mainly in the consumer loan portfolio and the financial leases portfolio, which increased 22.0% and 28.5%, respectively. Banco de Occidente’s delinquency ratio (measured as loans at least 30 days past due as a percentage of total gross loans) improved from 2.5% as of December 31, 2012 to 2.4% as of December 31, 2013.
Charge-offs increased from Ps 198.4 billion for the year ended December 31, 2012 to Ps 243.4 billion for the year ended December 31, 2013. Banco de Occidente’s ratio of charge-offs to average balance of loans and financial leases increased from an annualized 1.3% for the year ended December 31, 2012 to 1.4% for the year ended December 31, 2013. Since charge-offs were only a fraction of net provisions for loans and financial leases, the total allowance for loans and financial lease losses increased from Ps 611.3 billion as of December 31, 2012 to Ps 700.4 billion as of December 31, 2013. Banco de Occidente’s coverage ratio for its past due loans increased from 146.8% for the year ended December 31, 2012 to 146.9% for the year ended December 31, 2013.
Net provision expense for accrued interest and other receivables increased by Ps 4.1 billion to Ps 34.9 billion for the year ended December 31, 2013 from Ps 30.8 billion for 2012 due to a combination of a higher provision expense of Ps 10.4 billion and higher reversals of provisions of Ps 6.3 billion. This increase in net provision expense is mainly attributable to an increase in the balance of accrued interest and other receivables.
The recovery of charged-off assets decreased by Ps 1.6 billion for 2012 to Ps 50.3 billion for 2013. The ratio of recovered charged-off assets to average loans and financial leases remained unchanged at 0.3% for both 2012 and 2013.
Net provision expense for foreclosed assets and other assets decreased by Ps 5.0 billion to Ps 3.6 billion for the year ended December 31, 2013 from Ps 8.5 billion for 2012 due to a combination of a lower provision expense of Ps 2.6 billion and higher reversals of provisions of Ps 2.3 billion.
Total Fees and Other Services Income, Net
|
Year ended
December 31,
|
Change,
December 2013
vs. December 2012
|
|||||||||||||||
|
2013
|
2012
|
# |
%
|
|||||||||||||
|
(in Ps billions)
|
||||||||||||||||
|
Fees and other services income:
|
||||||||||||||||
|
Commissions from banking services
|
189.4 | 163.2 | 26.1 | 16.0 | ||||||||||||
|
Branch network services
|
– | – | – | – | ||||||||||||
|
Credit card merchant fees
|
98.0 | 81.7 | 16.2 | 19.9 | ||||||||||||
|
Checking fees
|
20.8 | 22.1 | (1.3 | ) | (5.7 | ) | ||||||||||
|
Warehouse services
|
– | – | – | – | ||||||||||||
|
Fiduciary activities
|
48.4 | 46.0 | 2.4 | 5.1 | ||||||||||||
|
Pension plan administration
|
– | – | – | – | ||||||||||||
|
Other
|
33.5 | 33.4 | 0.1 | 0.4 | ||||||||||||
|
Total fees and other services income
|
390.1 | 346.5 | 43.6 | 12.6 | ||||||||||||
|
Fees and other services expenses
|
(135.4 | ) | (117.5 | ) | 17.9 | 15.3 | ||||||||||
|
Total fees and other services income, net
|
254.7 | 229.0 | 25.7 | 11.2 | ||||||||||||
Total fees and other services income, net increased by 11.2%, or Ps 25.7 billion, to Ps 254.7 billion for the year ended December 31, 2013. This increase was primarily due to a Ps 26.1 billion increase in commissions from banking services to Ps 189.4 billion, mainly as a result of Banco de Occidente’s organic growth and higher commissions charged on different products such as management fees, and a Ps 16.2 billion increase in credit card merchant fess to Ps 98.0 billion. Partially offsetting these increases was the Ps 17.9 billion increase in fees and other services expenses to Ps 135.4 billion for the year ended December 31, 2013.
Other Operating Income
|
Year ended
December 31,
|
Change,
December 2013
vs. December 2012
|
|||||||||||||||
|
2013
|
2012
|
# |
%
|
|||||||||||||
|
(in Ps billions)
|
||||||||||||||||
|
Foreign exchange gains (losses), net
|
22.5 | 6.6 | 15.9 | 242.1 | ||||||||||||
|
Gains on derivative operations, net
|
3.3 | 30.4 | (27.1 | ) | (89.1 | ) | ||||||||||
|
Gains on sales of investments in equity securities, net
|
0.0 | – | 0.0 | – | ||||||||||||
|
Income from non-financial sector, net
|
1.5 | 2.2 | (0.8 | ) | (33.7 | ) | ||||||||||
|
Dividend income
|
143.1 | 133.6 | 9.5 | 7.1 | ||||||||||||
|
Other
|
150.3 | 159.9 | (9.6 | ) | (6.0 | ) | ||||||||||
|
Other operating income
|
320.8 | 332.7 | (12.0 | ) | (3.6 | ) | ||||||||||
Total other operating income decreased by 3.6%, or Ps 12.0 billion, to Ps 320.8 billion for the year ended December 31, 2013. This increase was primarily a result of a Ps 11.1 billion decrease in gains from foreign exchange and derivative operations during the year ended December 31, 2013.
Operating Expenses
|
Year ended
December 31,
|
Change,
December 2013
vs. December 2012
|
|||||||||||||||
|
2013
|
2012
|
# |
%
|
|||||||||||||
|
(in Ps billions)
|
||||||||||||||||
|
Salaries and employee benefits
|
(344.8 | ) | (327.9 | ) | 16.8 | 5.1 | ||||||||||
|
Bonus plan payments
|
(23.5 | ) | (22.0 | ) | 1.5 | 6.6 | ||||||||||
|
Termination payments
|
(3.3 | ) | (2.8 | ) | 0.5 | 18.5 | ||||||||||
|
Administrative and other expenses
|
(448.4 | ) | (408.8 | ) | 39.6 | 9.7 | ||||||||||
|
Deposit security, net
|
(46.7 | ) | (39.0 | ) | 7.7 | 19.7 | ||||||||||
|
Charitable and other donation expenses
|
(0.7 | ) | (1.8 | ) | (1.1 | ) | (59.4 | ) | ||||||||
|
Depreciation
|
(141.0 | ) | (133.3 | ) | 7.8 | 5.8 | ||||||||||
|
Goodwill amortization
|
(1.5 | ) | (1.4 | ) | 0.1 | 6.8 | ||||||||||
|
Total operating expenses
|
(1,010.1 | ) | (937.2 | ) | 72.9 | 7.8 | ||||||||||
Total operating expenses increased by 7.8%, or Ps 72.9 billion, to Ps 1,010.1 billion for the year ended December 31, 2013 primarily due to a Ps 39.6 billion increase in administrative and other expenses, to Ps 448.4 billion, principally driven by the organic growth of the business and particularly as a result of Banco de Occidente’s larger loan and financial leases portfolio. Salaries and employee benefits increased by Ps 16.8 billion or 5.1% to Ps 344.8 billion, which was explained by an increase in headcount from 10,876 at December 31, 2012 to 11,652 at
December 31, 2013. On a per employee basis, salaries decreased by 1.9%. Depreciation expense increased by Ps 7.8 billion to Ps 141.0 billion as a result of higher depreciation expense from operating leases. Deposit security expense, net (representing Colombian mandatory deposit insurance) increased by Ps 7.7 billion, due to an increase in the average balance of deposits in 2013. Banco de Occidente’s efficiency, measured as a cost-to-income ratio, deteriorated from 43.5% at December 31, 2012 to 45.6% at December 31, 2013, mainly driven by a decrease in operating income. The annualized ratio of operating expenses before depreciation and amortization as a percentage of average assets improved from 3.5% for the year ended December 31, 2012 to 3.3% for the year ended December 31, 2013.
Non-Operating Income (Expense)
Total non-operating income (expense) includes gains (losses) from the sale of foreclosed assets, property, plant and equipment and other assets. Total non-operating income slightly decreased to Ps 12.3 billion for the year ended December 31, 2013, from a total net non-operating income of Ps 12.9 billion for the year ended December 31, 2012.
Income Tax Expense
Income tax expense for Banco de Occidente decreased by Ps 19.2 billion to Ps 155.5 billion for the year ended December 31, 2013. This decrease was primarily due to a lower income before income tax expense and non-controlling interest. Banco de Occidente’s effective tax rate, calculated before non-controlling interest, increased from 25.1% for the year ended December 20, 2012 to 26.6% for the year ended December 31, 2013. The increase in the effective tax rate was driven by change in the Colombian tax system as a result of the 2012 Tax Reform, which came into effect in 2013 (see “Item 4. Information on the Company—B. Business Overview—Supervision and regulation—Regulation on Payroll Loans—2012 Tax Reform”).
Non-Controlling Interest
Banco de Occidente’s non-controlling interest decreased by Ps 0.7 billion to Ps 1.2 billion for the year ended December 31, 2013. Non-controlling interest is not a significant contributor to net income for Banco de Occidente, responsible for only 0.3% of net income before non-controlling interest for the year ended December 31, 2013.
Banco Popular
Net Income
|
Year ended
December 31,
|
Change,
December 2013
vs. December 2012
|
|||||||||||||||
|
2013
|
2012
|
# |
%
|
|||||||||||||
|
(in Ps billions)
|
||||||||||||||||
|
Total interest income
|
1,564.9 | 1,613.2 | (48.3 | ) | (3.0 | ) | ||||||||||
|
Total interest expense
|
(458.7 | ) | (554.9 | ) | (96.2 | ) | (17.3 | ) | ||||||||
|
Net interest income
|
1,106.2 | 1,058.3 | 47.9 | 4.5 | ||||||||||||
|
Total (provisions) / reversals, net
|
(66.1 | ) | (90.7 | ) | (24.6 | ) | (27.1 | ) | ||||||||
|
Total fees and other services income, net
|
147.6 | 145.0 | 2.5 | 1.8 | ||||||||||||
|
Total other operating income
|
44.0 | 48.9 | (4.8 | ) | (9.9 | ) | ||||||||||
|
Total operating income
|
1,231.7 | 1,161.6 | 70.2 | 6.0 | ||||||||||||
|
Total operating expenses
|
(715.9 | ) | (669.2 | ) | 46.7 | 7.0 | ||||||||||
|
Net operating income
|
515.8 | 492.4 | 23.4 | 4.8 | ||||||||||||
|
Total non-operating income (expense), net
|
93.4 | 77.1 | 16.3 | 21.2 | ||||||||||||
|
Income before income tax expense and non-controlling interest
|
609.2 | 569.5 | 39.8 | 7.0 | ||||||||||||
|
Income tax expense
|
(210.6 | ) | (187.7 | ) | 22.9 | 12.2 | ||||||||||
|
Income before non-controlling interest
|
398.6 | 381.8 | 16.8 | 4.4 | ||||||||||||
|
Non-controlling interest
|
(2.3 | ) | (3.8 | ) | (1.5 | ) | (39.4 | ) | ||||||||
|
Net income attributable to shareholders
|
396.3 | 377.9 | 18.4 | 4.9 | ||||||||||||
Banco Popular’s net income attributable to its shareholders increased by 4.9% to Ps 396.3 billion for the year ended December 31, 2013. This increase was mainly due to an increase in net interest income, a decrease in total provisions, net, an increase in total non-operating income, and an increase in total fees and other services income, net, offset in part by an increase in total operating expenses and an increase in income tax expense.
Net Interest Income
|
Year ended
December 31,
|
Change,
December 2013
vs. December 2012
|
|||||||||||||||
|
2013
|
2012
|
# |
%
|
|||||||||||||
|
(in Ps billions)
|
||||||||||||||||
|
Interest income:
|
||||||||||||||||
|
Interest on loans
|
1,400.8 | 1,415.7 | (14.8 | ) | (1.0 | ) | ||||||||||
|
Interest on investment securities
|
116.3 | 141.9 | (25.6 | ) | (18.0 | ) | ||||||||||
|
Interbank and overnight funds
|
14.1 | 18.7 | (4.6 | ) | (24.7 | ) | ||||||||||
|
Financial leases
|
33.7 | 37.0 | (3.3 | ) | (8.8 | ) | ||||||||||
|
Total interest income
|
1,564.9 | 1,613.2 | (48.3 | ) | (3.0 | ) | ||||||||||
|
Interest expense:
|
||||||||||||||||
|
Checking accounts
|
(7.5 | ) | (23.8 | ) | (16.3 | ) | (68.4 | ) | ||||||||
|
Time deposits
|
(86.4 | ) | (129.1 | ) | (42.7 | ) | (33.1 | ) | ||||||||
|
Savings deposits
|
(245.1 | ) | (237.6 | ) | 7.5 | 3.2 | ||||||||||
|
Total interest expense from deposits
|
(339.0 | ) | (390.5 | ) | (51.5 | ) | (13.2 | ) | ||||||||
|
Borrowing from banks and others
|
(9.3 | ) | (37.3 | ) | (27.9 | ) | (75.0 | ) | ||||||||
|
Interbank and overnight funds (expenses)
|
(3.8 | ) | (8.0 | ) | (4.2 | ) | (52.4 | ) | ||||||||
|
Long-term debt (bonds)
|
(106.5 | ) | (119.1 | ) | (12.6 | ) | (10.6 | ) | ||||||||
|
Total interest expense
|
(458.7 | ) | (554.9 | ) | (96.2 | ) | (17.3 | ) | ||||||||
|
Net interest income
|
1,106.2 | 1,058.3 | 47.9 | 4.5 | ||||||||||||
Banco Popular’s net interest income grew by 4.5%, or Ps 47.9 billion, from Ps 1,058.3 billion for the year ended December 31, 2012 to Ps 1,106.2 billion for the year ended December 31, 2013. This increase was driven primarily by a Ps 96.2 billion decrease in total interest expense and a decrease in total interest income of Ps 48.3 billion.
Despite a 5.6%, or Ps 612.0 billion, increase in Banco Popular’s average of interest-earning loans and financial leases portfolio to Ps 11,479.4 billion, which resulted in a Ps 76.6 billion increase in interest income, total interest income from loans and financial leases decreased by 1.2%, or Ps 18.1 billion, to Ps 1,434.6 billion for the year ended December 31, 2013 due to a decrease in the average yield of loans and financial leases from 13.4% for the year ended December 31, 2012 to 12.5% for the year ended December 31, 2013, which resulted in a Ps 94.7 billion decrease in interest income from loans and financial leases. The decrease in the yield was a result of a decreasing rate environment in Colombia where the average DTF rate decreased from 5.35% for the year ended December 31, 2012 to 4.24% for the year ended December 31, 2013.
Interest income from investment securities decreased by 18.0%, or Ps 25.6 billion, to Ps 116.3 billion for the year ended December 31, 2013 mainly as a result of a decrease in the average yield earned on investment securities from 6.3% for the year ended December 31, 2012 to 4.7% for the year ended December 31, 2013. This decrease in the average yield was driven by an increase in the rate for fixed income securities’ experienced in Colombia during the second and third quarters of 2013. The average balance of investment securities increased from Ps 2,258.8 billion for the year ended December 31, 2012 to Ps 2,453.6 billion for the year ended December 31, 2013. The fixed income portfolio generated Ps 114.8 billion of interest income from investment securities, accounting for 98.8% of Banco Popular’s interest income from investment securities, while the equity portfolio generated Ps 1.4 billion of interest income from investment securities, accounting for 1.2% of Banco Popular’s interest income from investment securities.
Interest income from interbank and overnight funds decreased by Ps 4.6 billion to Ps 14.1 billion for the year ended December 31, 2013 mainly driven by a decrease in the average balance of interbank and overnight funds from Ps 247.7 billion as of December 31, 2012 to Ps 136.6 billion as of December 31, 2013.
The average yield from interest-earning assets decreased from 12.1% for the year ended December 31, 2012 to 11.1% for the year ended December 31, 2013 as a result of (i) the decreasing rate environment described above, and (ii) a decrease in the average yield on investment securities.
Total interest expense decreased by Ps 96.2 billion to Ps 458.7 billion for the year ended December 31, 2013 as compared to the year ended December 31, 2012. This decrease was mainly explained by a Ps 42.7 billion decrease in interest expense on time deposits, a Ps 27.9 billion decrease in interest expense on borrowings from banks and others, a Ps 16.3 billion decrease in interest expense on checking accounts, and a Ps 12.6 billion decrease in interest expense on long-term debt.
The Ps 42.7 billion decrease in interest expense on time deposits was driven by a decrease in the average balance of time deposits from Ps 2,068.9 billion in 2012 to Ps 1,622.2 billion in 2013, which resulted in a decrease of Ps 23.8 billion in interest expense, and a decrease in the average interest rate paid on those deposits from 6.2% for the year ended December 31, 2012 to 5.3% for the year ended December 31, 2013. The 92 basis points decrease in the cost of these funds resulted in a decrease of Ps 18.9 billion in interest expense and was mainly a result of the above-mentioned decreasing DTF rate environment.
The decrease in interest expense on borrowings from banks and others of Ps 27.9 billion was driven by a decrease in the average balance of these funds from Ps 566.3 billion in 2012 to Ps 235.8 billion in 2013, which resulted in a decrease of Ps 17.4 billion in interest expense, and by a decrease in the average interest rate paid on borrowings from banks and others which decreased from 6.6% for the year ended December 31, 2012 to 4.0% for the year ended December 31, 2013. The decrease in the interest rate paid was, as in the case of the time deposits, consistent with a decreasing interest-rate environment and resulted in a Ps 10.5 billion decrease in interest expense.
The Ps 16.3 billion decrease in interest expense on checking accounts was driven by a decrease in the average rate paid for checking accounts which decreased from 7.2% for the year ended December 31, 2012 to 3.8% for the year ended December 31, 2013. The decrease in the interest rate paid was also consistent with the decreasing interest-rate environment and resulted in a Ps 11.4 billion decrease in interest expense. Also contributing to the decrease in interest expense was a decrease in the average balance of these funds from Ps 330.4 billion in 2012 to Ps 200.4 billion in 2013, which resulted in a decrease of Ps 4.9 billion in interest expense.
The decrease in interest expense on long-term debt of Ps 12.6 billion was driven by a decrease in the average rate paid for long-term debt which decreased from 6.9% for the year ended December 31, 2012 to 5.8% for the year ended December 31, 2013. The decrease in the interest rate paid was also consistent with the decreasing interest-rate environment and resulted in a Ps 20.0 billion decrease in interest expense. Partially offsetting this decrease was a 7.4%, or Ps 127.7 billion, increase in the average balance of these funds from Ps 1,718.1 billion in 2012 to Ps 1,845.9 billion in 2013, which resulted in an increase of Ps 7.4 billion in interest expense.
The average rate paid on interest-bearing liabilities decreased from 5.2% for the year ended December 31, 2012 to 4.1% for the year ended December 31, 2013.
Average total interest-earning assets for the year ended December 31, 2013 compared to the year ended December 31, 2012 increased by 5.2% or Ps 695.5 billion to Ps 14,069.4 billion, while the increase in net interest income between the same periods was 4.5%, as a result, net interest margin for the years ended December 31, 2012 December 31, 2013 was 7.9%. Interest spread between the average yield earned on loans and financial leases and the average rate paid on deposits was 8.7% both for the year ended December 31, 2012 and for the year ended December 31, 2013.
Provisions
Total net provisions decreased by Ps 24.6 billion to Ps 66.1 billion for the year ended December 31, 2013, driven primarily by a Ps 24.5 billion decrease in net provisions for loans and financial leases to Ps 74.6 billion. The decrease in the net provision for loan and financial lease losses is mainly due to an improvement in credit quality, as Banco Popular’s delinquency ratio (measured as loans at least 30 days past due as a percentage of total gross loans) improved from 2.12% as of December 31, 2012 to 2.06% as of December 31, 2013.
Charge-offs showed an increase from Ps 57.8 billion for the year ended December 31, 2012 to Ps 65.8 billion for the year ended December 31, 2013. Banco Popular’s ratio of charge-offs to average loans and financial leases slightly increased from an annualized 0.5% for the year ended December 31, 2012 to 0.6% for the year ended
December 31, 2013. Since Banco Popular’s net provisions for loan and financial lease losses increased, in absolute terms, more than the increase in charge-offs, the allowance for loan and financial lease losses increased from Ps 430.1 billion as of December 31, 2012 to Ps 438.6 billion as of December 31, 2013. Banco Popular’s coverage over its past due loans increased from 172.4% as of December 31, 2012 to 176.1% as of December 31, 2013.
Net provisions for accrued interest and other receivables decreased by Ps 1.5 billion to a net expense of Ps 3.0 billion as of December 31, 2013 from a net expense of Ps 4.5 billion as of December 31, 2012 due to a combination of a lower provision expense of Ps 3.2 billion and lower reversals of provisions of Ps 1.7 billion.
Net provisions for foreclosed assets and other assets increased by Ps 1.7 billion to a net expense of Ps 4.5 billion as of December 31, 2013 from a net expense of Ps 2.8 billion as of December 31, 2012 due to a higher provision expense of Ps 1.7 billion.
The recovery of charged-off assets increased between the year ended December 31, 2012 and the year ended December 31, 2013 by Ps 0.3 billion to Ps 16.0 billion.
Total Fees and Other Services Income, Net
|
Year ended
December 31,
|
Change,
December 2013
vs. December 2012
|
|||||||||||||||
|
2013
|
2012
|
# |
%
|
|||||||||||||
|
(in Ps billions)
|
||||||||||||||||
|
Fees and other services income:
|
||||||||||||||||
|
Commissions from banking services
|
94.3 | 83.6 | 10.7 | 12.8 | ||||||||||||
|
Branch network services
|
– | – | – | – | ||||||||||||
|
Credit card merchant fees
|
6.8 | 6.1 | 0.7 | 12.0 | ||||||||||||
|
Checking fees
|
3.2 | 3.7 | (0.5 | ) | (13.0 | ) | ||||||||||
|
Warehouse services
|
59.7 | 62.2 | (2.5 | ) | (4.0 | ) | ||||||||||
|
Fiduciary activities
|
14.2 | 13.8 | 0.4 | 3.0 | ||||||||||||
|
Pension plan administration
|
0.7 | 0.7 | 0.0 | 1.3 | ||||||||||||
|
Other
|
8.4 | 10.0 | (1.5 | ) | (15.3 | ) | ||||||||||
|
Total fees and other services income
|
187.4 | 180.0 | 7.4 | 4.1 | ||||||||||||
|
Fees and other services expenses
|
(39.8 | ) | (35.0 | ) | 4.9 | 13.9 | ||||||||||
|
Total fees and other services income, net
|
147.6 | 145.0 | 2.5 | 1.8 | ||||||||||||
Total fees and other services income, net increased by 1.8%, or Ps 2.5 billion, to Ps 147.6 billion for the year ended December 31, 2013. This increase was primarily due to a Ps 10.7 billion increase in commissions from banking services to Ps 94.3 billion. Partially offsetting this increase was a Ps 4.9 billion increase in total fees and other services expenses to Ps 39.8 billion, a Ps 2.5 billion decrease in warehouse services fees to Ps 59.7 billion, and a Ps 1.5 billion decrease in other fees.
Other Operating Income
|
Year ended
December 31,
|
Change,
December 2013
vs. December 2012
|
|||||||||||||||
|
2013
|
2012
|
# |
%
|
|||||||||||||
|
(in Ps billions)
|
||||||||||||||||
|
Foreign exchange gains (losses), net
|
2.7 | (0.6 | ) | 3.3 | 580.0 | |||||||||||
|
Gains on derivative operations, net
|
(0.2 | ) | 0.1 | (0.4 | ) | (286.5 | ) | |||||||||
|
Gains on sales of investments in equity securities, net
|
– | (0.0 | ) | 0.0 | – | |||||||||||
|
Income from non-financial sector, net
|
2.7 | 4.4 | (1.7 | ) | (39.5 | ) | ||||||||||
|
Dividend income
|
33.3 | 31.5 | 1.7 | 5.5 | ||||||||||||
|
Other
|
5.6 | 13.4 | (7.7 | ) | (57.8 | ) | ||||||||||
|
Other operating income
|
44.0 | 48.9 | (4.8 | ) | (9.9 | ) | ||||||||||
Total other operating income decreased by 9.9%, or Ps 4.8 billion, to Ps 44.0 billion for the year ended December 31, 2013. This decrease was primarily a result of a Ps 7.7 billion decrease in other income, partially offset by a Ps 2.9 billion increase in net foreign exchange and derivative operations. The decrease in other income was driven by lower income from joint venture for the year ended December 31, 2013 as Fiduciaria Popular ceased their participation in Foncep (
Fondo de prestaciones económicas, cesantías y pensiones
).
Operating Expenses
|
Year ended
December 31,
|
Change,
December 2013
vs. December 2012
|
|||||||||||||||
|
2013
|
2012
|
# |
%
|
|||||||||||||
|
(in Ps billions)
|
||||||||||||||||
|
Salaries and employee benefits
|
(263.8 | ) | (259.3 | ) | 4.5 | 1.7 | ||||||||||
|
Bonus plan payments
|
(4.1 | ) | (3.9 | ) | 0.3 | 6.6 | ||||||||||
|
Termination payments
|
(0.7 | ) | (0.4 | ) | 0.3 | 83.2 | ||||||||||
|
Administrative and other expenses
|
(388.1 | ) | (350.2 | ) | 37.9 | 10.8 | ||||||||||
|
Deposit security, net
|
(31.5 | ) | (29.5 | ) | 1.9 | 6.6 | ||||||||||
|
Charitable and other donation expenses
|
(1.4 | ) | (1.4 | ) | 0.0 | 3.3 | ||||||||||
|
Depreciation
|
(26.3 | ) | (24.5 | ) | 1.8 | 7.4 | ||||||||||
|
Goodwill amortization
|
– | – | – | – | ||||||||||||
|
Total operating expenses
|
(715.9 | ) | (669.2 | ) | 46.7 | 7.0 | ||||||||||
Total operating expenses increased by 7.0% or Ps 46.7 billion to Ps 715.9 billion for the year ended December 31, 2013 versus the year ended December 31, 2012. Administrative and other expenses increased by Ps 37.9 billion to Ps 388.1 billion, principally driven by the organic growth of the business as Banco Popular’s total assets increased by 10.5%. Salaries and employee benefits increased by Ps 4.5 billion to Ps 263.8 billion, which was partially explained by the increase in headcount from 6,674 at December 31, 2012 to 6,709 at December 31, 2013. On a per employee basis, salaries and employee benefits increased by 1.2%. Banco Popular’s efficiency ratio deteriorated, on a cost to income basis, from 51.5% for the year ended December 31, 2012 to 53.1% for the year ended December 31, 2013 as operating income before provisions grew at a slower pace than operating expenses. The annualized ratio of operating expenses before depreciation and amortization as a percentage of average assets remained unchanged at 4.3% for both the years ended December 31, 2012 and 2013.
Non-Operating Income (Expense)
Total net non-operating income (expense) increased by Ps 16.3 billion to Ps 93.4 billion for the year ended December 31, 2013, mainly driven by recoveries of labor contingencies derived from new calculations of their actuarial models.
Income Tax Expense
Income tax expense for Banco Popular increased by Ps 22.9 billion to Ps 210.6 billion for the year ended December 31, 2013, primarily due to higher income before income tax expense and non-controlling interest. Banco Popular’s effective tax rate, calculated before non-controlling interest, increased from 33.0% for the year ended December 31, 2012 to 34.6% for the year ended December 31, 2013, driven by change in the Colombian tax system as a result of the 2012 Tax Reform, which came into effect in 2013 (see “Item 4. Information on the Company—B. Business Overview—Supervision and regulation—Regulation on Payroll Loans—2012 Tax Reform”).
Non-Controlling Interest
Banco Popular’s non-controlling interest decreased by Ps 1.5 billion to Ps 2.3 billion. Non-controlling interest is not a significant contributor to net income for Banco Popular, responsible for only 0.6% of net income before non-controlling interest for the year ended December 31, 2013.
Banco AV Villas
Net Income
|
Year ended
December 31,
|
Change,
December 2013
vs. December 2012
|
|||||||||||||||
|
2013
|
2012
|
# |
%
|
|||||||||||||
|
(in Ps billions)
|
||||||||||||||||
|
Total interest income
|
946.6 | 868.5 | 78.1 | 9.0 | ||||||||||||
|
Total interest expense
|
(223.0 | ) | (254.2 | ) | (31.1 | ) | (12.3 | ) | ||||||||
|
Net interest income
|
723.6 | 614.3 | 109.3 | 17.8 | ||||||||||||
|
Total (provisions) / reversals, net
|
(133.3 | ) | (88.0 | ) | 45.3 | 51.5 | ||||||||||
|
Total fees and other services income, net
|
165.6 | 159.4 | 6.2 | 3.9 | ||||||||||||
|
Total other operating income
|
6.0 | 4.2 | 1.8 | 41.2 | ||||||||||||
|
Total operating income
|
761.8 | 690.0 | 71.8 | 10.4 | ||||||||||||
|
Total operating expenses
|
(482.6 | ) | (455.7 | ) | 26.9 | 5.9 | ||||||||||
|
Net operating income
|
279.2 | 234.3 | 45.0 | 19.2 | ||||||||||||
|
Total non-operating income (expense), net
|
3.2 | 16.2 | (13.0 | ) | (80.1 | ) | ||||||||||
|
Income before income tax expense and non-controlling interest
|
282.5 | 250.5 | 32.0 | 12.8 | ||||||||||||
|
Income tax expense
|
(96.4 | ) | (78.0 | ) | 18.4 | 23.6 | ||||||||||
|
Income before non-controlling interest
|
186.1 | 172.5 | 13.6 | 7.9 | ||||||||||||
|
Non-controlling interest
|
(0.0 | ) | (0.2 | ) | (0.2 | ) | (94.9 | ) | ||||||||
|
Net income attributable to shareholders
|
186.1 | 172.3 | 13.8 | 8.0 | ||||||||||||
Banco AV Villas’ net income attributable to its shareholders increased by 8.0%, or Ps 13.8 billion, to Ps 186.1 billion for the year ended December 31, 2013 as compared to the year ended December 31, 2012. The increase was primarily due to an increase in net interest income and in total fees and other services income, net offset in part by an increase in total net provisions, an increase in operating expenses and a decrease in non-operating income (expense) net.
Net Interest Income
|
Year ended
December 31,
|
Change,
December 2013
vs. December 2012
|
|||||||||||||||
|
2013
|
2012
|
# |
%
|
|||||||||||||
|
(in Ps billions)
|
||||||||||||||||
|
Interest income:
|
||||||||||||||||
|
Interest on loans
|
785.7 | 732.1 | 53.6 | 7.3 | ||||||||||||
|
Interest on investment securities
|
156.8 | 128.5 | 28.3 | 22.0 | ||||||||||||
|
Interbank and overnight funds
|
4.1 | 7.9 | (3.8 | ) | (48.3 | ) | ||||||||||
|
Financial leases
|
– | – | – | – | ||||||||||||
|
Total interest income
|
946.6 | 868.5 | 78.1 | 9.0 | ||||||||||||
|
Interest expense:
|
||||||||||||||||
|
Checking accounts
|
(2.1 | ) | (2.4 | ) | (0.3 | ) | (14.0 | ) | ||||||||
|
Time deposits
|
(112.4 | ) | (129.2 | ) | (16.8 | ) | (13.0 | ) | ||||||||
|
Savings deposits
|
(84.8 | ) | (87.1 | ) | (2.3 | ) | (2.6 | ) | ||||||||
|
Total interest expense from deposits
|
(199.3 | ) | (218.7 | ) | (19.4 | ) | (8.9 | ) | ||||||||
|
Borrowing from banks and others
|
(4.0 | ) | (6.9 | ) | (3.0 | ) | (42.7 | ) | ||||||||
|
Interbank and overnight funds (expenses)
|
(19.8 | ) | (28.6 | ) | (8.8 | ) | (30.7 | ) | ||||||||
|
Long-term debt (bonds)
|
– | – | – | – | ||||||||||||
|
Total interest expense
|
(223.0 | ) | (254.2 | ) | (31.1 | ) | (12.3 | ) | ||||||||
|
Net interest income
|
723.6 | 614.3 | 109.3 | 17.8 | ||||||||||||
Banco AV Villas’ net interest income increased by 17.8%, or Ps 109.3 billion, from Ps 614.3 billion for the year ended December 31, 2012 to Ps 723.6 billion for the year ended December 31, 2013. This increase was driven by a Ps 78.1 billion increase in total interest income and a Ps 31.1 billion decrease in total interest expense.
Interest earned on loans increased by 7.3%, or Ps 53.6 billion, to Ps 785.7 billion for the year ended December 31, 2013 as compared to the year ended December 31, 2012. The increase was mainly driven by a 13.1%, or Ps 701.6 billion, increase in Banco AV Villas’ average interest-bearing loan portfolio to Ps 6,057.3 billion as of December 31, 2013, which resulted in an increase of Ps 91.0 billion in interest income on loans, and a decrease in the average yield on loans from 13.7% for the year ended December 31, 2012 to 13.0% for the year ended December 31, 2013, which resulted in a Ps 37.4 billion decrease in interest income. The decrease in yields was a result of a decreasing rate environment where the average DTF rate decreased from 5.35% for the year ended December 31, 2012 to 4.24% for the year ended December 31, 2013.
Interest income from investment securities increased by 22.0%, or Ps 28.3 billion, to Ps 156.8 billion for the year ended December 31, 2013 as compared to the year ended December 31, 2012. The fixed income portfolio generated Ps 155.9 billion, or 99.4%, of Banco AV Villas’ earnings on investment securities for the year ended December 31, 2013 while the equity portfolio generated Ps 0.9 billion, or 0.6%, of total earnings from investment securities. The increase in interest income from investment securities was a result of a higher average balance of the investment portfolio, which increased by Ps 275.6 billion, or 14.8%, and a higher yield on investments which increased from 6.9% for the year ended December 31, 2012 to 7.3% for the year ended December 31, 2013.
The average yield earned on interest-earning assets decreased from 11.7% for the year ended December 31, 2012 to 11.4% for the year ended December 31, 2013, mainly driven by the decrease in the average yield on loans described above.
Total interest expense decreased by 12.3%, or Ps 31.1 billion, to Ps 223.0 billion for the year ended December 31, 2013 as compared to the year ended December 31, 2012. This decrease was mainly driven by a Ps 16.8 billion decrease in interest expense on time deposits, a Ps 8.8 billion decrease in interest expense on interbank and overnight funds, a Ps 3.0 billion decrease in interest expense on borrowings from banks and others, and a Ps 2.3 billion decrease in interest expense on savings deposits.
The Ps 16.8 billion decrease in interest expense on time deposits was mainly driven by a decrease in the average interest rate paid from 5.5% for the year ended December 31, 2012 to 4.7% for the year ended December 31, 2013. The 81 basis points decrease in the cost of these funds, which resulted in a Ps 18.8 billion decrease in interest expense from time deposits, was mainly a result of a 111 basis points decrease in the average DTF rate from 5.35% for the year in December 31, 2012 to 4.24% for the year ended December 2013. Partially offsetting this decrease in interest expense was a 1.8%, or Ps 43.0 billion, increase in the average balance of time deposits which resulted in a Ps 2.0 billion increase in interest expense.
The decrease in interest expense on interbank and overnight funds of Ps 8.8 billion was mainly driven by a 198 basis points decrease in the average interest rate paid from 4.9% for the period ended December 31, 2012 to 2.9% for the period ended December 31, 2013, and resulted in a Ps 11.5 billion decrease in interest expense. Partially offsetting this decrease in interest expense was a 16.2%, or Ps 94.4 billion, increase in the average balance of interbank and overnight funds to Ps 677.3 billion for the year ended December 31, 2013, which resulted in a Ps 2.8 billion increase in interest expense. As in the case of time deposits, the decrease in the cost of interbank and overnight funds was driven by a decreasing interest rate environment.
The Ps 3.0 billion decrease in interest expense on borrowings from banks and others was driven by a decrease in the average interest rate paid on those funds which decreased from 6.8% for the year ended December 31, 2012 to 5.0% for the year ended December 31, 2013, resulting in a decrease of Ps 1.8 billion in interest expense. Also contributing to the decrease in interest expense was a decrease in the average balance of borrowings from banks and others from Ps 101.8 billion in 2012 to Ps 78.8 billion in 2013 resulting in a Ps 1.2 billion decrease in interest expense.
The decrease in interest expense on savings deposits of Ps 2.3 billion was mainly driven by a 45 basis points decrease in the average interest rate paid from 2.6% for the period ended December 31, 2012 to 2.1% for the period ended December 31, 2013, which resulted in a Ps 15.3 billion decrease in interest expense. Partially offsetting this decrease in interest expense was an 18.0%, or Ps 612.7 billion, increase in the average balance of savings deposits to
Ps 4,012.3 billion for the year ended December 31, 2013, which resulted in a Ps 12.9 billion increase in interest expense.
The average rate paid on interest-bearing liabilities decreased from 3.9% for the year ended December 31, 2012 to 3.0% for the year ended December 31, 2012, which was consistent with the above-mentioned decreasing rate environment.
Average total interest-earning assets for the year ended December 31, 2013 compared to the year ended December 31, 2012 increased by 12.3%, or Ps 907.2 billion, and net interest income by 17.8%, which resulted in an increase in the net interest margin from 8.3% for the year ended December 31, 2012 to 8.7% for the year ended December 31, 2013. The interest spread between the average rate on loans and financial leases and the average rate paid on deposits was 9.9% for both 2013 and 2012.
Provisions
Total net provisions increased Ps 45.3 billion in 2013, from Ps 88.0 billion for the year ended December 31, 2012 to Ps 133.3 billion for the year ended December 31, 2013. This increase was primarily driven by a Ps 38.8 billion increase in net provisions for loan losses, from Ps 109.2 billion for the year ended December 31, 2012 to Ps 148.0 billion for the year ended December 31, 2013. The increase in net provisions for loan losses was driven by (i) an increase in the average volume of loans and (ii) a deterioration in the credit quality of the loan portfolio, as Banco AV Villas’ delinquency ratio (measured as loans at least 30 days past due as a percentage of total gross loans) increased from 3.7% as of December 31, 2012 to 3.8% as of December 31, 2013, driven by a deterioration in the delinquency ratio of consumer loans from 4.8% in 2012 to 5.3% in 2013.
Charge-offs increased from Ps 101.6 billion for the year ended December 31, 2012 to Ps 103.6 billion for the year ended December 31, 2013 and the ratio of charge-offs to average loans improved from 1.9% to 1.7% as of December 31, 2012 and 2013, respectively. Since Banco AV Villas’ net provisions for loan and financial lease losses increased, in absolute terms, more than the increase in charge-offs, the allowance for loan losses increased from Ps 251.2 billion as of December 31, 2012 to Ps 295.6 billion as of December 31, 2013. As of December 31, 2013 Banco AV Villas coverage over its past due loans increased from 116.9% in 2012 to 118.2% in 2013.
The recovery of charged-off assets decreased between the year ended December 31, 2012 and the year ended December 31, 2013 by Ps 4.1 billion to Ps 23.0 billion due to a decrease in the volume of charged-off loans subject to recovery.
Net provisions for foreclosed assets and other assets increased by Ps 1.5 billion to a net expense of Ps 0.7 billion for the year ended December 31, 2013 due to a combination of higher provision expense of Ps 1.1 billion and lower reversals of provisions of Ps 0.4 billion.
Net provisions for accrued interest and other receivables increased by Ps 1.0 billion to a net expense of Ps 7.7 billion for the year ended December 31, 2013 from Ps 6.7 billion for the same period in 2012.
Total Fees and Other Services Income, Net
|
Year ended
December 31,
|
Change,
December 2013
vs. December 2012
|
|||||||||||||||
|
2013
|
2012
|
# |
%
|
|||||||||||||
|
(in Ps billions)
|
||||||||||||||||
|
Fees and other services income:
|
||||||||||||||||
|
Commissions from banking services
|
150.1 | 149.8 | 0.3 | 0.2 | ||||||||||||
|
Branch network services
|
– | – | – | – | ||||||||||||
|
Credit card merchant fees
|
16.3 | 13.6 | 2.8 | 20.5 | ||||||||||||
|
Checking fees
|
7.7 | 7.9 | (0.3 | ) | (3.2 | ) | ||||||||||
|
Warehouse services
|
– | – | – | – | ||||||||||||
|
Fiduciary activities
|
– | – | – | – | ||||||||||||
|
Pension plan administration
|
– | – | – | – | ||||||||||||
|
Other
|
58.2 | 45.3 | 13.0 | 28.6 | ||||||||||||
|
Total fees and other services income
|
232.3 | 216.5 | 15.8 | 7.3 | ||||||||||||
|
Fees and other services expenses
|
(66.7 | ) | (57.1 | ) | 9.6 | 16.9 | ||||||||||
|
Total fees and other services income, net
|
165.6 | 159.4 | 6.2 | 3.9 | ||||||||||||
Total fees and other services income, net increased by 3.9%, or Ps 6.2 billion, to Ps 165.6 billion for the year ended December 31, 2013. This was primarily due to a Ps 13.0 billion increase in other fees which includes fees received from disbursing social security payments and a Ps 2.8 billion in credit card and merchant fees. This increase was partially offset by a Ps 9.6 billion increase in fees and other services expenses.
Other Operating Income
|
Year ended
December 31,
|
Change,
December 2013
vs. December 2012
|
|||||||||||||||
|
2013
|
2012
|
# |
%
|
|||||||||||||
|
(in Ps billions)
|
||||||||||||||||
|
Foreign exchange gains (losses), net
|
1.4 | (0.5 | ) | 1.9 | 358.3 | |||||||||||
|
Gains on derivative operations, net
|
(0.5 | ) | 1.5 | (2.0 | ) | (132.6 | ) | |||||||||
|
Gains on sales of investments in equity securities, net
|
– | – | – | – | ||||||||||||
|
Income from non-financial sector, net
|
– | – | – | – | ||||||||||||
|
Dividend income
|
5.1 | 3.3 | 1.8 | 56.8 | ||||||||||||
|
Other
|
0.0 | 0.0 | (0.0 | ) | (78.2 | ) | ||||||||||
|
Other operating income
|
6.0 | 4.2 | 1.8 | 41.2 | ||||||||||||
Total other operating income increased by Ps 1.8 billion to Ps 6.0 billion for the year ended December 31, 2013. This increase was mainly driven by an increase in dividend income received from Banco AV Villas’ investment in Redeban, a clearing house in Colombia.
Operating Expenses
|
Year ended
December 31,
|
Change,
December 2013
vs. December 2012
|
|||||||||||||||
|
2013
|
2012
|
# |
%
|
|||||||||||||
|
(in Ps billions)
|
||||||||||||||||
|
Salaries and employee benefits
|
(157.6 | ) | (152.5 | ) | 5.1 | 3.4 | ||||||||||
|
Bonus plan payments
|
(1.7 | ) | (1.2 | ) | 0.5 | 40.9 | ||||||||||
|
Termination payments
|
(0.5 | ) | (0.4 | ) | 0.1 | 13.5 | ||||||||||
|
Administrative and other expenses
|
(280.7 | ) | (263.7 | ) | 17.0 | 6.5 | ||||||||||
|
Deposit security, net
|
(21.3 | ) | (15.5 | ) | 5.7 | 36.9 | ||||||||||
|
Charitable and other donation expenses
|
(0.5 | ) | (0.8 | ) | (0.3 | ) | (36.9 | ) | ||||||||
|
Depreciation
|
(20.3 | ) | (21.6 | ) | (1.3 | ) | (6.0 | ) | ||||||||
|
Goodwill amortization
|
– | – | – | – | ||||||||||||
|
Total operating expenses
|
(482.6 | ) | (455.7 | ) | 26.9 | 5.9 | ||||||||||
Total operating expenses for the year ended December 31, 2013 increased by 5.9% or Ps 26.9 billion to Ps 482.6 billion. Administrative and other expenses increased by Ps 17.0 billion to Ps 280.7 billion, principally driven by the organic growth of the business and particularly due to Banco AV Villas’ larger loan portfolio. Salaries and employee benefits increased by Ps 5.1 billion, or 3.4%, to Ps 157.6 billion, partially explained by the growth in the number of Banco AV Villas’ employees from 6,211 on December 31, 2012 to 6,517 on December 31, 2013. On a per employee basis, salary and employee benefits decreased by 1.5%.
Deposit security expense, net (representing Colombian mandatory deposit insurance) increased by Ps 5.7 billion, mainly due to an increase in the average balance of deposits in 2013. As Banco AV Villas’ total operating expenses before depreciation and goodwill amortization grew by 6.5%, while its operating income before net provisions increased by 15.1%, Banco AV Villas’ efficiency ratio improved for the year ended December 31, 2013 as compared to the year ended December 31, 2012 from 55.8% to 51.6%. The ratio of annualized operating expenses before depreciation and goodwill amortization as a percentage of average assets also showed an improvement from 5.2% for the year ended December 31, 2012 to 5.0% for the year ended December 31, 2013.
Non-Operating Income (Expense)
Total non-operating income (expense) decreased by Ps 13.0 billion to Ps 3.2 billion for the year ended December 31, 2013. This decrease was driven by a Ps 8.9 billion decrease in non-operating income and an increase of Ps 4.1 billion in non-operating expenses.
The decrease in non-operating income during the year ended December 31, 2013 was principally due to higher reversals of other provisions for the year ended December 31, 2012 of Ps 5.3 billion related to taxes and deposit security, and a gain from the sale of property plant and equipment of Ps 1.2 billion recorded in the year ended December 31, 2012.
The increase in non-operating expense was mainly driven by higher expenses related to fines, penalties and casualties of Ps 2.4 billion for the year ended December 31, 2013 as compared to the year ended December 31, 2012. Also contributing to this increase was a higher loss of Ps 1.3 billion in the recovery of charged-off assets during 2013 as compared to 2012.
Income Tax Expense
Income tax expense increased by Ps 18.4 billion to Ps 96.4 billion for the year ended December 31, 2013 primarily due to higher income before income tax expense and non-controlling interest. Banco AV Villas’ effective tax rate increased from 31.1% for the year ended December 31, 2012 to 34.1% for the year ended December 31, 2013, driven by change in the Colombian tax system as a result of the 2012 Tax Reform, which came into effect in 2013 (see “Item 4. Information on the Company—B. Business Overview—Supervision and regulation—Regulation on Payroll Loans—2012 Tax Reform”).
Non-Controlling Interest
Banco AV Villas’ non-controlling interest, responsible for only 0.01% of its net income before non-controlling interest for the year ended December 31, 2013, decreased from Ps 0.21 billion for year ended December 31, 2012 to Ps 0.01 billion for year ended December 31, 2013. Banco AV Villas’ non-controlling interest reflects other Grupo Aval banks’ ownership in A Toda Hora S.A. by other subsidiaries of Grupo Aval.
U.S. GAAP Reconciliation
We prepare our financial statements in accordance with Colombian Banking GAAP, which differs in significant respects from U.S. GAAP. Our net income attributable to Grupo Aval shareholders, in accordance with Colombian Banking GAAP, was Ps 1,668.7 billion, Ps 1,600.5 billion and Ps 1,526.4 billion for the years ended December 31, 2014, 2013 and 2012, respectively. Under U.S. GAAP, we would have reported a net income attributable to Grupo Aval shareholders of Ps 1,854.9 billion, Ps 1,632.5 billion and Ps 1,564.5 billion for the years ended December 31, 2014, 2013 and 2012, respectively.
The following items generated the most significant differences between Colombian Banking GAAP and U.S. GAAP in determining net income and shareholders’ equity:
|
|
·
|
Equity tax;
|
|
|
·
|
Consolidation of Promigas
|
|
|
·
|
Allowance for loans, lease losses and foreclosed assets;
|
|
|
·
|
Reappraisal of assets;
|
|
|
·
|
Deferred income taxes;
|
|
|
·
|
Cumulative translation adjustment; and
|
|
|
·
|
Business combination.
|
For a discussion of the principal differences between Colombian Banking GAAP and U.S. GAAP as they relate to our financial statements and a reconciliation of net income in 2014, 2013 and 2012 and shareholders’ equity at December 31, 2014 and 2013, see note 30 to our audited consolidated financial statements.
Critical Accounting Policies under U.S. GAAP
Allowance for Loan Losses
Under U.S. GAAP, we consider loans to be impaired when it is probable that all amounts of principal and interest will not be collected according to the contractual terms of the loan agreement. Pursuant to Accounting Standards Codification, or “ASC”, Subtopic 310-10, “
Accounting by Creditors for Impairment of a Loan
”, the allowance for significant impaired loans is assessed based on the present value of estimated future cash flows discounted at the current effective loan rate or the fair value of the collateral in the case where the loan is considered collateral-dependent. An allowance for impaired loans is provided when discounted future cash flows or collateral fair value is lower than book value.
In addition, if necessary, a collective allowance for loan losses is established for individual loans, based on recent loss experience, credit scores, the risk characteristics of the various classifications of loans and other factors directly influencing the potential collectability and affecting the quality of the loan portfolio.
To calculate the allowance required for smaller-balance impaired loans, we perform an analysis of historical losses from our loan portfolios in order to estimate losses for U.S. GAAP purposes resulting from loan losses that had been incurred in such loan portfolios at the balance sheet date but which had not been individually identified. Loss estimates are analyzed by loan type and for homogeneous groups of clients. Such historical ratios are updated to incorporate the most recent data reflecting current economic conditions, industry performance trends, geographic or obligor concentrations within each portfolio segment, and any other pertinent information that may affect the estimation of the allowance for loan losses.
Many factors can affect our estimates of allowance for loan losses, including volatility of default probability, migrations and estimated loss severity.
A 10% decrease in the expected cash flows of significant impaired loans individually analyzed, could result in an additional impairment of approximately Ps 177.1 billion.
A 10% increase in the historical loss ratios for loans collectively analyzed could result in an additional impairment of approximately Ps 152.4 billion.
These sensitivity analyses do not represent our management’s expectations of the deterioration in risk ratings or the increases in loss rates but are provided as hypothetical scenarios to assess the sensitivity of the allowance for loan and lease losses to changes in key inputs. We believe the risk ratings and loss severities currently in use are appropriate and that the probability of a downgrade of one level of the internal risk ratings for commercial loans and leases within a short period of time is remote.
The allowance for loan losses, which includes the allowance for loan and lease losses and the reserve for unfunded lending commitments, represents management’s estimate of probable losses inherent in our loan portfolio excluding those loans accounted for under the fair value option.
We consider accounting estimates related to loan provisions part of our critical accounting policies because the assumptions and estimates utilized to calculate future estimated losses require a high degree of judgment. It is possible that others, given the same information, may at any point in time reach different reasonable conclusions.
Contingencies
Under U.S. GAAP, ASC 450, “
Accounting for Contingencies
,” provides guidance for recording contingencies. Under ASC 450, there are three levels of assessment of contingent events: probable, reasonably possible and remote. The term “probable” in ASC 450 is defined as “the future event or events are likely to occur.” The term “reasonably possible” is defined as “the chance of the future event or events occurring is more than remote but less than likely.” In addition, the term “remote” is defined as “the chance of the future event or events occurring is slight.”
Under ASC 450, an estimated loss related to a contingent event is to be accrued by a charge to income if both of the following conditions are met:
|
|
·
|
information available prior to issuance of the financial statements indicates that it is probable that an asset had been impaired or a liability had been incurred at the date of the financial statements; and
|
|
|
·
|
the amount of loss can be reasonably estimated.
|
The amount recorded is an estimate of the amount of loss at the date of the financial statements. If the contingent event is evaluated to be reasonably possible, no provision for the contingent event may be made, but disclosure of the event is required.
We consider contingencies to be part of our critical accounting policies because of the high degree of judgment and assumptions involved in developing and applying valuation methodologies.
Fair Value Estimates
A portion of our assets are carried at fair value, including trading and available for sale securities, derivatives, asset-backed securities, loans, short-term borrowings and long-term debt to meet client needs and to manage liquidity needs and market risk. We determine the fair values of financial instruments based on the fair value hierarchy under applicable accounting guidance which requires an entity to maximize the use of observable inputs and minimize the use of unobservable inputs when measuring fair value. Applicable accounting guidance establishes three levels of inputs used to measure fair value.
ASC Subtopic 820-10, “
Fair Value Measurements
,” defines fair value as the price that would be received to sell an asset or paid to transfer a liability in an orderly transaction between market participants at the measurement date. ASC Subtopic 820-10, “
Financial Investments
,” among other things, requires Grupo Aval to maximize the use of observable inputs and minimize the use of unobservable inputs when measuring fair value.
In addition, ASC 825-10 provides an option to elect fair value as an alternative measurement for selected financial assets, financial liabilities, unrecognized firm commitments and written loan commitments not previously recorded at fair value. Under ASC 825-10, fair value is used for both the initial and subsequent measurement of the designated assets, liabilities and commitments, with the changes on fair value recognized in net income. As a result of ASC 825-10 analysis we have not elected to apply fair value accounting for any of its financial instruments not previously carried at fair value.
We consider fair value estimates to be part of our critical accounting policies because of the high degree of judgment and assumptions involved in developing and applying valuation methodologies.
Fair Value Hierarchy
ASC 820-10 establishes a three-level valuation hierarchy for disclosure of fair value measurements. The valuation hierarchy is based upon the transparency of inputs to the valuation of an asset or liability as of the measurement date. The three levels are defined as follows:
|
|
·
|
Level 1: inputs to the valuation methodology are quoted prices (unadjusted) for identical assets or liabilities in active markets.
|
|
|
·
|
Level 2: inputs to the valuation methodology include quoted prices for similar assets and liabilities in active markets, and inputs that are observable for the asset or liability, either directly or indirectly, for substantially the full term of the asset or liability.
|
|
|
·
|
Level 3: inputs to the valuation methodology are unobservable and significant to the fair value measurement.
|
Inputs include the following:
|
|
·
|
quoted prices for similar assets or liabilities in active markets;
|
|
|
·
|
quoted prices for identical or similar assets or liabilities in non-active markets;
|
|
|
·
|
pricing models whose inputs are observable for substantially the full term of the asset or liability; and
|
|
|
·
|
pricing models whose inputs are derived principally from or corroborated by observable market data through correlation or other means.
|
A financial instrument’s categorization within the valuation hierarchy is based upon the lowest level of input that is significant to the fair value measurement.
Determination of Fair Value
Fair value is based upon quoted market prices, where available. If listed prices or quotes are not available, fair value is based upon internally developed models that use primarily market-based or independently sourced market parameters, including interest rate yield curves, option volatilities and currency rates. Valuation adjustments may be made to ensure that financial instruments are recorded at fair value. These adjustments include amounts to reflect counterparty credit quality, the creditworthiness of our bank subsidiaries, liquidity and unobservable parameters that are applied consistently over time.
We consider that the accounting estimates related to the valuation of financial instruments, including derivatives, where quoted market prices are not available to be part of our critical accounting policies. These types of instruments are highly susceptible to change and require management to make assumptions about interest rates, volatility, exchange rates, the credit rating of the counterparty, valuation adjustments and specific features of the transactions.
We believe these valuation methods are appropriate and consistent with other market participants. The use of different methodologies or assumptions, to determine the fair value of certain financial instruments could result in a different estimate of fair value at the reporting date.
Other-than-Temporary Impairment
Under U.S. GAAP, certain debt securities, including those securities issued or secured by the Colombian government, Colombian government entities or foreign governments, were classified as available for sale securities, and therefore, carried at fair value with changes in the fair value reflected in other comprehensive income for the years ended December 31, 2013 and 2012.
ASC Subtopic 320, “
Investments—Debt and Equity Securities
,” establishes a new method of recognizing and reporting other-than-temporary impairments of debt securities. Impairment is now considered to be other-than-temporary if an entity:
|
|
·
|
intends to sell the security;
|
|
|
·
|
is more likely than not to be required to sell the security before recovering its cost; or
|
|
|
·
|
does not expect to recover the security’s entire amortized cost basis (even if the entity does not intend to sell)—that is, a “credit loss.”
|
This credit loss is based on the present value of cash flows expected to be collected from the debt security. If a credit loss exists but an entity does not intend to sell the impaired debt security and it is likely that it will not be required to sell before recovery, the impairment is other-than-temporary. It should, therefore, be separated into:
|
|
·
|
the estimated amount relating to the credit loss; and
|
|
|
·
|
all other changes in fair value.
|
Only the estimated credit loss amount is recognized in profit or loss and the remaining change in fair value is recognized in “Other comprehensive income.” This approach more closely aligns the impairment models for debt securities and loans by reflecting only credit losses as impairment in profit and loss.
The fair value of debt securities was determined on the balance sheet date, based primarily on the quoted market price, and in limited cases, bond valuation models are used. These models take into consideration certain assumptions in estimating future cash flows and a rate under which the cash flows are discounted.
At December 31, 2014 and 2013 the amortized cost exceeded the fair value of these securities. Nevertheless, we have determined, for U.S. GAAP purposes, that unrealized losses on these securities are temporary in nature based on our ability and intent to hold the investment for a period of time sufficient to allow for any anticipated recovery and the results of our review conducted to identify and evaluate investments that have indications of possible impairments.
Impairment of Goodwill and Intangibles Recognized upon Business Combinations
At least annually, we test goodwill and intangibles recognized upon business combinations for impairment. We use a two-step process: (1) we screen for potential impairment using an estimation of the fair value of the reporting unit and (2) we measure the amount of impairment, if any. Management determines fair value either by reference to market value, if available, by a pricing model or with the assistance of a qualified evaluator. Any determination of fair value through a pricing model or by a qualified evaluator requires management to make assumptions and use estimates. In certain circumstances, the requirement to test goodwill for impairment annually can be satisfied without a remeasurement of the fair value of a reporting unit.
The estimated fair value of the reporting unit is highly sensitive to changes in these estimates and assumptions; therefore, in some instances, changes in these assumptions could impact whether the fair value of a reporting unit is greater than its carrying value. We perform sensitivity analyses around these assumptions in order to assess the reasonableness of the assumptions and the resulting estimated fair values. Ultimately, future potential changes in these assumptions may impact the estimated fair value of a reporting unit and cause the fair value of the reporting unit to be below its carrying value.
We consider the accounting practice of impairment testing to be part of our critical accounting policies because it involves a significant degree of estimates and assumptions that must be considered and due to the fact that valuation models are highly sensitive to changes in these assumptions and estimates.
Recognition and Measurement of Intangibles Recognized upon Business Combinations
Under U.S. GAAP, we use the purchase accounting method of to account for businesses we have acquired. This requires us to record the assets acquired and liabilities assumed at their respective fair values at the date of acquisition. This process requires us to make certain estimates and assumptions, in particular concerning the fair values of the acquired intangible assets and property, plant and equipment, and the liabilities assumed at the date of the acquisition. We also base our determination of the useful lives of the acquired intangible assets, property, plant and equipment base our determination of judgments as to purchase price allocation can materially impact our future results; therefore, for large acquisitions, we may obtain purchase price allocations from third-parties. We use different valuation methodologies for each intangible asset and base our valuation on information available at the acquisition date.
We consider these recognitions and measurements of intangibles to be part of our critical accounting policies because of the high level of estimation and assumptions that must be made.
Pension Plans
Under U.S. GAAP, specifically ASC 715-30, “
Defined Benefit Plans—Pension
,” pension plan actuarial valuation is determined annually based on the projected unit credit method and is based on actuarial, economic and demographic assumptions about future events.
We consider the accounting estimates related to our pension plans to be part of our critical accounting policies as the amounts contributed to the plans involve certain assumptions and determinations made by our actuaries relating to, among others, future macroeconomic and employee demographics factors, which will not necessarily coincide with the future outcome of such factors.
Deferred Income Tax Assets and Liabilities
Income taxes are accounted for under the asset and liability method. Deferred income tax assets and liabilities are recorded for the estimated future tax effects of temporary differences between the carrying amounts of assets and liabilities recorded for accounting and tax reporting purposes and for the future tax effects of net operating loss carryforwards. Deferred tax assets and liabilities are measured using enacted tax rates expected to apply to taxable income in the years in which those temporary differences are expected to be recovered or settled. The effect on deferred tax assets and liabilities of a change in tax rates is recognized in income in the period that includes the enactment date. We recognize a valuation allowance for a deferred tax asset if it is more likely than not that some portion or all of the deferred tax assets will not be realized. We will achieve a tax benefit only if we have sufficient taxable income in future periods against which we can apply the carryforward.
Beginning with the adoption of FASB Interpretation No. 48, “
Accounting for Uncertainty in Income Taxes (included in FASB ASC Subtopic 740 10—Income Taxes—Overall
”) on January 1, 2009, we recognize the effect of income tax positions only if those positions are more likely than not to be sustained. Recognized income tax positions are measured at the largest amount that is greater than 50% likely of being realized. Changes in recognition or measurement are reflected in the period in which the change in judgment occurs. Prior to the adoption of Interpretation 48, we recognized the effect of income tax positions only if such positions were likely to be sustained.
We review estimated future taxable income and reversals of existing temporary taxable differences in determining valuations allowances. When calculating deferred tax, we take into account our future estimates, financial statements, applicable tax legislation and interpretations of the Colombian tax authorities.
We consider the determination of deferred income tax assets and liabilities to be part of our critical accounting policies as it involves estimates of future taxable income, which can be affected, among others, by economic conditions and changes to tax regulations.
Recent U.S. GAAP pronouncements.
In January 2015, FASB issued ASU 2015-01, “Income Statement—Extraordinary and Unusual Items” to simplify the income statement presentation requirements in Subtopic 225-20 by eliminating the concept of extraordinary items. Extraordinary items are events and transactions that are distinguished by their unusual nature and by the infrequency of their occurrence. Eliminating the extraordinary classification simplifies income statement presentation by altogether removing the concept of extraordinary items from consideration. The amendments in this Update will be effective for fiscal years, and interim periods within those fiscal years, beginning after December 15, 2015. A reporting entity may apply the amendments prospectively. A reporting entity also may apply the amendments retrospectively to all prior periods presented in the financial statements. Early adoption is permitted provided that the guidance is applied from the beginning of the fiscal year of adoption.
In February 2015, the FASB issued ASU No. 2015-02, Consolidation (Topic 810). The Board issued the amendments in this Update to respond to stakeholders’ concerns about the current accounting for consolidation of certain legal entities. Current generally accepted accounting principles (GAAP) might require a reporting entity to consolidate another legal entity in situations in which the reporting entity’s contractual rights do not give it the ability to act primarily on its own behalf, the reporting entity does not hold a majority of the legal entity’s voting rights, or the reporting entity is not exposed to a majority of the legal entity’s economic benefits or obligations. The amendments in this Update affect reporting entities that are required to evaluate whether they should consolidate certain legal entities. All legal entities are subject to reevaluation under the revised consolidation model. Specifically, the amendments:
|
|
1.
|
Modify the evaluation of whether limited partnerships and similar legal entities are variable interest entities (VIEs) or voting interest entities
|
|
|
2.
|
Eliminate the presumption that a general partner should consolidate a limited partnership
|
|
|
3.
|
Affect the consolidation analysis of reporting entities that are involved with VIEs, particularly those that have fee arrangements and related party relationships.
|
|
|
4.
|
Provide a scope exception from consolidation guidance for reporting entities with interests in legal entities that are required to comply with or operate in accordance with requirements that are similar to those in Rule 2a-7 of the Investment Company Act of 1940 for registered money market funds.
|
This Update will be effective for public business entities for fiscal years, and for interim periods within those fiscal years, beginning after December 15, 2015. We are currently evaluating the impact of ASU No. 2015-02 on our consolidated financial condition and results of operations.
In November 2014, FASB issued ASU 2014-17,
“Pushdown Accounting a consensus of the FASB Emerging Issues Task Force”
to provide guidance for determining whether and at what threshold pushdown accounting should be established in an acquired entity’s separate financial statements. According to ASU 2014-16, an acquired entity may elect the option to apply pushdown accounting in the reporting period in which the change-in-control event occurs. An acquired entity should determine whether to elect to apply pushdown accounting for each individual change-in-control event in which an acquirer obtains control of the acquired entity. If pushdown accounting is not applied in the reporting period in which the change-in-control event occurs, an acquired entity will have the option to elect to apply pushdown accounting in a subsequent reporting period to the acquired entity’s most recent change-in-control event. The amendments in this Update became effective on November 18, 2014.
In
August
2014, FASB issued ASU 2014-15,
“Presentation of Financial Statements-Going Concern: Disclosure of Uncertainties about an Entity’s Ability to Continue as a Going Concern”
to provide guidance about management’s responsibility to evaluate whether there are conditions or events, considered in the aggregate, that raise substantial doubt about the entity’s ability to continue as a going concern within one year after the date that the financial statements are issued. The amendments require management to assess an entity’s ability to continue as a going concern by incorporating and expanding upon certain principles that are currently in U.S. auditing standards. Specifically, the amendments (1) provide a definition of the term substantial doubt, (2) require an evaluation every reporting period including interim periods, (3) provide principles for considering the mitigating effect of management’s plans, (4) require certain disclosures when substantial doubt is alleviated as a result of consideration of management’s plans, (5) require an express statement and other disclosures when substantial doubt is not alleviated and (6) require an assessment for a period of one year after the date that the financial statements are issued (or available to be issued). The amendments in this Update will be effective for the annual period ending after December 15, 2016, and for annual periods and interim periods thereafter. Early application is permitted.
In June 2014, FASB issued ASU 2014-11,
“Transfers and Servicing: Repurchase-to-Maturity Transactions, Repurchase Financings, and Disclosures”
to provide guidance in the accounting of the different types of repurchase agreements, specifically for Repurchase-to-maturity transactions and repurchase financing secured borrowing accounting, which is consistent with the accounting of other repurchase agreements. Formerly, repurchase-to-maturity transactions (repurchase agreements that mature at the same time as the transferred financial asset) were generally accounted for as a sale and a forward repurchase agreement when they are not considered to maintain the transferor’s effective control and they satisfied the other conditions for derecognition. In accordance with the amendments in this update, repurchase-to-maturity transactions must be accounted for as secured borrowings.
On the other hand, a repurchase financing executed contemporaneously with an initial transfer with the same counterparty generally was accounted for as a derivative if the two transactions were required to be linked in their accounting. The amendments in this update require that the repurchase agreement be accounted for as a secured borrowing separately from the initial transfer of the financial asset, which is accounted for as a sale.
Additionally, the amendments require two additional disclosures about transfers accounted for as sales in transactions that are economically similar to repurchase agreements, and the type of collateral pledged in repurchase agreements and similar transactions accounted for as secured borrowings. The accounting changes in this Update became effective for public business entities for the first interim or annual period beginning after December 15, 2014. Management does not expect any significant impact concerning the amendments introduced by ASU 2014-11 on the Bank’s financial statement and U.S. GAAP disclosures.
In January 2014, FASB issued ASU 2014-04, “Receivables—Troubled Debt Restructurings by Creditors: Reclassification of Residential Real Estate Collateralized Consumer Mortgage Loans upon Foreclosure” to clarify
when an in substance repossession or foreclosure occurs, that is, when a creditor should be considered to have received physical possession of residential real estate property collateralizing a consumer mortgage loan such that the loan receivable should be derecognized and the real estate property recognized. According to the new guidance, physical possession has been received upon either: (1) the creditor obtaining legal title to the residential real estate property upon completion of a foreclosure or (2) the borrower conveying all interest in the residential real estate property to the creditor to satisfy that loan through completion of a deed in lieu of foreclosure or through a similar legal agreement. Additionally, the amendments require interim and annual disclosure of both (1) the amount of foreclosed residential real estate property held by the creditor and (2) the recorded investment in consumer mortgage loans collateralized by residential real estate property that are in the process of foreclosure according to local requirements of the applicable jurisdiction. These amendments became effective for public business entities for annual periods, and interim periods within those annual periods, beginning after December 15, 2014.
The following table sets forth our internal and external sources of funding at December 31, 2014, 2013 and 2012.
|
At December 31,
|
||||||||||||
|
2014
|
2013
|
2012
|
||||||||||
|
Liabilities and shareholders’ equity:
|
(in Ps billions)
|
|||||||||||
|
Deposits
|
114,392.2 | 101,190.4 | 81,463.3 | |||||||||
|
Bankers’ acceptances outstanding
|
310.6 | 221.2 | 86.8 | |||||||||
|
Interbank borrowings and overnight funds
|
4,589.5 | 5,123.6 | 5,156.5 | |||||||||
|
Borrowings from banks and others
|
14,555.1 | 11,954.1 | 10,380.9 | |||||||||
|
Accounts payable
|
2,834.0 | 2,867.7 | 3,005.3 | |||||||||
|
Accrued interest payable
|
625.2 | 509.2 | 474.8 | |||||||||
|
Other liabilities
|
4,704.1 | 2,447.8 | 2,023.9 | |||||||||
|
Long-term debt (bonds)
|
12,541.0 | 11,179.7 | 9,769.0 | |||||||||
|
Estimated liabilities
|
598.2 | 593.3 | 811.7 | |||||||||
|
Non-controlling interest
|
7,368.2 | 6,472.2 | 5,407.7 | |||||||||
|
Total liabilities
|
162,518.0 | 142,559.2 | 118,579.9 | |||||||||
|
Total shareholders’ equity
|
15,096.6 | 11,728.2 | 9,083.1 | |||||||||
|
Total liabilities and shareholders’ equity
|
177,614.7 | 154,287.4 | 127,663.0 | |||||||||
Capitalization ratios
The following tables present consolidated capitalization ratios for our Colombian banking subsidiaries, Grupo Aval and our principal competitors at the dates indicated.
|
At December 31, 2014
|
||||||||||||||||||||||||||||||||||||
|
Grupo Aval entities
|
||||||||||||||||||||||||||||||||||||
|
Colombian Banking GAAP (in percentages)
|
Banco de Bogotá
|
Banco de Occidente
|
Banco Popular
|
Banco AV Villas
|
Grupo Aval aggregate (1)
|
Grupo Aval consolidated
|
Bancolombia
|
Davivienda
|
BBVA Colombia
|
|||||||||||||||||||||||||||
|
Tangible equity ratio(2)
|
10.0 | 12.3 | 15.8 | 11.7 | 11.1 | 9.8 | 9.2 | 8.3 | 8.3 | |||||||||||||||||||||||||||
|
Tier 1 ratio(3)
|
8.0 | 8.9 | 10.5 | 11.6 | 8.6 | - | 7.7 | 6.2 | 7.2 | |||||||||||||||||||||||||||
|
Solvency ratio(4)
|
11.5 | 11.8 | 12.2 | 12.6 | 11.7 | - | 13.3 | 10.9 | 10.8 | |||||||||||||||||||||||||||
Source
: Company calculations for competitors based on each entity’s respective financial statements for the period indicated that are publicly available on their websites.
|
(1)
|
Reflects the summation of calculated amounts for each line item for each of our banking subsidiaries.
|
|
(2)
|
Tangible equity ratio is calculated as total shareholders’ equity plus minority interest minus goodwill, divided by total assets minus goodwill. See “Item 3. Key Information—A. Selected financial and operating data—Non-GAAP measures reconciliation.”
|
|
(3)
|
Tier 1 ratio is calculated as primary capital divided by risk-weighted assets. Tier 1 ratio for BBVA Colombia is based on unconsolidated figures as consolidated figures are not publicly available.
|
|
(4)
|
Solvency ratio is calculated as technical capital divided by risk-weighted assets. For a definition of technical capital, see “—Supervision and regulation—Capital adequacy requirements.” The solvency ratio for Grupo Aval is calculated as the sum of
|
technical capital of our banking subsidiaries on a consolidated basis divided by the sum of risk-weighted assets of our banking subsidiaries on a consolidated basis.
Each of our banking subsidiaries is required by the Superintendency of Finance to maintain a solvency ratio of at least 9.0% of its total risk-weighted assets and a “core solvency” for Common Equity Tier 1, which requires higher quality capital and is set at a minimum of 4.5% of risk-weighted assets. As Grupo Aval is not regulated as a financial institution or bank holding company, it is not required to comply with capital adequacy regulations applicable to our banking subsidiaries. See “Item 4. Information on the Company—B. Business Overview—Supervision and regulation—Capital adequacy requirements.”
Funding
Our banking subsidiaries fund most of their assets with deposits. Other sources of funding include interbank borrowings and overnight funds, and borrowings from development banks and long-term bond issuances.
The following table summarizes the funding structure of our banks on a consolidated basis at the dates indicated.
|
At December 31,
|
||||||||||||
|
2014
|
2013
|
2012
|
||||||||||
|
(in Ps billions)
|
||||||||||||
|
Deposits
|
114,392.2 | 101,190.4 | 81,463.3 | |||||||||
|
Borrowings from banks and others
|
14,555.1 | 11,954.1 | 10,380.9 | |||||||||
|
Bankers’ acceptances outstanding
|
310.6 | 221.2 | 86.8 | |||||||||
|
Interbank borrowings and overnight funds
|
4,589.5 | 5,123.6 | 5,156.5 | |||||||||
|
Long-term debt (bonds)
|
12,541.0 | 11,179.7 | 9,769.0 | |||||||||
|
Total funding
|
146,388.3 | 129,669.0 | 106,856.5 | |||||||||
In 2014, total funding increased by 12.9 percentage points from the same period in 2013, mainly as a result of an increase in deposits, borrowings from bank and others, and long-term debt. In 2013, total funding increased by 21.3 percentage points from the same period in 2012, mainly as a result of an increase in deposits.
From year-end 2013 to year-end 2014, borrowings from banks and others and deposits as a percentage of total funding increased by 0.7 and 0.1 percentage points, respectively. Interbank and overnight funds, and long-term debt decreased as a percentage of total funding by 0.8 and 0.1 percentage points, respectively.
From year-end 2012 to year-end 2013, deposits and bankers’ acceptances outstanding increased by 1.8 and 0.1 percentage points, respectively, while interbank and overnight funds, long-term debt and borrowings from banks and others decreased as a percentage of total funding by 0.9, 0.5 and 0.5 percentage points, respectively.
Our Colombian funding base also benefits from the highest available local credit ratings for each of our banking subsidiaries and each of Porvenir and Corficolombiana, as assigned by BRC Investor Services S.A. S.C.V., an affiliate of Moody’s Investors Services, Inc., or “Moody’s.” Banco Popular and Banco AV Villas have also achieved the highest available local credit ratings as assigned by Value and Risk Rating S.A. S.C.V. In addition, Banco de Bogotá’s 5.00% Senior Notes due 2017 received international ratings of Baa2 by Moody’s, BBB- by Fitch Ratings, or “Fitch,” and BBB- by Standard & Poor’s Ratings Services at issuance, and Grupo Aval Limited’s 5.25% Senior Notes due 2017 and 4.75% Senior Notes due 2022 received international ratings of Baa3 by Moody’s and BBB- by Fitch each at issuance. Further Banco de Bogotá’s 5.375% Subordinated Notes due 2023 received international ratings of Baa3 by Moody’s and BBB- by Fitch at issuance. Any adverse change in credit ratings may increase the cost of our funding. See “Item 3. Key Information—D. Risk factors—Risks relating to our businesses and industry—Risks relating to our banking business—Downgrades in our long-term credit ratings or in the credit ratings of our banking subsidiaries would increase the cost of, or impair access to, funding.”
In September 2014, we completed an SEC-registered initial public offering in the United States of 93,703,703 ADSs, each representing 20 preferred shares, raising U.S.$1.3 billion in net proceeds. In January 2014, we completed our third public offering of common shares pursuant to a preemptive rights offering in Colombia, raising Ps 2.4 trillion (U.S.$1.3 billion).
We financed Banco de Bogotá’s recent Central American acquisitions through (i) an equity injection of U.S.$500 million from Banco de Bogotá to LB Panamá, (ii) a U.S.$282 million securitization of certain credit card inflows by BAC Credomatic due November 2020, and (iii) a short term loan of U.S.$250 million from Citibank N.A. expiring on November 29, 2014, which was replaced on April 16, 2014 with part of the net proceeds of a U.S.$350 million securitization of certain of BAC Credomatic’s credit card inflows, due October 2021.
We believe that our working capital is sufficient to meet the company’s present requirements and that the current level of funding of each of our banks is adequate to support its business.
The following table presents our consolidated funding from deposits at the dates indicated.
|
At December 31,
|
||||||||||||
|
2014
|
2013
|
2012
|
||||||||||
|
(in Ps billions)
|
||||||||||||
|
Interest-bearing deposits:
|
||||||||||||
|
Checking accounts
|
13,192.2 | 10,328.1 | 8,249.6 | |||||||||
|
Time deposits
|
41,858.6 | 32,739.2 | 26,865.0 | |||||||||
|
Savings deposits
|
42,283.1 | 42,479.6 | 33,545.9 | |||||||||
|
Total
|
97,333.8 | 85,546.9 | 68,660.5 | |||||||||
|
Non-interest-bearing deposits:
|
||||||||||||
|
Checking accounts
|
15,598.6 | 14,555.6 | 11,852.8 | |||||||||
|
Other deposits
|
1,459.8 | 1,087.9 | 950.0 | |||||||||
|
Total
|
17,058.4 | 15,643.5 | 12,802.8 | |||||||||
|
Total deposits
|
114,392.2 | 101,190.4 | 81,463.3 | |||||||||
Checking accounts
. Our consolidated balance of checking accounts was Ps 28,790.8 billion at December 31, 2014, Ps 24,883.7 billion at December 31, 2013 and Ps 20,102.4 billion at December 31, 2012, representing 19.7%, 19.2% and 18.8% of total funding, respectively.
Time deposits
. Our consolidated balance of time deposits was Ps 41,858.6 billion at December 31, 2014, Ps 32,739.2 billion at December 31, 2013 and Ps 26,865.0 billion at December 31, 2012, representing 28.6%, 25.2% and 25.1% of total funding, respectively.
The following tables present time deposits held at December 31, 2014, by amount and maturity for deposits.
|
At December 31, 2014
|
||||||||||||
|
Peso-denominated
|
Foreign currency-denominated
|
Total
|
||||||||||
|
(in Ps billions)
|
||||||||||||
|
Up to 3 months
|
7,264.4 | 6,277.8 | 13,542.2 | |||||||||
|
From 3 to 6 months
|
2,645.7 | 3,081.2 | 5,726.9 | |||||||||
|
From 6 to 12 months
|
3,953.6 | 4,364.4 | 8,318.0 | |||||||||
|
More than 12 months
|
6,971.0 | 2,494.4 | 9,465.4 | |||||||||
|
Time deposits less than U.S.$100,000(1)
|
3,147.4 | 1,658.7 | 4,806.2 | |||||||||
|
Total
|
23,982.0 | 17,876.6 | 41,858.6 | |||||||||
|
(1)
|
Equivalent to Ps 239.2 million at the representative market rate at December 31, 2014 of Ps 2,392.46 per U.S.$1.00.
|
Savings deposits
. Our consolidated balance of savings deposits was Ps 42,283.1 billion at December 31, 2014, Ps 42,479.6 billion at December 31, 2013 and Ps 33,545.9 billion at December 31, 2012, representing 28.9%, 32.8% and 31.4% of total funding requirements, respectively, in each of those years.
Other deposits
. Our consolidated balance of other deposits, which consist of deposits from correspondent banks, cashier checks and collection services, was Ps 1,459.8 billion at December 31, 2014, Ps 1,087.9 billion at December 31, 2013 and Ps 950.0 billion at December 31, 2012, representing 1.0%, 0.8% and 0.9%, respectively.
Interbank borrowings and overnight funds
. Our consolidated balance of interbank borrowings and overnight funds was Ps 4,589.5 billion at December 31, 2014, Ps 5,123.6 billion at December 31, 2013 and Ps 5,156.5 billion at December 31, 2012, representing 3.1%, 4.0% and 4.8% of total funding requirements, respectively.
The following table sets forth our short-term borrowings consisting of interbank borrowings for the periods indicated.
|
At December 31,
|
||||||||||||||||||||||||
|
2014
|
2013
|
2012
|
||||||||||||||||||||||
|
Amount
|
Nominal rate
|
Amount
|
Nominal rate
|
Amount
|
Nominal rate
|
|||||||||||||||||||
|
(in Ps billions, except percentages)
|
||||||||||||||||||||||||
|
Short-term borrowings
|
||||||||||||||||||||||||
|
Interbank borrowings and overnight funds
|
||||||||||||||||||||||||
|
End of period
|
4,589.5 | – | 5,123.6 | – | 5,156.5 | – | ||||||||||||||||||
|
Average during period
|
5,956.9 | 3.1 | % | 5,588.4 | 2.9 | % | 5,269.7 | 4.3 | % | |||||||||||||||
|
Maximum amount of borrowing at any month-end
|
7,176.0 | – | 7,004.7 | – | 8,323.7 | – | ||||||||||||||||||
|
Interest paid during the period
|
184.9 | – | 160.8 | – | 228.3 | – | ||||||||||||||||||
As part of their interbank transactions, our banks maintain a portfolio of government securities and private sector liquid debt instruments used to obtain overnight funds from other financial institutions or investment funds by selling such securities and simultaneously agreeing to repurchase them. Due to the short-term nature of this source of funding, these transactions are volatile and are generally composed of Colombian government securities.
Borrowings from banks and others
. Borrowings from banks are provided by correspondent banks and by governmental entities to promote lending to specific sectors of the Colombian economy. This funding, which mainly has fully matched maturities and interest rates with related loans, totaled Ps 14,555.1 billion at December 31, 2014, Ps 11,954.1 billion at December 31, 2013 and Ps 10,380.9 billion at December 31, 2012, representing 9.9%, 9.2% and 9.7% of total funding requirements, respectively.
Bankers’ acceptances outstanding
. The consolidated outstanding balances of our bankers’ acceptances was Ps 310.6 billion at December 31, 2014, Ps 221.2 billion at December 31, 2013 and Ps 86.8 billion at December 31, 2012, representing 0.2%, 0.2% and 0.1% of total funding, respectively.
Bonds
. We issue bonds in the Colombian and international markets. Our consolidated balance of bonds outstanding was Ps 12,541.0 billion at December 31, 2014, Ps 11,179.7 billion at December 31, 2013 and Ps 9,769.0 billion at December 31, 2012, representing 8.6%, 8.6% and 9.1%, respectively. On February 1, 2012, Grupo Aval Limited issued U.S.$600.0 million (Ps 1,083.6 billion at the date of the issuance) of 5.25% Senior Notes due 2017 and on September 26, 2012, Grupo Aval Limited issued U.S.$1.0 billion (Ps 1,795.7 billion at the date of the issuance) 4.75% Senior Notes due 2022.
The following bond issuances were placed in the market in 2014:
|
Issuer (in Ps billions)
|
Issuance date
|
Amount
|
Expiration date
|
Interest rate
|
|||||
|
Banco de Occidente
|
2014
|
350.0
|
May 2017 to May 2024
|
IBR+1.39% to ICP+3.70% to ICP+4.00%
|
|||||
|
Banco Popular
|
2014
|
335.5
|
May 2016 to May 2017
|
IBR+1.26% to IBR+1.35%
|
|||||
|
BAC Credomatic Honduras
|
2014
|
37.6
|
December 2015 to October 2017
|
5.50% to 14.08%
|
|||||
|
BAC Credomatic El Salvador
|
2014
|
206.7
|
July 2014 to October 2019
|
4.00% to 5.80%
|
|||||
|
BAC Credomatic Guatemala
|
2014
|
329.5
|
February 2015 to June 2016
|
4.65% to 8.50%
|
|||||
|
BAC Credomatic Nicaragua
|
2014
|
11.2
|
October 2015 to November 2017
|
5.00% to 5.25%
|
|||||
Banco de Bogotá
The following table presents the composition of Banco de Bogotá’s funding at the dates indicated.
|
Year ended December 31,
|
||||||||||||||||||||||||
|
2014
|
2013
|
2012
|
||||||||||||||||||||||
|
(in Ps billions)
|
%
|
(in Ps billions)
|
%
|
(in Ps billions)
|
%
|
|||||||||||||||||||
|
Checking accounts
|
20,276.0 | 21.2 | 16,591.1 | 20.0 | 13,112.6 | 19.8 | ||||||||||||||||||
|
Time deposits
|
31,495.6 | 33.0 | 24,682.1 | 29.8 | 18,557.4 | 28.1 | ||||||||||||||||||
|
Savings deposits
|
21,571.2 | 22.6 | 22,201.6 | 26.8 | 18,794.7 | 28.4 | ||||||||||||||||||
|
Other deposits
|
960.0 | 1.0 | 619.0 | 0.7 | 557.0 | 0.8 | ||||||||||||||||||
|
Total deposits
|
74,302.8 | 77.8 | 64,093.8 | 77.3 | 51,021.7 | 77.2 | ||||||||||||||||||
|
Interbank and overnight funds
|
2,898.1 | 3.0 | 4,141.1 | 5.0 | 4,031.9 | 6.1 | ||||||||||||||||||
|
Borrowings from banks and other
|
14,016.9 | 14.7 | 11,301.4 | 13.6 | 8,949.6 | 13.5 | ||||||||||||||||||
|
Bankers’ acceptances outstanding
|
285.6 | 0.3 | 196.9 | 0.2 | 61.3 | 0.1 | ||||||||||||||||||
|
Long-term debt (includes convertible bonds)
|
3,989.8 | 4.2 | 3,199.7 | 3.9 | 2,050.5 | 3.1 | ||||||||||||||||||
|
Total other funding
|
21,190.5 | 22.2 | 18,839.2 | 22.7 | 15,093.3 | 22.8 | ||||||||||||||||||
|
Total funding
|
95,493.3 | 100.0 | 82,932.9 | 100.0 | 66,115.0 | 100.0 | ||||||||||||||||||
Banco de Occidente
The following table presents the composition of Banco de Occidente’s funding at the dates indicated.
|
Year ended December 31,
|
||||||||||||||||||||||||
|
2014
|
2013
|
2012
|
||||||||||||||||||||||
|
(in Ps billions)
|
%
|
(in Ps billions)
|
%
|
(in Ps billions)
|
%
|
|||||||||||||||||||
|
Checking accounts
|
6,255.1 | 22.8 | 5,899.4 | 24.1 | 4,819.6 | 23.5 | ||||||||||||||||||
|
Time deposits
|
7,380.2 | 26.9 | 5,256.0 | 21.5 | 4,652.2 | 22.7 | ||||||||||||||||||
|
Savings deposits
|
9,358.9 | 34.1 | 8,466.3 | 34.6 | 6,450.8 | 31.4 | ||||||||||||||||||
|
Other deposits
|
329.8 | 1.2 | 278.1 | 1.1 | 248.9 | 1.2 | ||||||||||||||||||
|
Total deposits
|
23,324.0 | 85.0 | 19,899.8 | 81.2 | 16,171.6 | 78.8 | ||||||||||||||||||
|
Interbank and overnight funds
|
220.5 | 0.8 | 462.7 | 1.9 | 434.8 | 2.1 | ||||||||||||||||||
|
Borrowings from banks and other
|
1,593.4 | 5.8 | 1,641.4 | 6.7 | 1,576.4 | 7.7 | ||||||||||||||||||
|
Bankers’ acceptance outstanding
|
22.5 | 0.1 | 22.0 | 0.1 | 22.7 | 0.1 | ||||||||||||||||||
|
Long-term debt (bonds)
|
2,269.8 | 8.3 | 2,473.3 | 10.1 | 2,312.1 | 11.3 | ||||||||||||||||||
|
Total other funding
|
4,106.2 | 15.0 | 4,599.5 | 18.8 | 4,345.9 | 21.2 | ||||||||||||||||||
|
Total funding
|
27,430.2 | 100.0 | 24,499.3 | 100.0 | 20,517.5 | 100.0 | ||||||||||||||||||
Banco Popular
The following table presents the composition of Banco Popular’s funding at the dates indicated.
|
Year ended December 31,
|
||||||||||||||||||||||||
|
2014
|
2013
|
2012
|
||||||||||||||||||||||
|
(in Ps billions)
|
%
|
(in Ps billions)
|
%
|
(in Ps billions)
|
%
|
|||||||||||||||||||
|
Checking accounts
|
1,329.1 | 9.8 | 1,546.6 | 11.7 | 1,518.7 | 12.8 | ||||||||||||||||||
|
Time deposits
|
1,907.9 | 14.1 | 1,160.0 | 8.8 | 1,922.2 | 16.2 | ||||||||||||||||||
|
Savings deposits
|
7,236.3 | 53.5 | 8,405.6 | 63.7 | 5,910.9 | 49.9 | ||||||||||||||||||
|
Other deposits
|
88.6 | 0.7 | 105.0 | 0.8 | 84.7 | 0.7 | ||||||||||||||||||
|
Total deposits
|
10,561.9 | 78.1 | 11,217.1 | 85.0 | 9,436.6 | 79.6 | ||||||||||||||||||
|
Interbank and overnight funds
|
750.2 | 5.5 | 3.9 | 0.0 | 70.0 | 0.6 | ||||||||||||||||||
|
Borrowings from banks and
other
|
227.4 | 1.7 | 156.2 | 1.2 | 440.3 | 3.7 | ||||||||||||||||||
|
Bankers’ acceptances outstanding
|
2.4 | 0.0 | 1.2 | 0.0 | 2.7 | 0.0 | ||||||||||||||||||
|
Long-term debt (bonds)
|
1,989.5 | 14.7 | 1,814.7 | 13.8 | 1,897.9 | 16.0 | ||||||||||||||||||
|
Total other funding
|
2,969.5 | 21.9 | 1,975.9 | 15.0 | 2,411.0 | 20.4 | ||||||||||||||||||
|
Total funding
|
13,531.4 | 100.0 | 13,193.0 | 100.0 | 11,847.6 | 100.0 |
Banco AV Villas
The following table presents the composition of Banco AV Villas’ funding at the dates indicated.
|
Year ended December 31,
|
||||||||||||||||||||||||
|
2014
|
2013
|
2012
|
||||||||||||||||||||||
|
(in Ps billions)
|
%
|
(in Ps billions)
|
%
|
(in Ps billions)
|
%
|
|||||||||||||||||||
|
Checking accounts
|
975.9 | 10.4 | 868.2 | 10.6 | 680.8 | 9.1 | ||||||||||||||||||
|
Time deposits
|
2,821.9 | 30.1 | 2,252.7 | 27.4 | 2,338.7 | 31.2 | ||||||||||||||||||
|
Savings deposits
|
4,561.3 | 48.6 | 4,395.1 | 53.5 | 3,706.5 | 49.5 | ||||||||||||||||||
|
Other deposits
|
81.7 | 0.9 | 86.1 | 1.0 | 59.5 | 0.8 | ||||||||||||||||||
|
Total deposits
|
8,440.7 | 90.0 | 7,602.0 | 92.5 | 6,785.4 | 90.7 | ||||||||||||||||||
|
Interbank and overnight funds
|
720.7 | 7.7 | 524.0 | 6.4 | 627.8 | 8.4 | ||||||||||||||||||
|
Borrowings from banks and other
|
214.5 | 2.3 | 90.6 | 1.1 | 70.8 | 0.9 | ||||||||||||||||||
|
Bankers’ acceptances outstanding
|
0.0 | - | 1.0 | 0.0 | – | – | ||||||||||||||||||
|
Total other funding
|
935.2 | 10.0 | 615.6 | 7.5 | 698.6 | 9.3 | ||||||||||||||||||
|
Total funding
|
9,375.9 | 100.0 | 8,217.6 | 100.0 | 7,484.0 | 100.0 | ||||||||||||||||||
Capital expenditures
Grupo Aval incurred Ps 331.6 billion of capital expenditures in property, plant and equipment in 2014, as compared to Ps 358.0 billion in 2013.
Other than our technology program, we do not have any significant policies or projects relating to research and development, and we own no patents or licenses. See “Item 4. Information on the Company—B. Business overview—Other corporate information—Technology.”
For a discussion of trend information, see “—A. Operating results—Principal factors affecting our financial condition and results of operations.”
In the ordinary course of business, our bank subsidiaries have entered into various types of off-balance sheet arrangements, including credit lines, letters of credit and financial guarantees. Our bank subsidiaries utilize these instruments to meet their customers’ financing needs. The contractual amount of these instruments represents the maximum possible credit risk should the counterparty draw down the entire commitment or our bank fulfill its entire obligation under the guarantees, and the counterparty subsequently fails to perform according to the terms of the contract. Our bank subsidiaries may hold cash or other liquid collateral to support these commitments, and they generally have legal recourse to recover amounts paid but not recovered from customers under these instruments. Most of these commitments and guarantees expire undrawn. As a result, the total contractual amount of these
instruments does not represent our bank subsidiaries’ future credit exposure or funding requirements. In addition, some of these commitments, primarily those related to consumer financing, are cancelable by our banks upon notice.
The following table presents the maximum potential amount of future payments under these instruments at the dates presented for Grupo Aval on a consolidated basis.
|
At December 31,
|
||||||||||||
|
Grupo Aval
|
2014
|
2013
|
2012
|
|||||||||
|
(in Ps billions)
|
||||||||||||
|
Unused credit card limits
|
11,610.6 | 10,239.9 | 10,932.0 | |||||||||
|
Civil demands against our banks
|
783.2 | 718.9 | 657.5 | |||||||||
|
Issued and confirmed letters of credit
|
765.8 | 902.5 | 529.2 | |||||||||
|
Unused lines of credit
|
3,047.3 | 2,988.9 | 3,093.3 | |||||||||
|
Bank guarantees
|
3,100.3 | 2,618.8 | 2,106.1 | |||||||||
|
Approved credits not disbursed
|
2,073.5 | 2,066.8 | 1,821.0 | |||||||||
|
Other
|
1,997.0 | 2,266.0 | 2,069.0 | |||||||||
|
Total
|
23,377.7 | 21,801.8 | 21,208.1 | |||||||||
The following tables present our contractual obligations at December 31, 2014.
|
At December 31, 2014
|
||||||||||||||||||||
|
Payments due by period
|
||||||||||||||||||||
|
Total
|
Less than 1 year
|
1 - 3 years
|
3 - 5 years
|
More than 5 years
|
||||||||||||||||
|
Grupo Aval (in Ps billions)
|
||||||||||||||||||||
|
Liabilities:
|
||||||||||||||||||||
|
Long-term debt obligations(1)
|
12,541.0 | 2,077.2 | 4,819.1 | 691.0 | 4,953.6 | |||||||||||||||
|
Time deposits
|
41,858.6 | 29,899.4 | 8,743.7 | 1,204.5 | 2,011.0 | |||||||||||||||
|
Long-term borrowings from banks and others
|
14,555.1 | 5,726.7 | 5,410.6 | 1,972.6 | 1,445.2 | |||||||||||||||
|
Repurchase agreements
|
4,046.5 | 4,046.5 | 0.0 | 0.0 | 0.0 | |||||||||||||||
|
Employee benefit plans
|
312.1 | 30.4 | 62.7 | 64.6 | 154.3 | |||||||||||||||
|
Total
|
73,313.2 | 41,780.2 | 19,036.1 | 3,932.7 | 8,564.2 | |||||||||||||||
|
(1)
|
See note 20 to our audited consolidated financial statements at December 31, 2014.
|
Board of directors
The board of directors of Grupo Aval is composed of seven principal members and seven alternate members, each of whom serves a one-year term and may be reelected indefinitely. The term for the current directors expires on March 31, 2016.
The current members of the board of directors were appointed at a shareholders’ meeting held on March 27, 2015. The following table presents the names of the current principal and alternate members of the board of directors.
|
Board member
|
Alternate
|
|
|
Luis Carlos Sarmiento Angulo
|
Hernán Rincón Gómez
|
|
|
Alejandro Figueroa Jaramillo
|
Juan María Robledo Uribe
|
|
|
Efraín Otero Álvarez
|
Juan Camilo Ángel Mejía
|
|
|
Álvaro Velásquez Cock
|
Ana María Cuéllar de Jaramillo
|
|
|
Julio Leonzo Álvarez Álvarez(1)(3)
|
Gabriel Mesa Zuleta
|
|
|
José Mauricio Rodríguez Múnera(1)(2)(3)
|
Enrique Mariño Esguerra(2)
|
|
|
Esther América Paz Montoya(1)(2)(3)
|
Germán Villamil Pardo(2)
|
|
(1)
|
Member of the Audit committee.
|
|
(2)
|
Independent director under Colombian requirements.
|
|
(3)
|
Independent director under SEC Audit Committee rules.
|
Luis Fernando Pabón Pabón is the secretary of our board.
Biographical information of the principal members of our board of directors and the secretary of our board is set forth below. Ages of members of our board of directors throughout this annual report are as of April 22, 2015.
Luis Carlos Sarmiento Angulo
, age 82, has served as the Chairman of the board of directors of Grupo Aval since 1999. Mr. Sarmiento Angulo is the founder and controlling shareholder of Grupo Aval and, since 1985, has served as a member of the board of directors of Organización Luis Carlos Sarmiento Angulo Ltda., an affiliate of our controlling shareholder. Since 2010 he has served as principal member of the Board of Directors of Casa Editorial El Tiempo and of CEET TV. He also serves as Chairman of the board of directors of four not-for-profit entities: Asociación Nacional de Instituciones Financieras—ANIF, Fundación para el Futuro de Colombia—Colfuturo; Fundación Grupo Aval and Fundación Luis Carlos Sarmiento Angulo, through which he is sponsoring, among other initiatives, Corporación Microcrédito Aval, a microfinance not-for-profit organization. He holds a degree in Civil Engineering from Universidad Nacional de Colombia. He is the father of the President of Grupo Aval, Mr. Luis Carlos Sarmiento Gutiérrez. Mr. Sarmiento Angulo’s business address is Carrera 13 No. 26A-47, Bogotá D.C., Colombia.
Alejandro Figueroa Jaramillo
, age 73, has served as a principal member on the board of directors of Grupo Aval since 1999. Mr. Figueroa Jaramillo has been the President of Banco de Bogotá since 1988. He has been employed with Banco de Bogotá since 1978, where he also served as Executive Vice President and Vice President of Finance. He is the Chairman of the board of directors of Porvenir and has been a board member of Porvenir since 1991. He has also been a member of the board of directors of Corficolombiana since 1998 and of Fundación Grupo Aval since 2011. He previously served as Vice-Minister of Economic Development of Colombia and President of Almaviva S.A., Banco de Bogotá’s bonded warehouse. He holds a degree in Civil Engineering from Facultad de Minas de la Universidad Nacional in Antioquia and a Master of Science degree in Economics from Harvard University. Mr. Figueroa Jaramillo’s business address is Calle 35 No. 7-47, Bogotá, D.C., Colombia.
Efraín Otero Álvarez
, age 66, has served as a principal member on the board of directors of Grupo Aval since 1999. Mr. Otero Álvarez has been the President of Banco de Occidente since 1995. He has been employed with Banco de Occidente since 1973, where he also served as Vice President of Finance and Executive Vice President. He has also served as a member of the boards of directors of Porvenir since 1995, of Corficolombiana since 1998, of Banco de Occidente—Panamá since 2006 and of Fundación Grupo Aval since 2011. He previously worked as an economist at Corporación Autónoma del Valle del Cauca. He holds a degree in Economics and a Master’s degree in Industrial Engineering, both from the Universidad del Valle. Mr. Otero Álvarez’s business address is Carrera 4 No. 7-61, Cali, Colombia.
Álvaro Velásquez Cock
, age 75, has served as a principal member of the board of directors of Grupo Aval since 2013. Mr. Velásquez Cock previously served as an alternate member of the board of directors of Grupo Aval since 2008. Mr. Velásquez Cock has served as advisor to Grupo Ethuss since 1994. He has acted as Dean of the Faculty of Economics of the Universidad de Antioquia, Chief of the Departamento Nacional de Estadística—DANE, President of Pedro Gómez & Cía. S.A. and as a member of the Advisory Committee of the Superintendency of Finance. He has been a member of the board of directors of Banco de Bogotá since 2001, of Banco de Bogotá—Panamá since 1984, of Corficolombiana since 1992 and of Unipalma since 1996. He holds a degree in Economics from the Universidad de Antioquia. Mr. Velásquez Cock’s business address is Calle 69 No. 9-58, Bogotá D.C., Colombia.
Julio Leonzo Álvarez Álvarez
, age 68, has served as a principal member of the board of directors of Grupo Aval since 2013. Mr. Álvarez has previously occupied several positions at Grupo Aval, including Vice President of Shared Services, Chief Technology Officer and Vice President of Corporate Systems. Mr. Álvarez Álvarez has acted as President of Avianca, Cervecería Unión S.A. and Pedro Gómez & Cía. He has been a member of the board of directors of Porvenir since 2001 and of Banco Popular since 1996 and is a former member of the board of directors of A Toda Hora S.A.—ATH. He holds a degree in civil engineering from the Universidad Nacional de Colombia with studies in the Higher Management Program, INALDE at the Universidad de la Sabana, Postgraduate Program in Financial Management at the Universidad de Medellín, and Postgraduate Program in Statistics Applied to Engineering at the Universidad Nacional de Colombia. Mr. Álvarez Álvarez’s business address is Carrera 13 No. 26A-47, Bogotá, D.C., Colombia.
José Mauricio Rodríguez Múnera
, age 57, has served as a principal member of the board of directors of Grupo Aval since 2014. Mr. Rodríguez has previously served as president of Portafolio, a daily financial and business Colombian newspaper from 1993 to 2007, President of CESA Business School from 2007 to 2009, Colombian Ambassador of Colombia in the United Kingdom from 2009 to 2013 and senior advisor to President Juan Manuel Santos from 2013 to 2014. Mr. Rodríguez currently serves as director and conductor of the radio program “Leaders of RCN” and professor of leadership at the Universidad de los Andes. He also serves as member of the board of directors of Colombia Telecomunicaciones S.A. E.S.P. since 2014. He holds a degree in Business Administration from CESA Business School. Mr. Rodríguez’s business address is Calle 31 No. 13A-19, Bogotá D.C., Colombia.
Esther América Paz Montoya
, age 60, has served as a principal member on the board of directors of Grupo Aval since 2010, and previously as an alternate member thereof since 2005. Ms. Paz Montoya is a former President of Banco AV Villas, where she also served as Vice President of Finance and Vice President of Operations, and a former President of Ahorramás Corporación de Ahorro y Vivienda. Ms. Paz Montoya has served as a member of the board of directors of Agremiación Cívica Centro Internacional San Diego S.A. since 2009. She holds a degree in Business Administration from the Universidad del Valle. Ms. Paz Montoya’s business address is Carrera 13 No. 26A-47, Bogotá D.C., Colombia.
Biographical information of the alternate members of our board of directors is set forth below.
José Hernán Rincón Gómez
, age 86, has served as an alternate member of the board of directors of Grupo Aval since 2010 and previously as a principal member thereof since 2005. Mr. Rincón Gómez served as President of Banco Popular from 1991 to May 2014. He has served as a member of the board of directors of Corficolombiana since 1998 and of Fundación Grupo Aval since 2011. He is the former President of, among other entities, Banco Comercial Antioqueño (the predecessor to Banco Santander Colombia), Avianca (airline company) and Banco del Estado. He holds a degree in Economics from the Universidad de Antioquia and is qualified as a public accountant. Mr. Rincón Gómez’s business address is Carrera 13 No. 26A-47, Bogotá D.C., Colombia.
Juan María Robledo Uribe
, age 70, has served as an alternate member on the board of directors of Grupo Aval since 2000. Mr. Robledo Uribe has acted as Executive Vice President of Banco de Bogotá from 1990 to 1992, from 1993 to 2001 and since 2003. He has been employed with Banco de Bogotá for over 40 years, where he has also served as Vice President of Banking Services and Vice President of Commercial Banking. He has been a member of the board of directors of Corficolombiana from 1993 to 2001 and since 2006, of Fidubogotá since 2007, of Porvenir since 1991 and of Fundación Grupo Aval since 2011. He holds a degree in Economics from the Universidad del Rosario. He is also the former President of Banco del Comercio (which merged with Banco de Bogotá in 1992) and of Corficolombiana from 2003 until 2005. Mr. Robledo Uribe’s business address is Calle 35 No. 7-47, Bogotá D.C., Colombia.
Juan Camilo Ángel Mejía
, age 49, has served as an alternate member on the board of directors of Grupo Aval since 2008. Mr. Ángel Mejía has been the President of Banco AV Villas since 2007, and previously acted as its Vice President of Credit and Portfolio, Vice President of Asset Regularization and Vice President of Real Estate. Previously he was an advisor in the Offerings Department of Banco Central Hipotecario and Project Manager in the Capital Markets division of Corfinsura. He has also been a member of the board of directors of Asociación Bancaria de Colombia since 2007, of Titularizadora Colombiana S.A. since 2008 and of Fundación Grupo Aval since 2011. He holds a degree in Civil Engineering from the Universidad de Medellín. Mr. Ángel Mejía’s business address is Carrera 13 No. 26A-47, Bogotá D.C., Colombia.
Gabriel Mesa Zuleta
, age 48, has served as an alternate member on the board of directors of Grupo Aval since 2004. Mr. Mesa Zuleta has been the President of Sadinsa S.A. since 2003 and a member of the board of directors of Banco Popular since 2004, of Seguros Alfa S.A. since 2004 and of Seguros de Vida Alfa S.A. since 2004. He previously acted as Director of the Administrative Department of the President of the Republic of Colombia and as President of Empresa de Telecomunicaciones de Colombia-Telecom. He holds a law degree from the Universidad del Rosario. Mr. Mesa Zuleta’s business address is Carrera 13 No. 26-45, Bogotá D.C., Colombia.
Ana María Cuéllar de Jaramillo
, age 61, has served as an alternate member of the board of directors of Banco de Bogotá since 2007 and also serves as a member of the board of directors of Megalínea and Biomax S.A. Ms. Cuéllar de Jaramillo is an independent consultant who specializes in systems and procedures for financial control and has formerly served as Director of the Dirección de Impuestos y Aduanas Nacionales DIAN and in several positions in Citibank. She holds a degree in accounting from Universidad Jorge Tadeo Lozano. Ms. Cuéllar de Jaramillo’s business address is Carrera 13 No. 26A-47, Bogotá D.C., Colombia.
Enrique Mariño Esguerra
, age 89, has served as an alternate member on the board of directors of Grupo Aval since 2006. Mr. Mariño Esguerra is a manager, partner and member of the board of directors of Ingeniería CEISA. He is a former member of the board of directors of Corporación de Ahorro y Vivienda AV Villas (the predecessor to Banco AV Villas), Cemento Samper S.A., Seguros Alfa S.A. and Seguros de Vida Alfa S.A. He holds a degree in Civil Engineering from the Universidad Nacional. Mr. Mariño Esguerra’s business address is Avenida Carrera 19 No. 135-30, Bogotá D.C., Colombia.
Germán Villamil Pardo
, age 55, has served as an alternate member on the board of directors of Grupo Aval since 2010 and previously as a principal member thereof since 2006. Mr. Villamil Pardo is a partner of Gómez Pinzón Zuleta Abogados S.A. He has served as a member of the board of directors of Gómez Pinzón Zuleta Abogados S.A. since 1997, Gómez Pinzón Zuleta Asemarcas S.A. since 2003, Inversiones Inmobiliarias Arauco Alameda S.A.S since 2010 and Inversiones Inmobiliarias Barranquilla Arauco S.A.S. since 2010. He previously held several positions in the Ministry of Finance of Colombia as well as in Banco de la República. He holds a law degree with a specialty in tax from the Universidad de los Andes. Mr. Villamil Pardo’s business address is Calle 67 No. 7-35 Oficina 1204, Bogotá D.C., Colombia.
Luis Fernando Pabón Pabón
, age 56, has served as Secretary of the Board of Grupo Aval since 2000. Mr. Pabón Pabón formerly served as Legal Vice President of Banco de Colombia and as Legal Counsel to the President of Banco de Bogotá. He has been a member of the board of directors of Banco AV Villas since 1998, of Porvenir since 2003, of Almaviva S.A. since 2007, of Organización Luis Carlos Sarmiento Angulo Ltda. since 2006 and of Casa Editorial El Tiempo and CEET TV since 2011. He also serves as legal counsel to Organización Luis Carlos Sarmiento Angulo Ltda. Mr. Pabón Pabón holds a law degree from Universidad Javeriana and a specialization in financial law from the Universidad de los Andes. Mr. Pabón Pabón’s business address is Carrera 13 No. 26A-47, Bogotá D.C., Colombia.
Executive officers
The executive officers of Grupo Aval are responsible for the day-to-day management of our company. Although the Presidents of Banco Popular, Corficolombiana, Porvenir and BAC Credomatic are not represented in the board of directors or in the management of Grupo Aval, they are key individuals in our group’s banking, merchant banking, pension management and Central American businesses.
The following table lists the names and positions of our executive officers and the presidents of our banking subsidiaries, Porvenir, Corficolombiana and BAC Credomatic. Certain of our executive officers are also members of the boards of directors of our subsidiaries.
|
Name
|
Position
|
|
|
Luis Carlos Sarmiento Gutiérrez
|
President
|
|
|
Diego Fernando Solano Saravia
|
Chief Financial Officer
|
|
|
Diego Rodríguez Piedrahita
|
Chief Risk Management Officer
|
|
|
Carlos Ernesto Pérez Buenaventura
|
Chief Strategy Officer
|
|
|
Jorge Adrián Rincón Plata
|
Chief Legal Counsel
|
|
|
Rodolfo Vélez Borda
|
Vice President of Shared Services
|
|
|
María Edith González Flórez
|
Vice President of Accounting
|
|
|
Rafael Eduardo Neira Torres
|
Vice President of Internal Control
|
|
|
José Manuel Ayerbe Osorio
|
Vice President of Marketing
|
|
|
Edgar Enrique Lasso Fonseca
|
Vice President of Operational and Regulatory Risk Management
|
|
|
María José Arango Caicedo
|
Vice President of Procurement
|
|
|
Mauricio Maldonado Umaña
|
Vice President of Strategy
|
|
|
Tatiana Uribe Benninghoff
|
Vice-President of Financial Planning and Investor Relations
|
|
|
Leopoldo Jesús Vásquez Sebastiani
|
Vice-President of Planning and Projects
|
|
|
Banco de Bogotá
|
||
|
Alejandro Figueroa Jaramillo
|
President
|
|
|
Banco de Occidente
|
||
|
Efraín Otero Álvarez
|
President
|
|
|
Banco Popular
|
||
|
Carlos Eduardo Upegui Cuartas
|
President
|
|
|
Banco AV Villas
|
||
|
Juan Camilo Ángel Mejía
|
President
|
|
|
Corficolombiana
|
||
|
José Elías Melo Acosta
|
President
|
|
|
Porvenir
|
||
|
Miguel Largacha Martínez
|
President
|
|
|
BAC Credomatic
|
||
|
Ernesto Castegnaro
|
President
|
Biographical information of our executive officers and key employees who are not directors is set forth below. Ages of our executive officers throughout this annual report are as of April 22, 2015.
Luis Carlos Sarmiento Gutiérrez
, age 53, has acted as President of Grupo Aval since 2000. Mr. Sarmiento Gutiérrez acted as President of Cocelco S.A. from 1997 until 2000. Previously he served as Executive Vice President at First Bank of the Americas in New York and as an analyst and financial manager at Procter & Gamble’s corporate headquarters. He has been the Chairman of the board of directors of Banco de Bogotá since 2004 and of Corficolombiana since 2006. He holds a Bachelor of Science degree, magna cum laude, in civil engineering from the University of Miami and a Master’s degree in Business Administration with a concentration in Finance from the Johnson Graduate School of Management at Cornell University. Mr. Sarmiento Gutiérrez is the son of the Chairman of the board of directors of Grupo Aval, Mr. Sarmiento Angulo. Mr. Sarmiento Gutiérrez’s business address is Carrera 13 No. 26A-47, Bogotá D.C., Colombia.
Diego Fernando Solano Saravia
, age 49, has acted as Chief Financial Officer, and formerly as Vice President of Corporate Planning, of Grupo Aval since 2006. He previously served as associate principal at McKinsey & Co. and Corporate Vice President at Banco Santander Colombia. He holds a degree in Systems Engineering from the Universidad de los Andes and a Master’s degree in Business Administration from the Wharton School at the University of Pennsylvania. His business address is Carrera 13 No. 26A-47, Bogotá D.C., Colombia.
Diego Rodríguez Piedrahita
, age 56, has acted as Chief Risk Management Officer of Grupo Aval since 1999. Mr. Rodríguez Piedrahita previously worked at Bank of America and ING. He has been the Chairman of the board of directors of Banco AV Villas since 2004 and has been a board member thereof since 2000. He has also been a member of the board of directors of Fidubogotá since 2000, Organización Luis Carlos Sarmiento Angulo Ltda. since 2006, Inverprogreso S.A. since 2003 and of Inversegovia S.A. since 2003. He holds a Bachelor’s degree in Business Management and a Master in Business Administration from George Washington University. Mr. Rodríguez Piedrahita’s business address is Carrera 13 No. 26A-47, Bogotá D.C., Colombia.
Carlos Ernesto Pérez Buenaventura
, age 60, has served as Chief Strategy Officer of Grupo Aval since 2012 and formerly as CEO of Barclays in Spain. Previously he was the Division Head responsible for the Retail Bank, the Pension Fund Business and the Consumer Finance Companies of Citigroup in Argentina, Chile, Uruguay and Paraguay. He also worked for Citigroup in Colombia, Ecuador and Puerto Rico. In addition he has served as Marketing and Sales Manager of Alpina S.A. (food-producing company). He holds a degree in Industrial
Engineering from Universidad Javeriana and pursued graduate studies in Business Management from Universidad del Rosario. Mr. Pérez Buenaventura’s business address is Carrera 13 No. 26A-47, Bogotá D.C., Colombia.
Jorge Adrián Rincón Plata
, age 35, has acted as our Chief Legal Counsel since May 2012. Mr. Rincón previously served as Legal Counsel to Banco de Bogotá. He holds a degree in law from the Universidad Autónoma de Bucaramanga and a Masters in International Business Law from Queen Mary University & Westfield College, University of London. Mr. Rincón Plata’s business address is Carrera 13 No. 26A-47, Bogotá D.C., Colombia.
Rodolfo Vélez Borda
, age 50, has served as Vice President of Shared Services of Grupo Aval since 2012 and formerly as Vice President of Technology and Operations of Banco AV Villas and Corporación Ahorramás. He has been a member of the board of directors of Fondo de Empleados FEVI since 2012, ACH Colombia S.A. since 2006 and A Toda Hora S.A. ATH since 2005. He holds a degree in Systems Engineering from the Universidad de Los Andes, a Telecommunications specialty from the Universidad de Los Andes and a Business Management specialty from Aden Business School and MIT. Mr. Vélez Borda’s business address is Carrera 13 No. 26A-47, Bogotá D.C., Colombia.
María Edith González Flórez
, age 56, has acted as Vice President of Accounting, and formerly as Financial and Administrative Manager, of Grupo Aval since 2004. Ms. González Flórez previously worked as Financial Manager at Cocelco S.A. and Movistar. She holds a degree in Public Accounting from the Universidad de Santiago de Cali and a Finance specialty from Universidad ICESI. Ms. González Flórez’s business address is Carrera 13 No. 26A-47, Bogotá D.C., Colombia.
Rafael Eduardo Neira Torres
, age 59, has acted as Vice President of Internal Control of Grupo Aval since 2009. Mr. Neira Torres acted as Deputy Financial Superintendent, and formerly as Adjunct Financial Superintendent, at the Superintendency of Finance from 2006 to 2008. He previously worked as Operations Vice President at Banco Davivienda. He holds a degree in Accounting from the Universidad Jorge Tadeo Lozano and in Banking Management from the Universidad de los Andes. Mr. Neira Torres’ business address is Carrera 13 No. 26A-47, Bogotá D.C., Colombia.
Jose Manuel Ayerbe Osorio
, age 42, he has served as Vice President of Marketing of Grupo Aval since 2012 and formerly as Marketing Manager of Visa Colombia, he also worked as Marketing Manager of Grupo Aval and previously acted as Advertisement Manager of Cocelco—Celumovil. He has been a member of the board of directors of A Toda Hora S.A. ATH since April 2013 and Corporación Publicitaria S.A. since April 2013. He holds a degree in Systems Engineering from Universidad Javeriana de Cali, a Marketing specialty from the Universidad Jorge Tadeo Lozano. He is currently pursuing an Executive MBA from the Tecnológico de Monterrey. His business address is Carrera 13 No. 26A-47, Bogotá D.C., Colombia.
Edgar Enrique Lasso Fonseca
, age 58, has acted as Vice President of Operational and Regulatory Risk Management of Grupo Aval since 2009. Mr. Lasso Fonseca held several positions at the Superintendency of Finance, including Delegate for Financial Intermediaries from 1995 until 2007. He previously worked as a corporate analyst at Banco de Bogotá. He has been a member of the board of directors of Casa de Bolsa since 2010. He holds a degree in Economics from Universidad Externado de Colombia and in Banking Management from the Universidad de los Andes. Mr. Lasso Fonseca’s business address is Carrera 13 No. 26A-47, Bogotá D.C., Colombia.
María José Arango Caicedo
, age 49, has acted as Vice President of Procurement of Grupo Aval since 2012 and formerly, as Vice President of Corporate Services at Grupo Aval from 2000 to 2011. She previously worked as Commercial Manager of Cocelco S.A., as Electronic Banking Manager at Banco de Occidente and as Project Manager at Fanalca. She has been a member of the board of directors of Inverprogreso S.A. since 2003, Inversegovia S.A. since 2003, Taxair since 2003 and Corporación Publicitaria de Colombia S.A. since 2003. She was a member of the board of directors of A Toda Hora S.A. ATH from 2011 to April 2013. She holds a degree in Systems Engineering from Universidad ICESI and a Master’s degree in Business Administration from the Universidad del Valle. Ms. Arango Caicedo’s business address is Carrera 13 No. 26A-47, Bogotá D.C., Colombia.
Mauricio Maldonado Umaña
, age 37, has acted as Vice President of Strategy since 2012. Mr. Maldonado served as engagement manager at McKinsey & Co. and investment banking director at Corficolombiana. He has been a member of the board of directors of Promigas S.A. E.S.P. since March 2013 and Banco Popular since December 2014. He holds a degree in industrial engineering from the Universidad de los Andes and a Master of
Business Administration from the University of Chicago Booth School of Business. His business address is Carrera 13 No. 26A-47, Bogotá D.C., Colombia.
Tatiana Uribe Benninghoff
, age 34, has acted as Vice-President of Financial Planning and Investor Relations since 2013 and formerly as Strategy and M&A Manager since 2012 at Grupo Aval. Previously she served as a junior advisor to the Chairman of the Board of Grupo Aval and as an Investment Bank Director at Corficolombiana S.A. She holds a degree in Finance and International Relations from the Universidad Externado de Colombia and a Master of Business Administration from the McDonough School of Business at Georgetown University where she was given the Beta Gamma Sigma award. Her business address is Carrera 13 No. 26A-47, Bogotá D.C., Colombia.
Leopoldo Jesús Vásquez Sebastiani
, age 36, has served as Vice-President of Planning and Projects at Grupo Aval since 2013. Previously, he acted as Engagement Manager specializing in Latin American Financial Institutions at McKinsey and Company in Colombia for six years. Mr. Vásquez is also a member of the board of directors of Casa de Bolsa. He has also worked as Operations Area Manager at Hach Company in Colorado, USA. Mr. Vásquez holds a degree in Industrial Engineering from Universidad Católica Andrés Bello, Caracas, Venezuela, and a Master in Manufacturing Management from The Pennsylvania State University. Mr. Vásquez’s business address is Carrera 13 No. 26A-47, Bogotá D.C., Colombia.
Carlos Eduardo Upegui Cuartas
, age 53, has served as President of Banco Popular since June 2014. Mr. Upegui previously served as Executive Vice-president of Banco Popular, legal representative of Ripley Compañía de Financiamiento S.A. from 2012 to 2014 and President of BCSC S.A. from 2009 to 2012. He has also served in the past as member of the Board of Directors in several financial entities including Metlife Colombia Seguros de Vida S.A., Titularizadora Colombiana S.A., Depósito Centralizado de Valores de Colombia—Deceval S.A. He holds a degree in business administration with a specialization in markets from Universidad de los Andes. His business address is Calle 17 No. 7-43, Bogotá D.C., Colombia.
José Elías Melo Acosta
, age 55, has served as President of Corficolombiana since 2008. Mr. Melo is also a member of the board of directors of Leasing Corficolombiana S.A., Fiduciaria Corficolombiana S.A., Promigas S.A., Banco AV Villas S.A. and Sociedad Gas Natural de Lima y Callao S.A. and an alternate member of the board of directors of Fundación Grupo Aval. Mr. Melo Acosta previously served as President of Megabanco from 1999 to 2006, of Banco del Estado in 1999 and of Confederación de Cooperativas de Colombia from 1994 to 1998. He has also served in several positions within the Colombian government including as Minister of Employment and Social Security, Superintendent of Finance, Vice Minister of Finance and Public Credit and Secretary of the Monetary Board of the Banco de la República. He holds a law degree with a specialty in socioeconomic sciences from Universidad Javeriana. His business address is Carrera 13 No. 26-45, Bogotá D.C., Colombia.
Miguel Largacha Martínez
, age 51, has served as President of Porvenir since 2008. Mr. Largacha Martínez previously served as President of Horizonte Sociedad Administradora de Fondos de Pensiones y de Cesantías S.A., and held other positions within BBVA Colombia S.A., including Executive Vice President and Legal Vice President of Banco Ganadero (the predecessor to BBVA Colombia S.A.) and has been a member of the board of directors of Fundación Grupo Aval since 2011. He holds a law degree from Universidad Javeriana and has further completed postgraduate studies in Financial Legislation and Executive Management at the Universidad de los Andes. His business address is Carrera 13 No. 27-75, Bogotá D.C., Colombia.
Ernesto Castegnaro
, age 64, has served as President of BAC Credomatic since 1983 and as President of BAC International Bank since December 2008. Mr. Castegnaro joined BAC Credomatic in 1976 and has over 30 years of experience managing credit card operations and over 25 years of experience managing banking operations. He is also a director on the MasterCard Latin America Board of Directors, a member of the board of directors of BAC San Jose since 1985 and a member of the board of directors of BAC International Corp. since 2002. Mr. Castegnaro holds an MBA in Banking and Finance from INCAE and a Civil Engineering degree from the University of Costa Rica. His business address is Centro Corporativo Plaza Roble, Edificio Terrazas B, Escazú, San José, Costa Rica.
Our common shareholders must approve the compensation of our board of directors at the first semi-annual shareholders’ meeting of every calendar year.
Each member of our board of directors, including alternates, receives a fee based on attendance at each board of directors’ session. Members of our audit committee also receive an additional fee for attending audit committee meetings. For the April 1, 2014 to March 31, 2015 period, the board of directors’ session fee was Ps 1,900,000 per board member and the audit committee session fee was Ps 1,900,000 per board member. For the April 1, 2015 to March 31, 2016 period, the board of directors’ session fee is Ps 2,000,000 per board member and the audit committee session fee is Ps 2,000,000 per board member.
We are not required under Colombian law to publish information regarding the compensation of our individual executive officers, and we do not make this information public. Our shareholders, however, can request this information before our semi-annual general shareholders’ meetings. The aggregate amount of compensation, inclusive of bonuses, that we and our subsidiaries paid to directors, alternate directors and senior executive officers was Ps 59.2 billion (U.S.$24.8 million) in 2014. We pay bonuses to our executive officers which vary according to each officer’s performance and the achievement of certain predefined goals, and, therefore, the amounts paid may vary for each officer.
We do not have, and have not had in the past, any share option plans.
Principal differences between Colombian and U.S. corporate governance practices
Grupo Aval, as a listed company that qualifies as a foreign private issuer under the NYSE listing standards in accordance with the NYSE corporate governance rules, is permitted to follow home-country practice in some circumstances in lieu of the provisions of the corporate governance rules contained in Section 303A of the NYSE Listed Company Manual that are applicable to U.S. companies. We follow corporate governance practices applicable to Colombian companies and those described in our Corporate Governance Code, which in turn follow Colombian corporate governance rules. The Corporate Governance Code is available at Grupo Aval’s website at www.grupoaval.com. Information on our website is not incorporated into this annual report.
The following is a summary of the significant differences between the corporate governance practices followed by Grupo Aval and those applicable to domestic issuers under the NYSE listing standards.
Independence of directors
Under NYSE corporate governance rules, a majority of a U.S. company’s board of directors must be composed of independent directors, although as a foreign private issuer and a company that is controlled, directly or indirectly, by Mr. Luis Carlos Sarmiento Angulo, we would not be required to comply with this rule. Law 964 of 2005 requires that our board of directors consist of five to ten members and that at least 25% of such members be independent directors, and Decree 3923 of 2006 regulates their election. “Independence” within the meaning of Law 964 of 2005 is primarily concerned with independence from management and the absence of material related-party transactions between the director and the company. See “Item 10. Additional Information—A. Share capital.” In compliance with Colombian law and our by-laws, Grupo Aval’s board of directors is composed of seven members, of which two are independent under Colombian rules. In addition, Colombian law mandates that all directors exercise independent judgment under all circumstances.
Non-executive director meetings
Pursuant to the NYSE listing standards, non-executive directors of U.S. listed companies must meet on a regular basis without management being present. Under Colombian regulations, there is no prohibition against officers being members of the board of directors, and it is our practice that each president of our banks be a member of our board of directors. The non-executive directors of Grupo Aval do not meet formally without management present.
Committees of the board of directors
Under NYSE listing standards, all U.S. companies listed on the NYSE must have an audit committee, a compensation committee and a nominating/corporate governance committee, each with a written charter addressing certain minimum specified duties, and all members of such committees must be independent. In each case, the independence of directors must be established pursuant to highly detailed rules promulgated by the NYSE and, in
the case of the audit committee, the NYSE and the SEC. We have established an audit committee, a corporate matters committee and a compensation committee as further described below.
Audit committee
Our audit committee is composed of three members, appointed by the board of directors: Esther América Paz Montoya, Julio Leonzo Álvarez Álvarez and José Mauricio Rodríguez Múnera. Julio Leonzo Álvarez Álvarez is the financial expert on the audit committee. All members of our audit committee are independent under the NYSE and SEC corporate governance rules applicable to us. Company officers are not members of the audit committee; however, the meetings and work product of the audit committee are supported by reports and presentations by company officers. Pursuant to Colombian Securities regulation (Law 964 of 2005), the audit committee has a charter approved by the board of directors, which sets forth the main aspects related to the operation of such committee, including, among others, its composition and duties. The audit committee charter addresses various corporate governance subjects. Our external auditor KPMG Ltda., as our independent registered public accounting firm, is invited to attend the meetings of the audit committee. Pursuant to Colombian law, the audit committee must meet at least quarterly.
Our audit committee advises the board of directors generally on internal control matters, and it specifically undertakes to:
|
|
·
|
review financial statements prior to their submission to the board of directors and to the general shareholders’ meeting;
|
|
|
·
|
supervise the internal auditor to verify if its actions address the internal control needs of the company and to identify limitations with respect to its duties;
|
|
|
·
|
review all internal control reports of the company and supervise compliance with such reports by the company’s management;
|
|
|
·
|
issue its opinion on the independence of the external auditor, based on standards set forth by Colombian and U.S. regulations;
|
|
|
·
|
monitor the company’s levels of risk exposure at least every six months and propose mitigation measures as needed;
|
|
|
·
|
propose to the board of directors control systems to prevent, detect and adequately respond to the risk of fraud and improper conduct by company employees;
|
|
|
·
|
provide assistance to our board of directors in fulfilling its responsibilities with respect to our compliance with legal and regulatory requirements;
|
|
|
·
|
make recommendations to the general shareholders meeting concerning the engagement of the independent accounting firm; and
|
|
|
·
|
issue reports to the board of directors on matters deemed relevant.
|
Corporate matters committee
Our corporate matters committee is composed of the same members as the audit committee. The corporate matters committee advises the board of directors relating to the preparation and execution of internal policies related to risk management and internal control at the holding company level and of its subsidiaries.
Compensation committee
Our compensation committee is composed of two directors: Mr. Luis Carlos Sarmiento Angulo and Mr. Julio Leonzo Álvarez Álvarez. Our Board of Directors may change the members of the committee at any time. The compensation committee advises the board on remuneration matters and specifically undertakes to (i) review the remuneration of our President and (ii) review the criteria upon which our President will determine the remuneration
of our senior management and employees. Because Colombian law does not require the creation of a compensation committee, the Board of Directors has not adopted a compensation committee charter.
At December 31, 2014, on a consolidated basis, we employed approximately 74,211 individuals, with 59,293 employees, 5,084 personnel provided by staffing service companies and 9,834 outside contractors.
The following table presents the approximate breakdown of the employees, personnel provided by staffing service companies and outside contractors of our banking subsidiaries, Porvenir, Corficolombiana and Grupo Aval (unconsolidated), at December 31, 2014.
|
Banco de Bogotá(1)(2)
|
Banco de Occidente(3)
|
Banco Popular(4)
|
Banco AV Villas(5)
|
Porvenir(6)
|
Corficolombiana
|
BAC Credomatic(7)
|
Grupo Aval (unconsolidated)
|
Total
|
||||||||||||||||||||||||||||
|
Employees
|
12,234 | 13,044 | 4,073 | 4,797 | 2,678 | 789 | 21,553 | 125 | 59,293 | |||||||||||||||||||||||||||
|
Personnel provided by staffing service companies
|
2,778 | 94 | 1,405 | 702 | 53 | 51 | 1 | 5,084 | ||||||||||||||||||||||||||||
|
Outside contractors
|
3,522 | 1,424 | 1,640 | 1,448 | 107 | 106 | 1,582 | 5 | 9,834 | |||||||||||||||||||||||||||
|
Total
|
18,534 | 14,562 | 7,118 | 6,947 | 2,838 | 946 | 23,135 | 131 | 74,211 | |||||||||||||||||||||||||||
|
(1)
|
Excludes employees of Porvenir, Corficolombiana, BAC and their subsidiaries.
|
|
(2)
|
48.47% (4,788) of Banco de Bogotá’s direct employees (9,878) are represented by unions and 56.27% (5,558) of such employees are covered by collective bargaining agreements that expire in August 2015.
|
|
(3)
|
47.60% (3,844) of Banco de Occidente’s direct employees (8,076) are represented by unions and are covered by collective bargaining agreements that expire in December 2014.
|
|
(4)
|
43.75% (1,453) of Banco Popular’s direct employees (3,321) are represented by unions and 98.01% (3,255) of such employees are covered by collective bargaining agreements that expire in December 2014.
|
|
(5)
|
Less than 0.2% (7) of Banco AV Villas’ direct employees (4,179) are represented by unions.
|
|
(6)
|
Less than 0.2% (5) of Porvenir’s direct employees (2,532) are represented by unions.
|
|
(7)
|
Includes 1,478 employees of Grupo Financiero Reformador, which was acquired by BAC Credomatic on December 23, 2013 through its subsidiary Credomatic International Corporation.
|
Mr. Sarmiento Angulo beneficially owns
96.4%
of our outstanding common shares and
43.7%
of our preferred shares as determined under SEC rules at
April 22, 2015
. See “Item 7. Major Shareholders and Related Party Transactions—A. Major shareholders.” The following table provides the names of our other directors and key executive officers who owned shares of Grupo Aval at
April 22, 2015
.
|
Shareholder
|
Common shares
|
Percentage of outstanding common shares
|
Preferred shares
|
Percentage of outstanding preferred shares
|
||||||
|
José Hernán Rincón Gómez
|
1,280,542
|
0.01%
|
1,285,416
|
0.02%
|
||||||
|
Alejandro Figueroa Jaramillo
|
557,695
|
0.00%
|
1,538,460
|
0.02%
|
||||||
|
Juan María Robledo Uribe
|
323,920
|
0.00%
|
384,769
|
0.01%
|
||||||
|
Esther América Paz Montoya
|
251,718
|
0.00%
|
423,076
|
0.01%
|
||||||
|
Efraín Otero Álvarez
|
102,729
|
0.00%
|
300,000
|
0.00%
|
||||||
|
Gabriel Mesa Zuleta
|
85,868
|
0.00%
|
35,384
|
0.00%
|
||||||
|
Luis Fernando Pabón Pabón
|
78,237
|
0.00%
|
115,384
|
0.00%
|
||||||
|
Enrique Mariño Esguerra
|
49,687
|
0.00%
|
38,461
|
0.00%
|
||||||
|
Diego Fernando Solano Saravia
|
49,586
|
0.00%
|
152,078
|
0.00%
|
||||||
|
Julio Leonzo Álvarez Álvarez
|
47,694
|
0.00%
|
–
|
0.00%
|
||||||
|
José Mauricio Rodríguez Múnera
|
2,036
|
0.00%
|
–
|
0.00%
|
||||||
|
Germán Villamil Pardo
|
33,058
|
0.00%
|
–
|
0.00%
|
||||||
|
María José Arango Caicedo
|
21,908
|
0.00%
|
9,230
|
0.00%
|
||||||
|
Diego Rodríguez Piedrahita
|
–
|
0.00%
|
49,847
|
0.00%
|
||||||
|
Álvaro Velásquez Cock
|
8,264
|
0.00%
|
11,538
|
0.00%
|
||||||
|
Juan Camilo Ángel Mejía
|
7,319
|
0.00%
|
22,666
|
0.00%
|
||||||
|
Rodolfo Vélez Borda
|
7,112
|
0.00%
|
11,538
|
0.00%
|
||||||
|
Jorge Adrián Rincón Plata
|
–
|
0.00%
|
17,095
|
0.00%
|
||||||
|
Ana María Cuéllar de Jaramillo
|
–
|
0.00%
|
50,846
|
0.00%
|
||||||
|
Miguel Largacha Martínez
|
–
|
0.00%
|
172,680
|
0.00%
|
||||||
|
José Elías Melo Acosta
|
–
|
0.00%
|
–
|
0.00%
|
||||||
|
Carlos Ernesto Pérez Buenaventura
|
–
|
0.00%
|
–
|
0.00%
|
||||||
|
Carlos Eduardo Upegui Cuartas
|
–
|
0.00%
|
–
|
0.00%
|
||||||
|
Luis Carlos Sarmiento Gutiérrez
|
–
|
0.00%
|
–
|
0.00%
|
||||||
|
Edgar Enrique Lasso Fonseca
|
–
|
0.00%
|
–
|
0.00%
|
||||||
|
María Edith González Flórez
|
–
|
0.00%
|
–
|
0.00%
|
||||||
|
Rafael Eduardo Neira Torres
|
–
|
0.00%
|
–
|
0.00%
|
||||||
|
Mauricio Maldonado Umaña
|
–
|
0.00%
|
–
|
0.00%
|
||||||
|
José Manuel Ayerbe Osorio
|
–
|
0.00%
|
–
|
0.00%
|
||||||
|
Tatiana Uribe Benninghoff
|
–
|
0.00%
|
–
|
0.00%
|
||||||
|
Leopoldo Jesús Vásquez Sebastiani
|
–
|
0.00%
|
–
|
0.00%
|
||||||
|
Ernesto Castegnaro
|
–
|
0.00%
|
–
|
0.00%
|
||||||
Mr. Luis Carlos Sarmiento Angulo controls Grupo Aval and was the beneficial owner of 79.9% of our issued and outstanding share capital at April 22, 2015. He retained 96.4% of our voting power by virtue of his beneficial ownership of 96.4% of our outstanding common shares, and beneficially owned 43.7% of our outstanding preferred shares, as determined under SEC rules, at April 22, 2015. Beneficial ownership is defined in Form 20-F and generally includes voting or investment power over securities. Percentage of beneficial ownership is based on 22,281,017,159 of our aggregate equity securities outstanding comprising of 15,301,995,843 common shares outstanding and 6,979,021,316 preferred shares outstanding at April 22, 2015.
The principal shareholder, as a common shareholder and a preferred shareholder, does not have any different or special voting rights in comparison to any other common shareholder or preferred shareholder, respectively.
The following table sets forth information, as of December 31, 2014, regarding the beneficial ownership of our equity securities by:
|
|
·
|
Mr. Sarmiento Angulo, who beneficially owns 79.9% of our outstanding equity securities;
|
|
|
·
|
all directors and executive officers as a group; and
|
|
|
·
|
other shareholders.
|
|
At December 31, 2014
|
||||||||||||||||
|
Principal beneficial owners
|
Common shares
|
Percentage of outstanding
common shares
|
Preferred shares
|
Percentage of outstanding preferred shares
|
||||||||||||
|
Luis Carlos Sarmiento Angulo
|
14,758,013,849 | 96.0 | % | 3,048,024,627 | 44.1 | % | ||||||||||
|
Other directors and officers as a group
|
2,908,386 | * | 4,625,456 | * | ||||||||||||
|
Other shareholders
|
614,034,754 | 4.0 | % | 3,853,410,087 | 55.8 | % | ||||||||||
|
Total
|
15,374,956,989 | 100.0 | % | 6,906,060,170 | 100.0 | % | ||||||||||
|
*
|
less than 0.1%.
|
As of December 31, 2014, we had 78,229 holders of preferred shares registered in Colombia in addition to JPMorgan Chase Bank, N.A. as depositary of the ADRs evidencing ADSs. As of April 21, 2015, there were a total of 642 ADR holders of record and 69,840,137 ADRs outstanding, representing 1,396,802,740 preferred shares or
20.0% of outstanding preferred shares. Since some of these ADRs are held by nominees, the number of record holders may not be representative of the number of beneficial holders.
We currently engage in, and expect from time to time in the future to engage in, financial and commercial transactions with “related parties” (within the meaning of the SEC rules). Unless otherwise indicated below, such transactions are conducted on an arm’s-length basis in the ordinary course of business, on terms that would apply to transactions with third parties.
Loans or deposits involving related parties
The following chart presents outstanding amounts of related party transactions involving loans or deposits between Grupo Aval and its consolidated subsidiaries, and each of the following individuals and entities.
|
Transactions between Grupo Aval and its subsidiaries, and
|
||||||||||||||||
|
Grupo Aval’s directors and key management and their affiliates(1)
|
Close family members of Mr. Sarmiento Angulo and their affiliates
|
Mr. Sarmiento Gutiérrez and his affiliates
|
Mr. Sarmiento Angulo and his affiliates
|
|||||||||||||
|
(in Ps billions)
|
||||||||||||||||
|
At December 31, 2014
|
||||||||||||||||
|
Outstanding loans granted by us(2)
|
35.5 | 59.9 | 0.03 | 805 | ||||||||||||
|
Outstanding loans granted to us(3)
|
– | – | – | – | ||||||||||||
|
Deposits(4)
|
10.3 | 5.5 | 0.7 | 3,651 | ||||||||||||
|
At December 31, 2013
|
||||||||||||||||
|
Outstanding loans granted by us(2)
|
9.9 | 59.4 | 0.01 | 900 | ||||||||||||
|
Outstanding loans granted to us(3)
|
– | – | – | – | ||||||||||||
|
Deposits(4)
|
10.2 | 4.3 | 0.8 | 2,479 | ||||||||||||
|
(1)
|
Excludes Mr. Sarmiento Angulo and Mr. Sarmiento Gutiérrez and their affiliates. Key management includes executive officers of Grupo Aval as well as each of the presidents of our banks, Porvenir, Corficolombiana and BAC Credomatic.
|
|
(2)
|
Figures based on disbursed loans. See “—Loans granted to related parties by our banking subsidiaries.”
|
|
(3)
|
Figures based on disbursed. See “—Loans granted to Grupo Aval and its subsidiaries by shareholders of Grupo Aval and their affiliates.”
|
|
(4)
|
All deposits, including time deposits and investment portfolios, of all related parties held with us are made in the ordinary course of business, held at market rates and on terms and conditions not materially different from those available to the general public.
|
For information on related party transactions in accordance with Colombian disclosure rules, see note 27 to our audited consolidated financial statements. Required Colombian disclosures as to related party transactions differ from those required by the SEC. For the purposes of note 27 to our audited consolidated financial statements, “related parties” includes the principal shareholders of Grupo Aval, members of the board of directors, individuals who are legal representatives of Grupo Aval and companies in which Grupo Aval, its principal shareholders or board members have a direct equity interest of at least 10.0%. For the purposes of this section, and as required by SEC rules, “related parties” includes enterprises that control, or are under common control with Grupo Aval, associates, individuals owning directly or indirectly an interest in the voting power that gives them significant influence over Grupo Aval, close family members, key management personnel (including directors and senior management) and any enterprises in which a substantial interest in the voting power is owned, directly or indirectly, by any of the persons listed above. We determine beneficial ownership under SEC rules. See “—A. Major shareholders.”
In May 2011, our Board of Directors authorized Mr. Luis Carlos Sarmiento Angulo to acquire, directly or indirectly, common or preferred shares of the company up to an amount of Ps 30 billion.
Certain members of our board of directors and key management own shares of Grupo Aval which, other than in the case of Mr. Sarmiento Angulo, were acquired in the open market or in one of our public offerings and represent less than 0.1% of our total outstanding shares.
In January 2014 we completed our Common Share Rights Offering raising Ps 2.4 trillion (U.S.$1.3 billion) through the issuance of 1,855,176,646 of common shares. Subscription of the common shares was offered with preemptive rights to the existing shareholders of the company. Shareholders subscribing a total amount under their preemptive rights were allowed to subscribe an additional amount of common shares subject to terms of the approved rules. Mr. Luis Carlos Sarmiento Angulo acquired 1,852,895,755 common shares in the offering and, as the beneficial owner of approximately 95.2% of our issued and outstanding common shares at that time, fully exercised his preemptive rights as a part of the offering on the same terms as other common shareholders.
Loans granted to Grupo Aval and its subsidiaries by shareholders of Grupo Aval and their affiliates
Certain shareholders of Grupo Aval and their affiliates have granted loans to Grupo Aval and its subsidiaries on an arm’s-length basis and at market rates that are substantially consistent with interest rates and collateral that would have been available to such parties from other lenders at the time those borrowings were entered into. Such loans have been granted for general corporate purposes (including funding the acquisition of 13,726,421 mandatorily convertible bonds issued by Banco de Bogotá (converted into 29,205,152 shares of Banco de Bogotá)). Loans have been previously granted on an unsecured basis and a five-year term, with a two-year grace period. There are no outstanding loans granted to Grupo Aval by shareholders of Grupo Aval and their respective affiliates since December 20, 2013 through to April 22, 2015. The prior outstanding balance of Ps 1,373 billion (U.S.$713.7 million) relating to loans granted by Bienes y Comercio S.A., Adminegocios & Cía S.C.A. and Rendifin S.A. were fully repaid on December 18 and December 20, 2013 with proceeds from our 2014 Common Share Rights Offering (effected from December 16
th
, 2013 to January 17
th
, 2014).
The largest amount of loans (including guarantees) outstanding during the period from January 1, 2012 to December 31, 2014 was Ps
1,509.1
billion (U.S.$
853.5
million).
Business and financial reasons for borrowing from entities affiliated with Mr. Sarmiento Angulo
At April 22, 2015, there are no outstanding loans from companies beneficially owned by Mr. Sarmiento Angulo. However, in the past, we have borrowed from entities beneficially owned by Mr. Sarmiento Angulo. These loans have been entered into on an arm’s-length basis with us, the holding company, at a rate substantially consistent with rates that would have been available to the holding company from other lenders at the time those borrowings were entered into. The amount of the loans outstanding from companies beneficially owned by Mr. Sarmiento Angulo was 1,373 billion (U.S.$713.7 million) in 2013. Such amounts were repaid on December 18 and December 20, 2013 and there are no outstanding loans since December 20, 2013 through April 22, 2015.
Grupo Aval has chosen not to borrow from competing banks at the holding company level. Among our funding alternatives, in addition to the global and local bond markets are companies affiliated with our controlling shareholder. These companies provide us with a stable source of financing at rates that are substantially consistent with rates available to us from other lenders. In addition, these loans are executed in a shorter timeframe and at lower transaction costs than if borrowed from other potential sources of funding.
Loans granted to related parties by our banking subsidiaries
Key management of Grupo Aval and our banks, and their respective affiliates, who meet our credit eligibility requirements may subscribe to loans in the ordinary course of business, on market terms and conditions available to the general public.
All outstanding loans with our related parties are made in the ordinary course of business and on terms and conditions, including interest rates and collateral, not materially different from those available to the general public and did not involve more than the normal risk of collectability or present other unfavorable features.
In connection with our Preferred Shares Local Offering, certain members of our board of directors and key management were granted loans by our banking subsidiaries for the purpose of acquiring Grupo Aval preferred shares. These loans were granted at market rates and on terms and conditions not materially different from those available to other purchasers of Grupo Aval shares.
Other transactions with Mr. Sarmiento Angulo and his affiliates
Beneficial ownership in our banking subsidiaries (outside of Grupo Aval)
In addition to his beneficial ownership in Grupo Aval, Mr. Sarmiento Angulo beneficially owns at April
22, 2
015,
8.3
% of Banco de Bogotá,
13.3
% of Banco de Occidente,
15.5
% of Banco AV Villas,
0.8
% of Banco Popular, and
0.3
% of Corficolombiana.
On February 10, 2014 Grupo Aval’s Board of Directors authorized Adminegocios & Cia S.C.A., an affiliate of Mr. Sarmiento, to acquire preferred shares of Grupo Aval for a period of six months and up to Ps 150.0 billion (U.S.$62.7 million). As of December 31, 2014, Adminegocios had acquired 23,479,727 preferred shares or Ps 30.3 billion (U.S.$12.7 million) through open market transactions.
On August 13, 2014 Grupo Aval’s Board of Directors extended until August 13, 2015, the authorization issued on February 10, 2014 regarding the direct or indirect acquisitions by Mr. Luis Carlos Sarmiento Angulo of preferred shares of the company up to an amount of Ps 150.0 billion (U.S.$62.7 million). Such authorization was extended until August 13, 2015. As of April
22
, 2015, Mr. Luis Carlos Sarmiento Angulo had beneficially acquired
23,479,727
preferred shares or Ps
30.3
billion (U.S.$
12.7
million) through open market transactions.
Except as stated above, Mr. Sarmiento Angulo does not have any other beneficial ownership in our banking subsidiaries. For information on the dividend history of our banking subsidiaries, see “Item 10. Additional Information—F. Dividends and paying agents—Dividend history of our banking subsidiaries.”
Insurance services
Seguros de Vida Alfa S.A., or “Vida Alfa,” a life insurance affiliate of Mr. Sarmiento Angulo, provides insurance required by law, as well as annuities, relating to the mandatory pension funds managed by Porvenir. The insurance provider is selected by Porvenir through a competitive bidding process once every four years. Premiums under this insurance policy are deducted by Porvenir from the individual customers’ account and transferred to Vida Alfa on behalf of the individual customer.
The table below presents the insurance premiums paid for the periods indicated.
|
Period
|
Amount
|
|||
|
(in Ps billions)
|
||||
|
For the year ended December 31:
|
||||
|
2014
|
747.8 | (1) | ||
|
2013
|
395.6 | |||
|
2012
|
336.9 | |||
|
(1)
|
The increase in the insurance premiums for the year ended December 31, 2014 reflects the acquisition and merger of AFP Horizonte into Porvenir and an increase in the premiums’ rates under this insurance policy from 1.60% in 2013 to 1.85% in 2014.
|
Vida Alfa also provides:
|
|
·
|
life insurance, as sole provider and as co-insurer with non-affiliated insurers (pursuant to a competitive bidding process), for individual borrowers of our banking subsidiaries to cover the risk of non-payment upon death. Premiums are paid by the borrowers; and
|
|
|
·
|
workers compensation for all employees of Grupo Aval and its subsidiaries (except BAC Credomatic).
|
Seguros Alfa S.A., or “Alfa,” a property and casualty insurance affiliate of Mr. Sarmiento Angulo, provides fire and earthquake insurance for mortgage loans granted by certain of our banks. In addition, Alfa provides surety bonds and property insurance for our subsidiaries. Our banking subsidiaries also provide insurance products affiliated with Vida Alfa and Alfa through their bancassurance lines. These transactions are conducted on an arm’s-length basis in the ordinary course of business. Alfa has in the past, but not currently, provided bankers’ blanket bond coverage to us and our subsidiaries, reinsured under prevailing market conditions, and surety bonds for Corficolombiana’s toll-road concessions.
Other
The following companies are beneficially owned by Mr. Sarmiento Angulo, and may continue to provide services to us and our subsidiaries for amounts that are immaterial: Construcciones Planificadas S.A. (office renovations), Vigía S.A. (security services), and Corporación Publicitaria (advertising).
Not applicable.
Financial statements
See “Item 18. Financial Statements,” which contains our financial statements prepared in accordance with Colombian Banking GAAP.
Legal proceedings
We, our banking subsidiaries, Porvenir, Corficolombiana and our other subsidiaries are party to lawsuits and administrative proceedings incidental to the normal course of our business.
We record contingency provisions when the risk of loss is probable, in which case, we would consider settling. In cases where we litigate a claim, we record a provision for our estimate of the probable loss based on historical data for similar claims. Due to the provisions we have established and the legal opinions we have received, we do not believe that any liabilities related to such lawsuits or proceedings will have a material adverse effect on our financial conditions or results of operations. For the years ended December 31, 2014 and 2013, we and our banking subsidiaries had recorded consolidated provisions relating to administrative fines, indemnifications and legal proceedings for a total amount of approximately Ps 85.0 billion and Ps 83.4 billion, respectively.
Constitutional actions
We, our banking subsidiaries, Porvenir, Corficolombiana and our other subsidiaries are also party to collective or class actions (“
acciones populares
” or “
acciones de grupo
,” respectively). Collective actions are court actions where an individual seeks to protect collective rights and prevent contingent damages, obtain injunctions and damages caused by an infringement of collective rights of which the following are the most significant.
All pension and severance fund administrators in Colombia, including Porvenir, are subject to at least two class actions in which certain individuals are alleging that the pension and severance funds administrators have caused damages to their customers by (1) paying returns earned by the severance and pension funds below the minimum profitability certified by the Superintendency of Finance, and (2) making payments to its customers—under the scheduled retirement system—below the established standards. Additionally, Porvenir and certain other pension and severance funds are subject to a constitutional action relating to charging commissions above the legally established limits for contributions to mandatory pension funds. These constitutional actions are seeking the payment of the alleged damages caused to fund managers’ customers. No provisions have been established in connection with these three constitutional actions because the amount is unquantifiable, and we consider the probability of loss to be remote.
Banco de Bogotá, Banco de Occidente and Banco Popular are subject to two relevant constitutional actions that are described below.
|
|
·
|
A constitutional action filed by certain individuals on behalf of the taxpayers of Cali, claiming that Banco de Bogotá, Banco de Occidente and Banco Popular, among other financial institutions, unduly capitalized interest of certain obligations as creditors of the municipality of Cali in connection with credit facilities granted by such institutions, and therefore, are seeking the reimbursement of interest paid by the municipality in excess of the amounts due at June 30, 2009. We believe that the probability of loss in connection with this constitutional action is low (
eventual
) and, as such, have not recorded any provisions in connection with this constitutional action.
|
|
|
·
|
A constitutional action filed by certain individuals on behalf of the Department of Valle del Cauca (
Departamento del Valle del Cauca
) against several financial institutions, including Banco de Bogotá, Banco de Occidente, Banco Popular and Corficolombiana claims that the Department has paid interest in a manner prohibited by law, in connection with a credit facility granted to the Department. In addition, the plaintiffs are claiming that the defendants did not pay the alleged real value of the shares of Sociedad Portuaria de Buenaventura and Empresa de Energía del Pacífico, on a sale transaction of said shares. We consider the probability of loss in connection with this constitutional action to be low (
eventual
) and, therefore, have not recorded any provision.
|
Banco AV Villas is subject to constitutional actions brought against several companies in the financial sector in Colombia in connection with the recalculation of mortgage interests that allegedly damaged several mortgage lenders. Banco AV Villas has a comparatively small mortgage portfolio with respect to its main competitors, and we believe that the probability of loss in connection with these constitutional actions is remote.
Other litigation
We, our banking subsidiaries, Porvenir, Corficolombiana, BAC Credomatic and our other subsidiaries are from time to time subject to claims and parties to legal proceedings incidental to the normal course of our business, including in connection with our lending activities, employees, taxation matters and other general commercial matters. Due to the inherent difficulty of predicting the outcome of legal disputes, we cannot predict the eventual outcome of these pending matters, what the timing of the ultimate resolution of these matters will be or what the eventual loss, fines or penalties related to each pending matter may be. We believe that we have recorded adequate provisions for the anticipated costs in connection with these claims and legal proceedings and believe that liabilities related to such claims and proceedings should not, in the aggregate, have a material adverse effect on our business, financial conditions, or results of operations. However, in light of the uncertainties involved in such claims and proceedings, the ultimate resolution of these matters may exceed the provisions that we have currently recorded. As a result, the outcome of a particular matter could be material to our operating results for a particular period.
A discussion of the significant changes in our business can be found under “Item 4. Information on the Company—A. History and development of the company.”
Not applicable.
Not applicable.
Market price and volume information
Trading history of our ADSs
Our ADSs began trading on the NYSE under the symbol “AVAL” on September 23, 2014. The following table shows the quarterly range of the high and low per share closing sales price for our ADSs as reported by the NYSE.
|
New York Stock Exchange
|
||||||||||||
|
High
|
Low
|
Average daily trading volume
|
||||||||||
|
(U.S.$ per share)
|
(in shares)
|
|||||||||||
|
Year
|
||||||||||||
|
2014 (beginning September 23)
|
13.78 | 9.46 | 13,590,762 | |||||||||
|
Quarter
|
||||||||||||
|
Third quarter 2014 (beginning September 23)
|
13.78 | 13.55 | 88,793,588 | |||||||||
|
Fourth quarter 2014
|
13.61 | 9.46 | 6,540,497 | |||||||||
|
First quarter 2015
|
10.69 | 8.50 | 5,959,320 | |||||||||
|
Month
|
||||||||||||
|
October 2014
|
13.61 | 12.65 | 5,334,970 | |||||||||
|
November 2014
|
13.59 | 12.42 | 4,950,640 | |||||||||
|
December 2014
|
12.14 | 9.46 | 9,173,879 | |||||||||
|
January 2015
|
10.58 | 9.91 | 7,632,807 | |||||||||
|
February 2015
|
10.69 | 9.74 | 4,697,071 | |||||||||
|
March 2015
|
9.73 | 8.50 | 5,528,091 | |||||||||
|
April 2015 (through April 22)
|
9.50 | 9.16 | 2,717,993 | |||||||||
Source:
New York Stock Exchange.
On April 22, 2015, the last reported closing sale price on the New York Stock Exchange was U.S.$9.49 per ADS.
Trading history of our preferred shares
Our preferred shares have been listed since February 1, 2011 on the Colombian Stock Exchange under the symbol “PFAVAL” and we first issued preferred shares on May 12, 2011 at the conclusion of the Preferred Shares Local Offering. The following table presents the high and low closing sales prices for the periods indicated, and average daily trading volume for our preferred shares on the Colombian Stock Exchange.
|
Colombian Stock Exchange
|
||||||||||||
|
High
|
Low
|
Average daily trading volume
|
||||||||||
|
(Ps per share)
|
(in shares)
|
|||||||||||
|
Year
|
||||||||||||
|
2011 (beginning May 12)
|
1,320 | 1,120 | 3,363,366 | |||||||||
|
2012
|
1,325 | 1,130 | 3,077,023 | |||||||||
|
2013
|
1,435 | 1,235 | 4,323,943 | |||||||||
|
2014
|
1,455 | 1,135 | 6,026,633 | |||||||||
|
Quarter
|
||||||||||||
|
First quarter 2013
|
1,305 | 1,255 | 3,799,814 | |||||||||
|
Second quarter 2013
|
1,430 | 1,235 | 6,906,810 | |||||||||
|
Third quarter 2013
|
1,435 | 1,315 | 4,074,499 | |||||||||
|
Fourth quarter 2013
|
1,400 | 1,240 | 2,505,641 | |||||||||
|
First quarter 2014
|
1,305 | 1,135 | 2,415,869 | |||||||||
|
Second quarter 2014
|
1,360 | 1,285 | 3,210,991 | |||||||||
|
Third quarter 2014
|
1,455 | 1,345 | 9,275,897 | |||||||||
|
Fourth quarter 2014
|
1,445 | 1,155 | 9,000,408 | |||||||||
|
Colombian Stock Exchange
|
||||||||||||
|
High
|
Low
|
Average daily trading volume
|
||||||||||
|
(Ps per share)
|
(in shares)
|
|||||||||||
|
First quarter 2015
|
1,285 | 1,140 | 7,266,326 | |||||||||
|
Month
|
||||||||||||
|
October 2014
|
1,395 | 1,315 | 8,276,456 | |||||||||
|
November 2014
|
1,445 | 1,390 | 5,735,683 | |||||||||
|
December 2014
|
1,380 | 1,155 | 12,735,009 | |||||||||
|
January 2015
|
1,285 | 1,215 | 7,352,457 | |||||||||
|
February 2015
|
1,260 | 1,210 | 3,521,368 | |||||||||
|
March 2015
|
1,230 | 1,140 | 10,750,924 | |||||||||
|
April 2015 (through April 22)
|
1,190 | 1,135 | 9,681,273 | |||||||||
Source:
Colombian Stock Exchange.
On April
22
, 2015, the last reported closing sale price on the Colombian Stock Exchange was Ps
1,180
per preferred share.
Trading on the Colombian Stock Exchange
The Colombian Stock Exchange is the sole trading market for our common and preferred shares. There are no official market makers or independent specialists on the Colombian Stock Exchange to assure market liquidity and, therefore, orders to buy or sell in excess of corresponding orders to sell or buy will not be executed. The aggregate equity market capitalization of the
75
companies listed on the Colombian Stock Exchange at April
22
, 2015 was Ps
338.6
trillion (U.S.$
137.2
billion at the representative market exchange rate of April
22
, 2015). See “Item 4. Information on the Company—B. Business Overview—Industry—Colombia—Recent developments in the Colombian stock market.”
Regulation of Colombian Securities Markets
Colombian securities markets are subject to the supervision and regulation of the Superintendency of Finance, which was created in 2005 following the merger of the Superintendency of Banking and the Superintendency of Securities. The Superintendency of Finance is an independent regulatory entity ascribed to the Ministry of Finance. The Superintendency of Finance has the authority to inspect, supervise and control the financial, insurance and securities exchange sectors and any other activities related to the investment or management of public savings. Accordingly, we are subject to the control of the Superintendency of Finance as an issuer of securities, and our subsidiaries are subject to its control, supervision and regulation as financial institutions and issuers of securities. See “Item 4. Information on the Company—B. Business Overview—Supervision and regulation—Colombian banking regulators—Ministry of Finance” and “—Superintendency of Finance.”
Registration of the ADR Program and Investment in Our ADSs by Non-Residents of Colombia
The International Investment Statute of Colombia as provided by Decree 2080 of 2000, as amended, regulates the manner in which foreign investors may participate in the Colombian securities markets and undertake other types of investment, prescribes registration with the Colombian Central Bank of certain foreign exchange transactions and specifies procedures under which certain types of foreign investments are to be authorized and administered.
The International Investment Statute provides specific procedures for the registration of ADR programs as a form of foreign portfolio investment, which is required for the acquisition of the preferred shares to be offered in the form of ADSs. In addition, a holder of our ADSs or preferred shares may under certain circumstances be required to comply directly with certain registration and other requirements under the foreign investment regulations. Under these regulations, the failure of a non-resident investor to report or register foreign exchange transactions relating to investments in Colombia with the Colombian Central Bank on a timely basis may prevent the investor from obtaining remittance payments, including for the payment of dividends, and constitute an exchange control violation and/or result in a fine.
Each individual investor who deposits preferred shares into the ADR facility in exchange for our ADSs (other than in connection with this offering) will be required, as a condition to acceptance by Fiduciaria Bogotá S.A., or “Fidubogotá,” as custodian of such deposit, to provide or cause to be provided certain information to Fidubogotá and/or the Depositary to enable it to comply with the registration requirements under the foreign investment regulations relating to foreign exchange. A holder of ADSs who withdraws preferred shares from the ADS deposit facility under certain circumstances may be required to comply directly with certain registration and other requirements under the foreign investment regulations. Under these regulations, the failure of a non-resident investor to report or register foreign exchange transactions relating to investments in Colombia with the Central Bank on a timely basis may prevent the investor from obtaining remittance payments, including for the payment of dividends, constitute an exchange control violation and/or result in a fine.
Under Colombian law, foreign investors receive the same treatment as Colombian citizens with respect to the ownership and voting of our ADSs and preferred shares. See “Item 3. Key Information—D. Risk factors—Risks relating to our preferred shares and ADSs” and “Item 4. Information on the Company—B. Business overview—Supervision and regulation—Restrictions on foreign investment in Colombia.”
Not applicable.
Not applicable.
Not applicable.
Not applicable.
The following is a summary of certain significant provisions of our by-laws, Colombian corporate law, the rules and regulations of the Superintendency of Finance and the Listing Rules of the Colombian Stock Exchange that pertain to our capital, management, periodical and occasional disclosures, as well as other corporate issues applicable to us. The description below includes the material provisions of our by-laws and Colombian corporate law. In Colombia, by-laws are the principal governing document of a corporation.
Our by-laws provide for an authorized share capital of 120,000,000,000 shares of par value of Ps 1.00 each, which may be either of two classes: common shares or shares with a preferred dividend, liquidation preference and no voting. At April 22, 2015, we had 15,301,995,843 common shares outstanding, and 6,979,021,316 preferred shares outstanding.
Our by-laws also provide for the conversion of common shares into preferred shares only when such conversion is approved or authorized at a general shareholders’ meeting. A shareholders’ meeting must define, in each case, the procedure to be followed for such conversion and must determine, among other matters, the maximum number or percentage of shares that may be converted. The shareholders’ meeting may also authorize the Board of Directors or the President of our Company to approve the agreements, forms and other documents to be executed in order to give effect to a conversion.
Our shareholders’ meeting held on December 7, 2010, determined that outstanding common shares may be converted into preferred shares on a 1-to-1 basis. Conversion of common shares into preferred shares may only be made once a month, provided that, as required by Colombian law and in accordance with our by-laws, our preferred shares shall not exceed 50% of our subscribed capital.
For a description of offerings of our shares see “Item 4. Information on the Company—B. Business overview—Our history.”
Voting Rights
Common Shares
The holders of common shares are entitled to vote on the basis of one vote per share on any matter subject to approval at a general shareholders’ meeting according to articles 14 through 19 of the by-laws, as amended from time to time. These general meetings may be ordinary meetings or extraordinary meetings. Ordinary general shareholders’ meetings occur twice a year, no later than the last business day of March and September, for the following purposes:
|
|
·
|
to review the general situation of the Company;
|
|
|
·
|
to determine the general economic policy of the Company;
|
|
|
·
|
to consider the approval of our report for the preceding semester ending on June 30 or December 31, as applicable, including the financial statements for the above-mentioned term;
|
|
|
·
|
to review the report prepared by the external auditor for the preceding semester ending on June 30 or December 31;
|
|
|
·
|
to elect directors and the external auditor (on an annual basis);
|
|
|
·
|
to determine the compensation of the members of the board of directors and the external auditor (on an annual basis); and
|
|
|
·
|
to determine the dividend policy and the allocation of profits, if any, of the preceding semester ending on June 30 or December 31, respectively, as well as any retained earnings from six months.
|
Pursuant to Law 964 of 2005, at least 25% of the members of our board of directors must be independent within the meaning of Colombian rules. A person who is an “independent director” is understood to mean a director who is not:
|
|
·
|
an employee or executive officer of the issuer or any of its parent or subsidiary companies, including any person acting in such capacity during the year immediately preceding that in which they were appointed to the board, except in the case of an independent member of the board of directors being re-elected;
|
|
|
·
|
a shareholder, who either directly or by virtue of an agreement directs, guides or controls the majority of the entity’s voting rights or who determines the majority composition of the administrative, directing or controlling bodies of this same entity;
|
|
|
·
|
a partner or employee of any association or firm that provides advisory or consultancy services to the issuer or to companies belonging to the same economic group to which such issuer belongs, in the event that income obtained from such services represent for said association or firm at least twenty percent (20.0%) of its total operating income;
|
|
|
·
|
an employee or executive officer of a foundation, association, partnership or corporation that receives significant donations from the issuer. The term “significant donations” is quantified as twenty percent (20.0%) or more of the total amount of donations received by the respective institution;
|
|
|
·
|
an administrator of any entity on whose board of directors a legal representative of the issuer participates; or
|
|
|
·
|
a board member who receives from the issuer any kind of remuneration other than fees as a member of the board of directors, member of the audit committee or any other committee established by the board of directors.
|
Pursuant to Decree 3923 of 2006, the election of independent directors must be in a ballot separate from the ballot to elect the rest of the directors, unless the reaching of the minimum number of independent directors required by law or by the by-laws is assured, or when there is only one list that includes the minimum number of independent directors required by law or by the by-laws.
Both elections are made under a proportional representation voting system named electoral quotient—”
cociente electoral
” (except for the elections unanimously approved by the general shareholders’ meeting). Under that system:
|
|
·
|
each holder of common shares is entitled at the first annual general shareholders’ meeting to nominate candidates for the election of directors;
|
|
|
·
|
each nomination of one or more directors by a shareholder constitutes a list for the purposes of the election;
|
|
|
·
|
each list of nominees must contain a hierarchy as to the order of preference for nominees in that list to be elected;
|
|
|
·
|
once all lists have been nominated, holders of common shares may cast one vote for each common share held in favor of a particular list of nominees. Votes may not be cast for particular nominees in a list; they may be cast only for the entire list;
|
|
|
·
|
the total number of votes cast in the election is divided by the number of directors to be elected. The resulting quotient is the quota of votes necessary to elect particular directors. For each time that the number of votes cast for a list of nominees is divisible by the quota of votes, one nominee from that list is elected, in the order of the hierarchy of that list; and
|
|
|
·
|
when no list has enough remaining votes to satisfy the quota of votes necessary to elect a director, any remaining board seat or seats are filled by electing the highest remaining nominee from the list with the highest number of remaining votes cast until all available seats have been filled.
|
There is no age limit requirement for the election or retirement of directors. No minimum number of shares is required for a director’s qualification. Directors may be removed by shareholders entitled to vote prior to the expiration of their term.
Extraordinary general shareholders’ meetings may take place when duly called for a specified purpose or purposes, or, without prior notice, when holders representing all outstanding shares entitled to vote on the issues presented are present at the meeting. Extraordinary meetings of shareholders may be called by our president, our board of directors or the certified public accountant, directly or by request of a plural number of shareholders representing no less than 25.0% of the company’s capital, in which case an announcement must be made by the board of directors, the legal representative or the certified public accountant. In addition, meetings may be called by the Superintendency of Finance, directly or by request of shareholders holding at least 15.0% of the shares outstanding. Notice of extraordinary meetings should be given at least five days in advance.
Quorum for ordinary and extraordinary general shareholders’ meetings to be convened at first call requires the presence of multiple shareholders who represent at least 50.0% plus one of the outstanding shares entitled to vote at the relevant meeting. If no quorum is present for a general shareholders’ meeting, a subsequent meeting may be called within 10 to 30 business days at which the presence of two or more shareholders entitled to vote at the relevant meeting constitutes quorum, regardless of the number of shares represented.
Notice of ordinary general meetings must be published in one newspaper of wide circulation, at least 15 business days prior to the proposed date of a general shareholders’ meeting. Notice of extraordinary general meetings, listing the matters to be addressed at such meetings, must be published in one newspaper of wide circulation, at least five calendar days prior to the proposed date of an extraordinary general shareholders’ meeting.
Except where Colombian law requires a supermajority, decisions made at a shareholders’ meeting must be approved by a majority of the shares present. Pursuant to Colombian law and/or our by-laws, special-majorities are required in the following cases:
|
|
·
|
the vote of at least 70.0% of the shares present and entitled to vote at a shareholders’ meeting is required to approve the issuance of common shares not subject to preemptive rights;
|
|
|
·
|
the Company must distribute (1) at least 50.0% of the semester’s net profits according to Article 155 of the Colombian Code of Commerce, or (2) at least 70.0% of the semester’s net profits if the total amount segregated in the legal, statutory and other reserves exceeds the Company’s outstanding capital, according to Article 454 of the Colombian Code of Commerce; however, the vote of at least 78.0% of the shares represented and entitled to vote may approve the distribution of a lower percentage of dividends;
|
|
|
·
|
the vote of at least 80.0% of the shares present and entitled to vote is required to approve the payment of dividends in shares; however, according to Law 222 of 1995, if a “situation of control” exists, whereby the decision-making power is subject to the will of a person or group of persons, a company may only pay dividends by issuing shares, to the shareholders that so accept;
|
|
|
·
|
unanimity is required to replace a vacancy on the board of directors without applying the electoral quotient system described above; and
|
|
|
·
|
the vote of 70.0% of the issued and outstanding common shares and 70.0% of the outstanding and issued preferred shares is required to approve any amendment that may impair the rights of the preferred shares.
|
The adoption by a shareholders’ meeting of certain corporate actions such as mergers,
escisiones
, and share conversions are also subject to authorization by the Superintendency of Finance.
Preferred Shares
The holders of preferred shares are not entitled to receive notice of, attend or vote at any general shareholders’ meeting of holders of common shares, except as described below.
The holders of preferred shares will be entitled to vote on the basis of one vote per share at any shareholders’ meeting, whenever a shareholder vote is required on the following matters:
|
|
·
|
in the event that amendments to our by-laws may impair the conditions or rights assigned to such preferred shares and when the conversion of such shares into common shares is to be approved. In both such cases, the vote of 70.0% of the outstanding and issued common shares and preferred shares is required; and
|
|
|
·
|
if at the end of any six-month period, our profits are not sufficient to pay the minimum dividend on the preferred shares and the Superintendency of Finance, by its own decision or upon request of holders of at least 10.0% of preferred shares, determines that benefits were concealed or shareholders were misled with regard to benefits thereby decreasing the profits to be distributed, the Superintendency of Finance may resolve that holders of preferred shares should participate with speaking and voting rights at the general shareholders’ meeting, in the terms established by law.
|
We must issue a notice of any meeting at which holders of preferred shares are entitled to vote. The notice must be published in a newspaper of wide circulation. Depending on the matters to be subjects of the shareholders meeting, notice to preferred shareholders must be delivered at least 15 business days or 5 calendar days before the meeting. Each notice must contain the following:
|
|
·
|
the date of the meeting;
|
|
|
·
|
a description of any resolution to be proposed for adoption at the meeting on which the holders of preferred shares are entitled to vote; and
|
|
|
·
|
instructions for the delivery of proxies.
|
Redemption
All shareholders (whether holders of common or preferred shares) have, at their option, a redemption right in the following cases:
|
|
·
|
If, as a result of a merger, transformation or
escisión
of the Company, (a) the shareholders must assume a higher level of liability (i.e., by transforming a corporation into a partnership), or (b) the economic rights of
|
the shareholders are impaired. In these events, the shareholders that were not present at the meeting in which the decision was taken or voted against it, may exercise the redemption right.
|
|
·
|
Pursuant to Colombian Law (Article 12 of Law 222 of 1995), the economic rights of shareholders are deemed to be impaired if:
|
|
|
·
|
their ownership percentage is reduced as a result of the merger, transformation or
escisión
of the Company;
|
|
|
·
|
the equity value or the par value of the shares is reduced (in the latter case, only to the extent that the reduction of the par value implies a decrease in the Company’s stock capital); and
|
|
|
·
|
the negotiability of the shares is restricted or diminished.
|
|
|
·
|
If the Company decides to withdraw the listing of its shares from a stock exchange or its registration before the National Registry of Shares and Issuers.
|
The exercise of this right is regulated by Articles 15 and 16 of Law 222 of 1995. According to Article 15, within five days following notice of the exercise of this right by a shareholder, the Company must offer to the other shareholders the shares owned by the exercising shareholder. Within the following 15 days, the other shareholders may acquire the shares on a pro rata basis. If all or a part of the shares are not acquired by the other shareholders, then the Company must reacquire them to the extent there are profits or reserves built up by the Company for those purposes. If neither the shareholders nor the Company acquires all of the shares owned by the exercising shareholder, then pursuant to Article 16 of Law 222 of 1995, such exercising shareholder is entitled to the reimbursement of the capital contributions made to the Company.
In both cases, the redemption price of the shares will be established by the agreement of seller and buyer. In the absence of such agreement, the redemption price will be determined by an expert appraiser. Notwithstanding the above, the by-laws may establish other methods for determining the redemption price to be paid in the foregoing circumstances. Our current by-laws do not contemplate such other methods.
Dividends
Common Shares
Following the approval of the financial statements at a general shareholders’ meeting, shareholders may determine the allocation of distributable profits, if any, of the preceding six months by a resolution approved by the majority of the holders of common shares present at the ordinary general shareholders’ meeting, pursuant to the recommendation of the board of directors and management.
Under the Colombian Code of Commerce, a company must, after payment of income taxes and appropriation of legal reserves, and after off-setting losses from prior terms, distribute at least 50.0% of net profits to all shareholders, payable in cash, or as determined by the shareholders, within a period of one year following the date on which the shareholders determine the dividends. If the total amount segregated in the legal, statutory and occasional reserves of a company exceeds its outstanding capital, this percentage is increased to 70.0%. The minimum common shares dividend requirement of 50.0% or 70.0%, as the case may be, may be waived by a favorable vote of the holders of 78.0% of a company’s common shares present at the meeting, in which case the shareholders may distribute any percentage of the net profits. The dividends may be paid in shares if such proposal is approved by representatives of eighty (80%) of the shares present at the meeting.
Under Colombian law and our by-laws, net profits obtained in each semester are to be allocated as follows:
|
|
·
|
first, an amount equivalent to 10.0% of net profits is segregated to build a legal reserve, until that reserve is equal to at least 50.0% of our subscribed capital;
|
|
|
·
|
second, payment of the minimum dividend on the preferred shares; and
|
|
|
·
|
third, allocation of the balance of the net profits is determined by the holders of a majority of the common shares entitled to vote on the recommendation of the board of directors and the president and may, subject to further reserves required by the by-laws, be distributed as dividends.
|
Under Colombian law, the dividends payable to the holders of common shares, for each common share, cannot exceed the dividends payable to holders of the preferred shares, for each preferred share. All common shares that are fully paid-in and outstanding at the time a dividend or other distribution is declared are entitled to share equally in that dividend or other distribution. Common shares that are only partially paid-in participate in a dividend or distribution in the same proportion as the shares have been paid in at the time of the dividend or distribution.
The general shareholders’ meeting may allocate a portion of the profits to, among others, welfare, education or civic services.
Preferred Shares
Holders of preferred shares are entitled to receive a minimum dividend after deducting losses affecting the capital, and deducting any amounts set aside for legal reserve, but before creating or accruing for any other reserve and before any declared dividends are paid to holders of common shares, so long as dividends have been approved by the shareholders’ meeting of Grupo Aval. Dividends to holders of common and preferred shares must be approved by the shareholders. If no dividends are declared, no holder of Grupo Aval’s preferred or common shares will be entitled to payment. The minimum dividend will be equal to Ps 1.00 in each calendar semester, so long as this value is higher than the dividend paid to the holders of common shares. If the minimum preferred dividend is not equal or higher than the per share dividend on the common shares, the minimum dividend will be equal to the dividend paid to the holders of common shares, if any.
Payment of the preferred dividend shall be made at the time and in the manner established in the general shareholders’ meeting and with the priority indicated by Colombian law.
Grupo Aval is under a “situation of control” (whereby the decision-making power is subject to the will of a person or group of persons). As a result, the Company may only pay stock dividends to the shareholders that so accept it. Those shareholders that do not accept to receive a stock dividend, are entitled to receive their dividend in cash.
For additional information regarding dividends, see “—F. Dividends and paying agents—Dividend policy of Grupo Aval.”
General Aspects Involving Dividends
The dividend periods may be different from the periods covered by the balance sheet. In the general shareholders’ meeting, shareholders will determine such dividend periods, the effective date, and the method and the place for payment of dividends.
Dividends declared on the common shares and the preferred shares will be payable to the record holders of those shares, as they are recorded on our share registry, on the appropriate dates as determined in the general shareholders’ meeting. However, in accordance with Decree 4766 of December 14, 2011 (which amended articles 2.23.1.1.4 and 2.23.1.1.5 of Decree 2555 of 2010), issued by the Ministry of Finance:
|
|
·
|
companies whose shares are registered with the National Registry of Shares and Issuers must establish a period of at least three trading days between the date that they receive approval to distribute profits from the General Shareholders Assembly and the date of payment; and
|
|
|
·
|
the ex-dividend period (
fecha ex-dividendo
) is the period during which it is understood that a purchase of shares does not include the right to receive dividends. The ex-dividend date shall be set forth by stock exchanges, and it cannot be less than two trading days. According to Colombian Stock Exchange regulations, a transaction is “ex-dividend” if it takes place between the first day of dividend payment and the four trading days preceding that date.
|
Liquidation Rights
We will be dissolved if certain events take place, including the following:
|
|
·
|
our term of existence, as stated in our by-laws, set at May 25, 2044, expires without being extended by the shareholders prior to its expiration date;
|
|
|
·
|
losses cause the decrease of our shareholders’ equity below 50% of the amount of outstanding share capital, unless one or more of the corrective measures described in the Colombian Code of Commerce are adopted by the shareholders within six months;
|
|
|
·
|
by decision at the general shareholders’ meeting; and
|
|
|
·
|
in certain other events expressly provided by law and in the by-laws.
|
Upon dissolution, a liquidator must be appointed by a general meeting of the shareholders to wind up the affairs of our company.
Upon liquidation, and out of the surplus assets available for distribution to shareholders, holders of fully paid preferred shares are entitled to a preference in the reimbursement of their contribution (“
aporte
” as provided by article 63 of Law 222 of 1995) to Grupo Aval. This reimbursement, if any, is payable in pesos before any distribution or payment may be made to holders of common shares. If, upon any liquidation, assets that are available for distribution among the holders of preferred shares are insufficient to pay in full their respective liquidation preferences, such assets will be distributed among those holders pro rata.
Subject to the preferential liquidation rights of holders of preferred shares, and provided there are still sufficient assets remaining, all fully paid common shares will be entitled to participate in any distribution upon liquidation. Partially paid common shares must participate in a distribution upon liquidation in the same proportion that those shares have been paid at the time of the distribution.
To the extent there are surplus assets available for distribution after full payment to the holders of preferred and common shares of their contribution to Grupo Aval, the surplus assets will be distributed among all holders of shares of share capital (common or preferred), pro rata, in accordance with their respective holdings of shares.
Preemptive Rights and Other Anti-Dilution Provisions
Pursuant to the Colombian Code of Commerce, we are allowed to have an outstanding amount of share capital that is less than the authorized share capital set out in our by-laws. Under our by-laws, the holders of common shares determine the amount of authorized share capital, and our board of directors has the power to (1) order the issuance and regulate the terms of subscription of common shares up to the total amount of authorized share capital, and (2) regulate the issuance of preferred shares, when expressly delegated at the general shareholders’ meeting. The issuance of preferred shares must be approved by the general shareholders’ meeting, which shall determine the nature and extent of any rights, according to our by-laws and Colombian law.
At the time of incorporation of a Colombian company, its outstanding share capital must represent at least 50% of the authorized capital. Any increases in the authorized share capital or decreases in the outstanding share capital must be approved by the majority of shareholders required to approve a general amendment to the by-laws.
Colombian law requires that, whenever we issue new common shares, we must offer to the holders of common shares the right to subscribe a number of common shares sufficient to maintain their existing ownership percentage of the aggregate share capital. These rights are preemptive rights. On the other hand, holders of preferred shares are entitled to preemptive rights only in the specific situations that the shareholders’ meeting so decides. See “Item 3. Key Information—D. Risk factors—Risks relating to our preferred shares and ADSs.”
Common shareholders at a general shareholders’ meeting may waive preemptive rights with respect to a particular capital increase by the favorable vote of at least 70.0% of the shares represented at the meeting. Preemptive rights must be exercised within the period stated in the share placement terms of the increase, which cannot be less than 15 business days following the publication of the notice of the public offer of that capital
increase. From the date of the notice of the share placement terms, preemptive rights may be transferred separately from the corresponding shares.
The Superintendency of Finance will authorize a decrease in the outstanding share capital approved by the holders of common shares only if:
|
|
·
|
we have no outstanding liabilities;
|
|
|
·
|
our creditors consent in writing; or
|
|
|
·
|
the outstanding share capital remaining after the reduction represents at least twice the amount of our liabilities.
|
Restrictions on Purchases and Sales of Share Capital by Related Parties
Pursuant to the Colombian Code of Commerce, the members of our board of directors and certain of our principal executive officers may not, directly or indirectly, buy or sell shares of our share capital while they hold their positions, unless they obtain the prior approval of the board of directors passed with the vote of two-thirds of its members (excluding, in the case of transactions by a director, such director’s vote). Furthermore, pursuant to Article 262 of the Colombian Code of Commerce, Grupo Aval’s subsidiaries are prohibited from owning (directly or indirectly) shares of Grupo Aval.
In addition, as our shares are publicly traded on the Colombian Stock Exchange, the transfer of the shares is subject to the tender offer rules.
Pursuant to Article 23 of Law 222 of 1995, the members of our board of directors and our legal representatives generally must perform their duties according to the principles of good faith, due diligence and loyalty. In particular, the directors and legal representatives must refrain from entering into any transaction (including any sale and purchase of shares) which may imply competition with the Company or a conflict of interests, unless they obtain the prior approval of the General Shareholders Meeting, which, in any case, shall only be granted if the respective transaction does not harm the Company’s interests. The Company, in the ordinary course of its business, may enter into transactions with its directors.
Under the Company’s by-laws, directors have no power to vote on compensation to themselves or any members of the Board of Directors. This task is specifically assigned to the shareholders entitled to vote.
Transfer and Registration of Shares
Grupo Aval’s common and preferred shares are listed on the Colombian Stock Exchange. According to Colombian regulations, shares listed on a stock exchange must be sold and transferred only through such exchange, unless such shares were issued outside Colombia and are transferred outside Colombia, or unless the share purchase transaction amounts to a value that is lower than the regulatory threshold of 66,000 UVRs, as required by Article 6.15.1.1.2 of Decree 2555 of 2010. In addition, among others, the following transactions are not required to be effected through the relevant stock exchange:
|
|
·
|
transfers between shareholders with the same beneficial owner;
|
|
|
·
|
transfers of shares owned by financial institutions that are being liquidated under the control and supervision of the Superintendency of Finance;
|
|
|
·
|
issuer repurchases;
|
|
|
·
|
transfers by the State; and
|
|
|
·
|
any other transactions as may be authorized by the Superintendency of Finance.
|
Under Colombian law, shares may be traded either in physical form or electronic form. Transfers of shares are subject to a registry system which differs depending on whether the shares are evidenced in electronic form or physical form. Transfers of shares evidenced by electronic certificates must first be registered with a securities
central depositary through a stockbroker. The main purpose of the securities central depositary is to receive, safe keep and manage securities certificates issued by corporations in order to keep a record of the transactions undertaken over such securities, including transfers, pledges and withdrawals. Accordingly, they are not allowed to hold, invest or otherwise use the securities held under their custody.
Transfer of shares evidenced by electronic or physical certificates, as the case may be, must be registered on the company’s share ledger. Only those holders registered on the share ledger are recognized as shareholders. Registration requires endorsement of the certificates or a written instruction from the holder. In the case of electronic certificates, the securities central depositary notifies us regarding the transfer of shares after registering it in its system.
All of our shares are currently deposited with the securities central depositary (Deceval).
LB Panamá entered into two U.S.$135.0 million, totaling U.S.$270.0 million, five-year term loans with Bancolombia and Bancolombia Miami Agency at 180 day LIBOR plus 3.125% on November 26, 2010 to finance, in part, the acquisition of BAC Credomatic.
On February 1, 2012, we entered into an indenture in connection with our issuance of U.S.$600 million (Ps 1,083.6 billion at the date of the issuance) of 5.25% Senior Notes due 2017. The indenture was among us, as guarantor, Grupo Aval Limited, as Issuer, Deutsche Bank Trust Company Americas, as Trustee, Registrar, Paying Agent and Transfer Agent and Deutsche Bank Luxembourg S.A., as Luxembourg Paying Agent and Transfer Agent.
On September 19, 2012, we entered into an indenture in connection with our issuance of U.S.$1.0 billion (Ps 1,795.7 billion at the date of the issuance) of 4.75% Senior Notes due 2022. The indenture was among us, as guarantor, Grupo Aval Limited, as Issuer, Deutsche Bank Trust Company Americas, as Trustee, Registrar, Paying Agent and Transfer Agent and Deutsche Bank Luxembourg S.A., as Luxembourg Paying Agent and Transfer Agent.
Restrictions on Foreign Investment in Colombia
Colombia’s foreign investment statute regulates the manner in which non-residents are permitted to invest in Colombia and participate in the Colombian securities market. Among other requirements, Colombian law requires foreign investors to register certain foreign exchange transactions with the Colombian Central Bank and obtain authorization for certain types of investments. Certain foreign exchange transactions, including those between residents and non-residents, must be made through authorized foreign exchange intermediaries.
Non-residents are permitted to hold portfolio investments in Colombia, through either a registered stock brokerage firm, a trust company or an investment firm. Investors would only be allowed to transfer dividends abroad after the foreign investment registration procedure with the Colombian Central Bank has been completed. The failure of a non-resident investor to report or register foreign exchange transactions with the Colombian Central Bank relating to investments in Colombia on a timely basis may prevent the investor from remitting dividends, or an investigation that may result in a fine, may be commenced.
The following summary contains a description of certain Colombian and U.S. federal income tax consequences of the acquisition, ownership and disposition of ADSs and preferred shares, but it does not purport to be a comprehensive description of all the tax considerations. The summary is based upon the tax laws of Colombia and regulations thereunder and on the tax laws of the United States and regulations thereunder as of the date hereof, which are subject to change
.
Colombian Tax Considerations
For purposes of Colombian taxation, depending on the individual, residence consists of one of the following hypotheses:
|
|
·
|
Aliens
: The continuous or discontinuous presence in the country for more than 183 days including entry and exit days, within any period of 365 consecutive calendar days. For this purpose, when the continuous or discontinuous presence in the country happens in more than one taxable year, the person would be considered as a resident from the second taxable year.
|
|
|
·
|
Diplomatic employees of the Colombian State and their companions
: totally or partially exempted from income tax or capital gains tax in the country in which they are performing their work, according to the Vienna Conventions about diplomatic and consular relationships.
|
|
|
·
|
Colombian nationals if
: (i) the spouse or permanent companion or dependent children are residents in Colombia for tax purposes; or, (ii) 50% or more of their income is considered to be Colombian-source income; or, (iii) 50% or more of their assets are managed within Colombia; or, (iv) 50% or more of their assets are deemed to be possessed in Colombia; or, (v) foreign residency status has not been demonstrated as required by the Colombian Tax Authorities; or, (vi) they are fiscal residents in a tax haven as qualified by the Colombian Government.
|
For purposes of Colombian taxation, a legal entity is a resident of Colombia if the place of effective management is located in Colombia for the relevant taxable year. Legal entities organized under the laws of Colombia or which principal place of business is located in Colombia are considered Colombian residents as well.
Pursuant to the Colombian Tax Code, resident individuals and Colombian entities are subject to Colombian taxes on income earned in Colombia and worldwide, while non-resident individuals and foreign entities are only taxed on their Colombian-source income. Foreign entities with permanent establishments or branches in Colombia are only taxed on Colombian-source income obtained through those permanent establishments or branches.
Colombian Tax Law includes a definition of permanent establishment for foreign entities or individuals that is applicable when the entity or individual performs in Colombia the activities that are described in Article 20-1 of the Colombian Tax Code. In this case, the permanent establishment is considered as a Colombian taxpayer with respect to its Colombian-source income.
Taxation of Dividends
In Colombia, dividends received by foreign companies or other foreign entities, non-resident individuals and successors of non-residents are not subject to income or withholding taxes, insofar as the profits from which they are paid have been taxed at the corporate level (Articles 48, 49 and 245 of the Colombian Tax Code). However, if those profits are not taxed at the corporate level, the amount paid as a dividend will be subjected to a withholding tax at a rate of 33% (or whatever is the income tax rate at the moment of the accrual or payment of dividends), according to Article 245 of the Colombian Tax Code.
Dividends paid to non-resident holders of ADSs through the depositary will not be subject to income, withholding and remittance taxes in Colombia, provided that such dividends are paid in respect of previously taxed earnings at the corporate level. In the case of dividends paid out of non-taxed earnings at the corporate level, the amount paid as a dividend will be subject to a withholding tax of 25%, pursuant to article 18-1 of the Colombian Tax Code.
Foreign companies, foreign investment funds, and individuals that are not Colombian residents are not required by law to file an income tax return in Colombia either when the dividends received by them have been subject to withholding taxes or when dividends are paid out of profits subject to income tax at the corporate level, provided that the respective tax withholdings are duly applied.
Dividend distributions to residents in Colombia, with respect to profits not taxed at the corporate level, are subject to an income tax withholding at a 20% or 33% rate depending on whether the investor is required to file an income tax return.
The Colombian government may implement changes in the tax rules applicable to payment of dividends which may adversely affect our shareholders.
Taxation of Capital Gains Derived From the Sales of ADSs:
Pursuant to article 24 of the Colombian Tax Code, gains derived by non-resident entities or non-resident individuals, of Colombia, from the sale of the ADSs are not subject to income, withholding, remittance or other taxes in Colombia. If the holder is a resident in Colombia, this capital gain will be taxed in Colombia according with the general tax rules.
Taxation of Capital Gains Derived From the Sales of Shares:
According to article 36-1 of the Colombian Tax Code, capital gains obtained in a sale of shares listed on the Colombian Stock Exchange are not subject to income tax in Colombia, provided that the shares sold by the same beneficial owner during each fiscal year do not represent more than 10% of the issued and outstanding shares of the listed company. The Colombian government may implement changes in the tax rules applicable to the sale of the offered securities which may adversely affect our shareholders.
ADSs do not have the same tax benefits as equity investments in Colombia. Although ADSs represent our preferred shares, they are subject to a different tax regulatory regime. Accordingly, the tax benefits applicable in Colombia to equity investments, in particular those relating to dividends and profits from sale, are not applicable to ADSs.
Tax on Foreign Capital Investment Portfolio Income:
The 2012 Tax Reform (see “Item 4. Information on the Company—B. Business Overview—Supervision and regulation—Regulation on Payroll Loans—2012 Tax Reform”) established a new tax regime for foreign capital portfolio investments. These investors will be required to pay income tax for the profits obtained in the development of their activities, regardless of the vehicle used to carry them out, pursuant to Article 18-1 of the Colombian Tax Code. The rate of such tax is generally 14%; however, a 25% rate will apply to investors domiciled in a tax haven jurisdiction. As of the date hereof, the list of jurisdictions deemed to be tax havens for Colombian tax purposes is set forth in Decree 2193 of 2013. For income resulting from dividends subject to taxation, a general tax rate of 25% will apply.
Payment of this tax will be accomplished through withholding that is performed on a monthly basis by the administrator of such investment portfolio, based on the profits earned by the investor during the corresponding month. When the income corresponds to dividends subject to taxation, the withholding will be made by the company paying the dividend, at the time of payment.
The withholding, performed according to the rules established in the Colombian Tax Code, shall constitute the final tax and investors will not be required to file an income tax return. However, if the investor sells shares of stock that are listed on the Colombian Stock Exchange in an amount that is above the 10% limit as set forth in Article 36-1 of the Colombian Tax Code (as described in the above paragraph under “—Taxation of capital gains derived from the sales of shares”), the investor will be required to file the corresponding income tax return, which will be filed by the administrator of the portfolio on his/her behalf.
Other Colombian Taxes
At the date of this annual report, there is no income tax treaty and no inheritance or gift tax treaty in effect between Colombia and the United States. Pursuant to Articles 24 and 36-1 of the Colombian Tax Code, transfers of ADSs from non-residents or residents to non-residents of Colombia by gift or inheritance are not subject to Colombian income tax. Transfers of ADSs by gift or inheritance from residents to residents or from non-residents to residents will be subject to Colombian income tax at the income tax rate applicable for occasional gains obtained by residents of Colombia. There are no Colombian stamp, issue, registration, transfer or similar taxes or duties payable by holders of preferred shares or ADSs.
United States Federal Income Taxation Considerations For U.S. Holders
In General
The following is a description of the material U.S. federal income tax consequences to the U.S. Holders described below of owning and disposing of our ADSs or preferred shares, but it does not purport to be a comprehensive description of all tax considerations that may be relevant to a particular person’s decision to hold the securities. This discussion applies only to a U.S. Holder that holds our ADSs or preferred shares as capital assets for tax purposes. In addition, it does not describe all of the tax consequences that may be relevant in light of the U.S. Holder’s particular circumstances, including alternative minimum tax consequences, the potential application of certain provisions of the Internal Revenue Code of 1986, as amended (the
“
Code
”
) relating to what is known as the Medicare contribution tax, and tax consequences applicable to U.S. Holders subject to special rules, such as:
|
|
·
|
certain financial institutions;
|
|
|
·
|
dealers in securities or currencies or traders in securities who use a mark-to-market method of tax accounting;
|
|
|
·
|
persons holding ADSs or preferred shares as part of a hedging transaction, straddle, wash sale, conversion transaction or integrated transaction or persons entering into a constructive sale with respect to the ADSs or preferred shares;
|
|
|
·
|
persons whose functional currency for U.S. federal income tax purposes is not the U.S. dollar;
|
|
|
·
|
entities classified as partnerships for U.S. federal income tax purposes;
|
|
|
·
|
tax-exempt entities, including “individual retirement accounts” or “Roth IRAs”;
|
|
|
·
|
persons that own or are deemed to own ten percent or more of our voting stock;
|
|
|
·
|
persons who acquired our ADSs or preferred shares pursuant to the exercise of an employee stock option or otherwise as compensation; or
|
|
|
·
|
persons holding our ADSs or preferred shares in connection with a trade or business conducted outside of the United States.
|
If an entity that is classified as a partnership for U.S. federal income tax purposes holds our ADSs or preferred shares, the U.S. federal income tax treatment of a partner will generally depend on the status of the partner and the activities of the partnership. Partnerships holding our ADSs or preferred shares and partners in such partnerships should consult their tax advisers as to the particular U.S. federal income tax consequences of holding and disposing of the ADSs or preferred shares.
This discussion is based on the Code, administrative pronouncements, judicial decisions, and final, temporary and proposed Treasury regulations, all as of the date hereof, any of which is subject to change, possibly with retroactive effect. It is also based in part on representations by the depositary and assumes that each obligation under the deposit agreement and any related agreement will be performed in accordance with its terms.
A
“
U.S. Holder
”
is a beneficial owner of our ADSs or preferred shares that is for U.S. federal income tax purposes:
|
|
·
|
a citizen or individual resident of the United States;
|
|
|
·
|
a corporation, or other entity taxable as a corporation, created or organized in or under the laws of the United States, any state therein or the District of Columbia; or
|
|
|
·
|
an estate or trust the income of which is subject to U.S. federal income taxation regardless of its source.
|
In general, a U.S. Holder who owns ADSs will be treated as the owner of the underlying preferred shares represented by those ADSs for U.S. federal income tax purposes. Accordingly, no gain or loss will be recognized if a U.S. Holder exchanges ADSs for the underlying shares represented by those ADSs.
The U.S. Treasury has expressed concern that intermediaries in the chain of ownership between holders of ADSs and the issuer of the securities underlying the ADSs (which may include intermediaries involved in the release of American depositary shares before the underlying securities are delivered to the depositary) may be taking actions that are inconsistent with the claiming of foreign tax credits by holders of American depositary shares. These actions would also be inconsistent with the claiming of the reduced rate of tax, described below, applicable to dividends received by certain non-corporate holders. Accordingly, the creditability of Colombian taxes, and the availability of the reduced tax rate for dividends received by certain non-corporate U.S. Holders, each described below, could be affected by actions taken by such parties or intermediaries.
U.S. Holders should consult their tax advisers concerning the U.S. federal, state, local and foreign tax consequences of owning and disposing of our ADSs or preferred shares in their particular circumstances.
Taxation of Dividends
The preferred shares constitute equity of our company for U.S. federal income tax purposes. Therefore, subject to the passive foreign investment company, or
“
PFIC,
”
rules described below, distributions paid on our ADSs or preferred shares will be treated as dividends to the extent paid out of our current or accumulated earnings and profits (as determined under U.S. federal income tax principles). Because we do not maintain calculations of our earnings and profits under U.S. federal income tax principles, it is expected that distributions generally will be reported to U.S. Holders as dividends. Subject to applicable limitations (including a minimum holding period requirement) and the discussion above regarding concerns expressed by the U.S. Treasury, dividends paid to certain non-corporate U.S. Holders that constitute qualified dividend income will be taxable at rates applicable to long-term capital gains. Dividends paid on our ADSs will generally constitute
“
qualified dividend income,
”
provided the ADSs are readily tradable on an established securities market in the United States (such as the NYSE, where our ADSs have been authorized for listing, subject to official notice of issuance). It is unclear whether these reduced rates will apply to dividends paid with respect to our preferred shares that are not backed by ADSs. U.S. Holders should consult their tax advisers regarding the availability of the reduced tax rate on dividends in their particular circumstances.
The amount of a dividend will include any amounts withheld by our company in respect of Colombian taxes. The amount of the dividend will generally be treated as foreign-source dividend income to U.S. Holders and will not be eligible for the dividends-received deduction generally available to U.S. corporations under the Code. Dividends will be included in a U.S. Holder’s income on the date of the depositary’s receipt of the dividend, in the case of ADSs, or on the date actually or constructively received by the U.S. Holder, in the case of the preferred shares. The amount of any dividend income paid in pesos will be the U.S. dollar amount calculated by reference to the exchange rate in effect on the applicable date of receipt, regardless of whether the payment is in fact converted into U.S. dollars. If the dividend is converted into U.S. dollars on the applicable date of receipt, a U.S. Holder should not be required to recognize foreign currency gain or loss in respect of the dividend income. A U.S. Holder may have foreign currency gain or loss if the dividend is converted into U.S. dollars after the date of receipt.
Subject to applicable limitations (including a minimum holding period requirement), some of which vary depending upon the U.S. Holder’s circumstances, and subject to the discussion above regarding concerns expressed by the U.S. Treasury, Colombian income taxes withheld from dividends on ADSs or preferred shares will be creditable against the U.S. Holder’s U.S. federal income tax liability. In lieu of claiming a foreign tax credit, U.S. Holders may, at their election, deduct foreign taxes, including the Colombian tax, in computing their taxable income, subject to generally applicable limitations under U.S. law. An election to deduct foreign taxes instead of claiming foreign tax credits applies to all taxes paid or accrued in the taxable year to foreign countries and possessions of the United States. The rules governing foreign tax credits are complex, and U.S. Holders should consult their tax advisers regarding the creditability of foreign taxes in their particular circumstances.
Sale, Redemption or Other Taxable Disposition of ADSs or Preferred Shares
Subject to the PFIC rules described below, for U.S. federal income tax purposes, gain or loss realized on the sale, redemption or other taxable disposition of our ADSs or preferred shares will generally be capital gain or loss, and will be long-term capital gain or loss if the U.S. Holder held the ADSs or preferred shares for more than one
year. The amount of the gain or loss will equal the difference between the U.S. Holder’s tax basis in the ADSs or preferred shares disposed of and the amount realized on the disposition, in each case as determined in U.S. dollars. This gain or loss will generally be U.S.-source gain or loss for foreign tax credit purposes.
Passive Foreign Investment Company Rules
Based on proposed Treasury regulations, which are proposed to be effective for taxable years beginning after December 31, 1994, and on management estimates, we believe we were not a PFIC for U.S. federal income tax purposes for the 2014 taxable year. However, because the proposed Treasury regulations may not be finalized in their current form, because the application of the proposed regulations is not entirely clear and because the composition of our income and assets will vary over time, there can be no assurance that we were not or will not be a PFIC for any taxable year. The determination of whether we are a PFIC, however, is made annually and is based upon the composition of our income and assets (including the income and assets of, among others, entities in which we hold at least a 25% interest), and the nature of our activities. In general, we will be a PFIC for any taxable year in which at least 75% of our gross income is passive income, or at least 50% of the value (determined on a quarterly basis) of our assets is attributable to assets that produce or are held for the production of passive income.
If we are a PFIC for any taxable year during which a U.S. Holder held our ADSs or preferred shares, any gain recognized by a U.S. Holder on a sale or other disposition of ADSs or preferred shares (including certain pledges) would be allocated ratably over the U.S. Holder’s holding period for the ADSs or preferred shares. The amounts allocated to the taxable year of the sale or other disposition and to any year before we became a PFIC would be taxed as ordinary income. The amount allocated to all other taxable years would be subject to tax at the highest rate in effect for individuals or corporations, as appropriate, for that taxable year, and an interest charge would be imposed on the amount allocated to those taxable years. Further, any distribution in respect of ADSs or preferred shares in excess of 125% of the average of the annual distributions on ADSs or preferred shares received by the U.S. Holder during the preceding three years or the U.S. Holder’s holding period, whichever is shorter, would be subject to taxation as described immediately above with respect to gains. Certain elections may be available that would result in alternative treatments (such as mark-to-market treatment) of the ADSs or preferred shares. U.S. Holders should consult their tax advisers to determine whether any of these elections would be available and, if so, what the consequences of the alternative treatments would be in their particular circumstances.
If we are a PFIC in a taxable year in which we pay a dividend or the prior taxable year, the favorable dividend rates discussed above with respect to qualified dividend income paid to non-corporate holders would not apply. In addition, if we are a PFIC for any taxable year during which a U.S. Holder owned our ADSs or preferred shares, the U.S. Holder will generally be required to file IRS Form 8621 with their annual U.S. federal income tax returns, subject to certain exceptions.
Information Reporting and Backup Withholding
Payments of dividends and sales proceeds that are made within the United States or through certain U.S.- related financial intermediaries generally are subject to information reporting, and may be subject to backup withholding, unless (1) the U.S. Holder is an exempt recipient or (2) in the case of backup withholding, the U.S. Holder provides a correct taxpayer identification number and certifies that it is not subject to backup withholding. The amount of any backup withholding from a payment to a U.S. Holder will be allowed as a credit against the holder’s U.S. federal income tax liability and may entitle it to a refund, provided that the required information is timely furnished to the Internal Revenue Service.
Dividend policy of Grupo Aval
The amount of dividends, if any, that we pay will be dependent, in large part, on the amount of dividends received from our subsidiaries. From 2009 to 2014, the amount of dividends that we have paid increased at a compound annual growth rate of 22.7%. Dividends are declared semi-annually in March and September of each year, and we do not declare dividends quarterly. Our subsidiaries declared Ps 1,062.1 billion in 2014 and Ps 936.2 billion in 2013 of dividends payable to us, and we declared an aggregate of Ps 1,290.1 billion in 2014 and Ps 1,035.2 billion in 2013 of dividends to our shareholders.
Unless noted otherwise, the following table presents the net profits of, and dividends declared by, each of our banks and Porvenir, and the amount of dividends that we would be entitled to receive from each of them during the periods indicated. Dividends are paid to us on a monthly basis.
| Dividends declared with respect to net income for the year ended December 31, | ||||||||||||||
| 2014 |
2013
|
2014 | 2013 | 2014 | 2013 | 2014 | 2013 | 2014 | 2013 | 2014 | 2013 | 2014 | 2013 | |
|
Banco de
Bogotá
|
Banco de
Occidente
|
Banco
Popular
|
Banco
AV Villas
|
Porvenir | Corficolombiana | Total | ||||||||
| (in Ps billions, except percentages) | ||||||||||||||
|
Direct ownership interest held by Grupo Aval
|
68.7%
|
67.6%
|
72.2%
|
72.2%
|
93.7%
|
93.7%
|
79.9%
|
79.9%
|
20.0%
|
20.0%
|
9.3%
|
–
|
–
|
–
|
|
Unconsolidated net profits
|
1,505
|
1,418
|
1,201
|
456
|
380
|
399
|
195
|
186
|
280
|
201
|
502
|
–
|
4,063
|
2,660
|
|
Dividends declared
|
805
|
713
|
275
|
250
|
185
|
185
|
87
|
82
|
275
|
193
|
540
|
–
|
2,167
|
1,422
|
|
Dividends contributed to Grupo Aval
|
565
|
490
|
199
|
180
|
174
|
174
|
69
|
65
|
55
|
39
|
41
|
–
|
1,103
|
947
|
|
Dividends declared by Grupo Aval
|
–
|
–
|
–
|
–
|
–
|
–
|
–
|
–
|
–
|
–
|
–
|
–
|
1,290
|
1,035
|
The allocation of our distributable profits, if any, is determined by our common shareholders following approval of our semi-annual financial statements. Our general shareholders’ meetings generally occur in March and September, three months after the close of the semi-annual period. As such, dividends declared in one year may relate to the results of the previous year.
In the past we have paid dividends on a monthly basis. We have not, however, adopted a specific dividend policy with respect to future dividends. The amount of any distributions will depend on many factors, such as the results of operations and financial condition of our company and our subsidiaries, their cash requirements, their prospects and other factors deemed relevant by our board of directors and shareholders.
Our company pays dividends based on the results shown in our semi-annual unconsolidated audited financial statements prepared under Colombian GAAP for companies other than financial institutions. See “Presentation of financial and other information—Financial statements.”
The principal differences between Colombian Banking GAAP and Colombian GAAP for companies other than financial institutions are the following:
|
|
·
|
Valuation of investments in securities
: Under Colombian GAAP, all investments in debt securities are accounted for at book value, as opposed to Colombian Banking GAAP, according to which, depending on how the securities are classified, investments may be accounted for at market value. Therefore, in our financial statements prepared under Colombian GAAP, investments in debt securities that at the bank’s level had been accounted for at market value, are re-expressed at book value.
|
|
|
·
|
Deferred assets
: Under Colombian GAAP deferred assets are amortized in full on a yearly basis. Under Colombian Banking GAAP deferred assets can be amortized in periods longer than one year. Therefore, in our financial statements prepared under Colombian GAAP, the bank’s deferred assets are fully amortized each year.
|
In addition there are other differences related to the general provision for loans and inflation adjustments that do not have a material effect on our financial statements.
For the years ended December 31, 2014 and 2013, net income as reported in our consolidated Colombian GAAP financial statements was Ps 76.8 billion (4.8%) lower and Ps 44.4 billion (2.8%) higher than net income as reported in our consolidated Colombian Banking GAAP financial statements, respectively.
We expect that differences between Colombian GAAP and Colombian Banking GAAP will continue to occur in future periods.
The amount of dividends expected from our subsidiaries will also depend on the future share ownership in our subsidiaries.
Dividend history of Grupo Aval
The following table presents the annual cash dividends paid by Grupo Aval on each share during the periods indicated.
|
Dividends declared with respect to net income
|
Cash dividends per share
|
Cash dividends
per share
|
||||||
|
(Ps)
|
(U.S.$)
|
|||||||
|
Year ended:
|
||||||||
|
2010
|
37.80 | 0.016 | ||||||
|
2011
|
42.60 | 0.018 | ||||||
|
2012
|
49.20 | 0.021 | ||||||
|
2013
|
53.10 | 0.022 | ||||||
|
2014
|
57.90 | 0.024 | ||||||
Dividend history of our banking subsidiaries
The following tables set forth the annual cash dividends paid by each of our banks on each share during the periods indicated.
Banco de Bogotá
|
Dividends declared with respect to net income
|
Cash dividends per share
|
Cash dividends
per share
|
||||||
|
(Ps)
|
(U.S.$)
|
|||||||
|
Year ended:
|
||||||||
|
2010
|
1,608.00 | 0.672 | ||||||
|
2011
|
1,728.00 | 0.722 | ||||||
|
2012
|
2,028.00 | 0.848 | ||||||
|
2013
|
2,400.00 | 1.003 | ||||||
|
2014
|
2,520.00 | 1.053 | ||||||
Banco de Occidente
|
Dividends declared with respect to net income
|
Cash dividends per share
|
Cash dividends
per share
|
||||||
|
(Ps)
|
(U.S.$)
|
|||||||
|
Year ended:
|
||||||||
|
2010
|
1,233.00 | 0.515 | ||||||
|
2011
|
1,314.00 | 0.549 | ||||||
|
2012
|
1,452.00 | 0.607 | ||||||
|
2013
|
1,602.00 | 0.670 | ||||||
|
2014
|
1,764.00 | 0.737 | ||||||
Banco Popular
|
Dividends declared with respect to net income
|
Cash dividends per share
|
Cash dividends
per share
|
||||||
|
(Ps)
|
(U.S.$)
|
|||||||
|
Year ended:
|
||||||||
|
2010
|
21.84 | 0.009 | ||||||
|
2011
|
22.92 | 0.010 | ||||||
|
2012
|
23.28 | 0.010 | ||||||
|
2013
|
24.00 | 0.010 | ||||||
|
2014
|
24.00 | 0.010 | ||||||
Banco AV Villas
|
Dividends declared with respect to net income
|
Cash dividends per share
|
Cash dividends
per share
|
||||||
|
(Ps)
|
(U.S.$)
|
|||||||
|
Year ended:
|
||||||||
|
2010
|
285.81 | 0.119 | ||||||
|
2011
|
315.00 | 0.132 | ||||||
|
2012
|
345.00 | 0.144 | ||||||
|
2013
|
363.00 | 0.152 | ||||||
|
2014
|
387.00 | 0.162 | ||||||
Dividend history of Porvenir and Corficolombiana
The following tables present the annual cash dividends paid by Porvenir and Corficolombiana during the periods indicated.
Porvenir
|
Dividends declared with respect to net income
|
Cash dividends per share
|
Cash dividends
per share
|
||||||
|
(Ps)
|
(U.S.$)
|
|||||||
|
Year ended:
|
||||||||
|
2010
|
1,207.00 | 0.505 | ||||||
|
2011
|
972.00 | 0.406 | ||||||
|
2012
|
– | – | ||||||
|
2013
|
1,212.00 | 0.507 | ||||||
|
2014
|
1,320.36 | 0.552 | ||||||
Corficolombiana
|
Dividends declared with respect to net income
|
Cash dividends per share
|
Cash dividends
per share
|
||||||
|
(Ps)
|
(U.S.$)
|
|||||||
|
Year ended:
|
||||||||
|
2010
|
882.00 | 0.369 | ||||||
|
2011
|
1,464.00 | 0.612 | ||||||
|
2012
|
882.00 | 0.369 | ||||||
|
2013
|
660.00 | 0.276 | ||||||
|
2014
|
630.00 | 0.263 | ||||||
Dividend history of BAC Credomatic
As of December 31, 2014, BAC Credomatic had declared U.S.$22.67 of cash dividends per share.
General aspects involving dividends
The dividend periods may be different from the periods covered by the general balance sheet. At the general shareholders’ meeting, shareholders will determine such dividend periods, the effective date, the system and the place for payment of dividends.
Dividends declared on the shares of common and preferred shares will be payable to the record holders of those shares, as they are recorded on our stock registry, on the appropriate record dates as determined at the general shareholders’ meeting. However, pursuant to External Circular 13 of 1998 issued by the former Superintendency of Securities (currently, the Superintendency of Finance), if a shareholder sells shares during the ten business days immediately preceding the payment date, dividends corresponding to those shares will be paid by us to the seller.
The vote of at least 80.0% of the shares present and entitled to vote is required to approve the payment of dividends in shares; however, according to Law 222 of 1995, if a “situation of control” exists, whereby the decision-making power is subject to the will of another person or group of persons, a company may only pay dividends by issuing shares, to the shareholders that so accept.
Not applicable.
We are subject to the informational requirements of the Exchange Act. Accordingly, we are required to file reports and other information with the SEC, including annual reports on Form 20-F and reports on Form 6-K. You may inspect and copy reports and other information filed with the SEC at the Public Reference Room at 100 F Street, N.E., Washington, D.C. 20549. Information on the operation of the Public Reference Room may be obtained by calling the SEC at 1-800-SEC-0330. In addition, the SEC maintains an internet website that contains reports and other information about issuers, like us, that file electronically with the SEC. The address of that website is www.sec.gov.
Not applicable.
Risk management
The guiding principles of risk management at Grupo Aval and our banks are the following:
|
|
·
|
collective decision making for commercial lending at the board level of each of our banks;
|
|
|
·
|
extensive and in-depth market knowledge, the result of our market leadership and our experienced, stable and seasoned senior management;
|
|
|
·
|
clear top-down directives with respect to:
|
|
|
·
|
compliance with know-your-customer policies; and
|
|
|
·
|
commercial loan credit structures based on the clear identification of sources of repayment and on the cash-flow generating capacity of the borrower;
|
|
|
·
|
use of common credit analysis tools and loan pricing tools across all our banks;
|
|
|
·
|
diversification of the commercial loan portfolio with respect to industries and economic groups;
|
|
|
·
|
specialization in consumer product niches;
|
|
|
·
|
extensive use of continuously updated rating and scoring models to ensure the growth of high-credit quality consumer lending;
|
|
|
·
|
use of our extensive market presence in the identification and implementation of best practices for operational risk management; and
|
|
|
·
|
conservative policies in terms of:
|
|
|
·
|
the trading portfolio composition, with a bias towards instruments with lower volatility;
|
|
|
·
|
proprietary trading; and
|
|
|
·
|
the variable remuneration of trading personnel.
|
Unless otherwise indicated, risk management figures for Banco de Bogotá consolidate financial data of LB Panamá, including BAC Credomatic. BAC Credomatic has in place its own risk management controls for credit risk, market risk and operational risk.
With respect to credit risk, BAC Credomatic has a centralized structure with a Regional Risk Director reporting to the CEO of BAC Credomatic, who chairs the Regional Credit Committee and is responsible for setting out credit policies and procedures applicable at the local (individual country) level and defining growth strategies in accordance with country risk. While local credit-risk managers report to the country head, compliance with the credit policies is reported directly to the Regional Risk Director.
With respect to market risk, BAC Credomatic has Regional Investment Policies and Regional Asset and Liability Management Policies which set out the guidelines for establishing country risk and issuer limits as well as limits on foreign currency positions and general guidelines for the administration of liquidity, interest rate and exchange-rate risks. The establishment and administration of the regional policies is the responsibility of the Regional Asset and Liability Committee, which is comprised of BAC Credomatic board members.
Daily adherence to these policies at BAC Credomatic is carried out with the investment portfolio control management module, which documents the entire investment process. The monitoring of exposures is the responsibility of the Regional Financial Director through the local assets and liabilities committees.
Operating Risk Management at BAC Credomatic is carried out using the conceptual methodology of Basel II guidelines and the elements of The Committee of Sponsoring Organizations of the Treadway Commission, or “COSO”, integral risk management. A centralized operating risk management unit ensures that there are in place policies to ensure a standardized treatment of operating risks including methodologies for the timely recognition of the principal exposures, the ownership of operational risks by functional units, accountability throughout the organization and effective procedures to collect information on operational losses. The centralized operating risk committee is also responsible for putting in place an effective business continuity plan.
Credit Risk
The credit-risk management process at all our banks takes into consideration the requirements of the Superintendency of Finance, the guidelines of Grupo Aval credit-risk management and the composition of each of the banks’ loan portfolio, which, in turn, is the result of the execution of each bank’s strategy.
Commercial Lending
55.7
% of our total loan portfolio is composed of commercial loans to corporate and small and medium sized enterprises. However, the level of commercial loans varies in each of our banks. At December 31, 2014, the proportion of commercial loans was
60.0
%,
54.1
%,
44.8
% and
36.4
% at Banco de Bogotá, Banco de Occidente, Banco Popular and Banco AV Villas, respectively.
The credit approval process for commercial loans at each of our banks follows the policies and lending authorities established by each bank subsidiary. The highest lending authority at all banks, other than the board of directors, is the national credit committee (
Comité Nacional de Crédito
at Banco de Bogotá, Banco Popular and Banco AV Villas or
Comité de Crédito Dirección General
at Banco de Occidente), which has lending limits that range between Ps 1.7 billion (approximately U.S.$0.7 million) at Banco Popular and Ps 8.0 billion (approximately U.S.$3.3 million) at Banco de Bogotá and Banco de Occidente.
Following the approval of a transaction by the credit committee of any of our banks, information regarding the loan is sent to the Grupo Aval risk management committee if the loan would result in aggregate exposure to the borrower in excess of Ps 5.0 billion. For commercial loans, the credit approval process includes the presentation to the Grupo Aval risk management committee of all potential credit exposures per client that, across all of our banks, represent an exposure in excess of Ps 30.0 billion (approximately U.S.$12.5 million). This committee, which is composed of the vice presidents of credit of each of our banks and the risk management staff of Grupo Aval, meets on a weekly basis to discuss general developments in the industry and economy, risks and opportunities, and the structure of credit transactions, as well as to consult on and evaluate potential business opportunities. The committee consolidates requests for loans across all banks and evaluates our total exposure to potential borrowers. In each case,
the committee evaluates the relevant bank’s application of its credit analysis policy and it may make recommendations with respect to the structure of the loan (such as guarantees, interest rates, commissions and covenants). The risk management committee will then submit the transaction to the Grupo Aval advisory board.
The Grupo Aval advisory board, which is composed of the presidents of our banks and the vice presidents of Grupo Aval, meets every two months to discuss the adoption of policies for risk management and how to accommodate clients with large credit needs, as well as to advise the banks with respect to defaults or other credit risk issues. The advisory board also evaluates transactions submitted to it by the Grupo Aval risk management committee for compliance with applicable policies and makes recommendations to the banks with respect to such loans. The boards of the banks make the ultimate decisions with respect to such loans.
In order to facilitate the analysis of commercial loans which meet the threshold and are thus reviewed by Grupo Aval, we have developed certain tools, including a standardized “
proyecto de crédito
,” a stand-alone document containing all of the information considered necessary for us to make a credit decision. We have also developed financial projection models and pricing models that assist us in analyzing potential loans and comparing the estimated return on a loan with that of a comparable risk-free instrument.
We seek to achieve a profitable, high-quality commercial loan portfolio and an efficient procedure for analyzing potential loans across our banks. To that end, we have established policies and procedures for the analysis and approval of potential commercial credit transactions that seek to focus lending on the following principles:
|
|
·
|
borrowers whose shareholders and management are, in our opinion, of the highest integrity (taking into account not only an analysis of the borrower’s credit profile but also their reputation in the business community and other factors);
|
|
|
·
|
borrowers which participate in key industries;
|
|
|
·
|
borrowers which are leaders or major players in the industries in which they participate;
|
|
|
·
|
transaction structures, including covenants and guarantees, which provide adequate protection; and
|
|
|
·
|
pricing which compensates adequately for capital invested and the market and credit risks incurred.
|
In addition, we make loans to public sector entities. For purposes of evaluating the extension of credit to public sector entities, our banks follow three criteria: (1) the loan must be used to finance an investment that has been approved by local authorities; (2) a source of repayment must be clearly identified, such as tax revenues; and (3) the source of repayment so identified must be pledged to secure the loan.
Consumer Lending
Consumer lending represented
29.4
% of the total loan portfolio at December 31, 2014; however, the participation and specialization by product varies in each of our banks. At December 31, 2014, Banco Popular’s consumer lending represented
51.9
% of the total loan portfolio and was concentrated in payroll deduction loans (
libranzas
), a product in which it is the leader in Colombia. At Banco AV Villas and Banco de Bogotá, consumer lending represented
45.4
% and
25.0
% of their total loan portfolio, respectively. At Banco de Occidente,
24.9
% of the total loan portfolio consisted of consumer loans, with motor vehicle financing representing
7.9
% of the total loan portfolio.
The credit approval process for consumer loans at each of our banks follows the policies and lending authorities established by each bank. The highest lending authority at all banks, other than the board of directors, is the national credit committee (
Comité Nacional de Crédito
at Banco de Bogotá, Banco Popular and Banco AV Villas or
Comité de Crédito Dirección General
at Banco de Occidente), which have lending limits that range between Ps 1.7 billion (approximately U.S.$0.7 million) at Banco Popular, and Ps 8.0 billion (approximately U.S.$3.3 million) at Banco de Bogotá and Banco de Occidente.
For consumer banking, each bank has developed a business model designed to take into consideration the product offering. Banco Popular, for which payroll deduction loans represent
50.5
% of the total loan portfolio, has developed a business model which concentrates its analysis on the credit and operational risks of the payee (the employer) supported with statistical origination and behavior models. Banco AV Villas is the bank with the most
diversified consumer loan portfolio. After being exclusively a mortgage lending institution until 2000, it has developed different niches in consumer lending. The fast growth of consumer lending with above average credit quality has been the result of the development of in-house statistical origination and behavior models and the development of a multiple view vintage analysis tool, which has allowed the sale of consumer loan products to the lower income population, which is a more profitable customer segment in which relatively few banks compete. Banco de Bogotá has successfully integrated Megabanco’s operations into its full-service consumer loan portfolio of credit cards, personal loans, automobile loans and overdrafts. Banco de Occidente has become a leader in motor vehicle financing by maintaining an independent motor vehicle financing unit which has developed its own statistical models and its own origination and collection strategies.
Mortgage Lending
Mortgage lending represented
8.0
% of the total loan portfolio at December 31, 2014, compared to
6.8
% as of December 31, 2013, with Banco AV Villas and Banco de Bogotá being the highest contributors to this increase. At Banco AV Villas mortgage lending represents
18.2
% of its loan portfolio, up from 15.1% in 2013, given an increase of
30.4
% in the mortgage loan portfolio, but down from its peak of 44.5% in 2005.
At Banco de Bogotá, mortgage lending represents
10.4
% of its loan portfolio as of December 31, 2014, up from
9.3
% in 2013 and 0.3% in 2009. At Banco de Bogotá, growth of the mortgage loan portfolio comes from both its Colombian and Central American consolidated operations. In Colombia, the mortgage lending portfolio went from 0.1% in 2009 to
2.9%
in 2014 of total loans, and has been the highest growing lending type since 2010. In Central America, the mortgage portfolio represented
22.1
% of the total loan portfolio in 2014, down from 30.3% in 2010, the year we acquired BAC Credomatic. Banco de Occidente launched its mortgage product during the second semester of 2013, and at December 31, 2014, it represented
0.6
% of its loan portfolio.
In order to ensure an adequate mortgage loan portfolio quality, Banco de Bogotá and Banco AV Villas have developed statistical models for the origination and follow-up on new mortgage loans, which has resulted in a very low past due to total loan ratios for recently originated loans.
Financial Leases
Financial leases represented
6.6
% of the total loan portfolio at December 31, 2014 and corresponded to the financial leasing transactions processed primarily through Banco de Bogotá’s, Banco de Occidente’s and Banco Popular’s respective leasing divisions and Leasing Corficolombiana, a subsidiary of Corficolombiana which consolidates with Banco de Bogotá. All leasing subsidiaries have independent credit approval processes and their own credit policies, which in turn are closely supervised by their parent companies.
Microcredit Lending
Microcredit loans represented
0.3
% of the total loan portfolio at December 31, 2014.
Credit Classification and Provisioning
Our banks continually engage in the determination of risk factors associated with their credit-related assets, through their duration, including restructurings. For such purposes, they have designed and adopted the System of Credit Risk Administration (
Sistema de Administración de Riesgo de Crédito
), or “SARC,” in accordance with Superintendency of Finance guidelines. The SARC has integrated credit policies and procedures for the administration of credit risks, models of reference for the determination and calculation of anticipated losses, provisions for coverage of credit risks and internal control procedures.
Our banks are required to classify the loan portfolio in accordance with the rules of the Superintendency of Finance, which established the following loan classification categories: “AA,” “A,” “BB,” “B,” “CC” and “Default,” depending on the strength of the credit and, after the loan is disbursed, its past due status.
Each bank reviews outstanding loan portfolio components under the above-mentioned criteria and classifies individual loans under the risk-rating categories below on the basis of minimum objective criteria, such as balance sheet strength, profitability and cash generation capacity. The classification of new commercial loans is made on the basis of these objective criteria. The criteria are also evaluated on an ongoing basis, together with loan performance, in reviewing the classification of existing commercial loans.
|
Category
|
Approval
|
Commercial loan portfolio
|
Consumer loan portfolio
|
|||
|
“AA”
|
New loans with risk rating at approval of “AA”
|
Outstanding loans and financial leases with past due payments not exceeding 29 days (i.e., between 0 and 29 days past due). The debtor’s financial statements or its projected cash flows, as well as all other credit information available to the financial subsidiaries, reflect excellent paying capacity.
|
Loans whose risk rating is “AA” according to the methodology of the Consumer Reference Model, or “MRCO,” as established by the Superintendency of Finance
|
|||
|
“A”
|
New loans with risk rating at approval of “A”
|
Outstanding loans and financial leases with delayed payments in excess of 30 days but not exceeding 59 days (i.e., between 30 and 59 days past due). The debtor’s financial statements or its projected cash flows, as well as all other credit information available to the financial subsidiaries, reflect appropriate paying capacity.
|
Loans whose risk rating is “A” according to the methodology of the MRCO as established by the Superintendency of Finance
|
|||
|
“BB”
|
New loans with risk rating at approval of “BB”
|
Outstanding loans and financial leases past due more than 60 days but less than 90 days (i.e., between 60 and 89 days past due). Loans in this category are acceptably serviced and collateralized, but there are weaknesses which may potentially affect, on a transitory or permanent basis, the debtor’s ability to pay or its projected cash flows, to the extent that, if not timely corrected, would affect the normal collection of credit or contracts.
|
Loans whose risk rating is “BB” according to the methodology of the MRCO as established by the Superintendency of Finance
|
|||
|
“B”
|
New loans with risk rating at approval of “B”
|
Outstanding loans and financial leases past due over 90 days but less than 120 days (i.e., between 90 and 119 days past due). The debtor shows insufficient paying capacity of its obligations.
|
Loans whose risk rating is “B” according to the methodology of the MRCO as established by the Superintendency of Finance
|
|||
|
“CC”
|
New loans with risk rating approval of “CC”
|
Outstanding loans and financial lessees past due more than 120 days but less than 150 days (i.e., between 120 and 149 days past due). Loans in this category represent grave insufficiencies in the debtors’ paying capacity or in the project’s cash flow, which may compromise the normal collection of the obligations.
|
Loans whose risk rating is “CC” according to the methodology of the MRCO as established by the Superintendency of Finance
|
|
“Default”
|
–
|
Outstanding loans and financial leases past due for 150 days or more. This category is deemed uncollectible. These loans are considered in default.
|
Consumer loan portfolio past due over 90 days
|
For new consumer loans, the banks use their internal statistical origination models to develop an initial classification category (“AA,” “A,” “BB,” “B” and “CC”). Once the loan is disbursed, the banks use formulas provided by the Superintendency of Finance, which incorporate payment performance of the borrower to calculate a score which in turn is used to determine the loan classification.
For financial leases the risk categories are established in the same manner as commercial or consumer loans.
For financial statement reporting purposes, the Superintendency requires that loans and leases be given a risk category on the scale of “A,” “B,” “C,” “D” and “E.” As a result, the risk classifications are aligned to the risk categories as follows.
|
Risk classification
|
||||
|
Risk category
|
Commercial
|
Consumer
|
||
|
“A”
|
“AA”
|
“AA”
|
||
|
“A” – between 0 and 30 days past due
|
||||
|
“B”
|
“A”
|
“A” – more than 30 days past due
|
||
|
“BB”
|
“BB”
|
|||
|
“C”
|
“B”
|
“B”
|
||
|
“CC”
|
“CC”
|
|||
|
“D”
|
“Default”
|
“Default” – all other past due loans not classified in “E”
|
||
|
“E”
|
“Default”
|
“Default” – past due loans with a Loss given default (LGD) of 100%(1)
|
||
|
(1)
|
LGD is defined as a percentage to reflect the credit loss incurred if an obligor defaults. LGD for debtors depends on the type of collateral and as a percentage would gradually increase depending on the number of days elapsed after being classified in each category.
|
For our mortgage and microcredit loan portfolios the risk categories in effect at December 31, 2014, based on past due status, are as follows.
|
Category
|
Microcredit
|
Mortgage
|
||
|
“A” Normal Risk
|
In compliance or up to date and up to 30 days past due
|
In compliance or up to 60 days past due
|
||
|
“B” Acceptable Risk
|
Past due between 31 and 60 days
|
Past due between 61 and 150 days
|
||
|
“C” Appreciable Risk
|
Past due between 61 and 90 days
|
Past due between 151 and 360 days
|
||
|
“D” Significant Risk
|
Past due between 91 and 120 days
|
Past due between 361 and 540 days
|
||
|
“E” Uncollectable
|
Past due over 120 days
|
Past due over 540 days
|
Loan Loss Provisions
Our banks follow the norms of the Superintendency of Finance for the establishment of loan loss provisions. There are separate rules for commercial loans and leases, consumer loans and mortgage loans.
For commercial loans and financial leases, the process is as follows:
|
|
·
|
determination of the loan classification (“AA,” “A,” “BB,” “B,” “CC” or “Default”) based on the repayment capacity and payment record, among other considerations, of the borrower;
|
|
|
·
|
determination of the probability of default from tables provided by the Superintendency of Finance which take into account the loan classification (“AA” through “Default”) and the size of the borrower in terms of assets (large, medium or small business);
|
|
|
·
|
determining the loss given default based on the type of credit support (guarantees) and the past due status of the loan, using guides (tables) provided by the Superintendency of Finance; and
|
|
|
·
|
based on the expected loss given default and the exposure at default, the amount of the loan provision for the individual loan is determined and booked.
|
For consumer loans, the process is as follows:
|
|
·
|
determination of the loan classification (“AA,” “A,” “BB,” “B,” “CC” or “Default”) based on the score generated by the bank’s internal statistical origination model (for new loans) or on a score determined by a formula provided by the Superintendency of Finance, which incorporates the payment performance of the borrower;
|
|
|
·
|
determining the probability of default from tables provided by the Superintendency of Finance which take into account the loan classification (“AA” through “Default”);
|
|
|
·
|
determining the loss given default based on the type of credit support and past due status using tables provided by the Superintendency of Finance; and
|
|
|
·
|
based on the expected loss given default and the exposure at default, the amount of the loan provision for the individual loan is determined and booked.
|
For microcredit and mortgage loans, the provision as a percentage of the principal is determined in accordance with the following table.
|
Microcredit loans
|
Mortgage loans
|
||
|
Risk category
|
Provision as % of principal
|
Provision as % of principal covered by guarantee
|
Provision as % of principal not covered by guarantee
|
|
“A”
|
0.0
|
1.0
|
1.0
|
|
“B”
|
1.0
|
3.2
|
100.0
|
|
“C”
|
20.0
|
10.0
|
100.0
|
|
“D”
|
50.0
|
20.0
|
100.0
|
|
“E”
|
100.0
|
30.0
|
100.0
|
Liquidity Risk
As a holding company, Grupo Aval’s liquidity requirements are limited to dividends, debt-service payments and operational expenses. Our liquidity is derived entirely from dividends from subsidiaries, which management believes is sufficient for these purposes. Grupo Aval is not required to maintain minimum liquidity positions. Subject to the capital requirements of each of our banks, there are no limitations on our banks’ ability to pay dividends to Grupo Aval.
Banks controlled by Grupo Aval are required to, and maintain adequate liquidity positions based on the Superintendency of Finance’s liquidity parameters, as follows:
|
|
·
|
Until 2009, banks were required to determine liquidity gap, which is the difference between the expected cash flow disbursements from assets and the expected cash flow disbursements from liabilities, classified by time bracket, including in the calculation of both on- and off-balance sheet assets and liabilities as well
|
as contingent assets and liabilities. Cumulative liquidity gap is defined as the sum of liquidity gap for the current and previous periods.
|
|
·
|
Banks were generally required to have a positive three-month cumulative liquidity gap and, if this measure was negative, its absolute value was accounted for as “Liquidity Value at Risk.” No bank was allowed to have two consecutive evaluations of Liquidity Value at Risk which exceeded its “Net liquid assets” defined as net interbank loans, tradable debt securities that mature in more than three months, and available cash.
|
|
|
·
|
In 2009, a short-term liquidity index (
Indicador de Riesgo de Liquidez
), or “IRL,” that measures 7-, 15- and 30-day liquidity was established. This index is defined as the difference between adjusted liquid assets and net liquidity requirements. Liquid assets include total debt securities adjusted by market liquidity and exchange rate, excluding investments classified as “held to maturity” different from mandatory investments, Central Bank deposits and available cash. Net liquidity requirements are the difference between expected contractual asset and contractual and non-contractual liability cash flows. Cash flows from past due loans are not included in this calculation.
|
|
|
·
|
In 2011, the Superintendency of Finance implemented changes to liquidity reporting requiring the calculation of a new IRL ratio, or “IRL Ratio,” defined as adjusted liquid assets divided by the net liquidity requirements (in each case, as defined above), expressed as a percentage. The IRL Ratio may not fall below 100% for two consecutive weeks.
|
|
|
·
|
The Superintendency of Finance additionally adjusted the components of the IRL and IRL Ratio. The adjusted liquid assets now have to be classified as “high quality” or “other,” and high quality assets must represent at least 70% of the adjusted liquid assets. In addition, non-contractual outflows (demand and savings deposits outflows) have to be calculated using the median of the fifth percentile of the series of the largest outflows since December 31, 1996.
|
Our banks have adequate liquidity, as shown in the following table. The three-month cumulative liquidity gap values for our banks for year-end 2014, 2013 and 2012 and reflect unconsolidated figures for each of our banks.
|
Year ended December 31,
|
||||||||||||
|
Three-month cumulative liquidity position
|
2014
|
2013
|
2012
|
|||||||||
|
(in Ps billions)
|
||||||||||||
|
Banco de Bogotá
|
||||||||||||
|
Total assets and contingencies
|
14,997 | 12,829 | 10,767 | |||||||||
|
Total liabilities, equity and contingencies
|
15,850 | 12,626 | 11,067 | |||||||||
|
Liquidity gap
|
(852 | ) | 204 | (300 | ) | |||||||
|
Net liquid assets (NLA)
|
2,678 | 2,833 | 2,308 | |||||||||
|
Liquidity gap plus NLA
|
1,826 | 3,037 | 2,008 | |||||||||
|
Banco de Occidente
|
||||||||||||
|
Total assets and contingencies
|
6,219 | 7,406 | 7,088 | |||||||||
|
Total liabilities, equity and contingencies
|
4,896 | 5,698 | 3,468 | |||||||||
|
Liquidity gap
|
1,323 | 1,708 | 3,620 | |||||||||
|
Net liquid assets (NLA)
|
2,713 | 1,765 | 1,471 | |||||||||
|
Liquidity gap plus NLA
|
4,036 | 3,473 | 5,091 | |||||||||
|
Banco Popular
|
||||||||||||
|
Total assets and contingencies
|
3,580 | 2,505 | 2,741 | |||||||||
|
Total liabilities, equity and contingencies
|
2,275 | 1,446 | 1,423 | |||||||||
|
Liquidity gap
|
1,305 | 1,059 | 1,318 | |||||||||
|
Net liquid assets (NLA)
|
1,219 | 1,226 | 1,061 | |||||||||
|
Liquidity gap plus NLA
|
2,523 | 2,285 | 2,379 | |||||||||
|
Banco AV Villas
|
||||||||||||
|
Total assets and contingencies
|
1,726 | 1,544 | 1,281 | |||||||||
|
Total liabilities, equity and contingencies
|
3,581 | 1,744 | 2,167 | |||||||||
|
Liquidity gap
|
(1,856 | ) | (200 | ) | (885 | ) | ||||||
|
Net liquid assets (NLA)
|
3,071 | 1,436 | 2,876 | |||||||||
|
Liquidity gap plus NLA
|
1,215 | 1,236 | 1,991 | |||||||||
The following tables show the short-term liquidity index and the IRL Ratio at December 31, 2014 and 2013 for each of our banks, expressed in Ps billions and as a percentage.
|
At December 31,
|
||||||||||||||||||||||||||||||||
|
Banco de Bogotá
|
Banco de Occidente
|
Banco Popular
|
Banco AV Villas
|
|||||||||||||||||||||||||||||
|
2014
|
2013
|
2014
|
2013
|
2014
|
2013
|
2014
|
2013
|
|||||||||||||||||||||||||
|
(in Ps billions)
|
||||||||||||||||||||||||||||||||
|
IRL – 7 days
|
7,268 | 7,986 | 6,093 | 3,874 | 1,681 | 3,075 | 2,843 | 2,076 | ||||||||||||||||||||||||
|
IRL – 15 days
|
6,496 | 7,035 | 5,894 | 3,571 | 1,458 | 2,799 | 2,689 | 1,906 | ||||||||||||||||||||||||
|
IRL – 30 days
|
4,614 | 6,478 | 5,412 | 3,321 | 1,312 | 2,289 | 2,462 | 1,776 | ||||||||||||||||||||||||
|
At December 31,
|
||||||||||||||||||||||||||||||||
|
Banco de Bogotá
|
Banco de Occidente
|
Banco Popular
|
Banco AV Villas
|
|||||||||||||||||||||||||||||
|
2014
|
2013
|
2014
|
2013
|
2014
|
2013
|
2014
|
2013
|
|||||||||||||||||||||||||
|
(in percentages)
|
||||||||||||||||||||||||||||||||
|
IRL – 7 days
|
717 | 2,469 | 2,244 | 1,593 | 785 | 4,826 | 1,346 | 1,314 | ||||||||||||||||||||||||
|
IRL – 15 days
|
433 | 646 | 1,321 | 735 | 412 | 922 | 805 | 657 | ||||||||||||||||||||||||
|
IRL – 30 days
|
220 | 451 | 661 | 509 | 314 | 369 | 505 | 477 | ||||||||||||||||||||||||
Operational Risk Management
The policies with respect to operational risk at Grupo Aval and our banks are directed at complying with the norms established by the Superintendency of Finance (which, in turn, follow the Basel II Accord of 2004), and the U.S. Sarbanes-Oxley Act of 2002. These norms require that Colombian banks establish a system for the administration of operational risks (
Sistema de Administración de Riesgo Operacional
) which includes the identification, measurement, control and monitoring functions as well as a business continuity plan.
In order to comply with these norms, each of our banks established within its organizational structure an operational risk unit independent of the operational and control areas of each bank. The responsibilities of these units are the establishment and definition of policies and methodologies and the procedures for communicating within each organization all information related to operational risk. In addition to the staff of each operational risk unit, the banks have established the role of operational risk advisors, which are employees in key areas who, in addition to their functional responsibilities, are required to report events or situations which may result in operational losses. Additionally, each bank has an operational risk management committee composed of selected members of the board of directors, the internal auditor, external auditor and selected vice presidents, which meets on a quarterly basis to review operational risks policies and follow up on the execution of action plans.
At Grupo Aval, an operational risk management committee, composed of the heads of the operational risk units of each bank and staff of Grupo Aval risk management, was established. The principal activities of this committee, which meets on a semi-monthly basis, are as follows:
|
|
·
|
advisory in the engagement of external consultants for the identification of gaps with international standards and the development of work plans to close the gaps;
|
|
|
·
|
coordinated analysis of norms and the impact in each of Grupo Aval’s banks;
|
|
|
·
|
identification and application of best practices;
|
|
|
·
|
identification and implementation of operational risk management tools;
|
|
|
·
|
unification of criteria in the search of business continuity tools;
|
|
|
·
|
economies of scale in the engagement of consultants and the acquisition of tools; and
|
|
|
·
|
coordination in the preparation of requests for proposals and the evaluation of proposals.
|
We implement, from time to time, best practices that result from meetings of the Grupo Aval operational risk management committee.
Market Risk Management
Grupo Aval does not manage market risk at a consolidated level. Rather each bank monitors its market risk. Grupo Aval on an unconsolidated basis does not have material market risk; however, our banking subsidiaries have substantial market risk, primarily as a result of our banks’ lending, trading and investments businesses. The primary market risks to which we are exposed are interest rate risk, foreign exchange rate risk, variations in stock price risk and investment fund risk.
We are exposed to interest rate risk whenever there is a mismatch between interest-rate-sensitive assets and liabilities, subject to any hedging we have engaged in using interest rate swaps or other off-balance sheet derivative instruments. Interest rate risk arises in connection with both trading and non-trading activities.
We are exposed to foreign exchange rate risk as a result of mismatches between assets and liabilities, and off-balance sheet items denominated in different currencies. We are exposed to variations in stock price risk in connection with investments in equity securities, including our merchant banking investments. We are exposed to fund risk primarily from investments in mutual funds.
We and our banks’ respective boards of directors, through their risk management committees, are responsible for establishing policies, procedures and limits with respect to market risk. These committees also monitor overall performance in light of the risks assumed. These policies and procedures describe the control framework used by us and each of our banks to identify, measure and manage market risk exposures inherent in our and their activities. The main purpose of these policies and procedures is to set limits on risk. All risk managers within Grupo Aval must ensure that each business activity is performed in accordance with the policies established by the relevant bank and also Grupo Aval. These policies and procedures are followed in market risk decision-making in all business units and activities. All of our banks comply with the requirements of SARM (
Sistema de Administración de Riesgos de Mercado
) of the Superintendency of Finance.
Each bank is responsible for setting market risk limits and monitoring market risk.
Risk management personnel at Grupo Aval and each of our banks are responsible for the following:
|
|
·
|
identification, measurement and management of the market risk exposures inherent in their businesses;
|
|
|
·
|
analyzing exposures under stress scenarios;
|
|
|
·
|
confirming compliance with applicable risk management policies, reporting violations of such policies, and proposing new policies;
|
|
|
·
|
designing of methodologies for valuing securities and financial instruments; and
|
|
|
·
|
reporting daily to senior management as to the levels of market risk associated with trading instruments.
|
Our banks hold trading and non-trading instruments. Trading instruments are recorded in our banks’ “treasury books” and non-trading instruments are recorded in their “banking books.”
Trading Instruments
Trading instruments include our proprietary positions in financial instruments held for sale and/or acquired to take advantage of current and/or expected differences between purchase and sale prices. The tables in this section include certain investments recorded under Colombian Banking GAAP in “Held to maturity” and recorded under U.S. GAAP in “Trading” and “Available for sale.” As a result of trading fixed income and floating rate securities, equity securities, investment funds and foreign exchange, we and our banks are exposed to interest rate, variations in stock prices, investment fund and foreign exchange rate risks, as well as volatility risk when derivatives are used. Our banks trade foreign exchange, fixed income instruments, floating rate securities and basic derivative instruments (forwards, options, cross currency swaps and interest rate swaps).
Our banks use VaR to measure their exposure to market risk in trading instruments. VaR is an estimate of the expected maximum loss in market value of a given portfolio over a time horizon at a specific confidence interval, subject to certain assumptions and limitations discussed below.
VaR models have inherent limitations, including the fact that they rely on historical data, which may not be indicative of future market conditions or trading patterns. As a result, VaR models could overestimate or underestimate the value at risk and should not be viewed as predictive of future results. Furthermore, our banks may incur losses materially in excess of the amounts indicated by the VaR models on a particular trading day or over a period of time. VaR does not calculate the greatest possible loss. In addition, VaR models are subject to the reasonable judgment of our bank’s risk management personnel.
Each bank’s board of directors, assets and liabilities committee and risk management committee establishes the maximum VaR for each type of investment and for each type of risk using their own internal VaR models as well as the Superintendency of Finance methodology, or the regulatory VaR. Our banks use VaR estimates to alert senior management whenever the statistically estimated losses in the banks’ portfolios exceed pre-established levels. Limits on VaR are used to control exposure on a portfolio-by-portfolio basis.
In order to strictly control the trading portfolios, each entity has limits for every risk factor. To determine the limits, the impact of the variation (dollar value for 1 basis point or DV01) in each risk is taken into account. These risk limits are validated through stress testing based on historical extreme scenarios.
As described below, our banks measure interest rate risk, foreign exchange risk, variations in stock price risk and investment fund risk in accordance with VaR models. We use two types of approaches to measure VaR: (1) regulatory VaR methodology and (2) internal VaR models.
|
|
·
|
The regulatory VaR used in the calculation of the capital ratio (solvency ratio) follows the methodology established by the Superintendency of Finance. The Superintendency methodology is based on the Basel II model. The Superintendency of Finance has not made publicly available technical information on how it determines the volatilities used in this model, and only limited information is available. The volatilities used in the Superintendency of Finance’s model are of a magnitude similar to those observed in very high volatility or stress periods. These parameters are seldom changed by the Superintendency of Finance. See “—Regulatory VaR” below.
|
|
|
·
|
In addition, our banks use internal models to manage market risk. Parameters are set to adapt to the evolution of volatility of the risk factors over time using statistical methods to estimate them. Our banks generally give recent data more weight in calculations to reflect actual market conditions. The corporate governance bodies of our banks set limits based on this VaR measure in order to control the market risks. Parametric VaR and historical simulation methodologies are also used.
|
Regulatory VaR
The Regulatory VaR calculation is primarily used for the Superintendency of Finance’s solvency ratio calculations.
The Superintendency of Finance methodology is based on the Basel II model. This model applies only to the banks’ investment portfolio and excludes investments classified as “held to maturity” and any other non-trading positions included in the “Trading” and “Available for sale” portfolios. Total market risk is calculated on a daily basis by aggregating the VaR for each risk exposure category on a ten-day horizon using risk factors calculated in extreme market stress scenarios. VaR at month-end comprises part of the capital adequacy ratio calculation (as set forth in Decree 2555 of 2010). The Superintendency of Finance’s rules require our banks to calculate VaR for the following risk factors: interest rate risk, foreign exchange rate risk, variations in stock price risk and fund risk; correlations between risk factors are not considered. The fluctuations in the portfolio’s VaR depend on sensitivity factors determined by the Superintendency of Finance, modified duration and changes in balances outstanding. The ten-day horizon is defined as the average time in which an entity could sell a trading position on the market.
The VaR calculation for each bank is the aggregate of the VaR of the bank and its subsidiaries. Trust companies (
fiduciarias
), our pension and severance fund manager, Porvenir, and our brokerage firm, Casa de Bolsa S.A.
Sociedad Comisionista de Bolsa, or “Casa de Bolsa,” are not included in this calculation as the risk of their proprietary portfolios is not material to Grupo Aval.
Interest Rate Risk
Our banks’ exposure to interest rate risk in their trading portfolios primarily arises from investments in securities (floating and fixed rate) and derivative instruments. In accordance with the Superintendency of Finance rules, our banks calculate interest rate risk for positions in pesos, foreign currency and UVRs separately. UVR is a Colombian inflation-adjusted monetary index calculated by the board of directors of the Colombian Central Bank and generally used for pricing home-mortgage loans. The interest rate risk model is designed to measure the risk of loss arising from changes in market interest rates. It includes the sum of the net short or long position in the whole trading book, a proportion of the matched positions in each time band (the “vertical disallowance”) and a proportion of the matched positions across different time bands (the “horizontal disallowance”). The interest rate sensitivity factors and vertical and horizontal disallowances are not updated frequently by the Superintendency of Finance because those are calculated based on extreme historical market situations; the most recent update was made in November 2010 and published in External Circular 42.
A significant portion of the market risk of our banks is interest rate risk VaR as quantified in the tables below. The interest rate risk of our banks is primarily generated by long positions held in Peso-denominated Colombian government debt. Our banks have a preference for these securities as the government debt market is the largest and most developed of the local financial markets. Additionally, government debt securities support the liquidity management of our banks as they are eligible for Colombian Central Bank overnight repo funding and are classified as high-quality liquid assets. Government debt securities also carry a zero weight for capital adequacy calculations making them attractive in terms of utilization of capital. These factors provide a strong incentive for our banks to invest in government debt securities and diversify less into other debt securities that do not possess these characteristics.
Foreign Exchange Rate Risk
Our banks use a sensitivity factor to calculate the probability of losses as a result of fluctuations in currencies in which our banks hold positions. Regulatory VaR is computed daily by multiplying the net position by the maximum probable variation in the price of such positions on a ten-day horizon, determined by the Superintendency of Finance as shown in the following table.
|
U.S. dollar
|
5.5%
|
|
Euro
|
6.0%
|
|
Other currencies
|
8.0%
|
Our banks’ exposure to foreign exchange rate risk arises primarily from changes to the U.S. dollar/peso exchange rate. Our banks use an approximation to estimate the risk in exchange-rate-related option positions based on delta, gamma and vega sensitivities, which is included in foreign exchange risk.
The foreign exchange rate risk VaR calculation under the standard model of the Superintendency of Finance includes both the trading and non-trading book.
Equity Price Risk
In determining regulatory VaR variations in stock price risk, certain investments are excluded: (a) equity investments in financial institutions that are supervised by the Superintendency of Finance and (b) equity investments derived from corporate restructuring processes (under Law 550 of 1999) or received as in-kind payment for non-performing loans. In addition, as part of the solvency ratio calculation, equity investments in entities supervised by the Superintendency of Finance that do not consolidate are deducted from primary capital. Investments in entities that consolidate but are not supervised by Superintendency of Finance (non-financial investment) are included in VaR calculations.
Variations in stock price risk in Grupo Aval come primarily from Corficolombiana’s non-financial investment portfolio. This risk is factored into Banco de Bogotá variations in stock price risk VaR as it consolidates Corficolombiana and is excluded from Banco de Occidente’s and Banco Popular’s variations in stock price risk calculation.
The Superintendency of Finance’s methodology for determining VaR for variations in stock price risk outlined above results in the inclusion of Corficolombiana’s consolidated and non-consolidated equity investments in non-financial institutions.
In December 2010, the Superintendency of Finance issued a revised methodology that excludes from the VaR calculation investments that are available for sale equity securities that are acquired as strategic investments and intended to be held on a long-term horizon. Grupo Aval has historically considered in its internal models that Corficolombiana’s consolidated equity investments and our investments that are held on a long-term horizon should have more limited variations in stock price risk on us.
Variations in stock price risk VaR is computed daily by multiplying the net position by the maximum probable variation in the price of such positions on a ten-day horizon, determined by the Superintendency of Finance to be 14.7%. This coefficient is based on historic volatilities and is seldom adjusted.
Investment Fund Risk
Investment fund risk comes from temporary investment of cash in portfolios managed by trust companies.
Investment fund risk VaR is computed daily by multiplying the net position by the maximum probable variation in the price of such positions on a ten-day horizon, determined by the Superintendency of Finance to be 14.7%.
The following tables show the VaR calculation relating to each of the risk factors described above and based on the Superintendency of Finance Methodology (Regulatory VaR) for the years ended December 31, 2014 and 2013, for a ten-day horizon for each of our banks. The averages, minimums and maximums are determined based on end-of-the-month calculations.
Banco de Bogotá
|
Year ended December 31, 2014
|
At December 31, 2013
|
|||||||||||||||||||
|
Period end
|
Average
|
Maximum
|
Minimum
|
Period end
|
||||||||||||||||
|
(in Ps millions)
|
||||||||||||||||||||
|
Interest rate risk VaR
|
533,883 | 556,029 | 658,524 | 467,215 | 571,069 | |||||||||||||||
|
Foreign exchange rate risk VaR
|
45,967 | 19,321 | 45,967 | 6,665 | 7,003 | |||||||||||||||
|
Variations in stock price risk VaR
|
8,228 | 9,470 | 9,874 | 8,024 | 11,099 | |||||||||||||||
|
Fund risk VaR
|
57,572 | 50,189 | 57,572 | 47,050 | 47,682 | |||||||||||||||
|
Total market risk VaR
|
645,650 | 635,009 | 731,205 | 562,560 | 636,854 | |||||||||||||||
Banco de Occidente
|
Year ended December 31, 2014
|
At December 31, 2013
|
|||||||||||||||||||
|
Period end
|
Average
|
Maximum
|
Minimum
|
Period end
|
||||||||||||||||
|
(in Ps millions)
|
||||||||||||||||||||
|
Interest rate risk VaR
|
267,011 | 187,148 | 267,011 | 136,358 | 134,116 | |||||||||||||||
|
Foreign exchange rate risk VaR
|
2,050 | 2,229 | 3,230 | 614 | 2,495 | |||||||||||||||
|
Variations in stock price risk VaR
|
15 | 13 | 15 | 12 | 12 | |||||||||||||||
|
Fund risk VaR
|
– | – | – | – | – | |||||||||||||||
|
Total market risk VaR
|
269,076 | 189,390 | 269,076 | 138,606 | 136,623 | |||||||||||||||
Banco Popular
|
Year ended December 31, 2014
|
At December 31, 2013
|
|||||||||||||||||||
|
Period end
|
Average
|
Maximum
|
Minimum
|
Period end
|
||||||||||||||||
|
(in Ps millions)
|
||||||||||||||||||||
|
Interest rate risk VaR
|
130,848 | 139,738 | 155,291 | 127,511 | 172,985 | |||||||||||||||
|
Foreign exchange rate risk VaR
|
204 | 1,096 | 2,356 | 204 | 1,264 | |||||||||||||||
|
Variations in stock price risk VaR
|
18 | 16 | 18 | 14 | 14 | |||||||||||||||
|
Fund risk VaR
|
455 | 533 | 745 | 423 | 746 | |||||||||||||||
|
Total market risk VaR
|
131,525 | 141,383 | 158,410 | 128,152 | 175,009 | |||||||||||||||
Banco AV Villas
|
Year ended December 31, 2014
|
At December 31, 2013
|
|||||||||||||||||||
|
Period end
|
Average
|
Maximum
|
Minimum
|
Period end
|
||||||||||||||||
|
(in Ps millions)
|
||||||||||||||||||||
|
Interest rate risk VaR
|
67,816 | 91,989 | 106,950 | 61,230 | 77,280 | |||||||||||||||
|
Foreign exchange rate risk VaR
|
8 | 70 | 448 | – | 23 | |||||||||||||||
|
Variations in stock price risk VaR
|
– | – | – | – | – | |||||||||||||||
|
Fund risk VaR
|
89 | 103 | 720 | – | – | |||||||||||||||
|
Total market risk VaR
|
67,913 | 92,162 | 107,079 | 61,755 | 77,303 | |||||||||||||||
The regulatory VaR of Banco de Occidente (mostly interest rate risk) increased 99.1% between December 31, 2013 and December 31, 2014. Increases in the amount and the duration of the local currency debt securities (primarily TESs) are the reason for the growth of the regulatory VaR.
Internal Models for VaR Calculation
In addition to Regulatory VaR, our banks use internal models to measure VaR in order to determine and control their main risks under normal operating conditions. In particular, all of our banks use internal models to oversee the interest rate risk of their investment portfolio. Banco de Bogotá, Banco de Occidente and Banco Popular use internal models to measure VaR of their full investment portfolio on a daily basis, while Banco AV Villas uses an internal model to measure VaR only for its government debt securities position.
We use methodologies such as Parametric VaR and historical simulation. The Parametric VaR, which is based on Riskmetrics Group, Inc.’s methodology, involves the identification of specific risks, such as interest and exchange rate risks that could affect the value of assets included in the trading book. The volatility of each factor, measured as a standard deviation, and the correlation with other factors are determined by using an exponentially weighted moving average model. Once this is determined, the expected cash flow of each security included in the portfolio is determined. These cash flows are classified into categories for each risk identified and multiplied by the corresponding volatility to calculate the VaR per factor. The VaR for the various factors is then aggregated using a correlation matrix to identify the overall standard deviation of the bank’s treasury book. The VaR of the bank’s treasury book is determined based on the standard deviation subject to a confidence level of 99% and a one-day horizon.
The historical simulation calculates daily VaR based on the historical behavior of the one-day variations of prices in the market. This methodology does not assume any statistical distribution function for the earnings and loss of a portfolio. This simulation assumes that the market is stable during a period of time and infers the market’s future behavior based on historical data.
Back testing is required by the Superintendency of Finance to establish the validity of the internal models used for VaR calculations. The Superintendency of Finance requires two sets of tests: so called “dirty tests,” which compare the value at risk estimated for the day against the result effectively obtained (profit and loss) of the same day using the previous day’s portfolio; and “clean tests,” which compare the value at risk estimated for the day
against an estimated result (profit and loss) based on the previous day’s portfolio. These tests are performed on a daily basis, although the requirement for the “clean” test is on a monthly basis. The methodology and results of these tests are available for review by the Superintendency of Finance.
The following table shows the interest rate VaR calculation based on internal models as of December 31, 2014 and December 31, 2013 on a ten-day horizon (using an adjustment factor applied to VaR on a one day horizon). The values presented for Banco AV Villas were calculated on Banco de Bogotá’s model. Values for all other banks are based on their internal models. The averages, minimums and maximums are determined based on daily calculations except for BAC Credomatic, which are determined based on end-of-the-quarter calculations.
Interest Rate Risk VaR (Per Internal Model)
|
Banco de Bogotá
|
Banco de Occidente
|
Banco Popular(1)
|
Banco AV Villas
|
|||||||||||||
|
(in Ps millions)
|
||||||||||||||||
|
2014
|
||||||||||||||||
|
As of December 31
|
132,388 | 106,937 | 10,417 | 18,721 | ||||||||||||
|
Average
|
96,801 | 56,237 | 7,498 | – | ||||||||||||
|
Maximum
|
158,454 | 122,512 | 17,972 | – | ||||||||||||
|
Minimum
|
67,458 | 40,679 | 4,343 | – | ||||||||||||
|
2013
|
||||||||||||||||
|
As of December 31
|
185,045 | 52,485 | 48,188 | 13,224 | ||||||||||||
|
(1)
|
Banco Popular’s internal VaR data reflects Banco Popular’s unconsolidated results. The regulatory VaR, however, corresponds to consolidated figures. Banco Popular (unconsolidated) accounts for over
98
% of the consolidated regulatory VaR at December 31, 2014. Banco Popular’s VaR results are lower than Banco de Occidente’s as a significant portion of Banco de Occidente’s portfolio is held in foreign currencies through its subsidiaries in Panamá and the Bahamas, resulting in increased volatility. In comparison, an immaterial amount of Banco Popular’s portfolio is denominated in foreign currencies.
|
Considerations on Equity Price Risk Regulatory VaR
As stated above, variations in equity price risk measured based on the regulatory VaR methodology include both equity investments held for trading and non-strategic holdings. In addition, it does not discriminate between listed and unlisted equity investments or between those which consolidate and those which do not. It focuses on investments in non-financial institutions.
Holding periods for many of Corficolombiana’s equity investments exceed ten years. Its largest investments have remained in the portfolio for several years and are intended to remain as permanent investments. At December 31, 2014 and at December 31, 2013, the investment subject to regulatory VaR were holdings in Mineros S.A. and CFC Energy Holdings SAS.
The following table breaks down our investments subject to regulatory VaR by time since initial investments at December 31, 2014 and 2013.
|
At December 31,
|
||||||||||||||||||||||||
|
2014
|
2013
|
|||||||||||||||||||||||
|
Investment subject to Regulatory VaR
|
Regulatory VaR
|
Percentage
of
portfolio
|
Investment subject to Regulatory VaR
|
Regulatory VaR
|
Percentage of
portfolio
|
|||||||||||||||||||
|
Less than 18 months
|
– | – | – | 169 | 25 | 0.2 | % | |||||||||||||||||
|
18 - 36 months
|
174 | 26 | 0.3 | % | – | – | – | |||||||||||||||||
|
More than 36 months
|
53,521 | 7,868 | 99.7 | % | 73,165 | 10,755 | 99.8 | % | ||||||||||||||||
|
Total
|
53,695 | 7,893 | 100.0 | % | 73,334 | 10,780 | 100.0 | % | ||||||||||||||||
Non-Trading Instruments
Non-trading instruments consist primarily of loans and deposits. Our banks’ primary market risk exposure in their non-trading instruments is interest rate risk, which arises from the possibility of changes in market interest rates. Such changes in market interest rates affect our banks’ net interest income due to timing differences on the repricing of their assets and liabilities. Our banks are also affected by gaps in maturity dates and interest rates in the different asset and liability accounts. As part of their management of interest rate risk, our banks analyze the interest rate mismatches between their interest-earning assets and their interest-earning liabilities.
Superintendency of Finance rules require our banks to measure foreign exchange rate risk VaR not only for treasury book positions but also for all assets and liabilities denominated in foreign currencies. Our non-trading instruments are exposed to foreign exchange rate risk primarily from loans and deposits denominated in dollars. This foreign exchange rate risk is monitored under the VaR methodology described above.
Sensitivity of fair value is determined using either one of two methodologies: (1) determining the difference between the fair value and the net present value of the expected cash flows using a discount rate of 50 basis points and 100 basis points higher than that used for the original calculation; or (2) determining the sensitivity of the remaining cash flows (modified duration), multiplied by the fair value, multiplied by the increase in discount rate for each scenario (50 basis points and 100 basis points). Methodology 1 is in some cases more precise while methodology 2 is a good approximation for moderate variations in the discount rate.
Sensitivity of certain instruments is assumed to be zero because its fair value is equal to its book value as is the case with instruments with maturities of 90 days or less, or loans and borrowings from development banks.
Our sensitivity analysis methodology should be interpreted in light of the following limitations: (1) we have assumed a uniform interest rate change for assets and liabilities of varying maturities; and (2) we have assumed that the modified duration of variable rate assets and liabilities is the time remaining until the next interest reset date.
An increase in interest rates negatively affects the value of our banks’ assets and positively affects the value of our banks’ liabilities, as an increase in interest rates decreases the fair value of both assets and liabilities.
The following tables present our sensitivity analysis based on hypothetical changes of 50 and 100 basis point shifts in interest rates on the net present value of interest rate sensitive assets and liabilities for the periods indicated.
|
December 31, 2014
|
December 31, 2013
|
|||||||||||||||||||||||
|
Grupo Aval (1)
|
Fair value
|
+50 basis points
|
+100 basis points
|
Fair value
|
+50 basis points
|
+100 basis points
|
||||||||||||||||||
|
(in Ps millions)
|
||||||||||||||||||||||||
|
Assets
|
||||||||||||||||||||||||
|
Held-to-maturity securities
|
2,645,654 | (5,226 | ) | (10,442 | ) | 2,973,425 | (7,493 | ) | (14,962 | ) | ||||||||||||||
|
Loans
|
114,498,438 | (1,253,659 | ) | (1,952,328 | ) | 97,588,950 | (954,098 | ) | (1,873,097 | ) | ||||||||||||||
|
Short-term funds
|
2,188,290 | - | - | 3,103,195 | – | – | ||||||||||||||||||
|
Customer’s acceptances
|
130,794 | - | - | 220,839 | – | – | ||||||||||||||||||
|
Total interest rate sensitive assets
|
119,463,175 | (1,258,885 | ) | (1,962,771 | ) | 103,886,409 | (961,591 | ) | (1,888,059 | ) | ||||||||||||||
|
Liabilities
|
||||||||||||||||||||||||
|
Checking accounts, savings deposits and other
|
73,023,806 | - | - | 69,407,392 | – | – | ||||||||||||||||||
|
Time deposits
|
44,289,855 | (160,491 | ) | (318,445 | ) | 33,548,682 | (133,927 | ) | (265,351 | ) | ||||||||||||||
|
Bank acceptances outstanding
|
310,702 | - | - | 221,852 | – | – | ||||||||||||||||||
|
Short-term funds
|
4,589,495 | - | - | 5,131,604 | – | – | ||||||||||||||||||
|
Borrowings from banks
|
16,047,463 | (180,313 | ) | (355,025 | ) | 13,051,107 | (129,050 | ) | (253,073 | ) | ||||||||||||||
|
Long-term debt
|
13,077,937 | (155,722 | ) | (284,514 | ) | 11,420,793 | (146,058 | ) | (251,742 | ) | ||||||||||||||
|
Total interest rate sensitive liabilities
|
151,339,258 | (496,527 | ) | (957,984 | ) | 132,781,430 | (409,036 | ) | (770,166 | ) | ||||||||||||||
|
Total net change
|
(31,876,082 | ) | (762,358 | ) | (1,004,787 | ) | (28,895,021 | ) | (552,555 | ) | (1,117,893 | ) | ||||||||||||
|
(1)
|
Grupo Aval reflects the sum of the fair values of each of our consolidated banking subsidiaries under Colombian Banking GAAP, Grupo Aval at the holding company level on an unconsolidated basis and Grupo Aval Limited.
|
Not applicable.
Not applicable.
Not applicable.
Fees and Expenses
The depositary may charge each person to whom ADSs are issued, including, without limitation, issuances against deposits of preferred shares, issuances in respect of preferred share distributions, rights and other distributions, issuances pursuant to a share dividend or share split declared by us or issuances pursuant to a merger, exchange of securities or any other transaction or event affecting the ADSs or deposited securities, and each person surrendering ADSs for withdrawal of deposited securities in any manner permitted by the deposit agreement or whose ADRs are cancelled or reduced for any other reason, up to U.S.$5.00 for each 100 ADSs (or any portion thereof) issued, delivered, reduced, cancelled or surrendered, as the case may be. The depositary may sell (by public or private sale) sufficient securities and property received in respect of a preferred share distribution, rights and/or other distribution prior to such deposit to pay such charge.
The following additional charges will be incurred by the ADR holders, by any party depositing or withdrawing preferred shares or by any party surrendering ADSs or to whom ADSs are issued (including, without limitation, issuances pursuant to a share dividend or share split declared by our company or an exchange of securities regarding the ADRs or the deposited securities or a distribution of ADSs), whichever is applicable:
|
|
·
|
a fee of U.S.$0.05 or less per ADS for any cash distribution made pursuant to the deposit agreement;
|
|
|
·
|
a fee of U.S.$1.50 per ADR or ADRs for transfers of ADRs;
|
|
|
·
|
a fee for the distribution of securities (or the sale of securities in connection with a distribution), such fee being in an amount equal to the fee for the execution and delivery of ADSs that would have been charged as a result of the deposit of such securities (treating all such securities as if they were preferred shares) but which securities or the net cash proceeds from the sale thereof are instead distributed by the depositary to those holders entitled thereto;
|
|
|
·
|
an aggregate fee of U.S.$0.05 per ADS per calendar year (or portion thereof) for services performed by the depositary in administering our ADR program (which fee may be charged on a periodic basis during each calendar year and shall be assessed against holders as of the record date or record dates set by the depositary during each calendar year and will be payable at the sole discretion of the depositary by billing such holders or by deducting such charge from one or more cash dividends or other cash distributions);
|
|
|
·
|
any other charge payable by any of the depositary, any of the depositary’s agents, including, without limitation, the custodian, or the agents of the depositary’s agents in connection with the servicing of our preferred shares or other deposited securities (which charge will be assessed against registered holders of our ADRs as of the record date or dates set by the depositary and will be payable at the sole discretion of the depositary by billing such registered holders or by deducting such charge from one or more cash dividends or other cash distributions);
|
|
|
·
|
stock transfer or other taxes and other governmental charges;
|
|
|
·
|
cable, telex and facsimile transmission and delivery charges incurred at your request in connection with the deposit or delivery of shares;
|
|
|
·
|
transfer or registration fees for the registration of transfer of deposited securities on any applicable register in connection with the deposit or withdrawal of deposited securities;
|
|
|
·
|
expenses of the depositary in connection with the conversion of foreign currency into U.S. dollars; and
|
|
|
·
|
such fees and expenses as are incurred by the depositary (including without limitation expenses incurred in connection with compliance with foreign exchange control regulations or any law or regulation relating to foreign investment) in delivery of deposited securities or otherwise in connection with the depositary’s or its custodian’s compliance with applicable laws, rules or regulations.
|
We will pay all other charges and expenses of the depositary and any agent of the depositary (except the custodian) pursuant to agreements from time to time between us and the depositary. The charges described above may be amended from time to time.
Direct and Indirect Payments
Our depositary has agreed to reimburse us for certain expenses we incur that are related to the establishment and maintenance of the ADR program upon such terms and conditions as we and the depositary may agree from time to time. The depositary may make available to us a set amount or a portion of the depositary fees charged in respect of the ADR program or otherwise upon such terms and conditions as we and the depositary may agree from time to time.
The depositary collects fees for making distributions to investors by deducting those fees from the amounts distributed or by selling a portion of distributable property to pay the fees. The depositary may collect its annual fee for depositary services by deduction from cash distributions, by directly billing investors or by charging the book-entry system accounts of participants acting for them. The depositary will generally set off the amounts owing from distributions made to holders of ADSs. If, however, no distribution exists and payment owing is not timely received by the depositary, the depositary may refuse to provide any further services to holders that have not paid those fees and expenses owing until such fees and expenses have been paid. At the discretion of the depositary, all fees and charges owing under the deposit agreement are due in advance and/or when declared owing by the depositary. The depositary may generally refuse to provide services to any holder until the fees and expenses owing by such holder for those services or otherwise are paid.
For the year ended December 31, 2014, we have not received any direct or indirect payments from J.P. Morgan Chase Bank, N.A. as depositary of the ADR program.
No matters to report.
No matters to report.
None.
None.
None.
None.
On September 22, 2014, our registration statement on Form F-1 (File No. 333-197823), as amended, was declared effective by the SEC for our initial public offering of our ADS, pursuant to which we offered and sold a total of 93,703,703 ADSs, each representing 20 of our preferred shares, par value Ps 1.00 per share, at a public offering price of U.S.$13.50 per ADS. J.P. Morgan Securities LLC and Goldman, Sachs & Co. acted as global coordinators, joint bookrunners and representatives of the underwriters. The offering began on September 9, 2014 and was completed on October 2, 2014. All securities registered in the registration statement have been sold pursuant to the underwriting agreement for the initial public offering.
We sold 93,703,703 ADSs, including 12,222,222 ADSs purchased by the underwriters to cover over-allotments for an aggregate price of U.S.$1,265.0 million. We received net proceeds of approximately U.S.$1,231.8 million (Ps 2,425.1 billion), after deducting underwriting discounts and commissions of approximately U.S.$28.5 million and other expenses of approximately U.S.$4.7 million.
Our expenses in connection with our initial public offering from September 22, 2014 through December 31, 2014, other than underwriting discounts and commissions, were the following:
|
Expenses
|
Amount
|
|||
|
(in U.S.$)
|
||||
|
SEC registration fee
|
162,932.00 | |||
|
FINRA filing fee
|
175,250.00 | |||
|
NYSE listing fee
|
273,696.00 | |||
|
Printing and engraving expenses
|
114,054.65 | |||
|
Legal fees and expenses
|
2,098,729.16 | |||
|
Accounting fees and expenses
|
910,350.10 | |||
|
Road show expenses
|
322,625.23 | |||
|
Miscellaneous costs
|
654,030.10 | |||
|
Total
|
4,711,667.24 | |||
None of the underwriting discounts and commissions or other expenses were paid directly or indirectly to any director, officer or general partner of ours or to their associates, persons owning ten percent or more of any class of our equity securities, or to any of our affiliates.
For the period up until December 31, 2014 Grupo Aval made the following uses of the net proceeds from the IPO:
|
|
·
|
Grupo Aval participated in Banco de Bogotá´s equity raise with Ps 1,201.4 billion;
|
|
|
·
|
Grupo Aval purchased from Banco de Occidente a further 9.35% direct stake in Corficolombiana for Ps 769.5 billion; and
|
|
|
·
|
Grupo Aval made debt payments for Ps 295.5 billion.
|
The three uses described above totaled Ps 2,266.4 billion.
There has been no material change in the planned use of proceeds from our initial public offering as described in our final prospectus dated September 22, 2014 filed with the SEC on September 24, 2014.
As of December 31, 2014, under the supervision and with the participation of our management, including our President and Chief Financial Officer, we performed an evaluation of the effectiveness of the design and operation of our disclosure controls and procedures (as defined in Rule 13a-15(e) under the Exchange Act). There are inherent limitations to the effectiveness of any disclosure controls and procedures system, including the possibility of human error and circumventing or overriding them. Even if effective, disclosure controls and procedures can provide only reasonable assurance of achieving their control objectives.
Based on such evaluation, our President and Chief Financial Officer concluded that our disclosure controls and procedures are effective to provide reasonable assurance that the information we are required to disclose in the reports we file or submit under the Exchange Act is (1) recorded, processed, summarized and reported within the time periods specified in the SEC’s rules and forms and (2) accumulated and communicated to our management to allow timely decisions regarding required disclosures.
Our management is responsible for establishing and maintaining an adequate internal control over financial reporting as defined in Rule 13a-15(f) under the Exchange Act.
Our internal control over financial reporting is a process designed by, or under the supervision of, our principal executive and principal financial officers, management and other personnel, to provide reasonable assurance regarding the reliability of financial reporting and the preparation of our financial statements for external reporting purposes, in accordance with generally accepted accounting principles. These include those policies and procedures that:
|
|
·
|
pertain to the maintenance of records that, in reasonable detail, accurately and fairly reflect transactions and dispositions of our assets;
|
|
|
·
|
provide reasonable assurance that transactions are recorded as necessary to permit preparation of financial statements, in accordance with generally accepted accounting principles, and that receipts and expenditures are being made only in accordance with authorization of our management and directors; and
|
|
|
·
|
provide reasonable assurance regarding prevention or timely detection of unauthorized acquisition, use or disposition of our assets that could have a material effect on our financial statements.
|
Because of its inherent limitations, internal control over financial reporting may not prevent or detect misstatements. Therefore, effective control over financial reporting cannot, and does not, provide absolute assurance of achieving our control objectives. Also, projections of, and any evaluation of effectiveness of the internal controls in future periods are subject to the risk that controls may become inadequate because of changes in conditions, or that the degree of compliance with the policies or procedures may deteriorate.
We have adapted our internal control over financial reporting based on the guidelines set by the Internal Control – Integrated Framework of the Committee of Sponsoring Organizations of the Treadway Commission of 2013 (“COSO”).
Under the supervision and with the participation of our management, including our President, our Chief Financial Officer, our Chief Risk Management Officer and our Vice-President of Internal Control, we conducted an evaluation of the effectiveness of our internal control over financial reporting as of December 31, 2014, based on the guidelines set forth by the COSO.
Based on this assessment, management believes that, as of December 31, 2014, its internal control over financial reporting was effective based on those criteria.
The effectiveness of the internal control over financial reporting, as of December 31, 2014, has been audited by KPMG Ltda., an independent registered public accounting firm, which appears on page F-2.
There was no change in our internal control over financial reporting that occurred during the period covered by this annual report that has materially affected, or is reasonably likely to materially affect, our internal control over financial reporting.
The board of directors has determined that Julio Leonzo Álvarez Álvarez is an audit committee financial expert. All members of our audit committee, namely Esther América Paz Montoya, Julio Leonzo Álvarez Álvarez and José Mauricio Rodríguez Múnera, are independent audit committee members under the standards of the New York Stock Exchange, which applies the audit committee independence requirements of the Securities and Exchange Commission.
New York Stock Exchange rules for U.S. companies require that listed companies adopt and disclose a code of business conduct and ethics for directors, officers and employees, and promptly disclose any waivers of the code for directors or executive officers. We have in place a code of ethics that applies to the Company’s officers and employees.
Amounts billed by KPMG for audit and other services were as follows:
|
2014
|
2013
|
|||||||
|
(In Ps millions)
|
||||||||
|
Audit fees
|
20,824 | 17,393 | ||||||
|
Audit-related fees
|
– | – | ||||||
|
Tax fees
|
23 | 27 | ||||||
|
Other fees paid
|
375 | 1,730 | ||||||
The aggregate fees billed under the caption audit fees for professional services rendered to Grupo Aval for the audit of its financial statements and for services that are normally provided to Grupo Aval, in connection with statutory or regulatory filings or engagements totaled Ps 20,824 and Ps 17,393 million for the years 2014 and 2013, respectively.
Additionally other fees paid totaled Ps 375 million and Ps 1,730 million for the years ended 2014 and 2013, respectively, and tax fees paid totaled Ps 23 million and Ps 27 million for the years ended 2014 and 2013, respectively.
The services commissioned from our auditors meet the independence requirements stipulated by the Board of Accountants (
Junta Central de Contadores
) and by SEC rules and regulations, and they did not involve the performance of any work that is incompatible with the audit function.
If we are required to engage an auditing firm for audit and audit-related services, those services have to be pre-approved by the Audit Committee.
The Audit Committee is regularly informed of all fees paid to the auditing firms by us.
All of the members of our audit committee satisfy the independence requirements of the NYSE applicable to foreign private issuers.
Grupo Aval may repurchase its shares only with retained earnings. On the other hand, Colombian law prohibits the repurchase of shares of entities under the comprehensive supervision of, and subject to inspection and surveillance as financial institutions by, the Superintendency of Finance. As such, Banco de Bogotá, Banco de Occidente, Banco Popular, Banco AV Villas, and their respective financial subsidiaries, including Porvenir, Corficolombiana and BAC Credomatic are not permitted to repurchase their shares or Grupo Aval’s shares.
The following table presents purchases of our preferred shares, none of which were in the form of ADSs, by our “affiliated purchasers” (as that term is defined in Rule 10b-18(a)(3) under the Securities Exchange Act of 1934, as amended). Grupo Aval did not effect any purchases of its preferred shares or ADSs:
|
Period
|
(a) Total number of shares (or units) purchased
|
(b) Average price paid per share (or units)
|
(c) Total number of shares (or units) purchased as part of publicly announced plans or programs(1)
|
(d) Maximum number (or approximate dollar value) of shares (or units) that may yet be purchased under the plans or programs(1)
|
||||
|
February, 2014
|
7,228,035
|
Ps 1,231
|
–
|
–
|
||||
|
March, 2014
|
7,561,012
|
Ps 1,244
|
–
|
–
|
||||
|
April, 2014
|
45,000
|
Ps 1,291
|
–
|
–
|
||||
|
May, 2014
|
1,190,000
|
Ps 1,310
|
–
|
–
|
||||
|
June, 2014
|
215,000
|
Ps 1,305
|
–
|
–
|
||||
|
July, 2014
|
2,801,947
|
Ps 1,390
|
–
|
–
|
||||
|
August, 2014
|
2,096,733
|
Ps 1,377
|
–
|
–
|
||||
|
September, 2014
|
2,342,000
|
Ps 1,420
|
–
|
–
|
||||
(1) Pursuant to Article 404 of the Colombian Code of Commerce, administrators of a company (including management and members of the Board of Directors) are required to obtain prior approval from the board of directors of the Company prior to the sale or purchase shares of the Company. Such sale or purchase must not be for speculative purposes. We informed the market on February 11, 2014 that Grupo Aval’s Board of Directors had authorized Adminegocios & Cia S.C.A., an affiliate of Mr. Luis Carlos Sarmiento Angulo (Chairman of the Board), to acquire preferred shares of Grupo Aval for a period of six months and up to Ps 150.0 billion (U.S.$62.7 million). On August 13, 2014, we informed the market that Grupo Aval’s Board of Directors extended this authorization for an additional period of twelve months,
accordingly, the authorization for Adminegocios & Cia S.C.A. to acquire such shares will expire on August 13, 2015.
As of December 31, 2014, Adminegocios had acquired 23,479,727 preferred shares or Ps 30.3 billion (U.S.$12.7 million) through open market transactions on the Colombian Stock Exchange.
Not applicable.
Grupo Aval, as a listed company that qualifies as a foreign private issuer under the NYSE listing standards in accordance with the NYSE corporate governance rules, is permitted to follow home-country practice in some circumstances in lieu of the provisions of the corporate governance rules contained in Section 303A of the NYSE Listed Company Manual that are applicable to U.S. companies. We follow corporate governance practices applicable to Colombian companies and those described in our Corporate Governance Code, which in turn follow Colombian corporate governance rules. The Corporate Governance Code is available at Grupo Aval’s website at www.grupoaval.com. Information on our website is not incorporated into this annual report.
The following is a summary of the significant differences between the corporate governance practices followed by Grupo Aval and those applicable to domestic issuers under the NYSE listing standards.
Independence of directors
Under NYSE corporate governance rules, a majority of a U.S. company’s board of directors must be composed of independent directors, although as a foreign private issuer and a company that is controlled, directly or indirectly, by Mr. Luis Carlos Sarmiento Angulo, we would not be required to comply with this rule. Law 964 of 2005 requires that our board of directors consist of five to ten members and that at least 25% of such members be independent directors, and Decree 3923 of 2006 regulates their election. “Independence” within the meaning of Law 964 of 2005 is primarily concerned with independence from management and the absence of material related-party transactions between the director and the company. See “Item 10. Additional Information—A. Share capital.” In compliance with Colombian law and our by-laws, Grupo Aval’s board of directors is composed of seven members, of which two are independent under Colombian rules. In addition, Colombian law mandates that all directors exercise independent judgment under all circumstances.
Non-executive director meetings
Pursuant to the NYSE listing standards, non-executive directors of U.S. listed companies must meet on a regular basis without management being present. Under Colombian regulations, there is no prohibition against officers being members of the board of directors, and it is our practice that each president of our banks be a member of our board of directors. The non-executive directors of Grupo Aval do not meet formally without management present.
Committees of the board of directors
Under NYSE listing standards, all U.S. companies listed on the NYSE must have an audit committee, a compensation committee and a nominating/corporate governance committee, each with a written charter addressing certain minimum specified duties, and all members of such committees must be independent. In each case, the independence of directors must be established pursuant to highly detailed rules promulgated by the NYSE and, in the case of the audit committee, the NYSE and the SEC. We have established an audit committee, a corporate matters committee and a compensation committee.
Shareholder approval of equity compensation plans
Under NYSE listing standards, shareholders of U.S. companies must be given the opportunity to vote on all equity compensation plans and to approve material revisions to those plans, with limited exceptions set forth in the NYSE rules. Grupo Aval and its subsidiaries currently have no equity compensation plans. Under Colombian law, shareholder approval is required for the compensation of members of the board of directors.
Shareholder approval of dividends.
While NYSE corporate governance standards for U.S. companies do not require listed companies to have shareholders approve or declare dividends, in accordance with the Colombian Code of Commerce, all dividends must be approved by Grupo Aval’s shareholders.
Corporate governance guidelines
NYSE rules for U.S. companies require that listed companies adopt and disclose corporate governance guidelines. The Superintendency of Finance recommends, but does not require, that listed companies adopt corporate governance guidelines; instead, it requires an annual corporate governance survey that compares a company’s corporate governance practices to those recommended by the Superintendency of Finance, and mandates periodic disclosure thereof to the Colombian securities market information system. The annual corporate governance survey is available at Grupo Aval’s website at www.grupoaval.com.
Code of business conduct and ethics
NYSE rules for U.S. companies require that listed companies adopt and disclose a code of business conduct and ethics for directors, officers and employees, and promptly disclose any waivers of the code for directors or executive officers. Grupo Aval has in place a code of ethics that applies to the Company’s officers and employees.
Compliance with corporate governance rules
NYSE rules require the chief executive officer to certify annually that such officer is not aware of any non-compliance with NYSE corporate governance rules, and executive officers are required to promptly notify the NYSE of any material non-compliance. Companies must also submit a written affirmation annually or promptly upon the occurrence of certain changes in corporate governance. No similar requirements exist under Colombian law.
Internal audit function
NYSE rules for U.S. companies require that listed companies maintain an internal audit function to provide management and the audit committee with ongoing assessments of the company’s risk management processes and system of internal control. Grupo Aval maintains an internal auditor, and a Vice-President of Internal Control to coordinate this function at the corporate level.
Not applicable.
We have responded to Item 18 in lieu of this item.
Financial Statements are filed as part of this annual report, see page F-1.
|
1.1
|
English translation of By-laws of Grupo Aval (incorporated by reference to our Registration Statement on Form 20-F (File No. 000-54290) filed with the SEC on March 7, 2011).
|
|
2.1
|
Indenture among Grupo Aval Limited, as Issuer, Grupo Aval Acciones y Valores S.A., as Guarantor, Deutsche Bank Trust Company Americas, as Trustee, Registrar, Paying Agent and Transfer Agent and Deutsche Bank Luxembourg S.A., as Luxembourg Paying Agent and Transfer Agent, dated as of February 1, 2012 (incorporated by reference to our Annual Report on Form 20-F filed with the SEC on April 30, 2012 (File No. 000-54290)).
|
|
2.2
|
Indenture among Grupo Aval Limited, as Issuer, Grupo Aval Acciones y Valores S.A., as Guarantor, Deutsche Bank Trust Company Americas, as Trustee, Registrar, Paying Agent and Transfer Agent and Deutsche Bank Luxembourg S.A., as Luxembourg Paying Agent and Transfer Agent, dated as of September 26, 2012 (incorporated by reference to our Registration Statement on Form 20-F (File No. 000-54290) filed with the SEC on April 26, 2013).
|
|
2.3
|
Form of Deposit Agreement among Grupo Aval, JPMorgan Chase Bank, N.A., as depositary, and the holders from time to time of American depositary shares issued thereunder, including the form of American depositary receipts (incorporated by reference to our Registration Statement on Form F-6 (File No. 333-198614) filed with the SEC on September 8, 2014).
|
|
4.2
|
Loan Agreement between Bancolombia S.A. and Leasing Bogota S.A. – Panamá, dated as of November 26, 2010 (incorporated by reference to our Registration Statement on Form 20-F (File No. 000-54290) filed with the SEC on March 7, 2011).
|
|
4.3
|
Loan Agreement between Bancolombia S.A. and Leasing Bogota S.A. – Panamá, dated as of November 26, 2010 (incorporated by reference to our Registration Statement on Form 20-F (File No. 000-54290) filed with the SEC on March 7, 2011).
|
|
8.1
|
List of subsidiaries.
|
|
12.1
|
Certification pursuant to section 302 of the Sarbanes-Oxley Act of 2002.
|
|
12.2
|
Certification pursuant to section 302 of the Sarbanes-Oxley Act of 2002.
|
|
13.1
|
Certification pursuant to 18 U.S.C. section 1350, as adopted pursuant to section 906 of the Sarbanes-Oxley Act of 2002.
|
|
13.2
|
Certification pursuant to 18 U.S.C. section 1350, as adopted pursuant to section 906 of the Sarbanes-Oxley Act of 2002.
|
The registrant hereby certifies that it meets all of the requirements for filing on Form 20-F and that it has
duly
caused and authorized the undersigned to sign this annual report on its behalf.
|
Grupo Aval Acciones y Valores S.A.
|
||||||
|
Date:
|
April 27, 2015
|
By:
|
/s/ Luis Carlos Sarmiento Gutiérrez
|
|||
|
Name:
|
Luis Carlos Sarmiento Gutiérrez
|
|||||
|
Title:
|
President
|
|||||
|
Page
|
|
|
Audited consolidated financial statements of Grupo Aval Acciones y Valores S.A. and its subsidiaries as of December 31, 2014 and 2013 and for each of the years ended December 31, 2014, 2013 and 2012
|
|
|
F-2
|
|
|
F-3
|
|
|
F-5
|
|
|
F-7
|
|
|
F-8
|
|
|
F-10
|

|
KPMG Ltda.
Calle 90 No. 19C - 74
Bogotá D.C.
|
Teléfono
Fax
www.kpmg.com.co
|
57 (1) 6188100
57 (1) 2185490
|
The Board of Directors and Stockholders
Grupo Aval Acciones y Valores S.A. and Subsidiaries:
We have audited the accompanying consolidated balance sheets of Grupo Aval Acciones y Valores S.A. (“Grupo Aval”) and subsidiaries as of December 31, 2014 and 2013, and the related consolidated statements of income, stockholders’ equity, and cash flows for each of the years in the three-year period ended December 31, 2014. We also have audited Grupo Aval’s internal control over financial reporting as of December 31, 2014, based on criteria established in Internal Control – Integrated Framework (2013) issued by the Committee of Sponsoring Organizations of the Treadway Commission (“COSO”). Grupo Aval’s management is responsible for these consolidated financial statements, for maintaining effective internal control over financial reporting, and for its assessment of the effectiveness of internal control over financial reporting, included in its 2014 annual report on Form 20-F. Our responsibility is to express an opinion on these consolidated financial statements and an opinion on the Company’s internal control over financial reporting based on our audits.
We conducted our audits in accordance with the standards of the Public Company Accounting Oversight Board (United States). Those standards require that we plan and perform the audits to obtain reasonable assurance about whether the financial statements are free of material misstatement and whether effective internal control over financial reporting was maintained in all material respects. Our audits of the consolidated financial statements included examining, on a test basis, evidence supporting the amounts and disclosures in the financial statements, assessing the accounting principles used and significant estimates made by management, and evaluating the overall financial statement presentation. Our audit of internal control over financial reporting included obtaining an understanding of internal control over financial reporting, assessing the risk that a material weakness exists, and testing and evaluating the design and operating effectiveness of internal control based on the assessed risk. Our audits also included performing such other procedures as we considered necessary in the circumstances. We believe that our audits provide a reasonable basis for our opinions.
A company’s internal control over financial reporting is a process designed to provide reasonable assurance regarding the reliability of financial reporting and the preparation of financial statements for external purposes in accordance with generally accepted accounting principles in Colombia and the regulations of the Colombian Superintendency of Finance for financial institutions (collectively, “Colombian Banking GAAP”). A company’s internal control over financial reporting includes those policies and procedures that (1) pertain to the maintenance of records that, in reasonable detail, accurately and fairly reflect the transactions and dispositions of the assets of the company; (2) provide reasonable assurance that transactions are recorded as necessary to permit preparation of financial statements in accordance with Colombian Banking GAAP, and that receipts and expenditures of the company are being made only in accordance with authorizations of management and directors of the company; and (3) provide reasonable assurance regarding prevention or timely detection of unauthorized acquisition, use, or disposition of the company’s assets that could have a material effect on the financial statements.
Because of its inherent limitations, internal control over financial reporting may not prevent or detect misstatements. Also, projections of any evaluation of effectiveness to future periods are subject to the risk that controls may become inadequate because of changes in conditions, or that the degree of compliance with the policies or procedures may deteriorate.
In our opinion, the consolidated financial statements referred to above present fairly, in all material respects, the financial position of Grupo Aval and subsidiaries as of December 31, 2014 and 2013, and the results of its operations and its cash flows for each of the years in the three-year period ended December 31, 2014, in conformity with Colombian Banking GAAP. Also in our opinion, Grupo Aval and subsidiaries maintained, in all material respects, effective internal control over financial reporting as of December 31, 2014, based on criteria established in Internal Control – Integrated Framework (2013) issued by COSO.
The accompanying consolidated financial statements as of and for the year ended December 31, 2014 have been translated into United States dollars solely for convenience of the reader. We have audited the translation and, in our opinion, the consolidated financial statement expressed in Colombian pesos have been translated into United States dollars on the basis set forth in note 2(c) of the notes to the consolidated financial statements.
Colombian Banking GAAP varies in certain significant respects from U.S generally accepted accounting principles. Information relating to the nature and effect of such differences is presented in note 30 to the consolidated financial statements.
/s/ KPMG Ltda.
KPMG Ltda.
Bogotá, Colombia
April 27, 2015
GRUPO AVAL ACCIONES Y VALORES S. A. AND ITS SUBSIDIARIES
As of December 31, 2014 and 2013
(Stated in millions of Colombian pesos and millions of U.S. dollars)
|
Notes
|
U.S. dollars (1)
December 31, 2014
|
December 31, 2014
|
December 31, 2013
|
|||||||||||||
|
Assets
|
||||||||||||||||
|
Cash and cash equivalents
|
||||||||||||||||
|
Cash and due from banks
|
U.S.$ | 7,040 | Ps. | 16,843,147 | Ps. | 13,309,621 | ||||||||||
|
Interbank and overnight funds
|
773 | 1,850,335 | 2,786,991 | |||||||||||||
|
Total cash and cash equivalents
|
3 | 7,813 | 18,693,482 | 16,096,612 | ||||||||||||
|
Investment securities, net
|
4 | |||||||||||||||
|
Debt securities:
|
||||||||||||||||
|
Trading
|
1,445 | 3,456,803 | 6,093,814 | |||||||||||||
|
Available for sale
|
7,528 | 18,010,696 | 14,132,508 | |||||||||||||
|
Held to maturity
|
1,278 | 3,057,581 | 3,348,380 | |||||||||||||
|
Total debt securities
|
10,251 | 24,525,080 | 23,574,702 | |||||||||||||
|
Equity securities:
|
||||||||||||||||
|
Trading
|
668 | 1,597,836 | 1,424,015 | |||||||||||||
|
Available for sale
|
1,033 | 2,472,539 | 2,306,566 | |||||||||||||
|
Total equity securities
|
1,701 | 4,070,375 | 3,730,581 | |||||||||||||
|
Allowance for investment securities
|
(2 | ) | (4,462 | ) | (6,678 | ) | ||||||||||
|
Total investment securities, net
|
11,950 | 28,590,993 | 27,298,605 | |||||||||||||
|
Loans and financial leases:
|
5 | |||||||||||||||
|
Commercial loans
|
26,234 | 62,764,815 | 54,855,580 | |||||||||||||
|
Consumer loans
|
13,863 | 33,166,391 | 27,801,275 | |||||||||||||
|
Microcredit loans
|
147 | 351,781 | 341,857 | |||||||||||||
|
Mortgage loans
|
3,776 | 9,034,678 | 6,520,119 | |||||||||||||
|
Financial leases
|
3,109 | 7,438,413 | 6,994,991 | |||||||||||||
| 47,103 | 112,756,078 | 96,513,822 | ||||||||||||||
|
Allowance for loans and financial leases losses
|
(1,427 | ) | (3,413,680 | ) | (3,073,035 | ) | ||||||||||
|
Total loans and financial leases, net
|
45,703 | 109,342,398 | 93,440,787 | |||||||||||||
|
Interest accrued on loans and financial leases
|
6 | |||||||||||||||
|
Accrued interest receivable on loans and financial leases
|
387 | 927,040 | 819,636 | |||||||||||||
|
Allowance for accrued interest losses
|
(40 | ) | (96,371 | ) | (84,422 | ) | ||||||||||
|
Total interest accrued on loans and financial leases, net
|
347 | 830,669 | 735,214 | |||||||||||||
|
Accounts receivable, net
|
6 | 882 | 2,109,200 | 1,765,631 | ||||||||||||
|
Bankers’ acceptances, spot transactions and derivative financial instruments
|
7 | 509 | 1,218,926 | 411,914 | ||||||||||||
|
Property, plant and equipment, net
|
8 | 951 | 2,275,982 | 2,044,808 | ||||||||||||
|
Operating leases, net
|
9 | 170 | 406,845 | 439,237 | ||||||||||||
|
Foreclosed assets, net
|
10 | 56 | 134,143 | 109,237 | ||||||||||||
|
Prepaid expenses and deferred charges, net
|
11 | 1,187 | 2,827,012 | 2,239,696 | ||||||||||||
|
Goodwill, net
|
12 | 2,352 | 5,626,694 | 4,968,021 | ||||||||||||
|
Other assets, net
|
13 | 710 | 1,698,307 | 1,323,932 | ||||||||||||
|
Reappraisal of assets
|
14 | 1,613 | 3,860,026 | 3,413,697 | ||||||||||||
|
Total assets
|
U.S.$ | 74,239 | Ps. | 177,614,677 | Ps. | 154,287,391 | ||||||||||
|
Memorandum accounts
|
24 | U.S.$ | 287,978 | Ps. | 688,975,858 | Ps. | 602,514,193 | |||||||||
|
(1)
|
See note 2 (c).
|
The accompanying notes form an integral part of these Consolidated Financial Statements.
GRUPO AVAL ACCIONES Y VALORES S. A. AND ITS SUBSIDIARIES
CONSOLIDATED BALANCE SHEETS - Continued
As of December 31, 2014 and 2013
(Stated in millions of Colombian pesos and millions of U.S. dollars)
|
Notes
|
U.S. dollars (1)
December 31, 2014
|
December 31, 2014
|
December 31, 2013
|
|||||||||||||
|
Liabilities and shareholders’ equity
|
||||||||||||||||
|
Deposits:
|
||||||||||||||||
|
Non-interest bearing:
|
||||||||||||||||
|
Checking accounts
|
U.S.$ | 6,520 | Ps. | 15,598,602 | Ps. | 14,555,582 | ||||||||||
|
Other
|
610 | 1,459,771 | 1,087,934 | |||||||||||||
|
Total non-bearing deposits
|
7,130 | 17,058,373 | 15,643,516 | |||||||||||||
|
Interest bearing:
|
||||||||||||||||
|
Checking accounts
|
5,514 | 13,192,171 | 10,328,074 | |||||||||||||
|
Time deposits
|
15 | 17,496 | 41,858,609 | 32,739,250 | ||||||||||||
|
Saving deposits
|
17,673 | 42,283,058 | 42,479,567 | |||||||||||||
|
Total interest bearing deposits
|
40,684 | 97,333,838 | 85,546,891 | |||||||||||||
|
Total deposits
|
47,814 | 114,392,211 | 101,190,407 | |||||||||||||
|
Bankers’ acceptances and derivative financial instruments
|
833 | 1,992,075 | 447,318 | |||||||||||||
|
Interbank borrowings and overnight funds
|
16 | 1,918 | 4,589,494 | 5,123,597 | ||||||||||||
|
Borrowings from banks and others
|
17 | 6,084 | 14,555,113 | 11,954,097 | ||||||||||||
|
Accounts payable
|
18 | 1,185 | 2,833,994 | 2,867,675 | ||||||||||||
|
Accrued interest payable
|
261 | 625,165 | 509,211 | |||||||||||||
|
Other liabilities
|
19 | 1,263 | 3,022,613 | 2,221,666 | ||||||||||||
|
Bonds
|
20 | 5,242 | 12,540,961 | 11,179,705 | ||||||||||||
|
Accrued expenses and other liabilities
|
21 | 250 | 598,214 | 593,254 | ||||||||||||
|
Non-controlling interest
|
22 | 3,080 | 7,368,199 | 6,472,242 | ||||||||||||
|
Total liabilities
|
67,929 | 162,518,039 | 142,559,172 | |||||||||||||
|
Shareholders’ equity
|
23 | |||||||||||||||
|
Subscribed and paid in capital:
|
||||||||||||||||
|
Common and preferred shares
|
9 | 22,281 | 20,178 | |||||||||||||
|
Additional paid in capital
|
3,555 | 8,504,729 | 5,784,513 | |||||||||||||
|
Retained earnings:
|
||||||||||||||||
|
Appropriated
|
1,659 | 3,967,910 | 3,574,754 | |||||||||||||
|
Unappropriated
|
355 | 849,407 | 765,605 | |||||||||||||
|
Equity surplus:
|
||||||||||||||||
|
Equity inflation adjustments
|
273 | 652,122 | 652,180 | |||||||||||||
|
Unrealized net (losses) gains on investment securities available for sale
|
(227 | ) | (543,943 | ) | (523,562 | ) | ||||||||||
|
Reappraisal of assets
|
14 | 687 | 1,644,132 | 1,454,551 | ||||||||||||
|
Total shareholders’ equity
|
U.S.$ | 6,310 | Ps. | 15,096,638 | Ps. | 11,728,219 | ||||||||||
|
Total liabilities and shareholders’ equity
|
U.S.$ | 74,239 | Ps. | 177,614,677 | Ps. | 154,287,391 | ||||||||||
|
Memorandum accounts
|
24 | U.S.$ | 287,978 | Ps. | 688,975,858 | Ps. | 602,514,193 | |||||||||
|
(1)
|
See note 2 (c).
|
The accompanying notes form an integral part of these Consolidated Financial Statements.
GRUPO AVAL ACCIONES Y VALORES S. A. AND ITS SUBSIDIARIES
For the years ended December 31, 2014, 2013 and 2012
(Stated in millions of Colombian pesos and millions of U.S. dollars, except per share data)
|
Notes
|
2014(1)
U.S. dollars
|
2014
|
2013
|
2012
|
|||||||||||||
|
Interest income:
|
|||||||||||||||||
|
Interest on loans
|
U.S.$ | 4,044 | Ps. | 9,674,796 | Ps. | 8,605,952 | Ps. | 8,045,972 | |||||||||
|
Interest on investment securities
|
555 | 1,328,941 | 1,306,938 | 1,298,971 | |||||||||||||
|
Interbank and overnight funds
|
82 | 196,287 | 190,132 | 206,840 | |||||||||||||
|
Financial leases
|
287 | 686,434 | 680,364 | 653,189 | |||||||||||||
|
Total interest income
|
4,968 | 11,886,458 | 10,783,386 | 10,204,972 | |||||||||||||
|
Interest expense:
|
|||||||||||||||||
|
Checking accounts
|
71 | 169,199 | 148,008 | 159,243 | |||||||||||||
|
Time deposits
|
683 | 1,632,972 | 1,383,793 | 1,396,062 | |||||||||||||
|
Saving deposits
|
537 | 1,284,345 | 1,093,046 | 1,094,030 | |||||||||||||
|
Total interest expense on deposits
|
1,290 | 3,086,516 | 2,624,847 | 2,649,335 | |||||||||||||
|
Borrowings from banks and others
|
167 | 398,787 | 395,640 | 473,377 | |||||||||||||
|
Interbank and overnight funds (expenses)
|
77 | 184,907 | 160,798 | 228,272 | |||||||||||||
|
Bonds
|
275 | 658,163 | 621,126 | 543,689 | |||||||||||||
|
Total interest expense
|
1,801 | 4,328,373 | 3,802,411 | 3,894,673 | |||||||||||||
|
Net Interest Income
|
3,159 | 7,558,085 | 6,980,975 | 6,310,299 | |||||||||||||
|
Provisions for loan and financial lease losses, accrued interest and other receivables, net
|
700 | 1,675,031 | 1,417,391 | 1,041,757 | |||||||||||||
|
Recovery of charged-off assets
|
(79 | ) | (189,223 | ) | (148,172 | ) | (142,650 | ) | |||||||||
|
Provision for investment securities, foreclosed assets and other assets
|
35 | 83,401 | 50,012 | 57,314 | |||||||||||||
|
Recovery of provisions for investments securities, foreclosed assets and other assets
|
(13 | ) | (30,983 | ) | (25,029 | ) | (39,078 | ) | |||||||||
|
Total provisions, net
|
643 | 1,538,226 | 1,294,202 | 917,343 | |||||||||||||
|
Net interest income after provisions
|
2,516 | 6,019,859 | 5,686,773 | 5,392,956 | |||||||||||||
|
Fees and other services income:
|
|||||||||||||||||
|
Commissions from banking services
|
750 | 1,794,050 | 1,546,000 | 1,377,550 | |||||||||||||
|
Branch network services
|
13 | 31,041 | 27,850 | 27,445 | |||||||||||||
|
Credit card merchant fees
|
192 | 459,759 | 413,959 | 355,917 | |||||||||||||
|
Checking fees
|
28 | 66,083 | 66,521 | 71,947 | |||||||||||||
|
Warehouse services
|
81 | 194,432 | 188,508 | 174,745 | |||||||||||||
|
Fiduciary activities
|
91 | 217,149 | 204,583 | 178,446 | |||||||||||||
|
Pension plan management
|
315 | 754,063 | 722,171 | 486,530 | |||||||||||||
|
Other
|
92 | 220,854 | 190,041 | 171,582 | |||||||||||||
|
Total fees and other services income
|
1,562 | 3,737,431 | 3,359,633 | 2,844,162 | |||||||||||||
|
Fees and other services expenses
|
240 | 574,656 | 545,277 | 462,142 | |||||||||||||
|
Total fees and other services income, net
|
U.S.$ | 1,322 | Ps. | 3,162,775 | Ps. | 2,814,356 | Ps. | 2,382,020 | |||||||||
|
(1)
|
See note 2 (c).
|
The accompanying notes form an integral part of these Consolidated Financial Statements.
GRUPO AVAL ACCIONES Y VALORES S. A. AND ITS SUBSIDIARIES
CONSOLIDATED STATEMENTS OF INCOME
- Continued
For the years ended December 31, 2014, 2013 and 2012
(Stated in millions of Colombian pesos and millions of U.S. dollars, except per share data)
|
Notes
|
2014 (1)
U.S. dollars
|
2014
|
2013
|
2012
|
||||||||||||||||
|
Other operating income:
|
||||||||||||||||||||
|
Foreign exchange gains (losses), net
|
U.S.$ | 537 | Ps. | 1,283,911 | Ps. | 344,594 | Ps. | (35,018 | ) | |||||||||||
|
(Losses) gains on derivative operations, net
|
(440 | ) | (1,002,185 | ) | (39,434 | ) | 214,944 | |||||||||||||
|
Gains on sales of investments in equity securities, net
|
14 | 33,234 | 96,430 | 10,708 | ||||||||||||||||
|
Income from non-financial sector, net
|
138 | 329,473 | 440,535 | 385,954 | ||||||||||||||||
|
Dividend income
|
125 | 298,479 | 326,431 | 98,935 | ||||||||||||||||
|
Other
|
76 | 182,478 | 148,852 | 210,138 | ||||||||||||||||
|
Total other operating income
|
449 | 1,125,390 | 1,317,408 | 885,661 | ||||||||||||||||
|
Total operating income
|
4,287 | 10,308,024 | 9,818,537 | 8,660,637 | ||||||||||||||||
|
Operating expenses:
|
||||||||||||||||||||
|
Salaries and employee benefits
|
995 | 2,380,842 | 2,178,779 | 1,927,545 | ||||||||||||||||
|
Bonus plan payments
|
47 | 113,107 | 122,204 | 95,087 | ||||||||||||||||
|
Termination payments
|
12 | 29,368 | 19,291 | 21,508 | ||||||||||||||||
|
Administrative and other expenses, net
|
25 | 1,370 | 3,277,701 | 3,053,337 | 2,667,626 | |||||||||||||||
|
Insurance on deposit, net
|
94 | 225,501 | 215,198 | 185,264 | ||||||||||||||||
|
Charitable and other donation expenses
|
5 | 11,257 | 6,647 | 12,738 | ||||||||||||||||
|
Depreciation
|
8,9 | 156 | 373,777 | 318,932 | 296,643 | |||||||||||||||
|
Goodwill amortization
|
12 | 70 | 166,651 | 113,714 | 93,109 | |||||||||||||||
|
Total operating expenses
|
2,750 | 6,578,204 | 6,028,102 | 5,299,520 | ||||||||||||||||
|
Net operating income
|
1,538 | 3,729,820 | 3,790,435 | 3,361,117 | ||||||||||||||||
|
Non-operating income (expense):
|
26 | |||||||||||||||||||
|
Other income
|
229 | 547,094 | 453,352 | 618,516 | ||||||||||||||||
|
Other expense
|
(97 | ) | (284,002 | ) | (217,217 | ) | (170,448 | ) | ||||||||||||
|
Total non-operating income (expense), net
|
131 | 263,092 | 236,135 | 448,068 | ||||||||||||||||
|
Income before income tax expense and non-controlling interest
|
1,669 | 3,992,912 | 4,026,569 | 3,809,186 | ||||||||||||||||
|
Income tax expense
|
21 | (606 | ) | (1,449,025 | ) | (1,414,688 | ) | (1,371,739 | ) | |||||||||||
|
Income before non-controlling interest
|
1,063 | 2,543,887 | 2,611,881 | 2,437,447 | ||||||||||||||||
|
Non-controlling interest
|
(366 | ) | (875,215 | ) | (1,011,378 | ) | (911,059 | ) | ||||||||||||
|
Net income attributable to Grupo Aval shareholders
|
U.S.$ | 697 | Ps. | 1,668,672 | Ps. | 1,600,503 | Ps. | 1,526,388 | ||||||||||||
|
Earnings per share (in pesos)
|
Ps. | 79.851 | Ps. | 86.014 | Ps. | 82.278 | ||||||||||||||
|
Weighted average number of common and preferred shares outstanding
|
20,897,356,358 | 18,607,487,293 | 18,551,656,161 | |||||||||||||||||
|
(1)
|
See note 2 (c).
|
The accompanying notes form an integral part of these Consolidated Financial Statements.
GRUPO AVAL ACCIONES Y VALORES S. A. AND ITS SUBSIDIARIES
For the years ended December 31, 2014, 2013 and 2012
(Stated in millions of Colombian pesos and millions of U.S. dollars)
|
Millions of shares
|
Retained earnings
|
Equity surplus
|
||||||||||||||||||||||||||||||||||||||
|
Preferred non-voting
shares
|
Voting
common
shares
|
Capital at
Par value
|
Additional
paid-in
capital
|
Appropriated
|
Unappropriated
|
Equity
inflation
adjustments
|
Unrealized (losses) /gains/ on investments available for sale
|
Reappraisal of assets
|
Total
Shareholders’
equity
|
|||||||||||||||||||||||||||||||
|
Balance at December 31, 2011
|
4,745 | 13,806 | Ps. | 18,551 | Ps. | 3,671,048 | Ps. | 2,332,030 | Ps. | 668,996 | Ps. | 741,892 | Ps. | (292,952 | ) | Ps. | 1,019,561 | Ps. | 8,159,126 | |||||||||||||||||||||
|
Transfer to appropriated retained earnings and change of common shares by preferred shares
|
185 | (185 | ) | - | - | 721,466 | (721,466 | ) | - | - | - | - | ||||||||||||||||||||||||||||
|
Issuance of preferred shares
|
- | - | - | 615 | - | - | - | - | - | 615 | ||||||||||||||||||||||||||||||
|
Unrealized gains
|
- | - | - | - | - | - | - | 197,267 | - | 197,267 | ||||||||||||||||||||||||||||||
|
Net Income
|
- | - | - | - | - | 1,526,388 | - | - | - | 1,526,388 | ||||||||||||||||||||||||||||||
|
Transfer to appropriated retained earnings
|
- | - | - | - | 668,996 | (668,996 | ) | - | - | - | - | |||||||||||||||||||||||||||||
|
Equity tax paid
|
- | - | - | - | - | - | (47,161 | ) | - | - | (47,161 | ) | ||||||||||||||||||||||||||||
|
Reappraisal of assets
|
- | - | - | - | - | - | - | - | 98,143 | 98,143 | ||||||||||||||||||||||||||||||
|
Dividends declared
|
- | - | - | - | (845,959 | ) | - | - | - | - | (845,959 | ) | ||||||||||||||||||||||||||||
|
Changes in equity surplus
|
- | - | - | - | 35,957 | - | (40,123 | ) | 173,903 | (2) | (173,903 | ) (2) | (4,166 | ) | ||||||||||||||||||||||||||
|
Donations
|
- | - | - | - | (1,150 | ) | - | - | - | - | (1,150 | ) | ||||||||||||||||||||||||||||
|
Balance at December 31, 2012(1)
|
4,930 | 13,621 | Ps. | 18,551 | Ps. | 3,671,663 | Ps. | 2,911,340 | Ps. | 804,922 | Ps. | 654,608 | Ps. | 78,218 | Ps. | 943,801 | Ps. | 9,083,103 | ||||||||||||||||||||||
|
Change of common shares by preferred shares
|
70 | (70 | ) | - | - | - | - | - | - | - | - | |||||||||||||||||||||||||||||
|
Issuance of common shares
(3)
|
- | 1,627 | 1,627 | 2,112,850 | - | - | - | - | - | 2,114,477 | ||||||||||||||||||||||||||||||
|
Unrealized (losses) gains
|
- | - | - | - | - | - | - | (601,780 | ) | - | (601,780 | ) | ||||||||||||||||||||||||||||
|
Net Income
|
- | - | - | - | - | 1,600,503 | - | - | - | 1,600,503 | ||||||||||||||||||||||||||||||
|
Transfer to appropriated retained earnings
|
- | - | - | - | 1,639,820 | (1,639,820 | ) | - | - | - | - | |||||||||||||||||||||||||||||
|
Equity tax paid
|
- | - | - | - | - | - | (2,428 | ) | - | - | (2,428 | ) | ||||||||||||||||||||||||||||
|
Reappraisal of assets
|
- | - | - | - | - | - | - | - | 510,750 | 510,750 | ||||||||||||||||||||||||||||||
|
Dividends declared
|
- | - | - | - | (975,916 | ) | - | - | - | - | (975,916 | ) | ||||||||||||||||||||||||||||
|
Cumulative translation adjustment
|
- | - | - | - | (193 | ) | - | - | - | - | (193 | ) | ||||||||||||||||||||||||||||
|
Donations
|
- | - | - | - | (297 | ) | - | - | - | - | (297 | ) | ||||||||||||||||||||||||||||
|
Balance at December 31, 2013
|
5,000 | 15,178 | Ps. | 20,178 | Ps. | 5,784,513 | Ps. | 3,574,754 | Ps. | 765,605 | Ps. | 652,180 | Ps. | (523,562 | ) | Ps. | 1,454,551 | Ps. | 11,728,219 | |||||||||||||||||||||
|
Change of common shares by preferred shares
|
32 | (32 | ) | - | - | - | - | - | - | - | - | |||||||||||||||||||||||||||||
|
Issuance of common shares (4)
|
1,874 | 229 | 2,103 | 2,720,216 | - | - | - | - | - | 2,722,319 | ||||||||||||||||||||||||||||||
|
Unrealized (losses) gains
|
- | - | - | - | - | - | - | 24,666 | - | 24,666 | ||||||||||||||||||||||||||||||
|
Net Income
|
- | - | - | - | - | 1,668,672 | - | - | - | 1,668,672 | ||||||||||||||||||||||||||||||
|
Transfer to appropriated retained earnings
|
- | - | - | - | 1,584,870 | (1,584,870 | ) | - | - | - | - | |||||||||||||||||||||||||||||
|
Equity tax paid
|
- | - | - | - | - | - | (58 | ) | - | - | (58 | ) | ||||||||||||||||||||||||||||
|
Reappraisal of assets
|
- | - | - | - | - | - | - | - | 189,581 | 189,581 | ||||||||||||||||||||||||||||||
|
Dividends declared
|
- | - | - | - | (1,192,680 | ) | - | - | - | - | (1,192,680 | ) | ||||||||||||||||||||||||||||
|
Cumulative translation adjustment
|
- | - | - | - | - | - | - | (45,047 | ) | - | (45,047 | ) | ||||||||||||||||||||||||||||
|
Donations
|
- | - | - | - | (27 | ) | - | - | - | - | (27 | ) | ||||||||||||||||||||||||||||
|
Reimbursement of reserves
|
- | - | - | - | 995 | - | - | - | - | 995 | ||||||||||||||||||||||||||||||
|
Balance at December 31, 2014
|
6,906 | 15,375 | Ps. | 22,281 | Ps. | 8,504,729 | Ps. | 3,967,910 | Ps. | 849,407 | Ps. | 652,122 | Ps. | (543,943 | ) | Ps. | 1,644,132 | Ps. | 15,096,638 | |||||||||||||||||||||
|
Balance at December 31, 2014
(US dollars)
|
U.S.$ | 9.3 | U.S.$ | 3,554.8 | U.S.$ | 1,658.5 | U.S.$ | 355.0 | U.S.$ | 272.6 | U.S.$ | (227.4 | ) | U.S.$ | 687.2 | U.S.$ | 6,310.1 | |||||||||||||||||||||||
|
(1)
|
In March 2012 Grupo Aval sold
466,457
of its preferred shares through the Colombian Stock Exchange. Grupo Aval held these shares since June 2011, when a limited number of initial purchasers in our Preferred Shares Local Offering defaulted on their obligation to pay for all preferred shares allocated to them. As set forth in the governing documents of the Preferred Shares Local Offering, Grupo Aval sold these shares as soon as practicable upon completion of the Preferred Shares Local Offering at a price in excess of Ps. 1,300, or the initial issuance price. The sale of these shares generated additional paid-in capital of Ps. 615 million, for Grupo Aval.
|
|
(2)
|
Reflects a reclassification between unrealized gains/losses on investments available for sale and reappraisal of assets associated with the escision process related to Banco Popular.
|
|
(3)
|
At the Extraordinary Shareholders’ Meeting held on December 12, 2013, Grupo Aval obtained authorization to issue 1,855,176,646 ordinary shares, subject to preemptive rights. As of December 31, 2013 a total of 1,626,520,862 shares were subscribed and fully paid. As of December 31, 2013 a total of 229 shares were pending to be subscribed and paid. Those shares were subscribed and paid in January 2014.
|
|
(4)
|
Between September 23, 2014 and October 2, 2014, we issued through the New York Stock Exchange an aggregate of 1,874,074,060 preferred shares, equivalent to 93,703,703 ADSs at a price of U.S.$13.5 per ADS, raising U.S.$1.3 billion (Ps. 2.4 trillion at the date of issuance). The sale of these shares generated an increase of Ps. 2,425,060 million in subscribed capital and of Ps. 1,874 million in additional paid-in capital Ps. 2,423,186, for Grupo Aval. (See note 23).
|
GRUPO AVAL ACCIONES Y VALORES S. A. AND ITS SUBSIDIARIES
For the years ended December 31, 2014, 2013 and 2012
(Stated in millions of Colombian pesos and millions of U.S. dollars)
|
2014(1)
|
||||||||||||||||
|
U.S. dollars
|
2014
|
2013
|
2012
|
|||||||||||||
|
Cash flows from operating activities:
|
||||||||||||||||
|
Net income attributable to Grupo Aval’s shareholders for the year
|
U.S.$ | 697 | Ps. | 1,668,672 | Ps. | 1,600,503 | Ps. | 1,526,388 | ||||||||
|
Adjustments to reconcile net income to net cash provided by operating activities:
|
||||||||||||||||
|
Depreciation
|
174 | 417,418 | 352,048 | 315,168 | ||||||||||||
|
Goodwill amortization
|
73 | 173,530 | 116,039 | 97,661 | ||||||||||||
|
Non-controlling interest
|
366 | 875,216 | 1,011,378 | 911,060 | ||||||||||||
|
Provisions for loan and financial lease losses, accrued interest and other receivables, net
|
702 | 1,680,691 | 1,419,044 | 1,051,685 | ||||||||||||
|
Provision for foreclosed assets, net
|
13 | 31,560 | 14,448 | 10,286 | ||||||||||||
|
Recovery for losses on investment securities, net
|
(1 | ) | (2,330 | ) | (396 | ) | (827 | ) | ||||||||
|
Provision (recovery) for property, plant and equipment
|
4 | 8,850 | 4,066 | 2,360 | ||||||||||||
|
Gain on sales of investment securities, net
|
(11 | ) | (26,496 | ) | (28,997 | ) | (11,861 | ) | ||||||||
|
Gain on valuation of investment securities
|
(401 | ) | (958,785 | ) | (544,101 | ) | (721,102 | ) | ||||||||
|
Gain on sales of foreclosed assets
|
(8 | ) | (19,366 | ) | (17,617 | ) | (101,642 | ) | ||||||||
|
Gain on sales of property, plant and equipment
|
(21 | ) | (51,635 | ) | (39,413 | ) | (113,253 | ) | ||||||||
|
Realized and unrealized losses (gains) on derivative transactions
|
190 | 455,366 | (236,153 | ) | (114,645 | ) | ||||||||||
|
Decrease in trading securities
|
3,479 | 8,323,160 | 5,243,190 | 3,066,372 | ||||||||||||
|
Net change in other assets and liabilities
|
538 | 1,286,521 | (1,945,939 | ) | (781,490 | ) | ||||||||||
|
Net cash provided by operating activities
|
5,794 | 13,862,372 | 6,948,100 | 5,136,160 | ||||||||||||
|
Cash flows from investing activities:
|
||||||||||||||||
|
(Increase) of loans and financial leases
|
(4,429 | ) | (10,595,175 | ) | (10,989,540 | ) | (12,410,637 | ) | ||||||||
|
Proceeds from sales of property, plant and equipment
|
249 | 595,914 | 293,382 | 393,124 | ||||||||||||
|
Proceeds from sales of available for sale
|
3,115 | 7,451,374 | 4,616,529 | 4,452,067 | ||||||||||||
|
Proceeds from paydowns and maturities help to maturity investment
|
1,244 | 2,975,498 | 3,058,000 | 2,453,778 | ||||||||||||
|
Proceeds from sales of foreclosed assets
|
41 | 99,186 | 99,606 | 173,596 | ||||||||||||
|
Acquisition of property, plant and equipment and assets for operating leases
|
(440 | ) | (1,053,553 | ) | (833,175 | ) | (711,802 | ) | ||||||||
|
Payment for purchase of companies (2)
|
– - | – | (2,784,280 | ) | (35,553 | ) | ||||||||||
|
Purchase of subsidiaries’ shares (3)
|
(26 | ) | (62,922 | ) | (652,813 | ) | – | |||||||||
|
Acquisition of investment of available for sale
|
(6,384 | ) | (15,273,109 | ) | (9,648,773 | ) | (10,977,558 | ) | ||||||||
|
Acquisition of held to maturity investment
|
(1,091 | ) | (2,609,489 | ) | (3,073,605 | ) | (2,568,760 | ) | ||||||||
|
Net cash (used in) investing activities
|
U.S.$ | (7,721 | ) | Ps. | (18,472,276 | ) | Ps. | (19,914,669 | ) | Ps. | (19,231,745 | ) | ||||
|
(1)
|
See note 2 (c).
|
|
(2)
|
For more detail, during December, 2013 see note 12(a) BBVA Horizonte Sociedad Administradora de Fondos de Pensiones y Cesantias S.A. acquisition and (b) BBVA Panama and Grupo Financiero Reformador acquisitions.
|
|
(3)
|
During 2013, Grupo Aval acquired shares of Banco de Bogota and Banco de Occidente in Colombian market stock exchange.
|
The accompanying notes form an integral part of these Consolidated Financial Statements.
GRUPO AVAL ACCIONES Y VALORES S. A. AND ITS SUBSIDIARIES
CONSOLIDATED STATEMENTS OF CASH FLOWS - Continued
For the years ended December 31, 2014, 2013 and 2012
(Stated in millions of Colombian pesos and millions of U.S. dollars)
|
2014(1)
|
||||||||||||||||
|
U.S. dollars
|
2014
|
2013
|
2012
|
|||||||||||||
|
Cash flows from financing activities:
|
||||||||||||||||
|
Dividends paid
|
U.S.$ | (471 | ) | Ps. | (1,127,929 | ) | Ps. | (925,730 | ) | Ps. | (810,161 | ) | ||||
|
Increase of deposits
|
2,513 | 6,011,111 | 12,684,382 | 12,005,716 | ||||||||||||
|
(Decrease) increase in interbank borrowings and overnight funds
|
(259 | ) | (620,349 | ) | (49,405 | ) | 1,962,494 | |||||||||
|
Increase (decrease) in borrowings from banks and others
|
113 | 271,326 | 524,022 | (434,111 | ) | |||||||||||
|
Decrease in bonds
|
(18 | ) | (42,251 | ) | 933,481 | 3,380,782 | ||||||||||
|
(Decrease) in non-controlling interest
|
(3 | ) | (7,453 | ) | (765,134 | ) | (309,459 | ) | ||||||||
|
Issuance of common and preferred shares
|
1,138 | 2,722,319 | 2,114,477 | 615 | ||||||||||||
|
Net cash provided by financing activities
|
3,013 | 7,206,774 | 14,516,092 | 15,795,876 | ||||||||||||
|
Increase (decrease) in cash and cash equivalents
|
1,086 | 2,596,870 | 1,549,524 | 1,700,291 | ||||||||||||
|
Cash acquired on business combination (2)
|
– | – | 1,148,210 | – | ||||||||||||
|
Cash and cash equivalents at beginning of year
|
6,727 | 16,096,612 | 13,398,878 | 11,698,587 | ||||||||||||
|
Cash and cash equivalents at end of year
|
U.S.$ | 7,813 | Ps. | 18,693,482 | Ps. | 16,096,612 | Ps. | 13,398,878 | ||||||||
|
Supplemental disclosure of cash flow information
|
||||||||||||||||
|
Cash paid during the year for:
|
||||||||||||||||
|
Interest
|
U.S.$ | 1,761 | Ps. | 4,212,460 | Ps. | 3,768,078 | Ps. | 3,911,222 | ||||||||
|
Income taxes
|
U.S.$ | 256 | Ps. | 611,310 | Ps. | 740,485 | Ps. | 1,010,276 | ||||||||
|
|
||||||||||||||||
|
(1)
|
See note 2 (c).
|
|
(2)
|
Reflects cash acquired from BBVA Horizonte Sociedad Administradora de Fondos de Pensiones y Cesantias S.A., BBVA Panamá and Grupo Financiero Reformador.
|
The accompanying notes form an integral part of these Consolidated Financial Statements.
GRUPO AVAL ACCIONES Y VALORES S.A. AND ITS SUBSIDIARIES
FOR THE YEARS ENDED DECEMBER 31, 2014, 2013 AND 2012
(
Stated in millions of Colombian pesos and U.S. dollars)
|
(1)
|
ORGANIZATION AND BACKGROUND
|
|
|
a.
|
Organization
|
Grupo Aval Acciones y Valores S.A. (the “Company” or “Grupo Aval”) was incorporated under Colombian law on January 7, 1994 with a registered office and business address in Bogota, Colombia. The main purpose of Grupo Aval’s consolidated banking subsidiaries (Banco de Bogota S.A., Banco de Occidente S.A., Banco Popular S.A. and Banco Comercial AV Villas S.A.) is to carry out all transactions, acts and services inherent to the banking business according to applicable laws and regulations. Through its investments in Corporacion Financiera Colombiana S.A. (“Corficolombiana”) and Sociedad Administradora de Fondos de Pensiones y Cesantias Porvenir S.A. (“Porvenir”). Grupo Aval is also present in the merchant banking and pension and severance fund management businesses in Colombia. Through its investments in BAC Credomatic and Banco BAC de Panama, Grupo Aval is also present in the Central American banking market in seven countries of the region.
The corporate purpose of Grupo Aval’s (parent company) includes the purchase and sale of stock, bonds and other securities issued by financial and other commercial entities.
In exercising its activities, and pursuant to its by-laws, Grupo Aval may (i) promote the creation of all types of companies related to its corporate purpose; (ii) represent individuals or legal entities that engage in activities that are similar to those mentioned above; (iii) take or grant loans with or without interest; (iv) create liens on its properties as collateral; (v) issue, endorse, acquire, accept, cancel, collect, contest or pay drafts, checks, promissory notes or any other securities, or deliver them in payment; (vi) acquire, divest, encumber, lease or manage all kind of assets; (vii) subscribe or acquire all types of securities and sell or otherwise dispose of them; (viii) participate in companies that seek similar or complementary corporate purposes and freely divest its capital participations in all such companies, (ix) provide services in those areas related to the activities, experience and knowledge of the company; and (x) in general, enter into and execute all actions and agreements directly related to the above purposes in order to permit the exercise of its rights or compliance with its obligations.
During 2013, the Company made three acquisitions (see note 12) that are domiciled in Colombia, Guatemala, Panama City, and Barbados and are engaged in the business of pension plan fund management and Banking Services. On December 31, 2013, the pension plan fund management company was merged with Porvenir.
During December 2014, BAC International Corporation (BIC) went through a reorganization process by which two of its subsidiaries (Banco BAC de Panamá and BAC International Bank) were merged. After the merger, Bank international Bank’s ownership was as follows: 90.4456% owned by BAC International Corporation (BIC), 9.4530% owned by leasing Bogotá Panamá and 0.1014% a owned by third parties.
|
|
b.
|
Grupo Aval and its consolidated subsidiaries
|
These Consolidated Financial Statements include the assets, liabilities, earnings, contingent accounts and memorandum accounts of Grupo Aval Acciones y Valores S.A. and its majority-owned subsidiaries in which it holds, directly or indirectly, 50% or more of the outstanding voting shares. Private equity funds and other special purposes entities are not considered companies under Colombian law.
All significant inter-company transactions and balance sheet accounts have been eliminated in consolidation.
The following chart shows the share directly held in the subsidiaries that Grupo Aval directly consolidates and its share in each of their shareholders’ equity as of December 31, 2014, 2013 and 2012:
|
2014
|
2013
|
2012
|
|||
|
Banco de Bogotá S.A. (1)
|
68.69%
|
62.12%
|
64.44%
|
||
|
Banco de Occidente S.A.
|
72.24%
|
72.16%
|
68.24%
|
||
|
Banco Popular S.A.
|
93.73%
|
93.73%
|
93.73%
|
||
|
Banco Comercial AV Villas S.A.
|
79.85%
|
79.85%
|
79.85%
|
||
|
Grupo Aval Limited
|
100.00%
|
100.00%
|
100.00%
|
||
|
Grupo Aval International Limited
|
100.00%
|
100.00%
|
100.00%
|
|
(1)
|
The change in the direct ownership of Grupo Aval between 2012 and 2013 in Banco de Bogota is the result of: a) the acquisition of 6,162,279 shares equivalent to Ps 425,423, from third parties in Colombian market stock exchange transactions and b) the fact that in Banco de Bogota’s equity issuance of December 2013, Grupo Aval did not participate directly but it did trough Grupo Aval Limited. The ownership in Banco de Bogotá (67.58%) includes the shares that Grupo Aval owns directly (62.12%) and indirectly through Grupo Aval Limited (5.46%). Between Grupo Aval and Grupo Aval Limited our consolidated stake in Banco de Bogota increased from 64.44% as of December 2012 to 67.58% as of December 2013.
|
F-10
GRUPO AVAL ACCIONES Y VALORES S.A. AND ITS SUBSIDIARIES
NOTES TO THE CONSOLIDATED FINANCIAL STATEMENTS
FOR THE YEARS ENDED DECEMBER 31, 2014, 2013 AND 2012
(
Stated in millions of Colombian pesos and U.S. dollars)
During the year ended December 31, 2013, Grupo Aval acquired 6,116,127 shares equivalent to Ps 227,390, through Colombian market stock exchange, and increased its ownership in Banco de Occidente by 3.9271%, from 68.24% as of December 31, 2012 to 72.16% as of December 31, 2013.
Open market purchases of shares of Banco de Bogota and Banco de Occidente during 2013 totaled Ps 652,813 and generated goodwill at Grupo Aval for Ps 307,566.
During 2014, Grupo Aval increase its direct ownership in its subsidiaries though capitalizations, open market transactions, reorganization processes and reception of dividends in kind:
Increases in ownership in Banco de Bogotá:
During the first semester of 2014, Grupo Aval acquired 16,177,067 shares of Banco de Bogotá. 15,552,336 of those shares were acquired from Grupo Aval Ltd. Through a reorganization process and 624,731 shares were acquired through open market transactions. After both events, direct ownership of Grupo Aval in Banco de Bogotá increased from 62.12% to 67.38%.
During the second semester of 2014, Grupo Aval acquired 20,379,085 shares in Banco de Bogotá. 19,060,189 of those shares were acquired through the equity issuance of November and December of 2014, 1,293,582 were acquired from Grupo Aval Ltd. As a continuance of the reorganization process that began during the first semester and 25,314 shares were acquired through open market transactions. After the above mentioned events, ownership of Grupo Aval in Banco de Bogotá ended 2014 in 68.69%.
Increases in ownership in Banco de Occidente:
During 2014 a total of 119,142 shares of Banco de Occidente were acquired through open market transactions taking Grupo Aval’s ownership in the Bank from 72.16% to 72.24%.
Increases in shares owned in Porvenir:
During 2014 Grupo Aval received 738,133 shares of Porvenir as this company paid dividends in kind. No changes in direct ownership resulted from this.
Increases in ownership in Corficolombiana:
Through a related party transaction, Grupo Aval acquired from Banco de Occidente a total of 20,008,260 shares of Corficolombiana equivalent to 9.35%.
In all of the transactions described above Grupo Aval Ps. 3,215,781 as follows: Ps. 2,421,125 in shares of Banco de Bogotá, Ps. 769,498 in shares of CFC, Ps. 20,891 in shares of Porvenir, and Ps. 4,267 in shares of Banco de Occidente.
Banco de Bogota S. A.
was incorporated as a banking establishment in Bogota on November 15, 1870. Banco de Bogota’s business purpose is to engage and carry out all transactions and contracts legally authorized for commercial banks, subject to limitations and requirements imposed by Colombian laws and regulations.
Banco de Occidente S. A.
was
incorporated as a banking establishment on September 8, 1964, and it is authorized to operate under the terms of the Resolution for Renewal No. 2345 dated June 29, 1990 issued by the Superintendency of Finance of Colombia. Banco de Occidente’s business purpose is to engage and carry out all transactions and contracts legally authorized for commercial banks, subject to limitations and requirements imposed by Colombian laws and regulations.
Banco Popular S. A.
was incorporated as a banking establishment on July 5, 1950. Banco Popular is currently a privately owned bank with a minor participation of government entities of 2%. Its main business purpose is to engage and carry out all transactions and contracts legally authorized for commercial banks, subject to limitations and requirements imposed by Colombian laws and regulations.
F-11
GRUPO AVAL ACCIONES Y VALORES S.A. AND ITS SUBSIDIARIES
NOTES TO THE CONSOLIDATED FINANCIAL STATEMENTS
FOR THE YEARS ENDED DECEMBER 31, 2014, 2013 AND 2012
(
Stated in millions of Colombian pesos and U.S. dollars)
Banco Comercial AV Villas S. A.
was incorporated on November 24, 1972. Banco Comercial AV Villas’s business purpose is to engage and carry out all transactions and contracts legally authorized for commercial banks, subject to limitations and requirements imposed by Colombian laws and regulations.
Grupo Aval Limited
was incorporated in the Cayman Islands in January 2012 as a special purpose vehicle. In exercise of its activities, and pursuant to its by-laws, Grupo Aval Limited may issue debt and grant loans to related companies.
Grupo Aval International Limited
was incorporated in the Cayman Islands in October 8, 2012 as a special purpose vehicle. The objects for which Grupo Aval International Limited was established are unrestricted and it shall have full power and authority to carry out any permitted activities pursuant to applicable law.
The following chart shows the assets, liabilities, shareholders’ equity and net income of all the subsidiaries consolidated by Grupo Aval through the above-mentioned entities for the year ended December 31, 2014:
|
For the year ended
December 31, 2014
|
Assets
|
%
|
Liabilities
|
%
|
Equity
|
%
|
Net Income
|
%
|
||||||||||||||||||||||||
|
Banco de Bogotá S.A. (unconsolidated)
|
Ps. | 66,762,870 | 37.59 | % | 52,787,089 | 32.48 | % | 13,975,780 | 92.58 | % | 1,505,263 | 90.21 | % | |||||||||||||||||||
|
Almaviva S.A. and subsidiaries
|
215,287 | 0.12 | % | 41,417 | 0.03 | % | 173,870 | 1.15 | % | 17,452 | 1.05 | % | ||||||||||||||||||||
|
Banco de Bogotá S.A.- Panama and subsidiaries
|
2,853,143 | 1.61 | % | 2,674,891 | 1.65 | % | 178,252 | 1.18 | % | 27,504 | 1.65 | % | ||||||||||||||||||||
|
Bogota Finance Corp.
|
203 | – | – | – | 203 | – | 2 | – | ||||||||||||||||||||||||
|
Casa de Bolsa S.A.
|
61,901 | 0.03 | % | 34,713 | 0.02 | % | 27,188 | 0.18 | % | 371 | 0.02 | % | ||||||||||||||||||||
|
Corficolombiana S.A. and subsidiaries
|
12,004,827 | 6.76 | % | 7,471,629 | 4.60 | % | 4,533,198 | 30.03 | % | 420,856 | 25.22 | % | ||||||||||||||||||||
|
Corp. Financiera Centroamericana FICENTRO
|
7 | – | 7 | – | – | – | – | – | ||||||||||||||||||||||||
|
Fiduciaria Bogota S.A.
|
275,769 | 0.16 | % | 60,661 | 0.04 | % | 215,108 | 1.42 | % | 58,486 | 3.50 | % | ||||||||||||||||||||
|
Leasing Bogota S.A. - Panama and subsidiaries
|
46,110,468 | 25.96 | % | 39,177,342 | 24.11 | % | 6,933,126 | 45.92 | % | 502,006 | 30.08 | % | ||||||||||||||||||||
|
Megalinea S.A.
|
13,026 | 0.01 | % | 10,536 | 0.01 | % | 2,490 | 0.02 | % | 106 | 0.01 | % | ||||||||||||||||||||
|
Porvenir S.A. and subsidiaries
|
1,898,655 | 1.07 | % | 616,450 | 0.38 | % | 1,282,205 | 8.49 | % | 282,310 | 16.92 | % | ||||||||||||||||||||
|
Eliminations from consolidation
|
(11,829,515 | ) | (6.66 | %) | 3,289,109 | 2.02 | % | (15,118,624 | ) | (100.15 | %) | (1,425,736 | ) | (85.44 | %) | |||||||||||||||||
|
Banco de Bogotá S.A. consolidated
|
Ps. | 118,366,641 | 66.64 | % | 106,163,844 | 65.32 | % | 12,202,796 | 80,83 | % | 1,388,620 | 83.22 | % | |||||||||||||||||||
|
Banco de Occidente S.A. (unconsolidated)
|
30,440,463 | 17.14 | % | 26,378,854 | 16.23 | % | 4,061,609 | 26.90 | % | 1,200,810 | 71.96 | % | ||||||||||||||||||||
|
Banco de Occidente S.A. – Panama
|
2,401,514 | 1.35 | % | 2,372,310 | 1.46 | % | 29,204 | 0.19 | % | (10,381 | ) | (0.62 | %) | |||||||||||||||||||
|
Fiduoccidente S.A.
|
221,578 | 0.12 | % | 23,282 | 0.01 | % | 198,296 | 1.31 | % | 32,123 | 1.93 | % | ||||||||||||||||||||
|
Occidental Bank Barbados Ltd.
|
612,299 | 0.34 | % | 561,824 | 0.35 | % | 50,474 | 0.33 | % | 1,016 | 0.06 | % | ||||||||||||||||||||
|
Ventas y Servicios S.A.
|
61,408 | 0.03 | % | 40,967 | 0.03 | % | 20,441 | 0.14 | % | 3,182 | 0.19 | % | ||||||||||||||||||||
|
Eliminations from consolidation
|
(1,206,023 | ) | (0.68 | %) | (848,559 | ) | (0.52 | %) | (357,463 | ) | (2.37 | %) | (31,206 | ) | (1.87 | %) | ||||||||||||||||
|
Banco de Occidente S.A. consolidated
|
Ps. | 32,531,239 | 18.32 | % | 28,528,678 | 17.55 | % | 4,002,561 | 26.51 | % | 1,195,544 | 71.65 | % | |||||||||||||||||||
|
Banco Popular S.A. (unconsolidated)
|
16,959,701 | 9.55 | % | 14,349,408 | 8.83 | % | 2,610,292 | 17.29 | % | 380,080 | 22.78 | % | ||||||||||||||||||||
|
Alpopular S.A.
|
158,289 | 0.09 | % | 17,812 | 0.01 | % | 140,477 | 0.93 | % | 3,917 | 0.23 | % | ||||||||||||||||||||
|
Fiduciaria Popular S.A.
|
61,879 | 0.03 | % | 7,068 | – | 54,811 | 0.36 | % | 1,338 | 0.08 | % | |||||||||||||||||||||
|
INCA S.A.
|
45,993 | 0.03 | % | 4,600 | – | 41,394 | 0.27 | % | (781 | ) | (0.05 | %) | ||||||||||||||||||||
|
Eliminations from consolidation
|
(166,598 | ) | (0.09 | %) | 53,920 | 0.03 | % | (220,517 | ) | (1.46 | %) | (18,859 | ) | (1.13 | %) | |||||||||||||||||
|
Banco Popular S.A. consolidated
|
Ps. | 17,059,264 | 9.60 | % | 14,432,808 | 8.88 | % | 2,626,457 | 17.40 | % | 365,695 | 21.92 | % | |||||||||||||||||||
|
Banco Comercial AV Villas S.A. (unconsolidated)
|
10,917,267 | 6.15 | % | 9,632,995 | 5.93 | % | 1,284,272 | 8.51 | % | 195,196 | 11,70 | % | ||||||||||||||||||||
|
A Toda Hora S.A. (ATH)
|
56,916 | 0.03 | % | 49,838 | 0.03 | % | 7,078 | 0.05 | % | 490 | 0.03 | % | ||||||||||||||||||||
|
Eliminations from consolidation
|
(3,145 | ) | – | 3,932 | – | (7,077 | ) | (0.05 | %) | (294 | ) | (0.02 | %) | |||||||||||||||||||
|
Banco Comercial AV Villas S.A. consolidated
|
Ps. | 10,971,038 | 6.18 | % | 9,686,765 | 5.96 | % | 1,284,273 | 8.51 | % | 195,392 | 11.71 | % | |||||||||||||||||||
|
Grupo Aval Acciones y Valores S.A. (unconsolidated)
|
19,961,114 | 11.24 | % | 1,145,287 | 0.70 | % | 18,815,827 | 124.64 | % | 947,639 | 56.79 | % | ||||||||||||||||||||
|
Grupo Aval Limited
|
3,726,228 | 2.10 | % | 3,889,003 | 2.39 | % | (162,775 | ) | (1.08 | %) | (23,344 | ) | (1.40 | %) | ||||||||||||||||||
|
Grupo Aval International Limited
|
845,840 | 0.48 | % | 927,491 | 0.57 | % | (81,651 | ) | (0.54 | %) | 45,310 | 2.72 | % | |||||||||||||||||||
|
Eliminations from consolidation
|
(25,846,687 | ) | (14.55 | %) | (2,255,837 | ) | (1.39 | %) | (23,590,850 | ) | (156.27 | %) | (2,446,184 | ) | (146.59 | %) | ||||||||||||||||
|
Grupo Aval Consolidated
|
Ps. | 177,614,677 | 100 | % | 162,518,039 | 100 | % | 15,096,638 | 100 | % | 1,668,672 | 100 | % | |||||||||||||||||||
GRUPO AVAL ACCIONES Y VALORES S.A. AND ITS SUBSIDIARIES
NOTES TO THE CONSOLIDATED FINANCIAL STATEMENTS
FOR THE YEARS ENDED DECEMBER 31, 2014, 2013 AND 2012
(
Stated in millions of Colombian pesos and U.S. dollars)
The following chart shows the assets, liabilities, shareholders’ equity and net income of all the subsidiaries consolidated by Grupo Aval through the above-mentioned banks for the year ended December 31, 2013:
|
For the year ended
December 31, 2013
|
Assets
|
%
|
Liabilities
|
%
|
Equity
|
%
|
Net Income
|
%
|
||||||||||||||||||||||||
|
Banco de Bogotá S.A. (unconsolidated)
|
Ps. | 57,327,276 | 37.16 | % | 45,773,175 | 32.11 | % | 11,554,101 | 98.52 | % | 1,418,450 | 88.63 | % | |||||||||||||||||||
|
Almaviva S.A. and subsidiaries
|
209,253 | 0.14 | % | 54,225 | 0.04 | % | 155,028 | 1.32 | % | 28,551 | 1.78 | % | ||||||||||||||||||||
|
Banco de Bogotá S.A.- Panama and subsidiaries
|
2,004,534 | 1.30 | % | 1,881,520 | 1.32 | % | 123,014 | 1.05 | % | 10,005 | 0.63 | % | ||||||||||||||||||||
|
Bogota Finance Corp.
|
162 | – | – | – | 162 | – | 1 | - | ||||||||||||||||||||||||
|
Casa de Bolsa S.A.
|
48,998 | 0.03 | % | 21,537 | 0.02 | % | 27,461 | 0.23 | % | 365 | 0.02 | % | ||||||||||||||||||||
|
Corficolombiana S.A. and subsidiaries
|
14,061,412 | 9.11 | % | 10,033,975 | 7.04 | % | 4,027,438 | 34.34 | % | 539,038 | 33.68 | % | ||||||||||||||||||||
|
Corp. Financiera Centroamericana FICENTRO
|
6 | – | 6 | – | – | – | – | – | ||||||||||||||||||||||||
|
Fiduciaria Bogota S.A.
|
234,572 | 0.15 | % | 50,449 | 0.04 | % | 184,123 | 1.57 | % | 52,278 | 3.27 | % | ||||||||||||||||||||
|
Leasing Bogota S.A. - Panama and subsidiaries
|
35,213,284 | 22.82 | % | 30,085,047 | 21.10 | % | 5,128,237 | 43.73 | % | 480,790 | 30.04 | % | ||||||||||||||||||||
|
Megalinea S.A.
|
7,316 | – | 4,932 | – | 2,384 | 0.02 | % | 46 | – | |||||||||||||||||||||||
|
Porvenir S.A. and subsidiaries
|
1,645,366 | 1.07 | % | 516,070 | 0.36 | % | 1,129,296 | 9.63 | % | 201,629 | 12.60 | % | ||||||||||||||||||||
|
Eliminations from consolidation
|
(10,083,147 | ) | (6.54 | %) | 2,350,730 | 1.65 | % | (12,433,878 | ) | (106.02 | %) | (1,331,130 | ) | (83.17 | %) | |||||||||||||||||
|
Banco de Bogotá S.A. consolidated
|
Ps. | 100,669,032 | 65,24 | % | 90,771,666 | 63.68 | % | 9,897,366 | 84.39 | % | 1,400,023 | 87.48 | % | |||||||||||||||||||
|
Banco de Occidente S.A. (unconsolidated)
|
27,559,648 | 17.86 | % | 23,756,205 | 16.66 | % | 3,803,443 | 32.43 | % | 455,869 | 28.48 | % | ||||||||||||||||||||
|
Banco de Occidente S.A. – Panama
|
1,664,522 | 1.08 | % | 1,632,049 | 1.14 | % | 32,473 | 0.28 | % | (9,389 | ) | (0.59 | %) | |||||||||||||||||||
|
Fiduoccidente S.A.
|
162,569 | 0.11 | % | 31,738 | 0.02 | % | 130,831 | 1.12 | % | 30,368 | 1.90 | % | ||||||||||||||||||||
|
Occidental Bank Barbados Ltd.
|
397,012 | 0.26 | % | 357,141 | 0.25 | % | 39,872 | 0.34 | % | 441 | 0.03 | % | ||||||||||||||||||||
|
Ventas y Servicios S.A.
|
41,562 | 0.03 | % | 29,057 | 0.02 | % | 12,505 | 0.11 | % | 1,762 | 0.11 | % | ||||||||||||||||||||
|
Eliminations from consolidation
|
(795,510 | ) | (0.52 | %) | (543,873 | ) | (0.38 | %) | (251,638 | ) | (2.15 | %) | (50,891 | ) | (3.18 | %) | ||||||||||||||||
|
Banco de Occidente S.A. consolidated
|
Ps. | 29,029,803 | 18,82 | % | 25,262,317 | 17,71 | % | 3,767,486 | 32.13 | % | 428,160 | 26.75 | % | |||||||||||||||||||
|
Banco Popular S.A. (unconsolidated)
|
16,600,505 | 10.76 | % | 14,200,340 | 9.96 | % | 2.400,166 | 20.46 | % | 398,557 | 24.90 | % | ||||||||||||||||||||
|
Alpopular S.A.
|
148,757 | 0.10 | % | 12,792 | 0.01 | % | 135,965 | 1.16 | % | 3,527 | 0.22 | % | ||||||||||||||||||||
|
Fiduciaria Popular S.A.
|
59,973 | 0.04 | % | 7,031 | – | 52,942 | 0.45 | % | 1,724 | 0.11 | % | |||||||||||||||||||||
|
INCA S.A.
|
48,957 | 0.03 | % | 6,221 | – | 42,736 | 0.36 | % | 2,412 | 0.15 | % | |||||||||||||||||||||
|
Eliminations from consolidation
|
(146,336 | ) | (0.09 | %) | 55,413 | 0.04 | % | (201,750 | ) | (1.72 | %) | (9,941 | ) | (0.62 | %) | |||||||||||||||||
|
Banco Popular S.A. consolidated
|
Ps. | 16,711,856 | 10.84 | % | 14,281,797 | 10.01 | % | 2,430,059 | 20.71 | % | 396,279 | 24.76 | % | |||||||||||||||||||
|
Banco Comercial AV Villas S.A. (unconsolidated)
|
9,651,766 | 6.26 | % | 8,476,249 | 5.95 | % | 1,175,517 | 10.02 | % | 186,106 | 11.63 | % | ||||||||||||||||||||
|
A Toda Hora S.A. (ATH)
|
61,358 | 0.04 | % | 54,681 | 0.04 | % | 6,678 | 0.06 | % | 17 | – | |||||||||||||||||||||
|
Eliminations from consolidation
|
(3.560 | ) | – | 3,146 | – | (6,707 | ) | (0.06 | %) | (10 | ) | – | ||||||||||||||||||||
|
Banco Comercial AV Villas S.A. consolidated
|
Ps. | 9,709,564 | 6.30 | % | 8,534,076 | 5.99 | % | 1,175,488 | 10.02 | % | 186,112 | 11.63 | % | |||||||||||||||||||
|
Grupo Aval Acciones y Valores S.A. (unconsolidated)
|
17,651,644 | 11.44 | % | 1,175,557 | 0.82 | % | 16,476,088 | 140.48 | % | 686,056 | 42.87 | % | ||||||||||||||||||||
|
Grupo Aval Limited
|
3,064,044 | 1.99 | % | 3,132,061 | 2.20 | % | (68,017 | ) | (0.58 | %) | (50,675 | ) | (3.17 | %) | ||||||||||||||||||
|
Grupo Aval International Limited
|
422,367 | 0.27 | % | 543,380 | 0.38 | % | (121,013 | ) | (1.03 | %) | (108,952 | ) | (6.81 | %) | ||||||||||||||||||
|
Eliminations from consolidation
|
(22,970,919 | ) | (14.89 | %) | (1,141,682 | ) | (0.80 | %) | (21,829,238 | ) | (186.13 | %) | (1,336,500 | ) | (83.51 | %) | ||||||||||||||||
|
Grupo Aval Consolidated
|
Ps. | 154,287,391 | 100 | % | 142,559,172 | 100 | % | 11,728,219 | 100 | % | 1,600,503 | 100 | % | |||||||||||||||||||
|
(2)
|
SUMMARY OF SIGNIFICANT ACCOUNTING POLICIES
|
|
a)
|
Basis of presentation
|
Grupo Aval and its local subsidiaries have prepared these financial statements in accordance with the regulations of the Superintendency of Finance of Colombia (Resolution 3600 of 1988 and External Circular 100 of 1995) and, on issues not addressed by these regulations, with the generally accepted accounting principles in Colombia, or “Colombian GAAP” and, together with such regulations, “Colombian Banking GAAP”.
The financial statements of foreign subsidiaries have been adjusted in order to adopt uniform accounting policies as required by Colombian Banking GAAP.
F-13
GRUPO AVAL ACCIONES Y VALORES S.A. AND ITS SUBSIDIARIES
NOTES TO THE CONSOLIDATED FINANCIAL STATEMENTS
FOR THE YEARS ENDED DECEMBER 31, 2014, 2013 AND 2012
(
Stated in millions of Colombian pesos and U.S. dollars)
|
b)
|
Translation of foreign currency transactions and consolidated balances
|
Translation of financial statements in foreign currency:
Financial statements of Grupo Aval’s subsidiaries with functional currencies different from the Colombian peso are translated to pesos as follows:
Balance sheet accounts are translated to pesos using the “
Tasa Representativa de Mercado”
or market exchange rate applicable at the end of the year, as established by the Superintendency of Finance of Colombia (except equity accounts which are translated at the historical exchange rate). The market exchange rates at December 31, 2014, 2013 and 2012 were Ps 2,392.46 Ps 1,926.83 and Ps 1,768.23 per U.S.$1.00, respectively. Consolidated statements of income accounts for the years ended December 31, 2014, 2013 and 2012 were translated to pesos using average monthly historical rates, these averages were Ps 2,037.99 Ps 1,910.56 and Ps 1,802.27 per U.S.$1.00, respectively. Exchange differences originated in the balance sheet accounts, are recorded as “Cumulative translation adjustments” in Shareholders’ Equity, and exchange differences originated in the statement of income accounts are recorded as “Foreign exchange gains (losses), net”.
Transactions and balances in foreign currency by Grupo Aval and its local subsidiaries
Transactions and balances in foreign currency are translated by Grupo Aval and its banking subsidiaries to pesos using the market exchange rates applicable on the corresponding dates, as established by the Superintendency of Finance of Colombia. The exchange rates at December 31, 2014, December 31, 2013 and December 31, 2012 are as stated above. Exchange rate differences arising from the translation of assets and liabilities denominated in foreign currency to pesos are recorded in the account “Foreign exchange difference gains (losses), net” on the consolidated statements of income.
|
c)
|
Convenience translation to U.S. dollars
|
Grupo Aval and its banking subsidiaries present their financial statements in Colombian pesos. The U.S. dollar amounts disclosed in the accompanying consolidated financial statements are presented solely for the convenience of the reader, dividing the peso amounts by the exchange rate of Ps. 2,392.46 per U.S.$1.00, which is the market exchange rate at December 31, 2014, as determined by the Superintendency of Finance of Colombia. The use of this methodology in translating Colombian pesos to U.S. dollars is referred to as the “U.S. dollar translation methodology,” and should not be construed as a representation that the Colombian peso amounts actually represent or have been, or could be converted into U.S. dollars at that or any other rate.
|
d)
|
Use of estimates in the preparation of consolidated financial statements
|
The preparation of consolidated financial statements, according to Colombian Banking GAAP, requires management to make certain estimates and assumptions that affect the reported amounts of assets and liabilities at the date of consolidated financial statements, as well as the reported amounts of revenues and expenses during the reporting period. Actual amounts could differ from those estimates.
|
e)
|
Real Value Unit rate (UVR)
|
The transactions that Grupo Aval’s banking subsidiaries carry out with regard to mortgage loans linked to the Unidad de Valor Real (the “Real Value Unit” or “UVR”) are adjusted on a daily basis based on the daily value of the UVR, as published by the Colombian Central Bank. The values assigned by the Central Bank to the UVR, in Colombian pesos, at December 31, 2014, 2013 and 2012 were Ps. 215.0333, Ps. 207.8381 and Ps. 204.2017, respectively. The UVR reflects the monthly variance of the ICP (Colombian Consumer Price Index).
|
f)
|
Cash and cash equivalents
|
Cash and cash equivalents consist of cash and due from banks that are highly liquid investments with a maturity of three months or less at the date of acquisition. Interbank borrowings and overnight funds, (explained in note 2(g) below) with a maturity of less than 90 days, are also included in the “Cash and cash equivalents” account in the consolidated balance sheets
.
GRUPO AVAL ACCIONES Y VALORES S.A. AND ITS SUBSIDIARIES
NOTES TO THE CONSOLIDATED FINANCIAL STATEMENTS
FOR THE YEARS ENDED DECEMBER 31, 2014, 2013 AND 2012
(
Stated in millions of Colombian pesos and U.S. dollars)
|
g)
|
Money market transactions
|
Money market transactions involve interbank and overnight funds, repurchase and resale (repo) transactions, simultaneous transactions and transactions involving the temporary transfer of securities.
Interbank and overnight funds
Interbank and overnight funds consist of funds either received from or placed in, directly, by any of Grupo Aval’s banking subsidiaries, other financial institutions. These transactions are undertaken for periods no longer than 30 calendar days, seeking to either take advantage of excess liquidity positions or compensate for liquidity deficiencies. Interest from interbank and overnight funds operations is recorded as income in the consolidated statements of income.
Repurchase and resale (repo) transactions
A repo transaction is defined as the acquisition or transfer of securities, in exchange for the delivery of liquid funds (with or without a discount), assuming at that time and by virtue of such action, the commitment to transfer or acquire from the counterparty, on either the same day or at a later date, without at any time exceeding the term of one year, at an established price, the securities subject to the transaction or other securities of similar kind. Under the terms of certain repo transactions, securities may be exchanged for other securities, and restrictions may be imposed as to the transferability of such securities. The value of the securities granted or received to support repo transactions is registered in the “Memorandum accounts”. The returns agreed upon for these transactions are based on the Superintendency of Finance of Colombia rules and regulations and are recorded as income (in the case of lending operations) or expense (in the case of borrowing operations) in the consolidated statements of income.
|
h)
|
Investment securities
|
Since March 4, 2013, in accordance with Chapter 16 of Title I of Circular Basica Contable issued by the Superintendency of Finance of Colombia, the entities should hire an official price provider company for minimum periods of one year. Meanwhile, the official price provider company should provide the information to value the securities (prices, reference rates and spreads), and supply the valuation methodologies during 2014 and 2013. Grupo Aval and its subsidiaries hired Infovalmer S.A. as their official price provider company and as December 31, 2014 the investment securities were valued using Infovalmer price information.
|
1.
|
Classification
|
Investment securities are classified as “trading”, “available for sale” or “held to maturity”.
|
1.1.
|
Trading securities
|
Trading securities are those acquired mainly with the purpose of obtaining profits from short-term price fluctuations and are accounted for at fair value.
|
1.2.
|
Available for sale securities
|
Available for sale securities are those for which the investor has both a clear intention and legal, contractual, financial and operational capacity to hold for at least six months, before initiating a sale or reclassifying the securities, in accordance to the External Circular No. 033 of 2013 issued by the Superintendency of Finance of Colombia. Prior to External Circular N° 033 of 2013, a security had to be held as available for sale securities before selling it or reclassifying it for a minimum period of one year.
On the first business day after the minimum time period is passed, investors decide whether to leave them as available for sale securities or reclassify them as trading or held to maturity. On the day an available for sale security is reclassified as trading, unrealized gains or losses, carried up to that point in their balance sheet must be recognized as either income or expense in the consolidated statements of income.
Available for sale securities include, in accordance with the Bolsa de Valores de Colombia, (Colombian Stock Exchange), low liquidity level and unquoted equity securities.
F-15
GRUPO AVAL ACCIONES Y VALORES S.A. AND ITS SUBSIDIARIES
NOTES TO THE CONSOLIDATED FINANCIAL STATEMENTS
FOR THE YEARS ENDED DECEMBER 31, 2014, 2013 AND 2012
(
Stated in millions of Colombian pesos and U.S. dollars)
These securities can be used in liquidity transactions, including repo and simultaneous transactions. They can also be used as guarantees for derivative transactions if and when the counterparty is a clearinghouse.
|
1.3.
|
Held to maturity securities
|
Held to maturity securities are debt securities acquired with the stated purpose and legal, contractual, financial and operational capacity to hold until maturity. These securities are accounted for at their acquisition cost plus accrued interest using the effective interest rate method and may not be used for liquidity operations, unless they are mandatory investments entered into on the primary market, provided that the counterparty for the transaction is the Colombian Central Bank, institutions overseen by the Superintendency of Finance of Colombia or, in exceptional cases, as otherwise determined by the Superintendency of Finance of Colombia.
|
2.
|
Initial measurement
|
Securities are initially accounted for at their acquisition cost. Subsequent recognition depends on their classification.
|
2.1.
|
Debt securities
|
Held to maturity debt securities are recorded for at their acquisition cost plus accrued interest using the internal rate of return calculated on the purchase date.
|
2.2.
|
Equity securities
|
The Superintendency of Finance of Colombia mandates that equity investments are to be marked to market on a daily basis. However, in the case of investments in securities that have low liquidity levels, or that are not listed on a securities exchange, and whose only source of valuation are the financial statements of the issuing company, Grupo Aval and its banking subsidiaries annually conduct valuations of such investments, recording the amounts thus appraised in their consolidated financial statements.
Grupo Aval follows the following stock valuation method:
a.
Listed equity securities, issued and traded in Colombia
Securities are valued daily based on prices published by authorized entities (i.e., the Colombian Stock Exchange). In the absence of a price calculated for the day on which these securities are appraised, the last known valuation price is to be used. In the case of a listed equity security not reporting any trades on the secondary market as of its issue date, and for which there is no indicated market price for its primary issue, it should be appraised based on the guidelines stipulated in 2.2.b. below.
b. Non-listed equity securities, issued in Colombia
Securities are valued based on acquisition cost which is later increased or decreased depending upon the investor’s percentage stake in all subsequent changes in the issuer’s shareholders’ equity.
For this purpose, the issuer’s shareholders’ equity is calculated based on audited financial statements at the cut-off dates of June 30 and December 31 of each year. However, when more recent audited financial statements are released, these financial statements may be used to calculate the latest changes to the equity of the issuer. Entities have a maximum allowed time of three months, subsequent to the cut-off date of the financial statements, to update the valuations of their investments.
c.
Listed equity securities, issued and traded in countries other than Colombia
Securities are valued based on their respective closing prices, and if not available, based on the latest prices reported in the securities exchange where they trade. If there is no price reported for five days preceding each valuation, the securities are valued based on the average reported price of the last 30 days. If there is no price reported for the last 30 days, then securities are valued based on the methodology described in 2.2.b. above for non-listed equity securities.
F-16
GRUPO AVAL ACCIONES Y VALORES S.A. AND ITS SUBSIDIARIES
NOTES TO THE CONSOLIDATED FINANCIAL STATEMENTS
FOR THE YEARS ENDED DECEMBER 31, 2014, 2013 AND 2012
(
Stated in millions of Colombian pesos and U.S. dollars)
The value of such securities is translated to pesos using the market exchange rate of the day they are valued, as published by the Superintendency of Finance of Colombia.
|
2.3.
|
Private Investment Funds
|
Private Investment Funds are valued by multiplying the number of units owned by the value of the unit provided by the administrator of the fund at the date of the closing of its financial statements period.
|
3.
|
Subsequent measurement
|
As described above, security investments are initially recorded for at their acquisition cost. Subsequent measurement and recognition depend upon how they are classified by the investor as follows:
|
3.1
|
Trading securities
|
These investments are recorded on a daily basis at fair value and include investments in debt and equity securities acquired for short-term trading purposes. Unrealized gain or losses resulting from differences in fair values are included in the consolidated statement of income for the year.
As of December 31, 2014, trading investments securities were valued using Infovalmer S.A. price information and as December 31, 2013 the company were valued using Infovalmer price information.
Dividends in kind, including those that stem from the revaluation of equity accounts do not create income and only affect the number of shares owned of the investment. Dividends in cash, when paid, decrease the value of the investment and affect the income statement at the income on investment securities line item.
|
3.2
|
Available-for-sale securities
|
|
3.2.1
|
Debt securities
|
Differences between the present value of the valuation date and the last present value calculated and recorded are registered as increases or decreases in the “investment securities” account in the balance sheet and are also accounted for in the consolidated statements of income. Differences arising between the market value and the present value are reported as “unrealized gains (losses) on investment securities available for sale” in the investors’ shareholders’ equity. This procedure is performed on a daily basis.
|
3.2.2
|
Equity securities
|
Changes in the value of equity securities depend on their liquidity levels, as reported by the Colombian Stock Exchange, as follows:
|
3.2.2.1
|
Securities with low liquidity levels or securities not listed in a stock exchange
|
If the value of the investment, based on the latest audited financial statements available and released by the issuer, exceeds the investment, the difference reduces the devaluation account of the investment. If the increase in value of the investment exceeds the total value of its devaluation account, this difference is accounted for as a reduction of the investment’s valuation surplus.
If the value of the investment, based on the latest audited financial statements available and released by the issuer, reflects a lesser value than the cost of the investment, the difference reduces the valuation surplus account of the investment. If the decrease in the value of the investment exceeds the total value of its valuation surplus, any excess is recorded as an increase of the investment’s devaluation account.
When dividends or earnings are distributed in cash, including those resulting from the capitalization of the equity revaluation account, the amount recorded in valuation surplus is accounted for as income, that valuation surplus is reversed, and the dividend excess amount is recorded as a lesser value of the investment. When dividends or earnings are distributed in kind, the portion that was accounted for as valuation surplus is recorded as income with a charge against the investment, and the valuation surplus is reversed.
F-17
GRUPO AVAL ACCIONES Y VALORES S.A. AND ITS SUBSIDIARIES
NOTES TO THE CONSOLIDATED FINANCIAL STATEMENTS
FOR THE YEARS ENDED DECEMBER 31, 2014, 2013 AND 2012
(
Stated in millions of Colombian pesos and U.S. dollars)
|
3.2.2.2
|
Securities with high or medium liquidity levels
|
Differences between current and previous mark-to-market valuations of these securities are recorded daily as “Unrealized gains or losses on investment securities available for sale”, within the shareholders’ equity accounts, and crediting or debiting the investment securities account.
Dividends received in cash or in kind, including those from capitalizing the equity revaluation account, must be recorded as dividend income up to the amount which corresponds to the investor in the net income or the revaluation of equity account of the investee since the date of the investment with charge to accounts receivable.
|
3.3
|
Investments held to maturity
|
Investments held to maturity are accounted for at acquisition cost plus accrued interest using the effective interest rate method. The effective interest rate is the internal rate of return calculated at the time of the purchase of the investment. Interest accruals are recorded as interest income on investment securities in the consolidated statements of income.
|
3.4
|
Securities denominated in foreign currency or UVR
|
Foreign exchange gains or losses resulting from the conversion of investment securities denominated in foreign currency or UVR are recorded as “Net foreign exchange gains (losses)” in the consolidated statements of income.
|
4.
|
Impairment evaluation of investment securities
|
|
4.1.
|
Securities of issuances or issuers without a credit rating
|
Securities are classified according to a methodology defined by Grupo Aval’s banking subsidiaries and approved by the Superintendency of Finance of Colombia. The securities are categorized as “A” except for when there is a risk associated with them, in which case they are rated from “B” to “E”.
The maximum percentage of net value, as defined by the Superintendency of Finance of Colombia, at which these investments may be recorded, according to their category, as follows:
|
Category
|
Risk Level
|
Investment characteristics
|
Maximum percentage of net value
|
|||
|
A
|
Normal
|
Comply with the agreed terms for the security and have sufficient debt service capacity for both principal and interest
|
100%
|
|||
|
B
|
Acceptable
|
Present factors of uncertainty that could affect the capacity to continue adequately making principal and interest payments. Also, their financial statements and other information available present weaknesses that may affect their financial condition.
|
Net value must not exceed eighty percent (80%) of its acquisition cost.
|
|||
|
C
|
Appreciable
|
Present medium-high probabilities of non-fulfillment of timely payments of principal and interests. Also, their financial statements and other information available evidence deficiencies in the financial condition that compromises the recovery of the underlying investment.
|
Net value must not exceed sixty percent (60%) of its acquisition cost.
|
|||
|
D
|
Significant
|
Present non-fulfillment of agreed terms on the security and material deficiencies in their financial situation; also, their financial statements and other information available evidence marked deficiencies in their financial condition and, as a result, probability of recovery is highly questionable.
|
Net value may not exceed forty percent (40%) of its acquisition cost.
|
|||
|
E
|
Uncollectible
|
Issues that as per their financial statements and other information available deem the investment uncollectible. Also, there are no financial statements as of the closing of June 30 and December 31
of each year.
|
The full value of this item must be entirely reserved.
|
|
4.2.
|
Securities or issuers that have a local credit rating
|
The value of securities that are rated by a local rating agency recognized by the Superintendency of Finance of Colombia cannot be recorded at an amount that exceeds the following percentages of their nominal value, net of amortization as of each valuation date:
GRUPO AVAL ACCIONES Y VALORES S.A. AND ITS SUBSIDIARIES
NOTES TO THE CONSOLIDATED FINANCIAL STATEMENTS
FOR THE YEARS ENDED DECEMBER 31, 2014, 2013 AND 2012
(
Stated in millions of Colombian pesos and U.S. dollars)
|
Long-Term Rating
(local scale)
|
Maximum Amount %
|
Short-Term Rating
(local scale)
|
Maximum Amount %
|
|||
|
BB+, BB, BB-
|
Ninety (90)
|
3
|
Ninety (90)
|
|||
|
B+, B, B-
|
Seventy (70)
|
4
|
Fifty (50)
|
|||
|
CCC
|
Fifty (50)
|
5 and 6
|
Zero (0)
|
|||
|
DD, EE
|
Zero (0)
|
5 and 6
|
Zero (0)
|
|
4.3.
|
Cautionary provisions for equity securities
|
The Superintendency of Finance in Colombia allows financial institutions to recognize, on a case by case basis, cautionary provisions for equity securities on the basis of management expectations of on future decreases in fair value. Information used by Grupo Aval’s management for the assessment consists of possible economic scenarios and expectations. These provisions are based on the prudence criteria established in the Colombian accounting principles.
|
(i)
|
Loans and financial leases
|
Loans and financial leases are recorded at their outstanding principal, net of premiums and discounts on purchased loans. Accrued interest is recorded as other account receivables and unearned interest is recorded as liability. Grupo Aval’s banking subsidiaries grant commercial, consumer, microcredit, mortgage loans and financial leases to customers as follows:
|
|
(1)
|
Commercial loans
|
Loans to legal entities for business activities different from those extended as microcredit transactions, or to individuals (mainly sole ownership enterprises) for business activities different from those extended as consumer loans.
|
|
(2)
|
Consumer loans
|
Loans which, regardless of the amount, are extended to individuals for the purchase of consumer goods or payment of services for non-commercial or entrepreneurial purposes and different from those disbursed as microcredit transactions.
|
|
(3)
|
Microcredit loans
|
Loans defined in accordance with Article 39 of Law 590 of 2000, as well as transactions entered into with micro-businesses, under which the principal repayment source arises from revenues generated by their operations.
The debtor’s outstanding debt may not exceed the equivalent of 120 minimum legal monthly salaries at the moment of approval of the respective credit transaction. Outstanding indebtedness is the total amount of combined indebtedness of the micro-business with the entire financial sector, as determined through consultation of databases and information provided by the company, excluding mortgage loans for the financing of housing units and adding the new obligation.
A micro-business is defined by such law as a legal entity focused on entrepreneurial activities related to agricultural, industrial, commercial or services nature, rural or urban, for which total number of employees is not higher than ten people and whose total assets are less than 500 minimum legal monthly salaries.
|
|
(4)
|
Mortgage loans
|
Loans granted to individuals for the acquisition of new or used residential units. Loans are denominated in UVRs or pesos and are backed by a first-priority mortgage on the asset financed. The tenure for amortization must fall between a minimum of 5 years and a maximum of 30 years. Loans may be fully or partially prepaid at any time without penalty. In the event of partial prepayment, the debtor is entitled to choose whether application is to be made against outstanding capital installments or to a reduction in the tenure of the obligation.
F-19
GRUPO AVAL ACCIONES Y VALORES S.A. AND ITS SUBSIDIARIES
NOTES TO THE CONSOLIDATED FINANCIAL STATEMENTS
FOR THE YEARS ENDED DECEMBER 31, 2014, 2013 AND 2012
(
Stated in millions of Colombian pesos and U.S. dollars)
|
|
(5)
|
Financial Leases
|
Commercial agreements where the lessor (Grupo Aval’s banking subsidiaries with leasing operations) acquires an asset (e.g., equipment, vehicle or software) and rents it to a lessee. The lessee pays monthly installments to the lessor in exchange for the use of the asset. The lessee has the option of acquiring the asset once the term for the lease contract expires at a previously agreed upon price.
Evaluation by credit risk categories
Each of Grupo Aval’s banking subsidiaries analyzes, on an ongoing basis, the credit risks to which their loan portfolio is exposed, considering the terms of the corresponding obligations as well as the level of risk associated with each of the borrowers. This risk evaluation is based on information relating to the historical performance data, the particular characteristics of the borrower, collaterals, debt service with other entities, macroeconomic factors and financial information, in addition to other relevant information. The Superintendency of Finance of Colombia does not require credit risk evaluation on consolidated basis when the parent company prepares its consolidated financial statements.
Grupo Aval’s banking subsidiaries review their outstanding loan portfolio under the above-mentioned criteria and classify individual loans under risk rating categories as follows:
|
Category
|
Approval
|
Commercial loan portfolio
|
Consumer loan portfolio
|
|||
|
“AA”
|
New loans whose risk rating at approval is “AA”.
|
Outstanding loans and financial leases past due payments not exceeding 29 days (i.e. between 0 and 29 days past due). The debtor’s financial statements or its
projected cash flows, as well as all other credit information
available to the financial subsidiaries, reflect excellent paying capacity.
|
Loans whose risk rating is “AA” according to the methodology of the Consumer Reference Model (MRCO) as established by the Superintendency of Finance of Colombia.
|
|||
|
New loans whose risk rating at approval is “A”.
|
Outstanding loans and financial leases with delayed payments in excess of 30 days but not exceeding 59 days (i.e. between 30 and 59 days past due). The debtor’s financial statements or its
projected cash flows, as well as all other credit information
available to the financial subsidiaries, reflect appropriate paying capacity.
|
Loans whose risk rating is “A” according to the methodology of the MRCO as established by the Superintendency of Finance of Colombia.
|
||||
|
“BB”
|
New loans whose risk rating at approval is “BB”.
|
Outstanding loan and financial leases past due more than 60 days but less than 90 days (i.e. between 60 and 89 days past due). Loans in this category are acceptably serviced and collateralized, but there are weaknesses which may potentially affect, on a transitory or permanent basis, the debtor’s ability to pay or its projected cash flows, to the extent that, if not timely corrected, would affect the normal collection of credit or contracts.
|
Loans whose risk rating is “BB” according to the methodology of the MRCO as established by the Superintendency of Finance of Colombia.
|
|||
|
“B”
|
New loans whose risk rating at approval is “B”.
|
Outstanding loans and financial leases past due over 90 days but less than 120 days (i.e. between 90 and 119 days past due). The debtor shows insufficient paying capacity of its obligations.
|
Loans whose risk rating is “B” according to the methodology of the MRCO as established by the Superintendency of Finance.
|
|||
|
“CC”
|
New loans whose risk rating at approval is “CC”.
|
Outstanding loans and financial leases past due more than 120 days but less than 150 days (i.e. between 120 and 149 days past due). Loans in this category represent grave insufficiencies in the debtors’ paying capacity or in the project’s cash flow, which may compromise the normal collection of the obligations.
|
Loans whose risk rating is “CC” according to the methodology of the MRCO as established by the Superintendency of Finance of Colombia.
|
|||
|
“Default”
|
-
|
Outstanding loans and financial leases past due for 150 days or more. This category is deemed uncollectible. These loans are considered in default.
|
Consumer loan portfolio past due over 90 days.
|
The previously described risk categories are reorganized into the standard risk ratings shown in Grupo Aval’s consolidated financial statements using the following chart:
|
Consolidated financial statements risk category
|
Reporting category
|
|||
|
Commercial
|
Consumer
|
|||
|
“A” Normal Risk
|
AA
|
AA
A - between 0 and 30 days past due
|
||
|
“B” Acceptable Risk
|
A
|
A - more than 30 days past due | ||
|
BB
|
BB
|
|||
|
“C” Appreciable Risk
|
B | B | ||
|
CC
C
|
CC
C
|
|||
|
“D” Significant Risk
|
“Default” - all other past due loans not classified in “E”
|
|||
|
“E” Uncollectible
|
“Default” - past due loans with a LGD (explained below) of 100%
|
|||
F-20
GRUPO AVAL ACCIONES Y VALORES S.A. AND ITS SUBSIDIARIES
NOTES TO THE CONSOLIDATED FINANCIAL STATEMENTS
FOR THE YEARS ENDED DECEMBER 31, 2014, 2013 AND 2012
(
Stated in millions of Colombian pesos and U.S. dollars)
Microcredit and mortgage loan portfolios, on the basis of past due loans, are classified as follows:
|
Category
|
Microcredit
|
Mortgage
|
||
|
“A” Normal Risk
|
In compliance or up to 30 days past due
|
In compliance or with up to 60 days past due
|
||
|
“B” Acceptable Risk
|
Past due between 31 and 60 days
|
Past due between 61 and 150 days
|
||
|
“C” Appreciable Risk
|
Past due between 61 and 90 days
|
Past due between 151 and 360 days
|
||
|
“D” Significant Risk
|
Past due between 91 and 120 days
|
Past due between 361 and 540 days
|
||
|
“E” Uncollectible
|
Past due over 120 days
|
Past due over 540 days
|
Allowance for loan and financial lease losses
Commercial and consumer loans
Allowances for loan and financial lease losses are established based on requirements issued by the Superintendency of Finance of Colombia.
Grupo Aval’s banking subsidiaries adopted the Commercial and Consumer Reference Models (MRC and MRCO as their acronyms in Spanish), issued by the Superintendency of Finance of Colombia to calculate their commercial and consumer loans, individual allowance respectively, as explained below.
In order to cover loss-related risks, Grupo Aval’s banking subsidiaries implemented a loan-loss reserve system through which allowances are calculated over the outstanding balance of the obligation, depending on actual past due period and on the risk category for all loans under microcredit and mortgage portfolios, and as a function of anticipated losses as calculated by application of the reference models for commercial and consumer loan portfolios. Such system includes the following:
Specific or individual allowance
These allowances reflect the individual credit rating of each debtor and combine a “pro-cyclical” individual allowance component and “counter-cyclical” individual allowance component. The first component reflects credit risk exposure during regular economic conditions, and the second reflects changes in the credit risk exposure of each debtor as a result of impairment of debt service capacity during future crisis periods. Both the MRC and MRCO Reference Models calculate both components of the allowance.
According to the above-mentioned reference models, the allowance for loan losses is stated through the calculation of the Expected Loss:
Expected Loss = [Probability of default (%)] x [Exposure to default] x [Loss given default (%)]
Probability of Default (PD)
PD corresponds to the probability of the debtors defaulting on their obligations in a period of twelve months. PD is defined as a percentage according to the following matrixes, established by the Superintendency of Finance of Colombia:
GRUPO AVAL ACCIONES Y VALORES S.A. AND ITS SUBSIDIARIES
NOTES TO THE CONSOLIDATED FINANCIAL STATEMENTS
FOR THE YEARS ENDED DECEMBER 31, 2014, 2013 AND 2012
(
Stated in millions of Colombian pesos and U.S. dollars)
Commercial loans
|
Matrix A (*)
|
Matrix B (*)
|
|||||||||||||||
|
Companies
|
Companies
|
|||||||||||||||
|
Classification
|
Large
|
Medium
|
Small
|
Individuals
|
Large
|
Medium
|
Small
|
Individuals
|
||||||||
|
AA
|
1.53%
|
1.51%
|
4.18%
|
5.27%
|
2.19%
|
4.19%
|
7.52%
|
8.22%
|
||||||||
|
A
|
2.24%
|
2.40%
|
5.30%
|
6.39%
|
3.54%
|
6.32%
|
8.64%
|
9.41%
|
||||||||
|
BB
|
9.55%
|
11.65%
|
18.56%
|
18.72%
|
14.13%
|
18.49%
|
20.26%
|
22.36%
|
||||||||
|
B
|
12.24%
|
14.64%
|
22.73%
|
22.00%
|
15.22%
|
21.45%
|
24.15%
|
25.81%
|
||||||||
|
CC
|
19.77%
|
23.09%
|
32.50%
|
32.21%
|
23.35%
|
26.70%
|
33.57%
|
37.01%
|
||||||||
|
Default
|
100.00%
|
100.00%
|
100.00%
|
100.00%
|
100.00%
|
100.00%
|
100.00%
|
100.00%
|
||||||||
(*) As defined by the Superintendency of Finance of Colombia, Matrix A reflects PD in a growing economic scenario while Matrix B reflects PD in a worsening economic scenario. Matrix A is used to calculate the pro-cyclical component of the individual allowance while Matrix B is used to calculate the counter-cyclical component.
Consumer loans
|
Matrix A (1)
|
Matrix B (1)
|
|||||||||||
|
Classification
|
Automobile and vehicle loans
|
General purpose loans
(2)
|
Credit card
|
Automobile and vehicle loans
|
General purpose loans
(2)
|
Credit card
|
||||||
|
AA
|
0.97%
|
2.10%
|
1.58%
|
2.75%
|
3.88%
|
3.36%
|
||||||
|
A
|
3.12%
|
3.88%
|
5.35%
|
4.91%
|
5.67%
|
7.13%
|
||||||
|
BB
|
7.48%
|
12.68%
|
9.53%
|
16.53%
|
21.72%
|
18.57%
|
||||||
|
B
|
15.76%
|
14.16%
|
14.17%
|
24.80%
|
23.20%
|
23.21%
|
||||||
|
CC
|
31.01%
|
22.57%
|
17.06%
|
44.84%
|
36.40%
|
30.89%
|
||||||
|
Default
|
100.00%
|
100.00%
|
100.00%
|
100.00%
|
100.00%
|
100.00%
|
||||||
|
(1)
|
As defined by the Superintendency of Finance of Colombia, Matrix A reflects PD in a growing economic scenario while Matrix B reflects PD in a worsening economic scenario. Matrix A is used to calculate the pro-cyclical component of the individual allowance while Matrix B is used to calculate the counter-cyclical component.
|
|
(2)
|
“General purpose” refers to all consumer loans other than automobile and vehicle loans and credit cards.
|
Exposure to default
With regard to the MRC and MRCO Reference Models, the exposure value of an asset is the current balance of the principal outstanding, accrued and unpaid interest, and other receivables regarding commercial and consumer loan obligations.
Loss Given Default (LGD)
LGD is defined as a percentage to reflect the credit loss incurred if an obligor defaults.
LGD for debtors depends on the type of collateral and would suffer a gradual increase in the percentage of loss according to the amount of days elapsing after being classified in each category. For this purpose, 100% of the collateral value is considered to cover the principal amount.
In 2014 and 2013, Grupo Aval’s banking subsidiaries applied the criteria for LGD defined by Superintendency of Finance of Colombia.
GRUPO AVAL ACCIONES Y VALORES S.A. AND ITS SUBSIDIARIES
NOTES TO THE CONSOLIDATED FINANCIAL STATEMENTS
FOR THE YEARS ENDED DECEMBER 31, 2014, 2013 AND 2012
(
Stated in millions of Colombian pesos and U.S. dollars)
The following tables show the LGD depending on the type of guarantee:
Commercial loan portfolio
| Type of guarantee | Days past due | LGD | Days past due | LGD | Days past due | LGD | ||||||
|
Not admissible guarantee
|
1-269
|
55%
|
270-539
|
70%
|
540 or more
|
100%
|
||||||
|
Subordinated debt
|
1-269
|
75%
|
270-539
|
90%
|
540 or more
|
100%
|
||||||
|
Admissible financial collateral
|
–
|
0 - 12%
|
–
|
–
|
–
|
–
|
||||||
|
Commercial and residential real estate properties
|
1-539
|
40%
|
540-1079
|
70%
|
1080 or more
|
100%
|
||||||
|
Assets under real estate leasing
|
1-539
|
35%
|
540-1079
|
70%
|
1080 or more
|
100%
|
||||||
|
Assets under leasing modalities other than real estate leasing
|
1-359
|
45%
|
360-719
|
80%
|
720 or more
|
100%
|
||||||
|
Other forms of collateral
|
1-359
|
50%
|
360-719
|
80%
|
720 or more
|
100%
|
||||||
|
Collection rights
|
1-359
|
45%
|
360-719
|
80%
|
720 or more
|
100%
|
||||||
|
Unguaranteed
|
1-209
|
55%
|
210-419
|
80%
|
420 or more
|
100%
|
Consumer loan portfolio
|
Type of guarantee
|
Days past du
|
LGD
|
Days past due
|
LGD
|
Days past due
|
LGD
|
||||||
|
Not admissible guarantee
|
1 – 209
|
60%
|
210-419
|
70%
|
420 or more
|
100%
|
||||||
|
Admissible financial collateral
|
–
|
0 – 12%
|
–
|
–
|
–
|
100%
|
||||||
|
Commercial and residential real estate properties
|
1 – 359
|
40%
|
360-719
|
70%
|
720 or more
|
–
|
||||||
|
Assets under real estate leasing
|
1 – 359
|
35%
|
360-719
|
70%
|
720 or more
|
100%
|
||||||
|
Assets under leasing modalities other than real estate leasing
|
1 – 269
|
45%
|
270-539
|
70%
|
540 or more
|
100%
|
||||||
|
Other forms of collateral
|
1 – 269
|
50%
|
270-539
|
70%
|
540 or more
|
100%
|
||||||
|
Collection rights
|
1 – 359
|
45%
|
360-719
|
80%
|
720 or more
|
100%
|
||||||
|
Unguaranteed
(*)
|
1 - 30
|
75%
|
31-90
|
85%
|
91 or more
|
100%
|
|
(*)
|
Before October 31, 2011, Unguaranteed
PDI
were classified as following:
|
|
Type of guarantee
|
Days past due
|
LGD
|
Days past due
|
LGD
|
Days past due
|
LGD
|
||||||
|
Unguaranteed
|
1-179
|
65%
|
180-359
|
85%
|
360 or more
|
100%
|
Microcredit and mortgage loans
Although there are no reference models for microcredit and mortgage loans, the Superintendency of Finance of Colombia establishes the following tables for provisioning for such loans:
|
Microcredit
|
Mortgage Loans
|
|||||
|
Risk Category
|
Provision as % of principal
|
Provision as % of principal covered by guarantee
|
Provision as % of principal not covered by guarantee
|
|||
|
A
|
1.0%
|
1.0%
|
1.0%
|
|||
|
B
|
3.2%
|
3.2%
|
100.0%
|
|||
|
C
|
20.0%
|
10.0%
|
100.0%
|
|||
|
D
|
50.0%
|
20.0%
|
100.0%
|
|||
|
E
|
100.0%
|
30.0% (*)
|
100.0%
|
|||
|
(*)
|
After two years in risk category E, the provision increases to 60.0%, and after a third year in this category, it increases to 100.0%.
|
The collateral for such loans only covers principal amounts outstanding and is impaired when past due time increases as established by the Superintendency of Finance of Colombia. Only 70% of the collateral value is considered to cover the principal amount.
F-23
GRUPO AVAL ACCIONES Y VALORES S.A. AND ITS SUBSIDIARIES
NOTES TO THE CONSOLIDATED FINANCIAL STATEMENTS
FOR THE YEARS ENDED DECEMBER 31, 2014, 2013 AND 2012
(
Stated in millions of Colombian pesos and U.S. dollars)
All of Grupo Aval’s banking subsidiaries adhere to the provision table detailed above, with the exception of Banco de Bogota S.A., which holds a provision of at least 1.0% of the principal amount of microcredit A-rated loans, and 5.0% of the principal amount of microcredit B-rated loans.
Valuation of mortgage collateral for allowance purposes
The value of the collateral posted by each of Grupo Aval’s banking subsidiaries is established based on parameters issued by the Superintendency of Finance of Colombia, as discussed below.
In the case of mortgage collateral consisting of residences, the market value is the initial appraisal value of the collateral adjusted by the corresponding change in the housing price index published by the Colombian National Planning Department. The value is updated at least on a quarterly basis, using the above-mentioned index.
In the case of mortgage collateral consisting of real property, the market value is the appraisal value of the pledged property when the loan was issued or the new appraisal value as subsequently calculated.
General allowance
Grupo Aval’s banking subsidiaries apply a general allowance corresponding to 1% of the total value of microcredit and mortgage loans.
The general allowance, however, may increase if approved by a general shareholders ‘meeting of each of group of Grupo Aval’s banking subsidiaries, and is updated on a monthly basis according to the increases or decreases in the loan portfolio.
Charge-offs
Loans may be subject to charge-offs when all possible collection mechanisms have been exhausted, and when such loans are provisioned for one hundred percent (100%).
Charge-offs however, do not constitute a release of the officers’ responsibility for approval and administration of the incumbent loan, nor do they eliminate their obligation to continue to engage in collection efforts aimed to accomplish recovery. The recovery of charged-off loans is accounted for in the consolidated statements of income.
The Board of Directors of each of Grupo Aval’s banking subsidiaries is the only administrative body with sufficient authority to approve charge-offs of loans deemed uncollectible.
Rules of alignment
Grupo Aval’s banking subsidiaries engage in alignment of loan debtors based on the following criteria:
|
a.
|
Prior to estimation of the allowance for loan-losses and reconciliation of risk ratings, on a monthly basis and for each debtor, each of Grupo Aval’s banking subsidiaries engages in an internal alignment process in which all loans outstanding for one debtor are brought up to the highest risk category assigned to any of them. An exception is made upon demonstration before the Superintendency of Finance of Colombia of sufficient reasons for classification in a lower risk category.
|
|
b.
|
As per standing legal provisions, all subsidiaries of each banking entity have to assign the same classification to all similar loans extended to one debtor unless it is demonstrated before the Superintendency of Finance of Colombia that there are sufficient reasons for classification in a lower risk category.
|
GRUPO AVAL ACCIONES Y VALORES S.A. AND ITS SUBSIDIARIES
NOTES TO THE CONSOLIDATED FINANCIAL STATEMENTS
FOR THE YEARS ENDED DECEMBER 31, 2014, 2013 AND 2012
(
Stated in millions of Colombian pesos and U.S. dollars)
Troubled loan restructurings
Loans are restructured when Grupo Aval’s banking subsidiaries grant a concession to a debtor, as a result of economic or legal matters adversely impacting the debtor’s financial situation, which it would not otherwise consider.
Loans can be restructured either through the capitalization of interest recorded in memorandum accounts or by writing-off balances (which may include capital, interest, and other items). The amounts capitalized are recorded as “deferred income” under the “other liabilities” line item, and are amortized in proportion to the amounts actually collected and the income that is recorded on a cash basis.
Extraordinary restructurings are those based on External Memorandum 039 of 1999 issued by the Superintendency of Finance of Colombia. According to the External Memorandum, reversals of loan loss allowances or improvements of credit risk categories are only acceptable when all the terms of the restructured loan are sufficiently demonstrated. In the event that a debtor with a restructured loan does not comply with each of the agreed terms, its loans are downgraded to the credit risk category that the debtor had prior to the restructuring or to an even higher risk category.
According to Law 550 of 1999, which stipulated restructuring regulations, Grupo Aval’s banking subsidiaries that had restructured loans, adhered to such Law, outstanding as of December 2010, are expected to stop accruing interest on the outstanding loans once the restructuring conditions are agreed upon. Grupo Aval’s banking subsidiaries are required to maintain the same credit risk category on loans pre- and post-restructuring. The only exception is the case in which prior to the restructuring, the loan was classified as A. In this situation, the financial subsidiaries must downgrade it at least to B and create an allowance of 100.0% of the debt outstanding. Law 1116 of 2006 (“The Bankruptcy Law”) repealed Law 550 of 1999 and stipulated that any debtor that enters into a restructuring agreement is considered as in “default”.
Pursuant to loan restructurings which adhered to the terms established in the Fiscal and Financial Reform Programs stipulated by Law 617 of 2000 and that are still outstanding as of December 2010, Grupo Aval’s banking subsidiaries engage in the application of the following policies:
The Colombian Government guarantees the financial obligations that governmental entities have with financial institutions supervised by the Superintendency of Finance of Colombia (i.e., all of Grupo Aval’s banking subsidiaries) upon fulfillment of all requirements established under Law 617 of 2000, including, among others, that fiscal adjustment agreements were signed with the Government before June 30, 2001. For loans outstanding as of December 31, 1999, the Government guarantees up to 40.0%, and for all new loans intended to fulfill the signed fiscal adjustment agreement, the Government guarantees up to 100.0%.
Previously established allowances for restructured loans under Law 617 of 2000 were reversed for the portion guaranteed by the Government. The portion of the loan not guaranteed by the Government maintained the credit risk category that it had as of June 30, 2001.
Suspension of accruals
The Superintendency of Finance of Colombia established that interest, income for UVR, lease payments and other items of income cease to be accrued in the consolidated statements of income and begin to be recorded in Memorandum Accounts until effective payment is collected after a loan is in arrears for more than sixty (60) days for mortgage and consumer loans, ninety (90) days for commercial loans, and thirty (30) days for microcredit loans. After the suspension of accruals, interests collected are recorded in the consolidated statements of income on a cash basis.
|
(j)
|
Loan fees
|
Loan origination and commitment fees, as well as direct loan origination and commitment costs, are recorded in the consolidated statements of income as incurred.
GRUPO AVAL ACCIONES Y VALORES S.A. AND ITS SUBSIDIARIES
NOTES TO THE CONSOLIDATED FINANCIAL STATEMENTS
FOR THE YEARS ENDED DECEMBER 31, 2014, 2013 AND 2012
(
Stated in millions of Colombian pesos and U.S. dollars)
|
(k)
|
Bankers’ acceptances, spot transactions and derivative financial instruments
|
Bankers’ acceptances
Bankers’ acceptances have a maximum maturity up to one year and may only be originated from import and export (i.e., trade- related) transactions or under purchases and sales of domestic movable assets (personal property).
After maturity, bankers’ acceptances are subject to reserve requirements prescribed by the Colombian Central Bank. These reserve requirements are based on a percentage of short-term deposits maintained at Grupo Aval’s banking subsidiaries.
Spot transactions
Spot transactions are transactions whose liquidation and settlements takes place within the next three business days after their agreement.
Derivative financial instruments
Derivative are held on behalf of customers, for trading, as economic hedges, or as qualifying accounting hedges, with the determination made when Grupo Aval enters into the derivative contract. The designation may change based upon management’s reassessment or changing circumstances. Derivatives utilized by Grupo Aval’s banking subsidiaries, include swaps, future and forward contracts and options.
Grupo Aval’s banking subsidiaries recognize derivative financial instruments as either assets or liabilities in the consolidated balance sheet at its related fair values. Changes in the fair value of a derivative are recorded depending on the intended use of the derivative and the resulting designation. Fair value measurements do not include the Grupo Aval’s own credit standing nor counterparty credit risk.
Since January 1, 2010, the Superintendency of Finance of Colombia allows the application of hedge accounting as either fair value hedges, cash flow hedges or hedges on foreign assets and liabilities financial instruments. Before 2010, hedge accounting was not permitted. For derivative instruments that are not designated as accounting hedges, changes in fair value are recognized in income in the period of change. Grupo Aval’s banking subsidiaries manage foreign currency exchange rate sensitivity predominantly through the use of derivatives. Before that date, hedge accounting was not allowed.
During the year ended December 31, 2014 and 2013, Banco de Bogota S.A. applied hedge accounting over its net investment in Leasing Bogota Panama S.A. For accounting hedges, Banco de Bogota formally documents at inception all relationships between hedging instruments and hedged items, as well as the risk management objectives and strategies for undertaking various accounting hedges. Additionally, it applies on a monthly basis and for each reporting period retrospective and prospective, effectiveness test to assess whether the derivative used in its hedging transaction is expected to be and has been highly effective, in a range between 80% and 100%, in offsetting changes in the fair value of the hedged item.
Financial Derivatives for Hedging
These operations are intended to protect the Bank`s assets and liabilities in foreign currency from exchange risk generated by the structural positions of its affiliates and agencies abroad.
The primary position, subject to hedging, is part of the investment.
The way financial derivatives for hedging are entered on the books depends on the type of hedging involved. In accordance with the amendments introduced by the External Circular No 049 of November 2012 by the Financial Superintendency of finance of Colombia, for the case of hedges of assets and liabilities in foreign currency:
|
|
·
|
The daily accrued amount resulting from the implicit devaluation or revaluation agreed upon in the initial contract is recognized in the consolidated statement of income.
|
F-26
GRUPO AVAL ACCIONES Y VALORES S.A. AND ITS SUBSIDIARIES
NOTES TO THE CONSOLIDATED FINANCIAL STATEMENTS
FOR THE YEARS ENDED DECEMBER 31, 2014, 2013 AND 2012
(
Stated in millions of Colombian pesos and U.S. dollars)
|
|
·
|
Accumulated profit or loss on a financial derivative is recorded in gains (losses) on derivative operations, net in accordance with the previous paragraph and the difference is entered in the equity account “unrealized accumulated gain or loss on financial derivatives hedging assets or liabilities in the foreign currency”, with the respective sign.
|
|
|
·
|
On the date hedging ends, the accumulated result of the derivate used for this type of coverage, which appears in the equity sub-account entitled “unrealized accumulated gain or loss on financial derivatives for hedging assets or liabilities in foreign currency” is transferred to the consolidated statement of income, specifically to the respective sub-account for derivatives.
|
The primary positions hedged are registered as follows:
|
|
·
|
The primary position continues to be registered at its respective nominal value on each date, in the same balance sheet and within gains (losses) on derivative operations, net in, using the same method and procedure as would be the case if were not hedged.
|
|
|
·
|
At the start of hedging with financial derivatives, the present value of the primary position is registered in memorandum accounts.
|
Peso/US dollar forward operations with different maturity profiles are the financial derivatives used for hedging. Although these derivatives hedge against exchange risk, they generate volatility in the statement of income, given the variation in the other associated risk factors, such as dollar/peso devaluation (interest rates differential). The objective in the way hedging is treated from an accounting standpoint is to isolate the effect on the volatility on the statement of income produced by variations in risk factors other than the exchange risk. This is done by recording only income/losses from exchange re-expression in the statement of income, while the portion of the variation in fair value attributed to other factors (the passage of time, etc.) is entered in the equity accounts.
Thereby, from November 28, 2012, the daily accrued amount resulting from the implicit devaluation or revaluation agreed upon in the initial contract is recognized in the consolidated statement of income.
Grupo Aval’s banking subsidiaries discontinue hedge accounting when it is determined that a derivative is not expected to be or has ceased to be highly effective as a hedge, and then reflects changes in fair value of the derivative in earnings after termination of the hedge relationship.
For hedging instruments under Colombian Banking GAAP purposes, Grupo Aval follows the forward-rate method for the U.S. dollar forwards in order to test effectiveness. The test is done every month.
Management’s intention is to renew forward contracts for hedging purposes as those mature.
For the U.S. dollar forwards designated as hedging instruments, ineffectiveness could be generated between the hedging instrument and the hedged item if both have different notional amounts or different currencies. Grupo Aval will measure hedge ineffectiveness by comparing the change in the value of the actual derivative with the change in value of a hypothetical derivative with the same maturity.
In addition and also effective on January 1, 2010, any day one gain or losses derived from valuations performed, on Swaps are required to be deferred and amortized on a straight-line basis during the life of the associated derivative instrument.
Fair value measurements
The fair value of derivative financial instruments is measured as follows:
Forward contracts
Since January 2009, forwards are measured using the standardized methodology issued by the Superintendency of Finance of Colombia, which uses quoted forward price points published by authorized providers and/or brokerage firms that encompass a major portion of the market’s liquidity. Regulations established by the Superintendency of Finance of Colombia suggest the following:
F-27
GRUPO AVAL ACCIONES Y VALORES S.A. AND ITS SUBSIDIARIES
NOTES TO THE CONSOLIDATED FINANCIAL STATEMENTS
FOR THE YEARS ENDED DECEMBER 31, 2014, 2013 AND 2012
(
Stated in millions of Colombian pesos and U.S. dollars)
The value of the obligation that a forward contract seller (right for its buyer) has to register in its balance sheet is calculated as the product of the amount of foreign currency being negotiated, times the exchange rate of the day of the valuation plus the appropriate quoted forward price points of the transaction, all divided by 1 plus the zero coupon rate as of the maturity of the forward times the result of dividing the maturity of the forward (in days) by 360. The value of the right that the forward contract seller (obligation for its buyer) has to register in its balance sheet is calculated as the product of the amount of foreign currency being negotiated times the expected exchange rate of the day of the maturity, all divided by 1 plus the zero coupon rate as of the maturity of the forward times the result of dividing the maturity of the forward (in days) by 360. To calculate income or expense associated to the transaction, the investor has to consider the difference between the agreed forward exchange rate and the actual forward exchange rate of the day of the valuation. The present value of this difference is calculated using a zero coupon rate. If the resulting value is positive, then the seller of the forward has to recognize it as income in its consolidated statement of operations and the buyer has to recognize a loss for the same value. If the resulting value is negative, then the buyer of the forward has to recognize it as income in its consolidated statement of operations and the seller has to recognize a loss for the same value.
Swap contracts
The fair value of swap contracts is determined using the discounted cash flow method at the interest rates applicable for each cash flow. Interest rate curves are drawn up for each operation based on information sourced from Infovalmer.
Option contracts
Options are appraised as stipulated by the Superintendency of Finance of Colombia using the Black-Scholes/Merton method, which is the model commonly used on an international basis.
The information to be used in the model for the valuation of options is obtained from financial information systems which provide data for the variables involved (volatilities, risk-free rates and exchange rates).
When a financial entity purchases an option, either “call” or “put” the premiums paid and the daily variations on their fair value are recorded under assets in the option’s account. Meanwhile, when a financial entity sells an option, either “call” or “put” the premiums received and the daily variation on their fair value are recorded under liabilities.
On the contract settlement date, balances corresponding to the right and the obligation are cancelled out, and any difference with the proceeds is recorded as a profit or loss on valuation of derivatives.
|
(l)
|
Foreclosed assets
|
Grupo Aval’s banking subsidiaries record the value of assets received as collateral using the following criteria:
|
·
|
Foreclosed assets represented by real estate properties are recognized based on commercial appraisals technically determined and personal properties, stocks and equity interests are received based on market values.
|
|
·
|
When foreclosed assets are not in a condition to be immediately liquidated, their cost increases with all those expenses required in order to prepare such assets ready for sale.
|
|
·
|
If the proceeds of the sale are more than the settlement value agreed upon with the debtor, that difference is recorded as accounts payable to the debtor. If the proceeds of the sale are expected to be insufficient to cover the outstanding debt, the difference must be immediately recorded charged as a non-operating expense.
|
|
·
|
Personal property received in payment corresponding to investment securities is valued by applying the criteria indicated in this note under
“2(h) Investment securities”,
but taking into account provision requirements for the periods referred to below.
|
|
·
|
The profits obtained from a credit sale are deferred over the life of the credit, and are realized as the obligation is paid off.
|
F-28
GRUPO AVAL ACCIONES Y VALORES S.A. AND ITS SUBSIDIARIES
NOTES TO THE CONSOLIDATED FINANCIAL STATEMENTS
FOR THE YEARS ENDED DECEMBER 31, 2014, 2013 AND 2012
(
Stated in millions of Colombian pesos and U.S. dollars)
|
·
|
When the commercial value of the property is lower than its book value, a provision is recorded for the difference.
|
|
·
|
Reappraisals of foreclosed assets are recorded as memorandum accounts.
|
Legal term for sale of foreclosed assets
Banking subsidiaries must sell the foreclosed assets, in a period no later than two years after the foreclosure date, except when, upon the request of each of Grupo Aval’s banking subsidiaries, the Superintendency of Finance of Colombia extends the term. However, in any event the extension may not exceed an additional period of two years.
Provisions for foreclosed assets
All of Grupo Aval’s banking subsidiaries register their provisions for foreclosed assets according to External Circular 034 of 2003 issued by the Superintendency of Finance of Colombia, both for real estate assets and for movable assets (personal property).
According to the External Circular mentioned above, during the first year following the receipt of the real estate asset, a provision of 30% of the carrying value of the asset at the time of receipt is recognized in the consolidated income statement in proportional monthly installments. This provision increases by an additional 30% in proportional monthly installments within the second year following date of foreclosure of the asset up to 60% of the cost of the asset. Once the legal term for sale has expired an authorization for extension is required by the Superintendency of Finance of Colombia. If the authorization is not granted, a provision equal to 80% of the carrying value of the asset should be recognized. If extension is granted, the remaining 20% of the provision should be recognized.
For foreclosed assets different from real estate, the provision is equal to 35% of the carrying value of the asset at the time of foreclosure and should be constituted in proportional monthly installments within the first year following the receipt. This provision should be increased by an additional 35% within the second year up to 70% of the cost of the assets. Once the legal term for sale has expired without authorization for extension, the provision should be increased up to 100%. If extension is granted, the remaining 30% of the provision should be recognized by the end of the extension period.
Banco de Bogota S.A. has established its own model of reference to determine the allowance for foreclosed assets, which was approved by the Superintendency of Finance of Colombia.
|
(m)
|
Property, plant and equipment
|
This account includes tangible assets acquired or leased, constructed or in the process of importation or construction and permanently used in the course of business which have a useful life exceeding one year. Property, plant and equipment is recorded at the cost of acquisition, including direct and indirect costs and expenses incurred up to the time that the asset is in a usable condition (adjusted for inflation up to 2000).
Additions, improvements and extraordinary repairs that have a significant increase in the useful life of these assets are capitalized, while maintenance and repairs are expensed as incurred.
Depreciation is calculated on a straight-line basis over the estimated useful life of the asset. The annual depreciation rates for each asset item are:
|
Buildings
|
5.0 %
|
|
|
Equipment, furniture and fixtures
|
10.0 %
|
|
|
Machinery and equipment
|
10.0 %
|
|
|
Computer equipment
|
20.0 %
|
|
|
Vehicles
|
20.0 %
|
The individual net book value of buildings (cost less accumulated depreciation) is compared against fair values taken from independent professional appraisals. If the fair value is higher, the difference is recorded as a “Reappraisal of assets” with credit on the “Reappraisal of assets” in shareholders’ equity; if the fair value is lower, the difference first affects the revaluation account and if the value of such an account is not sufficient to absorb such a difference, then the amount that was not recorded as a lesser value of the revaluation is charged to expenses as a provision for other assets of the period. Appraisals must be made at least every three years.
F-29
GRUPO AVAL ACCIONES Y VALORES S.A. AND ITS SUBSIDIARIES
NOTES TO THE CONSOLIDATED FINANCIAL STATEMENTS
FOR THE YEARS ENDED DECEMBER 31, 2014, 2013 AND 2012
(
Stated in millions of Colombian pesos and U.S. dollars)
|
(n)
|
Operating leases
|
In the normal course of business, Banco de Bogota, Banco de Occidente and Banco Popular lease different assets under operating leasing arrangements through their leasing subsidiaries. These assets are recorded at cost.
Depreciation for these assets is applied over either the asset’s useful life or the term of the leasing agreement, whichever period is the shorter.
General provision of 1% of the book value of these assets is recorded.
|
(o)
|
Prepaid expenses and deferred charges
|
Amortization of prepaid expenses and deferred charges is calculated from the date on which they start contributing to the generation of income, based on the following factors:
Prepaid expenses
Prepaid expenses mainly include the following monetary items: interest amortized over the life of the loan, commissions amortized over the period prepaid, leases, amortized over the period prepaid; insurance premiums, amortized over the life of the policy; equipment maintenance, amortized over the life of the contract; and other prepaid expenses amortized over the period in which services are received or costs and expenses are incurred.
Deferred Charges
|
a.
|
Expenses incurred in the reorganization and pre-operational expenses which are amortized over a period not longer than five years.
|
|
b.
|
Remodeling, research and development of studies are amortized over a period not longer than two years.
|
|
c.
|
Computer programs are amortized over periods not longer than three years.
|
|
d.
|
Leasehold improvements are amortized during the lesser of the initial duration of the underlying contract and its probable useful life.
|
|
e.
|
Commissions paid for the issuance of debt are amortized over a period of five years which corresponds to the life of the related debt by which the costs were incurred.
|
|
f.
|
Deferred income tax assets resulting from temporary differences are amortized upon compliance with legal and regulatory fiscal requirements.
|
|
g.
|
Improvements on road constructions and inflation adjustments are amortized over each joint venture project.
|
|
h.
|
Equity tax is amortized in 48 monthly quotas between years 2011 to 2014.
|
|
i.
|
Losses for valuation of securities are amortized up to its maturity
|
|
j.
|
Other concepts are amortized over the period for recovery of the cash outlay or during the period in which benefits are received.
|
|
k.
|
Commissions paid for derivatives are amortized during the time of the redemption of the titles.
|
GRUPO AVAL ACCIONES Y VALORES S.A. AND ITS SUBSIDIARIES
NOTES TO THE CONSOLIDATED FINANCIAL STATEMENTS
FOR THE YEARS ENDED DECEMBER 31, 2014, 2013 AND 2012
(
Stated in millions of Colombian pesos and U.S. dollars)
|
(p)
|
Intangible assets
|
Goodwill
The Superintendency of Finance of Colombia stipulates how to value, where to register and how to amortize goodwill. According to the Superintendency of Finance of Colombia rules, goodwill is defined as the difference between the amount of capital paid in an acquisition of a business and the book value of equity of the acquired entity. Goodwill is created only after the acquiring company achieves control of the acquired entity.
Allocation of goodwill in business lines is allowed according the rules of the Superintendency of Finance of Colombia and amortization is to be done in a monthly basis over a period of 20 years, unless a financial entity decides to amortize it in a shorter period of time. The methodology proposed by the Superintendency of Finance of Colombia to amortize goodwill uses an exponential method based on the following formula:
y = e
x/15
The following chart shows the results of the application of such formula where
x
equals each year of goodwill amortization (20 years in this chart);
e
equals 2.71828; and
Y%
= [y
x /
å
y
(1-20)
] and shows the percentage of the goodwill to be amortized per year.
|
x
|
Y
|
Y%
|
x
|
y
|
Y%
|
|||||
|
1
|
1.07
|
2.47%
|
11
|
2.08
|
4.81%
|
|||||
|
2
|
1.14
|
2.64%
|
12
|
2.23
|
5.14%
|
|||||
|
3
|
1.22
|
2.82%
|
13
|
2.38
|
5.49%
|
|||||
|
4
|
1.31
|
3.01%
|
14
|
2.54
|
5.87%
|
|||||
|
5
|
1.40
|
3.22%
|
15
|
2.72
|
6.28%
|
|||||
|
6
|
1.49
|
3.44%
|
16
|
2.91
|
6.71%
|
|||||
|
7
|
1.59
|
3.68%
|
17
|
3.11
|
7.17%
|
|||||
|
8
|
1.70
|
3.94%
|
18
|
3.32
|
7.66%
|
|||||
|
9
|
1.82
|
4.21%
|
19
|
3.55
|
8.19%
|
|||||
|
10
|
1.95
|
4.50%
|
20
|
3.79
|
8.76%
|
|
(q)
|
Other assets
|
Other assets primarily include assets held for sale, investments in trusts, assets available for lease contracts, and prepaid taxes.
Assets held for sale correspond to assets which are no longer used in the core business of Grupo Aval’s banking subsidiaries and which are depreciated until their realization. Moreover, those assets are tested for impairment and any deterioration is charged to the consolidated statement of income. Investments in trusts include rights acquired in trust operations. The assets held under trust agreements are accounted for based on their adjusted costs and neither income nor expense is generated by such transaction. Impact of the consolidated statements of income is registered when the assets are actually sold or transferred to a third party. Assets available for lease contracts correspond to the inventory of assets which are expected to be placed under lease contracts in short term.
|
(r)
|
Rights under trust agreements
|
This account records the rights generated through the execution of all mercantile fiduciary agreements which give either the trustee or the beneficiary the right to exert in accordance with either the contract or legal dispositions.
|
(s)
|
Reappraisals
|
This account includes reappraisal of investments available for sale with low liquidity levels and properties and equipment - specifically, real estate and works of art.
F-31
GRUPO AVAL ACCIONES Y VALORES S.A. AND ITS SUBSIDIARIES
NOTES TO THE CONSOLIDATED FINANCIAL STATEMENTS
FOR THE YEARS ENDED DECEMBER 31, 2014, 2013 AND 2012
(
Stated in millions of Colombian pesos and U.S. dollars)
Reappraisal of available for sale equity securities is recorded based on the shareholder’s stake in the issuers’ equity.
Reappraisal of real estate properties is measured as the difference between the net cost of the assets and the value of their commercial appraisal conducted by firms with recognized experience and reputation in these matters. In the event of devaluation in the value of the property, under a rule of prudence, an allowance is recorded. According to Decree 2649 of 1993, reappraisals of assets should be done at least once every three years.
Reappraisal of works of art is recorded taking into account the condition of preservation of the works, their authenticity, size, technique and the price of similar works.
In the consolidation process, the portion of equity surplus from reappraisal of assets acquired in business combinations is eliminated while the portion related to the assets, remains in the balance sheet until the asset is sold. Another portion of the reappraisal of assets from subsidiaries not wholly owned for Colombian Banking GAAP related with non-controlling interest is reclassified as part of the liability.
|
(t)
|
Deferred income
|
This account records deferred income and income received in advance in the regular course of business. Amounts recorded in this account are amortized over the period to which they relate, or in which the services are rendered or the money is collected in the case of profits obtained from the sale of goods sold on credit.
The capitalization of yields on restructured loans that have been recorded in memorandum accounts or as charge-off loan balances are included in this category as indicated in note 2 (i) above.
|
(u)
|
Deferred tax
|
In Colombia, the inclusion of timing differences related to the amortization of carry over losses and the excess of presumed income over ordinary income as a deferred tax asset is restricted.
|
(v)
|
Income tax, CREE and CREE surtax
|
Law 1607 of 2012, decreased income taxes from 33% to 25% and created a CREE tax of 9% for the years 2013, 2014 and 2015 going down to 8% in 2016.
Law 1739 of 2014 imposed a CREE surtax of 5% in 2015 taking it to 14%; 6% in 2016 taking it to 15%; 8% in 2017 taking it to 17% and 9% in 2018 taking it to 18%.
According to the laws described above, total rates of income tax plus CREE will be 34% in 2014, 39% in 2015, 40% in 2016, 42% in 2017 and 43% in 2018.
|
(w)
|
Equity tax
|
In December 30, 2009, the Congress of Colombia enacted Law No. 1370, which added a net worth tax on the wealth of corporate entities (hereinafter referred to as the “Equity Tax”). The Equity Tax accrued on January 1, 2011 amounted to Ps. 783,354 payable in eight equal installments through 2014. The tax rate to be paid by Grupo Aval and its subsidiaries is 6.0% of their net fiscal worth calculated on January 1, 2011. In accordance with Colombian Banking GAAP this liability was recorded against deferred charges and can be amortized on a straight line monthly basis between January 2011 and December 2014 with a charge to the statement of income. Entities with a positive balance in the “Equity inflation adjustment” line in their shareholders’ equity can also use it against the Equity Tax Liability, according to Decree 514 of 2010. As of December 31, 2013, Grupo Aval’s remaining consolidated liability associated with the Equity Tax was Ps. 195,839. During 2014 the balance of this tax was paid in full.
|
(x)
|
Wealth tax:
|
Law 1739 of 2014 created the “Wealth tax”.
F-32
GRUPO AVAL ACCIONES Y VALORES S.A. AND ITS SUBSIDIARIES
NOTES TO THE CONSOLIDATED FINANCIAL STATEMENTS
FOR THE YEARS ENDED DECEMBER 31, 2014, 2013 AND 2012
(
Stated in millions of Colombian pesos and U.S. dollars)
The wealth tax to be paid by Grupo Aval and its subsidiaries will be 1.15% in 2015 of the liquid equity, as per defined in the law, 1.00% in 2016 and 0.40% in 2017.
The law allowed companies to charge this tax against their retained earnings reserves in their equity.
|
(y)
|
Pension plan and benefits to employees
|
By means of Resolution 1555 of July 30, 2010, the Superintendency of Finance of Colombia replaced the mortality charts used to prepare the actuarial computation and determined that the change effect may be recognized gradually.
Considering the above, Grupo Aval and its local subsidiaries have modified its accounting policy on actuarial computation amortization regarding pension payments, quotas, parts and pension and health bonuses (commuted liabilities), and, as from 2010, it adopted a 19-year term to amortize the 2010 actuarial computation increase.
Payments of retirement pensions are made against the pertinent reserve.
Grupo Aval’s banking subsidiaries recorded other benefits to employees based on labor agreements with its employees which cover, health, education and seniority bonus.
|
(z)
|
Accrued expenses and other liabilities
|
Grupo Aval registers provisions to cover estimated liabilities, considering:
|
|
·
|
A right has been acquired and, consequently, an obligation;
|
|
|
·
|
Payment may be demanded or probable;
|
|
|
·
|
The provision is justifiable, quantifiable and verifiable;
|
Estimates for taxes, contributions and membership also are registered in this account. Estimated labor liabilities are recorded based on applicable legislation and current labor agreements.
|
(y)
|
Equity inflation adjustments
|
Since January 1992 until December 2000, Grupo Aval and its consolidated banking subsidiaries’ financial statements were subject to inflation adjustments. The cumulative effect of such adjustments in non-monetary assets and liabilities is included in each of the adjusted accounts, and the adjustments to the equity accounts are included in the “equity inflation adjustments” line item.
During 2013, 2012 and 2011, the amount of such account decreased due to a payment of the “equity tax” mandated by law. According to Law 1111 of 2006, all entities subject to payment of the “equity tax” are allowed to charge those taxes against the “equity inflation adjustments” and not charge them in the consolidated statements of income.
|
(z)
|
Recognition of financial income, costs and expenses
|
Financial income and expenses are recognized on an accrual basis.
Loan origination costs are recorded in the consolidated statements of income when incurred and the corresponding revenues are collected. Grupo Aval’s banking subsidiaries do not implement a policy of collecting commissions on the origination of the loans. Commissions that they collect from credit cards are recorded in the consolidated statements of income using the accrual method. All profits obtained from credit sales of foreclosed assets are recorded as revenues when the value of the credit is collected.
Suspension of accruals of interest is detailed in note 2 (
i
)- “
Loans and Financial Leases”.
GRUPO AVAL ACCIONES Y VALORES S.A. AND ITS SUBSIDIARIES
NOTES TO THE CONSOLIDATED FINANCIAL STATEMENTS
FOR THE YEARS ENDED DECEMBER 31, 2014, 2013 AND 2012
(
Stated in millions of Colombian pesos and U.S. dollars)
|
(aa)
|
Memorandum accounts
|
Memorandum accounts record transactions in which Grupo Aval’s banking subsidiaries acquire contingent rights or assume contingent obligations, which are in each case conditioned by possible or remote future events. These accounts also include financial income accrued since the time at which the balance sheet ceases to accrue on the income accounts with regard to the loan portfolio and financial leasing operations.
Contingencies including fines, sanctions, litigation and lawsuits are evaluated by each of the banking subsidiaries’ legal departments. Estimating loss contingencies necessarily implies exercising judgment and is, therefore, subject to opinion. In estimating loss contingencies regarding pending legal proceedings against each banking subsidiary, each legal department evaluates, among other aspects, the merits of each case, the case law of the courts in question and the current status of the individual proceedings.
If this evaluation reveals the probability that a material loss has occurred and the amount of the liability can be estimated, then this is recorded in the consolidated financial statements. If the evaluation reveals that a potential loss is not probable or the outcome either is uncertain or probable but the amount of the loss cannot be estimated, then the nature of the corresponding contingency is disclosed in a note to the consolidated financial statements along with the probable estimated range of the loss. Loss contingencies that are estimated as being remote are not disclosed.
Memorandum accounts record third-party operations whose nature does not affect the financial situation of Grupo Aval’s banking subsidiaries. This also includes tax memorandum accounts that record figures for drawing up tax returns and internal control or management information accounts.
|
(ab)
|
Earnings per share
|
Earnings per share as of December 2014, 2013 and 2012 are calculated based on the weighted average number of shares outstanding, including common and preferred shares issued, which for the year ended December 2014, 2013 and 2012 was 20,897,356,358, 18,607,487,293 and 18,551,656,161, respectively, with a nominal price of Ps. 1.00 each. As of December 2014, 2013 and 2012, the number of shares issued was 22,281,017,159, 20,178,287,315 and 18,551,766,453, respectively. In the consolidated financial statements earnings per share are shown as “Earnings per share”.
|
(ac)
|
Business combinations
|
Upon a business combination, the purchase method of accounting requires that (i) the purchase price be allocated to the acquired assets and liabilities on the basis of their book value under Colombian Banking GAAP, (ii) the statement of income of the acquiring company for the period in which a business combination occurs includes the income of the acquired company as if the acquisition had occurred on the first day of the reporting period, except for the acquisition of BAC Credomatic where Grupo Aval obtained a waiver from the Superintendency of Finance of Colombia to consolidate only the results generated after the acquisition date and (iii) the costs directly related to the purchase business combination are expensed as incurred.
|
(3)
|
CASH AND CASH EQUIVALENTS
|
The balances of cash and cash equivalents due from banks consisted of the following:
|
December 31,
|
December 31,
|
|||||||
|
2014
|
2013
|
|||||||
|
Colombian peso-denominated
:
|
||||||||
|
Cash
|
Ps. | 2,885,748 | Ps. | 2,225,340 | ||||
|
Due from the Colombian Central Bank
|
4,079,220 | 4,705,047 | ||||||
|
Due from domestic banks
|
210,032 | 162,401 | ||||||
|
Remittances of domestic negotiated checks in transit
|
3,454 | 2,726 | ||||||
|
Allowance for cash and cash equivalents
|
(6,090 | ) | (3,670 | ) | ||||
|
Total Colombian peso-denominated
|
7,172,364 | 7,091,844 | ||||||
GRUPO AVAL ACCIONES Y VALORES S.A. AND ITS SUBSIDIARIES
NOTES TO THE CONSOLIDATED FINANCIAL STATEMENTS
FOR THE YEARS ENDED DECEMBER 31, 2014, 2013 AND 2012
(
Stated in millions of Colombian pesos and U.S. dollars)
|
December 31,
|
December 31,
|
|||||||
|
2014
|
2013
|
|||||||
|
Foreign currency-denominated:
|
||||||||
|
Cash
|
1,121,992 | 791,336 | ||||||
|
Due from the Colombian Central Bank
|
680 | 661 | ||||||
|
Due from foreign banks
|
8,224,782 | 5,168,856 | ||||||
|
Remittances of foreign negotiated checks in transit
|
315,695 | 254,473 | ||||||
|
Foreign correspondents
|
7,767 | 2,510 | ||||||
|
Allowance for cash and cash equivalents
|
(133 | ) | (59 | ) | ||||
|
Total foreign currency-denominated
|
9,670,783 | 6,217,777 | ||||||
|
Interbank and overnight funds
|
1,850,335 | 2,786,991 | ||||||
|
Total cash and cash equivalents
|
Ps. | 18,693,482 | Ps. | 16,096,612 | ||||
The central banks in Colombia and other countries where subsidiaries of Grupo Aval operate, require financial institutions to set aside specific amounts of cash as reserves against deposits. These reserves may be held as vault cash in a noninterest-bearing account with the central banks. Through one objective of reserve requirements is to safeguard liquidity in the banking system, institutions do not look to their reserves as a primary source of liquidity.
Grupo Aval’s banking subsidiaries had reserves in cash and deposits with the central banks amounting Ps. 8,087,641 and Ps. 7,722,384 at December 31, 2014 and 2013, respectively.
In Colombia, according to Resolution 11 of 2008, reserve requirements are measured bi-weekly and reserve amounts depend on the type of deposits held in the Balance Sheet (11.0% for checking and saving accounts and 4.5% for time deposits with a maturity of less than 540 days).
There are no other restrictions over cash and cash equivalents.
Our financial institutions operating in Central America were required to maintain the following reserve for the years ended December 31, 2014 and 2013:
|
|
Costa Rica |
Panama
|
Nicaragua
|
El Salvador
|
Honduras
|
Guatemala
|
|||||
|
Checking accounts
|
15%
|
30%
(*)
|
15%
|
25%
|
Non bearing local currency 6%. Bearing local currency and foreign currency 12%.
|
14%
|
|||||
|
Time deposits and saving deposits
|
15%
|
30%
(*)
|
15%
|
20%
|
Non bearing local currency 6%. Bearing local currency and foreign currency 12%.
|
14%
|
|||||
|
Foreign loans, except multilateral loans
|
N/A
|
N/A
|
N/A
|
5%
|
8% of us dollar denominated obligations with tenors of less than a year.
|
N/A
|
|||||
|
Measurement frequency
|
Bi-monthly
|
N/A
|
Bi-weekly
|
Bi-weekly
|
Bi-weekly
|
Daily
|
|
(*)
|
Liquidity reserve.
|
GRUPO AVAL ACCIONES Y VALORES S.A. AND ITS SUBSIDIARIES
NOTES TO THE CONSOLIDATED FINANCIAL STATEMENTS
FOR THE YEARS ENDED DECEMBER 31, 2014, 2013 AND 2012
(
Stated in millions of Colombian pesos and U.S. dollars)
|
(4)
|
INVESTMENT SECURITIES, NET
|
Investment securities, net consisted of the following
:
|
December 31,
|
December 31,
|
|||||||
|
2014
|
2013
|
|||||||
|
Debt securities:
|
||||||||
|
Trading
|
Ps. | 3,456,803 | Ps. | 6,093,814 | ||||
|
Available for sale
|
18,010,696 | 14,132,508 | ||||||
|
Held to maturity
|
3,057,581 | 3,348,380 | ||||||
|
Total debt securities
|
24,525,080 | 23,574,702 | ||||||
|
Equity securities:
|
||||||||
|
Trading
|
1,597,836 | 1,424,015 | ||||||
|
Available for sale
|
2,472,539 | 2,306,566 | ||||||
|
Total equity securities
|
4,070,375 | 3,730,581 | ||||||
|
Allowance for investment securities
|
(4,462 | ) | (6,678 | ) | ||||
|
Total investment securities, net
|
Ps. | 28,590,993 | Ps. | 27,298,605 | ||||
Investments in trading-debt securities consisted of the following:
|
December 31,
|
December 31,
|
|||||||
|
2014
|
2013
|
|||||||
|
Trading-debt securities
|
||||||||
|
Colombian peso-denominated:
|
||||||||
|
Colombian Government
|
Ps. | 1,681,314 | Ps. | 4,373,323 | ||||
|
Government entities
|
45,307 | 144,182 | ||||||
|
Financial institutions
|
478,001 | 529,244 | ||||||
|
Mortgage Backed Securities
|
7,471 | 5,552 | ||||||
|
Corporate bonds
|
109,722 | 104,990 | ||||||
|
Others
|
25,250 | 30,318 | ||||||
|
Total Colombian peso-denominated
|
2,347,065 | 5,187,609 | ||||||
|
Foreign currency-denominated:
|
||||||||
|
Colombian Government
|
13,660 | 12,602 | ||||||
|
Government entities
|
21,894 | 8,825 | ||||||
|
Foreign Governments
|
57,665 | 56,115 | ||||||
|
Financial institutions
|
1,013,735 | 775,066 | ||||||
|
Corporate bonds
|
2,784 | 53,597 | ||||||
|
Total foreign currency-denominated
|
1,109,738 | 906,205 | ||||||
|
Total trading-debt securities
|
Ps. | 3,456,803 | Ps. | 6,093,814 | ||||
The foreign currency-denominated debt securities issued or secured by the Colombian Government are bonds denominated in U.S. dollars, purchased at nominal value, with annualized yields of 2.30% and 2.10% for 2014 and 2013, respectively.
Available for sale debt securities as of December 31, 2014 and 2013 consisted of the following:
|
December 31,
|
December 31,
|
|||||||
|
2014
|
2013
|
|||||||
|
Available for sale debt securities
|
||||||||
|
Colombian peso-denominated:
|
||||||||
|
Colombian Government
|
Ps. | 10,918,263 | Ps. | 8,676,443 | ||||
|
Financial institutions
|
109,239 | 10,557 | ||||||
|
Government entities
|
15,770 | – | ||||||
|
Mortgage backed securities
|
15,867 | 37,390 | ||||||
|
Others
|
66,504 | 89,967 | ||||||
|
Total Colombian peso-denominated
|
11,125,643 | 8,814,357 | ||||||
GRUPO AVAL ACCIONES Y VALORES S.A. AND ITS SUBSIDIARIES
NOTES TO THE CONSOLIDATED FINANCIAL STATEMENTS
FOR THE YEARS ENDED DECEMBER 31, 2014, 2013 AND 2012
(
Stated in millions of Colombian pesos and U.S. dollars)
|
December 31,
|
December 31,
|
|||||||
|
2014
|
2013
|
|||||||
|
Foreign currency-denominated:
|
||||||||
|
Colombian Government
|
1,029,512 | 703,933 | ||||||
|
Government entities
|
295,543 | 239,225 | ||||||
|
Foreign Government (*)
|
1,504,643 | 1,248,387 | ||||||
|
Financial institutions (*)
|
2,712,236 | 2,011,613 | ||||||
|
Corporate bonds (*)
|
124,280 | 79,644 | ||||||
|
Others
|
1,218,839 | 1,035,349 | ||||||
|
Total foreign currency-denominated
|
6,885,053 | 5,318,151 | ||||||
|
Total available for sale debt securities
|
Ps. | 18,010,696 | Ps. | 14,132,508 | ||||
|
(*)
|
On December 31,2014 this amount includes Ps. 1,737,192 (U.S.$726.1 million) available for sale debt securities as collateral a U.S.$540 million three-year term loan between Leasing Bogota Panama and Deutsche Bank. (see note 17).
|
Investments classified as held to maturity debt securities as of December 31, 2014 and 2013 consisted of the following:
|
December 31,
|
December 31,
|
|||||||
|
2014
|
2013
|
|||||||
|
Held to maturity debt securities
|
||||||||
|
Colombian peso-denominated:
|
||||||||
|
Colombian Government
|
Ps. | 270,194 | Ps. | 475,726 | ||||
|
Colombian Government entities
|
2,401,205 | 2,506,881 | ||||||
|
Financial institutions
|
5,050 | 18,657 | ||||||
|
Corporate bonds
|
8,466 | – | ||||||
|
Total Colombian peso-denominated
|
2,684,915 | 3,001,264 | ||||||
|
Foreign currency-denominated:
|
||||||||
|
Colombian Government entities
|
– | 1,986 | ||||||
|
Government Entities
|
9,306 | 4,513 | ||||||
|
Foreign Government
|
31,240 | 23,278 | ||||||
|
Financial institutions
|
318,307 | 295,624 | ||||||
|
Others
|
13,813 | 21,715 | ||||||
|
Total foreign currency-denominated
|
372,666 | 347,116 | ||||||
|
Total held to maturity debt securities
|
Ps. | 3,057,581 | Ps. | 3,348,380 | ||||
The maturity and yield of debt securities held to maturity, as of December 31, 2014, were as follow:
|
Balance
|
Yield (*)
|
|||||||
|
Maturity
|
||||||||
|
One year or less
|
Ps. | 2,994,130 | 2.34 | % | ||||
|
One year through five years
|
50,521 | 3.98 | % | |||||
|
Five years through ten years
|
8,593 | 3.51 | % | |||||
|
More than ten years
|
4,337 | 0.00 | % | |||||
|
Total
|
Ps. | 3,057,581 | 2.37 | % | ||||
|
(*)
|
Calculated using Internal Rate Return (IRR) as of December 31, 2014.
|
Investments classified as trading equity securities as of December 31, 2014 and 2013 consisted of the following:
|
December 31,
|
December 31,
|
|||||||
|
2014
|
2013
|
|||||||
|
Trading-equity securities
|
||||||||
|
Colombian peso-denominated:
|
||||||||
|
Private investment funds (*)
|
Ps. | 448,432 | Ps. | 644,754 | ||||
|
Mandatory investment funds
(**)
|
864,213 | 657,808 | ||||||
|
Common investment funds
|
138,722 | 38,110 | ||||||
|
Bolsa de Valores de Colombia S.A.
|
246 | 3,450 | ||||||
|
Others
|
144,723 | 78,744 | ||||||
|
Total Colombian peso-denominated
|
1,596,336 | 1,422,866 | ||||||
GRUPO AVAL ACCIONES Y VALORES S.A. AND ITS SUBSIDIARIES
NOTES TO THE CONSOLIDATED FINANCIAL STATEMENTS
FOR THE YEARS ENDED DECEMBER 31, 2014, 2013 AND 2012
(
Stated in millions of Colombian pesos and U.S. dollars)
|
December 31,
|
December 31,
|
|||||||
|
2014
|
2013
|
|||||||
|
Foreign currency-denominated:
|
||||||||
|
Banco Internacional del Peru - Interbank
|
1,456 | 1,110 | ||||||
|
Investment Funds
|
44 | 39 | ||||||
|
Total foreign currency-denominated
|
1,500 | 1,149 | ||||||
|
Total trading-equity securities
|
Ps. | 1,597,836 | Ps. | 1,424,015 | ||||
|
(*)
|
Corresponds to Corficolombiana’s private equity
fund, “Corredores Capital 1”. The change between 2013 and 2014 is explained by dividends received from Promigas.
|
|
(**)
|
Mandatory investment funds correspond to investments that are required by law for pension fund managers to operate in the pension fund market and the stock exchange market. Grupo Aval operates such markets through its subsidiary Porvenir S.A. The increase in Mandatory investment funds for the year ended December 31, 2014 was driven by an increase in Porvenir’s assets under management and their stabilization reserve that is required by law.
|
Available for sale equity securities as of December 31, 2014 and 2013 consisted of the following:
|
Ownership % as of December 31, 2014
|
Ownership % as of December 31, 2013
|
|||||||||||||||
|
Available for sale-equity securities
|
||||||||||||||||
|
Promigas S.A. E.S.P.
|
44.8 | % | Ps. | 1,656,551 | 44.7 | % | Ps. | 1,575,625 | ||||||||
|
Empresa de Energia de Bogotá “EEB”
|
3.6 | % | 556,156 | 3.6 | % | 502,176 | ||||||||||
|
Gas Natural S.A.
|
1.7 | % | 53,480 | 1.7 | % | 53,480 | ||||||||||
|
Concesionaria Ruta del Sol S.A.
|
33.0 | % | 86,562 | 33.0 | % | 86,562 | ||||||||||
|
Bolsa de Valores de Colombia S.A. “BVC”
|
5.1 | % | 13,420 | 3.9 | % | 14,263 | ||||||||||
|
Jardin Plaza S.A.
|
17,8 | % | 10,031 | 17.8 | % | 10,031 | ||||||||||
|
Concesionaria Tibitoc S.A.
|
33.3 | % | 9,823 | 33.3 | % | 9,823 | ||||||||||
|
Titularizadora Colombiana S.A.
|
10.0 | % | 12,446 | 10.0 | % | 6,867 | ||||||||||
|
Sociedad Transportadora de Gas de Occidente S.A.
|
2.8 | % | 3,717 | 2.8 | % | 3,691 | ||||||||||
|
Aerocali S.A.
|
49.9 | % | 7,721 | 49.9 | % | 7,718 | ||||||||||
|
Textiles el Espinal S.A.
|
8.6 | % | 2,399 | 8.6 | % | 2,399 | ||||||||||
|
Deposito Centralizado de Valores de Colombia “DECEVAL”
|
8.0 | % | 2,843 | 8.0 | % | 2,843 | ||||||||||
|
Redeban Redmulticolor S.A.
|
20.0 | % | 4,552 | 20.0 | % | 4,552 | ||||||||||
|
ACH Colombia S.A.
|
33.8 | % | 2,378 | 33.8 | % | 2,378 | ||||||||||
|
Others
|
47,460 | 24,158 | ||||||||||||||
|
Total available for sale-equity securities
|
Ps. | 2,472,539 | Ps. | 2,306,566 | ||||||||||||
Dividends received from equity investments and accounted for in the consolidated income statement amounted to Ps. 298,479, Ps. 326,431 and Ps. 98,935 for the years ended December 31, 2014, 2013 and 2012, respectively.
Grupo Aval sold equity and debt securities for Ps. 129,534,863 and Ps. 124,362,410 and Ps. 307,282,476 during the years ended December 31, 2014, 2013 and 2012, respectively.
Restriction on Investments
- As required by law, Sociedad Administradora de Fondos de Pensiones y Cesantias Porvenir maintains a stabilization reserve yield to ensure compliance with the minimum return on third-party portfolios belonging to the City of Manizales, the City of Medellin, and Licorera de Caldas and Rionegro, as well as for pension and severance funds.
- The Trading investments in equity securities reported by Fiduciaria Bogota S.A. and Sociedad Administradora de Pensiones y Cesantias – Porvenir S.A. at December 31, 2014 (Ps. 62,425 and Ps. 102,304, respectively), are part of the stabilization reserve set up to comply with the minimum return stipulated under Law 1450/2011 and the regulation in Decree 1861/2012, Article 7, with respect to management of the resources of Fondo de Pensiones de Entidades Territoriales (FONPET).
GRUPO AVAL ACCIONES Y VALORES S.A. AND ITS SUBSIDIARIES
NOTES TO THE CONSOLIDATED FINANCIAL STATEMENTS
FOR THE YEARS ENDED DECEMBER 31, 2014, 2013 AND 2012
(
Stated in millions of Colombian pesos and U.S. dollars)
- The stabilization reserve yield is equivalent to 1% of the average monthly value at market prices, of the assets constituting the third-party portfolios managed by the consortium known as FONPET 2012, which includes Sociedad Administradora de Pensiones y Cesantias – PORVENIR S.A., with 59% interest, and Fiduciaria Bogota, with 41%.
- The Mandatory investments held by Casa de Bolsa on the Colombian stock exchange are pledged, as a general guarantee, to back all its obligations with Bolsa de Valores de Colombia S.A.
- The Other restrictions pertain to investment repurchase rights and securities pledged as collateral. The former were pledged to support liquidity operations with counterparts and the latter with the Central Counterparty Clearing House.
Allowance for investment securities as of December 31, 2014 and 2013, are as follows:
|
December 31,
|
December 31,
|
|||||||
|
2014
|
2013
|
|||||||
|
Allowance for debt securities:
|
||||||||
|
Trading
|
Ps. | – | Ps. | 267 | ||||
|
Available for sale
|
318 | 2,312 | ||||||
|
Total allowance for debt securities
|
318 | 2,579 | ||||||
|
Allowance for equity securities:
|
||||||||
|
Available for sale
|
4,144 | 4,099 | ||||||
|
Total allowance for equity securities
|
4,144 | 4,099 | ||||||
|
Total allowance for investment securities
|
Ps. | 4,462 | Ps. | 6,678 | ||||
Investment securities were classified under risk categories as follows:
|
Category
|
December 31, 2014
Allowance
|
Category
|
December 31, 2013
Allowance
|
|||||||||||||
|
Agroganadera del Valle S.A.
|
E | Ps. | 22 | E | Ps. | 22 | ||||||||||
|
CCI Marketplace S. A.
|
C | 139 | C | 139 | ||||||||||||
|
Centro de Ferias, Exposiciones y Conveciones de B/manga (Cenfer S.A.)
|
B | 84 | B | 84 | ||||||||||||
|
Empresa de Desarrollo Urbano de Barranquilla - Edubar
|
E | 125 | E | 127 | ||||||||||||
|
Grupo APC S.A.
|
A | 7 | - | - | ||||||||||||
|
Inducarbon
|
E | 1 | E | 1 | ||||||||||||
|
Inmobiliaria Selecta S.A.
|
E | 85 | E | 85 | ||||||||||||
|
Inversiones Sides S.A.S.
|
C | 24 | C | 24 | ||||||||||||
|
Petroleos Colombianos Limited
|
E | 118 | E | 96 | ||||||||||||
|
Petroleos Nacionales S.A.
|
E | 257 | E | 257 | ||||||||||||
|
Pizano Iberica S.L.
|
E | 94 | E | 76 | ||||||||||||
|
Promotora de Inversiones de Santander S.A. Promisan S.A. (en liquidación)
|
E | 30 | E | 30 | ||||||||||||
|
Promotora de Inversiones Ruitoque S. A. (Promision)
|
B | 198 | B | 198 | ||||||||||||
|
Promotora Industrial Comercial y Turistica de Sevilla S.A.
|
E | 2 | E | 2 | ||||||||||||
|
Promotora la Alborada S.A.
|
E | 318 | E | 318 | ||||||||||||
|
Promotora la Enseñanza
|
E | 210 | E | 210 | ||||||||||||
|
Reforestadora de Santa Rosalia
|
E | 12 | E | 12 | ||||||||||||
|
Textiles el Espinal S.A.
|
E | 2,399 | E | 2,399 | ||||||||||||
|
Triple A Barranquilla
|
D | 19 | D | 19 | ||||||||||||
|
Total allowance for available for sale equity securities
|
Ps. | 4,144 | Ps. | 4,099 | ||||||||||||
GRUPO AVAL ACCIONES Y VALORES S.A. AND ITS SUBSIDIARIES
NOTES TO THE CONSOLIDATED FINANCIAL STATEMENTS
FOR THE YEARS ENDED DECEMBER 31, 2014, 2013 AND 2012
(
Stated in millions of Colombian pesos and U.S. dollars)
|
(5)
|
LOANS AND FINANCIAL LEASES, NET
|
Loan portfolio and financial lease contracts were classified in accordance with the requirements of the Superintendency of Finance of Colombia and were as of December 31, 2014 and 2013 as follows:
As of December 31, 2014
|
Classification
|
Commercial
|
Consumer
|
Microcredit
|
Mortgage
|
Financial leases
|
Total
|
|||||||||||||||||||||
| “A” |
Normal risk
|
Ps. | 59,530,616 | Ps. | 30,269,025 | Ps. | 311,491 | Ps. | 8,318,400 | Ps. | 6,756,228 | Ps. | 105,185,760 | ||||||||||||||
| “B” |
Acceptable risk
|
1,502,158 | 957,647 | 9,423 | 194,829 | 348,386 | 3,012,443 | ||||||||||||||||||||
| “C” |
Appreciable risk
|
973,622 | 1,061,353 | 5,227 | 406,079 | 158,229 | 2,604,510 | ||||||||||||||||||||
| “D” |
Significant risk
|
475,189 | 632,997 | 4,170 | 43,092 | 139,103 | 1,294,551 | ||||||||||||||||||||
| “E” |
Unrecoverable
|
283,230 | 245,369 | 21,470 | 72,278 | 36,467 | 658,814 | ||||||||||||||||||||
|
Total loans and financial leases
|
62,764,815 | 33,166,391 | 351,781 | 9,034,678 | 7,438,413 | 112,756,078 | |||||||||||||||||||||
|
Allowance for loans and
financial leases losses
|
(1,460,471 | ) | (1,602,265 | ) | (87,264 | ) | (31,223 | ) | (232,457 | ) | (3,413,680 | ) | |||||||||||||||
|
Net Book Value
|
Ps. | 61,304,344 | Ps. | 31,564,126 | Ps. | 264,517 | Ps. | 9,003,455 | Ps. | 7,205,956 | Ps. | 109,342,398 | |||||||||||||||
As of December 31, 2013
|
Classification
|
Commercial
|
Consumer
|
Microcredit
|
Mortgage
|
Financial leases
|
Total
|
|||||||||||||||||||||
| “A” |
Normal risk
|
Ps. | 51,733,782 | Ps. | 25,859,861 | Ps. | 306,818 | Ps. | 6,042,417 | Ps. | 6,523,235 | Ps. | 90,466,113 | ||||||||||||||
| “B” |
Acceptable risk
|
1,708,550 | 550,156 | 8,231 | 139,413 | 243,358 | 2,649,708 | ||||||||||||||||||||
| “C” |
Appreciable risk
|
748,239 | 608,921 | 5,299 | 256,870 | 83,985 | 1,703,314 | ||||||||||||||||||||
| “D” |
Significant risk
|
400,086 | 542,734 | 3,485 | 22,852 | 87,308 | 1,056,465 | ||||||||||||||||||||
| “E” |
Unrecoverable
|
264,923 | 239,603 | 18,024 | 58,567 | 57,105 | 638,222 | ||||||||||||||||||||
|
Total loans and financial leases
|
54,855,580 | 27,801,275 | 341,857 | 6,520,119 | 6,994,991 | 96,513,822 | |||||||||||||||||||||
|
Allowance for loans and financial leases losses
|
(1,358,538 | ) | (1,402,461 | ) | (27,778 | ) | (74,315 | ) | (209,943 | ) | (3,073,035 | ) | |||||||||||||||
|
Net Book Value
|
Ps. | 53,497,042 | Ps. | 26,398,814 | Ps. | 314,079 | Ps. | 6,445,804 | Ps. | 6,785,048 | Ps. | 93,440,787 | |||||||||||||||
The following table represents a summary of troubled loans that have been restructured:
|
December 31,
|
December 31,
|
|||||||
|
2014
|
2013
|
|||||||
|
Ordinary restructurings
|
Ps. | 1,723,233 | Ps. | 1,461,818 | ||||
|
Extraordinary restructurings
|
11,090 | 14,933 | ||||||
|
Under Law 550
|
74,771 | 79,962 | ||||||
|
Under Law 617
|
145,095 | 189,910 | ||||||
|
Creditor agreement proceedings
|
27,005 | 30,703 | ||||||
|
Interest and other receivables items
|
33,817 | 30,725 | ||||||
|
Under Law 1116
|
207,914 | 189,038 | ||||||
|
Restructured loans
|
2,222,925 | 1,997,089 | ||||||
|
Allowances for loan losses
|
(432,059 | ) | (406,813 | ) | ||||
|
Restructured loans, net
|
Ps. | 1,790,866 | Ps. | 1,590,276 | ||||
GRUPO AVAL ACCIONES Y VALORES S.A. AND ITS SUBSIDIARIES
NOTES TO THE CONSOLIDATED FINANCIAL STATEMENTS
FOR THE YEARS ENDED DECEMBER 31, 2014, 2013 AND 2012
(
Stated in millions of Colombian pesos and U.S. dollars)
Allowance for loan and financial lease losses
The following table sets forth an analysis of the activity in the allowance for loan and financial lease losses:
|
December 31,
|
December 31,
|
December 31,
|
||||||||||
|
2014
|
2013
|
2012
|
||||||||||
|
Balance at beginning of period
|
Ps. | 3,073,035 | Ps. | 2,545,565 | Ps. | 2,306,500 | ||||||
|
Increase due to additions or mergers (*)
|
– | 120,111 | 11,616 | |||||||||
|
Provisions for loan losses
|
3,088,352 | 2,800,035 | 2,263,625 | |||||||||
|
Charge-offs
(**)
|
(1,304,883 | ) | (930,150 | ) | (713,161 | ) | ||||||
|
Effect of changes in foreign exchange rate
|
107,735 | 24,211 | (21,784 | ) | ||||||||
|
Reclassification – Securitization
|
4,857 | (310 | ) | (965 | ) | |||||||
|
Recovery of provisions
|
(1,555,416 | ) | (1,486,427 | ) | (1,300,266 | ) | ||||||
|
Balance at end of period
|
Ps. | 3,413,680 | Ps. | 3,073,035 | Ps. | 2,545,565 | ||||||
|
(*)
|
Amount in 2013 explained by Grupo Financiero Reformador and BBVA panama acquisitions. During 2012, Banco de Bogota increased due to real estate restoration from Megabanco.
|
|
(**)
|
Recoveries of charge-offs loans are recorded separately in the consolidated statements of income.
|
|
(6)
|
ACCRUED INTEREST RECEIVABLE ON LOANS AND FINANCIAL LEASES AND ACCOUNTS RECEIVABLE, NET
|
Accrued interest receivable on loans and financial leases and accounts receivable, net as of December 31, 2014 and 2013 consisted of the following:
|
December 31,
|
December 31,
|
|||||||
|
2014
|
2013
|
|||||||
|
Accrued interest receivable on loans and financial leases
|
Ps. | 927,040 | Ps. | 819,636 | ||||
|
Allowance for accrued interest losses
|
(96,371 | ) | (84,422 | ) | ||||
|
Total interest accrued on loans and financial leases, net
|
830,669 | 735,214 | ||||||
|
Accounts receivable:
|
||||||||
|
Payments on behalf of customers
|
110,803 | 101,893 | ||||||
|
Commissions and fees
|
61,852 | 71,695 | ||||||
|
Governmental institutions
|
119,375 | 118,558 | ||||||
|
Advances to contractors and suppliers
|
916,111 | 789,922 | ||||||
|
Receivable from customers
|
100,985 | 79,334 | ||||||
|
Advance in commitment to purchase
|
40,126 | 50,740 | ||||||
|
Dividends
|
83,529 | 54,705 | ||||||
|
Warehouse services
|
28,949 | 31,845 | ||||||
|
Insurance claims
|
18,894 | 13,078 | ||||||
|
Taxes
|
11,623 | 47,226 | ||||||
|
Sale of services and goods
|
261,274 | 240,421 | ||||||
|
Inactive accounts
|
27,815 | 26,779 | ||||||
|
ATMS
|
58,907 | 53,356 | ||||||
|
Assets under operating lease
|
37,190 | 34,666 | ||||||
|
Retirement pensions
|
4,994 | 4,640 | ||||||
|
Contracts (non-financial sector)
|
50,412 | 35,102 | ||||||
|
Credit and debit cards
|
162,213 | 107,100 | ||||||
|
Receivables from third parties
|
50,631 | 15,920 | ||||||
|
Other receivables
|
135,451 | 31,601 | ||||||
|
Total accounts receivable
|
2,281,134 | 1,908,581 | ||||||
|
Allowance for accounts receivable losses
|
(171,934 | ) | (142,950 | ) | ||||
|
Total accounts receivable, net
|
2,109,200 | 1,765,631 | ||||||
|
Total accrued interest receivable on loans and financial leases and accounts receivable, net
|
Ps. | 2,939,869 | Ps. | 2,500,845 | ||||
F-41
GRUPO AVAL ACCIONES Y VALORES S.A. AND ITS SUBSIDIARIES
NOTES TO THE CONSOLIDATED FINANCIAL STATEMENTS
FOR THE YEARS ENDED DECEMBER 31, 2014, 2013 AND 2012
(
Stated in millions of Colombian pesos and U.S. dollars)
The changes in allowance for accrued interest receivable on loans and financial leases and accounts receivable were as follows:
|
December 31,
|
December 31,
|
December 31,
|
||||||||||
|
2014
|
2013
|
2012
|
||||||||||
|
Balance at beginning of period
|
Ps. | 227,372 | Ps. | 197,010 | Ps. | 171,202 | ||||||
|
Increase due to additions or mergers (*)
|
– | 11,026 | 1,024 | |||||||||
|
Provisions for uncollectible amounts
|
253,580 | 206,088 | 168,396 | |||||||||
|
Charge-offs
|
(99,608 | ) | (84,277 | ) | (55,929 | ) | ||||||
|
Recoveries of provisions
|
(103,682 | ) | (92,287 | ) | (88,566 | ) | ||||||
|
Reclassifications – Securitizations
|
(10,216 | ) | (10,608 | ) | (6,485 | ) | ||||||
|
Effect of changes in foreign exchange rate
|
859 | 420 | 7,368 | |||||||||
|
Balance at end of period
|
Ps. | 268,305 | Ps. | 227,372 | Ps. | 197,010 | ||||||
|
(*)
|
During December, 2013 see note 12(a) BBVA Horizonte Sociedad Administradora de Fondos de Pensiones y Cesantias S.A. acquisition and (b) BBVA Panamá and Grupo Financiero Reformador acquisitions. During 2012, Banco de Bogota increased due to real estate restoration from Megabanco.
|
|
(7)
|
BANKERS’ ACCEPTANCES, SPOT TRANSACTIONS AND DERIVATIVES
|
Grupo Aval’s rights and obligations from bankers’ acceptances, spot transactions and derivatives as of December 31, 2014 and 2013 were as follows:
|
December 31, 2014
|
December 31, 2013
|
|||||||||||||||||||||||
|
Assets
|
Liabilities
|
Net
|
Assets
|
Liabilities
|
Net
|
|||||||||||||||||||
|
Bankers’ acceptances
|
||||||||||||||||||||||||
|
Current banker’s acceptances
|
Ps. | 121,881 | 301,631 | (179,750 | ) | Ps. | 213,340 | 214,393 | (1,053 | ) | ||||||||||||||
|
Non – current banker’s acceptances
|
8,912 | 8,928 | (16 | ) | 6,796 | 6,812 | (16 | ) | ||||||||||||||||
|
Total bankers’ acceptances
|
130,793 | 310,559 | (179,766 | ) | 220,136 | 221,205 | (1,069 | ) | ||||||||||||||||
|
Spot transactions
|
||||||||||||||||||||||||
|
Foreign exchange rights contracts-purchased
|
5,427 | – | 5,427 | 41,564 | – | 41,564 | ||||||||||||||||||
|
Foreign exchange commitments contracts purchased
|
(5,415 | ) | – | (5,415 | ) | (41,565 | ) | – | (41,565 | ) | ||||||||||||||
|
Foreign exchange rights contracts-sold
|
31,115 | – | 31.115 | 10,207 | – | 10,207 | ||||||||||||||||||
|
Foreign exchange commitments contracts sold
|
(31,117 | ) | – | (31,117 | ) | (10,197 | ) | – | (10,197 | ) | ||||||||||||||
|
Investment securities rights purchase (peso-denominated)
|
167 | – | 167 | – | – | – | ||||||||||||||||||
|
Investment securities commitments-purchased (peso-denominated)
|
(169 | ) | – | (167 | ) | – | – | – | ||||||||||||||||
|
Investment securities rights sold (peso-denominated)
|
216 | – | 216 | 102,654 | – | 102,654 | ||||||||||||||||||
|
Investment securities commitments-sold (peso-denominated)
|
(215 | ) | – | (215 | ) | (102,569 | ) | – | (102,569 | ) | ||||||||||||||
| 9 | – | 9 | 94 | – | 94 | |||||||||||||||||||
|
Speculative forwards
|
||||||||||||||||||||||||
|
Foreign exchange rights contracts purchased (peso-denominated)
|
7,786,185 | (1,838,676 | ) | 9,624,861 | 2,401,944 | (6,187,706 | ) | 8,589,650 | ||||||||||||||||
|
Foreign exchange commitments contracts purchased (peso-denominated)
|
(6,993,000 | ) | 1,861,680 | (8,854,680 | ) | (2,338,696 | ) | 6,231,074 | (8,569,770 | ) | ||||||||||||||
|
Foreign exchange rights contracts sale (peso-denominated)
|
2,013,379 | (8,264,732 | ) | 10,278,111 | 8,073,021 | (2,689,201 | ) | 10,762,222 | ||||||||||||||||
|
Foreign exchange commitments contracts sale (peso- denominated)
|
(1,987,788 | ) | 9,108,910 | (11,096,698 | ) | (8,029,855 | ) | 2,739,339 | (10,769,194 | ) | ||||||||||||||
|
Foreign exchange rights contracts purchased
|
5,700 | (337,163 | ) | 342,863 | 203,352 | (28,478 | ) | 231,830 | ||||||||||||||||
|
Foreign exchange commitments contracts purchased
|
(5,693 | ) | 346,712 | (352,405 | ) | (199,494 | ) | 29,356 | (228,850 | ) | ||||||||||||||
|
Foreign exchange rights contracts sold
|
207,074 | (54,300 | ) | 261,374 | 30,184 | (178,452 | ) | 208,636 | ||||||||||||||||
|
Foreign exchange commitments contracts sold
|
(201,251 | ) | 59,667 | (260,918 | ) | (29,278 | ) | 181,640 | (210,918 | ) | ||||||||||||||
|
Investment securities rights-purchased (peso-denominated)
|
135,481 | (36,014 | ) | 171,495 | 28,392 | (53,044 | ) | 81,436 | ||||||||||||||||
|
Investment securities commitments purchased (peso-denominated)
|
(134,618 | ) | 36,149 | (170,767 | ) | (28,330 | ) | 53,093 | (81,423 | ) | ||||||||||||||
|
Securities rights contracts sale
|
505,358 | (179,736 | ) | 685,094 | 750,213 | (226,442 | ) | 976,655 | ||||||||||||||||
|
Securities commitments contracts sale
|
(500,535 | ) | 180,289 | (680,824 | ) | (749,236 | ) | 227,691 | (976,927 | ) | ||||||||||||||
|
Others – rights
|
13,743 | – | 13,743 | 2,184 | – | 2,184 | ||||||||||||||||||
|
Other commitments
|
(11,317 | ) | – | (11,317 | ) | (2,115 | ) | – | (2,115 | ) | ||||||||||||||
| 832,717 | 882,786 | (50,069 | ) | 112,286 | 98,870 | 13,416 | ||||||||||||||||||
|
Forward Contracts – Hedging
|
||||||||||||||||||||||||
|
Foreign exchange rights contracts purchased (peso- denominated)
|
485,489 | (48,972 | ) | 534,461 | 187,049 | (1,179,841 | ) | 1,366,890 | ||||||||||||||||
|
Foreign exchange commitments contracts purchased (peso-denominated)
|
(432,768 | ) | 49,067 | (481,835 | ) | (186,196 | ) | 1,188,869 | (1,375,065 | ) | ||||||||||||||
|
Foreign exchange rights contracts sale (peso-denominated)
|
629,453 | (3,648,015 | ) | 4,277,467 | 1,361,748 | (1,911,299 | ) | 3,273,047 | ||||||||||||||||
|
Foreign exchange commitments contracts sale (peso-denominated)
|
(623,902 | ) | 4,164,834 | (4,788,736 | ) | (1,346,937 | ) | 1,943,316 | (3,290,253 | ) | ||||||||||||||
| 58,272 | 516,914 | (458,642 | ) | 15,644 | 41,044 | (25,381 | ) | |||||||||||||||||
GRUPO AVAL ACCIONES Y VALORES S.A. AND ITS SUBSIDIARIES
NOTES TO THE CONSOLIDATED FINANCIAL STATEMENTS
FOR THE YEARS ENDED DECEMBER 31, 2014, 2013 AND 2012
(
Stated in millions of Colombian pesos and U.S. dollars)
|
December 31, 2014
|
December 31, 2013
|
|||||||||||||||||||||||
|
Assets
|
Liabilities
|
Net
|
Assets
|
Liabilities
|
Net
|
|||||||||||||||||||
|
Speculative Futures Contracts
|
||||||||||||||||||||||||
|
Foreign exchange rights contracts purchased
|
2,706,885 | (193,005 | ) | 2,899,890 | 2,283,265 | (31,066 | ) | 2,314,331 | ||||||||||||||||
|
Foreign exchange commitments contracts purchased
|
(2,706,885 | ) | 193,005 | (2,899,890 | ) | (2,283,193 | ) | 31,066 | (2,314,259 | ) | ||||||||||||||
|
Foreign exchange rights contracts sold
|
916,148 | (1,189,637 | ) | 2,105,786 | 1,055,148 | (629,870 | ) | 1,685,018 | ||||||||||||||||
|
Foreign exchange commitments contracts sold
|
(916,148 | ) | 1,190,052 | (2,106,201 | ) | (1,055,148 | ) | 629,870 | (1,685,018 | ) | ||||||||||||||
|
Securities rights contracts purchase
|
– | (42,126 | ) | 42,126 | 2,914 | (5,184 | ) | 8,097 | ||||||||||||||||
|
Securities commitments contracts purchase
|
– | 42,126 | (42,126 | ) | (2,914 | ) | 5,184 | (8,097 | ) | |||||||||||||||
|
Investment securities commitments purchased
|
515,814 | – | 515,814 | 27,138 | (4,645 | ) | 31,783 | |||||||||||||||||
|
Investment securities commitments sold
|
(515,814 | ) | – | (515,814 | ) | (27,138 | ) | 4,645 | (31,783 | ) | ||||||||||||||
| – | 415 | (415 | ) | 72 | – | 72 | ||||||||||||||||||
|
Speculative Swaps
|
||||||||||||||||||||||||
|
Foreign exchange right contracts
|
336,039 | (919,549 | ) | 1,255,588 | 661,422 | (695,848 | ) | 1,357,270 | ||||||||||||||||
|
Foreign exchange commitments contracts
|
(278,696 | ) | 1,119,184 | (1,397,879 | ) | (635,224 | ) | 726,673 | (1,361,897 | ) | ||||||||||||||
|
Interest rate rights contracts
|
696,058 | (477,823 | ) | 1,173,881 | 294,229 | (330,728 | ) | 624,957 | ||||||||||||||||
|
Interest rate commitments contracts
|
(661,869 | ) | 499,064 | (1,160,934 | ) | (271,886 | ) | 353,032 | (624,917 | ) | ||||||||||||||
|
Others – rights
|
– | – | – | – | (315 | ) | 315 | |||||||||||||||||
|
Other commitments
|
– | – | – | – | 330 | (330 | ) | |||||||||||||||||
| 91,532 | 220,876 | (129,344 | ) | 48,541 | 53,144 | (4,603 | ) | |||||||||||||||||
|
Swaps Contracts – Hedging
|
||||||||||||||||||||||||
|
Interest rate commitments contracts
|
– | 2,670 | (2,670 | ) | – | 7,699 | (7,699 | ) | ||||||||||||||||
| – | 2,670 | (2,670 | ) | – | 7,699 | (7,699 | ) | |||||||||||||||||
|
Speculative
Options
|
||||||||||||||||||||||||
|
Foreign exchange call options
|
44,526 | 36,143 | 8,383 | 3,684 | 5,003 | (1,318 | ) | |||||||||||||||||
|
Call option - Others
|
60,758 | 16,465 | 44,293 | 7,908 | 487 | 7,421 | ||||||||||||||||||
|
Foreign exchange put options
|
268 | 3,060 | (2,792 | ) | 3,119 | 15,539 | (12,420 | ) | ||||||||||||||||
|
Put options - Others
|
51 | 2,187 | (2,136 | ) | 410 | 4,326 | (3,916 | ) | ||||||||||||||||
| 105,603 | 57,855 | 47,748 | 15,121 | 25,355 | (10,234 | ) | ||||||||||||||||||
|
Total bankers’ acceptances, spot transactions and derivatives
|
Ps. | 1,218,926 | 1,992,075 | (773,149 | ) | Ps. | 411,914 | 447,318 | (35,404 | ) | ||||||||||||||
|
(8)
|
PROPERTY, PLANT AND EQUIPMENT, NET
|
Property, plant and equipment as of December 31, 2014 and 2013 consisted of the following:
|
December 31,
|
December 31,
|
|||||||
|
2014
|
2013
|
|||||||
|
Land
(1)
|
Ps. | 497,002 | Ps. | 443,569 | ||||
|
Buildings
|
1,223,992 | 1,156,897 | ||||||
|
Equipment, furniture and fixtures
|
735,236 | 684,850 | ||||||
|
Computer equipment
|
1,047,172 | 884,552 | ||||||
|
Vehicles
|
111,677 | 81,829 | ||||||
|
Construction in progress
(2)
|
135,626 | 112,627 | ||||||
|
Machinery and equipment
|
344,941 | 344,426 | ||||||
|
Equipment in transit
(2)
|
96,694 | 76,631 | ||||||
|
Total
|
4,192,340 | 3,785,381 | ||||||
|
Less accumulated depreciation
|
(1,895,575 | ) | (1,724,190 | ) | ||||
|
Allowance for impairment
|
(20,783 | ) | (16,383 | ) | ||||
|
Property, plant and equipment, net
|
Ps. | 2,275,982 | Ps. | 2,044,808 | ||||
|
(1)
|
Not a depreciable asset.
|
|
(2)
|
These assets begin to depreciate when the constructions are completed and/or the assets are ready for use.
|
Property, plant and equipment depreciation expense for the years ended December 31, 2014, 2013 and 2012, amounted to Ps. 373,777, Ps. 318,932 and Ps. 296,643, respectively.
GRUPO AVAL ACCIONES Y VALORES S.A. AND ITS SUBSIDIARIES
NOTES TO THE CONSOLIDATED FINANCIAL STATEMENTS
FOR THE YEARS ENDED DECEMBER 31, 2014, 2013 AND 2012
(
Stated in millions of Colombian pesos and U.S. dollars)
|
(9)
|
OPERATING LEASES, NET
|
Operating leases where the Grupo Aval’s banking subsidiaries act as lessors as of December 31, 2014 and 2013 consisted of the following:
|
December 31,
|
December 31,
|
|||||||
|
2014
|
2013
|
|||||||
|
Machinery and equipment
|
Ps. | 165,487 | Ps. | 136,365 | ||||
|
Vehicles
|
91,148 | 74,265 | ||||||
|
Equipment, furniture and fixtures
|
96,482 | 95,719 | ||||||
|
Computer equipment
|
380,623 | 391,228 | ||||||
|
Total
|
733,740 | 697,577 | ||||||
|
Less accumulated depreciation
|
(316,620 | ) | (252,416 | ) | ||||
|
Allowance for impairment
|
(10,275 | ) | (5,924 | ) | ||||
|
Operating leases, net
|
Ps. | 406,845 | Ps. | 439,237 | ||||
Operating lease depreciation cost for the years ended December 31, 2014, 2013 and 2012 amounted to Ps. 151,007 Ps. 115,095 and Ps. 104,844, respectively.
|
(10)
|
FORECLOSED ASSETS, NET
|
Foreclosed assets as of December 31, 2014 and 2013 consisted of the following:
|
December 31,
|
December 31,
|
|||||||
|
2014
|
2013
|
|||||||
|
Foreclosed assets:
|
||||||||
|
Real estate
|
Ps. | 286,072 | Ps. | 240,318 | ||||
|
Other assets
|
59,656 | 37,627 | ||||||
|
Total
|
345,728 | 277,945 | ||||||
|
Allowance
|
(211,585 | ) | (168,708 | ) | ||||
|
Total foreclosed assets, net
|
Ps. | 134,143 | Ps. | 109,237 | ||||
The changes in allowance for foreclosed assets were as follows:
|
December 31,
|
December 31,
|
December 31,
|
||||||||||
|
2014
|
2013
|
2012
|
||||||||||
|
Balance at beginning of year
|
Ps. | 168,708 | Ps. | 142,108 | Ps. | 143,073 | ||||||
|
Increases due to additions or mergers
(*)
|
– | 20,681 | 1,213 | |||||||||
|
Provisions for uncollectible amounts
|
51,291 | 34,181 | 43,386 | |||||||||
|
Charge-offs
|
954 | (682 | ) | (3,058 | ) | |||||||
|
Recoveries of provisions
|
(19,866 | ) | (19,733 | ) | (33,110 | ) | ||||||
|
Reclassifications – Securitizations
|
7,522 | - | 643 | |||||||||
|
Provisions used on sales
|
(7,529 | ) | (10,427 | ) | (7,474 | ) | ||||||
|
Effect of changes in foreign exchange rate
|
10,505 | 2,580 | (2,565 | ) | ||||||||
|
Balance at the end of year
|
Ps. | 211,585 | Ps. | 168,708 | Ps. | 142,108 | ||||||
|
(*)
|
For more detail, during December, 2013 see note 12 (a) BBVA Horizonte Sociedad Administradora de Fondos de Pensiones y Cesantias S.A. acquisition and 12(b) BBVA Panama and Grupo Financiero Reformador acquisitions. During 2012, Banco de Bogota increased due to real estate restoration from Megabanco.
|
GRUPO AVAL ACCIONES Y VALORES S.A. AND ITS SUBSIDIARIES
NOTES TO THE CONSOLIDATED FINANCIAL STATEMENTS
FOR THE YEARS ENDED DECEMBER 31, 2014, 2013 AND 2012
(
Stated in millions of Colombian pesos and U.S. dollars)
|
(11)
|
PREPAID EXPENSES AND DEFERRED CHARGES, NET
|
Prepaid expenses and deferred charges as of December 31, 2014 and 2013 consisted of the following:
|
December 31,
|
December 31,
|
|||||||
|
2014
|
2013
|
|||||||
|
Prepaid expenses:
|
||||||||
|
Insurance premiums
|
Ps. | 21,518 | Ps. | 17,727 | ||||
|
Interest
|
12,676 | 12,566 | ||||||
|
Leases
|
1,387 | 1,457 | ||||||
|
Equipment maintenance
|
2,979 | 1,192 | ||||||
|
Commissions
|
5,149 | 8,745 | ||||||
|
Other
|
14,921 | 10,669 | ||||||
|
Total prepaid expenses
|
58,630 | 52,356 | ||||||
|
Deferred charges:
|
||||||||
|
Pre-operating and reorganization expenses
|
9,911 | 10,328 | ||||||
|
Remodeling expenses
|
9,328 | 8,202 | ||||||
|
Computer programs
|
122,694 | 105,175 | ||||||
|
Improvements on road constructions
(1)
|
1,732,431 | 1,315,710 | ||||||
|
Leasehold improvements
|
121,952 | 97,654 | ||||||
|
Advertising
|
2,821 | 88 | ||||||
|
Deferred income tax asset
(2)
|
378,116 | 159,146 | ||||||
|
Studies and projects
|
222,390 | 199,551 | ||||||
|
Equity tax and others taxes
(3)
|
34,655 | 183,152 | ||||||
|
Other
|
134,084 | 108,334 | ||||||
|
Total deferred charges
|
2,768,382 | 2,187,340 | ||||||
|
Total prepaid expenses and deferred charges
|
Ps. | 2,827,012 | Ps. | 2,239,696 | ||||
|
(1)
|
In 1995, “Concesiones CCFC S.A.”, entered into an agreement with “Instituto Nacional de Vias”, for the construction, operation and maintenance of a public highway. According to the agreement “Concesiones CCFC S.A.”, would fund all the construction costs in exchange for the right to charge and collect a toll to the users of the highway for a period of twenty years this item also includes commissions and fees paid to contractors for the maintenance of the projects.
|
The increase between 2013 and 2014 is driven by the increase in Epiandes investment associated with the construction of the second lane of the road towards the east of the country.
|
(2)
|
Deferred income tax assets relates to the following temporary differences:
|
|
December 31,
|
December 31,
|
|||||||
|
2014
|
2013
|
|||||||
|
Deferred income tax asset
|
||||||||
|
Accrued expenses and other liabilities
|
Ps. | 34,548 | Ps. | 42,772 | ||||
|
Bankers’ acceptances and derivatives
|
208,425 | 14,400 | ||||||
|
Deferred charges
|
4,585 | 4,348 | ||||||
|
Fixed Assets
|
15,369 | 7,943 | ||||||
|
Industry and commerce
|
8,303 | 7,288 | ||||||
|
Provisions for loan
|
71,098 | 55,070 | ||||||
|
Tax losses and excess of presumptive income over ordinary income
|
8,002 | 8,950 | ||||||
|
Other
|
27,786 | 18,375 | ||||||
|
Total deferred income tax asset
|
Ps. | 378,116 | Ps. | 159,146 | ||||
|
(3)
|
In December 30, 2009, the Congress of Colombia enacted Law No. 1370, which added a net worth tax on the wealth of corporate entities (hereinafter referred to as the “Equity Tax”). The Equity Tax accrued on January 1, 2011 amounted to Ps. 783,354 payable in four equal installments through 2014 (one per year). The tax rate to be paid by Grupo Aval and its subsidiaries, each on an unconsolidated basis, is 6.0% of their net fiscal worth as of January 1, 2011. As of December 31, 2014, the Equity tax was paid in full.
|
In accordance with Colombian Banking GAAP, the equity tax liability was recorded as a deferred charge and has been and will continue to be amortized on a straight monthly basis until 2014. Colombian Banking GAAP regulations allow companies to charge the amortized portion against the “equity inflation adjustments” line item in the shareholders’ equity account, but since most of the companies consolidated by Grupo Aval had already used up their “equity inflation adjustments” account, Grupo Aval and its subsidiaries charged the expense to the consolidated statement of income.
F-45
GRUPO AVAL ACCIONES Y VALORES S.A. AND ITS SUBSIDIARIES
NOTES TO THE CONSOLIDATED FINANCIAL STATEMENTS
FOR THE YEARS ENDED DECEMBER 31, 2014, 2013 AND 2012
(
Stated in millions of Colombian pesos and U.S. dollars)
|
(12)
|
GOODWILL, NET
|
|
|
a.
|
BBVA Horizonte Sociedad Administradora de Fondos de Pensiones y Cesantias S.A. acquisition
|
On April 18, 2013, after having obtained the necessary approvals, Grupo Aval and its affiliates completed the acquisition of 99.99% of the shares of “BBVA Horizonte Sociedad Administradora de Fondos de Pensiones y Cesantias S.A.", a Colombian private pension and severance fund management company. The adjusted total price of the transaction was Ps. 999,621 (U.S.$541 million).
On December 31, 2013 the merger by absorption between AFP Horizonte Pensiones y Cesantias S.A. and Sociedad Administradora de Fondos de Pensiones y Cesantias Porvenir S.A. occurred, in which the latter acted as the absorbing entity. Consequently, as of the abovementioned date Sociedad Administradora de Fondos de Pensiones y Cesantias Porvenir S.A. had acquired full title to the assets, rights and obligations of AFP Horizonte Pensiones y Cesantias S.A.
The following table presents the
AFP Horizonte Pensiones y Cesantias S.A. unaudited Balance Sheet as of March 31, 2013 used to calculate the goodwill under Colombian Banking GAAP:
|
Assets
|
||||
|
Cash
|
Ps. | 168,707 | ||
|
Investments
|
312,801 | |||
|
Accounts receivable
|
22,208 | |||
|
Property, plant and equipment, net
|
12,636 | |||
|
Other assets
|
44,305 | |||
|
Total assets acquired
|
560,657 | |||
|
Liabilities
|
||||
|
Derivatives
|
Ps. | 3 | ||
|
Accounts payable
|
35,643 | |||
|
Other liabilities
|
3,408 | |||
|
Accrued expenses
|
69,654 | |||
|
Total liabilities acquired
|
108,708 | |||
|
Net assets acquired
|
Ps. | 451,949 | ||
|
Purchase Price
|
999,621 | |||
|
Goodwill
|
547,672 | |||
|
|
b.
|
BBVA Panamá and Grupo Financiero Reformador (Grupo Reformador) acquisitions.
|
On December 19, 2013 and through Leasing Bogota Panama, Banco de Bogota completed the acquisition of 100% of BBVA’s direct and indirect ownership in Banco Bilbao Vizcaya Argentaria (Panama), S.A. (“BBVA Panama”). BBVA’s ownership in BBVA Panama represents approximately 98.92%. The adjusted total price of the transaction was approximately Ps. 973,318 (U.S.$505 million). During 2014 BBVA Panama (now BAC Bank of Panama) successfully merged with BAC Panama.
On December 23, 2013 and through Credomatic International Corporation (a subsidiary of BAC), Banco de Bogota completed the acquisition of 100% of Grupo Financiero Reformador de Guatemala (whose subsidiaries are Banco Reformador and Transcom Bank (Barbados) Limited). The adjusted total price of the transaction was Ps. 811,141 (U.S.$421 million).
GRUPO AVAL ACCIONES Y VALORES S.A. AND ITS SUBSIDIARIES
NOTES TO THE CONSOLIDATED FINANCIAL STATEMENTS
FOR THE YEARS ENDED DECEMBER 31, 2014, 2013 AND 2012
(
Stated in millions of Colombian pesos and U.S. dollars)
The following table presents the audited Balance Sheet as of December 31, 2013 under Colombian Banking GAAP:
|
Grupo Financiero Reformador
|
Banco BAC de Panama
|
Total Acquisitions
|
||||||||||
|
Assets
|
||||||||||||
|
Cash and cash equivalents
|
Ps. | 521,743 | 747,184 | 1,268,927 | ||||||||
|
Time deposits
|
99,362 | 2,753 | 102,115 | |||||||||
|
Investments
|
401,827 | 57,121 | 458,948 | |||||||||
|
Loans
|
1,927,882 | 2,702,817 | 4,630,699 | |||||||||
|
Property Plant and equipment
|
46,827 | 22,810 | 69,637 | |||||||||
|
Foreclosed assets
|
23,889 | (942 | ) | 22,947 | ||||||||
|
Equity Investments
|
– | 8,133 | 8,133 | |||||||||
|
Other assets
|
56,824 | 79,868 | 136,692 | |||||||||
|
Total assets acquired
|
3,078,354 | 3,619,744 | 6,698,098 | |||||||||
|
Liabilities
|
||||||||||||
|
Deposits
|
2,320,387 | 2,954,617 | 5,275,004 | |||||||||
|
Accounts payable
|
403,974 | 89,735 | 493,709 | |||||||||
|
Other liabilities
|
62,898 | 210,447 | 273,345 | |||||||||
|
Non-controlling interest
|
– | 3,923 | 3,923 | |||||||||
|
Total liabilities acquired
|
2,787,259 | 3,258,722 | 6,045,981 | |||||||||
|
Equity acquired
|
Ps. | 291,095 | 361,022 | 652,117 | ||||||||
The following table presents the goodwill calculation for the Central American acquisitions, as reported to the
Superintendency of Finance of Colombia:
|
Grupo Financiero Reformador
|
Banco BAC de Panama
|
Total Acquisitions
|
||||||||||
|
Shareholders’ equity
|
Ps. | 294,789 | 366,210 | 661,000 | ||||||||
|
Percentage Acquired
|
100 | % | 98.92 | % | ||||||||
|
Shareholders’ equity acquired
|
294,789 | 362,274 | 657,063 | |||||||||
|
Adjusts to Banking GAAP
|
(3,693 | ) | (1,253 | ) | (4,945 | ) | ||||||
|
Loans
|
(8,162 | ) | (9,215 | ) | (17,376 | ) | ||||||
|
Interest suspend
|
(24 | ) | (95 | ) | (120 | ) | ||||||
|
Loans origination fees and costs
|
(1,000 | ) | (634 | ) | (1,634 | ) | ||||||
|
Long term assets
|
(627 | ) | 5,528 | 4,900 | ||||||||
|
Foreclosed assets
|
941 | (942 | ) | (1 | ) | |||||||
|
Warranties
|
– | 1,118 | 1,118 | |||||||||
|
Deferred income tax
|
2,733 | – | 2,733 | |||||||||
|
Income tax deferred on
homogenization adjustment
|
3,023 | 2,686 | 5,709 | |||||||||
|
Fair value
|
(265 | ) | 288 | 23 | ||||||||
|
Deferred charges
|
(313 | ) | – | (313 | ) | |||||||
|
Shareholders’ equity
|
291,095 | 361,022 | 652,117 | |||||||||
|
Purchase Price
|
811,141 | 973,318 | 1,784,459 | |||||||||
|
Goodwill
|
Ps. | 520,045 | 612,297 | 1,132,342 | ||||||||
Goodwill, net as of December 31, 2014 and 2013 was as follows:
|
December 31, 2014
|
December 31, 2013
|
|||||||
|
BAC Credomatic GEFC Inc.
|
Ps. | 2,282,733 | Ps. | 1,888,216 | ||||
|
Megabanco
|
441,112 | 465,905 | ||||||
|
Banco Popular and Banco Comercial AV Villas
|
367,204 | 387,977 | ||||||
|
Banco Aliadas and Banco Union
|
21,067 | 22,724 | ||||||
|
Intrex acquisition
|
120,202 | 124,403 | ||||||
|
Banco BAC de Panama
|
748,578 | 612,297 | ||||||
|
Proyectos de Infraestructura and Hoteles Estelar’s acquisitions
|
7,230 | 7,517 | ||||||
|
AFP Horizonte S.A.
|
524,059 | 540,126 | ||||||
|
Grupo Financiero Reformador
|
636,978 | 520,045 | ||||||
|
Corficolombiana S.A.
|
9,710 | 9,956 | ||||||
|
Banco de Bogotá S.A.
|
379,807 | 301,222 | ||||||
|
Banco de Occidente S.A.
|
88,014 | 87,634 | ||||||
|
Total goodwill, net
|
Ps. | 5,626,694 | Ps. | 4,968,021 | ||||
F-47
GRUPO AVAL ACCIONES Y VALORES S.A. AND ITS SUBSIDIARIES
NOTES TO THE CONSOLIDATED FINANCIAL STATEMENTS
FOR THE YEARS ENDED DECEMBER 31, 2014, 2013 AND 2012
(
Stated in millions of Colombian pesos and U.S. dollars)
Goodwill attributable to Grupo Aval’s shareholders was Ps. 4,133,325 and Ps. 3,617,427 for the years ended December 31, 2014 and 2013, respectively.
The movements in goodwill were as follows:
|
December 31,
|
December 31,
|
December 31,
|
||||||||||
|
2014
|
2013
|
2012
|
||||||||||
|
Balance at beginning of period
|
Ps. | 4,968,021 | Ps. | 2,842,533 | Ps. | 3,110,745 | ||||||
|
Goodwill acquired in business combination
(1)
|
– | – | 8,479 | |||||||||
|
Banco BAC de Panama
(2)
|
5,935 | 612,297 | – | |||||||||
|
BAC Credomatic CEFC Inc.
|
16,074 | – | – | |||||||||
|
AFP Horizonte S.A.
|
– | 547,672 | – | |||||||||
|
Grupo Financiero Reformador
|
6,029 | 520,045 | – | |||||||||
|
Corficolombiana S.A.
|
– | 9,956 | – | |||||||||
|
Banco de Bogotá S.A.
(3)
|
85,888 | 304,127 | – | |||||||||
|
Banco de Occidente S.A.
(3)
|
1,784 | 88,822 | – | |||||||||
|
Effect of changes in foreign exchange rate
|
709,614 | 156,092 | (146,813 | ) | ||||||||
|
Amortization expenses
|
(166,651 | ) | (113,714 | ) | (93,109 | ) | ||||||
|
Other related expenses
|
– | – | (36,769 | ) | ||||||||
|
Balance at end of period
|
Ps. | 5,626,694 | Ps. | 4,968,021 | Ps. | 2,842,533 | ||||||
|
(1)
|
In 2012, goodwill recorded of Ps. 8,479 was associated to an adjustment identified in the acquisition of Compañìa Hotelera de Cartagena de Indias by Hoteles Estelar.
|
|
(2)
|
During the first quarter of 2014, a subsidiary of the Company acquired 0.89% of the non-controlling interest in Banco BAC of Panama.
|
|
(3)
|
During the six month period ended June 30, 2014, Grupo Aval acquired 624,731 and 119,142 shares, of Banco de Bogotá and Banco de Occidente, respectively, through the Colombian market stock exchange. These acquisitions totaled Ps. 47,141 and generated a goodwill of Ps. 21,184.
|
Goodwill is allocated among several business lines which are subject to impairment tests in which Grupo Aval compares its book value (including the assigned goodwill) to technical studies prepared annually by independent experts. At the end of each reporting period or when there is any indication of impairment (i.e. a reduction in its recoverable amount to below its carrying amount) any impairment is written off. As of December 31, 2014, 2013 and 2012, no impairment was recognized.
GRUPO AVAL ACCIONES Y VALORES S.A. AND ITS SUBSIDIARIES
NOTES TO THE CONSOLIDATED FINANCIAL STATEMENTS
FOR THE YEARS ENDED DECEMBER 31, 2014, 2013 AND 2012
(
Stated in millions of Colombian pesos and U.S. dollars)
|
(13)
|
OTHER ASSETS, NET
|
Other assets as of December 31, 2014 and 2013 consisted of the following:
|
December 31,
|
December 31,
|
|||||||
|
2014
|
2013
|
|||||||
|
Assets held for sale
|
Ps. | 223,473 | Ps. | 253,551 | ||||
|
Value added tax deductible and withholding taxes
|
123,511 | 99,400 | ||||||
|
Restricted deposits
(1)
|
559,702 | 181,942 | ||||||
|
Investment in trust
|
310,541 | 274,555 | ||||||
|
Prepaid taxes
|
106,380 | 49,680 | ||||||
|
Assets available for lease contracts
|
254,768 | 375,089 | ||||||
|
Consortium and temporal unions
|
23,437 | 15,606 | ||||||
|
Industry and commerce tax
|
9,016 | 10,798 | ||||||
|
Other
|
149,742 | 127,646 | ||||||
|
Total
|
1,760,570 | 1,388,267 | ||||||
|
Less: Allowance for impairment
|
(62,263 | ) | (64,335 | ) | ||||
|
Total other assets, net
|
Ps. | 1,698,307 | Ps. | 1,323,932 | ||||
|
(1)
|
The difference is a mainly driven by Banco de Bogotá’s increase in derivative operations, which require restricted, deposits as collateral. Some of these deposits are dollar denominated and their balance has increased with the US dollar Exchange rate.
|
|
(14)
|
REAPPRAISAL OF ASSETS
|
The following table describes reappraisals of assets as of December 31, 2014 and 2013
|
December 31,
|
December 31,
|
|||||||
|
2014
|
2013
|
|||||||
|
Reappraisal of property plant and equipment
|
Ps. | 2,706.044 | Ps. | 2,582,161 | ||||
|
Revaluation of investments
|
1,142,892 | 820,754 | ||||||
|
Reappraisal of other assets
|
11,090 | 10,782 | ||||||
|
Total reappraisal of assets
|
3,860,026 | 3,413,697 | ||||||
|
Less: Non-controlling interests
|
(2,215,894 | ) | (1,959,146 | ) | ||||
|
Total equity revaluations
|
Ps. | 1,644,132 | Ps. | 1,454,551 | ||||
The amount of reappraisal of assets attributable to non-controlling interests reflects third-party participation in Banco de Bogota and its subsidiaries (including Corficolombiana and its subsidiaries), Banco de Occidente and its subsidiaries, Banco Popular and its subsidiaries and Banco Comercial AV Villas.
|
(15)
|
TIME DEPOSITS
|
Time deposits (classified per maturity at the issuance date) as of December 31, 2014 and 2013 were as follows:
|
December 31,
|
December 31,
|
|||||||
|
2014
|
2013
|
|||||||
|
Up to 3 months
|
Ps. | 13,542,192 | Ps. | 10,006,714 | ||||
|
From 3 to 6 months
|
5,726,877 | 5,632,268 | ||||||
|
From 6 to 12 months
|
8,318,012 | 6,351,315 | ||||||
|
More than 12 months
|
9,456,373 | 6,857,102 | ||||||
|
Time deposits less than U.S.$100,000
|
4,806,155 | 3,891,851 | ||||||
|
Total certificates of time deposits
|
Ps. | 41,858,609 | Ps. | 32,739,250 | ||||
GRUPO AVAL ACCIONES Y VALORES S.A. AND ITS SUBSIDIARIES
NOTES TO THE CONSOLIDATED FINANCIAL STATEMENTS
FOR THE YEARS ENDED DECEMBER 31, 2014, 2013 AND 2012
(
Stated in millions of Colombian pesos and U.S. dollars)
|
(16)
|
INTERBANK BORROWINGS AND OVERNIGHT FUNDS
|
Interbank borrowings and overnight funds as of December 31, 2014 and 2013 were as follows:
|
December 31,
|
December 31,
|
|||||||
|
2014
|
2013
|
|||||||
|
Ordinary interbank funds purchased
|
Ps. | 772,981 | Ps. | 663,572 | ||||
|
Commitments of investment in simultaneous operations
|
2,273,519 | 2,446,323 | ||||||
|
Commitments of closed repo operations
|
1,227,916 | 1,936,496 | ||||||
|
Commitments of open repo operations
|
315,078 | 77,206 | ||||||
|
Total interbank and overnight funds (*)
|
Ps. | 4,589,494 | Ps. | 5,123,597 | ||||
|
(*)
|
Maturities of interbank borrowings and other overnight funds as of December 31, 2014 are less than one year.
|
|
(17)
|
BORROWINGS FROM BANKS AND OTHERS
|
Borrowings from banks and others as of December 31, 2014 and 2013 were as follows:
|
Interest rates
|
December 31,
2014 |
December 31,
2013 |
|||||||
|
Banco de Comercio Exterior - “BANCOLDEX”
|
0.0%
to14.7%
|
Ps. | 814,345 | Ps. | 687,879 | ||||
|
Fondo para el Financiamiento del Sector Agropecuario - “FINAGRO”
|
0.1%
to 12.6%
|
389,296 | 481,588 | ||||||
|
Financiera de Desarrollo Territorial “FINDETER
”
|
0.0%
to
8.6%
|
898,917 | 932,943 | ||||||
|
Foreign Banks (*)
|
0.36%
to 15.0%
|
11,476,604 | 9,001,402 | ||||||
|
Others
|
0.0% to 18.0%
|
975,951 | 850,285 | ||||||
|
Total borrowings from banks and others
|
Ps. | 14,555,113 | Ps. | 11,954,097 | |||||
|
(*)
|
Includes a U.S.$540 million three-year term loan between Leasing Bogota Panama and Deutsche Bank, backed with Ps. 1,737,192 (U.S.$726.1 million) available for sale debt securities as collateral (see note 4).
|
The Colombian Government has established programs to promote the development of specific sectors of the economy, including foreign
trade, agriculture, tourism and many other industries. These programs are managed by the Colombian Central Bank and various government entities such as
Banco de Comercio Exterior
(“Bancoldex”),
Fondo para el Financiamiento del Sector Agropecuario
(“FINAGRO”) and
Financiera de Desarrollo Territorial
(“FINDETER”).
Maturities of borrowings from banks and others as of December 31, 2014 were as follows:
|
2015
|
5,815,589 | |||
|
2016
|
1,825,078 | |||
|
2017
|
2,896,763 | |||
|
2018
|
1,127,259 | |||
|
2019 and thereafter
|
2,890,424 | |||
|
Total borrowings from banks and others
|
Ps. | 14,555,113 |
F-50
GRUPO AVAL ACCIONES Y VALORES S.A. AND ITS SUBSIDIARIES
NOTES TO THE CONSOLIDATED FINANCIAL STATEMENTS
FOR THE YEARS ENDED DECEMBER 31, 2014, 2013 AND 2012
(
Stated in millions of Colombian pesos and U.S. dollars)
|
(18)
|
ACCOUNTS PAYABLE
|
Accounts payable as of December 31, 2014 and 2013 were as follows:
|
December 31, 2014
|
December 31, 2013
|
|||||||
|
Dividends payable (See note 23)
|
Ps. | 535,884 | Ps. | 472,127 | ||||
|
Derivatives payable
|
481,494 | 200,247 | ||||||
|
Taxes (1)
|
194,311 | 437,781 | ||||||
|
Suppliers
|
535,555 | 390,598 | ||||||
|
Insurance (2)
|
204,717 | 309,460 | ||||||
|
Withholdings and labor contributions
|
252,191 | 278.268 | ||||||
|
Collections for third parties
|
152,823 | 115,087 | ||||||
|
Compensation payable to Grupo Aval related companies (3)
|
103,564 | 109,939 | ||||||
|
Cedulas cafeteras
|
16,159 | 99,740 | ||||||
|
Pending checks
|
30,781 | 83,363 | ||||||
|
Contribution on financial transactions
|
23,550 | 45,081 | ||||||
|
Commissions and fees
|
55,873 | 36,181 | ||||||
|
Patrimonio autonomo Helm Fiduciaria
|
25,352 | 33,673 | ||||||
|
Principal and interest bonds
|
28,543 | 28,522 | ||||||
|
Time deposits due
|
24,106 | 28,177 | ||||||
|
Pension contributions
|
30,310 | 18,473 | ||||||
|
Contributions and affiliations
|
17,368 | 10,540 | ||||||
|
Branch account payable
|
11,187 | 9,687 | ||||||
|
National VISA receipts
|
18,660 | 5,090 | ||||||
|
Rents
|
6,139 | 4,999 | ||||||
|
Principal and interest bonds
|
7,368 | 7,316 | ||||||
|
Other
|
78,059 | 143,326 | ||||||
|
Total accounts payable
|
Ps. | 2,833,994 | Ps. | 2,867,675 | ||||
|
(1)
|
The variation between 2014 and 2013, is explained by the last payment of the equity tax.
|
|
(2)
|
Includes BAC Credomatic insurance premium related to loans granted to its clients.
|
|
(3)
|
Relates to items from ACH processes and other Aval transactions.
|
|
(19)
|
OTHER LIABILITIES
|
Other liabilities as of December 31, 2014 and 2013 were as follows:
|
December 31,
|
December 31,
|
|||||||
|
2014
|
2013
|
|||||||
|
Contribution for future works – Epiandes (a)
|
Ps. | 1,103,069 | Ps. | 732,265 | ||||
|
Pension obligations (b)
|
652,352 | 308,513 | ||||||
|
Deferred income tax (c)
|
288,727 | 297,526 | ||||||
|
Unallocated payments from customers
|
272,061 | 277,937 | ||||||
|
Consolidated severance and interest on severance
|
123,169 | 118,433 | ||||||
|
Deferred income
|
16,239 | 101,246 | ||||||
|
Other labor benefits
|
117,677 | 89,787 | ||||||
|
Accrued vacations
|
94,142 | 82,851 | ||||||
|
Unearned interest (d)
|
55,424 | 54,976 | ||||||
|
Inactive deposits
|
27,045 | 25,431 | ||||||
|
Consortium and temporal unions
|
20,703 | 12,592 | ||||||
|
Interest
|
11,599 | 10,661 | ||||||
|
Income received
|
63,599 | 58,899 | ||||||
|
Transport, freights and carries
|
14,975 | 15,792 | ||||||
|
Rent
|
11,153 | 10,788 | ||||||
|
Others
|
127,324 | 23,969 | ||||||
|
Total other liabilities
|
Ps. | 3,022,613 | Ps. | 2,221,666 | ||||
|
(a)
|
Income received in advance from customers for concessions that will be developed in the next years.
|
GRUPO AVAL ACCIONES Y VALORES S.A. AND ITS SUBSIDIARIES
NOTES TO THE CONSOLIDATED FINANCIAL STATEMENTS
FOR THE YEARS ENDED DECEMBER 31, 2014, 2013 AND 2012
(
Stated in millions of Colombian pesos and U.S. dollars)
The following table shows Grupo Aval’s banking subsidiaries pension obligations as of December 31, 2014 and 2011:
|
Pension liability
|
Deferred cost
|
Net pension liability
|
||||||||||
|
Balance at December 31, 2011
|
Ps. | 366,920 | Ps. | (67,926 | ) | Ps. | 298,995 | |||||
|
Adjustment per actuarial valuation
|
36,650 | (36,650 | ) | – | ||||||||
|
Benefits paid
|
(33,622 | ) | – | (33,622 | ) | |||||||
|
Pension expense
|
– | 41,405 | 41,405 | |||||||||
|
Balance at December 31, 2012
|
Ps. | 369,948 | Ps. | (63,171 | ) | Ps. | 306,778 | |||||
|
Adjustment per actuarial valuation
|
32,890 | (32,890 | ) | – | ||||||||
|
Benefits paid
|
(32,975 | ) | – | (32,975 | ) | |||||||
|
Pension expense
|
237 | 34,473 | 34,710 | |||||||||
|
Balance at December 31, 2013
|
Ps. | 370,100 | (61,588 | ) | 308,513 | |||||||
|
Adjustment per actuarial valuation
|
32,734 | (32,734 | ) | – | ||||||||
|
Benefits paid
|
(32,953 | ) | – | (32,953 | ) | |||||||
|
Pension expense
|
157 | 36,366 | 36,523 | |||||||||
|
Balance at December 31, 2014
|
Ps. | 370,038 | (57,956 | ) | 312,082 | |||||||
In compliance with Colombian law, the present value of the expected pension payments was determined on the basis of actuarial calculations. The significant assumptions used in the actuarial calculations were the following:
|
December 31,
|
December 31,
|
December 31,
|
|||||||||
|
2014
|
2013
|
2012
|
|||||||||
|
Discount rate
|
4.8%
|
4.8%
|
5.6%
|
to
|
6.4%
|
||||||
|
Future pension increase
|
3.0%
|
to
|
2.4%
|
3.0%
|
to
|
3.3%
|
3.0%
|
to
|
3.2%
|
||
|
(b)
|
Deferred income tax liability relates to the following temporally differences:
|
|
December 31,
|
December 31,
|
|||||||
|
2014
|
2013
|
|||||||
|
Deferred income tax liabilities
|
||||||||
|
Unrealized gains on investment securities
|
Ps. | 57,245 | Ps. | 36,450 | ||||
|
Property, plant and equipment
|
41, 505 | 32,083 | ||||||
|
Bankers` acceptances, spot transactions and derivatives
|
411,879 | 113,969 | ||||||
|
Deferred charges
|
40,362 | 41,787 | ||||||
|
Pension plan
|
18,785 | 19,946 | ||||||
|
Allowance for loan losses
|
26,325 | 5,062 | ||||||
|
Other
|
56,251 | 48,230 | ||||||
|
Total deferred income tax liabilities
|
Ps. | 652,352 | Ps. | 297,526 | ||||
|
(c)
|
Unearned interest primarily consists of prepayments of interest by customers.
|
|
(20)
|
BONDS
|
Companies are authorized by the Superintendency of Finance of Colombia to issue secured and unsecured bonds. As of December 31, 2014 and 2013, the majority of the bonds issued by Grupo Aval and its subsidiaries are unsecured and are solely obligations of each issuer.
GRUPO AVAL ACCIONES Y VALORES S.A. AND ITS SUBSIDIARIES
NOTES TO THE CONSOLIDATED FINANCIAL STATEMENTS
FOR THE YEARS ENDED DECEMBER 31, 2014, 2013 AND 2012
(
Stated in millions of Colombian pesos and U.S. dollars)
As of December 31, 2014 and 2013, bonds issued were as follows:
|
Issuer
|
Issuance date
|
December 31, 2014
|
December 31, 2013
|
Maturity
|
Interest Rate
|
|||||
|
BAC Honduras
|
dec-12
|
13,290
|
11,179
|
dec-15
|
14.08%
|
|||||
|
jan-13
|
3,473
|
2,923
|
dec-15
|
14.08%
|
||||||
|
feb-13
|
17
|
14
|
dec-15
|
14.08%
|
||||||
|
mar-13
|
3,087
|
2,597
|
dec-15
|
14.08%
|
||||||
|
apr-13
|
8,901
|
7,485
|
dec-15
|
14.08%
|
||||||
|
may-13
|
25,270
|
20,400
|
dec-15 to may-16
|
6.00% to 14.08%
|
||||||
|
jun-13
|
9,151
|
9,398
|
dec-15 to may-16
|
6.00% to 14.08%
|
||||||
|
jul-13
|
12,629
|
11,400
|
dec-15 to jul-18
|
6.00% to 14.08%
|
||||||
|
aug-13
|
7,653
|
6,279
|
dec-15 to aug-16
|
5.50% to 14.08%
|
||||||
|
sep-13
|
778
|
626
|
aug-16
|
5.50%
|
||||||
|
oct-13
|
644
|
519
|
aug-16
|
5.50%
|
||||||
|
nov-13
|
1,280
|
1,031
|
aug-16
|
5.50%
|
||||||
|
dec-13
|
9,206
|
7,418
|
dec-15 to dec-16
|
5.50% to 14.08%
|
||||||
|
jan-14
|
5,294
|
–
|
dec-16
|
5.50%
|
||||||
|
mar-14
|
1,367
|
–
|
dec-15
|
14.08%
|
||||||
|
may-14
|
6,663
|
–
|
may-17
|
5.50%
|
||||||
|
jun-14
|
7,692
|
–
|
may-17
|
5.50%
|
||||||
|
sep-14
|
2,392
|
–
|
may-16
|
6.00%
|
||||||
|
oct-14
|
14,169
|
–
|
oct-17
|
12.00%
|
||||||
|
132,956
|
81,269
|
|||||||||
|
BAC Banco el Salvador
|
feb-09
|
–
|
28,902
|
feb-14
|
5.56%
|
|||||
|
dec-11
|
9,570
|
7,707
|
dec-16
|
4,25%
|
||||||
|
feb-12
|
4,785
|
3,854
|
feb-17
|
4.25%
|
||||||
|
mar-12
|
9,450
|
7,707
|
mar-17
|
4.25%
|
||||||
|
may-12
|
13,989
|
11,267
|
may-17
|
4.25%
|
||||||
|
dec-12
|
-
|
19,268
|
dec-14
|
5.00%
|
||||||
|
jan-13
|
11,962
|
9,634
|
jan-15
|
5.00%
|
||||||
|
feb-13
|
71,774
|
57,805
|
feb-20
|
5.50%
|
||||||
|
dec-13
|
-
|
14,722
|
jan-14
|
4.00%
|
||||||
|
may-14
|
47,849
|
–
|
may-19
|
5.80%
|
||||||
|
jun-14
|
23,925
|
–
|
jul-14 to jun-19
|
4.00% to 5.80%
|
||||||
|
jul-14
|
47,849
|
–
|
jul-19
|
5.80%
|
||||||
|
oct-14
|
47,849
|
–
|
oct-19
|
5.80%
|
||||||
|
dec-14
|
39,269
|
–
|
jan-15
|
4.25% to 5.00%
|
||||||
|
328,271
|
160,866
|
|||||||||
|
Banco de Bogota S.A.
|
apr-08 (1)
|
216,745
|
213,801
|
apr-15
|
ICP + 7.00% to UVR + 7.00% to DTF + 3.00%
|
|||||
|
feb-10 (1)
|
215,808
|
211,789
|
feb-17 to feb-20
|
ICP + 5.33%
ICP + 5.45%
UVR + 5.29%
UVR + 5.45%.
|
||||||
|
dec-11 (2)
|
1,435,476
|
1,154,171
|
jan-17
|
5.00%
|
||||||
|
feb-13 (2)
|
1,099,335
|
880,561
|
feb-23
|
5.37%
|
||||||
|
2,967,364
|
2,460,322
|
|||||||||
|
Banco de Occidente S.A.
|
aug-08
|
73,926
|
73,926
|
aug-14 to aug-18
|
ICP + 6.60%
to ICP + 7.00%
|
|||||
|
aug-07
|
–
|
80,000
|
sep-14
|
IPC + 5.90%
|
||||||
|
jun-07
|
–
|
53,841
|
jun-14
|
ICP + 6.60%
|
||||||
|
mar-09
|
124,450
|
174,536
|
mar-14 to mar 19
|
ICP + 5.00%
to ICP + 6.00%
|
||||||
|
nov-10
|
140,500
|
140,500
|
nov 15 to nov 18
|
ICP + 2.72%
ICP + 3.15%
DTF + 1.35%
IBR + 1.42%
|
||||||
|
mar-11
|
39,300
|
400,000
|
mar-14 to mar-16
|
ICP + 2.49%
ICP + 3.05%
IBR + 1.50%
|
||||||
|
sep-11
|
238,240
|
247,120
|
sep-14 to sep-21
|
6.65% EA
7.25% EA
ICP + 4.0%
ICP + 4.20%
ICP + 4.50%
IBR + 1.80%
|
||||||
|
feb-12
|
200,000
|
200,000
|
feb-19 to feb-22
|
ICP + 4.34%
ICP + 4.65%
|
GRUPO AVAL ACCIONES Y VALORES S.A. AND ITS SUBSIDIARIES
NOTES TO THE CONSOLIDATED FINANCIAL STATEMENTS
FOR THE YEARS ENDED DECEMBER 31, 2014, 2013 AND 2012
(
Stated in millions of Colombian pesos and U.S. dollars)
|
Issuer
|
Issuance date
|
December 31, 2014
|
December 31, 2013
|
Maturity
|
Interest Rate
|
|||||
|
aug-12
|
300,000
|
300,000
|
aug-15 to aug-27
|
ICP + 4.10%
ICP + 4.27%
DTF + 1.67%
|
||||||
|
jan-13
|
200,000
|
200,000
|
jan-25
|
ICP + 3.58%
|
||||||
|
may-13
|
253,390
|
253,390
|
may-16 to may-28
|
ICP + 2.90%
ICP + 3.10%
IBR + 1.30%
|
||||||
|
nov-13
|
350,000
|
350,000
|
nov-15 to nov-20
|
IBR + 2.08%
ICP + 4.35%
ICP + 3.89%
|
||||||
|
may-14
|
350,000
|
–
|
may-17 to may-24
|
IBR + 1.39%
ICP + 3.70%
ICP + 4.00%
|
||||||
|
2,269,806
|
2,473,313
|
|||||||||
|
Banco Popular S.A.
|
jul-08
|
100,000
|
100,000
|
jul-15
|
ICP + 7.00%
|
|||||
|
feb-10
|
41,836
|
41,836
|
feb-14 to feb-15
|
ICP + 3.90%
|
||||||
|
aug-10
|
156,276
|
156,276
|
feb-13 to aug-15
|
ICP + 3.68%
|
||||||
|
jan-12
|
222,326
|
316,559
|
jan-13 to jan-17
|
DTF + 1.82%
ICP + 3.90%
|
||||||
|
sep-12
|
319,080
|
400,000
|
sep-14 to sep-17
|
6.30%
6.39%
ICP + 3.69%
|
||||||
|
feb-13
|
399,500
|
399,500
|
feb-15 to feb-20
|
IBR + 1.33%
ICP + 3.14%
|
||||||
|
oct-13
|
400,000
|
400,000
|
apr-15 to oct-18
|
ICP + 3.10%
ICP + 3,89%
IBR + 2.09%
|
||||||
|
may-14
|
335,500
|
–
|
may-16 to may-17
|
IBR + 1.26%
IBR + 1.35%
|
||||||
|
1,974,518
|
1,814,171
|
|||||||||
|
Epiandes
|
jul-07
|
–
|
29,150
|
jul-14
|
ICP + 5.70%
|
|||||
|
–
|
29,150
|
|||||||||
|
BAC Credomatic Guatemala
|
oct-12
|
–
|
1,106
|
may-14
|
8.25%
|
|||||
|
jan-13
|
–
|
24,268
|
jul-14
|
5.84% to 8.50%
|
||||||
|
feb-13
|
–
|
19,000
|
feb-14
|
5.84% to 8.50%
|
||||||
|
mar-13
|
–
|
13,163
|
mar-14
|
5.84% to 8.50%
|
||||||
|
apr-13
|
–
|
16,408
|
may 14
|
5.84% to 8.50%
|
||||||
|
may-13
|
–
|
24,489
|
jun-14
|
5.84% to 8.25%
|
||||||
|
jun-13
|
–
|
25,830
|
dec-14
|
5.84% to 8.25%
|
||||||
|
jul-13
|
1,970
|
26,735
|
jul-14 to jan-15
|
4.75% to 8.25%
|
||||||
|
aug-13
|
–
|
24,700
|
sep-14
|
4.75% to 8.25%
|
||||||
|
sep-13
|
–
|
13,595
|
oct-14
|
4.65% to 8.25%
|
||||||
|
oct-13
|
5,354
|
19,233
|
sep-14 to jun-15
|
4.75% to 8.25%
|
||||||
|
nov-13
|
–
|
16,897
|
dec-14
|
4.65% to 8.25%
|
||||||
|
dec-13
|
–
|
13,183
|
dec-14
|
5.84% to 8.25%
|
||||||
|
jan-14
|
27,484
|
–
|
feb-15
|
5.84% to 8.25%
|
||||||
|
feb-14
|
34,717
|
–
|
mar-15
|
5.84% to 8.25%
|
||||||
|
mar-14
|
16,874
|
–
|
mar-15
|
5.84% to 8.25%
|
||||||
|
apr-14
|
26,027
|
–
|
jun-15
|
5.84% to 8.25%
|
||||||
|
may-14
|
31,665
|
–
|
jun-15
|
5.84% to 8.25%
|
||||||
|
jun-14
|
26,751
|
–
|
jul-15
|
5.84% to 8.50%
|
||||||
|
jul-14
|
34,184
|
–
|
jul-15
|
4.65% to 8.25%
|
||||||
|
aug-14
|
39,433
|
–
|
sep-15
|
4.75% to 8.50%
|
||||||
|
sep-14
|
15,674
|
–
|
sep-15
|
4.89% to 8.25%
|
||||||
|
oct-14
|
30,228
|
–
|
sep-15
|
4.75% to 8.25%
|
||||||
|
nov-14
|
22,661
|
–
|
nov-15
|
5.50% to 8.50%
|
||||||
|
dec-14
|
23.818
|
–
|
dec-15 to jun-16
|
4.89% to 8.25%
|
||||||
|
336,840
|
238,607
|
|||||||||
|
BAC Nicaragua (5)
|
oct-13
|
13,159
|
19,268
|
oct-14 to oct-15
|
4.50% to 5.25%
|
|||||
|
nov-13
|
8,524
|
780
|
nov-16
|
5.10%
|
||||||
|
oct-14
|
10,766
|
–
|
oct-15
|
5.00%
|
||||||
|
dec-14
|
478
|
–
|
nov-17
|
5.25%
|
||||||
|
32,927
|
20,048
|
GRUPO AVAL ACCIONES Y VALORES S.A. AND ITS SUBSIDIARIES
NOTES TO THE CONSOLIDATED FINANCIAL STATEMENTS
FOR THE YEARS ENDED DECEMBER 31, 2014, 2013 AND 2012
(
Stated in millions of Colombian pesos and U.S. dollars)
|
Issuer
|
Issuance date
|
December 31, 2014
|
December 31, 2013
|
Maturity
|
Interest Rate
|
|||||
|
BAC Panama (5)
|
oct-11
|
12,321
|
9,924
|
oct-21
|
5.25%
|
|||||
|
mar-12
|
3,589
|
2,890
|
mar-20
|
4.75%
|
||||||
|
may-13
|
-
|
38,537
|
may-16
|
3.75%
|
||||||
|
15,910
|
51,351
|
|||||||||
|
Grupo Aval Acciones y Valores S.A.
|
feb-12
|
100,000
|
100,000
|
oct-15
|
ICP + 3.37%
|
|||||
|
sep-12
|
518,750
|
624,249
|
dec-14 to dec-24
|
ICP + 3.69% to 5.20%
|
||||||
|
618,750
|
724,249
|
|||||||||
|
Grupo Aval Limited (3)
|
feb-12
|
1,425,906
|
1,145,785
|
feb-17
|
5.25%
|
|||||
|
sep-12
|
2,356,660
|
1,899,521
|
sep-22
|
4.75%
|
||||||
|
3,782,566
|
3,045,306
|
|||||||||
|
Industrias Lenher S.A. (4)
|
jun-00
|
1,053
|
1,053
|
jan-17
|
DTF
|
|||||
|
1,053
|
1,053
|
|||||||||
|
Proyectos de Infraestructura S.A.
|
may-09
|
80,000
|
80,000
|
may-16 to may-19
|
ICP + 6.59% to
ICP + 6.90%
|
|||||
|
80,000
|
80,000
|
|||||||||
|
$
|
12,540,961
|
$
|
11,179,705
|
|
(1)
|
Subordinated Bonds.
|
|
(2)
|
During February 2013, Banco de Bogota S.A. issued a ten year bond of U.S.$500 million (Ps. 957,634 as of December 31, 2013) with a coupon of 5.375%, at 100% of its nominal value, and during December 2011, Banco de Bogota S.A. issued a five year bond of U.S.$600 million (Ps. 1,060,938 as of December 31, 2012) in the international market under rule 144-A/Reg S with a coupon of 5%, at 98.894% of its nominal value.
|
|
(3)
|
On January 23, 2012, Grupo Aval through its subsidiary Grupo Aval Limited, issued a five year bond of U.S.$600 million (Ps. 1,060,938 as of December 31, 2012) in the international market under rule 144-A/Reg S with a coupon of 5.25% at 99.458% of its nominal value. In addition, on September 19, 2012, Grupo Aval issued a ten year bond of U.S.$1,000 million (Ps. 1,736,402 as of December 31, 2012) in the international market under rule 144A/Reg S with a coupon of 4.75% at 99.607% of its nominal value.
|
|
(4)
|
As part of its restructuring process, Industrias Lenher S.A. issued convertible bonds for Ps. 13,464 in April 2002. These bonds were offered to Lenher’s creditors to cover all or part of the accounts receivable that they had with the company. All bondholders had the right to exchange their bonds into shares at any time. The amount outstanding of Ps. 1,053 reflects the portion of the issuance that has not yet been converted.
|
|
(5)
|
For more detail, during December, 2013 see note 12 (b) BBVA Panama and Grupo Financiero Reformador acquisition.
|
|
(6)
|
Leasing Corficolombiana’s issuance of securities on 2009 was entirely redeemed on 2013.
|
Interest expenses for bonds for 2014, 2013 and 2012 amounted to Ps. 658,163, Ps. 621,126 and Ps. 543,689, respectively.
The abbreviations used in the table above were the following:
“IBR” refers to the Colombian interbanking short-term borrowing rate.
“ICP” Consumer Price Index, is a statistical estimate that measures changes in the price level of a market basket of consumer goods and services purchased by households.
“DTF” refers to the weighted average interest rates of uptake Time Deposits Certificate “CDT” 90 days offered by the Colombian financial system.
“EA” Effective Annual Rate
The scheduled maturities of bonds as of December 31, 2014 were as follows:
|
2015
|
Ps. | 1,655,275 | ||
|
2016
|
837,373 | |||
|
2017
|
4,168,018 | |||
|
2018
|
331,767 | |||
|
2019 and thereafter
|
5,548,528 | |||
|
Total bonds
|
Ps. | 12,540,961 |
GRUPO AVAL ACCIONES Y VALORES S.A. AND ITS SUBSIDIARIES
NOTES TO THE CONSOLIDATED FINANCIAL STATEMENTS
FOR THE YEARS ENDED DECEMBER 31, 2014, 2013 AND 2012
(
Stated in millions of Colombian pesos and U.S. dollars)
|
(21)
|
ACCRUED EXPENSES AND OTHER LIABILITIES
|
Accrued expenses and other liabilities as of December 31, 2014 and 2013 consisted of the following:
|
December 31,
|
December 31,
|
|||||||||||
|
2014
|
2013
|
|||||||||||
|
Income tax payable
|
Ps. | 155,146 | Ps. | 188,642 | ||||||||
|
Contingencies, fines and other
(*)
|
85,007 | 83,421 | ||||||||||
|
Loyalty programs
|
72,302 | 51,093 | ||||||||||
|
Trade tax and other
|
46,929 | 46,618 | ||||||||||
|
Pension contingencies
|
30,987 | 31,250 | ||||||||||
|
Insurance on deposits
|
47,051 | 25,716 | ||||||||||
|
Labor obligations
|
25,996 | . | 20,351 | |||||||||
|
Provisions
|
7,007 | 19,962 | ||||||||||
|
Contributions and affiliations
|
12,053 | 6,719 | ||||||||||
|
Other
|
115,736 | 119,482 | ||||||||||
|
Total accrued expenses and other liabilities
|
Ps. | 598,214 | Ps. | 593,254 | ||||||||
|
(*)
|
Includes disputes and litigations which are considered probable (50% or higher) and for which the amount can be reasonably estimated. Additionally, a contingent liability for disputes or litigations must be recorded in the balance sheet when a court takes a position against Grupo Aval or any of its subsidiaries. The number for December 31, 2014 includes a $24,815 litigation provision that was classified as probable, regarding Compañia Hotelera de Cartagena de Indias S.A., a subsidiary of Corficolombiana.
|
Income tax
On December 26, 2012 Colombian Government approved a tax reform. As of December 31, 2012 the income tax rate in Colombia was 33%. According to an amendment of the 1607 tax law issued in December 2012, starting in 2013 the income tax rate will decrease to 25%.
Also, in December 2012, another change to the income tax law in Colombia was issued regarding the income tax rate for occasional gains, this tax rate decreased from 33% in 2012 to 10% in 2013 onwards.
In addition, a new income tax for equality (CREE, for its acronym in Spanish) was created. The rate for this new tax will be 9% for 2013, 2014 and 2015, and will decrease to 8% in 2016. Except for some special deductions, and also for offset of excess losses of presumptive income and benefits not applicable to CREE, the tax base will be the same tax base as the net income tax. Non-profit entities and businesses that are classified as free trade zone users are exempt of the CREE income tax.
Law 1607 of 2012, decreased income taxes from 33% to 25% and created a CREE tax of 9% for the years 2013, 2014 and 2015 going down to 8% in 2016.
Law 1739 of 2014 imposed a CREE surtax of 5% in 2015 taking it to 14%; 6% in 2016 taking it to 15%; 8% in 2017 taking it to 17% and 9% in 2018 taking it to 18%.
According to the laws described above, total rates of income tax plus CREE will be 34% in 2014, 39% in 2015, 40% in 2016, 42% in 2017 and 43% in 2018.
For BAC Credomatic and its subsidiaries, which operate in Central America, the following are the tax jurisdictions in which the Company and its affiliates operate, and the fiscal year closest to inspection: United States - 2010, Mexico - 2008, Guatemala - 2009, El Salvador - 2011, Honduras - 2008, Nicaragua - 2010, Costa Rica - 2009 and Panama - 2011.
In 2010, Panama revised the income tax rate applicable to the legal entities for the following years: 2011 was revised to 30%, 2012 and 2013 to 27.5% and subsequent years were revised to a 25% rate.
In 2012, Guatemala revised the income tax rates and established the following rates to federal taxes: 2013 was revised to 31%, 2014 to 28% and subsequent years were revised to a 25% rate.
GRUPO AVAL ACCIONES Y VALORES S.A. AND ITS SUBSIDIARIES
NOTES TO THE CONSOLIDATED FINANCIAL STATEMENTS
FOR THE YEARS ENDED DECEMBER 31, 2014, 2013 AND 2012
(
Stated in millions of Colombian pesos and U.S. dollars)
Income tax expense from continuing operations under Colombian Banking GAAP for the years ended December 31, 2014, 2013 and 2012 was comprised of the following components:
|
2014
|
2013
|
2012
|
||||||||||
|
Current income tax expense
|
Ps. | 1,313,164 | Ps. | 1,375,152 | Ps. | 1,323,918 | ||||||
|
Deferred income tax expense (benefit)
|
135,861 | 39,536 | 47,821 | |||||||||
|
Total income tax expense
|
Ps. | 1,449,025 | Ps. | 1,414,688 | Ps. | 1,371,739 | ||||||
Deferred income tax expense for the years ended December 31, 2014, 2013 and 2012 was comprised by the changes of the following components detailed in the following table:
|
December 31,
|
December 31,
|
December 31,
|
||||||||||
|
2014
|
2013
|
2012
|
||||||||||
|
Temporary differences on tax assets
|
||||||||||||
|
Bankers’ acceptances, spot transactions and derivatives
|
Ps. | (194,025 | ) | Ps. | 6,993 | Ps. | (14,913 | ) | ||||
|
Accrued expenses and other liabilities
|
8,224 | (11,087 | ) | (2,094 | ) | |||||||
|
Deferred charges
|
(237 | ) | 611 | 1,936 | ||||||||
|
Other
|
(32,927 | ) | 44,173 | 860 | ||||||||
|
Total temporary differences on tax assets
|
(218,965 | ) | 40,690 | (14,211 | ) | |||||||
|
Temporary differences on tax liabilities
|
||||||||||||
|
Unrealized gains on investment securities
|
20,795 | (4,730 | ) | (27,465 | ) | |||||||
|
Property, plant and equipment
|
9,421 | 45 | 5,968 | |||||||||
|
Bankers` acceptances, spot transactions and derivatives
|
279,911 | (73,163 | ) | (35,283 | ) | |||||||
|
Deferred charges
|
(1,425 | ) | (31,903 | ) | 517 | |||||||
|
Pension plan liabilities
|
(1,161 | ) | 62 | 1,044 | ||||||||
|
Allowance for loan losses
|
21,263 | 1,387 | 208 | |||||||||
|
Accrued expenses
|
– | – | 6,509 | |||||||||
|
Other
|
8,022 | (28,076 | ) | 14,892 | ||||||||
|
Total temporary differences on tax liabilities
|
354,826 | (80,226 | ) | (33,610 | ) | |||||||
|
Net change in temporary differences (Total income tax (benefit) expense)
|
Ps. | 135,861 | Ps. | (39,536 | ) | Ps. | (47,821 | ) | ||||
Income taxes for the years ended December 31, 2014, 2013 and 2012 are subject to review by the tax authorities. Grupo Aval’s banking subsidiaries’ management and their legal advisors believe that no significant additional liabilities could arise from such a review.
The following table presents the tax losses carry-forward and excess of presumptive income over taxable income of Grupo Aval’s subsidiaries as of December 31, 2014:
|
Expiration Date
|
Carry forward losses
|
Excess of presumptive income over taxable income
|
||||||
|
2015
|
– | 1,276 | ||||||
|
2016
|
– | 5,706 | ||||||
|
2017
|
– | 4,656 | ||||||
|
2018
|
– | 7,702 | ||||||
|
2019
|
– | 83,025 | ||||||
|
No expiration date
|
246,549 | – | ||||||
|
Total
|
Ps. | 246,549 | Ps. | 102,365 | ||||
GRUPO AVAL ACCIONES Y VALORES S.A. AND ITS SUBSIDIARIES
NOTES TO THE CONSOLIDATED FINANCIAL STATEMENTS
FOR THE YEARS ENDED DECEMBER 31, 2014, 2013 AND 2012
(
Stated in millions of Colombian pesos and U.S. dollars)
|
(22)
|
NON-CONTROLLING INTEREST
|
Non-controlling interest as of December 31, 2014 and 2013 was originated as follows:
|
December 31,
|
December 31,
|
|||||||
|
2014
|
2013
|
|||||||
|
Banco de Bogota S.A.
and its subsidiaries
|
Ps. | 6,103,505 | Ps. | 5,312,760 | ||||
|
Banco de Occidente S.A.
and its subsidiaries
|
806,652 | 735,643 | ||||||
|
Banco Comercial AV Villas S.A.
and its subsidiaries
|
258,513 | 236,563 | ||||||
|
Banco Popular S.A. and its subsidiaries
|
199,529 | 187,276 | ||||||
|
Total non-controlling interest
|
Ps. | 7,368,199 | Ps. | 6,472,242 | ||||
|
(23)
|
SHAREHOLDERS’ EQUITY
|
Authorized, issued and outstanding shares as of December 31, 2014, 2013 and 2012 consisted of the following:
|
December 31,
|
December 31,
|
December 31,
|
||||||||||
|
2014
|
2013
|
2012
|
||||||||||
|
Authorized shares
|
120,000,000,000 | 120,000,000,000 | 120,000,000,000 | |||||||||
|
Subscribed fully paid shares
(3)
|
22,281,017,159 | 20,178,287,315 | 18,551,766,453 | |||||||||
|
Subscribed but pending to be paid shares
|
- | |||||||||||
|
Total outstanding shares
|
22,281,017,159 | 20,178,287,315 | 18,551,766,453 | |||||||||
|
The outstanding shares are as follows:
|
||||||||||||
|
Common voting shares
(1) (2)
|
15,374,956,989 | 15,178,488,834 | 13,622,022,124 | |||||||||
|
Preferred non-voting shares
(1) (3)
|
6,906,060,170 | 4,999,798,481 | 4,929,744,329 | |||||||||
|
(1)
|
Since 2011, Grupo Aval allows its shareholders to convert their common shares into preferred shares. For the years ended December 31, 2014, 2013 and 2012, 32,187,629, 70,054,152 and 184,669,116 common shares were converted into preferred shares, respectively. Preferred shares have the right to receive a preferential minimum dividend of one Colombian peso (Ps. 1) per semester per share. This preferential minimum dividend is only applicable when dividends declared for common shares are less than one Colombian peso (Ps. 1). Preferential minimum dividends are not cumulative.
|
|
(2)
|
At the extraordinary Shareholders’ Meeting held on December 12, 2013, Grupo Aval obtained authorization to issue 1,855,176,646 ordinary shares, subject to preemptive rights. As of December 31, 2013 a total of 1,626,520,862 shares were subscribed and fully paid. In January 2013 an additional 228,655,784 shares were subscribed and fully paid.
|
|
(3)
|
Between September 23, 2014 and October 02, 2014, Grupo Aval issued through the New York Stock Exchange an aggregate of 1,874,074,060 preferred shares, equivalent to 93,703,703 ADSs at a price of U.S.$13.5 per ADS, raising U.S.$1.3 billion (Ps. 2.4 trillion at the date of issuance). The sale of these shares generated an increase of Ps. 2,425,060 million in subscribed capital and of Ps 1,874 million in additional paid-in capital Ps. 2,423,186, for Grupo Aval.
|
|
Concept
|
September
22 - 2014
|
October
02 - 2014
|
Total
|
|||||||||
|
No. of ADS
|
81,481,481 | 12,222,222 | 93,703,703 | |||||||||
|
# of preferred shares per ADS – ADRs
|
20 | 20 | 20 | |||||||||
|
# of preferred shares issued
|
1,629,629,620 | 244,444,440 | 1,874,074,060 | |||||||||
|
Price per ADS
|
U.S.$ | 13.50 | 13.50 | 13.50 | ||||||||
|
Price per preferred share
|
U.S.$ | 0.6750 | 0.6750 | 0.6750 | ||||||||
|
Exchange rate for 22/09/2014
|
$ | 1,966.89 | 1,966.89 | 1,966.89 | ||||||||
|
Price per preferred share
|
$ | 1,327.65 | 1,327.65 | 1,327.65 | ||||||||
|
Total Offering
|
$ | 1,099,999,993.50 | 164,999,997.00 | 1,264,999,990.50 | ||||||||
F-58
GRUPO AVAL ACCIONES Y VALORES S.A. AND ITS SUBSIDIARIES
NOTES TO THE CONSOLIDATED FINANCIAL STATEMENTS
FOR THE YEARS ENDED DECEMBER 31, 2014, 2013 AND 2012
(
Stated in millions of Colombian pesos and U.S. dollars)
|
Concept
|
September
22 - 2014
|
October
02 - 2014
|
Total
|
|||||||||
|
% Underwriting fee
|
2.25 | % | 2.25 | % | 2.25 | % | ||||||
|
Underwriting fee
|
U.S.$ | 24,750,000 | 3,712,500 | 28,462,500 | ||||||||
|
Total offering after underwriting fee
|
U.S.$ | 1,075,249,993.65 | 161,287,497.07 | 1,236,537,490.71 | ||||||||
|
Total offering
|
$ | 2,163,578,987,215.22 | 324,536,844,099.33 | 2,488,115,831,314.54 | ||||||||
|
% Underwriting fee
|
2.25 | % | 2.25 | % | 2.25 | % | ||||||
|
Total underwriting fee
|
$ | 55,753,110,505.43 | 7,302,078,992 | 63,055,189,497.67 | ||||||||
|
Total offering after underwriting fee
|
$ | 2,107,825,876,709.76 | 317,234,765,107.10 | 2,425,060,641,816.88 | ||||||||
|
Subscribed and paid-in capital:
|
||||||||||||
|
Preferred shares
|
$ | 1,629,629,620.00 | 244,444,440.00 | 1,874,074,060.00 | ||||||||
|
Additional paid-in capital
|
$ | 2,106,196,247,089.78 | 316,990,320,667.10 | 2,423,186,567,756.88 | ||||||||
|
Total subscribed and paid-in capital
|
$ | 2,107,825,876,709.76 | 317,234,765,107.10 | 2,425,060,641,816.88 | ||||||||
Our by-laws provide for two classes of shares: common shares and shares with a preferred dividend, liquidation preference and no voting power (except in limited and extraordinary circumstances). Holders of preferred shares are entitled to receive a minimum dividend after deducting losses affecting the capital, and deducting any amounts set aside for legal reserve, but before creating or accruing for any other reserve and before any declared dividends are paid to holders of common shares. Dividends to holders of common shares must be approved by the shareholders. If no dividends are declared, no holder of Grupo Aval’s preferred or common shares will be entitled to payment. The minimum dividend will be equal to Ps 1.00 in each calendar semester, so long as this value is higher than the dividend paid to the holders of common shares. If the minimum preferred dividend is not equal or higher than the per share dividend on the common shares, the minimum dividend will be equal to the dividend paid to the holders of common shares, if any.
Appropriated retained earnings
Appropriated retained earnings, as of December 31, 2014, 2013 and 2012 consisted of the following:
|
December 31,
|
December 31,
|
December 31,
|
||||||||||
|
2014
|
2013
|
2012
|
||||||||||
|
Legal reserve
|
Ps. | 11,018 | 9,276 | 9,276 | ||||||||
|
Statutory and voluntary reserves
|
3,956,892 | 3,565,478 | 2,902,064 | |||||||||
|
Total
|
Ps. | 3,967,910 | 3,574,754 | 2,911,340 | ||||||||
Retained earnings
Legal reserves
In accordance with applicable legal requirements, Grupo Aval and its banking subsidiaries must create a legal reserve through the allocation of 10% of the liquid earnings of each fiscal period up to the amount of 50% of subscribed common stock. The legal reserve may not be reduced to less than the indicated percentage, except to cover losses in excess of retained earnings.
Statutory and voluntary reserves
Statutory and voluntary reserves are determined by the shareholders in their bi-annual meetings.
GRUPO AVAL ACCIONES Y VALORES S.A. AND ITS SUBSIDIARIES
NOTES TO THE CONSOLIDATED FINANCIAL STATEMENTS
FOR THE YEARS ENDED DECEMBER 31, 2014, 2013 AND 2012
(
Stated in millions of Colombian pesos and U.S. dollars)
Equity inflation adjustments
From January 1992 to December 2000, Grupo Aval and its consolidated banking subsidiaries’ financial statements were subject to inflation adjustments. The cumulative effect of such adjustments in non-monetary assets and liabilities is included in each of the adjusted accounts. Adjustments on the equity accounts are included in the “equity inflation adjustments” line item. According to Law 1111 of 2006, all entities subject of the “equity tax” are allowed to charge those taxes against the “equity inflation adjustments” rather than an expense in the consolidated statements of income. During 2013, 2012 and 2011, the amount of this account decreased due to a payment of the “equity tax” mandated by law.
Dividends declared
According to the extraordinary Shareholders’ Meeting held on December 12, 2013, the common shares, issued on December, 2014, included the right to receive dividends, as follows:
|
2015
|
2014
|
2013
|
|||||||
|
Unconsolidated earnings from first semester
|
Ps.
|
- |
Ps.
|
920,813
|
Ps. |
811,122
|
|||
|
Unconsolidated earnings from second semester
|
-
|
1,347,738
|
766,063
|
||||||
|
Dividends in cash (in Colombian pesos)
|
Ps. 29.1 per ordinary and preferred shares payable in six installments of Ps. 4.85 per share from April to September 2015, based on second semester net income of 2014.
|
Ps. 27.00 per ordinary and preferred shares payable in six installments of Ps. 4.50 per share from April 2014 to September 2014, based on second semester net income of 2013.
Ps. 28.80 per ordinary and preferred shares payable in six installments of Ps. 4.80 per share from October 2014 to march 2015, based on first semester net income of 2014.
|
Ps. 26.1 per ordinary and preferred shares payable in six installments of Ps. 4.35 per share from October 2013 to march 2014, based on first semester net income of 2013.
Ps. 25.20 per ordinary and preferred shares payable in six installments of Ps. 4.20 per share from April 2013 to September 2013, based on second semester net income of 2012.
|
||||||
|
Common shares outstanding
|
15,390,808,045
|
15,407,144,618
|
13,558,237,783
|
||||||
|
Preferred shares issued
|
6,890,209,114
|
4,999,798,481
|
4,993,528,670
|
||||||
|
Total dividends declared
|
648,378
|
1,192,681
|
951,705
|
||||||
|
Dividends payable at December 31
|
–
|
1,133,565
|
928,162
|
|
1.
|
To receive a monthly dividend, equivalent to the dividend approved by the Ordinary General Meeting of Shareholders that took place on September 27, 2013 (Ps. 4.35 per share). Such dividend will be paid beginning on the calendar month immediately succeeding that in which the common shares were duly paid, and ending in March 2014. The above pursuant to Article 34 of the By-laws of the company,
|
|
2.
|
To allocate, from the company’s occasional reserve with tax benefit, available to the General Meeting of Shareholders, an amount of Ps. 24,210 in order to pay the dividend mentioned on section 1 above and in the rules applicable to the offering,
|
|
3.
|
And the balance of the resources allocated to pay the mentioned dividends, if any, shall be returned to the occasional reserve, following the expiration of the public offering.
|
GRUPO AVAL ACCIONES Y VALORES S.A. AND ITS SUBSIDIARIES
NOTES TO THE CONSOLIDATED FINANCIAL STATEMENTS
FOR THE YEARS ENDED DECEMBER 31, 2014, 2013 AND 2012
(
Stated in millions of Colombian pesos and U.S. dollars)
|
(24)
|
MEMORANDUM ACCOUNTS
|
Memorandum accounts as of December 31, 2014 and 2013 are broken as follows:
|
December 31,
|
December 31,
|
|||||||
|
2014
|
2013
|
|||||||
|
Assets in trusts:
|
||||||||
|
Investment funds and assets from third parties held in trusts
|
Ps. | 91,982,251 | Ps. | 79,885,011 | ||||
|
Commitments receivable:
|
||||||||
|
Securities transferred in repos and simultaneous transactions
|
4,543,920 | 4,693,295 | ||||||
|
Interests on loans
|
492,678 | 405,429 | ||||||
|
Rights in options
|
1,497,221 | 1,277,901 | ||||||
|
Lease rents receivable
|
9,355,610 | 8,736,207 | ||||||
|
Call options receivable
|
515,819 | 473,143 | ||||||
|
Other
|
1,061,511 | 887,433 | ||||||
|
Total commitments receivable
|
17,466,759 | 16,473,408 | ||||||
|
Commitments payable:
|
||||||||
|
Unused credit card limits
|
11,610,647 | 10,239,921 | ||||||
|
Civil demands against the bank
|
783,167 | 718,933 | ||||||
|
Issued and confirmed letters of credit
|
765,804 | 902,506 | ||||||
|
Unused lines of credit
|
3,047,251 | 2,988,873 | ||||||
|
Bank guarantees
|
3,107,314 | 2,625,827 | ||||||
|
Approved credits not disbursed
|
2,073,469 | 2,066,753 | ||||||
|
Other
|
1,990,049 | 2,258,997 | ||||||
|
Total commitments payable
|
23,377,701 | 21,801,810 | ||||||
|
Total commitments accounts
|
40,844,460 | 38,275,218 | ||||||
|
Memorandum accounts in favor:
|
||||||||
|
Tax value of assets
|
142,255,541 | 127,633,708 | ||||||
|
Assets and securities given in custody
|
7,400,921 | 8,059,697 | ||||||
|
Assets and securities given as a collateral
|
1,793,322 | 517,739 | ||||||
|
Trading investments in debt securities
|
5,051,371 | 6,029,944 | ||||||
|
Written-off assets
|
5,170,017 | 5,874,090 | ||||||
|
Investments held to maturity
|
2,623,703 | 2,933,336 | ||||||
|
Adjustments for inflation of assets
|
1,035,934 | 1,040,995 | ||||||
|
Investments available for sale in debt securities
|
10,279,783 | 9,346,855 | ||||||
|
Amortized debt securities investment
|
3,139,691 | 2,666,184 | ||||||
|
Other
|
101,894,987 | 90,352,472 | ||||||
|
Total memorandum accounts in favor
|
280,645,270 | 254,455,020 | ||||||
|
Memorandum accounts against:
|
||||||||
|
Assets and securities received as collateral
|
89,491,687 | 70,600,175 | ||||||
|
Loans plus interest receivable on loans
|
113,077,692 | 96,852,386 | ||||||
|
Assets and securities received in custody
|
5,867,552 | 6,229,056 | ||||||
|
Tax value of shareholders’ equity
|
24,181,504 | 20,534,438 | ||||||
|
Adjustment for inflation of equity
|
1,903,274 | 1,903,310 | ||||||
|
Merchandise in owned warehouses
|
2,240,815 | 2,492,228 | ||||||
|
Other
|
38,741,353 | 31,287,351 | ||||||
|
Total memorandum accounts against
|
275,503,877 | 229,898,944 | ||||||
|
Total memorandum accounts
|
556,149,147 | 484,353,964 | ||||||
|
Total assets in trusts, commitments and memorandum accounts
|
Ps. | 688,975,858 | Ps. | 602,514,193 | ||||
GRUPO AVAL ACCIONES Y VALORES S.A. AND ITS SUBSIDIARIES
NOTES TO THE CONSOLIDATED FINANCIAL STATEMENTS
FOR THE YEARS ENDED DECEMBER 31, 2014, 2013 AND 2012
(
Stated in millions of Colombian pesos and U.S. dollars)
|
(25)
|
ADMINISTRATIVE AND OTHER EXPENSES, NET
|
Administrative and other expenses for the years ended December 31, 2014, 2013 and 2012 consisted of the following:
|
2014
|
2013
|
2012
|
||||||||||
|
Professional fees
|
Ps. | 217,080 | Ps. | 176,934 | Ps. | 149,475 | ||||||
|
Taxes other than income
|
630,146 | 579,814 | 522,148 | |||||||||
|
Rent
|
286,975 | 246,448 | 199,917 | |||||||||
|
Contributions and membership fees
|
259,314 | 224,765 | 198,645 | |||||||||
|
Insurance
|
38,694 | 41,170 | 36,600 | |||||||||
|
Maintenance and repairs
|
261,874 | 221,234 | 192,803 | |||||||||
|
Amortization of deferred charges
|
210,461 | 206,280 | 186,164 | |||||||||
|
Cleaning and security services
|
115,358 | 109,409 | 97,856 | |||||||||
|
Temporary services
|
108,037 | 132,385 | 126,716 | |||||||||
|
Public relationship
|
257,829 | 206,562 | 189,774 | |||||||||
|
Utilities
|
248,534 | 229,742 | 207,114 | |||||||||
|
Transport services
|
132,404 | 126,340 | 117,955 | |||||||||
|
Operating costs of non-financial sector
|
17,424 | 9,060 | 10,152 | |||||||||
|
Travel expenses
|
38,339 | 38,416 | 33,530 | |||||||||
|
Utilities and stationary
|
66,733 | 61,567 | 60,639 | |||||||||
|
Others
|
388,500 | 443,211 | 338,138 | |||||||||
|
Total
|
Ps. | 3,277,701 | Ps. | 3,053,337 | Ps. | 2,667,626 | ||||||
|
(26)
|
NON-OPERATING INCOME (EXPENSES)
|
The following table summarizes the components of non-operating income and expenses for the years ended December 31, 2014, 2013 and 2012 of Grupo Aval’s banking subsidiaries’:
|
2014
|
2013
|
2012
|
||||||||||
|
Non-operating income:
|
||||||||||||
|
Gain on sale of foreclosed assets
|
Ps. | 17,443 | Ps. | 12,135 | Ps. | 98,265 | ||||||
|
Gain on sale of property, plant and equipment
|
62,273 | 40,807 | 112,296 | |||||||||
|
Recoveries of other provisions
|
248,118 | 277,892 | 282,438 | |||||||||
|
Leasing
|
6,769 | 7,173 | 6,937 | |||||||||
|
Consortium and temporal unions
|
8,125 | 2,548 | 1,518 | |||||||||
|
Gains on sales of operating leased assets
|
3,545 | 1,274 | 1,651 | |||||||||
|
Gains on sales of finance leased
|
74 | 31 | 32 | |||||||||
|
Gains on foreclosed asset
|
785 | 771 | 320 | |||||||||
|
Other
|
199,962 | 110,721 | 115,059 | |||||||||
|
Total non-operating income
|
547,094 | 453,352 | 618,516 | |||||||||
|
Non-operating (expenses):
|
||||||||||||
|
Loss on sale of property, plant and equipment
|
(13,910 | ) | (5,602 | ) | (310 | ) | ||||||
|
Indemnities
|
(2,204 | ) | (2,900 | ) | (2,589 | ) | ||||||
|
Penalties
|
(51,568 | ) | (23,479 | ) | (12,078 | ) | ||||||
|
Others
|
(216,320 | ) | (185,236 | ) | (155,471 | ) | ||||||
|
Total non-operating (expenses)
|
(284,002 | ) | (217,217 | ) | (170,448 | ) | ||||||
|
Total non-operating income (expenses), net
|
Ps. | 263,092 | Ps. | 236,135 | Ps. | 448,068 | ||||||
GRUPO AVAL ACCIONES Y VALORES S.A. AND ITS SUBSIDIARIES
NOTES TO THE CONSOLIDATED FINANCIAL STATEMENTS
FOR THE YEARS ENDED DECEMBER 31, 2014, 2013 AND 2012
(
Stated in millions of Colombian pesos and U.S. dollars)
|
(27)
|
RELATED PARTY TRANSACTIONS
|
Related parties are considered to be Grupo Aval’s main shareholders, members of the board of directors and related companies in which Grupo Aval holds an interest of 10% or more of total equity, or where it holds common transactions. It also considers investments in which Grupo Aval’s shareholders or members of the board of directors hold an interest of 10% or more of total equity. Grupo Aval’s banking subsidiaries have loans outstanding with, and deposits from, their Officers all reflecting current fair market conditions.
Shareholders
Significant balances and transactions with shareholders as of December 31, 2014 and 2013 were as follows:
|
2014
|
2013
|
|||||||
|
Accounts payable: (*)
|
||||||||
|
Adminegocios y Cia. S.A.
|
88,062 | 77,976 | ||||||
|
Rendifin S.A.
|
11,524 | 9,986 | ||||||
|
Actiunidos S.A.
|
53,516 | 48,038 | ||||||
|
Total accounts payable
|
Ps. | 153,102 | Ps. | 136,000 | ||||
|
(*
)
|
Accounts payable includes dividends payable by Grupo Aval to Adminegocios y Cia. S.A., Rendifin S.A. and Actiunidos S.A.
|
|
(28)
|
RELEVANT INFORMATION
|
According to law 1314 of 2009 and decrees 2706 and 2784 of 2012, Grupo Aval is obliged to converge its reporting standards to IFRS. Grupo Aval’s transition period began on January 1, 2014 and it is required to provide its first set of comparative financial statements during 2015.
As per required by the “Carta Circular” 10 of January 2013 of the Superintendency of Finance, Grupo Aval S.A. and its subordinates presented to the authorities the implementation plan to adopt IFRS, as per defined by Colombian regulation and after obtaining all the required approvals from the boards.
On August 29. 2013 the Ministry of Finance of Colombia enacted the decree 1851 by which it allowed an exception in the preparation of the individual or unconsolidated financial statements with regards to the application of IAS 39 and IFRS 9 which relates to the loan portfolio and its quality.
On November 31, 2013 the Superintendency of Finance required the entities under its control and surveillance to present a summary of the principles to be adopted in the initial balance under IFRS. The summary was presented on January 30, 2014.
On December 27, 2013 the Ministry of Finance enacted the decree 3023 by which it updated the general framework of the implementation of IFRS with the IASB rules as of December 2012.
On July 1, 2014 the Superintendency of Finance enacted the “Circular externa” 021 by which it created the unified accounting standards to be applied by entities under its surveillance starting January 1, 2015.
On August 2014, Grupo Aval presented to the Superintendency of Finance its initial unconsolidated balance sheet under IFRS and on September 2014, it presented its initial consolidated balance sheet under IFRS.
On December 2014, the Superintendency enacted two “Circulares externas”:
|
|
-
|
“Circular Externa” 034 gave instructions on how to classify, value and account investments.
|
|
|
-
|
“Circular Externa” 036 gave instructions on how to treat net positive or negative differences arising from the adoption of IFRS.
|
F-63
GRUPO AVAL ACCIONES Y VALORES S.A. AND ITS SUBSIDIARIES
NOTES TO THE CONSOLIDATED FINANCIAL STATEMENTS
FOR THE YEARS ENDED DECEMBER 31, 2014, 2013 AND 2012
(
Stated in millions of Colombian pesos and U.S. dollars)
Grupo Aval is expected to prepare and present to the public its first set of Financial Statements under the new accounting standards on 2015.
In any case, it is important to mention that Grupo Aval is a not a financial institution and is not supervised or regulated as a financial institution in Colombia. Grupo Aval is required to comply with corporate governance and periodic reporting requirements to which all issuers are subject, but it is not regulated as a financial institution or as a holding company of banking subsidiaries and, thus, is not required to comply with capital adequacy regulations applicable to banks and other financial institutions.
Grupo Aval is expected to prepare and present to the public its first set of Financial Statements under modified IFRS as adopted in Colombia on 2015
|
(29)
|
PARENT COMPANY INFORMATION
|
Following are the condensed unconsolidated balance sheets of Grupo Aval Acciones y Valores S.A., at December 31, 2014 and 2013, related condensed unconsolidated statements of income and cash flows for the fiscal years ended December 31, 2014, 2013 and 2012 under Colombian Banking GAAP. Grupo Aval Acciones y Valores S.A. also prepares unconsolidated financial statements under Colombian GAAP, which differs in certain respects from Colombian Banking GAAP. The unconsolidated financial statements of Grupo Aval Acciones y Valores, S.A. in Colombian GAAP are the basis for distribution of dividends.
|
Condensed Unconsolidated Balance Sheets
|
||||||||
|
2014
|
2013
|
|||||||
|
Assets
|
||||||||
|
Cash and cash equivalents
|
Ps. | 42,457 | Ps. | 835,833 | ||||
|
Investment securities
|
383 | 13,499 | ||||||
|
Investments in subsidiaries
|
26,131,537 | 23,302,155 | ||||||
|
Reappraisal of investments in subsidiaries
|
55,620 | 46,112 | ||||||
|
Other assets
|
1,491,879 | 931,514 | ||||||
|
Total assets
|
Ps. | 27,721,876 | Ps. | 25,129,113 | ||||
|
Liabilities and shareholders’ equity
|
||||||||
|
Borrowings from related parties
|
Ps. | 92,588 | Ps. | 74,568 | ||||
|
Accrued expenses and other liabilities
|
433,949 | 376,740 | ||||||
|
Bonds
|
618,750 | 724,249 | ||||||
|
Total liabilities
|
1,145,287 | 1,175,557 | ||||||
|
Shareholders’ equity
|
26,576,589 | 23,953,556 | ||||||
|
Total liabilities and shareholders’ equity
|
Ps. | 27,721,876 | Ps. | 25,129,113 | ||||
|
Condensed Unconsolidated Statements of Income
|
||||||||||||
|
2014
|
2013
|
2012
|
||||||||||
|
Income
|
||||||||||||
|
Dividends received from subsidiaries
|
Ps. | 1,021,435 | Ps. | 874,298 | Ps. | 753,541 | ||||||
|
Interest on investment securities
|
19,492 | 16,733 | 62,289 | |||||||||
|
Other income
|
49,081 | 48,936 | 59,402 | |||||||||
|
Total income
|
1,090,008 | 939,967 | 875,232 | |||||||||
|
Expense
|
||||||||||||
|
Interest on borrowed funds
|
60,298 | 127,619 | 169,106 | |||||||||
|
Non- interest expense
|
68,792 | 118,941 | 105,715 | |||||||||
|
Total expense
|
129,090 | 246,560 | 274,821 | |||||||||
|
Income before income taxes
|
960,918 | 693,407 | 600,411 | |||||||||
|
Income tax expense
|
13,279 | 7,351 | 12,079 | |||||||||
|
Net income (*)
|
Ps. | 947,639 | Ps. | 686,056 | Ps. | 588,332 | ||||||
|
(*)
|
Net Income in Colombian GAAP for Grupo Aval on an unconsolidated basis was Ps. 2,268,551 for the year ended December 31, 2014, Ps. 1,577,185 for the year ended December 31, 2013; and Ps. 1,524,972 for the year ended December 31, 2012.
|
F-64
GRUPO AVAL ACCIONES Y VALORES S.A. AND ITS SUBSIDIARIES
NOTES TO THE CONSOLIDATED FINANCIAL STATEMENTS
FOR THE YEARS ENDED DECEMBER 31, 2014, 2013 AND 2012
(
Stated in millions of Colombian pesos and U.S. dollars)
|
Condensed Unconsolidated Statements of Cash flows
|
||||||||||||
|
2014
|
2013
|
2012
|
||||||||||
|
Net income
|
Ps. | 947,639 | Ps. | 686,056 | Ps. | 588,332 | ||||||
|
Adjustments to reconcile net income to net cash used by operating activities
|
(57,662 | ) | (52,544 | ) | 26,176 | |||||||
|
Net cash provided by operating activities
|
889,977 | 633,512 | 614,507 | |||||||||
|
Net cash (used in) provided by investing activities
|
(461,317 | ) | (723,940 | ) | (61,955 | ) | ||||||
|
Net cash (used in) provided by financing activities
|
(1,222,034 | ) | 109,935 | (1,326,114 | ) | |||||||
|
Increase (decrease) in cash and cash equivalents
|
793,374 | 19,507 | (773,562 | ) | ||||||||
|
Cash and cash equivalents at beginning of year
|
835,833 | 816,326 | 1,589,888 | |||||||||
|
Cash and cash equivalents at end of year
|
Ps. | 42,459 | Ps. | 835,833 | Ps. | 816,326 | ||||||
|
a)
|
Basis of presentation
|
The accompanying condensed unconsolidated financial statements have been prepared in accordance with Colombian Banking GAAP. Certain information and footnote disclosures normally included in financial statements prepared in accordance with Colombian Banking GAAP have been condensed or omitted.
Under Colombian Banking GAAP and for presentation purposes of Grupo Aval parent-only financial information, investments in subsidiaries are initially classified as available for sale and recognized at either their acquisition cost or daily market prices depending on their liquidity and marketability. On August 24, 2009, the Superintendency of Finance of Colombia established the following stock valuation method:
|
1.
|
Listed equity securities, issued and traded in Colombia
|
Securities are valued daily based on prices published by authorized entities (i.e., the Colombian Stock Exchange). In the absence of a price calculated for the day on which these securities are appraised, the last known valuation price is to be used. In the case of a listed equity security not reporting any trades on the secondary market as of its issue date, and for which there is no indicated market price for its primary issue, it should be appraised based on the guidelines stipulated below.
|
2.
|
Non-listed equity securities, issued and traded in Colombia
|
Securities are valued based on acquisition cost which is later increased or decreased depending upon the investor’s percentage stake in all subsequent changes in the issuer’s shareholders’ equity. For this purpose, the issuer’s shareholders’ equity is calculated based on audited financial statements at the cut-off dates of June 30 and December 31 of each year. However, when more recent audited financial statements are released, those may be used. Entities have a maximum allowed time of three months, subsequent to the cut-off date of the financial statements, to update the valuations of their investments.
Depending on their liquidity levels, equity securities were valued as follows:
|
-
|
High-liquidity equity securities: based on the last daily average trade-weighted price published by the Colombian Stock Exchange.
|
|
-
|
Medium-liquidity equity securities: based on the average price published by the Colombian Stock Exchange, which corresponded to the average trade-weighted price for the last five days on which such securities were traded.
|
|
-
|
Low-liquidity equity securities or those not listed on a stock exchange: based on the increase or decrease of an investor’s percentage stake in the issuers’ shareholders’ equity updated using the latest audited financial statements released by the issuer.
|
F-65
GRUPO AVAL ACCIONES Y VALORES S.A. AND ITS SUBSIDIARIES
NOTES TO THE CONSOLIDATED FINANCIAL STATEMENTS
FOR THE YEARS ENDED DECEMBER 31, 2014, 2013 AND 2012
(
Stated in millions of Colombian pesos and U.S. dollars)
The consolidated financial statements footnote disclosures contain supplemental information relating to the operations of the Company, as such, these financial statements should be read in conjunction with the notes to the consolidated financial statements of Grupo Aval.
Assets, liabilities, income and expenses items are recorded based on the currency of the primary economic environment in which each entity operates (“the functional currency”). For the Company the functional currency is the Colombian peso.
|
b)
|
Commitments and contingencies
|
In the normal course of business, certain subsidiaries of Grupo Aval are defendants in various tax and legal proceedings. Grupo Aval is not aware of any pending legal proceedings which could have a significant effect on its financial position or the results of its operations.
|
c)
|
Investment in subsidiaries
|
Investment in subsidiaries as of December 31, 2014 and 2013 comprise the following:
|
2014
|
2013
|
|||||||||||||||||||||||
|
Subsidiary
|
Participation
|
Value per share (in pesos)
(3)
|
Value
|
Participation
|
Value per share (in pesos)
|
Value
|
||||||||||||||||||
|
Banco de Bogota S.A.
|
68.69 | % | 66,100 | (1) | 15,040,976 | 67.58 | % | 71,500 | (1) | Ps. | 13,655,975 | |||||||||||||
|
Banco de Occidente S.A.
|
72.24 | % | 42,000 | (1) | 4,730,069 | 72.16 | % | 40,100 | (1) | 4,511,312 | ||||||||||||||
|
Banco Popular S.A.
|
93.73 | % | 499 | (1) | 3,613,407 | 93.73 | % | 510 | (1) | 3,692,482 | ||||||||||||||
|
Banco Comercial AV Villas S.A.
|
79.85 | % | 27,051 | (1) | 1,703,264 | 79.85 | % | 24,525 | (1) | 1,218,987 | ||||||||||||||
|
Sociedad Administradora de Fondo de Pensiones y Cesantias Porvenir S.A.
|
20.00 | % | 9,914 | (2) | 200,650 | 20.00 | % | 8,021 | (2) | 179,758 | ||||||||||||||
|
Banco Popular Escision
|
26,561 | – | 26,561 | |||||||||||||||||||||
|
Rendifin Escision
|
17,080 | – | 17,080 | |||||||||||||||||||||
|
Rights under trust agreements
|
– | – | – | |||||||||||||||||||||
|
Grupo Aval Limited
|
100 | % | – | 100 | % | – | – | |||||||||||||||||
|
Grupo Aval International Limited
|
100 | % | – | 100 | % | – | – | |||||||||||||||||
|
Corficolombiana
|
9.35 | % | 39,960 | (1) | 799,530 | – | – | – | ||||||||||||||||
| Ps. | 26,131,537 | Ps. | 23,302,155 | |||||||||||||||||||||
|
(1)
|
Market value
|
|
(2)
|
Book Value
|
|
(3)
|
Information on the value of the action is obtained from the website of the stock exchange BVC Colombia.
|
GRUPO AVAL ACCIONES Y VALORES S.A. AND ITS SUBSIDIARIES
NOTES TO THE CONSOLIDATED FINANCIAL STATEMENTS
FOR THE YEARS ENDED DECEMBER 31, 2014, 2013 AND 2012
(
Stated in millions of Colombian pesos and U.S. dollars)
|
d)
|
Bonds
|
Bonds at December 31, 2014 and 2013 comprise the following:
|
Amounts outstanding
|
|||||||||||||||||
|
Issuance date
|
Tranches
|
Maturity
|
Coupon rate
|
2014
|
2013
|
||||||||||||
|
December, 2009
|
Ps. | 105,500 |
December, 2014
|
ICP + 3.69%
|
Ps. | – | Ps. | 105,499 | |||||||||
|
December, 2009
|
114,670 |
December, 2016
|
ICP+ 4.49%
|
114,670 | 114,670 | ||||||||||||
|
December, 2009
|
279,560 |
December, 2019
|
ICP+ 4.84%
|
279,560 | 279,560 | ||||||||||||
|
December, 2009
|
124,520 |
December, 2024
|
ICP+ 5.20%
|
124,520 | 124,520 | ||||||||||||
|
December, 2009
|
125,750 |
December, 2012
|
DTF + 1.14%
|
– | – | ||||||||||||
|
October, 2005
|
100,000 |
October, 2015
|
ICP+ 3.37%
|
100,000 | 100,000 | ||||||||||||
|
April, 2005
|
94,700 |
April, 2012
|
ICP+ 5.60%
|
– | – | ||||||||||||
|
Total bonds
|
Ps. | 944,700 | Ps. | 618,750 | Ps. | 724,249 | |||||||||||
The scheduled maturities of bonds as of December 31, 2014 are as follows:
|
2015
|
Ps. | 100,000 | ||
|
2016
|
114,670 | |||
|
2017
|
– | |||
|
2018
|
– | |||
|
2019 and thereafter
|
404,080 | |||
|
Total
|
Ps. | 618,750 |
F-67
GRUPO AVAL ACCIONES Y VALORES S.A. AND ITS SUBSIDIARIES
NOTES TO THE CONSOLIDATED FINANCIAL STATEMENTS
FOR THE YEARS ENDED DECEMBER 31, 2014, 2013 AND 2012
(
Stated in millions of Colombian pesos and U.S. dollars)
|
(30)
|
DIFFERENCES BETWEEN COLOMBIAN ACCOUNTING PRINCIPLES FOR GRUPO AVAL AND SUPPLEMENTAL DISCLOSURE REQUIRED BY U.S. GAAP
|
Grupo Aval’s Consolidated Financial Statements have been prepared in accordance with Colombian Banking GAAP. See Note 2 to the Consolidated Financial Statements. These principles and regulations differ in certain significant aspects from accounting principles generally accepted in the United States of America (“U.S. GAAP”) The principal differences between Colombian Banking GAAP and U.S. GAAP and the effect on consolidated net income and consolidated shareholders’ equity attributable to Grupo Aval are presented below, with an explanation of the adjustments.
Reconciliation of Consolidated Net Income:
The table below presents the reconciliation of consolidated net income as per Colombian Banking GAAP to consolidated net income under U.S. GAAP attributable to Grupo Aval for the years ended December 31, 2014, 2013 and 2012:
|
2014 (1)
|
2013 (2)
|
2012 (2)
|
||||||||||
|
Net income attributable to controlling interest under Colombian Banking GAAP
|
Ps. | 1,668,672 | Ps. | 1,600,503 | Ps. | 1,526,388 | ||||||
|
Pre-1992 inflation adjustment to fixed assets (3)
|
(10,438 | ) | (675 | ) | (22,707 | ) | ||||||
|
Net income attributable to controlling interest under Colombian Banking GAAP after pre-1992 inflation adjustment
|
1,658,234 | 1,599,828 | 1,503,681 | |||||||||
|
U.S. GAAP adjustments:
|
||||||||||||
|
a) Income taxes:
|
||||||||||||
|
1) Deferred income taxes
|
14,719 | (27,756 | ) | (176,158 | ) | |||||||
|
2) Uncertainty in income taxes
|
(32,428 | ) | (36,458 | ) | (9,444 | ) | ||||||
|
b) Employee benefit plans
|
15,744 | (7,978 | ) | (7,674 | ) | |||||||
|
c) Fixed assets
|
39,587 | 32,451 | 40,981 | |||||||||
|
d) Reappraisal of assets
|
– | – | – | |||||||||
|
e) Allowance for losses on loans, leases and foreclosed assets
|
105,161 | 160,305 | (98,365 | ) | ||||||||
|
f) Loan origination fees and costs
|
6,884 | 35,574 | 22,740 | |||||||||
|
g) Interest recognition on non-accrual loans
|
1,850 | 2,623 | 2,427 | |||||||||
|
h) Deferred charges and other assets
|
||||||||||||
|
1) Deferred charges
|
(18,489 | ) | (18,820 | ) | (37,736 | ) | ||||||
|
2) Other assets
|
(5,778 | ) | 731 | (760 | ) | |||||||
|
i) Investment securities and derivatives
|
||||||||||||
|
1) Investment securities
|
(32,339 | ) | (18,909 | ) | (530 | ) | ||||||
|
2) Derivatives
|
3,583 | 3,065 | 1,038 | |||||||||
|
j) Investments in unaffiliated companies
|
25,560 | 11,032 | 37,790 | |||||||||
|
k) Investments in affiliated companies
|
(16,346 | ) | 1,273 | 66,656 | ||||||||
|
l) Lessor accounting
|
(5,624 | ) | (12,662 | ) | (2,234 | ) | ||||||
|
m) Business combinations
|
169 | (80,341 | ) | 323,825 | ||||||||
|
n) Consolidation of Promigas
|
(107,368 | ) | (259,696 | ) | 9,491 | |||||||
|
o) Non-controlling interest
|
(3,406 | ) | 151,112 | (117,838 | ) | |||||||
|
p) Guarantees and contingencies
|
(21,910 | ) | (50,983 | ) | (5,019 | ) | ||||||
|
q) Equity tax
|
174,788 | 160,663 | 120,178 | |||||||||
|
r) Variable interest entities
|
(12,027 | ) | (22,892 | ) | (127,166 | ) | ||||||
|
s) Cumulative translation adjustment
|
64,336 | 10,309 | 18,593 | |||||||||
|
Net income attributable to controlling interest under U.S. GAAP
|
1,854,900 | 1,632,471 | 1,564,476 | |||||||||
|
Net income attributable to non-controlling interest under U.S. GAAP
|
1,068,767 | 1,115,816 | 1,028,897 | |||||||||
|
Net income under U.S. GAAP
|
Ps. | 2,923,667 | Ps. | 2,748,287 | Ps. | 2,593,373 | ||||||
|
(1)
|
Includes the results for the year ended December 31, 2014, related to the acquisition Reformador Group and Bilbao Vizcaya Panama Bank. (See note (m))
.
|
|
(2)
|
Includes the results for the nine months period ended December 31, 2013 related to the acquisition of Horizonte and one month period ended December 31, 2012 related to the acquisition of Promigas (See note (n)).
|
|
(3)
|
Inflation adjustment to fixed assets
|
F-68
GRUPO AVAL ACCIONES Y VALORES S.A. AND ITS SUBSIDIARIES
NOTES TO THE CONSOLIDATED FINANCIAL STATEMENTS
FOR THE YEARS ENDED DECEMBER 31, 2014, 2013 AND 2012
(
Stated in millions of Colombian pesos and U.S. dollars)
Non-monetary assets (e.g., property, plant and equipment, etc.) of Grupo Aval under Colombian Banking GAAP were adjusted for inflation based on the variation in the Consumer Price Index (IPC), on a prospective basis from January 1, 1992 to December 31, 2000, when, under Colombian Banking GAAP, the country was no longer considered a highly inflationary economy. Colombia had been considered a highly inflationary country since the 1960’s; therefore, the adjustment is related to property, plant and equipment purchased before January 1, 1992. This adjustment recognizes the portion of inflation accumulated before this date, less the associated accumulated depreciation which would have been reported, with the purpose of presenting financial statements on a constant currency basis. The remaining accumulated pre-1992 inflation effect in fixed assets to be amortized in future years is not considered material.
|
ii)
|
Reconciliation of Consolidated Shareholders’ Equity:
|
The table below presents the reconciliation of the Consolidated Shareholders’ Equity as per Colombian Banking GAAP to the Consolidated Shareholders’ Equity under U.S. GAAP attributable to Grupo Aval for the years ended December 31, 2014, and 2013:
|
2014
|
2013
|
|||||||
|
Shareholders’ equity attributable to controlling interest under Colombian Banking GAAP
|
Ps. | 15,096,638 | Ps. | 11,728,219 | ||||
|
Pre-1992 inflation adjustment to fixed assets (1)
|
231,615 | 242,053 | ||||||
|
Shareholders’ equity attributable to controlling interest under Colombian Banking GAAP after pre-1992 inflation adjustment to fixed assets
|
15,328,253 | 11,970,272 | ||||||
|
U.S. GAAP Adjustments:
|
||||||||
|
a) Income taxes:
|
||||||||
|
1) Deferred income taxes
|
(884,054 | ) | (863,239 | ) | ||||
|
2) Uncertainty in income taxes
|
(137,563 | ) | (105,135 | ) | ||||
|
b) Employee benefit plans
|
(240,210 | ) | (286,777 | ) | ||||
|
c) Fixed assets
|
299,404 | 259,817 | ||||||
|
d) Reappraisal of assets
|
(1,644,131 | ) | (1,454,550 | ) | ||||
|
e) Allowance for losses on loans, leases and foreclosed assets
|
637,184 | 532,023 | ||||||
|
f) Loan origination fees and costs
|
214,765 | 207,881 | ||||||
|
g) Interest recognition on non-accrual loans
|
18,327 | 16,477 | ||||||
|
h) Deferred charges and other assets:
|
||||||||
|
1) Deferred charges
|
(182,858 | ) | (164,369 | ) | ||||
|
2) Other assets
|
(15,295 | ) | (9,520 | ) | ||||
|
i) Investment securities and derivatives:
|
||||||||
|
1) Investment securities
|
(5,480 | ) | 508 | |||||
|
2) Derivatives
|
5,370 | 1,398 | ||||||
|
j) Investments in unaffiliated companies
|
24,089 | 21,806 | ||||||
|
k) Investments in affiliates companies
|
15,156 | 31,502 | ||||||
|
l) Lessor accounting
|
(11,985 | ) | (6,361 | ) | ||||
|
m) Business combinations
|
(121,399 | ) | (58,670 | ) | ||||
|
n) Consolidation of Promigas
|
(286,398 | ) | (231,460 | ) | ||||
|
o) Non-controlling interest
|
23,959 | 100,957 | ||||||
|
p) Guarantees and contingencies
|
(70,543 | ) | (48,633 | ) | ||||
|
q) Equity tax
|
– | (174,803 | ) | |||||
|
r) Variable interest entities
|
(97,453 | ) | (83,289 | ) | ||||
|
s) Cumulative translation adjustment
|
– | – | ||||||
|
t) Receivables from issuance of equity
|
(113,062 | ) | (119,302 | ) | ||||
|
Controlling interest shareholders’ equity under U.S. GAAP
|
12,756,076 | 9,536,534 | ||||||
|
Non-controlling interest under U.S. GAAP
|
7,831,842 | 6,929,297 | ||||||
|
Total shareholders’ equity under U.S. GAAP
|
Ps. | 20,587,918 | Ps. | 16,465,831 | ||||
(1)
Inflation adjustment to fixed assets
, see comment (3) above.
GRUPO AVAL ACCIONES Y VALORES S.A. AND ITS SUBSIDIARIES
NOTES TO THE CONSOLIDATED FINANCIAL STATEMENTS
FOR THE YEARS ENDED DECEMBER 31, 2014, 2013 AND 2012
(
Stated in millions of Colombian pesos and U.S. dollars)
|
iii)
|
Supplemental Condensed Consolidated Financial Statements under U.S. GAAP
|
|
iii)
|
1. Supplemental Condensed Consolidated Balance Sheets:
|
The following are the Condensed Consolidated Balance Sheets under U.S. GAAP as of December, 31, 2014 and 2013:
|
2014
|
2013
|
|||||||
|
Assets
|
||||||||
|
Cash and cash equivalents (1)
|
Ps. | 17,173,577 | Ps. | 13,583,939 | ||||
|
Trading securities
|
4,659,762 | 7,127,700 | ||||||
|
Investment securities
|
21,751,606 | 18,136,458 | ||||||
|
Loans
|
108,969,805 | 93,924,356 | ||||||
|
Financial leases
|
8,672,029 | 8,103,399 | ||||||
|
Allowance for loans, financial leases and other receivables losses
|
(2,894,482 | ) | (2,615,733 | ) | ||||
|
Property, plant and equipment, net
|
5,744,058 | 5,204,238 | ||||||
|
Other assets, net
|
17,478,217 | 14,040,246 | ||||||
|
Total assets
|
Ps. | 181,554,572 | Ps. | 157,504,603 | ||||
|
Liabilities and shareholders’ equity
|
||||||||
|
Liabilities
|
||||||||
|
Deposits
|
Ps. | 114,396,855 | Ps. | 101,179,535 | ||||
|
Long-term debt
|
34,115,764 | 30,241,480 | ||||||
|
Other liabilities
|
12,454,035 | 9,617,757 | ||||||
|
Total liabilities
|
160,966,654 | 141,038,772 | ||||||
|
Shareholders’ equity
|
||||||||
|
Controlling interest shareholders’ equity
|
12,756,076 | 9,536,534 | ||||||
|
Non-controlling interest
|
7,831,842 | 6,929,297 | ||||||
|
Total shareholders’ equity
|
20,587,918 | 16,465,831 | ||||||
|
Total liabilities and shareholders’ equity
|
Ps. | 181,554,572 | Ps. | 157,504,603 | ||||
|
(1)
|
Under Colombian Banking GAAP, interbank loans and remittances of negotiated checks in transit are considered as cash equivalents. These loans and remittances do not meet the definition of cash equivalents under U.S. GAAP and therefore they were reclassified to the loan portfolio. This reclassification amounted to Ps. 1,874,939 and Ps. 2,802,709 as of December 31, 2014 and 2013, respectively. In addition, at December 31, 2014 and 2013 cash and cash equivalents included Ps. 91,711 and Ps. 134,966 and Ps. 147,757, and Ps. 123,127, respectively from Promigas and VIEs consolidated under U.S. GAAP.
|
GRUPO AVAL ACCIONES Y VALORES S.A. AND ITS SUBSIDIARIES
NOTES TO THE CONSOLIDATED FINANCIAL STATEMENTS
FOR THE YEARS ENDED DECEMBER 31, 2014, 2013 AND 2012
(
Stated in millions of Colombian pesos and U.S. dollars)
|
iii)
|
2. Supplemental Condensed Consolidated Statements of Income:
|
The following are the Condensed Consolidated Statements of Income under U.S. GAAP for the years ended December 31, 2014, 2013 and 2012:
|
2014 (1)
|
2013 (2)
|
2012 (2)
|
||||||||||
|
Total interest income
|
Ps. | 10,517,676 | Ps. | 9,448,306 | Ps. | 8,897,567 | ||||||
|
Total interest expense
|
(4,328,374 | ) | (3,802,411 | ) | (3,894,673 | ) | ||||||
|
Net interest income
|
6,189,302 | 5,645,895 | 5,002,894 | |||||||||
|
Provision for loans, leases and other receivables
|
(1,389,607 | ) | (1,113,542 | ) | (971,727 | ) | ||||||
|
Net interest income after provision for loans, leases and other receivables
|
4,799,695 | 4,532,353 | 4,031,167 | |||||||||
|
Income from investment portfolio
|
1,374,149 | 1,312,282 | 1,407,022 | |||||||||
|
Other income
|
4,844,156 | 4,241,287 | 4,011,182 | |||||||||
|
Other expenses
|
(6,490,019 | ) | (5,719,922 | ) | (5,298,657 | ) | ||||||
|
Income before income taxes
|
4,527,981 | 4,366,000 | 4,150,714 | |||||||||
|
Income tax expense
|
(1,604,314 | ) | (1,617,713 | ) | (1,557,341 | ) | ||||||
|
Net income
|
2,923,667 | 2,748,287 | 2,593,373 | |||||||||
|
Net income attributable to non-controlling interest
|
(1,068,767 | ) | (1,115,816 | ) | (1,028,897 | ) | ||||||
|
Net income attributable to Grupo Aval’s shareholders
|
Ps. | 1,854,900 | Ps. | 1,632,471 | Ps. | 1,564,476 | ||||||
|
|
(1)
|
Includes the results for the year ended December 31, 2014, related to the acquisition Reformador Group and Bilbao Vizcaya Panama Bank. (See note (m)).
|
|
|
(2)
|
Includes the result for the nine months period ended December 31, 2013 related to the acquisition of Horizonte and one month period ended December 31, 2012 to the acquisition of Promigas (See note (n)).
|
GRUPO AVAL ACCIONES Y VALORES S.A. AND ITS SUBSIDIARIES
NOTES TO THE CONSOLIDATED FINANCIAL STATEMENTS
FOR THE YEARS ENDED DECEMBER 31, 2014, 2013 AND 2012
(
Stated in millions of Colombian pesos and U.S. dollars)
|
iii)
|
3. Supplemental Condensed Consolidated Statements of Cash Flows
|
The following are the Supplemental Condensed Consolidated Statements of Cash Flows under U.S. GAAP for the years ended December 31, 2014, 2013 and 2012:
|
2014 (1)
|
2013 (2)
|
2012 (2)
|
||||||||||
|
Net income
|
Ps. | 2,923,667 | Ps. | 2,748,287 | Ps. | 2,593,373 | ||||||
|
Adjustments to reconcile net income to net cash used by operating activities
|
7,949,416 | 5,547,680 | 1,144,698 | |||||||||
|
Net cash provided by operating activities
|
10,873,083 | 8,295,967 | 3,738,072 | |||||||||
|
Net cash used in investing activities (3)
|
(17,516,916 | ) | (19,074,650 | ) | (17,726,675 | ) | ||||||
|
Net cash provided by financing activities
|
7,450,633 | 13,696,776 | 15,878,221 | |||||||||
|
Effect of exchange rate changes on cash and cash equivalents
|
2,782,838 | 519,831 | (515,194 | ) | ||||||||
|
Increase in cash and cash equivalents
|
3,589,638 | 3,437,924 | 1,374,422 | |||||||||
|
Cash and cash equivalents at beginning of period
|
13,583,939 | 10,146,015 | 8,771,593 | |||||||||
|
Cash and cash equivalents at end of period
|
Ps. | 17,173,577 | Ps. | 13,583,939 | Ps. | 10,146,015 | ||||||
|
Non-cash transactions:
|
||||||||||||
|
Foreclosed assets
|
Ps. | 78,050 | Ps. | 81,208 | $ | 96,456 | ||||||
|
Non-monetary transactions in Promigas business combination (Net) (See note (m)).
|
Ps. | – | Ps. | – | Ps. | 1,779,567 | ||||||
|
|
(1)
|
Includes the results for the year ended December 31, 2014, related to the acquisition Reformador Group and Bilbao Vizcaya Panama Bank. (See note (m))
.
|
|
|
(2)
|
Includes the results for the nine months period ended December 31, 2013 related to the acquisition of Horizonte and one month period ended December 31, 2012 related to the acquisition of Promigas (See note (n)).
|
|
|
(3)
|
This caption includes cash acquired in business acquisition during 2013 by Ps. 1,437,644, during 2012 by Ps. 248,425 (See note m).
|
GRUPO AVAL ACCIONES Y VALORES S.A. AND ITS SUBSIDIARIES
NOTES TO THE CONSOLIDATED FINANCIAL STATEMENTS
FOR THE YEARS ENDED DECEMBER 31, 2014, 2013 AND 2012
(
Stated in millions of Colombian pesos and U.S. dollars)
|
iii)
|
4. Supplemental Condensed Consolidated Statements of Shareholders’ Equity
|
The following are the Supplemental Condensed Consolidated Statements of Shareholders’ Equity under U.S. GAAP for the years ended December 31, 2014 and 2013:
|
2014
|
2013
|
|||||||
|
Controlling interest shareholders’ equity under U.S. GAAP
|
||||||||
|
Balance at the beginning of the year
|
Ps. | 9,536,534 | Ps. | 7,426,225 | ||||
|
Issuance of common and preferred shares
|
2,722,319 | 2,114,477 | ||||||
|
Additional paid capital in acquisition of non-controlling interest
|
(192,924 | ) | (375,294 | ) | ||||
|
Receivables for issuance of equity
|
6,240 | 88,697 | ||||||
|
Net income
|
1,854,900 | 1,632,471 | ||||||
|
Dividends declared
|
(1,191,686 | ) | (975,916 | ) | ||||
|
Other comprehensive income
|
20,693 | (374,126 | ) | |||||
|
Balance at the end of the year
|
12,756,076 | 9,536,534 | ||||||
|
Non-controlling interest under U.S. GAAP:
|
||||||||
|
Balance at beginning of year
|
6,929,297 | 6,369,913 | ||||||
|
Net income attributable to non-controlling interests
|
1,068,767 | 1,115,816 | ||||||
|
Other comprehensive income attributable to non-controlling interests
|
105,850 | 23,591 | ||||||
|
Increase in capital paid in subsidiaries
|
665,692 | 458,206 | ||||||
|
Dividends declared and others, net
|
(937,764 | ) | (1,038,229 | ) | ||||
|
Balance at the end of the year
|
7,831,842 | 6,929,297 | ||||||
|
Total shareholders’ equity under U.S. GAAP
|
Ps. | 20,587,918 | Ps. | 16,465,831 | ||||
GRUPO AVAL ACCIONES Y VALORES S.A. AND ITS SUBSIDIARIES
NOTES TO THE CONSOLIDATED FINANCIAL STATEMENTS
FOR THE YEARS ENDED DECEMBER 31, 2014, 2013 AND 2012
(
Stated in millions of Colombian pesos and U.S. dollars)
|
iii)
|
5. Supplemental Consolidated Comprehensive Income:
|
The following are the Supplemental Consolidated Statements of Comprehensive Income under U.S. GAAP for the years ended December 31, 2014, 2013 and 2012:
|
2014
|
2013
|
2012
|
||||||||||
|
Net income
|
Ps. | 2,923,667 | Ps. | 2,748,287 | Ps. | 2,593,373 | ||||||
|
Other comprehensive income (loss), net of deferred income tax:
|
||||||||||||
|
Unrealized (loss) or gain on securities available for sale (1)
|
37,418 | (432,975 | ) | 198,062 | ||||||||
|
Pension plan and other benefits to employees
|
26,875 | 34,700 | (43,556 | ) | ||||||||
|
Cumulative translation adjustments
|
1,355,193 | 355,149 | (340,485 | ) | ||||||||
|
Derivatives – Hedge accounting gains (loss)
|
(1,292,940 | ) | (307,410 | ) | 309,780 | |||||||
|
Other comprehensive (loss) income
|
126,546 | (350,536 | ) | 123,801 | ||||||||
|
Total comprehensive income
|
3,050,213 | 2,397,751 | 2,717,174 | |||||||||
|
Net income attributable to non-controlling interest
|
(1,068,767 | ) | (1,115,816 | ) | (1,028,897 | ) | ||||||
|
Other comprehensive income attributable to non-controlling interest
|
(105,850 | ) | (23,591 | ) | (94,759 | ) | ||||||
|
Comprehensive income attributable to non-controlling interest
|
(1,174,617 | ) | (1,139,407 | ) | (1,123,656 | ) | ||||||
|
Comprehensive income attributable to Grupo Aval
|
Ps. | 1,875,596 | Ps. | 1,258,344 | Ps. | 1,593,518 | ||||||
|
(1)
|
See changes in unrealized gain (losses) in Section i) investment securities and derivatives.
|
A detail of the changes during the period in Accumulated Other Comprehensive Income (loss), including the related income tax effects, is presented below:
|
2014
|
||||||||||||
|
Before – tax
Amount
|
Tax (expense)
Benefit
|
Net-of-tax
Amount
|
||||||||||
|
Unrealized loss on securities available for sale
|
51,888 | (14,470 | ) | 37,418 | ||||||||
|
Addition (Reduction) in pension liability
|
30,823 | (3,948 | ) | 26,875 | ||||||||
|
Derivatives – hedge accounting
|
(1,292,940 | ) | – | (1,292,940 | ) | |||||||
|
Cumulative translation adjustment
|
1,349,747 | 5,446 | 1,355,193 | |||||||||
|
Change in other comprehensive income (loss)
|
Ps. | 139,518 | Ps. | (12,972 | ) | Ps. | 126,546 | |||||
GRUPO AVAL ACCIONES Y VALORES S.A. AND ITS SUBSIDIARIES
NOTES TO THE CONSOLIDATED FINANCIAL STATEMENTS
FOR THE YEARS ENDED DECEMBER 31, 2014, 2013 AND 2012
(
Stated in millions of Colombian pesos and U.S. dollars)
|
2013
|
||||||||||||
|
Before – tax Amount
|
Tax (expense) Benefit
|
Net-of-tax Amount
|
||||||||||
|
Unrealized loss on securities available for sale
|
Ps. | (640,960 | ) | Ps. | 207,985 | Ps. | (432,975 | )(1) | ||||
|
Addition (Reduction) in pension liability
|
52,576 | (17,876 | ) | 34,700 | ||||||||
|
Derivatives – Hedge accounting
|
(307,410 | ) | – | (307,410 | ) | |||||||
|
Cumulative translation adjustment
|
355,149 | – | 355,149 | |||||||||
|
Change in other comprehensive income
|
Ps. | (540,645 | ) | Ps. | 190,109 | Ps. | (350,536 | ) | ||||
|
2012
|
||||||||||||
|
Before – tax Amount
|
Tax (expense) Benefit
|
Net-of-tax Amount
|
||||||||||
|
Unrealized gain on securities available for sale
|
Ps. | 335,612 | Ps. | (137,550 | ) | Ps. | 198,062 | |||||
|
Addition (Reduction) in pension liability
|
(68,291 | ) | 24,735 | (43,556 | ) | |||||||
|
Derivatives – Hedge accounting
|
309,780 | – | 309,780 | |||||||||
|
Cumulative translation adjustment
|
(340,485 | ) | – | (340,485 | ) | |||||||
|
Accumulated other comprehensive income
|
Ps. | 236,616 | Ps. | (112,815 | ) | Ps. | 123,801 | |||||
The following table relates to the accumulated unrealized gain on securities available for sale:
|
2014
|
2013
|
2012
|
||||||||||||||||||||||||||||||||||
|
Before - tax amount
|
Tax (expense) benefit
|
Net-of-tax amount
|
Before - tax amount
|
Tax (expense) benefit
|
Net-of-tax amount
|
Before - tax amount
|
Tax (expense) benefit
|
Net-of-tax amount
|
||||||||||||||||||||||||||||
|
Unrealized taxable net gain/ (loss) on securities available for sale
|
Ps. | (119,427 | ) | Ps. | 46,576 | Ps. | (72,851 | ) | Ps. | (179,547 | ) | Ps. | 61,046 | Ps. | (118,501 | ) | Ps. | 432,174 | Ps. | (146,939 | ) | Ps. | 285,235 | |||||||||||||
|
Unrealized non-taxable net gain on securities available for sale
|
219,293 | – | 219,293 | 227,525 | – | 227,525 | 256,764 | – | 256,764 | |||||||||||||||||||||||||||
|
Accumulated other comprehensive income
|
Ps. | 99,866 | (1) | Ps. | 46,576 | Ps. | 146,442 | Ps. | 47,978 | (1) | Ps. | 61,046 | Ps. | 109,024 | Ps. | 688,938 | (1) | Ps. | (146,939 | ) | Ps. | 541,999 | ||||||||||||||
|
(1)
|
See changes in unrealized gains (losses) in Section i) investment securities and derivatives.
|
F-75
GRUPO AVAL ACCIONES Y VALORES S.A. AND ITS SUBSIDIARIES
NOTES TO THE CONSOLIDATED FINANCIAL STATEMENTS
FOR THE YEARS ENDED DECEMBER 31, 2014, 2013 AND 2012
(
Stated in millions of Colombian pesos and U.S. dollars)
Components of Accumulated Other Comprehensive Income for the years ended December 31, 2014, 2013 and 2012 are as follows:
|
Unrealized Gains (losses) on securities net of taxes
|
Additional minimum pension liability
|
Cumulative translation adjustment(*)
|
Less: Accumulated other comprehensive income attributable to non-controlling interests
|
Total accumulated other comprehensive income (loss) attributable to Grupo Aval
|
||||||||||||||||
|
Beginning balance 2011
|
343,937 | (101,583 | ) | 20,017 | 69,760 | 192,611 | ||||||||||||||
|
Current-period change
|
198,062 | (43,556 | ) | (30,705 | ) | 94,759 | 29,042 | |||||||||||||
|
Ending balance 2012
|
541,999 | (145,139 | ) | (10,688 | ) | 164,522 | 221,650 | |||||||||||||
|
Current-period change
|
(432,975 | ) | 34,700 |
47,739|
|
23,591 | (374,127 | ) | |||||||||||||
|
Ending balance 2013
|
109,024 | (110,439 | ) | 37,051 | 188,113 | (152,477 | ) | |||||||||||||
|
Current-period change
|
37,418 | 26,875 | 62,253 | 105,850 | 20,696 | |||||||||||||||
|
Ending balance 2014
|
Ps. | 146,442 | Ps. | (83,564 | ) | Ps. | 99,304 | Ps. | 293,963 | Ps. | (131,781 | ) | ||||||||
|
(*)
|
Cumulative translation adjustment is presented net of Ps. (1,344,577) Ps. (51,637) and Ps. 255,773 in 2014, 2013 and 2012, respectively; as part of the hedge of net investments in foreign subsidiaries made during the years ended December 31, 2014, 2013, and 2012 respectively, see Note 30.s).
|
The table below presents effects on net income of significant amounts reclassified out of each component of accumulated OCI before and after tax for the years ended December 31, 2014 and 2013.
|
Reclassifications out of accumulated OCI
|
||||||||||
|
Accumulated OCI components
|
Income statement line Item
|
December 31, 2014
|
December 31, 2013
|
|||||||
|
Available for sale debt securities
|
||||||||||
|
Income from investment portfolio
|
Income from investment portfolio
|
Ps. | 118,803 | Ps. | 339,657 | |||||
|
Income before income taxes
|
118,803 | 339,657 | ||||||||
|
Income tax expense
|
(40,393 | ) | (115,483 | ) | ||||||
|
Net income
|
78,410 | 224,174 | ||||||||
|
Employee benefit plans
|
||||||||||
|
Net transition obligation
|
Other expenses
|
(10,088 | ) | (7,765 | ) | |||||
|
Net actuarial gain (loss)
|
Other expenses
|
16,359 | (14,710 | ) | ||||||
|
Loss before income taxes
|
6,271 | (22,475 | ) | |||||||
|
Income tax expense
|
(2,132 | ) | 7,642 | |||||||
|
Net income
|
4,139 | (14,833 | ) | |||||||
|
Total reclassification adjustments
|
Ps. | 82,549 | Ps. | 209,341 | ||||||
F-76
GRUPO AVAL ACCIONES Y VALORES S.A. AND ITS SUBSIDIARIES
NOTES TO THE CONSOLIDATED FINANCIAL STATEMENTS
FOR THE YEARS ENDED DECEMBER 31, 2014, 2013 AND 2012
(
Stated in millions of Colombian pesos and U.S. dollars)
|
iv)
|
Summary of significant differences and required U.S. GAAP disclosures
|
|
a)
|
Income taxes:
|
|
|
1)
|
Deferred income taxes
|
Under Colombian Banking GAAP, deferred income taxes are not generally recognized for certain timing differences, such as for carry-forward losses and the excess of the minimum presumptive income tax. Only a reduced amount of items are recognized as deferred income tax assets and liabilities under Colombian Banking GAAP, and those mainly relate to estimated liabilities and investments recognized at fair value.
Under U.S. GAAP, specifically ASC 740 “Income taxes", deferred tax assets or liabilities are recognized for all temporary differences between the financial and tax bases of assets and liabilities, unless a specific exception exists. Deferred tax assets and liabilities are included in the financial statements at currently enacted income tax rates applicable to the period in which the deferred tax assets and liabilities are expected to be realized and settled as prescribed in ASC 740. A valuation allowance is provided for deferred tax assets to the extent that it is more likely than not that the asset will not be realized. In addition, under U.S. GAAP during 2014, 2013 and 2012, Grupo Aval calculated the carrying amount of certain property and equipment acquired based on the simultaneous equations method in accordance to ASC 740-10-25-51.
The difference between the deferred income tax balance as per Colombian Banking GAAP and the balance for U.S. GAAP is associated with two different effects the first is the different methods used to recognize and measure deferred income tax, and the second is the tax effect of pretax accounting differences between U.S. GAAP and Colombian Banking GAAP.
|
2014
|
2013
|
|||||||
|
Deferred tax from different methodology under U.S. GAAP.
|
(412,059
|
) |
(383,290
|
) | ||||
|
Deferred tax on U.S. GAAP adjustments.
|
(241,785
|
) |
(195,518
|
) | ||||
|
Net deferred tax (liability) under U.S. GAAP
|
Ps. | (653,844 | ) | Ps. | (578,808 | ) | ||
Until December 31, 2012 the income tax rate in Colombia was 33%. According to a tax law issued in Colombia in December 2012, starting in 2013 the income tax rate was decreased from 33% to 25%. In addition, a new income tax (CREE, for its acronym in Spanish) was created through this amendment. The rate for this new tax was 9% for 2013, 2014 and 2015. The CREE did not allow for the realization of net operating loss carry forward or excess of presumptive income carryforwards against the related taxable income. The effect of this change in the income tax rate increases the income taxes charged during the year ended December 31, 2013 by approximately Ps.45,601. Also, in December 2012, based on the new income tax law in Colombia, the income tax rate for occasional gains decreased from 33% in 2012 to 10% in 2013 thereafter.
In December 2014, a new tax law was issued in Colombia. Under the new law an additional surtax to CREE was created increasing such tax to 14% in 2015, 15% in 2016, 17% in 2017, 18% in 2018 and 9% for the following years. In addition, companies can deduct net operating loss and excess of presumptive income recognized since 2015 from their tax income. The new rates were used in order to calculate the deferred taxes under U.S. GAAP for 2014.
Income before income taxes under U.S. GAAP for the years ended December 31, 2014, 2013 and 2012 is comprised of the following:
|
2014
|
2013
|
2012
|
||||||||||
|
Domestic pre-tax income
|
Ps. |
3,554,007
|
Ps. |
2,990,334
|
Ps. | 3,526,188 | ||||||
|
Foreign pre-tax income
|
973,974
|
1,375,666
|
624,526
|
|||||||||
|
Total pre-tax income
|
Ps. | 4,527,981 | Ps. | 4,366,000 | Ps. | 4,150,714 | ||||||
GRUPO AVAL ACCIONES Y VALORES S.A. AND ITS SUBSIDIARIES
NOTES TO THE CONSOLIDATED FINANCIAL STATEMENTS
FOR THE YEARS ENDED DECEMBER 31, 2014, 2013 AND 2012
(
Stated in millions of Colombian pesos and U.S. dollars)
Income tax expense from continuing operations under U.S. GAAP for the years ended December 31, 2014, 2013 and 2012 is comprised of the following:
|
2014
|
2013
|
2012
|
||||||||||
|
Domestic current income tax expense
|
Ps. |
1,253,603
|
Ps. |
1,366,878
|
Ps. |
1,168,875
|
||||||
|
Foreign current income tax expense
|
229,569
|
183,544
|
164,488
|
|||||||||
|
Total current income tax expense
|
1,483,172
|
1,550,422
|
1,333,363
|
|||||||||
|
Domestic deferred income tax (benefit) expense
|
127,113
|
68,404
|
210,161
|
|||||||||
|
Foreign deferred income tax (benefit) expense
|
(5,971)
|
(1,113)
|
13,817
|
|||||||||
|
Total deferred income tax (benefit) expense
|
121,142
|
67,291
|
223,978
|
|||||||||
|
Total
|
Ps. | 1,604,314 | Ps. | 1,617,713 | Ps. | 1,557,341 | ||||||
For the years ended December 31, 2014, 2013 and 2012, Grupo Aval recorded Ps. (12,972), Ps. 190,109 and Ps. (112,815), respectively, of deferred income tax expense (benefit) in Other Comprehensive Income.
Income tax expense related to subsidiaries located in the Colombian jurisdiction represented 86.06%, 88.72% and 88.55% during the years ended December 31, 2014, 2013 and 2012, respectively, of the total amounts reported by the Group.
Temporary differences between the amounts reported in the Consolidated Financial Statements and the tax bases for assets and liabilities result in deferred taxes. Deferred tax assets and liabilities at December 31, 2014 and 2013 were as follows:
|
2014
|
2013
|
|||||||
|
Deferred tax assets:
|
||||||||
|
Accrual of employee benefits
|
Ps. |
74,107
|
Ps. |
81,834
|
||||
|
Tax loss carry forwards and tax credits for excess of minimum presumptive income generated in previous years
|
165,659 | 163,169 | ||||||
| Derivatives | 205,170 | – | ||||||
| Accrued expenses | 112,037 | 144,791 | ||||||
| Trust assets | 22,160 | 16,266 | ||||||
| Unrealized gain on investment securities | 65,695 | 54,037 | ||||||
| Foreclosed assets | 9,201 | – | ||||||
| Other | 9,645 | 7,166 | ||||||
| Total gross deferred tax assets | 663,674 | 467,263 | ||||||
| Less valuation allowance | (115,826 | ) | (107,743 | ) | ||||
| Net deferred tax assets | Ps. |
547,848
|
Ps. |
359,520
|
||||
|
2014
|
2013
|
|||||||
|
Deferred tax liabilities:
|
||||||||
|
Allowance for loans, leases and other receivables
|
Ps. |
(208,127
|
) | Ps. | (239,010 | ) | ||
|
Fixed assets
|
(242,217
|
) |
(236,562
|
) | ||||
|
Derivatives
|
–
|
(96,085
|
) | |||||
|
Goodwill
|
(47,158
|
) |
(39,079
|
) | ||||
|
Intangible assets and deferred charges, net
|
(207,759
|
) |
(200,490
|
) | ||||
|
Investment securities
|
(56,912
|
) |
(46,557
|
) | ||||
|
Inflation adjustments
|
(254
|
) |
(484
|
) | ||||
|
Outside basis (1) (2)
|
(439,265
|
) |
(80,061
|
) | ||||
|
Total deferred liabilities
|
(1,201,692
|
) |
(938,328
|
) | ||||
|
Net deferred tax (liability) under U.S. GAAP
|
Ps. | (653,844 | ) | Ps. |
(578,808
|
) | ||
GRUPO AVAL ACCIONES Y VALORES S.A. AND ITS SUBSIDIARIES
NOTES TO THE CONSOLIDATED FINANCIAL STATEMENTS
FOR THE YEARS ENDED DECEMBER 31, 2014, 2013 AND 2012
(
Stated in millions of Colombian pesos and U.S. dollars)
|
(1)
|
As of December 31, 2014, this caption includes a deferred tax liability amounting to Ps. 363,625 calculated over exchange difference gains on foreign currencies by Ps. 1,069,484 on foreign Grupo Aval investment in Leasing Bogotá Panamá subsidiary, recorded as income in 2014 for local purposes which for tax purposes are considered nontaxable income until they would be realized by investment sale, due to a change in the tax rules in Colombia established under Law 1314 of 2014. These exchange difference gains are a portion of the cumulative translations adjustments under U.S. GAAP of Grupo Aval equity.
|
|
(2)
|
The deferred tax liability related to the outside basis corresponds to retained earnings from subsidiaries abroad.
|
Under Colombian tax law, certain acquisitions of property, plant and equipment have an additional deduction over the total depreciation of such assets, equivalent to 30% for property, plant and equipment purchased from 2004 through 2006, 40% from 2007 through 2009 and 30% during 2010. After 2010, this additional deduction was eliminated, except for the leasing operations of the subsidiary Banco de Occidente which according to a special agreement signed with the Colombian Government maintains this deduction of 30% until 2028. This additional deduction is recognized in the income tax return in the year that such assets are purchased. Under Colombian Banking GAAP, there is an immediate recognition in the consolidated statement of income of such deduction through the current income tax expense.
Under U.S. GAAP, specifically ASC 740-10-25-51, “Income tax” the tax effect of asset purchases that are not business combinations in which the amount paid differs from the tax basis of the asset shall not result in immediate consolidated statement of income recognition. The simultaneous equation method shall be used to record the assigned value of the asset and the related deferred tax asset. Therefore, for the purpose of this reconciliation, the initial temporary difference related to this deduction was calculated according to ASC 740-10-25-51 and is recorded as a deferred tax asset, decreasing the book value of these assets. Thereafter, the deductions taken in computing current income tax expense for both Colombian Banking GAAP and U.S. GAAP are offset by decreases in the corresponding deferred tax asset under U.S. GAAP.
In assessing the realizability of deferred tax assets, management considers whether it is more likely than not that some portion or all of the deferred tax assets will not be realized. The ultimate realization of deferred tax assets depends upon the generation of future taxable income during the periods in which those temporary differences become deductible. Management considers the scheduled reversal level of deferred tax liabilities, and projected future taxable income when making this assessment. Based upon the historical taxable income and projections for future taxable income over the periods in which the deferred tax assets are deductible, management believes that Grupo Aval will not recover a portion of its future net operating tax loss carryforward with taxable income. Therefore, a valuation allowance was provided against this amount for a total of Ps. 115,826 and Ps. 107,743 as of December 31, 2014 and 2013, respectively, to reduce the deferred tax assets to the amount more likely than not to be realized. The amount of the deferred tax asset considered realizable, however, could be reduced in the near term if estimates of future taxable income during the carry-forward period are not achieved.
Deferred tax assets recognized are supported by the reversals of the deferred tax liabilities.
The U.S. GAAP adjustments shown in the shareholders’ equity reconciliation for deferred income taxes of Ps. (884,054) and Ps. (863,239) in 2014 and 2013, respectively, are determined as the difference between the U.S. GAAP net deferred tax (liability) asset balances for both 2014 and 2013 and the Colombian Banking GAAP net deferred tax liability balances for the corresponding years. Both of these amounts have been adjusted for the cumulative effects derived from the amortization of the deferred tax assets recognized upon the acquisition of the underlying property and equipment pursuant to ASC 740-10-25-51 and the impact of the deferred tax assumed from the business combinations (see note m), as shown in the following table:
GRUPO AVAL ACCIONES Y VALORES S.A. AND ITS SUBSIDIARIES
NOTES TO THE CONSOLIDATED FINANCIAL STATEMENTS
FOR THE YEARS ENDED DECEMBER 31, 2014, 2013 AND 2012
(
Stated in millions of Colombian pesos and U.S. dollars)
|
2014
|
2013
|
|||||||
|
Net deferred tax (liability) under U.S. GAAP
|
Ps. | (653,844 | ) | Ps. | (578,808 | ) | ||
|
Reclassification from property, plant and equipment of gross additional tax deduction according to ASC 740-10-25-51
|
(460,800 | ) | (395,414 | ) | ||||
|
Deferred income tax from Promigas consolidation
|
(43,646 | ) | (27,397 | ) | ||||
|
Net deferred tax liability under Colombian Banking GAAP
|
274,236 | 138,380 | ||||||
|
Difference to be recognized under U.S. GAAP shareholders’ equity
|
Ps. | (884,054 | ) | Ps. | (863,239 | ) | ||
The activity of the difference to be recognized under U.S. GAAP shareholders’ equity during 2014, 2013 and 2012 was as follows:
|
2014
|
2013
|
2012
|
||||||||||
|
Balance at the beginning of the year
|
Ps. | (863,239 | ) | Ps. | (912,597 | ) | Ps. | (257,723 | ) | |||
|
Adjustment to reconciliation of consolidated net income
|
14,719 | (27,756 | ) | (176,158 | ) | |||||||
|
Business combination of the year (1)
|
– | (50,885 | ) | (365,902 | ) | |||||||
|
Reclasification of previous year business combination (2)
|
(22,562 | ) | (62,110 | ) | – | |||||||
|
Decrease (increase) in Other Comprehensive Income
|
(12,972 | ) | 190,109 | (112,815 | ) | |||||||
|
Balance at the end of the year
|
Ps. | (884,054 | ) | Ps. | (863,239 | ) | Ps. | (912,597 | ) | |||
|
|
(1)
|
The balance shown in the 2013 column relates to the deferred income tax balance at the acquisition date of Horizonte by Ps. (30,493), BBVA Panama by Ps. (10,264) and Grupo Reformador by Ps. (10,128). On the other hand, the balance shown in 2012 relates to the deferred income tax balance at the acquisition date of Promigas by Ps. (326,964) and Intrex by Ps. (38,938).
|
|
|
(2)
|
This balance represents the deferred income tax of BAC Credomatic at the date of its acquisition in 2010, which since then was included in the U.S. GAAP adjustment of business combination (m). In 2014 and 2013 Grupo Aval reclassified this balance in order to present it within the U.S. GAAP adjustment of deferred income taxes in the equity reconciliation.
|
The Colombian statutory income tax rate was 34% for year 2014 and 2013 and 33% for 2012 which differs from the 34.40%, 37.05% and 37.52% effective tax rates for years 2014, 2013 and 2012, respectively, due to the following differences which reconcile the statutory income tax with the reported income tax expense:
|
2014
|
2013
|
2012
|
||||||||||
|
Income before income tax under U.S. GAAP
|
Ps. | 4,527,981 | Ps. | 4,366,000 | Ps. | 4,150,714 | ||||||
|
Income tax as per statutory rate
|
Ps. | 1,539,513 | Ps. | 1,484,440 | Ps. | 1,369,735 | ||||||
|
Tax effect on non-deductible expenses
|
||||||||||||
|
Non deductible expenses (1)
|
263,453 | 285,787 | 305,762 | |||||||||
|
Equity tax
|
– | 7,578 | 6,555 | |||||||||
|
Other
|
6,797 | – | 4,808 | |||||||||
|
Total tax effect on non-deductible
|
270,248 | 355,957 | 365,552 | |||||||||
|
Tax effect on non- taxable income
|
||||||||||||
|
Securities income recorded by equity method
|
(11,458 | ) | (63,937 | ) | (36,180 | ) | ||||||
|
Profit on investment securities sold
|
(18,416 | ) | (2,037 | ) | (1,894 | ) | ||||||
|
Dividends received
|
(36,406 | ) | (83,629 | ) | (20,384 | ) | ||||||
|
Recovery of profits
|
– | (9,970 | ) | (16,091 | ) | |||||||
|
Equity tax
|
(14,671 | ) | – | – | ||||||||
|
Exempt income
|
(80,425 | ) | (62,592 | ) | (48,427 | ) | ||||||
|
Other
|
(20,096 | ) | (23,927 | ) | – | |||||||
|
Total effect on non-taxable income
|
(181,472 | ) | (246,092 | ) | (122,976 | ) | ||||||
|
Enacted tax rate
|
(32,059 | ) | – | (78,951 | ) | |||||||
|
( Decrease) increase in the valuation allowance
|
8,083 | 23,408 | 23,981 | |||||||||
|
Income tax expense
|
Ps. | 1,604,314 | Ps. | 1,617,713 | Ps. | 1,557,341 | ||||||
GRUPO AVAL ACCIONES Y VALORES S.A. AND ITS SUBSIDIARIES
NOTES TO THE CONSOLIDATED FINANCIAL STATEMENTS
FOR THE YEARS ENDED DECEMBER 31, 2014, 2013 AND 2012
(
Stated in millions of Colombian pesos and U.S. dollars)
|
(1)
|
This item include allowance over assets, local taxes, losses in valuation on investments and other expenses that are not deductible for tax purposes. They also included in 2012 Ps. 269,802, which corresponds to pre-existing participation in Promigas (see note (m)).
|
|
|
2)
|
ASC 740-10 “Uncertainty in income taxes”
|
Provisions contained in ASC 740 – 10, related to uncertainty in income taxes, prescribe a comprehensive model for the recognition, measurement, financial statement presentation and disclosure of unrecognized tax benefits taken or expected to be taken in a tax return. The amount of unrecognized tax benefits identified at December 31, 2014, 2013 and 2012 are the amount that would affect the effective tax rate, if recognized. The total amount of unrecognized tax benefits in 2014, 2013 and 2012 was as follows:
|
2014
|
2013
|
2012
|
||||||||||
|
Unrecognized tax benefits, opening balance
|
Ps. | 87,867 | Ps. | 69,056 | Ps. | 67,123 | ||||||
|
Gross increases - current-period tax positions
|
19,018 | 32,149 | 27,181 | |||||||||
|
Increase from prior year
|
20,387 | 764 | – | |||||||||
|
Decrease in previous years (for closed periods)
|
(22,007 | ) | (14,102 | ) | (25,248 | ) | ||||||
|
Unrecognized tax benefits ending balance
|
105,265 | 87,867 | 69,056 | |||||||||
|
Interest and penalties
|
32,298 | 37,181 | 28,674 | |||||||||
|
Total
|
137,563 | 125,048 | 97,730 | |||||||||
|
Unrecognized tax benefits recognized through business combination adjustment (1) (2)
|
– | (19,913 | ) | (29,053 | ) | |||||||
|
Difference to be recognized under U.S. GAAP shareholders’ equity
|
Ps. | 137,563 | Ps. | 105,135 | Ps. | 68,677 | ||||||
|
(1)
|
Includes Ps. 11,631 of taxes, and Ps. 8,282 of interest and penalties, as of December 31, 2013.
|
|
(2)
|
Includes Ps. 18,531 of taxes, and Ps. 10,522 of interest and penalties, as of December 31, 2012.
|
The business combination amount relates to the difference between Colombian Banking GAAP and U.S. GAAP relating to business combinations and is included within row (m) of the U.S. GAAP reconciliations.
Included in the balance of total unrecognized tax benefits at December 31, 2014, are potential benefits of Ps. 105,265 and Ps. 32,298 of interest and penalties that if recognized, would affect the effective tax rate on income from continuing operations.
Ps. 3,400, Ps. 10,749, and Ps. 3,361 of interests and penalties related to unrecognized tax benefits were recognized in income tax expense for 2014, 2013 and 2012, respectively.
Grupo Aval is not aware of positions for which it is reasonably possible that the total amounts of unrecognized tax benefits will be significantly increased or decreased within the next 12 months from the reporting date.
The difference between the benefit recognized and the tax benefit claimed on a tax return is referred to as an unrecognized tax benefit, which is recognized as a reduction to a deferred tax asset in certain circumstances. The application of the ASU 2013-11 (
Income Taxes (Topic 740): Presentation of an Unrecognized Tax Benefit When a Net Operating Loss Carryforward, a Similar Tax Loss, or a Tax Credit Carryforward Exists (a consensus of the FASB Emerging Issues Task Force)
did not have a significant impact in Grupo Aval's accounting records under U.S. GAAP.
GRUPO AVAL ACCIONES Y VALORES S.A. AND ITS SUBSIDIARIES
NOTES TO THE CONSOLIDATED FINANCIAL STATEMENTS
FOR THE YEARS ENDED DECEMBER 31, 2014, 2013 AND 2012
(
Stated in millions of Colombian pesos and U.S. dollars)
The open tax years of the major companies of Grupo Aval are as follows:
|
Company
|
Open tax year
|
|
|
Banco de Bogotá S. A.
|
2014 and 2013
|
|
|
Banco Comercial AV Villas S. A.
|
2014 to 2009 and 2007
|
|
|
Banco Popular S. A.
|
2014 to 2012
|
|
|
Banco de Occidente S. A.
|
2014 to 2012
|
|
|
Grupo Aval Acciones y Valores S. A.
|
2014 and 2013
|
|
b)
|
Employee benefit plans:
|
The following tables provide the components of the net periodic benefit costs charged to the consolidated Statement of Income:
|
Pension plans
|
Other benefits
|
|||||||||||||||||||||||
|
2014
|
2013
|
2012
|
2014
|
2013
|
2012
|
|||||||||||||||||||
|
Components of net periodic benefit cost
|
||||||||||||||||||||||||
|
Service cost
|
Ps. | – | Ps. | 13 | Ps. | 59 | Ps. | 26,020 | Ps. | 24,484 | Ps. | 20,234 | ||||||||||||
|
Interest cost
|
27,404 | 26,397 | 27,239 | 19,672 | 22,900 | 21,330 | ||||||||||||||||||
|
Amortization of net transition obligation
|
6,205 | 5,963 | 5,911 | 3,883 | 1,802 | 1,845 | ||||||||||||||||||
|
Amortization of net actuarial (gain) or loss
|
(9,742 | ) | 12,853 | 6,261 | (15,617 | ) | 1,857 | 15,003 | ||||||||||||||||
|
Net periodic pension cost under U.S. GAAP
|
23,867 | 45,226 | 39,470 | 33,958 | 51,043 | 58,412 | ||||||||||||||||||
|
Net periodic pension cost from Promigas Consolidation (See note m ii)
|
555 | (54 | ) | – | (114 | ) | (1,394 | ) | – | |||||||||||||||
|
Net periodic pension cost under Colombian Banking GAAP
|
(34,996 | ) | (43,960 | ) | (43,271 | ) | (39,014 | ) | (42,883 | ) | (46,937 | ) | ||||||||||||
|
Difference recognized under U.S. GAAP
|
Ps. | (10,574 | ) | Ps. | 1,212 | Ps. | (3,801 | ) | Ps. | (5,170 | ) | Ps. | 6,766 | Ps. | 11,475 | |||||||||
The following table provides a reconciliation of the changes in the pension and other benefit obligations for the years ended December 31, 2014 and 2013 and a statement of funded status as of December 31, 2014 and 2013:
|
Pension plans
|
Other benefits
|
|||||||||||||||
|
2014
|
2013
|
2014
|
2013
|
|||||||||||||
|
Change in projected benefit obligation
|
||||||||||||||||
|
Unfunded benefit obligation at beginning of year
|
Ps. | 383,782 | Ps. | 426,314 | Ps. | 274,101 | Ps. | 268,125 | ||||||||
|
Service cost
|
– | 13 | 26,020 | 24,484 | ||||||||||||
|
Interest cost
|
27,404 | 26,397 | 19,672 | 22,900 | ||||||||||||
|
Actuarial (gain)/loss, net
|
2,395 | (31,600 | ) | (49,992 | ) | 1,498 | ||||||||||
|
Pension settlement
|
(4,116 | ) | (2,058 | ) | – | – | ||||||||||
|
Benefits paid
|
(32,283 | ) | (34,044 | ) | (42,002 | ) | (42,906 | ) | ||||||||
|
Unfunded benefit obligation at end of year
|
377,182 | 385,022 | 227,799 | 274,101 | ||||||||||||
|
Plan asset
|
– | (1,240 | ) | – | – | |||||||||||
|
Net accrued benefit plans under U.S. GAAP
|
377,182 | 383,782 | 227,799 | 274,101 | ||||||||||||
|
Net accrued benefit plans from Promigas consolidation (see note m)
|
(428 | ) | (468 | ) | (7,699 | ) | (11,367 | ) | ||||||||
|
Accrued benefit cost under Colombian Banking GAAP
|
(312,081 | ) | (313,435 | ) | (44,563 | ) | (45,836 | ) | ||||||||
|
Difference recognized under U.S. GAAP shareholders’ equity
|
Ps. | 64,673 | Ps. | 69,879 | Ps. | 175,537 | Ps. | 216,898 | ||||||||
F-82
GRUPO AVAL ACCIONES Y VALORES S.A. AND ITS SUBSIDIARIES
NOTES TO THE CONSOLIDATED FINANCIAL STATEMENTS
FOR THE YEARS ENDED DECEMBER 31, 2014, 2013 AND 2012
(
Stated in millions of Colombian pesos and U.S. dollars)
Pension Plan
The measurement of pension plan obligations differs from Colombian Banking GAAP to U.S. GAAP basically due to the fact that Colombian Banking GAAP requires a calculation of the estimated liability using the actuarial methodology mortality data and projection rates determined by law, including but not limited to, actuarial assumptions or increase rates. For U.S. GAAP purposes, actuarial valuations of pension plans are performed annually using the projected unit credit method, which requires the use of entity and market specific assumptions.
Other benefits
|
·
|
Under Colombian labor regulations, employees are entitled to receive one month’s salary for each year of service. This benefit is accumulated annually, transferred to a contribution pension fund and paid to the employees upon their termination or retirement from Grupo Aval. No differences are recognized for U.S. GAAP purposes. However, employees hired before 1990 are subject to a different regulation under which Grupo Aval has the obligation to pay the accumulated benefits upon their termination or retirement calculated based on the last salary of the employee and multiplied by the years of service rendered. Under Colombian Banking GAAP, this benefit is accrued on an annual basis and does not consider possible future obligations or increases in salaries. Under U.S. GAAP, these benefits are recognized using the projected unit credit method.
|
|
·
|
Under Colombian labor regulations, employers and employees are entitled to privately negotiate compensation, other than for benefit plans, which are stated by the law. Based on such agreements, Grupo Aval recognizes an additional premium paid to its employees on the date of retirement. Calculation of the premium pension plan varies from Colombian Banking GAAP to U.S. GAAP because the latter is performed using the projected unit credit method, while under Colombian Banking GAAP benefits are recognized when paid.
|
|
·
|
Active Grupo Aval employees are entitled to a seniority bonus which depends on the number of years of service with Grupo Aval. Benefits are calculated as days of salary (between 15 and 180) and paid at the moment the employee has completed a specific period of service years. Calculation of the seniority bonus differs from Colombian Banking GAAP to U.S. GAAP because the latter applies requirements from ASC 710-10-25. Grupo Aval, for the purpose of this calculation, uses the projected unit credit method, while under Colombian Banking GAAP the seniority bonus is recognized when paid.
|
|
·
|
Some retirees pensioned by Grupo Aval receive payments related to medical treatment, hospitalization and surgical events. Calculations differ between Colombian Banking GAAP and U.S. GAAP because the latter is performed using the projected unit credit method, while under Colombian Banking GAAP benefits are recognized when paid.
|
Disclosure and calculation of differences under U.S. GAAP
|
Pension Plans
|
Other Benefits
|
|||||||||||||||
|
2014
|
2013
|
2014
|
2013
|
|||||||||||||
|
Net amount recognized in the Consolidated Balance Sheet at December 31,
|
||||||||||||||||
|
Statement of Financial Position
|
||||||||||||||||
|
Current liabilities
|
Ps. | 33,537 | Ps. | 34,496 | Ps. | 48,649 | Ps. | 40,819 | ||||||||
|
Noncurrent liabilities
|
343,645 | 349,286 | 179,150 | 231,516 | ||||||||||||
|
Amount recognized in financial position
|
Ps. | 377,182 | Ps. | 383,782 | Ps. | 227,799 | Ps. | 274,101 | ||||||||
|
Accumulated other comprehensive income
|
||||||||||||||||
|
Net actuarial losses
|
Ps. | (65,741 | ) | Ps. | (53,604 | ) | Ps. | (18,430 | ) | Ps. | (52,804 | ) | ||||
|
Net transition obligation
|
(42,888 | ) | (49,093 | ) | (7,946 | ) | (11,830 | ) | ||||||||
|
Total at December 31
|
Ps. | (108,629 | ) | (102,697 | ) | Ps. | (26,376 | ) | Ps. | (64,634 | ) | |||||
|
Deferred income tax
|
40,875 | 34,916 | 12,070 | 21,796 | ||||||||||||
|
Accumulated other comprehensive income
|
Ps. | (67,754 | ) | Ps. | (67,781 | ) | Ps. | (14,306 | ) | Ps. | (42,658 | ) | ||||
F-83
GRUPO AVAL ACCIONES Y VALORES S.A. AND ITS SUBSIDIARIES
NOTES TO THE CONSOLIDATED FINANCIAL STATEMENTS
FOR THE YEARS ENDED DECEMBER 31, 2014, 2013 AND 2012
(
Stated in millions of Colombian pesos and U.S. dollars)
Changes in the accumulated other comprehensive income before income tax during the years 2014, 2013 and 2012 are described as follows:
|
Pension Plans
|
Other Benefits
|
|||||||||||||||||||||||
|
2014
|
2013
|
2012
|
2014
|
2013
|
2012
|
|||||||||||||||||||
|
(Increase) decrease in
accumulated other comprehensive income
|
||||||||||||||||||||||||
|
Recognized during year - transition obligation
|
Ps. | (6,205 | ) | Ps. | (5,963 | ) | Ps. | (5,911 | ) | Ps. | (3,883 | ) | Ps. | (1,802 | ) | Ps. | (1,845 | ) | ||||||
|
Recognized during year - net actuarial losses/(gains)
|
2,395 | (31,600 | ) | 45,937 | (49,992 | ) | 1,498 | 51,370 | ||||||||||||||||
|
Occurring during year - net actuarial (losses)/gains
|
9,742 | (12,853 | ) | (6,261 | ) | 15,617 | (1,857 | ) | (15,003 | ) | ||||||||||||||
|
Accumulated other comprehensive income before income tax
|
Ps. | 5,932 | Ps. | (50,416 | ) | Ps. | 33,765 | Ps. | (38,258 | ) | Ps. | (2,161 | ) | Ps. | 34,522 | |||||||||
The effect of a one-percentage-point increases or decreases in the assumed health care cost trend rates on the aggregate of the service and interest cost components of net periodic postretirement health care benefit costs as well the effects on the accumulated postretirement benefit obligation for health care benefits are displayed in the table below. Measuring the sensitivity of the accumulated postretirement benefit obligation and the combined service and interest cost components to a change in the assumed health care cost trend rates requires remeasuring the accumulated postretirement benefit obligation as of the beginning and end of the year.
Assumed health care cost trend rates have an effect on the amounts reported for the health care planes. One percentage point change in assumed health care cost trend rates would have the following effects:
|
1% Percentage Point
|
||||||||
|
Increase
|
Decrease
|
|||||||
|
Total of service and interest cost
|
Ps. | 812 | Ps. | 714 | ||||
|
Total projected benefit obligation
|
Ps. | 9,826 | Ps. | 11,197 | ||||
Grupo Aval expects the following amounts in other comprehensive income to be recognized as components of net periodic pension cost related to the pension plan and other benefits during 2015:
|
Pension
|
Other benefits
|
|||||||
|
Net transition obligation
|
Ps. | 3,559 | Ps. | 948 | ||||
|
Net gain
|
2,852 | 948 | ||||||
|
Total
|
Ps. | 6,411 | Ps. | 1,896 | ||||
The economic assumptions adopted (shown below in nominal terms) are used in determining the actuarial present value of pension obligation and the projected pension obligations for the plan years:
|
Pension Plans
|
Other Benefits
|
||||||
|
2014
|
2013
|
2014
|
2013
|
||||
|
Discount rate
|
7.60%
|
7.50%
|
7.60%
|
7.50%
|
|||
|
Rate of compensation increases
|
3.00%
|
3.00%
|
3.00%
|
3.00%
|
|||
|
Rate of pension increases
|
3.00%
|
3.00%
|
–
|
–
|
|||
GRUPO AVAL ACCIONES Y VALORES S.A. AND ITS SUBSIDIARIES
NOTES TO THE CONSOLIDATED FINANCIAL STATEMENTS
FOR THE YEARS ENDED DECEMBER 31, 2014, 2013 AND 2012
(
Stated in millions of Colombian pesos and U.S. dollars)
Estimated Future Benefit Payments
The benefit payments, which reflect expected future services, as appropriate, are expected to be paid as follows:
|
Pension
|
Other benefits
|
|||||||
|
2015
|
Ps. | 33,537 | Ps. | 48,649 | ||||
|
2016
|
33,127 | 30,535 | ||||||
|
2017
|
32,217 | 35,084 | ||||||
|
2018
|
30,888 | 31,139 | ||||||
|
2019
|
29,158 | 28,863 | ||||||
|
Years 2020 – 2024
|
118,704 | 112,182 | ||||||
|
c)
|
Fixed assets:
|
The following table shows the adjustments for each item:
|
Net income
|
Shareholders’ equity
|
|||||||||||||||||||
|
2014
|
2013
|
2012
|
2014
|
2013
|
||||||||||||||||
|
Reversal of depreciation recorded under Colombian Banking GAAP on property, plant and equipment acquired with income tax benefits
|
Ps. | 29,592 | Ps. | 29,666 | Ps. | 55,556 | Ps. | 273,248 | Ps. | 243,656 | ||||||||||
|
Business combination (see note m)
|
– | – | – | 6,690 | 6,690 | |||||||||||||||
|
Reversal of provisions under Colombian Banking GAAP
|
9,995 | 2,785 | ( 14,575 | ) | 19,466 | 9,471 | ||||||||||||||
|
Total
|
Ps. | 39,587 | Ps. | 32,451 | Ps. | 40,981 | Ps. | 299,404 | Ps. | 259,817 | ||||||||||
Depreciation adjustment on property, plant and equipment purchased with income tax benefits
Under Colombia tax law, certain acquisitions of property, plant and equipment have an additional deduction over the total depreciation of such assets, recognized in the income tax return on the year when such assets are purchased. Under U.S. GAAP, specifically ASC 740-10-25-51, the tax effect of asset purchases that are not business combinations in which the amount paid differs from the tax basis of the asset does not result in immediate income statement recognition and, thus, is recorded as a deferred tax asset, which results in a decrease in the book value of such assets. For any previously recognized gains a debit should be recognized to the income statement for the difference between the valuation and the current book value of the assets.
This adjustment relates to the lower amount of depreciation expense and accumulated depreciation of certain property, plant and equipment to be recognized for U.S. GAAP purposes. This is due to the fact that the book value of these assets is lower than the amount presented under Colombian Banking GAAP based on the recognition under U.S. GAAP of the related deferred tax asset on additional tax deductions (See literal a)(1) above). This deduction was discontinued by the authorities in 2011, except for leasing operations of Banco de Occidente which according to a special agreement signed with the Colombian Government will maintain a deduction of 30% until 2028.
Impairment of fixed assets and reversals of provisions recorded under Colombian Banking GAAP
Under Colombian Banking GAAP, technical appraisals for property, plant and equipment are performed every three years. If the value from the appraisal is lower than the carrying value, the difference is recorded as an allowance in the consolidated balance sheet with the corresponding debit entry to equity. Reversal of the allowance is permitted for subsequent recoveries of the appraised asset.
F-85
GRUPO AVAL ACCIONES Y VALORES S.A. AND ITS SUBSIDIARIES
NOTES TO THE CONSOLIDATED FINANCIAL STATEMENTS
FOR THE YEARS ENDED DECEMBER 31, 2014, 2013 AND 2012
(
Stated in millions of Colombian pesos and U.S. dollars)
Under U.S. GAAP, in accordance with ASC 360-10, Property, Plant and Equipment, “Impairment or Disposal of Long-Lived Assets” an impairment test for a long-lived asset must be performed whenever events or changes in circumstances indicate that the carrying amount of an asset may not be recoverable. Impairment is recognized only if the carrying amount of a long-lived asset is not recoverable and exceeds its fair value. The carrying amount of a long-lived asset is not recoverable if it exceeds the sum of the undiscounted cash flows expected to result from the use and eventual disposal of the asset. An impairment loss should be measured as the amount by which the carrying amount of a long-lived asset exceeds its fair value. Reversal of impairment is not permitted for subsequent recoveries in the fair value of the asset.
Under U.S. GAAP and based on triggering events and subsequent calculations following the guidance mentioned above, Grupo Aval did not need to record impairments in long-lived assets during 2014, 2013 and 2012. Under Colombian Banking GAAP impairment is reviewed every three years, while impairment under U.S. GAAP is reviewed yearly or upon any triggering events.
|
d)
|
Reappraisal of assets:
|
In accordance with Colombian Banking GAAP, reappraisals of a portion of Grupo Aval’s property, plant and equipment, equity investments and other non-monetary assets are made periodically. The surplus between the appraisal and the book value of the asset is recorded in the balance sheet of each individual company of Grupo Aval under the asset caption “reappraisal of assets” and the shareholders’ equity under the caption “Equity Surplus: reappraisals of assets”. Technical appraisals for PP&E are performed every three years. In the consolidation process, the portion of equity surplus from reappraisal of assets acquired in business combination is eliminated while the portion related to the “reappraisal of assets” remains in the balance sheet until the asset is sold. Another portion of “Equity Surplus of Reappraisal of Assets” from subsidiaries not wholly owned for Colombian Banking GAAP is reclassified as part of the non controlling interest liability.
Under U.S. GAAP, such reappraisals of assets are not allowed and, therefore, are reversed out for the purpose of this U.S. GAAP reconciliation. This adjustment does not have impact on the reconciliation of the Statement of Income because under Colombian Banking GAAP, reappraisals are not amortized. The total effect of this adjustment decreases the shareholders’ equity under U.S. GAAP by Ps. 1,644,131, and Ps. 1,454,550 as of December 31, 2014 and 2013, respectively.
|
e)
|
Allowance for losses on loans, leases and foreclosed assets:
|
The following summarizes the allowance for loan and lease losses and foreclosed assets under Colombian Banking GAAP and U.S. GAAP:
|
2014
|
2013
|
|||||||
|
Allowance for loans losses, financial leases losses and other receivables under Colombian Banking GAAP:
|
||||||||
|
Allowance for loans and financial lease losses
|
Ps. | (3,413,680 | ) | Ps. | (3,073,035 | ) | ||
|
Allowance for accrued interest and other receivables
|
(268,304 | ) | (227,372 | ) | ||||
| (3,681,984 | ) | (3,300,407 | ) | |||||
|
U.S. GAAP adjustments:
|
||||||||
|
Business combination (1)
|
228,204 | 240,342 | ||||||
|
Difference recognized in shareholders’ equity under U.S. GAAP (2)
|
560,421 | 445,432 | ||||||
|
Allowance for certain variable interest entities (See iv)r) (3)
|
(1,123 | ) | (1,099 | ) | ||||
|
Allowance for loans losses, financial leases losses and other receivables under U.S. GAAP
|
(2,894,482 | ) | ( 2,615,733 | ) | ||||
|
Allowance for foreclosed assets under Colombian Banking GAAP
|
(211,584 | ) | (168,708 | ) | ||||
|
Difference recognized in shareholders’ equity under U.S. GAAP (4)
|
76,763 | 86,590 | ||||||
|
Allowance for certain variable interest entities (See iv)r) (3)
|
(7,882 | ) | (19,796 | ) | ||||
|
Allowance for foreclosed assets under U.S. GAAP
|
(142,703 | ) | (101,914 | ) | ||||
|
Total difference recognized in shareholders’ equity under U.S. GAAP
|
Ps. | 637,184 | Ps. | 532,023 | ||||
F-86
GRUPO AVAL ACCIONES Y VALORES S.A. AND ITS SUBSIDIARIES
NOTES TO THE CONSOLIDATED FINANCIAL STATEMENTS
FOR THE YEARS ENDED DECEMBER 31, 2014, 2013 AND 2012
(
Stated in millions of Colombian pesos and U.S. dollars)
The following table summarizes the U.S. GAAP allowance adjustment losses on financial leases, loans and foreclosed assets to the consolidated statement of income:
|
2014
|
2013
|
2012
|
||||||||||
|
Provision for loan and financial lease losses
|
Ps. | 114,916 | Ps. | 141,611 | Ps. | (94,044 | ) | |||||
|
Accounts receivables
|
632 | 211 | (210 | ) | ||||||||
|
Non-performing loans securitization
|
(1,025 | ) | 1,416 | (952 | ) | |||||||
|
Foreclosed assets
|
(9,828 | ) | 18,243 | (11,903 | ) | |||||||
|
Adjustment for VIE’s
|
466 | (1,176 | ) | 8,744 | ||||||||
| Ps. | 105,161 | Ps. | 160,305 | Ps. | ( 98,365 | ) | ||||||
|
Gross loans and financial leases
|
Ps. | 117,641,834 | Ps. | 102,027,755 | Ps. | 85,983,991 | ||||||
|
Allowance at the end of the period as a percentage of gross loans
|
2.46 | % | 2.56 | % | 2.73 | % | ||||||
|
(1)
|
Business Combinations:
|
This amount reflects historical adjustments from business combinations, see note (m) for a further description of business combinations. Under Colombian Banking GAAP in a business combination process, the allowance for loan losses of the entity acquired is maintained following the business combination. Under U.S. GAAP, the balances of loan portfolios and their allowances acquired in business combination transactions are adjusted to their fair value.
|
(2)
|
Difference recognized in shareholders’ equity under U.S. GAAP:
|
As established by the Superintendency of Finance, the methodology for evaluating loans and financial leases under Colombian Banking GAAP is based on their inherent risk characteristics and serves as a basis for recording provisions based on loss percentage estimates set out in tables provided directly by the Superintendency of Finance. This methodology reflects economic conditions in the sector in Colombia as well as pro-cyclical components reflecting possible future economic conditions such as expected losses. The tables on pages F-21 and F-23 provide a more detailed description of the subject. Under Colombian Banking GAAP, the loan loss allowance is determined and monitored on an ongoing basis and is established through periodic provisions charged to the condensed Statement of Income.
Commercial and consumer loans number of days the loans are past due are provisioned according to models developed by the Superintendency of Finance, which take into consideration the gains analysis of loans. The allowance for these loans calculated in these models is determined by considering the “expected loss.” The expected loss for these loans is determined by multiplying the exposure to default of the loans by its “probability of default” (likelihood of a borrower defaulting on an obligation within the next 12 months) and its “loan losses” (an estimate of the amount the Bank would expect to lose in the event a borrower defaults). For purposes of calculating “loan losses”, collateralized loans are subject to appraisals by independent third parties. These appraisals may differ from the appraisals that would be calculated when the collateral finally would be recognized. Both the probability of default and the loan loss values are provided by the Superintendency of Finance depending on each category of credit risk and each type of loan. Furthermore, portfolios for which the Superintendency of Finance does not provide a standard model, specifically mortgage and microcredit loans, require a general allowance equal to 1.0% of the gross portfolio value in addition to specific provisions mandated according to the individual loans’ risk category. The table on page F-23 presents more detailed information.
Under Colombian regulations for restructure troubled loans, financial entities should comply with certain local legal requirements. Once in compliance, troubled loans that have been restructured are assigned a risk category in the same way that the performing loans and the allowance is established according to each type of credit and risk category assigned. Recoveries of provisions previously recognized are not permitted until the customer complies with the restructured terms. However, certain loans with guarantees granted by the National Government are exempt from this provision.
GRUPO AVAL ACCIONES Y VALORES S.A. AND ITS SUBSIDIARIES
NOTES TO THE CONSOLIDATED FINANCIAL STATEMENTS
FOR THE YEARS ENDED DECEMBER 31, 2014, 2013 AND 2012
(
Stated in millions of Colombian pesos and U.S. dollars)
ASC 310 Subsequent measurement analysis
Under U.S. GAAP, management uses a systematic methodology to establish the amount of allowance for loan losses and the provisions for loan losses it considers appropriate to provide for probable losses in the portfolio.
In compliance with ASC 310, Grupo Aval evaluates loans individually, analyzing each client’s debt profile, financial guarantees, and data from credit reporting services in Colombia. Loans are considered impaired when, based on current information and events, it is probable that the bank will be unable to collect a portion of or all amounts due according to the contractual terms of the original loan agreement, including contractual interest payments. When a loan has been identified as impaired, the amount of impairment is measured as the cash flow of expected repayments discounted using the loan’s contractual interest rate at the time of the calculation or as the fair value of the underlying collateral less estimated selling costs when it is determined that the source of repayment is the liquidation of the underlying collateral.
The allowance consists of specific, historical, and subjective components. The methodology includes the following elements:
|
–
|
A periodic detailed analysis of the loan portfolio;
|
|
–
|
A systematic loan grading system;
|
|
–
|
A periodic review of the summary of the allowance for loan losses;
|
|
–
|
Identification of loans to be evaluated on an individual basis for impairment under ASC Section 310-10-35, “Subsequent Measurement” of ASC Topic 310, “Receivables”;
|
|
–
|
Consideration of internal factors such as our size, organizational structure, loan portfolio structure, loan administration procedures, past due and delinquency trends, and historical loss experience;
|
|
–
|
Consideration of risks inherent to different kinds of lending; and
|
|
–
|
Consideration of external factors such as local, regional, and national economic factors;
|
ASC 450 Loss Contingency Analysis
To calculate the allowance required for smaller balance, portfolios impaired loans and all performing loans, Grupo Aval performs an analysis of historical losses from our consumer and performing commercial loan portfolios in order to estimate losses for U.S. GAAP purposes resulting from loan losses that have been incurred in such loan portfolios at the balance sheet date, but which had not been individually identified. Loss estimates are analyzed by loan type and thus for homogeneous groups of clients. Historical loss rates used in the process are updated to incorporate the most recent data reflecting current economic conditions, industry performance trends, geographic or obligor concentrations within each portfolio segment, and any other pertinent information that may affect the estimation of the allowance for loan losses. Many factors can affect Grupo Aval’s estimates of allowance for loan losses, including volatility of default probability, migrations and estimated loss severity. Loans are written off when deemed uncollectible. Recoveries of previously written off loans are recorded by decreasing the allowance.
In addition, under Colombian Banking GAAP, Grupo Aval maintains a provision for credit losses on off-balance sheet credit instruments, including commitments to extend credit, guarantees granted, standby letters of credit and other financial instruments. For U.S. GAAP purposes this provision is recorded as a liability. Grupo Aval follows the same methodology described for allowances for loan losses, including an estimated probability of drawdown by the borrower.
GRUPO AVAL ACCIONES Y VALORES S.A. AND ITS SUBSIDIARIES
NOTES TO THE CONSOLIDATED FINANCIAL STATEMENTS
FOR THE YEARS ENDED DECEMBER 31, 2014, 2013 AND 2012
(
Stated in millions of Colombian pesos and U.S. dollars)
|
(3)
|
Allowance for certain variable interest entities:
|
According to ASC 310-40 this item corresponds to allowances for loans under U.S. GAAP and adjustments for fair value less the costs to sell of foreclosed assets according to variable interest entities that are not consolidated under Colombian Banking GAAP but are required to be consolidated under U.S. GAAP. See note (r).
|
(4)
|
Difference recognized in shareholders’ equity under U.S. GAAP for
foreclosed assets:
|
In accordance with Colombian Banking GAAP, foreclosed assets are recognized at fair value and should be sold within two years from the date of foreclosure. During the first year following the date of foreclosure of a real estate asset, a provision equal to 30% of the carrying value of the asset at the time of receipt is recognized in the Consolidated Statement of Income in proportional monthly charges. This provision increases by an additional 30% in proportional monthly charges within the second year following date of foreclosure of the asset. If the legal term for sale has expired, an authorization for extension is required by the Superintendency of Finance. If the authorization is not granted, a provision equal to 80% of the carrying value of the asset should be recognized. If the extension is granted, the remaining 20% of the provision should be recognized by the end of the extension period.
For foreclosed assets that are not real estate, the provision is equal to 35% of the carrying value of the asset at the time of foreclosure and is adjusted in proportional monthly charges within the first year following the receipt. This provision is increased by an additional 35% within the second year. If the legal term for sale has expired without authorization for extension, the provision is increased up to 100%. If extension is granted, the remaining 30% of the provision is recognized by the end of the extension period.
Under U.S. GAAP ASC 310-40, foreclosed assets shall be classified as assets “held-for-sale” and recognized at the lower of their carrying amounts at foreclosure or fair value less the cost to sell, in the period in which all of the following criteria are met: (a) management, having the authority to approve the action, commits to a plan to sell the asset, (b) the asset is available for immediate sale in its present condition subject only to terms that are usual and customary for sales of such assets, (c) an active program to locate a buyer and other actions required to complete the plan to sell the asset have been initiated, (d) the sale of the asset is probable, and transfer of the asset is expected to qualify for recognition as a completed sale, within one year, (e) the asset is being actively marketed for sale at a price that is reasonable in relation to its current fair value and (f) actions required to complete the plan indicate that it is unlikely that significant changes to the plan will be made or that the plan will be withdrawn. If at any time the criteria in the paragraph above are no longer met, a long-lived asset classified as held for sale is reclassified to in use. Therefore, the foreclosed assets population analysis is the same under both Colombian Banking GAAP and U.S. GAAP. The adjustment reflects the reversal of a portion of the provisions recorded under Colombian Banking GAAP to adjust the value of the assets to the lower of their carrying amount at the date of foreclosure or fair value less costs to sell.
GRUPO AVAL ACCIONES Y VALORES S.A. AND ITS SUBSIDIARIES
NOTES TO THE CONSOLIDATED FINANCIAL STATEMENTS
FOR THE YEARS ENDED DECEMBER 31, 2014, 2013 AND 2012
(
Stated in millions of Colombian pesos and U.S. dollars)
Additional disclosures under ASU 2010-20
The following summarizes each class of financing receivable and the allowance for loan losses under Colombian Banking GAAP and U.S. GAAP as of December 31, 2014 and 2013:
Loan Portfolio Breakdown - by type of loan as of December 31, 2014
|
Commercial
|
Consumer
|
Residential Mortgage
|
Microcredit
|
Financial Leasing
|
Total
|
|||||||||||||||||||
|
Loans and financial leases portfolio recorded under Colombian Banking GAAP
|
Rs. | 62,764,815 | Rs. | 33,166,392 | Rs. | 9,034,677 | Rs. | 351,781 | Rs. | 7,438,413 | Rs. | 112,756,078 | ||||||||||||
|
U.S. GAAP adjustments and reclassifications:
|
||||||||||||||||||||||||
|
Leasing operations
|
– | – | – | – | 372,354 | 372,354 | ||||||||||||||||||
|
Adjustments related to consolidation of VIEs
|
(19,498 | ) | – | (8 | ) | – | – | (19,506 | ) | |||||||||||||||
|
Payments on behalf of customers
|
69,389 | 27,539 | 2,345 | 1,925 | 9,607 | 110,805 | ||||||||||||||||||
|
Loan origination costs
|
44,137 | 154,587 | 6,498 | 1,509 | 8,035 | 214,766 | ||||||||||||||||||
|
Loans to finance preferred shares
|
(113,024 | ) | (38 | ) | – | – | – | (113,062 | ) | |||||||||||||||
|
Business combinations
|
152,636 | 539,420 | (86,399 | ) | – | (141 | ) | 605,516 | ||||||||||||||||
|
Interest received in advance
|
(26,727 | ) | (24,278 | ) | (2,354 | ) | (21 | ) | (2,045 | ) | (55,425 | ) | ||||||||||||
|
Suspension of accruals
|
– | 14,462 | 1,518 | 2,346 | – | 18,326 | ||||||||||||||||||
|
Loan installments pending application
|
(30,678 | ) | (241,036 | ) | (340 | ) | (7 | ) | – | (272,061 | ) | |||||||||||||
|
Reclassifications under U.S. GAAP(*)
|
2,653,934 | 469,956 | 47,148 | 7,199 | 845,806 | 4,024,043 | ||||||||||||||||||
|
Gross loan and financial leases portfolio under U.S. GAAP
|
65,494,984 | 34,107,004 | 9,003,085 | 364,732 | 8,672,029 | 117,641,834 | ||||||||||||||||||
|
Allowance for loan and financial lease losses:
|
||||||||||||||||||||||||
|
Principal – Colombian Banking GAAP
|
(1,460,471 | ) | (1,602,265 | ) | (87,264 | ) | (31,223 | ) | (232,457 | ) | (3,413,680 | ) | ||||||||||||
|
Interest – Colombian Banking GAAP
|
(50,547 | ) | (38,841 | ) | (2,282 | ) | (1,278 | ) | (3,423 | ) | (96,371 | ) | ||||||||||||
|
U.S. GAAP adjustments:
|
||||||||||||||||||||||||
|
Other adjustments– Col GAAP
|
(127,097 | ) | (32,552 | ) | (1,881 | ) | (1,469 | ) | (8,933 | ) | (171,932 | ) | ||||||||||||
|
Reduction of allowance for loan losses and lease losses for U.S. GAAP purposes.
|
212,298 | 257,878 | 26,253 | (10,487 | ) | 74,479 | 560,421 | |||||||||||||||||
|
Adjustment related to consolidation of VIEs
|
(1,123 | ) | – | – | – | – | (1,123 | ) | ||||||||||||||||
|
Business combinations
|
168,920 | 42,053 | 17,089 | – | 141 | 228,204 | ||||||||||||||||||
|
Allowance for loan losses and financial lease losses under U.S. GAAP
|
(1,258,020 | ) | (1,373,727 | ) | (48,085 | ) | (44,457 | ) | (170,193 | ) | (2,894,482 | ) | ||||||||||||
|
Net book value under U.S. GAAP
|
Rs. | 64,236,964 | Rs. | 32,733,277 | Rs. | 8,955,000 | Rs. | 320,275 | Rs. | 8,501,836 | Rs. | 114,747,352 | ||||||||||||
GRUPO AVAL ACCIONES Y VALORES S.A. AND ITS SUBSIDIARIES
NOTES TO THE CONSOLIDATED FINANCIAL STATEMENTS
FOR THE YEARS ENDED DECEMBER 31, 2014, 2013 AND 2012
(
Stated in millions of Colombian pesos and U.S. dollars)
Loan Portfolio Breakdown - by type of loan as of December 31, 2013
|
Commercial
|
Consumer
|
Residential Mortgage
|
Microcredit
|
Financial Leasing
|
Total
|
|||||||||||||||||||
|
Loans and financial leases portfolio recorded under Colombian Banking GAAP
|
Ps. | 54,855,580 | Ps. | 27,801,275 | Ps. | 6,520,119 | Ps. | 341,857 | Ps. | 6,994,991 | Ps. | 96,513,822 | ||||||||||||
|
U.S. GAAP adjustments and reclassifications:
|
||||||||||||||||||||||||
|
Leasing operations
|
– | – | – | – | 415,548 | 415,548 | ||||||||||||||||||
|
Adjustments related to consolidation of VIEs
|
(23,225 | ) | – | 15,132 | – | – | (8,093 | ) | ||||||||||||||||
|
Payments on behalf of customers
|
69,008 | 24,867 | 958 | 1,352 | 5,707 | 101,892 | ||||||||||||||||||
|
Loan origination costs
|
76,920 | 114,192 | 4,978 | 1,587 | 10,204 | 207,881 | ||||||||||||||||||
|
Loans to finance preferred shares
|
(117,880 | ) | (1,417 | ) | – | (5 | ) | – | (119,302 | ) | ||||||||||||||
|
Business combinations
|
78,854 | 448,669 | (70,276 | ) | – | (101 | ) | 457,146 | ||||||||||||||||
|
Interest received in advance
|
(23,857 | ) | (26,871 | ) | (2,095 | ) | (16 | ) | (2,139 | ) | (54,978 | ) | ||||||||||||
|
Suspension of accruals
|
– | 12,799 | 1,418 | 2,260 | – | 16,477 | ||||||||||||||||||
|
Loan installments pending
of application
|
(33,350 | ) | (243,799 | ) | (680 | ) | (108 | ) | – | (277,937 | ) | |||||||||||||
|
Reclassifications under U.S. GAAP(*)
|
3,599,635 | 445,354 | 43,903 | 7,218 | 679,189 | 4,775,299 | ||||||||||||||||||
|
Gross loan and financial leases portfolio under U.S. GAAP
|
58,481,685 | 28,575,069 | 6,513,457 | 354,145 | 8,103,399 | 102,027,755 | ||||||||||||||||||
|
Allowance for loan and financial lease losses:
|
||||||||||||||||||||||||
|
Principal – Colombian Banking GAAP
|
(1,358,538 | ) | (1,402,461 | ) | (74,315 | ) | (27,778 | ) | (209,943 | ) | (3,073,035 | ) | ||||||||||||
|
Interest – Colombian Banking GAAP
|
(41,695 | ) | (36,669 | ) | (1,549 | ) | (1,162 | ) | (3,347 | ) | (84,422 | ) | ||||||||||||
|
U.S. GAAP adjustments:
|
||||||||||||||||||||||||
|
Other adjustment – Col GAAP
|
(93,427 | ) | (33,995 | ) | (9,276 | ) | (1,022 | ) | (5,233 | ) | (142,953 | ) | ||||||||||||
|
Reduction of allowance for loan losses and lease losses for U.S. GAAP purposes.
|
201,434 | 134,565 | 4,510 | (1,256 | ) | 83,974 | 423,227 | |||||||||||||||||
|
Adjustment related to consolidation of VIEs
|
(1,099 | ) | – | – | – | – | (1,099 | ) | ||||||||||||||||
|
Business combinations
|
203,266 | 42,053 | 17,089 | – | 141 | 262,549 | ||||||||||||||||||
|
Allowance for loan losses and financial lease losses under U.S. GAAP
|
(1,090,056 | ) | (1,296,507 | ) | (63,541 | ) | (31,219 | ) | (134,408 | ) | (2,615,733 | ) | ||||||||||||
|
Net book value under U.S. GAAP
|
Ps. | 57,391,629 | Ps. | 27,278,562 | Ps. | 6,449,916 | Ps. | 322,928 | Ps. | 7,968,990 | Ps. | 99,412,022 | ||||||||||||
|
(*)
|
These reclassifications are mainly related to interbank loans which are recorded as cash equivalents under Colombian Banking GAAP. Under U.S. GAAP, these loans do not meet the definition of cash equivalents, and therefore are recorded and presented as loans in the consolidated balance sheet.
|
GRUPO AVAL ACCIONES Y VALORES S.A. AND ITS SUBSIDIARIES
NOTES TO THE CONSOLIDATED FINANCIAL STATEMENTS
FOR THE YEARS ENDED DECEMBER 31, 2014, 2013 AND 2012
(
Stated in millions of Colombian pesos and U.S. dollars)
An analysis of the activity in the allowance for loan losses and financial lease losses under U.S. GAAP for the years ended December 31, 2014, 2013 and 2012 is as follows:
|
Commercial
|
Consumer
|
Residential mortgage
|
Leasing transactions
|
Microcredit
|
Total
|
|||||||||||||||||||
|
Allowance for loan losses and financial lease losses
|
||||||||||||||||||||||||
|
Balance as of December 31, 2012
|
Ps. | (1,064,208 | ) | Ps. | (727,738 | ) | Ps. | (75,583 | ) | Ps. | (128,173 | ) | Ps. | (17,225 | ) | Ps. | (2,012,927 | ) | ||||||
|
Write-offs
|
117,375 | 642,687 | (44,649 | ) | 26,939 | 12,774 | 755,126 | |||||||||||||||||
|
Recovery of write-offs
|
(67,671 | ) | (61,422 | ) | (3,696 | ) | (8,329 | ) | (1,532 | ) | (142,650 | ) | ||||||||||||
|
Provision recorded during the year
|
13,639 | (1,010,750 | ) | 62,918 | (14,269 | ) | (23,265 | ) | (971,727 | ) | ||||||||||||||
|
Foreign exchange differences
|
14,592 | 5,562 | 647 | 739 | 244 | 21,784 | ||||||||||||||||||
|
Balance as of December 31, 2013
|
(986,273 | ) | (1,151,662 | ) | (60,361 | ) | (123,093 | ) | (29,005 | ) | (2,350,394 | ) | ||||||||||||
|
Write-offs
|
103,765 | 874,963 | 3,135 | 9,733 | 29,409 | 1,021,006 | ||||||||||||||||||
|
Recovery of write-offs
|
(69,299 | ) | (64,323 | ) | (4,863 | ) | (8,179 | ) | (1,508 | ) | (148,172 | ) | ||||||||||||
|
Provision recorded during the period
|
(129,637 | ) | (941,252 | ) | 97 | (12,663 | ) | (30,086 | ) | (1,113,542 | ) | |||||||||||||
|
Foreign exchange differences
|
(8,612 | ) | (14,235 | ) | (1,549 | ) | (206 | ) | (28 | ) | (24,630 | ) | ||||||||||||
|
Balance as of December 31, 2014
|
(1,090,059 | ) | (1,296,507 | ) | (63,541 | ) | (134,408 | ) | (31,219 | ) | (2,615,733 | ) | ||||||||||||
|
Write-offs
|
235,882 | 1,092,785 | 13,544 | 35,765 | 30,679 | 1,408,655 | ||||||||||||||||||
|
Recovery of write-offs
|
(80,614 | ) | (91,697 | ) | (3,833 | ) | (10,460 | ) | (2,599 | ) | (189,203 | ) | ||||||||||||
|
Provision recorded during the period
|
(286,223 | ) | (1,011,271 | ) | 9,560 | (60,608 | ) | (41,065 | ) | (1,389,607 | ) | |||||||||||||
|
Foreign exchange differences
|
(37,006 | ) | (67,037 | ) | (3,815 | ) | (483 | ) | (253 | ) | (108,594 | ) | ||||||||||||
|
Balance as of December 31, 2014
|
Ps. | (1,258,020 | ) | Ps. | (1,373,727 | ) | Ps. | (48,085 | ) | Ps. | (170,193 | ) | Ps. | (44,457 | ) | Ps. | (2,894,482 | ) | ||||||
Loans and asset quality
The following tables are presented for each class of financing receivable and provide additional information about Grupo Aval’s credit risks and the adequacy of our allowance for credit losses.
GRUPO AVAL ACCIONES Y VALORES S.A. AND ITS SUBSIDIARIES
NOTES TO THE CONSOLIDATED FINANCIAL STATEMENTS
FOR THE YEARS ENDED DECEMBER 31, 2014, 2013 AND 2012
(
Stated in millions of Colombian pesos and U.S. dollars)
Allowance for loan losses
The following table sets forth the allocation of the allowances by loan category as of December 31, 2014 and 2013:
Allowance for Loan Losses and Outstanding Gross Loan Portfolio as of December 31, 2014
|
Commercial
|
Consumer
|
Residential mortgage
|
Leasing transactions
|
Microcredit
|
Total
|
|||||||||||||||||||||||||||
|
Credit Card
|
Automobiles
|
Personal Loans
|
||||||||||||||||||||||||||||||
|
Allowance for loan losses under U.S. GAAP:
|
||||||||||||||||||||||||||||||||
|
Evaluated individually for impairment
|
Ps. | 309,932 | Ps. | – | Ps. | – | Ps. | 195 | Ps. | – | Ps. | 59,133 | Ps. | – | Ps. | 369,260 | ||||||||||||||||
|
Collectively evaluated for impairment
|
948,088 | 370,800 | 149,677 | 853,055 | 48,085 | 111,060 | 44,457 | 2,525,222 | ||||||||||||||||||||||||
|
Total allowance for loan losses under U.S. GAAP
|
Ps. | 1,258,020 | Ps. | 370,800 | Ps. | 149,677 | Ps. | 853,250 | Ps. | 48,085 | Ps. | 170,193 | Ps. | 44,457 | Ps. | 2,894,482 | ||||||||||||||||
|
Gross Loan Portfolio under U.S. GAAP:
|
||||||||||||||||||||||||||||||||
|
Ending balance:
individually evaluated for impairment
|
Ps. | 39,300,298 | (1) | Ps. | 461 | Ps. | 93 | Ps. | 87,112 | Ps. | 4,952 | Ps. | 3,744,807 | Ps. | – | Ps. | 43,137,723 | |||||||||||||||
|
Ending balance evaluated collectively for impairment
|
26,194,686 | 8,701,118 | 4,177,994 | 21,140,226 | 8,998,133 | 4,927,222 | 364,732 | 74,504,111 | ||||||||||||||||||||||||
|
Total Gross Loan Portfolio under U.S. GAAP:
|
Ps. | 65,494,984 | Ps. | 8,701,579 | Ps. | 4,178,087 | Ps. | 21,227,338 | Ps. | 9,003,085 | Ps. | 8,672,029 | Ps. | 364,732 | $ | 117,641,834 | ||||||||||||||||
GRUPO AVAL ACCIONES Y VALORES S.A. AND ITS SUBSIDIARIES
NOTES TO THE CONSOLIDATED FINANCIAL STATEMENTS
FOR THE YEARS ENDED DECEMBER 31, 2014, 2013 AND 2012
(
Stated in millions of Colombian pesos and U.S. dollars)
Allowance for Loan Losses and Outstanding Gross Loan Portfolio as of December 31, 2013
|
Commercial
|
Consumer
|
Residential
mortgage
|
Leasing
transactions
|
Microcredit
|
Total
|
|||||||||||||||||||||||||||
|
Credit Card
|
Automobiles
|
Personal Loans
|
||||||||||||||||||||||||||||||
|
Allowance for loan losses under U.S. GAAP:
|
||||||||||||||||||||||||||||||||
|
Evaluated individually for impairment
|
Ps. | 236,554 | Ps. | – | Ps. | – | Ps. | 15 | Ps. | – | Ps. | 25,948 | Ps. | – | Ps. | 262,517 | ||||||||||||||||
|
Collectively evaluated for impairment
|
853,505 | 369,586 | 117,020 | 809,885 | 63,541 | 108,460 | 31,219 | 2,353,216 | ||||||||||||||||||||||||
|
Total allowance for loan losses under U.S. GAAP
|
Ps. | 1,090,059 | Ps. | 369,586 | Ps. | 117,020 | Ps. | 809,900 | Ps. | 63,541 | Ps. | 134,408 | Ps. | 31,219 | Ps. | 2,615,733 | ||||||||||||||||
|
Gross Loan Portfolio under U.S. GAAP:
|
||||||||||||||||||||||||||||||||
|
Ending balance: individually evaluated for impairment
|
Ps. | 34,616,473 | (1) | Ps. | 281 | Ps. | 21 | Ps. | 82,542 | Ps. | 2,041 | Ps. | 3,503,207 | Ps. | – | Ps. | 38,204,564 | |||||||||||||||
|
Ending balance evaluated collectively for impairment
|
23,865,211 | 6,875,249 | 3,402,143 | 18,214,835 | 6,511,414 | 4,600,192 | 354,149 | 63,823,190 | ||||||||||||||||||||||||
|
Total Gross Loan Portfolio under U.S. GAAP:
|
Ps. | 58,481,684 | Ps. | 6,875,530 | Ps. | 3,402,162 | Ps. | 18,297,377 | Ps. | 6,513,457 | Ps. | 8,103,398 | Ps. | 354,149 | Ps. | 102,027,755 | ||||||||||||||||
|
|
(1)
|
Loans individually evaluated for impairment that are not considered impaired, additionally are evaluated collectively for impairment according to historical losses experience adjusted to reflect current economic conditions.
|
GRUPO AVAL ACCIONES Y VALORES S.A. AND ITS SUBSIDIARIES
NOTES TO THE CONSOLIDATED FINANCIAL STATEMENTS
FOR THE YEARS ENDED DECEMBER 31, 2014, 2013 AND 2012
(
Stated in millions of Colombian pesos and U.S. dollars)
Past due loans
The table below sets forth information about Grupo Aval’s past due loans as of December 31, 2014 and 2013:
Ageing analysis of Loan Portfolio by tenor loan portfolio category as of December 31, 2014
|
Between 31 and 60 days
|
Between 61 and 90 days
|
Over 90 days
|
Total Past Due
|
Current loan portfolio
|
Total loan Portfolio
|
|||||||||||||||||||
|
Commercial
|
||||||||||||||||||||||||
|
Non Real Estate
|
Ps. | 143,602 | Ps. | 130,019 | Ps. | 677,120 | Ps. | 950,741 | Ps. | 57,166,016 | Ps. | 58,116,757 | ||||||||||||
|
Real Estate – Construction
|
3,591 | 4,885 | 30,559 | 39,035 | 1,287,882 | 1,326,917 | ||||||||||||||||||
|
Real Estate -Other
|
24,703 | 7,100 | 90,655 | 122,458 | 5,928,852 | 6,051,310 | ||||||||||||||||||
|
Total commercial
|
171,896 | 142,004 | 798,334 | 1,112,234 | 64,382,750 | 65,494,984 | ||||||||||||||||||
|
Consumer
|
||||||||||||||||||||||||
|
Credit Card
|
249,887 | 36,269 | 182,876 | 469,032 | 8,232,547 | 8,701,579 | ||||||||||||||||||
|
Automobile
|
38,392 | 17,317 | 43,871 | 99,580 | 4,078,507 | 4,178,087 | ||||||||||||||||||
|
Personal loans
|
133,257 | 201,118 | 470,674 | 805,049 | 20,422,289 | 21,227,338 | ||||||||||||||||||
|
Total consumer
|
421,536 | 254,704 | 697,421 | 1,373,661 | 32,733,343 | 34,107,004 | ||||||||||||||||||
|
Residential mortgages
|
54,196 | 14,310 | 235,186 | 303,692 | 8,699,393 | 9,003,085 | ||||||||||||||||||
|
Leasing transactions
|
42,365 | 48,387 | 147,461 | 238,213 | 8,433,816 | 8,672,029 | ||||||||||||||||||
|
Microcredit
|
9,108 | 5,126 | 25,365 | 39,599 | 325,133 | 364,732 | ||||||||||||||||||
|
Total
|
Ps. | 699,101 | Ps. | 464,531 | Ps. | 1,903,767 | Ps. | 3,067,399 | Ps. | 114,574,435 | Ps. | 117.641.834 | ||||||||||||
GRUPO AVAL ACCIONES Y VALORES S.A. AND ITS SUBSIDIARIES
NOTES TO THE CONSOLIDATED FINANCIAL STATEMENTS
FOR THE YEARS ENDED DECEMBER 31, 2014, 2013 AND 2012
(
Stated in millions of Colombian pesos and U.S. dollars)
Ageing analysis of Loan Portfolio by loan portfolio category as of December 31, 2013
|
Between 31 and
60 days
|
Between 61
and 90 days
|
Over 90 days
|
Total Past Due
|
Current loan
portfolio
|
Total loan
Portfolio
|
|||||||||||||||||||
|
Commercial
|
||||||||||||||||||||||||
|
Non Real Estate
|
Ps. | 83,775 | Ps. | 69,667 | Ps. | 498,351 | Ps. | 651,793 | Ps. | 51,230,962 | Ps. | 51,882,755 | ||||||||||||
|
Real Estate – Construction
|
1,546 | 8,495 | 21,772 | 31,812 | 1,176,897 | 1,208,710 | ||||||||||||||||||
|
Real Estate -Other
|
20,638 | 5,699 | 59,632 | 85,970 | 5,304,250 | 5,390,220 | ||||||||||||||||||
|
Total commercial
|
105,960 | 83,861 | 579,755 | 769,576 | 57,712,109 | 58,481,684 | ||||||||||||||||||
|
Consumer
|
||||||||||||||||||||||||
|
Credit Card
|
198,212 | 29,398 | 151,977 | 379,587 | 6,495,945 | 6,875,532 | ||||||||||||||||||
|
Automobile
|
27,047 | 18,133 | 46,156 | 91,336 | 3,310,825 | 3,402,161 | ||||||||||||||||||
|
Personal loans
|
122,583 | 165,964 | 437,073 | 725,620 | 17,571,757 | 18,297,377 | ||||||||||||||||||
|
Total consumer
|
347,842 | 213,495 | 635,206 | 1,196,543 | 27,378,525 | 28,575,068 | ||||||||||||||||||
|
Residential mortgages
|
44,351 | 12,166 | 214,610 | 271,127 | 6,242,330 | 6,513,457 | ||||||||||||||||||
|
Leasing transactions
|
39,243 | 21,490 | 116,529 | 177,262 | 7,926,136 | 8,103,398 | ||||||||||||||||||
|
Microcredit
|
8,059 | 5,293 | 20,807 | 34,159 | 319,989 | 354,148 | ||||||||||||||||||
|
Total
|
Ps. | 545,455 | Ps. | 336,305 | Ps. | 1,566,907 | Ps. | 2,448,667 | Ps. | 99,579,089 | Ps. | 102,027,755 | ||||||||||||
Credit quality indicators
The following table illustrates credit risks by category and internally assigned grades for the years ended December 31, 2014 and 2013:
Loan Portfolio Quality Ratios as of the closing of December 31, 2014 and 2013
|
Exposure in the form of Commercial Loan Portfolio
|
|||||||||||||||||
|
Loan Portfolio Risk Profile by Credit Rating
|
|||||||||||||||||
|
Commercial
|
Commercial financial leasing
|
||||||||||||||||
|
December 31, 2014
|
December 31, 2013
|
December 31, 2014
|
December 31, 2013
|
||||||||||||||
| A | Ps. | 62,152,722 | Ps. | 55,250,546 | Ps. | 7,850,812 | Ps. | 7,543,150 | |||||||||
| B | 1,534,793 | 1,756,352 | 405,421 | 273,880 | |||||||||||||
| C | 999,644 | 764,077 | 173,033 | 93,534 | |||||||||||||
| D | 504,518 | 427,678 | 142,101 | 86,684 | |||||||||||||
| E | 303,307 | 283,032 | 42,495 | 65,558 | |||||||||||||
|
Total
|
Ps. | 65,494,984 | Ps. | 58,481,684 | Ps. | 8,613,862 | Ps. | 8,062,806 | |||||||||
GRUPO AVAL ACCIONES Y VALORES S.A. AND ITS SUBSIDIARIES
NOTES TO THE CONSOLIDATED FINANCIAL STATEMENTS
FOR THE YEARS ENDED DECEMBER 31, 2014, 2013 AND 2012
(
Stated in millions of Colombian pesos and U.S. dollars)
Exposure in the form of Residential mortgage Loan Portfolio
Loan Portfolio Risk Profile by Credit Rating
|
Residential Mortgages
|
||||||||
|
December 31, 2014
|
December 31, 2013
|
|||||||
|
Rating
|
||||||||
| A | Ps. | 8,279,105 | Ps. | 6,018,573 | ||||
| B | 197,114 | 143,724 | ||||||
| C | 411,621 | 261,478 | ||||||
| D | 43,309 | 23,330 | ||||||
| E | 71,936 | 66,351 | ||||||
|
Total
|
Ps. | 9,003,085 | Ps. | 6,513,457 | ||||
|
Consumer
|
||||||||||||||||||||||||
|
Credit Card
|
Automobile
|
Personal loans
|
Total consumer
|
Consumer financial leasing
|
Microcredit
|
|||||||||||||||||||
|
December 31, 2014
|
||||||||||||||||||||||||
|
Performing (up to 90 days)
|
Ps. | 8,518,703 | Ps. | 4,134,216 | Ps. | 20,756,664 | Ps. | 33,409,583 | Ps. | 13,898 | Ps. | 339,367 | ||||||||||||
|
Non-performing (over 90 days)
|
182,876 | 43,871 | 470,674 | 697,421 | 44,269 | 25,365 | ||||||||||||||||||
|
Total
|
Ps. | 8,701,579 | Ps. | 4,178,087 | Ps. | 21,227,338 | Ps. | 34,107,004 | Ps. | 58,167 | Ps. | 364,732 | ||||||||||||
|
Consumer
|
||||||||||||||||||||||||
|
Credit Card
|
Automobile
|
Personal loans
|
Total
consumer
|
Consumer financial
leasing
|
Microcredit
|
|||||||||||||||||||
|
December 31, 2013
|
||||||||||||||||||||||||
|
Performing (up to 90 days)
|
Ps. | 6,723,554 | Ps. | 3,356,005 | Ps. | 17,860,304 | Ps. | 27,939,862 | Ps. | 13,036 | Ps. | 333.342 | ||||||||||||
|
Non-performing (over 90 days)
|
151,977 | 46,156 | 437,073 | 635,206 | 27,556 | 20,806 | ||||||||||||||||||
|
Total
|
Ps. | 6,875,530 | Ps. | 3,402,161 | Ps. | 18,297,377 | Ps. | 28,575,068 | Ps. | 40,592 | Ps. | 354,148 | ||||||||||||
Internally assigned grades are described in the “loans and financial leases” credit quality indicators.
GRUPO AVAL ACCIONES Y VALORES S.A. AND ITS SUBSIDIARIES
NOTES TO THE CONSOLIDATED FINANCIAL STATEMENTS
FOR THE YEARS ENDED DECEMBER 31, 2014, 2013 AND 2012
(
Stated in millions of Colombian pesos and U.S. dollars)
Impaired loans
The following table presents loans individually evaluated and considered impaired with the corresponding allowance for loan losses for the years ended December 31, 2014 and 2013:
|
2014
|
||||||||||||||||||||
|
Recorded investment
|
Outstanding principal
|
Loan loss reserve
|
Average book value for the period ending December 31, 2014
|
Recognized interest income
|
||||||||||||||||
|
Without provision recorded (1)
|
||||||||||||||||||||
|
Commercial
|
Ps. | 86,118 | Ps. | 85,342 | Ps. | – | Ps. | 51,780 | Ps. | 2,676 | ||||||||||
|
Leasing
|
57,829 | 56,570 | – | 43,662 | 5,321 | |||||||||||||||
| 143,947 | 141,912 | – | 95,442 | 7,997 | ||||||||||||||||
|
With provision recorded
|
||||||||||||||||||||
|
Commercial
|
2,000,695 | 1,957,569 | 309,932 | 1,622,748 | 42,322 | |||||||||||||||
|
Leasing
|
225,171 | 220,003 | 59,133 | 145,726 | 11,561 | |||||||||||||||
|
Consumer
|
215 | 205 | 195 | 99 | – | |||||||||||||||
| 2,226,081 | 2,177,777 | 369,260 | 1,768,573 | 53,883 | ||||||||||||||||
|
Total
|
||||||||||||||||||||
|
Commercial
|
2,086,813 | 2,042,911 | 309,932 | 1,674,528 | 44,998 | |||||||||||||||
|
Leasing
|
283,000 | 276,573 | 59,133 | 189,388 | 16,882 | |||||||||||||||
|
Consumer
|
215 | 205 | 195 | 99 | – | |||||||||||||||
| Ps. | 2,370,028 | Ps. | 2,319,689 | Ps. | 369,260 | Ps. | 1,864,015 | Ps. | 61,880 | |||||||||||
|
2013
|
||||||||||||||||||||
|
Recorded investment
|
Outstanding principal
|
Loan loss reserve
|
Average book value for the period ending December 31, 2013
|
Recognized interest income
|
||||||||||||||||
|
Without provision recorded (1)
|
||||||||||||||||||||
|
Commercial
|
Ps. | 114,745 | Ps. | 113,304 | Ps. | – | Ps. | 58,591 | Ps. | 4,656 | ||||||||||
|
Leasing
|
30,291 | 29,464 | – | 36,995 | 2,920 | |||||||||||||||
| 145,036 | 142,768 | – | 95,586 | 7,576 | ||||||||||||||||
|
With provision recorded
|
||||||||||||||||||||
|
Commercial
|
1,749,252 | 1,712,900 | 236,554 | 1,591,234 | 36,947 | |||||||||||||||
|
Leasing
|
166,262 | 164,330 | 25,948 | 126,582 | 9,979 | |||||||||||||||
|
Consumer
|
104 | 99 | 15 | 67 | – | |||||||||||||||
| 1,915,618 | 1,877,329 | 262,517 | 1,717,883 | 46,926 | ||||||||||||||||
|
Total
|
||||||||||||||||||||
|
Commercial
|
1,863,997 | 1,826,204 | 236,554 | 1,649,825 | 41,603 | |||||||||||||||
|
Leasing
|
196,552 | 193,794 | 25,948 | 163,577 | 12,899 | |||||||||||||||
|
Consumer
|
104 | 99 | 15 | 67 | – | |||||||||||||||
| Ps. | 2,060,654 | Ps. | 2,020,097 | Ps. | 262,517 | Ps. | 1,813,469 | Ps. | 54,502 | |||||||||||
|
(1)
|
Impaired loans without provisions recorded for which their collateral fair value less cost of sales exceeds loan gross investments at the end of the year.
|
F-98
GRUPO AVAL ACCIONES Y VALORES S.A. AND ITS SUBSIDIARIES
NOTES TO THE CONSOLIDATED FINANCIAL STATEMENTS
FOR THE YEARS ENDED DECEMBER 31, 2014, 2013 AND 2012
(
Stated in millions of Colombian pesos and U.S. dollars)
The interest income that would have been recorded on impaired loans in non-accrual status in accordance with the original contractual terms amounted to Ps. 131,499, Ps. 137,081 and Ps. 126,186 for the years ended 2014, 2013 and 2012, respectively.
Non-performing loans
The following table summarizes the amount of non-performing loans by loan category for years ended December 31, 2014 and 2013:
|
December 31, 2014
|
December 31, 2013
|
|||||||
|
Commercial
|
||||||||
|
Non real estate
|
Ps. | 677,120 | Ps. | 498,351 | ||||
|
Real Estate – construction
|
30,559 | 21,772 | ||||||
|
Other
|
90,655 | 59,632 | ||||||
|
Consumer
|
||||||||
|
Credit card
|
182,876 | 151,977 | ||||||
|
Automobiles
|
43,871 | 46,156 | ||||||
|
Personal loans
|
470,674 | 437,073 | ||||||
|
Residential mortgage
|
||||||||
|
Normal (Prime)
|
233,889 | 213,351 | ||||||
|
Subnormal (Subprime)
|
1,297 | 1,259 | ||||||
|
Leasing transactions
|
147,461 | 116,529 | ||||||
|
Microcredit
|
25,365 | 20,807 | ||||||
|
Total
|
Ps. | 1,903,767 | Ps. | 1,566,907 | ||||
Troubled debt restructurings
The following table summarizes the total of troubled debt restructured loans (TDR) by loan category:
December 31, 2014
|
Number of loans Restructured
|
Principal amounts before the restructuring
|
Principal amounts after the restructuring
|
||||||||||
|
Commercial
|
||||||||||||
|
Real Estate – Other
|
49 | Ps. | 27,154 | Ps. | 21,191 | |||||||
|
Construction
|
3 | 64 | 61 | |||||||||
|
Non Real Estate
|
2,064 | 256,030 | 237,378 | |||||||||
|
Consumer
|
||||||||||||
|
Credit card
|
25,997 | 162,795 | 140,318 | |||||||||
|
Automobiles
|
703 | 16,167 | 14,990 | |||||||||
|
Personal loans
|
14,228 | 138,161 | 166,331 | |||||||||
|
Residential mortgage
|
||||||||||||
|
Normal (Prime)
|
169 | 29,169 | 27,700 | |||||||||
|
Subnormal (Subprime)
|
82 | 1,544 | 1,532 | |||||||||
|
Leasing transactions
|
167 | 67,698 | 73,760 | |||||||||
|
Microcredit
|
1,467 | 34,049 | 29,022 | |||||||||
|
Total
|
44,929 | Ps. | 732,831 | Ps. | 712,283 | |||||||
GRUPO AVAL ACCIONES Y VALORES S.A. AND ITS SUBSIDIARIES
NOTES TO THE CONSOLIDATED FINANCIAL STATEMENTS
FOR THE YEARS ENDED DECEMBER 31, 2014, 2013 AND 2012
(
Stated in millions of Colombian pesos and U.S. dollars)
December 31, 2013
|
Number of loans Restructured
|
Principal amounts before the restructuring
|
Principal amounts after the restructuring
|
||||||||||
|
Commercial
|
||||||||||||
|
Real Estate - Other
|
18 | Ps. | 1,606 | Ps. | 1,469 | |||||||
|
Construction
|
35 | 1,378 | 1,386 | |||||||||
|
Non Real Estate
|
1,615 | 302,686 | 264,797 | |||||||||
|
Consumer
|
||||||||||||
|
Credit card
|
15,118 | 98,858 | 74,497 | |||||||||
|
Automobiles
|
863 | 19,672 | 17,506 | |||||||||
|
Personal loans
|
18,627 | 172,388 | 202,227 | |||||||||
|
Residential mortgage
|
||||||||||||
|
Normal (Prime)
|
180 | 19,162 | 17,510 | |||||||||
|
Subnormal (Subprime)
|
205 | 3,252 | 3,218 | |||||||||
|
Leasing transactions
|
115 | 25,068 | 25,646 | |||||||||
|
Microcredit
|
1,369 | 23,174 | 21,010 | |||||||||
|
Total
|
38,145 | Ps. | 667,244 | Ps. | 629,267 | |||||||
Upon identifying those receivables as troubled debt restructurings, Grupo Aval identified them as impaired under the ASC 310-10-35. The amendments in Accounting Standards Update No. 2011-02 require prospective application of the impairment measurement guidance in Section 310-10-35 for those receivables newly identified as impaired.
The following tables summarize the total of receivables restructured as troubled debt during 2013 and 2012 that do not comply with the terms of the restructured agreement during the year ended December 31, 2014 and 2013 and its amounts by loan category:
December 31, 2014
|
Number of trouble debt restructurings
|
Amounts as of December 31,2014
|
Restructured loans charge-off from January 1 to December 31, 2014
|
||||||||||
|
Commercial
|
||||||||||||
|
Non-Real estate
|
984 | Ps. | 72,607 | Ps. | 21,113 | |||||||
|
Real state- Construction
|
– | – | 150 | |||||||||
|
Other
|
4 | 1,969 | 12 | |||||||||
|
Consumer
|
||||||||||||
|
Credit card
|
6,858 | 42,400 | 5,644 | |||||||||
|
Automobiles
|
358 | 7,772 | 6,101 | |||||||||
|
Personal loans
|
8,258 | 91,664 | 78,208 | |||||||||
|
Residential mortgage
|
||||||||||||
|
Normal (Prime)
|
138 | 16,402 | – | |||||||||
|
Subnormal (Subprime)
|
144 | 2,625 | – | |||||||||
|
Leasing transactions
|
40 | 4,603 | 7,483 | |||||||||
|
Microcredit
|
601 | 12,650 | 3,930 | |||||||||
|
Total
|
17,385 | Ps. | 252,692 | Ps. | 122,641 | |||||||
GRUPO AVAL ACCIONES Y VALORES S.A. AND ITS SUBSIDIARIES
NOTES TO THE CONSOLIDATED FINANCIAL STATEMENTS
FOR THE YEARS ENDED DECEMBER 31, 2014, 2013 AND 2012
(
Stated in millions of Colombian pesos and U.S. dollars)
December 31, 2013
|
Number of trouble
debt restructurings
|
Amounts as of
December 31,2013
|
Restructured loans charge-off from January 1
st
to
December 31, 2013
|
||||||||||
|
Commercial
|
||||||||||||
|
Non-Real estate
|
1,348 | Ps. | 82,113 | Ps. | 12,334 | |||||||
|
Real state - Construction
|
20 | 1,346 | 73 | |||||||||
|
Other
|
14 | 1,949 | – | |||||||||
|
Consumer
|
||||||||||||
|
Credit card
|
5,944 | 21,584 | 6,299 | |||||||||
|
Automobiles
|
922 | 18,088 | 4,523 | |||||||||
|
Personal loans
|
10,492 | 117,328 | 45,052 | |||||||||
|
Residential mortgage
|
||||||||||||
|
Normal (Prime)
|
94 | 8,610 | – | |||||||||
|
Subnormal (Subprime)
|
138 | 2,676 | – | |||||||||
|
Leasing transactions
|
116 | 24,409 | 2,340 | |||||||||
|
Microcredit
|
997 | 12,739 | 1,169 | |||||||||
|
Total
|
20,085 | Ps. | 290,842 | Ps. | 71,790 | |||||||
Modifications of loans terms to borrowers that are experiencing financial difficulty are designed to reduce the Group’s loss exposure while providing the borrower with an opportunity to work through financial difficulties, often to avoid foreclosure or bankruptcy. Each modification is unique and reflects the individual circumstances of the borrower. Modifications that result in a TDR may include extensions of maturity and a concessionary rate of interest, payment forbearances or other actions designed to benefit the customer while mitigating the Group’s risk exposure.
The following table summarizes the total of troubled debt restructured loans by types of concessions as of December 31 2014 and 2013.
|
2014
|
2013
|
|||||||||||||||
|
Number of concessions
|
Amounts
|
Number of concessions
|
Amounts
|
|||||||||||||
|
Rate reductions
|
– | Ps. | – | 2 | Ps. | 256 | ||||||||||
|
Payment extension
|
7,925 | 233,827 | 9,761 | 124,542 | ||||||||||||
|
Rate reductions and payment extension simultaneously
|
36,994 | 478,242 | 28,334 | 484,406 | ||||||||||||
|
Forgiveness of principal, rate reductions and payment extension simultaneously
|
10 | 214 | 48 | 20,063 | ||||||||||||
|
Total
|
44,929 | Ps. | 712,283 | 38,145 | Ps. | 629,267 | ||||||||||
According to past experience, Grupo Aval’s restructuring debt process in consumer and mortgage loans has been more successful when the process includes both interest rate reductions and an extension of payment term. Regarding commercial loans, the restructuring debt process is generally more effective when there is a forgiveness of principal included.
The following table summarizes the total of troubled debt restructured loans by accrual and nonaccrual as of December 31 2014 and 2013.
GRUPO AVAL ACCIONES Y VALORES S.A. AND ITS SUBSIDIARIES
NOTES TO THE CONSOLIDATED FINANCIAL STATEMENTS
FOR THE YEARS ENDED DECEMBER 31, 2014, 2013 AND 2012
(
Stated in millions of Colombian pesos and U.S. dollars)
December 31, 2014
|
Accrual
|
Non-accrual
|
Total
|
Valuation allowance December 2014
|
|||||||||||||
|
Commercial
|
Ps. | 125,536 | Ps. | 133,094 | Ps. | 258,630 | Ps. | 66,356 | ||||||||
|
Commercial - Real Estate- Other
|
21,191 | – | 21,191 | 19,125 | ||||||||||||
|
Construction
|
– | 61 | 61 | 26 | ||||||||||||
|
Commercial non real Estate
|
104,345 | 133,033 | 237,378 | 47,205 | ||||||||||||
|
Consumer
|
233,515 | 88,124 | 321,639 | 87,543 | ||||||||||||
|
Consumer - Credit card
|
119,193 | 21,125 | 140,318 | 28,017 | ||||||||||||
|
Consumer - Personal loans
|
106,032 | 60,299 | 166,331 | 53,637 | ||||||||||||
|
Consumer - Automobiles
|
8,290 | 6,700 | 14,990 | 5,889 | ||||||||||||
|
Residential mortgage
|
24,916 | 4,316 | 29,232 | 650 | ||||||||||||
|
Normal (Prime)
|
24,131 | 3,569 | 27,700 | 544 | ||||||||||||
|
Subnormal (Subprime)
|
785 | 747 | 1,532 | 106 | ||||||||||||
|
Leasing transactions
|
59,091 | 14,669 | 73,760 | 7,976 | ||||||||||||
|
Microcredit
|
16,086 | 12,936 | 29,022 | 4,249 | ||||||||||||
|
Total
|
Ps. | 459,144 | Ps. | 253,139 | Ps. | 712,283 | Ps. | 166,774 | ||||||||
December 31, 2013
|
Accrual
|
Non-accrual
|
Total
|
Valuation allowance December 2013
|
|||||||||||||
|
Commercial
|
Ps. | 135,886 | Ps. | 131,766 | Ps. | 267,652 | Ps. | 44,107 | ||||||||
|
Commercial - Real Estate - Other
|
1,417 | 52 | 1,469 | 371 | ||||||||||||
|
Construction
|
1,216 | 170 | 1,386 | 415 | ||||||||||||
|
Commercial non real Estate
|
133,253 | 131,544 | 264,797 | 43,321 | ||||||||||||
|
Consumer
|
205,489 | 88,741 | 294,230 | 83,487 | ||||||||||||
|
Consumer - Credit card
|
67,141 | 7,356 | 74,497 | 17,300 | ||||||||||||
|
Consumer - Personal loans
|
130,045 | 72,182 | 202,227 | 59,939 | ||||||||||||
|
Consumer - Automobiles
|
8,303 | 9,203 | 17,506 | 6,248 | ||||||||||||
|
Residential mortgage
|
15,711 | 5,017 | 20,728 | 1,149 | ||||||||||||
|
Normal (Prime)
|
14,385 | 3,125 | 17,510 | 806 | ||||||||||||
|
Subnormal (Subprime)
|
1,326 | 1,892 | 3,218 | 343 | ||||||||||||
|
Leasing transactions
|
9,031 | 16,615 | 25,646 | 8,370 | ||||||||||||
|
Microcredit
|
9,746 | 11,265 | 21,011 | 2,375 | ||||||||||||
|
Total
|
Ps. | 375,863 | Ps. | 253,404 | Ps. | 629,267 | Ps. | 139,488 | ||||||||
Additional disclosure for trouble debt restructurings
The following paragraphs illustrate the policies considered by Grupo Aval for the troubled debt restructuring process:
|
|
1)
|
In order to restructure a troubled loan, Grupo Aval reviews the conditions to be restructured which include an updated financial information analysis, the type of guarantees and its possible extension. Regarding commercial loans, once the restructuring is approved, Grupo Aval’s special departments start a periodic follow-up on a monthly basis to the restructuring agreement by analyzing the updated financial information of the customer.
|
For consumer, residential mortgage and microcredit, a periodic follow-up on a monthly basis past due analysis is performed by the Group.
|
|
2)
|
Grupo Aval classifies the loans by risk categories; category A, category B, category C, category D or category E, being E the most risky. TDRs are generally reported as nonperforming loans and leases on nonaccrual status in risk categories C, D or E. Nonperforming TDRs may be returned to accrual status when, among other criteria, payment in full of all due amounts is made under the restructured terms.
|
F-102
GRUPO AVAL ACCIONES Y VALORES S.A. AND ITS SUBSIDIARIES
NOTES TO THE CONSOLIDATED FINANCIAL STATEMENTS
FOR THE YEARS ENDED DECEMBER 31, 2014, 2013 AND 2012
(
Stated in millions of Colombian pesos and U.S. dollars)
|
|
3)
|
A loan identified as restructured, is permanently identified as such.
|
|
|
4)
|
TDRs are primarily measured based on the present value of payments expected to be received, discounted at the loans’ original effective contractual interest rates, or discounted at the portfolio average contractual annual percentage rate; TDRs that are solely dependent on the collateral for repayment are measured based on the estimated fair value of the collateral less estimated costs to sell. If the recorded investment in impaired loans exceeds this amount, a specific allowance is established as a component of the allowance for loan and lease losses unless these are secured consumer loans that are solely dependent on the collateral for repayment, in which case the initial amount that exceeds the fair value of the collateral is charged off.
|
During regular lending operations, Grupo Aval can modify loan conditions due to commercial reasons without qualifying it as restructured loan. Modifications in loan conditions mainly consist of interest rate changes and/or, terms extensions because of market conditions, to avoid prepayments and to ensure customers fidelity. These modifications can be made only to good standing loans that are not past due.
|
f)
|
Loan origination fees and costs:
|
Under Colombian Banking GAAP, Grupo Aval recognizes in the statement of income, loan origination, lines of credit and letters of credit, when collected and records related direct costs when incurred.
Under U.S. GAAP, specifically ASC 310-20-50 “Accounting for Non-Refundable Fees and Costs Associated with Origination or Acquiring Loans and Initial Direct Costs of Leases”, loan origination fees and certain direct loan origination costs that are required to be recognized as a yield adjustment over the life of the related loans are recognized by the effective interest method, except for certain loan agreements, such as revolving lines of credit and credit cards, which are recognized in the condensed Statement of Income on a straight-line basis over the life of the product or a twelve month period for fees on credit cards. For certain consumer loans with a history of prepayment the amortization period was adjusted according to that history. The total effect of this adjustment increases the shareholders’ equity under U.S. GAAP by Ps. 214,765 and Ps. 207,881 as of December 31, 2014 and 2013, respectively. The increase in the adjustment for the years ended December 31, 2014, 2013 and 2012 mainly relates to (i) an increase in loans granted during the year which represents an adjustment for U.S. GAAP purposes in the consolidated statement of income Ps. 6,884, Ps. 35,574 and Ps. 22,740, respectively.
|
g)
|
Interest recognition on non-accrual loans:
|
For Colombian Banking GAAP purposes, Grupo Aval established that interest ceases to be accrued in the consolidated Statement of Income and begins to be recorded in Memorandum Accounts until effective payment is collected, after a loan is in arrears for more than a certain time:
|
Type of loan and financial lease
|
Arrears in excess of:
|
|
|
Residential mortgage
|
60 days
|
|
|
Consumer
|
60 days
|
|
|
Microcredit
|
30 days
|
|
|
Commercial
|
90 days
|
F-103
GRUPO AVAL ACCIONES Y VALORES S.A. AND ITS SUBSIDIARIES
NOTES TO THE CONSOLIDATED FINANCIAL STATEMENTS
FOR THE YEARS ENDED DECEMBER 31, 2014, 2013 AND 2012
(
Stated in millions of Colombian pesos and U.S. dollars)
For this reconciliation to U.S. GAAP, Grupo Aval discontinues accrual of interest income once a loan becomes more than 90 days past due (as defined by contractual terms) in accordance with management’s estimate about the recoverability of such interest costs, which is also aligned to customary practices for U.S. banks. These estimations are made according to the following guidelines:
|
|
1.
|
The loans are placed in a past due status when a delay in the payment of principal or interest occur according to contractual terms.
|
|
|
2.
|
The payments received from customers on loans which accrual is suspended is applied first to interest and then to the principal. And for interest payments received, they are recorded in the consolidated statement of income.
|
|
|
3.
|
The non-accrual loans may be returned to accrual status when all principal and interest is current, full repayment of the remaining contractual principal and interest is expected and based on credit analysis, not classified in a risk category C, D, or E.
|
|
|
4.
|
Under no circumstances the accrual of interest is recorded for 90 days past due loans and therefore there are no loan balances that under U.S. GAAP at December 31, 2014 and 2013 had accrued interest on that kind of loans.
|
|
h)
|
Deferred charges and other assets:
|
For Colombian Banking GAAP purposes, Grupo Aval has deferred certain expenses and other charges, including among others, maintenance, pre-operating expenses, and certain costs of studies and projects including administrative projects, improvement of internal processes related to clients, multiple services and benchmark studies. These charges are expensed as incurred under U.S. GAAP. Debt issuance costs are amortized, using the effective interest method, over the life of the related debt by which the costs were incurred under Colombian Banking GAAP and U.S. GAAP.
|
i)
|
Investment securities and derivatives:
|
|
1)
|
Investment securities
|
The table below provides details regarding the differences in accounting for investment securities between Colombian Banking GAAP and U.S. GAAP:
|
Net income
|
Shareholders’ equity
|
|||||||||||||||||||
|
2014
|
2013
|
2012
|
2014
|
2013
|
||||||||||||||||
|
Differences in classification of held to maturity investments
and fair value adjustment (a)
|
Ps. | (7,211 | ) | Ps. | (5,689 | ) | Ps. | (3,121 | ) | Ps. | (5,692 | ) | Ps. | (2,388 | ) | |||||
|
Impairment on investments (b)
|
(2,443 | ) | (2,670 | ) | 2,754 | 212 | 2,896 | |||||||||||||
|
Foreign exchange differences on available for sale investments (c)
|
(22,685 | ) | (10,550 | ) | (163 | ) | – | – | ||||||||||||
| Ps. | (32,339 | ) | Ps. | (18,909 | ) | Ps. | (530 | ) | Ps. | (5,480 | ) | Ps. | 508 | |||||||
|
|
(a)
|
These adjustments relate to securities debt and equity securities, with readily determinable fair value
|
Under U.S. GAAP and Colombian Banking GAAP, investment securities are classified and measured in a similar manner, except for the following:
Certain investment securities, classified as held to maturity under Colombian Banking GAAP, are classified under U.S. GAAP as “available for sale” with adjustments in the related fair value against OCI.
GRUPO AVAL ACCIONES Y VALORES S.A. AND ITS SUBSIDIARIES
NOTES TO THE CONSOLIDATED FINANCIAL STATEMENTS
FOR THE YEARS ENDED DECEMBER 31, 2014, 2013 AND 2012
(
Stated in millions of Colombian pesos and U.S. dollars)
Under Colombian Banking GAAP, the Superintendency of Finance allows recognition at amortized cost of certain investment securities classified as trading or available for sale. Under U.S. GAAP, all debt securities classified as trading or available for sale are recorded at fair value determined according to ASC 820-10 requirements.
In addition under Colombian banking GAAP available for sale securities held must be kept in the category for at least six months, while U.S. GAAP have no such requirement.
|
|
(b)
|
Impairment on investments
|
Under Colombian Banking GAAP, Grupo Aval follows the requirements of the Superintendency of Finance to account for impairment of securities. Based on such guidance, a credit risk qualification analysis is performed for both debt and equity securities; based on this analysis a credit risk rating will be assigned to each investment, setting mandatory provisions depending on the credit risk level determined for the investment.
Under U.S. GAAP, a decline in the estimated fair market value of held to maturity or available for sale debt or equity securities compared to the amortized cost is charged to earnings for the period in which management considers that this decrease is other than temporary. Management evaluates securities for other than temporary impairment at each balance sheet date or sooner when conditions require such evaluation. Factors considered in determining whether impairment is other than temporary include: (1) the length of time and the extent to which the fair value has been less than cost; (2) the financial condition and the near term prospects of the issuer; and (3) the intent and ability of Grupo Aval to hold the investment for a period of time sufficient to allow full recovery in fair value.
For debt securities, when an entity does not intend to sell an impaired debt security, and it is more likely than not it will be required to sell the security prior to recovery, the entity must determine whether it will recover its amortized cost. If it concludes it will not recover amortized cost, a credit loss exists and the resulting Other Than Temporary Impairment is separated into the amount representing the credit loss, which is recognized in earnings, and the amount related to all other factors, which is recognized in Other Comprehensive Income (OCI).
The guidance requires that the total Other Than Temporary Impairment (difference between the fair value and the amortized cost of the security) be presented in the Consolidated Statement of Income with an offset in a separate line item for any amount of the total Other Than Temporary Impairment that is recognized in OCI. Therefore, based on the analysis performed, under U.S. GAAP, Other Than Temporary Impairment has been recognized for available for sale equity securities.
See note below in this caption for additional disclosures on unrealized loss position for more than and less than twelve months.
|
(c)
|
Foreign exchange differences on available for sale investments
|
Under Colombian Banking GAAP, fluctuations in fair value resulting from changes in foreign currency exchange rates on available for sale debt securities are reflected in the Consolidated Statements of Income. In accordance with U.S. GAAP, based on ASC 320-10 and ASC 830-20, changes in the fair value of available for sale debt securities as a result of changes in foreign currency exchange rates are reflected in shareholders’ equity. The U.S. GAAP adjustment reflects reclassifications of these effects from net income to shareholders’ equity.
Additional disclosures for investment securities
The following tables are included with the purpose of providing ASC 320-10 complementary disclosure requirements of investment securities:
GRUPO AVAL ACCIONES Y VALORES S.A. AND ITS SUBSIDIARIES
NOTES TO THE CONSOLIDATED FINANCIAL STATEMENTS
FOR THE YEARS ENDED DECEMBER 31, 2014, 2013 AND 2012
(
Stated in millions of Colombian pesos and U.S. dollars)
As of December 31, 2014
Available for sale securities
|
Cost Basis
|
Unrealized Gains
|
Unrealized Losses
|
Fair value
|
|||||||||||||
|
Debt securities (*)
|
||||||||||||||||
|
Securities issued or secured by Colombian Government
|
Ps. | 12,163,109 | Ps. | 39,229 | Ps. | (227,972 | ) | Ps. | 11,974,366 | |||||||
|
Securities issued or secured by government entities
|
345,932 | 10,815 | (7,048 | ) | 349,699 | |||||||||||
|
Securities issued or secured by other financial entities
|
3,248,334 | 14,021 | (45,652 | ) | 3,216,703 | |||||||||||
|
Securities issued or secured by foreign governments
|
1,505,459 | 11,296 | (11,980 | ) | 1,504,775 | |||||||||||
|
Other
|
1,072,981 | 7,315 | (70,168 | ) | 1,010,128 | |||||||||||
| 18,335,815 | 82,676 | (362,820 | ) | 18,055,671 | ||||||||||||
|
Equity securities
|
||||||||||||||||
|
Bolsa de Valores de Colombia S.A.
|
11,984 | 3,152 | – | 15,136 | ||||||||||||
|
Empresa de Energía de Bogotá S.A. E.S.P.
|
218,028 | 338,128 | – | 556,156 | ||||||||||||
|
Bladex S.A
|
303 | 84 | – | 387 | ||||||||||||
|
Gas Natural S.A. E.S.P.
|
29,225 | 44,155 | – | 73,380 | ||||||||||||
|
Mineros S.A.
|
62,701 | – | (9,180 | ) | 53,521 | |||||||||||
|
Mastercard Int
|
91 | 2,473 | – | 2,564 | ||||||||||||
|
Other
|
623 | 1,198 | – | 1,821 | ||||||||||||
| 322,955 | 389,190 | (9,180 | ) | 702,965 | ||||||||||||
|
Total investments available for sale and unrealized gains (losses ) in other comprehensive income
|
Ps. | 18,658,770 | Ps. | 471,866 | Ps. | (372,000 | ) | Ps. | 18,758,636 | |||||||
|
(*)
|
On December 31, 2014 this amount includes Ps. 1,737,165 (U.S.$726.1 million) available for sale debt securities, as collateral for a loan for U.S.$540 million three-year term loan between Leasing Bogotá Panamá and Deutsche Bank.
|
Held-to-maturity securities
|
Cost Basis
|
Gross unrealized gains
|
Gross unrealized losses
|
Fair value
|
|||||||||||||
|
Securities issued or secured by Colombian Government
|
Ps. | 269,510 | Ps. | – | Ps. | (4,816 | ) | Ps. | 264,694 | |||||||
|
Securities issued or secured by government entities
|
2,360,428 | 2 | (31,545 | ) | 2,328,885 | |||||||||||
|
Securities issued or secured by other financial entities
|
312,125 | 5,797 | – | 317,922 | ||||||||||||
|
Securities issued or secured by foreign governments
|
31,240 | 2 | (4 | ) | 31,238 | |||||||||||
|
Other
|
19,667 | – | (87 | ) | 19,580 | |||||||||||
| Ps. | 2,992,970 | Ps. | 5,801 | Ps. | (36,452 | ) | Ps. | 2,962,319 | ||||||||
GRUPO AVAL ACCIONES Y VALORES S.A. AND ITS SUBSIDIARIES
NOTES TO THE CONSOLIDATED FINANCIAL STATEMENTS
FOR THE YEARS ENDED DECEMBER 31, 2014, 2013 AND 2012
(
Stated in millions of Colombian pesos and U.S. dollars)
The scheduled maturities of debt securities at December 31, 2014 were as follows:
|
Available for sale
|
Held to maturity
|
|||||||||||||||
|
Cost basis
|
Fair value
|
Amortized cost
|
Fair value
|
|||||||||||||
|
Due in one year or less
|
Ps. | 2,084,320 | Ps. | 2,089,699 | Ps. | 2,947,619 | Ps. | 2,917,814 | ||||||||
|
Due from one year to five years
|
7,783,051 | 7,761,937 | 38,843 | 37,996 | ||||||||||||
|
Due from five years to ten years
|
7,956,754 | 7,735,594 | 2,173 | 2,173 | ||||||||||||
|
Due after ten years
|
511,690 | 468,441 | 4,335 | 4,336 | ||||||||||||
| Ps. | 18,335,815 | Ps. | 18,055,671 | Ps. | 2,992,970 | Ps. | 2,962,319 | |||||||||
As of December 31, 2013
Available for sale securities
|
Cost Basis
|
Gross Unrealized Gains
|
Gross unrealized Losses
|
Fair value
|
|||||||||||||
|
Debt securities (*)
|
||||||||||||||||
|
Securities issued or secured by Colombian Government
|
Ps. | 9,563,932 | Ps. | 29,846 | Ps. | (206,489 | ) | Ps. | 9,387,289 | |||||||
|
Securities issued or secured by Colombian government entities
|
291,459 | 4,848 | (5,999 | ) | 290,308 | |||||||||||
|
Securities issued or secured by other financial entities
|
2,118,461 | 8,102 | (52,991 | ) | 2,073,572 | |||||||||||
|
Securities issued or secured by foreign governments (1)
|
1,253,101 | 4,095 | (8,246 | ) | 1,248,950 | |||||||||||
|
Other (2)
|
1,221,638 | 3,131 | (77,356 | ) | 1,147,413 | |||||||||||
| 14,448,591 | 50,022 | ( 351,081 | ) | 14,147,532 | ||||||||||||
|
Equity securities
|
||||||||||||||||
|
Bolsa de Valores de Colombia S.A.
|
11,948 | 4,159 | – | 16,107 | ||||||||||||
|
Empresa de Energía de Bogotá S.A. E.S.P.
|
218,027 | 284,149 | – | 502,176 | ||||||||||||
|
Bladex S.A
|
94 | 131 | – | 225 | ||||||||||||
|
Gas Natural S.A. E.S.P.
|
29,225 | 42,289 | – | 71,514 | ||||||||||||
|
Mineros S.A.
|
56,785 | 16,380 | – | 73,165 | ||||||||||||
|
Mastercard Int
|
74 | 1,929 | – | 2,003 | ||||||||||||
| 316,153 | 349,037 | – | 665,190 | |||||||||||||
|
Total investments available for sale and unrealized gains (losses ) in other comprehensive income
|
Ps. | 14,764,744 | Ps. | 399,059 | Ps. | (351,081 | ) | Ps. | 14,812,722 | |||||||
|
(*)
|
On December 31, 2013 this amount includes Ps. 1,399,092 (U.S.$726.1 million) available for sale debt securities, as collateral of a loan for U.S.$540 million three-year term loan between Leasing Bogotá Panamá and Deutsche Bank.
|
Held-to-maturity securities
|
Cost Basis
|
Gross Unrealized Gains
|
Gross unrealized Losses
|
Fair value
|
|||||||||||||
|
Securities issued or secured by Colombian Government
|
Ps. | 462,366 | Ps. | 170 | Ps. | (21,454 | ) | Ps. | 441,082 | |||||||
|
Securities issued or secured by Colombian Government entities
|
2,511,975 | 1 | (39,660 | ) | 2,472,316 | |||||||||||
|
Securities issued or secured by other financial entities
|
306,339 | 7,787 | – | 314,126 | ||||||||||||
|
Securities issued or secured by foreign governments (1)
|
23,278 | 2 | – | 23,280 | ||||||||||||
|
Other (2)
|
19,779 | 100 | (146 | ) | 19,733 | |||||||||||
| Ps. | 3,323,737 | Ps. | 8,060 | Ps. | ( 61,260 | ) | Ps. | 3,270,537 | ||||||||
GRUPO AVAL ACCIONES Y VALORES S.A. AND ITS SUBSIDIARIES
NOTES TO THE CONSOLIDATED FINANCIAL STATEMENTS
FOR THE YEARS ENDED DECEMBER 31, 2014, 2013 AND 2012
(
Stated in millions of Colombian pesos and U.S. dollars)
The scheduled maturities of debt securities at December 31, 2013 were as follows:
December 31
2013
|
Available for sale
|
Held to maturity
|
|||||||||||||||
|
Cost basis
|
Fair value
|
Amortized cost
|
Fair value
|
|||||||||||||
|
Due in one year or less
|
Ps. | 1,336,300 | Ps. | 1,340,053 | Ps. | 3,033,696 | Ps. | 2,998,246 | ||||||||
|
Due from one year to five years
|
6,687,415 | 6,628,743 | 290,041 | 272,291 | ||||||||||||
|
Due to five years to ten years
|
5,432,542 | 5,241,514 | – | – | ||||||||||||
|
Due after ten years
|
992,334 | 937,222 | – | – | ||||||||||||
| Ps. | 14,448,591 | Ps. | 14,147,532 | Ps. | 3,323,737 | Ps. | 3,270,537 | |||||||||
The other restrictions pertain to investment repurchase rights and securities pledged as collateral. The former were pledged to support liquidity operations with counterparts and the latter with the Central Counterparty Risk Exchange.
|
|
(1)
|
The tables below presents debt securities issued or secured by foreign governments by Country:
|
Available for sale securities
|
Fair value
|
||||||||
|
2014
|
2013
|
|||||||
|
Brazil
|
Ps. | 28,691 | Ps. | 23,296 | ||||
|
Costa Rica
|
508,184 | 404,831 | ||||||
|
México
|
32,999 | 24,012 | ||||||
|
Panamá
|
379,857 | 140,703 | ||||||
|
United States of America
|
19,665 | 8,131 | ||||||
|
El Salvador
|
49,396 | 115,467 | ||||||
|
Chile
|
– | – | ||||||
|
Guatemala
|
126,628 | 291,756 | ||||||
|
Nicaragua
|
1,679 | 1,690 | ||||||
|
Perú
|
12,536 | 19,763 | ||||||
|
Barbados
|
– | 4,328 | ||||||
|
Honduras
|
345,140 | 214,973 | ||||||
|
Total Securities issued or secured by foreign governments
|
Ps. | 1,504,775 | Ps. | 1,248,950 | ||||
Held-to-maturity securities
|
Fair value
|
||||||||
|
2014
|
2013
|
|||||||
|
United States of America
|
Ps. | 31,238 | Ps. | 23,280 | ||||
|
Total Securities issued or secured by foreign governments
|
Ps. | 31,238 | Ps. | 23,280 | ||||
|
|
(2)
|
This amount mainly included debt securities issued by local and foreign entities classified in low risk categories such as: Titularizadora Colombiana, Grupo Suramericana in Colombia, Petrobras and Votorantim Group Ltd. in Brazil and Celulosa Arauco and Constitución S.A., Braskem, Gerdau and Telefonica Chile in Chile.
|
F-108
GRUPO AVAL ACCIONES Y VALORES S.A. AND ITS SUBSIDIARIES
NOTES TO THE CONSOLIDATED FINANCIAL STATEMENTS
FOR THE YEARS ENDED DECEMBER 31, 2014, 2013 AND 2012
(
Stated in millions of Colombian pesos and U.S. dollars)
Unrealized Losses Disclosure
The following table presents debt securities classified as available for sale and held to maturity that have unrealized losses as of December 31, 2014 and 2013:
Unrealized losses as of December 31, 2014
|
Cost basis
|
Unrealized Loss
|
Fair value
|
||||||||||
|
Available for sale - Debt securities less than 12 months
|
||||||||||||
|
Securities issued or secured by Colombian Government
|
Ps. | 3,888,058 | Ps. | (82,749 | ) | Ps. | 3,805,309 | |||||
|
Securities issued or secured by government entities
|
70,847 | (1,417 | ) | 69,430 | ||||||||
|
Securities issued or secured by other financial entities
|
1,435,251 | (9,718 | ) | 1,425,533 | ||||||||
|
Securities issued or secured by foreign governments
|
551,533 | (8,151 | ) | 543,382 | ||||||||
|
Other
|
141,888 | (4,605 | ) | 137,283 | ||||||||
| 6,087,577 | (106,640 | ) | 5,980,937 | |||||||||
|
Available for sale - Debt securities more than 12 months
|
||||||||||||
|
Securities issued or secured by Colombian Government
|
3,783,642 | (145,223 | ) | 3,638,419 | ||||||||
|
Securities issued or secured by government entities
|
178,490 | (5,631 | ) | 172,859 | ||||||||
|
Securities issued or secured by other financial entities
|
962,258 | (35,934 | ) | 926,324 | ||||||||
|
Securities issued or secured by foreign governments
|
46,019 | (3,829 | ) | 42,190 | ||||||||
|
Other
|
773,852 | (65,563 | ) | 708,289 | ||||||||
| 5,744,261 | (256,180 | ) | 5,488,081 | |||||||||
|
Available for sale - Equity securities less than 12 months
|
||||||||||||
|
Mineros S.A.
|
62,701 | (9,180 | ) | 53,521 | ||||||||
| 62,701 | (9,180 | ) | 53,521 | |||||||||
|
Total securities available for sale
|
11,894,539 | (372,000 | ) | 11,522,539 | ||||||||
|
Securities held to maturity less than 12 months
|
||||||||||||
|
Securities issued or secured by Colombian Government
|
6,512 | (192 | ) | 6,320 | ||||||||
|
Securities issued or secured by government entities
|
2,343,987 | (31,475 | ) | 2,312,512 | ||||||||
|
Securities issued or secured by financial entities
|
– | – | – | |||||||||
|
Securities issued or secured by foreign governments
|
7,237 | (4 | ) | 7,233 | ||||||||
|
Other
|
– | – | – | |||||||||
| 2,357,736 | (31,671 | ) | 2,326,065 | |||||||||
|
Securities held to maturity more than 12 months
|
||||||||||||
|
Securities issued or secured by Colombian Government
|
262,921 | (4,624 | ) | 258,297 | ||||||||
|
Securities issued or secured by government entities
|
15,124 | (70 | ) | 15,054 | ||||||||
|
Securities issued or secured by financial entities
|
– | – | – | |||||||||
|
Securities issued or secured by foreign governments
|
– | – | – | |||||||||
|
Other
|
11,202 | (87 | ) | 11,115 | ||||||||
| 289,247 | (4,781 | ) | 284,466 | |||||||||
|
Total securities held to maturity
|
2,646,983 | (36,452 | ) | 2,610,531 | ||||||||
|
Total investments with unrealized losses
|
14,541,522 | (408,452 | ) | 14,133,070 | ||||||||
|
Total investments with unrealized losses more than 12 months
|
Ps. | 6,033,508 | Ps. | (260,961 | ) | Ps. | 5,772,547 | |||||
GRUPO AVAL ACCIONES Y VALORES S.A. AND ITS SUBSIDIARIES
NOTES TO THE CONSOLIDATED FINANCIAL STATEMENTS
FOR THE YEARS ENDED DECEMBER 31, 2014, 2013 AND 2012
(
Stated in millions of Colombian pesos and U.S. dollars)
|
Unrealized losses as of December 31, 2013
|
Cost basis
|
Unrealized
Loss
|
Fair value
|
|||||||||
|
Available for sale - Debt securities less than 12 months
|
||||||||||||
|
Securities issued or secured by Colombian Government
|
Ps. | 6,524,533 | Ps. | (206,489 | ) | Ps. | 6,318,044 | |||||
|
Securities issued or secured by government entities
|
180,626 | (5,999 | ) | 174,627 | ||||||||
|
Securities issued or secured by other financial entities
|
1,270,001 | (52,780 | ) | 1,217,221 | ||||||||
|
Securities issued or secured by foreign governments
|
418,571 | (7,911 | ) | 410,660 | ||||||||
|
Other
|
950,953 | (77,356 | ) | 873,597 | ||||||||
| 9,344,684 | (350,535 | ) | 8,994,149 | |||||||||
|
Available for sale - Debt securities more than 12 months
|
||||||||||||
|
Securities issued or secured by other financial entities
|
9,099 | (211 | ) | 8,888 | ||||||||
|
Securities issued or secured by foreign governments
|
20,693 | (335 | ) | 20,358 | ||||||||
|
Other
|
18,858 | - | 18,858 | |||||||||
| 48,650 | (546 | ) | 48,104 | |||||||||
|
Total securities available for sale
|
9,393,334 | (351,081 | ) | 9,042,253 | ||||||||
|
Securities held to maturity less than 12 months
|
||||||||||||
|
Securities issued or secured by Colombian Government
|
1,376 | (16 | ) | 1,360 | ||||||||
|
Securities issued or secured by government entities
|
535,866 | (6,327 | ) | 529,539 | ||||||||
|
Securities issued or secured by foreign governments
|
9,662 | – | 9,662 | |||||||||
| 546,904 | (6,343 | ) | 540,561 | |||||||||
|
Securities held to maturity more than 12 months
|
||||||||||||
|
Securities issued or secured by Colombian Government
|
455,229 | (21,438 | ) | 433,791 | ||||||||
|
Securities issued or secured by government entities
|
1,975,585 | (33,333 | ) | 1,942,252 | ||||||||
|
Securities issued or secured by financial entities
|
13,594 | (146 | ) | 13,448 | ||||||||
| 2,444,408 | (54,917 | ) | 2,389,491 | |||||||||
|
Total securities held to maturity
|
2,991,312 | (61,260 | ) | 2,930,052 | ||||||||
|
Total investments with unrealized losses
|
12,384,646 | (412,341 | ) | 11,972,305 | ||||||||
|
Total investments with unrealized losses more than 12 months
|
Ps. | 2,493,058 | Ps. | (55,463 | ) | Ps. | 2,437,595 | |||||
The amount of realized gain or (loss) on trading securities included in earnings during 2014, 2013 and 2012 was Ps. 341,495, Ps. 338,959 and Ps. 388,508, respectively.
The amount of realized gain or (loss) on available for sale included in earnings during 2014, 2013 and 2012 was Ps. 118,803 Ps. 339,657 and Ps. 265,996, respectively.
As of December 31, 2014 losses with more than twelve months amounted to Ps. 260,961 and are represented primarily by mandatory securities issued or secured by the Colombian Government. Grupo Aval considers this decline in fair value as temporary, due to the fluctuations in the interest rates; however, those events do not affect the issuer’s creditworthiness. Grupo Aval has the ability and intent to hold these securities for a period of time sufficient to recover all unrealized losses. Accordingly, Grupo Aval has not recognized any other-than temporary impairment for these securities. These securities pay a fixed interest rate and have an average maturity of less than five years.
F-110
GRUPO AVAL ACCIONES Y VALORES S.A. AND ITS SUBSIDIARIES
NOTES TO THE CONSOLIDATED FINANCIAL STATEMENTS
FOR THE YEARS ENDED DECEMBER 31, 2014, 2013 AND 2012
(
Stated in millions of Colombian pesos and U.S. dollars)
|
2)
|
Derivatives
|
Fair value of derivative instruments
Under Colombian Banking GAAP, the fair value of derivative instruments is similar to U.S. GAAP, specifically ASC 820, except for the fact that Colombian Banking GAAP does not consider in the determination of fair values the company’s own credit risk, counterparty risk and consideration of collateral in addition to another previously mentioned difference.
On January 1, 2010 new rules were established by the Superintendency of Finance to measure the fair value of derivative instruments under Colombian Banking GAAP. Any day one gain or losses derived from the new valuation requirements on Swaps are deferred and amortized during the life of the instrument. This regulation was eliminated in March, 2013.
For U.S. GAAP purposes, such deferrals are reversed through the consolidated statement of income as these derivative instruments were classified as trading under U.S. GAAP.
The impact of the abovementioned differences in shareholders’ equity as of December 31, 2014 and 2013 consisted of Ps. 5,370 and Ps. 1,398, respectively, and the impact in the consolidated statements of income for the year ended December 31, 2014, 2013 and 2012 was Ps. 3,583, Ps. 3,065 and Ps. 1,038, respectively.
Hedge of a Net Investment in a Foreign Operation
Grupo Aval designated foreign exchange forwards and foreign currency denominated debt to hedge the foreign exchange risk associated with Grupo Aval’s investments in non-Colombian Peso functional currency subsidiaries; in the case of the designated forwards, these are entered into for a short term period and as they expire, new forwards are again entered into (known as “rolling hedge” strategy), in order to preserve the portion of the net equity investment in terms of Colombian Pesos if the USD depreciates against Grupo Aval’s functional currency. See Note 30 s) for differences between Colombian Banking GAAP and U.S. GAAP in relation to hedge accounting.
Additional disclosures for derivatives
The tables below are included in accordance with ASC 820-10 disclosure requirements and present the financial position of the derivatives contracts recorded to the caption “other assets” and “other liabilities” as of December 31, 2014 and 2013 and their gain and loss recognized in the Consolidated Statement of Income:
|
Asset
|
||||||||||||||||||||||||
|
As of December
|
December 31, 2014
|
December 31, 2013
|
||||||||||||||||||||||
|
Notional amount
|
Fair Value
|
Average Maturity (days)
|
Notional amount
|
Fair Value
|
Average maturity (days)
|
|||||||||||||||||||
|
Interest rate contracts (1)
|
Ps. | 7,232,354 | Ps. | 72,056 | 681 | Ps. | 2,615,618 | Ps. | 31,837 | 597 | ||||||||||||||
|
Foreign exchange contracts (1)
|
15,749,533 | 1,012,324 | 156 | 5,789,389 | 159,188 | 109 | ||||||||||||||||||
|
Total
|
Ps. | 22,981,887 | Ps. | 1,084,380 | Ps. | 8,405,007 | Ps. | 191,025 | ||||||||||||||||
|
Liability
|
||||||||||||||||||||||||
|
Interest rate contracts (2)
|
Ps. | (7,591,621 | ) | (95,685 | ) | 800 | Ps. | (3,415,800 | ) | Ps. | (29,320 | ) | 605 | |||||||||||
|
Foreign exchange contracts (2)
|
(21,151,410 | ) | (1,576,711 | ) | 114 | (5,895,682 | ) | (194,739 | ) | 136 | ||||||||||||||
|
Total
|
Ps. | (28,743,031 | ) | Ps. | (1,672,396 | ) | Ps. | ( 9,311,482 | ) | Ps. | (224,059 | ) | ||||||||||||
|
|
(1)
|
Presented in the condensed consolidated balance sheet within “Other assets”.
|
|
|
(2)
|
Presented in the condensed consolidated balance sheet within “Other liabilities”.
|
GRUPO AVAL ACCIONES Y VALORES S.A. AND ITS SUBSIDIARIES
NOTES TO THE CONSOLIDATED FINANCIAL STATEMENTS
FOR THE YEARS ENDED DECEMBER 31, 2014, 2013 AND 2012
(
Stated in millions of Colombian pesos and U.S. dollars)
The following table presents the gain or (loss) from derivatives not designated as hedging instruments:
|
2014
|
2013
|
2012
|
||||||||||
|
Presentation of gain or (loss) recognized in income
on derivative
|
Amount of gain or (loss) recognized in income on Derivatives
|
Amount of gain or (loss) recognized in income on Derivatives
|
Amount of gain or (loss) recognized in income on Derivatives
|
|||||||||
|
Gain from fair value adjustment
|
Ps. | 6,115,729 | Ps. | 5,077,169 | Ps. | 3,391,603 | ||||||
|
Loss from fair value adjustment
|
(6,432,056 | ) | ( 5,035,424 | ) | ( 3,360,000 | ) | ||||||
| Ps. | (316,327 | ) | Ps. | 41,745 | Ps. | 31,603 | ||||||
The following table presents the derivatives notional amounts as of December 31, 2014 and 2013:
|
2014
|
2013
|
|||||||
|
Derivatives not designated as hedging
instruments under ASC 815
|
||||||||
|
Interest rate contracts
|
Ps. | 14,823,975 | Ps. | 6,031,417 | ||||
|
Foreign exchange contracts
|
32,472,499 | 9,563,632 | ||||||
| Ps. | 47,296,474 | Ps. | 15,595,049 | |||||
|
2014
|
2013
|
|||||||
|
Derivatives designated as hedging instrument
|
||||||||
|
Foreign exchange contracts
|
Ps. | (4,428,443 | ) | Ps. | ( 2,121,440 | ) | ||
| Ps. | (4,428,443 | ) | Ps. | ( 2,121,440 | ) | |||
Offsetting Financial Assets and Liabilities.
According to ASU 2013 – 01, we were required to disclose both gross and net information about instruments and transactions eligible for offset on the balance sheet as well as instruments and transactions subject to an agreement similar to a master netting arrangement. The disclosures are required irrespective of whether such instruments are presented gross or net on the balance sheet. The guidance was effective for annual and interim reporting periods beginning on or after January 1, 2013, with comparative retrospective disclosures required for all periods presented. Our adoption of the guidance had no effect on our financial condition, results of operations or liquidity as it only affects our disclosures.
Offsetting assets
|
Gross Amounts of Recognized Assets
|
Gross Amounts Offset in the Consolidated Balance Sheet
|
Net Amounts of Assets Presented in the Consolidated Balance Sheet
|
Gross Amounts Not Offset in the Consolidated Balance Sheet
|
Net Exposure
|
||||||||||||||||||||
|
Financial Instruments
|
Collateral Received
|
|||||||||||||||||||||||
|
As of December 31, 2014
|
||||||||||||||||||||||||
|
Derivatives
|
Ps. | 1,377,090 | Ps. | (292,701 | ) | Ps. | 1,084,389 | Ps. | - | Ps. | (2,584 | ) | Ps. | 1,081,805 | ||||||||||
|
Repurchase agreements
|
588,895 | - | 588,895 | (556,406 | ) | - | 32,489 | |||||||||||||||||
|
Total
|
Ps. | 1,965,985 | Ps. | (292,701 | ) | Ps. | 1,673,284 | Ps. | (556,406 | ) | Ps. | (2,584 | ) | Ps. | 1,114,294 | |||||||||
GRUPO AVAL ACCIONES Y VALORES S.A. AND ITS SUBSIDIARIES
NOTES TO THE CONSOLIDATED FINANCIAL STATEMENTS
FOR THE YEARS ENDED DECEMBER 31, 2014, 2013 AND 2012
(
Stated in millions of Colombian pesos and U.S. dollars)
Offsetting liabilities
|
Gross Amounts of Recognized Liabilities
|
Gross Amounts Offset in the Consolidated Balance Sheet
|
Net Amounts of Liabilities Presented in the Consolidated Balance Sheet
|
Gross Amounts Not Offset in the Consolidated Balance Sheet
|
Net Exposure
|
||||||||||||||||||||
|
Financial Instruments
|
Collateral Pledged
|
|||||||||||||||||||||||
|
As of December 31, 2014
|
||||||||||||||||||||||||
|
Derivatives
|
Ps. | 2,526,169 | Ps. | (841,601 | ) | Ps. | 1,684,568 | Ps. | – | Ps. | (312,302 | ) | Ps. | 1,372,265 | ||||||||||
|
Repurchase agreements
|
3,816,514 | – | 3,816,514 | (2,327,091 | ) | (857,058 | ) | 632,365 | ||||||||||||||||
|
Total
|
Ps. | 6,342,683 | Ps. | ( 841,601 | ) | Ps. | 5,501,082 | Ps. | ( 2,327,091 | ) | Ps. | (1,169,360 | ) | Ps. | 2,004,630 | |||||||||
Offsetting assets
|
Gross Amounts of Recognized Assets
|
Gross Amounts Offset in the Consolidated Balance Sheet
|
Net Amounts of Assets Presented in the Consolidated Balance Sheet
|
Gross Amounts Not Offset in the Consolidated Balance Sheet
|
Net Exposure
|
||||||||||||||||||||
|
Financial Instruments
|
Collateral Received
|
|||||||||||||||||||||||
|
As of December 31, 2013
|
||||||||||||||||||||||||
|
Derivatives
|
Ps. | 267,434 | Ps. | (76,409 | ) | Ps. | 191,025 | Ps. | (31,871 | ) | Ps. | (10,322 | ) | Ps. | 148,832 | |||||||||
|
Repurchase agreements
|
960,654 | - | 960,654 | (932,366 | ) | (12,162 | ) | 16,126 | ||||||||||||||||
|
Total
|
Ps. | 1,228,088 | Ps. | ( 76,409 | ) | Ps. | 1,151,679 | Ps. | (964,237 | ) | Ps. | (22,484 | ) | Ps. | 164,958 | |||||||||
Offsetting liabilities
| Gross Amounts of Recognized Liabilities | Gross Amounts Offset in the Consolidated Balance Sheet | Net Amounts of Liabilities Presented in the Consolidated Balance Sheet |
Gross Amounts Not Offset in the Consolidated Balance Sheet
|
Net Exposure | ||||||||||||||||||||
|
Financial Instruments
|
Collateral Pledged
|
|||||||||||||||||||||||
|
As of December 31, 2013
|
||||||||||||||||||||||||
|
Derivatives
|
Ps. | 297,034 | Ps. | (72,975 | ) | Ps. | 224,059 | Ps. | - | Ps. | (12,808 | ) | Ps. | 211,251 | ||||||||||
|
Repurchase agreements
|
4,670,067 | - | 4,670,067 | (4,113,846 | ) | (381,620 | ) | 174,602 | ||||||||||||||||
|
Total
|
Ps. | 4,967,101 | Ps. | ( 72,975 | ) | Ps. | 4,894,126 | Ps. | (4,113,846 | ) | Ps. | (394,428 | ) | Ps. | 385,852 | |||||||||
Embedded derivatives
Unlike Colombian Banking GAAP, U.S. GAAP requires the separation of embedded derivatives from the host contract with the embedded derivatives carried at fair value if the economic characteristics of the derivative are not clearly and closely related to the economic characteristics of the host contract. As of December 31, 2014 and 2013, no embedded derivatives required bifurcation.
F-113
GRUPO AVAL ACCIONES Y VALORES S.A. AND ITS SUBSIDIARIES
NOTES TO THE CONSOLIDATED FINANCIAL STATEMENTS
FOR THE YEARS ENDED DECEMBER 31, 2014, 2013 AND 2012
(
Stated in millions of Colombian pesos and U.S. dollars)
|
j)
|
Investments in unaffiliated companies:
|
Under Colombian Banking GAAP, these investments are initially recognized at cost and subsequently measured depending on the liquidity of the security and the market of reference where it is traded, either in Colombia or in countries other than Colombia. Equity securities listed, issued and traded in Colombia are mainly valued on a daily basis using prices published by authorized entities (i.e., Infovalmer). Equity securities non-listed, issued and traded in Colombia are valued based on the acquisition cost which is later increased or decreased depending upon the investor’s percentage stake in all subsequent changes in the issuer’s shareholders’ equity. For this purpose, the issuer’s shareholders’ equity is calculated based on audited financial statements at the cut-off dates of December 31 of each year.
Under U.S. GAAP, investments where an investor does not have significant influence over the investee’s operations are accounted for at fair value if their fair value is readily determinable. The U.S. GAAP adjustment reflects in shareholders’ equity the difference between fair value under U.S. GAAP and the equity method of accounting recognized under Colombian Banking GAAP as well as differences in the fair value under Colombian Banking and U.S. GAAP. Depending on the classification under U.S. GAAP, trading or available for sale, the adjustment will remain in shareholders’ equity or be reclassified to the statement of income as necessary.
Certain reclassifications made under Colombian Banking GAAP from available for sale to trading as described in Note 4 have been reversed for U.S. GAAP purposes.
The U.S. GAAP adjustment on the condensed consolidated statements of income for the years ended December 31, 2014, 2013 and 2012 relates to the following unaffiliated companies:
|
2014
|
2013
|
2012
|
||||||||||
|
Equity securities
|
||||||||||||
|
Mineros S.A.
|
Ps. | 25,560 | Ps. | 11,032 | Ps. | (27,413 | ) | |||||
|
Proenergía Internacional S.A. (1)
|
– | – | 65,203 | |||||||||
|
Total
|
Ps. | 25,560 | Ps. | 11,032 | Ps. | 37,790 | ||||||
|
(1)
|
During 2012 the investment in Proenergía Internacional was sold and the adjustments recorded were reversed against income.
|
The U.S. GAAP adjustment on shareholders’ equity relates to the following unaffiliated companies:
|
December 31, 2014
|
December 31, 2013
|
|||||||||||||||||||||||
|
Equity securities
|
Amount under Colombian Banking
GAAP
|
U.S. GAAP adjustments
|
Amount under U.S. GAAP
|
Amount under Colombian Banking GAAP
|
U.S. GAAP adjustments
|
Amount under U.S. GAAP
|
||||||||||||||||||
|
Empresa de Energía de Bogotá S. A.
|
Ps. | 556,156 | Ps. | – | Ps. | 556,156 | Ps. | 502,176 | Ps. | – | Ps. | 502,176 | ||||||||||||
|
Gas Natural S. A. E.S.P.
|
53,480 | 19,900 | 73,380 | 53,480 | 18,034 | 71,514 | ||||||||||||||||||
|
Mineros S. A.
|
53,521 | – | 53,521 | 73,165 | – | 73,165 | ||||||||||||||||||
|
Bladex S.A.
|
387 | – | 387 | 225 | – | 225 | ||||||||||||||||||
|
Mastercard Int
|
91 | 2,473 | 2,564 | 74 | 1,929 | 2,003 | ||||||||||||||||||
|
Bolsa de Valores de Colombia S. A.
|
13,420 | 1,716 | 15,136 | 14,264 | 1,843 | 16,107 | ||||||||||||||||||
|
Other
|
1,821 | – | 1,821 | - | – | – | ||||||||||||||||||
|
Total
|
Ps. | 678,876 | Ps. | 24,089 | Ps. | 702,965 | Ps. | 643,384 | Ps. | 21,806 | Ps. | 655,190 | ||||||||||||
F-114
GRUPO AVAL ACCIONES Y VALORES S.A. AND ITS SUBSIDIARIES
NOTES TO THE CONSOLIDATED FINANCIAL STATEMENTS
FOR THE YEARS ENDED DECEMBER 31, 2014, 2013 AND 2012
(
Stated in millions of Colombian pesos and U.S. dollars)
The following represents a roll forward of the accumulated effect in equity of the U.S. GAAP adjustment
:
|
2014
|
2013
|
2012
|
||||||||||
|
Balance at the beginning of the year
U.S. GAAP adjustment
|
Ps. | (21,806 | ) | Ps. | (26,909 | ) | Ps. | (25,546 | ) | |||
|
Adjustment recorded during the year to
statement of income
|
(25,560 | ) | (11,032 | ) | (37,790 | ) | ||||||
|
Adjustment recorded to OCI (unrealized gains (losses) on available for sale securities)
|
23,277 | 16,135 | 36,427 | |||||||||
|
Balance at the end of the year
|
Ps. | (24,089 | ) | Ps. | ( 21,806 | ) | Ps. | ( 26,909 | ) | |||
|
k)
|
Investments in affiliated companies:
|
This adjustment relates to investments in equity securities where Grupo Aval exercises significant influence over the investee’s operations.
Under Colombian Banking GAAP, investments in affiliated companies are recorded at their fair value similar to investments in unaffiliated companies, recording any effects derived from these adjustments on reappraisal of assets within shareholders’ equity.
Under U.S. GAAP, these investments are recognized under the equity method of accounting determined using the latest audited financial statements issued by the each investees adjusted to U.S. GAAP, with effect in the Consolidated Statement of Income or OCI for unrealized gains or losses.
As of December 31, 2010, Corficolombiana held a 14.39% direct equity stake in Promigas. As of that date, this investment was classified as available for sale and affected the unrealized gains account in the “other comprehensive income”.
On February 10, 2011, Corficolombiana, Empresa de Energia de Bogotá and two Colombian private investment funds, purchased from AEI three Special Purpose Vehicles located in Cayman Islands (AEI Promigas Holdings Ltd., AEI Promigas Ltd. and AEI Promigas Investments Ltd.) which together held a 52.13% stake in Promigas SA ESP. Corficolombiana acquired 20.3% of the three Special Purpose Vehicles which resulted in an additional indirect stake in Promigas of 10.58% for a total direct and indirect economic interest of 24.9%.
Additionally, Corficolombiana, together with some Investments Funds managed by Porvenir, and Corredores Asociados (an independent brokerage firm in Colombia), invested in a private investment fund which bought an additional stake in the three Special Purpose Vehicles mentioned above. The private investment fund, independently managed by Corredores Asociados, acquired 47.9% of the three Special Purpose Vehicles (acquiring an indirect investment in Promigas of 24.97%). The investment associated with this transaction totaled U.S.$792.8 million equivalent to Ps. 1,488,029 approximately of which Corficolombiana contributed U.S.$388.7 million equivalent to Ps. 729,562 and the Investments Funds managed by Porvenir contributed U.S.$151.6 million equivalent to Ps. 283,104. Through its participation in this private investment fund, Corficolombiana acquired an additional exposure of 14.94% to Promigas for a total of 39.91% direct and indirect stake.
Due to the increase in the equity stake of Promigas, during the year ended December 31, 2011 and up to November 30, 2012, Corficolombiana’s investment in Promigas was recorded under the equity method (No retroactive impacts were included as they were deemed immaterial). In November 30, 2012, and as further explained in the “business combination” section, Grupo Aval acquired control, under U.S. GAAP regulations, (not under Colombian regulations) of Promigas by acquiring an additional 10.32% of the company through two tender offer processes done in the local capital market.
After Corficolombiana acquired control of Promigas, the U.S. GAAP adjustment to this investment was reclassified from the “equity method” caption to the “business combination” caption.
GRUPO AVAL ACCIONES Y VALORES S.A. AND ITS SUBSIDIARIES
NOTES TO THE CONSOLIDATED FINANCIAL STATEMENTS
FOR THE YEARS ENDED DECEMBER 31, 2014, 2013 AND 2012
(
Stated in millions of Colombian pesos and U.S. dollars)
U.S. GAAP adjustment on the consolidated statements of income for the years ended December 31, 2014, 2013 and 2012 relate to the following affiliated companies:
|
Equity securities
|
2014
|
2013
|
2012
|
|||||||||
|
A.C.H. Colombia S.A.
|
Ps. | 1,669 | Ps. | 1,321 | Ps. | (95 | ) | |||||
|
Aerocali S.A.
|
2,364 | 3,422 | 1,167 | |||||||||
|
Colombiana de Extrusión S.A. Extrucol
|
587 | (248 | ) | 168 | ||||||||
|
Compañía Aguas de Colombia
|
84 | (10 | ) | 45 | ||||||||
|
Concesionaria Ruta del Sol SA
|
(15,318 | ) | (9,699 | ) | 5,437 | |||||||
|
Concesionaria Tibitoc S.A.
|
604 | 485 | 1,874 | |||||||||
|
Fidecomiso Meléndez
|
(2,686 | ) | 22 | 65 | ||||||||
|
Hoteles Estelar Yopal
|
(1,153 | ) | – | – | ||||||||
|
Fondo Capital I Corredores Investment fund (*)
|
– | – | 42,716 | |||||||||
|
Promigas S.A. (*)
|
– | – | 14,554 | |||||||||
|
Redeban Multicolor SA
|
(2,497 | ) | 5,980 | 725 | ||||||||
|
Sociedad Transportadora de Gas del Oriente S.A.
|
– | – | – | |||||||||
|
Total
|
Ps. | ( 16,346 | ) | Ps. | 1,273 | Ps. | 66,656 | |||||
|
(*)
|
See Note 30 (m) “Business combination”
|
The U.S. GAAP adjustment on shareholders’ equity relates to the following affiliated companies:
|
December 31, 2014
|
||||||||||||||||||||
|
Equity securities
|
Amount under Colombian Banking GAAP
|
Accumulated U.S. GAAP adjustments of prior year
|
Adjustments net income under equity method of 2014
|
Accumulated U.S. GAAP adjustments
|
Amount under U.S. GAAP
|
|||||||||||||||
|
A.C.H. Colombia S.A.
|
Ps. | 2,379 | Ps. | 3,259 | Ps. | 1,669 | Ps. | 4,928 | Ps. | 7,307 | ||||||||||
|
Aerocali S.A.
|
7,720 | 6,812 | 2,364 | 9,176 | 16,896 | |||||||||||||||
|
Colombiana de Extrusión S.A. Extrucol
|
1,785 | 1,208 | 587 | 1,795 | 5,370 | |||||||||||||||
|
Compañía Aguas de Colombia
|
1,097 | 58 | 84 | 142 | 1,239 | |||||||||||||||
|
Concesionaria Ruta del Sol SA
|
86,562 | 962 | (15,318 | ) | (14,356 | ) | 72,206 | |||||||||||||
|
Concesionaria Tibitoc S.A.
|
9,823 | 5,959 | 604 | 6,563 | 16,386 | |||||||||||||||
|
Hoteles Estelar Yopal
|
3,811 | – | (1,153 | ) | (1,153 | ) | 2,658 | |||||||||||||
|
Fidecomiso Meléndez
|
14,825 | (170 | ) | (2,686 | ) | (2,856 | ) | 11,969 | ||||||||||||
|
Redeban Multicolor SA
|
4,552 | 13,414 | (2,497 | ) | 10,917 | 15,469 | ||||||||||||||
|
Gases del Caribe S.A. ESP (Gascaribe)
|
– | – | – | – | 8,436 | |||||||||||||||
|
Gas Natural de Lima y Callao
|
– | – | – | – | 386,842 | |||||||||||||||
|
Energía Eficiente S.A. ESP
|
– | – | – | – | 4,146 | |||||||||||||||
|
Metrex
|
– | – | – | – | 617 | |||||||||||||||
|
Complejo Energético del Este
|
– | – | – | – | 2,659 | |||||||||||||||
|
Total
|
Ps. | 132,554 | Ps. | 31,502 | Ps. | (16,346 | ) | Ps. | 15,156 | Ps. | 552,200 | |||||||||
GRUPO AVAL ACCIONES Y VALORES S.A. AND ITS SUBSIDIARIES
NOTES TO THE CONSOLIDATED FINANCIAL STATEMENTS
FOR THE YEARS ENDED DECEMBER 31, 2014, 2013 AND 2012
(
Stated in millions of Colombian pesos and U.S. dollars)
|
December 31, 2013
|
||||||||||||||||||||
|
Equity securities
|
Amount under Colombian Banking GAAP
|
Accumulated U.S. GAAP prior year adjustments
|
Adjustments to net income under equity method of 2013
|
Total U.S. GAAP adjustments
|
Amount under U.S. GAAP
|
|||||||||||||||
|
A.C.H. Colombia S.A.
|
Ps. | 2,379 | Ps. | 1,938 | Ps. | 1,321 | Ps. | 3,259 | Ps. | 5,638 | ||||||||||
|
Aerocali S.A.
|
7,718 | 3,390 | 3,422 | 6,812 | 14,530 | |||||||||||||||
|
Colombiana de Extrusión S.A. Extrucol
|
1,785 | 1,456 | (248 | ) | 1,208 | 4,576 | ||||||||||||||
|
Compañía Aguas de Colombia
|
1,097 | 68 | (10 | ) | 58 | 1,154 | ||||||||||||||
|
Concesionaria Ruta del Sol SA (1)
|
86,562 | 10,662 | (9,966 | ) | 963 | 87,526 | ||||||||||||||
|
Concesionaria Tibitoc S.A.
|
9,823 | 5,473 | 485 | 5,958 | 15,781 | |||||||||||||||
|
Fidecomiso Meléndez
|
14,825 | (192 | ) | 22 | (170 | ) | 14,655 | |||||||||||||
|
Redeban Multicolor SA
|
4,552 | 7,433 | 5,981 | 13,414 | 17,966 | |||||||||||||||
|
Gases del Caribe S.A. ESP (Gascaribe)
|
– | – | – | – | 14,930 | |||||||||||||||
|
Gas Natural de Lima y Callao
|
– | – | – | – | 308,354 | |||||||||||||||
|
Energía Eficiente S.A. ESP
|
– | – | – | – | 909 | |||||||||||||||
|
Metrex
|
– | – | – | – | 728 | |||||||||||||||
|
Complejo Energético del Este
|
– | – | – | – | 2,934 | |||||||||||||||
|
Total
|
Ps. | 128,741 | Ps. | 30,228 | Ps. | 1,273 | Ps. | 31,502 | Ps. | 489,681 | ||||||||||
The following table shows the investments in affiliates under U.S. GAAP for the years 2014 and 2013.
|
Equity securities
|
2014
|
2013
|
||||||
|
A.C.H. Colombia S.A.
|
Ps. | 7,307 | Ps. | 5,638 | ||||
|
Aerocali S.A.
|
16,896 | 14,530 | ||||||
|
Colombiana de Extrusión S.A. Extrucol
|
5,370 | 4,576 | ||||||
|
Compañía Aguas de Colombia
|
1,239 | 1,155 | ||||||
|
Concesionaria Ruta del Sol SA
|
72,206 | 87,524 | ||||||
|
Concesionaria Tibitoc S.A.
|
16,386 | 15,782 | ||||||
|
Fidecomiso Meléndez
|
11,969 | 14,655 | ||||||
|
Hoteles Estelar Yopal
|
2,658 | - | ||||||
|
Redeban Multicolor SA
|
15,469 | 17,966 | ||||||
|
Gases del Caribe S.A. ESP (Gascaribe)
|
8,436 | 14,930 | ||||||
|
Gas Natural de Lima y Callao
|
386,842 | 308,354 | ||||||
|
Energía Eficiente S.A. ESP
|
4,146 | 909 | ||||||
|
Metrex
|
617 | 728 | ||||||
|
Complejo Energético del Este
|
2,659 | 2,934 | ||||||
|
Total
|
Ps. | 552,200 | Ps. | 489,681 | ||||
|
l)
|
Lessor accounting:
|
Under Colombian Banking GAAP, from the standpoint of the lessor, leases are classified as either financial or operating leases based on legal terms. Agreements with bargain purchase options are recognized as direct financial leases. Other agreements are recognized as operating leases. Assets provided through financial lease agreements are recorded as loans while assets provided through operating lease agreements are recorded as property, plant and equipment.
Under U.S. GAAP, leases are classified as either financial or operating leases based on the economic substance of the agreements using criteria established by ASC 840-10. Direct financing leases are carried at the aggregate of lease payments receivable plus the estimated residual value of the leased property less unearned income.
F-117
GRUPO AVAL ACCIONES Y VALORES S.A. AND ITS SUBSIDIARIES
NOTES TO THE CONSOLIDATED FINANCIAL STATEMENTS
FOR THE YEARS ENDED DECEMBER 31, 2014, 2013 AND 2012
(
Stated in millions of Colombian pesos and U.S. dollars)
The reconciliation adjustment relates to differences in the book value of certain operating lease agreements classified from the standpoint of the lessor, under Colombian Banking GAAP as a fixed asset in the balance sheet (cost less accumulated depreciation), which under U.S. GAAP are classified as direct leases do not recognize the fixed assets posted under Colombian Banking GAAP due to treatment required under U.S. GAAP.
Such difference decreases shareholders’ equity under U.S. GAAP by Ps. (11,985) and Ps. (6,361) in 2014, and 2013, respectively, decreases the condensed statements of income by Ps. (5,624), Ps. (12,662) and Ps. (2,234) in 2014, 2013 and 2012, respectively, due to treatment from the U.S. GAAP standpoint.
The following lists the components of net investment in direct financial leases for the years ended December 31, 2014 and 2013:
|
2014
|
2013
|
|||||||
|
Total minimum lease payments to be received
|
Ps. | 11,376,618 | Ps. | 10,597,670 | ||||
|
Less: Amount representing estimated executory cost (such as taxes, maintenance or insurance) including profit and total minimum lease payments
|
(233,602 | ) | (228,211 | ) | ||||
|
Minimum lease payments receivable
|
11,143,016 | 10,369,459 | ||||||
|
Estimated residual values of leased (unguaranteed)
|
(84,330 | ) | (93,459 | ) | ||||
|
Less: Unearned income
|
(2,386,657 | ) | (2,172,601 | ) | ||||
|
Net investment in direct financial leases
|
Ps. | 8,672,029 | Ps. | 8,103,399 | ||||
The following schedule shows the future minimum lease payments to be received on direct financial leases and operating leases for each of the next five years and thereafter.
|
For the year ended December 31, 2014
|
Financial leases
|
Operating leases
|
||||||
|
2015
|
Ps. | 3,057,571 | Ps. | 242 | ||||
|
2016
|
1,782,364 | 1,180 | ||||||
|
2017
|
1,512,182 | 612 | ||||||
|
2018
|
1,039,835 | 304 | ||||||
|
2019
|
969,477 | 1,695 | ||||||
|
2020 and thereafter
|
3,015,189 | 3,086 | ||||||
|
Total minimum future lease payments to be received
|
Ps. | 11,376,618 | Ps. | 7,119 | ||||
The total rental expense for all operating leases, except for terms of a month or less that were not renewed, for 2014, 2013 and 2012 were Ps. 240,732, Ps. 208,919 and Ps. 169,101, respectively.
|
m)
|
Business combinations
|
Under Colombian Banking GAAP, the accounting for business combinations requires the purchase price to be allocated among the acquired assets and liabilities on the basis of their book values. The difference between the purchase price, which excludes acquisition costs, and the book value of the acquired asset is recognized as goodwill. Goodwill generated in acquisitions prior to 2006 is amortized over a 10-year period and goodwill generated in acquisitions after 2006 is amortized over a 20-year period.
Rules issued by the Superintendency of Finance require that for the period in which a business acquisition occurs, the acquiring company’s statement of income must include the gross income and expenses for the same period of the acquired company. The acquiring company’s statement of income will appear as if the acquisition had occurred on the first day of the reporting period. The statement of income shall include deductions of the acquired company and accumulated net income for the period up to the last month prior to the acquisition date.
F-118
GRUPO AVAL ACCIONES Y VALORES S.A. AND ITS SUBSIDIARIES
NOTES TO THE CONSOLIDATED FINANCIAL STATEMENTS
FOR THE YEARS ENDED DECEMBER 31, 2014, 2013 AND 2012
(
Stated in millions of Colombian pesos and U.S. dollars)
U.S. GAAP requires the purchase price to be allocated among the identifiable assets acquired, including any intangible assets and liabilities assumed, on the basis of their respective fair values. The difference between this amount and the purchase price is recognized as goodwill. Under U.S. GAAP, goodwill is not amortized but is subject to an annual impairment test. Furthermore, business combinations are always accounted for on the condensed consolidated statement of income from the date on which the acquirer obtains control or legally transfers the consideration, acquires the assets, or assumes the liabilities of the acquiree.
Horizonte acquisition
On April 18, 2013 Grupo Aval acquired 99.99% of the common shares issued by Administradora Horizonte S.A. (hereinafter “Horizonte”), a severance and pension fund company manager incorporated under Colombian law to administer severance and pension plans of Colombian workers. The cash price paid for the acquisition was U.S.$541,372 (thousands) equivalent to Ps. 999,622. The purpose of such acquisition was to merge Horizonte with Sociedad Administradora de Fondos de Pensiones y Cesantías Porvenir S.A., a Grupo Aval subsidiary, which is dedicated to the same business as Horizonte. Such acquisition will consolidate the market share of these two companies. For consolidation purposes, the results of Horizonte have been included as from the acquisition date in Grupo Aval’s financial statements. Goodwill resulting from the acquisition has been recognized in the amount of Ps. 397,662 under U.S. GAAP. The Goodwill primarily consists of the potential future benefits of the Horizonte business and the synergies and economies of scale expected from the combined operations with Porvenir.
The following table discloses the total assets acquired and liabilities assumed from Horizonte under U.S. GAAP on March 31, 2013:
|
U.S. GAAP Book value
|
Adjustment to fair value
|
Fair value
|
||||||||||
|
Purchase Price
|
999,622 | |||||||||||
|
Cash and due from banks
|
Ps. | 168,717 | Ps. | – | Ps. | 168,717 | ||||||
|
Investments
|
317,011 | – | 317,011 | |||||||||
|
Accounts receivable
|
22,207 | (92 | ) | 22,115 | ||||||||
|
Property, plant and equipment, net
|
12,636 | 20,834 | 33,470 | |||||||||
|
Intangibles (*)
|
– | 261,062 | 261,062 | |||||||||
|
Deferred tax asset
|
20,516 | 63,028 | 83,543 | |||||||||
|
Other assets
|
13,106 | (7,178 | ) | 5,929 | ||||||||
|
Total Assets Acquired
|
554,193 | 337,654 | 891,847 | |||||||||
|
Other liabilities
|
(122,129 | ) | (62,489 | ) | (184,618 | ) | ||||||
|
Deferred tax
|
(11,750 | ) | (93,519 | ) | ( 105,269 | ) | ||||||
|
Total Liabilities Assumed
|
(133,879 | ) | (156,008 | ) | (289,887 | ) | ||||||
|
Identifiable assets acquired and liabilities assumed in Horizonte measured in accordance with ASC 805- 20-30
|
Ps. | 420,314 | Ps. | 181,646 | 601,960 | |||||||
|
Goodwill
|
397,662 | |||||||||||
|
Fair value of assets acquired and liabilities assumed
|
Ps. | 999,622 | ||||||||||
|
(*)
|
This amount includes trademarks for Ps. 1,000 and rights to assets management for Ps. 260,062.
|
GRUPO AVAL ACCIONES Y VALORES S.A. AND ITS SUBSIDIARIES
NOTES TO THE CONSOLIDATED FINANCIAL STATEMENTS
FOR THE YEARS ENDED DECEMBER 31, 2014, 2013 AND 2012
(
Stated in millions of Colombian pesos and U.S. dollars)
Reformador Group acquisition
On December 23, 2013 Credomatic International Corporation, a subsidiary of Grupo Aval, acquired 100% of the common shares issued by Grupo Financiero Reformador de Guatemala S.A. The price paid for the acquisition was U.S.$421,349 (thousands) equivalent to Ps. 811,869. On December 23, 2013, Ps. 791,927 (U.S.$411 million) was paid and the remaining Ps. 19,942 (U.S.$10.3 million) was paid as an adjustment to the purchase price on 2014. The purpose of this acquisition was to merge BAC Credomatic with Reformador, in order to recognize certain synergies as both companies are involved in similar businesses. For consolidation purposes, the results of Reformador have been included in Grupo Aval’s consolidated financial statements from acquisition date beginning on the date of acquisition. Goodwill resulting from the acquisition was recognized in the amount of U.S.$248,894 (thousands) equivalent to Ps. 479,576 under U.S. GAAP. This goodwill primarily consists of the potential future benefits of the Reformador business and the synergies and economies of scale expected from the newly combined operations.
The following chart summarizes the amount paid for the acquisition of the Reformador Group and the value of assets acquired and liabilities assumed at December 31, 2013:
|
Book value as of December 31, 2013
(U.S.$)
|
Adjustments to fair value
(U.S.$)
|
Fair value as of December 31, 2013
(U.S.$)
|
Equivalent to millions of Colombian pesos
|
|||||||||||||
|
Purchase price (*)
|
U.S.$ | 421,349,580 | Ps. | 811,869 | ||||||||||||
|
Assets acquired and liabilities assumed
|
||||||||||||||||
|
Assets
|
||||||||||||||||
|
Cash and cash equivalents
|
U.S.$ | 270,778,042 | U.S.$ | – | U.S.$ | 270,778,042 | Ps. | 521,743 | ||||||||
|
Term deposits
|
51,567,509 | – | 51,567,509 | 99,362 | ||||||||||||
|
Investments in securities
|
208,680,690 | – | 208,680,690 | 402,092 | ||||||||||||
|
Loan portfolio (*)
|
1,031,139,800 | (30,905,490 | ) | 1,000,234,310 | 1,927,281 | |||||||||||
|
Properties and equipment
|
24,628,106 | (245,190 | ) | 24,382,916 | 46,982 | |||||||||||
|
Intangible assets (*)
|
– | 26,386,509 | 26,386,509 | 50,842 | ||||||||||||
|
Assets held for sale
|
11,909,717 | – | 11,909,717 | 22,948 | ||||||||||||
|
Other assets
|
23,412,740 | 6,147,591 | 29,560,331 | 56,958 | ||||||||||||
|
Total Assets Acquired
|
1,622,116,604 | 1,383,420 | 1,623,500,024 | 3,128,208 | ||||||||||||
|
Liabilities
|
||||||||||||||||
|
Deposits
|
1,204,250,781 | (362,815 | ) | 1,203,887,966 | 2,319,687 | |||||||||||
|
Obligations
|
209,657,059 | (405,519 | ) | 209,251,540 | 403,192 | |||||||||||
|
Other Liabilities (*)
|
32,481,657 | 5,422,961 | 37,904,618 | 73,036 | ||||||||||||
|
Total Liabilities Assumed
|
1,446,389,497 | 4,654,627 | 1,451,044,124 | 2,795,915 | ||||||||||||
|
Identifiable assets acquired and liabilities assumed in Reformador Group measured in accordance with ASC 805- 20-30
|
U.S.$ | 175,727,107 | U.S.$ | (3,271,207 | ) | 172,455,900 | 332,293 | |||||||||
|
Goodwill
|
248,893,680 | 479,576 | ||||||||||||||
|
Fair value of assets acquired and liabilities assumed
|
U.S.$ | 421,349,580 | Ps. | 811,869 | ||||||||||||
|
(*)
|
During the year 2014, the measurement period for Grupo Aval’s business combination was completed. During this period, new information was obtained about the facts and circumstances that were not available as of the acquisition date that, if known, would have resulted in the recognition of certain assets and liabilities as of that date. Therefore, Grupo Aval has recognized these assets and liabilities as part of its acquisition accounting during 2014, which were not considered material.
|
GRUPO AVAL ACCIONES Y VALORES S.A. AND ITS SUBSIDIARIES
NOTES TO THE CONSOLIDATED FINANCIAL STATEMENTS
FOR THE YEARS ENDED DECEMBER 31, 2014, 2013 AND 2012
(
Stated in millions of Colombian pesos and U.S. dollars)
Bilbao Vizcaya Panama Bank acquisition
On December 19, 2013 Grupo Aval acquired 98.92% of the common shares issued by Banco Bilbao Vizcaya Argentaria (BBVA) de Panamá S.A. (hereinafter “Bilbao Vizcaya Panama”). The price paid for the acquisition was U.S.$505,139 (thousands) equivalent to Ps. 973,318 fully paid in cash. The purpose of this acquisition is to benefit from the future potential on the banking operations in Panama. For consolidation purposes, the results of BBVA have been included in Grupo Aval’s financial statements from acquisition date. Goodwill resulting from the acquisition was recognized in the amount of Ps. 312,770 (thousands) equivalent to Ps. 602,654 under U.S. GAAP. This goodwill primarily consists of the potential future benefits of the BBVA business and positive expectations of future cashflows.
During the year 2014 a Grupo Aval subsidiary acquired an additional 0,94% of the Banco BAC Panamá formerly BBVA by U.S.$4,790, (thousands) equivalent to Ps. 9,012. The difference between the price paid and the book value of this non controlling interest was recorded in additional paid in capital by Ps. 5,658.
The following chart summarizes the amount paid for the acquisition of Bilbao Vizcaya Panama and the value of assets acquired and liabilities assumed on December 19, 2013, the date of acquisition:
As result of this business combinations Grupo Aval acquired credit an impaired loan portfolio with carrying account of Ps. 49,187, U.S.$26,147 (thousand) and fair value of Ps. 31,423, U.S.$16,704
|
Book value as of December 31, 2013
(U.S.$)
|
Adjustments to fair value
(U.S.$)
|
Fair value as of December 31, 2013
(U.S.$)
|
Equivalent to millions of Colombian pesos
|
|||||||||||||
|
Purchase price (*)
|
U.S.$ | 505,139,760 | Ps. | 973,318 | ||||||||||||
|
Assets acquired and liabilities assumed
|
||||||||||||||||
|
Assets
|
||||||||||||||||
|
Cash and cash equivalents
|
U.S.$ | 387,778,961 | U.S.$ | – | U.S.$ | 387,778,961 | Ps. | 747,184 | ||||||||
|
Term deposits
|
1,428,878 | – | 1,428,878 | 2,753 | ||||||||||||
|
Investments in Securities
|
29,495,402 | – | 29,495,402 | 56,833 | ||||||||||||
|
Loan Portfolio (*)
|
1,458,199,326 | (57,476,784 | ) | 1,400,722,542 | 2,698,954 | |||||||||||
|
Properties and Equipment
|
8,969,231 | 2,859,485 | 11,828,716 | 22,792 | ||||||||||||
|
Intangible Assets
|
– | 26,859,371 | 26,859,371 | 51,753 | ||||||||||||
|
Assets held for sale
|
1,315,180 | – | 1,315,180 | 2,534 | ||||||||||||
|
Other Assets (*)
|
25,648,510 | 16,108,556 | 41,757,066 | 80,459 | ||||||||||||
|
Total Assets Acquired
|
1,912,835,488 | (11,649,372 | ) | 1,901,186,116 | 3,663,262 | |||||||||||
|
Liabilities
|
||||||||||||||||
|
Deposits
|
1,533,408,497 | 6,719,105 | 1,540,127,602 | 2,967,564 | ||||||||||||
|
Obligations
|
73,221,429 | (107,518 | ) | 73,113,911 | 140,878 | |||||||||||
|
Other Liabilities
|
82,569,039 | 7,516,178 | 90,085,217 | 173,579 | ||||||||||||
|
Total Liabilities Assumed
|
1,689,198,965 | 14,127,765 | 1,703,326,730 | 3,282,021 | ||||||||||||
|
Non-controlling interest
|
2,043,148 | 3,446,128 | 5,489,276 | 10,577 | ||||||||||||
|
Identifiable assets acquired and liabilities assumed in Reformador Group measured in accordance with ASC 805- 20-30
|
U.S.$ | 221,593,375 | U.S.$ | (29,223,265 | ) | 192,370,110 | 370,664 | |||||||||
|
Goodwill
|
312,769,650 | 602,654 | ||||||||||||||
|
Fair value of assets acquired and liabilities assumed
|
U.S.$ | 505,139,760 | Ps. | 973,318 | ||||||||||||
|
(*)
|
During the year 2014, the measurement period for Grupo Aval’s business combination was completed. During this period, new information was obtained about the facts and circumstances that were not available as of the acquisition date that, if known, would have resulted in the recognition of certain assets and liabilities as of that date. Therefore, Grupo Aval has recognized these assets and liabilities as part of its acquisition accounting during 2014, which were not considered material.
|
GRUPO AVAL ACCIONES Y VALORES S.A. AND ITS SUBSIDIARIES
NOTES TO THE CONSOLIDATED FINANCIAL STATEMENTS
FOR THE YEARS ENDED DECEMBER 31, 2014, 2013 AND 2012
(
Stated in millions of Colombian pesos and U.S. dollars)
Promigas acquisition
As mentioned on
“k) Investments in affiliated companies”,
on November 27, 2012 an additional 10.32% stake in Promigas S.A. was acquired by Corficolombiana through two tender offer processes which led it to a direct and indirect stake in Promigas of 50.23%. As a result, according to U.S. GAAP, Corficolombiana acquired control of Promigas and began accounting for this business combination using the acquisition method.
Under U.S. GAAP, ASC paragraph 805-10-25-10 provides that in a business combination achieved in stages, the acquirer shall remeasure its previously held equity interest in the acquiree at its acquisition-date fair value and recognize the resulting gain or loss, if any, in earnings. As a result, the gain on the valuation of the 39.91% pre-existing participation in Promigas before income tax was Ps. 269,802 and was recognized in net income.
Additionally, under U.S. GAAP the consideration being transferred is measured as the identifiable assets acquired, the liabilities assumed, and any noncontrolling interest in the acquiree. The resulting goodwill is recognized, and the acquirer consolidates the acquiree from the date of acquisition. On November 27, 2012, the acquisition of the controlling interest in Promigas under U.S. GAAP generated goodwill of Ps. 2,504,680 and had an impact on non-controlling interest of Ps. 1,925,314 at the acquisition date.
The following table discloses the main adjustments to U.S. GAAP at the date of the transaction related to the acquisition of Promigas:
|
39.91% investment in Promigas under Colombian Banking GAAP before business combinations (1)
|
Ps. | 1,696,639 | ||
|
Accumulated U.S. GAAP adjustments under equity method before business combination (1)
|
(185,181 | ) | ||
|
Remeasurement at fair value of previously held equity interest in Promigas at acquisition-date recognized in income
|
269,802 | |||
|
Acquisition cost taken to income
|
(1,693 | ) | ||
|
Acquisition-date fair value of the acquirer's previously held equity interest in Promigas
|
1,779,567 | |||
|
Consideration transferred for the additional 10.32% acquired (1)
|
348,930 | |||
|
Fair value of 49.77% noncontrolling interest in Promigas
|
1,925,314 | |||
| 4,053,812 | ||||
|
Fair value identifiable assets acquired and liabilities assumed in Promigas
|
( 1,549,132 | ) | ||
|
Goodwill
|
Ps. | 2,504,680 |
|
(1)
|
As of December 31, 2012 total adjustment of Ps. 1,860,388 were reclassified from affiliated company (see note (k) above).
|
The following table discloses the total assets acquired and liabilities assumed from Promigas under U.S. GAAP before and after the acquisition on November 27, 2012:
|
U.S. GAAP book value
|
Adjustment to fair value
|
Fair value
|
||||||||||
|
Cash and due from banks
|
Ps. | 207,773 | Ps. | – | Ps. | 207,773 | ||||||
|
Investments
|
325,405 | 107,737 | 433,142 | |||||||||
|
Accounts receivable
|
894,429 | – | 894,429 | |||||||||
|
Property, plant and equipment, net
|
1,931,356 | 631,745 | 2,563,101 | |||||||||
|
Intangibles (*)
|
– | 287,711 | 287,711 | |||||||||
|
Other assets
|
646,835 | – | 646,835 | |||||||||
|
Financial obligations
|
(1,612,102 | ) | – | (1,612,102 | ) | |||||||
|
Bonds
|
(550,015 | ) | – | (550,015 | ) | |||||||
|
Other liabilities
|
(995,428 | ) | – | (995,428 | ) | |||||||
|
Deferred tax
|
2,920 | ( 329,233 | ) | (326,313 | ) | |||||||
|
Identifiable assets acquired and liabilities assumed in Promigas measured in accordance with ASC 805 -20-30
|
Ps. | 851,173 | Ps. | 697,959 | Ps. | 1,549,132 | ||||||
|
(*)
|
Include intangibles assets by rights in connection Ps. 2,984, customer relationship Ps. 283,584 and other Ps. 1,143.
|
F-122
GRUPO AVAL ACCIONES Y VALORES S.A. AND ITS SUBSIDIARIES
NOTES TO THE CONSOLIDATED FINANCIAL STATEMENTS
FOR THE YEARS ENDED DECEMBER 31, 2014, 2013 AND 2012
(
Stated in millions of Colombian pesos and U.S. dollars)
The methods used for the determination of the fair value
The methods used for the determination of the fair value of assets acquired and liabilities assumed for all the acquisitions described are as follows:
Loan portfolio
The fair value of loan portfolios was determined on the basis of discounted cash flows through the utilization of net returns. The portfolio was segmented into sets of loans with similar characteristics, including, but not limited to, the type of loan, its currency of disbursement, applicable interest rate, collateral, among other factors. The estimated cash flows for each set of loans were prepared on the basis of the outstanding principal amount pending payment, the weighted average interest rate applicable, prepayments and the remaining weighted time until maturity. Forecasted cash flows were discounted at a market rate deemed appropriate for each specific group of loans under analysis. Market rates were established by observing market prices and using internal pricing policies for the extension of these loans.
Methods used to estimate the fair values are extremely sensitive to the assumptions made. Although it was the intention of management to use those assumptions that best reflect the loan portfolios acquired as well as current market conditions, a higher degree of subjectivity is nevertheless inherent to those values when compared to values determined in active markets. Such fair value is not representative of an exit price.
Securities
When available securities are measured using quoted market prices. If quoted market prices are not available, fair value is determined using the market price of a similar instrument or of observable inputs used in valuations. In the events in which the most significant inputs of valuation are not directly observable in the market, the incumbent securities are measured through use of the best information available for determination of the fair value. Such information may be internally developed and does take into account the premiums that would be required by a market participant.
Relationship with depositors
The relationship with depositors (hereinafter “CDI”) is a measure of the value of demand deposits, savings deposits and monetary market deposits that are acquired through business combinations. The fair value of CDI was determined on the basis of the present value of cost savings attributable to financing received from depositors, as compared with an alternative financing source.
Relationship with customers
Relationships with credit card holders, commercial customers and affiliated merchants, measure the value of those relationships for the entities acquired based on the history of recurring cash flows derived from current customers and the likelihood that those customers will continue generating cash flows in the future. Fair value of these intangible assets was established through use of the methodology of multi-period excess income, which basic assumption is that the fair value of a customer relationship may be determined on the basis of the present value of net future cash flows to be collected through the life of the underlying asset.
F-123
GRUPO AVAL ACCIONES Y VALORES S.A. AND ITS SUBSIDIARIES
NOTES TO THE CONSOLIDATED FINANCIAL STATEMENTS
FOR THE YEARS ENDED DECEMBER 31, 2014, 2013 AND 2012
(
Stated in millions of Colombian pesos and U.S. dollars)
Trademarks and brands
A brand or trademark of high recognition in the market has considerable value for an entity. The determination of the fair value of trademarks and brands takes into consideration, among other factors, the royalty payment rate comparable for the industry and the total forecasted income flows to be generated by the banking business.
Deposit liabilities
Fair value used for demand and savings deposits is, by definition, equal to the amount payable on demand as of the date of acquisition. The fair value for fixed term deposits is estimated through utilization of the method of discounted cash flows using interest rates offered by similar banks operating in each country and each currency, applicable to the different groups of outstanding maturities. In those cases in which there are no available market interest rates for a particular maturity, rate extrapolation was conducted on the basis of available interest rates.
Deferred taxes
Deferred income taxes are those arising from differences between amounts recorded in the consolidated financial statements and the amounts recognized for tax purposes basis of assets acquired and liabilities assumed as a result of the acquisition.
Debt instruments
Fair value of debt instruments was estimated through utilization of discounted cash flows. Contractual interest rates were compared to market interest rates on the date of valuation. Those debt instruments whose contractual interest rate were either above or below market rates were adjusted to reflect either a premium or a discount.
Other assets and liabilities
Due to the relative short term nature of both other assets and liabilities, it is considered that their book value fairly approximates their fair value.
The following is a detailed reconciliation of the adjustments between Colombian Banking GAAP and U.S. GAAP related to all business combinations in Aval Group:
|
December 31, 2014
|
December 31, 2013
|
|||||||
|
U.S. GAAP adjustment to goodwill (1)
|
Ps. | (680,251 | ) | Ps. | (763,488 | ) | ||
|
Purchase price allocated to intangible assets identified (2)
|
827,402 | 841,291 | ||||||
|
Fair value of other assets acquired and liabilities assumed (3)
|
(548,567 | ) | (451,787 | ) | ||||
|
Promigas business combinations (4)
|
358,007 | 366,863 | ||||||
|
Additional paid-in capital in equity transactions with non controlling interest
|
(78,349 | ) | (51,908 | ) | ||||
|
Deferred; Income tax
|
359 | 359 | ||||||
|
|
Ps. | (121,399 | ) | Ps. | ( 58,670 | ) | ||
|
(1)
|
Goodwill
|
This adjustment represents the difference in the amount of goodwill under Colombian Banking GAAP, which represents purchase price less book value of net assets acquired and related goodwill amortization, with U.S. GAAP which recognizes goodwill as the purchase price less fair value of net assets acquired including intangible assets not recognized on books prior to the acquisition.
F-124
GRUPO AVAL ACCIONES Y VALORES S.A. AND ITS SUBSIDIARIES
NOTES TO THE CONSOLIDATED FINANCIAL STATEMENTS
FOR THE YEARS ENDED DECEMBER 31, 2014, 2013 AND 2012
(
Stated in millions of Colombian pesos and U.S. dollars)
The breakdown of goodwill under U.S. GAAP during the years ended December 31, 2014, 2013 and 2012 is as follows:
|
2014
|
2013
|
2012
|
||||||||||
|
Balance at beginning of year
|
Ps. | 6,595,226 | Ps. | 5,145,527 | Ps. | 2,876,904 | ||||||
|
Additions related to business acquisitions:
|
||||||||||||
|
Bilbao Vizcaya Panama Bank
|
40,849 | 562,689 | – | |||||||||
|
Reformador Group
|
18,911 | 460,572 | – | |||||||||
|
Administradora Horizonte S.A.
|
– | 397,662 | – | |||||||||
|
Promigas S.A. E.S.P.
|
– | – | 2,504,680 | |||||||||
|
Proyectos de Infraestructura
|
– | – | – | |||||||||
|
Reclassification to intangible assets and deferred income tax (a)
|
– | – | (69,860 | ) | ||||||||
|
Effects of foreign exchange rates
|
682,150 | 142,763 | (166,197 | ) | ||||||||
|
Adjustment to goodwill due to Promigas subsidiary sale
|
– | (113,987 | ) | – | ||||||||
|
Balance at end of year
|
7,337,136 | 6,595,226 | 5,145,527 | |||||||||
|
Goodwill under Colombian Banking GAAP
|
5,626,694 | 4,968,021 | 2,842,533 | |||||||||
|
Subtotal
|
Ps. | 1,710,442 | Ps. | 1,627,205 | Ps. | 2,302,994 | ||||||
|
Less goodwill in Promigas consolidation
|
2,390,693 | 2,390,693 | 2,504,680 | |||||||||
|
Adjustment recorded under U.S. GAAP
|
Ps. | (680,251 | ) | Ps. | (763,488 | ) | Ps. | (201,686 | ) | |||
|
|
(a)
|
This amount represents the business combination of “Intrex Investment Inc” and “Consesionaria Panamericana” which acquired concession road in Colombia, which operates in the non-financial sector.
|
Goodwill under U.S. GAAP, allocated by segments, as of December 31, 2014 and 2013 were:
|
December 31, 2014
|
December 31, 2013
|
|||||||
|
Banco de Bogotá
|
Ps. | 7,102,981 | Ps. | 6,361,071 | ||||
|
Banco de Occidente
|
116,845 | 116,845 | ||||||
|
Banco Popular
|
117,310 | 117,310 | ||||||
|
Total Goodwill
|
Ps. | 7,337,136 | Ps. | 6,595,226 | ||||
Under U.S. GAAP, Grupo Aval tests goodwill for impairment at least annually using a two-step process that begins with an estimation of the fair value of a reporting unit. The first step is a screen for potential impairment and the second step measures the amount of impairment. Grupo Aval conducted qualitative impairment tests of goodwill which indicated that there is no goodwill impairment for the years ended December 31, 2014 and 2013.
|
(2)
|
Intangible Assets:
|
This adjustment represents the difference in the amount of intangible assets under Colombian Banking GAAP and U.S. GAAP. Colombian Banking GAAP does not require the recognition of intangible assets, while U.S. GAAP requires identification and valuation of intangibles in a business combination.
F-125
GRUPO AVAL ACCIONES Y VALORES S.A. AND ITS SUBSIDIARIES
NOTES TO THE CONSOLIDATED FINANCIAL STATEMENTS
FOR THE YEARS ENDED DECEMBER 31, 2014, 2013 AND 2012
(
Stated in millions of Colombian pesos and U.S. dollars)
The changes of Grupo Aval’s intangible assets, net under U.S. GAAP for the years ended December 31, 2014, 2013 and 2012 were as follows:
|
2014
|
2013
|
2012
|
||||||||||
|
Balance at beginning of year
|
Ps. | 1,069,586 | Ps. | 778,966 | Ps. | 463,539 | ||||||
|
Adjustment to intangibles assets due to the sale of a subsidiary of Promigas.
|
– | (1,261 | ) | – | ||||||||
|
Reclassifications (a)
|
– | – | 118,024 | |||||||||
|
Additions related to business combinations
|
– | 381,289 | 287,711 | |||||||||
|
Customer relationships purchased (b)
|
15,377 | – | – | |||||||||
|
Effect of foreign exchange rate
|
99,972 | 27,267 | (27,833 | ) | ||||||||
|
Amortization
|
(177,142 | ) | (116,675 | ) | (62,475 | ) | ||||||
|
Balance at end of year
|
1,007,793 | 1,069,586 | 778,966 | |||||||||
|
Less intangible assets recorded in Promigas consolidation
|
180,391 | 228,295 | 283,217 | |||||||||
|
Adjustment recorded under U.S. GAAP
|
Ps. | 827,402 | Ps. | 841,291 | Ps. | 495,749 | ||||||
|
|
(a)
|
This amount represents the business combination of “Intrex Investment INC” and “Consesionaria Panamericana” which acquired concession road in Colombia, which operates in the non-financial sector.
|
|
|
(b)
|
This amount is related to the credit card customer relationships purchased by the subsidiary Bac Credomatic.
|
Below is a detailed description of each intangible asset recognized.
Brands
Grupo Aval determines brand value through the royalty savings method (relief from royalties). This method measures the savings a company generates as a result of not having to pay for a license to use such brand. The value of the brands is equal to the sum of the net present value of the after-tax savings a company generates during the period in question as a result of not having to pay for the use of such a brand plus the net present value of the after-tax savings a company would generate in perpetuity after the last year of the period in question.
Core Deposit
Core deposit intangibles, defined as the premium paid to acquire the core deposits of an institution, was determined by using the alternative funding method, which estimates the net present value of the cost difference or “spread” between the cost of using the core deposit intangibles and the cost of an alternative source of funding under current market conditions.
Concession roads
Grupo Aval through its subsidiary Corficolombiana has entered into the road concession business which involves construction, operation and maintenance of public toll road granted by the Colombian Government. Road concession arose from contractual rights related to the acquisition of Consesionaria Panamericana and Intrex Investment Inc.
Customer relationships
Customer relationships are defined as the relationship that Grupo Aval has established with its customers through contracts. Customer relationships arise from contractual rights, thus classified as intangible assets that meet the contractual-legal criterion.
GRUPO AVAL ACCIONES Y VALORES S.A. AND ITS SUBSIDIARIES
NOTES TO THE CONSOLIDATED FINANCIAL STATEMENTS
FOR THE YEARS ENDED DECEMBER 31, 2014, 2013 AND 2012
(
Stated in millions of Colombian pesos and U.S. dollars)
Rights to asset management contracts
Contractual rights with asset management clients are assets resulting from businesses that were initially recognized at fair value, as determined based on the future cash flows expected from those relationships over a period of time based on an estimation of the time period those customers remain as customers for Grupo Aval. These assets are assessed annually in order to determine whether they have been impaired, either from termination or deterioration of the relationship.
Intangibles are calculated based on the expected gains to be received from these relationships for a specific period of time.
Intangible assets under U.S. GAAP were as follows:
|
December 31, 2014
|
||||||||||||
|
Gross carrying amount
|
Accumulated amortization
|
Net
|
||||||||||
|
Non-amortizable intangible assets
|
Ps. | 139,779 | Ps. | - | Ps. | 139,779 | ||||||
|
Amortizable intangible assets
|
1,338,976 | (470,962 | ) | 868,014 | ||||||||
| Ps. | 1,478,755 | Ps. | (470,962 | ) | Ps. | 1,007,793 | ||||||
|
December 31, 2013
|
||||||||||||
|
Gross carrying amount
|
Accumulated amortization
|
Net
|
||||||||||
|
Non-amortizable intangible assets
|
Ps. | 113,758 | Ps. | - | Ps. | 113,758 | ||||||
|
Amortizable intangible assets
|
1,236,267 | (280,440 | ) | 955,828 | ||||||||
| Ps. | 1,350,026 | Ps. | (280,440 | ) | Ps. | 1,069,586 | ||||||
The following table shows the intangible assets gross amount under U.S. GAAP, detailed with their respective useful lives:
|
2014
|
2013
|
Weighted average useful life (months)
|
||||||||||
|
Brands
|
Ps. | 140,748 | Ps. | 114,726 |
Indefinite
|
|||||||
|
Core deposits
|
208,148 | 187,939 | 173 | |||||||||
|
Road concessions (a)
|
121,008 | 121,008 | 253 | |||||||||
|
Customer relationships (b)
|
703,386 | 629,500 | 164 | |||||||||
|
Rights to asset management contracts
|
260,062 | 260,062 | 300 | |||||||||
|
Other
|
45,403 | 36,791 | 68 | |||||||||
| Ps. | 1,478,755 | Ps. | 1,350,026 | |||||||||
|
(a)
|
This amount represents the business combination of “Intrex Investment Inc” and “Consesionaria Panamericana” which acquired concession roads in Colombia, which operate in the non-financial sector.
|
|
(b)
|
This amount includes Ps. 282,301 and Ps. 283,584 from Promigas business combination for during 2014 and 2013 respectively.
|
GRUPO AVAL ACCIONES Y VALORES S.A. AND ITS SUBSIDIARIES
NOTES TO THE CONSOLIDATED FINANCIAL STATEMENTS
FOR THE YEARS ENDED DECEMBER 31, 2014, 2013 AND 2012
(
Stated in millions of Colombian pesos and U.S. dollars)
Grupo Aval expects that the estimated aggregate amortization expense for intangible assets for the next five fiscal years to be as shown in the following table.
|
Fiscal year ending December 31
|
Aggregate amortization expense
|
|||
|
2015
|
Ps. | 127,643 | ||
|
2016
|
113,696 | |||
|
2017
|
97,850 | |||
|
2018
|
73,242 | |||
|
2019
|
68,795 | |||
|
Total
|
Ps. | 481,226 | ||
|
(3)
|
Fair value of other assets acquired and liabilities assumed
|
The following is the consolidated movement of fair value of assets acquired and liabilities assumed in business combination
|
2013
|
Additions
(1)
|
Effect of foreign exchange rates
|
Amortization
|
Deferred tax reclassification
|
2014
|
|||||||||||||||||||
|
Investment securities
|
Ps. | 100,410 | Ps. | – | Ps. | – | Ps. | (4,062 | ) | Ps. | – | Ps. | 96,348 | |||||||||||
|
Loan portfolio
|
(44,894 | ) | (61,805 | ) | (24,231 | ) | (5,398 | ) | – | (136,328 | ) | |||||||||||||
|
Allowance
|
26,922 | – | 6,506 | (22,444 | ) | – | 10,984 | |||||||||||||||||
|
Fixed assets
|
768,432 | – | 27,235 | (27,982 | ) | – | 767,685 | |||||||||||||||||
|
Other assets
|
(18,506 | ) | 13,616 | 6,422 | 16,245 | (14,414 | ) | 3,363 | ||||||||||||||||
|
Reappraisal of assets
|
(476,490 | ) | – | (37,437 | ) | (7,685 | ) | – | (521,612 | ) | ||||||||||||||
|
Deposits
|
(15,991 | ) | – | (3,865 | ) | 11,740 | – | (8,116 | ) | |||||||||||||||
|
Other liabilities
|
(55,903 | ) | 6,713 | (23,189 | ) | 26,759 | (8,147 | ) | (53,767 | ) | ||||||||||||||
|
Non controlling interest
|
( 1,802,162 | ) | – | (1,608 | ) | 37,933 | – | (1,765,837 | ) | |||||||||||||||
| (1,518,182 | ) | (41,476 | ) | (50,167 | ) | 25,106 | (22,561 | ) | (1,607,280 | ) | ||||||||||||||
|
Less fair value of other assets in Promigas consolidation
|
( 1,066,395 | ) | – | – | – | – | (1,058,713 | ) | ||||||||||||||||
|
Adjustment recorded under U.S. GAAP
|
Ps. | (451,787 | ) | Ps. | (41,476 | ) | Ps. | (50,167 | ) | Ps. | 25,106 | Ps. | (22,561 | ) | Ps. | (548,567 | ) | |||||||
|
(1)
|
See a summary about the amount paid for the acquisition of the Reformador Grupo and Bilbao Vizcaya Panama Bank above.
|
GRUPO AVAL ACCIONES Y VALORES S.A. AND ITS SUBSIDIARIES
NOTES TO THE CONSOLIDATED FINANCIAL STATEMENTS
FOR THE YEARS ENDED DECEMBER 31, 2014, 2013 AND 2012
(
Stated in millions of Colombian pesos and U.S. dollars)
|
2012
|
Additions
|
Effect of foreign exchange rates
|
Amortization
|
Deferred tax reclassification
|
2013
|
|||||||||||||||||||
|
Investment securities
|
Ps. | 104,472 | Ps. | – | Ps. | – | Ps. | (4,062 | ) | Ps. | – | Ps. | 100,410 | |||||||||||
|
Loan portfolio
|
(74,851 | ) | 18,673 | (8,116 | ) | 19,400 | – | (44,894 | ) | |||||||||||||||
|
Allowance
|
32,459 | – | 2,854 | (8,391 | ) | – | 26,922 | |||||||||||||||||
|
Fixed assets
|
835,827 | 5,203 | 9,026 | (81,624 | ) | – | 768,432 | |||||||||||||||||
|
Other assets
|
16,459 | 2,327 | 2,763 | (12,734 | ) | (27,321 | ) | (18,506 | ) | |||||||||||||||
|
Reappraisal of assets
|
(444,574 | ) | (15,100 | ) | (11,798 | ) | (5,018 | ) | – | (476,490 | ) | |||||||||||||
|
Deposits
|
(5,454 | ) | (11,925 | ) | (511 | ) | 1,899 | – | (15,991 | ) | ||||||||||||||
|
Other liabilities
|
(76,255 | ) | (94,954 | ) | (6,818 | ) | 11,976 | 110,148 | (55,903 | ) | ||||||||||||||
|
Non controlling interest
|
( 1,912,471 | ) | 3,343 | – | 106,966 | – | ( 1,802,162 | ) | ||||||||||||||||
| (1,524,388 | ) | (92,433 | ) | (12,600 | ) | 28,411 | 82,827 | (1,518,182 | ) | |||||||||||||||
|
Less fair value of other assets in Promigas consolidation
|
– | – | – | – | – | ( 1,066,395 | ) | |||||||||||||||||
|
Adjustment recorded under U.S. GAAP
|
Ps. | ( 1,524,388 | ) | Ps. | (92,433 | ) | Ps. | ( 12,600 | ) | Ps. | 28,411 | Ps. | 82,827 | Ps. | (451,787 | ) | ||||||||
Under Colombian Banking GAAP assets acquired and liabilities assumed are recorded at their carrying amounts. Under U.S. GAAP, fair value adjustments are allocated to each acquired asset and assumed liability and the differences between the fair value and book value of the depreciable assets are amortized during the estimated period of useful life.
|
|
(4)
|
The following table discloses the adjustment between Colombian banking GAAP and U.S. GAAP for Promigas business combination in Aval Group shareholders’ equity as of December 31, 2014 and 2013:
|
|
2014
|
2013
|
|||||||
|
Remeasurement at fair value of previously held equity interest in Promigas at acquisition date recognized in income
|
Ps. | 269,802 | Ps. | 269,802 | ||||
|
Accumulated U.S. GAAP adjustments under equity method before business combination
|
(185,181 | ) | (185,181 | ) | ||||
|
Acquisition cost taken to income
|
(1,693 | ) | (1,693 | ) | ||||
|
Deferred income tax reclassification to deferred income tax caption for disclosure purpose and provision for loans reclassification
|
275,079 | 283,935 | ||||||
|
Total shareholders’ equity adjustment under U.S. GAAP for Promigas
|
Ps. | 358,007 | Ps. | 366,863 | ||||
GRUPO AVAL ACCIONES Y VALORES S.A. AND ITS SUBSIDIARIES
NOTES TO THE CONSOLIDATED FINANCIAL STATEMENTS
FOR THE YEARS ENDED DECEMBER 31, 2014, 2013 AND 2012
(
Stated in millions of Colombian pesos and U.S. dollars)
The following is the movement of business combinations adjustment under U.S. GAAP.
|
2014
|
2013
|
2012
|
||||||||||
|
Balance at the beginning of the year U.S. GAAP adjustments
|
Ps. | (58,670 | ) | Ps. | 302,716 | Ps. | (213,913 | ) | ||||
|
Adjustment recorded during the year to statement of income (1)
|
169 | (80,341 | ) | 323,825 | ||||||||
|
Adjustment recorded to OCI under U.S. GAAP (Unrealized gains (losses) on available for sale securities)
|
32,757 | (44,452 | ) | 12,083 | ||||||||
|
Additional paid in capital in equity transactions with non controlling interest (2)
|
(118,217 | ) | (357,373 | ) | – | |||||||
|
Reclassifications from affiliated investment caption of $ 185,181 and deferred taxes caption of $ (365,902).
|
– | – | 180,721 | |||||||||
|
Transfer from other U.S. GAAP adjustment captions (3)
|
22,562 | 120,780 | – | |||||||||
|
Balance at the end of year
|
Ps. | ( 121,399 | ) | Ps. | ( 58,670 | ) | Ps. | 302,716 | ||||
|
(1)
|
In 2012, this
amount
mainly included the remeasurement at fair value of previously held equity interest in Promigas at the acquisition-date recognized in income
|
|
(2)
|
Grupo Aval frequently performs equity transactions with non controlling interest in order to buy or sell stock in its subsidiaries; this does not imply a loss of control in the subsidiaries. Under Banking GAAP, the highest value in relation to book value of the stock purchased is recorded as goodwill in the assets and the profit from the sale of stocks is recorded in the Condensed Consolidated Statement of Income. Under U.S. GAAP these transactions are considered equity transactions and as such the additional value paid to non controlling interest over their book value of the stock purchased and the profit in the sale of the stocks in the subsidiaries without loss of the control are recorded in equity of the controlling interest. In additions, in other reconciliation captions recognize additional paid-in capital of Ps. 73,988 in equity transaction with non controlling interest totaling Ps. 192,922 in this kind of transactions in 2014 and Ps. 18,106 in 2013, totaling Ps. 385,949.
|
|
(3)
|
Mainly related to transfer of Ps. 22,383, to deferred income tax caption in 2014 and Ps. 112,995 in 2013 (see note a) 1 above.
|
GRUPO AVAL ACCIONES Y VALORES S.A. AND ITS SUBSIDIARIES
NOTES TO THE CONSOLIDATED FINANCIAL STATEMENTS
FOR THE YEARS ENDED DECEMBER 31, 2014, 2013 AND 2012
(
Stated in millions of Colombian pesos and U.S. dollars)
|
n)
|
Consolidation of Promigas.
|
Under Colombian regulations and Banking GAAP, Grupo Aval does not control nor consolidate Promigas as: (i) under Colombian Banking GAAP control results from one beneficial owner having an equity stake higher than 50%, and (ii) 5.58% of the 50.23% stake mentioned above is held by a private investment fund whose legal direct beneficial owner under Colombian laws is not Grupo Aval; however under U.S. GAAP consolidation is required.
The following tables disclose the Promigas and Private Capital Fund consolidation process under U.S. GAAP as of December 31, 2014 and for the year then ended previous to consolidation with Corficolombiana. All transactions were eliminate in consolidation process:
Consolidated B
alance Sheet as of December 31, 2014
|
Book value under U.S. GAAP as of
December 31, 2014
|
Adjustments to fair value at
acquisition date
|
Fair value
amortizations
|
Eliminations for consolidation
purposes
|
Promigas balance and adjustment included in consolidated Grupo Aval
balance
|
||||||||||||||||
|
Assets
|
||||||||||||||||||||
|
Cash and cash equivalents
|
Ps. | 220,068 | Ps. | – | Ps. | – | Ps. | (128,357 | ) | Ps. | 91,711 | |||||||||
|
Investment securities
|
307,399 | 107,737 | (10,646 | ) | – | 404,490 | ||||||||||||||
|
Aval Group investment in Promigas
|
182,804 | (1,360,380 | ) | – | (833,734 | ) | (2,011,310 | ) | ||||||||||||
|
Loans and accounts receivable, net
|
946,112 | – | – | (118,460 | ) | 827,652 | ||||||||||||||
|
Property, plant and equipment, net
|
2,502,535 | 631,745 | (85,991 | ) | – | 3,048,289 | ||||||||||||||
|
Goodwill
|
10,786 | 2,493,894 | (113,987 | ) | – | 2,390,693 | ||||||||||||||
|
Other assets, net
|
902,648 | 287,711 | (107,320 | ) | (69 | ) | 1,082,970 | |||||||||||||
|
Total assets
|
Ps. | 5,072,352 | Ps. | 2,160,707 | Ps. | (317,944 | ) | Ps. | (1,080,620 | ) | Ps. | 5,834,495 | ||||||||
|
Liabilities and shareholders’ equity
|
||||||||||||||||||||
|
Liabilities
|
||||||||||||||||||||
| Short and long-term debt | Ps. |
2,606,346
|
Ps. | – | Ps. | – | Ps. | (120,935 | ) | Ps. | 2,485,411 | |||||||||
|
Other liabilities
|
1,361,773 | 329,233 | (54,155 | ) | (125,951 | ) | 1,510,900 | |||||||||||||
|
Total liabilities
|
3,968,119 | 329,233 | (54,155 | ) | (246,886 | ) | 3,996,311 | |||||||||||||
|
Shareholders’ equity
|
||||||||||||||||||||
|
Controlling interest
|
954,373 | – | (132,422 | ) | (1,008,869 | ) | (186,918 | ) | ||||||||||||
|
Non-controlling interest
|
149,860 | 1,831,474 | (131,367 | ) | 175,135 | 2,025,102 | ||||||||||||||
|
Total shareholders’ equity
|
1,104,233 | 1,831,474 | (263,789 | ) | (833,734 | ) | 1,838,184 | |||||||||||||
|
Total liabilities and shareholders’ equity
|
Ps. | 5,072,352 | Ps. | 2,160,707 | Ps. | (317,944 | ) | Ps. | (1,080,620 | ) | Ps. | 5,834,495 | ||||||||
GRUPO AVAL ACCIONES Y VALORES S.A. AND ITS SUBSIDIARIES
NOTES TO THE CONSOLIDATED FINANCIAL STATEMENTS
FOR THE YEARS ENDED DECEMBER 31, 2014, 2013 AND 2012
(
Stated in millions of Colombian pesos and U.S. dollars)
Consolidated Statement of income
|
Book value under U.S. GAAP as of December 31, 2014
|
Fair value amortizations
|
Eliminations for consolidation purposes
|
Promigas balance and adjustment included in consolidated Grupo Aval balance
|
|||||||||||||
|
Total interest income
|
Ps. | 7,068 | Ps. | – | Ps. | 8,520 | Ps. | 15,588 | ||||||||
|
Total interest expense
|
(150,516 | ) | – | (8,904 | ) | (159,420 | ) | |||||||||
|
Income from investment portfolio
|
24,279 | – | (269,265 | ) | (244,986 | ) | ||||||||||
|
Other income
|
639,824 | – | 2,365 | 642,189 | ||||||||||||
|
Other expense
|
(1,315 | ) | (69,911 | ) | (995 | ) | (72,221 | ) | ||||||||
|
Income tax expense (1)
|
(137,580 | ) | 8,857 | – | (128,723 | ) | ||||||||||
|
Net income
|
381,760 | (61,054 | ) | (268,279 | ) | 52,427 | ||||||||||
|
Net income attributable to non-controlling interest
|
(22,351 | ) | 30,351 | (167,795 | ) | (159,795 | ) | |||||||||
|
Net income attributable to Grupo Aval’s shareholders
|
Ps. | 359,409 | Ps. | (30,703 | ) | Ps. | (436,074 | ) | Ps. | (107,368 | ) | |||||
|
(1)
|
Included current income tax expense of Promigas.
|
The following tables disclose the Promigas and Private Capital Fund consolidation process under U.S. GAAP as of December 31, 2012 and for the year then ended previous to consolidation with Corficolombiana, all transactions were eliminate in consolidation process:
Consolidated B
alance Sheet as of December 31, 2013
|
Book value under U.S. GAAP as of December 31, 2013
|
Adjustments to fair value at acquisition date
|
Fair value amortizations
|
Eliminations for consolidation purposes
|
Promigas balance and adjustment included in consolidated Grupo Aval balance
|
||||||||||||||||
|
Assets
|
||||||||||||||||||||
|
Cash and cash equivalents
|
Ps. | 200,130 | Ps. | – | Ps. | – | Ps. | (52,373 | ) | Ps. | 147,757 | |||||||||
|
Investment securities
|
19,723 | 107,737 | (5,536 | ) | – | 121,924 | ||||||||||||||
|
Aval Group investment in Promigas
|
172,709 | (1,360,380 | ) | – | (692,010 | ) | (1,879,681 | ) | ||||||||||||
|
Loans and accounts receivable, net
|
906,640 | – | – | (306,946 | ) | 599,694 | ||||||||||||||
|
Property, plant and equipment, net
|
2,172,099 | 631,745 | (69,094 | ) | – | 2,734,750 | ||||||||||||||
|
Goodwill
|
10,786 | 2,493,894 | (113,987 | ) | – | 2,390,693 | ||||||||||||||
|
Other assets, net
|
1,033,442 | 287,711 | (59,415 | ) | – | 1,261,738 | ||||||||||||||
|
Total assets
|
Ps. | 4,515,529 | Ps. | 2,160,707 | Ps. | ( 248,032 | ) | Ps. | ( 1,051,329 | ) | Ps. | 5,376,875 | ||||||||
|
Liabilities and shareholders’ equity
|
||||||||||||||||||||
|
Liabilities
|
||||||||||||||||||||
|
Short and long-term debt
|
Ps. | 932,563 | Ps. | – | Ps. | – | Ps. | (359,170 | ) | Ps. | 573,393 | |||||||||
|
Other liabilities
|
2,756,809 | 329,233 | (45,298 | ) | – | 3,040,744 | ||||||||||||||
|
Total liabilities
|
3,689,372 | 329,233 | (45,298 | ) | (359,170 | ) | 3,614,137 | |||||||||||||
|
Shareholders’ equity
|
||||||||||||||||||||
|
Controlling interest
|
714,116 | – | (101,718 | ) | (760,930 | ) | 148,532 | |||||||||||||
|
Non-controlling interest
|
112,041 | 1,831,474 | ( 101,016 | ) | 68,771 | 1,911,270 | ||||||||||||||
|
Total shareholders’ equity
|
826,157 | 1,831,474 | ( 202,734 | ) | (692,159 | ) | 1,762,738 | |||||||||||||
|
Total liabilities and shareholders’ equity
|
Ps. | 4,515,529 | Ps. | 2,160,707 | Ps. | ( 248,032 | ) | Ps. | (1,051,329 | ) | Ps. | 5,376,875 | ||||||||
F-132
GRUPO AVAL ACCIONES Y VALORES S.A. AND ITS SUBSIDIARIES
NOTES TO THE CONSOLIDATED FINANCIAL STATEMENTS
FOR THE YEARS ENDED DECEMBER 31, 2014, 2013 AND 2012
(
Stated in millions of Colombian pesos and U.S. dollars)
Statement of income
|
Book value under U.S. GAAP as of December 31, 2013
|
Fair value amortizations
|
Eliminations for consolidation purposes
|
Promigas balance and adjustment included in consolidated Grupo Aval balance
|
|||||||||||||
|
Total interest income
|
Ps. | 15,670 | Ps. | – | Ps. | (10,688 | ) | Ps. | 4,982 | |||||||
|
Total interest expense
|
(127,718 | ) | – | 9,874 | (117,844 | ) | ||||||||||
|
Income from investment portfolio
|
34,206 | – | (434,041 | ) | (399,835 | ) | ||||||||||
|
Other income
|
750,755 | (*)(148,474 | ) | (629 | ) | 601,652 | ||||||||||
|
Other expense
|
(3,725 | ) | (92,645 | ) | 514 | (95,856 | ) | |||||||||
|
Income tax expense (1)
|
(138,810 | ) | 43,030 | – | (95,780 | ) | ||||||||||
|
Net income
|
530,378 | (198,089 | ) | (434,970 | ) | (102,681 | ) | |||||||||
|
Net income attributable to non-controlling interest
|
(25,191 | ) | 98,535 | (230,359 | ) | (157,015 | ) | |||||||||
|
Net income attributable to Grupo Aval’s shareholders
|
Ps. | 505,187 | Ps. | ( 99,554 | ) | Ps. | ( 665,329 | ) | Ps. | (259,696 | ) | |||||
|
(*)
|
This amount is related to the sale of the Promigas subsidiary named Promitel.
|
The following is the movement of Promigas adjustments under U.S. GAAP.
|
2014
|
2013
|
2012
|
||||||||||
|
Balance at the beginning of the year of U.S. GAAP adjustments
|
Ps. | (231,460 | ) | Ps. | (2,166 | ) | Ps. | – | ||||
|
Adjustment recorded during the year to statement of income (1)
|
(107,368 | ) | (259,696 | ) | 9,491 | |||||||
|
Adjustment recorded to OCI under U.S. GAAP Unrealized gains (losses) on available for sale securities
|
53,152 | 30,219 | (11,657 | ) | ||||||||
|
Additional Paid in Capital in equity transactions with non controlling interests
|
(722 | ) | 183 | – | ||||||||
|
Balance at the end of year
|
Ps. | (286,398 | ) | Ps. | (231,460 | ) | Ps. | (2,166 | ) | |||
|
(1)
|
In 2013, this amount included the reversal of the Promigas investment valuation in Corficolombiana and any income in the form of either stock or cash dividends received by Corficolombiana taken to income according to local regulations, which are eliminated in the consolidation process. In 2012 the net income consolidation process included only one month since the Promigas business combination occurred in November 2012 (See note (m) above).
|
|
(o)
|
Non-controlling interest
|
Under Colombian Banking GAAP, the non-controlling interest is presented as a separate line item within total liabilities and thus, does not comprise part of shareholders’ equity.
For U.S. GAAP purposes, ASC 810-10-65-65-1 requires the non-controlling interest in subsidiaries to be classified as a separate component of shareholders’ equity in the consolidated financial statements. Additionally, consolidated net income and comprehensive income are reported with separate disclosures of the amounts attributable to the parent company and the non-controlling interest.
F-133
GRUPO AVAL ACCIONES Y VALORES S.A. AND ITS SUBSIDIARIES
NOTES TO THE CONSOLIDATED FINANCIAL STATEMENTS
FOR THE YEARS ENDED DECEMBER 31, 2014, 2013 AND 2012
(
Stated in millions of Colombian pesos and U.S. dollars)
The following is the reconciliation of non-controlling interest between Colombian Banking GAAP and U.S. GAAP:
|
December 31, 2014
|
December 31, 2013
|
|||||||
|
Non-controlling interest under Colombian Banking GAAP
|
Ps. | 7,368,199 | Ps. | 6,472,242 | ||||
|
Adjustments incorporated under U.S. GAAP reconciliation:
|
||||||||
|
Non-controlling interest in reappraisal of assets (1)
|
(1,601,780 | ) | (1,430,749 | ) | ||||
|
Non-controlling interest participation in U.S. GAAP adjustments
|
(23,959 | ) | (100,957 | ) | ||||
|
Business combinations (2) (3)
|
2,089,382 | 1,982,190 | ||||||
|
Non-controlling interest in variable interest entities
|
– | 6,571 | ||||||
| 463,643 | 457,055 | |||||||
|
Non-controlling interest under U.S. GAAP
|
Ps. | 7,831,842 | Ps. | 6,929,297 | ||||
|
(1)
|
As explained in note (iv) (d) above, under Colombian Banking GAAP the surplus between the appraisal and the book value of the asset is recorded in the unconsolidated balance sheet under the asset caption “Reappraisal of assets” and the effect in shareholders’ equity under the caption “Equity surplus: reappraisals of assets”. This adjustment relates to the reversal of the participation of the non-controlling interest in reappraisal of assets.
|
|
(2)
|
During 2012, Corporacion Financiera Colombiana acquired control in Promigas and measured the assets acquired and liabilities assumed at their fair values including those related to non controlling interest. The 2014 and 2013 balances include Ps. 2,025,102 and Ps. 1,911,269 of non-controlling interest from Promigas, respectively (See note (m), and (n) above).
|
|
(3)
|
During 2005, Corporación Financiera del Valle “Corfivalle” (an entity not controlled by Grupo Aval) acquired the shares of Corporación Financiera Colombiana (a subsidiary of Grupo Aval) in an exchange of equity interest. With this transaction, Grupo Aval acquired the control of “Corfivalle” (transaction commonly referred to as reverse acquisition), which was recorded for U.S. GAAP reconciliation purposes according to ASC 323 (previously EITF 98-13), determining the fair value of the assets given, of the net assets acquired and the fair value of the non-controlling interest after the merger process.
|
Under Colombian Banking GAAP, an agreement whereby Grupo Aval assigned to Adminegocios & Cia. S.C.A. its right to acquire up to 2,605,000 mandatorily convertible bonds issued by Banco de Bogotá by Ps. 118,450 is regarded as the sale of a stake of Banco de Bogotá by Grupo Aval. As a direct consequence of this transaction, Grupo Aval recognized a gain of Ps. 61,222 and reduced its stake in Banco de Bogotá from 65.33% to 64.44%. Under U.S. GAAP, this agreement was considered in substance, a loan in accordance with ASC 470 and thus no gain was recognized and Grupo Aval’s stake in Banco de Bogotá was not reduced. The option expired on February 2, 2013, and it was not exercised by either Grupo Aval or by Adminegocios & Cia. S.C.A.
Due to the aforementioned situation, under U.S. GAAP the financial obligation of Ps. 118,450 plus accrued interest amounting to Ps. 15,399 was settled with a charge to non-controlling interest in shareholders’ equity of Ps. 68,594 and the difference of Ps. 65,255 was charged to additional paid–in capital in the controlling interest shareholders’ equity.
|
(p)
|
Guarantees and contingencies:
|
|
|
1)
|
Guarantees
|
Grupo Aval provides its clients with a variety of guarantees and similar arrangements, including stand-by letters of credit and bank guarantees.
Under Colombian Banking GAAP, at the inception of the guarantees, Grupo Aval recognizes in Memorandum Accounts the full guaranteed amount. Any premium received is recognized as collected in the Consolidated Statement of Income.
Under U.S. GAAP, at the inception of a guarantee, Grupo Aval recognizes in its Consolidated Balance Sheet a liability for all guarantees granted. The liability recognized is the premium received or receivable which represents the fair value of the guarantee at its inception and it is subsequently amortized over the term of the guarantee.
F-134
GRUPO AVAL ACCIONES Y VALORES S.A. AND ITS SUBSIDIARIES
NOTES TO THE CONSOLIDATED FINANCIAL STATEMENTS
FOR THE YEARS ENDED DECEMBER 31, 2014, 2013 AND 2012
(
Stated in millions of Colombian pesos and U.S. dollars)
The table below shows guarantees by expiration dates and maximum potential amount of future losses:
|
Expire within one year
|
Expire after one year
|
Total amount outstanding
|
Maximum potential amount of future losses
|
|||||||||||||||||||||||||||||
|
2014
|
2013
|
2014
|
2013
|
2014
|
2013
|
2014
|
2013
|
|||||||||||||||||||||||||
|
Financial standby letters of credit
|
Ps. | 285,163 | Ps. | 268,021 | Ps. | 480,642 | Ps. | 634,484 | Ps. | 765,804 | Ps. | 902,506 | Ps. | 765,804 | Ps. | 902,506 | ||||||||||||||||
|
Bank guarantees
|
1,815,768 | 880,074 | 1,478,633 | 1,738,754 | 3,294,401 | 2,618,827 | 3,294,401 | 2,618,827 | ||||||||||||||||||||||||
|
Total
|
Ps. | 2,100,931 | Ps. | 1,148,094 | Ps. | 1,959,275 | Ps. | 2,373,237 | Ps. | 4,060,205 | Ps. | 3,521,333 | Ps. | 4,060,205 | Ps. | 3,521,333 | ||||||||||||||||
|
Notional amount
|
Fair value
|
Notional amount
|
Fair value
|
|||||||||||||
|
2014
|
2013
|
|||||||||||||||
|
Financial standby letters of credit
|
Ps. | 765,804 | Ps. | 6,938 | Ps. | 902,506 | Ps. | 6,515 | ||||||||
|
Bank guarantees
|
3,294,401 | 37,455 | 2,618,827 | 34,608 | ||||||||||||
|
Total
|
Ps. | 4,060,205 | Ps. | 44,393 | Ps. | 3,521,333 | Ps. | 41,122 | ||||||||
|
|
2)
|
Contingencies
|
Under Colombian Banking GAAP, contingencies are recognized in the following events:
Information available prior to issuance of the consolidated financial statements indicates that it is probable (>50%) that an asset had been impaired or a liability had been incurred at the date of the consolidated financial statements. Then, the amount of loss can be reasonably estimated.
A provision for a contingent events is recorded at the time notice is served to Grupo Aval in a court proceeding. No reference is made in the provision as to the evaluation of the probable final outcome.
Under U.S. GAAP, ASC 450, “Accounting for Contingencies”, provides guidance for recording contingencies. Under ASC 450, there are three levels to assess contingent events – probable, reasonably possible and remote. The term “probable” in ASC 450 is defined as “the future event or events that are likely to occur”. The term “reasonably possible” is defined as “the chance of the future event or events occurring is more than remote but less than likely”. In addition, the term “remote” is defined as “the chance of the future event or events occurring is low”.
Under ASC 450, an estimated loss related to a contingent event is to be accrued by a charge to income if both of the following conditions are met:
Information available prior to issuance of the financial statements indicates that it is probable (>75%) that an asset had been impaired or a liability had been incurred at the date of the financial statements and the amount of loss can be reasonably estimated. The amount recorded is an estimate of the amount of loss at the date of the financial statements. If the contingent event is evaluated to be reasonably possible, no provision for the contingent event may be made, but disclosure of the event is required.
|
|
3)
|
Loyalty Programs
|
Grupo Aval’s Banking subsidiaries have customer loyalty programs that assign points for credit card purchases and for the use of some financial services granted by their banks. The maturity of the points ranges between 18 and 36 months and allow customers to exchange them for prizes such as miles, hotels and other awards.
Under U.S. GAAP, a liability is required to be recorded for the value of the existing points which are earned and expected to be redeemed based on the statistics of redemption. The estimated cost per point includes the average cost of the awards. Periodic adjustments to this liability are recorded as other operating expenses on the Consolidated Statement of Income based on the awards earned, awards redeemed, awards expired and changes in the cost base and changes in the award system.
The liability is recorded under the accrued expenses and other liabilities caption.
F-135
GRUPO AVAL ACCIONES Y VALORES S.A. AND ITS SUBSIDIARIES
NOTES TO THE CONSOLIDATED FINANCIAL STATEMENTS
FOR THE YEARS ENDED DECEMBER 31, 2014, 2013 AND 2012
(
Stated in millions of Colombian pesos and U.S. dollars)
|
Net Income
|
Shareholders’ equity
|
|||||||||||||||||||
|
2014
|
2013
|
2012
|
2014
|
2013
|
||||||||||||||||
|
Guarantees
|
Ps. | 1,838 | Ps. | (272 | ) | Ps. | (343 | ) | Ps. | (358 | ) | Ps. | (2,196 | ) | ||||||
|
Probable contingencies
(1)
|
(17,330 | ) | (40,482 | ) | (1,143 | ) | (29,234 | ) | (11,904 | ) | ||||||||||
|
Loyalty programs
|
(6,418 | ) | (10,229 | ) | (3,533 | ) | (26,325 | ) | (19,907 | ) | ||||||||||
|
Business combination
|
– | – | – | (14,626 | ) | ( 14,626 | ) | |||||||||||||
| Ps. | (21,910 | ) | Ps. | ( 50,983 | ) | Ps. | (5,019 | ) | Ps. | (70,543 | ) | Ps. | ( 48,633 | ) | ||||||
|
(1)
|
The increase in 2013 is due to certain estimations made of probable contingencies in the subsidiary Porvenir related to the lack of account balances of certain clients in the obligatory pension fund. Porvenir manages these accounts and must pay the minimum payment required under Colombian law regardless of the client’s ability to pay. Losses in these accounts stem from an increase in interest rates in Colombia.
|
|
(q)
|
Equity tax:
|
In accordance to Law 1111 of 2006, companies and individuals who possess liquid equity in excess of Ps. 3,000 were subject to a special equity tax during 2011. Under Colombian Banking GAAP, the equity tax was recorded against deferred charges and amortized on a straight monthly basis from 2011 to 2014 with taxes charged to the consolidated statement of income.
Under U.S. GAAP, tax expense derived from the equity tax is recorded directly on the Consolidated Statements of Income, discounted at its present value.
The adjustment to Shareholders’ Equity under U.S. GAAP of Ps. - and Ps. (174,803) as of December 31, 2014 and 2013, respectively, and in Consolidated Statements of Income of Ps. 174,788, Ps. 160,663 and Ps. 120,178 in 2014, 2013 and 2012, respectively.
As explained in (note (1)(w)), on December 2014 a new tax law was issued in Colombia. Under the new law an additional equity tax was created to be paid by the companies during 2015, 2016 and 2017 calculated over the companies’ equity tax recorded as of January 1, each year, which can be recorded under Colombian Banking GAAP as a deduction of retained earnings in equity. Aval shareholder meeting occurred in January 2015 and the shareholders decided to record this equity tax with charge to the retained earnings. For U.S. GAAP purposes this tax must be recorded against to earnings.
(r)
Variable interest entities:
Under Colombian Banking GAAP, consolidation is required only when an entity holds the majority of voting rights of another legal society.
Under U.S. GAAP, application of the majority voting interest requirement to certain types of entities may not identify the party with a controlling financial interest because that interest may be achieved through other arrangements. Although ASC 810-10-15-14 states that consolidated financial statements include subsidiaries in which Grupo Aval has a controlling financial interest, (i.e., a majority voting interest), U.S. GAAP also requires a company to consolidate a variable interest entity (“VIE”) if that company is a primary beneficiary that has the power to direct the activities of a variable interest entity that most significantly impact the entity's economic performance and has the obligation to absorb losses of the entity that could potentially be significant to the variable interest entity or the right to receive benefits from the entity that could potentially be significant to the variable interest entity. Under Colombian Banking GAAP, no such concept as a variable interest entity exists.
F-136
GRUPO AVAL ACCIONES Y VALORES S.A. AND ITS SUBSIDIARIES
NOTES TO THE CONSOLIDATED FINANCIAL STATEMENTS
FOR THE YEARS ENDED DECEMBER 31, 2014, 2013 AND 2012
(
Stated in millions of Colombian pesos and U.S. dollars)
The overall methodology for evaluating transactions and relationships under the VIE requirements includes the following two steps:
|
|
1.)
|
Determine whether the entity meets the criteria to qualify as a VIE; and
|
|
|
2.)
|
Determine whether Grupo Aval is the primary beneficiary of the VIE.
|
In performing the first step, significant factors and judgments are considered in making the determination as to whether an entity is a VIE.
For each VIE identified, Grupo Aval performs the second step and evaluates whether it is the primary beneficiary of the VIE by considering the following significant factors and criteria:
|
|
1.)
|
Whether Grupo Aval has the obligation to absorb losses of the entity that could potentially be significant to the variable interest entity;
|
|
|
2.)
|
Whether Grupo Aval has the right to receive benefits from the entity that could potentially be significant to the variable interest; and
|
|
|
3.)
|
Whether Grupo Aval has the power to direct the activities of the variable interest entity that most significantly impact the entity's economic performance.
|
Grupo Aval’s management has identified the following VIEs in accordance with the variable interest model as prescribed in U.S. GAAP, and concluded that Grupo Aval itself should be regarded as the primary beneficiary. The table below provides details regarding the nature, purpose, and size, activities of the entity and the nature of Grupo Aval’s involvement with each entity.
|
Entity
|
Nature
|
Purpose
|
Activities of the entity
|
Nature of Grupo Aval’s involvement with the entity
|
Total assets
|
|||||||||||
|
2014
|
2013
|
|||||||||||||||
|
Megabanco Foreclosed Assets Trust
|
Trust managed by Helm Fiduciaria
|
Sale of non- performing assets
|
Administration and sale of non performing assets
|
Primary beneficiary of expected losses and returns
|
Ps. | (3,272 | ) | Ps. |
4,981
|
|||||||
|
Corficolombiana Banco de Bogotá A Trust
|
Trust managed by Fiduciaria Bogotá
|
Collection of non -performing loans
|
Administration and collection of non- performing loans
|
Primary beneficiary of expected losses and returns
|
37,927 | 20,828 | ||||||||||
|
Fiduciaria de Occidente
|
Trust managed by Fiduciaria de Occidente
|
Sale of non-performing assets and collection of non-performing loans
|
Administration and collection of non-performing loans
|
Primary beneficiary of expected losses and returns
|
13 | 23,214 | ||||||||||
|
Patrimonio Autonomo Corficolombiana
|
Trust managed by Fiduciaria Colpatria
|
Collection of non -performing loans
|
Administration and collection of non- performing loans
|
Primary beneficiary of expected losses and returns
|
19,736 | 18,024 | ||||||||||
|
Hoteles Estelar PA Cartagena
|
Trust managed by Fiduciaria Colpatria
|
Collection of non -performing loans
|
Administration of property and equipment
|
Primary beneficiary of expected losses and returns
|
26,020 | 39,709 | ||||||||||
|
Pizano
|
Trust managed by Helm Fiduciaria
|
Sale of non- performing assets
|
Administration of biological assets
|
Primary beneficiary of expected losses and returns
|
– | 22,430 | ||||||||||
|
PISA CCFC –Episol
|
Trust managed by Helm Fiduciaria
|
Sale of non-performing assets
|
Administration of right on road concessions
|
Primary beneficiary of expected losses and returns
|
384,548 | 298,949 | ||||||||||
|
Total
|
Ps. | 464,972 | Ps. | 428,135 | ||||||||||||
In addition and due to the consolidation of certain, Grupo Aval recognized additional allowances for loan losses, and foreclosed assets under U.S. GAAP of Ps. 21,825 and Ps. 20,895 for 2014 and 2013.
F-137
GRUPO AVAL ACCIONES Y VALORES S.A. AND ITS SUBSIDIARIES
NOTES TO THE CONSOLIDATED FINANCIAL STATEMENTS
FOR THE YEARS ENDED DECEMBER 31, 2014, 2013 AND 2012
(
Stated in millions of Colombian pesos and U.S. dollars)
The table below presents a summary of the assets and liabilities of VIEs under U.S. GAAP which have been consolidated on Grupo Aval’s Consolidated Balance Sheet for the years December 31, 2014 and 2013:
|
December 31, 2014
|
December 31, 2013
|
|||||||
|
Assets
|
||||||||
|
Cash and cash equivalents
|
Ps. | 134,966 | Ps. | 123,127 | ||||
|
Loans and other receivables
|
15,598 | 28,420 | ||||||
|
Foreclosed assets
|
452 | 3,202 | ||||||
|
Allowance for loan losses, and other receivables
|
(1,123 | ) | (1,099 | ) | ||||
|
Property, foreclosed assets and deferred charges on road concessions
|
192,272 | 168,302 | ||||||
|
Other assets
|
122,807 | 106,183 | ||||||
|
Total assets
|
Ps. | 464,972 | Ps. | 428,135 | ||||
|
Total liabilities
|
Ps. | 325,285 | Ps. | 258,071 | ||||
|
Total controlling interest shareholders’ equity
|
139,687 | 163,493 | ||||||
|
Total non-controlling interest (see note iv) o))
|
– | 6,571 | ||||||
|
Total shareholders’ equity
|
139,687 | 170,064 | ||||||
|
Total liabilities and shareholders’ equity
|
Ps. | 464,972 | Ps. | 428,135 | ||||
|
Total controlling interest shareholders’ equity
|
Ps. | 139,687 | Ps. | 163,493 | ||||
|
Investments elimination for consolidation purposes
|
(237,140 | ) | (246,782 | ) | ||||
|
Difference to be recognized under U.S. GAAP in shareholders’ equity
|
Ps. | (97,453 | ) | Ps. | (83,289 | ) | ||
Net income attributable to Grupo Aval in VIEs consolidation process under U.S. GAAP amounted to Ps. (12,027), Ps. (22,892) and Ps. (127,166) during the years ended December 31, 2014, 2013 and 2012 respectively.
Grupo Aval’s maximum exposure to loss as a result of its involvement with VIEs was Ps. 237,140 and Ps. 246,782 at December 31, 2014 and 2013, respectively.
Grupo Aval did not provide any additional financial support to these or other VIEs during 2014 and 2013. Furthermore, Grupo Aval does not have any contractual commitments or obligations to provide additional financial support to these VIEs. Investors in debt securities issued by the securitized entities have no recourse to any other Grupo Aval assets.
|
(s)
|
Cumulative translation adjustment:
|
The following table presents the U.S. GAAP adjustment in the consolidated net income for the years ended December 31, 2014, 2013 and 2012 related to cumulative translation adjustments:
|
2014
|
2013
|
2012
|
||||||||||
|
Translation of financial statements (1)
|
Ps. | (1,235,663 | ) | Ps. | (295,826 | ) | Ps. | 348,898 | ||||
|
Hedge of net investment in foreign operations (2)
|
1,299,999 | 306,135 | ( 330,305 | ) | ||||||||
|
Total U.S. GAAP statement of income adjustment
|
Ps. | 64,336 | Ps. | 10,309 | Ps. | 18,593 | ||||||
(1) Translation of financial statements
For Colombian Banking GAAP purposes, translation adjustments originated from accounts of subsidiaries with a functional currency other than the reporting currency (Colombian pesos) are included in the consolidated statement of income.
Under U.S. GAAP, according to ASC 830 and ASC 220, translation adjustments are presented as a component of shareholders’ equity within other comprehensive income.
F-138
GRUPO AVAL ACCIONES Y VALORES S.A. AND ITS SUBSIDIARIES
NOTES TO THE CONSOLIDATED FINANCIAL STATEMENTS
FOR THE YEARS ENDED DECEMBER 31, 2014, 2013 AND 2012
(
Stated in millions of Colombian pesos and U.S. dollars)
(2) Hedge of Net Investment in Foreign Operations
In relation to the acquisition of BAC Credomatic in 2010 and the related capital investment of Banco de Bogotá in Leasing Bogotá Panamá for Ps. 6,861,352 equivalent to U.S.$ 2.87 billion (the “Hedged Item”) (see Note 1(b)), Grupo Aval Credit Risk Committee designated U.S. dollar forward contracts for hedging of one portion of the hedged item and U.S. dollar denominated debts to hedge another portion. This accounting hedge under U.S. GAAP was enacted in order to hedge the exchange rate exposure of positions in U.S. dollars against the Colombian Peso. As of December 31, 2014, the Ps. 6,861,352 investment in Leasing Bogotá Panamá, equivalent to U.S.$2.85 billion, represented the portion of the net investment being hedged through the strategy mentioned above. As of December 31, 2013 the investment in Leasing Bogotá Panamá of Ps. 5,004,761, equivalent to U.S.$2.6 billion, was hedged in the amount of Ps 4,971,887 equivalent to U.S.$2.58 billion.
The variation in the fluctuation of the Colombian peso exchange rate against the U.S. Dollar is described in the table below as of December 31:
|
2014
|
2,392.46
|
|
2013
|
1,926.83
|
|
2012
|
1,768.23
|
Forward contracts
Since December 30, 2010, for both Colombian Banking GAAP and U.S. GAAP, U.S. dollar forward contracts were formally designated as hedging instruments over a portion of the net investment in Leasing Bogotá Panamá. As of December 31, 2014, the notional amounts of the U.S. dollar forwards amounted to U.S.$1.851 billion which were used to hedge a corresponding portion of the foreign net investment (as of December 31, 2013 U.S.$ 1.10 billions).
These forward contracts are entered into with other financial counterparties and follow a documented “rolling hedge” strategy, by means of entering into new forwards subsequently as the prior forwards expire. This hedge strategy mitigates the risk that the USD may depreciate against the Colombian Peso, which would create a loss within the Cumulative Translation Adjustment reflected within the Other Comprehensive Income in Shareholders Equity.
As mentioned in Note 2(k), under Colombian Banking GAAP, changes in fair value of derivatives used as hedges of net investment in foreign operations, while ineffective, are recorded as a component of stockholders’ equity until the settlement day when they are taken to income, and to the extent effective are recorded in the consolidated statement of income. In addition and derived from the amendments introduced in November, 2013, until the settlement day when they are taken to income, the daily accrued amount resulting from the implicit devaluation or revaluation agreed upon in the initial contract is recognized in the consolidated statement of income.
Under U.S. GAAP, changes in the fair values of derivative and non-derivative financial instruments used as hedges of net investments in foreign operations are, while ineffective, recorded in the consolidated statement of income. However, in accordance with ASC 815-35-35-16, “Method based on Changes in Forward Exchanges Rates”, all changes in fair value relating solely to the foreign exchange rate portion of the hedge relationship are recorded in the foreign currency translation adjustment account within accumulated other comprehensive income (loss).
Foreign currency denominated debt
Under Colombian Banking GAAP, only derivative financial instruments can be designated as accounting hedges. Under U.S. GAAP (ASC 815 “Derivatives and Hedging”), entities may designate a non-derivative financial instrument that gives rise to a foreign currency transaction gain or loss, in accordance with ASC 830 “Foreign Currency Matters,” as a hedge of the foreign currency exposure of a net investment in a foreign operation.
Under U.S. GAAP exchange rate fluctuations derived from the U.S. dollar denominated debt designated as the hedging instrument are recorded in shareholders' equity in accordance with requirements for hedge accounting. However, under Colombian Banking GAAP, no hedge accounting is applied and therefore any exchange rate fluctuation is recorded in the consolidated statement of income.
On December 31, 2014 and 2013 bonds issued in international markets under regulation 144a in the amount of U.S.$1 billion were designated hedging instruments to hedge the same value of the risk as the investment in Leasing Bogotá.
F-139
GRUPO AVAL ACCIONES Y VALORES S.A. AND ITS SUBSIDIARIES
NOTES TO THE CONSOLIDATED FINANCIAL STATEMENTS
FOR THE YEARS ENDED DECEMBER 31, 2014, 2013 AND 2012
(
Stated in millions of Colombian pesos and U.S. dollars)
Effectiveness test
As mentioned in Note 2(k), Colombian Banking GAAP requires entities to perform effectiveness tests on a monthly basis and for each reporting period retrospectively and prospectively, in order to assess whether the derivative used in its hedging transaction is expected to be and has been highly effective, in a range between 80% and 100%, in offsetting changes in the fair value of the hedged item. Colombian Banking GAAP does not require or recommend the application of any specific effectiveness test method for net investment hedges.
U.S. GAAP requires entities to perform effectiveness tests whenever earnings or financial statements are reported and at least every three months. For U.S. GAAP purposes, Grupo Aval documented the effectiveness of its hedge of its investment in Leasing Bogotá Panamá and its assessment is based on the beginning balance of the portion of net investment hedged at the inception of the hedge relationship. Since Banco de Bogotá’s investment in Leasing Bogotá Panamá will fluctuate during the year, Grupo Aval will evaluate the hedging relationship and the results of the effectiveness tests. In addition, the effectiveness range for U.S. GAAP is set between 80% and 125%, in offsetting changes in the fair value of the hedged item.
Effectiveness test - Forward contracts
For U.S. GAAP purposes, Grupo Aval follows the forward-rate method for the U.S. dollar forwards in order to test for effectiveness.
For the U.S. dollar forwards designated as hedging instrument, any ineffectiveness could be generated between the hedging instrument and the hedged item if both have different notional amounts or different currencies. Grupo Aval will measure hedge ineffectiveness by comparing the change in the value of the actual derivative with the change in value of a hypothetical derivative with the same maturity.
Under Colombian Banking GAAP and as stated previously, there are no specific requirements regarding the application of a particular effectiveness test and therefore, Grupo Aval also follows the forward-rate method.
Effectiveness test - Foreign currency denominated debt
For U.S. GAAP purposes, Grupo Aval follows the spot exchange rate method for the U.S. dollar denominated debt instrument in order to test effectiveness.
For the U.S. dollar denominated debt instrument designated as hedging instrument, the translation gain or loss that is recorded in the foreign currency translation adjustment account is based on the spot exchange rate between the functional currency of Leasing Bogotá S.A. Panamá and the investor’s functional currency. To the extent the notional amount of the hedging instrument exactly matches the hedged net investment and the underlying exchange rate of the derivative hedging instrument relates to the exchange rate between the functional currency of the net investment and the investor’s functional currency (or, in the case of a non-derivative debt instrument, these instruments are denominated in the functional currency of the net investment), no ineffectiveness is recorded in earnings.
U.S. GAAP adjustment for the years ended December 31, 2014 and 2013
As of December 31, 2014, Ps. 1,352,878 and as of December 31, 2013 Ps. 52,879 related to (i) foreign exchange differences of the U.S. dollar denominated debt and (ii) changes in the fair value of U.S. dollar forwards contracts, which were both recorded in the consolidated statement of income for Colombian Banking GAAP purposes, were reclassified to the cumulative translation adjustment account within accumulated other comprehensive income (loss) for U.S. GAAP purposes.
|
(t)
|
Receivables from Issuance of Equity
|
During 2011 and in connection with its issuance of preferred shares, Grupo Aval provided its clients the option of financing the acquisition of such shares through credit facilities that ranged from 1 to 3 years, however, some of these facilities have been restructured under commercial basis extending their terms. As part of the financing program, shares are pledged until the extinguishment of the liability by the creditor.
F-140
GRUPO AVAL ACCIONES Y VALORES S.A. AND ITS SUBSIDIARIES
NOTES TO THE CONSOLIDATED FINANCIAL STATEMENTS
FOR THE YEARS ENDED DECEMBER 31, 2014, 2013 AND 2012
(
Stated in millions of Colombian pesos and U.S. dollars)
Under Colombian Banking GAAP, any issuance of shares payable in notes is recognized directly as an increase in equity, debiting loans.
Under U.S. GAAP, in accordance to ASC 505-10-45, if notes received in exchange for an issuance of shares are not convertible into cash in the short term, it is required to offset the notes and stock issued in the equity section. As of December 31, 2014 and 2013, an adjustment of Ps. 113,062 and Ps. 119,302, respectively, was posted as a reduction to equity in order to offset recognized notes received under U.S. GAAP.
|
(u)
|
Earnings per share
|
Under Colombian Banking GAAP, earnings per share (“EPS”) are computed by dividing net income by the weighted-average number of common and preferred shares outstanding for each period presented.
U.S. GAAP requires dual presentation of basic and diluted EPS for entities with complex capital structures, as well as a reconciliation of the basic EPS computation to the diluted EPS computation. Basic EPS is calculated by dividing net income available to common shareholders by the weighted average number of common shares outstanding. Diluted EPS assumes the issuance of common shares for all dilutive potential common shares outstanding during the reporting period.
For the years ended December 31, 2014, 2013 and 2012, Grupo Aval had a simple capital structure and there were no outstanding dilutive instruments. Therefore, there was no difference between basic or diluted EPS for these years.
Before December 31, 2010, Grupo Aval only had common shares outstanding. During 2011, Grupo Aval issued 4,929,744,329 non-voting preferred shares, which according to local law are entitled to receive a non-cumulative minimum preferential dividend equivalent to Ps. 1 (one Colombian peso) biannually and also participate in the same proportion that the common shares in the net income subject to distribution. In October and September Grupo Aval issued 1,629,629,620 non-voting preferred shares on the New York Stock Exchange (see note 23).
Based on the above, the following table summarizes net income per common share for the years ended December 31, 2014, 2013 and 2012
(in millions of pesos, except per share data):
|
2014
|
2013
|
2012
|
||||||||||
|
U.S. GAAP consolidated net income
|
Ps. | 2,923,667 | Ps. | 2,748,287 | Ps. | 2,593,373 | ||||||
|
Less: participation of non-controlling interest
|
(1,068,767 | ) | (1,115,816 | ) | (1,028,897 | ) | ||||||
|
Net income attributable to controlling interest
|
Ps. | 1,854,900 | Ps. | 1,632,471 | Ps. | 1,564,476 | ||||||
|
Weighted average number of shares outstanding used in basic EPS calculation (1)
|
20,897,356,358 | 18,607,487,293 | 18,551,656,161 | |||||||||
|
Basic and diluted earnings per share (U.S. GAAP):
|
20,897,356,358 | 18,607,487,293 | 18,551,656,161 | |||||||||
|
Net income per share attributable to controlling interest (pesos)
|
Ps. | 88.76 | (2) | Ps. | 87.73 | (2) | Ps. | 84.33 | (2) | |||
|
(1)
|
The balance of outstanding shares of Grupo Aval is 22,281,017,159 at December 31, 2014 (December 31, 2013 -20,178,287,315), and the average number of shares during 2014 was 20,897,356,358 (2013 - 18,607,487,293). The increase was due to the fact that in the first quarter of 2013, Grupo Aval had 466,457 shares subscribed but not paid and issued 1,626,520,862 common shares in December 31, 2013. In September and October 2014 Grupo Aval issued in the NY Stock Exchange 1,629,629,620 non voting preferred shares.
|
|
(2)
|
Our bylaws provide for two classes of shares: common shares and shares with a preferred dividend, liquidation preference and no voting power (except in limited and extraordinary circumstances). Holders of preferred shares are entitled to receive a minimum dividend after deducting losses affecting the capital, and deducting any amounts set aside for legal reserve, but before creating or accruing for any other reserve and before any declared dividends are paid to holders of common shares. Dividends to holders of common shares must be approved by the shareholders. If no dividends are declared, no holder of Grupo Aval’s preferred or common shares will be entitled to payment. The minimum dividend will be equal to Ps. 1.00 in each calendar semester, so long as this value is higher than the dividend paid to the holders of common shares. If the minimum preferred dividend is not equal or higher than the per share dividend on the common shares, the minimum dividend will be equal to the dividend paid to the holders of common shares, if any.
|
F-141
GRUPO AVAL ACCIONES Y VALORES S.A. AND ITS SUBSIDIARIES
NOTES TO THE CONSOLIDATED FINANCIAL STATEMENTS
FOR THE YEARS ENDED DECEMBER 31, 2014, 2013 AND 2012
(
Stated in millions of Colombian pesos and U.S. dollars)
As such, Grupo Aval’s non-voting, preferred shares do not meet the definition of preferred shares under U.S. GAAP, which would normally have priority to receive dividends. In addition, preferred shares under U.S. GAAP would have a minimum dividend - similar to the coupon on a bond- for which unpaid dividends would accumulate to subsequent periods, characteristic that is not found in Grupo Aval’s non-voting preferred shares. For these reasons, under U.S. GAAP the non-voting preferred shares issued by Grupo Aval are considered “Participating securities”. Due to the aforementioned considerations, net income per share for 2014, 2013 and 2012 has been calculated by dividing the net income attributable to controlling interest under U.S. GAAP by the combined weighted average of common and preferred shares for that year.
|
(v)
|
Estimated Fair Value of Financial Instruments
|
Fair value of financial instruments
ASC 820 - Fair Value Measurements. Among other things, ASC 820 defines fair value, establishes a consistent framework for measuring fair value and expands disclosure for each major asset and liability category measured at fair value on either a recurring or non-recurring basis.
The framework for measuring fair value under Colombian Banking GAAP is consistent with ASC 820, except for considerations about own credit risk, counterparty risk and valuation of collaterals in the valuation of derivatives.
Fair Value Hierarchy
ASC 820 establishes a fair value hierarchy that prioritizes the inputs to valuation techniques used to measure fair value. Observable inputs reflect market data obtained from independent sources, while unobservable inputs reflect Grupo Aval’s market assumptions. The three levels of the fair value hierarchy under ASC 820 are described below:
Level 1
- Unadjusted quoted prices in active markets that are accessible on the measurement date for identical, unrestricted assets or liabilities.
Level 2
- Inputs to the valuation methodology include quoted prices for similar assets and liabilities in active markets, and inputs that are observable for the asset or liability, either directly or indirectly, for substantially the full term of the asset or liability. Inputs include the following:
|
(a)
|
Quoted prices for similar assets or liabilities in active markets;
|
|
(b)
|
Quoted prices for identical or similar assets or liabilities in non-active markets;
|
|
(c)
|
Pricing models whose inputs are observable for substantially the full term of the asset or liability;
|
|
(d)
|
Pricing models whose inputs are derived principally from or corroborated by observable market data through correlation or other means.
|
Level 3
- Prices or valuation techniques that require inputs that are both significant to the fair value measurement and unobservable (i.e., supported by little or no market activity).
Grupo Aval considers relevant and observable market prices in its valuations where possible. The frequency of transactions, the size of the bid-ask spread and the amount of adjustment necessary when comparing similar transactions are all factors in determining the liquidity of markets and the relevance of observed prices in those markets.
Determination of Fair Value
Fair value is based upon quoted market prices, where available. If listed prices or quotes are not available, fair value is based upon internally developed models that use primarily market-based or independently-sourced market parameters, including interest rate yield curves, option volatilities and currency rates. Valuation adjustments may be made to ensure that financial instruments are recorded at fair value. These adjustments include, among others, amounts to reflect counterparty credit quality, liquidity and unobservable parameters that are applied consistently over time.
F-142
GRUPO AVAL ACCIONES Y VALORES S.A. AND ITS SUBSIDIARIES
NOTES TO THE CONSOLIDATED FINANCIAL STATEMENTS
FOR THE YEARS ENDED DECEMBER 31, 2014, 2013 AND 2012
(
Stated in millions of Colombian pesos and U.S. dollars)
The following section describes the valuation methodologies used by Grupo Aval, including an indication of the level in the fair value hierarchy in which each instrument is generally classified. Where appropriate, the description includes details of the valuation models, the key inputs to those models, as well as any significant assumptions.
Grupo Aval conducts a review of its fair value hierarchy classifications on an annual basis. Transfers into or out of fair value hierarchy classifications are made if the significant inputs used in the financial models measuring the fair values of the assets and liabilities became unobservable or observable, respectively, in the current marketplace. These transfers are considered to be effective as of the beginning of the year in which they occur.
|
1.
|
Fair value measurement on a recurring and non-recurring basis (ASC 820)
|
Investment securities
|
|
a)
|
Debt securities:
|
When available, Grupo Aval uses quoted market prices to determine fair value and such items are classified in Level 1 of the fair value hierarchy. For certain securities that are not-traded or are over-the–counter securities, Grupo Aval generally determines fair value utilizing industry standard valuation models and standard techniques. These techniques include determination of expected future cash flows which are discounted using curves of the applicable currencies and interest.
Grupo Aval may also use quoted prices for recent trading activity of assets with similar characteristics to the security. If deemed appropriate, Grupo Aval adjusts these values for liquidity risks using their own methodologies. Securities using such methods are generally classified as Level 2. However, when less liquidity exists for a security, a quoted price goes stale or prices from independent sources do not agree, a security is generally classified as Level 3.
Derivatives
The fair values of derivative assets and liabilities traded in the over-the-counter market are determined using industry standard valuation models that require the use of multiple market inputs including interest rates, prices and indices to generate continuous yield and volatility factors. The majority of market inputs is actively quoted and can be validated through external sources, including brokers, market transactions and third-party pricing services. Estimation risk is greater for derivative asset and liability positions that are either option-based or have longer maturity dates where observable market inputs are less readily available or are unobservable; in this case, quantitative-based extrapolations of rate, price or index scenarios are used in determining fair values. The fair values of derivative assets and liabilities include adjustments for market liquidity, counterparty credit quality and other deal specific factors, where appropriate. Derivatives are classified in level 2.
Credit Valuation Adjustment
Under Colombian Banking GAAP, the measurement of the fair value of derivatives does not include the credit valuation adjustment “CVA”. Under U.S. GAAP, Grupo Aval measures the effects of the credit risk of its counterparties and its own creditworthiness in determining fair value of the swap and forward derivatives.
On December 31, 2014, 2013 and 2012, the total adjustment on CVA was Ps. (5,370), Ps. (1,396) and Ps. (1,846), respectively.
Counterparty credit-risk adjustments are applied to derivatives when Grupo Aval’s position is an asset and its own credit risk is incorporated when the position is a liability. Grupo Aval attempts to mitigate credit risk with third parties which are international banks by entering into master netting agreements. When assessing the impact of credit exposure, only the net counterparty exposure is considered at risk due to the offsetting of certain same-counterparty positions and the application of cash and other collateral. Grupo Aval generally calculates the asset’s credit risk adjustment for derivatives transacted with international financial institutions by incorporating credit related pricing that is generally observable in the market such as Credit Default Swaps spreads (“CDS”). The credit-risk adjustment for derivatives transacted with non-public counterparties is calculated by incorporating unobservable credit data derived from internal credit qualifications to financial institutions and corporate companies located in Colombia.
F-143
GRUPO AVAL ACCIONES Y VALORES S.A. AND ITS SUBSIDIARIES
NOTES TO THE CONSOLIDATED FINANCIAL STATEMENTS
FOR THE YEARS ENDED DECEMBER 31, 2014, 2013 AND 2012
(
Stated in millions of Colombian pesos and U.S. dollars)
A hundred basis point reduction in our own credit spreads when determining the fair value of the liabilities associated with derivative contracts could result in an increase of the associated liability of approximately Ps. (6,992), and Ps. (213) in 2014 and 2013, respectively.
A hundred basis point increase in the counterparty credit spreads when determining the fair value of the assets associated with derivative contracts could result in a reduction of the associated asset of approximately Ps. (3,408) and Ps. (526) in 2014 and 2013, respectively.
Impaired loans measured at fair value
Grupo Aval measured certain impaired loans based on the fair values of the collateral less costs to sell. The fair values of the collateral are determined using internal valuation techniques or external experts.
Asset-backed securities
Grupo Aval invests in asset-backed securities with underlying assets corresponding to mortgages issued by financial institutions. The asset-backed securities are denominated in local market as Titulos Inmobiliarios Participativos (and can be classified as available for sale securities). These asset-backed securities have different maturities and are generally classified as AAA by credit rating agencies. Grupo Aval does not expect significant changes in those ratings. Fair values were estimated using discounted cash flow models that use certain key economic assumptions, prepayment rates and weighted
-
average lives of the securitized mortgage portfolio, probability of default and interest rate curves.
|
2.
|
Fair value disclosures
|
ASC 825 requires entities to disclose the fair value of financial instruments, both assets and liabilities recognized and not recognized in the statement of financial position, for which it is practicable to estimate fair value. Fair value disclosures are within the scope of ASC 820; therefore, Grupo Aval applies ASC 820 when performing fair value measurements for disclosure purposes. The financial instruments below are not recorded at fair value on a recurring or nonrecurring basis:
Short-term financial instruments
Short-term financial instruments are valued at their carrying amounts included in the Consolidated Balance Sheet, which are reasonable estimates of fair value due to the relatively short - term maturities. This approach was used for cash and cash equivalents, accrued interest receivable, customers’ acceptances, accounts receivable, accounts payable, accrued interest payable, and bank acceptances outstanding.
Deposits
The fair value of time deposits was estimated based on the discounted cash flow values determined using the current offering rate for the corresponding maturity and the discount rate. Fair value of deposits with undefined maturities represents the amount payable on demand as of the Balance Sheet date.
Interbank borrowings and borrowings from banks and others
Short-term interbank borrowings and borrowings from banks and others have been valued at their carrying amounts because of their relatively short-term nature. The fair value long-term debt is determined based on the discounted value of cash flows using the rates currently offered for the debt of similar remaining maturities and its own creditworthiness.
F-144
GRUPO AVAL ACCIONES Y VALORES S.A. AND ITS SUBSIDIARIES
NOTES TO THE CONSOLIDATED FINANCIAL STATEMENTS
FOR THE YEARS ENDED DECEMBER 31, 2014, 2013 AND 2012
(
Stated in millions of Colombian pesos and U.S. dollars)
Long-term debt
The fair value of long-term debt, which comprises bonds issued by Grupo Aval and its subsidiaries, was estimated substantially based on quoted market prices. Certain bonds which are not publicly traded were determined based on the discounted value of cash flows using the rates currently offered for debt of similar remaining maturities and its own creditworthiness.
Items Measured at Fair Value on a Recurring Basis
The following table presents, for each of the fair-value hierarchy levels, Grupo Aval’s assets and liabilities measured at fair value on a recurring basis as of December 31, 2014 and 2013 based on the Consolidated Balance Sheets under Colombian Banking GAAP.
Fair value measurements at December 31, 2014
|
Level 1(1)
|
Level 2(1)
|
Level 3
|
Balance
|
|||||||||||||
|
Assets
|
||||||||||||||||
|
Trading securities
|
Ps. | 1,728,771 | Ps. | 2,930,99 | Ps. | – | Ps. | 4,659,762 | ||||||||
|
Investments securities available for sale
|
||||||||||||||||
|
Debt securities
|
12,692,505 | 5,334,913 | 28,253 | 18,055,671 | ||||||||||||
|
Equity securities
|
628,295 | 74,670 | – | 702,965 | ||||||||||||
|
Derivatives
|
– | 1,084,380 | – | 1,084,380 | ||||||||||||
|
Liabilities
|
||||||||||||||||
|
Derivatives
|
– | (1,672,396 | ) | – | (1,672,396 | ) | ||||||||||
|
Total
|
Ps. | 15,049,571 | Ps. | 7,752,558 | Ps. | 28,253 | Ps. | 22,830,382 | ||||||||
|
(1)
|
During 2014, Ps. 2,367,578 of assets were transferred from Level 1 to Level 2, and gross transfers between Level 2 and Level 1 during 2014 were Ps. 575,504. These transfers were due to changes in the securities liquidity.
|
Fair value measurements at December 31, 2013
|
Level 1
(1)
|
Level 2
(1)
|
Level 3
|
Balance
|
|||||||||||||
|
Assets
|
||||||||||||||||
|
Trading securities
|
Ps. | 4,008,730 | Ps. | 3,118,970 | Ps. | – | Ps. | 7,127,700 | ||||||||
|
Investments securities available for sale
|
||||||||||||||||
|
Debt securities
|
11,006,489 | 3,108,482 | 32,561 | 14,147,532 | ||||||||||||
|
Equity securities
|
593,676 | 71,514 | – | 665,190 | ||||||||||||
|
Derivatives
|
– | 191,025 | – | 191,025 | ||||||||||||
|
Liabilities
|
||||||||||||||||
|
Derivatives
|
– | (224,059 | ) | – | (224,059 | ) | ||||||||||
|
Total
|
Ps. | 15,608,895 | Ps. | 6,265,932 | Ps. | 32,561 | Ps. | 21,907,388 | ||||||||
|
(1)
|
During 2013, Ps. 686,569 of assets were transferred from Level 1 to Level 2, and gross transfers between Level 2 and Level 1 during 2013 were Ps. 1,728,796. These transfers were due to changes in the securities liquidity.
|
GRUPO AVAL ACCIONES Y VALORES S.A. AND ITS SUBSIDIARIES
NOTES TO THE CONSOLIDATED FINANCIAL STATEMENTS
FOR THE YEARS ENDED DECEMBER 31, 2014, 2013 AND 2012
(
Stated in millions of Colombian pesos and U.S. dollars)
The following table shows the fair value hierarchy levels by different category of investment securities:
Fair value measurements at December 31, 2014
|
Level 1
|
Level 2
|
Level 3
|
Balance
|
|||||||||||||
|
Assets
|
||||||||||||||||
|
Investments securities available for sale
|
||||||||||||||||
|
Debt securities
|
Ps. | 12,692,506 | Ps. | 5,334,912 | Ps. | 28,253 | Ps. | 18,055,671 | ||||||||
|
Securities issued or secured by Colombian Government
|
9,223,197 | 2,751,169 | – | 11,974,366 | ||||||||||||
|
Securities issued or secured by Government entities
|
333,929 | 15,770 | – | 349,699 | ||||||||||||
|
Securities issued or secured by other financial entities
|
2,502,139 | 714,564 | – | 3,216,703 | ||||||||||||
|
Securities issued or secured by foreign governments
|
121,308 | 1,383,467 | – | 1,504,775 | ||||||||||||
|
Other
|
511,933 | 469,942 | 28,253 | 1,010,128 | ||||||||||||
|
Equity securities
|
628,295 | 74,670 | – | 702,965 | ||||||||||||
|
Bolsa de Valores de Colombia S.A.
|
15,136 | – | – | 15,136 | ||||||||||||
|
Empresa de Energía de Bogotá S.A. E.S.P.
|
556,156 | – | – | 556,156 | ||||||||||||
|
Bladex S.A
|
387 | – | – | 387 | ||||||||||||
|
Gas Natural S.A. E.S.P.
|
– | 73,380 | – | 73,380 | ||||||||||||
|
Mineros S.A.
|
53,521 | – | – | 53,521 | ||||||||||||
|
Mastercard INT
|
2,564 | – | – | 2,564 | ||||||||||||
|
Other
|
531 | 1,290 | – | 1,821 | ||||||||||||
Fair value measurements at December 31, 2013
|
Level 1
|
Level 2
|
Level 3
|
Balance
|
|||||||||||||
|
Assets
|
||||||||||||||||
|
Investments securities available for sale
|
||||||||||||||||
|
Debt securities
|
Ps. | 11,006,489 | Ps. | 3,108,482 | Ps. | 32,561 | Ps. | 14,147,532 | ||||||||
|
Securities issued or secured by Colombian Government
|
7,901,156 | 1,486,133 | – | 9,387,289 | ||||||||||||
|
Securities issued or secured by Colombian government entities
|
285,161 | 5,147 | – | 290,308 | ||||||||||||
|
Securities issued or secured by other financial entities
|
1,709,910 | 363,662 | – | 2,073,572 | ||||||||||||
|
Securities issued or secured by foreign governments
|
181,708 | 1,066,971 | 271 | 1,248,950 | ||||||||||||
|
Other
|
928,554 | 186,569 | 32,290 | 1,147,413 | ||||||||||||
|
Equity securities
|
593,676 | 71,514 | – | 665,190 | ||||||||||||
|
Bolsa de Valores de Colombia S.A.
|
16,107 | – | – | 16,107 | ||||||||||||
|
Empresa de Energía de Bogotá S.A. E.S.P.
|
502,176 | – | – | 502,176 | ||||||||||||
|
Bladex S.A
|
225 | – | – | 225 | ||||||||||||
|
Gas Natural S.A. E.S.P.
|
– | 71,514 | – | 71,514 | ||||||||||||
|
Mineros S.A.
|
73,165 | – | – | 73,165 | ||||||||||||
|
Mastercard INT
|
2,003 | – | – | 2,003 | ||||||||||||
The following methods and assumptions were used to estimate the fair value of each class of financial instruments.
Investment securities
: Equity securities classified as trading and available for sale are measured at fair value using market quotes and margins of similar assets. The methodology used is based on the present value of future cash flows considering the notional features of each title, for which the discount rates are constructed from curves of prices of similar assets in an active market, such as:
– Curved zero coupon TES UVR
– Reference Bloomberg curve for banks of rating BBB (C883 Composite)
– IRS (Interest Rate Swap) USD LIBOR
– CDS (Credit Default Swap) of the Republic of Colombia
Derivative instruments:
Grupo AVAL ranked as level 3 financial derivatives traded on the OTC market (forward contracts, IRS and Cross Currency Swaps “CCS”) with customers in the real sector (manufacturing), that require the addition of unobservable market inputs for determining the Credit valuation adjustment “CVA”. Those inputs are, the administrative costs for the placement of credits portfolio, except the curves of interest rates and exchange rates, which are observable in the market. As of December 31, 2014 and 2013, there were no derivative instruments presented as Level 3.
F-146
GRUPO AVAL ACCIONES Y VALORES S.A. AND ITS SUBSIDIARIES
NOTES TO THE CONSOLIDATED FINANCIAL STATEMENTS
FOR THE YEARS ENDED DECEMBER 31, 2014, 2013 AND 2012
(
Stated in millions of Colombian pesos and U.S. dollars)
The table below presents a roll forward for all assets and liabilities measured at fair value on a recurring basis using significant unobservable inputs (Level 3) during 2014:
|
December 31, 2014
|
||||||||||||||||
|
Available for sale
|
Trading
|
Derivatives contracts
|
Total
|
|||||||||||||
|
Beginning balance
|
Ps. | 32,561 | Ps. | – | Ps. | – | Ps. | 32,561 | ||||||||
|
Transfer into level 3
|
– | – | – | – | ||||||||||||
|
Transfer out of level 3
|
– | – | – | – | ||||||||||||
|
Total Gains or Losses
|
– | – | – | – | ||||||||||||
|
Included in earnings (or changes in net assets)
|
51 | – | – | 51 | ||||||||||||
|
Included in other comprehensive income
|
(1,017 | ) | – | – | (1,017 | ) | ||||||||||
|
Purchases, issuances, sales and settlements:
|
– | – | – | – | ||||||||||||
|
Purchases
|
– | – | – | – | ||||||||||||
|
Issuances
|
– | – | – | – | ||||||||||||
|
Sales
|
– | – | – | – | ||||||||||||
|
Settlements
|
(3,343 | ) | – | – | (3,343 | ) | ||||||||||
|
Ending Balance
|
Ps. | 28,253 | Ps. | – | Ps. | – | Ps. | 28,253 | ||||||||
|
December 31, 2013
|
||||||||||||||||
|
Available for sale
|
Trading
|
Derivatives contracts
|
Total
|
|||||||||||||
|
Beginning balance
|
Ps. | 52,156 | – | – | Ps. | 52,156 | ||||||||||
|
Transfer into level 3
|
– | – | – | – | ||||||||||||
|
Transfer out of level 3
|
(14,177 | ) | – | – | (14,177 | ) | ||||||||||
|
Total Gains or Losses
|
(243 | ) | – | – | (243 | ) | ||||||||||
|
Included in earnings (or changes in net assets)
|
– | – | – | – | ||||||||||||
|
Included in other comprehensive income
|
– | – | – | – | ||||||||||||
|
Purchases, issuances, sales and settlements:
|
||||||||||||||||
|
Purchases
|
– | – | – | – | ||||||||||||
|
Issuances
|
– | – | – | – | ||||||||||||
|
Sales
|
– | – | – | – | ||||||||||||
|
Settlements
|
(5,175 | ) | – | – | (5,175 | ) | ||||||||||
|
Ending Balance
|
Ps. | 32,561 | – | – | Ps. | 32,561 | ||||||||||
Trading securities and available for sale Level 3 changes in the fair value are included in the consolidated statement of income as part of income from investment portfolio and changes of fair value of derivatives Level 3 are included in the consolidated statement of income as part of the other income.
Items Measured at Fair Value on a Nonrecurring Basis
Under U.S. GAAP according to ASC 820, the Company is required, on a nonrecurring basis to adjust the carrying value of certain assets and liabilities or provide valuation allowances. These assets or liabilities primarily include impaired collateralized loans and foreclosed assets recorded at fair value less cost to sell. The fair values of these financial assets which are classified as Level 3 are determined using pricing models, discounted cash flow methodologies, a current replacement cost or similar techniques for which the determination of fair value requires significant management judgment or estimation. The following tables present the company’s assets and liabilities, classified within the fair value hierarchy, which are measured on a nonrecurring basis as of December 31, 2014 and 2013:
F-147
GRUPO AVAL ACCIONES Y VALORES S.A. AND ITS SUBSIDIARIES
NOTES TO THE CONSOLIDATED FINANCIAL STATEMENTS
FOR THE YEARS ENDED DECEMBER 31, 2014, 2013 AND 2012
(
Stated in millions of Colombian pesos and U.S. dollars)
|
Year ended
|
Level 1
|
Level 2
|
Level 3
|
|||||||||
|
2014
|
||||||||||||
|
Collateralized loans
|
Ps. | – | Ps. | – | Ps. | 53,861 | ||||||
|
Foreclosed assets
|
– | – | 195,290 | |||||||||
| Ps. | – | Ps. | – | Ps. | 249,151 | |||||||
|
2013
|
||||||||||||
|
Collateralized loans
|
Ps. | – | Ps. | – | Ps. | 32,467 | ||||||
|
Foreclosed assets
|
– | – | 219,544 | |||||||||
| Ps. | – | Ps. | – | Ps. | 252,011 | |||||||
ASC 825 Disclosures
The table below presents the disclosures required by ASC 825 for all financial instruments assets and liabilities based on the Supplemental Condensed Consolidated Balance Sheets under U.S. GAAP and comparing amounts presented to fair values calculated for U.S. GAAP purposes under ASC 820:
|
December 31, 2014
|
December 31, 2013
|
|||||||||||||||
|
Book value under U.S. GAAP
|
Estimated fair value
|
Book value under U.S. GAAP
|
Estimated fair value
|
|||||||||||||
|
Financial assets:
|
||||||||||||||||
|
Cash and cash equivalent
|
Ps. | 17,173,577 | Ps. | 17,173,577 | Ps. | 13,583,939 | Ps. | 13,583,939 | ||||||||
|
Investment securities, net
|
26,411,369 | 26,380,717 | 25,264,160 | 25,210,959 | ||||||||||||
|
Loans, net
|
114,747,352 | 117,277,760 | 99,412,022 | 101,297,966 | ||||||||||||
|
Derivatives
|
1,084,380 | 1,084,380 | 191,025 | 191,025 | ||||||||||||
|
Financial liabilities:
|
||||||||||||||||
|
Deposits
|
114,396,855 | 115,076,442 | 101,179,535 | 101,333,756 | ||||||||||||
|
Interbank borrowings and overnight funds
|
4,589,494 | 4,589,494 | 5,123,597 | 5,123,597 | ||||||||||||
|
Derivative and banker’s acceptances outstanding, net
|
1,982,954 | 1,982,954 | 447,318 | 447,318 | ||||||||||||
|
Borrowings from banks and others
|
17,528,341 | 17,523,622 | 14,391,708 | 14,253,166 | ||||||||||||
|
Bonds
|
12,540,961 | 12,923,065 | 11,179,705 | 11,305,598 | ||||||||||||
|
(w)
|
Related party transactions:
|
We currently engage in, and expect from time to time in the future to engage in, financial and commercial transactions with “related parties” (within the meaning of the SEC rules). Unless otherwise indicated below, such transactions are conducted on an arm’s-length basis in the ordinary course of business, on terms that would apply to transactions with third parties.
Loans or deposits involving related parties
The following chart presents outstanding amounts of related party transactions involving loans or deposits between Grupo Aval and its consolidated subsidiaries, and each of the following individuals and entities.
GRUPO AVAL ACCIONES Y VALORES S.A. AND ITS SUBSIDIARIES
NOTES TO THE CONSOLIDATED FINANCIAL STATEMENTS
FOR THE YEARS ENDED DECEMBER 31, 2014, 2013 AND 2012
(
Stated in millions of Colombian pesos and U.S. dollars)
|
Transactions between Grupo Aval and its subsidiaries, and
|
||||||||||||||||
|
Grupo Aval’s directors and key management and their affiliate (1)
|
Close family members of Mr. Sarmiento Angulo and their affiliates
|
Mr. Sarmiento Gutiérrez and his affiliates
|
Mr. Sarmiento Angulo and his affiliates
|
|||||||||||||
|
December 31, 2014
|
||||||||||||||||
|
Outstanding loans guaranteed by us (2)
|
Ps. | 35,527 | (5) | Ps. | 59,920 | Ps. | 33 | Ps. | 804,590 | |||||||
|
Outstanding loans guaranteed to us (3)
|
– | – | – | – | ||||||||||||
|
Deposits (4)
|
10,345 | 5,529 | 677 | 3,650,655 | ||||||||||||
|
December 31, 2013
|
||||||||||||||||
|
Outstanding loans guaranteed
by us (2)
|
Ps. | 9,864 | Ps. | 59,428 | Ps. | 11 | Ps. | 899,860 | ||||||||
|
Outstanding loans guaranteed to us (3)
|
– | – | – | – | ||||||||||||
|
Deposits (4)
|
10,236 | 4,305 | 773 | 2,479,380 | ||||||||||||
|
(1)
|
Excludes Mr. Sarmiento Angulo and Mr. Sarmiento Gutiérrez and their affiliates. Key management includes executive officers of Grupo Aval as well as each of the presidents of our banks, Porvenir, Corficolombiana and BAC Credomatic.
|
|
(2)
|
Figures based on disbursed loans. See “—Loans granted to related parties by our banking subsidiaries.”
|
|
(3)
|
Figures based on disbursed. See “—Loans granted to Grupo Aval and its subsidiaries by shareholders of Grupo Aval and their affiliates.”
|
|
(4)
|
All deposits, including time deposits and investment portfolios, of all related parties held with us are made in the ordinary course of business, held at market rates and on terms and conditions not materially different from those available to the general public.
|
|
(5)
|
Includes loans to Gas Natural S.A. E.S.P for $24,292,061,111 that were disbursed by Banco Popular ($15,033,670,644) and Banco de Occidente ($9,258,390,467). |
For information on related party transactions in accordance with Colombian disclosure rules, see note 27 to our audited consolidated financial statements. Required Colombian disclosures as to related party transactions differ from those required by the SEC. For the purposes of note 27 to our audited consolidated financial statements, “related parties” includes the principal shareholders of Grupo Aval, members of the board of directors, individuals who are legal representatives of Grupo Aval and companies in which Grupo Aval, its principal shareholders or board members have a direct equity interest of at least 10.0%. For the purposes of this section, and as required by SEC rules, “related parties” includes enterprises that control, or are under common control with Grupo Aval, associates, individuals owning directly or indirectly an interest in the voting power that gives them significant influence over Grupo Aval, close family members, key management personnel (including directors and senior management) and any enterprises in which a substantial interest in the voting power is owned, directly or indirectly, by any of the persons listed above. We determine beneficial ownership under SEC rules. See “A. Major shareholders.”
In May 2011, our Board of Directors authorized Mr. Luis Carlos Sarmiento Angulo to acquire, directly or indirectly, common or preferred shares of the company up to an amount of Ps. 30 billion.
Certain members of our board of directors and key management own shares of Grupo Aval which, other than in the case of Mr. Sarmiento Angulo, were acquired in the open market or in one of our public offerings and represent less than 0.1% of our total outstanding shares.
In January 2014 we completed our Common Share Rights Offering raising Ps. 2.4 trillion (U.S.$1.3 billion) through the issuance of 1,855,176,646 of common shares. Subscription of the common shares was offered with preemptive rights to the existing shareholders of the company. Shareholders subscribing a total amount under their preemptive rights were allowed to subscribe an additional amount of common shares subject to terms of the approved rules. Mr. Luis Carlos Sarmiento Angulo acquired 1,852,895,755 common shares in the offering and, as the beneficial owner of approximately 95.2% of our issued and outstanding common shares at that time, fully exercised his preemptive rights as a part of the offering on the same terms as other common shareholders.
F-149
GRUPO AVAL ACCIONES Y VALORES S.A. AND ITS SUBSIDIARIES
NOTES TO THE CONSOLIDATED FINANCIAL STATEMENTS
FOR THE YEARS ENDED DECEMBER 31, 2014, 2013 AND 2012
(
Stated in millions of Colombian pesos and U.S. dollars)
In September 2014, we completed an SEC-registered initial public offering in the United States of 93,703,703 ADSs, each representing 20 preferred shares, including 12,222,222 ADSs sold to the underwriters to cover over-allotments.
Loans granted to Grupo Aval and its subsidiaries by shareholders of Grupo Aval and their affiliates
Certain shareholders of Grupo Aval and their affiliates have granted loans to Grupo Aval and its subsidiaries on an arm’s-length basis and at market rates that are substantially consistent with interest rates and collateral that would have been available to such parties from other lenders at the time those borrowings were entered into. Such loans have been granted for general corporate purposes (including funding the acquisition of 13,726,421 mandatorily convertible bonds issued by Banco de Bogotá (converted into 29,205,152 shares of Banco de Bogotá)). Loans have been previously granted on an unsecured basis and a five-year term, with a two-year grace period. There are no outstanding loans granted to Grupo Aval by shareholders of Grupo Aval and their respective affiliates since December 20, 2013 through to April
22
, 2015. The prior outstanding balance of Ps. 1,373 billion (U.S.$713.7 million) relating to loans granted by Bienes y Comercio S.A., Adminegocios & Cía S.C.A. and Rendifin S.A. were fully repaid on December 18 and December 20, 2013 with proceeds from our 2014 Common Share Rights Offering.
The largest amount of loans (including guarantees) outstanding during the period from January 1, 2012 to December 31, 2014 was Ps.
1,509.1
billion (U.S.$
853.5
million).
Business and financial reasons for borrowing from entities affiliated with Mr. Sarmiento Angulo
At April
22
, 2015, there are no outstanding loans from companies beneficially owned by Mr. Sarmiento Angulo. However, in the past, we have borrowed from entities beneficially owned by Mr. Sarmiento Angulo. These loans have been entered into on an arm’s-length basis with us, the holding company, at a rate substantially consistent with rates that would have been available to the holding company from other lenders at the time those borrowings were entered into. The amount of the loans outstanding from companies beneficially owned by Mr. Sarmiento Angulo was Ps. 1,373 billion (U.S.$713.7 million) in 2013. Such amounts were repaid on December 18 and December 20, 2013 and there are no outstanding loans since December 20, 2013 through April 22, 2015.
Grupo Aval has chosen not to borrow from competing banks at the holding company level. Among our funding alternatives, in addition to the global and local bond markets are companies affiliated with our controlling shareholder. These companies provide us with a stable source of financing at rates that are substantially consistent with rates available to us from other lenders. In addition, these loans are executed in a shorter timeframe and at lower transaction costs than if borrowed from other potential sources of funding.
Loans granted to related parties by our banking subsidiaries
Key management of Grupo Aval and our banks, and their respective affiliates, who meet our credit eligibility requirements may subscribe to loans in the ordinary course of business, on market terms and conditions available to the general public.
All outstanding loans with our related parties are made in the ordinary course of business and on terms and conditions, including interest rates and collateral, not materially different from those available to the general public and did not involve more than the normal risk of collectability or present other unfavorable features.
In connection with our Preferred Shares Local Offering, certain members of our board of directors and key management were granted loans by our banking subsidiaries for the purpose of acquiring Grupo Aval preferred shares. These loans were granted at market rates and on terms and conditions not materially different from those available to other purchasers of Grupo Aval shares.
F-150
GRUPO AVAL ACCIONES Y VALORES S.A. AND ITS SUBSIDIARIES
NOTES TO THE CONSOLIDATED FINANCIAL STATEMENTS
FOR THE YEARS ENDED DECEMBER 31, 2014, 2013 AND 2012
(
Stated in millions of Colombian pesos and U.S. dollars)
Other transactions with Mr. Sarmiento Angulo and his affiliates
Beneficial ownership in our banking subsidiaries (outside of Grupo Aval)
In addition to his beneficial ownership in Grupo Aval, Mr. Sarmiento Angulo beneficially owns at April 22, 2015, 8.3% of Banco de Bogotá, 13.3% of Banco de Occidente, 15.5% of Banco AV Villas, 0.8% of Banco Popular, and 0.3% of Corficolombiana.
On February 11, 2014 Grupo Aval’s Board of Directors authorized Adminegocios & Cia S.C.A., an affiliate of Mr. Sarmiento, to acquire preferred shares of Grupo Aval for a period of six months and up to Ps 150.0 billion (U.S.$62.7 million at the representative exchange rate of that date). As of December 31, 2014, Adminegocios had acquired 23.479.727 preferred shares or Ps 30.3 billion (U.S.$12.7 million at the representative exchange rate of that date) through open market transactions.
On August 13, 2014 Grupo Aval’s Board of Directors extended an authorization issued on February 10, 2014 regarding the direct or indirect acquisitions by Mr. Luis Carlos Sarmiento Angulo of preferred shares of the company up to an amount of Ps 150.0 billion (U.S.$62.7 million). Such authorization was extended until August 13, 2015. As of April 22, 2015, Mr. Luis Carlos Sarmiento Angulo had beneficially acquired 23,479,727 preferred shares or Ps. 30.3 billion (U.S.$12.7 million) through open market transactions.
Except as stated above, Mr. Sarmiento Angulo does not have any other beneficial ownership in our banking subsidiaries. For information on the dividend history of our banking subsidiaries, see “Item 10. Additional Information—F. Dividends and paying agents dividend policy—Dividend history of our banking subsidiaries.”
Insurance services
Seguros de Vida Alfa S.A., or “Vida Alfa,” a life insurance affiliate of Mr. Sarmiento Angulo, provides insurance required by law, as well as annuities, relating to the mandatory pension funds managed by Porvenir. The insurance provider is selected by Porvenir through a competitive bidding process once every four years. Premiums under this insurance policy are deducted by Porvenir from the individual customers’ account and transferred to Vida Alfa on behalf of the individual customer.
The table below presents the insurance premiums paid for the periods indicated.
|
Period
|
Amount
|
|
|
(in Ps. billions)
|
||
|
For the year ended December 31:
|
||
|
2014
|
747.8(1)
|
|
|
2013
|
395.6
|
|
|
2012
|
336.9
|
|
(1)
|
The increase in the insurance premiums for the year ended December 31, 2014 reflects the acquisition and merger of AFP Horizonte into Porvenir and an increase in the premiums’ rates under this insurance policy from 1.60% in 2013 to 1.85% in 2014.
|
Vida Alfa also provides:
|
|
·
|
life insurance, as sole provider and as co-insurer with non-affiliated insurers (pursuant to a competitive bidding process), for individual borrowers of our banking subsidiaries to cover the risk of non-payment upon death. Premiums are paid by the borrowers; and
|
|
|
·
|
workers compensation for all employees of Grupo Aval and its subsidiaries (except BAC Credomatic).
|
Seguros Alfa S.A., or “Alfa,” a property and casualty insurance affiliate of Mr. Sarmiento Angulo, provides fire and earthquake insurance for mortgage loans granted by certain of our banks. In addition, Alfa provides surety bonds and property insurance for our subsidiaries. Our banking subsidiaries also provide insurance products affiliated with Vida Alfa and Alfa through their bancassurance lines. These transactions are conducted on an arm’s-length basis in the ordinary course of business. Alfa has in the past, but not currently, provided bankers’ blanket bond coverage to us and our subsidiaries, reinsured under prevailing market conditions, and surety bonds for Corficolombiana’s toll-road concessions.
F-151
GRUPO AVAL ACCIONES Y VALORES S.A. AND ITS SUBSIDIARIES
NOTES TO THE CONSOLIDATED FINANCIAL STATEMENTS
FOR THE YEARS ENDED DECEMBER 31, 2014, 2013 AND 2012
(
Stated in millions of Colombian pesos and U.S. dollars)
Other
The following companies are beneficially owned by Mr. Sarmiento Angulo, and may continue to provide services to us and our subsidiaries for amounts that are immaterial: Construcciones Planificadas S.A. (office renovations), Vigía S.A. (security services), and Corporación Publicitaria (advertising).
|
(x)
|
Segments Disclosure:
|
Grupo Aval’s businesses are organized into four operating segments: Banco de Bogotá, Banco de Occidente, Banco Popular and Banco Comercial AV Villas. Each of these segments operate several lines of businesses and regularly report their consolidated results of operations to Grupo Aval’s president and board of directors. Each of the four banks is represented on the board of directors by its respective president, and the banks’ presidents are compensated on the basis of the consolidated results of operations of each respective bank under their management.
Grupo Aval’s president allocates resources, sets budgets and targets, and assesses the performance of Grupo Aval’s business on the basis of its four consolidated bank operating segments. Grupo Aval’s president and board of directors analyze group performance and allocate resources on the basis of the banks’ consolidated reports and consolidated statements.
Grupo Aval does not have any individual external customer which represents 10% or more of the enterprise’s revenues. The 75% of the operations carried out by Grupo Aval are performed inside Colombia.
Following is a brief description of our four operating segments:
Banco de Bogotá
, founded in 1870, is a full-service bank with nationwide coverage and a comprehensive portfolio of services and products. Banco de Bogotá serves high-income individual customers directly and low- and medium-income individual customers through a dedicated distribution network. This bank controls (1) AFP Porvenir, the pension and severance fund management business in Colombia, (2) Corficolombiana, a merchant bank that primarily invests in strategic sectors of the Colombian economy, including infrastructure, energy, and finance, and it also provides treasury, investment banking, and private banking services and (3) BAC Credomatic, a Central American bank specialized in consumer banking products.
Banco de Occidente
is a full-service bank with presence throughout the southwest region of Colombia. It serves enterprise customers with a focus on large- and medium-sized companies, and consumers with medium- to high-income levels. Banco de Occidente offers comprehensive services and product portfolios and has a financial leasing business.
Banco Popular
processes payroll loans and provides financial solutions to government entities throughout Colombia. Banco Popular achieves returns on its consumer loan portfolio due to its access to payroll deductions for repayment of loans, which results in consumer loans with a substantially lower-risk profile.
Banco Comercial AV Villas
focuses on consumer and mortgage businesses, serving its clients through a nationwide service-point network and a mobile banking platform. Over the past decade, Banco AV Villas has evolved from being a lender exclusively focused on mortgages to a diversified full-service low- and middle-income consumer bank. Banco AV Villas’ risk management systems provide the bank with real-time and in-depth credit quality analyses that allow the bank to approve consumer loans on an accelerated basis.
The following table presents information on reported operating segments profit or loss, and segment assets as of and for the years ended December 31, 2014, 2013 and 2012 under Colombian Banking GAAP:
GRUPO AVAL ACCIONES Y VALORES S.A. AND ITS SUBSIDIARIES
NOTES TO THE CONSOLIDATED FINANCIAL STATEMENTS
FOR THE YEARS ENDED DECEMBER 31, 2014, 2013 AND 2012
(
Stated in millions of Colombian pesos and U.S. dollars)
December 31, 2014
|
Banco de Bogotá
|
Banco de Occidente
|
Banco AV Villas
|
Banco Popular
|
Grupo Aval(*)
|
Eliminations
|
Grupo Aval consolidated
|
||||||||||||||||||||||
|
Total interest income
|
Ps. | 7,123,325 | Ps. | 3,005,070 | Ps. | 929,771 | Ps. | 1,585,318 | Ps. | 114,838 | Ps. | (871,864 | ) | Ps. | 11,886,458 | |||||||||||||
|
Total interest expense
|
(2,661,287 | ) | (842,462 | ) | (231,493 | ) | (505,488 | ) | (223,062 | ) | 135,417 | (4,328,373 | ) | |||||||||||||||
|
Net interest income
|
4,462,038 | 2,162,608 | 698,278 | 1,079,830 | (108,224 | ) | (736,448 | ) | 7,558,085 | |||||||||||||||||||
|
Total provisions, net
|
(987,593 | ) | (367,761 | ) | (113,749 | ) | (69,101 | ) | (21 | ) | – | (1,538,225 | ) | |||||||||||||||
|
Total fees and other services income
|
2,904,683 | 416,801 | 248,952 | 186,209 | 252,151 | (271,365 | ) | 3,737,431 | ||||||||||||||||||||
|
Fees and other services expenses
|
(310,613 | ) | (158,288 | ) | (76,457 | ) | (42,695 | ) | (640 | ) | 14,037 | (574,656 | ) | |||||||||||||||
|
Total other operating income
|
876,023 | 391,848 | 8,029 | 59,255 | 1,120,933 | (1,330,698 | ) | 1,125,390 | ||||||||||||||||||||
|
Total operating expenses
|
(4,232,779 | ) | (1,113,045 | ) | (487,645 | ) | (710,435 | ) | (116,200 | ) | 81,900 | (6,578,204 | ) | |||||||||||||||
|
Total non-operating income (expense), net
|
172,072 | 27,995 | 12,912 | 48,008 | (165,114 | ) | 167,219 | 263,093 | ||||||||||||||||||||
|
Income tax expense
|
(993,489 | ) | (163,069 | ) | (94,633 | ) | (184,555 | ) | (13,279 | ) | – | (1,449,025 | ) | |||||||||||||||
|
Income before non-controlling interest
|
1,890,342 | 1,197,089 | 195,687 | 366,516 | 969,606 | (2,075,354 | ) | 2,543,887 | ||||||||||||||||||||
|
Non-controlling interest
|
(501,720 | ) | (1,544 | ) | (294 | ) | (820 | ) | - | (370,837 | ) | (875,215 | ) | |||||||||||||||
|
Net income attributable to Grupo Aval shareholders
|
Ps. | 1,388,622 | Ps. | 1,195,545 | Ps. | 195,393 | Ps. | 365,696 | Ps. | 969,606 | Ps. | (2,446,191 | ) | Ps. | 1,668,672 | |||||||||||||
|
Loans and financial leases:
|
||||||||||||||||||||||||||||
|
Commercial loans
|
Ps. | 42,837,911 | Ps. | 11,491,102 | Ps. | 2,599,697 | Ps. | 5,853,580 | Ps. | – | Ps. | (17,476 | ) | Ps. | 62,764,814 | |||||||||||||
|
Consumer loans
|
17,863,048 | 5,278,748 | 3,241,921 | 6,782,674 | – | – | 33,166,391 | |||||||||||||||||||||
|
Microcredit loans
|
333,397 | – | 6,232 | 12,152 | – | – | 351,781 | |||||||||||||||||||||
|
Mortgage loans
|
7,411,773 | 134,281 | 1,298,921 | 189,702 | – | – | 9,034,677 | |||||||||||||||||||||
|
Financial leases
|
2,894,356 | 4,325,139 | – | 233,916 | – | (14,998 | ) | 7,438,413 | ||||||||||||||||||||
|
Allowance for loan and financial lease losses
|
(1,855,956 | ) | (796,537 | ) | (316,684 | ) | (444,501 | ) | – | – | (3,413,678 | ) | ||||||||||||||||
|
Total loans and financial leases, net
|
Ps. |
69,484,529
|
Ps. | 20,432,733 | Ps. | 6,830,087 | Ps. | 12,627,523 | Ps. | – | Ps. | (32,474 | ) | Ps. | 109,342,398 | |||||||||||||
|
Total assets
|
Ps. | 118,366,641 | Ps. | 32,531,239 | Ps. | 10,971,038 | Ps. | 17,059,264 | Ps. | 24,533,183 | Ps. | (25,846,688 | ) | Ps. | 177,614,677 | |||||||||||||
|
(*)
|
Includes Grupo Aval Acciones y Valores S.A, Grupo Aval Limited and Grupo Aval International Limited.
|
GRUPO AVAL ACCIONES Y VALORES S.A. AND ITS SUBSIDIARIES
NOTES TO THE CONSOLIDATED FINANCIAL STATEMENTS
FOR THE YEARS ENDED DECEMBER 31, 2014, 2013 AND 2012
(
Stated in millions of Colombian pesos and U.S. dollars)
December 31, 2013
|
Banco de Bogotá
|
Banco de Occidente
|
Banco AV Villas
|
Banco Popular
|
Grupo Aval(*)
|
Eliminations
|
Grupo Aval consolidated
|
||||||||||||||||||||||
|
Total interest income
|
Ps. | 6,225,626 | Ps. | 2,050,649 | Ps. | 946,580 | Ps. | 1,564,896 | Ps. | 112,907 | Ps. | (117,272 | ) | Ps. | 10,783,386 | |||||||||||||
|
Total interest expense
|
(2,242,440 | ) | (722,503 | ) | (223,017 | ) | (458,664 | ) | (278,985 | ) | 123,198 | (3,802,411 | ) | |||||||||||||||
|
Net interest income
|
3,983,186 | 1,328,146 | 723,563 | 1,106,232 | (166,078 | ) | 5,926 | 6,980,975 | ||||||||||||||||||||
|
Total provisions, net
|
(773,870 | ) | (320,898 | ) | (133,334 | ) | (66,101 | ) | – | – | (1,294,202 | ) | ||||||||||||||||
|
Total fees and other services income
|
2,566,476 | 390,061 | 232,319 | 187,389 | 229,492 | (246,105 | ) | 3,359,633 | ||||||||||||||||||||
|
Fees and other services expenses
|
(312,191 | ) | (135,391 | ) | (66,717 | ) | (39,830 | ) | (2,387 | ) | 11,239 | (545,277 | ) | |||||||||||||||
|
Total other operating income
|
1,036,703 | 320,777 | 5,999 | 44,047 | 889,315 | (979,432 | ) | 1,317,408 | ||||||||||||||||||||
|
Total operating expenses
|
(3,780,086 | ) | (1,010,107 | ) | (482,585 | ) | (715,900 | ) | (124,902 | ) | 85,479 | (6,028,102 | ) | |||||||||||||||
|
Total non-operating income (expense), net
|
171,183 | 12,257 | 3,229 | 93,410 | (291,660 | ) | 247,715 | 236,135 | ||||||||||||||||||||
|
Income tax expense
|
(944,895 | ) | (155,453 | ) | (96,351 | ) | (210,638 | ) | (7,351 | ) | - | (1,414,688 | ) | |||||||||||||||
|
Income before non-controlling interest
|
1,946,506 | 429,392 | 186,123 | 398,609 | 526,429 | (875,178 | ) | 2,611,881 | ||||||||||||||||||||
|
Non-controlling interest
|
(546,484 | ) | (1,232 | ) | (10 | ) | (2,329 | ) | – | (461,322 | ) | (1,011,378 | ) | |||||||||||||||
|
Net income attributable to Grupo Aval shareholders
|
Ps. | 1,400,022 | Ps. | 428,160 | Ps. | 186,113 | Ps. | 396,280 | Ps. | 526,429 | Ps. | (1,336,500 | ) | Ps. | 1,600,503 | |||||||||||||
|
Loans and financial leases:
|
||||||||||||||||||||||||||||
|
Commercial loans
|
Ps. | 36,210,691 | Ps. | 10,904,893 | Ps. | 2,554,985 | Ps. | 5,201,936 | Ps. | – | Ps. | (16,925 | ) | Ps. | 54,855,580 | |||||||||||||
|
Consumer loans
|
13,939,798 | 4,327,123 | 3,025,229 | 6,509,124 | – | – | 27,801,275 | |||||||||||||||||||||
|
Microcredit loans
|
316,304 | – | 11,734 | 13,819 | – | – | 341,857 | |||||||||||||||||||||
|
Mortgage loans
|
5,392,061 | 32,138 | 996,041 | 99,879 | – | – | 6,520,119 | |||||||||||||||||||||
|
Financial leases
|
2,362,917 | 4,383,508 | – | 266,036 | – | (17,470 | ) | 6,994,991 | ||||||||||||||||||||
|
Allowance for loan and financial lease losses
|
(1,638,431 | ) | (700,446 | ) | (295,600 | ) | (438,557 | ) | – | – | (3,073,035 | ) | ||||||||||||||||
|
Total loans and financial leases, net
|
Ps. | 56,583,340 | Ps. | 18,947,216 | Ps. | 6,292,389 | Ps. | 11,652,237 | Ps. | – | Ps. | (34,395 | ) | Ps. | 93,440,787 | |||||||||||||
|
Total assets
|
Ps. | 100,669,032 | Ps. | 29,029,803 | Ps. | 9,709,564 | Ps. | 16,711,856 | Ps. | 21,138,055 | Ps. | ( 22,970,918 | ) | Ps. | 154,287,391 | |||||||||||||
|
(*)
|
Includes Grupo Aval Acciones y Valores S.A, Grupo Aval Limited and Grupo Aval International Limited.
|
GRUPO AVAL ACCIONES Y VALORES S.A. AND ITS SUBSIDIARIES
NOTES TO THE CONSOLIDATED FINANCIAL STATEMENTS
FOR THE YEARS ENDED DECEMBER 31, 2014, 2013 AND 2012
(
Stated in millions of Colombian pesos and U.S. dollars)
December 31, 2012
|
Banco de Bogotá
|
Banco de Occidente
|
Banco AV Villas
|
Banco Popular
|
Grupo Aval(*)
|
Eliminations
|
Grupo Aval consolidated
|
||||||||||||||||||||||
|
Total interest income
|
Ps. | 5,698,484 | Ps. | 2,028,635 | Ps. | 868,454 | Ps. | 1,613,226 | Ps. | 81,706 | Ps. | (85,533 | ) | Ps. | 10,204,972 | |||||||||||||
|
Total interest expense
|
( 2,188,833 | ) | (745,460 | ) | (254,159 | ) | (554,889 | ) | (242,684 | ) | 91,353 | (3,894,673 | ) | |||||||||||||||
|
Net interest income
|
3,509,651 | 1,283,175 | 614,295 | 1,058,337 | (160,978 | ) | 5,820 | 6,310,299 | ||||||||||||||||||||
|
Total provisions, net
|
(515,052 | ) | (223,626 | ) | (87,995 | ) | (90,667 | ) | (3 | ) | - | (917,343 | ) | |||||||||||||||
|
Total fees and other services income
|
2,145,629 | 346,450 | 216,529 | 179,989 | 61,829 | (106,264 | ) | 2,844,162 | ||||||||||||||||||||
|
Fees and other services
expenses
|
(261,940 | ) | (117,461 | ) | (57,090 | ) | (34,978 | ) | (750 | ) | 10,077 | (462,142 | ) | |||||||||||||||
|
Total other operating income
|
676,327 | 332,729 | 4,247 | 48,880 | 753,583 | (930,104 | ) | 885,662 | ||||||||||||||||||||
|
Total operating expenses
|
(3,198,640 | ) | (937,248 | ) | (455,730 | ) | (669,169 | ) | (113,457 | ) | 74,725 | (5,299,520 | ) | |||||||||||||||
|
Total non-operating income (expense), net
|
314,943 | 12,938 | 16,228 | 77,065 | (12,292 | ) | 39,186 | 448,068 | ||||||||||||||||||||
|
Income tax expense
|
(919,317 | ) | (174,685 | ) | (77,969 | ) | (187,697 | ) | (12,074 | ) | – | (1,371,739 | ) | |||||||||||||||
|
Income before non-
controlling interest
|
1,751,601 | 522,272 | 172,515 | 381,762 | 515,858 | (906,561 | ) | 2,437,447 | ||||||||||||||||||||
|
Non-controlling interest
|
(425,553 | ) | (1,967 | ) | (206 | ) | (3,846 | ) | – | (479,487 | ) | (911,059 | ) | |||||||||||||||
|
Net income attributable to Grupo Aval shareholders
|
Ps. | 1,326,048 | Ps. | 520,305 | Ps. | 172,309 | Ps. | 377,916 | Ps. | 515,858 | Ps. | (1,386,048 | ) | Ps. | 1,526,388 | |||||||||||||
|
Loans and financial leases:
|
||||||||||||||||||||||||||||
|
Commercial loans
|
Ps. | 28,721,859 | Ps. | 9,487,518 | Ps. | 2,224,030 | Ps. | 5,101,383 | Ps. | – | Ps. | (20,597 | ) | Ps. | 45,514,193 | |||||||||||||
|
Consumer loans
|
10,861,972 | 3,492,456 | 2,808,478 | 6,217,291 | – | – | 23,380,197 | |||||||||||||||||||||
|
Microcredit loans
|
256,989 | – | 18,438 | 15,489 | – | – | 290,916 | |||||||||||||||||||||
|
Mortgage loans
|
3,448,742 | 1,786 | 805,363 | 92,440 | – | – | 4,348,331 | |||||||||||||||||||||
|
Financial leases
|
2,175,186 | 4,016,556 | – | 322,298 | – | (18,323 | ) | 6,495,717 | ||||||||||||||||||||
|
Allowance for loan and financial lease losses
|
(1,252,948 | ) | (611,343 | ) | (251,205 | ) | (430,069 | ) | – | – | (2,545,564 | ) | ||||||||||||||||
|
Total loans and financial leases, net
|
Ps. | 44,211,802 | Ps. | 16,386,973 | Ps. | 5,605,104 | Ps. | 11,318,832 | Ps. | – | Ps. | (38,920 | ) | Ps. | 77,483,790 | |||||||||||||
|
Total assets
|
Ps. | 80,506,449 | Ps. | 24,837,389 | Ps. | 8,920,405 | Ps. | 15,128,585 | Ps. | 16,842,601 | Ps. | (18,572,471 | ) | Ps. | 127,662,958 | |||||||||||||
|
(*)
|
Relates to Grupo Aval Acciones y Valores S.A. stand alone.
|
The following summarizes the Grupo Aval’s revenues and long-lived assets attributable to Colombia and other foreign countries:
|
2014
|
2013
|
2012
|
|||||||||||||||||||||||
|
Revenues
|
Long-term assets (1)
|
Revenues
|
Long-term assets (1)
|
Revenues
|
Long-term assets (1)
|
||||||||||||||||||||
|
Geographic Information
|
|||||||||||||||||||||||||
|
Colombia
|
Ps. | 13,107,321 | Ps. | 1,680,703 | Ps. | 12,731,679 | Ps. | 1,637,608 | Ps. | 12,105,326 | Ps. | 1,546,578 | |||||||||||||
|
Central America and Caribbean
|
4,409,261 | 729,422 | 3,355,500 | 516,437 | 2,629,713 | 340,349 | |||||||||||||||||||
|
Total, net
|
Ps. | 17,516,582 | Ps. | 2,410,125 | Ps. | 16,086,979 | Ps. | 2,154,045 | Ps. | 14,735,040 | Ps. | 1,886,927 | |||||||||||||
|
(1)
|
Includes foreclosed assets, net, and property, plant and equipment, net.
|
GRUPO AVAL ACCIONES Y VALORES S.A. AND ITS SUBSIDIARIES
NOTES TO THE CONSOLIDATED FINANCIAL STATEMENTS
FOR THE YEARS ENDED DECEMBER 31, 2014, 2013 AND 2012
(
Stated in millions of Colombian pesos and U.S. dollars)
|
a)
|
Recent U.S. GAAP pronouncements.
|
In January 2015, FASB issued ASU 2015-01, “Income Statement—Extraordinary and Unusual Items” to simplify the income statement presentation requirements in Subtopic 225-20 by eliminating the concept of extraordinary items. Extraordinary items are events and transactions that are distinguished by their unusual nature and by the infrequency of their occurrence. Eliminating the extraordinary classification simplifies income statement presentation by altogether removing the concept of extraordinary items from consideration. The amendments in this Update are effective for fiscal years, and interim periods within those fiscal years, beginning after December 15, 2015. A reporting entity may apply the amendments prospectively. A reporting entity also may apply the amendments retrospectively to all prior periods presented in the financial statements. Early adoption is permitted provided that the guidance is applied from the beginning of the fiscal year of adoption.
In February 2015, the FASB issued ASU No. 2015-02, Consolidation (Topic 810). The Board is issued the amendments in this Update to respond to stakeholders concerns about the current accounting for consolidation of certain legal entities. Current generally accepted accounting principles (GAAP) might require a reporting entity to consolidate another legal entity in situations in which the reporting entity’s contractual rights do not give it the ability to act primarily on its own behalf, the reporting entity does not hold a majority of the legal entity’s voting rights, or the reporting entity is not exposed to a majority of the legal entity’s economic benefits or obligations. The amendments in this Update affect reporting entities that are required to evaluate whether they should consolidate certain legal entities. All legal entities are subject to reevaluation under the revised consolidation model. Specifically, the amendments:
|
1.
|
Modify the evaluation of whether limited partnerships and similar legal entities are variable interest entities (VIEs) or voting interest entities
|
|
2.
|
Eliminate the presumption that a general partner should consolidate a limited partnership
|
|
3.
|
Affect the consolidation analysis of reporting entities that are involved with VIEs, particularly those that have fee arrangements and related party relationships
|
|
4.
|
Provide a scope exception from consolidation guidance for reporting entities with interests in legal entities that are required to comply with or operate in accordance with requirements that are similar to those in Rule 2a-7 of the Investment Company Act of 1940 for registered money market funds.
|
This Update are effective for public business entities for fiscal years, and for interim periods within those fiscal years, beginning after December 15, 2015. We are currently evaluating the impact of ASU No. 2015-02 on our consolidated financial condition and results of operations.
In November 2014, FASB issued ASU 2014-17,
“Pushdown Accounting a consensus of the FASB Emerging Issues Task Force”
to provide guidance for determining whether and at what threshold pushdown accounting should be established in an acquired entity’s separate financial statements. According to ASU 2014-16, an acquired entity may elect the option to apply pushdown accounting in the reporting period in which the change-in-control event occurs. An acquired entity should determine whether to elect to apply pushdown accounting for each individual change-in-control event in which an acquirer obtains control of the acquired entity. If pushdown accounting is not applied in the reporting period in which the change-in-control event occurs, an acquired entity will have the option to elect to apply pushdown accounting in a subsequent reporting period to the acquired entity’s most recent change-in-control event. The amendments in this Update are effective on November 18, 2014.
In August 2014, FASB issued ASU 2014-15,
“Presentation of Financial Statements-Going Concern: Disclosure of Uncertainties about an Entity’s Ability to Continue as a Going Concern”
to provide guidance about management’s responsibility to evaluate whether there are conditions or events, considered in the aggregate, that raise substantial doubt about the entity’s ability to continue as a going concern within one year after the date that the financial statements are issued. The amendments require management to assess an entity’s ability to continue as a going concern by incorporating and expanding upon certain principles that are currently in U.S. auditing standards. Specifically, the amendments (1) provide a definition of the term substantial doubt, (2) require an evaluation every reporting period including interim periods,
GRUPO AVAL ACCIONES Y VALORES S.A. AND ITS SUBSIDIARIES
NOTES TO THE CONSOLIDATED FINANCIAL STATEMENTS
FOR THE YEARS ENDED DECEMBER 31, 2014, 2013 AND 2012
(
Stated in millions of Colombian pesos and U.S. dollars)
(3) provide principles for considering the mitigating effect of management’s plans, (4) require certain disclosures when substantial doubt is alleviated as a result of consideration of management’s plans, (5) require an express statement and other disclosures when substantial doubt is not alleviated, and (6) require an assessment for a period of one year after the date that the financial statements are issued (or available to be issued). The amendments in this Update are effective for the annual period ending after December 15, 2016, and for annual periods and interim periods thereafter. Early application is permitted.
In June 2014, FASB issued ASU 2014-11,
“Transfers and Servicing: Repurchase-to-Maturity Transactions, Repurchase Financings, and Disclosures”
to provide guidance in the accounting of the different types of repurchase agreements, specifically for Repurchase-to-maturity transactions and repurchase financing secured borrowing accounting, which is consistent with the accounting of other repurchase agreements. Formerly, repurchase-to-maturity transactions (repurchase agreements that mature at the same time as the transferred financial asset) were generally accounted for as a sale and a forward repurchase agreement when they are not considered to maintain the transferor’s effective control and they satisfied the other conditions for derecognition. According with the amendments in this update, repurchase-to-maturity transactions must be accounted for as secured borrowings.
On the other hand, a repurchase financing executed contemporaneously with an initial transfer with the same counterparty generally was accounted for as a derivative if the two transactions were required to be linked in their accounting. The amendments in this update require the repurchase agreement be accounted for as a secured borrowing separately from the initial transfer of the financial asset, that is accounted for as a sale.
Besides, the amendments require two additional disclosures about transfers accounted for as sales in transactions that are economically similar to repurchase agreements, and the type of collateral pledged in repurchase agreements and similar transactions accounted for as secured borrowings. The accounting changes in this Update are effective for public business entities for the first interim or annual period beginning after December 15, 2014. Management does not expect any significant impact concerning the amendments introduced by ASU 2014-11 on the Bank’s financial statement and U.S. GAAP disclosures.
In January 2014, FASB issued ASU 2014-04,
“Receivables—Troubled Debt Restructurings by Creditors: Reclassification of Residential Real Estate Collateralized Consumer Mortgage Loans upon Foreclosure”
to clarify when an in substance repossession or foreclosure occurs, that is, when a creditor should be considered to have received physical possession of residential real estate property collateralizing a consumer mortgage loan such that the loan receivable should be derecognized and the real estate property recognized. According to new guidance physical possession has been received upon either: (1) the creditor obtaining legal title to the residential real estate property upon completion of a foreclosure or (2) the borrower conveying all interest in the residential real estate property to the creditor to satisfy that loan through completion of a deed in lieu of foreclosure or through a similar legal agreement. Additionally, the amendments require interim and annual disclosure of both (1) the amount of foreclosed residential real estate property held by the creditor and (2) the recorded investment in consumer mortgage loans collateralized by residential real estate property that are in the process of foreclosure according to local requirements of the applicable jurisdiction. Those amendments are effective for public business entities for annual periods, and interim periods within those annual periods, beginning after December 15, 2014.
|
b)
|
Other accounting matters:
|
In 2009, the Colombian Congress passed Law 1314 and in 2012, the Colombian government enacted Decree 2784 which established the implementation of IFRS in Colombia (IFRS-Col), including certain waivers related to investments and equity tax. Colombian authorities have proposed a schedule for the implementation of IFRS-Col in which Colombian issuers of securities in the public market (such as Grupo Aval) shall (i) prepare an opening transition balance sheet beginning on January 1, 2014 in accordance with IFRS-Col, and (ii) prepare financial statements in compliance with IFRS-Col no later than December 31, 2015 comparative with December 31, 2014 and for the years then ended.
F-157
GRUPO AVAL ACCIONES Y VALORES S.A. AND ITS SUBSIDIARIES
NOTES TO THE CONSOLIDATED FINANCIAL STATEMENTS
FOR THE YEARS ENDED DECEMBER 31, 2014, 2013 AND 2012
(
Stated in millions of Colombian pesos and U.S. dollars)
Considering the above and current SEC regulations, and assuming that Grupo Aval will be required to comply with IFRS-Col, as the basis of presentation, Grupo Aval still will be required to include a reconciliation note of equity and income under U.S. GAAP in its annual consolidated financial statements.
Through Decrees 1851 of August 29, 2013 and 2267 of November 11, 2014, the Colombian government decided to implement a partial application of IFRS with respect to the separate (unconsolidated) financial statements of financial entities and IFRS-Col application in the case of the consolidated financial statements of these entities. Considering that Grupo Aval will be subject to implementation of IFRS-Col, its consolidated financial statements will have to include homogenization adjustments in its consolidation process.
Even though there are certain similarities between IFRS-Col and U.S. GAAP, adoption of IFRS-Col may have an effect on, for example, our accounting for the following items of our consolidated financial statements on January 1, 2014 and thereafter: (i) loan loss reserves, (ii) business combinations, (iii) valuation of securities, (iv) calculation of employee benefit liabilities, (v) consolidation of structured entities, (vi) deferred taxes, (vii) calculation and presentation of equity regarding non-controlling interest (viii) loan origination fees, and (ix) increased disclosures on our financial statements.
F-158
TABLE OF CONTENTS
Part IItem 1. Identity Of Directors, Senior Management and AdvisersItem 2. Offer Statistics and Expected TimetableItem 3. Key InformationItem 4. Information on The CompanyItem 4A. Unresolved Staff CommentsItem 5. Operating and Financial Review and ProspectsItem 6. Directors, Senior Management and EmployeesItem 7. Major Shareholders and Related Party TransactionsItem 8. Financial InformationItem 9. The Offer and ListingItem 10. Additional InformationItem 11. Quantitative and Qualitative Disclosures About RiskItem 12. Description Of Securities Other Than Equity SecuritiesPart IIItem 13. Defaults, Dividend Arrearages and DelinquenciesItem 14. Material Modifications To The Rights Of Security Holders and Use Of ProceedsItem 15. Controls and ProceduresItem 16. [reserved]Item 16A. Audit Committee Financial ExpertItem 16B. Code Of EthicsItem 16C. Principal Accountant Fees and ServicesItem 16D. Exemptions From The Listing Standards For Audit CommitteesItem 16E. Purchases Of Equity Securities By The Issuer and Affiliated PurchasersItem 16F. Change in Registrant S Certifying AccountantItem 16G. Corporate GovernanceItem 16H. Mine Safety DisclosurePart IIIItem 17. Financial StatementsItem 18. Financial StatementsItem 19. Exhibits