AVIAT NETWORKS, INC.
10-Ks and 10-Qs
|
|
|
|
|
|
|
|
|
|
|
|
|
|
|
|
|
|
|
|
|
|
|
|
|
|
|
|
|
|
|
|
|
|
|
|
|
|
|
|
|
|
|
|
|
|
|
|
|
|
|
|
|
|
|
|
|
|
|
|
|
|
UNITED STATES
SECURITIES AND EXCHANGE COMMISSION
Washington, D.C. 20549
________________________________
Form 10-K
(Mark One)
|
x
|
ANNUAL REPORT PURSUANT TO SECTION 13 OR 15(d) OF THE SECURITIES EXCHANGE ACT OF 1934
|
For the fiscal year ended
June 28, 2013
or
|
¨
|
TRANSITION REPORT PURSUANT TO SECTION 13 OR 15(d) OF THE SECURITIES EXCHANGE ACT OF 1934
|
Commission File Number 001-33278
______________________________
AVIAT NETWORKS, INC.
(Exact name of registrant as specified in its charter)
|
Delaware
|
|
20-5961564
|
|
(State or other jurisdiction of
incorporation or organization)
|
|
(I.R.S. Employer
Identification No.)
|
|
5200 Great America Parkway
Santa Clara, California
|
|
95054
|
|
(Address of principal executive offices)
|
|
(Zip Code)
|
Registrant’s telephone number, including area code: (408) 567-7000
Securities registered pursuant to Section 12(b) of the Act:
|
Title of Each Class
|
|
Name of Each Exchange on Which Registered
|
|
Common Stock, par value $0.01 per share
|
|
NASDAQ Stock Market LLC
(NASDAQ Global Select Market)
|
Securities registered pursuant to Section 12(g) of the Act: None
_____________________________________________
Indicate by check mark if the registrant is a well-known seasoned issuer, as defined in Rule 405 of the Securities Act. Yes
o
No
x
Indicate by check mark if the registrant is not required to file reports pursuant to Section 13 or Section 15(d) of the Act. Yes
o
No
x
Indicate by check mark whether the registrant (1) has filed all reports required to be filed by Section 13 or 15(d) of the Securities Exchange Act of 1934 during the preceding 12 months (or for such shorter period that the registrant was required to file such reports), and (2) has been subject to such filing requirements for the past 90 days. Yes
x
No
o
Indicate by check mark whether the registrant has submitted electronically and posted on its corporate Web site, if any, every Interactive Data File required to be submitted and posted pursuant to Rule 405 of Regulation S-T (§232.405 of this chapter) during the preceding 12 months (or for such shorter period that the registrant was required to submit and post such files). Yes
x
No
o
Indicate by check mark if disclosure of delinquent filers pursuant to Item 405 of Regulation S-K (§229.405 of this chapter) is not contained herein, and will not be contained, to the best of registrant’s knowledge, in definitive proxy statements incorporated by reference in Part III of this Form 10-K or any amendment to this Form 10-K.
x
Indicate by check mark whether the registrant is a large accelerated filer, an accelerated filer, a non-accelerated filer, or a smaller reporting company. See the definitions of “large accelerated filer,” “accelerated filer” and “smaller reporting company” in Rule 12b-2 of the Exchange Act. (Check one):
|
Large accelerated filer
|
o
|
|
Accelerated filer
|
x
|
|
Non-accelerated filer
|
o
(Do not check if a smaller reporting company)
|
|
Smaller reporting company
|
o
|
Indicate by check mark whether the registrant is a shell company (as defined in Rule 12b-2 of the Exchange Act). Yes
o
No
x
As of
December 28, 2012
(the last business day of the registrant’s most recently completed second fiscal quarter), the aggregate market value of the registrant’s common stock held by non-affiliates was approximately
$134,617,046
based upon the closing price per share on the NASDAQ Global Select Market. For purposes of this calculation, the registrant has assumed that its directors and executive officers as of
December 28, 2012
are affiliates.
The number of shares outstanding of the registrant’s common stock as of
August 30, 2013
was
62,377,639
shares.
_________________________________
DOCUMENTS INCORPORATED BY REFERENCE
Portions of the registrant’s definitive Proxy Statement for its Annual Meeting of Stockholders, which will be filed with the Securities and Exchange Commission within 120 days after the end of the registrant’s fiscal year ended
June 28, 2013
, are incorporated by reference into Part III of this Annual Report on Form 10-K.
AVIAT NETWORKS, INC.
ANNUAL REPORT ON FORM 10-K
For the Fiscal Year Ended
June 28, 2013
Table of Contents
|
Item 1.
|
||
|
Item 1A.
|
||
|
Item 1B.
|
||
|
Item 2.
|
||
|
Item 3.
|
||
|
Item 4.
|
||
|
Item 5.
|
||
|
Item 6.
|
||
|
Item 7.
|
||
|
Item 7A.
|
||
|
Item 8.
|
||
|
Item 9.
|
||
|
Item 9A.
|
||
|
Item 9B.
|
||
|
Item 10.
|
||
|
Item 11.
|
||
|
Item 12.
|
||
|
Item 13.
|
||
|
Item 14.
|
||
|
Item 15.
|
||
2
CAUTIONARY STATEMENT REGARDING FORWARD-LOOKING STATEMENTS
This Annual Report on Form 10-K, including “Item 7. Management’s Discussion and Analysis of Financial Condition and Results of Operations,” contains forward-looking statements that involve risks and uncertainties, as well as assumptions that, if they do not materialize or prove correct, could cause our results to differ materially from those expressed or implied by such forward-looking statements. All statements other than statements of historical fact are statements that could be deemed forward-looking statements, including statements of, about, concerning or regarding: our plans, strategies and objectives for future operations; our research and development efforts and new product releases and services; trends in revenue; drivers of our business and the markets in which we operate; future economic conditions; performance or outlook and changes in our industry and the markets we serve; the outcome of contingencies; the value of our contract awards; beliefs or expectations; the sufficiency of our cash and our capital needs and expenditures; our intellectual property protection; our compliance with regulatory requirements and the associated expenses; expectations regarding litigation; our intention not to pay cash dividends; the seasonality of our business; the impact of foreign exchange and inflation; taxes; our ongoing business restructuring efforts; and assumptions underlying any of the foregoing. Forward-looking statements may be identified by the use of forward-looking terminology, such as “anticipates,” “believes,” “expects,” “may,” “should,” “would,” “will,” “intends,” “plans,” “estimates,” “strategy,” “projects,” “targets,” “goals,” “seeing,” “delivering,” “continues,” “forecasts,” “future,” “predict,” “might,” “could,” “potential,” or the negative of these terms, and similar words or expressions.
These forward-looking statements are based on estimates reflecting the current beliefs of the senior management of Aviat Networks. These forward-looking statements involve a number of risks and uncertainties that could cause actual results to differ materially from those suggested by the forward-looking statements. Forward-looking statements should therefore be considered in light of various important factors, including those set forth in this Annual Report on Form 10-K. Important factors that could cause actual results to differ materially from estimates or projections contained in the forward-looking statements include the following:
|
•
|
continued price erosion as a result of increased competition in the microwave transmission industry;
|
|
•
|
the impact of the volume, timing and customer, product and geographic mix of our product orders;
|
|
•
|
our ability to meet projected new product development dates or anticipated cost reductions of new products;
|
|
•
|
our suppliers’ inability to perform and deliver on time as a result of their financial condition, component shortages or other supply chain constraints;
|
|
•
|
customer acceptance of new products;
|
|
•
|
the ability of our subcontractors to timely perform;
|
|
•
|
continued weakness in the global economy affecting customer spending;
|
|
•
|
retention of our key personnel;
|
|
•
|
our ability to manage and maintain key customer relationships;
|
|
•
|
uncertain economic conditions in the telecommunications sector combined with operator and supplier consolidation;
|
|
•
|
the timing of our receipt of payment for products or services from our customers;
|
|
•
|
our failure to protect our intellectual property rights or defend against intellectual property infringement claims by others;
|
|
•
|
the effects of currency and interest rate risks;
|
|
•
|
the impact of political turmoil in countries where we have significant business; and
|
|
•
|
the timing and size of future restructuring plans and write-offs.
|
Other factors besides those listed here also could adversely affect us. See “Item 1A. Risk Factors” in this Annual Report on Form 10-K for more information regarding factors that may cause our results to differ materially from those expressed or implied by the forward-looking statements contained in this Annual Report on Form 10-K.
You should not place undue reliance on these forward-looking statements, which reflect our management’s opinions only as of the date of the filing of this Annual Report on Form 10-K. Forward-looking statements are made in reliance upon the safe harbor provisions of Section 27A of the Securities Act of 1933, as amended, and Section 21E of the Securities Exchange Act of 1934, as amended, along with provisions of the Private Securities Litigation Reform Act of 1995, and we undertake no obligation, other than as imposed by law, to update any forward-looking statements to reflect further developments or information obtained after the date of filing of this Annual Report on Form 10-K or, in the case of any document incorporated by reference, the date of that document.
3
Item 1.
Business
Aviat Networks, Inc., together with its subsidiaries, is a global supplier of microwave networking solutions, backed by an extensive suite of professional services and support. Aviat Networks, Inc. may be referred to as “the Company,” “AVNW,” “Aviat Networks,” “we,” “us” and “our” in this Annual Report on Form 10-K.
We were incorporated in Delaware in 2006 to combine the businesses of Harris Corporation’s Microwave Communications Division (“MCD”) and Stratex Networks, Inc. (“Stratex”). On January 28, 2010, we changed our corporate name from Harris Stratex Networks, Inc. to Aviat Networks, Inc.
Our principal executive offices are located at 5200 Great America Parkway, Santa Clara, California 95054, and our telephone number is (408) 567-7000. Our common stock is listed on the NASDAQ Global Select Market under the symbol AVNW. As of
June 28, 2013
, we employed approximately
1,000
people, compared with approximately
980
people as of
June 29, 2012
.
Overview and Description of the Business
We design, manufacture and sell a range of wireless networking products, solutions and services to mobile and fixed operators, private network operators, government agencies, transportation and utility companies, public safety agencies and broadcast network operators around the world. We sell products and services directly to our customers and also use agents and distributors.
Our products include point-to-point (“PTP”) digital microwave transmission systems designed for first/last mile access, middle mile/backhaul and long distance trunking applications. We also provide network management solutions to enable our customers to deploy, monitor and manage our systems; third party equipment such as antennas, routers, multiplexers, etc, necessary to build and deploy a complete wireless network; and a full suite of turnkey support services.
Our wireless systems deliver regional and country-wide backbone in developing nations, where microwave radio installations provide 21st-century communications rapidly and economically. Rural communities, areas with rugged terrain and regions with extreme temperatures benefit from the ability to build an advanced, affordable communications infrastructure despite these challenges. A significant part of our international business consists of supplying wireless segments in small-pocket, remote, rural and metropolitan areas. High-capacity backhaul is one of the fastest growing wireless market segments and is a major opportunity for us. We see the increase in subscriber density and the forecasted growth and introduction of new bandwidth-hungry High Speed Packet Access (“HSPA”)/Long Term Evolution (“LTE”) mobile broadband services as major drivers for growth in this market.
Revenue from our North America and international regions represented approximately
38%
and
62%
, respectively, of our revenue in fiscal
2013
,
37%
and
63%
, respectively, of our revenue in fiscal
2012
, and
35%
and
65%
, respectively, of our revenue in fiscal
2011
. Information about our revenue attributable to our geographic regions is set forth in “Item 7. Management’s Discussion and Analysis of Financial Condition and Results of Operations” and in Note 12 of the accompanying consolidated financial statements in this Annual Report on Form 10-K.
Market Overview
Wireless transmission networks currently are constructed using microwave radios and other equipment to interconnect cell sites, switching systems, wireline transmission systems and other fixed access facilities. Wireless transmission networks range in size from a single transmission link connecting two buildings to complex networks consisting of thousands of wireless links. The architecture of a network is influenced by several factors, including the available radio frequency spectrum, coordination of frequencies with existing infrastructure, application requirements, environmental factors and local geography.
In recent years, there has been an increase in capital spending in the wireless telecommunications industry. In addition, the overall demand for high-speed wireless transmission products has been growing at a higher rate than the wireless industry as a whole. We believe that this growth in capital spending and demand is directly related to a growing global subscriber base for mobile wireless communications services, emergence of new high capacity mobile devices and data-intensive applications and need for new services delivered from next-generation networks capable of delivering broadband services. We see a variety of factors that drive demand for infrastructure investment and especially in microwave backhaul:
4
|
•
|
Expanding mobile coverage.
Mobile operators around the world are continually being challenged to meet the needs of a growing mobile subscriber base flooded by the tremendous growth of broadband applications and devices. They are installing more cell sites to expand geographic coverage and to fill in spots where user coverage is insufficient.
|
|
•
|
Upgrading mobile backhaul.
Many mobile operators are modernizing their mobile radio access networks (“RANs”) with either 3G (HSPA) or 4G (HSPA+ and LTE) technologies. Mobile backhaul networks will also be upgraded with the RAN moving from T1/E1 copper to fiber or microwave to deliver higher user bandwidth.
|
|
•
|
Increasing backhaul capacity:
With RAN upgrades, operators are increasing cell site backhaul capacity from a typical 8 Mbps (4 E1/T1) at an edge site to over 40 Mbps. At hubs or aggregation sites, where traffic from multiple edge sites is combined, backhaul capacity may need to be as high as 2 Gbps.
|
|
•
|
Deploying small cells backhaul.
More and more mobile operators are experiencing a capacity crunch. Outdoor small cells are gaining momentum as one of the best ways to remedy this issue. Industry analysts forecast the main deployment of small cells will start in 2014-2015, and that microwave will be one of the preferred solutions for small cells backhaul to be widely used by mobile operators.
|
|
•
|
Meeting government requirements.
In some countries, governments require that service providers deploy 4G in underserved, rural areas as a condition of obtaining an LTE spectrum license.
|
|
•
|
Using microwave in other vertical markets.
In addition to mobile backhaul, we see increasing demand for microwave technology in other vertical markets, including utility, public safety, financial institution and broadcast.
|
|
◦
|
Many utility companies around the world are actively investing in Smart Grid solutions and energy demand management, which drive the need for network modernization and increased capacity of networks.
|
|
◦
|
In the public safety vertical market, whether it is for improving border patrol or emergency services for local or state police, access to timely information or enhanced communications is critical. Mobile video and access to centralized data servers at the scene of an incident requires a high bandwidth network. Such demands drive the need for new generation microwave radios with high reliability, high performance, maximum system redundancy and strong security.
|
|
◦
|
New opportunities have emerged in some other niche markets in non-mobile sectors as well, such as the low latency application for high frequency trading in financial industry, for which demand has been growing at a higher rate than the wireless industry, as a whole. With lower latency and shorter line of sight distance between transmission sites than fiber, microwave technology has been selected over fiber by more and more financial institutions for such applications. There is also the broadcast market, where terrestrial TV broadcasting is progressively going digital on a global basis and has presented new opportunities for microwave vendors.
|
These factors are combining to create a range of opportunities for continued investment in backhaul and transport networks favoring microwave technology. As we focus on our execution of the future generations of our technology, our goal is to make wireless a viable choice for an ever broadening range of network types.
Strategy
Over the past year, we have made significant strides in transitioning our company to focus on our cost effective core microwave transmission business. We offer and will continue to improve upon our microwave transmission solutions that deliver the network performance needed to support next generation services and enable a smooth transition from legacy networks to all IP.
Newer generation 4G technologies require high-speed packet infrastructures. To address this requirement, we have enhanced our core product offering by building on our market leading Eclipse Packet Node platform by adding new features and capacity enhancements and leveraging technology in third party products to provide a complete IP network solution. We have also introduced a new line of all-outdoor, all-IP microwave radio solutions under the Aviat WTM 3000 product family that addresses the need for “zero-footprint” wireless transport solutions for mobile and private network applications, in areas where customers do not have space to install equipment indoors.
We look to retain our position as a wireless transmission technology leader with the introduction of
our new CTR 8000 family of products in 2014. The CTR is a transformational microwave product line since it has a router integrated in the hardware and software. This new architecture will enable
our customers to create a fully evolved IP transport network. The CTR builds upon our
5
Eclipse Packet Node platform, enabling re-use of already deployed assets, to provide a smooth migration path for our existing customers, for the lowest risk, lowest cost, and most flexible solution available. Built from the ground up as an IP/MPLS microwave networking platform, Aviat's CTR 8000 delivers higher microwave capacity and new networking capabilities, which will enable Aviat to improve its cost structure, and stay well ahead of our competition in existing mobile operator accounts.
Our strategy includes partnering with companies with technical expertise in areas outside of our core competencies to meet our customers' demand for an end-to-end solution. Our partner product strategy enables us to go beyond wireless transmission to combat the vendor consolidation trend whereby customers are “buying more from fewer vendors” and in doing so providing expanding market share opportunity. A comprehensive solutions portfolio comprised of our wireless product and intelligent partner products can allow us to compete with vendors that offer turnkey solution portfolios and serve to focus our research and development (“R&D”) efforts on core competency wireless innovations. Having a broader portfolio will enable us to further differentiate our offerings from other independent microwave equipment suppliers.
We expect to continue to serve and expand upon our existing customer base and develop business with new customers. We have sold more than 1,000,000 microwave radios in over 140 countries and are present in more than 350 mobile networks worldwide. We intend to leverage our customer base, our longstanding presence in many countries, our distribution channels, our comprehensive product line, our superior customer service and our turnkey solution capability to continue to sell existing and new products and services to current and future customers.
Products and Solutions
We offer a comprehensive product and solutions portfolio that meets the needs of service providers and network operators in every region of the world and addresses a broad range of applications, frequencies, capacities and network topologies. Our product categories include point-to-point microwave radios that are licensed (subject to local frequency regulatory requirements), lightly-licensed and license-exempt (operating in license-exempt frequencies), and element and network management software. In addition, we provide end-to-end turnkey broadband telecommunications systems, including complete design, deployment, maintenance, and managed network services, while being an attentive and adaptable partner for our customers — a key competitive differentiator for us.
|
•
|
Broad product and solution portfolio.
We offer a comprehensive suite of wireless transmission networking systems for microwave and millimeter-wave networking applications. Our solution consists of tailored offerings of our own wireless products and our own integrated ancillary equipment or that of other manufacturers and providers of element and network management systems and professional services. These solutions address a wide range of transmission frequencies, ranging from 2.4 MHz to 90 GHz, and a wide range of transmission capacities, ranging up to 4 Gbps and beyond. The major product families included in these solutions are CTR Aviat CTR 8000, Aviat Eclipse, Aviat WTM 3000, Aviat WTM 6000 and Aviat ProVision, our network management software.
|
|
•
|
Low total cost of ownership.
Our wireless-based solutions offer a relatively low total cost of ownership, including savings on the combined costs of initial acquisition, installation and ongoing operation and maintenance. Our latest generation system designs reduce rack space requirements, require less power, are software-configurable to reduce spare parts requirements, and are simple to install, operate, upgrade and maintain. Our advanced wireless features can also enable operators to save on related costs, including spectrum fees and tower rental fees.
|
|
•
|
Futureproof network.
Our solutions are designed to protect the network operator’s investment by incorporating software-configurable capacity upgrades and plug-in modules that provide a smooth migration path to Carrier Ethernet and IP/MPLS-based networking, without the need for costly equipment substitutions and additions. Our products include key technologies we believe will be needed by operators for their network evolution to support new broadband services.
|
|
•
|
Flexible, easily configurable products.
We use flexible architectures with a high level of software configurable features. This design approach produces high-performance products with reusable components while at the same time allowing for a manufacturing strategy with a high degree of flexibility, improved cost and reduced time-to-market. The software features of our products offer our customers a greater degree of flexibility in installing, operating and maintaining their networks.
|
|
•
|
Comprehensive network management.
We offer a range of flexible network management solutions, from element management to enterprise-wide network management and service assurance that we can optimize to work with our wireless systems.
|
|
•
|
Complete professional services.
In addition to our product offerings, we provide network planning and design, site surveys and builds, systems integration, installation, maintenance, network monitoring, training, customer service
|
6
and many other professional services. Our services cover the entire evaluation, purchase, deployment and operational cycle and enable us to be one of the few complete turnkey solution providers in the industry.
Business Operations
Sales and Service
We believe that a direct and continuing relationship with service providers is a competitive advantage in attracting new customers and satisfying existing ones. As a result, we offer our products and services through our own direct sales, service and support organization, which allows us to closely monitor the needs of our customers. We have offices in Canada and the United States in North America; Brazil, Argentina and Mexico in Central and South America; Slovenia, Poland, France, Austria, Amsterdam and the United Kingdom in Europe; Nigeria, Kenya, Ivory Coast, Algeria and South Africa in Africa; the United Arab Emirates, Saudi Arabia and Lebanon in the Middle East; and Australia, Bangladesh, India, New Zealand, Indonesia, China, Malaysia, the Philippines, Singapore and Thailand in the Asia Pacific region. Our local offices provide us with a better understanding of our customers’ needs and enable us to respond to local issues and unique local requirements.
We also have informal, and in some cases formal, relationships with original equipment manufacturers (“OEMs”) and system integrators. Such relationships increase our ability to pursue a limited number of major contract awards each year. In addition, such relationships provide our customers with easier access to financing and integrated system providers with a variety of equipment and service capabilities. In selected countries, we also market our products through independent agents and distributors, as well as through system integrators.
We use indirect sales channels, including dealers, distributors and sales representatives, in the marketing and sale of some lines of products and equipment on a global basis. These independent representatives may buy for resale or, in some cases, solicit orders from commercial or governmental customers for direct sales by us. Prices to the ultimate customer in many instances may be recommended or established by the independent representative and may be above or below our list prices. These independent representatives generally receive a discount from our list prices and are free to set the final sales prices paid by the customer.
We have repair and service centers in India, Nigeria, Ghana, Brazil, Mexico, the Philippines, the United Kingdom and the United States. We have customer service and support personnel who provide customers with training, installation, technical support, maintenance and other services on systems under contract. We install and maintain customer equipment directly in some cases and contract with third-party service providers in other cases, depending on the equipment being installed and customer requirements.
The specific terms and conditions of our product warranties vary depending upon the product sold and country in which we do business. On direct sales, warranty periods generally start on the delivery date and continue for one to two years.
Manufacturing
Our global manufacturing strategy is an entirely outsourced manufacturing model using multiple contract manufacturers in both the United States and Asia locations. Our strategy is to use a select number of contract manufacturers for all products. We continue to perform our system integration and customer acceptance and testing in an Aviat Networks facility co-located with one of our contract manufacturers in the United States.
In accordance with our global logistics requirements and customer geographic distribution, we are engaged with contract manufacturing partners in Asia and the United States. All manufacturing operations have been certified to International Standards Organization 9001, a recognized international quality standard. We have also been certified to the TL 9000 standard, a telecommunication industry-specific quality system standard.
Backlog
Our backlog by geographic region is as follows:
|
June 28, 2013
|
June 29, 2012
|
||||||
|
|
(In millions)
|
||||||
|
North America
|
$
|
89.8
|
|
$
|
93.9
|
|
|
|
International
|
89.2
|
|
114.6
|
|
|||
|
Total backlog
|
$
|
179.0
|
|
$
|
208.5
|
|
|
7
Backlog for our products generally consists of contracts or purchase orders for both product deliveries scheduled within the next 12 months and extended service warranty. We regularly review our backlog to ensure that our customers continue to honor their purchase commitments and have the financial means to purchase and deploy our products and services in accordance with the terms of their purchase contracts.
We expect to substantially fill the entire backlog as of
June 28, 2013
during fiscal 2014, but we cannot be assured that this will occur. Product orders in our current backlog are subject to changes in delivery schedules or to cancellation at the option of the purchaser without significant penalty. Accordingly, although useful for scheduling production, backlog as of any particular date may not be a reliable measure of sales for any future period because of the timing of orders, delivery intervals, customer and product mix and the possibility of changes in delivery schedules and additions or cancellations of orders. The backlog figures exclude advance payments and unearned income amounts. As of
June 28, 2013
, the Mobile Telephone Networks Group (“MTN Group”) in Africa accounted for 17% of our total backlog and no other customers accounted for 10% or more of our total backlog.
Customers
Principal customers for our products and services include domestic and international wireless/mobile service providers, OEMs, and private network users such as public safety agencies, government institutions, and utility, pipeline, railroad and other industrial enterprises that operate wireless networks.
During fiscal
2013
, the MTN Group in Africa accounted for
25%
of our total revenue compared with
17%
in fiscal
2012
and
14%
in fiscal
2011
. We have entered into separate and distinct contracts with MTN Group as well as separate arrangements with MTN Group subsidiaries. During fiscal 2013, revenue from Verizon Wireless accounted for
11%
of our total revenue. The loss of all or a substantial portion of MTN Group's business or of Verizon Wireless' business could adversely affect our results of operations, cash flows and financial position.
Although we have a large customer base, during any given fiscal year or quarter a small number of customers may account for a significant portion of our revenue. In certain circumstances, we sell our products to service providers through OEMs, which provide the service providers with access to financing and in some instances, protection from fluctuations in international currency exchange rates.
Competition
The wireless access, backhaul and interconnection business is a specialized segment of the wireless telecommunications industry that is sensitive to technological advancements and is extremely competitive. Some of our competitors have more extensive engineering, manufacturing and marketing capabilities and greater financial, technical and personnel resources than us. Many of our competitors may have greater name recognition, broader product lines (some including non-wireless telecommunications equipment and managed services), a larger installed base of products and longer-standing customer relationships. In addition, some competitors offer seller financing, which is a competitive advantage in the current economic environment.
Although successful product and systems development is not necessarily dependent on substantial financial resources, many of our competitors are significantly larger than us and can maintain higher levels of expenditures for research and development. In addition, a portion of our overall market is addressed by large mobile infrastructure providers who bundle microwave radios with other mobile network equipment, such as cellular base stations or switching systems, and offer a full range of services. This part of the market is generally not open to independent microwave suppliers like us.
We also compete with a number of smaller independent private and public specialist companies, who typically leverage new technologies and low-cost models, but usually are not able to offer a complete solution including turnkey services in all regions of the world.
Our principal microwave competitors include large mobile infrastructure manufacturers such as Alcatel-Lucent, Ericsson, NEC, Huawei and ZTE, as well as a number of other smaller public and private microwave specialists companies such as Ceragon, DragonWave, SIAE and Exalt. Some of our competitors are OEMs or systems integrators through which we sometimes distribute and sell products and services to end users.
We concentrate on market opportunities that we believe are compatible with our resources, overall technological capabilities and objectives. Principal competitive factors are cost-effectiveness, product quality and reliability, technological capabilities, service, ability to meet delivery schedules and the effectiveness of dealers in international areas. We believe that the combination of our network and systems engineering support and service, global reach, technological innovation, agility
8
and close collaborative relationships with our customers, are the key competitive strengths for us. However, customers may still make decisions based primarily on factors such as price, financing terms and/or past or existing relationships, where it may be difficult for us to compete effectively or profitably.
Research and Development
We believe that our ability to enhance our current products, develop and introduce new products on a timely basis, maintain technological competitiveness and meet customer requirements is essential to our success. Accordingly, we allocate, and intend to continue to allocate, a significant portion of our resources to research and development efforts in two major product areas: backhaul solutions and network management systems. In addition, we are investing in key innovation that will help separate these products from the competition. The majority of such research and development resources will be used for point-to-point digital microwave radio systems for access, backhaul, trunking and license-exempt applications.
Our research and development expenditures totaled
$39.4 million
, or
8.4%
of revenue in fiscal
2013
,
$36.0 million
, or
8.1%
of revenue in fiscal
2012
, and
$40.5 million
, or
9.0%
of revenue in fiscal
2011
.
Research and development are primarily directed to the development of new products and to building technological capability. We are an industry innovator and intend to continue to focus significant resources on product development in an effort to maintain our competitiveness and support our entry into new markets. We maintain development programs intended to result in new products, such as additions to our WTM3000, Eclipse and new CTR product platforms
.
Our product development teams numbered
235
employees as of
June 28, 2013
, and were located in Santa Clara, California; Wellington, New Zealand; Singapore and Ljubljana, Slovenia.
Raw Materials and Supplies
Because of the range of our products and services, as well as the wide geographic dispersion of our facilities, we use numerous sources for the wide array of raw materials needed for our operations and for our products, such as electronic components, printed circuit boards, metals and plastics. We are dependent upon suppliers and subcontractors for a large number of components and subsystems and upon the ability of our suppliers and subcontractors to adhere to customer or regulatory materials restrictions and meet performance and quality specifications and delivery schedules.
Our strategy for procuring raw material and supplies includes dual sourcing on strategic assemblies and components. In general, we believe this reduces our risk with regard to the potential financial difficulties in our supply base. In some instances, we are dependent upon one or a few sources, either because of the specialized nature of a particular item or because of local content preference requirements pursuant to which we operate on a given project. Examples of sole or limited source categories include metal fabrications and castings, for which we own the tooling and therefore limit our supplier relationships, and MMICs (a type of integrated circuit used in manufacturing microwave radios), which we procure at volume discount from a single source. Our supply chain plan includes mitigation plans for alternative manufacturing sources and identified alternate suppliers.
Although we have been affected by performance issues of some of our suppliers and subcontractors, we have not been materially adversely affected by the inability to obtain raw materials or products. In general, any performance issues causing short-term material shortages are within the normal frequency and impact range experienced by high-tech manufacturing companies. They are due primarily to the highly technical nature of many of our purchased components.
Looking ahead, we anticipate standard lead times for our raw materials and supplies.
Patents and Other Intellectual Property
We consider our patents and other intellectual property rights, in the aggregate, to constitute an important asset. We own a portfolio of patents, trade secrets, know-how, confidential information, trademarks, copyrights and other intellectual property. We also license intellectual property to and from third parties. As of August 15, 2013, we held 124 U.S. patents and 122 international patents and had 62 U.S. patent applications pending and 91 international patent applications pending. We do not consider our business to be materially dependent upon any single patent, license or other intellectual property right, or any group of related patents, licenses or other intellectual property rights. From time to time, we might engage in litigation to enforce our patents and other intellectual property or defend against claims of alleged infringement. Any of our patents, trade secrets, trademarks, copyrights and other proprietary rights could be challenged, invalidated or circumvented, or may not provide competitive advantages. Numerous trademarks used on or in connection with our products are also considered to be valuable assets.
9
In addition, to protect confidential information, including our trade secrets, we require our employees and contractors to sign confidentiality and invention assignment agreements. We also enter into non-disclosure agreements with our suppliers and appropriate customers to limit access to and disclosure of our proprietary information.
Although our ability to compete may be affected by our ability to protect our intellectual property, we believe that, because of the rapid pace of technological change in the wireless telecommunications industry, our innovative skills, technical expertise and ability to introduce new products on a timely basis will be more important in maintaining our competitive position than protection of our intellectual property. Trade secret, trademark, copyright and patent protections are important but must be supported by other factors such as the expanding knowledge, ability and experience of our personnel, new product introductions and product enhancements. Although we continue to implement protective measures and intend to vigorously defend our intellectual property rights, there can be no assurance that these measures will be successful.
Environmental and Other Regulations
Our facilities and operations, in common with those of our industry in general, are subject to numerous domestic and international laws and regulations designed to protect the environment, particularly with regard to wastes and emissions. We believe that we have complied with these requirements and that such compliance has not had a material adverse effect on our results of operations, financial condition or cash flows. Based upon currently available information, we do not expect expenditures to protect the environment and to comply with current environmental laws and regulations over the next several years to have a material impact on our competitive or financial position, but can give no assurance that such expenditures will not exceed current expectations. From time to time, we receive notices from the U.S. Environmental Protection Agency or equivalent state or international environmental agencies that we are a potentially responsible party under the Comprehensive Environmental Response, Compensation and Liability Act, which is commonly known as the Superfund Act and equivalent laws. Such notices may assert potential liability for cleanup costs at various sites, which include sites owned by us, sites we previously owned and treatment or disposal sites not owned by us, allegedly containing hazardous substances attributable to us from past operations. We are not presently aware of any such liability that could be material to our business, financial condition or operating results, but due to the nature of our business and environmental risks, we cannot provide assurance that any such material liability will not arise in the future.
Electronic products are subject to environmental regulation in a number of jurisdictions. Equipment produced by us is subject to domestic and international requirements requiring end-of-life management and/or restricting materials in products delivered to customers. We believe that we have complied with such rules and regulations, where applicable, with respect to our existing products sold into such jurisdictions.
Radio communications are also subject to governmental regulation. Equipment produced by us is subject to domestic and international requirements to avoid interference among users of radio frequencies and to permit interconnection of telecommunications equipment. We believe that we have complied with such rules and regulations with respect to our existing products, and we intend to comply with such rules and regulations with respect to our future products. Reallocation of the frequency spectrum also could impact our business, financial condition and results of operations.
We are in the process of developing comprehensive policies and procedures concerning conflict minerals compliance.
Employees
As of
June 28, 2013
we employed approximately
1,000
people, compared with approximately
980
as of the end of fiscal
2012
and approximately
1,000
as of the end of fiscal
2011
. Approximately
460
of our employees are located in the U.S. We also utilized approximately
65
independent contractors as of
June 28, 2013
. None of our employees in the U.S. are represented by a labor union. In certain international subsidiaries, our employees are represented by workers’ councils or statutory labor unions. In general, we believe that our relations with our employees are good.
Executive Officers of the Registrant
The name, age, position held with us, and principal occupation and employment during at least the past 5 years for each of our executive officers as of
September 20, 2013
, are as follows:
10
|
Name and Age
|
Position Currently Held and Past Business Experience
|
|
|
Michael A. Pangia, 52
|
Mr. Pangia has been our President and Chief Executive Officer and a member of the Board since July 18, 2011. From March 2009 to July 2011, he served as our Chief Sales Officer responsible for company-wide operations of the global sales and services organization. Prior to joining Aviat Networks, from 2008 to 2009, Mr. Pangia served as Senior Vice President, global sales operations and strategy at Nortel, where he was responsible for all operational aspects of the global sales function. From 2006 to 2008, he was President of Nortel’s Asia region where his key responsibilities included sales and overall business management for all countries where Nortel did business in the region.
|
|
|
Edward J. (“Ned”) Hayes, 58
|
Mr. Hayes joined Aviat Networks in October 2011 and serves as our Senior Vice President and Chief Financial Officer responsible for the finance and IT organizations. Prior to joining Aviat Networks, from 2006 through October 2011, Mr. Hayes was the Chief Financial Officer at Pillar Data Systems, Inc., an enterprise data storage company, which was acquired by Oracle Corporation. Before joining Pillar Data, he served as Executive Vice President and Chief Financial Officer of Quantum Corporation, a data storage company. Mr. Hayes currently serves as a senior advisor to the CEO of Super Micro Computer, Inc., where he previously served as an independent director and Chair of the Audit Committee. He also currently serves as an independent director and non-executive Chairman of the Board of Alaska Communications Systems,
a provider of high-speed wireless, mobile broadband, internet, local, long-distance and advanced broadband solutions for businesses and consumers in Alaska
.
|
|
|
Meena Elliott, 50
|
Ms. Elliott was appointed Senior Vice President, General Counsel and Secretary on September 1, 2011. From July 2009 to August 2011, she served as Vice President, General Counsel and Secretary and in August 2011, was appointed Senior Vice President, General Counsel and Secretary. She joined our company as Associate General Counsel and Assistant Secretary in January 2007 when Harris Corporation's MCD and Stratex Networks merged. Ms. Elliott joined MCD as Division Counsel in March 2006. Prior to joining MCD, she was Chief Counsel at the Department of Commerce from 2002 to 2006.
|
|
|
Heinz H. Stumpe, 58
|
Mr. Stumpe was appointed Chief Sales Officer on June 25, 2012. Before his appointment as Chief Sales Officer, Mr. Stumpe was our Senior Vice President and Chief Operation Officer since June 30, 2008. Previously, he was Vice President, Global Operations for Aviat Networks and Stratex Networks. He joined Stratex Networks as Director of Marketing in 1996. He was promoted to Vice President, Global Accounts in 1999, Vice President, Strategic Accounts in 2002 and Vice President, Global Operations in April 2006.
|
|
|
Shaun McFall, 53
|
Mr. McFall has been our Chief Marketing Officer since July 2008. Previously, from 2000 to 2008, he served as Vice President, Marketing for Aviat Networks and Stratex Networks. He has been with us since 1989.
|
|
There is no family relationship between any of our executive officers or directors, and there are no arrangements or understandings between any of our executive officers or directors and any other person pursuant to which any of them was appointed or elected as an officer or director, other than arrangements or understandings with our directors.
Web site Access to Aviat Networks’ Reports; Available Information
We maintain an Internet Web site at
http://www.aviatnetworks.com.
Our annual reports on Form 10-K, proxy statements, quarterly reports on Form 10-Q, current reports on Form 8-K and amendments to such reports, filed or furnished pursuant to Section 13(a) or 15(d) of the Securities Exchange Act of 1934 (the “Exchange Act”) are available free of charge on our Web site as soon as reasonably practicable after these reports are electronically filed with, or furnished to, the Securities and Exchange Commission (“SEC”). Our website and the information posted thereon are not incorporated into this Annual Report on Form 10-K or any current or other periodic report that we file or furnish to the SEC.
We will also provide the reports in electronic or paper form, free of charge upon request. All reports we file with or furnish to the SEC are also available free of charge via EDGAR through the SEC’s website at
http://www.sec.gov
. The public may read and copy any materials filed by us with the SEC at the SEC’s Public Reference Room, 100 F. Street, N.E., Washington, D.C. 20549. The public may obtain information on the operation of the Public Reference Room by calling the SEC at 1-800-SEC-0330.
Additional information relating to our business and operations is set forth in “Item 7. Management’s Discussion and Analysis of Financial Condition and Results of Operations” in this Annual Report on Form 10-K.
11
Item 1A.
Risk Factors
In addition to the risks described elsewhere in this Annual Report on Form 10-K and in certain of our other filings with the SEC, the following risks and uncertainties, among others, could cause our actual results to differ materially from those contemplated by us or by any forward-looking statement contained herein. Prospective and existing investors are strongly urged to carefully consider the various cautionary statements and risks set forth in this Annual Report on Form 10-K and our other public filings.
We have many business risks including those related to our financial performance, investments in our common stock, operating our business and legal matters. The risks and uncertainties described below are not the only ones facing us. Additional risks and uncertainties that we are not aware of or focused on may also impair our business operations. If any of these risks actually occur, our financial condition and results of operations could be materially and adversely affected.
Our success will depend on new products introduced to the marketplace in a timely manner, successfully completing product transitioning and achieving customer acceptance.
The market for our products is characterized by rapid technological change, evolving industry standards and frequent new product introductions. Our future success will depend, in part, on continuous, timely development and introduction of new products and enhancements that address evolving market requirements and are attractive to customers. If we fail to develop or introduce on a timely basis new products or product enhancements or features that achieve market acceptance, our business may suffer. Additionally, we work closely with a variety of third party partners to develop new product features and new platforms. Should our partners face delays in the development process, then the timing of the rollout of our new products may be significantly impacted which may negatively impact our revenue and gross margin. Another factor impacting our future success is the growth in the customer demand of our new products. Rapidly changing technology, frequent new products introductions and enhancements, short product life cycles and changes in customer requirements characterize the markets for our products. We believe that successful new product introductions provide a significant competitive advantage because of the significant resources committed by customers in adopting new products and their reluctance to change products after these resources have been expended. We have spent, and expect to continue to spend, significant resources on internal research and development to support our effort to develop and introduce new products and enhancements.
As we transition to new product platforms, we face significant risk that the development of our new products may not be accepted by our current customers or by new customers. To the extent that we fail to introduce new and innovative products that are adopted by customers, we could fail to obtain an adequate return on these investments and could lose market share to our competitors, which could be difficult or impossible to regain. Similarly we may face decreased revenue, gross margins and profitability due to a rapid decline in sales of current products as customers hold spending to focus purchases on new product platforms.
We could incur significant costs in completing the transition, including costs of inventory writedowns of the current product as customers transition to new product platforms. In addition, products or technologies developed by others may render our products noncompetitive or obsolete and result in significant reduction in orders from our customers and the loss of existing and prospective customers.
Our average sales prices may decline in the future.
We are experiencing, and are likely to continue to experience, declining sales prices. This price pressure is likely to result in downward pricing pressure on our products and services. As a result, we are likely to experience declining average sales prices for our products. Our future profitability will depend upon our ability to improve manufacturing efficiencies, reduce costs of materials used in our products and to continue to introduce new lower-cost products and product enhancements. If we are unable to respond to increased price competition, our business, financial condition and results of operations will be harmed. Because customers frequently negotiate supply arrangements far in advance of delivery dates, we may be required to commit to price reductions for our products before we are aware of how, or if, cost reductions can be obtained. As a result, current or future price reduction commitments and any inability on our part to respond to increased price competition could harm our business, financial condition and results of operations.
Our sales cycle may be lengthy, and the timing of sales, along with additional services such as warehousing, inventory management, installation and implementation of our products within our customers' networks, may extend over more than one period, which can make our operating results difficult to predict.
We anticipate difficulty in accurately predicting the timing of the sale of products and amounts of revenue generated from sales of our products, primarily in developing countries. The establishment of a business relationship with a potential customer is a lengthy process, generally taking several months and sometimes longer. Following the establishment of the relationship, the negotiation of purchase terms can be time-consuming, and a potential customer may require an extended
12
evaluation and testing period. We expect that our product sales cycle, which results in our products being designed into our customers' networks, could take 12 to 24 months. A number of factors can contribute to the length of the sales cycle, including technical evaluations of our products and the design process required to integrate our products into our customers' networks and warehousing and/or inventory management services that may be requested by certain large customers. In anticipation of product orders, we may incur substantial costs before the sales cycle is complete and before we receive any customer payments. Specifically, should a customer require warehousing and/or inventory management services, such services may impact our operating results in any period due to the costs associated with providing such services and the fact that the timing of the revenue recognition may be delayed. As a result, in the event that a sale is not completed or is canceled or delayed, we may have incurred substantial expenses, making it more difficult for us to become profitable or otherwise negatively impacting our financial results. Furthermore, because of our lengthy sales cycle, our recognition of revenue from our selling efforts may be substantially delayed, our ability to forecast our future revenue may be more limited and our revenue may fluctuate significantly from quarter to quarter.
Once a purchase agreement has been executed, the timing and amount of revenue, if applicable, may remain difficult to predict. The completion of services such as warehousing and inventory management, installation and testing of the customer’s networks and the completion of all other suppliers network elements are subject to the customer’s timing and efforts, and other factors outside our control which may prevent us from making predictions of revenue with any certainty and could cause us to experience substantial period-to-period fluctuations in our operating results.
We have not been profitable and must increase our revenues and reduce costs if we hope to achieve profitability.
As measured under U.S. generally accepted accounting principles (“U.S. GAAP”), we have incurred a net loss in each of the last 6 fiscal years. We incurred net losses of
$15.0 million
in fiscal
2013
,
$24.1 million
in fiscal
2012
and
$90.5 million
in fiscal
2011
and have been unprofitable since we became a public company in January 2007. We also have consistently reported losses from operations, although we have generated cash from operations in fiscal 2013, 2012, 2010 and 2009.
Throughout fiscal
2013
we experienced strong price competition for new business in all regions while major customer consolidations also put pressure on revenue and gross margin. We saw pricing pressures in all markets, with increased pressure in international markets where we compete for the business of large carrier customers. In all markets, telecommunication operating companies consolidated through mergers or acquisitions, leading to fewer, but larger customers. This consolidation may have a negative impact on our revenue if Aviat is not selected as a vendor. In order to counter pricing pressures, we invested heavily in product improvements to reduce unit costs and enhance product features, exited manufacturing facilities and shifted production to contract manufacturers, and worked with our vendors to attain more favorable pricing. If we are unable to reduce product unit costs associated with enhanced product features, including payments to contract manufacturers and other suppliers, we may not achieve profitability.
We cannot be certain that these actions or others that we may take in the future will result in operating profitability or net income as determined under U.S. GAAP.
We may undertake further restructuring activities, which may adversely impact our operations, and we may not realize all of the anticipated benefits of these activities or any potential future restructurings; in addition, these restructuring activities may harm our business.
We continue to evaluate our business to determine the potential need to realign our resources as we continue to transform our business in order to achieve desired cost savings in an increasingly competitive market. In prior years and again in fiscal 2013, we have undertaken a series of restructuring of our operations involving, among other things and depending on the year, reductions of our workforce, the relocation of our corporate headquarters and the reduction and outsourcing of manufacturing activities. We incurred restructuring charges of
$3.1 million
,
$2.3 million
and
$15.4 million
in fiscal 2013, 2012 and 2011, respectively.
We have based our restructuring efforts on assumptions and plans regarding the appropriate cost structure of our business based on our product mix and projected sales among other factors. Some of our assumptions include that the relocation of personnel and the outsourcing of certain functions would reduce our operating expenses and the transition risk is low. These assumptions may not be correct and we may not be able to operate in accordance with our plans. Should this occur we may determine that we must incur additional restructuring charges in the future. Moreover, we cannot assure you that we will realize all of the anticipated benefits of our restructuring actions or that we will not further reduce or otherwise adjust our workforce or exit, or dispose of, certain businesses and product lines. Any decision to further limit investment, exit, or dispose of businesses or product lines may result in the recording of additional restructuring charges. As a result, the costs actually incurred in connection with the restructuring efforts may be higher than originally planned and may not lead to the anticipated cost savings and/or improved results. For example, if we consolidate additional facilities in the future, we may incur additional
13
restructuring and related expenses, which could have a material adverse effect on our business, financial condition or results of operations.
Our restructuring actions could harm our relationships with our employees and impact our ability to recruit new employees.
Employees, whether or not directly affected by any restructuring actions that we undertake, may seek employment with our business partners, customers or competitors. We cannot assure you that the confidential nature of our proprietary information will not be compromised by any such employees who terminate their employment with us. Further, we believe that our future success will depend in large part upon our ability to attract, motivate and retain highly skilled personnel. We may have difficulty attracting and retaining such personnel as a result of a perceived risk of future workforce reductions, and we may terminate the employment of employees as part of a restructuring and later determine that such employees were important to the success of the ongoing business.
Our business could be adversely affected if we are unable to attract and retain key personnel.
Our success and ability to invest and grow depend largely on our ability to attract and retain highly skilled technical, professional, managerial, sales and marketing personnel. Historically, competition for these key personnel has been intense. The loss of services of any of our key personnel (including key personnel joining our company through acquisitions), the inability to retain and attract qualified personnel in the future, delays in hiring required personnel, particularly engineering and sales personnel, or the loss of key personnel to competitors could make it difficult to meet key objectives, such as timely and effective product introductions and financial goals.
We face strong competition for maintaining and improving our position in the market, which can adversely affect our revenue growth and operating results.
The wireless access, interconnection and backhaul business is a specialized segment of the wireless telecommunications industry and is extremely competitive. We expect competition in this segment to increase. Some of our competitors have more extensive engineering, manufacturing and marketing capabilities and significantly greater financial, technical and personnel resources than we have. In addition, some of our competitors have greater name recognition, broader product lines, a larger installed base of products and longer-standing customer relationships. Our competitors include established companies, such as Alcatel-Lucent, Eltek ASA, Ericsson, NEC, Huawei and ZTE, as well as a number of other public and private companies such as Ceragon, DragonWave, SIAE and Exalt. Some of our competitors are OEMs or systems integrators through whom we market and sell our products, which means our business success may depend on these competitors to some extent. One or more of our largest customers could internally develop the capability to manufacture products similar to those manufactured or outsourced by us and, as a result, the demand for our products and services may decrease.
In addition, we compete for acquisition and expansion opportunities with many entities that have substantially greater resources than we have. Our competitors may enter into business combinations in order to accelerate product development or to compete more aggressively and we may lack the resources to meet such enhanced competition.
Our ability to compete successfully will depend on a number of factors, including price, quality, availability, customer service and support, breadth of product lines, product performance and features, rapid time-to-market delivery capabilities, reliability, timing of new product introductions by us, our customers and competitors, the ability of our customers to obtain financing and the stability of regional sociopolitical and geopolitical circumstances, and the ability of large competitors to obtain business by providing more seller financing especially for large transactions. We can give no assurances that we will have the financial resources, technical expertise, or marketing, sales, distribution, customer service and support capabilities to compete successfully, or that regional sociopolitical and geographic circumstances will be favorable for our successful operation.
The effects of the prolonged global financial and economic downturn has had, and may continue to have, significant effects on our customers and suppliers that would result in material adverse effects on our business, operating results, financial condition and stock price.
The effects of the global financial and economic downturn include, among other things, significant reductions in available capital and liquidity from banks and other providers of credit, substantial reductions and/or fluctuations in equity and currency values worldwide, and concerns that the worldwide economy has entered into or may enter into a further prolonged recessionary period.
This financial downturn has adversely affected and may continue to adversely affect our customers’ access to capital and/or willingness to spend capital on our products, and/or their levels of cash liquidity and/or their ability and/or willingness
14
to pay for products that they will order or have already ordered from us, or result in their ceasing operations. Further, we have experienced an increasing number of our customers, principally in emerging markets, requesting longer payment terms, lease or vendor financing arrangements, longer terms for the letters of credit securing purchases of our products and services, which could potentially negatively impact our orders, revenue conversion cycle, and cash flows.
In seeking to reduce their expenses, we have also seen significant pressure from our customers to lower prices for our products as they try to improve their operating performance and procure additional capital equipment within their reduced budget levels. To the extent that we lower prices on our products and services, our orders, revenues, and gross margins may be negatively impacted. Additionally, certain emerging markets are particularly sensitive to pricing as a key differentiator. Where price is a primary decision driver, we may not be able to effectively compete or we may choose not to compete due to unacceptable margins.
In addition, the financial downturn may materially adversely affect our suppliers’ access to capital and liquidity with which to maintain their inventories, production levels, and/or product quality, could cause them to raise prices or lower production levels, or result in their ceasing operations. Further, with respect to our credit facility discussed under “Liquidity, Capital Resources and Financial Strategies” in Item 7 of this Annual Report on Form 10-K, if the global financial crisis adversely affects Silicon Valley Bank, our ability to access the funds available under our credit facility could be materially adversely affected.
The potential effects of these economic factors are difficult to forecast and mitigate. As a consequence, our operating results for a particular period are difficult to predict, and, therefore, prior results are not necessarily indicative of results to be expected in future periods. Any of the foregoing effects could have a material adverse effect on our business, results of operations, and financial condition and could adversely affect our stock price.
If we fail to accurately forecast our manufacturing requirements or customer demand, we could incur additional costs, which would adversely affect our business and results of operations.
If we fail to accurately predict our manufacturing requirements or forecast customer demand, we may incur additional costs of manufacturing and our gross margins and financial results could be adversely affected. If we overestimate our requirements, our contract manufacturers may experience an oversupply of components and assess us charges for excess or obsolete components that could adversely affect our gross margins. If we underestimate our requirements, our contract manufacturers may have inadequate inventory or components, which could interrupt manufacturing and result in higher manufacturing costs, shipment delays, damage to customer relationships and/or our payment of penalties to our customers. Our contract manufacturers also have other customers and may not have sufficient capacity to meet all of their customer's needs, including ours, during periods of excess demand.
Part of our inventory may be written off, which would increase our cost of revenues. In addition, we may be exposed to inventory-related losses on inventories purchased by our contract manufacturers.
During fiscal
2013, 2012 and 2011
, we recorded charges to reduce the carrying value of our inventory to the lower of cost or market totaling
$7.7 million
,
$3.4 million
and
$20.2 million
, respectively. Such charges equaled
1.6%
,
0.8%
and
4.5%
of our revenue in fiscal
2013, 2012 and 2011
, respectively. These charges were primarily due to excess and obsolete inventory, including deferred cost of sales, resulting from product transitioning and discontinuance.
Inventory of raw materials, work in-process or finished products may accumulate in the future, and we may encounter losses due to a variety of factors, including:
|
•
|
rapid technological change in the wireless telecommunications industry resulting in frequent product changes;
|
|
•
|
the need of our contract manufacturers to order raw materials that have long lead times and our inability to estimate exact amounts and types of items thus needed, especially with regard to the frequencies in which the final products ordered will operate; and
|
|
•
|
cost reduction initiatives resulting in component changes within the products.
|
Further, our inventory of finished products may accumulate as the result of cancellation of customer orders or our customers’ refusal to confirm the acceptance of our products. Our contract manufacturers are required to purchase inventory based on manufacturing projections we provide to them. If actual orders from our customers are lower than these manufacturing projections, our contract manufacturers will have excess inventory of raw materials or finished products which we would be required to purchase. In addition, we require our contract manufacturers from time to time to purchase more inventory than is immediately required, and to partially assemble components, in order to shorten our delivery time in case of an increase in demand for our products. In the absence of such increase in demand, we may need to compensate our contract manufacturers. If we are required to purchase excess inventory from our contract manufacturers or otherwise compensate our
15
contract manufacturers for purchasing excess inventory, our business, financial condition and results of operations could be materially adversely affected. We also may purchase components or raw materials from time to time for use by our contract manufacturers in the manufacturing of our products. These purchases are based on our own manufacturing projections. If our actual orders are lower than these manufacturing projections, we may accumulate excess inventory, which we may be required to write-off. If we are forced to write-off this inventory other than in the normal course of business, our business, financial condition, results of operations could be materially adversely affected.
Our effective tax rate could be highly volatile and could adversely affect our operating results.
Our future effective tax rate may be adversely affected by a number of factors, many of which are outside of our control, including:
|
•
|
the jurisdictions in which profits are determined to be earned and taxed;
|
|
•
|
adjustments to estimated taxes upon finalization of various tax returns;
|
|
•
|
increases in expenses not deductible for tax purposes, including write-offs of acquired in-process research and development and impairment of goodwill in connection with acquisitions;
|
|
•
|
changes in available tax credits;
|
|
•
|
changes in share-based compensation expense;
|
|
•
|
changes in the valuation of our deferred tax assets and liabilities;
|
|
•
|
changes in domestic or international tax laws or the interpretation of such tax laws;
|
|
•
|
the resolution of issues arising from tax audits with various tax authorities;
|
|
•
|
the tax effects of purchase accounting for acquisitions and restructuring charges that may cause fluctuations between reporting periods; and
|
|
•
|
taxes that may be incurred upon a repatriation of cash from foreign operations.
|
Any significant increase in our future effective tax rates could impact our results of operations for future periods adversely.
If we fail to effectively manage our contract manufacturer relationships, we could incur additional costs or be unable to timely fulfill our customer commitments, which would adversely affect our business and results of operations and, in the event of an inability to fulfill commitments, would harm our customer relationships.
We outsource all of our manufacturing and a substantial portion of our repair service operations to independent contract manufacturers and other third parties. Our contract manufacturers typically manufacture our products based on rolling forecasts of our product needs that we provide to them on a regular basis. The contract manufacturers are responsible for procuring components necessary to build our products based on our rolling forecasts, building and assembling the products, testing the products in accordance with our specifications and then shipping the products to us. We configure the products to our customer requirements, conduct final testing and then ship the products to our customers. Although we currently partner with multiple major contract manufacturers, there can be no assurance that we will not encounter problems as we are dependent on contract manufacturers to provide these manufacturing services or that we will be able to replace a contract manufacturer that is not able to meet our demand.
In addition, if we fail to effectively manage our relationships with our contract manufacturers or other service providers, or if one or more of them should not fully comply with their contractual obligations or should experience delays, disruptions, component procurement problems or quality control problems, then our ability to ship products to our customers or otherwise fulfill our contractual obligations to our customers could be delayed or impaired which would adversely affect our business, financial results and customer relationships.
We depend on sole or limited sources for some key components and failure to receive timely delivery of any of these components could result in deferred or lost sales.
In some instances, we are dependent upon one or a few sources, either because of the specialized nature of a particular item or because of local content preference requirements pursuant to which we operate on a given project. Examples of sole or limited sourcing categories include metal fabrications and castings, for which we own the tooling and therefore limit our supplier relationships, and MMICs (a type of integrated circuit used in manufacturing microwave radios), which we procure at a volume discount from a single source. Our supply chain plan includes mitigation plans for alternative manufacturing sources and identified alternate suppliers. However, if these alternatives cannot address our requirements when our existing sources of these components fail to deliver them on time, we could suffer delayed shipments, canceled orders and lost or deferred
16
revenues, as well as material damage to our customer relationships. Should this occur, our operating results, cash flows and financial condition could be materially adversely affected.
Credit and commercial risks and exposures could increase if the financial condition of our customers declines.
A substantial portion of our sales are to customers in the telecommunications industry. These customers may require their suppliers to provide extended payment terms, direct loans or other forms of financial support as a condition to obtaining commercial contracts. We expect that we may provide or commit to financing where appropriate for our business. Our ability to arrange or provide financing for our customers will depend on a number of factors, including our credit rating, our level of available credit and our ability to sell off commitments on acceptable terms. In addition, if local currencies cannot be hedged, we have an inherent exposure in our ability to convert monies at favorable rates or to U.S. dollars. More generally, we expect to routinely enter into long-term contracts involving significant amounts to be paid by our customers over time. Pursuant to these contracts, we may deliver products and services representing an important portion of the contract price before receiving any significant payment from the customer. As a result of the financing that may be provided to customers and our commercial risk exposure under long-term contracts, our business could be adversely affected if the financial condition of our customers erodes. Over the past few years, certain of our customers have filed with the courts seeking protection under the bankruptcy or reorganization laws of the applicable jurisdiction, or have experienced financial difficulties. The financial healthiness may be exacerbated in many emerging markets, where our customers are being affected not only by recession, but by deteriorating local currencies and a lack of credit. Upon the financial failure of a customer, we may experience losses on credit extended and loans made to such customer, losses relating to our commercial risk exposure and the loss of the customer’s ongoing business. If customers fail to meet their obligations to us, we may experience reduced cash flows and losses in excess of reserves, which could materially adversely impact our results of operations and financial position.
Our customers may not pay for products and services in a timely manner, or at all, which would decrease our cash flows and adversely affect our working capital.
Our business requires extensive credit risk management that may not be adequate to protect against customer nonpayment. A risk of non-payment by customers is a significant focus of our business. We expect a significant amount of future revenue to come from international customers, many of whom will be startup telecommunications operators in developing countries. We do not generally expect to obtain collateral for sales, although we require letters of credit or credit insurance as appropriate for international customers. For information regarding the percentage of revenue attributable to certain key customers, see the risks discussed in the factor below titled
“Because a significant amount of our revenue may come from a limited number of customers, the termination of any of these customer relationships may adversely affect our business.”
Our historical accounts receivable balances have been concentrated in a small number of significant customers. Unexpected adverse events impacting the financial condition of our customers, bank failures or other unfavorable regulatory, economic or political events in the countries in which we do business may impact collections and adversely impact our business, require increased bad debt expense or receivable write-offs and adversely impact our cash flows, financial condition and operating results, which could also result in a breach of our bank covenants.
Because a significant amount of our revenue may come from a limited number of customers, the termination of any of these customer relationships may adversely affect our business.
Sales of our products and services historically have been concentrated in a small number of customers. Principal customers for our products and services include domestic and international wireless/mobile service providers, OEMs, as well as private network users such as public safety agencies; government institutions; and utility, pipeline, railroad and other industrial enterprises that operate broadband wireless networks. We had revenue from two customers that each exceeded 10% of our total revenue during fiscal 2013, and one customer in each of 2012 and 2011. Although we have a large customer base, during any given quarter a small number of customers may account for a significant portion of our revenue.
It is possible that a significant portion of our future product sales also could become even more concentrated in a limited number of customers as currently, two of our customers, MTN and Verizon Wireless, each represented over 10% of our revenue. In addition, product sales to major customers have varied widely from period to period. The loss of any existing customer, a significant reduction in the level of sales to any existing customer, or our inability to gain additional customers could result in declines in our revenue or an inability to grow revenue. In addition, further consolidation of our potential customer base could result in purchasing decision delays as consolidating customers integrate their operations and could generally reduce our opportunities to win new customers to the extent that the number of potential customers decreases. Furthermore, as our customers become larger, they may have more leverage to negotiate better pricing which could adversely affect our revenues and gross margins.
We continually evaluate strategic opportunities which could involve merger and/or acquisition activities that could disrupt our operations and harm our operating results.
17
Our growth depends upon market growth, our ability to enhance our existing products and our ability to introduce new products on a timely basis. We intend to continue to address the need to develop new products and enhance existing products through acquisitions, or “tuck-ins,” product lines, technologies, and personnel. Acquisitions involve numerous risks, including the following:
|
•
|
difficulties in integrating the operations, systems, technologies, products, and personnel of the acquired companies, particularly companies with large and widespread operations and/or complex products;
|
|
•
|
diversion of management's attention from normal daily operations of the business and the challenges of managing larger and more widespread operations resulting from acquisitions;
|
|
•
|
potential difficulties in completing projects associated with in-process research and development intangibles;
|
|
•
|
difficulties in entering markets in which we have no or limited direct prior experience and where competitors in each market have stronger market positions;
|
|
•
|
initial dependence on unfamiliar supply chains or relatively small supply partners;
|
|
•
|
insufficient revenue to offset increased expenses associated with acquisitions; and
|
|
•
|
the potential loss of key employees, customers, distributors, vendors and other business partners of the companies we acquire following and continuing after announcement of acquisition plans.
|
Acquisitions may also cause us to:
|
•
|
issue common stock that would dilute our current stockholders;
|
|
•
|
use a substantial portion of our cash resources, or incur debt;
|
|
•
|
significantly increase our interest expense, leverage and debt service requirements if we incur additional debt to pay for an acquisition;
|
|
•
|
assume material liabilities;
|
|
•
|
record goodwill and non-amortizable intangible assets that are subject to impairment testing on a regular basis and potential periodic impairment charges;
|
|
•
|
incur amortization expenses related to certain intangible assets;
|
|
•
|
incur tax expenses related to the effect of acquisitions on our intercompany R&D cost sharing arrangement and legal structure;
|
|
•
|
incur large and immediate write-offs and restructuring and other related expenses; and
|
|
•
|
become subject to intellectual property or other litigation.
|
Mergers and acquisitions of high-technology companies are inherently risky and subject to many factors outside of our control. No assurance can be given that our previous or future acquisitions will be successful and will not materially adversely affect our business, operating results or financial condition. Failure to manage and successfully integrate acquisitions could materially harm our business and operating results. Even when an acquired company has already developed and marketed products, there can be no assurance that product enhancements will be made in a timely fashion or that pre-acquisition due diligence will have identified all possible issues that might arise with respect to such products.
Our quarterly results may be volatile, which can adversely affect the trading price of our common stock.
Our quarterly operating results may vary significantly for a variety of reasons, many of which are outside our control. These factors could harm our business and include, among others:
|
•
|
seasonality in the purchasing habits of our customers;
|
|
•
|
the volume and timing of product orders and the timing of completion of our product deliveries and installations;
|
|
•
|
our ability and the ability of our key suppliers to respond to changes on demand as needed;
|
|
•
|
margin variability based on geographic and product mix;
|
|
•
|
our suppliers’ inability to perform and deliver on time as a result of their financial condition, component shortages or other supply chain constraints;
|
|
•
|
retention of key personnel;
|
|
•
|
our sales cycles can be lengthy;
|
|
•
|
litigation costs and expenses;
|
|
•
|
continued timely rollout of new product functionality and features;
|
|
•
|
increased competition resulting in downward pressure on the price of our products and services;
|
18
|
•
|
unexpected delays in the schedule for shipments of existing products and new generations of the existing platforms;
|
|
•
|
failure to realize expected cost improvement throughout our supply chain;
|
|
•
|
order cancellations or postponements in product deliveries resulting in delayed revenue recognition;
|
|
•
|
seasonality in the purchasing habits of our customers;
|
|
•
|
restructuring and organization of our operations;
|
|
•
|
war and acts of terrorism;
|
|
•
|
natural disasters;
|
|
•
|
the ability of our customers to obtain financing to enable their purchase of our products;
|
|
•
|
fluctuations in international currency exchange rates;
|
|
•
|
regulatory developments including denial of export and import licenses;
|
|
•
|
general economic conditions worldwide that affect demand and financing for microwave telecommunications networks; and
|
|
•
|
the timing and size of future restructuring plans and write-offs.
|
Our quarterly results are expected to be difficult to predict and delays in product delivery or closing a sale can cause revenue, margins and net income or loss to fluctuate significantly from anticipated levels. A substantial portion of our contracts are completed in the latter part of a quarter and a significant percentage of these are large orders. Because a significant portion of our cost structure is largely fixed in the short term, revenue shortfalls tend to have a disproportionately negative impact on our profitability and can increase our inventory. The number of large new transactions also increases the risk of fluctuations in our quarterly results because a delay in even a small number of these transactions could cause our quarterly revenues and profitability to fall significantly short of our predictions. In addition, we may increase spending in response to competition or in pursuit of new market opportunities. Accordingly, we cannot provide assurances that we will be able to achieve profitability in the future or that if profitability is attained, that we will be able to sustain profitability, particularly on a quarter-to-quarter basis.
Due to the significant volume of international sales we expect, we may be susceptible to a number of political, economic and geographic risks that could harm our business.
We are highly dependent on sales to customers outside the U.S. In fiscal
2013, 2012 and 2011
, our sales to international customers accounted for
62%
,
64%
and
67%
, respectively, of total revenue. Significant portions of our international sales are in less developed countries. Our international sales are likely to continue to account for a large percentage of our products and services revenue for the foreseeable future. As a result, the occurrence of any international, political, economic or geographic event could result in a significant decline in revenue. In addition, compliance with complex foreign and U.S. laws and regulations that apply to our international operations increases our cost of doing business in international jurisdictions. These numerous and sometimes conflicting laws and regulations include internal control and disclosure rules, data privacy and filtering requirements, anti-corruption laws, such as the Foreign Corrupt Practices Act, and other local laws prohibiting corrupt payments to governmental officials, and anti-competition regulations, among others. Violations of these laws and regulations could result in fines and penalties, criminal sanctions against us, our officers, or our employees, prohibitions on the conduct of our business and on our ability to offer our products and services in one or more countries, and could also materially affect our brand, our international expansion efforts, our ability to attract and retain employees, our business, and our operating results. Although we have implemented policies and procedures designed to ensure compliance with these laws and regulations, there can be no assurance that our employees, contractors, or agents will not violate our policies.
Some of the risks and challenges of doing business internationally include:
|
•
|
unexpected changes in regulatory requirements;
|
|
•
|
fluctuations in international currency exchange rates including its impact on unhedgeable currencies and our forecast variations for hedgeable currencies;
|
|
•
|
imposition of tariffs and other barriers and restrictions;
|
|
•
|
management and operation of an enterprise spread over various countries;
|
|
•
|
the burden of complying with a variety of laws and regulations in various countries;
|
|
•
|
application of the income tax laws and regulations of multiple jurisdictions, including relatively low-rate and relatively high-rate jurisdictions, to our sales and other transactions, which results in additional complexity and uncertainty;
|
|
•
|
general economic and geopolitical conditions, including inflation and trade relationships;
|
19
|
•
|
war and acts of terrorism;
|
|
•
|
kidnapping and high crime rate;
|
|
•
|
natural disasters;
|
|
•
|
currency exchange controls; and
|
|
•
|
changes in export regulations.
|
While these factors and the impacts of these factors are difficult to predict, any one or more of them could adversely affect our business, financial condition and results of operations in the future.
Consolidation within the telecommunications industry could result in a decrease in our revenue.
The telecommunications industry has experienced significant consolidation among its participants, and we expect this trend to continue. Some operators in this industry have experienced financial difficulty and have filed, or may file, for bankruptcy protection. Other operators may merge and one or more of our competitors may supply products to the customers of the combined company following those mergers. This consolidation could result in purchasing decision delays and decreased opportunities for us to supply products to companies following any consolidation. This consolidation may also result in lost opportunities for cost reduction and economies of scale. In addition, see the risks discussed in the factor above titled
“Because a significant amount of our revenue may come from a limited number of customers, the termination of any of these customer relationships may adversely affect our business.”
If we are unable to adequately protect our intellectual property rights, we may be deprived of legal recourse against those who misappropriate our intellectual property.
Our ability to compete will depend, in part, on our ability to obtain and enforce intellectual property protection for our technology in the U.S. and internationally. We rely upon a combination of trade secrets, trademarks, copyrights, patents and contractual rights to protect our intellectual property. In addition, we enter into confidentiality and invention assignment agreements with our employees, and enter into non-disclosure agreements with our suppliers and appropriate customers so as to limit access to and disclosure of our proprietary information. We cannot give assurances that any steps taken by us will be adequate to deter misappropriation or impede independent third-party development of similar technologies. In the event that such intellectual property arrangements are insufficient, our business, financial condition and results of operations could be harmed. We have significant operations in the U.S., United Kingdom, Singapore and New Zealand, and outsourcing arrangements in Asia and the U.S. We cannot provide assurances that the protection provided to our intellectual property by the laws and courts of particular nations will be substantially similar to the protection and remedies available under U.S. law. Furthermore, we cannot provide assurances that third parties will not assert infringement claims against us based on intellectual property rights and laws in other nations that are different from those established in the U.S.
If we fail to develop and maintain distribution and licensing relationships, our revenue may decrease.
Although a majority of our sales are made through our direct sales force, we also will market our products through indirect sales channels such as independent agents, distributors, OEMs and systems integrators. These relationships enhance our ability to pursue major contract awards and, in some cases, are intended to provide our customers with easier access to financing and a greater variety of equipment and service capabilities, which an integrated system provider should be able to offer. We may not be able to maintain and develop additional relationships. If additional relationships are developed, they may not be successful. Furthermore, as we consider increasing licensing revenue based on upgraded technology, we may not be successful in transitioning customers to the planned software upgrades. Our inability to establish or maintain these distribution and licensing relationships could restrict our ability to market our products and thereby result in significant reductions in revenue. If these revenue reductions occur, our business, financial condition and results of operations would be harmed.
If sufficient radio frequency spectrum is not allocated for use by our products, or we fail to obtain regulatory approval for our products, our ability to market our products may be restricted.
We will be affected by the allocation and auction of the radio frequency spectrum by governmental authorities both in the U.S. and internationally. These governmental authorities may not allocate sufficient radio frequency spectrum for use by our products or we may not be successful in obtaining regulatory approval for our products from these authorities. Historically, in many developed countries, the unavailability of frequency spectrum has inhibited the growth of wireless telecommunications networks. In addition, to operate in a jurisdiction, we must obtain regulatory approval for our products. Each jurisdiction in which we market our products has its own regulations governing radio communications. Products that support emerging wireless telecommunications services can be marketed in a jurisdiction only if permitted by suitable frequency allocations, auctions and regulations. The process of establishing new regulations is complex and lengthy. If we are
20
unable to obtain sufficient allocation of radio frequency spectrum by the appropriate governmental authority or obtain the proper regulatory approval for our products, our business, financial condition and results of operations may be harmed.
Radio communications are subject to regulation by U.S. and foreign laws and international treaties. Generally, our products need to conform to a variety of United States and international requirements established to avoid interference among users of transmission frequencies and to permit interconnection of telecommunications equipment. Any delays in compliance with respect to our future products could delay the introduction of such products.
Our business is subject to changing regulation of corporate governance, public disclosure, and anti-bribery measures that have resulted in increased costs and may continue to result in additional costs in the future and/or potential liabilities.
We are subject to rules and regulations of federal and state regulatory authorities, The NASDAQ Stock Market LLC (“NASDAQ”) and financial market entities charged with the protection of investors and the oversight of companies whose securities are publicly traded, and foreign and domestic legislative bodies. During the past few years, these entities, including the Public Company Accounting Oversight Board, the SEC, NASDAQ and several foreign governments such as the governments of the United Kingdom and Brazil, have issued requirements, laws and regulations and continue to develop additional requirements, laws and regulations, such as those in response to laws enacted by Congress, most notably the Sarbanes-Oxley Act of 2002 (“SOX”), and recent laws and regulations regarding bribery and unfair competition. Our efforts to comply with these requirements and regulations have resulted in, and are likely to continue to result in, increased general and administrative expenses and a diversion of substantial management time and attention from revenue-generating activities to compliance activities.
Moreover, because these laws, regulations and standards are subject to varying interpretations, their application in practice may evolve over time as new guidance becomes available. This evolution may result in continuing uncertainty regarding compliance matters and additional costs potentially necessitated by ongoing revisions to our disclosure and governance practices. Finally, if we are unable to ensure compliance with such requirements, laws, or regulations, we may be subject to costly prosecution and liability, and resulting reputational harm, from such noncompliance.
Our products are used in critical communications networks which may subject us to significant liability claims.
Because our products are used in critical communications networks, we may be subject to significant liability claims if our products do not work properly. We warrant to our current customers that our products will operate in accordance with our product specifications. If our products fail to conform to these specifications, our customers could require us to remedy the failure or could assert claims for damages. The provisions in our agreements with customers that are intended to limit our exposure to liability claims may not preclude all potential claims. In addition, any insurance policies we have may not adequately limit our exposure with respect to such claims. Liability claims could require us to spend significant time and money in litigation or to pay significant damages. Any such claims, whether or not successful, would be costly and time-consuming to defend, and could divert management’s attention and seriously damage our reputation and our business.
We may be subject to litigation regarding intellectual property associated with our wireless business. This litigation could be costly to defend and resolve, and could prevent us from using or selling the challenged technology.
The wireless telecommunications industry is characterized by vigorous protection and pursuit of intellectual property rights, which has resulted in often protracted and expensive litigation. Any litigation regarding patents or other intellectual property could be costly and time-consuming and could divert our management and key personnel from our business operations. The complexity of the technology involved and the uncertainty of intellectual property litigation increase these risks. Such litigation or claims could result in substantial costs and diversion of resources. In the event of an adverse result in any such litigation, we could be required to pay substantial damages, cease the use and transfer of allegedly infringing technology or the sale of allegedly infringing products and expend significant resources to develop non-infringing technology or obtain licenses for the infringing technology. We can give no assurances that we would be successful in developing such non-infringing technology or that any license for the infringing technology would be available to us on commercially reasonable terms, if at all. This could have a materially adverse effect on our business, results of operation, financial condition, competitive position and prospects.
System security risks, data protection breaches, and cyber-attacks could compromise our proprietary information, disrupt our internal operations and harm public perception of our security products, which could cause our business and reputation to suffer and adversely affect our stock price.
In the ordinary course of business, we store sensitive data, including intellectual property, our proprietary business information and that of our customers, suppliers and business partners on our networks. The secure maintenance of this information is critical to our operations and business strategy. Increasingly, companies, including Aviat Networks are subject
21
to a wide variety of attacks on their networks on an ongoing basis. Despite our security measures, Aviat Networks' information technology and infrastructure may be vulnerable to penetration or attacks by computer programmers and hackers, or breached due to employee error, malfeasance or other disruptions. Any such breach could compromise our networks, creating system disruptions or slowdowns and exploiting security vulnerabilities of our products, and the information stored on our networks could be accessed, publicly disclosed, lost or stolen, which could subject us to liability to our customers, suppliers, business partners and others, and cause us reputational and financial harm. In addition, sophisticated hardware and operating system software and applications that we produce or procure from third parties may contain defects in design or manufacture, including “bugs” and other problems that could unexpectedly interfere with the operation of our networks.
If an actual or perceived breach of network security occurs in our network or in the network of a customer of our security products, regardless of whether the breach is attributable to our products, the market perception of the effectiveness of our products could be harmed. Because the techniques used by computer programmers and hackers, many of whom are highly sophisticated and well-funded, to access or sabotage networks change frequently and generally are not recognized until after they are used, we may be unable to anticipate or immediately detect these techniques. This could impede our sales, manufacturing, distribution or other critical functions. In addition, the economic costs to us to eliminate or alleviate cyber or other security problems, bugs, viruses, worms, malicious software systems and security vulnerabilities could be significant and may be difficult to anticipate or measure because the damage may differ based on the identity and motive of the programmer or hacker, which are often difficult to identify.
Anti-takeover provisions of Delaware law and provisions in our Amended and Restated Certificate of Incorporation and Amended and Restated Bylaws could make a third-party acquisition of us difficult.
Because we are a Delaware corporation, the anti-takeover provisions of Delaware law could make it more difficult for a third party to acquire control of us, even if the change in control would be supported by our stockholders. We are subject to the provisions of Section 203 of the General Corporation Law of Delaware, which prohibits us from engaging in certain business combinations, unless the business combination is approved in a prescribed manner. In addition, our Amended and Restated Certificate of Incorporation and Amended and Restated Bylaws also contain certain provisions that may make a third-party acquisition of us difficult, including the ability of the board of directors to issue preferred stock and the requirement that nominations for directors and other proposals by stockholders must be made in advance of the meeting at which directors are elected or the proposals are voted upon.
Item 1B.
Unresolved Staff Comments
None.
Item 2.
Properties
As of
June 28, 2013
, we leased approximately 319,000 square feet of facilities worldwide, with approximately 61% in North America, mostly in California, Texas and North Carolina. Our corporate headquarters are located in Santa Clara, California, and consist of a building of approximately 129,000 square feet. The lease for our headquarters expires in April 2020 and we plan to sublease a portion of the facility as part of our restructuring plan. We also lease approximately 52,000 square feet of office and assembly facilities in San Antonio and Austin, Texas. Internationally, we lease approximately 125,000 square feet of facilities throughout Europe, Central America, South America, Africa and Asia regions, including offices in Singapore, Slovenia, Philippine Islands, India, Mexico, South Africa, Nigeria, Ivory Coast, France, Kenya, Poland, Australia and Bangladesh. In addition, we own approximately 110,000 square feet of facilities in Wellington, New Zealand and Lanarkshire, Scotland.
During fiscal 2011, we announced the closing of our 60,000 square-foot Morrisville, North Carolina office which formerly served as our headquarters. A sub-tenant for the entire 60,000 square feet of space took occupancy of the premises in early fiscal 2012. We continue to have an on-going lease commitment for this location ending in fiscal 2015.
We maintain our facilities in good operating condition, and believe that they are suitable and adequate for our current and projected needs. We continuously review our anticipated requirements for facilities and may, from time to time, acquire additional facilities, expand existing facilities, or dispose of existing facilities or parts thereof, as we deem necessary.
For more information about our lease obligations, see “Note 15. Commitments and Contingencies” of notes to consolidated financial statements, which are included in Item 8 in this Annual Report on Form 10-K.
Item 3.
Legal Proceedings
22
From time to time, we may be involved in various legal claims and litigation that arise in the normal course of our operations. While the results of such claims and litigation cannot be predicted with certainty, we currently believe that we are not a party to any litigation the final outcome of which is likely to have a material adverse effect on our financial position, results of operations or cash flows. However, should we not prevail in any such litigation; it could have a material adverse impact on our operating results, cash flows or financial position.
Item 4.
Mine Safety Disclosures
Not applicable.
23
Item 5.
Market for Registrant’s Common Equity, Related Stockholder Matters and Issuer Purchases of Equity Securities
Market Information and Price Range of Common Stock
Our common stock, with a par value of $0.01 per share, is listed and primarily traded on the NASDAQ Global Select Market, under the ticker symbol AVNW (prior to January 28, 2010 our ticker symbol was HSTX). There was no established trading market for shares of our common stock prior to January 29, 2007.
According to the records of our transfer agent, as of
August 30, 2013
, there were approximately
4,622
holders of record of our common stock. The following table sets forth the high and low closing prices for a share of our common stock on NASDAQ Global Select Market for the periods indicated during our fiscal years
2013
and
2012
:
|
|
Fiscal 2013
|
Fiscal 2012
|
|||||
|
|
High
|
Low
|
High
|
Low
|
|||
|
First Quarter
|
$2.80
|
$2.11
|
$4.21
|
$2.29
|
|||
|
Second Quarter
|
$3.32
|
$2.28
|
$2.66
|
$1.62
|
|||
|
Third Quarter
|
$3.75
|
$3.26
|
$3.06
|
$1.77
|
|||
|
Fourth Quarter
|
$3.35
|
$2.57
|
$2.92
|
$2.39
|
|||
Dividend Policy
We have not paid cash dividends on our common stock and do not intend to pay cash dividends in the foreseeable future. We intend to retain any earnings for use in our business. In addition, the covenants of our credit facility may restrict us from paying dividends or making other distributions to our stockholders under certain circumstances.
Sales of Unregistered Securities
During the fourth quarter of fiscal
2013
, we did not issue or sell any unregistered securities.
Issuer Repurchases of Equity Securities
During the fourth quarter of fiscal
2013
, we did not repurchase any equity securities.
Performance Graph
The following graph and accompanying data compares the cumulative total return on our common stock with the cumulative total return of the Total Return Index for The NASDAQ Composite Market (U.S. Companies) and the NASDAQ Telecommunications Index for the five-year period ended
June 28, 2013
. The stock price performance shown on the graph below is not necessarily indicative of future price performance. Note that this graph and accompanying data is “furnished,” not “filed,” with the SEC.
24
COMPARISON OF 5 YEAR CUMULATIVE TOTAL RETURN*
Among Aviat Networks, Inc., the NASDAQ Composite Index
and the NASDAQ Telecommunications Index
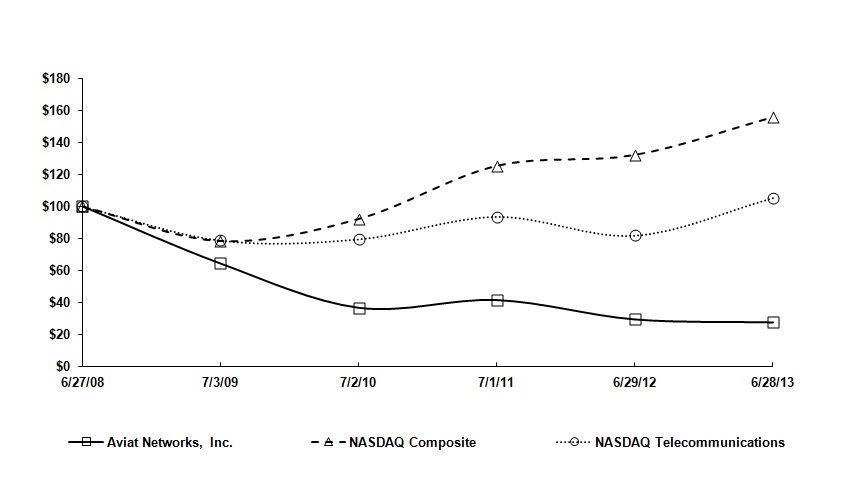
|
6/27/2008
|
7/3/2009
|
7/2/2010
|
7/1/2011
|
6/29/2012
|
6/28/2013
|
||||||||||||
|
Aviat Networks, Inc.
|
100.00
|
|
64.20
|
|
36.53
|
|
41.34
|
|
29.23
|
|
27.35
|
|
|||||
|
NASDAQ Composite
|
100.00
|
|
78.40
|
|
92.16
|
|
125.36
|
|
132.17
|
|
155.77
|
|
|||||
|
NASDAQ Telecommunications
|
100.00
|
|
78.78
|
|
79.53
|
|
93.58
|
|
81.84
|
|
105.27
|
|
|||||
____________________________
|
*
|
Assumes (i) $100 invested on June 27, 2008 in Aviat Networks, Inc. common stock, the Total Return Index for The NASDAQ Composite Market (U.S. companies) and the NASDAQ Telecommunications Index; and (ii) immediate reinvestment of all dividends.
|
Item 6.
Selected Financial Data
The following table summarizes our selected historical financial information for each of the last five fiscal years that has been derived from our audited consolidated financial statements. Data presented for fiscal years
2013
,
2012
and
2011
are included elsewhere in this Annual Report on Form 10-K. This table should be read in conjunction with our other financial information, including “Item 7. Management’s Discussion and Analysis of Financial Condition and Results of Operations” and the consolidated financial statements and notes, included elsewhere in this Annual Report on Form 10-K.
|
|
Fiscal Year Ended
|
||||||||||||||||||
|
|
June 28, 2013
|
June 29, 2012
|
July 1, 2011
|
July 2, 2010
|
July 3, 2009
|
||||||||||||||
|
|
(In millions)
|
||||||||||||||||||
|
Revenue from product sales and services
|
$
|
471.3
|
|
$
|
444.0
|
|
$
|
452.1
|
|
$
|
465.5
|
|
$
|
677.9
|
|
||||
|
Cost of product sales and services
|
331.2
|
|
312.3
|
|
324.0
|
|
332.7
|
|
503.8
|
|
|||||||||
|
Loss from continuing operations
|
(10.9
|
)
|
(15.5
|
)
|
(58.8
|
)
|
(108.4
|
)
|
(348.8
|
)
|
|||||||||
|
Net loss
|
(15.0
|
)
|
(24.1
|
)
|
(90.5
|
)
|
(130.2
|
)
|
(355.0
|
)
|
|||||||||
|
Basic and diluted loss per common share:
|
|||||||||||||||||||
|
Loss from continuing operations
|
$
|
(0.18
|
)
|
$
|
(0.26
|
)
|
$
|
(1.00
|
)
|
$
|
(1.82
|
)
|
$
|
(5.94
|
)
|
||||
|
Net loss
|
(0.25
|
)
|
(0.41
|
)
|
(1.54
|
)
|
(2.19
|
)
|
(6.05
|
)
|
|||||||||
25
|
|
As of
|
||||||||||||||||||
|
|
June 28, 2013
|
June 29, 2012
|
July 1, 2011
|
July 2, 2010
|
July 3, 2009
|
||||||||||||||
|
|
(In millions)
|
||||||||||||||||||
|
Total assets
|
$
|
305.8
|
|
$
|
329.6
|
|
$
|
383.9
|
|
$
|
447.0
|
|
$
|
600.2
|
|
||||
|
Long-term liabilities
|
24.8
|
|
24.7
|
|
15.1
|
|
17.2
|
|
17.9
|
|
|||||||||
|
Total net assets
|
149.9
|
|
157.5
|
|
177.7
|
|
263.2
|
|
387.9
|
|
|||||||||
The following table summarizes certain charges, expenses and gains included in our net losses for each of the fiscal years in the five-year period ended
June 28, 2013
:
|
|
Fiscal Year Ended
|
||||||||||||||||||
|
|
June 28, 2013
|
June 29, 2012
|
July 1, 2011
|
July 2, 2010
|
July 3, 2009
|
||||||||||||||
|
|
(In millions)
|
||||||||||||||||||
|
Share-based compensation expense
|
$
|
6.4
|
|
$
|
5.2
|
|
$
|
4.8
|
|
$
|
3.1
|
|
$
|
2.9
|
|
||||
|
Goodwill impairment charges
|
—
|
|
5.6
|
|
—
|
|
—
|
|
279.0
|
|
|||||||||
|
Intangible impairment charges
|
—
|
|
—
|
|
—
|
|
57.7
|
|
32.6
|
|
|||||||||
|
Property, plant and equipment impairment charges
|
—
|
|
—
|
|
—
|
|
8.7
|
|
3.2
|
|
|||||||||
|
Rebranding and transitional costs
|
—
|
|
—
|
|
0.9
|
|
8.4
|
|
—
|
|
|||||||||
|
Charges for product transition, product
discontinuances and inventory mark-downs
|
—
|
|
1.0
|
|
6.6
|
|
16.9
|
|
29.8
|
|
|||||||||
|
Amortization of purchased technology and intangible
assets
|
1.0
|
|
2.3
|
|
3.4
|
|
12.3
|
|
12.7
|
|
|||||||||
|
Restructuring charges
|
3.1
|
|
2.3
|
|
15.4
|
|
7.1
|
|
8.2
|
|
|||||||||
|
Amortization of the fair value adjustments related to
fixed assets and inventory
|
—
|
|
—
|
|
0.2
|
|
0.6
|
|
1.7
|
|
|||||||||
|
Acquired in-process research and development
|
—
|
|
—
|
|
—
|
|
—
|
|
2.4
|
|
|||||||||
|
Gains from sale of building and Telsima acquisition
purchase price settlement
|
—
|
|
—
|
|
—
|
|
(2.2
|
)
|
—
|
|
|||||||||
|
NetBoss bad debt expenses and other
|
—
|
|
0.8
|
|
—
|
|
—
|
|
—
|
|
|||||||||
|
Loss on sale of NetBoss assets
|
—
|
|
—
|
|
4.6
|
|
—
|
|
—
|
|
|||||||||
|
Transactional tax assessments
|
1.4
|
|
0.6
|
|
2.8
|
|
—
|
|
—
|
|
|||||||||
|
Liquidation of entities
|
—
|
|
—
|
|
0.8
|
|
—
|
|
—
|
|
|||||||||
|
Other adjustments
|
(0.7
|
)
|
—
|
|
(0.9
|
)
|
—
|
|
—
|
|
|||||||||
|
$
|
11.2
|
|
$
|
17.8
|
|
$
|
38.6
|
|
$
|
112.6
|
|
$
|
372.5
|
|
|||||
26
Item 7.
Management’s Discussion and Analysis of Financial Condition and Results of Operations
Overview of Business; Operating Environment and Key Factors Impacting Fiscal 2013 and 2014 Results
The following Management’s Discussion and Analysis (“MD&A”) is intended to help the reader understand our results of operations and financial condition. MD&A is provided as a supplement to, and should be read in conjunction with, our consolidated financial statements and the accompanying notes. In the discussion below, our fiscal year ending June 27, 2014 is referred to as “fiscal 2014” or “2014”; our fiscal year ended
June 28, 2013
is referred to as “fiscal
2013
” or “
2013
”; our fiscal year ended
June 29, 2012
is referred to as “fiscal
2012
” or “
2012
”; and our fiscal year ended
July 1, 2011
is referred to as “fiscal
2011
” or “
2011
.”
We generate revenue by designing, developing, manufacturing and supporting a range of wireless networking products, solutions and services for mobile and fixed communications service providers, private network operators, government agencies, transportation and utility companies, public safety agencies and broadcast system operators across the globe. Our products include point-to-point (PTP) digital microwave transmission systems designed for first/last mile access, middle mile/backhaul, and long distance trunking applications. We also provide network management software solutions to enable operators to deploy, monitor and manage our systems, third party equipment such as antennas, routers, and multiplexers, necessary to build and deploy a wireless transmission network, and a full suite of turnkey support services.
We work continuously to improve our established brands and to create new products that meet our customers’ evolving needs and preferences. Our fundamental business goal is to generate superior returns for our stockholders over the long term. We believe that increases in revenue, operating profits and earnings per share are the key measures of financial performance for our business.
Our strategic focus in fiscal 2014 will be to continue to accelerate innovation and optimize our product portfolio, improve costs and operational efficiencies, grow our revenue and create a sustainable, profitable business model. To do this, we have examined our products, markets, facilities, development programs, and operational flows to ensure we are focused on what we do well and what will differentiate us in the future. We will continue working to streamline management processes to attain the efficiency levels required by the markets in which we do business.
Although the general trend of increasing demand for bandwidth to support mobile networks applies in all markets, we expect to see quarter-to-quarter fluctuations within markets and with individual customers based on customers' past purchasing patterns. Seasonality is also a factor that impacts our business. Our fiscal third quarter revenue and orders have historically been lower than the revenue and orders in our second fiscal quarter because many of our customers utilize a significant portion of their capital budgets at the end of their fiscal years, which is typically the calendar year end and coincides with our second fiscal quarter. The majority of our customers begin a new fiscal year on January 1, and capital expenditures tend to be lower in an organization’s first quarter than in its fourth quarter. We anticipate that this seasonality will continue. The seasonality between the second quarter and third quarter may be affected by a variety of additional factors, including changes in the global economy and other factors.
During fiscal 2014, we expect to provide increased managed services to certain customers in certain geographies. Our operating results may be impacted by the provision of these services to the extent that we incur upfront and ongoing expenses associated with the provision of these services that are not offset with additional revenue from product sales associated with these services until a future period.
Please refer to the section entitled “Risk Factors” in Item 1A in this Annual Report on Form 10-K.
Operations Review
During fiscal 2013, we secured orders and continued to expand our footprint with our customers in the mobile operator market using our current technology and service capabilities. The market for mobile backhaul continues to be our primary addressable market segment and the demand for increasing the backhaul capacity in our customers' networks continues to grow in line with our expectations. In fiscal 2013 we saw sustained demand in North America as we supported the long-term evolution (“LTE”) deployments of our mobile operator customers. Internationally, our business continued to rely on a combination of customers increasing their capacity to handle subscriber growth, the ongoing build-out of some large 3G deployments, and the emergence of early stage LTE deployments. Our objective continues to be to position Aviat Networks to support our customers for LTE readiness and to ensure that our technology roadmap is well aligned with evolving market requirements. We continue to find that our strength in turnkey and after-sale support services is a differentiating factor in serving new business and enabling us to expand our business with existing customers across all markets. During fiscal 2013, our growth in revenue over fiscal 2012 was predominantly attributable to an increase in service orders in North America and
27
Africa. However, as disclosed above and in the “Risk Factors” section in Item 1A of this Annual Report on Form 10-K, a number of factors could prevent us from achieving our objectives, including ongoing pricing pressures attributable to competition and macroeconomic conditions in the geographic markets that we service.
During fiscal 2013, we incurred restructuring expenses that were taken to reduce our operational costs. We intend to complete a majority of the remaining restructuring activities under the Fiscal 2013-2014 Plan during fiscal 2014. See “Restructuring Charges” below.
Revenue
We manage our sales activities primarily on a geographic basis in North America and three international geographic regions: (1) Africa and Middle East, (2) Europe and Russia and (3) Latin America and Asia Pacific. Revenue by region for fiscal
2013, 2012 and 2011
and the related changes are shown in the table below:
|
|
Fiscal Year
|
$ Change
|
% Change
|
||||||||||||||||||||||
|
(In millions, except percentages)
|
2013
|
2012
|
2011
|
2013 /2012
|
2012 /2011
|
2013 /2012
|
2012 /2011
|
||||||||||||||||||
|
North America
|
$
|
180.5
|
|
$
|
164.9
|
|
$
|
160.4
|
|
$
|
15.6
|
|
$
|
4.5
|
|
9.5
|
%
|
2.8
|
%
|
||||||
|
Africa and Middle East
|
182.2
|
|
147.7
|
|
143.6
|
|
34.5
|
|
4.1
|
|
23.4
|
%
|
2.9
|
%
|
|||||||||||
|
Europe and Russia
|
48.0
|
|
53.6
|
|
73.4
|
|
(5.6
|
)
|
(19.8
|
)
|
(10.4
|
)%
|
(27.0
|
)%
|
|||||||||||
|
Latin America and Asia Pacific
|
60.6
|
|
77.8
|
|
74.7
|
|
(17.2
|
)
|
3.1
|
|
(22.1
|
)%
|
4.1
|
%
|
|||||||||||
|
Total Revenue
|
$
|
471.3
|
|
$
|
444.0
|
|
$
|
452.1
|
|
$
|
27.3
|
|
$
|
(8.1
|
)
|
6.1
|
%
|
(1.8
|
)%
|
||||||
Our revenue in North America increased
$15.6 million
, or
9.5%
, in fiscal
2013
compared with fiscal
2012
. In fiscal 2013, we saw improved sales to North American mobile operators which were attributable to their ongoing buildout of LTE networks in the region. At the same time, North America sales to non-mobile customers, such as power utilities and state and local government private networks, were flat in fiscal 2013 compared with fiscal 2012.
Our revenue in North America increased
$4.5 million
, or
2.8%
, in fiscal
2012
compared with fiscal
2011
. We have seen substantial changes in product mix of our sales in this region from year to year. The bulk of our product revenue in North America came from our Eclipse product platform, whereas in the first half of fiscal 2011, our legacy products made up a significant portion of the region's sales. The revenue growth and product mix changes reflect continued success in transitioning our customer base to the new product platform as well as an increase in our services business from major customers in fiscal 2012.
Our revenue in Africa and Middle East increased
$34.5 million
, or
23.4%
, in fiscal 2013 compared with fiscal 2012. The majority of the increase came in the first half of fiscal 2013 and was attributable to demand from mobile operator customers in Africa investing in network transmission capacity in order to accommodate growth in network data traffic and to increase their service competitiveness. Revenue from mobile operators in Europe and Russia declined
$5.6 million
, or
10.4%
, in fiscal 2013 compared with fiscal 2012. We believe the decrease was related to economic difficulties experienced generally throughout Europe. Revenue in Latin America and Asia Pacific declined
$17.2 million
, or
22.1%
, in fiscal 2013 compared with fiscal 2012. The decrease was primarily due to a decline in customer purchases in Asia as some of our larger customers, who are beginning to roll out LTE service, continue to deploy large orders that we delivered in the past year.
Our international revenue declined
$12.6 million
, or
4.3%
, in fiscal
2012
compared with fiscal 2011. Our business in Asia and Latin America showed improvement in fiscal 2012 from increased orders from network operators. However, our sales in Europe and Russia were down from fiscal 2011 primarily due to the reduction of business with a major customer in Russia who took substantial deliveries in fiscal 2011, partially offset by increased orders and sales to wireless network operators in other European countries. In fiscal 2012, we experienced substantially increased sales with our long-term customers in Africa, offsetting the reduced volume in the Middle East. Africa continued to be our strongest international sector, where we continued to compete successfully for wireless infrastructure business of large network operators, particularly in West Africa.
Our revenue from product sales increased
$1.2 million
, or
0.4%
, in fiscal 2013 compared with fiscal 2012. The increase came primarily from strong sales in Africa, offset in part by reductions in Asia Pacific, Europe and a small year-to-year decrease in North America. Our services revenue increased
$26.1 million
, or
24.1%
, in fiscal 2013 compared with fiscal 2012. The increase in fiscal 2013 came from additional services delivered in North America, Africa and a small increase in Europe, offset in part by a decrease in Asia Pacific.
28
Our revenue from product sales decreased
$22.0 million
, or
6.2%
, in fiscal 2012 compared with fiscal 2011. Product sales were lower in Europe and Russia and North America, offset in part by gains in Asia Pacific and Middle East Africa. Our services revenue increased
$13.9 million
, or
14.7%
, in fiscal 2012 compared with fiscal 2011. The increase in fiscal 2012 came from additional services delivered in North America, due to a growth in demand for our network services and support in the region, Africa and Middle East, offset in part by a decrease in Asia Pacific and Latin America.
During fiscal
2013
, the MTN Group in Africa accounted for
25%
of our total revenue compared with
17%
in fiscal
2012
and
14%
in fiscal
2011
. We have entered into separate and distinct contracts with MTN Group as well as separate arrangements with MTN Group subsidiaries. For fiscal 2013, revenue from Verizon Wireless accounted for
11%
of our total revenue. The loss of all or a substantial portion of MTN Group's business or of Verizon Wireless' business could adversely affect our results of operations, cash flows and financial position.
Gross Margin
|
|
Fiscal Year
|
$ Change
|
% Change
|
||||||||||||||||||||||
|
(In millions, except percentages)
|
2013
|
2012
|
2011
|
2013 /2012
|
2012 /2011
|
2013 /2012
|
2012 /2011
|
||||||||||||||||||
|
Revenue
|
$
|
471.3
|
|
$
|
444.0
|
|
$
|
452.1
|
|
$
|
27.3
|
|
$
|
(8.1
|
)
|
6.1
|
%
|
(1.8
|
)%
|
||||||
|
Cost of revenue
|
331.2
|
|
312.3
|
|
324.0
|
|
18.9
|
|
(11.7
|
)
|
6.1
|
%
|
(3.6
|
)%
|
|||||||||||
|
Gross margin
|
$
|
140.1
|
|
$
|
131.7
|
|
$
|
128.1
|
|
8.4
|
|
3.6
|
|
6.4
|
%
|
2.8
|
%
|
||||||||
|
% of revenue
|
29.7
|
%
|
29.7
|
%
|
28.3
|
%
|
|||||||||||||||||||
|
Product margin %
|
28.8
|
%
|
30.4
|
%
|
29.2
|
%
|
|||||||||||||||||||
|
Service margin %
|
31.9
|
%
|
27.4
|
%
|
24.9
|
%
|
|||||||||||||||||||
Gross margin for fiscal
2013
increased
$8.4 million
, or
6.4%
, compared with fiscal
2012
, primarily due to higher sales volume. Gross margin as a percentage of revenue remained approximately the same in fiscal 2013 compared with fiscal
2012
. Product margin as a percentage of product revenue for fiscal 2013 decreased
1.6%
compared with fiscal 2012. The slight reduction resulted from competitive pricing pressures in the international markets, offset in part by a small increase in margin on product sales in North America. Service margin as a percentage of service revenue for fiscal 2013 increased
4.5%
compared with fiscal 2012. Service revenue volume increased substantially in fiscal 2013, which enabled us to spread our fixed costs over a larger base of service business in North America as well as in international markets, resulting in improved service margin rate.
Gross margin for fiscal 2012 increased
$3.6 million
, or
2.8%
, compared with fiscal 2011. Gross margin as a percentage of revenue increased
1.4%
compared with fiscal 2011. The year-over-year gross margin improvement was primarily due to the absence in fiscal 2012 of a $6.0 million one-time charge related to manufacturing overhead that we recorded in the first quarter of fiscal 2011 and to the absence of large inventory write-downs, which we incurred in fiscal 2011 as we transitioned out of the legacy products.
Prior to fiscal 2011, we capitalized most of the costs associated with our internal manufacturing operations as a component of the overall cost of product inventory. Beginning in the first quarter of fiscal 2011, we shifted the manufacturing of our products primarily to contract manufacturers and completed the transfer by the end of fiscal 2011. Accordingly, the costs associated with our internal operations organization are now expensed as incurred. Gross margin in fiscal 2011 was negatively affected by the immediate expensing of $6.0 million of such previously capitalized costs in the first quarter of fiscal 2011.
Exclusive of the net impact from these charges, the gross margin and gross margin as a percentage of revenue in fiscal 2012 were lower than fiscal 2011 due to competitive pricing pressures and a small shift in the mix of our business toward services, which caused a small decline in the fiscal 2012 gross margin rate.
The general business trends of strong price competition for new business in all regions and major customer consolidations continue to put pressure on our gross margin. We expect our gross margin as a percentage of revenue to decline in the first quarter of fiscal 2014 due to anticipated geographic mix changes in the quarter and timing of long-term project completions. In the second quarter of fiscal 2014, we expect gross margin as a percentage of revenue to be in line with levels we generally experienced in fiscal 2013. In the second half of fiscal 2014 and beyond, we anticipate a directional improvement in gross margin rates as a result of the transition to our next generation products.
Research and Development Expenses
29
|
|
Fiscal Year
|
$ Change
|
% Change
|
||||||||||||||||||||||
|
(In millions, except percentages)
|
2013
|
2012
|
2011
|
2013 /2012
|
2012 /2011
|
2013 /2012
|
2012 /2011
|
||||||||||||||||||
|
Research and development expenses
|
$
|
39.4
|
|
$
|
36.0
|
|
$
|
40.5
|
|
$
|
3.4
|
|
$
|
(4.5
|
)
|
9.4
|
%
|
(11.1
|
)%
|
||||||
|
% of revenue
|
8.4
|
%
|
8.1
|
%
|
9.0
|
%
|
|||||||||||||||||||
Our R&D expenses increased
$3.4 million
, or
9.4%
, in fiscal
2013
compared with fiscal
2012
. As a percentage of revenue, R&D expenses also increased to
8.4%
in fiscal
2013
from
8.1%
in fiscal
2012
. The increase in R&D expenses of
$3.4 million
consisted primarily of a $2.0 million increase of personnel expenses and a $0.6 million increase in material supplies due to our investment in new product development. In addition, depreciation expenses increased by $0.4 million due to additions of new lab equipment. We continue to invest in new product features, new functionality and lower cost platforms that we believe will enable our product lines to retain their technology leads in a cost effective manner.
Our R&D expenses declined
$4.5 million
, or
11.1%
, in fiscal 2012 compared with fiscal 2011. As a percentage of revenue, R&D expenses also decreased to
8.1%
in fiscal 2012 from
9.0%
in fiscal 2011. The decrease in R&D expenses of
$4.5 million
, consisting mostly of personnel expenses, was primarily due to restructuring of our research and development workforce in prior years. In addition, share-based compensation expense in fiscal 2011 was higher by
$1.0 million
due to vesting of performance shares upon the achievement of new product development milestones in fiscal 2011.
Selling and Administrative Expenses
|
|
Fiscal Year
|
$ Change
|
% Change
|
||||||||||||||||||||||
|
(In millions, except percentages)
|
2013
|
2012
|
2011
|
2013 /2012
|
2012 /2011
|
2013 /2012
|
2012 /2011
|
||||||||||||||||||
|
Selling and administrative
expenses
|
$
|
95.5
|
|
$
|
99.5
|
|
$
|
107.6
|
|
$
|
(4.0
|
)
|
$
|
(8.1
|
)
|
(4.0
|
)%
|
(7.5
|
)%
|
||||||
|
% of revenue
|
20.3
|
%
|
22.4
|
%
|
23.8
|
%
|
|||||||||||||||||||
Our selling and administrative expenses declined
$4.0 million
, or
4.0%
, in fiscal
2013
compared with fiscal
2012
. The decrease was due primarily to a $2.1 million reduction in professional services, a $1.2 million reduction in personnel expenses, a $1.4 million reduction in telecommunications expense and a $0.7 million reduction in bad debt expenses, partially offset by a
$1.3 million
increase in share-based compensation expenses and a $0.8 million increase in transactional taxes assessments related to certain international entities. We will continue to seek ways to improve our operating efficiency in fiscal 2014.
Our selling and administrative expenses declined
$8.1 million
, or
7.5%
, in fiscal
2012
compared with fiscal
2011
. The decrease was due primarily to a $2.6 million reduction in sales and administrative compensation expenses and a $0.4 million decrease in facility expenses as a result of the restructuring programs we implemented, a $2.0 million decrease in agent commission expenses driven by lower fee-based revenues, and a decrease of $1.1 million in expenses for information technology projects, partially offset by an increase of $1.3 million in share-based compensation.
Restructuring Charges
During the fourth quarter of fiscal 2013, we initiated a restructuring plan (the “Fiscal 2013-2014 Plan”) that was intended to bring our cost structure in line with the changing business environment of the worldwide microwave radio and telecommunication markets, primarily in North America, Europe and Asia. Activities under the Fiscal 2013-2014 Plan included the downsizing of our Santa Clara, California headquarters and certain international field offices, and reductions in force to reduce our operating expenses.
During the first quarter of fiscal 2011, we initiated the Fiscal 2011 Plan to reduce our operational costs primarily in North America, Europe and Asia. Activities under the Fiscal 2011 Plan included the reductions in force to reduce our operating expenses and downsizing or closures of our Morrisville, North Carolina, Santa Clara, California, Montreal, Canada offices and certain international field offices. The Fiscal 2011 Plan has been completed as of the end of fiscal 2013.
Earlier in fiscal 2009, we commenced a restructuring plan (the “Fiscal 2009 Plan”) to reduce our workforce in the U.S., France, Canada and other locations throughout the world and outsource our San Antonio manufacturing operations to a third party in Austin, Texas. The Fiscal 2009 Plan was completed as of the end of fiscal 2011.
Our restructuring charges by plan for fiscal
2013, 2012 and 2011
are summarized in the table below:
30
|
|
Fiscal Year
|
$ Change
|
% Change
|
||||||||||||||||||||||
|
(In millions, except percentages)
|
2013
|
2012
|
2011
|
2013 /2012
|
2012 /2011
|
2013 /2012
|
2012 /2011
|
||||||||||||||||||
|
Restructuring charges:
|
$
|
3.1
|
|
$
|
2.3
|
|
$
|
15.4
|
|
$
|
0.8
|
|
$
|
(13.1
|
)
|
34.8
|
%
|
(85.1
|
)%
|
||||||
|
By Plan:
|
|||||||||||||||||||||||||
|
Fiscal 2013-2014 Plan
|
1.8
|
|
—
|
|
—
|
|
1.8
|
|
—
|
|
N/A
|
|
N/A
|
|
|||||||||||
|
Fiscal 2011 Plan
|
1.3
|
|
2.3
|
|
12.7
|
|
(1.0
|
)
|
(10.4
|
)
|
(43.5
|
)%
|
(81.9
|
)%
|
|||||||||||
|
Fiscal 2009 Plan
|
—
|
|
—
|
|
2.7
|
|
—
|
|
(2.7
|
)
|
N/A
|
|
(100.0
|
)%
|
|||||||||||
Our restructuring expenses consisted primarily of severance and related benefit charges and, to a lesser extent, facilities costs related to obligations under non-cancelable leases for facilities that we ceased to use. Restructuring charges increased by
$0.8 million
in fiscal
2013
compared with fiscal
2012
primarily due to employee termination benefits related to the initiation of the Fiscal 2013-2014 Plan, partially offset by the absence of a
$1.3 million
facilities charge in fiscal 2012 associated with the sublease and relocation of our Morrisville, North Carolina facility. We intend to complete a majority of the remaining restructuring activities under the Fiscal 2013-2014 Plan in fiscal 2014.
Restructuring charges declined significantly by
$13.1 million
in fiscal 2012 compared with fiscal 2011. The changes were due to the completion of Fiscal 2009 Plan in fiscal 2011 and the fact that major restructuring activities under the Fiscal 2011 Plan, such as the downsizing of our Morrisville, North Carolina office, occurred in fiscal 2011.
Other Income (Loss), Interest Income and Interest Expense
|
|
Fiscal Year
|
||||||||||
|
(In millions)
|
2013
|
2012
|
2011
|
||||||||
|
Loss on sale of NetBoss assets
|
$
|
—
|
|
$
|
—
|
|
$
|
(4.6
|
)
|
||
|
Other income, net
|
0.7
|
|
—
|
|
—
|
|
|||||
|
Interest income
|
0.8
|
|
0.6
|
|
0.3
|
|
|||||
|
Interest expense
|
(0.8
|
)
|
(1.3
|
)
|
(2.2
|
)
|
|||||
Other income of
$0.7 million
for fiscal 2013 reflected a nonrecurring benefit related to a customer contract.
Interest income reflected interest earned on our cash equivalents which were comprised of money market funds and certificates of deposit.
Interest expense was primarily related to interest associated with borrowings, term loan and letters of credit under our credit facility and, in fiscal 2012 and fiscal 2011, also included preference dividends on our $8.25 million redeemable preference shares. The $8.25 million preference shares were redeemed at their carrying value on January 30, 2012, funded by a two-year term loan of $8.25 million under our credit facility at a fixed interest rate of 5% per annum.
Income Taxes
|
|
Fiscal Year
|
$ Change
|
|||||||||||||||||
|
(In millions, except percentages)
|
2013
|
2012
|
2011
|
2013 /2012
|
2012 /2011
|
||||||||||||||
|
Income (loss) from continuing operations before income taxes
|
$
|
2.4
|
|
$
|
(14.0
|
)
|
$
|
(44.7
|
)
|
$
|
16.4
|
|
$
|
30.7
|
|
||||
|
Provision for income taxes
|
13.3
|
|
1.5
|
|
14.1
|
|
11.8
|
|
(12.6
|
)
|
|||||||||
|
As % of income (loss) from continuing operations
before income taxes
|
561.1
|
%
|
(10.8
|
)%
|
(31.5
|
)%
|
|||||||||||||
The income tax expense from continuing operations for fiscal 2013 was
$13.3 million
. The variation between our income tax expense from continuing operations and income tax expense at the statutory rate of
35%
on our pre-tax income of
$2.4 million
was primarily attributable to a
$11.7 million
increase in our reserves for uncertain tax positions, losses in tax jurisdictions in which we cannot recognize a tax benefit and increase in foreign withholding taxes. The increase in our unrecognized tax benefits was the result of additional information obtained during recent tax examinations in certain countries.
The income tax expense from continuing operations for fiscal 2012 was
$1.5 million
. The variation between our income tax expense from continuing operations and income tax benefit at the statutory rate of
35%
on our pre-tax loss of
$14.0 million
31
was primarily attributable to losses in tax jurisdictions in which we cannot recognize a tax benefit. The tax expense for fiscal 2012 of
$1.5 million
was primarily attributable to profitable foreign entities for which we have accrued income taxes.
The income tax expense from continuing operations for fiscal 2011 was
$14.1 million
. The variation between our income tax expense from continuing operations and income tax benefit at the statutory rate of
35%
on our pre-tax loss of
$44.7 million
was primarily due to an $11.3 million increase in valuation allowance for Singapore deferred tax assets as of the beginning of fiscal 2011 and a $1.4 million foreign branch withholding tax accrual. The expense was partially offset by a valuation allowance release of $1.6 million on Mexico deferred tax assets as of the beginning of fiscal 2011.
Loss from Discontinued Operations
|
|
Fiscal Year
|
$ Change
|
|||||||||||||||||
|
(In millions)
|
2013
|
2012
|
2011
|
2013 /2012
|
2012 /2011
|
||||||||||||||
|
Loss from discontinued operations, net of tax
|
$
|
(4.1
|
)
|
$
|
(8.6
|
)
|
$
|
(31.7
|
)
|
$
|
4.5
|
|
$
|
23.1
|
|
||||
Our discontinued operations consist of our WiMAX business, which was sold to EION Networks, Inc. (“EION”) on September 2, 2011. We completed the business transition with EION in fiscal 2012. The loss from discontinued operations decreased
$4.5 million
in fiscal 2013 compared with fiscal 2012. The loss incurred in fiscal 2013 was primarily due to $4.2 million write-downs of certain WiMAX deferred cost of sales that were not transferred to EION and certain expenses we incurred to support a remaining customer obligation. The loss was partially offset by a $0.3 million write down of our payable to EION related to customer receivables and $0.1 million contingent payments we received from EION.
The loss in fiscal 2012 included operating expenses we incurred to transition the business and a
$1.9 million
loss on disposition of the WiMAX business. The loss from discontinued operations decreased
$23.1 million
in fiscal 2012 compared with fiscal 2011. The decrease resulted primarily from the absence of large charges for provisions for excess and obsolete inventories and noncancellable purchase commitments which we incurred in fiscal 2011 when we decided to exit the WiMAX business, partially offset by higher WiMAX revenue in fiscal 2011. The loss in fiscal 2011 also included a $9.5 million loss on WiMAX assets held for sale.
Liquidity, Capital Resources and Financial Strategies
Sources of Cash
As of
June 28, 2013
, our total cash and cash equivalents were $
90.0 million
. Approximately
$30.8 million
, or
34.2%
, was held by entities domiciled in the United States. The remaining balance of
$59.2 million
, or
65.8%
, was held by entities outside the United States. Of the amount of cash and cash equivalents held by our foreign subsidiaries at
June 28, 2013
,
$48.2 million
was held in jurisdictions where our undistributed earnings are indefinitely reinvested, and would be subject to U.S. taxes if repatriated.
As of
June 28, 2013
, our principal sources of liquidity consisted of the $
90.0 million
in cash and cash equivalents,
$26.0 million
of available credit under our $40.0 million credit facility with Silicon Valley Bank (“SVB”), and future collections of receivables from customers. We regularly require letters of credit from some customers and, from time to time, these letters of credit are discounted without recourse shortly after shipment occurs in order to meet immediate liquidity requirements and to reduce our credit and sovereign risk. Historically our primary sources of liquidity have been cash flows from operations, credit facilities and cash proceeds from sale of our equity securities. During fiscal 2013, our total cash and cash equivalents decreased by $
6.0 million
primarily due to
$10.4 million
of cash used for capital expenditures and
$4.1 million
repayment on our long-term debt, partially offset by
$8.4 million
of cash provided by operating activities.
Cash provided by operating activities was $
8.4 million
in fiscal 2013 primarily due to decreases in inventories of
$14.9 million
and in receivables of
$1.9 million
, an increase in reserve for uncertain tax positions and deferred income taxes of
$11.5 million
, and taking into account our net loss of
$15.0 million
adjusted by non-cash expense items of
$22.7 million
, partially offset by decreases in accounts payable and accrued expenses of
$10.3 million
, in customer advance payments and unearned income of
$14.1 million
, and an increase in unbilled costs of
$3.1 million
. The decrease in our inventory was due to improvement of supply chain efficiency and a reduction in deferred cost of sales due to timing of revenue recognition on several large contracts. Our accounts receivable decreased during fiscal 2013 primarily due to strong collections from customers. The decrease in accounts payable and accrued expenses was primarily due to the timing of payments to our contract manufacturers and suppliers. The decrease in customer advance payments and unearned income was due to the timing of
32
revenue recognition on several large contracts. The increase in unbilled costs was due to the timing of billing of projects. We also used
$2.6 million
in cash during fiscal 2013 for restructuring liabilities.
For fiscal 2014, we expect to spend approximately
$10.0 million
for capital expenditures primarily on equipment for development of new products and improvement of our information technology infrastructure which will enable more automated supply chain management and financial reporting and lead to process and cost efficiency and ability to scale our business. During fiscal 2013, we increased our reserve for uncertain tax positions that may require future cash payments from
$4.2 million
to
$15.9 million
and recorded a reserve for transactional taxes of
$1.4 million
. The majority of these tax provisions are related to audits of past years in several foreign jurisdictions where we have not received final assessments. Although we continue to defend our positions and will continue with the appeal processes, we could receive demand for cash tax payments up to $20.0 million from one or more of these jurisdictions during fiscal 2014. We expect tax payments during the first two quarters of fiscal 2014 to be approximately
$3.6 million
and we are not able to estimate the timing and amount of the remaining tax payments.
We believe that our existing cash and cash equivalents, the available line of credit under our credit facility and future cash collections from customers will be sufficient to provide for our anticipated requirements for working capital and capital expenditures for the next 12 months and the foreseeable future. There can be no assurance, however, that our business will generate cash flow, or that anticipated operational improvements will be achieved. If we are unable to maintain cash balances or generate sufficient cash flow from operations to service our obligations or liability for uncertain tax positions that may arise in the future, we may be required to sell assets, reduce capital expenditures, or obtain financing. If we need to obtain additional financing, we cannot be assured that it will be available on favorable terms, or at all. Our ability to make scheduled principal payments or pay interest on or refinance any future indebtedness depends on our future performance and financial results, which, to a certain extent, are subject to general conditions in or affecting the microwave communications market and to general economic, political, financial, competitive, legislative and regulatory factors beyond our control.
Available Credit Facility, Borrowings and Repayment of Debt
As of
June 28, 2013
, we had $
26.0 million
of credit available under our credit facility with SVB and had $
8.8 million
in outstanding borrowings and $
5.2 million
in outstanding standby letters of credit issued under the credit facility.
In an amendment to the facility effective November 2, 2011, the commitment of $40.0 million under the credit facility was extended to expire on February 28, 2014 and provides for (1) advance borrowings at the prime rate published in the
Wall Street Journal
, (2) fixed term Eurodollar loans for up to six months at LIBOR plus a spread of between 2.00% to 2.75% based on the Company’s current leverage ratio, (3) a two-year term loan in the amount of $8.3 million at a fixed rate of 5% per annum expiring on January 31, 2014, and (4) the issuance of standby or commercial letters of credit. As of
June 28, 2013
, we had $6.0 million advance borrowings under the credit facility and $2.8 million outstanding balance for the term loan. The term loan drawn on January 30, 2012 is repaid in 24 equal monthly installments of principal plus accrued interest commencing February 29, 2012. The credit facility contains a minimum liquidity ratio covenant and a minimum profitability covenant and is secured by certain of the Company’s assets, including accounts receivable, inventory and equipment. The credit facility also imposes certain restrictions on our ability to pay dividends or make distributions to our stockholders under certain circumstances.
Based on financial covenants included as part of the amended credit facility effective September 28, 2012, we must maintain, as measured at the last day of each fiscal quarter beginning September 28, 2012 through December 27, 2013, (1) no less than a minimum liquidity ratio of 1.50 to 1 (defined as the ratio of total domestic unrestricted cash and cash equivalents plus short-term and long-term marketable securities plus the lesser of 25% of eligible accounts receivable or $12.5 million to total obligations outstanding with the bank) and (2) minimum consolidated EBITDA measured for each fiscal quarter. As of
June 28, 2013
, we were in compliance with these financial covenants.
Restructuring Payments
We have a liability for restructuring activities totaling $
2.7 million
as of
June 28, 2013
,
$2.3 million
of which is classified as current liability and expected to be paid out in cash over the next year. We expect to fund these future payments with available cash and cash flow provided by operations.
Contractual Obligations
As of
June 28, 2013
, cash payments due under our contractual obligations are estimated as follows:
33
|
|
Obligations Due by Fiscal Year
|
||||||||||||||||||||||
|
(In millions)
|
Total
|
2014
|
2015-2016
|
2017-2018
|
After 2018
|
Other
|
|||||||||||||||||
|
Advance borrowings
|
$
|
6.0
|
|
$
|
6.0
|
|
$
|
—
|
|
$
|
—
|
|
$
|
—
|
|
$
|
—
|
|
|||||
|
Current portion of long-term debt
|
2.8
|
|
2.8
|
|
—
|
|
—
|
|
—
|
|
—
|
|
|||||||||||
|
Interest on long-term debt
(1)(4)
|
0.1
|
|
0.1
|
|
—
|
|
—
|
|
—
|
|
—
|
|
|||||||||||
|
Purchase obligations
(2)(4)
|
61.5
|
|
54.9
|
|
6.6
|
|
—
|
|
—
|
|
—
|
|
|||||||||||
|
Other purchase obligations
(4)
|
5.0
|
|
4.3
|
|
0.5
|
|
0.2
|
|
—
|
|
|||||||||||||
|
Operating lease commitments
(4)
|
24.5
|
|
5.6
|
|
8.0
|
|
5.8
|
|
5.1
|
|
—
|
|
|||||||||||
|
Capital lease commitments
|
0.3
|
|
0.3
|
|
—
|
|
—
|
|
—
|
|
—
|
|
|||||||||||
|
Liabilities for uncertain tax positions
(3)
|
15.9
|
|
3.6
|
|
—
|
|
—
|
|
—
|
|
12.3
|
|
|||||||||||
|
Total contractual cash obligations
|
$
|
116.1
|
|
$
|
77.6
|
|
$
|
15.1
|
|
$
|
6.0
|
|
$
|
5.1
|
|
$
|
12.3
|
|
|||||
___________________________
|
(1)
|
The interest rate is 5% per annum on the two-year term loan expiring on January 31, 2014.
|
|
(2)
|
From time to time in the normal course of business we may enter into purchasing agreements with our suppliers that require us to accept delivery of, and remit full payment for, finished products that we have ordered, finished products that we requested be held as safety stock, and work in process started on our behalf in the event we cancel or terminate the purchasing agreement. It is not our intent, nor is it reasonably likely, that we would cancel a purchase order that we have executed. Because these agreements do not specify fixed or minimum quantities, do not specify minimum or variable price provisions, and do not specify the approximate timing of the transaction, we have no basis to estimate any future liability under these agreements and have therefore excluded them from the table above.
|
|
(3)
|
Liabilities for uncertain tax positions of
$15.9 million
were included in long-term liabilities in the consolidated balance sheet. At this time, we are unable to make a reasonably reliable estimate of the timing of payments related to this amount due to uncertainties in the timing of tax audit outcomes.
|
|
(4)
|
These items are not recorded on our balance sheet.
|
Commercial Commitments
We have entered into commercial commitments in the normal course of business including surety bonds, standby letters of credit and other arrangements with financial institutions and insurers primarily relating to the guarantee of future performance on certain tenders and contracts to provide products and services to customers. As of
June 28, 2013
, we had commercial commitments on outstanding surety bonds and standby letters of credit as follows:
|
|
Expiration of Commitments by Fiscal Year
|
||||||||||||||||||
|
(In millions)
|
Total
|
2014
|
2015
|
2016
|
After 2016
|
||||||||||||||
|
Standby letters of credit used for:
|
|||||||||||||||||||
|
Bids
|
$
|
0.4
|
|
$
|
0.4
|
|
$
|
—
|
|
$
|
—
|
|
$
|
—
|
|
||||
|
Payment guarantees
|
0.3
|
|
0.1
|
|
—
|
|
—
|
|
0.2
|
|
|||||||||
|
Performance
|
5.4
|
|
4.8
|
|
0.5
|
|
—
|
|
0.1
|
|
|||||||||
|
6.1
|
|
5.3
|
|
0.5
|
|
—
|
|
0.3
|
|
||||||||||
|
Surety bonds used for:
|
|||||||||||||||||||
|
Bids
|
0.5
|
|
0.5
|
|
—
|
|
—
|
|
—
|
|
|||||||||
|
Tax and payment guarantees
|
5.6
|
|
5.6
|
|
—
|
|
—
|
|
—
|
|
|||||||||
|
Performance
|
41.8
|
|
24.6
|
|
17.2
|
|
—
|
|
—
|
|
|||||||||
|
47.9
|
|
30.7
|
|
17.2
|
|
—
|
|
—
|
|
||||||||||
|
Total commercial commitments
|
$
|
54.0
|
|
$
|
36.0
|
|
$
|
17.7
|
|
$
|
—
|
|
$
|
0.3
|
|
||||
As we have not historically had to pay out on any of our performance guarantees, the outstanding commercial commitments have not been recorded on our consolidated balance sheet.
Off-Balance Sheet Arrangements
34
In accordance with the definition under SEC rules (Item 303(a) (4) (ii) of Regulation S-K), any of the following qualify as off-balance sheet arrangements:
|
•
|
any obligation under certain guarantee contracts;
|
|
•
|
a retained or contingent interest in assets transferred to an unconsolidated entity or similar entity or similar arrangement that serves as credit, liquidity or market risk support to that entity for such assets;
|
|
•
|
any obligation, including a contingent obligation, under certain derivative instruments; and
|
|
•
|
any obligation, including a contingent obligation, under a material variable interest held by the registrant in an unconsolidated entity that provides financing, liquidity, market risk or credit risk support to the registrant, or engages in leasing, hedging or research and development services with the registrant.
|
Currently we are not participating in transactions that generate relationships with unconsolidated entities or financial partnerships, including variable interest entities, and we do not have any material retained or contingent interest in assets as defined above. As of
June 28, 2013
, we did not have material financial guarantees or other contractual commitments that are reasonably likely to adversely affect liquidity. In addition, we are not currently a party to any related party transactions that materially affect our results of operations, cash flows or financial condition.
Due to the downsizing of certain of our operations pursuant to divestitures, restructuring plans or otherwise, some properties leased by us have been sublet to third parties. In the event any of these third parties vacate any of these premises, we would be legally obligated under master lease arrangements. We believe that the financial risk of default by such sublessors is not likely to be individually or in the aggregate material to our financial position, results of operations or cash flows.
Financial Risk Management
In the normal course of doing business, we are exposed to the risks associated with foreign currency exchange rates and changes in interest rates. We employ established policies and procedures governing the use of financial instruments to manage our exposure to such risks.
Exchange Rate Risk
We conduct business globally in numerous currencies and are therefore exposed to foreign currency risks. We use derivative instruments to reduce the volatility of earnings and cash flows associated with changes in foreign currency exchange rates. We do not hold nor issue derivatives for trading purposes or make speculative investments in foreign currencies.
We use foreign exchange forward contracts to hedge forecasted foreign currency transactions relating to forecasted sales and purchase transactions. These derivatives are designated as cash flow hedges and are carried at fair value. The effective portion of the gain or loss is initially reported as a component of accumulated other comprehensive income (loss), and upon occurrence of the forecasted transaction, is subsequently reclassified into the income or expense line item to which the hedged transaction relates. We also enter into foreign exchange forward contracts to mitigate the change in fair value of specific non-functional currency assets and liabilities on the balance sheet. All balance sheet hedges are marked to market through earnings every period. Changes in the fair value of these derivatives are largely offset by re-measurement of the underlying assets and liabilities.
As of
June 28, 2013
, we had foreign currency forward contracts outstanding with a total net notional amount of
$28.6 million
consisting of 12 different currencies. The following is a summary of the gross notional amount of our outstanding contracts grouped by the underlying foreign currency as of
June 28, 2013
:
35
|
Currency
|
Notional Contract Amount
(Local Currency)
|
Notional
Contract
Amount
(USD)
|
|||||
|
|
(In millions)
|
||||||
|
Australian dollar
|
2.8
|
|
$
|
2.6
|
|
||
|
Canadian dollar
|
0.3
|
|
0.3
|
|
|||
|
Euro
|
3.2
|
|
4.2
|
|
|||
|
Indian rupee
|
137.0
|
|
2.3
|
|
|||
|
Philippine peso
|
132.3
|
|
3.1
|
|
|||
|
Polish zloty
|
38.5
|
|
11.7
|
|
|||
|
Thailand baht
|
17.9
|
|
0.6
|
|
|||
|
Republic of South Africa rand
|
24.8
|
|
2.4
|
|
|||
|
Other currencies
|
N/A
|
|
1.4
|
|
|||
|
Total of all currency forward contracts
|
$
|
28.6
|
|
||||
Net foreign exchange loss recorded in our consolidated statements of operations during fiscal
2013, 2012 and 2011
totaled
$1.5 million
,
$1.5 million
and
$2.6 million
, respectively. A 10% adverse change in currency exchange rates for our foreign currency derivatives held as of
June 28, 2013
would have an impact of approximately $2.0 million on the fair value of such instruments. This quantification of exposure to the market risk associated with foreign exchange financial instruments does not take into account the offsetting impact of changes in the fair value of our foreign denominated assets, liabilities and firm commitments.
Certain of our international business was transacted in non-U.S. dollar currency environments. As discussed above, we utilize foreign currency hedging instruments to minimize the currency risk of international transactions. The impact of translating the assets and liabilities of foreign operations to U.S. dollars is included as a component of stockholders’ equity. As of
June 28, 2013
and
June 29, 2012
, the cumulative translation adjustment decreased our stockholders’ equity by $
3.4 million
and $
4.0 million
, respectively.
Interest Rate Risk
Our exposure to market risk for changes in interest rates relates primarily to our cash equivalents and borrowings under our credit facility.
Exposure on Cash Equivalents
We had $
90.0 million
in total cash and cash equivalents as of
June 28, 2013
. Cash equivalents totaled $
$41.6 million
as of
June 28, 2013
and were comprised of money market funds and certificates of deposit. Cash equivalents have been recorded at fair value on our balance sheet.
We do not use derivative financial instruments in our short-term investment portfolio. We invest in high-credit quality issues and, by policy, limit the amount of credit exposure to any one issuer and country. The portfolio includes only marketable securities with active secondary or resale markets to ensure portfolio liquidity. The portfolio is also diversified by maturity to ensure that funds are readily available as needed to meet our liquidity needs. This policy reduces the potential need to sell securities in order to meet liquidity needs and therefore the potential effect of changing market rates on the value of securities sold.
The primary objective of our short-term investment activities is to preserve principal while maximizing yields, without significantly increasing risk. Our cash equivalents earn interest at fixed rates; therefore, changes in interest rates will not generate a gain or loss on these investments unless they are sold prior to maturity. Actual gains and losses due to the sale of our investments prior to maturity have been immaterial. The weighted average days to maturity for cash equivalents held as of
June 28, 2013
was two days, and these investments had an average yield of 0.33% per annum. A 10% change in interest rates on our cash and cash equivalents is not expected to have a material impact on our financial position, results of operations or cash flows.
Exposure on Borrowings
During fiscal
2013
, we had $6.0 million of demand borrowings outstanding under our credit facility that incurred interest at the prime rate. We also recorded interest on our
$8.3 million
borrowing drawn on January 30, 2012 at the fixed rate of
5%
36
per annum. During fiscal
2013
, our weighted average interest rate was
4%
and we recorded total interest expense of $0.4 million on these borrowings.
A 10% change in interest rates on the current borrowings or on future borrowings is not expected to have a material impact on our financial position, results of operations or cash flows since interest on our borrowings is not material to our overall financial position.
Critical Accounting Estimates
Our consolidated financial statements are prepared in accordance with U.S. GAAP. These accounting principles require us to make certain estimates, judgments and assumptions. We believe that the estimates, judgments and assumptions upon which we rely are reasonable based upon information available to us.
These estimates, judgments and assumptions can affect the reported amounts of assets and liabilities as of the date of the consolidated financial statements as well as the reported amounts of revenues and expenses during the periods presented. To the extent there are material differences between these estimates, judgments or assumptions and actual results, our financial statements will be affected.
The accounting policies that reflect our more significant estimates, judgments and assumptions and which we believe are the most critical to aid in fully understanding and evaluating our reported financial results include the following:
|
•
|
revenue recognition;
|
|
•
|
inventory valuation and provision for excess and obsolete inventory losses;
|
|
•
|
impairment of long-lived assets; and
|
|
•
|
income taxes and tax valuation allowances.
|
In some cases, the accounting treatment of a particular transaction is specifically dictated by U.S. GAAP and does not require management’s judgment in its application. There are also areas in which management’s judgment in selecting among available alternatives would not produce a materially different result. Our senior management has reviewed these critical accounting policies and related disclosures with the Audit Committee of the Board of Directors.
The following is not intended to be a comprehensive list of all of our accounting policies or estimates. Our significant accounting policies are more fully described in “Note 1. The Company and Summary of Significant Accounting Policies” in the notes to consolidated financial statements. In preparing our financial statements and accounting for the underlying transactions and balances, we apply those accounting policies. We consider the estimates discussed below as critical to an understanding of our financial statements because their application places the most significant demands on our judgment, with financial reporting results relying on estimates about the effect of matters that are inherently uncertain.
Besides estimates that meet the “critical” accounting estimate criteria, we make many other accounting estimates in preparing our financial statements and related disclosures. All estimates, whether or not deemed critical, affect reported amounts of assets, liabilities, revenue and expenses as well as disclosures of contingent assets and liabilities. Estimates are based on experience and other information available prior to the issuance of the financial statements. Materially different results can occur as circumstances change and additional information becomes known, including for estimates that we do not deem “critical.”
Revenue Recognition
We generate substantially all of our revenue from the sales or licensing of our microwave radio and wireless access systems, network management software, and professional services including installation and commissioning and training. Principal customers for our products and services include domestic and international wireless/mobile service providers, original equipment manufacturers, distributors, system integrators, as well as private network users such as public safety agencies, government institutions, and utility, pipeline, railroad and other industrial enterprises that operate broadband wireless networks. Our customers generally purchase a combination of our products and services as part of a multiple element arrangement. Our assessment of which revenue recognition guidance is appropriate to account for each element in an arrangement can involve significant judgment. This assessment has a significant impact on the amount and timing of revenue recognition.
Revenue is recognized when all of the following criteria have been met:
|
•
|
Persuasive evidence of an arrangement exists. Contracts and customer purchase orders are generally used to determine the existence of an arrangement.
|
37
|
•
|
Delivery has occurred. Shipping documents and customer acceptance, when applicable, are used to verify delivery.
|
|
•
|
The fee is fixed or determinable. We assess whether the fee is fixed or determinable based on the payment terms associated with the transaction and whether the sales price is subject to refund or adjustment.
|
|
•
|
Collectability is reasonably assured. We use judgment to assess collectability based primarily on the creditworthiness of the customer as determined by credit checks and analysis, as well as the customer’s payment history.
|
We often enter into multiple contractual agreements with the same customer. Such agreements are reviewed to determine whether they should be evaluated as one arrangement. If an arrangement, other than a long-term contract, requires the delivery or performance of multiple deliverables or elements, we determine whether the individual elements represent “separate units of accounting”. The determination as to whether multiple contractual agreements should be evaluated as one arrangement and the identification of units of accounting in an arrangement requires significant judgment and impacts the amount of product and service revenue recognized in a given period.
In accordance with ASC 605-25,
Revenue Recognition
—
Multiple-Element Arrangements,
based on the terms and conditions of the product arrangements, we believe that our products and services can be accounted for separately as our products and services have value to our customers on a stand-alone basis. Accordingly, amounts related to services not yet performed at the time of product shipment are deferred based on their relative selling price and recognized as revenue as such services are performed. The relative selling price of any undelivered products is also deferred at the time of shipment and recognized as revenue when these products are delivered. There is generally no customer right of return in our sales agreements. The sequence for typical multiple-element arrangements is as follows: we deliver our products, perform installation services and then provide post-contract support services.
Vendor-specific objective evidence (“VSOE”) of fair value is based on the price charged when the element is sold separately. For multiple element arrangements, if VSOE cannot be established, we establish, where available, the selling price based on third-party evidence (“TPE”). TPE requires judgment and is determined based on evidence of competitor pricing for similar deliverables when sold separately. When we cannot determine VSOE or TPE, which is typically the case, we use the estimated selling price (“ESP”) in our allocation of arrangement consideration. The objective of ESP is to determine the price at which we would typically transact a stand-alone sale of the product or service. In determining ESP, we apply significant judgment as we weigh a variety of factors including our pricing policies, internal costs and gross margin objectives, method of distribution, information gathered from experience in customer negotiations, market research and information, recent technological trends, competitive landscape and geographies. The determination of ESP is approved by our management taking into consideration our pricing strategy. We regularly review VSOE, TPE and ESP and maintain internal controls over the establishment and updates of these estimates. We do not expect a material impact in future periods from changes in VSOE, TPE or ESP.
Revenues related to long-term contracts for customized network solutions are recognized using the percentage-of-completion method. In using the percentage-of-completion method, we generally apply the cost-to-cost method of accounting where sales and profits are recorded based on the ratio of costs incurred to estimated total costs at completion. Contracts are combined when specific aggregation criteria are met including when the contracts are in substance an arrangement to perform a single project with a customer; the contracts are negotiated as a package in the same economic environment with an overall profit objective; the contracts require interrelated activities with common costs that cannot be separately identified with, or reasonably allocated to the elements, phases or units of output and the contracts are performed concurrently or in a continuous sequence under the same project management at the same location or at different locations in the same general vicinity. Recognition of profit on long-term contracts requires estimates of the total contract value, the total cost at completion and the measurement of progress towards completion. Significant judgment is required when estimating total contract costs and progress to completion on the arrangements as well as whether a loss is expected to be incurred on the contract. Amounts representing contract change orders, claims or other items are included in sales only when they can be reliably estimated and realization is probable. When adjustments in contract value or estimated costs are determined, any changes from prior estimates are reflected in earnings in the current period. Anticipated losses on contracts or programs in progress are charged to earnings when identified.
Inventory Valuation and Provisions for Excess and Obsolete Losses
Our inventories have been valued at the lower of cost or market. We balance the need to maintain prudent inventory levels to ensure competitive delivery performance with the risk of excess or obsolete inventory due to changing technology and customer requirements, and new product introductions. Beginning in the first quarter of fiscal 2011, the manufacturing of our products was handled primarily by contract manufacturers. Our contract manufacturers procure components and manufacture
38
our products based on our forecast of product demand. We regularly review inventory quantities on hand and record a provision for excess and obsolete inventory based primarily on our estimated forecast of product demand, the stage of the product life cycle, anticipated end of product life and production requirements. Several factors may influence the sale and use of our inventories, including decisions to exit a product line, technological change, new product development and competing product offerings. These factors could result in a change in the amount of obsolete inventory quantities on hand. Additionally, our estimates of future product demand may prove to be inaccurate, in which case the provision required for excess and obsolete inventory may be overstated or understated. In the future, if we determine that our inventory is overvalued, we would be required to recognize such costs in cost of product sales and services in our Statement of Operations at the time of such determination. In the case of goods which have been written down below cost at the close of a fiscal quarter, such reduced amount is considered the new lower cost basis for subsequent accounting purposes, and subsequent changes in facts and circumstances do not result in the restoration or increase in that newly established cost basis. We did not make any material changes in the valuation methodology during the past three fiscal years.
Our customer service inventories are stated at the lower of cost or market. We carry service parts because we generally provide product warranty for 12 to 24 months and earn revenue by providing enhanced and extended warranty and repair service during and beyond this warranty period. Customer service inventories consist of both component parts, which are primarily used to repair defective units, and finished units, which are provided for customer use permanently or on a temporary basis while the defective unit is being repaired. We record adjustments to reduce the carrying value of customer service inventories to their net realizable value. Factors influencing these adjustments include product life cycles, end of service life plans and volume of enhanced or extended warranty service contracts. Estimates of net realizable value involve significant estimates and judgments about the future, and revisions would be required if these factors differ from our estimates.
Impairment of Long-Lived Assets
We evaluate long-lived assets for impairment whenever events or changes in circumstances indicate that the carrying value of an asset may not be recoverable. Impairment is considered to exist if the total estimated future cash flows on an undiscounted basis are less than the carrying amount of the assets. If impairment exists, the impairment loss is measured and recorded based on discounted estimated future cash flows. In estimating future cash flows, assets are grouped at the lowest levels for which there are identifiable cash flows that are largely independent of cash flows from other asset groups.
Our estimate of future cash flows is based upon, among other things, certain assumptions about expected future operating performance, growth rates and other factors. The actual cash flows realized from these assets may vary significantly from our estimates due to increased competition, changes in technology, fluctuations in demand, consolidation of our customers, reductions in average selling prices and other factors. Assumptions underlying future cash flow estimates are therefore subject to significant risks and uncertainties.
Income Taxes and Tax Valuation Allowances
We record the estimated future tax effects of temporary differences between the tax basis of assets and liabilities of amounts reported in our Consolidated Balance Sheet, as well as operating loss and tax credit carryforwards. Significant judgment is required in evaluating our uncertain tax positions and determining our provision for income taxes. Although we believe our reserves are reasonable, no assurance can be given that the final tax outcome of these matters will not be different from that which is reflected in our historical income tax provisions and accruals. We adjust these reserves in light of changing facts and circumstances, such as the opening and closing of a tax audit or the refinement of an estimate. To the extent that the final tax outcome of these matters is different than the amounts recorded, such differences may result in an increase or decrease to our tax provision in a subsequent period in which such determination is made.
We record deferred taxes by applying enacted statutory tax rates to the respective jurisdictions and follow specific and detailed guidelines in each tax jurisdiction regarding the recoverability of any tax assets recorded on the balance sheet and provide necessary valuation allowances as required. Future realization of deferred tax assets ultimately depends on meeting certain criteria in ASC 740,
Income Taxes
. One of the major criteria is the existence of sufficient taxable income of the appropriate character (for example, ordinary income or capital gain) within the carryback or carryforward periods available under the tax law. We regularly review our deferred tax assets for recoverability based on historical taxable income, projected future taxable income, the expected timing of the reversals of existing temporary differences and tax planning strategies. Our judgments regarding future profitability may change due to many factors, including future market conditions and our ability to successfully execute our business plans and/or tax planning strategies. Should there be a change in our ability to recover our deferred tax assets, our tax provision would increase or decrease in the period in which the assessment is changed.
The accounting estimates related to the liability for uncertain tax position require us to make judgments regarding the sustainability of each uncertain tax position based on its technical merits. It is inherently difficult and subjective to estimate our
39
reserves for the uncertain tax positions. Although we believe our estimates are reasonable, no assurance can be given that the final tax outcome of these matters will be same as these estimates. These estimates are updated quarterly based on factors such as change in facts or circumstances, changes in tax law, new audit activity, and effectively settled issues.
Impact of Recently Issued Accounting Pronouncements
See Note 1 of the accompanying consolidated financial statements for a full description of recently issued accounting pronouncements, including the respective expected dates of adoption and effects on our consolidated financial position and results of operations.
Item 7A.
Quantitative and Qualitative Disclosures About Market Risk.
In the normal course of doing business, we are exposed to the risks associated with foreign currency exchange rates and changes in interest rates. We employ established policies and procedures governing the use of financial instruments to manage our exposure to such risks. For a discussion of such policies and procedures and the related risks, see “Financial Risk Management” in “Item 7. Management’s Discussion and Analysis of Financial Condition and Results of Operations,” which is incorporated by reference into this Item 7A.
40
Item 8.
Financial Statements and Supplementary Data
Index to Financial Statements
|
|
Page
|
41
Report of Independent Registered Public Accounting Firm
The Board of Directors and Stockholders of Aviat Networks, Inc.
We have audited the accompanying consolidated balance sheets of Aviat Networks, Inc. and subsidiaries ("the Company") as of
June 28, 2013
, and the related consolidated statements of operations, comprehensive loss, stockholders' equity, and cash flows for the year ended
June 28, 2013
. In connection with our audit of the consolidated financial statements, we also have audited the financial statement schedule of valuation and qualifying accounts and reserves as listed in the accompanying index. We have also audited the Company's internal control over financial reporting as of
June 28, 2013
, based on criteria established in
Internal Control - Integrated Framework
issued by the Committee of Sponsoring Organizations of the Treadway Commission (COSO). The Company's management is responsible for these consolidated financial statements, for maintaining effective internal control over financial reporting, and for its assessment of the effectiveness of internal control over financial reporting, included in the accompanying
Management's Report on Internal Control over Financial Reporting
. Our responsibility is to express an opinion on these consolidated financial statements and schedule and an opinion on the Company's internal control over financial reporting based on our audits.
We conducted our audit in accordance with the standards of the Public Company Accounting Oversight Board (United States). Those standards require that we plan and perform the audits to obtain reasonable assurance about whether the financial statements are free of material misstatement and whether effective internal control over financial reporting was maintained in all material respects. Our audit of the consolidated financial statements included examining, on a test basis, evidence supporting the amounts and disclosures in the financial statements, assessing the accounting principles used and significant estimates made by management, and evaluating the overall financial statement presentation. Our audit of internal control over financial reporting included obtaining an understanding of internal control over financial reporting, assessing the risk that a material weakness exists, and testing and evaluating the design and operating effectiveness of internal control based on the assessed risk. Our audit also included performing such other procedures as we considered necessary in the circumstances. We believe that our audit provides a reasonable basis for our opinions.
A company's internal control over financial reporting is a process designed to provide reasonable assurance regarding the reliability of financial reporting and the preparation of financial statements for external purposes in accordance with generally accepted accounting principles. A company's internal control over financial reporting includes those policies and procedures that (1) pertain to the maintenance of records that, in reasonable detail, accurately and fairly reflect the transactions and dispositions of the assets of the company; (2) provide reasonable assurance that transactions are recorded as necessary to permit preparation of financial statements in accordance with generally accepted accounting principles, and that receipts and expenditures of the company are being made only in accordance with authorizations of management and directors of the company; and (3) provide reasonable assurance regarding prevention or timely detection of unauthorized acquisition, use, or disposition of the company's assets that could have a material effect on the financial statements.
Because of its inherent limitations, internal control over financial reporting may not prevent or detect misstatements. Also, projections of any evaluation of effectiveness to future periods are subject to the risk that controls may become inadequate because of changes in conditions, or that the degree of compliance with the policies or procedures may deteriorate.
In our opinion, the consolidated financial statements referred to above present fairly, in all material respects, the financial position of Aviat Networks, Inc. and subsidiaries as of
June 28, 2013
, and the results of their operations and their cash flows for the year ended
June 28, 2013
, in conformity with U.S. generally accepted accounting principles. Also in our opinion, the related financial statement schedule, when considered in relation to the basic consolidated financial statements taken as a whole, presents fairly, in all material respects, the information set forth therein. Also in our opinion, Aviat Networks, Inc. maintained, in all material respects, effective internal control over financial reporting as of
June 28, 2013
, based on criteria established in
Internal Control - Integrated Framework
issued by the Committee of Sponsoring Organizations of the Treadway Commission.
|
/s/ KPMG LLP
|
||
|
Santa Clara, California
September 20, 2013
|
||
42
Report of Independent Registered Public Accounting Firm
The Board of Directors and Stockholders of Aviat Networks, Inc.
We have audited the accompanying consolidated balance sheet of Aviat Networks, Inc. as of
June 29, 2012
, and the related consolidated statements of operations, comprehensive loss, stockholders' equity, and cash flows for each of the two years in the period ended
June 29, 2012
. Our audits also included the financial statement schedule listed in the Index at Item 15(a)(2). These financial statements and schedule are the responsibility of the Company's management. Our responsibility is to express an opinion on these financial statements and schedule based on our audits.
We conducted our audits in accordance with the standards of the Public Company Accounting Oversight Board (United States). Those standards require that we plan and perform the audit to obtain reasonable assurance about whether the financial statements are free of material misstatement. An audit includes examining, on a test basis, evidence supporting the amounts and disclosures in the financial statements. An audit also includes assessing the accounting principles used and significant estimates made by management, as well as evaluating the overall financial statement presentation. We believe that our audits provide a reasonable basis for our opinion.
In our opinion, the financial statements referred to above present fairly, in all material respects, the consolidated financial position of Aviat Networks, Inc. at
June 29, 2012
, and the consolidated results of its operations and its cash flows for each of the two years in the period ended
June 29, 2012
, in conformity with U.S. generally accepted accounting principles. Also, in our opinion, the related financial statement schedule, when considered in relation to the basic financial statements taken as a whole, presents fairly in all material respects the information set forth therein.
|
/s/ Ernst & Young LLP
|
||
|
Redwood City, California
September 4, 2012 |
||
43
AVIAT NETWORKS, INC.
|
|
Fiscal Year Ended
|
||||||||||
|
(In millions, except per share amounts)
|
June 28,
2013 |
June 29,
2012 |
July 1,
2011 |
||||||||
|
Revenues:
|
|||||||||||
|
Revenue from product sales
|
$
|
336.7
|
|
$
|
335.5
|
|
$
|
357.5
|
|
||
|
Revenue from services
|
134.6
|
|
108.5
|
|
94.6
|
|
|||||
|
Total revenues
|
471.3
|
|
444.0
|
|
452.1
|
|
|||||
|
Cost of revenues:
|
|||||||||||
|
Cost of product sales
|
239.6
|
|
233.5
|
|
253.0
|
|
|||||
|
Cost of services
|
91.6
|
|
78.8
|
|
71.0
|
|
|||||
|
Total cost of revenues
|
331.2
|
|
312.3
|
|
324.0
|
|
|||||
|
Gross margin
|
140.1
|
|
131.7
|
|
128.1
|
|
|||||
|
Operating expenses:
|
|||||||||||
|
Research and development expenses
|
39.4
|
|
36.0
|
|
40.5
|
|
|||||
|
Selling and administrative expenses
|
95.5
|
|
99.5
|
|
107.6
|
|
|||||
|
Amortization of identifiable intangible assets
|
0.4
|
|
1.6
|
|
2.8
|
|
|||||
|
Goodwill impairment charges
|
—
|
|
5.6
|
|
—
|
|
|||||
|
Restructuring charges
|
3.1
|
|
2.3
|
|
15.4
|
|
|||||
|
Total operating expenses
|
138.4
|
|
145.0
|
|
166.3
|
|
|||||
|
Operating income (loss)
|
1.7
|
|
(13.3
|
)
|
(38.2
|
)
|
|||||
|
Loss on sale of NetBoss assets
|
—
|
|
—
|
|
(4.6
|
)
|
|||||
|
Other income, net
|
0.7
|
|
—
|
|
—
|
|
|||||
|
Interest income
|
0.8
|
|
0.6
|
|
0.3
|
|
|||||
|
Interest expense
|
(0.8
|
)
|
(1.3
|
)
|
(2.2
|
)
|
|||||
|
Income (loss) from continuing operations before income taxes
|
2.4
|
|
(14.0
|
)
|
(44.7
|
)
|
|||||
|
Provision for income taxes
|
13.3
|
|
1.5
|
|
14.1
|
|
|||||
|
Loss from continuing operations
|
(10.9
|
)
|
(15.5
|
)
|
(58.8
|
)
|
|||||
|
Loss from discontinued operations, net of tax
|
(4.1
|
)
|
(8.6
|
)
|
(31.7
|
)
|
|||||
|
Net loss
|
$
|
(15.0
|
)
|
$
|
(24.1
|
)
|
$
|
(90.5
|
)
|
||
|
Basic and diluted loss per common share:
|
|||||||||||
|
Continuing operations
|
$
|
(0.18
|
)
|
$
|
(0.26
|
)
|
$
|
(1.00
|
)
|
||
|
Discontinued operations
|
$
|
(0.07
|
)
|
$
|
(0.15
|
)
|
$
|
(0.54
|
)
|
||
|
Net loss
|
$
|
(0.25
|
)
|
$
|
(0.41
|
)
|
$
|
(1.54
|
)
|
||
|
Weighted average shares outstanding, basic and diluted
|
60.0
|
|
59.0
|
|
58.6
|
|
|||||
See accompanying notes to consolidated financial statements
44
AVIAT NETWORKS, INC.
CONSOLIDATED STATEMENTS OF COMPREHENSIVE LOSS
|
Fiscal Year Ended
|
|||||||||||
|
(In millions)
|
June 28,
2013 |
June 29,
2012 |
July 1,
2011 |
||||||||
|
Net loss
|
$
|
(15.0
|
)
|
$
|
(24.1
|
)
|
$
|
(90.5
|
)
|
||
|
Other comprehensive income (loss):
|
|||||||||||
|
Transfer from currency translation adjustment to operating expenses resulting
from the liquidation of foreign entities
|
—
|
|
—
|
|
0.6
|
|
|||||
|
Foreign currency translation gain (loss)
|
0.6
|
|
(1.4
|
)
|
(0.3
|
)
|
|||||
|
Change in unrealized gain or loss on hedging activities
|
0.1
|
|
0.1
|
|
(0.4
|
)
|
|||||
|
0.7
|
|
(1.3
|
)
|
(0.1
|
)
|
||||||
|
Comprehensive loss
|
$
|
(14.3
|
)
|
$
|
(25.4
|
)
|
$
|
(90.6
|
)
|
||
See accompanying notes to consolidated financial statements
45
AVIAT NETWORKS, INC.
|
(In millions, except share and par value amounts)
|
June 28, 2013
|
June 29, 2012
|
|||||
|
ASSETS
|
|||||||
|
Current Assets
|
|||||||
|
Cash and cash equivalents
|
$
|
90.0
|
|
$
|
96.0
|
|
|
|
Receivables, net
|
86.3
|
|
90.7
|
|
|||
|
Unbilled costs
|
28.9
|
|
25.9
|
|
|||
|
Inventories
|
35.0
|
|
56.8
|
|
|||
|
Customer service inventories
|
16.2
|
|
18.5
|
|
|||
|
Deferred income taxes
|
0.9
|
|
1.0
|
|
|||
|
Other current assets
|
17.0
|
|
15.7
|
|
|||
|
Total current assets
|
274.3
|
|
304.6
|
|
|||
|
Long-Term Assets
|
|||||||
|
Property, plant and equipment, net
|
28.8
|
|
21.7
|
|
|||
|
Identifiable intangible assets, net
|
0.8
|
|
1.8
|
|
|||
|
Deferred income taxes
|
1.4
|
|
0.4
|
|
|||
|
Other assets
|
0.5
|
|
1.1
|
|
|||
|
Total long-term assets
|
31.5
|
|
25.0
|
|
|||
|
Total Assets
|
$
|
305.8
|
|
$
|
329.6
|
|
|
|
LIABILITIES AND STOCKHOLDERS’ EQUITY
|
|||||||
|
Current Liabilities
|
|||||||
|
Current portion of long-term debt
|
8.8
|
|
4.1
|
|
|||
|
Accounts payable
|
50.6
|
|
55.8
|
|
|||
|
Accrued compensation and benefits
|
12.4
|
|
11.9
|
|
|||
|
Other accrued expenses
|
33.7
|
|
39.5
|
|
|||
|
Advance payments and unearned income
|
18.6
|
|
33.3
|
|
|||
|
Reserve for uncertain tax positions
|
3.6
|
|
—
|
|
|||
|
Deferred income taxes
|
1.1
|
|
1.3
|
|
|||
|
Restructuring liabilities
|
2.3
|
|
1.5
|
|
|||
|
Total current liabilities
|
131.1
|
|
147.4
|
|
|||
|
Long-Term Liabilities
|
|||||||
|
Long-term debt
|
—
|
|
8.8
|
|
|||
|
Unearned income
|
8.5
|
|
8.0
|
|
|||
|
Other long-term liabilities
|
2.3
|
|
2.8
|
|
|||
|
Reserve for uncertain tax positions
|
12.3
|
|
4.2
|
|
|||
|
Deferred income taxes
|
1.7
|
|
0.9
|
|
|||
|
Total Liabilities
|
155.9
|
|
172.1
|
|
|||
|
Commitments and Contingencies (Note 15)
|
|
|
|||||
|
Stockholders’ Equity
|
|||||||
|
Preferred stock, $0.01 par value; 50,000,000 shares authorized; none issued
|
—
|
|
—
|
|
|||
|
Common stock, $0.01 par value; 300,000,000 shares authorized; issued and outstanding
61,252,494 shares as of June 28, 2013 and 61,274,740 shares as of June 29, 2012
|
0.6
|
|
0.6
|
|
|||
|
Additional paid-in-capital
|
803.5
|
|
796.8
|
|
|||
|
Accumulated deficit
|
(650.9
|
)
|
(635.9
|
)
|
|||
|
Accumulated other comprehensive loss
|
(3.3
|
)
|
(4.0
|
)
|
|||
|
Total Stockholders’ Equity
|
149.9
|
|
157.5
|
|
|||
|
Total Liabilities and Stockholders’ Equity
|
$
|
305.8
|
|
$
|
329.6
|
|
|
See accompanying notes to consolidated financial statements
46
AVIAT NETWORKS, INC.
|
|
Fiscal Year Ended
|
||||||||||
|
(In millions)
|
June 28,
2013 |
June 29,
2012 |
July 1,
2011 |
||||||||
|
Operating Activities
|
|||||||||||
|
Net loss
|
$
|
(15.0
|
)
|
$
|
(24.1
|
)
|
$
|
(90.5
|
)
|
||
|
Adjustments to reconcile net loss to net cash provided by (used in) operating activities:
|
|||||||||||
|
Amortization of identifiable intangible assets
|
1.0
|
|
2.3
|
|
3.4
|
|
|||||
|
Depreciation and amortization of property, plant and equipment and capitalized software
|
5.6
|
|
4.9
|
|
8.6
|
|
|||||
|
Goodwill impairment charges
|
—
|
|
5.6
|
|
—
|
|
|||||
|
Bad debt expenses
|
2.5
|
|
3.9
|
|
2.9
|
|
|||||
|
Share-based compensation expense
|
6.4
|
|
5.2
|
|
4.8
|
|
|||||
|
Charges for inventory write-downs
|
7.7
|
|
3.4
|
|
20.2
|
|
|||||
|
Impairment charges or loss (gain) on disposition related to WiMAX business
|
(0.4
|
)
|
1.9
|
|
9.5
|
|
|||||
|
Loss on sale of NetBoss assets
|
—
|
|
—
|
|
4.6
|
|
|||||
|
Other non-cash items
|
(0.1
|
)
|
—
|
|
—
|
|
|||||
|
Changes in operating assets and liabilities:
|
|||||||||||
|
Receivables
|
1.9
|
|
38.4
|
|
(28.7
|
)
|
|||||
|
Unbilled costs
|
(3.1
|
)
|
(1.1
|
)
|
5.5
|
|
|||||
|
Inventories
|
14.9
|
|
(7.6
|
)
|
(6.4
|
)
|
|||||
|
Customer service inventories
|
1.6
|
|
0.7
|
|
(10.9
|
)
|
|||||
|
Accounts payable
|
(7.1
|
)
|
(18.3
|
)
|
13.0
|
|
|||||
|
Accrued expenses
|
(3.2
|
)
|
(6.2
|
)
|
2.3
|
|
|||||
|
Advance payments and unearned income
|
(14.1
|
)
|
(4.6
|
)
|
8.5
|
|
|||||
|
Income taxes payable or receivable
|
(1.6
|
)
|
0.1
|
|
(1.9
|
)
|
|||||
|
Reserve for uncertain tax positions and deferred taxes
|
11.5
|
|
(0.5
|
)
|
11.0
|
|
|||||
|
Other assets and liabilities
|
(0.1
|
)
|
4.4
|
|
2.6
|
|
|||||
|
Net cash provided by (used in) operating activities
|
8.4
|
|
8.4
|
|
(41.5
|
)
|
|||||
|
Investing Activities
|
|||||||||||
|
Cash received from sale of NetBoss assets
|
—
|
|
—
|
|
3.8
|
|
|||||
|
Cash disbursed related to sale of WiMAX business, net
|
(0.1
|
)
|
(1.5
|
)
|
—
|
|
|||||
|
Additions of property, plant and equipment
|
(10.4
|
)
|
(5.9
|
)
|
(7.2
|
)
|
|||||
|
Additions of capitalized software related to NetBoss assets
|
—
|
|
—
|
|
(0.8
|
)
|
|||||
|
Net cash used in investing activities
|
(10.5
|
)
|
(7.4
|
)
|
(4.2
|
)
|
|||||
|
Financing Activities
|
|||||||||||
|
Payments on short-term debt arrangement
|
—
|
|
—
|
|
(5.0
|
)
|
|||||
|
Proceeds from long-term debt
|
—
|
|
8.3
|
|
6.0
|
|
|||||
|
Payments on long-term debt
|
(4.1
|
)
|
(1.4
|
)
|
—
|
|
|||||
|
Proceeds from share-based compensation awards
|
0.3
|
|
0.1
|
|
0.2
|
|
|||||
|
Redemption of preference shares
|
—
|
|
(8.3
|
)
|
—
|
|
|||||
|
Payments on capital lease obligations
|
(0.1
|
)
|
—
|
|
—
|
|
|||||
|
Net cash provided by (used in) financing activities
|
(3.9
|
)
|
(1.3
|
)
|
1.2
|
|
|||||
|
Effect of exchange rate changes on cash and cash equivalents
|
—
|
|
(1.9
|
)
|
1.0
|
|
|||||
|
Net decrease in cash and cash equivalents
|
(6.0
|
)
|
(2.2
|
)
|
(43.5
|
)
|
|||||
|
Cash and cash equivalents, beginning of year
|
96.0
|
|
98.2
|
|
141.7
|
|
|||||
|
Cash and cash equivalents, end of year
|
$
|
90.0
|
|
$
|
96.0
|
|
$
|
98.2
|
|
||
|
Supplemental disclosures of cash flow information:
|
|||||||||||
|
Cash paid for interest
|
$
|
0.8
|
|
$
|
1.3
|
|
$
|
2.2
|
|
||
|
Cash paid for income taxes
|
$
|
3.0
|
|
$
|
1.3
|
|
$
|
2.7
|
|
||
|
Non-cash investing activities:
|
|||||||||||
|
Property and equipment acquired under capital lease
|
$
|
0.4
|
|
$
|
—
|
|
$
|
—
|
|
||
See accompanying notes to consolidated financial statements
47
AVIAT NETWORKS, INC.
CONSOLIDATED STATEMENTS OF STOCKHOLDERS’ EQUITY
|
Common
Stock
Shares
|
Common
Stock
|
Additional
Paid-in
Capital
|
Accumulated
Deficit
|
Accumulated
Other
Comprehensive
Income (Loss)
|
Total
Stockholders’
Equity
|
|||||||||||||||||
|
|
(In millions)
|
|||||||||||||||||||||
|
Balance as of July 2, 2010
|
59.4
|
|
$
|
0.6
|
|
$
|
786.5
|
|
$
|
(521.3
|
)
|
$
|
(2.6
|
)
|
$
|
263.2
|
|
|||||
|
Net loss
|
—
|
|
—
|
|
—
|
|
(90.5
|
)
|
—
|
|
(90.5
|
)
|
||||||||||
|
Other comprehensive loss, net
|
—
|
|
—
|
|
—
|
|
—
|
|
(0.1
|
)
|
(0.1
|
)
|
||||||||||
|
Issuance of stock related to employee share-based awards
|
1.2
|
|
—
|
|
0.2
|
|
—
|
|
—
|
|
0.2
|
|
||||||||||
|
Share-based compensation
|
—
|
|
—
|
|
4.8
|
|
—
|
|
—
|
|
4.8
|
|
||||||||||
|
Other
|
—
|
|
—
|
|
0.1
|
|
—
|
|
—
|
|
0.1
|
|
||||||||||
|
Balance as of July 1, 2011
|
60.6
|
|
0.6
|
|
791.6
|
|
(611.8
|
)
|
(2.7
|
)
|
177.7
|
|
||||||||||
|
Net loss
|
—
|
|
—
|
|
—
|
|
(24.1
|
)
|
—
|
|
(24.1
|
)
|
||||||||||
|
Other comprehensive loss, net
|
—
|
|
—
|
|
—
|
|
—
|
|
(1.3
|
)
|
(1.3
|
)
|
||||||||||
|
Issuance of stock related to employee share-based awards
|
0.7
|
|
—
|
|
—
|
|
—
|
|
—
|
|
—
|
|
||||||||||
|
Share-based compensation
|
—
|
|
—
|
|
5.2
|
|
—
|
|
—
|
|
5.2
|
|
||||||||||
|
Balance as of June 29, 2012
|
61.3
|
|
0.6
|
|
796.8
|
|
(635.9
|
)
|
(4.0
|
)
|
157.5
|
|
||||||||||
|
Net loss
|
—
|
|
—
|
|
—
|
|
(15.0
|
)
|
—
|
|
(15.0
|
)
|
||||||||||
|
Other comprehensive income, net
|
—
|
|
—
|
|
—
|
|
—
|
|
0.7
|
|
0.7
|
|
||||||||||
|
Issuance of stock related to employee share-based awards
|
—
|
|
—
|
|
0.3
|
|
—
|
|
—
|
|
0.3
|
|
||||||||||
|
Share-based compensation
|
—
|
|
—
|
|
6.4
|
|
—
|
|
—
|
|
6.4
|
|
||||||||||
|
Balance as of June 28, 2013
|
61.3
|
|
$
|
0.6
|
|
$
|
803.5
|
|
$
|
(650.9
|
)
|
$
|
(3.3
|
)
|
$
|
149.9
|
|
|||||
See accompanying notes to consolidated financial statements
48
AVIAT NETWORKS, INC.
NOTES TO CONSOLIDATED FINANCIAL STATEMENTS
The Company
We design, manufacture and sell a range of wireless networking solutions and services to mobile and fixed telephone service providers, private network operators, government agencies, transportation and utility companies, public safety agencies and broadcast system operators across the globe. Our products include broadband wireless access base stations and customer premises equipment for fixed and mobile, point-to-point digital microwave radio systems for access, backhaul, trunking and license-exempt applications, supporting new network deployments, network expansion, and capacity upgrades.
We were incorporated in Delaware in 2006 to combine the businesses of Harris Corporation’s Microwave Communications Division (“MCD”) and Stratex Networks, Inc. (“Stratex”). On January 28, 2010, we changed our corporate name from Harris Stratex Networks, Inc. to Aviat Networks, Inc. (“Aviat Networks”, “we,” “us,” and “our”) to more effectively reflect our business and communicate our brand identity to customers. Additionally, the change of our corporate name was to comply with the termination of the Harris Corporation (“Harris”) trademark licensing agreement resulting from the spin-off by Harris of its interest in our stock to its stockholders in May 2009.
Basis of Presentation
The consolidated financial statements include the accounts of Aviat Networks and its wholly-owned and majority owned subsidiaries. Significant intercompany transactions and accounts have been eliminated.
Our fiscal year ends on the Friday nearest June 30. This was June 28 for fiscal 2013, June 29 for fiscal 2012 and July 1 for fiscal 2011. All fiscal years presented each included
52
weeks. In these notes to consolidated financial statements, we refer to our fiscal years as “fiscal 2013”, “fiscal 2012” and “fiscal 2011.”
Reclassifications
Certain amounts in the fiscal 2012 and 2011 financial statements have been reclassified to conform with fiscal 2013 presentation.
Use of Estimates
The preparation of consolidated financial statements in accordance with accounting principles generally accepted in the United States (“U.S. GAAP”) requires us to make estimates, assumptions and judgments affecting the amounts reported and related disclosures. Estimates are based upon historical factors, current circumstances and the experience and judgment of our management. We evaluate our estimates and assumptions on an ongoing basis and may employ outside experts to assist us in making these evaluations. Changes in such estimates, based on more accurate information, or different assumptions or conditions, may affect amounts reported in future periods. Such estimates affect significant items, including revenue recognition, provision for doubtful accounts, inventory valuation, valuation allowances for deferred tax assets, uncertainties in income taxes, restructuring obligations, product warranty obligations, share-based awards, contingencies and useful lives of intangible assets, property, plant and equipment.
Cash and Cash Equivalents
We consider all highly liquid investments with an original maturity of three months or less at the date of purchase to be cash equivalents. Cash and cash equivalents are carried at amortized cost, which approximates fair value due to the short-term nature of these investments. Amortization or accretion of premium or discount is included in interest income on the consolidated statements of operations. We hold cash and cash equivalents at several major financial institutions, which often significantly exceed Federal Deposit Insurance Corporation insured limits. However, a substantial portion of the cash equivalents is invested in prime money market funds which are backed by the securities in the fund. Historically, we have not experienced any losses due to such concentration of credit risk.
We invest our excess cash in high-quality marketable debt securities to ensure that cash is readily available for use in our current operations. Investments with original maturities greater than three months but less than one year are accounted for as
49
short-term and are classified as such at the time of purchase. Marketable securities are classified as “available-for-sale” and are classified as short-term because we view our entire portfolio as available for use in our current operations.
As of
June 28, 2013 and June 29, 2012
, all of our high-quality marketable debt securities were classified as cash equivalents.
Accounts Receivable, Major Customers and Other Significant Concentrations
We typically invoice our customers for the sales order (or contract) value of the related products delivered at various milestones, including order receipt, shipment, installation and acceptance and for services when rendered. Our trade receivables are derived from sales to customers located in North America, Africa, Europe, the Middle East, Russia, Asia-Pacific and Latin America.
Accounts receivable are presented net of allowance for estimated uncollectible accounts to reflect any loss anticipated on the collection of accounts receivable balances. We calculate the allowance based on our history of write-offs, level of past due accounts and economic status of the customers. The fair value of our accounts receivable approximates their net realizable value.
We regularly require letters of credit from some customers and we generally discount these letters of credit with various financial institutions. Under these arrangements, collection risk is fully transferred to the financial institutions. We record the cost of discounting these letters of credit as interest expense. Total customer letters of credit discounted and related interest expense are as follows:
|
|
Fiscal Year
|
||||||||||||
|
(In millions)
|
2013
|
2012
|
2011
|
||||||||||
|
Customer letters of credit discounted
|
$
|
36.8
|
|
$
|
59.1
|
|
$
|
57.7
|
|
||||
|
Interest expense
|
$
|
0.2
|
|
$
|
0.3
|
|
$
|
0.4
|
|
||||
During fiscal
2013, 2012 and 2011
, we had one international customer in Africa, Mobile Telephone Networks Group (“MTN Group”) that accounted for
25%
,
17%
and
14%
, respectively, of our total revenue. In addition, Verizon Wireless accounted for
11%
of our total revenue during fiscal 2013. As of
June 28, 2013 and June 29, 2012
, MTN Group accounted for approximately
12%
and
7%
, respectively, of our accounts receivable. No other customers accounted for more than 10% of our revenue or accounts receivable for the years presented.
Financial instruments that potentially subject us to a concentration of credit risk consist principally of cash equivalents, marketable debt securities, trade accounts receivable and financial instruments used in foreign currency hedging activities. We invest our excess cash primarily in prime money market funds and certificates of deposit. We are exposed to credit risks related to such instruments in the event of default or decrease in credit-worthiness of the issuers of the investments. We perform ongoing credit evaluations of our customers and generally do not require collateral on accounts receivable, as the majority of our customers are large, well-established companies. However, in certain circumstances, we may require letters of credit, additional guarantees or advance payments. We maintain allowances for collection losses, but historically have not experienced any significant losses related to any particular geographic area since our business is not concentrated within any particular geographic region. Our customers are primarily in the telecommunications industry, so our accounts receivable are concentrated within one industry and exposed to concentrations of credit risk within that industry. Accounts receivable are written off when attempts to collect outstanding amounts have been exhausted or there are other indicators that the amounts are no longer collectible.
We rely on sole providers for certain components of our products and rely on a limited number of contract manufacturers and suppliers to provide manufacturing services for our products. The inability of a contract manufacturer or supplier to fulfill our supply requirements could materially impact future operating results.
We have entered into agreements relating to our foreign currency contracts with large, multinational financial institutions. The amounts subject to credit risk arising from the possible inability of any such parties to meet the terms of their contracts are generally limited to the amounts, if any, by which such party’s obligations exceed our obligations to that party.
Inventories
Inventories are valued at the lower of cost or market. Cost is determined using standard cost, which approximates actual cost on a weighted-average basis. We regularly review inventory quantities on hand and record adjustments to reduce the cost
50
of inventory for excess and obsolete inventory based primarily on our estimated forecast of product demand and production requirements. Inventory adjustments are measured as the difference between the cost of the inventory and estimated market value based upon assumptions about future demand and charged to the provision for inventory, which is a component of cost of sales. At the point of the loss recognition, a new, lower-cost basis for that inventory is established, and any subsequent improvements in facts and circumstances do not result in the restoration or increase in that newly established cost basis.
Customer Service Inventories
Our customer service inventories are stated at the lower of cost or market. We carry service parts because we generally provide product warranty for
12
to
24
months and earn revenue by providing enhanced and extended warranty and repair service during and beyond this warranty period. Customer service inventories consist of both component parts, which are primarily used to repair defective units, and finished units, which are provided for customer use permanently or on a temporary basis while the defective unit is being repaired. We record adjustments to reduce the carrying value of customer service inventories to their net realizable value. Factors influencing these adjustments include product life cycles, end of service life plans and volume of enhanced or extended warranty service contracts. Estimates of net realizable value involve significant estimates and judgments about the future, and revisions would be required if these factors differ from our estimates.
Income Taxes and Related Uncertainties
We account for income taxes under the asset and liability method. Deferred tax assets and liabilities are determined based on the estimated future tax effects of temporary differences between the financial statement and tax bases of assets and liabilities, as measured by tax rates at which temporary differences are expected to reverse as well as operating loss and tax credit carry forwards. Deferred tax expense (benefit) is the result of changes in deferred tax assets and liabilities. A valuation allowance is established to offset any deferred tax assets if, based upon the available information, it is more likely than not that some or all of the deferred tax assets will not be realized.
We are required to compute our income taxes in each federal, state, and international jurisdiction in which we operate. This process requires that we estimate the current tax exposure as well as assess temporary differences between the accounting and tax treatment of assets and liabilities, including items such as accruals and allowances not currently deductible for tax purposes as well as operating loss and tax credit carry forwards. The income tax effects of the differences we identify are classified as current or long-term deferred tax assets and liabilities in our Consolidated Balance Sheets. Our judgments, assumptions, and estimates relative to the current provision for income tax take into account current tax laws, our interpretation of current tax laws, and possible outcomes of current and future audits conducted by foreign and domestic tax authorities. Changes in tax laws or our interpretation of tax laws and the resolution of current and future tax audits could significantly impact the amounts provided for income taxes in our consolidated balance sheets and consolidated statements of operations. We must also assess the likelihood that deferred tax assets will be realized from future taxable income and, based on this assessment, establish a valuation allowance, if required. Our determination of our valuation allowance is based upon a number of assumptions, judgments, and estimates, including forecasted earnings, future taxable income, and the relative proportions of revenue and income before taxes in the various domestic and international jurisdictions in which we operate. To the extent we establish a valuation allowance or change the valuation allowance in a period, we reflect the change with a corresponding increase or decrease to our tax provision in our consolidated statements of operations.
We use a two-step process to determine the amount of tax benefit to be recognized. The first step is to evaluate the tax position for recognition by determining if the weight of available evidence indicates that it is more likely than not that the position will be sustained on audit, including resolution of related appeals or litigation processes, if any. The second step requires us to estimate and measure the tax benefit as the largest amount that is more than
50%
likely of being realized upon ultimate settlement. It is inherently difficult and subjective to estimate such amounts, as this requires us to determine the probability of various possible outcomes. We reevaluate these uncertain tax positions on a quarterly basis. This evaluation is based on factors including, but not limited to, changes in facts or circumstances, changes in tax law, effectively settled issues under audit, and new audit activity. Such a change in recognition or measurement would result in the recognition of a tax benefit or an additional charge to the tax provision in the period.
Property, Plant and Equipment
Property, plant and equipment are stated on the basis of cost less accumulated depreciation and amortization. We capitalize costs of software, consulting services, hardware and other related costs incurred to purchase or develop internal-use software. We expense costs incurred during preliminary project assessment, re-engineering, training and application maintenance. Leasehold improvements made either at the inception of the lease or during the lease term are amortized over the remaining current lease term, or estimated life, if shorter.
51
Depreciation and amortization are calculated using the straight-line method over the estimated useful lives of the respective assets. Leasehold improvements are amortized on the straight-line method over the shorter of the remaining lease term or the estimated useful life of the improvements. The useful lives of the assets are generally as follows:
|
Buildings and leasehold improvements
|
2 to 45 years
|
|
Software
|
3 to 5 years
|
|
Machinery and equipment
|
2 to 5 years
|
Expenditures for maintenance and repairs are charged to expense as incurred. Cost and accumulated depreciation of assets sold or retired are removed from the respective property accounts, and any gain or loss is reflected in the consolidated statements of operations.
Impairment of Goodwill, Identifiable Intangible Assets and Long-Lived Assets
Our acquisition of Telsima Corporation and the merger with Stratex occurred in fiscal 2009 and fiscal 2007, respectively. We accounted for business combinations using the purchase method of accounting which means we recorded the assets acquired and liabilities assumed at their respective fair values at the date of acquisition, with any excess purchase price recorded as goodwill. Goodwill resulting from our past acquisitions has been impaired and written off in prior years. We therefore no longer have goodwill on our balance sheets as of June 28, 2013 and June 29, 2012.
Valuation of intangible assets and in-process research and development requires significant estimates and assumptions including, but not limited to, determining the timing and expected costs to complete development projects, estimating future cash flows from product sales, developing appropriate discount rates, estimating probability rates for the successful completion of development projects, continuation of customer relationships and renewal of customer contracts. Intangible assets determined to have finite lives are amortized over their estimated useful lives.
Goodwill and intangible assets deemed to have indefinite lives are not amortized but instead are tested for impairment at the reporting unit level at least annually in the fourth quarter of our fiscal year. In addition, we review the carrying value of our intangible assets and goodwill for impairment whenever events or circumstances indicate that their carrying amount may not be recoverable. Significant negative industry or economic trends, including a lack of recovery in the market price of our common stock, disruptions to our business, unexpected significant changes or planned changes in the use of the intangible assets, and mergers and acquisitions could result in the need to reassess the fair value of our assets and liabilities which could lead to an impairment charge for any of our intangible assets or goodwill. The value of our indefinite lived intangible assets and goodwill could also be impacted by future adverse changes such as any future declines in our operating results, a significant slowdown in the worldwide economy and the microwave industry or any failure to meet the performance projections included in our forecasts of future operating results.
Goodwill is tested for impairment using a two-step process. First, we determine if the carrying amount of any of our reporting units exceeds its fair value (determined using an analysis of a combination of projected discounted cash flows and market multiples based on revenue and earnings before interest, taxes, depreciation and amortization), which would indicate a potential impairment associated with that reporting unit. If we determine that a potential impairment exists, we then compare the implied fair value associated with the respective reporting unit, to its carrying amount to determine if there is an impairment loss.
Evaluations of impairment involve management estimates of asset useful lives and future cash flows. Significant management judgment is required in the forecasts of future operating results that are used in the evaluations. It is possible, however, that the plans and estimates used may prove to be inaccurate. If our actual results, or the plans and estimates used in future impairment analysis, are lower than the original estimates used to assess the recoverability of these assets, we could incur additional impairment charges in a future period which could result in charges that are material to our results of operations.
We evaluate other long-lived assets for impairment whenever events or changes in circumstances indicate that the carrying value of an asset may not be recoverable. Impairment is considered to exist if the total estimated future cash flows on an undiscounted basis are less than the carrying amount of the assets. If impairment exists, the impairment loss is measured and recorded based on discounted estimated future cash flows. In estimating future cash flows, assets are grouped at the lowest levels for which there are identifiable cash flows that are largely independent of cash flows from other asset groups.
Our estimate of future cash flows is based upon, among other things, certain assumptions about expected future operating performance, growth rates and other factors. The actual cash flows realized from these assets may vary significantly from our
52
estimates due to increased competition, changes in technology, fluctuations in demand, consolidation of our customers, reductions in average selling prices and other factors. Assumptions underlying future cash flow estimates are therefore subject to significant risks and uncertainties.
Other Accrued Expenses and Other Assets
No accrued liabilities or expenses within other accrued expenses on our consolidated balance sheets exceeded 5% of our total current liabilities as of
June 28, 2013 or June 29, 2012
. Other accrued expenses on our consolidated balance sheets primarily includes accruals for sales commissions, warranties and severance. No current assets other than those already disclosed on the consolidated balance sheets exceeded 5% of our total current assets as of
June 28, 2013 or June 29, 2012
. No assets within the caption “Other assets” on the consolidated balance sheets exceeded 5% of total assets as of
June 28, 2013 or June 29, 2012
.
Warranties
On product sales we provide for future warranty costs upon product delivery. The specific terms and conditions of those warranties vary depending upon the product sold and country in which we do business. In the case of products sold by us, our warranties generally start from the delivery date and continue for one to two years, depending on the terms.
Our products are manufactured to customer specifications and their acceptance is based on meeting those specifications. Factors that affect our warranty liability include the number of installed units, historical experience and management’s judgment regarding anticipated rates of warranty claims and cost per claim. We assess the adequacy of our recorded warranty liabilities every quarter and make adjustments to the liability as necessary.
Network management software products generally carry a
30
-day to
90
-day warranty from the date of acceptance. Our liability under these warranties is to provide a corrected copy of any portion of the software found not to be in substantial compliance with the agreed-upon specifications.
Operating Leases
We lease facilities and equipment under various operating leases. These lease agreements generally include rent escalation clauses, and many include renewal periods at our option. We recognize expense for scheduled rent increases on a straight-line basis over the lease term beginning with the date we take possession of the leased space. Leasehold improvements made either at the inception of the lease or during the lease term are amortized over the current lease term, or estimated life, if shorter.
Foreign Currency Translation
The functional currency of our subsidiaries located in the United Kingdom, Singapore, Mexico, Algeria and New Zealand is the U.S. dollar. Determination of the functional currency is dependent upon the economic environment in which an entity operates as well as the customers and suppliers the entity conducts business with. Changes in facts and circumstances may occur which could lead to a change in the functional currency of that entity. Accordingly, all of the monetary assets and liabilities of these subsidiaries are re-measured into U.S. dollars at the current exchange rate as of the applicable balance sheet date, and all non-monetary assets and liabilities are re-measured at historical rates. Income and expenses are re-measured at the average exchange rate prevailing during the period. Gains and losses resulting from the re-measurement of these subsidiaries’ financial statements are included in the consolidated statements of operations.
Our other international subsidiaries use their respective local currency as their functional currency. Assets and liabilities of these subsidiaries are translated at the local current exchange rates in effect at the balance sheet date, and income and expense accounts are translated at the average exchange rates during the period. The resulting translation adjustments are included in accumulated other comprehensive loss.
Gains and losses resulting from foreign exchange transactions and translation of monetary assets and liabilities in non-functional currencies are included in cost of product sales and services in the accompanying consolidated statements of operations. Net foreign exchange losses recorded in our consolidated statements of operations during fiscal
2013, 2012 and 2011
totaled
$1.5 million
,
$1.5 million
and
$2.6 million
, respectively.
Retirement Benefits
53
As of
June 28, 2013
, we provided retirement benefits to substantially all employees primarily through our defined contribution retirement plans. These plans have matching and savings elements. Contributions by us to these retirement plans are based on profits and employees’ savings with no other funding requirements. We may make additional contributions to the plan at our discretion.
Contributions to retirement plans are expensed as incurred. Retirement plan expense amounted to
$2.9 million
,
$2.8 million
and
$3.3 million
in fiscal
2013, 2012 and 2011
, respectively.
Revenue Recognition
We generate substantially all of our revenue from the sales or licensing of our microwave radio and wireless access systems, network management software, and professional services including installation and commissioning and training. Principal customers for our products and services include domestic and international wireless/mobile service providers, original equipment manufacturers, distributors, system integrators, as well as private network users such as public safety agencies, government institutions, and utility, pipeline, railroad and other industrial enterprises that operate broadband wireless networks. Our customers generally purchase a combination of our products and services as part of a multiple element arrangement. Our assessment of which revenue recognition guidance is appropriate to account for each element in an arrangement can involve significant judgment.
Revenue from product sales is generated predominately from the sales of products manufactured by third party manufacturers to whom we have outsourced our manufacturing processes. In general, printed circuit assemblies, mechanical housings, and packaged modules are manufactured by contract manufacturing partners, with periodic business reviews of material levels and obsolescence. Product assembly, product testing, complete system integration and system testing may either be performed within our own facilities or at the locations of our third party manufacturers.
Revenue from services includes certain installation, extended warranty, customer support, consulting, training and education. It also can include certain revenue generated from the resale of equipment purchased on behalf of customers for installation service contracts we perform for customers. Such equipment may include towers, antennas, and other related materials. Revenue from warranty services are recognized ratably over the service period.
Under our revenue recognition policy, revenue is recognized when all of the following criteria have been met:
|
•
|
Persuasive evidence of an arrangement exists. Contracts and customer purchase orders are generally used to determine the existence of an arrangement.
|
|
•
|
Delivery has occurred. Shipping documents and customer acceptance, when applicable, are used to verify delivery.
|
|
•
|
The fee is fixed or determinable. We assess whether the fee is fixed or determinable based on the payment terms associated with the transaction and whether the sales price is subject to refund or adjustment.
|
|
•
|
Collectibility is reasonably assured. We assess collectibility based primarily on the creditworthiness of the customer as determined by credit checks and analysis, as well as the customer’s payment history.
|
We often enter into multiple contractual agreements with the same customer. Such agreements are reviewed to determine whether they should be evaluated as one arrangement. If an arrangement, other than a long-term contract, requires the delivery or performance of multiple deliverables or elements, we determine whether the individual elements represent “separate units of accounting”. Based on the terms and conditions of our typical product sales arrangement, we believe that our products and services can be accounted for as separate units because our products and services have value to our customers on a stand-alone basis.
When a sale involves multiple deliverables, the entire fee from the arrangement is allocated to each unit of accounting based on the relative selling price of each deliverable. When applying the relative selling price method, we determine the selling price for each deliverable using vendor-specific objective evidence (“VSOE”) of selling price, if it exists, or third-party evidence (“TPE”) of selling price. If neither VSOE nor TPE of selling price exist for a deliverable, which is typically the case, we use our best estimate of selling price (“ESP”) for that deliverable. Revenue allocated to each element is then recognized when the other revenue recognition criteria are met for each element. Accordingly, services not yet performed at the time of product shipment are deferred based on their relative selling price and recognized as revenue as such services are performed. The relative selling price of any undelivered products is also deferred at the time of shipment and recognized as revenue when these products are delivered. There is generally no customer right of return in our sales agreements. The sequence for typical multiple element arrangements: we deliver our products, perform installation services and then provide post-contract support services.
54
VSOE of fair value is based on the price charged when the element is sold separately. For multiple element arrangements, if VSOE cannot be established, we establish, where available, the selling price based on TPE. TPE is determined based on evidence of competitor pricing for similar deliverables when sold separately. When we cannot determine VSOE or TPE, which is typically the case, we use ESP in our allocation of arrangement consideration. The objective of ESP is to determine the price at which we would typically transact a stand-alone sale of the product or service. ESP is determined by considering a number of factors including our pricing policies, internal costs and gross margin objectives, method of distribution, information gathered from experience in customer negotiations, market research and information, recent technological trends, competitive landscape and geographies. The determination of ESP is approved by our management taking into consideration our pricing strategy. We regularly review VSOE, TPE and ESP and maintain internal controls over the establishment and updating of these estimates.
For our proprietary and OEM products, we determine ESP using a discount off list methodology. Under this approach, reasonably available data points, including deals bid and won in the past rolling four quarters and competitor pricing data, for each part number are gathered. Then similar parts are grouped together and the average net price and the discount off the list price are calculated for each group of products. Since we have determined that pricing varies significantly by geography, the data is further stratified by geography. Within geographies, the data is stratified based on type of customer, distribution channel and estimated deal size or customer volume as larger opportunities with multiple deliverables bundled are more likely to receive preferential pricing. Based on all the available information (pricing practices and trends, competition, market, potential pricing limitations set by the competitors for the similar or identical product, functionality and expected technological life of the product, etc.), the final discount off list percentage is determined. Using the discount off list price percentage, the best estimated selling price for each product is determined.
For services ESP, we also stratify data based on geography, type of customer and estimated deal size. For training and extended support services, we determine ESP using a discount off list methodology as discussed above. For technical and installation services, we determine ESP using an estimated margin methodology. Under this methodology, ESP’s are determined based on estimated margins anticipated. We consider historical margins as well as current pricing trends and market conditions when determining the estimated margin.
Some of our products have both software and non-software components that function together to deliver the product’s essential functionality. Accordingly, these products are not within the scope of the software revenue recognition rules, ASC 985-605,
Software Revenue Recognition
.
In addition to the software in our core microwave product which is not within the scope of the software revenue recognition rules, some of our sales arrangements have multiple deliverables containing software and related software support components. Such sale arrangements are subject to the accounting guidance in ASC 985-605,
Software-Revenue Recognition.
Under the software revenue recognition guidance, we use the residual method to recognize revenue when a multiple element arrangement includes one or more elements to be delivered at a future date and VSOE of all undelivered elements exists. If VSOE cannot be established for the undelivered elements of an arrangement, we defer revenue until the earlier of delivery, or fair value of the undelivered element exists, unless the undelivered element is a service, in which the entire arrangement fee is recognized ratably over the period during which the services are expected to be performed.
Revenues related to long-term contracts for customized network solutions are recognized using the percentage-of-completion method. In using the percentage-of-completion method, we generally apply the cost-to-cost method of accounting where sales and profits are recorded based on the ratio of costs incurred to estimated total costs at completion. Contracts are combined when specific aggregation criteria are met including when the contracts are in substance an arrangement to perform a single project with a customer; the contracts are negotiated as a package in the same economic environment with an overall profit objective; the contracts require interrelated activities with common costs that cannot be separately identified with, or reasonably allocated to the elements, phases or units of output and the contracts are performed concurrently or in a continuous sequence under the same project management at the same location or at different locations in the same general vicinity. Recognition of profit on long-term contracts requires estimates of the total contract value, the total cost at completion and the measurement of progress towards completion. Significant judgment is required when estimating total contract costs and progress to completion on the arrangements as well as whether a loss is expected to be incurred on the contract. Amounts representing contract change orders, claims or other items are included in sales only when they can be reliably estimated and realization is probable. When adjustments in contract value or estimated costs are determined, any changes from prior estimates are reflected in earnings in the current period. Anticipated losses on contracts or programs in progress are charged to earnings when identified.
Royalty income is recognized on the basis of terms specified in the contractual agreements.
Cost of Product Sales and Services
55
Cost of sales consists primarily of materials, labor and overhead costs incurred internally and paid to contract manufacturers to produce our products, personnel and other implementation costs incurred to install our products and train customer personnel, and customer service and third party original equipment manufacturer costs to provide continuing support to our customers. Also included in cost of sales is the amortization of purchased technology intangible assets.
Shipping and handling costs are included as a component of costs of product sales in our consolidated statements of operations because we include in revenue the related costs that we bill our customers.
Presentation of Transactional Taxes Collected from Customers and Remitted to Government Authorities
We present transactional taxes such as sales and use tax collected from customers and remitted to governmental authorities on a net basis.
Share-Based Compensation
We have issued stock options, restricted stock and performance shares under our 2007 Stock Equity Plan and have assumed stock options from the acquisition of Stratex Networks, Inc. (“Stratex”). We estimate the grant date fair value of our share-based awards and amortize this fair value to compensation expense over the requisite service period or vesting term.
To estimate the fair value of our stock option awards, we use the Black-Scholes option pricing model. The determination of the fair value of share-based payment awards on the date of grant using an option pricing model is affected by our stock price as well as assumptions regarding a number of complex and subjective variables. These variables include our expected stock price volatility over the expected term of the awards, actual and projected employee stock option exercise behaviors, risk-free interest rate and expected dividends. Due to the inherent limitations of option valuation models, including consideration of future events that are unpredictable and the estimation process utilized in determining the valuation of the share-based awards, the ultimate value realized by our employees may vary significantly from the amounts expensed in our financial statements. For restricted stock and performance share awards, we measure the grant date fair value based upon the market price of our common stock on the date of the grant.
For stock options and restricted stock, we recognize compensation cost on a straight-line basis over the awards’ vesting periods for those awards which contain only a service vesting feature. For awards with a performance condition vesting feature, when achievement of the performance condition is deemed probable we recognize compensation cost on a straight-line basis over the awards’ expected vesting periods.
We estimate forfeitures at the time of grant and revise, if necessary, in subsequent periods if actual forfeitures differ significantly from initial estimates. Share-based compensation expense is recorded net of estimated forfeitures such that expense was recorded only for those share-based awards that are expected to vest.
Cash flows, if any, resulting from the gross benefit of tax deductions related to share-based compensation in excess of the grant date fair value of the related share-based awards are presented as part of cash flows from financing activities. This amount is shown as a reduction to cash flows from operating activities and an increase to cash flow from financing activities.
Net Income (Loss) per Share of Common Stock
We compute net income (loss) per share of common stock using the two-class method. Basic net income (loss) per share is computed using the weighted average number of common shares and participating securities outstanding. Our unvested restricted shares (including restricted stock awards and performance share awards) contain rights to receive non-forfeitable dividends and therefore are considered to be participating securities and would be included in the calculations of net income per basic and diluted common share. However, we incurred a net loss in all periods presented. In accordance with ASC subtopic 260-10, undistributed losses are not allocated to unvested restricted shares due to the fact that the unvested restricted shares are not contractually obligated to share in the losses of the company.
Restructuring Charges
Our restructuring charges represent expenses incurred in connection with certain cost reduction programs that we have implemented, and consist of the costs of employee termination benefits, facilities charges and other costs of exiting activities or geographies. A liability for costs associated with an exit or disposal activity is measured at its fair value when the liability is incurred. Expenses for one-time termination benefits are recognized at the date we notify the employee, unless the employee must provide future service, in which case the benefits are expensed ratably over the future service period. We recognize severance benefits provided as part of an ongoing benefit arrangement when the payment is probable and the amounts can be reasonably estimated. Liabilities related to an operating lease/contract are measured and recognized at fair value when the
56
contract does not have any future economic benefit to the entity (i.e., the entity ceases to utilize the rights conveyed by the contract). We expense all other costs related to an exit or disposal activity as incurred. Assumptions to estimate facility exit costs include the ability to secure sublease income largely based on market conditions, the likelihood and amounts of a negotiated settlement for contractual lease obligations and other exit costs.
Research and Development Costs
Our sponsored research and development costs, which include costs in connection with new product development, improvement of existing products, process improvement, and product use technologies, are charged to operations in the period in which they are incurred.
Recently Issued Accounting Standards
In July 2013, the Financial Accounting Standards Board (“FASB”) issued an amendment to the accounting guidance on the presentation of an unrecognized tax benefit when a net operating loss carryforward, a similar tax loss, or tax credit carryforward exists. This new guidance requires entities, if certain criteria are met, to present an unrecognized tax benefit, or portion of an unrecognized tax benefit, in the financial statements as a reduction to a deferred tax asset for a net operating loss carryforward, a similar tax loss, or a tax credit carryforward when such items exist in the same taxing jurisdiction. This new guidance is to be adopted prospectively and is effective for us beginning in our first quarter of fiscal 2015. The adoption of this standard will have no effect on our consolidated financial position or results of operations.
In February 2013, the FASB issued an accounting standards update on reporting amounts reclassified out of accumulated other comprehensive income (“AOCI”), which requires companies to present information about reclassifications out of AOCI in one place. Companies also are required to present reclassifications by component when reporting changes in AOCI balances. For significant items reclassified out of AOCI to net income in their entirety in the period, companies must report the effect of the reclassifications on the respective line items in the statement where net income is presented. This information may be provided either in the notes or parenthetically on the face of that statement as long as all the information is disclosed in a single location. For items not reclassified to net income in their entirety in the period, companies must cross-reference in a note to other required disclosures. This new guidance is to be adopted prospectively and is effective for us beginning in our first quarter of fiscal 2014. The adoption of this new guidance will not impact our consolidated financial position or results of operations, as the guidance relates only to financial statement presentation.
The changes in components of our accumulated other comprehensive income (loss) during fiscal
2013, 2012 and 2011
are as follows:
|
Foreign
Currency
Translation
Adjustment
(“CTA”)
|
Hedging
Derivatives
|
Total
Accumulated
Other
Comprehensive
Income (Loss)
|
|||||||||
|
(In millions)
|
|||||||||||
|
Balance as of July 2, 2010
|
$
|
(2.9
|
)
|
$
|
0.3
|
|
$
|
(2.6
|
)
|
||
|
Transfer from CTA to operating expenses resulting from the liquidation
of foreign entities
|
0.6
|
|
—
|
|
0.6
|
|
|||||
|
Foreign currency translation loss
|
(0.3
|
)
|
—
|
|
(0.3
|
)
|
|||||
|
Net unrealized loss on hedging activities
|
—
|
|
(0.4
|
)
|
(0.4
|
)
|
|||||
|
Balance as of July 1, 2011
|
(2.6
|
)
|
(0.1
|
)
|
(2.7
|
)
|
|||||
|
Foreign currency translation loss
|
(1.4
|
)
|
—
|
|
(1.4
|
)
|
|||||
|
Net unrealized gain on hedging activities
|
—
|
|
0.1
|
|
0.1
|
|
|||||
|
Balance as of June 29, 2012
|
(4.0
|
)
|
—
|
|
(4.0
|
)
|
|||||
|
Foreign currency translation gain
|
0.6
|
|
—
|
|
0.6
|
|
|||||
|
Net unrealized gain on hedging activities
|
—
|
|
0.1
|
|
0.1
|
|
|||||
|
Balance as of June 28, 2013
|
$
|
(3.4
|
)
|
$
|
0.1
|
|
$
|
(3.3
|
)
|
||
57
As we incurred net loss for all periods in fiscal
2013, 2012 and 2011
, all potential dilutive securities from stock options, restricted stocks and units and performance shares and units have been excluded from the diluted net loss per share calculations, as their effect would have been anti-dilutive. The following table summarizes the potential weighted average shares of common stock outstanding that have been excluded from the diluted net loss per share calculations:
|
|
Fiscal Year Ended
|
||||||||
|
|
June 28, 2013
|
|
June 29, 2012
|
|
July 1, 2011
|
|
|||
|
|
(In millions)
|
||||||||
|
Stock options
|
5.0
|
|
5.0
|
|
3.8
|
|
|||
|
Restricted stocks and units and performance shares and units
|
1.2
|
|
2.0
|
|
1.6
|
|
|||
|
Total potential shares of common stock excluded
|
6.2
|
|
7.0
|
|
5.4
|
|
|||
Receivables
Our net receivables are summarized below:
|
June 28,
2013 |
June 29,
2012 |
||||||
|
|
(In millions)
|
||||||
|
Accounts receivable
|
$
|
96.5
|
|
$
|
106.9
|
|
|
|
Less: allowances for collection losses
|
(10.2
|
)
|
(16.2
|
)
|
|||
|
$
|
86.3
|
|
$
|
90.7
|
|
||
Inventories
Our inventories are summarized below:
|
June 28,
2013 |
June 29,
2012 |
||||||
|
|
(In millions)
|
||||||
|
Finished products
|
$
|
30.9
|
|
$
|
49.2
|
|
|
|
Work in process
|
3.9
|
|
6.9
|
|
|||
|
Raw materials and supplies
|
0.2
|
|
0.7
|
|
|||
|
$
|
35.0
|
|
$
|
56.8
|
|
||
|
Deferred cost of sales included within finished goods
|
$
|
3.1
|
|
$
|
14.0
|
|
|
During fiscal
2013, 2012 and 2011
, we recorded charges to adjust our inventory and customer service inventory to the lower of cost or market. These charges were primarily due to excess and obsolete inventory resulting from product transitioning and discontinuance, and deferred costs of revenue that were unlikely to derive revenue from due to disposition of our WiMAX business or customer insolvency. Such charges incurred during fiscal 2013, 2012 and 2011 were classified in cost of product sales as follows:
|
|
Fiscal Year
|
||||||||||||
|
2013
|
2012
|
2011
|
|||||||||||
|
(In millions)
|
|||||||||||||
|
Excess and obsolete inventory and deferred cost of sales charges
|
$
|
6.9
|
|
$
|
1.7
|
|
$
|
19.4
|
|
||||
|
Customer service inventory write-downs
|
0.8
|
|
1.7
|
|
0.8
|
|
|||||||
|
$
|
7.7
|
|
$
|
3.4
|
|
$
|
20.2
|
|
|||||
|
As % of revenue
|
1.6
|
%
|
0.8
|
%
|
4.5
|
%
|
|||||||
Property, Plant and Equipment
58
Our property, plant and equipment are summarized below:
|
June 28,
2013 |
June 29,
2012 |
||||||
|
|
(In millions)
|
||||||
|
Land
|
$
|
0.7
|
|
$
|
0.7
|
|
|
|
Buildings and leasehold improvements
|
10.6
|
|
10.7
|
|
|||
|
Software
|
12.1
|
|
7.2
|
|
|||
|
Machinery and equipment
|
48.8
|
|
45.0
|
|
|||
|
72.2
|
|
63.6
|
|
||||
|
Less accumulated depreciation and amortization
|
(43.4
|
)
|
(41.9
|
)
|
|||
|
$
|
28.8
|
|
$
|
21.7
|
|
||
Depreciation and amortization expense related to property, plant and equipment, including amortization of software developed for internal use, was
$5.6 million
,
$4.9 million
and
$8.6 million
, respectively, in fiscal
2013, 2012 and 2011
.
Accrued Warranties
We have accrued for the estimated cost to repair or replace products under warranty at the time of sale. Changes in our warranty liability, which is included as a component of other accrued expenses on the consolidated balance sheets, during fiscal 2013 and 2012 are as follows:
|
|
Fiscal Year
|
||||||
|
|
2013
|
2012
|
|||||
|
|
(In millions)
|
||||||
|
Balance as of the beginning of the fiscal year
|
$
|
3.0
|
|
$
|
2.8
|
|
|
|
Warranty provision for revenue recorded during the period
|
4.1
|
|
3.7
|
|
|||
|
Consumption during the period
|
(3.8
|
)
|
(3.5
|
)
|
|||
|
Balance as of the end of the period
|
$
|
3.3
|
|
$
|
3.0
|
|
|
We determine fair value as the price that would be received to sell an asset or paid to transfer a liability in the principal market (or most advantageous market, in the absence of a principal market) for the asset or liability in an orderly transaction between market participants as of the measurement date. We try to maximize the use of observable inputs and minimize the use of unobservable inputs in measuring fair value and establish a three-level fair value hierarchy that prioritizes the inputs used to measure fair value. The three levels of inputs used to measure fair value are as follows:
|
•
|
Level 1 — Observable inputs such as quoted prices in active markets for identical assets or liabilities;
|
|
•
|
Level 2 — Observable market-based inputs or observable inputs that are corroborated by market data; and
|
|
•
|
Level 3 — Unobservable inputs reflecting our own assumptions.
|
The carrying amounts, estimated fair values and valuation input levels of our assets and liabilities that are measured at fair value on a recurring basis as of
June 28, 2013 and June 29, 2012
are as follows:
59
|
|
June 28, 2013
|
June 29, 2012
|
|
||||||||||||||
|
|
Carrying
Amount
|
Fair
Value
|
Carrying
Amount
|
Fair
Value
|
Valuation
Inputs
|
||||||||||||
|
|
(In millions)
|
||||||||||||||||
|
Assets:
|
|||||||||||||||||
|
Cash equivalents:
|
|||||||||||||||||
|
Bank certificates of deposit
|
$
|
2.4
|
|
$
|
2.4
|
|
$
|
0.3
|
|
$
|
0.3
|
|
Level 2
|
||||
|
Money market funds
|
$
|
39.2
|
|
$
|
39.2
|
|
$
|
50.8
|
|
$
|
50.8
|
|
Level 1
|
||||
|
Other current assets:
|
|||||||||||||||||
|
Foreign exchange forward contracts
|
$
|
0.1
|
|
$
|
0.1
|
|
$
|
0.1
|
|
$
|
0.1
|
|
Level 2
|
||||
|
Liabilities:
|
|||||||||||||||||
|
Other accrued expenses:
|
|||||||||||||||||
|
Foreign exchange forward contracts
|
$
|
0.1
|
|
$
|
0.1
|
|
$
|
0.1
|
|
$
|
0.1
|
|
Level 2
|
||||
We classify investments within Level 1 if quoted prices are available in active markets. Our level 1 investments include shares in prime money market funds purchased from two major financial institutions. As of
June 28, 2013
, these money market shares were valued at $
1.00
net asset value per share by these financial institutions.
We classify items in Level 2 if the investments are valued using observable inputs to quoted market prices, benchmark yields, reported trades, broker/dealer quotes or alternative pricing sources with reasonable levels of price transparency. Our foreign exchange forward contracts are classified within Level 2. Foreign currency forward contracts are valued using an income approach for the remaining term of the contract based on forward market rates less the contract rate multiplied by the notional amount.
Our policy is to recognize asset or liability transfers among Level 1, Level 2 and Level 3 as of the actual date of the events or change in circumstances that caused the transfer. During fiscal
2013, 2012 and 2011
, we had no transfers between levels of the fair value hierarchy of our assets or liabilities measured at fair value.
During fiscal 2007, our Singapore subsidiary issued
8,250
redeemable preference shares to the U.S. parent company which, in turn, sold the shares to
two
unrelated investment companies at par value for total sale proceeds of
$8.3 million
. Upon original issuance in fiscal 2007, our former majority stockholder, Harris Corporation, guaranteed redemption of these preference shares directly with these two unrelated investment companies through the existence of put option arrangements. During May 2009, one of these unrelated investment companies exercised a put option with Harris and sold its entire interest in
3,250
redeemable preference shares at face value to Harris.
These redeemable preference shares represented less than a
1
% interest in our Singapore subsidiary. The redeemable preference shares had an automatic redemption date of January 2017, which is
10 years
from the date of issue. Preference dividends were cumulative and payable quarterly in cash at the rate of
12
% per annum. Preference dividends totaling
$0.6 million
and
$1.0 million
, respectively, for fiscal 2012 and 2011, were recorded as interest expense in the accompanying consolidated statements of operations.
In an agreement dated June 30, 2011 by and among Harris, the Company and our Singapore subsidiary, we agreed to redeem the shares on the fifth anniversary of the date of issuance, which was January 30, 2012, at the stated redemption amount of
105
% of their face value. In consideration for the early redemption, Harris agreed to waive the
5
% premium for the amount that would otherwise be payable to them and to reimburse us for the
5
% premium that is payable to the remaining stockholder. On January 30, 2012, the preference shares were redeemed in accordance with the provisions of the redemption agreement and we funded the redemption with proceeds of
$8.3 million
from a
two
-year term loan under our credit facility with Silicon Valley Bank as described in Note 7 below.
During the quarter ended October 1, 2010, we terminated our previous credit facility with two commercial banks and entered into a new
$40.0 million
credit facility with Silicon Valley Bank (“SVB”) for an initial term of
one
year expiring on September 30, 2011. We repaid the outstanding debt of
$5.0 million
under the previous credit facility on October 1, 2010 with the proceeds of advance borrowings of
$6.0 million
under the new facility with SVB. On September 23, 2011, the availability
60
of the facility was extended and, on November 2, 2011, the facility was amended to expire on February 28, 2014 and provide for a
two
-year term loan for up to
$8.3 million
to fund the redemption of the preference shares issued by our Singapore subsidiary. On January 30, 2012, we borrowed
$8.3 million
to complete that redemption. The term loan matures on January 31, 2014 and must be repaid in
24
equal monthly principal payments commencing on February 29, 2012.
Our credit facility provides for a committed amount of
$40.0 million
. The facility provides for (1) advance borrowings (with no stated maturity date other than the February 28, 2014 expiration of the facility); (2) fixed term Eurodollar loans for up to six months, (3) a two-year term loan of
$8.3 million
; and (4) the issuance of standby or commercial letters of credit. As of
June 28, 2013
, available credit under this credit facility was
$26.0 million
reflecting borrowings of
$8.8 million
, as described below, and outstanding letters of credit of
$5.2 million
.
As of
June 28, 2013
, our outstanding debt under the credit facility consisted of the
$6.0 million
advance borrowings in fiscal 2011 and a
$2.8 million
outstanding balance on the original
$8.3 million
two-year term loan that matures on January 31, 2014. Since the expiration of the credit facility is less than 12 months from
June 28, 2013
, we classified the
$6.0 million
advance borrowings as short-term debt as of
June 28, 2013
.
The advance borrowings carry an interest rate computed at the daily prime rate as published in the
Wall Street Journal
. Interest on Eurodollar loans is offered at
LIBOR
plus a spread of between
2.00%
to
2.75%
based on our current leverage ratio. The interest rate on Eurodollar loans was set initially at a spread of
2.75%
for the fiscal quarter ended October 1, 2010 and is adjustable quarterly thereafter based on the computed actual leverage ratio for the most recently completed fiscal quarter. During fiscal 2013, the weighted average interest rate on our advance borrowings was
3.25%
. The two-year term loan bears a fixed interest rate of
5%
per annum and provides for equal monthly payments of principal. The SVB credit facility, as further amended on September 28, 2012, contains a minimum liquidity ratio covenant and a minimum profitability covenant. As of
June 28, 2013
, we were in compliance with these financial covenants. The facility also imposes certain restrictions on our ability to pay dividends or make distributions to our stockholders under certain circumstances. Certain of our assets, including accounts receivable, inventory, and equipment, are pledged as collateral for the credit facility. Pursuant to the loan and security agreement, if a material adverse event occurs, all obligations in connection with the agreement would be immediately due and payable.
WiMAX Discontinued Operations
In March 2011, our board of directors approved a plan for the sale of our WiMAX business. On September 2, 2011, we sold to EION Networks, Inc. (“EION”) our WiMAX business and related assets consisting of certain technology, inventory and equipment. We assigned customer contracts for WiMAX products and maintenance and agreed to license related patents to EION. We also agreed to indemnification for customary seller representations and warranties, and the provision of transitional services. As consideration for the sale of assets, EION agreed to pay us $
0.4
million in cash and up to $
2.8
million in additional cash payments contingent upon specific factors related to future WiMAX business performance. Currently we are not able to estimate the amount of consideration that we will receive beyond the $
0.4
million or the probability of any such payment. Accordingly, any future consideration will be recorded as a contingent gain in the period that it is received. As of
June 28, 2013
, we had received
$0.1 million
of such contingent payments. EION is also entitled to receive cash payments up to $
2.0
million upon collections of certain WiMAX accounts receivable, of which
$1.6 million
has been paid by us to EION and
$0.3 million
was reversed resulting from the write-down of the corresponding WiMAX accounts receivable as of
June 28, 2013
. As of
June 28, 2013 and June 29, 2012
, our accrued liabilities related to the disposition of WiMAX business were
$0.1 million
and
$0.6 million
, respectively.
In the third quarter of fiscal 2011, we began accounting for the WiMAX business as a discontinued operation and, therefore, the operating results of our WiMAX business are included in discontinued operations in our Consolidated Financial Statements for all years presented. We recognized a
$0.4 million
gain or adjustment and a
$1.9 million
loss on disposition, which was included in our loss from discontinued operations, in fiscal
2013
and
2012
, respectively.
Summary results of operations for the WiMAX business were as follows:
61
|
|
Fiscal Year
|
||||||||||
|
|
2013
|
2012
|
2011
|
||||||||
|
|
(In millions)
|
||||||||||
|
Revenues
|
$
|
0.1
|
|
$
|
1.6
|
|
$
|
20.6
|
|
||
|
Loss from operations of WiMAX
|
$
|
(4.3
|
)
|
$
|
(6.5
|
)
|
$
|
(31.7
|
)
|
||
|
Gain/adjustment (loss) on disposal
|
0.4
|
|
(1.9
|
)
|
—
|
|
|||||
|
Income taxes
|
(0.2
|
)
|
(0.2
|
)
|
—
|
|
|||||
|
Loss from discontinued operations, net of tax
|
$
|
(4.1
|
)
|
$
|
(8.6
|
)
|
$
|
(31.7
|
)
|
||
Sale of NetBoss Assets
In September 2010, we sold our NetBoss assets, consisting of internally-developed intellectual property and certain equipment, to a third party named NetBoss Technologies, Inc. for $
3.8
million of cash. We recognized a
$4.6 million
loss on the sale of the NetBoss assets in our Consolidated Statement of Operations during fiscal 2011. NetBoss Technologies, Inc. is a company formed by its management team, our former development partner for NetBoss, and private investors. As part of the terms of the sale, we have assigned our customer contracts for NetBoss software and maintenance to NetBoss Technologies, Inc. We continue to license NetBoss technology to operate our Network Operations Centers.
Goodwill
Our goodwill for fiscal 2012 and 2011 resulted from our acquisition of Telsima Corporation in fiscal 2009, which was accounted for as a purchase business combination. Goodwill resulting from the Telsima acquisition has been impaired and written off in prior years. We therefore no longer have goodwill on our balance sheets as of June 28, 2013 and June 29, 2012. The changes in the carrying amount of goodwill were as follows:
|
Amount
|
|||
|
(In millions)
|
|||
|
Balance as of July 2, 2010
|
$
|
6.2
|
|
|
Goodwill allocated to WiMAX business
|
(0.6
|
)
|
|
|
Balance as of July 1, 2011
|
5.6
|
|
|
|
Goodwill impairment charges
|
(5.6
|
)
|
|
|
Balance as of June 29, 2012
|
$
|
—
|
|
In the third quarter of fiscal 2011, in conjunction with the reclassification of WiMAX business as a discontinued operation,
$0.6 million
of goodwill was allocated to the WiMAX business. Concurrently we performed an impairment review and recorded a
$0.6 million
impairment charge for WiMAX business goodwill, which was included in loss from discontinued operations. We also performed impairment reviews on the remaining
$5.6 million
goodwill, and determined that there was no impairment as of July 1, 2011.
In the second quarter of fiscal 2012, we concluded that a goodwill impairment indicator existed due to a significant decline in our market capitalization. Therefore we performed a goodwill impairment analysis and recorded a
$5.6 million
goodwill impairment charge in the quarter. As of June 28, 2013 and June 29, 2012, we did not have any goodwill on our consolidated balance sheets.
Identifiable Intangible Assets
A summary of our identifiable intangible assets is presented below:
62
|
Purchased
Technology
|
Trade
Names
|
Customer
Relationships
|
Total
Identifiable
Intangible
Assets
|
||||||||||||
|
(In millions)
|
|||||||||||||||
|
Net identifiable intangible assets as of July 1, 2011
|
$
|
1.3
|
|
$
|
1.3
|
|
$
|
1.5
|
|
$
|
4.1
|
|
|||
|
Less: amortization expense
|
(0.7
|
)
|
(1.3
|
)
|
(0.3
|
)
|
(2.3
|
)
|
|||||||
|
Net identifiable intangible assets as of June 29, 2012
|
0.6
|
|
—
|
|
1.2
|
|
1.8
|
|
|||||||
|
Less: amortization expense
|
(0.6
|
)
|
—
|
|
(0.4
|
)
|
(1.0
|
)
|
|||||||
|
Net identifiable intangible assets as of June 28, 2013
|
$
|
—
|
|
$
|
—
|
|
$
|
0.8
|
|
$
|
0.8
|
|
|||
|
Amortization expenses:
|
|||||||||||||||
|
Fiscal 2013
|
$
|
0.6
|
|
$
|
—
|
|
$
|
0.4
|
|
$
|
1.0
|
|
|||
|
Fiscal 2012
|
$
|
0.7
|
|
$
|
1.3
|
|
$
|
0.3
|
|
$
|
2.3
|
|
|||
|
Fiscal 2011
|
$
|
0.7
|
|
$
|
2.3
|
|
$
|
0.4
|
|
$
|
3.4
|
|
|||
|
Weighted average estimated useful life (in years)
|
3.0
|
|
1.6
|
|
5.0
|
|
|||||||||
Our identifiable intangible assets are being amortized over their useful estimated economic lives, which range from
one
to
five
years.
At
June 28, 2013
, we estimate our future amortization of identifiable intangible assets with definite lives by year as follows:
|
Fiscal Year
|
Amount
|
||
|
|
(In millions)
|
||
|
2014
|
$
|
0.4
|
|
|
2015
|
0.4
|
|
|
|
$
|
0.8
|
|
|
Fiscal 2013-2014 Plan
During the fourth quarter of fiscal 2013, we initiated a restructuring plan (the “Fiscal 2013-2014 Plan”) to bring our cost structure in line with the changing business environment of the worldwide microwave radio and telecommunication markets, primarily in North America, Europe and Asia. Activities under the Fiscal 2013-2014 Plan include the downsizing of our Santa Clara, California headquarters and certain international field offices, and reductions in force to reduce our operating expenses. The following table summarizes our costs incurred during fiscal 2013, estimated additional costs to be incurred and estimated total costs expected to be incurred as of
June 28, 2013
under the Fiscal 2013-2014 Plan:
|
Costs Incurred During
Fiscal Year Ended
|
Estimated
Additional
Costs
to be Incurred
|
Total Restructuring
Costs Expected
to be Incurred
|
|||||||||
|
June 28, 2013
|
|||||||||||
|
(in millions)
|
|||||||||||
|
Severance and benefits
|
$
|
1.8
|
|
$
|
2.2
|
|
$
|
4.0
|
|
||
|
Facilities and other
|
—
|
|
5.0
|
|
5.0
|
|
|||||
|
Total for Fiscal 2013-2014 Plan
|
$
|
1.8
|
|
$
|
7.2
|
|
$
|
9.0
|
|
||
During fiscal 2013, our severance and benefits charges under the Fiscal 2013-2014 Plan primarily related to reductions in force in Santa Clara, California, and several international locations of their finance and engineering functions. We intend to complete a majority of the remaining restructuring activities in fiscal 2014.
Fiscal 2011 Plan
During the first quarter of fiscal 2011, we initiated a restructuring plan (the “Fiscal 2011 Plan”) to reduce our operational costs primarily in North America, Europe and Asia. The following table summarizes our costs incurred during fiscal 2013, 2012 and 2011 and total costs incurred through
June 28, 2013
under the Fiscal 2011 Plan:
63
|
Costs Incurred During
Fiscal Year Ended
|
Cumulative
Costs Incurred
Through
June 28, 2013
|
||||||||||||||
|
June 28, 2013
|
June 29, 2012
|
|
July 1, 2011
|
|
|||||||||||
|
(in millions)
|
|||||||||||||||
|
Severance and benefits
|
$
|
1.2
|
|
$
|
0.9
|
|
10.5
|
|
$
|
12.6
|
|
||||
|
Facilities and other
|
0.1
|
|
1.4
|
|
2.2
|
|
3.7
|
|
|||||||
|
Total for Fiscal 2011 Plan
|
$
|
1.3
|
|
$
|
2.3
|
|
$
|
12.7
|
|
$
|
16.3
|
|
|||
During fiscal 2011, our severance and benefits charges under the Fiscal 2011 Plan for North America region related to reductions in force for the downsizing of the Morrisville, North Carolina office, reductions in force in Canada of their finance, human resources, IT and engineering functions, and the reductions in force resulting from the sale of our NetBoss assets. The severance and benefits for International region related primarily to reductions in personnel located in our field offices during fiscal 2011. Facilities and other charges in fiscal 2011 included obligations under non-cancelable leases for facilities that we ceased to use at the Morrisville, North Carolina office upon the permanent downsizing of that office.
During fiscal 2013 and 2012, we continued executing restructuring activities to reduce our operating costs worldwide under the Fiscal 2011 Plan. The facilities charges primarily related to the sublease and relocation of our Morrisville, North Carolina office and Montreal office during the period. As of
June 28, 2013
, we have completed our initiatives under the Fiscal 2011 Plan.
Fiscal 2009 Plan
During the first quarter of fiscal 2009, we announced a restructuring plan to reduce our worldwide workforce in the U.S., France, Canada and other locations throughout the world (the “Fiscal 2009 Plan”). The Fiscal 2009 Plan also included the restructure and transition of our North America manufacturing operations and global supply chain operations. The Fiscal 2009 Plan has been completed at the end of fiscal 2011 and we do not expect to incur future restructuring costs related to the Fiscal 2009 Plan.
The following table summarizes our costs incurred during fiscal 2011 and total costs incurred under the Fiscal 2009 Plan:
|
Costs Incurred During
Fiscal Year Ended
|
Total
Restructuring Costs Incurred
(Completed in Q4 Fiscal 2011)
|
||||||
|
July 1, 2011
|
|||||||
|
Severance and benefits
|
$
|
2.5
|
|
$
|
15.0
|
|
|
|
Facilities and other
|
0.2
|
|
3.0
|
|
|||
|
Total for Fiscal 2009 Plan
|
$
|
2.7
|
|
$
|
18.0
|
|
|
During fiscal 2011, the restructuring activities related to the Fiscal 2009 Plan primarily consisted of outsourcing our San Antonio manufacturing operations to a third party in Austin, Texas. The restructuring charges primarily consisted of the severance and benefits charges for reductions in force in our San Antonio manufacturing facilities and costs related to facility lease obligation adjustments.
Restructuring Liabilities
The information in the following table summarizes our restructuring activities during fiscal
2013, 2012 and 2011
and restructuring liability as of
June 28, 2013
:
64
|
Severance and
Benefits
|
Facilities and
Other
|
Total
|
|||||||||
|
|
(In millions)
|
||||||||||
|
Restructuring liability as of July 2, 2010
|
$
|
2.2
|
|
$
|
4.2
|
|
$
|
6.4
|
|
||
|
Provision related to Fiscal 2011 Plan
|
10.5
|
|
2.2
|
|
12.7
|
|
|||||
|
Provision related to Fiscal 2009 Plan
|
2.5
|
|
0.2
|
|
2.7
|
|
|||||
|
Cash payments
|
(12.0
|
)
|
(4.8
|
)
|
(16.8
|
)
|
|||||
|
Restructuring liability as of July 1, 2011
|
3.2
|
|
1.8
|
|
5.0
|
|
|||||
|
Provision related to Fiscal 2011 Plan
|
0.9
|
|
1.4
|
|
2.3
|
|
|||||
|
Cash payments
|
(3.1
|
)
|
(2.0
|
)
|
(5.1
|
)
|
|||||
|
Restructuring liability as of June 29, 2012
|
1.0
|
|
1.2
|
|
2.2
|
|
|||||
|
Provision related to Fiscal 2013-2014 Plan
|
1.8
|
|
—
|
|
1.8
|
|
|||||
|
Provision related to Fiscal 2011 Plan
|
1.2
|
|
0.1
|
|
1.3
|
|
|||||
|
Cash payments
|
(2.1
|
)
|
(0.5
|
)
|
(2.6
|
)
|
|||||
|
Restructuring liability as of June 28, 2013
|
$
|
1.9
|
|
$
|
0.8
|
|
$
|
2.7
|
|
||
|
Current portion of restructuring liability as of June 28, 2013
|
$
|
2.3
|
|
||||||||
|
Long-term portion of restructuring liability (included in
other long-term liabilities) as of June 28, 2013
|
$
|
0.4
|
|
||||||||
Stock Incentive Programs
2007 Stock Equity Plan
As of
June 28, 2013
, we had
one
stock incentive plan for our employees and outside directors, the 2007 Stock Equity Plan, as amended and restated effective November 17, 2011 (the “2007 Stock Plan”). The 2007 Stock Plan provides for accelerated vesting of certain share-based awards if there is a change in control. The 2007 Stock Plan also provides for the issuance of share-based awards in the form of stock options, stock appreciation rights, restricted stock awards and units, and performance share awards and units. We have various incentive programs under the 2007 Stock Plan, including annual and long-term incentive programs (“AIP” or “LTIP”), a global equity program (“GEP”) and product development incentive programs (“PDIP”). Under the 2007 Stock Plan, option exercise prices are equal to the fair market value on the date the options are granted using our closing stock price. Options may be exercised for a period set at the time of grant, which is generally seven years after the date of grant. Options generally vest in installments on one of three vesting schedules: (1)
50%
one year from the grant date and
25%
each year thereafter over a three-year period from the date of grant; (2) one-third annually over a three-year period from the date of grant; or (3) one-fourth annually over a four-year period from date of grant. Stock options are issued to directors annually and generally vest in one year from the grant date.
Restricted stock is not transferable until vested and the restrictions lapse upon the achievement of continued employment or service over a specified time period. Restricted stock issued to employees generally vests either one-third annually over a three-year period from the date of grant or in full three years after the grant date. Restricted stock is issued to directors annually and generally vests in full one year from the grant date.
Vesting of performance shares under our AIP, LTIP or GEP is subject to financial performance criteria including revenue, operating income, or cash flow targets for the periods as defined in the programs and continued employment through the end of the applicable period. Performance shares under our PDIPs are issued to employees related to certain new product development projects and vest upon achievement of the product development milestones as defined in the programs.
Upon the exercise of stock options, vesting of restricted stock awards and units, or vesting of performance share awards and units, we issue new shares of our common stock to our employees. All awards that are cancelled prior to vesting or expire unexercised are returned to the approved pool of reserved shares under the 2007 Stock Plan and made available for future grants. Shares of our common stock remaining available for future issuance under the 2007 Stock Plan totaled
4,610,632
as of
June 28, 2013
.
Acquisition Plan
65
We assumed all of the former Stratex outstanding stock options as of January 26, 2007, as part of the Stratex acquisition. The outstanding former Stratex options became fully vested in fiscal 2011.
Employee Stock Purchase Plan
Under the Employee Stock Purchase Plan (“ESPP”), employees are entitled to purchase shares of our common stock at a
5%
discount from the fair market value at the end of a three-month purchase period. As of
June 28, 2013
,
787,750
shares were reserved for future issuances under the ESPP. We issued
26,016
shares under the ESPP during fiscal
2013
.
Share-Based Compensation
Total compensation expense for share-based awards included in our consolidated statements of operations for fiscal
2013, 2012 and 2011
was as follows:
|
Fiscal Year
|
|||||||||||
|
(In millions)
|
2013
|
2012
|
2011
|
||||||||
|
By Expense Category:
|
|||||||||||
|
Cost of product sales and services
|
$
|
0.5
|
|
$
|
0.7
|
|
$
|
0.4
|
|
||
|
Research and development
|
1.0
|
|
0.9
|
|
1.9
|
|
|||||
|
Selling and administrative
|
4.9
|
|
3.6
|
|
2.3
|
|
|||||
|
Discontinued operations
|
—
|
|
—
|
|
0.2
|
|
|||||
|
Total share-based compensation expense
|
$
|
6.4
|
|
$
|
5.2
|
|
$
|
4.8
|
|
||
|
By Types of Award:
|
|||||||||||
|
Options
|
$
|
2.5
|
|
$
|
2.6
|
|
$
|
2.4
|
|
||
|
Restricted stock awards
|
1.5
|
|
1.8
|
|
1.2
|
|
|||||
|
Performance shares
|
2.4
|
|
0.8
|
|
1.2
|
|
|||||
|
Total share-based compensation expense
|
$
|
6.4
|
|
$
|
5.2
|
|
$
|
4.8
|
|
||
As of
June 28, 2013
, there was
$4.2 million
of total unrecognized compensation expense related to nonvested stock options and restricted stock awards and units granted under our 2007 Stock Equity Plan. This expense is expected to be recognized over a weighted-average period of
1.5
years.
Stock Options
A summary of the combined stock option activity under our equity plans during fiscal 2013 is as follows:
|
Shares
|
Weighted
Average
Exercise Price
|
Weighted
Average
Remaining
Contractual
Life
|
Aggregate
Intrinsic Value
|
||||||
|
|
|
|
(Years)
|
($ in millions)
|
|||||
|
Options outstanding as of June 29, 2012
|
5,698,874
|
|
$4.95
|
5.27
|
|
$1.3
|
|||
|
Granted
|
1,371,477
|
|
$2.60
|
||||||
|
Exercised
|
(106,306
|
)
|
$2.17
|
||||||
|
Forfeited
|
(391,235
|
)
|
$2.91
|
||||||
|
Expired
|
(382,246
|
)
|
$12.60
|
||||||
|
Options outstanding as of June 28, 2013
|
6,190,564
|
|
$3.95
|
4.85
|
|
$1.0
|
|||
|
Options exercisable as of June 28, 2013
|
3,311,415
|
|
$5.07
|
4.06
|
|
$0.4
|
|||
|
Options vested and expected to vest as of June 28, 2013
|
5,953,527
|
|
$4.01
|
4.81
|
|
$1.0
|
|||
The aggregate intrinsic value represents the total pre-tax intrinsic value or the aggregate difference between the closing price of our common stock on
June 28, 2013
of
$2.62
and the exercise price for in-the-money options that would have been received by the optionees if all options had been exercised on
June 28, 2013
. The options expected to vest are the result of applying the pre-vesting forfeiture rate assumptions to total outstanding options.
66
Additional information related to our stock options is summarized below:
|
Fiscal Year
|
|||||||||||
|
(In millions, except per share amounts)
|
2013
|
2012
|
2011
|
||||||||
|
Weighted average grant date fair value per share granted
|
$
|
1.30
|
|
$
|
1.22
|
|
$
|
2.41
|
|
||
|
Intrinsic value of options exercised
|
$
|
—
|
|
$
|
—
|
|
$
|
—
|
|
||
|
Fair value of options vested
|
$
|
3.0
|
|
$
|
3.0
|
|
$
|
2.6
|
|
||
The fair value of each option grant under our 2007 Stock Equity Plan was estimated using the Black-Scholes option pricing model on the date of grant. A summary of the significant weighted average assumptions we used in the Black-Scholes valuation model is as follows:
|
Fiscal Year
|
||||||||
|
2013
|
2012
|
2011
|
||||||
|
Expected dividends
|
—
|
%
|
—
|
%
|
—
|
%
|
||
|
Expected volatility
|
64.9
|
%
|
65.9
|
%
|
63.7
|
%
|
||
|
Risk-free interest rate
|
0.49
|
%
|
0.73
|
%
|
1.32
|
%
|
||
|
Expected term (years)
|
4.33
|
|
4.46
|
|
4.35
|
|
||
Expected volatility is based on implied volatility for the expected term of the options from our stock price. Prior to fiscal 2012, due to lack of sufficient trading history, our stock price volatility assumption was based on a hybrid method of implied volatility from our stock price and a group of peer companies whose share prices are publicly available. The expected term of the options is calculated using the simplified method described in the SEC’s Staff Accounting Bulletins Topic 14.D.2. We use the simplified method because we do not have sufficient stock option exercise data and the types of employees that receive share option grants have been significantly changed due to the implementation of our 2012 global equity plan, under which we granted share-based awards to employees who are not eligible for the long-term incentive programs. The risk-free rate for the expected term of the option is based on the U.S. Treasury yield curve in effect at the time of grant. The expected dividend yield is zero because we have not historically paid dividends on our common stock and have no intention to pay dividends in the foreseeable future. The following summarizes all of our stock options outstanding and exercisable as of
June 28, 2013
:
|
|
Options Outstanding
|
|
|
|||||||||
|
|
Number
Outstanding
|
Weighted
Average
Remaining
Contractual
Life
|
Weighted
Average
Exercise Price
|
Options Exercisable
|
||||||||
|
Actual Range of Exercise Prices
|
Number
Exercisable
|
Weighted
Average
Exercise Price
|
||||||||||
|
|
(Years)
|
|||||||||||
|
$1.72 — $2.11
|
1,171,216
|
|
5.33
|
|
$2.08
|
663,158
|
|
$2.08
|
||||
|
$2.28 — $2.37
|
1,097,836
|
|
5.63
|
|
$2.33
|
328,743
|
|
$2.37
|
||||
|
$2.45 — $2.71
|
1,417,048
|
|
5.91
|
|
$2.63
|
186,732
|
|
$2.70
|
||||
|
$2.92 — $5.18
|
992,387
|
|
4.49
|
|
$4.28
|
677,400
|
|
$4.42
|
||||
|
$5.92 — $6.44
|
1,303,124
|
|
3.34
|
|
$6.14
|
1,246,429
|
|
$6.15
|
||||
|
$6.50 — $24.60
|
208,953
|
|
2.03
|
|
$16.63
|
208,953
|
|
$16.63
|
||||
|
$1.72 — $24.60
|
6,190,564
|
|
4.85
|
|
$3.95
|
3,311,415
|
|
$5.07
|
||||
Restricted Stock
A summary of the status of our restricted stock as of
June 28, 2013
and changes during fiscal
2013
are as follows:
67
|
Shares
|
Weighted Average
Grant Date
Fair Value
|
|||
|
Restricted stock outstanding as of June 29, 2012
|
1,310,712
|
|
$3.01
|
|
|
Granted
|
58,009
|
|
$3.62
|
|
|
Vested and released
|
(746,288
|
)
|
$2.87
|
|
|
Forfeited
|
(60,388
|
)
|
$2.73
|
|
|
Restricted stock outstanding as of June 28, 2013
|
562,045
|
|
$3.27
|
|
The fair value of each restricted stock grant is based on the closing price of our common stock on the date of grant and is amortized to compensation expense over its vesting period. The total fair value of restricted stock that vested during fiscal
2013, 2012 and 2011
was
$1.9 million
,
$0.6 million
and
$0.7 million
, respectively.
Performance Share Awards
A summary of the status of our performance shares as of
June 28, 2013
and changes during fiscal
2013
are as follows:
|
Shares
|
Weighted Average
Grant Date
Fair Value
|
|||
|
Performance shares outstanding as of June 29, 2012
|
1,316,175
|
|
$3.63
|
|
|
Granted
|
1,308,213
|
|
$2.38
|
|
|
Vested and released
|
(380,450
|
)
|
$2.47
|
|
|
Forfeited due to target thresholds not achieved
|
(513,740
|
)
|
$3.68
|
|
|
Forfeited due to terminations
|
(103,836
|
)
|
$3.14
|
|
|
Performance shares outstanding as of June 28, 2013
|
1,626,362
|
|
$2.91
|
|
The fair value of each performance share is based on the closing price of our common stock on the date of grant and is amortized to compensation expense over its vesting period if achievement of the performance conditions is considered probable. Any previously recognized compensation cost would be reversed if the performance condition is not satisfied or if it is not probable that the performance conditions will be achieved.
The total fair value of performance share awards that vested during fiscal
2013, 2012 and 2011
was
$0.9 million
,
$0.3 million
and
$1.2 million
, respectively.
We operate in
one
reportable business segment: the design, manufacturing and sale of a range of wireless networking products, solutions and services. We conduct business globally and our sales and support activities are managed on a geographic basis. Our Chief Executive Officer is the Chief Operating Decision Maker (the “CODM”). Our CODM manages our business primarily by function globally and reviews financial information on a consolidated basis, accompanied by disaggregated information about revenues by geographic region, for purposes of allocating resources and evaluating financial performance. The profitability of our geographic region is not a determining factor in allocating resources and the CODM does not evaluate profitability below the level of the consolidated company.
We report revenue by region and country based on the location where our customers accept delivery of our products and services. Revenue by region for
2013, 2012 and 2011
are as follows:
|
|
Fiscal Year
|
||||||||||
|
(In millions)
|
2013
|
2012
|
2011
|
||||||||
|
North America
|
$
|
180.5
|
|
$
|
164.9
|
|
$
|
160.4
|
|
||
|
Africa and Middle East
|
182.2
|
|
147.7
|
|
143.6
|
|
|||||
|
Europe and Russia
|
48.0
|
|
53.6
|
|
73.4
|
|
|||||
|
Latin America and Asia Pacific
|
60.6
|
|
77.8
|
|
74.7
|
|
|||||
|
Total Revenue
|
$
|
471.3
|
|
$
|
444.0
|
|
$
|
452.1
|
|
||
68
Revenue by country comprising more than
5%
of our sales to unaffiliated customers for fiscal
2013, 2012 and 2011
are as follows:
|
(In millions, except %)
|
Revenue
|
% of
Total Revenue
|
|||||
|
Fiscal 2013:
|
|||||||
|
United States
|
$
|
177.0
|
|
37.6
|
%
|
||
|
Nigeria
|
$
|
92.7
|
|
19.7
|
%
|
||
|
Fiscal 2012:
|
|||||||
|
United States
|
$
|
161.6
|
|
36.4
|
%
|
||
|
Nigeria
|
$
|
94.5
|
|
21.3
|
%
|
||
|
France
|
$
|
27.9
|
|
6.3
|
%
|
||
|
Fiscal 2011:
|
|||||||
|
United States
|
$
|
147.2
|
|
32.6
|
%
|
||
|
Nigeria
|
$
|
78.0
|
|
17.3
|
%
|
||
Our long-lived assets, consisting primarily of property, plant and equipment, by geographic areas based on the physical location of the assets as of
June 28, 2013 and June 29, 2012
are as follows:
|
(In millions)
|
June 28,
2013 |
June 29,
2012 |
|||||
|
United States
|
$
|
22.0
|
|
$
|
15.5
|
|
|
|
United Kingdom
|
3.5
|
|
3.6
|
|
|||
|
Other countries
|
3.8
|
|
3.7
|
|
|||
|
Total
|
$
|
29.3
|
|
$
|
22.8
|
|
|
Income (loss) from continuing operations before provision for income taxes during fiscal year
2013, 2012 and 2011
is as follows:
|
Fiscal Year
|
|||||||||||
|
2013
|
2012
|
2011
|
|||||||||
|
|
(In millions)
|
||||||||||
|
United States
|
$
|
(4.8
|
)
|
$
|
(5.6
|
)
|
$
|
(32.3
|
)
|
||
|
Foreign
|
7.2
|
|
(8.4
|
)
|
(12.4
|
)
|
|||||
|
Total
|
$
|
2.4
|
|
$
|
(14.0
|
)
|
$
|
(44.7
|
)
|
||
69
Provision for income taxes from continuing operations for fiscal year
2013, 2012 and 2011
are summarized as follows:
|
Fiscal Year
|
|||||||||||
|
2013
|
2012
|
2011
|
|||||||||
|
|
(In millions)
|
||||||||||
|
Current provision:
|
|||||||||||
|
United States
|
$
|
(0.1
|
)
|
$
|
0.1
|
|
$
|
0.1
|
|
||
|
Foreign
|
13.6
|
|
1.4
|
|
2.0
|
|
|||||
|
State and local
|
—
|
|
—
|
|
—
|
|
|||||
|
13.5
|
|
1.5
|
|
2.1
|
|
||||||
|
Deferred provision (benefit):
|
|||||||||||
|
United States
|
—
|
|
—
|
|
—
|
|
|||||
|
Foreign
|
(0.2
|
)
|
—
|
|
12.0
|
|
|||||
|
State and local
|
—
|
|
—
|
|
—
|
|
|||||
|
(0.2
|
)
|
—
|
|
12.0
|
|
||||||
|
Total provision
|
$
|
13.3
|
|
$
|
1.5
|
|
$
|
14.1
|
|
||
The following table summarizes the significant differences between the U.S. Federal statutory tax rate and our effective tax rate from continuing operations for fiscal year
2013, 2012 and 2011
:
|
Fiscal Year
|
||||||||
|
2013
|
2012
|
2011
|
||||||
|
Statutory U.S. federal tax rate
|
35.0
|
%
|
(35.0
|
)%
|
(35.0
|
)%
|
||
|
Valuation allowances
|
67.4
|
%
|
12.8
|
%
|
51.9
|
%
|
||
|
Foreign non-deductible expenses
|
11.1
|
%
|
—
|
%
|
—
|
%
|
||
|
State and local taxes, net of U.S. federal tax benefit
|
(1.7
|
)%
|
(1.7
|
)%
|
(3.4
|
)%
|
||
|
Goodwill impairment not deductible
|
—
|
%
|
6.6
|
%
|
0.2
|
%
|
||
|
Foreign income taxed at rates less than the U.S. statutory rate
|
(63.9
|
)%
|
4.4
|
%
|
9.0
|
%
|
||
|
Dividend from foreign subsidiary
|
—
|
%
|
12.1
|
%
|
—
|
%
|
||
|
Foreign branch income/withholding taxes
|
27.5
|
%
|
7.2
|
%
|
6.3
|
%
|
||
|
Change in uncertain tax positions
|
488.9
|
%
|
—
|
%
|
—
|
%
|
||
|
Other
|
(3.2
|
)%
|
4.4
|
%
|
2.5
|
%
|
||
|
Effective tax rate
|
561.1
|
%
|
10.8
|
%
|
31.5
|
%
|
||
The income tax expense from continuing operations for fiscal year 2013 was
$13.3 million
. The variation between our income tax expense from continuing operations and income tax expense at the statutory rate of
35%
on our pre-tax income of
$2.4 million
was primarily attributable to a
$11.7 million
increase in our reserve for uncertain tax positions, losses in tax jurisdictions in which we cannot recognize a tax benefit and increase in foreign withholding taxes.
The income tax expense from continuing operations for fiscal year 2012 was
$1.5 million
. The variation between our income tax expense from continuing operations and income tax benefit at the statutory rate of
35%
on our pre-tax loss of
$14.0 million
was primarily attributable to losses in tax jurisdictions in which we cannot recognize a tax benefit. The tax expense for fiscal year 2012 of
$1.5 million
was primarily attributable to profitable foreign entities for which we have accrued income taxes.
The income tax expense from continuing operations for fiscal year 2011 was
$14.1 million
. The variation between our income tax expense from continuing operations of
$14.1 million
and income tax benefit at the statutory rate of
35%
on our pre-tax loss of
$44.7 million
was primarily due to an
$11.3 million
increase in valuation allowance for Singapore deferred tax assets as of the beginning of fiscal 2011 and a
$1.4 million
foreign branch withholding tax accrual. The expense was partially offset by a valuation allowance release of
$1.6 million
on Mexico deferred tax assets as of the beginning of fiscal year 2011.
70
The components of deferred tax assets and liabilities are as follows:
|
|
June 28, 2013
|
June 29, 2012
|
|||||||||||||
|
|
Current
|
Non-Current
|
Current
|
Non-Current
|
|||||||||||
|
|
(In millions)
|
||||||||||||||
|
Deferred tax assets:
|
|||||||||||||||
|
Inventory
|
$
|
10.5
|
|
$
|
—
|
|
$
|
9.9
|
|
$
|
—
|
|
|||
|
Accruals and reserves
|
5.4
|
|
0.1
|
|
4.2
|
|
0.1
|
|
|||||||
|
Bad debts
|
2.5
|
|
—
|
|
4.6
|
|
—
|
|
|||||||
|
Depreciation
|
—
|
|
—
|
|
—
|
|
3.8
|
|
|||||||
|
Amortization
|
—
|
|
24.5
|
|
—
|
|
12.3
|
|
|||||||
|
Stock compensation
|
—
|
|
5.6
|
|
—
|
|
4.6
|
|
|||||||
|
Deferred revenue
|
—
|
|
0.7
|
|
—
|
|
1.9
|
|
|||||||
|
Unrealized exchange gain/loss
|
3.6
|
|
—
|
|
3.5
|
|
—
|
|
|||||||
|
Other
|
—
|
|
4.8
|
|
—
|
|
4.6
|
|
|||||||
|
Tax credit carryforwards
|
—
|
|
20.3
|
|
—
|
|
14.8
|
|
|||||||
|
Tax loss carryforwards
|
—
|
|
122.3
|
|
—
|
|
130.1
|
|
|||||||
|
Total deferred tax assets
|
22.0
|
|
178.3
|
|
22.2
|
|
172.2
|
|
|||||||
|
Valuation allowance
|
(21.1
|
)
|
(176.9
|
)
|
(21.2
|
)
|
(171.8
|
)
|
|||||||
|
Net deferred tax assets
|
0.9
|
|
1.4
|
|
1.0
|
|
0.4
|
|
|||||||
|
Deferred tax liabilities:
|
|||||||||||||||
|
Branch undistributed earnings reserve
|
1.1
|
|
0.2
|
|
1.3
|
|
0.1
|
|
|||||||
|
Depreciation
|
—
|
|
0.8
|
|
—
|
|
0.8
|
|
|||||||
|
Other accruals
|
—
|
|
0.7
|
|
—
|
|
—
|
|
|||||||
|
Total deferred tax liabilities
|
1.1
|
|
1.7
|
|
1.3
|
|
0.9
|
|
|||||||
|
Net deferred tax liability
|
$
|
(0.2
|
)
|
$
|
(0.3
|
)
|
$
|
(0.3
|
)
|
$
|
(0.5
|
)
|
|||
Our valuation allowance related to deferred income taxes, as reflected in our consolidated balance sheet, was
$198.0 million
as of
June 28, 2013
and
$193.0 million
as of
June 29, 2012
. The increase in valuation allowance from fiscal
2012
to fiscal
2013
was primarily due to excess R&D credit that was created in certain foreign jurisdiction.
Tax loss and credit carryforwards as of
June 28, 2013
have expiration dates ranging between one year and no expiration in certain instances. The amount of U.S. federal tax loss carryforwards as of
June 28, 2013
and
June 29, 2012
were
$282.8 million
and
$271.0 million
and begin to expire in fiscal 2023. Credit carryforwards as of
June 28, 2013
and
June 29, 2012
were
$26.1 million
and
$20.9 million
and certain credits began to expire in fiscal 2012. The amount of foreign tax loss carryforwards as of
June 28, 2013
and
June 29, 2012
was
$95.2 million
and
$143.0 million
, respectively.
United States income taxes have not been provided on basis differences in foreign subsidiaries of
$5.5 million
and
$6.3 million
as of
June 28, 2013
and
June 29, 2012
, because of our intention to reinvest these earnings indefinitely. The residual U.S. tax liability, if such amounts were remitted, would be nominal.
We entered into a tax sharing agreement with Harris effective on January 26, 2007, the date of the acquisition of Stratex. The tax sharing agreement addresses, among other things, the settlement process associated with pre-merger tax liabilities and tax attributes that are attributable to the Microwave Communication Division when it was a division of Harris. There was no settlement payments recorded in fiscal year 2013, 2012 or 2011.
We are subject to income taxes in the U.S. and numerous foreign jurisdictions. Significant judgment is required in determining our worldwide provision for income taxes and recording the related assets and liabilities. In the ordinary course of our business, there are many transactions and calculations where the ultimate tax determination is uncertain.
As of
June 28, 2013
and
June 29, 2012
, we had unrecognized tax benefits of
$28.7 million
and
$13.4 million
for various federal, foreign, and state income tax matters. Unrecognized tax benefits increased by
$15.3 million
. Our total unrecognized tax benefits that, if recognized, would affect our effective tax rate were
$15.9 million
and
$4.2 million
, respectively, as of
June 28, 2013
and
June 29, 2012
. These unrecognized tax benefits are presented on the accompanying consolidated balance sheet net of the tax effects of net operating loss carryforwards.
71
We account for interest and penalties related to unrecognized tax benefits as part of our provision for income taxes. We accrued
$0.1 million
interest as of
June 28, 2013
and did not accrue any amount for such interest as of
June 29, 2012
. No penalties have been accrued.
The amount of unrecognized tax benefits may change in the next twelve months. We believe that we have adequately provided for any reasonably foreseeable outcomes related to our tax audits.
Our unrecognized tax benefit activity for fiscal
2013, 2012 and 2011
is as follows:
|
(In millions)
|
Amount
|
||
|
Unrecognized tax benefit as of July 2, 2010
|
$
|
14.9
|
|
|
Additions for tax positions in prior periods
|
1.3
|
|
|
|
Decreases for tax positions in prior periods
|
(2.2
|
)
|
|
|
Unrecognized tax benefit as of July 1, 2011
|
14.0
|
|
|
|
Additions for tax positions in prior periods
|
—
|
|
|
|
Decreases for tax positions in prior periods
|
(0.6
|
)
|
|
|
Unrecognized tax benefit as of June 29, 2012
|
13.4
|
|
|
|
Additions for tax positions in current periods
|
0.7
|
|
|
|
Additions for tax positions in prior periods
|
15.0
|
|
|
|
Decreases for tax positions in prior periods
|
(0.4
|
)
|
|
|
Unrecognized tax benefit as of June 28, 2013
|
$
|
28.7
|
|
We have a number of years with open tax audits which vary from jurisdiction to jurisdiction. Our major tax jurisdictions include the U.S., Singapore and Nigeria. The earliest years still open and subject to potential audits for these jurisdictions are as follows: U.S. —2003; Singapore — 2005; and Nigeria — 2004.
In fiscal year 2013, we received several assessments from the taxing authorities in various foreign countries challenging certain tax benefits recognized in those jurisdictions. We continue to protest these assessments and defend the positions that we have taken with regards to these tax benefits.
We use derivative instruments to manage our market exposures to foreign currency risk. Our objectives for using derivatives are to reduce the volatility of earnings and cash flows associated with changes in foreign currency exchange rates. We do not hold or issue derivatives for trading purposes or make speculative investments in foreign currencies. All derivative instruments are carried on the balance sheet at fair value.
Our major foreign currency hedging activities are described below:
Cash Flow Hedges
. We use currency forward contracts to hedge exposures related to certain forecasted foreign currency transactions relating to revenue, product costs, operating expenses and intercompany transactions. As of
June 28, 2013
, hedged transactions included our customer and intercompany backlog and outstanding purchase commitments denominated primarily in the Australian dollar, Euro, Polish zloty and South Africa rand. These derivatives are designated as cash flow hedges and typically have maturities from one to three months with a maximum of six months, which in general closely match the underlying forecasted transaction in duration.
We measure the effectiveness of the hedges of forecasted transactions on a monthly basis by comparing the fair values of the designated currency forward contracts with the fair values of the forecasted transactions. The effective portion of the contract’s gain and loss is initially recognized in other comprehensive income or loss (“OCI”) and, upon occurrence of the forecasted transaction, is reclassified into the income or expense line item to which the hedged transaction relates. Any ineffective portion of the derivative hedging gain or loss as well as changes in the fair value of the derivative’s time value (which are excluded from the assessment of hedge effectiveness) is recorded in current period earnings, specifically, in cost of product sales as these gains and losses are considered by us to be operational in nature. If the forecasted transaction does not occur, or it becomes probable that it will not occur, the gain or loss on the related cash flow hedge is recognized immediately in cost of product sales.
72
As of
June 28, 2013
, it is expected that
$0.1 million
of derivative net gain on both outstanding and matured derivatives recorded in AOCI will be reclassified to net income or loss during the next twelve months as a result of underlying hedged transactions also being recorded in net income or loss. Actual amounts ultimately to be reclassified to net income or loss depend on the exchange rates in effect when currently outstanding derivative contracts mature.
Balance Sheet Hedges
. We also use foreign exchange forward contracts to mitigate the gains and losses generated from the re-measurement of certain monetary assets and liabilities denominated in a foreign currency, including primarily cash balances, third party accounts receivable and accounts payable, and intercompany transactions recorded on the balance sheet. These derivatives are not designated and do not qualify as hedge instruments and accordingly are carried at fair value with changes recorded in the cost of product sales in current period. Changes in the fair value of these derivatives are largely offset by re-measurement of the underlying assets and liabilities. These derivatives have maturities of approximately one month.
The following table presents the gross notional value of all our foreign exchange forward contracts outstanding as of
June 28, 2013
and
June 29, 2012
:
|
(In millions)
|
June 28, 2013
|
June 29, 2012
|
||||||
|
Cash flow hedges:
|
||||||||
|
Australian dollar
|
$
|
0.5
|
|
$
|
1.2
|
|
||
|
Euro
|
2.8
|
|
4.2
|
|
||||
|
Polish zloty
|
4.8
|
|
1.9
|
|
||||
|
Republic of South Africa rand
|
—
|
|
4.5
|
|
||||
|
Other
|
—
|
|
0.4
|
|
||||
|
Total cash flow hedges
|
8.1
|
|
12.2
|
|
||||
|
Balance sheet hedges:
|
||||||||
|
Australian dollar
|
2.1
|
|
2.4
|
|
||||
|
Canadian dollar
|
0.3
|
|
1.5
|
|
||||
|
Euro
|
1.4
|
|
6.2
|
|
||||
|
Indian rupee
|
2.3
|
|
0.9
|
|
||||
|
Philippine peso
|
3.1
|
|
3.8
|
|
||||
|
Polish zloty
|
6.9
|
|
5.6
|
|
||||
|
Singapore dollar
|
—
|
|
0.6
|
|
||||
|
Thailand baht
|
0.6
|
|
1.1
|
|
||||
|
Republic of South Africa rand
|
2.4
|
|
2.9
|
|
||||
|
Other
|
1.4
|
|
1.1
|
|
||||
|
Total non-designated hedges
|
20.5
|
|
26.1
|
|
||||
|
Total
|
$
|
28.6
|
|
$
|
38.3
|
|
||
The following table presents the fair value of derivative instruments included within our consolidated balance sheet as of
June 28, 2013
and
June 29, 2012
:
|
|
Asset Derivatives
|
Liability Derivatives
|
||||||||||||||||||
|
(In millions)
|
Balance Sheet
Location
|
June 28,
2013 |
June 29,
2012 |
Balance Sheet
Location
|
June 28,
2013 |
June 29,
2012 |
||||||||||||||
|
Derivatives designated as hedging instruments:
|
||||||||||||||||||||
|
Foreign exchange forward contracts
|
Other current
assets |
$
|
0.1
|
|
$
|
0.1
|
|
Other accrued
expenses
|
$
|
—
|
|
$
|
0.1
|
|
||||||
|
Derivatives not designated as hedging instruments:
|
||||||||||||||||||||
|
Foreign exchange forward contracts
|
Other current
assets |
—
|
|
—
|
|
Other accrued
expenses
|
0.1
|
|
—
|
|
||||||||||
|
Total derivatives
|
$
|
0.1
|
|
$
|
0.1
|
|
$
|
0.1
|
|
$
|
0.1
|
|
||||||||
73
The following table summarizes the location and amount of the gains and losses on derivative instruments reported in our financial statements during fiscal
2013, 2012 and 2011
:
|
Fiscal Year
|
||||||||||||
|
Locations of Gains (Losses) on Derivative Instruments
|
2013
|
2012
|
2011
|
|||||||||
|
|
(In millions)
|
|||||||||||
|
Designated as cash flow hedges (foreign exchange forward contracts):
|
||||||||||||
|
Effective portion of gain (loss) recognized in OCI
|
$
|
0.1
|
|
$
|
0.8
|
|
$
|
(0.6
|
)
|
|||
|
Effective portion of gain (loss) reclassified from AOCI into:
|
||||||||||||
|
Revenue
|
$
|
0.1
|
|
$
|
(0.9
|
)
|
$
|
0.4
|
|
|||
|
Cost of Products Sold
|
$
|
(0.1
|
)
|
$
|
0.1
|
|
$
|
(0.1
|
)
|
|||
|
Loss associated with the derivatives' time value recognized in cost of
product sales
|
$
|
(0.2
|
)
|
$
|
(0.2
|
)
|
$
|
(0.2
|
)
|
|||
|
Gain (loss) due to hedge ineffectiveness recognized in cost of product sales
|
$
|
—
|
|
$
|
—
|
|
$
|
—
|
|
|||
|
Not designated as cash flow hedges (foreign exchange forward contracts):
|
||||||||||||
|
Gain (loss) recognized in cost of product sales
|
$
|
0.5
|
|
$
|
1.2
|
|
$
|
(2.3
|
)
|
|||
Credit Risk
We are exposed to credit-related losses in the event of non-performance by counterparties to hedging instruments. The counterparties to all derivative transactions are major financial institutions with investment grade credit ratings. However, this does not eliminate our exposure to credit risk with these institutions. Should any of these counterparties fail to perform as contracted, we could incur interest charges and unanticipated gains or losses on the settlement of the derivatives in addition to the recorded fair value of the derivative due to non-delivery of the currency. To manage this risk, we have established strict counterparty credit guidelines for financial institutions providing foreign currency exchange services in accordance with corporate policy. As a result of the above considerations, we consider the risk of counterparty default to be immaterial.
The credit facilities we have with financial institutions under which we transact foreign exchange transactions are generally restricted to a total notional amount outstanding, a maximum settlement amount in any one day and a maximum term. There are no formal written agreements supporting these facilities other than the financial institutions’ general terms and conditions for trading. None of the facilities are collateralized and none require compliance with financial covenants or contain cross default or other provisions which could affect other credit arrangements we have with the same or other banks. If we fail to deliver currencies as required upon settlement of a trade, the bank may require early settlement on a net basis of all derivatives outstanding and if any amounts are still owing to the bank, they may charge any cash account we have with the bank for that amount.
Operating Lease Commitments
We lease office and manufacturing facilities under non-cancelable operating leases expiring at various dates through April 2020. We lease approximately
129,000
square feet of office space in Santa Clara, California as our corporate headquarters. As of
June 28, 2013
, future minimum lease payments for our headquarters total
$17.5 million
through April 2020.
As of
June 28, 2013
, our future minimum lease payments under all non-cancelable operating leases with an initial lease term in excess of one year are as follows:
74
|
Fiscal Years Ending in June
|
Amount
|
||
|
|
(In millions)
|
||
|
2014
|
$
|
5.6
|
|
|
2015
|
4.2
|
|
|
|
2016
|
3.8
|
|
|
|
2017
|
2.9
|
|
|
|
2018
|
2.9
|
|
|
|
Thereafter
|
5.1
|
|
|
|
Total
|
$
|
24.5
|
|
These commitments do not contain any material rent escalations, rent holidays, contingent rent, rent concessions, leasehold improvement incentives or unusual provisions or conditions. We sublease a portion of our facilities to third parties and total minimum rentals to be received in the future under our noncancelable subleases was
$0.7 million
as of
June 28, 2013
.
Rental expense for operating leases, including rentals on a month-to-month basis was
$8.5 million
,
$9.3 million
and
$11.1 million
in fiscal
2013, 2012 and 2011
, respectively.
Purchase Orders and Other Commitments
From time to time in the normal course of business we may enter into purchasing agreements with our suppliers that require us to accept delivery of, and remit full payment for, finished products that we have ordered, finished products that we requested be held as safety stock, and work in process started on our behalf in the event we cancel or terminate the purchasing agreement. Because these agreements do not specify fixed or minimum quantities, do not specify minimum or variable price provisions, and do not specify the approximate timing of the transaction, and we have no present intention to cancel or terminate any of these agreements, we currently do not believe that we have any future liability under these agreements. As of
June 28, 2013
, we had outstanding purchase obligations with our suppliers or contract manufacturers of
$61.5 million
. In addition, we had contractual obligations of approximately
$5.0 million
associated with major capital purchase and service agreements as of
June 28, 2013
.
Financial Guarantees and Commercial Commitments
Guarantees issued by banks, insurance companies or other financial institutions are contingent commitments issued to guarantee our performance under borrowing arrangements, such as bank overdraft facilities, tax and customs obligations and similar transactions or to ensure our performance under customer or vendor contracts. The terms of the guarantees are generally equal to the remaining term of the related debt or other obligations and are generally limited to
two
years or less. As of
June 28, 2013
, we had no guarantees applicable to our debt arrangements.
We have entered into commercial commitments in the normal course of business including surety bonds, standby letters of credit agreements and other arrangements with financial institutions primarily relating to the guarantee of future performance on certain contracts to provide products and services to customers. As of
June 28, 2013
, we had commercial commitments of
$54.0 million
outstanding that were not recorded on our consolidated balance sheets. We do not believe, based on historical experience and information currently available, that it is probable that any amounts will be required to be paid on the performance guarantees.
Indemnifications
Under the terms of substantially all of our license agreements, we have agreed to defend and pay any final judgment against our customers arising from claims against such customers that our software products infringe the intellectual property rights of a third party. As of
June 28, 2013
, we have not received any notice that any customer is subject to an infringement claim arising from the use of our software products; we have not received any request to defend any customers from infringement claims arising from the use of our software products; and we have not paid any final judgment on behalf of any customer related to an infringement claim arising from the use of our software products. Because the outcome of infringement disputes is related to the specific facts of each case, and given the lack of previous or current indemnification claims, we cannot estimate the maximum amount of potential future payments, if any, related to our indemnification provisions. As of
June 28, 2013
, we had not recorded any liabilities related to these indemnifications.
Legal Proceedings
75
From time to time, we may be involved in various legal claims and litigation that arise in the normal course of our operations. While the results of such claims and litigation cannot be predicted with certainty, we currently believe that we are not a party to any litigation the final outcome of which is likely to have a material adverse effect on our financial position, results of operations or cash flows. However, should we not prevail in any such litigation; it could have a material adverse impact on our operating results, cash flows or financial position.
Contingent Liabilities
We have unresolved legal and tax matters, as discussed further in “Note 13. Income Taxes” and in this note. We record a loss contingency as a charge to operations when (i) it is probable that an asset has been impaired or a liability has been incurred at the date of the financial statements; and (ii) the amount of the loss can be reasonably estimated. Disclosure in the notes to the financial statements is required for loss contingencies that do not meet both those conditions if there is a reasonable possibility that a loss may have been incurred. Gain contingencies are not recorded until realized. We expense all legal costs incurred to resolve regulatory, legal and tax matters as incurred.
Periodically, we review the status of each significant matter to assess the potential financial exposure. If a potential loss is considered probable and the amount can be reasonably estimated, we reflect the estimated loss in our results of operations. Significant judgment is required to determine the probability that a liability has been incurred or an asset impaired and whether such loss is reasonably estimable. Further, estimates of this nature are highly subjective, and the final outcome of these matters could vary significantly from the amounts that have been included in our consolidated financial statements. As additional information becomes available, we reassess the potential liability related to our pending claims and litigation and may revise estimates accordingly. Such revisions in the estimates of the potential liabilities could have a material impact on our results of operations and financial position.
The following financial information reflects all normal recurring adjustments, which are, in the opinion of management, necessary for a fair statement of the results of the interim periods. Our fiscal quarters end on the Friday nearest the end of the calendar quarter. Summarized quarterly data for fiscal
2013
and
2012
are as follows:
|
Q1
Ended 9/28/2012 |
Q2
Ended 12/28/2012 |
Q3
Ended 3/29/2013 |
Q4
Ended 6/28/2013 |
||||||||||||
|
|
(In millions, except per share amounts)
|
||||||||||||||
|
Fiscal 2013
|
|||||||||||||||
|
Revenue
|
$
|
115.0
|
|
$
|
129.0
|
|
$
|
118.3
|
|
$
|
109.0
|
|
|||
|
Gross margin
|
$
|
33.7
|
|
$
|
38.7
|
|
$
|
34.1
|
|
$
|
33.6
|
|
|||
|
Operating income (loss)
|
$
|
0.7
|
|
$
|
4.9
|
|
$
|
(1.0
|
)
|
$
|
(2.9
|
)
|
|||
|
Net loss
|
$
|
(2.2
|
)
|
$
|
(5.3
|
)
|
$
|
(1.7
|
)
|
$
|
(5.8
|
)
|
|||
|
Per share data:
|
|||||||||||||||
|
Basic and diluted net loss per common share
|
$
|
(0.04
|
)
|
$
|
(0.09
|
)
|
$
|
(0.03
|
)
|
$
|
(0.10
|
)
|
|||
|
|
Q1
Ended 9/30/2011 |
Q2
Ended 12/30/2011 |
Q3
Ended 3/30/2012 |
Q4
Ended 6/29/2012 |
|||||||||||
|
|
(In millions, except per share amounts)
|
||||||||||||||
|
Fiscal 2012
|
|||||||||||||||
|
Revenue
|
$
|
111.4
|
|
$
|
105.0
|
|
$
|
111.6
|
|
$
|
116.0
|
|
|||
|
Gross margin
|
$
|
32.7
|
|
$
|
31.9
|
|
$
|
34.3
|
|
$
|
32.8
|
|
|||
|
Operating loss
|
$
|
(2.5
|
)
|
$
|
(8.9
|
)
|
$
|
(0.5
|
)
|
$
|
(1.4
|
)
|
|||
|
Net loss
|
$
|
(6.8
|
)
|
$
|
(12.8
|
)
|
$
|
(3.2
|
)
|
$
|
(1.3
|
)
|
|||
|
Per share data:
|
|||||||||||||||
|
Basic and diluted net loss per common share
|
$
|
(0.12
|
)
|
$
|
(0.22
|
)
|
$
|
(0.05
|
)
|
$
|
(0.02
|
)
|
|||
The following tables summarize certain charges, expenses and loss from discontinued operations included in our results of operations for each of the fiscal quarters presented:
76
|
Q1
Ended 9/28/2012 |
Q2
Ended 12/28/2012 |
Q3
Ended 3/29/2013 |
Q4
Ended 6/28/2013 |
||||||||||||
|
(In millions)
|
|||||||||||||||
|
Fiscal 2013
|
|||||||||||||||
|
Amortization of purchased technology and intangible assets
|
$
|
0.3
|
|
$
|
0.2
|
|
$
|
0.3
|
|
$
|
0.2
|
|
|||
|
Restructuring charges
|
0.3
|
|
0.2
|
|
0.4
|
|
2.2
|
|
|||||||
|
Transactional tax assessments
|
0.7
|
|
—
|
|
0.7
|
|
—
|
|
|||||||
|
Share-based compensation expense
|
1.5
|
|
1.9
|
|
1.4
|
|
1.6
|
|
|||||||
|
Other
|
—
|
|
—
|
|
—
|
|
(0.7
|
)
|
|||||||
|
$
|
2.8
|
|
$
|
2.3
|
|
$
|
2.8
|
|
$
|
3.3
|
|
||||
|
Loss from discontinued operations
|
$
|
1.4
|
|
$
|
0.3
|
|
$
|
0.1
|
|
$
|
2.3
|
|
|||
|
|
Q1
Ended 9/30/2011 |
Q2
Ended 12/30/2011 |
Q3
Ended 3/30/2012 |
Q4
Ended 6/29/2012 |
|||||||||||
|
(In millions)
|
|||||||||||||||
|
Fiscal 2012
|
|||||||||||||||
|
Charges for product transition, product discontinuances and
inventory mark-downs
|
$
|
0.1
|
|
$
|
0.9
|
|
$
|
—
|
|
$
|
—
|
|
|||
|
Amortization of purchased technology and intangible assets
|
0.9
|
|
0.8
|
|
0.3
|
|
0.3
|
|
|||||||
|
Restructuring charges
|
0.9
|
|
0.1
|
|
0.4
|
|
0.9
|
|
|||||||
|
Goodwill impairment charges
|
—
|
|
5.6
|
|
—
|
|
—
|
|
|||||||
|
NetBoss bad debt expenses and other
|
—
|
|
0.4
|
|
0.5
|
|
(0.1
|
)
|
|||||||
|
Transactional tax assessments
|
—
|
|
0.3
|
|
0.3
|
|
—
|
|
|||||||
|
Share-based compensation expense
|
1.0
|
|
1.3
|
|
1.4
|
|
1.5
|
|
|||||||
|
$
|
2.9
|
|
$
|
9.4
|
|
$
|
2.9
|
|
$
|
2.6
|
|
||||
|
Loss from discontinued operations
|
$
|
3.1
|
|
$
|
2.8
|
|
$
|
2.4
|
|
$
|
0.3
|
|
|||
Item 9.
Changes in and Disagreements with Accountants on Accounting and Financial Disclosure
Not applicable.
Item 9A.
Controls and Procedures
Evaluation of Disclosure Controls and Procedures
We maintain disclosure controls and procedures that are designed to ensure that information required to be disclosed in our reports filed or submitted under the Exchange Act is recorded, processed, summarized and reported within the time periods specified in SEC rules and forms. Our disclosure controls and procedures include, without limitation, controls and procedures designed to ensure that information required to be disclosed in our reports filed under the Exchange Act is accumulated and communicated to management, including our Chief Executive Officer and Chief Financial Officer, as appropriate to allow timely decisions regarding required disclosures. There are inherent limitations to the effectiveness of any system of disclosure controls and procedures, including the possibility of human error and the circumvention or overriding of the controls and procedures. Accordingly, even effective disclosure controls and procedures can only provide reasonable assurance of achieving their control objectives.
Management has conducted an evaluation, under the supervision and with the participation of the Chief Executive Officer and Chief Financial Officer, of the effectiveness of the design and operation of our disclosure controls and procedures (as defined in Rules 13a-15(e) and 15d-15(e) under the Exchange Act). Based on this evaluation, the Chief Executive Officer and Chief Financial Officer concluded that our disclosure controls and procedures were effective as of
June 28, 2013
.
77
Management’s Report on Internal Control over Financial Reporting
Our management is responsible for establishing and maintaining adequate internal control over financial reporting (as defined in Rules 13a-15(f) and 15d-15(f) under the Exchange Act). Under the supervision and with the participation of management, including our Chief Executive Officer and Chief Financial Officer, management has assessed the effectiveness of the Company’s internal control over financial reporting based on the framework in Internal Control — Integrated Framework issued by the Committee of Sponsoring Organizations of the Treadway Commission. Based on our assessment, management has concluded that our internal control over financial reporting was effective as of
June 28, 2013
.
KPMG LLP, our independent registered public accounting firm, has issued an attestation report regarding its assessment of our internal control over financial reporting as of
June 28, 2013
, as set forth at the beginning of Part II, Item 8 of this Annual Report on Form 10-K.
Changes in Internal Control over Financial Reporting
There has been no change in our internal controls over financial reporting during the fourth quarter of fiscal 2013 that has materially affected, or is reasonably likely to materially affect, our internal controls over financial reporting.
Item 9B.
Other Information
None.
78
Certain information required by Part III is omitted from this Annual Report on Form 10-K because we will file a definitive Proxy Statement with the SEC within 120 days after the end of our fiscal year ended
June 28, 2013
.
Item 10.
Directors, Executive Officers and Corporate Governance
We adopted a Code of Conduct that is available at
www.aviatnetworks.com
. No amendments to our Code of Business Ethics or waivers from our Code of Conduct with respect to any of our executive officers or directors have been made. If, in the future, we amend our Code of Conduct or grant waivers from our Code of Conduct with respect to any of our executive officers or directors, we will make information regarding such amendments or waivers available on our corporate website (
www.aviatnetworks.com
) for a period of at least 12 months.
For information with respect to Executive Officers, see Part I, Item 1 of this Annual Report on Form 10-K, under “Executive Officers of the Registrant.”
Information regarding our directors and compliance with Section 16(a) of the Exchange Act by our directors and executive officers will appear in our definitive Proxy Statement and is incorporated herein by reference.
Item 11.
Executive Compensation
Information regarding our executive compensation will appear in our definitive Proxy Statement and is incorporated herein by reference.
Item 12.
Security Ownership of Certain Beneficial Owners and Management and Related Stockholder Matters
Equity Compensation Plan Summary
The following table provides information as of
June 28, 2013
, relating to our equity compensation plan pursuant to which grants of options, restricted stock and performance shares may be granted from time to time and the option plans and agreements assumed by us in connection with the Stratex acquisition:
|
Plan Category
|
Number of Securities to
be Issued Upon Exercise
of Options and Vesting
of restricted Stock Units
and Performance Share
Units
(1)
|
Weighted-Average
Exercise Price of
Outstanding
Options
(2)
|
Number of Securities
Remaining Available for
Further Issuance Under
Equity Compensation
Plans (Excluding
Securities Reflected in
the First Column)
|
||||||
|
Equity Compensation plan approved by security holders
(3)
|
7,540,012
|
|
$
|
3.80
|
|
4,610,632
|
|
||
|
Equity Compensation plans not approved by security
holders
(4)
|
44,875
|
|
$
|
23.73
|
|
—
|
|
||
|
Total
|
7,584,887
|
|
$
|
3.95
|
|
4,610,632
|
|
||
_________________________
|
(1)
|
Under the 2007 Stock Equity Plan, in addition to options, we have granted share-based compensation awards in the form of performance shares, restricted stock, performance share units and restricted stock units. As of
June 28, 2013
, there were
2,188,407
such awards outstanding under that plan. The outstanding awards consisted of (i) performance share awards at target and restricted stock awards, for which all
794,084
shares were issued and outstanding; and (ii)
1,394,323
performance share unit awards at target and restricted stock unit awards, for which all
1,394,323
were payable in shares but for which no shares were yet issued and outstanding. The
7,540,012
shares to be issued upon exercise of outstanding options and vesting of restricted stock units and performance share units as listed in the first column consisted of shares to be issued in respect of the exercise of
6,145,689
outstanding options and in respect of the
1,394,323
performance share unit awards and restricted stock units awards payable in shares.
|
|
(2)
|
Excludes weighted average fair value of restricted stock units and performance share units at issuance date.
|
|
(3)
|
Consists solely of our 2007 Stock Equity Plan, as amended and restated effective November 17, 2011.
|
79
|
(4)
|
Consists of common stock that may be issued pursuant to option plans and agreements assumed pursuant to the Stratex acquisition. The Stratex plans were duly approved by the stockholders of Stratex prior to the merger with us. No shares are available for further issuance.
|
|
(5)
|
For further information on our equity compensation plans see “Note 1. The Company and Summary of Significant Accounting Policies” and “Note 11. Stockholders’ Equity” in the notes to consolidated financial statements included in Item 8.
|
The other information required by this item will appear in our definitive Proxy Statement and is incorporated herein by reference.
Item 13.
Certain Relationships and Related Transactions, and Director Independence
Information regarding certain relationships and related transactions, and director independence will appear in our definitive Proxy Statement and is incorporated herein by reference.
Item 14.
Principal Accountant Fees and Services
Information regarding our principal accountant fees and services will appear in our definitive Proxy Statement and is incorporated herein by reference.
80
|
(a)
|
The following documents are filed as part of this report.
|
1. Financial Statements.
The financial statements of Aviat Networks, Inc. are set forth in Item 8 of this Annual Report on Form 10-K.
2. Financial Statement Schedules.
Schedule II — Valuation and Qualifying Accounts for the three fiscal years ended
June 28, 2013
All other schedules have been omitted because the required information is not present or is not present in amounts sufficient to require submission of the schedules or because the information required is included in the consolidated financial statements or notes thereto.
(b) Exhibits.
The following exhibits are filed herewith or are incorporated herein by reference to exhibits previously filed with the SEC:
|
Ex. #
|
|
Description
|
|
2.1
|
|
Intentionally omitted
|
|
2.2
|
|
Intentionally omitted
|
|
2.3
|
|
Intentionally omitted
|
|
2.4
|
|
Asset Purchase Agreement by and among Aviat U.S., Inc. and EION Networks, Inc., dated as of September 2, 2011 (incorporated by reference to Exhibit 2.1 to the Current Report on Form 8-K filed with the SEC on September 9, 2011, File No. 001-33278)
|
|
3.1
|
|
Amended and Restated Certificate of Incorporation of Harris Stratex Networks, Inc. as filed with the Secretary of State of the State of Delaware on November 19, 2009 (incorporated by reference to Exhibit 3.1 to the Current Report on Form 8-K filed with the SEC on November 23, 2009, File No. 001-33278)
|
|
3.2
|
|
Amended and Restated Bylaws of Harris Stratex Networks, Inc. (incorporated by reference to Exhibit 3.2 to the Current Report on Form 8-K filed with the SEC on November 23, 2009, File No. 001-33278)
|
|
3.3
|
|
Certificate of Ownership and Merger Merging Aviat Networks, Inc. into Harris Stratex Networks, Inc., effective January 27, 2010, as filed with the Secretary of State of the State of Delaware on January 27, 2010 (incorporated by reference to Exhibit 3.1 to the Current Report on Form 8-K filed with the SEC on January 28, 2010, File No. 001-33278)
|
81
|
Ex. #
|
|
Description
|
|
4.1
|
|
Intentionally omitted
|
|
4.1.1
|
|
Specimen common stock certificate, adopted as of January 29, 2010 (incorporated by reference to Exhibit 4.1.1 to the Annual Report on Form 10-K for fiscal year end July 2, 2010 filed with the SEC on September 9, 2010, File No. 001-33278)
|
|
4.2
|
|
Intentionally omitted
|
|
4.3
|
|
Intentionally omitted
|
|
10.1
|
|
Intentionally omitted
|
|
10.2
|
|
Intentionally omitted
|
|
10.3
|
|
Intellectual Property Agreement between Harris Stratex Networks, Inc. and Harris Corporation dated January 26, 2007 (incorporated by reference to Exhibit 10.4 to the Current Report on Form 8-K filed with the SEC on February 1, 2007, File No. 001-33278)
|
|
10.4
|
|
Intentionally omitted
|
|
10.5
|
|
Intentionally omitted
|
|
10.6
|
|
Intentionally omitted
|
|
10.6.1
|
|
Intentionally omitted
|
|
10.7
|
|
Intentionally omitted
|
|
10.8
|
|
Intentionally omitted
|
|
10.9
|
|
Intentionally omitted
|
|
10.10
|
|
Tax Sharing Agreement between Harris Stratex Networks, Inc. and Harris Corporation dated January 26, 2007 (incorporated by reference to Exhibit 10.11 to the Current Report on Form 8-K filed with the SEC on February 1, 2007, File No. 001-33278)
|
|
10.11
|
|
Intentionally omitted
|
|
10.12*
|
|
Intentionally omitted
|
|
10.13*
|
|
Intentionally omitted
|
82
|
Ex. #
|
|
Description
|
|
10.13.1*
|
|
Intentionally omitted
|
|
10.14*
|
|
Standard Form of Executive Employment Agreement between Harris Stratex Networks, Inc. and certain executives (incorporated by reference to Exhibit 10.16 to the Current Report on Form 8-K filed with the SEC on February 1, 2007, File No. 001-33278)
|
|
10.15
|
|
Form of Indemnification Agreement between Harris Stratex Networks, Inc. and its directors and certain officers (incorporated by reference to Exhibit 10.16 to the Registration Statement on Form S-1 of Stratex Networks, Inc., File No. 33-13431)
|
|
10.16
|
|
Intentionally omitted
|
|
10.17*
|
|
Harris Stratex Networks, Inc. Annual Incentive Plan (incorporated by reference to Exhibit 10.17 to the Annual Report on Form 10-K for the fiscal year ended June 27, 2008 filed with the SEC on September 25, 2008, File No. 001-33278)
|
|
10.18*
|
|
Harris Stratex Networks, Inc. 2007 Stock Equity Plan (incorporated by reference to Exhibit 4.9 to the Registration Statement on Form S-8 filed with the SEC on February 5, 2007, File No. 333-140442)
|
|
10.18.1
|
|
Harris Stratex Networks, Inc. 2007 Stock Equity Plan (As Amended and Restated Effective November 19, 2009) (incorporated by reference to Appendix B to the Registrant’s Schedule 14A filed with the Securities and Exchange Commission on October 7, 2009, File No. 001-33278)
|
|
10.18.2
|
Aviat Networks, Inc. 2007 Stock Equity Plan (as Amended and Restated Effective November 17, 2011) (incorporated by reference to Appendix A to Schedule 14A filed with the SEC on October 3, 2011, File No. 001-33278)
|
|
|
10.19
|
|
Intentionally omitted
|
|
10.19.1
|
|
Intentionally omitted
|
|
10.20
|
|
Intentionally omitted
|
|
10.20.1
|
|
Intentionally omitted
|
|
10.20.2
|
Loan and Security Agreement between Aviat Networks, Inc., Aviat U.S., Inc., Aviat Networks (S) Pte Ltd. and Silicon Valley Bank, dated September 30, 2010 (incorporated by reference to Exhibit 10.1 to the Current Report on Form 8-K filed with the SEC on October 4, 2010, File No. 001-33278)
|
|
|
10.21
|
|
Intentionally omitted
|
83
|
Ex. #
|
|
Description
|
|
10.22*
|
|
Intentionally omitted
|
|
10.22.1*
|
Employment Agreement, effective as of October 31, 2011, between Aviat Networks, Inc. and Edward J. Hayes, Jr.
(incorporated by reference to the Current Report on Form 8-K filed with the SEC on October 31, 2011, File No. 001-33278)
|
|
|
10.23*
|
|
Employment Agreement, dated as of April 1, 2006, between Harris Stratex Networks, Inc. and Heinz Stumpe (incorporated by reference to Exhibit 10.15.2 to the Quarterly Report on Form 10-Q for the fiscal quarter ended March 30, 2007 filed with the SEC on May 8, 2007, File No. 001-33278)
|
|
10.24*
|
|
Employment Agreement, dated as of May 14, 2002, between Stratex Networks, Inc. and Paul Kennard (incorporated by reference to Exhibit 10.1 to the Stratex Networks, Inc. Quarterly Report on Form 10-Q for the fiscal quarter ended June 30, 2006 filed with the SEC on August 9, 2006, File No. 000-15895)
|
|
10.24.1*
|
|
Amendment A, effective as of April 1, 2006, to Employment Agreement, dated May 14, 2002, between Stratex Networks, Inc. and Paul Kennard (incorporated by reference to Exhibit 10.2 to the Stratex Networks, Inc. Quarterly Report on Form 10-Q for the fiscal quarter ended June 30, 2006 filed with the SEC on August 9, 2006, File No. 000-15895)
|
|
10.24.2*
|
|
Amendment B, effective as of April 1, 2006, to Employment Agreement, dated May 14, 2002, between Stratex Networks, Inc. and Paul Kennard (incorporated by reference to Exhibit 10.3 to the Stratex Networks, Inc. Quarterly Report on Form 10-Q for the fiscal quarter ended June 30, 2006 filed with the SEC on August 9, 2006, File No. 000-15895)
|
|
10.25*
|
|
Employment Agreement, dated as of May 14, 2002, between Stratex Networks, Inc. and Shaun McFall (incorporated by reference to Exhibit 10.25 to the Annual Report on Form 10-K for the fiscal year ended July 3, 2009 filed with the SEC on September 4, 2009, File No. 001-33278)
|
|
10.25.1*
|
|
Amendment, effective April 1, 2006, to Employment Agreement, dated May 14, 2002, between Stratex Networks, Inc. and Shaun McFall (incorporated by reference to Exhibit 10.25.1 to the Annual Report on Form 10-K for the fiscal year ended July 3, 2009 filed with the SEC on September 4, 2009, File No. 001-33278)
|
|
10.26*
|
|
Intentionally omitted
|
|
10.26.1*
|
|
Intentionally omitted
|
|
10.27*
|
|
Intentionally omitted
|
|
10.28*
|
|
Employment Agreement, dated July 18, 2011, between Aviat Networks, Inc. and Michael Pangia (incorporated by reference to the Current Report on Form 8-K filed with the SEC on July 20, 2011, File No. 001-33278)
|
|
10.29*
|
|
Employment Agreement, dated December 30, 2010, between Aviat Networks, Inc. and John Madigan (incorporated by reference to Exhibit 10.1 to the Current Report on Form 8-K filed with the SEC on January 4, 2011, File No. 001-33278)
|
|
10.30
|
|
Moved to item number 10.20.2
|
84
|
Ex. #
|
|
Description
|
|
10.31
|
|
Intentionally omitted
|
|
16
|
|
Letter from Ernst & Young LLP to the Securities and Exchange Commission dated September 12, 2012 (incorporated by reference to Exhibit 16.1 to the Current Report on Form 8-K filed with the Securities and Exchange Commission on September 12, 2012, File No.. 001-33278)
|
|
21
|
|
List of Subsidiaries of Aviat Networks, Inc.
|
|
23.1
|
|
Consent of KPMG LLP
|
|
23.2
|
Consent of Ernst & Young LLP
|
|
|
31.1
|
|
Rule 13a-14(a)/15d-14(a) Certification of Chief Executive Officer
|
|
31.2
|
|
Rule 13a-14(a)/15d-14(a) Certification of Chief Financial Officer
|
|
32.1
|
|
Section 1350 Certification of Chief Executive Officer
|
|
32.2
|
|
Section 1350 Certification of Chief Financial Officer
|
|
101.INS**
|
|
XBRL Instance Document
|
|
101.SCH**
|
|
XBRL Taxonomy Extension Schema Document
|
|
101.CAL**
|
|
XBRL Taxonomy Extension Calculation Linkbase Document
|
|
101.DEF**
|
|
XBRL Taxonomy Extension Definition Linkbase Document
|
|
101.LAB**
|
|
XBRL Taxonomy Extension Label Linkbase Document
|
|
101.PRE**
|
|
XBRL Taxonomy Extension Presentation Linkbase Document
|
_____________________________
|
*
|
Management compensatory contract, arrangement or plan required to be filed as an exhibit pursuant to Item 15(b) of this report.
|
|
**
|
XBRL information is furnished and not filed herewith, is not a part of a registration statement or Prospectus for purposes of sections 11 or 12 of the Securities Act of 1933, is deemed not filed for purposes of section 18 of the Securities Exchange Act of 1934, and otherwise is not subject to liability under these sections.
|
85
SIGNATURES
Pursuant to the requirements of the Securities Exchange Act of 1934, the registrant has duly caused this report to be signed on its behalf by the undersigned, thereunto duly authorized.
|
AVIAT NETWORKS, INC.
(Registrant)
|
||
|
By:
|
|
/s/ Michael A. Pangia
|
|
|
Michael A. Pangia
President and Chief Executive Officer
|
|
Date:
September 20, 2013
Pursuant to the requirements of the Securities Exchange Act of 1934, this report has been signed below by the following persons on behalf of the registrant and in the capacities and on the dates indicated.
|
Signature
|
Title
|
Date
|
||
|
/s/ Michael A. Pangia
|
President and Chief Executive Officer
(Principal Executive Officer)
|
September 20, 2013
|
||
|
Michael A. Pangia
|
||||
|
/s/ Edward J. Hayes, Jr.
|
Senior Vice President and
Chief Financial Officer
(Principal Financial Officer)
|
September 20, 2013
|
||
|
Edward J. Hayes, Jr.
|
||||
|
/s/ John J. Madigan
|
Vice President, Corporate Controller and
Principal Accounting Officer
(Principal Accounting Officer)
|
September 20, 2013
|
||
|
John J. Madigan
|
||||
|
/s/ Charles D. Kissner
|
Chairman of the Board
|
September 20, 2013
|
||
|
Charles D. Kissner
|
||||
|
/s/ William A. Hasler
|
Director
|
September 20, 2013
|
||
|
William A. Hasler
|
||||
|
/s/ Clifford H. Higgerson
|
Director
|
September 20, 2013
|
||
|
Clifford H. Higgerson
|
||||
|
/s/ Raghavendra Rau
|
Director
|
September 20, 2013
|
||
|
Raghavendra Rau
|
||||
|
/s/ Dr. Mohsen Sohi
|
Director
|
September 20, 2013
|
||
|
Dr. Mohsen Sohi
|
||||
|
/s/ James C. Stoffel
|
Lead Independent Director
|
September 20, 2013
|
||
|
James C. Stoffel
|
||||
|
/s/ Edward F. Thompson
|
Director
|
September 20, 2013
|
||
|
Edward F. Thompson
|
||||
86
SCHEDULE II — VALUATION AND QUALIFYING ACCOUNTS AND RESERVES
AVIAT NETWORKS, INC.
Years Ended
June 28, 2013
,
June 29, 2012
and
July 1, 2011
|
|
Balance at
Beginning of
Period
|
Additions Charged to
Costs and
Expenses
|
Deductions
Describe
|
Balance
at End
of Period
|
|||||||||||
|
|
(In millions)
|
||||||||||||||
|
Allowances for collection losses:
|
|||||||||||||||
|
Year ended June 28, 2013
|
$
|
16.2
|
|
$
|
2.8
|
|
$
|
8.8
|
|
(A)
|
$
|
10.2
|
|
||
|
Year ended June 29, 2012
|
$
|
14.2
|
|
$
|
3.9
|
|
$
|
1.9
|
|
(B)
|
$
|
16.2
|
|
||
|
Year ended July 1, 2011
|
$
|
13.3
|
|
$
|
2.9
|
|
$
|
2.0
|
|
(C)
|
$
|
14.2
|
|
||
____________________________
|
Note A
|
Consists of changes to allowance for collection losses of $0.1 million for foreign currency translation losses and $8.9 million for uncollectible accounts charged off, net of recoveries on accounts previously charged off.
|
|
|
Note B
|
Consists of changes to allowance for collection losses of $0.7 million for foreign currency translation gains and $1.2 million for uncollectible accounts charged off, net of recoveries on accounts previously charged off.
|
|
|
Note C
|
Consists of changes to allowance for collection losses of $0.4 million for foreign currency translation losses, $1.7 million in additions from the sale of NetBoss assets and $4.1 million for uncollectible accounts charged off, net of recoveries on accounts previously charged off.
|
|
87
EXHIBIT INDEX
The following exhibits are filed herewith or are incorporated herein by reference to exhibits previously filed with the SEC:
|
Ex. #
|
|
Description
|
|
2.1
|
|
Intentionally omitted
|
|
2.2
|
|
Intentionally omitted
|
|
2.3
|
|
Intentionally omitted
|
|
2.4
|
|
Asset Purchase Agreement by and among Aviat U.S., Inc. and EION Networks, Inc., dated as of September 2, 2011 (incorporated by reference to Exhibit 2.1 to the Current Report on Form 8-K filed with the SEC on September 9, 2011, File No. 001-33278)
|
|
3.1
|
|
Amended and Restated Certificate of Incorporation of Harris Stratex Networks, Inc. as filed with the Secretary of State of the State of Delaware on November 19, 2009 (incorporated by reference to Exhibit 3.1 to the Current Report on Form 8-K filed with the SEC on November 23, 2009, File No. 001-33278)
|
|
3.2
|
|
Amended and Restated Bylaws of Harris Stratex Networks, Inc. (incorporated by reference to Exhibit 3.2 to the Current Report on Form 8-K filed with the SEC on November 23, 2009, File No. 001-33278)
|
|
3.3
|
|
Certificate of Ownership and Merger Merging Aviat Networks, Inc. into Harris Stratex Networks, Inc., effective January 27, 2010, as filed with the Secretary of State of the State of Delaware on January 27, 2010 (incorporated by reference to Exhibit 3.1 to the Current Report on Form 8-K filed with the SEC on January 28, 2010, File No. 001-33278)
|
|
4.1
|
|
Intentionally omitted
|
|
4.1.1
|
|
Specimen common stock certificate, adopted as of January 29, 2010 (incorporated by reference to Exhibit 4.1.1 to the Annual Report on Form 10-K for fiscal year end July 2, 2010 filed with the SEC on September 9, 2010, File No. 001-33278)
|
|
4.2
|
|
Intentionally omitted
|
|
4.3
|
|
Intentionally omitted
|
|
10.1
|
|
Intentionally omitted
|
|
10.2
|
|
Intentionally omitted
|
|
10.3
|
|
Intellectual Property Agreement between Harris Stratex Networks, Inc. and Harris Corporation dated January 26, 2007 (incorporated by reference to Exhibit 10.4 to the Current Report on Form 8-K filed with the SEC on February 1, 2007, File No. 001-33278)
|
88
|
Ex. #
|
|
Description
|
|
10.4
|
|
Intentionally omitted
|
|
10.5
|
|
Intentionally omitted
|
|
10.6
|
|
Intentionally omitted
|
|
10.6.1
|
|
Intentionally omitted
|
|
10.7
|
|
Intentionally omitted
|
|
10.8
|
|
Intentionally omitted
|
|
10.9
|
|
Intentionally omitted
|
|
10.10
|
|
Tax Sharing Agreement between Harris Stratex Networks, Inc. and Harris Corporation dated January 26, 2007 (incorporated by reference to Exhibit 10.11 to the Current Report on Form 8-K filed with the SEC on February 1, 2007, File No. 001-33278)
|
|
10.11
|
|
Intentionally omitted
|
|
10.12*
|
|
Intentionally omitted
|
|
10.13*
|
|
Intentionally omitted
|
|
10.13.1*
|
|
Intentionally omitted
|
|
10.14*
|
|
Standard Form of Executive Employment Agreement between Harris Stratex Networks, Inc. and certain executives (incorporated by reference to Exhibit 10.16 to the Current Report on Form 8-K filed with the SEC on February 1, 2007, File No. 001-33278)
|
|
10.15
|
|
Form of Indemnification Agreement between Harris Stratex Networks, Inc. and its directors and certain officers (incorporated by reference to Exhibit 10.16 to the Registration Statement on Form S-1 of Stratex Networks, Inc., File No. 33-13431)
|
|
10.16
|
|
Intentionally omitted
|
89
|
Ex. #
|
|
Description
|
|
10.17*
|
|
Harris Stratex Networks, Inc. Annual Incentive Plan (incorporated by reference to Exhibit 10.17 to the Annual Report on Form 10-K for the fiscal year ended June 27, 2008 filed with the SEC on September 25, 2008, File No. 001-33278)
|
|
10.18*
|
|
Harris Stratex Networks, Inc. 2007 Stock Equity Plan (incorporated by reference to Exhibit 4.9 to the Registration Statement on Form S-8 filed with the SEC on February 5, 2007, File No. 333-140442)
|
|
10.18.1
|
|
Harris Stratex Networks, Inc. 2007 Stock Equity Plan (As Amended and Restated Effective November 19, 2009) (incorporated by reference to Appendix B to the Registrant’s Schedule 14A filed with the Securities and Exchange Commission on October 7, 2009, File No. 001-33278)
|
|
10.18.2
|
Aviat Networks, Inc. 2007 Stock Equity Plan (as Amended and Restated Effective November 17, 2011) (incorporated by reference to Appendix A to Schedule 14A filed with the SEC on October 3, 2011, File No. 001-33278)
|
|
|
10.19
|
|
Intentionally omitted
|
|
10.19.1
|
|
Intentionally omitted
|
|
10.20
|
|
Intentionally omitted
|
|
10.20.1
|
|
Intentionally omitted
|
|
10.20.2
|
Loan and Security Agreement between Aviat Networks, Inc., Aviat U.S., Inc., Aviat Networks (S) Pte Ltd. and Silicon Valley Bank, dated September 30, 2010 (incorporated by reference to Exhibit 10.1 to the Current Report on Form 8-K filed with the SEC on October 4, 2010, File No. 001-33278)
|
|
|
10.21
|
|
Intentionally omitted
|
|
10.22*
|
|
Intentionally omitted
|
|
10.22.1*
|
Employment Agreement, effective as of October 31, 2011, between Aviat Networks, Inc. and Edward J. Hayes, Jr. (incorporated by reference to the Current Report on Form 8-K filed with the SEC on October 31, 2011, File No. 001-33278)
|
|
|
10.23*
|
|
Employment Agreement, dated as of April 1, 2006, between Harris Stratex Networks, Inc. and Heinz Stumpe (incorporated by reference to Exhibit 10.15.2 to the Quarterly Report on Form 10-Q for the fiscal quarter ended March 30, 2007 filed with the SEC on May 8, 2007, File No. 001-33278)
|
|
10.24*
|
|
Employment Agreement, dated as of May 14, 2002, between Stratex Networks, Inc. and Paul Kennard (incorporated by reference to Exhibit 10.1 to the Stratex Networks, Inc. Quarterly Report on Form 10-Q for the fiscal quarter ended June 30, 2006 filed with the SEC on August 9, 2006, File No. 000-15895)
|
|
10.24.1*
|
|
Amendment A, effective as of April 1, 2006, to Employment Agreement, dated May 14, 2002, between Stratex Networks, Inc. and Paul Kennard (incorporated by reference to Exhibit 10.2 to the Stratex Networks, Inc. Quarterly Report on Form 10-Q for the fiscal quarter ended June 30, 2006 filed with the SEC on August 9, 2006, File No. 000-15895)
|
90
|
Ex. #
|
|
Description
|
|
10.24.2*
|
|
Amendment B, effective as of April 1, 2006, to Employment Agreement, dated May 14, 2002, between Stratex Networks, Inc. and Paul Kennard (incorporated by reference to Exhibit 10.3 to the Stratex Networks, Inc. Quarterly Report on Form 10-Q for the fiscal quarter ended June 30, 2006 filed with the SEC on August 9, 2006, File No. 000-15895)
|
|
10.25*
|
|
Employment Agreement, dated as of May 14, 2002, between Stratex Networks, Inc. and Shaun McFall (incorporated by reference to Exhibit 10.25 to the Annual Report on Form 10-K for the fiscal year ended July 3, 2009 filed with the SEC on September 4, 2009, File No. 001-33278)
|
|
10.25.1*
|
|
Amendment, effective April 1, 2006, to Employment Agreement, dated May 14, 2002, between Stratex Networks, Inc. and Shaun McFall (incorporated by reference to Exhibit 10.25.1 to the Annual Report on Form 10-K for the fiscal year ended July 3, 2009 filed with the SEC on September 4, 2009, File No. 001-33278)
|
|
10.26*
|
|
Intentionally omitted
|
|
10.26.1*
|
|
Intentionally omitted
|
|
10.27*
|
|
Intentionally omitted
|
|
10.28*
|
|
Employment Agreement, dated July 18, 2011, between Aviat Networks, Inc. and Michael Pangia (incorporated by reference to the Current Report on Form 8-K filed with the SEC on July 20, 2011, File No. 001-33278)
|
|
10.29*
|
|
Employment Agreement, dated December 30, 2010, between Aviat Networks, Inc. and John Madigan (incorporated by reference to Exhibit 10.1 to the Current Report on Form 8-K filed with the SEC on January 4, 2011, File No. 001-33278)
|
|
10.30
|
|
Moved to item number 10.20.2
|
|
|
||
|
10.31
|
|
Intentionally omitted
|
|
16
|
|
Letter from Ernst & Young LLP to the Securities and Exchange Commission dated September 12, 2012 (incorporated by reference to Exhibit 16.1 to the Current Report on Form 8-K filed with the Securities and Exchange Commission on September 12, 2012, File No.. 001-33278)
|
|
21
|
|
List of Subsidiaries of Aviat Networks, Inc.
|
|
23.1
|
|
Consent of KPMG LLP
|
|
23.2
|
Consent of Ernst & Young LLP
|
|
|
31.1
|
|
Rule 13a-14(a)/15d-14(a) Certification of Chief Executive Officer
|
|
31.2
|
|
Rule 13a-14(a)/15d-14(a) Certification of Chief Financial Officer
|
|
32.1
|
|
Section 1350 Certification of Chief Executive Officer
|
|
32.2
|
|
Section 1350 Certification of Chief Financial Officer
|
|
101.INS**
|
|
XBRL Instance Document
|
|
101.SCH**
|
|
XBRL Taxonomy Extension Schema Document
|
|
101.CAL**
|
|
XBRL Taxonomy Extension Calculation Linkbase Document
|
|
101.DEF**
|
|
XBRL Taxonomy Extension Definition Linkbase Document
|
|
101.LAB**
|
|
XBRL Taxonomy Extension Label Linkbase Document
|
|
101.PRE**
|
|
XBRL Taxonomy Extension Presentation Linkbase Document
|
______________________________
91
|
*
|
Management compensatory contract, arrangement or plan required to be filed as an exhibit pursuant to Item 15(b) of this report.
|
|
**
|
XBRL information is furnished and not filed herewith, is not a part of a registration statement or Prospectus for purposes of sections 11 or 12 of the Securities Act of 1933, is deemed not filed for purposes of section 18 of the Securities Exchange Act of 1934, and otherwise is not subject to liability under these sections.
|
92
TABLE OF CONTENTS
Part IItem 1. BusinessItem 1A. Risk FactorsItem 1B. Unresolved Staff CommentsItem 2. PropertiesItem 3. Legal ProceedingsItem 4. Mine Safety DisclosuresPart IIItem 5. Market For Registrant S Common Equity, Related Stockholder Matters and Issuer Purchases Of Equity SecuritiesItem 6. Selected Financial DataItem 7. Management S Discussion and Analysis Of Financial Condition and Results Of OperationsItem 7A. Quantitative and Qualitative Disclosures About Market RiskItem 8. Financial Statements and Supplementary DataNote 1. The Company and Summary Of Significant Accounting PoliciesNote 2. Accumulated Other Comprehensive Income (loss)Note 3. Net Income (loss) Per Share Of Common StockNote 4. Balance Sheet ComponentsNote 5. Fair Value Measurements Of Assets and LiabilitiesNote 6. Redeemable Preference SharesNote 7. Credit Facility and DebtNote 8. DivestituresNote 9. Goodwill and Identifiable Intangible AssetsNote 10. Restructuring ActivitiesNote 11. Stockholders EquityNote 12. Segment and Geographic InformationNote 13. Income TaxesNote 14. Derivative Financial Instruments and Hedging ActivitiesNote 15. Commitments and ContingenciesNote 16. Quarterly Financial Data (unaudited)Item 9. Changes in and Disagreements with Accountants on Accounting and Financial DisclosureItem 9A. Controls and ProceduresItem 9B. Other InformationPart IIIItem 10. Directors, Executive Officers and Corporate GovernanceItem 11. Executive CompensationItem 12. Security Ownership Of Certain Beneficial Owners and Management and Related Stockholder MattersItem 13. Certain Relationships and Related Transactions, and Director IndependenceItem 14. Principal Accountant Fees and ServicesPart IVItem 15. Exhibits and Financial Statement Schedules