AVIAT NETWORKS, INC.
10-Ks and 10-Qs
|
|
|
|
|
|
|
|
|
|
|
|
|
|
|
|
|
|
|
|
|
|
|
|
|
|
|
|
|
|
|
|
|
|
|
|
|
|
|
|
|
|
|
|
|
|
|
|
|
|
|
|
|
|
|
|
|
|
|
|
|
|
UNITED STATES
SECURITIES AND EXCHANGE COMMISSION
Washington, D.C. 20549
________________________________
Form 10-K
(Mark One)
|
x
|
ANNUAL REPORT PURSUANT TO SECTION 13 OR 15(d) OF THE SECURITIES EXCHANGE ACT OF 1934
|
For the fiscal year ended
June 27, 2014
or
|
¨
|
TRANSITION REPORT PURSUANT TO SECTION 13 OR 15(d) OF THE SECURITIES EXCHANGE ACT OF 1934
|
Commission File Number 001-33278
______________________________
AVIAT NETWORKS, INC.
(Exact name of registrant as specified in its charter)
______________________________
|
Delaware
|
|
20-5961564
|
|
(State or other jurisdiction of incorporation or organization)
|
|
(I.R.S. Employer Identification No.)
|
|
5200 Great America Parkway
Santa Clara, California
|
|
95054
|
|
(Address of principal executive offices)
|
|
(Zip Code)
|
Registrant’s telephone number, including area code: (408) 567-7000
Securities registered pursuant to Section 12(b) of the Act:
|
Title of Each Class
|
|
Name of Each Exchange on Which Registered
|
|
Common Stock, par value $0.01 per share
|
|
NASDAQ Stock Market LLC
(NASDAQ Global Select Market)
|
Securities registered pursuant to Section 12(g) of the Act: None
_____________________________________________
Indicate by check mark if the registrant is a well-known seasoned issuer, as defined in Rule 405 of the Securities Act. Yes
o
No
x
Indicate by check mark if the registrant is not required to file reports pursuant to Section 13 or Section 15(d) of the Act. Yes
o
No
x
Indicate by check mark whether the registrant (1) has filed all reports required to be filed by Section 13 or 15(d) of the Securities Exchange Act of 1934 during the preceding 12 months (or for such shorter period that the registrant was required to file such reports), and (2) has been subject to such filing requirements for the past 90 days. Yes
o
No
x
Indicate by check mark whether the registrant has submitted electronically and posted on its corporate Web site, if any, every Interactive Data File required to be submitted and posted pursuant to Rule 405 of Regulation S-T (§232.405 of this chapter) during the preceding 12 months (or for such shorter period that the registrant was required to submit and post such files). Yes
x
No
o
Indicate by check mark if disclosure of delinquent filers pursuant to Item 405 of Regulation S-K (§229.405 of this chapter) is not contained herein, and will not be contained, to the best of registrant’s knowledge, in definitive proxy statements incorporated by reference in Part III of this Form 10-K or any amendment to this Form 10-K.
x
Indicate by check mark whether the registrant is a large accelerated filer, an accelerated filer, a non-accelerated filer, or a smaller reporting company. See the definitions of “large accelerated filer,” “accelerated filer” and “smaller reporting company” in Rule 12b-2 of the Exchange Act. (Check one):
|
Large accelerated filer
|
o
|
|
Accelerated filer
|
x
|
|
Non-accelerated filer
|
o
(Do not check if a smaller reporting company)
|
|
Smaller reporting company
|
o
|
Indicate by check mark whether the registrant is a shell company (as defined in Rule 12b-2 of the Exchange Act). Yes
o
No
x
As of
December 27, 2013
(the last business day of the registrant’s most recently completed second fiscal quarter), the aggregate market value of the registrant’s common stock held by non-affiliates was approximately
$102.7 million
based upon the closing price for shares of the registrant’s common stock as reported by the NASDAQ Global Select Market on that date. For purposes of this calculation, the registrant has assumed that its directors, executive officers and holders of 5% or more of the outstanding common stock are affiliates.
The number of shares outstanding of the registrant’s common stock as of
December 9, 2014
was
62,223,790
shares.
_________________________________
DOCUMENTS INCORPORATED BY REFERENCE
None.
AVIAT NETWORKS, INC.
ANNUAL REPORT ON FORM 10-K
For the Fiscal Year Ended
June 27, 2014
Table of Contents
|
Item 1.
|
||
|
Item 1A.
|
||
|
Item 1B.
|
||
|
Item 2.
|
||
|
Item 3.
|
||
|
Item 4.
|
||
|
Item 5.
|
||
|
Item 6.
|
||
|
Item 7.
|
||
|
Item 7A.
|
||
|
Item 8.
|
||
|
Item 9.
|
||
|
Item 9A.
|
||
|
Item 9B.
|
||
|
Item 10.
|
||
|
Item 11.
|
||
|
Item 12.
|
||
|
Item 13.
|
||
|
Item 14.
|
||
|
Item 15.
|
||
2
CAUTIONARY STATEMENT REGARDING FORWARD-LOOKING STATEMENTS
This Annual Report on Form 10-K, including “Item 7. Management’s Discussion and Analysis of Financial Condition and Results of Operations,” contains forward-looking statements that involve risks and uncertainties, as well as assumptions that, if they do not materialize or prove correct, could cause our results to differ materially from those expressed or implied by such forward-looking statements. All statements other than statements of historical fact are statements that could be deemed forward-looking statements, including statements of, about, concerning or regarding: our plans, strategies and objectives for future operations; our research and development efforts and new product releases and services; trends in revenue; drivers of our business and the markets in which we operate; future economic conditions; performance or outlook and changes in our industry and the markets we serve; the outcome of contingencies; the value of our contract awards; beliefs or expectations; the sufficiency of our cash and our capital needs and expenditures; our intellectual property protection; our compliance with regulatory requirements and the associated expenses; expectations regarding litigation; our intention not to pay cash dividends; the seasonality of our business; the impact of foreign exchange and inflation; taxes; our ongoing business restructuring efforts; and assumptions underlying any of the foregoing. Forward-looking statements may be identified by the use of forward-looking terminology, such as “anticipates,” “believes,” “expects,” “may,” “should,” “would,” “will,” “intends,” “plans,” “estimates,” “strategy,” “projects,” “targets,” “goals,” “seeing,” “delivering,” “continues,” “forecasts,” “future,” “predict,” “might,” “could,” “potential,” or the negative of these terms, and similar words or expressions.
These forward-looking statements are based on estimates reflecting the current beliefs of the senior management of Aviat Networks. These forward-looking statements involve a number of risks and uncertainties that could cause actual results to differ materially from those suggested by the forward-looking statements. Forward-looking statements should therefore be considered in light of various important factors, including those set forth in this Annual Report on Form 10-K. Important factors that could cause actual results to differ materially from estimates or projections contained in the forward-looking statements include the following:
|
•
|
material weaknesses identified in our system of internal control and associated remediation efforts and investments and actions needed to remedy those material weaknesses;
|
|
•
|
continued price and margin erosion as a result of increased competition in the microwave transmission industry;
|
|
•
|
the impact of the volume, timing and customer, product and geographic mix of our product orders;
|
|
•
|
our ability to meet financial covenant requirements which could impact our liquidity;
|
|
•
|
our ability to meet projected new product development dates or anticipated cost reductions of new products;
|
|
•
|
our suppliers’ inability to perform and deliver on time as a result of their financial condition, component shortages or other supply chain constraints;
|
|
•
|
customer acceptance of new products;
|
|
•
|
the ability of our subcontractors to timely perform;
|
|
•
|
continued weakness in the global economy affecting customer spending;
|
|
•
|
retention of our key personnel;
|
|
•
|
our ability to manage and maintain key customer relationships;
|
|
•
|
uncertain economic conditions in the telecommunications sector combined with operator and supplier consolidation;
|
|
•
|
the timing of our receipt of payment for products or services from our customers;
|
|
•
|
our failure to protect our intellectual property rights or defend against intellectual property infringement claims by others;
|
|
•
|
the results of our restructuring efforts;
|
|
•
|
the effects of currency and interest rate risks; and
|
|
•
|
the impact of political turmoil in countries where we have significant business.
|
Other factors besides those listed here also could adversely affect us. See “Item 1A. Risk Factors” in this Annual Report on Form 10-K for more information regarding factors that may cause our results to differ materially from those expressed or implied by the forward-looking statements contained in this Annual Report on Form 10-K.
You should not place undue reliance on these forward-looking statements, which reflect our management’s opinions only as of the date of the filing of this Annual Report on Form 10-K. Forward-looking statements are made in
3
reliance upon the safe harbor provisions of Section 27A of the Securities Act of 1933, as amended, and Section 21E of the Securities Exchange Act of 1934, as amended, along with provisions of the Private Securities Litigation Reform Act of 1995, and we undertake no obligation, other than as imposed by law, to update any forward-looking statements to reflect further developments or information obtained after the date of filing of this Annual Report on Form 10-K or, in the case of any document incorporated by reference, the date of that document.
4
Item 1.
Business
Aviat Networks, Inc., together with its subsidiaries, is a global supplier of microwave networking solutions, backed by an extensive suite of professional services and support. Aviat Networks, Inc. may be referred to as “the Company,” “AVNW,” “Aviat Networks,” “we,” “us” and “our” in this Annual Report on Form 10-K.
We were incorporated in Delaware in 2006 to combine the businesses of Harris Corporation’s Microwave Communications Division (“MCD”) and Stratex Networks, Inc. (“Stratex”). On January 28, 2010, we changed our corporate name from Harris Stratex Networks, Inc. to Aviat Networks, Inc.
Our principal executive offices are located at 5200 Great America Parkway, Santa Clara, California 95054, and our telephone number is (408) 567-7000. Our common stock is listed on the NASDAQ Global Select Market under the symbol AVNW. As of
June 27, 2014
, we employed approximately
960
people, compared with approximately
1,000
people as of
June 28, 2013
.
Overview and Description of the Business
We design, manufacture and sell a range of wireless networking products, solutions and services to mobile and fixed public network operators, private network operators, government agencies, transportation, energy and utility companies, public safety agencies and broadcast network operators around the world. We sell products and services directly to our customers and also use agents and distributors.
Our products utilize microwave and millimeter wave technologies to create point to point wireless links for short, medium and long distance interconnections. Our products incorporate Ethernet switching and IP routing capabilities to form complete networking solutions. We also provide network management software tools to enable our customers to deploy, monitor and manage our systems; third party equipment such as antennas, routers, optical transmission equipment and other equipment necessary to build and deploy a complete telecommunications transmission network. We provide a full suite of professional services.
Our wireless systems deliver urban, suburban, regional and country-wide communications links as the primary alternative to fiber optic connections. In dense urban and suburban areas, short range wireless solutions are faster to deploy and lower cost per mile than new fiber deployments. In developing nations, fiber infrastructure is scarce and wireless systems are used for both long and short distance connections. Wireless systems also have advantages over optical fiber in areas with rugged terrain, and to provide connections over bodies of water such as between islands or even oil and gas production platforms.
Revenue from our North America and international regions represented approximately
41%
and
59%
, respectively, of our revenue in fiscal
2014
,
38%
and
62%
, respectively, of our revenue in fiscal
2013
, and
37%
and
63%
, respectively, of our revenue in fiscal
2012
. Information about our revenue attributable to our geographic regions is set forth in “Item 7. Management’s Discussion and Analysis of Financial Condition and Results of Operations” and in Note 11 of the accompanying consolidated financial statements in this Annual Report on Form 10-K.
Market Overview
We believe that future demand for microwave and millimeter wave transmission systems will be influenced by a number of factors across several market segments.
Mobile Networks
As Mobile Networks expand, add subscribers and increase the number of wirelessly connected devices, sensors and machines, they require investment in backhaul infrastructure. Whether Mobile Network operators choose to self-build this backhaul infrastructure or lease backhaul services from other network providers, the evolution of the network drives demand for transmission technologies such as microwave and millimeter wave wireless backhaul. Within this overall scope there are multiple individual drivers for investment in backhaul infrastructure.
|
•
|
New RAN Technologies
. The evolution of Mobile Radio Access Network (“RAN”) technologies from 2G to 3G (HSPA) or 4G (HSPA+ and LTE) technologies is providing subscribers with faster speed access to the internet, social media, and video streaming services. The rapid increases in data to be transported through
|
5
the RAN and across the backhaul infrastructure drives requirements for higher data transport links necessitating upgrades to or replacement of the existing backhaul infrastructure.
|
•
|
Subscriber Growth
. Traffic on the backhaul infrastructure increases as the number of unique subscribers grows.
|
|
•
|
Connected Devices
. The number of devices connected to the Mobile Network is far greater than the number of unique subscribers due to demand for multiple mobile device types. Wireless sensors and machines are enabling new revenue streams for Mobile Network operators in healthcare, agriculture, transportation and education, all of which increases the data traffic crossing the backhaul infrastructure.
|
|
•
|
RAN Capacity
. RAN frequency spectrum is a limited resource and shared between all of the devices and users within the coverage area of each base station. Meeting the combined demand of increasing subscribers and devices will requires the deployment of much higher densities of base stations with smaller and smaller range (small cells) each requiring backhaul.
|
|
•
|
Geographic Coverage.
Expanding the geographic area covered by a Mobile Network requires the deployment of additional Cellular Base Station sites. Each additional base station site also needs to be connected to the core of the Mobile Network through expansion of the backhaul system.
|
|
•
|
License Mandates
. Mobile Operators are licensed telecommunications service providers. Licenses will typically mandate a minimum geographic footprint within a specific period of time and/or a minimum proportion of a national or regional population served. This can pace backhaul infrastructure investment and cause periodic spikes in demand.
|
|
•
|
Evolution to IP
. Network Infrastructure capacity, efficiency and flexibility is greatly enhanced by transitioning from legacy SDH (synchronous digital hierarchy) / SONET (synchronous optical network) / TDM (time division multiplexing) to IP (internet protocol) infrastructure. Our products offer integrated IP transport and routing functionality increasing the value they bring in the backhaul network.
|
|
•
|
Expansion of Offered Services.
Mobile Network operators especially in emerging markets now own and operate the most modern communications networks within their respective regions. These network assets can be further leveraged to provide high speed broadband services to fixed locations such as Small Medium and Large Business Enterprises, Airports, Hotels, Hospitals, and Educational institutions. Microwave and Millimeter Wave backhaul is ideally suited to providing high speed broadband connections to these end points due to the lack of fiber infrastructure.
|
Other Vertical Markets
In addition to mobile backhaul, we see increasing demand for microwave technology in other vertical markets, including utility, public safety, financial institution and broadcast.
|
•
|
Many utility companies around the world are actively investing in Smart Grid solutions and energy demand management, which drive the need for network modernization and increased capacity of networks.
|
|
•
|
In the public safety vertical market investment in network modernization can significantly enhance the capabilities of security agencies. Improving border patrol effectiveness, enabling interoperable emergency communications services for local or state police, providing access to timely information from centralized databases, or utilizing video and imaging devices at the scene of an incident requires a high bandwidth and reliable network. The mission critical nature of Public Safety and National security networks can require that these networks are built, operated and maintained independently of other public network infrastructure and microwave is very well suited to this environment because it is a cost-effective alternative to fiber.
|
|
•
|
New opportunities have emerged in some other niche markets in non-mobile sectors as well, such as the low latency application for high frequency trading in financial industry, for which demand has been growing at a higher rate than the wireless industry as a whole. With lower latency and shorter line of sight distance between transmission sites than fiber, microwave technology has been selected over fiber by more and more financial institutions for such applications. There is also the broadcast market, where terrestrial TV broadcasting is progressively going digital on a global basis and has presented new opportunities for microwave vendors.
|
6
These factors are combining to create a range of opportunities for continued investment in backhaul and transport networks favoring microwave and millimeter wave technologies. As we focus on our execution of the future generations of our technology, our goal is to make wireless a viable choice for an ever broadening range of network types.
Strategy
Over the past year, we made significant strides in updating our entire product portfolio with new microwave, millimeter wave and IP Routing solutions.
We introduced the first versions of our CTR (converged transport router) 8000 platform with both CTR 8440 and CTR 8540 models. The CTR is a transformational microwave product line since it efficiently integrates microwave transport and IP routing in a single solution. We also introduced our first millimeter wave solution, the WTM3300, in a very small form factor suited to dense urban and small cell applications.
We continued to develop our professional services portfolio as a key to our long term strategy and differentiation. During the year, we added managed network services to a key customer in Africa and expanded the number of customer networks managed from our North America Network Operations Center.
Our strategy includes partnering with companies with technical expertise in areas outside of our core competencies to meet our customers' demand for an end-to-end solution. Our partner product strategy enables us to go beyond wireless transmission to combat the vendor consolidation trend whereby customers are “buying more from fewer vendors” and in doing so providing expanding market share opportunity. A comprehensive solutions portfolio comprised of our wireless product and intelligent partner products can allow us to compete with vendors that offer turnkey solution portfolios and serve to focus our research and development (“R&D”) efforts on core competency wireless innovations. Having a broader portfolio will enable us to further differentiate our offerings from other independent microwave equipment suppliers.
We expect to continue to serve and expand upon our existing customer base and develop business with new customers. We have sold more than 1,000,000 microwave radios in over 140 countries and are present in more than 350 mobile networks worldwide. We intend to leverage our customer base, our longstanding presence in many countries, our distribution channels, our comprehensive product line, our superior customer service and our turnkey solution capability to continue to sell existing and new products and services to current and future customers.
Products and Solutions
We offer a comprehensive product and solutions portfolio that meets the needs of service providers and network operators in every region of the world and addresses a broad range of applications, frequencies, capacities and network topologies. Our product categories include point-to-point microwave and millimeter wave radios that are licensed (subject to local frequency regulatory requirements), lightly-licensed and license-exempt (operating in license-exempt frequencies), and element and network management software. In addition, we provide a full suite of professional services enabling us to deliver end-to-end turnkey networks, including complete design, deployment, maintenance, and managed services, while being an attentive and adaptable partner for our customers — a key competitive differentiator for us.
|
•
|
Broad product and solution portfolio.
We offer a comprehensive suite of wireless transmission networking systems for microwave and millimeter-wave networking applications. Our solution consists of tailored offerings of our own wireless products and our own integrated ancillary equipment or that of other manufacturers and providers of element and network management systems and professional services. These solutions address a wide range of transmission frequencies, ranging from 2.4 MHz to 90 GHz, and a wide range of transmission capacities, ranging up to 4 Gbps and beyond. The major product families included in these solutions are CTR 8000, Eclipse, WTM 3000, WTM 6000 and ProVision, our network management software.
|
|
•
|
Low total cost of ownership.
Our wireless-based solutions offer a relatively low total cost of ownership, including savings on the combined costs of initial acquisition, installation and ongoing operation and maintenance. Our latest generation system designs reduce rack space requirements, require less power, are software-configurable to reduce spare parts requirements, and are simple to install, operate, upgrade and maintain. Our advanced wireless features can also enable operators to save on related costs, including spectrum fees and tower rental fees.
|
|
•
|
Futureproof network.
Our solutions are designed to protect the network operator’s investment by incorporating software-configurable capacity upgrades and plug-in modules that provide a smooth migration path to Carrier Ethernet and IP/MPLS-based networking, without the need for costly equipment
|
7
substitutions and additions. Our products include key technologies we believe will be needed by operators for their network evolution to support new broadband services.
|
•
|
Flexible, easily configurable products.
We use flexible architectures with a high level of software configurable features. This design approach produces high-performance products with reusable components while at the same time allowing for a manufacturing strategy with a high degree of flexibility, improved cost and reduced time-to-market. The software features of our products offer our customers a greater degree of flexibility in installing, operating and maintaining their networks.
|
|
•
|
Comprehensive network management.
We offer a range of flexible network management solutions, from element management to enterprise-wide network management and service assurance that we can optimize to work with our wireless systems.
|
|
•
|
Complete professional services.
In addition to our product offerings, we provide network planning and design, site surveys and builds, systems integration, installation, maintenance, network monitoring, training, customer service and many other professional services. Our services cover the entire evaluation, purchase, deployment and operational cycle and enable us to be one of the few complete turnkey solution providers in the industry.
|
Business Operations
Sales and Service
We believe that a direct and continuing relationship with service providers is a competitive advantage in attracting new customers and satisfying existing ones. As a result, we offer our products and services through our own direct sales, service and support organization, which allows us to closely monitor the needs of our customers. We have offices in Canada and the United States in North America; Brazil and Mexico in Central and South America; Slovenia, Poland, France, Russia, the Netherlands and the United Kingdom in Europe; Nigeria, Kenya, Ghana, Ivory Coast, Algeria and South Africa in Africa; the United Arab Emirates, Saudi Arabia and Lebanon in the Middle East; and Australia, India, New Zealand, China, Malaysia, the Philippines, Singapore and Thailand in the Asia Pacific region. Our local offices provide us with a better understanding of our customers’ needs and enable us to respond to local issues and unique local requirements.
We also have informal, and in some cases formal, relationships with original equipment manufacturers (“OEMs”) and system integrators. Such relationships increase our ability to pursue a limited number of major contract awards each year. In addition, such relationships provide our customers with easier access to financing and integrated system providers with a variety of equipment and service capabilities. In selected countries, we also market our products through independent agents and distributors, as well as through system integrators.
We use indirect sales channels, including dealers, distributors and sales representatives, in the marketing and sale of some lines of products and equipment on a global basis. These independent representatives may buy for resale or, in some cases, solicit orders from commercial or governmental customers for direct sales by us. Prices to the ultimate customer in many instances may be recommended or established by the independent representative and may be above or below our list prices. These independent representatives generally receive a discount from our list prices and are free to set the final sales prices paid by the customer.
We have repair and service centers in India, Nigeria, Ghana, Brazil, Mexico, the Philippines, the United Kingdom and the United States. We have customer service and support personnel who provide customers with training, installation, technical support, maintenance and other services on systems under contract. We install and maintain customer equipment directly in some cases and contract with third-party service providers in other cases, depending on the equipment being installed and customer requirements.
The specific terms and conditions of our product warranties vary depending upon the product sold and country in which we do business. On direct sales, warranty periods generally start on the delivery date and continue for one to three years.
Manufacturing
Our global manufacturing strategy is an entirely outsourced manufacturing model using multiple contract manufacturers in both the United States and Asia locations. Our strategy is to use a select number of contract
8
manufacturers for all products. We continue to perform our system integration and customer acceptance and testing in an Aviat Networks facility co-located with one of our contract manufacturers in the United States.
In accordance with our global logistics requirements and customer geographic distribution, we are engaged with contract manufacturing partners in Asia and the United States. All manufacturing operations have been certified to International Standards Organization 9001, a recognized international quality standard. We have also been certified to the TL 9000 standard, a telecommunication industry-specific quality system standard.
Backlog
Our backlog by geographic region is as follows:
|
June 27, 2014
|
June 28, 2013
|
||||||
|
|
(In millions)
|
||||||
|
North America
|
$
|
112.0
|
|
$
|
79.4
|
|
|
|
International
|
97.3
|
|
79.1
|
|
|||
|
Total backlog
|
$
|
209.3
|
|
$
|
158.5
|
|
|
Our backlog consists primarily of contracts or purchase orders for both product and service deliveries scheduled within the next 12 months and extended service warranties. We regularly review our backlog to ensure that our customers continue to honor their purchase commitments and have the financial means to purchase and deploy our products and services in accordance with the terms of their purchase contracts.
We expect to substantially fill the backlog as of
June 27, 2014
during fiscal 2015, but we cannot be assured that this will occur. Product orders in our current backlog are subject to changes in delivery schedules or to cancellation at the option of the purchaser without significant penalty. Accordingly, although useful for scheduling production, backlog as of any particular date may not be a reliable measure of sales for any future period because of the timing of orders, delivery intervals, customer and product mix and the possibility of changes in delivery schedules and additions or cancellations of orders. The backlog figures exclude advance payments and unearned income amounts. As of
June 27, 2014
, the Mobile Telephone Networks Group (“MTN Group”) in Africa accounted for
16%
of our total backlog and no other customers accounted for 10% or more of our total backlog.
Customers
Principal customers for our products and services include domestic and international wireless/mobile service providers, OEMs, and private network users such as public safety agencies, government institutions, and utility, pipeline, railroad and other industrial enterprises that operate wireless networks.
During fiscal
2014
, the MTN Group in Africa accounted for
17%
of our total revenue compared with
25%
in fiscal
2013
and
17%
in fiscal
2012
. We have entered into separate and distinct contracts with MTN Group as well as separate arrangements with MTN Group subsidiaries. During fiscal 2013, revenue from Verizon Wireless accounted for
11%
of our total revenue. The loss of all or a substantial portion of MTN Group's business or of Verizon Wireless' business could adversely affect our results of operations, cash flows and financial position.
Although we have a large customer base, during any given fiscal year or quarter a small number of customers may account for a significant portion of our revenue. In certain circumstances, we sell our products to service providers through OEMs, which provide the service providers with access to financing and in some instances, protection from fluctuations in international currency exchange rates.
Competition
The microwave and millimeter wave wireless networking business is a specialized segment of the wireless telecommunications industry that is sensitive to technological advancements and is extremely competitive. Our principal competitors include business units of large mobile and IP network infrastructure manufacturers such as Ericsson, Huawei, NEC and Alcatel-Lucent, as well as a number of other smaller public and private microwave specialists companies such as Ceragon, DragonWave and SIAE.
Some of our larger competitors may have greater name recognition, broader product lines (some including non-wireless telecommunications equipment and managed services), a larger installed base of products and longer-standing
9
customer relationships. They may from time to time leverage their extensive overall portfolios into completely outsourced and managed network offerings restricting opportunities for specialist suppliers. In addition, some competitors may offer seller financing, which can be a competitive advantage under certain economic climates.
Some of our larger competitors may also act as systems integrators through which we sometimes distribute and sell products and services to end users.
The smaller independent private and public specialist competitors typically leverage new technologies and low products costs, but are generally less capable of offering a complete solution including professional services, especially in the North America and Africa regions which form the majority of our addressed market.
We concentrate on market opportunities that we believe are compatible with our resources, overall technological capabilities and objectives. Principal competitive factors are cost-effectiveness, product quality and reliability, technological capabilities, service, ability to meet delivery schedules and the effectiveness of dealers in international areas. We believe that the combination of our network and systems engineering support and service, global reach, technological innovation, agility and close collaborative relationships with our customers are the key competitive strengths for us. However, customers may still make decisions based primarily on factors such as price, financing terms and/or past or existing relationships, where it may be difficult for us to compete effectively or profitably.
Research and Development
We believe that our ability to enhance our current products, develop and introduce new products on a timely basis, maintain technological competitiveness and meet customer requirements is essential to our success. Accordingly, we allocate, and intend to continue to allocate, a significant portion of our resources to research and development efforts in two major product areas: backhaul solutions and network management systems. In addition, we are investing in key innovation that will help separate these products from the competition. The majority of such research and development resources will be used for point-to-point digital microwave radio systems for access, backhaul, trunking and license-exempt applications.
Our research and development expenditures totaled
$35.5 million
, or
10.3%
of revenue, in fiscal
2014
,
$39.4 million
, or
8.4%
of revenue, in fiscal
2013
, and
$36.0 million
, or
8.1%
of revenue, in fiscal
2012
.
Research and development are primarily directed to the development of new products and to building technological capability. We are an industry innovator and intend to continue to focus significant resources on product development in an effort to maintain our competitiveness and support our entry into new markets. We maintain development programs intended to result in new products, such as additions to our WTM3000, Eclipse and new CTR product platforms
.
Our product development teams numbered
195
employees as of
June 27, 2014
, and were located in Santa Clara, California; Wellington, New Zealand; Singapore; Ljubljana, Slovenia; and Montreal, Canada.
Raw Materials and Supplies
Because of the range of our products and services, as well as the wide geographic dispersion of our facilities, we use numerous sources for the wide array of raw materials needed for our operations and for our products, such as electronic components, printed circuit boards, metals and plastics. We are dependent upon suppliers and subcontractors for a large number of components and subsystems and upon the ability of our suppliers and subcontractors to adhere to customer or regulatory materials restrictions and meet performance and quality specifications and delivery schedules.
Our strategy for procuring raw material and supplies includes dual sourcing on strategic assemblies and components. In general, we believe this reduces our risk with regard to the potential financial difficulties in our supply base. In some instances, we are dependent upon one or a few sources, either because of the specialized nature of a particular item or because of local content preference requirements pursuant to which we operate on a given project. Examples of sole or limited source categories include metal fabrications and castings, for which we own the tooling and therefore limit our supplier relationships, and MMICs (a type of integrated circuit used in manufacturing microwave radios), which we procure at volume discount from a single source. Our supply chain plan includes mitigation plans for alternative manufacturing sources and identified alternate suppliers.
Although we have been affected by performance issues of some of our suppliers and subcontractors, we have not been materially adversely affected by the inability to obtain raw materials or products. In general, any performance
10
issues causing short-term material shortages are within the normal frequency and impact range experienced by high-tech manufacturing companies. They are due primarily to the highly technical nature of many of our purchased components.
Looking ahead, we anticipate standard lead times for our raw materials and supplies.
Patents and Other Intellectual Property
We consider our patents and other intellectual property rights, in the aggregate, to constitute an important asset. We own a portfolio of patents, trade secrets, know-how, confidential information, trademarks, copyrights and other intellectual property. We also license intellectual property to and from third parties. As of August 22, 2014, we held 143 U.S. patents and 113 international patents and had 60 U.S. patent applications pending and 113 international patent applications pending. We do not consider our business to be materially dependent upon any single patent, license or other intellectual property right, or any group of related patents, licenses or other intellectual property rights. From time to time, we might engage in litigation to enforce our patents and other intellectual property or defend against claims of alleged infringement. Any of our patents, trade secrets, trademarks, copyrights and other proprietary rights could be challenged, invalidated or circumvented, or may not provide competitive advantages. Numerous trademarks used on or in connection with our products are also considered to be valuable assets.
In addition, to protect confidential information, including our trade secrets, we require our employees and contractors to sign confidentiality and invention assignment agreements. We also enter into non-disclosure agreements with our suppliers and appropriate customers to limit access to and disclosure of our proprietary information.
Although our ability to compete may be affected by our ability to protect our intellectual property, we believe that, because of the rapid pace of technological change in the wireless telecommunications industry, our innovative skills, technical expertise and ability to introduce new products on a timely basis will be more important in maintaining our competitive position than protection of our intellectual property. Trade secret, trademark, copyright and patent protections are important but must be supported by other factors such as the expanding knowledge, ability and experience of our personnel, new product introductions and product enhancements. Although we continue to implement protective measures and intend to vigorously defend our intellectual property rights, there can be no assurance that these measures will be successful.
Environmental and Other Regulations
Our facilities and operations, in common with those of our industry in general, are subject to numerous domestic and international laws and regulations designed to protect the environment, particularly with regard to wastes and emissions. We believe that we have complied with these requirements and that such compliance has not had a material adverse effect on our results of operations, financial condition or cash flows. Based upon currently available information, we do not expect expenditures to protect the environment and to comply with current environmental laws and regulations over the next several years to have a material impact on our competitive or financial position, but can give no assurance that such expenditures will not exceed current expectations. From time to time, we receive notices from the U.S. Environmental Protection Agency or equivalent state or international environmental agencies that we are a potentially responsible party under the Comprehensive Environmental Response, Compensation and Liability Act, which is commonly known as the Superfund Act and equivalent laws. Such notices may assert potential liability for cleanup costs at various sites, which include sites owned by us, sites we previously owned and treatment or disposal sites not owned by us, allegedly containing hazardous substances attributable to us from past operations. We are not presently aware of any such liability that could be material to our business, financial condition or operating results, but due to the nature of our business and environmental risks, we cannot provide assurance that any such material liability will not arise in the future.
Electronic products are subject to environmental regulation in a number of jurisdictions. Equipment produced by us is subject to domestic and international requirements requiring end-of-life management and/or restricting materials in products delivered to customers. We believe that we have complied with such rules and regulations, where applicable, with respect to our existing products sold into such jurisdictions.
Radio communications are also subject to governmental regulation. Equipment produced by us is subject to domestic and international requirements to avoid interference among users of radio frequencies and to permit interconnection of telecommunications equipment. We believe that we have complied with such rules and regulations with respect to our existing products, and we intend to comply with such rules and regulations with respect to our future
11
products. Reallocation of the frequency spectrum also could impact our business, financial condition and results of operations.
We are in the process of developing comprehensive policies and procedures concerning conflict minerals compliance.
Employees
As of
June 27, 2014
we employed approximately
960
people, compared with approximately
1,000
as of the end of fiscal
2013
and approximately
1,000
as of the end of fiscal
2012
. Approximately
320
of our employees are located in the U.S. We also utilized approximately
76
independent contractors as of
June 27, 2014
. None of our employees in the U.S. are represented by a labor union. In certain international subsidiaries, our employees are represented by workers’ councils or statutory labor unions. In general, we believe that our relations with our employees are good.
Executive Officers of the Registrant
The name, age, position held with us, and principal occupation and employment during at least the past 5 years for each of our executive officers as of
December 19, 2014
, are as follows:
|
Name and Age
|
Position Currently Held and Past Business Experience
|
|
|
Michael A. Pangia, 53
|
Mr. Pangia has been our President and Chief Executive Officer and a member of the Board since July 18, 2011. From March 2009 to July 2011, he served as our Chief Sales Officer responsible for company-wide operations of the global sales and services organization. Prior to joining Aviat Networks, from 2008 to 2009, Mr. Pangia served as Senior Vice President, global sales operations and strategy at Nortel, where he was responsible for all operational aspects of the global sales function. From 2006 to 2008, he was President of Nortel’s Asia region where his key responsibilities included sales and overall business management for all countries where Nortel did business in the region.
|
|
|
Edward J. (“Ned”) Hayes, 59
|
Mr. Hayes joined Aviat Networks in October 2011 and serves as our Senior Vice President and Chief Financial Officer and is responsible for the finance and IT organizations. Prior to joining Aviat Networks, from 2006 to October 2011, Mr. Hayes was the Chief Financial Officer at Pillar Data Systems, Inc., an enterprise data storage company, which was acquired by Oracle Corporation. Before joining Pillar Data, he served as Executive Vice President and Chief Financial Officer of Quantum Corporation, a data storage company. Mr. Hayes currently serves as a senior advisor to the CEO of Super Micro Computer, Inc., where he previously served as an independent director and Chair of the Audit Committee. He also currently serves as an independent director and non-executive Chairman of the Board of Alaska Communications Systems, a provider of high-speed wireless, mobile broadband, internet, local, long-distance and advanced broadband solutions for businesses and consumers in Alaska.
|
|
|
Meena Elliott, 51
|
Ms. Elliott was appointed Senior Vice President, General Counsel and Secretary on September 1, 2011 and is responsible for the legal and human resources organizations. From July 2009 to August 2011, she served as Vice President, General Counsel and Secretary and in August 2011, was appointed Senior Vice President, General Counsel and Secretary. She joined our company as Associate General Counsel and Assistant Secretary in January 2007 when Harris Corporation's MCD and Stratex Networks merged. Ms. Elliott joined MCD as Division Counsel in March 2006. Prior to joining MCD, she was Chief Counsel at the Department of Commerce from 2002 to 2006.
|
|
|
Heinz H. Stumpe, 59
|
Mr. Stumpe was appointed Chief Sales Officer on June 25, 2012. Before his appointment as Chief Sales Officer, Mr. Stumpe was our Senior Vice President and Chief Operation Officer since June 30, 2008. Previously, he was Vice President, Global Operations for Aviat Networks and Stratex Networks. He joined Stratex Networks as Director of Marketing in 1996. He was promoted to Vice President, Global Accounts in 1999, Vice President, Strategic Accounts in 2002 and Vice President, Global Operations in April 2006.
|
|
|
Shaun McFall, 54
|
Mr. McFall has been our Chief Marketing Officer since July 2008. Previously, from 2000 to 2008, he served as Vice President, Marketing for Aviat Networks and Stratex Networks. He has been with us since 1989.
|
|
12
There is no family relationship between any of our executive officers or directors, and there are no arrangements or understandings between any of our executive officers or directors and any other person pursuant to which any of them was appointed or elected as an officer or director, other than arrangements or understandings with our directors.
Web site Access to Aviat Networks’ Reports; Available Information
We maintain an Internet Web site at
http://www.aviatnetworks.com.
Our annual reports on Form 10-K, proxy statements, quarterly reports on Form 10-Q, current reports on Form 8-K and amendments to such reports, filed or furnished pursuant to Section 13(a) or 15(d) of the Securities Exchange Act of 1934 (the “Exchange Act”) are available free of charge on our Web site as soon as reasonably practicable after these reports are electronically filed with, or furnished to, the Securities and Exchange Commission (“SEC”). Our website and the information posted thereon are not incorporated into this Annual Report on Form 10-K or any current or other periodic report that we file or furnish to the SEC.
We will also provide the reports in electronic or paper form, free of charge upon request. All reports we file with or furnish to the SEC are also available free of charge via EDGAR through the SEC’s website at
http://www.sec.gov
. The public may read and copy any materials filed by us with the SEC at the SEC’s Public Reference Room, 100 F. Street, N.E., Washington, D.C. 20549. The public may obtain information on the operation of the Public Reference Room by calling the SEC at 1-800-SEC-0330.
Additional information relating to our business and operations is set forth in “Item 7. Management’s Discussion and Analysis of Financial Condition and Results of Operations” in this Annual Report on Form 10-K.
13
Item 1A.
Risk Factors
In addition to the risks described elsewhere in this Annual Report on Form 10-K and in certain of our other filings with the SEC, the following risks and uncertainties, among others, could cause our actual results to differ materially from those contemplated by us or by any forward-looking statement contained herein. Prospective and existing investors are strongly urged to carefully consider the various cautionary statements and risks set forth in this Annual Report on Form 10-K and our other public filings.
We have many business risks including those related to our financial performance, investments in our common stock, operating our business and legal matters. The risks and uncertainties described below are not the only ones facing us. Additional risks and uncertainties that we are not aware of or focused on may also impair our business operations. If any of these risks actually occur, our financial condition and results of operations could be materially and adversely affected.
Our success will depend on new products introduced to the marketplace in a timely manner, successfully completing product transitioning and achieving customer acceptance.
The market for our products is characterized by rapid technological change, evolving industry standards and frequent new product introductions. Our future success will depend, in part, on continuous, timely development and introduction of new products and enhancements that address evolving market requirements and are attractive to customers. If we fail to develop or introduce on a timely basis new products or product enhancements or features that achieve market acceptance, our business may suffer. Additionally, we work closely with a variety of third party partners to develop new product features and new platforms. Should our partners face delays in the development process, then the timing of the rollout of our new products may be significantly impacted which may negatively impact our revenue and gross margin. Another factor impacting our future success is the growth in the customer demand of our new products. Rapidly changing technology, frequent new products introductions and enhancements, short product life cycles and changes in customer requirements characterize the markets for our products. We believe that successful new product introductions provide a significant competitive advantage because of the significant resources committed by customers in adopting new products and their reluctance to change products after these resources have been expended. We have spent, and expect to continue to spend, significant resources on internal research and development to support our effort to develop and introduce new products and enhancements.
As we transition to new product platforms, we face significant risk that the development of our new products may not be accepted by our current customers or by new customers. To the extent that we fail to introduce new and innovative products that are adopted by customers, we could fail to obtain an adequate return on these investments and could lose market share to our competitors, which could be difficult or impossible to regain. Similarly we may face decreased revenue, gross margins and profitability due to a rapid decline in sales of current products as customers hold spending to focus purchases on new product platforms.
We could incur significant costs in completing the transition, including costs of inventory write-downs of the current product as customers transition to new product platforms. In addition, products or technologies developed by others may render our products noncompetitive or obsolete and result in significant reduction in orders from our customers and the loss of existing and prospective customers.
Our average sales prices may decline in the future.
We are experiencing, and are likely to continue to experience, declining sales prices. This price pressure is likely to result in downward pricing pressure on our products and services. As a result, we are likely to experience declining average sales prices for our products. Our future profitability will depend upon our ability to improve manufacturing efficiencies, reduce costs of materials used in our products and to continue to introduce new lower-cost products and product enhancements. If we are unable to respond to increased price competition, our business, financial condition and results of operations will be harmed. Because customers frequently negotiate supply arrangements far in advance of delivery dates, we may be required to commit to price reductions for our products before we are aware of how, or if, cost reductions can be obtained. As a result, current or future price reduction commitments and any inability on our part to respond to increased price competition could harm our business, financial condition and results of operations.
Our sales cycle may be lengthy, and the timing of sales, along with additional services such as warehousing, inventory management, installation and implementation of our products within our customers' networks, may extend over more than one period, which can make our operating results difficult to predict.
We anticipate difficulty in accurately predicting the timing of the sale of products and amounts of revenue generated from sales of our products, primarily in developing countries. The establishment of a business relationship with a potential
14
customer is a lengthy process, generally taking several months and sometimes longer. Following the establishment of the relationship, the negotiation of purchase terms can be time-consuming, and a potential customer may require an extended evaluation and testing period. We expect that our product sales cycle, which results in our products being designed into our customers' networks, could take 12 to 24 months. A number of factors can contribute to the length of the sales cycle, including technical evaluations of our products, the design process required to integrate our products into our customers' networks and warehousing and/or inventory management services that may be requested by certain large customers. In anticipation of product orders, we may incur substantial costs before the sales cycle is complete and before we receive any customer payments. Specifically, should a customer require warehousing and/or inventory management services, such services may impact our operating results in any period due to the costs associated with providing such services and the fact that the timing of the revenue recognition may be delayed. As a result, in the event that a sale is not completed or is canceled or delayed, we may have incurred substantial expenses, making it more difficult for us to become profitable or otherwise negatively impacting our financial results. Furthermore, because of our lengthy sales cycle, our recognition of revenue from our selling efforts may be substantially delayed, our ability to forecast our future revenue may be more limited and our revenue may fluctuate significantly from quarter to quarter.
Once a purchase agreement has been executed, the timing and amount of revenue, if applicable, may remain difficult to predict. The completion of services such as warehousing and inventory management, installation and testing of the customer’s networks and the completion of all other suppliers network elements are subject to the customer’s timing and efforts, and other factors outside our control which may prevent us from making predictions of revenue with any certainty and could cause us to experience substantial period-to-period fluctuations in our operating results.
We have not been profitable and must increase our revenues and reduce costs if we hope to achieve profitability.
As measured under U.S. generally accepted accounting principles (“U.S. GAAP”), we incurred net losses of
$51.2 million
in fiscal
2014
,
$15.0 million
in fiscal
2013
and
$24.1 million
in fiscal
2012
and have been unprofitable since we became a public company in January 2007. We also have incurred losses from operations in all fiscal years since we became a public company, although we previously generated cash from operations in fiscal 2013, 2012, 2010 and 2009.
Throughout fiscal
2014
we experienced strong price competition for new business in all regions while major customer consolidations also put pressure on revenue and gross margin. We saw pricing pressures in all markets, with increased pressure in international markets where we compete for the business of large carrier customers. In all markets, telecommunication operating companies consolidated through mergers or acquisitions, leading to fewer, but larger customers. This consolidation may have a negative impact on our revenue if Aviat is not selected as a vendor. In order to counter pricing pressures, we invested heavily in product improvements to reduce unit costs and enhance product features, exited manufacturing facilities and shifted production to fewer contract manufacturers, and worked with our vendors to attain more favorable pricing. If we are unable to reduce product unit costs associated with enhanced product features, including payments to contract manufacturers and other suppliers, we may not achieve profitability.
We cannot be certain that these actions or others that we may take in the future will result in operating profitability or net income as determined under U.S. GAAP.
We may not be able to obtain capital when desired on favorable terms, if at all, or without dilution to our stockholders.
We believe that our existing cash and cash equivalents, the available line of credit under our credit facility and future cash collections from customers will be sufficient to provide for our anticipated requirements for working capital and capital expenditures for the next 12 months and the foreseeable future. However, it is possible that we may not generate sufficient cash flow from operations or otherwise have the capital resources to meet our future capital needs. If this occurs, we may need to sell assets, reduce capital expenditures, or obtain additional financing.
If we raise additional funds through the issuance of equity or convertible debt securities, the percentage ownership of our stockholders could be significantly diluted, and these newly-issued securities may have rights, preferences or privileges senior to those of existing stockholders. We cannot assure you that additional financing will be available on terms favorable to us, or at all. If adequate funds are not available or are not available on acceptable terms if and when needed, our business, financial condition and results of operations could be harmed.
We may undertake further restructuring activities, which may adversely impact our operations, and we may not realize all of the anticipated benefits of these activities or any potential future restructurings. Any restructuring activities may harm our business.
15
We continue to evaluate our business to determine the potential need to realign our resources as we continue to transform our business in order to achieve desired cost savings in an increasingly competitive market. In prior years and again in fiscal 2014, we have undertaken a series of steps to restructure our operations involving, among other things and depending on the year, reductions of our workforce, the relocation of our corporate headquarters and the reduction and outsourcing of manufacturing activities. We incurred restructuring charges of
$11.1 million
,
$3.1 million
and
$2.3 million
in fiscal 2014, 2013 and 2012, respectively.
We have based our restructuring efforts on assumptions and plans regarding the appropriate cost structure of our business based on our product mix and projected sales among other factors. Some of our assumptions include that the relocation of personnel and the outsourcing of certain functions would reduce our operating expenses and the transition risk is low. These assumptions may not be correct and we may not be able to operate in accordance with our plans. Should this occur we may determine that we must incur additional restructuring charges in the future. Moreover, we cannot assure you that we will realize all of the anticipated benefits of our restructuring actions or that we will not further reduce or otherwise adjust our workforce or exit, or dispose of, certain businesses and product lines. Any decision to further limit investment, exit, or dispose of businesses or product lines may result in the recording of additional restructuring charges. As a result, the costs actually incurred in connection with the restructuring efforts may be higher than originally planned and may not lead to the anticipated cost savings and/or improved results. For example, if we consolidate additional facilities in the future, we may incur additional restructuring and related expenses, which could have a material adverse effect on our business, financial condition or results of operations.
Our restructuring actions could harm our relationships with our employees and impact our ability to recruit new employees.
Employees, whether or not directly affected by any restructuring actions that we undertake, may seek employment with our business partners, customers or competitors. We cannot assure you that the confidential nature of our proprietary information will not be compromised by any such employees who terminate their employment with us. Further, we believe that our future success will depend in large part upon our ability to attract, motivate and retain highly skilled personnel. We may have difficulty attracting and retaining such personnel as a result of a perceived risk of future workforce reductions, and we may terminate the employment of employees as part of a restructuring and later determine that such employees were important to the success of the ongoing business.
Our business could be adversely affected if we are unable to attract and retain key personnel.
Our success and ability to invest and grow depend largely on our ability to attract and retain highly skilled technical, professional, managerial, sales and marketing personnel. Historically, competition for these key personnel has been intense. The loss of services of any of our key personnel (including key personnel joining our company through acquisitions), the inability to retain and attract qualified personnel in the future, delays in hiring required personnel, particularly engineering and sales personnel, or the loss of key personnel to competitors could make it difficult to meet key objectives, such as timely and effective product introductions and financial goals.
Due to the volume of our international sales, we may be susceptible to a number of political, economic and geographic risks that could harm our business.
We are highly dependent on sales to customers outside the U.S. In fiscal
2014, 2013 and 2012
, our sales to international customers accounted for
60%
,
62%
and
64%
, respectively, of total revenue. Significant portions of our international sales are in less developed countries. Our international sales are likely to continue to account for a large percentage of our products and services revenue for the foreseeable future. As a result, the occurrence of any international, political, economic or geographic event could result in a significant decline in revenue. In addition, compliance with complex foreign and U.S. laws and regulations that apply to our international operations increases our cost of doing business in international jurisdictions. These numerous and sometimes conflicting laws and regulations include internal control and disclosure rules, data privacy and filtering requirements, anti-corruption laws, such as the Foreign Corrupt Practices Act, and other local laws prohibiting corrupt payments to governmental officials, and anti-competition regulations, among others. Violations of these laws and regulations could result in fines and penalties, criminal sanctions against us, our officers, or our employees, prohibitions on the conduct of our business and on our ability to offer our products and services in one or more countries, and could also materially affect our brand, our international expansion efforts, our ability to attract and retain employees, our business, and our operating results. Although we have implemented policies and procedures designed to ensure compliance with these laws and regulations, there can be no assurance that our employees, contractors, or agents will not violate our policies.
16
Some of the risks and challenges of doing business internationally include:
|
•
|
unexpected changes in regulatory requirements;
|
|
•
|
fluctuations in international currency exchange rates including its impact on unhedgeable currencies and our forecast variations for hedgeable currencies;
|
|
•
|
imposition of tariffs and other barriers and restrictions;
|
|
•
|
management and operation of an enterprise spread over various countries;
|
|
•
|
the burden of complying with a variety of laws and regulations in various countries;
|
|
•
|
application of the income tax laws and regulations of multiple jurisdictions, including relatively low-rate and relatively high-rate jurisdictions, to our sales and other transactions, which results in additional complexity and uncertainty;
|
|
•
|
general economic and geopolitical conditions, including inflation and trade relationships;
|
|
•
|
war and acts of terrorism;
|
|
•
|
kidnapping and high crime rate;
|
|
•
|
natural disasters;
|
|
•
|
currency exchange controls; and
|
|
•
|
changes in export regulations.
|
While these factors and the impacts of these factors are difficult to predict, any one or more of them could adversely affect our business, financial condition and results of operations in the future.
We face strong competition for maintaining and improving our position in the market, which can adversely affect our revenue growth and operating results.
The wireless access, interconnection and backhaul business is a specialized segment of the wireless telecommunications industry and is extremely competitive. We expect competition in this segment to increase. Some of our competitors have more extensive engineering, manufacturing and marketing capabilities and significantly greater financial, technical and personnel resources than we have. In addition, some of our competitors have greater name recognition, broader product lines, a larger installed base of products and longer-standing customer relationships. Our competitors include established companies, such as Ericsson, Huawei, NEC and Alcatel-Lucent, as well as a number of other public and private companies such as Ceragon, DragonWave and SIAE. Some of our competitors are OEMs or systems integrators through whom we market and sell our products, which means our business success may depend on these competitors to some extent. One or more of our largest customers could internally develop the capability to manufacture products similar to those manufactured or outsourced by us and, as a result, the demand for our products and services may decrease.
In addition, we compete for acquisition and expansion opportunities with many entities that have substantially greater resources than we have. Our competitors may enter into business combinations in order to accelerate product development or to compete more aggressively and we may lack the resources to meet such enhanced competition.
Our ability to compete successfully will depend on a number of factors, including price, quality, availability, customer service and support, breadth of product lines, product performance and features, rapid time-to-market delivery capabilities, reliability, timing of new product introductions by us, our customers and competitors, the ability of our customers to obtain financing and the stability of regional sociopolitical and geopolitical circumstances, and the ability of large competitors to obtain business by providing more seller financing especially for large transactions. We can give no assurances that we will have the financial resources, technical expertise, or marketing, sales, distribution, customer service and support capabilities to compete successfully, or that regional sociopolitical and geographic circumstances will be favorable for our successful operation.
The effects of the prolonged global financial and economic downturn has had, and may continue to have, significant effects on our customers and suppliers, and has in the past, and may in the future have, a material adverse effect on our business, operating results, financial condition and stock price.
The effects of the global financial and economic downturn include, among other things, significant reductions in available capital and liquidity from banks and other providers of credit, substantial reductions and/or fluctuations in equity and currency values worldwide, and concerns that the worldwide economy has entered into or may enter into a further prolonged recessionary period.
17
This financial downturn has adversely affected and may continue to adversely affect our customers’ access to capital and/or willingness to spend capital on our products, and/or their levels of cash liquidity and/or their ability and/or willingness to pay for products that they will order or have already ordered from us, or result in their ceasing operations. Further, we have experienced an increasing number of our customers, principally in emerging markets, requesting longer payment terms, lease or vendor financing arrangements, longer terms for the letters of credit securing purchases of our products and services, which could potentially negatively impact our orders, revenue conversion cycle, and cash flows.
In seeking to reduce their expenses, we have also seen significant pressure from our customers to lower prices for our products as they try to improve their operating performance and procure additional capital equipment within their reduced budget levels. To the extent that we lower prices on our products and services, our orders, revenues, and gross margins may be negatively impacted. Additionally, certain emerging markets are particularly sensitive to pricing as a key differentiator. Where price is a primary decision driver, we may not be able to effectively compete or we may choose not to compete due to unacceptable margins.
In addition, a financial downturn could materially adversely affect our suppliers’ access to capital and liquidity with which to maintain their inventories, production levels, and/or product quality, could cause them to raise prices or lower production levels, or result in their ceasing operations. Further, with respect to our credit facility discussed under “Liquidity, Capital Resources and Financial Strategies” in Item 7 of this Annual Report on Form 10-K, if the global financial crisis adversely affects Silicon Valley Bank, our ability to access the funds available under our credit facility could be materially adversely affected.
The potential effects of these economic factors are difficult to forecast and mitigate. As a consequence, our operating results for a particular period are difficult to predict, and, therefore, prior results are not necessarily indicative of results to be expected in future periods. Any of the foregoing effects could have a material adverse effect on our business, results of operations, and financial condition and could adversely affect our stock price.
If we fail to accurately forecast our manufacturing requirements or customer demand, we could incur additional costs, which would adversely affect our business and results of operations.
If we fail to accurately predict our manufacturing requirements or forecast customer demand, we may incur additional costs of manufacturing and our gross margins and financial results could be adversely affected. If we overestimate our requirements, our contract manufacturers may experience an oversupply of components and assess us charges for excess or obsolete components that could adversely affect our gross margins. If we underestimate our requirements, our contract manufacturers may have inadequate inventory or components, which could interrupt manufacturing and result in higher manufacturing costs, shipment delays, damage to customer relationships and/or our payment of penalties to our customers. Our contract manufacturers also have other customers and may not have sufficient capacity to meet all of their customer's needs, including ours, during periods of excess demand.
Part of our inventory may be written off, which would increase our cost of revenues. In addition, we may be exposed to inventory-related losses on inventories purchased by our contract manufacturers.
During fiscal
2014, 2013 and 2012
, we recorded charges to reduce the carrying value of our inventory to the lower of cost or market totaling
$7.2 million
,
$9.7 million
and
$4.8 million
, respectively. Such charges equaled
2.1%
,
2.1%
and
1.1%
of our revenue in fiscal
2014, 2013 and 2012
, respectively. These charges were primarily due to excess and obsolete inventory, including deferred cost of sales, resulting from product transitioning and discontinuance.
Inventory of raw materials, work in-process or finished products may accumulate in the future, and we may encounter losses due to a variety of factors, including:
|
•
|
rapid technological change in the wireless telecommunications industry resulting in frequent product changes;
|
|
•
|
the need of our contract manufacturers to order raw materials that have long lead times and our inability to estimate exact amounts and types of items thus needed, especially with regard to the frequencies in which the final products ordered will operate; and
|
|
•
|
cost reduction initiatives resulting in component changes within the products.
|
Further, our inventory of finished products may accumulate as the result of cancellation of customer orders or our customers’ refusal to confirm the acceptance of our products. Our contract manufacturers are required to purchase inventory based on manufacturing projections we provide to them. If actual orders from our customers are lower than these manufacturing projections, our contract manufacturers will have excess inventory of raw materials or finished products which we would be required to purchase. In addition, we require our contract manufacturers from time to time to
18
purchase more inventory than is immediately required, and to partially assemble components, in order to shorten our delivery time in case of an increase in demand for our products. In the absence of such increase in demand, we may need to compensate our contract manufacturers. If we are required to purchase excess inventory from our contract manufacturers or otherwise compensate our contract manufacturers for purchasing excess inventory, our business, financial condition and results of operations could be materially adversely affected. We also may purchase components or raw materials from time to time for use by our contract manufacturers in the manufacturing of our products. These purchases are based on our own manufacturing projections. If our actual orders are lower than these manufacturing projections, we may accumulate excess inventory, which we may be required to write-off. If we are forced to write-off this inventory other than in the normal course of business, our business, financial condition and results of operations could be materially adversely affected.
Our effective tax rate could be highly volatile and could adversely affect our operating results.
Our future effective tax rate may be adversely affected by a number of factors, many of which are outside of our control, including:
|
•
|
the jurisdictions in which profits are determined to be earned and taxed;
|
|
•
|
adjustments to estimated taxes upon finalization of various tax returns;
|
|
•
|
increases in expenses not deductible for tax purposes, including write-offs of acquired in-process research and development and impairment of goodwill in connection with acquisitions;
|
|
•
|
changes in available tax credits;
|
|
•
|
changes in share-based compensation expense;
|
|
•
|
changes in the valuation of our deferred tax assets and liabilities;
|
|
•
|
changes in domestic or international tax laws or the interpretation of such tax laws;
|
|
•
|
the resolution of issues arising from tax audits with various tax authorities;
|
|
•
|
the tax effects of purchase accounting for acquisitions and restructuring charges that may cause fluctuations between reporting periods; and
|
|
•
|
taxes that may be incurred upon a repatriation of cash from foreign operations.
|
Any significant increase in our future effective tax rates could impact our results of operations for future periods adversely.
If we fail to effectively manage our contract manufacturer relationships, we could incur additional costs or be unable to timely fulfill our customer commitments, which would adversely affect our business and results of operations and, in the event of an inability to fulfill commitments, would harm our customer relationships.
We outsource all of our manufacturing and a substantial portion of our repair service operations to independent contract manufacturers and other third parties. Our contract manufacturers typically manufacture our products based on rolling forecasts of our product needs that we provide to them on a regular basis. The contract manufacturers are responsible for procuring components necessary to build our products based on our rolling forecasts, building and assembling the products, testing the products in accordance with our specifications and then shipping the products to us. We configure the products to our customer requirements, conduct final testing and then ship the products to our customers. Although we currently partner with multiple major contract manufacturers, there can be no assurance that we will not encounter problems as we are dependent on contract manufacturers to provide these manufacturing services or that we will be able to replace a contract manufacturer that is not able to meet our demand.
In addition, if we fail to effectively manage our relationships with our contract manufacturers or other service providers, or if one or more of them should not fully comply with their contractual obligations or should experience delays, disruptions, component procurement problems or quality control problems, then our ability to ship products to our customers or otherwise fulfill our contractual obligations to our customers could be delayed or impaired which would adversely affect our business, financial results and customer relationships.
We depend on sole or limited sources for some key components and failure to receive timely delivery of any of these components could result in deferred or lost sales.
In some instances, we are dependent upon one or a few sources, either because of the specialized nature of a particular item or because of local content preference requirements pursuant to which we operate on a given project. Examples of sole or limited sourcing categories include metal fabrications and castings, for which we own the tooling and therefore limit our supplier relationships, and MMICs (a type of integrated circuit used in manufacturing microwave
19
radios), which we procure at a volume discount from a single source. Our supply chain plan includes mitigation plans for alternative manufacturing sources and identified alternate suppliers. However, if these alternatives cannot address our requirements when our existing sources of these components fail to deliver them on time, we could suffer delayed shipments, canceled orders and lost or deferred revenues, as well as material damage to our customer relationships. Should this occur, our operating results, cash flows and financial condition could be materially adversely affected.
Credit and commercial risks and exposures could increase if the financial condition of our customers declines.
A substantial portion of our sales are to customers in the telecommunications industry. These customers may require their suppliers to provide extended payment terms, direct loans or other forms of financial support as a condition to obtaining commercial contracts. We expect that we may provide or commit to financing where appropriate for our business. Our ability to arrange or provide financing for our customers will depend on a number of factors, including our credit rating, our level of available credit and our ability to sell off commitments on acceptable terms. In addition, if local currencies cannot be hedged, we have an inherent exposure in our ability to convert monies at favorable rates from or to U.S. dollars. More generally, we expect to routinely enter into long-term contracts involving significant amounts to be paid by our customers over time. Pursuant to these contracts, we may deliver products and services representing an important portion of the contract price before receiving any significant payment from the customer. As a result of the financing that may be provided to customers and our commercial risk exposure under long-term contracts, our business could be adversely affected if the financial condition of our customers erodes. Over the past few years, certain of our customers have filed with the courts seeking protection under the bankruptcy or reorganization laws of the applicable jurisdiction, or have experienced financial difficulties. The financial healthiness may be exacerbated in many emerging markets, where our customers are being affected not only by recession, but by deteriorating local currencies and a lack of credit. Upon the financial failure of a customer, we may experience losses on credit extended and loans made to such customer, losses relating to our commercial risk exposure and the loss of the customer’s ongoing business. If customers fail to meet their obligations to us, we may experience reduced cash flows and losses in excess of reserves, which could materially adversely impact our results of operations and financial position.
Our customers may not pay for products and services in a timely manner, or at all, which would decrease our cash flows and adversely affect our working capital.
Our business requires extensive credit risk management that may not be adequate to protect against customer nonpayment. A risk of non-payment by customers is a significant focus of our business. We expect a significant amount of future revenue to come from international customers, many of whom will be startup telecommunications operators in developing countries. We do not generally expect to obtain collateral for sales, although we require letters of credit or credit insurance as appropriate for international customers. For information regarding the percentage of revenue attributable to certain key customers, see the risks discussed in the following risk factor. Our historical accounts receivable balances have been concentrated in a small number of significant customers. Unexpected adverse events impacting the financial condition of our customers, bank failures or other unfavorable regulatory, economic or political events in the countries in which we do business may impact collections and adversely impact our business, require increased bad debt expense or receivable write-offs and adversely impact our cash flows, financial condition and operating results, which could also result in a breach of our bank covenants.
Because a significant amount of our revenue may come from a limited number of customers, the termination of any of these customer relationships may adversely affect our business.
Sales of our products and services historically have been concentrated in a small number of customers. Principal customers for our products and services include domestic and international wireless/mobile service providers, OEMs, as well as private network users such as public safety agencies; government institutions; and utility, pipeline, railroad and other industrial enterprises that operate broadband wireless networks. We had revenue from two customers that each exceeded 10% of our total revenue during fiscal 2013, and one customer in each of 2014 and 2012. Although we have a large customer base, during any given quarter a small number of customers may account for a significant portion of our revenue.
It is possible that a significant portion of our future product sales also could become even more concentrated in a limited number of customers as currently, one of our customers, MTN, represented over 10% of our revenue. In addition, product sales to major customers have varied widely from period to period. The loss of any existing customer, a significant reduction in the level of sales to any existing customer, or our inability to gain additional customers could result in declines in our revenue or an inability to grow revenue. In addition, further consolidation of our potential customer base could result in purchasing decision delays as consolidating customers integrate their operations and could generally reduce our opportunities to win new customers to the extent that the number of potential customers decreases.
20
Furthermore, as our customers become larger, they may have more leverage to negotiate better pricing which could adversely affect our revenues and gross margins.
Consolidation within the telecommunications industry could result in a decrease in our revenue.
The telecommunications industry has experienced significant consolidation among its participants, and we expect this trend to continue. Some operators in this industry have experienced financial difficulty and have filed, or may file, for bankruptcy protection. Other operators may merge and one or more of our competitors may supply products to the customers of the combined company following those mergers. This consolidation could result in purchasing decision delays and decreased opportunities for us to supply products to companies following any consolidation. This consolidation may also result in lost opportunities for cost reduction and economies of scale.
We continually evaluate strategic opportunities which could involve merger and/or acquisition activities that could disrupt our operations and harm our operating results.
Our growth depends upon market growth, our ability to enhance our existing products and our ability to introduce new products on a timely basis. We intend to continue to address the need to develop new products and enhance existing products through acquisitions, or “tuck-ins,” product lines, technologies, and personnel. Acquisitions involve numerous risks, including the following:
|
•
|
difficulties in integrating the operations, systems, technologies, products, and personnel of the acquired companies, particularly companies with large and widespread operations and/or complex products;
|
|
•
|
diversion of management's attention from normal daily operations of the business and the challenges of managing larger and more widespread operations resulting from acquisitions;
|
|
•
|
potential difficulties in completing projects associated with in-process research and development intangibles;
|
|
•
|
difficulties in entering markets in which we have no or limited direct prior experience and where competitors in each market have stronger market positions;
|
|
•
|
initial dependence on unfamiliar supply chains or relatively small supply partners;
|
|
•
|
insufficient revenue to offset increased expenses associated with acquisitions; and
|
|
•
|
the potential loss of key employees, customers, distributors, vendors and other business partners of the companies we acquire following and continuing after announcement of acquisition plans.
|
Acquisitions may also cause us to:
|
•
|
issue common stock that would dilute our current stockholders;
|
|
•
|
use a substantial portion of our cash resources, or incur debt;
|
|
•
|
significantly increase our interest expense, leverage and debt service requirements if we incur additional debt to pay for an acquisition;
|
|
•
|
assume material liabilities;
|
|
•
|
record goodwill and non-amortizable intangible assets that are subject to impairment testing on a regular basis and potential periodic impairment charges;
|
|
•
|
incur amortization expenses related to certain intangible assets;
|
|
•
|
incur tax expenses related to the effect of acquisitions on our intercompany R&D cost sharing arrangement and legal structure;
|
|
•
|
incur large and immediate write-offs and restructuring and other related expenses; and
|
|
•
|
become subject to intellectual property or other litigation.
|
Mergers and acquisitions of high-technology companies are inherently risky and subject to many factors outside of our control. No assurance can be given that our previous or future acquisitions will be successful and will not materially adversely affect our business, operating results or financial condition. Failure to manage and successfully integrate acquisitions could materially harm our business and operating results. Even when an acquired company has already developed and marketed products, there can be no assurance that product enhancements will be made in a timely fashion or that pre-acquisition due diligence will have identified all possible issues that might arise with respect to such products.
Our quarterly results may be volatile, which can adversely affect the trading price of our common stock.
21
Our quarterly operating results may vary significantly for a variety of reasons, many of which are outside our control. These factors could harm our business and include, among others:
|
•
|
seasonality in the purchasing habits of our customers;
|
|
•
|
the volume and timing of product orders and the timing of completion of our product deliveries and installations;
|
|
•
|
our ability and the ability of our key suppliers to respond to changes on demand as needed;
|
|
•
|
margin variability based on geographic and product mix;
|
|
•
|
our suppliers’ inability to perform and deliver on time as a result of their financial condition, component shortages or other supply chain constraints;
|
|
•
|
retention of key personnel;
|
|
•
|
the length of our sales cycle;
|
|
•
|
litigation costs and expenses;
|
|
•
|
continued timely rollout of new product functionality and features;
|
|
•
|
increased competition resulting in downward pressure on the price of our products and services;
|
|
•
|
unexpected delays in the schedule for shipments of existing products and new generations of the existing platforms;
|
|
•
|
failure to realize expected cost improvement throughout our supply chain;
|
|
•
|
order cancellations or postponements in product deliveries resulting in delayed revenue recognition;
|
|
•
|
restructuring and streamlining of our operations;
|
|
•
|
war and acts of terrorism;
|
|
•
|
natural disasters;
|
|
•
|
the ability of our customers to obtain financing to enable their purchase of our products;
|
|
•
|
fluctuations in international currency exchange rates;
|
|
•
|
regulatory developments including denial of export and import licenses;
|
|
•
|
general economic conditions worldwide that affect demand and financing for microwave and millimeter wave telecommunications networks; and
|
|
•
|
the timing and size of future restructuring plans and write-offs.
|
Our quarterly results are expected to be difficult to predict and delays in product delivery or closing a sale can cause revenue, margins and net income or loss to fluctuate significantly from anticipated levels. A substantial portion of our contracts are completed in the latter part of a quarter and a significant percentage of these are large orders. Because a significant portion of our cost structure is largely fixed in the short term, revenue shortfalls tend to have a disproportionately negative impact on our profitability and can increase our inventory. The number of large new transactions also increases the risk of fluctuations in our quarterly results because a delay in even a small number of these transactions could cause our quarterly revenues and profitability to fall significantly short of our predictions. In addition, we may increase spending in response to competition or in pursuit of new market opportunities. Accordingly, we cannot provide assurances that we will be able to achieve profitability in the future or that if profitability is attained, that we will be able to sustain profitability, particularly on a quarter-to-quarter basis.
If we are unable to adequately protect our intellectual property rights, we may be deprived of legal recourse against those who misappropriate our intellectual property.
Our ability to compete will depend, in part, on our ability to obtain and enforce intellectual property protection for our technology in the U.S. and internationally. We rely upon a combination of trade secrets, trademarks, copyrights, patents and contractual rights to protect our intellectual property. In addition, we enter into confidentiality and invention assignment agreements with our employees, and enter into non-disclosure agreements with our suppliers and appropriate customers so as to limit access to and disclosure of our proprietary information. We cannot give assurances that any steps taken by us will be adequate to deter misappropriation or impede independent third-party development of similar technologies. In the event that such intellectual property arrangements are insufficient, our business, financial condition and results of operations could be harmed. We have significant operations in the U.S., United Kingdom, Singapore and New Zealand, and outsourcing arrangements in Asia and the U.S. We cannot provide assurances that the protection provided to our intellectual property by the laws and courts of particular nations will be substantially similar to the protection and remedies available under U.S. law. Furthermore, we cannot provide assurances that third parties will not
22
assert infringement claims against us based on intellectual property rights and laws in other nations that are different from those established in the U.S.
If we fail to develop and maintain distribution and licensing relationships, our revenue may decrease.
Although a majority of our sales are made through our direct sales force, we also market our products through indirect sales channels such as independent agents, distributors, OEMs and systems integrators. These relationships enhance our ability to pursue major contract awards and, in some cases, are intended to provide our customers with easier access to financing and a greater variety of equipment and service capabilities, which an integrated system provider should be able to offer. We may not be able to maintain and develop additional relationships. If additional relationships are developed, they may not be successful. Furthermore, as we consider increasing licensing revenue based on upgraded technology, we may not be successful in transitioning customers to the planned software upgrades. Our inability to establish or maintain these distribution and licensing relationships could restrict our ability to market our products and thereby result in significant reductions in revenue. If these revenue reductions occur, our business, financial condition and results of operations would be harmed.
If sufficient radio frequency spectrum is not allocated for use by our products, or we fail to obtain regulatory approval for our products, our ability to market our products may be restricted.
We will be affected by the allocation and auction of the radio frequency spectrum by governmental authorities both in the U.S. and internationally. These governmental authorities may not allocate sufficient radio frequency spectrum for use by our products or we may not be successful in obtaining regulatory approval for our products from these authorities. Historically, in many developed countries, the unavailability of frequency spectrum has inhibited the growth of wireless telecommunications networks. In addition, to operate in a jurisdiction, we must obtain regulatory approval for our products. Each jurisdiction in which we market our products has its own regulations governing radio communications. Products that support emerging wireless telecommunications services can be marketed in a jurisdiction only if permitted by suitable frequency allocations, auctions and regulations. The process of establishing new regulations is complex and lengthy. If we are unable to obtain sufficient allocation of radio frequency spectrum by the appropriate governmental authority or obtain the proper regulatory approval for our products, our business, financial condition and results of operations may be harmed.
Radio communications are subject to regulation by U.S. and foreign laws and international treaties. Generally, our products need to conform to a variety of United States and international requirements established to avoid interference among users of transmission frequencies and to permit interconnection of telecommunications equipment. Any delays in compliance with respect to our future products could delay the introduction of such products.
Our business is subject to changing regulation of corporate governance, public disclosure and anti-bribery measures which have resulted in increased costs and may continue to result in additional costs in the future and/or potential liabilities.
We are subject to rules and regulations of federal and state regulatory authorities, The NASDAQ Stock Market LLC (“NASDAQ”) and financial market entities charged with the protection of investors and the oversight of companies whose securities are publicly traded, and foreign and domestic legislative bodies. During the past few years, these entities, including the Public Company Accounting Oversight Board, the SEC, NASDAQ and several foreign governments such as the governments of the United Kingdom and Brazil, have issued requirements, laws and regulations and continue to develop additional requirements, laws and regulations, most notably the Sarbanes-Oxley Act of 2002 (“SOX”), and recent laws and regulations regarding bribery and unfair competition. Our efforts to comply with these requirements and regulations have resulted in, and are likely to continue to result in, increased general and administrative expenses and a diversion of substantial management time and attention from revenue-generating activities to compliance activities.
Moreover, because these laws, regulations and standards are subject to varying interpretations, their application in practice may evolve over time as new guidance becomes available. This evolution may result in continuing uncertainty regarding compliance matters and additional costs potentially necessitated by ongoing revisions to our disclosure and governance practices. Finally, if we are unable to ensure compliance with such requirements, laws, or regulations, we may be subject to costly prosecution and liability, and resulting reputational harm, from such noncompliance.
We have identified material weaknesses in our internal control over financial reporting that could, if not remediated, result in material misstatements in our financial statements.
In connection with the audit of our consolidated financial statements as of and for the year ended June 27, 2014, we have concluded that there are material weaknesses relating to our internal control over financial reporting. A material
23
weakness is a deficiency, or a combination of deficiencies, in internal control over financial reporting such that there is a reasonable possibility that a material misstatement of the company’s annual or interim consolidated financial statements will not be prevented or detected on a timely basis.
Specifically, we identified material weaknesses relating to (i) our controls pertaining to the control environment, risk assessment, monitoring activities and information and communication activities; (ii) ensuring that we identified, accumulated and documented appropriate information necessary to support manual journal entries; (iii) ensuring that account reconciliations were reviewed and approved for accuracy and completeness and that we identified, accumulated and documented appropriate information necessary to support account balances; and (iv) ensuring that the reported amount and timing of revenue recognition was accurate. For additional information on these matters, see Part II, Item 9A of this Annual Report on Form 10-K. As a result of these material weaknesses, management has determined that our disclosure controls and procedures and internal control over financial reporting were not effective as of June 27, 2014.
Subsequent to our
June 27, 2014
fiscal year end, we began taking a number of actions, including designing and implementing new controls and revising existing controls, in order to remediate the material weaknesses described above. We expect to continue our remediation efforts, including testing of operating effectiveness of new controls during the fiscal year ending July 3, 2015. We expect to incur additional costs remediating these material weaknesses.
We may need to take additional measures to fully mitigate the material weaknesses, and the measures we have taken, and expect to take, to improve our internal controls may not be sufficient to address the issues identified, to ensure that our internal controls are effective or to ensure that the identified material weaknesses will not result in a material misstatement of our annual or interim consolidated financial statements. In addition, other material weaknesses or deficiencies may be identified in the future. If we are unable to correct material weaknesses or deficiencies in internal controls in a timely manner, our ability to record, process, summarize and report financial information accurately and within the time periods specified in the rules and forms of the SEC will be adversely affected. This failure could negatively affect the market price and trading liquidity of our common stock, cause investors to lose confidence in our reported financial information, subject us to civil and criminal investigations and penalties, and generally materially and adversely impact our business and financial condition.
Our products are used in critical communications networks which may subject us to significant liability claims.
Because our products are used in critical communications networks, we may be subject to significant liability claims if our products do not work properly. We warrant to our current customers that our products will operate in accordance with our product specifications. If our products fail to conform to these specifications, our customers could require us to remedy the failure or could assert claims for damages. The provisions in our agreements with customers that are intended to limit our exposure to liability claims may not preclude all potential claims. In addition, any insurance policies we have may not adequately limit our exposure with respect to such claims. Liability claims could require us to spend significant time and money in litigation or to pay significant damages. Any such claims, whether or not successful, would be costly and time-consuming to defend, and could divert management’s attention and seriously damage our reputation and our business.
We may be subject to litigation regarding intellectual property associated with our wireless business. This litigation could be costly to defend and resolve, and could prevent us from using or selling the challenged technology.
The wireless telecommunications industry is characterized by vigorous protection and pursuit of intellectual property rights, which has resulted in often protracted and expensive litigation. Any litigation regarding patents or other intellectual property could be costly and time-consuming and could divert our management and key personnel from our business operations. The complexity of the technology involved and the uncertainty of intellectual property litigation increase these risks. Such litigation or claims could result in substantial costs and diversion of resources. In the event of an adverse result in any such litigation, we could be required to pay substantial damages, cease the use and transfer of allegedly infringing technology or the sale of allegedly infringing products and expend significant resources to develop non-infringing technology or obtain licenses for the infringing technology. We can give no assurances that we would be successful in developing such non-infringing technology or that any license for the infringing technology would be available to us on commercially reasonable terms, if at all. This could have a materially adverse effect on our business, results of operation, financial condition, competitive position and prospects.
System security risks, data protection breaches, and cyber-attacks could compromise our proprietary information, disrupt our internal operations and harm public perception of our security products, which could cause our business and reputation to suffer and adversely affect our stock price.
24
In the ordinary course of business, we store sensitive data, including intellectual property, our proprietary business information and proprietary information of our customers, suppliers and business partners, on our networks. The secure maintenance of this information is critical to our operations and business strategy. Increasingly, companies, including Aviat Networks are subject to a wide variety of attacks on their networks on an ongoing basis. Despite our security measures, Aviat Networks' information technology and infrastructure may be vulnerable to penetration or attacks by computer programmers and hackers, or breached due to employee error, malfeasance or other disruptions. Any such breach could compromise our networks, creating system disruptions or slowdowns and exploiting security vulnerabilities of our products, and the information stored on our networks could be accessed, publicly disclosed, lost or stolen, which could subject us to liability to our customers, suppliers, business partners and others, and cause us reputational and financial harm. In addition, sophisticated hardware and operating system software and applications that we produce or procure from third parties may contain defects in design or manufacture, including “bugs” and other problems that could unexpectedly interfere with the operation of our networks.
If an actual or perceived breach of network security occurs in our network or in the network of a customer of our security products, regardless of whether the breach is attributable to our products, the market perception of the effectiveness of our products could be harmed. Because the techniques used by computer programmers and hackers, many of whom are highly sophisticated and well-funded, to access or sabotage networks change frequently and generally are not recognized until after they are used, we may be unable to anticipate or immediately detect these techniques. This could impede our sales, manufacturing, distribution or other critical functions. In addition, the economic costs to us to eliminate or alleviate cyber or other security problems, bugs, viruses, worms, malicious software systems and security vulnerabilities could be significant and may be difficult to anticipate or measure because the damage may differ based on the identity and motive of the programmer or hacker, which are often difficult to identify.
Anti-takeover provisions of Delaware law and provisions in our Amended and Restated Certificate of Incorporation and Amended and Restated Bylaws could make a third-party acquisition of us difficult.
Because we are a Delaware corporation, the anti-takeover provisions of Delaware law could make it more difficult for a third party to acquire control of us, even if the change in control would be supported by our stockholders. We are subject to the provisions of Section 203 of the General Corporation Law of Delaware, which prohibits us from engaging in certain business combinations, unless the business combination is approved in a prescribed manner. In addition, our Amended and Restated Certificate of Incorporation and Amended and Restated Bylaws also contain certain provisions that may make a third-party acquisition of us difficult, including the ability of the Board of Directors to issue preferred stock and the requirement that nominations for directors and other proposals by stockholders must be made in advance of the meeting at which directors are elected or the proposals are voted upon.
Item 1B.
Unresolved Staff Comments
None.
Item 2.
Properties
As of
June 27, 2014
, we leased approximately 374,000 square feet of facilities worldwide, with approximately 63% in North America, mostly in California, Texas, North Carolina and Montreal. Our corporate headquarters are located in Santa Clara, California, and consist of a building of approximately 129,000 square feet. The lease for our headquarters expires in April 2020 and we plan to sublease a portion of the facility as part of our restructuring plan. We also lease approximately 40,000 square feet of office and assembly facilities in San Antonio and Austin, Texas. Internationally, we lease approximately 144,000 square feet of facilities throughout Europe, Central America, South America, Africa and Asia regions, including offices in Singapore, Slovenia, Philippine Islands, India, Mexico, South Africa, Nigeria, Ivory Coast, France, Kenya, Poland, Australia Saudi Arabia, Brazil, Thailand, and Malaysia. In addition, we own approximately 110,000 square feet of facilities in Wellington, New Zealand and Lanarkshire, Scotland.
We maintain our facilities in good operating condition, and believe that they are suitable and adequate for our current and projected needs. We continuously review our anticipated requirements for facilities and may, from time to time, acquire additional facilities, expand existing facilities, or dispose of existing facilities or parts thereof, as we deem necessary.
For more information about our lease obligations, see “Note 13. Commitments and Contingencies” of notes to consolidated financial statements, which are included in Item 8 in this Annual Report on Form 10-K.
25
Item 3.
Legal Proceedings
From time to time, we may be involved in various legal claims and litigation that arise in the normal course of our operations. We record accruals for our outstanding legal proceedings, investigations or claims when it is probable that a liability will be incurred and the amount of loss can be reasonably estimated. We evaluate, at least on a quarterly basis, developments in legal proceedings, investigations or claims that could affect the amount of any accrual, as well as any developments that would result in a loss contingency to become both probable and reasonably estimable.
While the results of such claims and litigation cannot be predicted with certainty, we currently believe that we are not a party to any litigation the final outcome of which is likely to have a material adverse effect on our financial position, results of operations or cash flows. However, should we not prevail in any such litigation; it could have a material adverse impact on our operating results, cash flows or financial position.
Item 4.
Mine Safety Disclosures
Not applicable.
26
Item 5.
Market for Registrant’s Common Equity, Related Stockholder Matters and Issuer Purchases of Equity Securities
Market Information and Price Range of Common Stock
Our common stock, with a par value of $0.01 per share, is listed and primarily traded on the NASDAQ Global Select Market, under the ticker symbol AVNW (prior to January 28, 2010 our ticker symbol was HSTX). There was no established trading market for shares of our common stock prior to January 29, 2007.
According to the records of our transfer agent, as of
September 4, 2014
, there were approximately
4,413
holders of record of our common stock. The following table sets forth the high and low closing prices for a share of our common stock on NASDAQ Global Select Market for the periods indicated during our fiscal years
2014
and
2013
:
|
|
Fiscal 2014
|
Fiscal 2013
|
|||||
|
|
High
|
Low
|
High
|
Low
|
|||
|
First Quarter
|
$2.74
|
$2.39
|
$2.80
|
$2.11
|
|||
|
Second Quarter
|
$2.57
|
$1.97
|
$3.32
|
$2.28
|
|||
|
Third Quarter
|
$2.31
|
$1.60
|
$3.75
|
$3.26
|
|||
|
Fourth Quarter
|
$1.66
|
$1.00
|
$3.35
|
$2.57
|
|||
Dividend Policy
We have not paid cash dividends on our common stock and do not intend to pay cash dividends in the foreseeable future. We intend to retain any earnings for use in our business. In addition, the covenants of our credit facility may restrict us from paying dividends or making other distributions to our stockholders under certain circumstances.
Sales of Unregistered Securities
During the fourth quarter of fiscal
2014
, we did not issue or sell any unregistered securities.
Issuer Repurchases of Equity Securities
During the fourth quarter of fiscal
2014
, we did not repurchase any equity securities.
Performance Graph
The following graph and accompanying data compares the cumulative total return on our common stock with the cumulative total return of the Total Return Index for The NASDAQ Composite Market (U.S. Companies) and the NASDAQ Telecommunications Index for the five-year period ended
June 27, 2014
. The stock price performance shown on the graph below is not necessarily indicative of future price performance. Note that this graph and accompanying data is “furnished,” not “filed,” with the SEC.
27
COMPARISON OF 5 YEAR CUMULATIVE TOTAL RETURN*
Among Aviat Networks, Inc., the NASDAQ Composite Index
and the NASDAQ Telecommunications Index
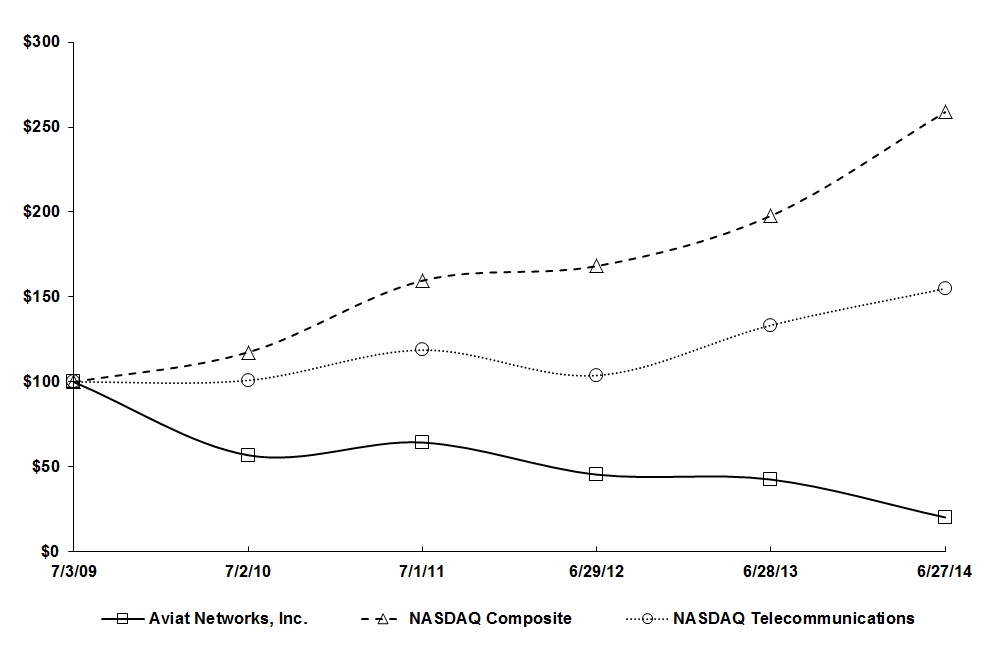
|
7/3/2009
|
7/2/2010
|
7/1/2011
|
6/29/2012
|
6/28/2013
|
6/27/2014
|
||||||||||||
|
Aviat Networks, Inc.
|
100.00
|
|
56.91
|
|
64.39
|
|
45.53
|
|
42.60
|
|
20.33
|
|
|||||
|
NASDAQ Composite
|
100.00
|
|
117.49
|
|
159.65
|
|
168.23
|
|
197.84
|
|
258.87
|
|
|||||
|
NASDAQ Telecommunications
|
100.00
|
|
100.95
|
|
118.79
|
|
103.87
|
|
133.40
|
|
154.98
|
|
|||||
____________________________
|
*
|
Assumes (i) $100 invested on July 3, 2009 in Aviat Networks, Inc. common stock, the Total Return Index for The NASDAQ Composite Market (U.S. companies) and the NASDAQ Telecommunications Index; and (ii) immediate reinvestment of all dividends.
|
Item 6.
Selected Financial Data
The following table summarizes our selected historical financial information for each of the last five fiscal years that has been derived from our audited consolidated financial statements. Data presented for fiscal years
2014
,
2013
and
2012
are included elsewhere in this Annual Report on Form 10-K. This table should be read in conjunction with our other financial information, including “Item 7. Management’s Discussion and Analysis of Financial Condition and Results of Operations” and the consolidated financial statements and notes, included elsewhere in this Annual Report on Form 10-K.
28
|
|
Fiscal Year Ended
|
||||||||||||||||||
|
|
June 27, 2014
|
June 28, 2013
|
June 29, 2012
|
July 1, 2011
|
July 2, 2010
|
||||||||||||||
|
|
(In millions)
|
||||||||||||||||||
|
Revenue from product sales and services
|
$
|
346.0
|
|
$
|
471.3
|
|
$
|
444.0
|
|
$
|
452.1
|
|
$
|
465.5
|
|
||||
|
Cost of product sales and services
|
260.9
|
|
331.2
|
|
312.3
|
|
324.0
|
|
332.7
|
|
|||||||||
|
Loss from continuing operations
|
(52.1
|
)
|
(10.9
|
)
|
(15.5
|
)
|
(58.8
|
)
|
(108.4
|
)
|
|||||||||
|
Net loss
|
(51.2
|
)
|
(15.0
|
)
|
(24.1
|
)
|
(90.5
|
)
|
(130.2
|
)
|
|||||||||
|
Basic and diluted loss per common share:
|
|||||||||||||||||||
|
Loss from continuing operations
|
$
|
(0.85
|
)
|
$
|
(0.18
|
)
|
$
|
(0.26
|
)
|
$
|
(1.00
|
)
|
$
|
(1.82
|
)
|
||||
|
Net loss
|
(0.83
|
)
|
(0.25
|
)
|
(0.41
|
)
|
(1.54
|
)
|
(2.19
|
)
|
|||||||||
|
|
As of
|
||||||||||||||||||
|
|
June 27, 2014
|
June 28, 2013
|
June 29, 2012
|
July 1, 2011
|
July 2, 2010
|
||||||||||||||
|
|
(In millions)
|
||||||||||||||||||
|
Total assets
|
$
|
253.2
|
|
$
|
305.8
|
|
$
|
329.6
|
|
$
|
383.9
|
|
$
|
447.0
|
|
||||
|
Long-term liabilities
|
19.7
|
|
24.8
|
|
24.7
|
|
15.1
|
|
17.2
|
|
|||||||||
|
Total net assets
|
102.6
|
|
149.9
|
|
157.5
|
|
177.7
|
|
263.2
|
|
|||||||||
The following table summarizes certain charges, expenses and gains included in our net losses for each of the fiscal years in the five-year period ended
June 27, 2014
:
|
|
Fiscal Year Ended
|
||||||||||||||||||
|
|
June 27, 2014
|
June 28, 2013
|
June 29, 2012
|
July 1, 2011
|
July 2, 2010
|
||||||||||||||
|
|
(In millions)
|
||||||||||||||||||
|
Share-based compensation expense
|
$
|
3.4
|
|
$
|
6.4
|
|
$
|
5.2
|
|
$
|
4.8
|
|
$
|
3.1
|
|
||||
|
Goodwill impairment charges
|
—
|
|
—
|
|
5.6
|
|
—
|
|
—
|
|
|||||||||
|
Intangible impairment charges
|
—
|
|
—
|
|
—
|
|
—
|
|
57.7
|
|
|||||||||
|
Property, plant and equipment impairment
charges
|
—
|
|
—
|
|
—
|
|
—
|
|
8.7
|
|
|||||||||
|
Rebranding and transitional costs
|
—
|
|
—
|
|
—
|
|
0.9
|
|
8.4
|
|
|||||||||
|
Charges for product transition, product
discontinuances and inventory mark-downs
|
1.2
|
|
—
|
|
1.0
|
|
6.6
|
|
16.9
|
|
|||||||||
|
Amortization of purchased technology and
intangible assets
|
0.4
|
|
1.0
|
|
2.3
|
|
3.4
|
|
12.3
|
|
|||||||||
|
Restructuring charges
|
11.1
|
|
3.1
|
|
2.3
|
|
15.4
|
|
7.1
|
|
|||||||||
|
Amortization of the fair value adjustments
related to fixed assets and inventory
|
—
|
|
—
|
|
—
|
|
0.2
|
|
0.6
|
|
|||||||||
|
Gains from sale of building and Telsima
acquisition purchase price settlement
|
—
|
|
—
|
|
—
|
|
—
|
|
(2.2
|
)
|
|||||||||
|
NetBoss bad debt expenses and other
|
—
|
|
—
|
|
0.8
|
|
—
|
|
—
|
|
|||||||||
|
Loss on sale of NetBoss assets
|
—
|
|
—
|
|
—
|
|
4.6
|
|
—
|
|
|||||||||
|
Transactional tax assessments
|
0.6
|
|
1.4
|
|
0.6
|
|
2.8
|
|
—
|
|
|||||||||
|
Liquidation of entities
|
—
|
|
—
|
|
—
|
|
0.8
|
|
—
|
|
|||||||||
|
Other adjustments
|
0.2
|
|
(0.7
|
)
|
—
|
|
(0.9
|
)
|
—
|
|
|||||||||
|
$
|
16.9
|
|
$
|
11.2
|
|
$
|
17.8
|
|
$
|
38.6
|
|
$
|
112.6
|
|
|||||
29
Item 7.
Management’s Discussion and Analysis of Financial Condition and Results of Operations
Overview of Business; Operating Environment and Key Factors Impacting Fiscal 2014 and 2015 Results
The following Management’s Discussion and Analysis (“MD&A”) is intended to help the reader understand our results of operations and financial condition. MD&A is provided as a supplement to, and should be read in conjunction with, our consolidated financial statements and the accompanying notes. In the discussion below, our fiscal year ending
July 3, 2015
is referred to as “fiscal
2015
” or “
2015
”; our fiscal year ended
June 27, 2014
is referred to as “fiscal
2014
” or “
2014
”; our fiscal year ended
June 28, 2013
is referred to as “fiscal
2013
” or “
2013
”; and our fiscal year ended
June 29, 2012
is referred to as “fiscal
2012
” or “
2012
.”
We generate revenue by designing, developing, manufacturing and supporting a range of wireless networking products, solutions and services for mobile and fixed communications service providers, private network operators, government agencies, transportation and utility companies, public safety agencies and broadcast system operators across the globe. Our products include point-to-point (PTP) digital microwave transmission systems designed for first/last mile access, middle mile/backhaul, and long distance trunking applications. We also provide network management software solutions to enable operators to deploy, monitor and manage our systems, third party equipment such as antennas, routers, and multiplexers, necessary to build and deploy a wireless transmission network, and a full suite of turnkey support services.
We work continuously to improve our established brands and to create new products that meet our customers’ evolving needs and preferences. Our fundamental business goal is to generate superior returns for our stockholders over the long term. We believe that increases in revenue, operating profits and earnings per share are the key measures of financial performance for our business.
Our strategic focus in fiscal 2015 will be to continue to accelerate innovation and optimize our product portfolio, improve costs and operational efficiencies, grow our revenue and create a sustainable, profitable business model. To do this, we continue to examine our products, markets, facilities, development programs, and operational flows to ensure we are focused on what we do well and what will differentiate us in the future. We will continue working to streamline management processes to attain the efficiency levels required by the markets in which we do business.
Although the general trend of increasing demand for bandwidth to support mobile networks applies in all markets, we expect to see quarter-to-quarter fluctuations within markets and with individual customers based on customers' past purchasing patterns. Seasonality is also a factor that impacts our business. Our fiscal third quarter revenue and orders have historically been lower than the revenue and orders in our second fiscal quarter because many of our customers utilize a significant portion of their capital budgets at the end of their fiscal years, which is typically the calendar year end and coincides with our second fiscal quarter. The majority of our customers begin a new fiscal year on January 1, and capital expenditures tend to be lower in an organization’s first quarter than in its fourth quarter. We anticipate that this seasonality will continue. The seasonality between the second quarter and third quarter may be affected by a variety of additional factors, including changes in the global economy.
During fiscal 2015, we expect to provide increased managed services, including network design, inventory management, final configuration and warehousing services, to certain customers in certain geographies. Our operating results may be impacted by providing these services to the extent that we may need to postpone the recognition of revenue and incur upfront and ongoing expenses that are not offset with additional revenue from product sales associated with these services until a future period.
Operations Review
The market for mobile backhaul continues to be our primary addressable market segment and, over the long term, the demand for increasing the backhaul capacity in our customers' networks continues to grow. In North America we supported long-term evolution ("LTE") deployments of our mobile operator customers, public safety network deployments for state and local governments, and private network implementations for utilities and other customers. Internationally, our business continued to rely on a combination of customers increasing their capacity to handle subscriber growth, the ongoing build-out of some large 3G deployments, and the emergence of early stage LTE deployments. Our position continues to be to support our customers for LTE readiness and ensure that our technology roadmap is well aligned with evolving market requirements. We continue to find that our strength in turnkey and after-sale support services is a differentiating factor that wins business for us and enables us to expand our business with existing customers in all markets. However, as disclosed above and in the “Risk Factors” section in Item 1A of this
30
Annual Report on Form 10-K, a number of factors could prevent us from achieving our objectives, including ongoing pricing pressures attributable to competition and macroeconomic conditions in the geographic markets that we service.
During the third quarter of fiscal 2014, in line with the decrease in revenue that we experienced and our reduced forecast for the immediate future, we announced a new restructuring plan. Our restructuring expenses incurred during fiscal 2014 related to two restructuring plans we initiated in fiscal 2014 (the “Fiscal 2014-2015 Plan”) and fiscal 2013 (the “Fiscal 2013-2014 Plan”). We intend to complete a majority of the remaining restructuring activities under the current plans by the end of second quarter of fiscal 2015. See “Restructuring Charges” below.
Revenue
We manage our sales activities primarily on a geographic basis in North America and three international geographic regions: (1) Africa and Middle East, (2) Europe and Russia and (3) Latin America and Asia Pacific. Revenue by region for fiscal
2014, 2013 and 2012
and the related changes were shown in the table below:
|
|
Fiscal Year
|
$ Change
|
% Change
|
||||||||||||||||||||||
|
(In millions, except percentages)
|
2014
|
2013
|
2012
|
2014/2013
|
2013/2012
|
2014/2013
|
2013/2012
|
||||||||||||||||||
|
North America
|
$
|
142.0
|
|
$
|
180.5
|
|
$
|
164.9
|
|
$
|
(38.5
|
)
|
$
|
15.6
|
|
(21.3
|
)%
|
9.5
|
%
|
||||||
|
Africa and Middle East
|
108.9
|
|
182.2
|
|
147.7
|
|
(73.3
|
)
|
34.5
|
|
(40.2
|
)%
|
23.4
|
%
|
|||||||||||
|
Europe and Russia
|
36.0
|
|
48.0
|
|
53.6
|
|
(12.0
|
)
|
(5.6
|
)
|
(25.0
|
)%
|
(10.4
|
)%
|
|||||||||||
|
Latin America and Asia Pacific
|
59.1
|
|
60.6
|
|
77.8
|
|
(1.5
|
)
|
(17.2
|
)
|
(2.5
|
)%
|
(22.1
|
)%
|
|||||||||||
|
Total Revenue
|
$
|
346.0
|
|
$
|
471.3
|
|
$
|
444.0
|
|
$
|
(125.3
|
)
|
$
|
27.3
|
|
(26.6
|
)%
|
6.1
|
%
|
||||||
Our revenue in North America decreased
$38.5 million
, or
21.3%
, in fiscal
2014
compared with fiscal
2013
. Revenue from wireless operator customers was down as they reach completion of their LTE network building period. We also saw lower revenue from private government and utility networks due to the timing of purchases and project deliveries to those customers.
Our revenue in North America increased
$15.6 million
, or
9.5%
, in fiscal
2013
compared with fiscal
2012
. In fiscal 2013, we saw improved sales to North American mobile operators which were attributable to their ongoing buildout of LTE networks in the region. At the same time, North America sales to non-mobile customers, such as power utilities and state and local government private networks, were flat in fiscal 2013 compared with fiscal 2012.
Our revenue in Africa and Middle East decreased
$73.3 million
, or
40.2%
, in fiscal
2014
compared with fiscal
2013
. The majority of the decrease came from reduced capital spending by our largest customer in the region. Revenue in Europe and Russia declined
$12.0 million
, or
25.0%
, in fiscal 2014 compared with fiscal 2013. This decrease was mostly from completion of a large project in fiscal 2013 that was not repeated in fiscal 2014 and from timing of customer purchases in fiscal 2014. Revenue in Latin America and Asia Pacific declined
$1.5 million
, or
2.5%
, in fiscal 2014 compared with fiscal 2013. The decrease was primarily due to reduced sales in Thailand and Afghanistan.
Our revenue in Africa and Middle East increased
$34.5 million
, or
23.4%
, in fiscal 2013 compared with fiscal 2012. The majority of the increase came in the first half of fiscal 2013 and was attributable to demand from mobile operator customers in Africa investing in network transmission capacity in order to accommodate growth in network data traffic and to increase their service competitiveness. Revenue from mobile operators in Europe and Russia declined
$5.6 million
, or
10.4%
, in fiscal 2013 compared with fiscal 2012. We believe the decrease was related to economic difficulties experienced generally throughout Europe. Revenue in Latin America and Asia Pacific declined
$17.2 million
, or
22.1%
, in fiscal 2013 compared with fiscal 2012. The decrease was primarily due to a decline in customer purchases in Asia as some of our larger customers, who were beginning to roll out LTE service, continued to deploy large orders that we delivered in the past year.
Our revenue from product sales decreased
$114.1 million
, or
33.9%
, in fiscal 2014 compared with fiscal 2013. The decrease was primarily due to reduced purchases of our products and services made by larger customers in Africa, North America and Europe compared to the previous year and continued reduction in fiscal 2014. Asia Pacific product sales were also down compared to fiscal 2013, with a small increase in Latin America. Our service revenue decreased
$10.7 million
, or
7.9%
, in fiscal 2014 compared with fiscal 2013. The main reason for the decline was the reduced revenue in North America owing to the reduction in business with wireless network operators. Other regions had relatively flat service revenue performance between the years.
31
Our revenue from product sales increased
$1.2 million
, or
0.4%
, in fiscal 2013 compared with fiscal 2012. The increase came primarily from strong sales in Africa, offset in part by reductions in Asia Pacific, Europe and a small year-to-year decrease in North America. Our services revenue increased
$26.1 million
, or
24.1%
, in fiscal 2013 compared with fiscal 2012. The increase in fiscal 2013 came from additional services delivered in North America, Africa and a small increase in Europe, offset in part by a decrease in Asia Pacific.
During fiscal
2014
, the MTN Group in Africa accounted for
17%
of our total revenue compared with
25%
in fiscal
2013
and
17%
in fiscal
2012
. We have entered into separate and distinct contracts with MTN Group as well as separate arrangements with various MTN Group subsidiaries. For fiscal 2013, revenue from Verizon Wireless accounted for
11%
of our total revenue. The loss of all or a substantial portion of MTN Group's business or of Verizon Wireless' business could adversely affect our results of operations, cash flows and financial position.
Gross Margin
|
|
Fiscal Year
|
$ Change
|
% Change
|
||||||||||||||||||||||
|
(In millions, except percentages)
|
2014
|
2013
|
2012
|
2014/2013
|
2013/2012
|
2014/2013
|
2013/2012
|
||||||||||||||||||
|
Revenue
|
$
|
346.0
|
|
$
|
471.3
|
|
$
|
444.0
|
|
$
|
(125.3
|
)
|
$
|
27.3
|
|
(26.6
|
)%
|
6.1
|
%
|
||||||
|
Cost of revenue
|
260.9
|
|
331.2
|
|
312.3
|
|
(70.3
|
)
|
18.9
|
|
(21.2
|
)%
|
6.1
|
%
|
|||||||||||
|
Gross margin
|
$
|
85.1
|
|
$
|
140.1
|
|
$
|
131.7
|
|
(55.0
|
)
|
8.4
|
|
(39.3
|
)%
|
6.4
|
%
|
||||||||
|
% of revenue
|
24.6
|
%
|
29.7
|
%
|
29.7
|
%
|
|||||||||||||||||||
|
Product margin %
|
22.4
|
%
|
28.8
|
%
|
30.4
|
%
|
|||||||||||||||||||
|
Service margin %
|
28.5
|
%
|
31.9
|
%
|
27.4
|
%
|
|||||||||||||||||||
Gross margin for fiscal
2014
decreased
$55.0 million
, or
39.3%
, compared with fiscal
2013
, primarily due to reduced sales volume. Gross margin as a percentage of revenue was
5.1 percent
age points less in fiscal
2014
compared with fiscal
2013
. Product margin as a percentage of product revenue for fiscal 2014 decreased
6.4 percent
age points compared with fiscal
2013
. The product margin rate reduction resulted from competitive pricing pressure and from spreading our fixed costs into a smaller volume of product revenue. Service margin as a percentage of service revenue for fiscal
2014
decreased
3.4 percent
age points compared with fiscal
2013
. Market pricing pressure as well as spreading of our fixed costs over a smaller revenue volume contributed to the decline in service margin rate.
Gross margin for fiscal
2013
increased
$8.4 million
, or
6.4%
, compared with fiscal
2012
, primarily due to higher sales volume. Gross margin as a percentage of revenue remained approximately the same in fiscal 2013 compared with fiscal
2012
. Product margin as a percentage of product revenue for fiscal 2013 decreased
1.6 percent
age points compared with fiscal 2012. The slight reduction resulted from competitive pricing pressures in the international markets, offset in part by a small increase in margin on product sales in North America. Service margin as a percentage of service revenue for fiscal 2013 increased
4.5 percent
age points compared with fiscal 2012. Service revenue volume increased substantially in fiscal 2013, which enabled us to spread our fixed costs over a larger base of service business in North America as well as in international markets, resulting in improved service margin rate.
Research and Development Expenses
|
|
Fiscal Year
|
$ Change
|
% Change
|
||||||||||||||||||||||
|
(In millions, except percentages)
|
2014
|
2013
|
2012
|
2014/2013
|
2013/2012
|
2014/2013
|
2013/2012
|
||||||||||||||||||
|
Research and development
expenses
|
$
|
35.5
|
|
$
|
39.4
|
|
$
|
36.0
|
|
$
|
(3.9
|
)
|
$
|
3.4
|
|
(9.9
|
)%
|
9.4
|
%
|
||||||
|
% of revenue
|
10.3
|
%
|
8.4
|
%
|
8.1
|
%
|
|||||||||||||||||||
Our R&D expenses decreased
$3.9 million
, or
9.9%
, in fiscal
2014
compared with fiscal
2013
. As a percentage of revenue, R&D expenses increased to
10.3%
in fiscal
2014
from
8.4%
in fiscal
2013
. The decrease in R&D expenses of
$3.9 million
consisted primarily of a $3.8 million decrease of personnel expenses as a result of the restructuring programs we implemented and a $0.7 million decrease in stock based compensation, partially offset by a $0.3 million increase in expenses related to our investment in new product development. We continue to invest in new product features, new functionality and lower cost platforms that we believe will enable our product lines to retain their technology leads in a cost effective manner.
32
Our R&D expenses increased
$3.4 million
, or
9.4%
, in fiscal
2013
compared with fiscal
2012
. As a percentage of revenue, R&D expenses also increased to
8.4%
in fiscal
2013
from
8.1%
in fiscal
2012
. The increase in R&D expenses of
$3.4 million
consisted primarily of a $2.0 million increase of personnel expenses and a $0.6 million increase in material supplies due to our investment in new product development. In addition, depreciation expenses increased by $0.4 million due to additions of new lab equipment. We continue to invest in new product features, new functionality and lower cost platforms that we believe will enable our product lines to retain their technology leads in a cost effective manner.
Selling and Administrative Expenses
|
|
Fiscal Year
|
$ Change
|
% Change
|
||||||||||||||||||||||
|
(In millions, except percentages)
|
2014
|
2013
|
2012
|
2014/2013
|
2013/2012
|
2014/2013
|
2013/2012
|
||||||||||||||||||
|
Selling and administrative
expenses
|
$
|
88.8
|
|
$
|
95.5
|
|
$
|
99.5
|
|
$
|
(6.7
|
)
|
$
|
(4.0
|
)
|
(7.0
|
)%
|
(4.0
|
)%
|
||||||
|
% of revenue
|
25.7
|
%
|
20.3
|
%
|
22.4
|
%
|
|||||||||||||||||||
Our selling and administrative expenses decreased
$6.7 million
, or
7.0%
, in fiscal
2014
compared with fiscal
2013
. The decrease was due primarily to a $2.9 million reduction in personnel expenses as a result of the restructuring programs we implemented, a $1.5 million reduction in bad debt expenses, a
$1.9 million
decrease in share-based compensation expenses, and a $1.8 million decrease in agent commissions. This was partially offset by a $2.0 million increase in expenses for information technology projects. We will continue to seek ways to improve our operating efficiency in fiscal 2015.
Our selling and administrative expenses decreased
$4.0 million
, or
4.0%
, in fiscal
2013
compared with fiscal
2012
. The decrease was due primarily to a $2.1 million reduction in professional services, a $1.2 million reduction in personnel expenses, a $1.4 million reduction in telecommunications expense and a $0.7 million reduction in bad debt expenses, partially offset by a
$1.3 million
increase in share-based compensation expenses and a $0.8 million increase in transactional taxes assessments related to certain international entities.
Restructuring Charges
During the third quarter of fiscal 2014, in line with the decrease in revenue that we experienced and our reduced forecast for the immediate future, we initiated the Fiscal 2014-2015 Plan to reduce our operating costs, primarily in North America, Europe and Asia. Activities under the Fiscal 2014-2015 Plan primarily related to reductions in force and additional downsizing of our Santa Clara, California headquarters.
During the fourth quarter of fiscal 2013, we initiated the Fiscal 2013-2014 Plan that was intended to bring our cost structure in line with the changing business environment of the worldwide microwave radio and telecommunication markets, primarily in North America, Europe and Asia. Activities under the Fiscal 2013-2014 Plan included the downsizing of our Santa Clara, California headquarters and certain international field offices, and reductions in force to reduce our operating expenses.
During the first quarter of fiscal 2011, we initiated a restructuring plan (the “Fiscal 2011 Plan”) to reduce our operational costs primarily in North America, Europe and Asia. Activities under the Fiscal 2011 Plan included the reductions in force to reduce our operating expenses and downsizing or closures of our Morrisville, North Carolina, Santa Clara, California, Montreal, Canada offices and certain international field offices. The Fiscal 2011 Plan has been completed as of the end of fiscal 2013.
Our restructuring charges by plan for fiscal
2014, 2013 and 2012
are summarized in the table below:
|
|
Fiscal Year
|
$ Change
|
% Change
|
||||||||||||||||||||||
|
(In millions, except percentages)
|
2014
|
2013
|
2012
|
2014/2013
|
2013/2012
|
2014/2013
|
2013/2012
|
||||||||||||||||||
|
Restructuring charges:
|
$
|
11.1
|
|
$
|
3.1
|
|
$
|
2.3
|
|
$
|
8.0
|
|
$
|
0.8
|
|
258.1
|
%
|
34.8
|
%
|
||||||
|
By Plan:
|
|||||||||||||||||||||||||
|
Fiscal 2014-2015 Plan
|
5.8
|
|
—
|
|
—
|
|
5.8
|
|
—
|
|
N/A
|
|
N/A
|
|
|||||||||||
|
Fiscal 2013-2014 Plan
|
5.3
|
|
1.8
|
|
—
|
|
3.5
|
|
1.8
|
|
194.4
|
%
|
N/A
|
|
|||||||||||
|
Fiscal 2011 Plan
|
—
|
|
1.3
|
|
2.3
|
|
(1.3
|
)
|
(1.0
|
)
|
(100.0
|
)%
|
(43.5
|
)%
|
|||||||||||
33
Our restructuring expenses consisted primarily of severance and related benefit charges and facilities costs related to obligations under non-cancelable leases for facilities that we ceased to use. Restructuring charges for fiscal 2014 included a
$4.7 million
facilities charge primarily related to ceasing to use a portion of our Santa Clara headquarters building and a
$6.4 million
employee termination charge primarily related to our Fiscal 2014-2015 Plan. Restructuring charges for fiscal 2013 included a
$3.0 million
employee termination charge primarily related to our Fiscal 2013-2014 Plan and Fiscal 2011 Plan. Restructuring charges for fiscal 2012 included a
$0.9 million
employee termination charge and a
$1.4 million
facilities charge associated with the sublease and relocation of our Morrisville, North Carolina facility under our Fiscal 2011 Plan.
We have substantially completed our activities under the Fiscal 2013-2014 Plan and intend to complete a majority of the remaining restructuring activities under the Fiscal 2014-2015 Plan by the end of the second quarter of fiscal 2015.
Other Income, Interest Income and Interest Expense
|
|
Fiscal Year
|
||||||||||
|
(In millions)
|
2014
|
2013
|
2012
|
||||||||
|
Other income, net
|
$
|
—
|
|
$
|
0.7
|
|
$
|
—
|
|
||
|
Interest income
|
0.5
|
|
0.8
|
|
0.6
|
|
|||||
|
Interest expense
|
(0.4
|
)
|
(0.8
|
)
|
(1.3
|
)
|
|||||
Other income of
$0.7 million
for fiscal 2013 reflected a nonrecurring benefit related to a customer contract.
Interest income reflected interest earned on our cash equivalents which were comprised of money market funds and certificates of deposit.
Interest expense was primarily related to interest associated with borrowings, term loans and letters of credit under the SVB Credit Facility. In fiscal 2012, interest expense also included preference dividends on our $8.25 million redeemable preference shares. The $8.25 million preference shares were redeemed at their carrying value on January 30, 2012, funded by a two-year term loan of $8.25 million under our credit facility at a fixed interest rate of 5% per annum.
Income Taxes
|
|
Fiscal Year
|
$ Change
|
|||||||||||||||||
|
(In millions, except percentages)
|
2014
|
2013
|
2012
|
2014/2013
|
2013/2012
|
||||||||||||||
|
Income (loss) from continuing operations before income
taxes
|
$
|
(50.6
|
)
|
$
|
2.4
|
|
$
|
(14.0
|
)
|
$
|
(53.0
|
)
|
$
|
16.4
|
|
||||
|
Provision for income taxes
|
1.5
|
|
13.3
|
|
1.5
|
|
(11.8
|
)
|
11.8
|
|
|||||||||
|
As % of income (loss) from continuing operations
before income taxes
|
(3.0
|
)%
|
554.2
|
%
|
(10.7
|
)%
|
|
||||||||||||
The income tax expense from continuing operations for fiscal 2014 was
$1.5 million
. The difference between our income tax expense from continuing operations and income tax expense at the statutory rate of
35%
on our pre-tax loss of
$50.6 million
was primarily attributable to losses in tax jurisdictions in which we cannot recognize a tax benefit and increase in foreign withholding taxes.
The income tax expense from continuing operations for fiscal 2013 was
$13.3 million
. The difference between our income tax expense from continuing operations and income tax benefit at the statutory rate of
35%
on our pre-tax income of
$2.4 million
was primarily attributable to a
$11.7 million
increase in our reserves for uncertain tax positions, losses in tax jurisdictions in which we cannot recognize a tax benefit and increase in foreign withholding taxes. The increase in our unrecognized tax benefits was the result of additional information obtained during recent tax examinations in certain countries.
The income tax expense from continuing operations for fiscal 2012 was
$1.5 million
. The difference between our income tax expense from continuing operations and income tax benefit at the statutory rate of
35%
on our pre-tax loss of
$14.0 million
was primarily attributable to losses in tax jurisdictions in which we cannot recognize a tax benefit. The tax expense for fiscal 2012 of
$1.5 million
was primarily attributable to profitable foreign entities for which we have accrued income taxes.
34
We are subject to income taxes in the U.S. and numerous foreign jurisdictions. Significant judgment is required in determining our worldwide provision for income taxes and recording the related assets and liabilities. In the ordinary course of our business, there are many transactions and calculations where the ultimate tax determination is uncertain.
Income (loss) from Discontinued Operations
|
|
Fiscal Year
|
$ Change
|
|||||||||||||||||
|
(In millions)
|
2014
|
2013
|
2012
|
2014/2013
|
2013/2012
|
||||||||||||||
|
Income (loss) from discontinued operations, net of tax
|
$
|
0.9
|
|
$
|
(4.1
|
)
|
$
|
(8.6
|
)
|
$
|
5.0
|
|
$
|
4.5
|
|
||||
Our discontinued operations consist of the WiMAX business, which was sold to EION Networks, Inc. (“EION”) on September 2, 2011. We completed the business transition with EION in fiscal 2012. The income incurred in fiscal 2014 was primarily due to recovery of certain WiMAX customer receivables that was previously written down. The loss incurred in fiscal 2013 was primarily due to $4.2 million write-downs of certain WiMAX deferred cost of sales that were not transferred to EION and certain expenses we incurred to support a remaining customer obligation. The loss was partially offset by a $0.3 million write down of our payable to EION related to customer receivables and $0.1 million contingent payments we received from EION. The loss in fiscal 2012 included operating expenses we incurred to transition the business and a
$1.9 million
loss on disposition of the WiMAX business.
Liquidity, Capital Resources and Financial Strategies
Sources of Cash
As of
June 27, 2014
, our total cash and cash equivalents were $
48.8 million
. Approximately
$8.2 million
, or
16.8%
, was held by entities domiciled in the United States. The remaining balance of
$40.6 million
, or
83.2%
, was held by entities outside the United States. Of the amount of cash and cash equivalents held by our foreign subsidiaries at
June 27, 2014
,
$30.1 million
was held in jurisdictions where our undistributed earnings are indefinitely reinvested, and if repatriated, would be subject to U.S. taxes which are currently nominal.
As of
June 27, 2014
, our principal sources of liquidity consisted of the $
48.8 million
in cash and cash equivalents,
$19.7 million
of available credit under our $40.0 million credit facility with Silicon Valley Bank (“SVB”), and future collections of receivables from customers. We regularly require letters of credit from some customers and, from time to time, these letters of credit are discounted without recourse shortly after shipment occurs in order to meet immediate liquidity requirements and to reduce our credit and sovereign risk. Historically our primary sources of liquidity have been cash flows from operations, credit facilities and cash proceeds from sale of our equity securities. During fiscal 2014, our total cash and cash equivalents decreased by $
41.2 million
primarily due to
$29.3 million
of cash used in operating activities,
$9.4 million
of cash used for capital expenditures and
$2.8 million
repayments on our debt.
Cash used in operating activities was $
29.3 million
in fiscal 2014, primarily due to our net loss of
$51.2 million
adjusted by non-cash expense items of
$18.8 million
, decreases in reserve for uncertain tax positions and deferred taxes of
$14.9 million
and in accounts payable and accrued expenses of
$9.1 million
, and an increase in inventories of
$7.0 million
, partially offset by decreases in accounts receivables of
$8.2 million
, in unbilled costs of
$5.1 million
and in net prepaid income taxes of
$2.7 million
, and increases in customer advance payments and unearned income of
$14.6 million
and in accrued restructuring liabilities of
$2.5 million
. The decrease in the reserve for uncertain tax positions and deferred taxes was primarily due a
$13.2 million
tax payment made to a jurisdiction during the second quarter of fiscal 2014. The decreases in accounts payable and accrued expenses were primarily due to the timing of payments to our contract manufacturers and suppliers as well as the payout of employee bonuses. The decrease in unbilled costs was due to the timing of billing of projects. The increase in inventories was due to the timing of customer shipments. The decrease in accounts receivable was due to collections during fiscal 2014 exceeding billings. The decrease in net prepaid income taxes was due to a tax refund that we received from a tax jurisdiction during the period. The increase in customer advance payments and unearned income was due to the timing of revenue recognition on several large contracts. The increase in restructuring liabilities was primarily related to severance related expenses we accrued under the Fiscal 2014-2015 Plan and the facility exit cost liability we incurred associated with our Santa Clara headquarters building under the Fiscal 2013-2014 Plan. We used
$8.6 million
in cash during fiscal 2014 on expenses related to restructuring liabilities.
For fiscal 2015, we expect to spend approximately
$6.3 million
for capital expenditures, primarily on equipment for development and manufacturing of new products and to support customer managed services.
35
We believe that our existing cash and cash equivalents, the available line of credit under the SVB Credit Facility and future cash collections from customers will be sufficient to provide for our anticipated requirements for working capital and capital expenditures for the next 12 months and the foreseeable future. There can be no assurance, however, that our business will generate cash flow, we will be in compliance with the quarterly financial covenants contained in the SVB Credit Facility, or that anticipated operational improvements will be achieved. If we are not in compliance with the financial covenants, the availability of our credit facility is not certain or may be diminished. If we are unable to maintain cash balances or generate sufficient cash flow from operations to service our obligations that may arise in the future, we may be required to sell assets, reduce capital expenditures, or obtain financing. If we need to obtain additional financing, we cannot be assured that it will be available on favorable terms, or at all. Our ability to make scheduled principal payments or pay interest on or refinance any future indebtedness depends on our future performance and financial results, which, to a certain extent, are subject to general conditions in or affecting the microwave communications market and to general economic, political, financial, competitive, legislative and regulatory factors beyond our control.
Available Credit Facility, Borrowings and Repayment of Debt
On March 28, 2014, we entered into a Second Amended and Restated Loan Agreement with SVB (the “SVB Credit Facility"). This agreement amends and restates our existing First Amended and Restated Loan and Security Agreement, which was entered into on September 27, 2013 and amended on October 29, 2013, November 20, 2013 and February 10, 2014, respectively, providing for certain amendments to the maximum borrowing limit and financial covenants. On September 27, 2013, we repaid the remaining
$1.7 million
outstanding balance of the original
$8.3 million
two
-year term loan that we borrowed on January 30, 2012. As of
June 27, 2014
, our outstanding debt under the SVB Credit Facility consisted of the
$6.0 million
borrowings that we advanced under a previous SVB credit facility in fiscal 2011.
The SVB Credit Facility provides for a committed amount of up to
$40.0 million
, decreased from the
$50.0 million
credit limit under the first amended and restated credit facility, with a
$30.0 million
sublimit that can be borrowed by our Singapore subsidiary. Borrowings may be advanced under the SVB Credit Facility at the lesser of
$40.0 million
or a borrowing base equal to a specified percentage of the value of eligible accounts receivable and U.S. unbilled accounts of the Company, subject to certain reserves and eligibility criteria. The SVB Credit Facility can also be utilized to issue letters of credit. Principal, together with all accrued and unpaid interest, is due and payable on September 26, 2016. We may prepay loans under the SVB Credit Facility in whole or in part at any time without premium or penalty. As of
June 27, 2014
, available credit under the SVB Credit Facility was
$19.7 million
reflecting the calculated borrowing base of
$31.4 million
less existing borrowings of
$6.0 million
and outstanding letters of credit of
$5.7 million
.
Borrowings under the SVB Credit Facility carry an interest rate computed at the daily
prime rate
as published in the
Wall Street Journal
plus a spread of
0.50%
to
1.50%
, with such spread determined based on our adjusted quick ratio. If a minimum adjusted quick ratio requirement is satisfied, LIBOR advances are offered at
LIBOR
plus a spread of
2.75%
. Interest is due and payable in arrears monthly for prime rate loans and, for LIBOR rate loans, at the end of an interest period or at each
3
-month interval if the interest period is greater than three months. During fiscal 2014, the weighted average interest rate on our
$6.0 million
loan was
3.38%
. The previous
$8.3 million
two-year term loan bore a fixed interest rate of
5%
per annum.
The SVB Credit Facility contains quarterly financial covenants including minimum adjusted quick ratio and minimum profitability (EBITDA) requirements. In the event our adjusted quick ratio falls below a certain level, cash received in our accounts with SVB may be directly applied to reduce outstanding obligations under the credit facility. The SVB Credit Facility also imposes certain restrictions on our ability to dispose of assets, permit a change in control, merge or consolidate, make acquisitions, incur indebtedness, grant liens, make investments, make certain restricted payments and enter into transactions with affiliates under certain circumstances. Certain of our assets, including accounts receivable, inventory, and equipment, are pledged as collateral for the SVB Credit Facility. Upon an event of default, outstanding obligations would be immediately due and payable. Under certain circumstances, a default interest rate will apply on all obligations during the existence of an event of default at a per annum rate of interest equal to
2.00%
above the applicable interest rate.
As of
June 27, 2014
,
we were in compliance with the quarterly financial covenants contained in the SVB Credit Facility. However, as a result of the uncertainty on our ability to meet the financial covenants and the fact that the SVB Credit Facility contains subjective acceleration clauses that could be triggered by the lender,
the
$6.0 million
borrowing was classified as a current liability as of
June 27, 2014
.
36
Restructuring Payments
We have a liability for restructuring activities totaling
$5.2 million
as of
June 27, 2014
, of which
$2.8 million
is classified as current liability and expected to be paid out in cash over the next year. We expect to fund these future payments with available cash and cash flow provided by operations.
Contractual Obligations
As of
June 27, 2014
, cash payments due under our contractual obligations were estimated as follows:
|
|
Obligations Due by Fiscal Year
|
||||||||||||||||||||||
|
(In millions)
|
Total
|
2015
|
2016-2017
|
2018-2019
|
After 2019
|
Other
|
|||||||||||||||||
|
Borrowings under credit facility
|
$
|
6.0
|
|
$
|
6.0
|
|
$
|
—
|
|
$
|
—
|
|
$
|
—
|
|
$
|
—
|
|
|||||
|
Purchase obligations
(1)(3)
|
48.3
|
|
48.3
|
|
—
|
|
—
|
|
—
|
|
—
|
|
|||||||||||
|
Operating lease commitments
(3)
|
20.2
|
|
5.0
|
|
7.0
|
|
5.8
|
|
2.4
|
|
—
|
|
|||||||||||
|
Capital lease commitments
|
0.1
|
|
0.1
|
|
—
|
|
—
|
|
—
|
|
—
|
|
|||||||||||
|
Reserve for uncertain tax positions
(2)
|
1.0
|
|
—
|
|
—
|
|
—
|
|
—
|
|
1.0
|
|
|||||||||||
|
Total contractual cash obligations
|
$
|
75.6
|
|
$
|
59.4
|
|
$
|
7.0
|
|
$
|
5.8
|
|
$
|
2.4
|
|
$
|
1.0
|
|
|||||
___________________________
|
(1)
|
From time to time in the normal course of business we may enter into purchasing agreements with our suppliers that require us to accept delivery of, and remit full payment for, finished products that we have ordered, finished products that we requested be held as safety stock, and work in process started on our behalf in the event we cancel or terminate the purchasing agreement. Because these agreements do not specify fixed or minimum quantities, do not specify minimum or variable price provisions, and do not specify the approximate timing of the transaction, and we have no present intention to cancel or terminate any of these agreements, we currently do not believe that we have any future liability under these agreements.
|
|
(2)
|
Liabilities for uncertain tax positions of
$1.0 million
were included in long-term liabilities in the consolidated balance sheet. At this time, we are unable to make a reasonably reliable estimate of the timing of payments related to this amount due to uncertainties in the timing of tax audit outcomes.
|
|
(3)
|
These items are not recorded on our balance sheet.
|
Commercial Commitments
We have entered into commercial commitments in the normal course of business including surety bonds, standby letters of credit and other arrangements with financial institutions and insurers primarily relating to the guarantee of future performance on certain tenders and contracts to provide products and services to customers. As of
June 27, 2014
, we had commercial commitments on outstanding surety bonds and standby letters of credit as follows:
|
|
Expiration of Commitments by Fiscal Year
|
||||||||||||||||||
|
(In millions)
|
Total
|
2015
|
2016
|
2017
|
After 2017
|
||||||||||||||
|
Standby letters of credit used for:
|
|||||||||||||||||||
|
Payment guarantees
|
$
|
1.0
|
|
$
|
0.2
|
|
$
|
0.6
|
|
$
|
—
|
|
$
|
0.2
|
|
||||
|
Performance
|
5.2
|
|
4.1
|
|
1.0
|
|
0.1
|
|
—
|
|
|||||||||
|
6.2
|
|
4.3
|
|
1.6
|
|
0.1
|
|
0.2
|
|
||||||||||
|
Surety bonds used for:
|
|||||||||||||||||||
|
Bids
|
0.1
|
|
0.1
|
|
—
|
|
—
|
|
—
|
|
|||||||||
|
Tax and payment guarantees
|
4.8
|
|
4.8
|
|
—
|
|
—
|
|
—
|
|
|||||||||
|
Performance
|
34.7
|
|
34.7
|
|
—
|
|
—
|
|
—
|
|
|||||||||
|
39.6
|
|
39.6
|
|
—
|
|
—
|
|
—
|
|
||||||||||
|
Total commercial commitments
|
$
|
45.8
|
|
$
|
43.9
|
|
$
|
1.6
|
|
$
|
0.1
|
|
$
|
0.2
|
|
||||
37
As we have not historically had to pay out on any of our performance guarantees, the outstanding commercial commitments have not been recorded in our consolidated balance sheet.
Off-Balance Sheet Arrangements
In accordance with the definition under SEC rules (Item 303(a) (4) (ii) of Regulation S-K), any of the following qualify as off-balance sheet arrangements:
|
•
|
any obligation under certain guarantee contracts;
|
|
•
|
a retained or contingent interest in assets transferred to an unconsolidated entity or similar entity or similar arrangement that serves as credit, liquidity or market risk support to that entity for such assets;
|
|
•
|
any obligation, including a contingent obligation, under certain derivative instruments; and
|
|
•
|
any obligation, including a contingent obligation, under a material variable interest held by the registrant in an unconsolidated entity that provides financing, liquidity, market risk or credit risk support to the registrant, or engages in leasing, hedging or research and development services with the registrant.
|
Currently we are not participating in transactions that generate relationships with unconsolidated entities or financial partnerships, including variable interest entities, and we do not have any material retained or contingent interest in assets as defined above. As of
June 27, 2014
, we did not have material financial guarantees or other contractual commitments that are reasonably likely to adversely affect liquidity. In addition, we are not currently a party to any related party transactions that materially affect our results of operations, cash flows or financial condition.
Due to the downsizing of certain of our operations pursuant to divestitures, restructuring plans or otherwise, some properties leased by us have been sublet to third parties. In the event any of these third parties vacate any of these premises, we would be legally obligated under master lease arrangements. We believe that the financial risk of default by such sublessors is not likely to be individually or in the aggregate material to our financial position, results of operations or cash flows.
Financial Risk Management
In the normal course of doing business, we are exposed to the risks associated with foreign currency exchange rates and changes in interest rates. We employ established policies and procedures governing the use of financial instruments to manage our exposure to such risks.
Exchange Rate Risk
We conduct business globally in numerous currencies and are therefore exposed to foreign currency risks. We use derivative instruments to reduce the volatility of earnings and cash flows associated with changes in foreign currency exchange rates. We do not hold or issue derivatives for trading purposes or make speculative investments in foreign currencies.
We use foreign exchange forward contracts to hedge forecasted foreign currency transactions relating to forecasted sales and purchase transactions. These derivatives are designated as cash flow hedges and are carried at fair value. The effective portion of the gain or loss is initially reported as a component of accumulated other comprehensive income (loss), and upon occurrence of the forecasted transaction, is subsequently reclassified into the income or expense line item to which the hedged transaction relates. We also enter into foreign exchange forward contracts to mitigate the change in fair value of specific non-functional currency assets and liabilities on the balance sheet. All balance sheet hedges are marked to market through earnings every period. Changes in the fair value of these derivatives are largely offset by re-measurement of the underlying assets and liabilities.
As of
June 27, 2014
, we had foreign currency forward contracts outstanding with a total notional amount of
$21.1 million
consisting of
11
different currencies. The following is a summary of the gross notional amount of our outstanding contracts grouped by the underlying foreign currency as of
June 27, 2014
:
38
|
Currency
|
Notional Contract Amount
(Local Currency)
|
Notional
Contract
Amount
(USD)
|
|||||
|
|
(In millions)
|
||||||
|
Australian dollar
|
0.4
|
|
$
|
0.3
|
|
||
|
Canadian dollar
|
1.6
|
|
1.5
|
|
|||
|
Euro
|
6.8
|
|
9.2
|
|
|||
|
Indian rupee
|
204.8
|
|
3.4
|
|
|||
|
Philippine peso
|
127.3
|
|
2.9
|
|
|||
|
Polish zloty
|
3.4
|
|
1.1
|
|
|||
|
Republic of South Africa rand
|
14
|
|
1.3
|
|
|||
|
Other currencies
|
N/A
|
|
1.4
|
|
|||
|
Total of all currency forward contracts
|
$
|
21.1
|
|
||||
Net foreign exchange loss recorded in our consolidated statements of operations during fiscal
2014, 2013 and 2012
totaled
$0.8 million
,
$1.5 million
and
$1.5 million
, respectively. A 10% adverse change in currency exchange rates for our foreign currency derivatives held as of
June 27, 2014
would have an impact of approximately
$2.1 million
on the fair value of such instruments. This quantification of exposure to the market risk associated with foreign exchange financial instruments does not take into account the offsetting impact of changes in the fair value of our foreign denominated assets, liabilities and firm commitments.
Certain of our international business was transacted in non-U.S. dollar currency. As discussed above, we utilize foreign currency hedging instruments to minimize the currency risk of international transactions. The impact of translating the assets and liabilities of foreign operations to U.S. dollars is included as a component of stockholders’ equity. As of
June 27, 2014
and
June 28, 2013
, the cumulative translation adjustment decreased our stockholders’ equity by $
2.9 million
and $
3.4 million
, respectively.
Interest Rate Risk
Our exposure to market risk for changes in interest rates relates primarily to our cash equivalents and borrowings under our credit facility.
Exposure on Cash Equivalents
We had $
48.8 million
in total cash and cash equivalents as of
June 27, 2014
. Cash equivalents totaled
$13.7 million
as of
June 27, 2014
and were comprised of money market funds and certificates of deposit. Cash equivalents have been recorded at fair value on our balance sheet.
We do not use derivative financial instruments in our short-term investment portfolio. We invest in high-credit quality issues and, by policy, limit the amount of credit exposure to any one issuer and country. The portfolio includes only marketable securities with active secondary or resale markets to ensure portfolio liquidity. The portfolio is also diversified by maturity to ensure that funds are readily available as needed to meet our liquidity needs. This policy reduces the potential need to sell securities in order to meet liquidity needs and therefore the potential effect of changing market rates on the value of securities sold.
The primary objective of our short-term investment activities is to preserve principal while maximizing yields, without significantly increasing risk. Our cash equivalents earn interest at fixed rates; therefore, changes in interest rates will not generate a gain or loss on these investments unless they are sold prior to maturity. Actual gains and losses due to the sale of our investments prior to maturity have been immaterial. The weighted average days to maturity for cash equivalents held as of
June 27, 2014
was
three
days, and these investments had an average yield of
0.17%
per annum. A 10% change in interest rates on our cash and cash equivalents is not expected to have a material impact on our financial position, results of operations or cash flows.
Exposure on Borrowings
During fiscal
2014
, we had $6.0 million of demand borrowings outstanding under our credit facility that incurred interest at the prime rate or prime rate plus a spread of
0.50%
to
1.50%
. We also recorded interest on our
$8.3 million
39
borrowing drawn on January 30, 2012 and paid off on September 27, 2013 at the fixed rate of
5%
per annum. During fiscal
2014
, our weighted average interest rate was
3.5%
and we recorded total interest expense of
$0.2 million
on these borrowings.
A 10% change in interest rates on the current borrowings or on future borrowings is not expected to have a material impact on our financial position, results of operations or cash flows since interest on our borrowings is not material to our overall financial position.
Critical Accounting Estimates
Our consolidated financial statements are prepared in accordance with U.S. GAAP. These accounting principles require us to make certain estimates, judgments and assumptions. We believe that the estimates, judgments and assumptions upon which we rely are reasonable based upon information available to us.
These estimates, judgments and assumptions can affect the reported amounts of assets and liabilities as of the date of the consolidated financial statements as well as the reported amounts of revenues and expenses during the periods presented. To the extent there are material differences between these estimates, judgments or assumptions and actual results, our financial statements will be affected.
The accounting policies that reflect our more significant estimates, judgments and assumptions and which we believe are the most critical to aid in fully understanding and evaluating our reported financial results include the following:
|
•
|
revenue recognition;
|
|
•
|
inventory valuation and provision for excess and obsolete inventory losses;
|
|
•
|
impairment of long-lived assets; and
|
|
•
|
income taxes and tax valuation allowances.
|
In some cases, the accounting treatment of a particular transaction is specifically dictated by U.S. GAAP and does not require management’s judgment in its application. There are also areas in which management’s judgment in selecting among available alternatives would not produce a materially different result. Our senior management has reviewed these critical accounting policies and related disclosures with the Audit Committee of the Board of Directors.
The following is not intended to be a comprehensive list of all of our accounting policies or estimates. Our significant accounting policies are more fully described in “Note 1. The Company and Summary of Significant Accounting Policies” in the notes to consolidated financial statements. In preparing our financial statements and accounting for the underlying transactions and balances, we apply those accounting policies. We consider the estimates discussed below as critical to an understanding of our financial statements because their application places the most significant demands on our judgment, with financial reporting results relying on estimates about the effect of matters that are inherently uncertain.
Besides estimates that meet the “critical” accounting estimate criteria, we make many other accounting estimates in preparing our financial statements and related disclosures. All estimates, whether or not deemed critical, affect reported amounts of assets, liabilities, revenue and expenses as well as disclosures of contingent assets and liabilities. Estimates are based on experience and other information available prior to the issuance of the financial statements. Materially different results can occur as circumstances change and additional information becomes known, including for estimates that we do not deem “critical.”
Revenue Recognition
We generate substantially all of our revenue from the sales or licensing of our microwave radio and wireless access systems, network management software, and professional services including installation and commissioning and training. Principal customers for our products and services include domestic and international wireless/mobile service providers, original equipment manufacturers, distributors, system integrators, as well as private network users such as public safety agencies, government institutions, and utility, pipeline, railroad and other industrial enterprises that operate broadband wireless networks. Our customers generally purchase a combination of our products and services as part of a multiple element arrangement. Our assessment of which revenue recognition guidance is appropriate to account for each element in an arrangement can involve significant judgment. This assessment has a significant impact on the amount and timing of revenue recognition.
40
Revenue is recognized when all of the following criteria have been met:
|
•
|
Persuasive evidence of an arrangement exists. Contracts and customer purchase orders are generally used to determine the existence of an arrangement.
|
|
•
|
Delivery has occurred. Shipping documents and customer acceptance, when applicable, are used to verify delivery.
|
|
•
|
The fee is fixed or determinable. We assess whether the fee is fixed or determinable based on the payment terms associated with the transaction and whether the sales price is subject to refund or adjustment.
|
|
•
|
Collectability is reasonably assured. We assess collectability based primarily on the creditworthiness of the customer as determined by credit checks and analysis, as well as the customer’s payment history.
|
We often enter into multiple contractual agreements with the same customer. Such agreements are reviewed to determine whether they should be evaluated as one arrangement. If an arrangement, other than a long-term contract, requires the delivery or performance of multiple deliverables or elements, we determine whether the individual elements represent “separate units of accounting”. The determination as to whether multiple contractual agreements should be evaluated as one arrangement and the identification of units of accounting in an arrangement requires significant judgment and impacts the amount of product and service revenue recognized in a given period.
In accordance with ASC 605-25,
Revenue Recognition
—
Multiple-Element Arrangements,
based on the terms and conditions of the product arrangements, we believe that our products and services can be accounted for separately as our products and services have value to our customers on a stand-alone basis. Accordingly, amounts related to services not yet performed at the time of product shipment are deferred based on their relative selling price and recognized as revenue as such services are performed. The relative selling price of any undelivered products is also deferred at the time of shipment and recognized as revenue when these products are delivered. There is generally no customer right of return in our sales agreements. The sequence for typical multiple-element arrangements is as follows: we deliver our products, perform installation services and then provide post-contract support services.
Vendor-specific objective evidence (“VSOE”) of fair value is based on the price charged when the element is sold separately. For multiple element arrangements, if VSOE cannot be established, we establish, where available, the selling price based on third-party evidence (“TPE”). TPE requires judgment and is determined based on evidence of competitor pricing for similar deliverables when sold separately. When we cannot determine VSOE or TPE, which is typically the case, we use the estimated selling price (“ESP”) in our allocation of arrangement consideration. The objective of ESP is to determine the price at which we would typically transact a stand-alone sale of the product or service. In determining ESP, we apply significant judgment as we weigh a variety of factors including our pricing policies, internal costs and gross margin objectives, method of distribution, information gathered from experience in customer negotiations, market research and information, recent technological trends, competitive landscape and geographies. The determination of ESP is approved by our management taking into consideration our pricing strategy. We regularly review VSOE, TPE and ESP and maintain internal controls over the establishment and updates of these estimates. We do not expect a material impact in future periods from changes in VSOE, TPE or ESP.
Revenues related to long-term contracts for customized network solutions are recognized using the percentage-of-completion method. In using the percentage-of-completion method, we generally apply the cost-to-cost method of accounting where sales and profits are recorded based on the ratio of costs incurred to estimated total costs at completion. Contracts are combined when specific aggregation criteria are met including when the contracts are in substance an arrangement to perform a single project with a customer; the contracts are negotiated as a package in the same economic environment with an overall profit objective; the contracts require interrelated activities with common costs that cannot be separately identified with, or reasonably allocated to the elements, phases or units of output and the contracts are performed concurrently or in a continuous sequence under the same project management at the same location or at different locations in the same general vicinity. Recognition of profit on long-term contracts requires estimates of the total contract value, the total cost at completion and the measurement of progress towards completion. Significant judgment is required when estimating total contract costs and progress to completion on the arrangements as well as whether a loss is expected to be incurred on the contract. Amounts representing contract change orders, claims or other items are included in sales only when they can be reliably estimated and realization is probable. When adjustments in contract value or estimated costs are determined, any changes from prior estimates are reflected in earnings in the current period. Anticipated losses on contracts or programs in progress are charged to earnings when identified.
41
Inventory Valuation and Provisions for Excess and Obsolete Losses
Our inventories have been valued at the lower of cost or market. We balance the need to maintain prudent inventory levels to ensure competitive delivery performance with the risk of excess or obsolete inventory due to changing technology and customer requirements, and new product introductions. Beginning in the first quarter of fiscal 2011, the manufacturing of our products was handled primarily by contract manufacturers. Our contract manufacturers procure components and manufacture our products based on our forecast of product demand. We regularly review inventory quantities on hand and record a provision for excess and obsolete inventory based primarily on our estimated forecast of product demand, the stage of the product life cycle, anticipated end of product life and production requirements. Several factors may influence the sale and use of our inventories, including decisions to exit a product line, technological change, new product development and competing product offerings. These factors could result in a change in the amount of obsolete inventory quantities on hand. Additionally, our estimates of future product demand may prove to be inaccurate, in which case the provision required for excess and obsolete inventory may be overstated or understated. In the future, if we determine that our inventory is overvalued, we would be required to recognize such costs in cost of product sales and services in our Statement of Operations at the time of such determination. In the case of goods which have been written down below cost at the close of a fiscal quarter, such reduced amount is considered the new lower cost basis for subsequent accounting purposes, and subsequent changes in facts and circumstances do not result in the restoration or increase in that newly established cost basis. We did not make any material changes in the valuation methodology during the past three fiscal years.
Our customer service inventories are stated at the lower of cost or market. We carry service parts because we generally provide product warranty for 12 to 36 months and earn revenue by providing enhanced and extended warranty and repair service during and beyond this warranty period. Customer service inventories consist of both component parts, which are primarily used to repair defective units, and finished units, which are provided for customer use permanently or on a temporary basis while the defective unit is being repaired. We record adjustments to reduce the carrying value of customer service inventories to their net realizable value. Factors influencing these adjustments include product life cycles, end of service life plans and volume of enhanced or extended warranty service contracts. Estimates of net realizable value involve significant estimates and judgments about the future, and revisions would be required if these factors differ from our estimates.
Impairment of Long-Lived Assets
We evaluate long-lived assets for impairment whenever events or changes in circumstances indicate that the carrying value of an asset may not be recoverable. Impairment is considered to exist if the total estimated future cash flows on an undiscounted basis are less than the carrying amount of the assets. If impairment exists, the impairment loss is measured and recorded based on discounted estimated future cash flows. In estimating future cash flows, assets are grouped at the lowest levels for which there are identifiable cash flows that are largely independent of cash flows from other asset groups.
Our estimate of future cash flows is based upon, among other things, certain assumptions about expected future operating performance, growth rates and other factors. The actual cash flows realized from these assets may vary significantly from our estimates due to increased competition, changes in technology, fluctuations in demand, consolidation of our customers, reductions in average selling prices and other factors. Assumptions underlying future cash flow estimates are therefore subject to significant risks and uncertainties.
Income Taxes and Tax Valuation Allowances
We record the estimated future tax effects of temporary differences between the tax basis of assets and liabilities of amounts reported in our consolidated balance sheet, as well as operating loss and tax credit carryforwards. Significant judgment is required in evaluating our uncertain tax positions and determining our provision for income taxes. Although we believe our reserves are reasonable, no assurance can be given that the final tax outcome of these matters will not be different from that which is reflected in our historical income tax provisions and accruals. We adjust these reserves in light of changing facts and circumstances, such as the opening and closing of a tax audit or the refinement of an estimate. To the extent that the final tax outcome of these matters is different than the amounts recorded, such differences may result in an increase or decrease to our tax provision in a subsequent period in which such determination is made.
We record deferred taxes by applying enacted statutory tax rates to the respective jurisdictions and follow specific and detailed guidelines in each tax jurisdiction regarding the recoverability of any tax assets recorded on the balance sheet and provide necessary valuation allowances as required. Future realization of deferred tax assets ultimately
42
depends on meeting certain criteria in ASC 740,
Income Taxes
. One of the major criteria is the existence of sufficient taxable income of the appropriate character (for example, ordinary income or capital gain) within the carryback or carryforward periods available under the tax law. We regularly review our deferred tax assets for recoverability based on historical taxable income, projected future taxable income, the expected timing of the reversals of existing temporary differences and tax planning strategies. Our judgments regarding future profitability may change due to many factors, including future market conditions and our ability to successfully execute our business plans and/or tax planning strategies. Should there be a change in our ability to recover our deferred tax assets, our tax provision would increase or decrease in the period in which the assessment is changed.
The accounting estimates related to the liability for uncertain tax position require us to make judgments regarding the sustainability of each uncertain tax position based on its technical merits. It is inherently difficult and subjective to estimate our reserves for the uncertain tax positions. Although we believe our estimates are reasonable, no assurance can be given that the final tax outcome of these matters will be same as these estimates. These estimates are updated quarterly based on factors such as change in facts or circumstances, changes in tax law, new audit activity, and effectively settled issues.
Impact of Recently Issued Accounting Pronouncements
See Note 1 of the accompanying consolidated financial statements for a full description of recently issued accounting pronouncements, including the respective expected dates of adoption and effects on our consolidated financial position and results of operations.
Item 7A.
Quantitative and Qualitative Disclosures About Market Risk.
In the normal course of doing business, we are exposed to the risks associated with foreign currency exchange rates and changes in interest rates. We employ established policies and procedures governing the use of financial instruments to manage our exposure to such risks. For a discussion of such policies and procedures and the related risks, see “Financial Risk Management” in “Item 7. Management’s Discussion and Analysis of Financial Condition and Results of Operations,” which is incorporated by reference into this Item 7A.
43
Item 8.
Financial Statements and Supplementary Data
Index to Financial Statements
|
|
|
|
|
Page
|
44
Report of Independent Registered Public Accounting Firm
The Board of Directors and Stockholders
Aviat Networks, Inc.:
We have audited the accompanying consolidated balance sheets of Aviat Networks, Inc. and subsidiaries ("the Company") as of
June 27, 2014
and
June 28, 2013
, and the related consolidated statements of operations, comprehensive loss, stockholders' equity, and cash flows for each of the years in the two-year period ended
June 27, 2014
. In connection with our audits of the consolidated financial statements, we also have audited the financial statement schedule of valuation and qualifying accounts and reserves. These consolidated financial statements and consolidated financial statement schedule are the responsibility of the Company’s management. Our responsibility is to express an opinion on these consolidated financial statements and consolidated financial statement schedules based on our audits.
We conducted our audits in accordance with the standards of the Public Company Accounting Oversight Board (United States). Those standards require that we plan and perform the audits to obtain reasonable assurance about whether the financial statements are free of material misstatement. An audit includes examining, on a test basis, evidence supporting the amounts and disclosures in the financial statements. An audit also includes assessing the accounting principles used and significant estimates made by management, as well as evaluating the overall financial statement presentation. We believe that our audits provide a reasonable basis for our opinion.
In our opinion, the consolidated financial statements referred to above present fairly, in all material respects, the financial position of Aviat Networks, Inc. and subsidiaries as of
June 27, 2014
and
June 28, 2013
, and the results of their operations and their cash flows for each of the years in the two-year period ended
June 27, 2014
, in conformity with U.S. generally accepted accounting principles. Also in our opinion, the related financial statement schedule, when considered in relation to the basic consolidated financial statements taken as a whole, presents fairly, in all material respects, the information set forth therein.
We also have audited, in accordance with the standards of the Public Company Accounting Oversight Board (United States), Aviat Networks, Inc.’s internal control over financial reporting as of
June 27, 2014
, based on criteria established in
Internal Control - Integrated Framework (1992)
issued by the Committee of Sponsoring Organizations of the Treadway Commission (COSO), and our report dated
December 19, 2014
expressed an adverse opinion on the effectiveness of the Company’s internal control over financial reporting
.
|
/s/ KPMG LLP
|
||
|
Santa Clara, CA
December 19, 2014
|
||
45
Report of Independent Registered Public Accounting Firm
The Board of Directors and Stockholders
Aviat Networks, Inc.:
We have audited Aviat Networks, Inc. and subsidiaries’ (“the Company”) internal control over financial reporting as of
June 27, 2014
, based on criteria established in
Internal Control ‑ Integrated Framework (1992)
issued by the Committee of Sponsoring Organizations of the Treadway Commission (COSO). The Company's management is responsible for maintaining effective internal control over financial reporting and for its assessment of the effectiveness of internal control over financial reporting, included in the accompanying Management’s Report on Internal Control over Financial Reporting. Our responsibility is to express an opinion on the Company's internal control over financial reporting based on our audit.
We conducted our audit in accordance with the standards of the Public Company Accounting Oversight Board (United States). Those standards require that we plan and perform the audit to obtain reasonable assurance about whether effective internal control over financial reporting was maintained in all material respects. Our audit included obtaining an understanding of internal control over financial reporting, assessing the risk that a material weakness exists, and testing and evaluating the design and operating effectiveness of internal control based on the assessed risk. Our audit also included performing such other procedures as we considered necessary in the circumstances. We believe that our audit provides a reasonable basis for our opinion.
A company's internal control over financial reporting is a process designed to provide reasonable assurance regarding the reliability of financial reporting and the preparation of financial statements for external purposes in accordance with generally accepted accounting principles. A company’s internal control over financial reporting includes those policies and procedures that (1) pertain to the maintenance of records that, in reasonable detail, accurately and fairly reflect the transactions and dispositions of the assets of the company; (2) provide reasonable assurance that transactions are recorded as necessary to permit preparation of financial statements in accordance with generally accepted accounting principles, and that receipts and expenditures of the company are being made only in accordance with authorizations of management and directors of the company; and (3) provide reasonable assurance regarding prevention or timely detection of unauthorized acquisition, use, or disposition of the company’s assets that could have a material effect on the financial statements.
Because of its inherent limitations, internal control over financial reporting may not prevent or detect misstatements. Also, projections of any evaluation of effectiveness to future periods are subject to the risk that controls may become inadequate because of changes in conditions, or that the degree of compliance with the policies or procedures may deteriorate.
A material weakness is a deficiency, or a combination of deficiencies, in internal control over financial reporting, such that there is a reasonable possibility that a material misstatement of the company’s annual or interim financial statements will not be prevented or detected on a timely basis. Material weaknesses related to the Company’s control environment, risk assessment processes, information and communication, monitoring activities, as well as control activities specific to manual journal entries, account reconciliations, and revenue recognition related to percentage-of-completion contracts, have been identified and included in management’s assessment in Item 9A(a). We also have audited, in accordance with the standards of the Public Company Accounting Oversight Board (United States), the consolidated balance sheet and consolidated statements of operations, comprehensive loss, stockholders’ equity, cash flows, and financial statement schedule of the Company. These material weaknesses were considered in determining the nature, timing, and extent of audit tests applied in our audit of the 2014 consolidated financial statements, and this report does not affect our audit opinion dated
December 19, 2014
, which expressed an unqualified opinion on those consolidated financial statements.
In our opinion, because of the effect of the aforementioned material weaknesses on the achievement of the objectives of the control criteria, the Company has not maintained effective internal control over financial reporting as of
June 27, 2014
, based on criteria established in
Internal Control - Integrated Framework
(1992)
issued by the Committee of Sponsoring Organizations of the Treadway Commission (COSO).
.
46
We do not express an opinion or any other form of assurance on management’s statements referring to corrective actions taken after
June 27, 2014
, relative to the aforementioned material weaknesses in internal control over financial reporting.
|
/s/ KPMG LLP
|
||
|
Santa Clara, CA
December 19, 2014 |
||
47
Report of Independent Registered Public Accounting Firm
The Board of Directors and Stockholders of Aviat Networks, Inc.
We have audited the accompanying consolidated statements of operations, comprehensive loss
,
stockholders' equity and cash flows of Aviat Networks, Inc. for the year ended June 29, 2012. Our audit also included the financial statement schedule listed in the Index at Item 15(a)(2). These financial statements and schedule are the responsibility of the Company's management. Our responsibility is to express an opinion on these financial statements and schedule based on our audit.
We conducted our audit in accordance with the standards of the Public Company Accounting Oversight Board (United States). Those standards require that we plan and perform the audit to obtain reasonable assurance about whether the financial statements are free of material misstatement. An audit includes examining, on a test basis, evidence supporting the amounts and disclosures in the financial statements. An audit also includes assessing the accounting principles used and significant estimates made by management, as well as evaluating the overall financial statement presentation. We believe that our audit provides a reasonable basis for our opinion.
In our opinion, the financial statements referred to above present fairly, in all material respects, the consolidated results of the operations and cash flows of Aviat Networks, Inc. for the year ended June 29, 2012, in conformity with U.S. generally accepted accounting principles. Also, in our opinion, the related financial statement schedule, when considered in relation to the basic financial statements taken as a whole, presents fairly in all material respects the information set forth therein.
|
/s/ Ernst & Young LLP
|
||
|
Redwood City, California
September 4, 2012 |
||
48
AVIAT NETWORKS, INC.
|
|
Fiscal Year Ended
|
||||||||||
|
(In millions, except per share amounts)
|
June 27,
2014 |
June 28,
2013 |
June 29,
2012 |
||||||||
|
Revenues:
|
|||||||||||
|
Revenue from product sales
|
$
|
222.6
|
|
$
|
336.7
|
|
$
|
335.5
|
|
||
|
Revenue from services
|
123.4
|
|
134.6
|
|
108.5
|
|
|||||
|
Total revenues
|
346.0
|
|
471.3
|
|
444.0
|
|
|||||
|
Cost of revenues:
|
|||||||||||
|
Cost of product sales
|
172.7
|
|
239.6
|
|
233.5
|
|
|||||
|
Cost of services
|
88.2
|
|
91.6
|
|
78.8
|
|
|||||
|
Total cost of revenues
|
260.9
|
|
331.2
|
|
312.3
|
|
|||||
|
Gross margin
|
85.1
|
|
140.1
|
|
131.7
|
|
|||||
|
Operating expenses:
|
|||||||||||
|
Research and development expenses
|
35.5
|
|
39.4
|
|
36.0
|
|
|||||
|
Selling and administrative expenses
|
88.8
|
|
95.5
|
|
99.5
|
|
|||||
|
Amortization of identifiable intangible assets
|
0.4
|
|
0.4
|
|
1.6
|
|
|||||
|
Goodwill impairment charges
|
—
|
|
—
|
|
5.6
|
|
|||||
|
Restructuring charges
|
11.1
|
|
3.1
|
|
2.3
|
|
|||||
|
Total operating expenses
|
135.8
|
|
138.4
|
|
145.0
|
|
|||||
|
Operating income (loss)
|
(50.7
|
)
|
1.7
|
|
(13.3
|
)
|
|||||
|
Other income, net
|
—
|
|
0.7
|
|
—
|
|
|||||
|
Interest income
|
0.5
|
|
0.8
|
|
0.6
|
|
|||||
|
Interest expense
|
(0.4
|
)
|
(0.8
|
)
|
(1.3
|
)
|
|||||
|
Income (loss) from continuing operations before income taxes
|
(50.6
|
)
|
2.4
|
|
(14.0
|
)
|
|||||
|
Provision for income taxes
|
1.5
|
|
13.3
|
|
1.5
|
|
|||||
|
Loss from continuing operations
|
(52.1
|
)
|
(10.9
|
)
|
(15.5
|
)
|
|||||
|
Income (loss) from discontinued operations, net of tax
|
0.9
|
|
(4.1
|
)
|
(8.6
|
)
|
|||||
|
Net loss
|
$
|
(51.2
|
)
|
$
|
(15.0
|
)
|
$
|
(24.1
|
)
|
||
|
Basic and diluted loss per common share:
|
|||||||||||
|
Continuing operations
|
$
|
(0.85
|
)
|
$
|
(0.18
|
)
|
$
|
(0.26
|
)
|
||
|
Discontinued operations
|
$
|
0.01
|
|
$
|
(0.07
|
)
|
$
|
(0.15
|
)
|
||
|
Net loss
|
$
|
(0.83
|
)
|
$
|
(0.25
|
)
|
$
|
(0.41
|
)
|
||
|
Weighted average shares outstanding, basic and diluted
|
61.6
|
|
60.0
|
|
59.0
|
|
|||||
See accompanying notes to consolidated financial statements
49
AVIAT NETWORKS, INC.
CONSOLIDATED STATEMENTS OF COMPREHENSIVE LOSS
|
Fiscal Year Ended
|
|||||||||||
|
(In millions)
|
June 27,
2014 |
June 28,
2013 |
June 29,
2012 |
||||||||
|
Net loss
|
$
|
(51.2
|
)
|
$
|
(15.0
|
)
|
$
|
(24.1
|
)
|
||
|
Other comprehensive income (loss):
|
|||||||||||
|
Cash flow hedges:
|
|||||||||||
|
Change in unrealized gain (loss) on cash flow hedges
|
(0.3
|
)
|
0.1
|
|
0.9
|
|
|||||
|
Reclassification adjustment for realized net gain (loss) on cash flow
hedges included in net loss
|
0.2
|
|
—
|
|
(0.8
|
)
|
|||||
|
Net change in unrealized gain (loss) on hedging activities
|
(0.1
|
)
|
0.1
|
|
0.1
|
|
|||||
|
Foreign currency translation gain (loss)
|
0.5
|
|
0.6
|
|
(1.4
|
)
|
|||||
|
Other comprehensive income (loss)
|
0.4
|
|
0.7
|
|
(1.3
|
)
|
|||||
|
Comprehensive loss
|
$
|
(50.8
|
)
|
$
|
(14.3
|
)
|
$
|
(25.4
|
)
|
||
See accompanying notes to consolidated financial statements
50
AVIAT NETWORKS, INC.
|
(In millions, except share and par value amounts)
|
June 27, 2014
|
June 28, 2013
|
|||||
|
ASSETS
|
|||||||
|
Current Assets
|
|||||||
|
Cash and cash equivalents
|
$
|
48.8
|
|
$
|
90.0
|
|
|
|
Receivables, net
|
77.2
|
|
86.3
|
|
|||
|
Unbilled costs
|
23.8
|
|
28.9
|
|
|||
|
Inventories
|
38.1
|
|
35.0
|
|
|||
|
Customer service inventories
|
11.4
|
|
16.2
|
|
|||
|
Deferred income taxes
|
1.5
|
|
0.9
|
|
|||
|
Other current assets
|
17.4
|
|
17.0
|
|
|||
|
Total current assets
|
218.2
|
|
274.3
|
|
|||
|
Long-Term Assets
|
|||||||
|
Property, plant and equipment, net
|
29.3
|
|
28.8
|
|
|||
|
Identifiable intangible assets, net
|
0.4
|
|
0.8
|
|
|||
|
Deferred income taxes
|
3.4
|
|
1.4
|
|
|||
|
Other assets
|
1.9
|
|
0.5
|
|
|||
|
Total long-term assets
|
35.0
|
|
31.5
|
|
|||
|
Total Assets
|
$
|
253.2
|
|
$
|
305.8
|
|
|
|
LIABILITIES AND STOCKHOLDERS’ EQUITY
|
|||||||
|
Current Liabilities
|
|||||||
|
Short-term debt
|
6.0
|
|
8.8
|
|
|||
|
Accounts payable
|
46.1
|
|
50.6
|
|
|||
|
Accrued compensation and benefits
|
10.1
|
|
12.4
|
|
|||
|
Other accrued expenses
|
32.4
|
|
33.7
|
|
|||
|
Advance payments and unearned income
|
33.3
|
|
18.6
|
|
|||
|
Reserve for uncertain tax positions
|
—
|
|
3.6
|
|
|||
|
Deferred income taxes
|
0.2
|
|
1.1
|
|
|||
|
Restructuring liabilities
|
2.8
|
|
2.3
|
|
|||
|
Total current liabilities
|
130.9
|
|
131.1
|
|
|||
|
Long-Term Liabilities
|
|||||||
|
Unearned income
|
8.5
|
|
8.5
|
|
|||
|
Other long-term liabilities
|
5.0
|
|
2.3
|
|
|||
|
Reserve for uncertain tax positions
|
1.0
|
|
12.3
|
|
|||
|
Deferred income taxes
|
5.2
|
|
1.7
|
|
|||
|
Total Liabilities
|
150.6
|
|
155.9
|
|
|||
|
Commitments and Contingencies (Note 13)
|
|
|
|||||
|
Stockholders’ Equity
|
|||||||
|
Preferred stock, $0.01 par value; 50,000,000 shares authorized; none issued
|
—
|
|
—
|
|
|||
|
Common stock, $0.01 par value; 300,000,000 shares authorized; issued and outstanding
62,218,226 shares as of June 27, 2014 and 61,252,494 shares as of June 28, 2013
|
0.6
|
|
0.6
|
|
|||
|
Additional paid-in-capital
|
807.0
|
|
803.5
|
|
|||
|
Accumulated deficit
|
(702.1
|
)
|
(650.9
|
)
|
|||
|
Accumulated other comprehensive loss
|
(2.9
|
)
|
(3.3
|
)
|
|||
|
Total Stockholders’ Equity
|
102.6
|
|
149.9
|
|
|||
|
Total Liabilities and Stockholders’ Equity
|
$
|
253.2
|
|
$
|
305.8
|
|
|
See accompanying notes to consolidated financial statements
51
AVIAT NETWORKS, INC.
|
|
Fiscal Year Ended
|
||||||||||
|
(In millions)
|
June 27,
2014 |
June 28,
2013 |
June 29,
2012 |
||||||||
|
Operating Activities
|
|||||||||||
|
Net loss
|
$
|
(51.2
|
)
|
$
|
(15.0
|
)
|
$
|
(24.1
|
)
|
||
|
Adjustments to reconcile net loss to net cash provided by (used in) operating activities:
|
|||||||||||
|
Amortization of identifiable intangible assets
|
0.4
|
|
1.0
|
|
2.3
|
|
|||||
|
Depreciation and amortization of property, plant and equipment
|
7.1
|
|
5.6
|
|
4.9
|
|
|||||
|
Goodwill impairment charges
|
—
|
|
—
|
|
5.6
|
|
|||||
|
Bad debt expenses
|
0.8
|
|
2.5
|
|
3.9
|
|
|||||
|
Share-based compensation expense
|
3.4
|
|
6.4
|
|
5.2
|
|
|||||
|
Charges for inventory and customer service inventory write-downs
|
7.2
|
|
9.7
|
|
4.8
|
|
|||||
|
Loss (gain) on disposition of WiMAX business
|
—
|
|
(0.4
|
)
|
1.9
|
|
|||||
|
Other non-cash items
|
(0.1
|
)
|
(0.1
|
)
|
—
|
|
|||||
|
Changes in operating assets and liabilities:
|
|||||||||||
|
Receivables
|
8.2
|
|
1.9
|
|
38.4
|
|
|||||
|
Unbilled costs
|
5.1
|
|
(3.1
|
)
|
(1.1
|
)
|
|||||
|
Inventories
|
(7.0
|
)
|
13.6
|
|
(9.0
|
)
|
|||||
|
Customer service inventories
|
1.5
|
|
0.9
|
|
0.7
|
|
|||||
|
Accounts payable
|
(2.7
|
)
|
(7.1
|
)
|
(18.3
|
)
|
|||||
|
Accrued expenses
|
(6.4
|
)
|
(3.2
|
)
|
(6.2
|
)
|
|||||
|
Advance payments and unearned income
|
14.6
|
|
(14.1
|
)
|
(4.6
|
)
|
|||||
|
Income taxes payable or receivable
|
2.7
|
|
(1.6
|
)
|
0.1
|
|
|||||
|
Reserve for uncertain tax positions and deferred taxes
|
(14.9
|
)
|
11.5
|
|
(0.5
|
)
|
|||||
|
Other assets and liabilities
|
2.0
|
|
(0.1
|
)
|
4.4
|
|
|||||
|
Net cash provided by (used in) operating activities
|
(29.3
|
)
|
8.4
|
|
8.4
|
|
|||||
|
Investing Activities
|
|||||||||||
|
Cash disbursed related to sale of WiMAX business, net
|
—
|
|
(0.1
|
)
|
(1.5
|
)
|
|||||
|
Additions of property, plant and equipment
|
(9.4
|
)
|
(10.4
|
)
|
(5.9
|
)
|
|||||
|
Net cash used in investing activities
|
(9.4
|
)
|
(10.5
|
)
|
(7.4
|
)
|
|||||
|
Financing Activities
|
|||||||||||
|
Proceeds from debt
|
—
|
|
—
|
|
8.3
|
|
|||||
|
Repayments of debt
|
(2.8
|
)
|
(4.1
|
)
|
(1.4
|
)
|
|||||
|
Proceeds from share-based compensation awards
|
0.1
|
|
0.3
|
|
0.1
|
|
|||||
|
Redemption of preference shares
|
—
|
|
—
|
|
(8.3
|
)
|
|||||
|
Payments on capital lease obligations
|
(0.1
|
)
|
(0.1
|
)
|
—
|
|
|||||
|
Net cash used in financing activities
|
(2.8
|
)
|
(3.9
|
)
|
(1.3
|
)
|
|||||
|
Effect of exchange rate changes on cash and cash equivalents
|
0.3
|
|
—
|
|
(1.9
|
)
|
|||||
|
Net decrease in cash and cash equivalents
|
(41.2
|
)
|
(6.0
|
)
|
(2.2
|
)
|
|||||
|
Cash and cash equivalents, beginning of year
|
90.0
|
|
96.0
|
|
98.2
|
|
|||||
|
Cash and cash equivalents, end of year
|
$
|
48.8
|
|
$
|
90.0
|
|
$
|
96.0
|
|
||
|
Supplemental disclosures of cash flow information:
|
|||||||||||
|
Cash paid for interest
|
$
|
0.4
|
|
$
|
0.8
|
|
$
|
1.3
|
|
||
|
Cash paid for income taxes
|
$
|
14.7
|
|
$
|
3.0
|
|
$
|
1.3
|
|
||
|
Non-cash investing activities:
|
|||||||||||
|
Property and equipment acquired under capital lease
|
$
|
—
|
|
$
|
0.4
|
|
$
|
—
|
|
||
See accompanying notes to consolidated financial statements
52
AVIAT NETWORKS, INC.
CONSOLIDATED STATEMENTS OF STOCKHOLDERS’ EQUITY
|
Common
Stock
Shares
|
Common
Stock
|
Additional
Paid-in
Capital
|
Accumulated
Deficit
|
Accumulated
Other
Comprehensive
Income (Loss)
|
Total
Stockholders’
Equity
|
|||||||||||||||||
|
|
(In millions)
|
|||||||||||||||||||||
|
Balance as of July 1, 2011
|
60.6
|
|
$
|
0.6
|
|
$
|
791.6
|
|
$
|
(611.8
|
)
|
$
|
(2.7
|
)
|
$
|
177.7
|
|
|||||
|
Net loss
|
—
|
|
—
|
|
—
|
|
(24.1
|
)
|
—
|
|
(24.1
|
)
|
||||||||||
|
Other comprehensive income (loss), net
|
—
|
|
—
|
|
—
|
|
—
|
|
(1.3
|
)
|
(1.3
|
)
|
||||||||||
|
Issuance of stock related to employee share-based awards
|
0.7
|
|
—
|
|
—
|
|
—
|
|
—
|
|
—
|
|
||||||||||
|
Share-based compensation
|
—
|
|
—
|
|
5.2
|
|
—
|
|
—
|
|
5.2
|
|
||||||||||
|
Balance as of June 29, 2012
|
61.3
|
|
0.6
|
|
796.8
|
|
(635.9
|
)
|
(4.0
|
)
|
157.5
|
|
||||||||||
|
Net loss
|
—
|
|
—
|
|
—
|
|
(15.0
|
)
|
—
|
|
(15.0
|
)
|
||||||||||
|
Other comprehensive income (loss), net
|
—
|
|
—
|
|
—
|
|
—
|
|
0.7
|
|
0.7
|
|
||||||||||
|
Issuance of stock related to employee share-based awards
|
—
|
|
—
|
|
0.3
|
|
—
|
|
—
|
|
0.3
|
|
||||||||||
|
Share-based compensation
|
—
|
|
—
|
|
6.4
|
|
—
|
|
—
|
|
6.4
|
|
||||||||||
|
Balance as of June 28, 2013
|
61.3
|
|
0.6
|
|
803.5
|
|
(650.9
|
)
|
(3.3
|
)
|
149.9
|
|
||||||||||
|
Net loss
|
—
|
|
—
|
|
—
|
|
(51.2
|
)
|
—
|
|
(51.2
|
)
|
||||||||||
|
Other comprehensive income (loss), net
|
—
|
|
—
|
|
—
|
|
—
|
|
0.4
|
|
0.4
|
|
||||||||||
|
Issuance of stock related to employee share-based awards
|
0.9
|
|
—
|
|
0.1
|
|
—
|
|
—
|
|
0.1
|
|
||||||||||
|
Share-based compensation
|
—
|
|
—
|
|
3.4
|
|
—
|
|
—
|
|
3.4
|
|
||||||||||
|
Balance as of June 27, 2014
|
62.2
|
|
$
|
0.6
|
|
$
|
807.0
|
|
$
|
(702.1
|
)
|
$
|
(2.9
|
)
|
$
|
102.6
|
|
|||||
See accompanying notes to consolidated financial statements
53
AVIAT NETWORKS, INC.
NOTES TO CONSOLIDATED FINANCIAL STATEMENTS
The Company
We design, manufacture and sell a range of wireless networking solutions and services to mobile and fixed telephone service providers, private network operators, government agencies, transportation and utility companies, public safety agencies and broadcast system operators across the globe. Our products include broadband wireless access base stations and customer premises equipment for fixed and mobile, point-to-point digital microwave radio systems for access, backhaul, trunking and license-exempt applications, supporting new network deployments, network expansion, and capacity upgrades.
We were incorporated in Delaware in 2006 to combine the businesses of Harris Corporation’s Microwave Communications Division (“MCD”) and Stratex Networks, Inc. (“Stratex”). On January 28, 2010, we changed our corporate name from Harris Stratex Networks, Inc. to Aviat Networks, Inc. (“Aviat Networks,” “we,” “us,” and “our”) to more effectively reflect our business and communicate our brand identity to customers. Additionally, the change of our corporate name was to comply with the termination of the Harris Corporation (“Harris”) trademark licensing agreement resulting from the spin-off by Harris of its interest in our stock to its stockholders in May 2009.
Basis of Presentation
The consolidated financial statements include the accounts of Aviat Networks and its wholly-owned and majority owned subsidiaries. Significant intercompany transactions and accounts have been eliminated.
Our fiscal year ends on the Friday nearest June 30. This was June 27 for fiscal 2014, June 28 for fiscal 2013 and June 29 for fiscal 2012. All fiscal years presented each included
52
weeks. In these notes to consolidated financial statements, we refer to our fiscal years as “fiscal 2014”, “fiscal 2013” and “fiscal 2012.”
Use of Estimates
The preparation of consolidated financial statements in accordance with accounting principles generally accepted in the United States (“U.S. GAAP”) requires us to make estimates, assumptions and judgments affecting the amounts reported and related disclosures. Estimates are based upon historical factors, current circumstances and the experience and judgment of our management. We evaluate our estimates and assumptions on an ongoing basis and may employ outside experts to assist us in making these evaluations. Changes in such estimates, based on more accurate information, or different assumptions or conditions, may affect amounts reported in future periods. Such estimates affect significant items, including revenue recognition, provision for doubtful accounts, inventory valuation, valuation allowances for deferred tax assets, uncertainties in income taxes, restructuring obligations, product warranty obligations, share-based awards, contingencies and useful lives of intangible assets, property, plant and equipment.
Cash and Cash Equivalents
We consider all highly liquid investments with an original maturity of three months or less at the date of purchase to be cash equivalents. Cash and cash equivalents that are restricted as to withdrawal or usage under the terms of contractual agreements are recorded as restricted cash. At June 27, 2014, restricted cash included cash balances in our disability insurance voluntary plan account that cannot be used by us for any operating purposes other than to pay benefits to the insured employees and was recorded in other assets in our consolidated balance sheets. The corresponding liabilities were recorded under other long-term liabilities in our consolidated balance sheets.
Cash equivalents are carried at amortized cost, which approximates fair value due to the short-term nature of these investments. Amortization or accretion of premium or discount is included in interest income on the consolidated statements of operations. We hold cash and cash equivalents at several major financial institutions, which often significantly exceed Federal Deposit Insurance Corporation insured limits. However, a substantial portion of the cash equivalents is invested in prime money market funds which are backed by the securities in the fund. Historically, we have not experienced any losses due to such concentration of credit risk.
54
We invest our excess cash in high-quality marketable debt securities to ensure that cash is readily available for use in our current operations. Investments with original maturities greater than three months but less than one year are accounted for as short-term and are classified as such at the time of purchase. Marketable securities are classified as “available-for-sale” and are classified as short-term because we view our entire portfolio as available for use in our current operations.
As of
June 27, 2014 and June 28, 2013
, all of our high-quality marketable debt securities were classified as cash equivalents.
Accounts Receivable, Major Customers and Other Significant Concentrations
We typically invoice our customers for the sales order (or contract) value of the related products delivered at various milestones, including order receipt, shipment, installation and acceptance and for services when rendered. Our trade receivables are derived from sales to customers located in North America, Africa, Europe, the Middle East, Russia, Asia-Pacific and Latin America.
Accounts receivable are presented net of allowance for estimated uncollectible accounts to reflect any loss anticipated on the collection of accounts receivable balances. We calculate the allowance based on our history of write-offs, level of past due accounts and economic status of the customers. The fair value of our accounts receivable approximates their net realizable value.
We regularly require letters of credit from some customers and we generally discount these letters of credit with various financial institutions. Under these arrangements, collection risk is fully transferred to the financial institutions. We record the cost of discounting these letters of credit as interest expense. Total customer letters of credit discounted and related interest expense are as follows:
|
|
Fiscal Year
|
|||||||||||
|
(In millions)
|
2014
|
2013
|
2012
|
|||||||||
|
Customer letters of credit discounted
|
$
|
1.8
|
|
$
|
36.8
|
|
$
|
59.1
|
|
|||
|
Interest expense
|
$
|
—
|
|
$
|
0.2
|
|
$
|
0.3
|
|
|||
During fiscal
2014, 2013 and 2012
, we had one international customer in Africa, Mobile Telephone Networks Group (“MTN Group”) that accounted for
17%
,
25%
and
17%
, respectively, of our total revenue. In addition, Verizon Wireless accounted for
11%
of our total revenue during fiscal 2013. As of
June 27, 2014 and June 28, 2013
, MTN Group accounted for approximately
17%
and
12%
, respectively, of our accounts receivable. No other customers accounted for more than 10% of our revenue or accounts receivable for the years presented.
Financial instruments that potentially subject us to a concentration of credit risk consist principally of cash equivalents, marketable debt securities, trade accounts receivable and financial instruments used in foreign currency hedging activities. We invest our excess cash primarily in prime money market funds and certificates of deposit. We are exposed to credit risks related to such instruments in the event of default or decrease in credit-worthiness of the issuers of the investments. We perform ongoing credit evaluations of our customers and generally do not require collateral on accounts receivable, as the majority of our customers are large, well-established companies. However, in certain circumstances, we may require letters of credit, additional guarantees or advance payments. We maintain allowances for collection losses, but historically have not experienced any significant losses related to any particular geographic area since our business is not concentrated within any particular geographic region. Our customers are primarily in the telecommunications industry, so our accounts receivable are concentrated within one industry and exposed to concentrations of credit risk within that industry. Accounts receivable are written off when attempts to collect outstanding amounts have been exhausted or there are other indicators that the amounts are no longer collectible.
We rely on sole providers for certain components of our products and rely on a limited number of contract manufacturers and suppliers to provide manufacturing services for our products. The inability of a contract manufacturer or supplier to fulfill our supply requirements could materially impact future operating results.
We have entered into agreements relating to our foreign currency contracts with large, multinational financial institutions. The amounts subject to credit risk arising from the possible inability of any such parties to meet the terms of their contracts are generally limited to the amounts, if any, by which such party’s obligations exceed our obligations to that party.
55
Inventories
Inventories are valued at the lower of cost or market. Cost is determined using standard cost, which approximates actual cost on a weighted-average basis. We regularly review inventory quantities on hand and record adjustments to reduce the cost of inventory for excess and obsolete inventory based primarily on our estimated forecast of product demand and production requirements. Inventory adjustments are measured as the difference between the cost of the inventory and estimated market value based upon assumptions about future demand and charged to the provision for inventory, which is a component of cost of sales. At the point of the loss recognition, a new, lower-cost basis for that inventory is established, and any subsequent improvements in facts and circumstances do not result in the restoration or increase in that newly established cost basis.
Customer Service Inventories
Our customer service inventories are stated at the lower of cost or market. We carry service parts because we generally provide product warranty for
12
to
36
months and earn revenue by providing enhanced and extended warranty and repair service during and beyond this warranty period. Customer service inventories consist of both component parts, which are primarily used to repair defective units, and finished units, which are provided for customer use permanently or on a temporary basis while the defective unit is being repaired. We record adjustments to reduce the carrying value of customer service inventories to their net realizable value. Factors influencing these adjustments include product life cycles, end of service life plans and volume of enhanced or extended warranty service contracts. Estimates of net realizable value involve significant estimates and judgments about the future, and revisions would be required if these factors differ from our estimates.
Income Taxes and Related Uncertainties
We account for income taxes under the asset and liability method. Deferred tax assets and liabilities are determined based on the estimated future tax effects of temporary differences between the financial statement and tax bases of assets and liabilities, as measured by tax rates at which temporary differences are expected to reverse as well as operating loss and tax credit carry forwards. Deferred tax expense (benefit) is the result of changes in deferred tax assets and liabilities. A valuation allowance is established to offset any deferred tax assets if, based upon the available information, it is more likely than not that some or all of the deferred tax assets will not be realized.
We are required to compute our income taxes in each federal, state, and international jurisdiction in which we operate. This process requires that we estimate the current tax exposure as well as assess temporary differences between the accounting and tax treatment of assets and liabilities, including items such as accruals and allowances not currently deductible for tax purposes as well as operating loss and tax credit carry forwards. The income tax effects of the differences we identify are classified as current or long-term deferred tax assets and liabilities in our consolidated balance sheets. Our judgments, assumptions, and estimates relative to the current provision for income taxes take into account current tax laws, our interpretation of current tax laws, and possible outcomes of current and future audits conducted by foreign and domestic tax authorities. Changes in tax laws or our interpretation of tax laws and the resolution of current and future tax audits could significantly impact the amounts provided for income taxes in our consolidated balance sheets and consolidated statements of operations. We must also assess the likelihood that deferred tax assets will be realized from future taxable income and, based on this assessment, establish a valuation allowance, if required. Our determination of our valuation allowance is based upon a number of assumptions, judgments, and estimates, including forecasted earnings, future taxable income, and the relative proportions of revenue and income before taxes in the various domestic and international jurisdictions in which we operate. To the extent we establish a valuation allowance or change the valuation allowance in a period, we reflect the change with a corresponding increase or decrease to our tax provision in our consolidated statements of operations.
We use a two-step process to determine the amount of tax benefit to be recognized. The first step is to evaluate the tax position for recognition by determining if the weight of available evidence indicates that it is more likely than not that the position will be sustained on audit, including resolution of related appeals or litigation processes, if any. The second step requires us to estimate and measure the tax benefit as the largest amount that is more than
50%
likely of being realized upon ultimate settlement. It is inherently difficult and subjective to estimate such amounts, as this requires us to determine the probability of various possible outcomes. We reevaluate these uncertain tax positions on a quarterly basis. This evaluation is based on factors including, but not limited to, changes in facts or circumstances, changes in tax law, effectively settled issues under audit, and new audit activity. Such a change in recognition or measurement would result in the recognition of a tax benefit or an additional charge to the tax provision in the period.
56
Property, Plant and Equipment
Property, plant and equipment are stated on the basis of cost less accumulated depreciation and amortization. We capitalize costs of software, consulting services, hardware and other related costs incurred to purchase or develop internal-use software. We expense costs incurred during preliminary project assessment, re-engineering, training and application maintenance. Leasehold improvements made either at the inception of the lease or during the lease term are amortized over the remaining current lease term, or estimated life, if shorter.
Depreciation and amortization are calculated using the straight-line method over the estimated useful lives of the respective assets. Leasehold improvements are amortized on the straight-line method over the shorter of the remaining lease term or the estimated useful life of the improvements. The useful lives of the assets are generally as follows:
|
Buildings and leasehold improvements
|
2 to 45 years
|
|
Software
|
3 to 5 years
|
|
Machinery and equipment
|
2 to 5 years
|
Expenditures for maintenance and repairs are charged to expense as incurred. Cost and accumulated depreciation of assets sold or retired are removed from the respective property accounts, and any gain or loss is reflected in the consolidated statements of operations.
Impairment of Long-Lived Assets
We evaluate long-lived assets for impairment whenever events or changes in circumstances indicate that the carrying value of an asset may not be recoverable. Impairment is considered to exist if the total estimated future cash flows on an undiscounted basis are less than the carrying amount of the assets. If impairment exists, the impairment loss is measured and recorded based on discounted estimated future cash flows. In estimating future cash flows, assets are grouped at the lowest levels for which there are identifiable cash flows that are largely independent of cash flows from other asset groups.
Our estimate of future cash flows is based upon, among other things, certain assumptions about expected future operating performance, growth rates and other factors. The actual cash flows realized from these assets may vary significantly from our estimates due to increased competition, changes in technology, fluctuations in demand, consolidation of our customers, reductions in average selling prices and other factors. Assumptions underlying future cash flow estimates are therefore subject to significant risks and uncertainties.
Other Accrued Expenses and Other Assets
No accrued liabilities or expenses within other accrued expenses in our consolidated balance sheets exceeded 5% of our total current liabilities as of
June 27, 2014 or June 28, 2013
. Other accrued expenses in our consolidated balance sheets primarily consists of accruals for sales commissions, warranties and severance. No current assets other than those already disclosed in the consolidated balance sheets exceeded 5% of our total current assets as of
June 27, 2014 or June 28, 2013
. No assets within other assets in the consolidated balance sheets exceeded 5% of total assets as of
June 27, 2014 or June 28, 2013
.
Warranties
On product sales we provide for future warranty costs upon product delivery. The specific terms and conditions of those warranties vary depending upon the product sold and country in which we do business. In the case of products sold by us, our warranties generally start from the delivery date and continue for
one
to
three
years, depending on the terms.
Many of our products are manufactured to customer specifications and their acceptance is based on meeting those specifications. Factors that affect our warranty liabilities include the number of product units subject to warranty protection, historical experience and management’s judgment regarding anticipated rates of warranty claims and cost per claim. We assess the adequacy of our recorded warranty liabilities every quarter and make adjustments to the liabilities as necessary.
57
Network management software products generally carry a
30
-day to
90
-day warranty from the date of customer acceptance. Our liability under these warranties is to provide a corrected copy of any portion of the software found not to be in substantial compliance with the agreed-upon specifications.
Operating Leases
We lease facilities and equipment under various operating leases. These lease agreements generally include rent escalation clauses, and many include renewal periods at our option. We recognize expense for scheduled rent increases on a straight-line basis over the lease term beginning with the date we take possession of the leased space. Leasehold improvements made either at the inception of the lease or during the lease term are amortized over the current lease term, or estimated life, if shorter.
Foreign Currency Translation
The functional currency of our subsidiaries located in the United Kingdom, Singapore, Mexico, Algeria and New Zealand is the U.S. dollar. Determination of the functional currency is dependent upon the economic environment in which an entity operates as well as the customers and suppliers the entity conducts business with. Changes in facts and circumstances may occur which could lead to a change in the functional currency of that entity. Accordingly, all of the monetary assets and liabilities of these subsidiaries are re-measured into U.S. dollars at the current exchange rate as of the applicable balance sheet date, and all non-monetary assets and liabilities are re-measured at historical rates. Income and expenses are re-measured at the average exchange rate prevailing during the period. Gains and losses resulting from the re-measurement of these subsidiaries’ financial statements are included in the consolidated statements of operations.
Our other international subsidiaries use their respective local currency as their functional currency. Assets and liabilities of these subsidiaries are translated at the local current exchange rates in effect at the balance sheet date, and income and expense accounts are translated at the average exchange rates during the period. The resulting translation adjustments are included in accumulated other comprehensive loss.
Gains and losses resulting from foreign exchange transactions and translation of monetary assets and liabilities in non-functional currencies are included in cost of product sales and services in the accompanying consolidated statements of operations. Net foreign exchange losses recorded in our consolidated statements of operations during fiscal
2014, 2013 and 2012
totaled
$0.8 million
,
$1.5 million
and
$1.5 million
, respectively.
Retirement Benefits
As of
June 27, 2014
, we provided retirement benefits to substantially all employees primarily through our defined contribution retirement plans. These plans have matching and savings elements. Contributions by us to these retirement plans are based on profits and employees’ savings with no other funding requirements. We may make additional contributions to the plan at our discretion. However, effective from the second quarter of fiscal 2014, we halted making matching contributions to the plan for an indefinite period of time.
Contributions to retirement plans are expensed as incurred. Retirement plan expense amounted to
$2.5 million
,
$2.9 million
and
$2.8 million
in fiscal
2014, 2013 and 2012
, respectively.
Revenue Recognition
We generate substantially all of our revenue from the sales or licensing of our microwave radio and wireless access systems, network management software, and professional services including installation and commissioning and training. Principal customers for our products and services include domestic and international wireless/mobile service providers, original equipment manufacturers, distributors, system integrators, as well as private network users such as public safety agencies, government institutions, and utility, pipeline, railroad and other industrial enterprises that operate broadband wireless networks. Our customers generally purchase a combination of our products and services as part of a multiple element arrangement. Our assessment of which revenue recognition guidance is appropriate to account for each element in an arrangement can involve significant judgment.
Revenue from product sales is generated predominately from the sales of products manufactured by third party manufacturers to whom we have outsourced our manufacturing processes. In general, printed circuit assemblies, mechanical housings, and packaged modules are manufactured by contract manufacturing partners, with periodic business reviews of material levels and obsolescence. Product assembly, product testing, complete system integration and system testing may either be performed within our own facilities or at the locations of our third party manufacturers.
58
Revenue from services includes certain installation, extended warranty, customer support, consulting, training and education. It also can include certain revenue generated from the resale of equipment purchased on behalf of customers for installation service contracts we perform for customers. Such equipment may include towers, antennas, and other related materials. Revenue from warranty services are recognized ratably over the service period.
Under our revenue recognition policy, revenue is recognized when all of the following criteria have been met:
|
•
|
Persuasive evidence of an arrangement exists. Contracts and customer purchase orders are generally used to determine the existence of an arrangement.
|
|
•
|
Delivery has occurred. Shipping documents and customer acceptance, when applicable, are used to verify delivery.
|
|
•
|
The fee is fixed or determinable. We assess whether the fee is fixed or determinable based on the payment terms associated with the transaction and whether the sales price is subject to refund or adjustment.
|
|
•
|
Collectibility is reasonably assured. We assess collectibility based primarily on the creditworthiness of the customer as determined by credit checks and analysis, as well as the customer’s payment history.
|
We often enter into multiple contractual agreements with the same customer. Such agreements are reviewed to determine whether they should be evaluated as one arrangement. If an arrangement, other than a long-term contract, requires the delivery or performance of multiple deliverables or elements, we determine whether the individual elements represent “separate units of accounting”. Based on the terms and conditions of our typical product sales arrangement, we believe that our products and services can be accounted for as separate units because our products and services have value to our customers on a stand-alone basis.
When a sale involves multiple deliverables, the entire fee from the arrangement is allocated to each unit of accounting based on the relative selling price of each deliverable. When applying the relative selling price method, we determine the selling price for each deliverable using vendor-specific objective evidence (“VSOE”) of selling price, if it exists, or third-party evidence (“TPE”) of selling price. If neither VSOE nor TPE of selling price exist for a deliverable, which is typically the case, we use our best estimate of selling price (“ESP”) for that deliverable. Revenue allocated to each element is then recognized when the other revenue recognition criteria are met for each element. Accordingly, services not yet performed at the time of product shipment are deferred based on their relative selling price and recognized as revenue as such services are performed. The relative selling price of any undelivered products is also deferred at the time of shipment and recognized as revenue when these products are delivered. There is generally no customer right of return in our sales agreements. The sequence for typical multiple element arrangements: we deliver our products, perform installation services and then provide post-contract support services.
VSOE of fair value is based on the price charged when the element is sold separately. For multiple element arrangements, if VSOE cannot be established, we establish, where available, the selling price based on TPE. TPE is determined based on evidence of competitor pricing for similar deliverables when sold separately. When we cannot determine VSOE or TPE, which is typically the case, we use ESP in our allocation of arrangement consideration. The objective of ESP is to determine the price at which we would typically transact a stand-alone sale of the product or service. ESP is determined by considering a number of factors including our pricing policies, internal costs and gross margin objectives, method of distribution, information gathered from experience in customer negotiations, market research and information, recent technological trends, competitive landscape and geographies. The determination of ESP is approved by our management taking into consideration our pricing strategy. We regularly review VSOE, TPE and ESP and maintain internal controls over the establishment and updating of these estimates.
For our proprietary and OEM products, we determine ESP using a discount off list methodology. Under this approach, reasonably available data points, including deals bid and won in the past rolling four quarters and competitor pricing data, for each part number are gathered. Then similar parts are grouped together and the average net price and the discount off the list price are calculated for each group of products. Since we have determined that pricing varies significantly by geography, the data is further stratified by geography. Within geographies, the data is stratified based on type of customer, distribution channel and estimated deal size or customer volume as larger opportunities with multiple deliverables bundled are more likely to receive preferential pricing. Based on all the available information (pricing practices and trends, competition, market, potential pricing limitations set by the competitors for the similar or identical product, functionality and expected technological life of the product, etc.), the final discount off list percentage is determined. Using the discount off list price percentage, the best estimated selling price for each product is determined.
For services ESP, we also stratify data based on geography, type of customer and estimated deal size. For training and extended support services, we determine ESP using a discount off list methodology as discussed above. For technical
59
and installation services, we determine ESP using an estimated margin methodology. Under this methodology, ESP’s are determined based on estimated margins anticipated. We consider historical margins as well as current pricing trends and market conditions when determining the estimated margin.
Some of our products have both software and non-software components that function together to deliver the product’s essential functionality. Accordingly, these products are not within the scope of the software revenue recognition rules, ASC 985-605,
Software Revenue Recognition
.
In addition to the software in our core microwave product which is not within the scope of the software revenue recognition rules, some of our sales arrangements have multiple deliverables containing software and related software support components. Such sale arrangements are subject to the accounting guidance in ASC 985-605,
Software-Revenue Recognition.
Under the software revenue recognition guidance, we use the residual method to recognize revenue when a multiple element arrangement includes one or more elements to be delivered at a future date and VSOE of all undelivered elements exists. If VSOE cannot be established for the undelivered elements of an arrangement, we defer revenue until the earlier of delivery, or fair value of the undelivered element exists, unless the undelivered element is a service, in which the entire arrangement fee is recognized ratably over the period during which the services are expected to be performed.
Revenues related to long-term contracts for customized network solutions are recognized using the percentage-of-completion method. In using the percentage-of-completion method, we generally apply the cost-to-cost method of accounting where sales and profits are recorded based on the ratio of costs incurred to estimated total costs at completion. Contracts are combined when specific aggregation criteria are met including when the contracts are in substance an arrangement to perform a single project with a customer; the contracts are negotiated as a package in the same economic environment with an overall profit objective; the contracts require interrelated activities with common costs that cannot be separately identified with, or reasonably allocated to the elements, phases or units of output and the contracts are performed concurrently or in a continuous sequence under the same project management at the same location or at different locations in the same general vicinity. Recognition of profit on long-term contracts requires estimates of the total contract value, the total cost at completion and the measurement of progress towards completion. Significant judgment is required when estimating total contract costs and progress to completion on the arrangements as well as whether a loss is expected to be incurred on the contract. Amounts representing contract change orders, claims or other items are included in sales only when they can be reliably estimated and realization is probable. When adjustments in contract value or estimated costs are determined, any changes from prior estimates are reflected in earnings in the current period. Anticipated losses on contracts or programs in progress are charged to earnings when identified.
Royalty income is recognized on the basis of terms specified in the contractual agreements.
Cost of Product Sales and Services
Cost of sales consists primarily of materials, labor and overhead costs incurred internally and amounts incurred to contract manufacturers to produce our products, personnel and other implementation costs incurred to install our products and train customer personnel, and customer service and third party original equipment manufacturer costs to provide continuing support to our customers. Also included in cost of sales is the amortization of purchased technology intangible assets.
Shipping and handling costs are included as a component of costs of product sales in our consolidated statements of operations because we include in revenue the related costs that we bill our customers.
Presentation of Transactional Taxes Collected from Customers and Remitted to Government Authorities
We present transactional taxes such as sales and use tax collected from customers and remitted to governmental authorities on a net basis.
Share-Based Compensation
We have issued stock options, restricted stock and performance shares under our 2007 Stock Equity Plan and have assumed stock options from the acquisition of Stratex Networks, Inc. (“Stratex”). We estimate the grant date fair value of our share-based awards and amortize this fair value to compensation expense over the requisite service period or vesting term.
To estimate the fair value of our stock option awards, we use the Black-Scholes option pricing model. The determination of the fair value of stock option awards on the date of grant using an option pricing model is affected by
60
our stock price as well as assumptions regarding a number of complex and subjective variables. These variables include our expected stock price volatility over the expected term of the awards, actual and projected employee stock option exercise behaviors, risk-free interest rate and expected dividends. Due to the inherent limitations of option valuation models, including consideration of future events that are unpredictable and the estimation process utilized in determining the valuation of the share-based awards, the ultimate value realized by our employees may vary significantly from the amounts expensed in our financial statements. For restricted stock and performance share awards, we measure the grant date fair value based upon the market price of our common stock on the date of the grant.
We generally recognize compensation cost for share-based payment awards on a straight-line basis over the requisite service period. For awards with a performance condition vesting feature, we recognize share-based compensation costs for the performance awards when achievement of the performance conditions is considered probable. Any previously recognized compensation cost would be reversed if the performance condition is not satisfied or if it is not probable that the performance conditions will be achieved.
We estimate forfeitures at the time of grant and revise, if necessary, in subsequent periods if actual forfeitures differ significantly from initial estimates. Share-based compensation expense is recorded net of estimated forfeitures such that expense was recorded only for those share-based awards that are expected to vest.
Cash flows, if any, resulting from the gross benefit of tax deductions related to share-based compensation in excess of the grant date fair value of the related share-based awards are presented as part of cash flows from financing activities. This amount is shown as a reduction to cash flows from operating activities and an increase to cash flow from financing activities.
Net Income (Loss) per Share of Common Stock
We compute net income (loss) per share of common stock using the two-class method. Basic net income (loss) per share is computed using the weighted average number of common shares and participating securities outstanding. Our unvested restricted shares (including restricted stock awards and performance share awards) contain rights to receive non-forfeitable dividends and therefore are considered to be participating securities and would be included in the calculations of net income per basic and diluted common share. However, we incurred a net loss in all periods presented. In accordance with ASC subtopic 260-10, undistributed losses are not allocated to unvested restricted shares due to the fact that the unvested restricted shares are not contractually obligated to share in the losses of the company.
Restructuring Charges
Our restructuring charges represent expenses incurred in connection with certain cost reduction programs that we have implemented, and consist of the costs of employee termination benefits, facilities charges and other costs of exiting activities or geographies. A liability for costs associated with an exit or disposal activity is measured at its fair value when the liability is incurred. Expenses for one-time termination benefits are recognized at the date we notify the employee, unless the employee must provide future service, in which case the benefits are expensed ratably over the future service period. We recognize severance benefits provided as part of an ongoing benefit arrangement when the payment is probable and the amounts can be reasonably estimated. Liabilities related to an operating lease/contract are measured and recognized at fair value when the contract does not have any future economic benefit to the entity and the fair value of the liability is determined based on the present value of the remaining lease obligations, adjusted for the effects of deferred items recognized under the lease, and reduced by estimated sublease rentals that could be reasonably obtained for the property. The assumptions in determining such estimates include anticipated timing of sublease rentals and estimates of sublease rental receipts and related costs based on market conditions. We expense all other costs related to an exit or disposal activity as incurred.
Research and Development Costs
Our sponsored research and development costs, which include costs in connection with new product development, improvement of existing products, process improvement, and product use technologies, are charged to operations in the period in which they are incurred.
Recently Issued Accounting Standards
On May 28, 2014, the Financial Accounting Standards Board (“FASB”) issued ASU No. 2014-09,
Revenue from Contracts with Customers
, which requires an entity to recognize the amount of revenue to which it expects to be entitled for the transfer of promised goods or services to customers. The ASU will replace most existing revenue recognition guidance in U.S. GAAP when it becomes effective. The new standard is effective for us beginning in our fiscal year
61
2018. Early application is not permitted. The standard permits the use of either the retrospective or cumulative effect transition method. We are evaluating the effect that ASU 2014-09 will have on our consolidated financial statements and related disclosures. We have not yet selected a transition method nor have we determined the effect of the standard on our consolidated financial position or results of operations.
In July 2013, the FASB issued an amendment to the accounting guidance on the presentation of an unrecognized tax benefit when a net operating loss carryforward, a similar tax loss, or tax credit carryforward exists. This new guidance requires entities, if certain criteria are met, to present an unrecognized tax benefit, or portion of an unrecognized tax benefit, in the financial statements as a reduction to a deferred tax asset for a net operating loss carryforward, a similar tax loss, or a tax credit carryforward when such items exist in the same taxing jurisdiction. This new guidance is to be adopted prospectively and is effective for us beginning in our first quarter of fiscal 2015. The adoption of this standard will have no effect on our consolidated financial position or results of operations.
The changes in components of our accumulated other comprehensive loss during fiscal
2014, 2013 and 2012
were as follows:
|
Foreign
Currency
Translation
Adjustment
(“CTA”)
|
Hedging
Derivatives
|
Total
Accumulated
Other
Comprehensive
Income (Loss)
|
|||||||||
|
(In millions)
|
|||||||||||
|
Balance as of July 1, 2011
|
$
|
(2.6
|
)
|
$
|
(0.1
|
)
|
$
|
(2.7
|
)
|
||
|
Foreign currency translation gain (loss)
|
(1.4
|
)
|
—
|
|
(1.4
|
)
|
|||||
|
Net unrealized gain (loss) on hedging activities
|
—
|
|
0.1
|
|
0.1
|
|
|||||
|
Balance as of June 29, 2012
|
(4.0
|
)
|
—
|
|
(4.0
|
)
|
|||||
|
Foreign currency translation gain (loss)
|
0.6
|
|
—
|
|
0.6
|
|
|||||
|
Net unrealized gain (loss) on hedging activities
|
—
|
|
0.1
|
|
0.1
|
|
|||||
|
Balance as of June 28, 2013
|
(3.4
|
)
|
0.1
|
|
(3.3
|
)
|
|||||
|
Foreign currency translation gain (loss)
|
0.5
|
|
—
|
|
0.5
|
|
|||||
|
Net unrealized gain (loss) on hedging activities
|
—
|
|
(0.1
|
)
|
(0.1
|
)
|
|||||
|
Balance as of June 27, 2014
|
$
|
(2.9
|
)
|
$
|
—
|
|
$
|
(2.9
|
)
|
||
As we incurred net loss for all periods in fiscal
2014, 2013 and 2012
, all potential dilutive securities from stock options, restricted stocks and units and performance shares and units have been excluded from the diluted net loss per share calculations, as their effect would have been anti-dilutive. The following table summarizes the potential weighted average shares of common stock outstanding that have been excluded from the diluted net loss per share calculations:
|
|
Fiscal Year
|
||||||||
|
|
2014
|
2013
|
2012
|
||||||
|
|
(In millions)
|
||||||||
|
Stock options
|
7.3
|
|
5.0
|
|
5.0
|
|
|||
|
Restricted stocks and units and performance shares and units
|
0.4
|
|
1.2
|
|
2.0
|
|
|||
|
Total potential shares of common stock excluded
|
7.7
|
|
6.2
|
|
7.0
|
|
|||
62
Receivables, net
Our net receivables are summarized below:
|
June 27,
2014 |
June 28,
2013 |
||||||
|
|
(In millions)
|
||||||
|
Accounts receivable
|
$
|
84.6
|
|
$
|
96.5
|
|
|
|
Less: allowances for collection losses
|
(7.4
|
)
|
(10.2
|
)
|
|||
|
$
|
77.2
|
|
$
|
86.3
|
|
||
Inventories
Our inventories are summarized below:
|
June 27,
2014 |
June 28,
2013 |
||||||
|
|
(In millions)
|
||||||
|
Finished products
|
$
|
25.3
|
|
$
|
22.3
|
|
|
|
Work in process
|
5.3
|
|
3.9
|
|
|||
|
Raw materials and supplies
|
7.5
|
|
8.8
|
|
|||
|
$
|
38.1
|
|
$
|
35.0
|
|
||
|
Deferred cost of sales included within finished goods
|
$
|
3.2
|
|
$
|
3.1
|
|
|
|
Consigned inventories included within raw materials
|
$
|
6.6
|
|
$
|
7.9
|
|
|
During fiscal
2014, 2013 and 2012
, we recorded charges to adjust our inventory and customer service inventory to the lower of cost or market. These charges were primarily due to excess and obsolete inventory resulting from product transitioning and discontinuance or customer insolvency. Such charges incurred during fiscal 2014, 2013 and 2012 were classified in cost of product sales as follows:
|
|
Fiscal Year
|
|||||||||||
|
2014
|
2013
|
2012
|
||||||||||
|
(In millions)
|
||||||||||||
|
Excess and obsolete inventory charges
|
$
|
4.0
|
|
$
|
4.0
|
|
$
|
3.1
|
|
|||
|
Customer service inventory write-downs
|
3.2
|
|
1.5
|
|
1.7
|
|
||||||
|
$
|
7.2
|
|
$
|
5.5
|
|
$
|
4.8
|
|
||||
|
As % of revenue
|
2.1
|
%
|
1.2
|
%
|
1.1
|
%
|
||||||
During fiscal 2013, we also incurred
$4.2 million
charges to write down deferred costs of revenue that were unlikely to derive revenue due to disposition of our WiMAX business. The charges were included in discontinued operations in our consolidated statement of operations for fiscal 2013.
63
Property, Plant and Equipment, net
Our property, plant and equipment are summarized below:
|
June 27,
2014 |
June 28,
2013 |
||||||
|
|
(In millions)
|
||||||
|
Land
|
$
|
0.7
|
|
$
|
0.7
|
|
|
|
Buildings and leasehold improvements
|
10.3
|
|
10.6
|
|
|||
|
Software
|
13.2
|
|
12.1
|
|
|||
|
Machinery and equipment
|
47.1
|
|
48.8
|
|
|||
|
71.3
|
|
72.2
|
|
||||
|
Less accumulated depreciation and amortization
|
(42.0
|
)
|
(43.4
|
)
|
|||
|
$
|
29.3
|
|
$
|
28.8
|
|
||
Depreciation and amortization expense related to property, plant and equipment, including amortization of internal use software , was
$7.1 million
,
$5.6 million
and
$4.9 million
, respectively, in fiscal
2014, 2013 and 2012
.
Accrued Warranties
We accrue for the estimated cost to repair or replace products under warranty. Changes in our warranty liability, which is included as a component of other accrued expenses in the consolidated balance sheets, during fiscal
2014
and
2013
were as follows:
|
|
Fiscal Year
|
||||||
|
|
2014
|
2013
|
|||||
|
|
(In millions)
|
||||||
|
Balance as of the beginning of the fiscal year
|
$
|
3.3
|
|
$
|
3.0
|
|
|
|
Warranty provision recorded during the period
|
5.2
|
|
5.8
|
|
|||
|
Consumption during the period
|
(4.7
|
)
|
(5.5
|
)
|
|||
|
Balance as of the end of the period
|
$
|
3.8
|
|
$
|
3.3
|
|
|
We determine fair value as the price that would be received to sell an asset or paid to transfer a liability in the principal market (or most advantageous market, in the absence of a principal market) for the asset or liability in an orderly transaction between market participants as of the measurement date. We try to maximize the use of observable inputs and minimize the use of unobservable inputs in measuring fair value and establish a three-level fair value hierarchy that prioritizes the inputs used to measure fair value. The three levels of inputs used to measure fair value are as follows:
|
•
|
Level 1 — Observable inputs such as quoted prices in active markets for identical assets or liabilities;
|
|
•
|
Level 2 — Observable market-based inputs or observable inputs that are corroborated by market data; and
|
|
•
|
Level 3 — Unobservable inputs reflecting our own assumptions.
|
The carrying amounts, estimated fair values and valuation input levels of our assets and liabilities that are measured at fair value on a recurring basis as of
June 27, 2014 and June 28, 2013
were as follows:
64
|
|
June 27, 2014
|
June 28, 2013
|
|
||||||||||||||
|
|
Carrying
Amount
|
Fair
Value
|
Carrying
Amount
|
Fair
Value
|
Valuation
Inputs
|
||||||||||||
|
|
(In millions)
|
||||||||||||||||
|
Assets:
|
|||||||||||||||||
|
Cash equivalents:
|
|||||||||||||||||
|
Bank certificates of deposit
|
$
|
3.5
|
|
$
|
3.5
|
|
$
|
2.4
|
|
$
|
2.4
|
|
Level 2
|
||||
|
Money market funds
|
$
|
10.2
|
|
$
|
10.2
|
|
$
|
39.2
|
|
$
|
39.2
|
|
Level 1
|
||||
|
Other current assets:
|
|||||||||||||||||
|
Foreign exchange forward contracts
|
$
|
—
|
|
$
|
—
|
|
$
|
0.1
|
|
$
|
0.1
|
|
Level 2
|
||||
|
Liabilities:
|
|||||||||||||||||
|
Other accrued expenses:
|
|||||||||||||||||
|
Foreign exchange forward contracts
|
$
|
—
|
|
$
|
—
|
|
$
|
0.1
|
|
$
|
0.1
|
|
Level 2
|
||||
We classify investments within Level 1 if quoted prices are available in active markets. Our Level 1 items include shares in money market funds purchased from
two
major financial institutions. As of
June 27, 2014
, these money market shares were valued at $
1.00
net asset value per share by these financial institutions.
We classify items in Level 2 if the observable inputs to quoted market prices, benchmark yields, reported trades, broker/dealer quotes or alternative pricing sources are available with reasonable levels of price transparency. Our bank certificates of deposit and foreign exchange forward contracts are classified within Level 2. Foreign currency forward contracts are measured at fair value using observable foreign currency exchange rates.
Our policy is to recognize asset or liability transfers among Level 1, Level 2 and Level 3 as of the actual date of the events or change in circumstances that caused the transfer. During fiscal
2014, 2013 and 2012
, we had no transfers between levels of the fair value hierarchy of our assets or liabilities measured at fair value.
On March 28, 2014, we entered into a Second Amended and Restated Loan Agreement with Silicon Valley Bank (the "SVB Credit Facility"). This agreement amends and restates our existing First Amended and Restated Loan and Security Agreement, which was entered into on September 27, 2013 and amended on October 29, 2013, November 20, 2013 and February 10, 2014, respectively, providing for certain amendments to the maximum borrowing limit and financial covenants. On September 27, 2013, we repaid the remaining
$1.7 million
outstanding balance of the original
$8.3 million
two
-year term loan that we borrowed on January 30, 2012. As of
June 27, 2014
, our outstanding debt under the SVB Credit Facility consisted of the
$6.0 million
borrowings that we advanced under a previous SVB credit facility in fiscal 2011.
The SVB Credit Facility provides for a committed amount of up to
$40.0 million
, decreased from the
$50.0 million
credit limit under the first amended and restated credit facility, with a
$30.0 million
sublimit that can be borrowed by our Singapore subsidiary. Borrowings may be advanced under the SVB Credit Facility at the lesser of
$40.0 million
or a borrowing base equal to a specified percentage of the value of eligible accounts receivable and U.S. unbilled accounts of the Company, subject to certain reserves and eligibility criteria. The SVB Credit Facility can also be utilized to issue letters of credit. Principal, together with all accrued and unpaid interest, is due and payable on September 26, 2016. We may prepay loans under the SVB Credit Facility in whole or in part at any time without premium or penalty. As of
June 27, 2014
, available credit under the SVB Credit Facility was
$19.7 million
reflecting the calculated borrowing base of
$31.4 million
less existing borrowings of
$6.0 million
and outstanding letters of credit of
$5.7 million
.
Borrowings under the SVB Credit Facility carry an interest rate computed at the daily
prime rate
as published in the
Wall Street Journal
plus a spread of
0.50%
to
1.50%
, with such spread determined based on our adjusted quick ratio. If a minimum adjusted quick ratio requirement is satisfied, LIBOR advances are offered at
LIBOR
plus a spread of
2.75%
. Interest is due and payable in arrears monthly for prime rate loans and, for LIBOR rate loans, at the end of an interest period or at each
three
-month interval if the interest period is greater than three months. During fiscal 2014, the weighted average interest rate on our
$6.0 million
loan was
3.38%
. The previous
$8.3 million
two-year term loan bore a fixed interest rate of
5%
per annum.
The SVB Credit Facility contains quarterly financial covenants including minimum adjusted quick ratio and minimum profitability (EBITDA) requirements. In the event our adjusted quick ratio falls below a certain level, cash
65
received in our accounts with SVB may be directly applied to reduce outstanding obligations under the credit facility. The SVB Credit Facility also imposes certain restrictions on our ability to dispose of assets, permit a change in control, merge or consolidate, make acquisitions, incur indebtedness, grant liens, make investments, make certain restricted payments and enter into transactions with affiliates under certain circumstances. Certain of our assets, including accounts receivable, inventory, and equipment, are pledged as collateral for the SVB Credit Facility. Upon an event of default, outstanding obligations would be immediately due and payable. Under certain circumstances, a default interest rate will apply on all obligations during the existence of an event of default at a per annum rate of interest equal to
2.00%
above the applicable interest rate.
As of
June 27, 2014
,
we were in compliance with the quarterly financial covenants contained in the SVB Credit Facility. However, as a result of the uncertainty on our ability to meet the financial covenants and the fact that the SVB Credit Facility contains subjective acceleration clauses that could be triggered by the lender,
the
$6.0 million
borrowing was classified as a current liability as of
June 27, 2014
.
In March 2011, our board of directors approved a plan for the sale of our WiMAX business. On September 2, 2011, we sold to EION Networks, Inc. (“EION”) our WiMAX business and related assets consisting of certain technology, inventory and equipment. As consideration for the sale of assets, EION agreed to pay us $
0.4
million in cash and up to $
2.8
million in additional cash payments contingent upon specific factors related to future WiMAX business performance. As of
June 27, 2014
, we had received
$0.1 million
of such contingent payments and do not expect any further payments from EION. EION is entitled to receive cash payments up to $
2.0
million upon collections of certain WiMAX accounts receivable, of which
$1.6 million
has been paid by us to EION and
$0.3 million
was written off resulting from the write-down of the corresponding WiMAX accounts receivable as of
June 27, 2014
. As of
June 27, 2014 and June 28, 2013
, our accrued liabilities related to the disposition of WiMAX business were
$0.1 million
and
$0.1 million
, respectively.
In the third quarter of fiscal 2011, we began accounting for the WiMAX business as a discontinued operation and, therefore, the operating results of our WiMAX business were included in discontinued operations in our consolidated financial statements for all years presented. The loss incurred in fiscal 2013 was primarily due to write-down of certain WiMAX deferred cost of sales that were not transferred to EION and certain expenses we incurred to support a remaining customer obligation. The income recognized in fiscal 2014 was primarily due to the recovery of certain WiMAX customer receivables that was previously written down. We recognized a
$0.4 million
gain and a
$1.9 million
loss on disposition, which was included in our loss from discontinued operations, in fiscal
2013
and
2012
, respectively.
Summary results of operations for the WiMAX business were as follows:
|
|
Fiscal Year
|
||||||||||
|
|
2014
|
2013
|
2012
|
||||||||
|
|
(In millions)
|
||||||||||
|
Revenues
|
$
|
—
|
|
$
|
0.1
|
|
$
|
1.6
|
|
||
|
Income (loss) from operations of WiMAX
|
1.2
|
|
(4.3
|
)
|
(6.5
|
)
|
|||||
|
Gain (loss) on disposal
|
—
|
|
0.4
|
|
(1.9
|
)
|
|||||
|
Income taxes
|
(0.3
|
)
|
(0.2
|
)
|
(0.2
|
)
|
|||||
|
Income (loss) from discontinued operations, net of tax
|
$
|
0.9
|
|
$
|
(4.1
|
)
|
$
|
(8.6
|
)
|
||
Goodwill
Our goodwill for fiscal 2012 resulted from our acquisition of Telsima Corporation in fiscal 2009, which was accounted for as a purchase business combination. The changes in the carrying amount of goodwill were as follows:
66
|
Amount
|
|||
|
(In millions)
|
|||
|
Balance as of July 1, 2011
|
$
|
5.6
|
|
|
Goodwill impairment charges
|
(5.6
|
)
|
|
|
Balance as of June 29, 2012
|
$
|
—
|
|
In the second quarter of fiscal 2012, we concluded that a goodwill impairment indicator existed due to a significant decline in our market capitalization. Therefore we performed a goodwill impairment analysis and recorded a
$5.6 million
goodwill impairment charge in the quarter. As of June 27, 2014 and June 28, 2013, we did not have any goodwill in our consolidated balance sheets.
Identifiable Intangible Assets
A summary of our identifiable intangible assets is presented below:
|
Purchased
Technology
|
Customer
Relationships
|
Total
Identifiable
Intangible
Assets
|
|||||||||
|
(In millions)
|
|||||||||||
|
Net identifiable intangible assets as of June 29, 2012
|
$
|
0.6
|
|
$
|
1.2
|
|
$
|
1.8
|
|
||
|
Less: amortization expense
|
(0.6
|
)
|
(0.4
|
)
|
(1.0
|
)
|
|||||
|
Net identifiable intangible assets as of June 28, 2013
|
—
|
|
0.8
|
|
0.8
|
|
|||||
|
Less: amortization expense
|
—
|
|
(0.4
|
)
|
(0.4
|
)
|
|||||
|
Net identifiable intangible assets as of June 27, 2014
|
$
|
—
|
|
$
|
0.4
|
|
$
|
0.4
|
|
||
|
Amortization expenses:
|
|||||||||||
|
Fiscal 2014
|
$
|
—
|
|
$
|
0.4
|
|
$
|
0.4
|
|
||
|
Fiscal 2013
|
$
|
0.6
|
|
$
|
0.4
|
|
$
|
1.0
|
|
||
|
Fiscal 2012
|
$
|
0.7
|
|
$
|
0.3
|
|
$
|
2.3
|
|
||
|
Weighted average estimated useful life (in years)
|
3.0
|
|
5.0
|
|
|||||||
Our identifiable intangible assets are being amortized over their useful estimated economic lives, which range from
one
to
five
years.
At
June 27, 2014
, we estimate our future amortization of identifiable intangible assets with definite lives by year as follows:
|
Fiscal Year
|
Amount
|
||
|
|
(In millions)
|
||
|
2015
|
$
|
0.4
|
|
|
$
|
0.4
|
|
|
Fiscal 2014-2015 Plan
During the third quarter of fiscal 2014, in line with the decrease in revenue that we experienced and our reduced forecast for the immediate future, we initiated a restructuring plan (the “Fiscal 2014-2015 Plan”) to reduce our operating costs, primarily in North America, Europe and Asia. Activities under the Fiscal 2014-2015 Plan primarily include reductions in force and additional downsizing of our Santa Clara, California headquarters.
The following table summarizes our costs incurred during fiscal 2014, estimated additional costs to be incurred and estimated total costs expected to be incurred as of
June 27, 2014
under the Fiscal 2014-2015 Plan:
67
|
Costs Incurred
During
Fiscal Year Ended
|
Cumulative
Costs Incurred
Through
June 27, 2014
|
Estimated
Additional
Costs
to be Incurred
|
Total Restructuring
Costs Expected
to be Incurred
|
|||||||||||||
|
June 27, 2014
|
||||||||||||||||
|
(in millions)
|
||||||||||||||||
|
Severance and benefits
|
$
|
5.4
|
|
$
|
5.4
|
|
$
|
1.1
|
|
$
|
6.5
|
|
||||
|
Facilities and other
|
0.4
|
|
0.4
|
|
1.7
|
|
2.1
|
|
||||||||
|
Total for Fiscal 2014-2015 Plan
|
$
|
5.8
|
|
$
|
5.8
|
|
$
|
2.8
|
|
$
|
8.6
|
|
||||
During fiscal 2014, our severance and benefits charges under the Fiscal 2014-2015 Plan primarily related to reductions in force in Santa Clara, California, and several international locations. We intend to substantially complete the remaining restructuring activities under the Fiscal 2014-2015 Plan by the end of the second quarter of fiscal 2015.
Fiscal 2013-2014 Plan
During the fourth quarter of fiscal 2013, we initiated a restructuring plan (the “Fiscal 2013-2014 Plan”) to bring our cost structure in line with the changing business environment of the worldwide microwave radio and telecommunication markets, primarily in North America, Europe and Asia. Activities under the Fiscal 2013-2014 Plan include the downsizing of our Santa Clara, California headquarters and certain international field offices, and reductions in force to reduce our operating expenses.
The following table summarizes our costs incurred during fiscal 2014 and 2013, estimated additional costs to be incurred and estimated total costs expected to be incurred as of
June 27, 2014
under the Fiscal 2013-2014 Plan:
|
Costs Incurred During
Fiscal Year Ended
|
Cumulative
Costs Incurred
Through
June 27, 2014
|
Estimated
Additional
Costs
to be Incurred
|
Total Restructuring
Costs Expected
to be Incurred
|
||||||||||||||||
|
June 27, 2014
|
June 28, 2013
|
||||||||||||||||||
|
(in millions)
|
|||||||||||||||||||
|
Severance and benefits
|
$
|
1.0
|
|
$
|
1.8
|
|
$
|
2.8
|
|
$
|
—
|
|
$
|
2.8
|
|
||||
|
Facilities and other
|
4.3
|
|
—
|
|
4.3
|
|
0.7
|
|
5.0
|
|
|||||||||
|
Total for Fiscal 2013-2014 Plan
|
$
|
5.3
|
|
$
|
1.8
|
|
$
|
7.1
|
|
$
|
0.7
|
|
$
|
7.8
|
|
||||
During fiscal 2014 and 2013, our severance and benefits charges under the Fiscal 2013-2014 Plan primarily related to reductions in force in Santa Clara, California and several international locations of their finance and engineering functions. Facilities and other charges in of fiscal 2014 included obligations under a non-cancelable lease for facilities that we ceased to use at our Santa Clara, California headquarters and certain U.S. and international field offices. As of June 27, 2014, we completed a majority of the restructuring activities under the Fiscal 2013-2014 Plan.
Fiscal 2011 Plan
During the first quarter of fiscal 2011, we initiated a restructuring plan (the “Fiscal 2011 Plan”) to reduce our operational costs. The Fiscal 2011 Plan was intended to bring our cost structure in line with the changing dynamics of the worldwide microwave radio and telecommunication markets, primarily in North America, Europe and Asia. Activities under the Fiscal 2011 Plan included reductions in force to reduce our operating expenses and the downsizing or closure of our Morrisville, North Carolina, Santa Clara, California, Montreal, Canada and certain international field offices. The initiatives under the Fiscal 2011 Plan were completed in fiscal 2013.
The following table summarizes our costs incurred during fiscal 2013 and 2012 and total costs incurred under the Fiscal 2011 Plan:
|
Costs Incurred During
Fiscal Year Ended
|
Cumulative
Costs Incurred
Through
June 28, 2013
|
|||||||||||
|
June 28, 2013
|
|
June 29, 2012
|
|
|||||||||
|
(in millions)
|
||||||||||||
|
Severance and benefits
|
$
|
1.2
|
|
0.9
|
|
$
|
12.6
|
|
||||
|
Facilities and other
|
0.1
|
|
1.4
|
|
3.7
|
|
||||||
|
Total for Fiscal 2011 Plan
|
$
|
1.3
|
|
$
|
2.3
|
|
$
|
16.3
|
|
|||
68
Restructuring Liabilities
The information in the following table summarizes our restructuring activities during fiscal
2014, 2013 and 2012
and restructuring liability as of
June 27, 2014
:
|
Severance and
Benefits
|
Facilities and
Other
|
Total
|
|||||||||
|
|
(In millions)
|
||||||||||
|
Restructuring liability as of July 1, 2011
|
$
|
3.2
|
|
$
|
1.8
|
|
$
|
5.0
|
|
||
|
Provision related to Fiscal 2011 Plan
|
0.9
|
|
1.4
|
|
2.3
|
|
|||||
|
Cash payments
|
(3.1
|
)
|
(2.0
|
)
|
(5.1
|
)
|
|||||
|
Restructuring liability as of June 29, 2012
|
1.0
|
|
1.2
|
|
2.2
|
|
|||||
|
Provision related to Fiscal 2013-2014 Plan
|
1.8
|
|
—
|
|
1.8
|
|
|||||
|
Provision related to Fiscal 2011 Plan
|
1.2
|
|
0.1
|
|
1.3
|
|
|||||
|
Cash payments
|
(2.1
|
)
|
(0.5
|
)
|
(2.6
|
)
|
|||||
|
Restructuring liability as of June 28, 2013
|
1.9
|
|
0.8
|
|
2.7
|
|
|||||
|
Provision related to Fiscal 2014-2015 Plan
|
5.4
|
|
0.4
|
|
5.8
|
|
|||||
|
Provision related to Fiscal 2013-2014 Plan
|
1.0
|
|
4.3
|
|
5.3
|
|
|||||
|
Cash payments
|
(6.8
|
)
|
(1.8
|
)
|
(8.6
|
)
|
|||||
|
Restructuring liability as of June 27, 2014
|
$
|
1.5
|
|
$
|
3.7
|
|
$
|
5.2
|
|
||
|
Current portion of restructuring liability as of June 27, 2014
|
$
|
2.8
|
|
||||||||
|
Long-term portion of restructuring liability (included in
other long-term liabilities) as of June 27, 2014
|
$
|
2.4
|
|
||||||||
Stock Incentive Programs
2007 Stock Equity Plan
As of
June 27, 2014
, we had
one
stock incentive plan for our employees and nonemployee directors, the 2007 Stock Equity Plan, as amended and restated effective November 17, 2011 (the “2007 Stock Plan”). The 2007 Stock Plan provides for accelerated vesting of certain share-based awards if there is a change in control of the Company. The 2007 Stock Plan also provides for the issuance of share-based awards in the form of stock options, stock appreciation rights, restricted stock awards and units, and performance share awards and units. We have various incentive programs under the 2007 Stock Plan, including annual and long-term incentive programs ("AIP" or "LTIP"), a global equity program ("GEP") and product development incentive programs (“PDIP”).
Under the 2007 Stock Plan, option exercise prices are equal to the fair market value on the date the options are granted using our closing stock price. Options may be exercised for a period set at the time of grant, which is generally
seven years
after the date of grant. Options generally vest in installments on one of three vesting schedules: (1)
50%
one year from the grant date and
25%
each year thereafter over a
three
-year period from the date of grant; (2) one-third annually over a
three
-year period from the date of grant; or (3)
one-fourth
annually over a
four
-year period from date of grant. Stock options are issued to directors annually and generally vest on the day before the annual shareholders' meeting.
Restricted stock is not transferable until vested and the restrictions lapse upon the achievement of continued employment or service over a specified time period. Restricted stock issued to employees generally vests either one-third annually over a three-year period from the date of grant or in full three years after the grant date. Restricted stock is issued to directors annually and generally vests on the day before the annual shareholders' meeting.
Vesting of performance shares under our AIP, LTIP or GEP is subject to financial performance criteria including revenue, operating income, or cash flow targets for the periods as defined in the programs and continued employment through the end of the applicable period. Performance shares under our PDIPs are issued to employees related to certain
69
new product development projects and vest upon achievement of the product development milestones as defined in the programs.
Upon the exercise of stock options, vesting of restricted stock awards and units, or vesting of performance share awards and units, we issue new shares of our common stock to our employees. All awards that are canceled prior to vesting or expire unexercised are returned to the approved pool of reserved shares under the 2007 Stock Plan and made available for future grants. Shares of our common stock remaining available for future issuance under the 2007 Stock Plan totaled
3,599,382
as of
June 27, 2014
.
Acquisition Plan
We assumed all of the former Stratex outstanding stock options as of January 26, 2007, as part of the Stratex acquisition. The outstanding former Stratex options became fully vested in fiscal 2011.
Employee Stock Purchase Plan
Under the Employee Stock Purchase Plan (“ESPP”), employees are entitled to purchase shares of our common stock at a
5%
discount from the fair market value at the end of a
three
-month purchase period. As of
June 27, 2014
,
766,257
shares were reserved for future issuances under the ESPP. We issued
21,493
shares under the ESPP during fiscal
2014
.
Share-Based Compensation
Total compensation expense for share-based awards included in our consolidated statements of operations for fiscal
2014, 2013 and 2012
was as follows:
|
Fiscal Year
|
|||||||||||
|
(In millions)
|
2014
|
2013
|
2012
|
||||||||
|
By Expense Category:
|
|||||||||||
|
Cost of product sales and services
|
$
|
0.1
|
|
$
|
0.5
|
|
$
|
0.7
|
|
||
|
Research and development
|
0.3
|
|
1.0
|
|
0.9
|
|
|||||
|
Selling and administrative
|
3.0
|
|
4.9
|
|
3.6
|
|
|||||
|
Total share-based compensation expense
|
$
|
3.4
|
|
$
|
6.4
|
|
$
|
5.2
|
|
||
|
By Types of Award:
|
|||||||||||
|
Options
|
$
|
1.9
|
|
$
|
2.5
|
|
$
|
2.6
|
|
||
|
Restricted stock awards
|
0.7
|
|
1.5
|
|
1.8
|
|
|||||
|
Performance shares
|
0.8
|
|
2.4
|
|
0.8
|
|
|||||
|
Total share-based compensation expense
|
$
|
3.4
|
|
$
|
6.4
|
|
$
|
5.2
|
|
||
As of
June 27, 2014
, there was
$2.7 million
of total unrecognized compensation expense related to nonvested stock options and restricted stock awards and units granted under our 2007 Stock Equity Plan. This expense is expected to be recognized over a weighted-average period of
1.7
years.
Stock Options
A summary of the combined stock option activity under our equity plans during fiscal
2014
is as follows:
70
|
Shares
|
Weighted
Average
Exercise Price
|
Weighted
Average
Remaining
Contractual
Life
|
Aggregate
Intrinsic
Value
|
|||||
|
|
|
|
(Years)
|
($ in millions)
|
||||
|
Options outstanding as of June 28, 2013
|
6,190,564
|
|
$3.95
|
4.85
|
$1.0
|
|||
|
Granted
|
2,263,978
|
|
$2.36
|
|||||
|
Exercised
|
(27,958
|
)
|
$2.09
|
|||||
|
Forfeited
|
(789,035
|
)
|
$3.85
|
|||||
|
Expired
|
(88,550
|
)
|
$20.18
|
|||||
|
Options outstanding as of June 27, 2014
|
7,548,999
|
|
$3.31
|
4.53
|
$0.0
|
|||
|
Options exercisable as of June 27, 2014
|
4,344,589
|
|
$3.98
|
3.59
|
$0.0
|
|||
|
Options vested and expected to vest as of June 27, 2014
|
7,211,372
|
|
$3.35
|
4.41
|
$0.0
|
|||
The aggregate intrinsic value represents the total pre-tax intrinsic value or the aggregate difference between the closing price of our common stock on
June 27, 2014
of
$1.25
and the exercise price for in-the-money options that would have been received by the optionees if all options had been exercised on
June 27, 2014
. The options expected to vest are the result of applying the pre-vesting forfeiture rate assumptions to total outstanding options.
Additional information related to our stock options is summarized below:
|
Fiscal Year
|
|||||||||||
|
(In millions, except per share amounts)
|
2014
|
2013
|
2012
|
||||||||
|
Weighted average grant date fair value per share granted
|
$
|
1.06
|
|
$
|
1.30
|
|
$
|
1.22
|
|
||
|
Intrinsic value of options exercised
|
$
|
—
|
|
$
|
—
|
|
$
|
—
|
|
||
|
Fair value of options vested
|
$
|
2.2
|
|
$
|
3.0
|
|
$
|
3.0
|
|
||
The fair value of each option grant under our 2007 Stock Equity Plan was estimated using the Black-Scholes option pricing model on the date of grant. A summary of the significant weighted average assumptions we used in the Black-Scholes valuation model is as follows:
|
Fiscal Year
|
||||||||
|
2014
|
2013
|
2012
|
||||||
|
Expected dividends
|
—
|
%
|
—
|
%
|
—
|
%
|
||
|
Expected volatility
|
54.1
|
%
|
64.9
|
%
|
65.9
|
%
|
||
|
Risk-free interest rate
|
1.26
|
%
|
0.49
|
%
|
0.73
|
%
|
||
|
Expected term (years)
|
4.43
|
|
4.33
|
|
4.46
|
|
||
Expected volatility is based on implied volatility for the expected term of the options from our stock price. The expected term of the options is calculated using the simplified method described in the SEC’s Staff Accounting Bulletins Topic 14.D.2. We use the simplified method because we do not have sufficient stock option exercise data and the types of employees that receive share option grants have been significantly changed due to the implementation of our 2012 global equity plan, under which we granted share-based awards to employees who are not eligible for the long-term incentive programs. The risk-free rate for the expected term of the option is based on the U.S. Treasury yield curve in effect at the time of grant. The expected dividend yield is zero because we have not historically paid dividends on our common stock and have no intention to pay dividends in the foreseeable future. The following summarizes all of our stock options outstanding and exercisable as of
June 27, 2014
:
71
|
|
Options Outstanding
|
|
|
||||||||||
|
|
Number
Outstanding
|
Weighted
Average
Remaining
Contractual
Life
|
Weighted
Average
Exercise Price
|
Options Exercisable
|
|||||||||
|
Actual Range of Exercise Prices
|
Number
Exercisable
|
Weighted
Average
Exercise Price
|
|||||||||||
|
|
(Years)
|
||||||||||||
|
$1.72
|
—
|
$2.11
|
1,357,137
|
|
4.72
|
$2.06
|
851,497
|
|
$2.08
|
||||
|
$2.19
|
—
|
$2.37
|
1,768,886
|
|
5.14
|
$2.28
|
713,288
|
|
$2.34
|
||||
|
$2.41
|
—
|
$2.60
|
1,708,065
|
|
5.65
|
$2.58
|
331,416
|
|
$2.56
|
||||
|
$2.71
|
—
|
$4.36
|
1,369,577
|
|
3.76
|
$3.58
|
1,103,054
|
|
$3.78
|
||||
|
$4.42
|
—
|
$6.44
|
1,244,431
|
|
2.32
|
$6.03
|
1,244,431
|
|
$6.03
|
||||
|
$6.50
|
—
|
$24.60
|
100,903
|
|
2.31
|
$12.57
|
100,903
|
|
$12.57
|
||||
|
$1.72
|
—
|
$24.60
|
7,548,999
|
|
4.43
|
$3.30
|
4,344,589
|
|
$3.97
|
||||
Restricted Stock
A summary of the status of our restricted stock as of
June 27, 2014
and changes during fiscal
2014
were as follows:
|
Shares
|
Weighted Average
Grant Date
Fair Value
|
|||
|
Restricted stock outstanding as of June 28, 2013
|
562,045
|
|
$3.27
|
|
|
Granted
|
104,475
|
|
$1.96
|
|
|
Vested and released
|
(325,112
|
)
|
$3.35
|
|
|
Forfeited
|
(26,750
|
)
|
$2.66
|
|
|
Restricted stock outstanding as of June 27, 2014
|
314,658
|
|
$2.80
|
|
The fair value of each restricted stock grant is based on the closing price of our common stock on the date of grant and is amortized to compensation expense over its vesting period. The total fair value of restricted stock that vested during fiscal
2014, 2013 and 2012
was
$0.7 million
,
$1.9 million
and
$0.6 million
, respectively.
Performance Share Awards
A summary of the status of our performance shares as of
June 27, 2014
and changes during fiscal
2014
were as follows:
|
Shares
|
Weighted Average
Grant Date
Fair Value
|
|||
|
Performance shares outstanding as of June 28, 2013
|
1,626,362
|
|
$2.91
|
|
|
Granted
|
—
|
|
N/A
|
|
|
Vested and released
|
(1,187,796
|
)
|
$2.37
|
|
|
Forfeited due to target thresholds not achieved
|
(359,274
|
)
|
$4.67
|
|
|
Forfeited due to terminations
|
(12,625
|
)
|
$5.13
|
|
|
Performance shares outstanding as of June 27, 2014
|
66,667
|
|
$2.59
|
|
The fair value of each performance share is based on the closing price of our common stock on the date of grant and is amortized over its vesting period. We begin recognize share-based compensation costs for the performance shares when achievement of the performance conditions is considered probable. Any previously recognized compensation cost would be reversed if the performance condition is not satisfied or if it is not probable that the performance conditions will be achieved.
The total fair value of performance share awards that vested during fiscal
2014, 2013 and 2012
was
$3.0 million
,
$0.9 million
and
$0.3 million
, respectively.
72
We operate in
one
reportable business segment: the design, manufacturing and sale of a range of wireless networking products, solutions and services. We conduct business globally and our sales and support activities are managed on a geographic basis. Our Chief Executive Officer is the Chief Operating Decision Maker (the “CODM”). Our CODM manages our business primarily by function globally and reviews financial information on a consolidated basis, accompanied by disaggregated information about revenues by geographic region, for purposes of allocating resources and evaluating financial performance. The profitability of our geographic region is not a determining factor in allocating resources and the CODM does not evaluate profitability below the level of the consolidated company.
We report revenue by region and country based on the location where our customers accept delivery of our products and services. Revenue by region for
2014, 2013 and 2012
were as follows:
|
|
Fiscal Year
|
||||||||||
|
(In millions)
|
2014
|
2013
|
2012
|
||||||||
|
North America
|
$
|
142.0
|
|
$
|
180.5
|
|
$
|
164.9
|
|
||
|
Africa and Middle East
|
108.9
|
|
182.2
|
|
147.7
|
|
|||||
|
Europe and Russia
|
36.0
|
|
48.0
|
|
53.6
|
|
|||||
|
Latin America and Asia Pacific
|
59.1
|
|
60.6
|
|
77.8
|
|
|||||
|
Total Revenue
|
$
|
346.0
|
|
$
|
471.3
|
|
$
|
444.0
|
|
||
Revenue by country comprising more than
5%
of our total revenue for fiscal
2014, 2013 and 2012
were as follows:
|
(In millions, except %)
|
Revenue
|
% of
Total Revenue
|
||||
|
Fiscal 2014:
|
||||||
|
United States
|
$
|
139.2
|
|
40.2
|
%
|
|
|
Nigeria
|
$
|
52.2
|
|
15.1
|
%
|
|
|
Fiscal 2013:
|
||||||
|
United States
|
$
|
177.0
|
|
37.6
|
%
|
|
|
Nigeria
|
$
|
92.7
|
|
19.7
|
%
|
|
|
Fiscal 2012:
|
||||||
|
United States
|
$
|
161.6
|
|
36.4
|
%
|
|
|
Nigeria
|
$
|
94.5
|
|
21.3
|
%
|
|
|
France
|
$
|
27.9
|
|
6.3
|
%
|
|
Our long-lived assets, consisting primarily of property, plant and equipment, by geographic areas based on the physical location of the assets as of
June 27, 2014 and June 28, 2013
were as follows:
|
(In millions)
|
June 27,
2014 |
June 28,
2013 |
|||||
|
United States
|
$
|
21.5
|
|
$
|
22.0
|
|
|
|
United Kingdom
|
3.3
|
|
3.5
|
|
|||
|
Other countries
|
4.5
|
|
3.8
|
|
|||
|
Total
|
$
|
29.3
|
|
$
|
29.3
|
|
|
Income (loss) from continuing operations before provision for income taxes during fiscal year
2014, 2013 and 2012
is as follows:
73
|
Fiscal Year
|
|||||||||||
|
2014
|
2013
|
2012
|
|||||||||
|
|
(In millions)
|
||||||||||
|
United States
|
$
|
(25.3
|
)
|
$
|
(4.8
|
)
|
$
|
(5.6
|
)
|
||
|
Foreign
|
(25.3
|
)
|
7.2
|
|
(8.4
|
)
|
|||||
|
Total Income (loss) from continuing operations before income taxes
|
$
|
(50.6
|
)
|
$
|
2.4
|
|
$
|
(14.0
|
)
|
||
Provision for income taxes from continuing operations for fiscal year
2014, 2013 and 2012
were summarized as follows:
|
Fiscal Year
|
|||||||||||
|
2014
|
2013
|
2012
|
|||||||||
|
|
(In millions)
|
||||||||||
|
Current provision (benefit):
|
|||||||||||
|
United States
|
$
|
(0.1
|
)
|
$
|
(0.1
|
)
|
$
|
0.1
|
|
||
|
Foreign
|
1.9
|
|
13.6
|
|
1.4
|
|
|||||
|
State and local
|
—
|
|
—
|
|
—
|
|
|||||
|
1.8
|
|
13.5
|
|
1.5
|
|
||||||
|
Deferred provision (benefit):
|
|||||||||||
|
United States
|
—
|
|
—
|
|
—
|
|
|||||
|
Foreign
|
(0.3
|
)
|
(0.2
|
)
|
—
|
|
|||||
|
State and local
|
—
|
|
—
|
|
—
|
|
|||||
|
(0.3
|
)
|
(0.2
|
)
|
—
|
|
||||||
|
Total provision for income taxes from continuing operations
|
$
|
1.5
|
|
$
|
13.3
|
|
$
|
1.5
|
|
||
The following table summarizes the significant differences between the U.S. Federal statutory tax rate and our effective tax rate from continuing operations for fiscal year
2014, 2013 and 2012
:
|
Fiscal Year
|
||||||||
|
2014
|
2013
|
2012
|
||||||
|
Statutory U.S. federal tax rate
|
(35.0
|
)%
|
35.0
|
%
|
(35.0
|
)%
|
||
|
Valuation allowances
|
30.0
|
%
|
67.4
|
%
|
12.8
|
%
|
||
|
Foreign non-deductible expenses
|
0.9
|
%
|
11.1
|
%
|
—
|
%
|
||
|
State and local taxes, net of U.S. federal tax benefit
|
(1.3
|
)%
|
(1.7
|
)%
|
(1.7
|
)%
|
||
|
Goodwill impairment not deductible
|
—
|
%
|
—
|
%
|
6.6
|
%
|
||
|
Foreign income taxed at rates less than the U.S. statutory rate
|
8.5
|
%
|
(63.9
|
)%
|
4.4
|
%
|
||
|
Dividend from foreign subsidiary
|
—
|
%
|
—
|
%
|
12.1
|
%
|
||
|
Foreign branch income/withholding taxes
|
2.0
|
%
|
27.5
|
%
|
7.2
|
%
|
||
|
Change in uncertain tax positions
|
(1.7
|
)%
|
488.9
|
%
|
—
|
%
|
||
|
Other
|
(0.4
|
)%
|
(10.1
|
)%
|
4.3
|
%
|
||
|
Effective tax rate
|
3.0
|
%
|
554.2
|
%
|
10.7
|
%
|
||
The income tax expense from continuing operations for fiscal year 2014 was
$1.5 million
. The difference between our income tax expense from continuing operations and income tax expense at the statutory rate of
35%
on our pre-tax loss of
$50.6 million
was primarily attributable to losses in tax jurisdictions in which we cannot recognize a tax benefit and increases in foreign withholding taxes.
The income tax expense from continuing operations for fiscal year 2013 was
$13.3 million
. The difference between our income tax expense from continuing operations and income tax benefit at the statutory rate of
35%
on our pre-tax income of
$2.4 million
was primarily attributable to a
$11.7 million
increase in our reserve for uncertain tax positions, losses in tax jurisdictions in which we cannot recognize a tax benefit, and increases in foreign withholding taxes.
74
The income tax expense from continuing operations for fiscal year 2012 was
$1.5 million
. The difference between our income tax expense from continuing operations and income tax benefit at the statutory rate of
35%
on our pre-tax loss of
$14.0 million
was primarily attributable to losses in tax jurisdictions in which we cannot recognize a tax benefit. The tax expense for fiscal year 2012 of
$1.5 million
was primarily attributable to profitable foreign entities for which we have accrued income taxes.
The components of deferred tax assets and liabilities were as follows:
|
|
June 27, 2014
|
June 28, 2013
|
|||||||||||||
|
|
Current
|
Non-Current
|
Current
|
Non-Current
|
|||||||||||
|
|
(In millions)
|
||||||||||||||
|
Deferred tax assets:
|
|||||||||||||||
|
Inventory
|
$
|
12.0
|
|
$
|
—
|
|
$
|
10.5
|
|
$
|
—
|
|
|||
|
Accruals and reserves
|
4.7
|
|
0.1
|
|
5.4
|
|
0.1
|
|
|||||||
|
Bad debts
|
2.4
|
|
—
|
|
2.5
|
|
—
|
|
|||||||
|
Depreciation
|
—
|
|
0.2
|
|
—
|
|
—
|
|
|||||||
|
Amortization
|
—
|
|
4.1
|
|
—
|
|
24.5
|
|
|||||||
|
Stock compensation
|
—
|
|
4.0
|
|
—
|
|
5.6
|
|
|||||||
|
Deferred revenue
|
—
|
|
3.9
|
|
—
|
|
0.7
|
|
|||||||
|
Unrealized exchange gain/loss
|
3.2
|
|
—
|
|
3.6
|
|
—
|
|
|||||||
|
Other
|
1.1
|
|
4.2
|
|
—
|
|
4.8
|
|
|||||||
|
Tax credit carryforwards
|
—
|
|
21.5
|
|
—
|
|
20.3
|
|
|||||||
|
Tax loss carryforwards
|
—
|
|
134.2
|
|
—
|
|
122.3
|
|
|||||||
|
Total deferred tax assets
|
23.4
|
|
172.2
|
|
22.0
|
|
178.3
|
|
|||||||
|
Valuation allowance
|
(21.9
|
)
|
(168.8
|
)
|
(21.1
|
)
|
(176.9
|
)
|
|||||||
|
Deferred tax assets net of valuation allowance
|
1.5
|
|
3.4
|
|
0.9
|
|
1.4
|
|
|||||||
|
Deferred tax liabilities:
|
|||||||||||||||
|
Branch undistributed earnings reserve
|
0.1
|
|
1.4
|
|
1.1
|
|
0.2
|
|
|||||||
|
Depreciation
|
—
|
|
3.8
|
|
—
|
|
0.8
|
|
|||||||
|
Other accruals
|
0.1
|
|
—
|
|
—
|
|
0.7
|
|
|||||||
|
Total deferred tax liabilities
|
0.2
|
|
5.2
|
|
1.1
|
|
1.7
|
|
|||||||
|
Net deferred tax assets (liabilities)
|
$
|
1.3
|
|
$
|
(1.8
|
)
|
$
|
(0.2
|
)
|
$
|
(0.3
|
)
|
|||
Our valuation allowance related to deferred income taxes, as reflected in our consolidated balance sheet, was
$190.7 million
as of
June 27, 2014
and
$198.0 million
as of
June 28, 2013
. The decrease in valuation allowance in fiscal
2014
was primarily due to the decrease of net operating loss in certain foreign jurisdiction.
Tax loss and credit carryforwards as of
June 27, 2014
have expiration dates ranging between one year and no expiration in certain instances. The amount of U.S. federal tax loss carryforwards as of
June 27, 2014
was
$292.2 million
and begin to expire in fiscal 2023. Credit carryforwards as of
June 27, 2014
were
$27.3 million
, and certain credits began to expire in fiscal 2017. The amount of foreign tax loss carryforwards as of
June 27, 2014
was
$104.1 million
.
United States income taxes have not been provided on basis differences in foreign subsidiaries of
$5.7 million
and
$5.5 million
, respectively, as of
June 27, 2014
and
June 28, 2013
, because of our intention to reinvest these earnings indefinitely. The residual U.S. tax liability, if such amounts were remitted, would be nominal.
We entered into a tax sharing agreement with Harris effective on January 26, 2007, the date of the acquisition of Stratex. The tax sharing agreement addresses, among other things, the settlement process associated with pre-merger tax liabilities and tax attributes that are attributable to the Microwave Communication Division when it was a division of Harris. There was no settlement payments recorded in fiscal year 2014, 2013 or 2012.
As of
June 27, 2014
and
June 28, 2013
, we had unrecognized tax benefits of
$28.2 million
and
$28.7 million
, respectively, for various federal, foreign, and state income tax matters. Our total unrecognized tax benefits that, if recognized, would affect our effective tax rate were
$1.0 million
as of
June 27, 2014
. These unrecognized tax benefits are presented on the accompanying consolidated balance sheet net of the tax effects of net operating loss carryforwards.
75
We account for interest and penalties related to unrecognized tax benefits as part of our provision for income taxes. We accrued such interest of
$0.1 million
as of
June 27, 2014
and
$0.1 million
as of
June 28, 2013
. No penalties have been accrued.
During the current year, we received an assessment letter from the Inland Revenue Authority of Singapore (“Singapore”) related to deductions claimed in prior years and made a prepayment of
$13.2 million
related to tax years 2007 through 2010, reflecting all of the taxes incrementally assessed by Singapore. We continue to defend our tax positions in Singapore and we continue to pursue remedies to object to this assessment. During the next twelve months, it is reasonably possible that an ultimate settlement will be achieved which will result in our unrecognized tax benefits changing by up to
$14.0 million
. We believe that we have adequately provided for any reasonably foreseeable outcomes related to our tax audits.
Our unrecognized tax benefit activity for fiscal
2014, 2013 and 2012
is as follows:
|
Amount
|
|||
|
(In millions)
|
|||
|
Unrecognized tax benefit as of July 1, 2011
|
$
|
14.0
|
|
|
Additions for tax positions in prior periods
|
—
|
|
|
|
Decreases for tax positions in prior periods
|
(0.6
|
)
|
|
|
Unrecognized tax benefit as of June 29, 2012
|
13.4
|
|
|
|
Additions for tax positions in current periods
|
0.7
|
|
|
|
Additions for tax positions in prior periods
|
15.0
|
|
|
|
Decreases for tax positions in prior periods
|
(0.4
|
)
|
|
|
Unrecognized tax benefit as of June 28, 2013
|
28.7
|
|
|
|
Additions for tax positions in prior periods
|
8.7
|
|
|
|
Decreases for tax positions in prior periods
|
(12.1
|
)
|
|
|
Increases related to change of foreign exchange rate
|
2.9
|
|
|
|
Unrecognized tax benefit as of June 27, 2014
|
$
|
28.2
|
|
We have a number of years with open tax audits which vary from jurisdiction to jurisdiction. Our major tax jurisdictions include the U.S., Singapore and Nigeria. The earliest years still open and subject to potential audits for these jurisdictions are as follows: U.S. —2003; Singapore — 2006; and Nigeria — 2011.
Operating Lease Commitments
We lease office and manufacturing facilities under non-cancelable operating leases expiring at various dates through April 2020. We lease approximately
129,000
square feet of office space in Santa Clara, California as our corporate headquarters. As of
June 27, 2014
, future minimum lease payments for our headquarters total
$15.1 million
through April 2020. We vacated approximately half of our Santa Clara headquarters building and made it available for sublease at September 27, 2013.
As of
June 27, 2014
, our future minimum lease payments under all non-cancelable operating leases with an initial lease term in excess of one year were as follows:
76
|
Fiscal Years
|
Amount
|
||
|
|
(In millions)
|
||
|
2015
|
$
|
5.0
|
|
|
2016
|
4.1
|
|
|
|
2017
|
2.9
|
|
|
|
2018
|
2.9
|
|
|
|
2019
|
2.9
|
|
|
|
Thereafter
|
2.4
|
|
|
|
Total
|
$
|
20.2
|
|
These commitments do not contain any material rent escalations, rent holidays, contingent rent, rent concessions, leasehold improvement incentives or unusual provisions or conditions. We sublease a portion of our facilities to third parties and total minimum rentals to be received in the future under our noncancelable subleases was
$0.1 million
as of
June 27, 2014
.
Rental expense for operating leases, including rentals on a month-to-month basis was
$7.7 million
,
$8.5 million
and
$9.3 million
in fiscal
2014, 2013 and 2012
, respectively.
Purchase Orders and Other Commitments
From time to time in the normal course of business we may enter into purchasing agreements with our suppliers that require us to accept delivery of, and remit full payment for, finished products that we have ordered, finished products that we requested be held as safety stock, and work in process started on our behalf in the event we cancel or terminate the purchasing agreement. Because these agreements do not specify fixed or minimum quantities, do not specify minimum or variable price provisions, and do not specify the approximate timing of the transaction, and we have no present intention to cancel or terminate any of these agreements, we currently do not believe that we have any future liability under these agreements. As of
June 27, 2014
, we had outstanding purchase obligations with our suppliers or contract manufacturers of
$48.3 million
.
Financial Guarantees and Commercial Commitments
Guarantees issued by banks, insurance companies or other financial institutions are contingent commitments issued to guarantee our performance under borrowing arrangements, such as bank overdraft facilities, tax and customs obligations and similar transactions or to ensure our performance under customer or vendor contracts. The terms of the guarantees are generally equal to the remaining term of the related debt or other obligations and are generally limited to
two
years or less. As of
June 27, 2014
, we had no guarantees applicable to our debt arrangements.
We have entered into commercial commitments in the normal course of business including surety bonds, standby letters of credit agreements and other arrangements with financial institutions primarily relating to the guarantee of future performance on certain contracts to provide products and services to customers. As of
June 27, 2014
, we had commercial commitments of
$45.8 million
outstanding that were not recorded in our consolidated balance sheets. We do not believe, based on historical experience and information currently available, that it is probable that any amounts will be required to be paid on the performance guarantees.
Indemnifications
Under the terms of substantially all of our license agreements, we have agreed to defend and pay any final judgment against our customers arising from claims against such customers that our software products infringe the intellectual property rights of a third party. As of
June 27, 2014
, we have not received any notice that any customer is subject to an infringement claim arising from the use of our software products; we have not received any request to defend any customers from infringement claims arising from the use of our software products; and we have not paid any final judgment on behalf of any customer related to an infringement claim arising from the use of our software products. Because the outcome of infringement disputes is related to the specific facts of each case, and given the lack of previous or current indemnification claims, we cannot estimate the maximum amount of potential future payments, if any, related to our indemnification provisions. As of
June 27, 2014
, we had not recorded any liabilities related to these indemnifications.
77
Legal Proceedings
From time to time, we may be involved in various legal claims and litigation that arise in the normal course of our operations. We record accruals for our outstanding legal proceedings, investigations or claims when it is probable that a liability will be incurred and the amount of loss can be reasonably estimated. We evaluate, at least on a quarterly basis, developments in legal proceedings, investigations or claims that could affect the amount of any accrual, as well as any developments that would result in a loss contingency to become both probable and reasonably estimable.
While the results of such claims and litigation cannot be predicted with certainty, we currently believe that we are not a party to any litigation the final outcome of which is likely to have a material adverse effect on our financial position, results of operations or cash flows. However, should we not prevail in any such litigation; it could have a material adverse impact on our operating results, cash flows or financial position.
Contingent Liabilities
We record a loss contingency as a charge to operations when (i) it is probable that an asset has been impaired or a liability has been incurred at the date of the financial statements; and (ii) the amount of the loss can be reasonably estimated. Disclosure in the notes to the financial statements is required for loss contingencies that do not meet both those conditions if there is a reasonable possibility that a loss may have been incurred. Gain contingencies are not recorded until realized. We expense all legal costs incurred to resolve regulatory, legal and tax matters as incurred.
Our Singapore subsidiary is in the process of evaluating its historical compliance with certain export regulations in Singapore. Depending on the results of this evaluation, we may take additional actions to ensure our compliance with these regulations in the future. As part of these additional actions, we could elect to make certain voluntary disclosures, which may, in certain circumstances, result in the imposition of various fines and penalties. Any fines and penalties will be based on the specific facts and findings of our evaluation, as well as negotiation with Singapore authorities. At this time, we cannot estimate the amount or range of any fines and penalties, if any should be imposed.
Periodically, we review the status of each significant matter to assess the potential financial exposure. If a potential loss is considered probable and the amount can be reasonably estimated, we reflect the estimated loss in our results of operations. Significant judgment is required to determine the probability that a liability has been incurred or an asset impaired and whether such loss is reasonably estimable. Further, estimates of this nature are highly subjective, and the final outcome of these matters could vary significantly from the amounts that have been included in our consolidated financial statements. As additional information becomes available, we reassess the potential liability related to our pending claims and litigation and may revise estimates accordingly. Such revisions in the estimates of the potential liabilities could have a material impact on our results of operations and financial position.
The following financial information reflects all normal recurring adjustments, which are, in the opinion of management, necessary for a fair statement of the results of the interim periods. Our fiscal quarters end on the Friday nearest the end of the calendar quarter. Summarized quarterly data for fiscal
2014
and
2013
were as follows:
78
|
Q1
Ended 9/27/2013 |
Q2
Ended 12/272013 |
Q3
Ended 3/28/2014 |
Q4
Ended 6/27/2014 |
||||||||||||
|
|
(In millions, except per share amounts)
|
||||||||||||||
|
Fiscal 2014
|
|||||||||||||||
|
Revenue
|
$
|
93.4
|
|
$
|
85.8
|
|
$
|
81.4
|
|
$
|
85.4
|
|
|||
|
Gross margin
|
$
|
23.1
|
|
$
|
21.3
|
|
$
|
20.9
|
|
$
|
19.8
|
|
|||
|
Operating loss
|
$
|
(13.4
|
)
|
$
|
(10.7
|
)
|
$
|
(14.8
|
)
|
$
|
(11.8
|
)
|
|||
|
Net loss
|
$
|
(13.6
|
)
|
$
|
(9.9
|
)
|
$
|
(14.8
|
)
|
$
|
(12.9
|
)
|
|||
|
Per share data:
|
|||||||||||||||
|
Basic and diluted net loss per common share
|
$
|
(0.22
|
)
|
$
|
(0.16
|
)
|
$
|
(0.24
|
)
|
$
|
(0.21
|
)
|
|||
|
|
Q1
Ended 9/28/2012 |
Q2
Ended 12/28/2012 |
Q3
Ended 3/29/2013 |
Q4
Ended 6/28/2013 |
|||||||||||
|
|
(In millions, except per share amounts)
|
||||||||||||||
|
Fiscal 2013
|
|||||||||||||||
|
Revenue
|
$
|
115.0
|
|
$
|
129.0
|
|
$
|
118.3
|
|
$
|
109.0
|
|
|||
|
Gross margin
|
$
|
33.7
|
|
$
|
38.7
|
|
$
|
34.1
|
|
$
|
33.6
|
|
|||
|
Operating income (loss)
|
$
|
0.7
|
|
$
|
4.9
|
|
$
|
(1.0
|
)
|
$
|
(2.9
|
)
|
|||
|
Net loss
|
$
|
(2.2
|
)
|
$
|
(5.3
|
)
|
$
|
(1.7
|
)
|
$
|
(5.8
|
)
|
|||
|
Per share data:
|
|||||||||||||||
|
Basic and diluted net loss per common share
|
$
|
(0.04
|
)
|
$
|
(0.09
|
)
|
$
|
(0.03
|
)
|
$
|
(0.10
|
)
|
|||
79
The following tables summarize certain charges, expenses and loss (income) from discontinued operations included in our results of operations for each of the fiscal quarters presented:
|
Q1
Ended 9/27/2013 |
Q2
Ended 12/272013 |
Q3
Ended 3/28/2014 |
Q4
Ended 6/27/2014 |
||||||||||||
|
(In millions)
|
|||||||||||||||
|
Fiscal 2014
|
|||||||||||||||
|
Amortization of purchased technology and intangible assets
|
$
|
0.1
|
|
$
|
0.1
|
|
$
|
0.1
|
|
$
|
0.1
|
|
|||
|
Restructuring charges
|
4.5
|
|
0.3
|
|
4.2
|
|
2.1
|
|
|||||||
|
Excess and obsolete inventory mark-downs
|
—
|
|
—
|
|
—
|
|
1.2
|
|
|||||||
|
Transactional tax assessments
|
—
|
|
0.6
|
|
—
|
|
—
|
|
|||||||
|
Share-based compensation expense
|
1.5
|
|
0.7
|
|
0.6
|
|
0.6
|
|
|||||||
|
Warehouse consolidation costs
|
0.2
|
|
—
|
|
—
|
|
—
|
|
|||||||
|
$
|
6.3
|
|
$
|
1.7
|
|
$
|
4.9
|
|
$
|
4.0
|
|
||||
|
Income from discontinued operations
|
$
|
(0.1
|
)
|
$
|
(0.3
|
)
|
$
|
(0.3
|
)
|
$
|
(0.2
|
)
|
|||
|
|
Q1
Ended 9/28/2012 |
Q2
Ended 12/28/2012 |
Q3
Ended 3/29/2013 |
Q4
Ended 6/28/2013 |
|||||||||||
|
(In millions)
|
|||||||||||||||
|
Fiscal 2013
|
|||||||||||||||
|
Amortization of purchased technology and intangible assets
|
$
|
0.3
|
|
$
|
0.2
|
|
$
|
0.3
|
|
$
|
0.2
|
|
|||
|
Restructuring charges
|
0.3
|
|
0.2
|
|
0.4
|
|
2.2
|
|
|||||||
|
Transactional tax assessments
|
0.7
|
|
—
|
|
0.7
|
|
—
|
|
|||||||
|
Share-based compensation expense
|
1.5
|
|
1.9
|
|
1.4
|
|
1.6
|
|
|||||||
|
Other
|
—
|
|
—
|
|
—
|
|
(0.7
|
)
|
|||||||
|
$
|
2.8
|
|
$
|
2.3
|
|
$
|
2.8
|
|
$
|
3.3
|
|
||||
|
Loss from discontinued operations
|
$
|
1.4
|
|
$
|
0.3
|
|
$
|
0.1
|
|
$
|
2.3
|
|
|||
80
Item 9.
Changes in and Disagreements with Accountants on Accounting and Financial Disclosure
Not applicable.
Item 9A.
Controls and Procedures
(a) Management’s Report on Internal Control over Financial Reporting
Our management is responsible for establishing and maintaining adequate internal control over financial reporting (as defined in Rules 13a-15(f) and 15d-15(f) under the Exchange Act). Internal control over financial reporting is a process designed by, or under the supervision of, the Chief Executive Officer and Chief Financial Officer, or persons performing similar functions, and effected by the board of directors, management and other personnel, to provide reasonable assurance regarding the reliability of financial reporting and the preparation of financial statements for external purposes in accordance with U.S. GAAP and includes those policies and procedures that: (i) pertain to the maintenance of records that in reasonable detail accurately and fairly reflect the transactions and dispositions of the assets of the Company; (ii) provide reasonable assurance that transactions are recorded as necessary to permit preparation of financial statements in accordance with U.S. GAAP, and that receipts and expenditures of the Company are being made only in accordance with authorizations of management and directors of the Company; and (iii) provide reasonable assurance regarding prevention or timely detection of unauthorized acquisition, use or disposition of the Company’s assets that could have a material effect on the financial statements.
Because of inherent limitations, internal control over financial reporting may not prevent or detect misstatements. Also, projections of any evaluation of effectiveness to future periods are subject to the risk that controls may become inadequate because of changes in conditions or that the degree of compliance with the policies or procedures may deteriorate.
Under the supervision and with the participation of management, including our Chief Executive Officer and Chief Financial Officer, management has assessed the effectiveness of the Company’s internal control over financial reporting based on the criteria set forth in the Internal Control - Integrated Framework (1992) issued by the Committee of Sponsoring Organizations of the Treadway Commission.
A material weakness is a control deficiency or a combination of control deficiencies that results in more than a remote likelihood that a material misstatement of the annual or interim financial statements will not be prevented or detected. In connection with the Company’s assessment of the effectiveness of internal control over financial reporting, the Company's management identified the following material weaknesses that existed as of June 27, 2014:
|
•
|
COSO Components, Excluding Control Activities.
We determined that our controls pertaining to the control environment, risk assessment, monitoring activities and information and communication activities did not operate effectively, resulting in a material weakness pertaining to these COSO components. Specifically, (i) with respect to the control environment, we did not maintain a sufficient complement of adequately trained personnel with an appropriate level of knowledge, experience, skills and training commensurate with our financial reporting requirements and business environment; (ii) with respect to risk assessment, we did not identify risks associated with (a) implementing our newly installed worldwide enterprise resource planning system, used for financial reporting purposes, including assessing the adequacy of staffing levels and training needs of our global accounting and financial reporting staff, segregation of duty conflicts and the adequacy and effectiveness of compensating controls; (b) the completeness and accuracy of information underlying accounting estimates used in management review controls and procedures, including appropriately documenting risk tolerance and precision of such controls; and (c) certain processes, further noted in the Control Activities discussion below, resulting in inadequately designed control activities; (iii) with respect to information and communication, we did not (a) sufficiently promote an appropriate level of control awareness or commit appropriate human or financial resources to support the development of necessary information systems, including system controls and training related to our newly installed worldwide enterprise resource planning system; and (b) ensure the completeness, accuracy and timeliness of communications between the project management and accounting functions regarding our percentage-of-completion contracts; and (iv) with respect to monitoring activities, (a) we did not design and maintain effective controls for the review, supervision and monitoring of our accounting operations and evaluating the adequacy of our internal control over financial reporting, including adequate documentation of control performance; (b) there were insufficient procedures to effectively determine the adequacy of our internal control over financial reporting; and (c) due to unanticipated turnover in the finance organization late in our fiscal year we did not maintain a sufficient number of accounting professionals with an appropriate level of knowledge, experience, skills and
|
81
training to monitor our compliance with internal control over financial reporting at both our domestic and international locations. The deficiencies in these COSO components are interrelated and represent a material weakness. This material weakness contributed to the other material weaknesses described below and an environment where there was more than a remote likelihood that a material misstatement of the interim and annual consolidated financial statements could occur and not be prevented or detected. As a result, adjustments to various accounts were made to correct immaterial errors to the financial statements.
|
•
|
Control Activities - Manual journal entries.
The design and operating effectiveness of our controls were inadequate to ensure that appropriate documentation was identified, accumulated and maintained to support manual journal entries and that such manual journal entries were independently reviewed and approved.
|
|
•
|
Control Activities - Account reconciliations.
The design and operating effectiveness of our controls were inadequate to ensure that account reconciliations,including intercompany account reconciliations and eliminations, were reviewed and approved for accuracy and completeness and that we identified, accumulated and documented appropriate information necessary to support account balances.
|
|
•
|
Control Activities - Revenue Recognition on Percentage-of-Completion ("POC") Contracts.
The design and operating effectiveness of our controls were inadequate to ensure that the reported amount and timing of revenue recognition was accurate.
|
Although no material errors were identified in our audited financial statements, these material weaknesses resulted in a reasonable possibility that a material misstatement of our annual or interim consolidated financial statements would not be prevented or detected on a timely basis.
The material weaknesses identified by management could result in a material misstatement to our annual or interim financial statements that would not be prevented or detected. Management has concluded that our internal control over financial reporting was not effective as of June 27, 2014 due to the material weaknesses identified. We reviewed the results of management’s assessment with the Audit Committee of the Company’s Board of Directors.
KPMG LLP, our independent registered public accounting firm, has issued an attestation report regarding its assessment of our internal control over financial reporting as of
June 27, 2014
, as set forth at the beginning of Part II, Item 8 of this Annual Report on Form 10-K.
(b) Evaluation of Disclosure Controls and Procedures
Disclosure controls and procedures are controls and other procedures that are designed to ensure that information required to be disclosed in our reports filed or submitted under the Exchange Act is recorded, processed, summarized and reported, within the time periods specified in the SEC’s rules and forms. Disclosure controls and procedures include, without limitation controls and procedures designed to ensure that information required to be disclosed in our reports filed or submitted under the Exchange Act is accumulated and communicated to management, including our Chief Executive Officer and Chief Financial Officer, as appropriate to allow timely decisions regarding required disclosure.
As of
June 27, 2014
, management carried out an evaluation, under the supervision and with the participation of our Chief Executive Officer and Chief Financial Officer, of the effectiveness of our disclosure controls and procedures. Based upon the evaluation and as a result of the material weaknesses described above, our Chief Executive Officer and Chief Financial Officer concluded that, as of June 27, 2014, our disclosure controls and procedures were not effective at the reasonable assurance level.
There are inherent limitations to the effectiveness of any system of disclosure controls and procedures. Accordingly, even effective disclosure controls and procedures can only provide reasonable assurances of achieving their control objectives.
(c) Changes in Internal Control over Financial Reporting
Other than the material weaknesses noted above, there were no changes in our internal control over financial reporting during the quarter ended
June 27, 2014
that have materially affected, or are reasonably likely to materially affect, our internal control over financial reporting.
Subsequent to our
June 27, 2014
fiscal year end, we began taking a number of actions, including designing and implementing new controls and revising existing controls, in order to remediate the material weaknesses described above. We expect to continue our remediation efforts, including testing of operating effectiveness of new controls, as
82
described below under “Remedial Actions to Address Material Weaknesses” during the fiscal year ending
July 3, 2015
and we plan to provide an update on the status of our remediation activities on a quarterly basis.
(d) Remedial Actions to Address Material Weaknesses
We continue to evaluate the effectiveness of our remediation efforts, including demonstrating that the new or improved controls operate effectively for a reasonable period of time. If appropriate, we expect to make further changes to our internal controls. The following actions have been taken, or we expect to take as soon as practicable, to strengthen our controls and organizational structure:
|
•
|
To address issues with recent employee turnover, we hired new accounting personnel with an appropriate level of knowledge, experience and skill sets commensurate with our newly installed enterprise resource planning system and business environment. We expect to continue to evaluate our needs for new and additional personnel. We leveraged the services of consulting firms and expect to continue to do so to assist us with strengthening our internal controls and documentation. We expect to provide training in order to enhance the level of communications and understanding of controls with key individuals that provide critical information used in financial accounting and reporting on matters relating to our business and operations
.
|
|
•
|
We expect to enhance our risk assessment process. With regard to risks associated with our newly installed worldwide enterprise resource planning system, we have identified subject matter experts (“SME”) and SME backups for each of the eight functional areas in our finance organization. The SMEs are expected to lead an international team of users in training, developing global processes and in logging and tracking system issues. The SMEs are expected to also be responsible for documenting all processes and coordinating all training materials and expected to have sufficient resources at our disposal to accomplish their tasks. With regard to procedures to ensure the completeness and accuracy of information used in the performance of control activities, we expect toe enhance oversight of accounting estimates and the precision level of those estimates. We expect to update policies and procedures in key areas, particularly with respect to areas that involve management judgment and the use of estimates
.
|
|
•
|
We are implementing processes to improve monitoring activities involving the review and supervision of our accounting operations. We expect this to involve (i)implementing increased and enhanced balance sheet reviews to allow more focus on quality account reconciliations; (ii) enhancing monitoring over international activities; and (iii) implementing more rigorous intercompany reconciliation procedures.
|
|
•
|
We have implemented a formal policy that expressly prohibits a manual journal entry being created and approved by the same employee. Further, we have implemented a process that includes the creation of a journal entry report that identifies the preparer and the approver of each journal entry. The report will be reviewed each month by senior accounting personnel so that any exceptions to the policy can be identified on a timely basis and appropriately addressed.
|
|
•
|
To improve the timeliness and accuracy of updates to revenue and cost estimates and the completeness and accuracy of POC revenue recognition, we implemented procedures to allow for more timely and accurate communications between field service project managers and accounting personnel and improved procedures.
|
Item 9B.
Other Information
None.
83
Item 10.
Directors, Executive Officers and Corporate Governance
Executive Officers
Information regarding our executive officers appears in Part I, Item 1 of this Annual Report on Form 10-K.
Board Members
The authorized size of the Board of Directors (the “Board”) is currently eight. Directors are nominated by the Governance and Nominating Committee of the Board. Except for Mr. Rau, who was elected to the Board on November 9, 2010, and Mr. Pangia, who was elected to the Board on July 18, 2011, all current directors have held office as directors since January 26, 2007, the date of the merger of the Microwave Communications Division (“MCD”) of Harris Corporation (“Harris”) with Stratex Networks, Inc. (“Stratex”), The Board is chaired by Mr. Kissner.
The current members of the Board are:
|
Name
|
Title and Positions
|
|
|
Charles D. Kissner
|
Director, Chairman of the Board
|
|
|
William A. Hasler
|
Director
|
|
|
Clifford H. Higgerson
|
Director
|
|
|
Michael A. Pangia
|
Director, President and CEO
|
|
|
Raghavendra Rau
|
Director
|
|
|
Dr. Mohsen Sohi
|
Director
|
|
|
Dr. James C. Stoffel
|
Lead Independent Director
|
|
|
Edward F. Thompson
|
Director
|
|
The Board has determined that each of our current directors except Mr. Kissner and Mr. Pangia has no relationship that would interfere with the exercise of independent judgment in carrying out the responsibilities of a director and is otherwise independent in accordance with listing rules of the NASDAQ Stock Market (the “NASDAQ Listing Rules”).
All of our directors are requested to attend our annual meetings of stockholders. Seven of our directors attended the 2013 Annual Meeting.
Board and Committee Meetings and Attendance
During fiscal year 2014, the Board held nine meetings. Each of the board members attended at least 77% of the total number of Board meetings and at least 78% of the total number of meetings of the committee or committees on which the member served during fiscal year 2014.
Board Member Qualifications
Our Board believes that its members should encompass a range of talents, skills and expertise, which enables the Board to provide sound guidance with respect to the Company’s operations and interest. Our Board prefers a variety of professional experiences and backgrounds among its members. In addition to considering a candidate’s experiences and background, candidates are reviewed in the context of the current composition of the Board and evolving needs of our businesses. In particular, the Board has sought to include members that have experience in establishing, growing and leading communications companies in senior management positions and serving on the board of directors of other companies. In determining that each of the members of the Board is qualified to be a director, the Board has relied on the attributes listed below and, where applicable, on the direct personal knowledge of each of the members’ prior service on the Board.
84
Directors’ Biographies
The following is a brief description of the business experience and background of each nominee for director, including the capacities in which each has served during at least the past five years:
Mr. Charles D. Kissner
, age 67, currently serves as our Chairman of the Board. Mr. Kissner served as our Executive Chairman from July 2011 to July 2012 and again from July 2014 to December 2014, and served as non-Executive Chairman from July 2012 to July 2014. Mr. Kissner served as CEO and Chairman of the Board of Aviat from July 2010 to July 2011. He was CEO of Stratex from July 1995 through May 2000, and again from October 2001 to May 2006. He was elected a director of Stratex in July 1995 and Chairman in August 1996. Mr. Kissner also served as Vice President and General Manager of M/A-COM, Inc., a manufacturer of radio and microwave communications products, from July 1993 to July 1995. Prior to that, he was President and CEO of Aristacom International Inc., a communications software company, and Executive Vice President and a Director of Fujitsu Network Switching, Inc. He also held a number of executive positions at AT&T (now Alcatel-Lucent). Mr. Kissner currently serves as Chairman of the board of directors of ShoreTel, Inc., an IP business telephony systems company. He also serves on the board of directors of Meru Networks Inc., a provider of advanced enterprise wireless networking systems, Rambus, Inc., a technology licensing company focusing on the development of technologies that enrich the end-user experience of electronic systems, and KQED Public Media, a non-profit organization.
Mr. Kissner brings extensive knowledge of our business, having served on our Board as non-executive Chairman for over three years. He also brings nearly fifteen years of relevant CEO experience having served in that capacity at technology driven companies such as Stratex and Aristacom. Mr. Kissner also brings extensive public company directorship and committee experience to the Board which has been an invaluable resource as our company regularly assesses its corporate governance, corporate compliance and risk management obligations. Mr. Kissner has also directly supervised nearly thirty merger and acquisition activities, which experience has been vital to the assessment and integration of acquisition opportunities.
Mr. William A. Hasler
, age 73, has served as a member of the Board since January 2007. He also serves on the board of directors of Globalstar, Inc., a supplier of satellite communication services, and Rubicon, Ltd., which holds subsidiaries focused in forestry biotechnology. Mr. Hasler served as a member of the Stratex board of directors from August 2001 through January 2007, and was Chairman of the Nominating and Corporate Governance Committee and a member of the Audit Committee. Mr. Hasler served as Chairman of the board of directors of Solectron Corporation from 2003 to 2007 and was a member of that board from 1998 to 2007. He was co-CEO and a Director of Aphton Corp., a biopharmaceutical company, from 1998 to 2003. From 1991 to 1998, Mr. Hasler was Dean of both the Graduate and Undergraduate Schools of Business at the University of California, Berkeley. Prior to his deanship at UC Berkeley, Mr. Hasler was Vice Chairman of KPMG Peat Marwick. He also served as a trustee of Schwab Funds.
Mr. Hasler’s current and prior service on the boards of several technology-driven companies, including Ditech, Globalstar and Rubicon, and his prior service as Chairman of a large publicly traded company provide him with an extensive knowledge base of complex management, financial, operational and governance issues faced by public companies with international operations. He is a member of the audit committee of various public and private companies. Mr. Hasler has extensive experience in Silicon Valley companies and this experience brings our Board important knowledge and expertise related to corporate finance and accounting, strategic planning, manufacturing and operations. He brings valuable financial expertise, including extensive knowledge of accounting, auditing and investments in both public and private companies. Additionally, through his service on public company boards, Mr. Hasler has gained an understanding and expertise in public company governance.
Mr. Clifford H. Higgerson
, age 75, has served as a member of the Board since January 2007. He has more than 40 years of experience in research, consulting, planning and venture investing primarily in the telecommunications industry, with an emphasis on carrier systems and equipment. In 2006, he became a partner with Walden International, a global venture capital firm focused on four key industry sectors: communications, electronics/digital consumer software and IT services, and semiconductors. Mr. Higgerson was a founding partner of ComVentures from 1986 to 2005, and has been a general partner with Vanguard Venture Partners since 1991. He currently serves as a member of the board of directors of Kotura Inc., Xtera Communications Inc., Ygnition Networks, Inc., Ormet Circuits, Inc., Thrupoint, Inc. and Geronimo Windpower. He served as a member of the Stratex board of directors from March 2006 to January 2007 and served on the Compensation and Strategic Business Development Committees. He previously served as a member of the board of directors of Hatteras Networks Inc. and World of Good.
85
Mr. Higgerson has more than 35 years of experience in research, consulting, planning and venture investing. He has served on the boards of other public companies and served as a chair of the audit committee for publicly listed companies. His prior Board experience and his experience in research, strategic planning and corporate finance in technology driven companies provide him with extensive knowledge of complex issues involved in new product development, strategic planning, and financial and governance issues faced by public companies. His extensive experience with private equity firms and investing provides him with critical experience related to capital raising, economic analysis and mergers and acquisitions.
Mr. Michael A Pangia
, age 53, has been our President and CEO and a member of the Board since July 18, 2011. From March 2009 to July 2011, he served as our Chief Sales Officer where he was responsible for company-wide operations of the Global Sales and Services organization. Prior to joining Aviat, Mr. Pangia served as senior vice president, Global Sales Operations and Strategy, at Nortel, where he was responsible for all operational aspects of the Global Sales function. Prior to that, he was president of Nortel’s Asia region, where his key responsibilities included sales and overall business management for all countries in the region where Nortel did business.
Mr. Pangia’s current and prior service as a senior executive officer with large technology driven companies with international operations provide him with an extensive knowledge base of complex management, financial, operational and governance issues faced by public companies with global operations. He also brings a high level of financial literacy to the Board through both formal education and over 15 years’ experience in multiple finance functional areas, including cost accounting, financial planning and analysis, and mergers and acquisitions.
Mr. Raghavendra Rau
, age 65, has served as a member of the Board since November 2010. Mr. Rau most recently served as CEO and a member on the board of directors of SeaChange International Inc., a provider of software based digital video platforms and related services to cable, telecommunications and broadcast television service providers worldwide. In addition, he is a member of the board of iProf, an e-learning company. Previously, Mr. Rau served as a member of the board of directors of Microtune, Inc., prior to its acquisition by Zoran, Inc., from May 2010 to December 2010. Mr. Rau served as Senior Vice President of the Mobile TV Solutions Business of Motorola, Inc. (“Motorola”), from May 2007 until January 2008, and as Senior Vice President of Strategy and Business Development, Networks & Enterprise of Motorola from March 2006 to May 2007. Mr. Rau served as Corporate Vice President of Global Marketing and Strategy for Motorola from 2005 to 2006, and as Corporate Vice President, Marketing and Professional Services, from 2001 to 2005. From October 1992 to 2001, Mr. Rau served in various positions within Motorola, including as Vice President of Strategic Business Planning and Vice President of Sales and Operations and held positions in Asia and Europe. Mr. Rau is a former Chairman of the QuEST Forum, a collaboration of service providers and suppliers dedicated to telecom supply chain quality and performance, and was a Director of the Center for Telecom Management at the University of Southern California. Mr. Rau also served on the Motorola Partnership Board of France Telecom.
Mr. Rau’s financial and business expertise, including his diversified background in global marketing, business strategy, venture capital and market development for communications and high-technology companies, provides him with the qualifications and skills to serve as a director.
Dr. James C. Stoffel
, age 68, currently serves as our lead independent director and has served as a member of the Board since January 2007. Presently, Dr. Stoffel is on the board of directors of Harris Corporation, of which he has been a member since August 2003, and is also a member of its Business Conduct and Corporate Responsibility Committee and Corporate Governance Committee. Additionally, he serves as General Partner of Trillium International, LLC, a private equity company, and is a senior advisor to other private equity companies. He also serves on the boards of the following privately held companies:Display Data, Omni-ID Ltd., Quintel Ltd., Clear Momentum and Intrinsiq Ltd. Prior to his retirement, Dr. Stoffel was Senior Vice President, Chief Technical Officer and Director of Research and Development of Eastman Kodak Company (“Kodak”). He held this position from 2000 to April 2005. He joined Kodak in 1997 as Vice President and Director, Electronic Imaging Products Research and Development, and became Director of Research and Engineering in 1998. Prior to joining Kodak, he was with Xerox Corporation (“Xerox”), where he began his career in 1972. His most recent position with Xerox was Vice President, Corporate Research and Technology. Dr. Stoffel serves on the Advisory Board for Research and Graduate Studies at the University of Notre Dame and is a member of the advisory board of the Applied Science and Technology Research Institute, Hong Kong.
Dr. Stoffel’s prior service as a senior executive of large, publicly traded, technology driven companies, and his more than 30 years’ experience focused on technology development, provide him with an extensive knowledge of the complex technical research and development, management, financial and governance issues faced by a public company with international operations. This experience brings our Board important knowledge and expertise related to research
86
and development, new product introductions, strategic planning, manufacturing, operations and corporate finance. His experience as an advisor to private equity firms also provides him with additional knowledge related to strategic planning, capital raising, mergers and acquisitions and economic analysis. Dr. Stoffel also has gained an understanding of public company governance and executive compensation through his service on public company boards, including as a lead independent director.
Mr. Edward F. Thompson
, age 76, has served as a member of the Board since January 2007. He is currently a member of the board of directors of ShoreTel, Inc., an IP business telephony systems company, InnoPath Software, Inc., ReachLocal Inc., an internet marketing company and XBridge Systems, Inc. a mainframe data discovery company. He is on the Advisory Board of Santa Clara University’s Leavey School of Business. Mr. Thompson served as a member of the Stratex board of directors from November 2002 through January 2007, where he was Chairman of the Audit Committee, and served on the Nominating and Corporate Governance Committee. Mr. Thompson was a consultant to Fujitsu Labs of America from 1995 to 2011. From 1976 to 1994, he held various positions at Amdahl Corporation, a multinational manufacturer of large scale computer systems, including CFO and Corporate Secretary, as well as Chairman and CEO of Amdahl Capital Corporation. Mr. Thompson also held positions at U.S. Leasing International, Inc., Computer Sciences Corporation, International Business Machines and Lockheed Missiles and Space Company. Mr. Thompson has contributed as a director or advisor to a number of companies, including Fujitsu, Ltd. and several of its subsidiaries, and SonicWALL Inc., a provider of Internet security solutions.
Mr. Thompson brings a high level of financial literacy to the Board and substantial public company directorship and committee experience. He is currently designated as an audit committee financial expert and is the audit committee chair on all three public company boards on which he is a member, as well as privately held InnoPath Software. Mr. Thompson’s experience with accounting principles, financial reporting rules and regulations, evaluation of financial results and oversight of the financial reporting process of publicly traded companies makes him a valuable asset to the Board. Mr. Thompson also brings to the Board significant experience in international operations based upon his past experience as a senior advisor to Fujitsu, as a director of several Fujitsu subsidiaries and portfolio companies and as CFO of Amdahl.
Board Leadership
The Board does not have a policy regarding the separation of the roles of CEO and Chairman of the Board as the Board believes that it is in the best interests of the Company for the Board to make that determination based on the position and direction of the Company and the membership of the Board. The members of the Board possess considerable experience and unique knowledge of the challenges and opportunities that the Company faces, and are in the best position to evaluate the needs of the Company and how to best organize the capabilities of the directors and management to meet those needs.
When the CEO also serves as Chairman of the Board, our Corporate Governance Guidelines provide for the appointment of a lead independent director. Accordingly, when our Chairman Charles Kissner was appointed CEO in June 2010, the Board appointed James Stoffel, an independent director, as lead independent director. Although, currently, the roles of the CEO and the Chairman remain separate, upon the recommendation of the Governance and Nominating Committee, the Board has determined to continue the role of the lead independent director for the present time.
The lead independent director is responsible for coordinating the activities of the other independent directors and has the authority to preside at all meetings of the Board at which the Chairman is not present, including executive sessions of the independent directors. The lead independent director may also recommend the retention of outside advisors and consultants who report directly to the Board. The Board believes that appointing a lead independent director to serve along with a CEO and a non-executive Chairman of the Board has enhanced the Board’s oversight of, and independence from, Company management, the ability of the Board to carry out its roles and responsibilities on behalf of our stockholders and our overall corporate governance.
The Board has determined that having Mr. Kissner serve as Chairman is in the best interest of the Company at this time. This structure ensures a greater role for the independent directors in the oversight of the Company and active participation of the independent directors in setting agendas and establishing Board priorities and procedures, and is useful in establishing a system of corporate checks and balances. Separating the Chairman position from the CEO position allows the CEO to focus on setting the strategic direction of the Company and the day-to-day leadership and performance of the Company, while the Chairman leads the Board in its role of, among other things, providing advice to,
87
and overseeing the performance of, the CEO. In addition, managing the Board can be a time-intensive responsibility, and this structure permits Mr. Pangia, our CEO, to focus on the management of the Company’s day-to-day operations.
The Board’s Role in Risk Oversight
Assessing and managing risk is the responsibility of the management of the Company. The Board, through the Governance and Nominating Committee, oversees and reviews certain aspects of the Company’s risk management efforts, focusing on the adequacy of the Company’s risk management and risk mitigation processes. At the Board’s request, management proposed a process for identifying, evaluating and monitoring material risks and such process has been approved by the Board and is currently in effect. This risk management program is overseen by senior management who, in connection with their regular review of the overall business, identify and prioritize a broad range of material risks (e.g., financial, strategic, compliance and operational). Senior management also discusses mitigation plans to address such material risks. Prioritized risks and management’s plans for mitigating such risks are regularly presented to the full Board for discussion and in order to ensure monitoring. In addition to the risk management program, the Board encourages management to promote a corporate culture that incorporates risk management into the Company’s corporate strategy and day-to-day business operations.
A discussion of risk factors in the Company’s compensation design can be found below under the heading “Risk Considerations in Our Compensation Program”.
Principles of Corporate Governance, Bylaws and Other Governance Documents
The Board has adopted Corporate Governance Guidelines and other corporate governance documents that supplement certain provisions of our Bylaws and relate to, among other things, the composition, structure, interaction and operation of the Board. Some of the key governance features of our Corporate Governance Guidelines, Bylaws and other governance documents are summarized below.
Majority Vote Policy in Director Elections.
Aviat’s Corporate Governance Guidelines provide that any nominee for director in an uncontested election (i.e., an election where the number of nominees is not greater than the number of directors to be elected) who receives a greater number of votes “withheld” from his election than votes “for” such election must, promptly following certification of the stockholder vote, offer his resignation to the Board for consideration in accordance with the following procedures. All of these procedures will be completed within 90 days following certification of the stockholder vote.
The Board, through its Qualified Independent Directors (as defined below), will evaluate the best interests of the Company and its stockholders and decides the action to be taken with respect to such offered resignation, which can include, without limitation: (i) accepting the resignation; (ii) accepting the resignation effective as of a future date not later than 180 days following certification of the stockholder vote; (iii) rejecting the resignation but addressing what the Qualified Independent Directors believe to be the underlying cause of the withhold votes; (iv) rejecting the resignation but resolving that the director will not be re-nominated in the future for election; or (v) rejecting the resignation.
In reaching their decision, the Qualified Independent Directors will consider all factors they deem relevant, including but not limited to: (i) any stated reasons why stockholders withheld votes from such director; (ii) the extent to which the “withhold” votes exceed the votes “for” the election of the director and whether the “withhold” votes represent a majority of the outstanding shares of common stock; (iii) any alternatives for curing the underlying cause of the withheld votes; (iv) the director’s tenure; (v) the director’s qualifications; (vi) the director’s past and expected future contributions to the Company; (vii) the overall composition of the Board, including whether accepting the resignation would cause the Company to fail or potentially fail to comply with any applicable law, rule or regulation of the SEC or the NASDAQ Listing Rules; and (viii) whether such director’s continued service on the Board for a specified period of time is appropriate in light of current or anticipated events involving the Company.
Following the Board’s determination, the Company will, within four business days, disclose publicly in a document furnished or filed with the SEC the Board’s decision as to whether or not to accept the resignation offer. The disclosure will also include a description of the process by which the decision was reached, including, if applicable, the reason or reasons for rejecting the offered resignation.
A director who is required to offer his or her resignation in accordance with this policy may not be present during the deliberations or voting whether to accept his or her resignation or, except as otherwise provided below, a resignation
88
offered by any other director in accordance with this policy. Prior to voting, the Qualified Independent Directors may afford the affected director an opportunity to provide any information or statement that he or she deems relevant.
For purposes of this policy, “Qualified Independent Directors” means all directors who (i) are independent directors (as defined in accordance with the NASDAQ Listing Rules); and (ii) are not required to offer their resignation in connection with an election in accordance with this majority voting policy. If there are fewer than three independent directors then serving on the Board who are not required to offer their resignations in accordance with this majority voting policy, then the Qualified Independent Directors means all of the independent directors, and each independent director who is required to offer his resignation in accordance with this majority voting policy must recuse himself from the deliberations and voting only with respect to his individual offer to resign.
All nominees for election as a director in an uncontested election are deemed to have agreed to abide by this majority voting policy and will offer to resign and will resign if requested to do so in accordance with this majority voting policy (and will, if requested, submit an irrevocable resignation letter, subject to this majority voting policy, as a condition to being nominated for election).
Prohibition Against Pledging Aviat Securities and Hedging Transactions.
In accordance with Aviat’s Code of Conduct, directors and executive officers are prohibited from pledging Aviat securities and engaging in hedging transactions with respect to Aviat securities. Aviat specifically prohibits directors and executive officers from holding Aviat securities in any margin account for investment purposes or otherwise using Aviat securities as collateral for a loan. Such persons are also prohibited from purchasing certain instruments (including prepaid variable forward contracts, equity swaps, and collars) and engaging in transactions designed to hedge or offset any decrease in the value of Aviat securities.
Board Committees
The Board maintains an Audit Committee, a Compensation Committee and a Governance and Nominating Committee. Copies of the charters for the Audit Committee, the Compensation Committee and the Governance and Nominating Committee are available on our website
www.investors.aviatnetworks.com/documents.cfm
.
The following table shows, for fiscal year 2014, the Chairman and members of each committee, the number of committee meetings held and the principal functions performed by each committee.
89
|
Committee
|
Number of Meetings in Fiscal 2014
|
Members
|
Principal Functions
|
|||
|
Audit
|
19
|
Edward F. Thompson*
William A. Hasler Raghavendra Rau |
• Selects our independent registered public accounting firm
• Reviews reports of our independent registered public accounting firm
• Reviews and pre-approves the scope and cost of all services, including all non-audit services, provided by the firm selected to conduct the audit
• Monitors the effectiveness of the audit process
• Reviews management’s assessment of the adequacy of financial reporting and operating controls
• Monitors corporate compliance program
|
|||
|
Compensation
|
4
|
Dr. James C. Stoffel*
Clifford H. Higgerson Dr. Mohsen Sohi |
• Reviews our executive compensation policies and strategies
• Oversees and evaluates our overall compensation structure and programs
|
|||
|
Governance and
Nominating |
5
|
William A. Hasler*
James C. Stoffel Clifford H. Higgerson |
• Develops and implements policies and practices relating to corporate governance
• Reviews and monitors implementation of our policies and procedures
• Reviews the process by which management identifies and mitigates key areas of risk and reviews critical risk areas with the Board
• Assists in developing criteria for open positions on the Board
• Reviews and recommends nominees for election of directors to the Board
• Reviews and recommends policies, if needed for selection of candidates for directors
|
|||
* Chairman of Committee
Audit Committee
The Audit Committee is primarily responsible for selecting, and approving the services performed by, our independent registered public accounting firm, as well as reviewing our accounting practices, corporate financial reporting and system of internal controls over financial reporting. The Audit Committee currently consists of Messrs. Thompson (Chairman), Hasler and Rau. No material amendments to the Audit Committee Charter were made during fiscal year 2014. The Audit Committee is comprised of independent, non-employee members of our Board who are “financially sophisticated” under the NASDAQ Listing Rules.
The Board has determined that each of Messrs. Thompson and Hasler qualifies as an “audit committee financial expert,” as defined under Item 407(d)(5)(i) of Regulation S-K under the Securities Act of 1933 and the Exchange Act, but that status does not impose on either of them duties, liabilities or obligations that are greater than the duties, liabilities or obligations otherwise imposed on them as members of our Audit Committee and the Board.
Compensation Committee
The Compensation Committee has the authority and responsibility to approve our overall executive compensation strategy, to administer our annual and long-term compensation plans and to review and make recommendations to the
90
Board regarding executive compensation. The Compensation Committee is comprised of independent, non-employee members of the Board in accordance with NASDAQ Listing Rules. During fiscal year 2014, the Compensation Committee utilized Pearl Meyer & Partners, LLC (“Pearl Meyer”) as an independent, third-party consulting firm.
Compensation Committee Interlock and Insider Participation
The Compensation Committee currently consists of Messrs. Stoffel (Chairman), Higgerson and Sohi. None of these individuals is an officer or employee or former officer of the Company. None of our executive officers currently serves or in the past year has served as a member of the board of directors or compensation committee of any entity that has one or more executive officers serving on our Board or Compensation Committee.
Governance and Nominating Committee
The Governance and Nominating Committee currently consists of Messrs. Hasler (Chairman), Higgerson
,
and Stoffel. Each member of the Governance and Nominating Committee meets the independence requirements of the NASDAQ Listing Rules.
The Governance and Nominating Committee develops and implements policies and practices related to corporate governance consistent with sound corporate governance principles. The Governance and Nominating Committee also reviews the process by which management identifies and mitigates key areas of risk and reviews critical risk areas with the Board.
The Governance and Nominating Committee also recommends candidates to the Board and periodically reviews whether a more formal selection policy should be adopted. There is no difference in the manner in which the committee members evaluate nominees for director based on whether the nominee is recommended by a stockholder. We currently do not pay a third party to identify or assist in identifying or evaluating potential nominees, although we may in the future utilize the services of such third parties.
In reviewing potential candidates for the Board, the Governance and Nominating Committee considers the individual’s experience and background. Candidates for the position of director should exhibit proven leadership capabilities, high integrity, exercise high level responsibilities within their chosen career, and possess an ability to quickly grasp complex principles of business, finance, international transactions and communications technologies. In general, candidates who have held an established executive level position in business, finance, law, education, research, government or civic activity will be preferred.
Although the Governance and Nominating Committee has not adopted a formal diversity policy with regard to the selection of director nominees, diversity is one of the factors that the committee considers in identifying director nominees. When identifying and recommending director nominees, the Governance and Nominating Committee views diversity expansively to include, without limitation, concepts such as race, gender, national origin, differences of viewpoint, professional experience, education, skill and other qualities or attributes that contribute to board diversity. As part of this process, the Governance and Nominating Committee evaluates how a particular candidate would strengthen and increase the diversity of the Board in terms of how that candidate may contribute to the Board’s overall balance of perspectives, backgrounds, knowledge, experience, skill sets and expertise in substantive matters pertaining to the Company’s business.
In making its recommendations, the Governance and Nominating Committee bears in mind that the foremost responsibility of a director of a corporation is to represent the interests of the stockholders as a whole. The Governance and Nominating Committee intends to continue to evaluate candidates for election to the Board on the basis of the foregoing criteria.
Stockholder Communications with the Board
Stockholders who wish to communicate directly with the Board may do so by submitting a comment via the Company’s website at
www.investors.aviatnetworks.com/contactBoard.cfm
or by sending a letter addressed to: Aviat Networks, Inc., c/o Corporate Secretary, 5200 Great America Parkway, Santa Clara, CA 95054. The Corporate Secretary monitors these communications and provides a summary of all received messages to the Board at its regularly scheduled meetings. When warranted by the nature of communications, the Corporate Secretary will request prompt attention by
91
the appropriate committee or independent director of the Board, independent advisors or management. The Corporate Secretary may decide in her judgment whether a response to any stockholder communication is appropriate.
Code of Conduct
We implemented our Code of Conduct effective January 26, 2007. All of our employees, including the CEO, CFO and Principal Accounting Officer, are required to abide by the Code of Conduct to help ensure that our business is conducted in a consistently ethical and legal manner. The Audit Committee has adopted a written policy, and management has implemented a reporting system, intended to encourage our employees to bring to the attention of management and the Audit Committee any complaints regarding the integrity of our internal system of controls over financial reporting, or the accuracy or completeness of financial or other information related to our financial statements.
Section 16(a) Beneficial Ownership Reporting Compliance
Section 16(a) of the Exchange Act requires our directors, executive officers and persons who own more than 10% of a registered class of the Company’s equity securities to file with the SEC initial reports of ownership and reports of changes in ownership of our common stock and other equity securities. Directors, executive officers and greater than 10% holders are required by SEC regulation to furnish us with copies of all Section 16(a) reports they file. Based solely on our review of Forms 3 and 4 received during fiscal year 2014, and Forms 5 (or any written representations) received with respect to fiscal year 2014, we believe that all directors, officers, executive officers and 10% stockholders complied with all applicable Section 16(a) filing requirements during fiscal year
2014.
Item 11.
Executive Compensation
Compensation Discussion and Analysis
Overview and Summary
This Compensation Discussion and Analysis, which has been prepared by management, is intended to help our stockholders understand our executive compensation philosophy, objectives, elements, policies, practices, and decisions. It is also intended to provide context for the compensation information for our CEO, CFO and the three other most highly compensated executive officers (our “named executive officers”) detailed in the Summary Compensation Table below and in the other tables and narrative discussion that follow.
To understand our approach to executive compensation, you should read the entire Compensation Discussion and Analysis that follows. The following brief summary introduces the major topics covered:
|
•
|
the cornerstone of our executive compensation program is pay for performance. Accordingly, while we pay competitive base salaries and other benefits, the majority of our named executive officers’ compensation opportunity is based on variable pay.
|
|
•
|
the objectives of our executive compensation program are to reward superior performance, motivate our executives to achieve our goals and attract and retain a world-class management team.
|
|
•
|
the Compensation Committee oversees our compensation program. The Compensation Committee makes most executive compensation decisions, but also makes recommendations on certain aspects of the program to the full Board. The Compensation Committee is composed solely of independent directors. In its work, the Compensation Committee is assisted by independent compensation consultants engaged by the Compensation Committee.
|
|
•
|
in reviewing the elements of our executive compensation program - base salary, annual incentives, long-term incentives and post-termination compensation - our Compensation Committee reviews market data from similar companies.
|
|
•
|
our competitive positioning philosophy is to set compensation at the 50th percentile of compensation at peer group companies with allowances for internal factors such as tenure, individual performances and the specific importance of the job to the Company.
|
92
|
•
|
our annual incentive program is based on specific Company financial performance goals for the fiscal year, and includes provisions to “claw back” any excess amounts paid in the event of a later correction or restatement of our financial statements.
|
The Company believes the compensation program for the named executive officers supported our strategic priorities and aligned compensation earned with the Company’s financial performance in fiscal year 2014. Moreover, we believe that in emphasizing long term stockholder value creation over short term operating results the structure of our executive compensation program has benefited our Company.
Compensation Governance Best Practices
The Compensation Committee believes that a demonstrated commitment to best practices in compensation governance is itself an essential component of our approach to executive compensation. The following practices are some examples of this commitment:
|
•
|
Pay for Performance
: A substantial portion of our executives’ compensation opportunity is tied to achieving specified corporate objectives. In fiscal year 2014, for example, 100% of the awards made to our executive officers under the Annual Incentive Plan (AIP) were performance based and at-risk, subject to achievement of earnings per share (“EPS”) objectives. Under the Long Term Incentive Plan (“LTIP”), 100% of fiscal year 2014 equity awards were in the form of stock options, which provide no value to our executives if our share price does not increase above the exercise price and vest ratably over three years, reinforcing the long-term focus of our executive compensation programs.
|
|
•
|
Mix of short term and long-term compensation
: Short term compensation for our executive officers is comprised of base salaries and the AIP, which pays out only to the extent that the Company meets its financial targets. Long term compensation is composed of stock options which vest over a three year period.
|
|
•
|
Independent Compensation Consultant
: The Compensation Committee directly retains the services of Pearl Meyer, an independent compensation consultant, to advise it in determining reasonable and market-based compensation policies.
|
|
•
|
Prohibition on hedging
: Our executive officers, together with all other employees, are prohibited from engaging in hedging or similar transactions with respect to our securities.
|
|
•
|
No perquisites
: Our executive officers are not provided with club memberships, personal use of corporate aircraft or any other perquisite or special benefits other than our occasional provision of relocation expense reimbursement.
|
|
•
|
No single trigger change of control acceleration
: All change of control arrangements with our executive officers provide for acceleration of vesting for outstanding equity awards only in the event that we are both subject to a change in control and the executive officer’s employment terminates thereafter for specified reasons.
|
|
•
|
Strong compensation risk management
: The Compensation Committee reviews and analyzes the risk profile of our compensation programs and practices at least annually.
|
Compensation Philosophy and Objectives
The primary objectives of our total executive compensation program are to recruit, retain, and develop exceptional executives, incentivize those individuals to achieve strategic, operational, and financial goals, rewarding superior performance and aligning the long term interests of our executives with our stockholders. The following principles guide our overall compensation program:
|
•
|
reward superior performance;
|
|
•
|
motivate our executives to achieve strategic, operational, and financial goals;
|
|
•
|
enable us to attract and retain a world-class management team; and
|
|
•
|
align outcomes and rewards with stockholder expectations.
|
93
The Compensation Committee annually reviews the executive compensation program to ensure our executive compensation policies and programs remain appropriately aligned with evolving business needs and to consider best compensation practices. Our executive compensation programs are reviewed to ensure that they achieve a balance between providing strong retention and performance incentives to our executives while accommodating a meaningful and continuing effort to manage both the Company’s share burn rate and the dilutive effects of equity awards to the Company’s stockholders.
Executive Compensation Process
The Compensation Committee is responsible for establishing and implementing executive compensation policies and programs in a manner consistent with our compensation objectives and principles. The Compensation Committee, which is comprised solely of independent directors, reviews and approves the features and design of our executive compensation program, and approves the compensation levels, individual bonus objectives and total compensation targets for our executive officers other than our CEO. The Board approves the compensation level, individual bonus objectives, and financial targets for our CEO. The Compensation Committee also monitors executive succession planning and monitors our performance as it relates to overall compensation policies for employees, including benefit and savings plans.
In discharging its responsibilities, the Compensation Committee may engage outside consultants and consult with our Human Resources Department as well as internal and external legal or accounting advisors, as the Compensation Committee determines to be appropriate. The Compensation Committee considers recommendations from our CEO and senior management when making decisions regarding our executive compensation program and compensation of our executive officers. Following each fiscal year end, our CEO, assisted by our Human Resources Department, assesses the performance of all named executive officers and other officers. Following this annual performance review process, our CEO recommends base salary and incentive and equity awards for our named executive officers and other officers to the Compensation Committee. Based on input from our CEO and management, as well as from independent consultants, if any are used, and, in the case of the CEO’s compensation, the Compensation Committee’s evaluation of the CEO’s performance, the Compensation Committee determines what changes, if any, should be made to the executive compensation program and either sets or recommends to the full Board the level of each compensation element for all of our officers.
Independent Compensation Consultant for Compensation Committee
The Compensation Committee has the authority under its charter to engage the services of outside advisors, experts and others to assist it. Accordingly, the Compensation Committee has hired Pearl Meyer as an independent consultant to advise the Committee on matters related to the compensation of the Company’s executive officers. All services that Pearl Meyer provided Aviat in fiscal year 2014 were approved by the Committee and were related to executive or Board compensation. Pearl Meyer provides an annual review of the Company’s compensation practices, reviews and makes recommendations regarding the compensation peer groups, and provides independent input to the Compensation Committee on programs and practices.
Compensation Committee Advisor Independence
The Compensation Committee has considered the independence of Pearl Meyer pursuant to the NASDAQ Listing Rules and related SEC rules finalized in 2012, and has found no conflict of interest in Pearl Meyer continuing to provide advice to the Compensation Committee. The Compensation Committee is also regularly advised by the Company’s primary outside counsel, Wilson Sonsini Goodrich & Rosati (“WSGR”). Pursuant to the NASDAQ Listing Rules and related SEC rules finalized in 2012, the Compensation Committee has found no conflict of interest in WSGR continuing to provide advice to the Compensation Committee. The Compensation Committee intends to reassess the independence of its advisors at least annually.
Consideration of Say on Pay Results
We conducted our advisory vote on executive compensation last year at our annual meeting. Although this vote was not binding on the Board or us, we believe that it is important for our stockholders to have an opportunity to express their views regarding our executive compensation philosophy, program and practices as disclosed in our proxy statement on an annual basis. The Board and our Compensation Committee value stockholders’ opinions and, to the extent there is
94
any significant vote against the compensation of our named executive officers, the Compensation Committee will evaluate whether any actions are warranted or appropriate.
At our 2013 Annual Meeting, 93.85% of the votes cast on the advisory vote on executive compensation supported our named executive officers’ compensation as disclosed in the proxy statement. Our Compensation Committee reviewed the favorable results of this advisory vote, noting the widespread support from our stockholders. Although none of our Compensation Committee’s subsequent actions or decisions with respect to the compensation of our executive officers were directly attributable to the results of the vote, our Compensation Committee took the vote outcome into consideration in the course of its deliberations. Our Compensation Committee believes that stockholder feedback and concerns on executive compensation matters should be considered as part of its deliberations and intends to consider the results of future advisory votes in its compensation review process.
Competitive Benchmarking
Our compensation program for all of our officers is addressed in the context of competitive compensation practices. Our management and Compensation Committee consider external data to assist in benchmarking total target compensation. For fiscal year 2014, targets for total cash and cash based compensation (base salary and short-term incentive), long-term incentives and total direct compensation (base salary and short-term and long-term incentives) for all officers were set based on data collected from our peer group companies (for Messrs. Pangia, Hayes and Stumpe) and from a published survey source, the Radford Global Technology Survey for our other named executive officers . In considering data from the Radford Global Technology Survey , we focused on results for technology companies with annual revenues of less than $500 million . The peer group companies selected for benchmarking are reflective of our market for executive talent and business line competitors. Also, the overall composition of the peer group reflects companies of similar complexity and size to us.
For fiscal 2014, these peer group companies included:
|
ADTRAN Inc.
|
Aruba Networks, Inc.
|
|
Bel Fuse, Inc.
|
Black Box Corp.
|
|
Calix, Inc.
|
Comtech Telecommunications, Corp.
|
|
Extreme Networks, Inc.
|
Finisar Corp.
|
|
Harmonic Inc.
|
Infinera Corp.
|
|
Ixia
|
Plantronics Inc.
|
|
Riverbed Technology, Inc.
|
Sonus Networks, Inc.
|
|
Symmetricom, Inc.
|
|
The Compensation Committee annually reviews the appropriateness of the comparison group used for assessing the compensation of our CEO and other named executive officers. Modifications to the peer group since fiscal 2013 included removal of Loral Space & Communications, Inc. following the divestiture of its principal subsidiary Space Systems/Loral, removal of Opnext, Inc. following its acquisition by Oclaro, removal of PowerWave Technologies following its Chapter 11 bankruptcy filing in January 2013, and removal of NETGEAR, Inc. and ViaSat, Inc. in recognition that these two companies had become dissimilar to us in size. We also added Bel Fuse, Inc. and Infinera Corp. to replace these removals and also to better align the revenue size of each of our peer group companies with our own.
Data for our peer group companies was collected directly from these companies’ proxy statements.
Total Compensation Elements
Our executive compensation program includes four major elements:
|
•
|
base salary
|
|
•
|
annual cash incentive
|
|
•
|
long-term compensation - equity incentives
|
|
•
|
post-termination compensation
|
95
Each named executive officer’s performance is measured against factors such as long and short-term strategic goals and financial measures of our performance, including factors such as revenue, operating income, cash flow from operations and earnings per share.
Our compensation policy and practice is to target total compensation levels for all officers, including our named executive officers, nominally at the 50th percentile for similar positions as derived from the market composite data, assuming experience in the position and competent performance. The Compensation Committee may decide to target total compensation above or below the 50th percentile for similar positions in unique circumstances based on an individual’s background, experience, or position. Though compensation levels may differ among our named executive officers based upon competitive factors and the role, responsibilities and performance of each named executive officer, there are no material differences in our compensation policies or in the manner in which total direct compensation opportunity is determined for any of our named executive officers. Because our CEO has significantly greater duties, responsibilities and accountabilities than our other named executive officers, the total compensation opportunity for the CEO is higher than for our other named executive officers. In determining CEO and other named executive officer compensation, the Board also considers the ratio between our CEO’s compensation and the average compensation of our other named executive officers as compared with similar ratios for peer group companies.
For fiscal year 2014, that
ratio
was 1.97 ,
compared to
a median ratio of 1.37 in the
peer group
companies.
Base Salary
Base salaries are provided as compensation for day-to-day responsibilities and services to us. Executive salaries are reviewed annually. Our CEO generally makes recommendations to the Compensation Committee in August of each year regarding the base pay of each named executive officer (other than himself). The Compensation Committee considers each executive officer’s responsibilities, as well as the Company’s performance and recommended increases in base salary for select named executive officers and other officers. In fiscal year 2014, the CEO recommended and the Compensation Committee approved, that named executive base salaries be held flat at fiscal year 2013 levels. Additional details concerning the compensation for our named executive officers for fiscal year 2014 are set forth in the Summary Compensation Table.
Annual Incentive
The short-term incentive element of our executive compensation program is currently comprised of our Annual Incentive Plan, or AIP. The CEO reviews his recommendations for each named executive officer with the Compensation Committee, taking into account benchmarked market data obtained from Pearl Meyer, the Compensation Committee’s independent consultant. Based on recommendations by the CEO, and as specified in any applicable employment agreement, the Compensation Committee recommends to the Board an annual incentive compensation target, expressed as a percentage of base salary, for each executive officer in August.
Each named executive officer’
s target annual incentive percentage is benchmarked against the
50th percentile within the market composite for his or her
specific role
.
The Compensation Committee also recommends to the Board specific Company financial performance measures and targets including the relative weighting and payout thresholds. The financial targets are aligned with our Board-approved annual operating plan, and during the year periodic reports are made to the Board about our performance compared with the targets. Under the AIP, a significant portion of the executive’s annual compensation is tied directly to our financial performance. The target amount of annual incentive compensation under our AIP, expressed as a percentage of base salary, generally increases with an executive’s level of management responsibility. AIP target incentive can represent up to 100% of the base cash compensation for our named executive officers and may be paid in the form of cash, stock or a combination of the two. If performance results meet target levels, our executives can earn up to a maximum of 100% of their target incentive. No incentive can be earned for performance below the minimum threshold. Equity awards under the AIP are granted under the 2007 Plan.
For fiscal year 2014, the AIP provided for a cash payout and contained minimum, target and maximum performance thresholds based on the performance measures, using EPS as the performance metric. The threshold amounts were established in August 2013, and the plan provided for no payout if the minimum threshold was not met, a 50% payout if the minimum threshold was met and a 100% payout if the target was achieved. If the maximum target threshold was met, the plan was capped at 150% payout. The EPS performance thresholds for fiscal year 2014 were based on a non-GAAP measure that excluded share-based compensation, amortization of purchased technology, transactional tax assessments, amortization of intangible assets, restructuring charges, excess and obsolete inventory writedowns associated with legacy products, costs related to liquidation of foreign subsidiaries, property plant and
96
equipment impairment charges, adjustments to the pro forma tax rate, non-recurring income and other non-recurring charges.
Table 1
|
Results-Driven Entitlement
|
||||||
|
Fiscal 2014 Annual Incentive Plan
|
Performance
(As % of
Financial Target)
|
Payout
(As % of
Award Target)
|
||||
|
Metric
|
Tiers
|
|||||
|
Earnings Per Share
|
Minimum Threshold
|
50%
|
50%
|
|||
|
Target
|
100%
|
100%
|
||||
|
Maximum Threshold
|
150%
|
150%
|
||||
In fiscal year 2014, the AIP did not guarantee payout of the target amounts, and the Compensation Committee considered the EPS performance thresholds to be challenging. During the 2014 fiscal year, we did not achieve the minimum threshold target for AIP awards; therefore, no named executive officer received a cash payout. The minimum threshold target required the Company to achieve an EPS target of $.26, a target of EPS of $.31 or a maximum target of $.36 in order to achieve the respective payouts.
Long-Term Compensation - Equity Incentives
The Compensation Committee uses the Long Term Incentive Plan (“LTIP”) as a means for determining awards of stock options, stock appreciation rights, restricted shares, restricted stock units, performance shares, and other stock-based awards to our officers and other executives based on multi-year performance. All of the awards are granted under the 2007 Plan.
Our LTIP is designed to motivate our executives to focus on achievement of our long-term financial goals. Equity awards motivate our executives to achieve our long-term goals and to the extent our results affect our stock price, link such results with the performance of our stock over a three to four year period. Using equity awards helps us to retain executives, encourage share ownership and maintain a direct link between our executive compensation program and the value and appreciation in the value of our stock.
In fiscal year 2014, LTIP awards were composed solely of stock options. Stock options vested one third on the first anniversary of the grant date, with one third vesting each year thereafter. The Committee believes that stock options provide clear alignment with stockholder interests.
Performance Shares.
In past fiscal years, the Compensation Committee recommended performance share awards that are earned, if the performance criteria are met, at the end of a three year plan cycle. The maximum possible entitlement to performance shares will occur if 100% of the target is achieved. In addition, irrespective of Company performance versus target, there is no entitlement to performance shares unless the award recipient continues to be employed throughout the multi-year period. Performance shares are subject to repurchase by the Company at $0.01 per share if eligible employment ends during the performance measurement period and to the extent the maximum performance is not achieved during the performance measurement period. For fiscal year 2014, upon recommendation of the Compensation Committee, all of the performance based restricted shares under the fiscal year 2011 LTIP, were repurchased by the Company since the Compensation Committee determined that the threshold targets had not been met. For compensation planning purposes, awards of performance-based restricted stock are valued at the fair market value of the shares on the date of award, which is the closing price on the NASDAQ Global Select Market on that date, without reduction to reflect vesting or other conditions.
Stock Options.
The Compensation Committee believes that stock options directly align the interests of executives and stockholders as the options only result in gain to the recipient if our stock price increases above the exercise price of the options. In addition, options are intended to help retain key employees because they vest over a period of time, and to assist in the hiring of new executives by replacing the value of stock options that may have been forfeited as a result of leaving a former employer. Generally, options are granted with an exercise price equal to the fair market value of the common stock on the grant date, which is the closing price on the NASDAQ Global Select Market on that date. Typically, the Compensation Committee awards stock options that vest and become exercisable solely on the basis of continued employment, or other service, over three or four years. Duration of stock options (subject to the terms of the 2007 Plan) is seven years from grant date. For compensation planning purposes, awards of stock options are valued
97
using the Black-Scholes valuation method, without reduction to reflect vesting or other conditions. In fiscal year 2014, the Black-Scholes valuations were approximately 50% of the grant-date exercise price value of the shares subject to the option.
Service-Based Restricted Stock.
Service-based restricted stock awards are awards of stock at the start of a vesting period which is subject to repurchase for nominal consideration if the specified vesting conditions are not satisfied. In addition to their use as a component of the LTIP, awards of service-based restricted stock may be made on a selective basis to individual executives primarily to facilitate retention and succession planning or to replace the value of equity awards that may have been forfeited as a result of the executive’s leaving a former employer. For compensation planning purposes, awards of service-based restricted stock are valued at the fair market value of the shares on the date of award, which is the closing price on the NASDAQ Global Select Market on that date, without reduction to reflect vesting or other conditions. Typically, the Compensation Committee awards restricted stock that vests and becomes exercisable solely on the basis of continued employment, or other service, usually over three years, with 33 1/3 % vesting on the first anniversary of the date of the grant and an additional 33 1/3 % vesting on the second and third anniversaries of the date of the grant. Unvested shares are subject to repurchase by the Company at $0.01 per share if employment ends before the third anniversary of the grant date.
Recovery of Executive Compensation
Our executive compensation program permits us to recover or “clawback” all or a portion of any performance-based compensation if our financial statements are restated as a result of errors, omissions, or fraud. The amount which may be recovered will be the amount by which the affected compensation exceeded the amount that would have been payable had the financial statements been initially filed as restated, or any greater or lesser amount that the Compensation Committee or our Board shall determine. In no case will the amount to be recovered by us be less than the amount required to be repaid or recovered as a matter of law. Recovery of such amounts by us would be in addition to any actions imposed by law, enforcement agencies, regulators, or other authorities.
Hedging Prohibition
Our executive officers, as well as other employees, are prohibited from engaging in hedging or similar transactions with respect to our securities where the transaction is designed or intended to decrease the risks associated with holding our securities. This prohibition includes transactions involving puts, call, collars or other derivative securities.
Perquisites
Our executive officers participate in the same group insurance and employee benefit plans as our other full-time U.S. employees. We do not provide special benefits or other perquisites to our executive officers
.
Stock Ownership Guidelines
While we do not have a minimum stock ownership requirement for members of the Board and our named executive officers, the corporate governance guidelines adopted by the Board encourage the ownership of our common stock. The Compensation Committee is satisfied that the stock and other equity holdings among our executive officers are sufficient at this time to provide appropriate motivation to align this group’s long-term interests with those of our stockholders.
Tax and Accounting Considerations
Tax Considerations.
The Compensation Committee generally considers the federal income tax and financial accounting consequences of the various components of the executive compensation program in making decisions about executive compensation. The Compensation Committee believes that achieving the compensation objectives discussed above is more important than the benefit of tax deductibility and the executive compensation programs may, from time to time, limit the tax deductibility of compensation. Nevertheless, when not inconsistent with these objectives, the Compensation Committee endeavors to award compensation that will be deductible for income tax purposes. Internal Revenue Code Section 162(m) may limit the tax deductions that a public company can claim for compensation to some of its named executive officers. The Company does not guarantee that any compensation intended to qualify as deductible performance-based compensation under Section 162(m) so qualifies.
98
Accounting Considerations.
The Compensation Committee also considers the accounting implications of various forms of executive compensation. In its financial statements, the Company records salaries and performance-based compensation such as bonuses as expenses in the amount paid or to be paid to the named executive officers. Accounting rules also require the Company to record an expense in its financial statements for equity awards, even though equity awards are not paid as cash to employees. The accounting expense of equity awards to employees is calculated in accordance with GAAP. The Compensation Committee believes that the many advantages of equity compensation, as discussed above, more than compensate for the non-cash accounting expense associated with them.
Benefits under the 401(k) Plan and Generally Available Benefit Programs
In fiscal year 2014, our named executive officers were eligible to participate in the health and welfare programs that are generally available to all full-time U.S.-based employees, including medical, dental, vision, life, short-term and long-term disability, employee assistance, flexible spending and accidental death and dismemberment.
In addition, the named executive officers and all other eligible U.S.-based employees can participate in our tax-qualified 401(k) Plan. Under the 401(k) Plan, all eligible employees can receive matching contributions from the Company; however, the Company suspended matching effective January 1, 2014 for an indefinite period of time. Our company-matching contribution for the 401(k) Plan during the first half of fiscal year 2014 was 100% of the first 5% of contributions by the employee to the 401(k) Plan. Employees under the age of 50 can contribute a maximum per participating employee of $17,500 during each calendar year, and employees over the age of 50 can contribute a maximum per participating employee of $23,000. We do not provide defined benefit pension plans or defined contribution retirement plans to the named executive officers or other employees other than the 401(k) Plan, or as required in certain countries other than the United States, for legal or competitive reasons.
We adopted an employee stock purchase plan effective November 19, 2009 and commencing on July 3, 2010, under which named executive officers and all other eligible U.S.-based employees can elect, on a quarterly basis, to apply a portion of their cash compensation to purchase shares of our common stock at a 5% discount. An employee’s total purchases in any year cannot exceed $25,000 in value or 15% of his or her salary, whichever is less. Furthermore, an employee may not purchase more than 608 shares of common stock annually under the employee stock purchase plan.
The 401(k) Plan, employee stock purchase plan and the other benefit programs allow us to remain competitive and enhance employee loyalty and productivity. These benefit programs are primarily intended to provide all eligible employees with competitive and quality healthcare, financial contributions for retirement and to enhance hiring and retention.
Post-Termination Compensation
Employment agreements have been established with each of our named executive officers. These agreements provide for certain payments and benefits to the employee if his or her employment with us is terminated. These arrangements are discussed in more detail below. We have determined that such payments and benefits are an integral part of a competitive compensation package for our named executive officers. For additional information regarding our employment agreements with our named executive officers, see the discussion under “Potential Payments Upon Termination or Change of Control.”
Compensation Committee Report
The Compensation Committee has reviewed and discussed with management the Compensation Discussion and Analysis included in this Annual Report on Form 10-K and in our proxy statement. Based on this review and discussion, the Compensation Committee recommended to the Board that the Compensation Discussion and Analysis be included in this Annual Report on Form 10-K and in our proxy statement.
Compensation Committee of the Board of Directors
Dr. James C. Stoffel, Chairman
Clifford H. Higgerson
Dr. Mohsen Sohi
99
Risk Considerations in Our Compensation Program
The Compensation Committee, pursuant to its charter, is responsible for reviewing and overseeing the compensation benefits structure applicable to our employees, generally. We do not believe that our compensation policies and practices for our employees give rise to risks that are reasonably likely to have a material adverse effect on our company. In reaching this conclusion, we considered the following factors:
|
•
|
Our compensation program is designed to provide a mix of both fixed and “at risk” incentive compensation.
|
|
•
|
The incentive elements of our compensation program (annual incentives and multi-year equity LTIP awards) are designed to reward both annual performance (under the annual incentive plan) and longer-term performance (under the LTIP). We believe this design mitigates any incentive for short-term risk-taking that could be detrimental to our company’s long-term best interests.
|
|
•
|
Maximum payouts under our annual incentive plan are currently capped at 100% of target payouts. We believe these limits mitigate excessive risk-taking, since the maximum amount that can be earned is limited.
|
|
•
|
Finally, our annual incentive plan and our long-term incentive plan both contain provisions under which awards may be recouped or forfeited if the recipient has not complied with our policies. In addition, our performance-based plans (cash incentive and performance shares) both contain provisions under which awards may be recouped or forfeited if the financial results for a period affecting the calculation of an award are later restated.
|
Summary Compensation Table
The following table summarizes the total compensation for each of our fiscal years ended June 27, 2014, June 28, 2013 and June 29, 2012 of our named executive officers, who consisted of our CEO, CFO and the next three other most highly compensated executive officers.
|
Name/Principal Position
|
Fiscal Year
(1) |
Salary
(3) |
Bonus
(4) |
Stock Awards
(5) |
Option Awards
(6) |
Non-Equity Incentive Plan Compensation(7)
|
Change in Pension Value and Non-Qualified Deferred Compensation Earnings
(8) |
All Other Compensation
(9) |
Total
|
|||||||||||||||||
|
($)
|
($)
|
($)
|
($)
|
($)
|
($)
|
($)
|
($)
|
|||||||||||||||||||
|
Michael Pangia, Chief Executive Officer (2)
|
2014
|
550,000
|
|
—
|
|
—
|
|
495,542
|
|
—
|
|
—
|
|
2,142
|
|
1,047,684
|
|
|||||||||
|
2013
|
550,000
|
|
—
|
|
539,809
|
|
160,999
|
|
—
|
|
—
|
|
92,778
|
|
1,343,586
|
|
||||||||||
|
2012
|
542,500
|
|
—
|
|
405,533
|
|
366,576
|
|
275,000
|
|
—
|
|
234,689
|
|
1,824,298
|
|
||||||||||
|
Edward Hayes Jr., Senior Vice President and Chief Financial Officer (2)
|
2014
|
360,000
|
|
—
|
|
—
|
|
243,265
|
|
—
|
|
—
|
|
6,284
|
|
609,549
|
|
|||||||||
|
2013
|
360,000
|
|
—
|
|
264,997
|
|
79,036
|
|
—
|
|
—
|
|
14,996
|
|
719,029
|
|
||||||||||
|
2012
|
235,385
|
|
75,000
|
|
355,937
|
|
458,068
|
|
96,250
|
|
—
|
|
54,426
|
|
1,275,066
|
|
||||||||||
|
Heinz H. Stumpe, Senior Vice President and Chief Sales Officer (formerly Chief Operations Officer) (2)
|
2014
|
345,000
|
|
—
|
|
—
|
|
217,588
|
|
—
|
|
—
|
|
2,415
|
|
565,003
|
|
|||||||||
|
2013
|
340,385
|
|
—
|
|
237,026
|
|
70,693
|
|
—
|
|
—
|
|
2,379
|
|
650,483
|
|
||||||||||
|
2012
|
325,000
|
|
—
|
|
92,430
|
|
97,476
|
|
97,500
|
|
—
|
|
2,260
|
|
614,666
|
|
||||||||||
|
Shaun McFall, Senior Vice President and Chief Marketing Officer
|
2014
|
320,000
|
|
—
|
|
—
|
|
187,405
|
|
—
|
|
—
|
|
5,940
|
|
513,345
|
|
|||||||||
|
2013
|
315,385
|
|
—
|
|
204,146
|
|
60,887
|
|
—
|
|
—
|
|
14,170
|
|
594,588
|
|
||||||||||
|
2012
|
300,000
|
|
—
|
|
85,320
|
|
89,977
|
|
90,000
|
|
—
|
|
9,181
|
|
574,478
|
|
||||||||||
|
Meena Elliott, Senior Vice President, General Counsel and Secretary
|
2014
|
300,000
|
|
—
|
|
—
|
|
162,178
|
|
—
|
|
—
|
|
4,569
|
|
466,747
|
|
|||||||||
|
2013
|
300,000
|
|
—
|
|
176,665
|
|
52,691
|
|
—
|
|
—
|
|
13,414
|
|
542,770
|
|
||||||||||
|
2012
|
295,385
|
|
—
|
|
85,320
|
|
89,977
|
|
90,000
|
|
—
|
|
13,584
|
|
574,266
|
|
||||||||||
|
(1)
|
Our fiscal year 2014 ended
June 27, 2014
, fiscal year 2013 ended
June 28, 2013
and our fiscal year 2012 ended
June 29, 2012
. The amounts in this table represent total compensation paid or earned for our fiscal year as included in our annual financial statements.
|
100
|
(2)
|
Effective July 18, 2011, Mr. Pangia was appointed President and CEO. Effective October 31, 2011, Mr. Hayes was appointed Senior Vice President and CFO. Effective June 24, 2012, Mr. Stumpe was appointed Senior Vice President and Chief Sales Officer.
|
|
(3)
|
The annual base salary for Mr. Pangia as our CEO is $550,000. The amount in the Summary Compensation table for the fiscal year ended June 29, 2012 of $542,500 reflects Mr. Pangia’s salary as our Chief Sales Officer for the period July 2, 2011 through July 17, 2011 and as our CEO for the period July 18, 2011 through June 29, 2012.
|
The annual base salary for Mr. Hayes is $360,000. The amount in the Summary Compensation table for fiscal year 2012 of $235,385 reflects Mr. Hayes’ salary for the period October 31, 2011 through June 29, 2012. The annual base salary for Mr. Stumpe is $345,000 effective July 1, 2012. The annual base salary for Mr. McFall is $320,000 effective August 15, 2012.
|
(4)
|
Represents a one-time bonus earned by Mr. Hayes in respect of fiscal year 2012 performance for the achievement of certain management objectives.
|
|
(5)
|
The “Stock Awards” column shows the full grant date fair value of the performance shares (at target) and restricted stock granted in fiscal years 2013 and 2012, respectively.
|
The grant date fair value of the performance shares and restricted stock was determined under FASB ASC Topic 718 and represents the amount we would expense in our financial statements over the entire vesting schedule for the awards. The grant date fair value for performance awards and restricted stock was based on the closing market price of our common stock on the respective award dates, except for the performance shares granted during fiscal year 2011 as discussed above. The assumptions used for determining values are set forth in Notes 1 and 10 to our audited consolidated financial statements in Part II, Item 8 of our Annual Report on Form 10-K for the fiscal year ended
June 27, 2014
. These amounts reflect our accounting for these grants and do not correspond to the actual values that may be recognized by the named executive officers.
|
(6)
|
The “Option Awards” column shows the full grant date fair value of the stock options granted in fiscal years 2014, 2013 and 2012, respectively. The grant date fair value of the stock option awards was determined under FASB ASC Topic 718 and represents the amount we would expense in our financial statements over the entire vesting schedule for the awards. The assumptions used for determining values are set forth in Notes 1 and 10 to our audited consolidated financial statements in Part II, Item 8 of our Annual Report on Form 10-K for the fiscal year ended
June 27, 2014
. These amounts reflect our accounting for these grants and do not correspond to the actual values that may be recognized by the named executive officers.
|
|
(7)
|
There was no non-equity incentive compensation under the AIP for fiscal years 2014 and 2013, respectively. For fiscal year 2012, this figure represents amounts earned in respect of fiscal year 2012 performance under the fiscal year 2012 AIP as though 100% of revenue and operating income (non-GAAP) targets had been achieved with actual achievement of 100% of both targets.
|
|
(8)
|
We do not currently have our own pension plan or deferred compensation plan.
|
101
|
(9)
|
The following table describes the components of the “All Other Compensation” column.
|
|
Life Insurance (a)
|
Housing and Auto Allowance
|
Vacation Payout in Cash
|
Severance & Related Benefits
|
Other Patent Income
|
Other Bonus (b)
|
Relocation Benefits (c)
|
Company Matching Contributions Under 401(k) Plan (d)
|
Total All Other Compensation
|
|||||||||||||||||||||
|
Name
|
Year
|
($)
|
($)
|
($)
|
($)
|
($)
|
($)
|
($)
|
($)
|
($)
|
|||||||||||||||||||
|
Michael Pangia
|
2014
|
2,142
|
|
—
|
|
—
|
|
—
|
|
—
|
|
—
|
|
—
|
|
—
|
|
2,142
|
|
||||||||||
|
2013
|
2,142
|
|
—
|
|
—
|
|
—
|
|
—
|
|
—
|
|
90,636
|
|
—
|
|
92,778
|
|
|||||||||||
|
2012
|
2,100
|
|
—
|
|
—
|
|
—
|
|
—
|
|
—
|
|
232,589
|
|
—
|
|
234,689
|
|
|||||||||||
|
Edward J. Hayes
|
2014
|
2,534
|
|
—
|
|
—
|
|
—
|
|
—
|
|
—
|
|
—
|
|
3,750
|
|
6,284
|
|
||||||||||
|
2013
|
2,534
|
|
—
|
|
—
|
|
—
|
|
—
|
|
—
|
|
—
|
|
12,462
|
|
14,996
|
|
|||||||||||
|
2012
|
1,657
|
|
—
|
|
—
|
|
—
|
|
—
|
|
50,000
|
|
—
|
|
2,769
|
|
54,426
|
|
|||||||||||
|
Heinz H. Stumpe
|
2014
|
2,415
|
|
—
|
|
—
|
|
—
|
|
—
|
|
—
|
|
—
|
|
—
|
|
2,415
|
|
||||||||||
|
2013
|
2,379
|
|
—
|
|
—
|
|
—
|
|
—
|
|
—
|
|
—
|
|
—
|
|
2,379
|
|
|||||||||||
|
2012
|
2,260
|
|
—
|
|
—
|
|
—
|
|
—
|
|
—
|
|
—
|
|
—
|
|
2,260
|
|
|||||||||||
|
Shaun McFall
|
2014
|
1,190
|
|
—
|
|
—
|
|
—
|
|
—
|
|
—
|
|
—
|
|
4,750
|
|
5,940
|
|
||||||||||
|
2013
|
1,170
|
|
—
|
|
—
|
|
—
|
|
—
|
|
—
|
|
—
|
|
13,000
|
|
14,170
|
|
|||||||||||
|
2012
|
1104
|
|
—
|
|
—
|
|
—
|
|
—
|
|
—
|
|
—
|
|
8,077
|
|
9,181
|
|
|||||||||||
|
Meena Elliott
|
2014
|
1107
|
|
—
|
|
—
|
|
—
|
|
—
|
|
—
|
|
—
|
|
3,462
|
|
4,569
|
|
||||||||||
|
2013
|
914
|
|
—
|
|
—
|
|
—
|
|
—
|
|
—
|
|
—
|
|
12,500
|
|
13,414
|
|
|||||||||||
|
2012
|
709
|
|
—
|
|
—
|
|
—
|
|
—
|
|
—
|
|
—
|
|
12,875
|
|
13,584
|
|
|||||||||||
_____________________
|
(a)
|
Represents premiums paid for life insurance that represent taxable income for the named executive officer.
|
|
(b)
|
Represents a sign-on bonus paid to Mr. Hayes.
|
|
(c)
|
Represents taxable benefits paid in connection with the relocation of Mr. Pangia’s household to California from Georgia.
|
|
(d)
|
Represents matching contributions made by us to
the 401(k) account of the respective named executive
.
|
Grants of Plan-Based Awards in Fiscal Year 2014
The following table lists our grants and incentives during our fiscal year ended June 27, 2014 of plan-based awards, both equity and non-equity based and including our Annual Incentive Plan and Long-Term Incentive Plan, to the named executive officers listed in the Summary Compensation Table. There is no assurance that the grant date fair value of stock and option awards will ever be realized.
|
All Other Stock Awards in Fiscal 2014
|
||||||||||||||||||||||||||||||||
|
Estimated Possible Payouts Under Short-Term Non-Equity Incentive Plan Awards in Fiscal 2014 (2)
|
Estimated Future Payments Under Equity Incentive Plan Awards in Fiscal 2014 (3)
|
Number of Shares of Stock or Units
|
Number of Securities Underlying Options (4)
|
Exercise or Base Price of Option Awards
|
Fair Value of Stock and Option Awards (5)
|
|||||||||||||||||||||||||||
|
Grant Date
|
Threshold
|
Target
|
Maximum
|
Threshold
|
Target
|
Maximum
|
||||||||||||||||||||||||||
|
Name
|
(1)
|
($)
|
($)
|
($)
|
(#)
|
(#)
|
(#)
|
(#)
|
(#)
|
($/Share)
|
($)
|
|||||||||||||||||||||
|
Michael Pangia
|
9/9/2013
|
—
|
|
—
|
|
—
|
|
—
|
|
—
|
|
—
|
|
—
|
|
416,667
|
|
2.60
|
|
495,542
|
|
|||||||||||
|
Edward Hayes Jr.
|
9/9/2013
|
—
|
|
—
|
|
—
|
|
—
|
|
—
|
|
—
|
|
—
|
|
204,545
|
|
2.60
|
|
243,265
|
|
|||||||||||
|
Heinz H. Stumpe
|
9/9/2013
|
—
|
|
—
|
|
—
|
|
—
|
|
—
|
|
—
|
|
—
|
|
182,955
|
|
2.60
|
|
217,588
|
|
|||||||||||
|
Shaun McFall
|
9/9/2013
|
—
|
|
—
|
|
—
|
|
—
|
|
—
|
|
—
|
|
—
|
|
157,576
|
|
2.60
|
|
187,405
|
|
|||||||||||
|
Meena Elliott
|
9/9/2013
|
—
|
|
—
|
|
—
|
|
—
|
|
—
|
|
—
|
|
—
|
|
136,364
|
|
2.60
|
|
162,178
|
|
|||||||||||
_____________________
|
(1)
|
Grant Date of Common Stock under the 2007 Plan.
|
|
(2)
|
There were no Non-Equity Incentive Plan Awards granted under our fiscal year 2014 Annual Incentive Plan.
|
102
|
(3)
|
There were no Equity Incentive Plan Awards granted under our fiscal year 2014 Annual Incentive Plan.
|
|
(4)
|
Stock options vest in installments of 33 1/3% one year from the grant date, 33 1/3% two years from the grant date, and 33 13% three years from the grant date based on continuous employment through those dates.
|
|
(5)
|
The “Grant Date Fair Value of Stock and Option Awards” column shows the full grant date fair value of the stock options granted in fiscal year 2014. The grant date fair value of the stock options was determined under FASB ASC Topic 718 and represents the amount we would expense in our financial statements over the entire vesting schedule for the awards in the event the vesting provisions are achieved.
|
The assumptions used for determining values are set forth in Notes 1 and 10 to our audited consolidated financial statements in Part II, Item 8 of this Annual Report on Form 10-K for the fiscal year ended June 27, 2014. These amounts reflect our accounting for these grants and do not correspond to the actual values that may be recognized by the named executive officers.
Outstanding Equity Awards at Fiscal Year-End 2014
The following table provides information regarding outstanding unexercised stock options and unvested stock awards held by each of our named executive officers as of June 27, 2014. Each grant of options or unvested stock awards is shown separately for each named executive officer. The vesting schedule for each award of options is shown in the footnotes following this table based on the option grant date. The material terms of the option awards, other than exercise price and vesting are generally described in the 2007 Plan.
103
|
Option Awards
|
Stock Awards
|
||||||||||||||||||||||||||||
|
[Awards Listed in Chronological Order] Award Grant Date
|
Number of Securities Underlying Unexercised Options Exercisable
|
Number of Securities Underlying Unexercised Options Unexercisable
|
Equity Incentive Plan Awards: Number of Securities Underlying Unexercised Unearned Options
|
Option Exercise Price
|
Option Expiration Date
|
Number of Shares or Units of Stock that have not Vested (3)
|
Market Value of Shares or Units of Stock that have not Vested (4)
|
Equity Incentive Plan Awards: Number of Unearned Shares Units or Other Rights that have not Vested
|
Equity Incentive Plan Awards: Market or Payout Value of Unearned Shares, Units or Other Rights that have not Vested (3)
|
||||||||||||||||||||
|
Name
|
(#)
|
(#)
|
(#)
|
($)
|
(#)
|
($)
|
(#)
|
($)
|
|||||||||||||||||||||
|
Michael Pangia
|
09/09/2013
|
—
|
|
416,667
|
|
(1)
|
—
|
|
2.60
|
|
9/9/2020
|
|
—
|
|
—
|
|
—
|
|
—
|
|
|||||||||
|
11/29/2012
|
—
|
|
—
|
|
—
|
|
—
|
|
—
|
|
—
|
|
—
|
|
22,298
|
|
(5)
|
27,873
|
|
||||||||||
|
10/03/2012
|
68,750
|
|
68,750
|
|
(2)
|
—
|
|
2.28
|
|
10/3/2019
|
|
—
|
|
—
|
|
—
|
|
—
|
|
||||||||||
|
09/08/2011
|
225,965
|
|
75,322
|
|
(2)
|
—
|
|
2.37
|
|
9/8/2018
|
|
—
|
|
—
|
|
—
|
|
—
|
|
||||||||||
|
09/08/2011
|
—
|
|
—
|
|
—
|
|
—
|
|
—
|
|
32,592
|
|
40,740
|
|
—
|
|
—
|
|
|||||||||||
|
11/11/2010
|
50,000
|
|
—
|
|
(2)
|
—
|
|
4.36
|
|
11/11/2017
|
|
—
|
|
—
|
|
—
|
|
—
|
|
||||||||||
|
11/12/2009
|
49,052
|
|
—
|
|
(2)
|
—
|
|
6.00
|
|
11/12/2016
|
|
—
|
|
—
|
|
—
|
|
—
|
|
||||||||||
|
03/30/2009
|
80,586
|
|
—
|
|
(2)
|
—
|
|
4.05
|
|
3/30/2016
|
|
—
|
|
—
|
|
—
|
|
—
|
|
||||||||||
|
Edward Hayes Jr.
|
09/09/2013
|
—
|
|
204,545
|
|
(1)
|
—
|
|
2.6
|
|
9/9/2020
|
|
—
|
|
—
|
|
—
|
|
—
|
|
|||||||||
|
11/29/2012
|
—
|
|
—
|
|
—
|
|
—
|
|
—
|
|
—
|
|
—
|
|
10,946
|
|
(5)
|
13,683
|
|
||||||||||
|
10/03/2012
|
33,750
|
|
33,750
|
|
(2)
|
—
|
|
2.28
|
|
10/3/2019
|
|
—
|
|
—
|
|
—
|
|
—
|
|
||||||||||
|
10/31/2011
|
222,175
|
|
74,059
|
|
(2)
|
—
|
|
2.05
|
|
10/31/2018
|
|
—
|
|
__
|
|
—
|
|
—
|
|
||||||||||
|
10/31/2011
|
101,959
|
|
33,987
|
|
(2)
|
—
|
|
2.05
|
|
10/31/2018
|
|
—
|
|
—
|
|
—
|
|
—
|
|
||||||||||
|
10/31/2011
|
—
|
|
—
|
|
—
|
|
—
|
|
—
|
|
30,487
|
|
38,109
|
|
—
|
|
—
|
|
|||||||||||
|
10/31/2011
|
—
|
|
—
|
|
—
|
|
—
|
|
—
|
|
11,738
|
|
14,673
|
|
—
|
|
—
|
|
|||||||||||
|
Heinz H. Stumpe
|
09/09/2013
|
—
|
|
182,955
|
|
(1)
|
—
|
|
2.6
|
|
9/9/20
|
|
—
|
|
—
|
|
—
|
|
—
|
|
|||||||||
|
11/29/2012
|
—
|
|
—
|
|
—
|
|
—
|
|
—
|
|
—
|
|
—
|
|
9,791
|
|
(5)
|
12,239
|
|
||||||||||
|
10/03/2012
|
30,187
|
|
30,188
|
|
(2)
|
—
|
|
2.28
|
|
10/3/2019
|
|
—
|
|
—
|
|
—
|
|
—
|
|
||||||||||
|
09/08/2011
|
60,086
|
|
20,029
|
|
(2)
|
—
|
|
2.37
|
|
9/8/2018
|
|
—
|
|
—
|
|
—
|
|
—
|
|
||||||||||
|
09/08/2011
|
—
|
|
—
|
|
—
|
|
—
|
|
—
|
|
4,333
|
|
5,416
|
|
—
|
|
—
|
|
|||||||||||
|
11/11/2010
|
55,000
|
|
—
|
|
(2)
|
—
|
|
4.36
|
|
11/11/2017
|
|
—
|
—
|
—
|
|
—
|
|
||||||||||||
|
11/12/2009
|
30,100
|
|
—
|
|
(2)
|
—
|
|
6.00
|
|
11/12/2016
|
|
—
|
|
—
|
|
—
|
|
—
|
|
||||||||||
|
11/05/2008
|
37,326
|
|
—
|
|
(2)
|
—
|
|
5.97
|
|
11/5/2015
|
|
—
|
|
—
|
|
—
|
|
—
|
|
||||||||||
|
Shaun McFall
|
09/09/2013
|
—
|
|
157,576
|
|
(1)
|
—
|
|
2.6
|
|
9/9/2020
|
|
—
|
|
—
|
|
—
|
|
—
|
|
|||||||||
|
11/29/2012
|
—
|
|
—
|
|
—
|
|
—
|
|
—
|
|
—
|
|
—
|
|
8,433
|
|
(5)
|
10,541
|
|
||||||||||
|
10/03/2012
|
26,000
|
|
26,000
|
|
(2)
|
—
|
|
2.28
|
|
10/3/2019
|
|
—
|
|
—
|
|
—
|
|
—
|
|
||||||||||
|
09/08/2011
|
55,464
|
|
18,488
|
|
(2)
|
—
|
|
2.37
|
|
9/8/2018
|
|
—
|
|
—
|
|
—
|
|
—
|
|
||||||||||
|
09/08/2011
|
—
|
|
—
|
|
—
|
|
—
|
|
—
|
|
4,000
|
|
5,000
|
|
—
|
|
—
|
|
|||||||||||
|
11/11/2010
|
55,000
|
|
—
|
|
(2)
|
—
|
|
4.36
|
|
11/11/2017
|
|
—
|
|
—
|
|
—
|
|
—
|
|
||||||||||
|
11/12/2009
|
26,198
|
|
—
|
|
(2)
|
—
|
|
6.00
|
|
11/12/2016
|
|
—
|
|
—
|
|
—
|
|
—
|
|
||||||||||
|
11/05/2008
|
29,796
|
|
—
|
|
(2)
|
—
|
|
5.97
|
|
11/5/2015
|
|
—
|
|
—
|
|
—
|
|
—
|
|
||||||||||
|
Meena Elliott
|
09/09/2013
|
—
|
|
136,364
|
|
(1)
|
—
|
|
2.6
|
|
9/9/2020
|
|
—
|
|
—
|
|
—
|
|
—
|
|
|||||||||
|
11/29/2012
|
—
|
|
—
|
|
—
|
|
—
|
|
—
|
|
—
|
|
—
|
|
7,298
|
|
(5)
|
9,123
|
|
||||||||||
|
10/03/2012
|
22,500
|
|
22,500
|
|
(2)
|
—
|
|
2.28
|
|
10/3/2019
|
|
—
|
|
—
|
|
—
|
|
—
|
|
||||||||||
|
09/08/2011
|
55,464
|
|
18,488
|
|
(2)
|
—
|
|
2.37
|
|
9/8/2018
|
|
—
|
|
—
|
|
—
|
|
—
|
|
||||||||||
|
09/08/2011
|
—
|
|
—
|
|
—
|
|
—
|
|
—
|
|
4,000
|
|
5,000
|
|
—
|
|
—
|
|
|||||||||||
|
11/11/2010
|
40,000
|
|
—
|
|
(2)
|
—
|
|
4.36
|
|
11/11/2017
|
|
—
|
|
—
|
|
—
|
|
—
|
|
||||||||||
|
11/12/2009
|
22,297
|
|
—
|
|
(2)
|
—
|
|
6.00
|
|
11/12/2016
|
|
—
|
|
—
|
|
—
|
|
—
|
|
||||||||||
|
11/05/2008
|
16,428
|
|
—
|
|
(2)
|
—
|
|
5.97
|
|
11/5/2015
|
|
—
|
|
—
|
|
—
|
|
—
|
|
||||||||||
__________________________
|
(1)
|
Stock options vest in installments of 33 1/3% one year from the grant date, 33 1/3% two years from the grant date and 33 1/3% three years from the grant date based on continuous employment through those dates.
|
|
(2)
|
Stock options vest in installments of 50% one year from the grant date, 25% two years from the grant date and 25% three years from the grant date based on continuous employment through those dates.
|
|
(3)
|
Restricted stock that vests in installments of 33 1/3% one year from the grant date, 33 1/3% two years from the grant date and 33 1/3% three years from the grant date based on continuous employment through those dates.
|
|
(4)
|
Market value is based on the $2.21 closing price of a share of our common stock on June 27, 2014, as reported on the NASDAQ Global Select Market.
|
104
|
(5)
|
Performance shares were granted under the fiscal year 2013 LTIP, and vest if performance target is met: 1/3 upon performance target is met, 1/3 at the end of fiscal year 2014 and 1/3 at the end of fiscal 2015. The performance target is $0.17 of Non-GAAP EPS for fiscal 2013. The shares may vest following the end of our fiscal years 2013, 2014 and 2015, respectively, based on continuous employment and achievement of performance results as stated above. The first one-third of the performance shares vested on August 28, 2013.
|
Option Exercised and Stock Vested in Fiscal 2014
The following table provides information for each of our named executive officers regarding the number of shares of our common stock acquired upon the vesting of stock awards during fiscal year 2014. No options to purchase common stock were exercised during fiscal year 2014. Stock awards vesting during fiscal year 2014 consisted of restricted stock with service-based and performance-based vesting provisions.
|
Option Awards
|
Stock Awards
|
|||||||||
|
Name
|
Number of Shares Acquired on Exercise (#)
|
Value Realized on Exercise ($)
|
Number of Shares Acquired on Vesting (#)
|
Value Received on Vesting
($) (3)
|
||||||
|
Michael Pangia
|
—
|
—
|
40,926
|
|
(1)
|
101,006
|
|
|||
|
205,365
|
|
(2)
|
498,355
|
|
||||||
|
Edward Hayes Jr.
|
—
|
—
|
42,226
|
|
(1)
|
86,986
|
|
|||
|
100,816
|
|
(2)
|
244,647
|
|
||||||
|
Heinz H. Stumpe
|
—
|
—
|
13,499
|
|
(1)
|
29,786
|
|
|||
|
90,174
|
|
(2)
|
218,823
|
|
||||||
|
Shaun McFall
|
—
|
—
|
13,166
|
|
(1)
|
28,927
|
|
|||
|
77,665
|
|
(2)
|
188,467
|
|
||||||
|
Meena Elliott
|
—
|
—
|
10,666
|
|
(1)
|
23,852
|
|
|||
|
67,210
|
|
(2)
|
163,096
|
|
||||||
_________________________
|
(1)
|
Vested number of shares of service-based restricted common stock.
|
|
(2)
|
Vested number of shares of performance-based restricted common stock.
|
|
(3)
|
Amount shown is the aggregate market value of the vested shares of restricted common stock based on the closing price of our stock on the vesting date.
|
Potential Payments Upon Termination or Change of Control
Employment agreements have been established with each of the continuing named executive officers, which provide for such executives to receive certain payments and benefits if their employment with us is terminated. These arrangements are set forth in detail below assuming a termination event on June 27, 2014 based on our stock price on that date. The Board has determined that such payments and benefits are an integral part of a competitive compensation package for our executive officers.
The table below reflects the compensation and benefits due to each of the named executive officers in the event of termination of employment by us without cause or termination by the executive for good reason (other than within 18 months after a Change of Control, as defined below) and in the event of disability and in the event of termination of employment by us without cause or termination by the executive for good reason within 18 months after a Change of Control. The amounts shown in the table are estimates of the amounts that would be paid upon termination of employment. There are no compensation and benefits due to any named executive officer in the event of death, or of termination of employment by us for cause or voluntary termination. The actual amounts would be determined only at the time of the termination of employment.
105
|
Name
|
Conditions for Payouts
|
Number of Months (#)
|
Base per Month (1)
($) |
Months Times Base
($) |
Total Severance Payments
($) |
Accelerated Equity Vesting (3)
($) |
Continuation of Insurance Benefit (4)
($) |
Out-Placement Services (5)
($) |
Total
($) |
||||||||||||||||
|
Michael Pangia
|
Termination without cause or for good reason, or due to disability
|
12
|
45,833
|
|
550,000
|
|
550,000
|
|
—
|
|
20,362
|
|
30,000
|
|
600,362
|
|
|||||||||
|
Within 18 months after Change of Control
|
24
|
45,833
|
|
1,100,000
|
|
1,100,000
|
|
873,505
|
|
40,724
|
|
30,000
|
|
2,044,229
|
|
||||||||||
|
Edward J. Hayes, Jr.
|
Termination without cause or for good reason, or due to disability
|
12
|
30,000
|
|
360,000
|
|
360,000
|
|
—
|
|
18,072
|
|
30,000
|
|
408,072
|
|
|||||||||
|
Within 18 months after Change of Control
|
24
|
30,000
|
|
720,000
|
|
720,000
|
|
660,199
|
|
36,145
|
|
30,000
|
|
1,446,344
|
|
||||||||||
|
Heinz H. Stumpe
|
Termination without cause or for good reason, or due to disability
|
12
|
28,750
|
|
345,000
|
|
345,000
|
|
—
|
|
25,124
|
|
30,000
|
|
400,124
|
|
|||||||||
|
Within 18 months after Change of Control
|
24
|
28,750
|
|
690,000
|
|
690,000
|
|
339,170
|
|
50,247
|
|
30,000
|
|
1,109,417
|
|
||||||||||
|
Shaun McFall
|
Termination without cause or for good reason, or due to disability
|
12
|
26,667
|
|
320,000
|
|
320,000
|
|
—
|
|
18,072
|
|
30,000
|
|
368,072
|
|
|||||||||
|
Within 18 months after Change of Control
|
24
|
26,667
|
|
640,000
|
|
640,000
|
|
297,476
|
|
36,145
|
|
30,000
|
|
1,003,621
|
|
||||||||||
|
Meena Elliott
|
Termination without cause or for good reason, or due to disability
|
12
|
27,067
|
|
324,804
|
|
324,804
|
|
—
|
|
16,520
|
|
30,000
|
|
371,324
|
|
|||||||||
|
Within 18 months after Change of Control
|
24
|
27,067
|
|
649,608
|
|
649,608
|
|
284,639
|
|
33,040
|
|
30,000
|
|
997,287
|
|
||||||||||
______________________
|
(1)
|
The monthly base salary represents the total gross monthly payments to each named executive officer at the current salary.
|
|
(2)
|
Reflects acceleration of outstanding equity awards as of June 27, 2014.
|
|
(3)
|
The insurance benefit provided is paid directly to the insurer benefit provider and includes amounts for COBRA.
|
|
(4)
|
The estimated dollar amounts for Outplacement Services would be paid directly to an outplacement provider selected by us.
|
106
The employment agreements with our named executive officers define a “Change of Control” as follows:
|
•
|
any merger, consolidation, share exchange or acquisition, unless immediately following such merger, consolidation, share exchange or acquisition of at least 50% of the total voting power (in respect of the election of directors, or similar officials in the case of an entity other than a corporation) of the entity resulting from such merger, consolidation or share exchange, or the entity which has acquired all or substantially all of our assets (in the case of an asset sale that satisfies the criteria of an acquisition) (in either case, the “Surviving Entity”), or
|
|
•
|
if applicable, the ultimate parent entity that directly or indirectly has beneficial ownership (within the meaning of Rule 13d-3 promulgated under the Exchange Act) of 50% or more of the total voting power (in respect of the election of directors, or similar officials in the case of an entity other than a corporation) of the Surviving Entity is represented by our securities that were outstanding immediately prior to such merger, consolidation, share exchange or acquisition (or, if applicable, is represented by shares into which such Company securities were converted pursuant to such merger, consolidation, share exchange or acquisition), or
|
|
•
|
any person or group of persons (within the meaning of Section 13(d)(3) of the Exchange Act) directly or indirectly acquires beneficial ownership (determined pursuant to SEC Rule 13d-3 promulgated under the Exchange Act) of securities possessing more than 30% of the total combined voting power of our outstanding securities pursuant to a tender or exchange offer made directly to the our stockholders that the Board does not recommend such stockholders accept, other than: (i) an employee benefit plan of ours or any of our Affiliates; (ii) a trustee or other fiduciary holding securities under an employee benefit plan of our or any of our Affiliates; or (iii) an underwriter temporarily holding securities pursuant to an offering of such securities; or
|
|
•
|
over a period of 36 consecutive months or less, there is a change in the composition of the Board such that a majority of the Board members (rounded up to the next whole number, if a fraction) ceases, by reason of one or more proxy contests for the election of Board members, to be composed of individuals each of whom meet one of the following criteria: (i) have been a Board member continuously since the adoption of this Plan or the beginning of such 36-month period; (ii) have been appointed by Harris; or (iii) have been elected or nominated during such 36-month period by at least a majority of the Board members that belong to the same Class of director as such Board member; and (iv) satisfied one of the above criteria when they were elected or nominated; or
|
|
•
|
a majority of the Board determines that a Change of Control has occurred; or
|
|
•
|
the complete liquidation or dissolution of the Company.
|
Employment agreements are in effect for the other current named executive officers, which provide that if they are terminated without cause or should they resign for good reason or become disabled and they sign a general release they will be entitled to receive the following severance benefits:
|
•
|
severance payments at their final base salary for a period of 12 months following termination;
|
|
•
|
payment of premiums necessary to continue their group health insurance under COBRA (or to purchase other comparable health coverage on an individual basis if the employee is no longer eligible for COBRA coverage) until the earlier of (i) 12 months; or (ii) the date on which they first became eligible to participate in another employer’s group health insurance plan;
|
|
•
|
the prorated portion of any incentive bonus they would have earned during the incentive bonus period in which their employment was terminated;
|
|
•
|
any equity compensation subject to service-based vesting granted to the executive officer will stop vesting as of their termination date; however, they will be entitled to purchase any vested share(s) of stock that are subject to the outstanding options until the earlier of: (i) 12 months; or (ii) the date on which the applicable option(s) expire; and
|
|
•
|
outplacement assistance selected and paid for by us.
|
107
In addition, these agreements provide that if there is a Change of Control, and employment with us is terminated by us without cause or by the employee for good reason within 18 months after the Change of Control and they sign a general release of known and unknown claims in a form satisfactory to us, (i) the severance benefits described shall be increased by an additional 12 months; (ii) they will receive a payment equal to the greater of (a) the average of the annual incentive bonus payments received by them, if any, for the previous three years; or (b) their target incentive bonus for the year in which their employment terminates; and (iii) the vesting of all unvested stock option(s) and unvested equity-compensation awards subject to service-based vesting will accelerate, such that all of such stock option(s) and equity-compensation awards will be fully vested as of the date of their termination/resignation.
DIRECTOR COMPENSATION AND BENEFITS
The form and amount of director compensation is reviewed and assessed from time to time by the Compensation Committee with changes, if any, recommended to the Board for action. Director compensation may take the form of cash, equity, and other benefits ordinarily available to directors.
Directors who are not employees of ours received the following fees, as applicable, for their services on our Board during fiscal year 2014:
|
•
|
$60,000 basic annual cash retainer, payable on a quarterly basis, which a director may elect to receive in the form of shares of common stock;
|
|
•
|
$18,000 annual cash retainer, payable on a quarterly basis, for service as the lead independent director of our Board;$10,000 annual cash retainer, payable on a quarterly basis, for service as Chairman of the Audit Committee;
|
|
•
|
$5,000 annual cash retainer, payable on a quarterly basis, for service as Chairman of the Governance and Nominating Committee;
|
|
•
|
$8,000 annual cash retainer, payable on a quarterly basis, for service as Chairman of the Compensation Committee;
|
|
•
|
Annual grant of restricted shares of common stock valued (based on market prices on the date of grant) at $30,000, with 100% vesting in one year, subject to continuing service as a director; and
|
|
•
|
Annual grant of options to purchase common stock valued (based on U.S. GAAP (as defined below) values of the options on the date of grant) at $30,000, with an exercise price per share equal to the market price on the date of grant and with 100% vesting in one year, subject to continuing service as a director.
|
During fiscal year 2014, Mr. Kissner received $130,000 for services provided concerning strategic transactions and investor relations, and was not paid a cash retainer in connection with this service as a director or as Chairman.
Directors are eligible to defer payment of all or a portion of the retainer fees and restricted stock awards that are payable to them. Directors may choose either a lump sum or installment distribution of such fees and awards. Installment distributions are payable in annual installments over a period no longer than 10 years.
We reimburse each non-employee director for reasonable travel expenses incurred and in connection with attendance at Board and committee meetings on our behalf, and for expenses such as supplies and continuing director education costs, including travel for one course per year. Employee directors are not compensated for service as a director.
108
Fiscal 2014 Compensation of Non-Employee Directors
Our non-employee directors received the following aggregate amounts of compensation in respect of the fiscal year ended June 27, 2014.
|
Name
|
Fees Earned or Paid in Cash (1)
|
Stock Awards (2)
|
Option Awards (2)
|
Non-Equity Incentive Plan Compensation
|
Changes in Pension Value and Non-Qualified Deferred Compensation Earnings
|
All Other Compensation
|
Total
|
||||||||||||||
|
($)
|
($)
|
($)
|
($)
|
($)
|
($)
|
($)
|
|||||||||||||||
|
William A. Hasler
|
65,000
|
|
29,253
|
|
29,239
|
|
—
|
|
—
|
|
—
|
|
123,492
|
|
|||||||
|
Clifford H. Higgerson
|
60,000
|
|
29,253
|
|
29,239
|
|
—
|
|
—
|
|
—
|
|
118,492
|
|
|||||||
|
Charles D. Kissner
|
130,000
|
|
29,253
|
|
29,239
|
|
—
|
|
—
|
|
—
|
|
188,492
|
|
|||||||
|
Raghavendra Rau
|
60,000
|
|
29,253
|
|
29,239
|
|
—
|
|
—
|
|
—
|
|
118,492
|
|
|||||||
|
Dr. Mohsen Sohi
|
60,000
|
|
29,253
|
|
29,239
|
|
—
|
|
—
|
|
—
|
|
118,492
|
|
|||||||
|
Dr. James C. Stoffel
|
86,000
|
|
29,253
|
|
29,239
|
|
—
|
|
—
|
|
—
|
|
144,492
|
|
|||||||
|
Edward F. Thompson
|
70,000
|
|
29,253
|
|
29,239
|
|
—
|
|
—
|
|
—
|
|
128,492
|
|
|||||||
___________________
|
(1)
|
Du
ring fiscal year 2014, Mr. Kissner received $130,000 for services provided concerning strategic transactions and investor relations, and was not paid a cash retainer in connection with this service as a director or as Chairman.
|
|
(2)
|
The amounts shown in this column reflect the aggregate grant date fair value of the stock awards and option awards granted to our non-employee directors computed in accordance with FASB ASC Topic 718. The assumptions made in determining the fair values of our stock awards and option awards are set forth in Notes 1 and 10 to our fiscal 2014 Consolidated Financial Statements in Part II, Item 8 of this Annual Report on Form 10-K filed with the SEC on September 12, 2014.
|
As of June 27, 2014, our non-employee directors held the following numbers of unvested restricted shares of common stock and stock options, all of which were granted under the 2007 Plan:
|
Name
|
Unvested Stock Awards
|
Unvested Option Awards
|
||||
|
William A. Hasler
|
14,925
|
|
36,403
|
|
||
|
Clifford H. Higgerson
|
14,925
|
|
36,403
|
|
||
|
Charles D. Kissner
|
14,925
|
|
36,403
|
|
||
|
Raghavendra Rau
|
14,925
|
|
36,403
|
|
||
|
Dr. Mohsen Sohi
|
14,925
|
|
36,403
|
|
||
|
Dr. James C. Stoffel
|
14,925
|
|
36,403
|
|
||
|
Edward F. Thompson
|
14,925
|
|
36,403
|
|
||
Indemnification
Our Bylaws require us to indemnify each of our directors and officers with respect to their activities as a director, officer, or employee of ours, or when serving at our request as a director, officer, or trustee of another corporation, trust, or other enterprise, against losses and expenses (including attorney fees, judgments, fines, and amounts paid in settlement) incurred by them in any threatened, pending, or completed action, suit, or proceeding, whether civil, criminal, administrative, or investigative, to which they are, or are threatened to be made, a party(ies) as a result of their service to us. In addition, we carry directors’ and officers’ liability insurance, which includes similar coverage for our directors and executive officers. We will indemnify each such director or officer for any one or a combination of the following, whichever is most advantageous to such director or officer:
109
|
•
|
The benefits provided by our Bylaws in effect on the date of the indemnification agreement or at the time expenses are incurred by the director or officer;
|
|
•
|
The benefits allowable under Delaware law in effect on the date the indemnification bylaw was adopted, or as such law may be amended;
|
|
•
|
The benefits available under liability insurance obtained by us; and
|
|
•
|
Such benefits as may otherwise be available to the director or officer under our existing practices.
|
Under our Bylaws, each director or officer will continue to be indemnified even after ceasing to occupy a position as an officer, director, employee or agent of ours with respect to suits or proceedings arising from his or her service with us.
Item 12.
Security Ownership of Certain Beneficial Owners and Management and Related Stockholder Matters
Security Ownership of Certain Beneficial Owners and Management
The following table sets forth information with respect to the beneficial ownership of our common stock as of
November 18, 2014
by each person or entity known by us to beneficially own more than 5 percent of our common stock, by our directors, by our named executive officers and by all our directors and executive officers as a group. Except as indicated in the footnotes to this table, and subject to applicable community property laws, the persons listed in the table below have sole voting and investment power with respect to all shares of our common stock shown as beneficially owned by them. Unless otherwise indicated, the address of each of the beneficial owners identified is c/o Aviat Networks, Inc., 5200 Great America Parkway, Santa Clara, CA 95054. As of
November 18, 2014
, there were
62,223,790
shares of our common stock outstanding.
110
|
Shares Beneficially Owned as of November 18, 2014(1)
|
|||||||
|
Number of Shares of Common Stock(2)
|
Percentage of Voting Power of Common Stock
|
||||||
|
Name and Address of Beneficial Owner
|
|||||||
|
Steel Partners Holdings L.P.
590 Madison Avenue, 32nd Floor New York, NY |
8,020,865
|
|
(3)
|
12.89
|
%
|
||
|
PENN Capital Management
Navy Yard Corporate Center Three Crescent Drive, Suite 400 Philadelphia, PA 19112 |
3,665,602
|
|
(4)
|
5.89
|
%
|
||
|
Schneider Capital Management Corporation
460 E. Swedesford Road, Suite 2000 Wayne, PA 19087 |
3,654,866
|
|
(5)
|
5.87
|
%
|
||
|
Dimensional Fund Advisors LP
Palisades West, Building One 6300 Bee Cave Road, Building One Austin, TX 78746 |
3,558,261
|
|
(6)
|
5.72
|
%
|
||
|
Named Executive Officers and Directors
|
|||||||
|
Meena Elliott
|
331,514
|
|
(7)
|
*
|
|
||
|
William A. Hasler
|
184,199
|
|
(8)
|
*
|
|
||
|
Clifford H. Higgerson
|
307,806
|
|
(9)
|
*
|
|
||
|
Edward J. Hayes, Jr.
|
784,246
|
|
(10)
|
1.26
|
%
|
||
|
Charles D. Kissner
|
790,658
|
|
(11)
|
1.27
|
%
|
||
|
Shaun McFall
|
408,035
|
|
(12)
|
*
|
|
||
|
Michael Pangia
|
1,113,516
|
|
(13)
|
1.79
|
%
|
||
|
Raghavendra Rau
|
146,506
|
|
(14)
|
*
|
|
||
|
Dr. Mohsen Sohi
|
175,660
|
|
(8)
|
*
|
|
||
|
Dr. James C. Stoffel
|
175,511
|
|
(8)
|
*
|
|
||
|
Heinz H. Stumpe
|
425,787
|
|
(15)
|
*
|
|
||
|
Edward F. Thompson
|
178,011
|
|
(8)
|
*
|
|
||
|
All directors and executive officers as a group (12 persons)
|
5,021,449
|
|
(16)
|
8.07
|
%
|
||
__________________________
* Less than one percent
* Less than one percent
|
(1)
|
Beneficial ownership is determined under the rules and regulations of the SEC, and generally includes voting or dispositive power with respect to such shares.
|
|
(2)
|
Shares of common stock that a person has the right to acquire within 60 days are deemed to be outstanding and beneficially owned by that person for the purpose of computing the total number of shares beneficially owned by that person and the percentage ownership of that person, but are not deemed to be outstanding for the purpose of computing the percentage ownership of any other person or group. Accordingly, the amounts in the table include shares of common stock that such person has the right to acquire within 60 days of
November 18, 2014
by the exercise of stock options.
|
|
(3)
|
Based solely on a review of Amendment No. 5 to the Schedule 13D filed with the SEC on November 10, 2014 by Steel Excel Inc., Steel Partners Holdings L.P., SPH Group LLC, SPH Group Holdings LLC and Steel Partners Holdings GP Inc. Each of the foregoing entities reported shared voting and dispositive power with respect to all of such shares.
|
|
(4)
|
Based solely on a review of the Schedule 13G filed with the SEC on February 15, 2013 by PENN Capital Management. PENN Capital Management reported sole voting and dispositive power with respect to all such shares.
|
111
|
(5)
|
Based solely on a review of the Schedule 13G filed with the SEC on February 14, 2014 by Schneider Capital Management Corporation. Schneider Capital Management Corporation reported sole voting power with respect to 3,630,240 of such shares and sole dispositive power with respect to all of such shares.
|
|
(6)
|
Based solely on a review of Amendment No. 1 to the Schedule 13G filed with the SEC on February 10, 2014 by Dimensional Fund Advisors LP. Dimensional Fund Advisors LP reported sole voting power with respect to 3,449,131 of such shares and sole dispositive power with respect to all such shares.
|
|
(7)
|
Includes options to purchase
231,882
shares of common stock that are currently exercisable or will become exercisable within 60 days of
November 18, 2014
.
|
|
(8)
|
Includes options to purchase
103,820
shares of common stock that are currently exercisable or will become exercisable within 60 days of
November 18, 2014
.
|
|
(9)
|
Includes options to purchase
103,820
shares of common stock that are currently exercisable or will become exercisable within 60 days of
November 18, 2014
. Includes
107,895
shares held by, or in trusts for, members of Mr. Higgerson’s family. Also includes
24,400
shares held by Higgerson Investments. Mr. Higgerson disclaims beneficial ownership of the shares held in trust and held by Higgerson Investments.
|
|
(10)
|
Includes options to purchase
550,987
shares of common stock that are currently exercisable or will become exercisable within 60 days of
November 18, 2014
.
|
|
(11)
|
Includes options to purchase
345,636
shares of common stock that are currently exercisable or will become exercisable within 60 days of
November 18, 2014
. Includes
239,041
shares held by, or in trusts for, members of Mr. Kissner’s family. Mr. Kissner disclaims beneficial ownership of the shares held in trust.
|
|
(12)
|
Includes options to purchase
276,472
shares of common stock that are currently exercisable or will become exercisable within 60 days of
November 18, 2014
.
|
|
(13)
|
Includes options to purchase
722,939
shares of common stock that are currently exercisable or will become exercisable within 60 days of
November 18, 2014
.
|
|
(14)
|
Includes options to purchase
100,983
shares of common stock that are currently exercisable or will become exercisable within 60 days of
November 18, 2014
.
|
|
(15)
|
Includes options to purchase
308,807
shares of common stock that are currently exercisable or will become exercisable within 60 days of
November 18, 2014
.
|
|
(16)
|
Includes options to purchase
3,056,806
shares of common stock that are currently exercisable or will become exercisable within 60 days of
November 18, 2014
.
|
Equity Compensation Plan Summary
The following table provides information as of
June 27, 2014
, relating to our equity compensation plan pursuant to which grants of options, restricted stock and performance shares may be granted from time to time and the option plans and agreements assumed by us in connection with the Stratex acquisition:
|
Plan Category
|
Number of Securities to
be Issued Upon Exercise
of Options and Vesting
of restricted Stock Units
and Performance Share
Units
(1)
|
Weighted-Average
Exercise Price of
Outstanding
Options
(2)
|
Number of Securities
Remaining Available for
Further Issuance Under
Equity Compensation
Plans (Excluding
Securities Reflected in
the First Column)
|
||||||
|
Equity Compensation plan approved by security holders
(3)
|
7,708,529
|
|
$
|
3.21
|
|
3,599,382
|
|
||
|
Equity Compensation plans not approved by security
holders
(4)
|
32,625
|
|
$
|
24.60
|
|
—
|
|
||
|
Total
|
7,741,154
|
|
$
|
3.30
|
|
3,599,382
|
|
||
_________________________
|
(1)
|
Under the 2007 Stock Equity Plan, in addition to options, we have granted share-based compensation awards in the form of performance shares, restricted stock, performance share units and restricted stock units. As of
June 27, 2014
, there were
389,612
such awards outstanding under that plan. The outstanding awards consisted of (i) performance share awards at target and restricted stock awards, for which all
197,457
shares were issued and outstanding; and (ii)
192,155
performance share unit awards at target and restricted stock unit awards, for which all
192,155
were payable in shares but for which no shares were yet issued and outstanding. The
|
112
7,708,529
shares to be issued upon exercise of outstanding options and vesting of restricted stock units and performance share units as listed in the first column consisted of shares to be issued in respect of the exercise of
7,516,374
outstanding options and in respect of the
192,155
performance share unit awards and restricted stock units awards payable in shares.
|
(2)
|
Excluded weighted average fair value of restricted stock units and performance share units at issuance date.
|
|
(3)
|
Consisted solely of our 2007 Stock Equity Plan, as amended and restated effective November 17, 2011.
|
|
(4)
|
Consisted of common stock that may be issued pursuant to option plans and agreements assumed pursuant to the Stratex acquisition. The Stratex plans were duly approved by the stockholders of Stratex prior to the merger with us. No shares are available for further issuance.
|
|
(5)
|
For further information on our equity compensation plans see “Note 1. The Company and Summary of Significant Accounting Policies” and “Note 10. Stockholders’ Equity” in the notes to consolidated financial statements included in Item 8.
|
Item 13.
Certain Relationships and Related Transactions, and Director Independence
During fiscal year 2014, we believe there were no transactions, or series of similar transactions, to which we were or are to be a party in which the amount exceeded $120,000, and in which any of our directors or executive officers, any holders of more than 5% of our common stock or any members of any such person’s immediate family, had or will have a direct or indirect material interest, other than compensation described in the sections titled “Director Compensation and Benefits” and “Executive Compensation.”
It is the policy and practice of our Board to review and assess information concerning transactions involving related persons. Related persons include our directors and executive officers and their immediate family members. If the determination is made that a related person has a material interest in a transaction involving us, then the disinterested members of our Board would review and approve or ratify it, and we would disclose the transaction in accordance with SEC rules and regulations. If the related person is a member of our Board, or a family member of a director, then that director would not participate in any discussion involving the transaction at issue.
Our Code of Conduct prohibits all employees, including our executive officers, from benefiting personally from any transactions with us other than approved compensation benefits.
Information regarding director independence appears in Part III, Item 10 of this Annual Report on Form 10-K.
Item 14.
Principal Accountant Fees and Services
KPMG LLP has been approved by our Audit Committee to act as our independent registered public accounting firm for the fiscal year ending June 27, 2014.
Audit and other fees billed to us for the fiscal year ended June 27, 2014 and June 28, 2013 are as follows:
|
Fiscal 2014
(2)
|
Fiscal 2013
(1)
|
|||||||
|
Audit Fees
(3)
|
$
|
2,989,380
|
|
$
|
1,428,917
|
|
||
|
Audit-Related Fees
(4)
|
—
|
|
7,500
|
|
||||
|
Tax Fees
(5)
|
104,356
|
|
64,185
|
|
||||
|
All Other Fees
(6)
|
10,000
|
|
—
|
|
||||
|
Total Fees for Services Provided
|
$
|
3,103,736
|
|
$
|
1,500,602
|
|
||
________________________
|
(1)
|
On September 6, 2012, the Audit Committee approved the engagement of KPMG LLP as its new independent registered public accounting firm for the year ending June 28, 2013. The appointment of KPMG LLP was ratified by our stockholders at our 2012 Annual Meeting held on November 13, 2012.
|
|
(2)
|
Includes the following fees billed to us by KPMG LLP for the period June 27, 2014 through December 19, 2014: audit fees totaling $1,488,698 and tax fees totaling $16,601.
|
113
|
(3)
|
Audit fees include fees associated with the annual audit, as well as reviews of our quarterly reports on Form 10-Q, SEC registration statements, accounting and reporting consultations and statutory audits required internationally for our subsidiaries.
|
|
(4)
|
Audit-related fees include fees for completion of certain statutory registration requirements.
|
|
(5)
|
Tax fees were for services related to tax compliance and tax planning services.
|
|
(6)
|
Other fees include fees billed for other services rendered not included within Audit Fees, Audit Related Fees or Tax Fees.
|
KPMG LLP did not perform any professional services related to financial information systems design and implementation for us in fiscal 2014 or fiscal 2013.
The Audit Committee has determined in its business judgment that the provision of non-audit services described above is compatible with maintaining KPMG LLP's independence.
114
Item 15.
Exhibits and Financial Statement Schedules
|
(a)
|
The following documents are filed as part of this report.
|
1. Financial Statements.
The financial statements of Aviat Networks, Inc. are set forth in Item 8 of this Annual Report on Form 10-K.
2. Financial Statement Schedules.
Schedule II — Valuation and Qualifying Accounts for the three fiscal years ended
June 27, 2014
All other schedules have been omitted because the required information is not present or is not present in amounts sufficient to require submission of the schedules or because the information required is included in the consolidated financial statements or notes thereto.
(b) Exhibits.
The following exhibits are filed herewith or are incorporated herein by reference to exhibits previously filed with the SEC:
|
Ex. #
|
|
Description
|
|
2.1
|
|
Intentionally omitted
|
|
2.2
|
|
Intentionally omitted
|
|
2.3
|
|
Intentionally omitted
|
|
2.4
|
|
Asset Purchase Agreement by and among Aviat U.S., Inc. and EION Networks, Inc., dated as of September 2, 2011 (incorporated by reference to Exhibit 2.1 to the Current Report on Form 8-K filed with the SEC on September 9, 2011, File No. 001-33278)
|
|
3.1
|
|
Amended and Restated Certificate of Incorporation of Harris Stratex Networks, Inc. as filed with the Secretary of State of the State of Delaware on November 19, 2009 (incorporated by reference to Exhibit 3.1 to the Current Report on Form 8-K filed with the SEC on November 23, 2009, File No. 001-33278)
|
|
3.2
|
|
Amended and Restated Bylaws of Harris Stratex Networks, Inc. (incorporated by reference to Exhibit 3.2 to the Current Report on Form 8-K filed with the SEC on November 23, 2009, File No. 001-33278)
|
|
3.3
|
|
Certificate of Ownership and Merger Merging Aviat Networks, Inc. into Harris Stratex Networks, Inc., effective January 27, 2010, as filed with the Secretary of State of the State of Delaware on January 27, 2010 (incorporated by reference to Exhibit 3.1 to the Current Report on Form 8-K filed with the SEC on January 28, 2010, File No. 001-33278)
|
115
|
Ex. #
|
|
Description
|
|
4.1
|
|
Intentionally omitted
|
|
4.1.1
|
|
Specimen common stock certificate, adopted as of January 29, 2010 (incorporated by reference to Exhibit 4.1.1 to the Annual Report on Form 10-K for fiscal year end July 2, 2010 filed with the SEC on September 9, 2010, File No. 001-33278)
|
|
4.2
|
|
Intentionally omitted
|
|
4.3
|
|
Intentionally omitted
|
|
10.1
|
|
Intentionally omitted
|
|
10.2
|
|
Intentionally omitted
|
|
10.3
|
|
Intellectual Property Agreement between Harris Stratex Networks, Inc. and Harris Corporation dated January 26, 2007 (incorporated by reference to Exhibit 10.4 to the Current Report on Form 8-K filed with the SEC on February 1, 2007, File No. 001-33278)
|
|
10.4
|
|
Intentionally omitted
|
|
10.5
|
|
Intentionally omitted
|
|
10.6
|
|
Intentionally omitted
|
|
10.6.1
|
|
Intentionally omitted
|
|
10.7
|
|
Intentionally omitted
|
|
10.8
|
|
Intentionally omitted
|
|
10.9
|
|
Intentionally omitted
|
|
10.10
|
|
Tax Sharing Agreement between Harris Stratex Networks, Inc. and Harris Corporation dated January 26, 2007 (incorporated by reference to Exhibit 10.11 to the Current Report on Form 8-K filed with the SEC on February 1, 2007, File No. 001-33278)
|
|
10.11
|
|
Intentionally omitted
|
|
10.12*
|
|
Intentionally omitted
|
|
10.13*
|
|
Intentionally omitted
|
116
|
Ex. #
|
|
Description
|
|
10.13.1*
|
|
Intentionally omitted
|
|
10.14*
|
|
Standard Form of Executive Employment Agreement between Harris Stratex Networks, Inc. and certain executives (incorporated by reference to Exhibit 10.16 to the Current Report on Form 8-K filed with the SEC on February 1, 2007, File No. 001-33278)
|
|
10.15
|
|
Form of Indemnification Agreement between Harris Stratex Networks, Inc. and its directors and certain officers (incorporated by reference to Exhibit 10.16 to the Registration Statement on Form S-1 of Stratex Networks, Inc., File No. 33-13431)
|
|
10.16
|
|
Intentionally omitted
|
|
10.17*
|
|
Harris Stratex Networks, Inc. Annual Incentive Plan (incorporated by reference to Exhibit 10.17 to the Annual Report on Form 10-K for the fiscal year ended June 27, 2008 filed with the SEC on September 25, 2008, File No. 001-33278)
|
|
10.18*
|
|
Harris Stratex Networks, Inc. 2007 Stock Equity Plan (incorporated by reference to Exhibit 4.9 to the Registration Statement on Form S-8 filed with the SEC on February 5, 2007, File No. 333-140442)
|
|
10.18.1
|
|
Harris Stratex Networks, Inc. 2007 Stock Equity Plan (As Amended and Restated Effective November 19, 2009) (incorporated by reference to Appendix B to the Registrant’s Schedule 14A filed with the Securities and Exchange Commission on October 7, 2009, File No. 001-33278)
|
|
10.18.2
|
Aviat Networks, Inc. 2007 Stock Equity Plan (as Amended and Restated Effective November 17, 2011) (incorporated by reference to Appendix A to Schedule 14A filed with the SEC on October 3, 2011, File No. 001-33278)
|
|
|
10.19
|
|
Intentionally omitted
|
|
10.19.1
|
|
Intentionally omitted
|
|
10.20
|
|
Intentionally omitted
|
|
10.20.1
|
|
Intentionally omitted
|
|
10.20.2
|
Intentionally omitted
|
|
|
10.20.3
|
Second Amended and Restated Loan and Security Agreement, dated as of March 28, 2014, by and among Aviat Networks, Inc., Aviat U.S., Inc., Aviat Networks (S) Pte. Ltd., and Silicon Valley Bank (incorporated by reference to Exhibit 10.1 to the Current Report on Form 8-K filed with the SEC on March 31, 2014, File No. 001-33278)
|
|
|
10.21
|
|
Intentionally omitted
|
117
|
Ex. #
|
|
Description
|
|
10.22*
|
|
Intentionally omitted
|
|
10.22.1*
|
Employment Agreement, effective as of October 31, 2011, between Aviat Networks, Inc. and Edward J. Hayes, Jr.
(incorporated by reference to the Current Report on Form 8-K filed with the SEC on October 31, 2011, File No. 001-33278)
|
|
|
10.23*
|
|
Employment Agreement, dated as of April 1, 2006, between Harris Stratex Networks, Inc. and Heinz Stumpe (incorporated by reference to Exhibit 10.15.2 to the Quarterly Report on Form 10-Q for the fiscal quarter ended March 30, 2007 filed with the SEC on May 8, 2007, File No. 001-33278)
|
|
10.24*
|
|
Intentionally omitted
|
|
10.24.1*
|
|
Intentionally omitted
|
|
10.24.2*
|
|
Intentionally omitted
|
|
10.25*
|
|
Employment Agreement, dated as of May 14, 2002, between Stratex Networks, Inc. and Shaun McFall (incorporated by reference to Exhibit 10.25 to the Annual Report on Form 10-K for the fiscal year ended July 3, 2009 filed with the SEC on September 4, 2009, File No. 001-33278)
|
|
10.25.1*
|
|
Amendment, effective April 1, 2006, to Employment Agreement, dated May 14, 2002, between Stratex Networks, Inc. and Shaun McFall (incorporated by reference to Exhibit 10.25.1 to the Annual Report on Form 10-K for the fiscal year ended July 3, 2009 filed with the SEC on September 4, 2009, File No. 001-33278)
|
|
10.26*
|
|
Intentionally omitted
|
|
10.26.1*
|
|
Intentionally omitted
|
|
10.27*
|
|
Intentionally omitted
|
|
10.28*
|
|
Employment Agreement, dated July 18, 2011, between Aviat Networks, Inc. and Michael Pangia (incorporated by reference to the Current Report on Form 8-K filed with the SEC on July 20, 2011, File No. 001-33278)
|
|
10.29*
|
|
Employment Agreement, dated December 30, 2010, between Aviat Networks, Inc. and John Madigan (incorporated by reference to Exhibit 10.1 to the Current Report on Form 8-K filed with the SEC on January 4, 2011, File No. 001-33278)
|
118
|
Ex. #
|
|
Description
|
|
10.31
|
|
Intentionally omitted
|
|
16
|
|
Letter from Ernst & Young LLP to the Securities and Exchange Commission dated September 12, 2012 (incorporated by reference to Exhibit 16.1 to the Current Report on Form 8-K filed with the Securities and Exchange Commission on September 12, 2012, File No.. 001-33278)
|
|
21
|
|
List of Subsidiaries of Aviat Networks, Inc.
|
|
23.1
|
|
Consent of KPMG LLP
|
|
23.2
|
Consent of Ernst & Young LLP
|
|
|
31.1
|
|
Rule 13a-14(a)/15d-14(a) Certification of Chief Executive Officer
|
|
31.2
|
|
Rule 13a-14(a)/15d-14(a) Certification of Chief Financial Officer
|
|
32.1
|
|
Section 1350 Certification of Chief Executive Officer
|
|
32.2
|
|
Section 1350 Certification of Chief Financial Officer
|
|
101.INS
|
|
XBRL Instance Document
|
|
101.SCH
|
|
XBRL Taxonomy Extension Schema Document
|
|
101.CAL
|
|
XBRL Taxonomy Extension Calculation Linkbase Document
|
|
101.DEF
|
|
XBRL Taxonomy Extension Definition Linkbase Document
|
|
101.LAB
|
|
XBRL Taxonomy Extension Label Linkbase Document
|
|
101.PRE
|
|
XBRL Taxonomy Extension Presentation Linkbase Document
|
_____________________________
|
*
|
Management compensatory contract, arrangement or plan required to be filed as an exhibit pursuant to Item 15(b) of this report.
|
119
SIGNATURES
Pursuant to the requirements of the Securities Exchange Act of 1934, the registrant has duly caused this report to be signed on its behalf by the undersigned, thereunto duly authorized.
|
AVIAT NETWORKS, INC.
(Registrant)
|
||
|
By:
|
|
/s/ Michael A. Pangia
|
|
|
Michael A. Pangia
President and Chief Executive Officer
|
|
Date:
December 19, 2014
Pursuant to the requirements of the Securities Exchange Act of 1934, this report has been signed below by the following persons on behalf of the registrant and in the capacities and on the dates indicated.
|
Signature
|
Title
|
Date
|
||
|
/s/ Michael A. Pangia
|
President and Chief Executive Officer
(Principal Executive Officer)
|
December 19, 2014
|
||
|
Michael A. Pangia
|
||||
|
/s/ Edward J. Hayes, Jr.
|
Senior Vice President and
Chief Financial Officer
(Principal Financial Officer)
|
December 19, 2014
|
||
|
Edward J. Hayes, Jr.
|
||||
|
/s/ John J. Madigan
|
Vice President, Corporate Controller and
Principal Accounting Officer
(Principal Accounting Officer)
|
December 19, 2014
|
||
|
John J. Madigan
|
||||
|
/s/ Charles D. Kissner
|
Chairman of the Board
|
December 19, 2014
|
||
|
Charles D. Kissner
|
||||
|
/s/ William A. Hasler
|
Director
|
December 19, 2014
|
||
|
William A. Hasler
|
||||
|
/s/ Clifford H. Higgerson
|
Director
|
December 19, 2014
|
||
|
Clifford H. Higgerson
|
||||
|
/s/ Raghavendra Rau
|
Director
|
December 19, 2014
|
||
|
Raghavendra Rau
|
||||
|
/s/ Dr. Mohsen Sohi
|
Director
|
December 19, 2014
|
||
|
Dr. Mohsen Sohi
|
||||
|
/s/ James C. Stoffel
|
Lead Independent Director
|
December 19, 2014
|
||
|
James C. Stoffel
|
||||
|
/s/ Edward F. Thompson
|
Director
|
December 19, 2014
|
||
|
Edward F. Thompson
|
||||
120
SCHEDULE II — VALUATION AND QUALIFYING ACCOUNTS AND RESERVES
AVIAT NETWORKS, INC.
Years Ended
June 27, 2014
,
June 28, 2013
and
June 29, 2012
|
|
Balance at
Beginning of
Period
|
Additions Charged to
Costs and
Expenses
|
Deductions
Describe
|
Balance
at End
of Period
|
|||||||||||
|
|
(In millions)
|
||||||||||||||
|
Allowances for collection losses:
|
|||||||||||||||
|
Year ended June 27, 2014
|
$
|
10.2
|
|
$
|
1.5
|
|
$
|
4.3
|
|
(A)
|
$
|
7.4
|
|
||
|
Year ended June 28, 2013
|
$
|
16.2
|
|
$
|
2.8
|
|
$
|
8.8
|
|
(B)
|
$
|
10.2
|
|
||
|
Year ended June 29, 2012
|
$
|
14.2
|
|
$
|
3.9
|
|
$
|
1.9
|
|
(C)
|
$
|
16.2
|
|
||
____________________________
|
Note A
|
Consisted of changes to allowance for collection losses of $4.3 million for uncollectible accounts charged off, net of recoveries on accounts previously charged off.
|
|
|
Note B
|
Consisted of changes to allowance for collection losses of $0.1 million for foreign currency translation losses and $8.9 million for uncollectible accounts charged off, net of recoveries on accounts previously charged off.
|
|
|
Note C
|
Consisted of changes to allowance for collection losses of $0.7 million for foreign currency translation gains and $1.2 million for uncollectible accounts charged off, net of recoveries on accounts previously charged off.
|
|
121
EXHIBIT INDEX
The following exhibits are filed herewith or are incorporated herein by reference to exhibits previously filed with the SEC:
|
Ex. #
|
|
Description
|
|
2.1
|
|
Intentionally omitted
|
|
2.2
|
|
Intentionally omitted
|
|
2.3
|
|
Intentionally omitted
|
|
2.4
|
|
Asset Purchase Agreement by and among Aviat U.S., Inc. and EION Networks, Inc., dated as of September 2, 2011 (incorporated by reference to Exhibit 2.1 to the Current Report on Form 8-K filed with the SEC on September 9, 2011, File No. 001-33278)
|
|
3.1
|
|
Amended and Restated Certificate of Incorporation of Harris Stratex Networks, Inc. as filed with the Secretary of State of the State of Delaware on November 19, 2009 (incorporated by reference to Exhibit 3.1 to the Current Report on Form 8-K filed with the SEC on November 23, 2009, File No. 001-33278)
|
|
3.2
|
|
Amended and Restated Bylaws of Harris Stratex Networks, Inc. (incorporated by reference to Exhibit 3.2 to the Current Report on Form 8-K filed with the SEC on November 23, 2009, File No. 001-33278)
|
|
3.3
|
|
Certificate of Ownership and Merger Merging Aviat Networks, Inc. into Harris Stratex Networks, Inc., effective January 27, 2010, as filed with the Secretary of State of the State of Delaware on January 27, 2010 (incorporated by reference to Exhibit 3.1 to the Current Report on Form 8-K filed with the SEC on January 28, 2010, File No. 001-33278)
|
|
4.1
|
|
Intentionally omitted
|
|
4.1.1
|
|
Specimen common stock certificate, adopted as of January 29, 2010 (incorporated by reference to Exhibit 4.1.1 to the Annual Report on Form 10-K for fiscal year end July 2, 2010 filed with the SEC on September 9, 2010, File No. 001-33278)
|
|
4.2
|
|
Intentionally omitted
|
|
4.3
|
|
Intentionally omitted
|
|
10.1
|
|
Intentionally omitted
|
|
10.2
|
|
Intentionally omitted
|
|
10.3
|
|
Intellectual Property Agreement between Harris Stratex Networks, Inc. and Harris Corporation dated January 26, 2007 (incorporated by reference to Exhibit 10.4 to the Current Report on Form 8-K filed with the SEC on February 1, 2007, File No. 001-33278)
|
122
|
Ex. #
|
|
Description
|
|
10.4
|
|
Intentionally omitted
|
|
10.5
|
|
Intentionally omitted
|
|
10.6
|
|
Intentionally omitted
|
|
10.6.1
|
|
Intentionally omitted
|
|
10.7
|
|
Intentionally omitted
|
|
10.8
|
|
Intentionally omitted
|
|
10.9
|
|
Intentionally omitted
|
|
10.10
|
|
Tax Sharing Agreement between Harris Stratex Networks, Inc. and Harris Corporation dated January 26, 2007 (incorporated by reference to Exhibit 10.11 to the Current Report on Form 8-K filed with the SEC on February 1, 2007, File No. 001-33278)
|
|
10.11
|
|
Intentionally omitted
|
|
10.12*
|
|
Intentionally omitted
|
|
10.13*
|
|
Intentionally omitted
|
|
10.13.1*
|
|
Intentionally omitted
|
|
10.14*
|
|
Standard Form of Executive Employment Agreement between Harris Stratex Networks, Inc. and certain executives (incorporated by reference to Exhibit 10.16 to the Current Report on Form 8-K filed with the SEC on February 1, 2007, File No. 001-33278)
|
|
10.15
|
|
Form of Indemnification Agreement between Harris Stratex Networks, Inc. and its directors and certain officers (incorporated by reference to Exhibit 10.16 to the Registration Statement on Form S-1 of Stratex Networks, Inc., File No. 33-13431)
|
|
10.16
|
|
Intentionally omitted
|
123
|
Ex. #
|
|
Description
|
|
10.17*
|
|
Harris Stratex Networks, Inc. Annual Incentive Plan (incorporated by reference to Exhibit 10.17 to the Annual Report on Form 10-K for the fiscal year ended June 27, 2008 filed with the SEC on September 25, 2008, File No. 001-33278)
|
|
10.18*
|
|
Harris Stratex Networks, Inc. 2007 Stock Equity Plan (incorporated by reference to Exhibit 4.9 to the Registration Statement on Form S-8 filed with the SEC on February 5, 2007, File No. 333-140442)
|
|
10.18.1
|
|
Harris Stratex Networks, Inc. 2007 Stock Equity Plan (As Amended and Restated Effective November 19, 2009) (incorporated by reference to Appendix B to the Registrant’s Schedule 14A filed with the Securities and Exchange Commission on October 7, 2009, File No. 001-33278)
|
|
10.18.2
|
Aviat Networks, Inc. 2007 Stock Equity Plan (as Amended and Restated Effective November 17, 2011) (incorporated by reference to Appendix A to Schedule 14A filed with the SEC on October 3, 2011, File No. 001-33278)
|
|
|
10.19
|
|
Intentionally omitted
|
|
10.19.1
|
|
Intentionally omitted
|
|
10.20
|
|
Intentionally omitted
|
|
10.20.1
|
|
Intentionally omitted
|
|
10.20.2
|
Intentionally omitted
|
|
|
10.20.3
|
Second Amended and Restated Loan and Security Agreement, dated as of March 28, 2014, by and among Aviat Networks, Inc., Aviat U.S., Inc., Aviat Networks (S) Pte. Ltd., and Silicon Valley Bank (incorporated by reference to Exhibit 10.1 to the Current Report on Form 8-K filed with the SEC on March 31, 2014, File No. 001-33278)
|
|
|
10.21
|
|
Intentionally omitted
|
|
10.22*
|
|
Intentionally omitted
|
|
10.22.1*
|
Employment Agreement, effective as of October 31, 2011, between Aviat Networks, Inc. and Edward J. Hayes, Jr. (incorporated by reference to the Current Report on Form 8-K filed with the SEC on October 31, 2011, File No. 001-33278)
|
|
|
10.23*
|
|
Employment Agreement, dated as of April 1, 2006, between Harris Stratex Networks, Inc. and Heinz Stumpe (incorporated by reference to Exhibit 10.15.2 to the Quarterly Report on Form 10-Q for the fiscal quarter ended March 30, 2007 filed with the SEC on May 8, 2007, File No. 001-33278)
|
|
10.24*
|
|
Intentionally omitted
|
|
10.24.1*
|
|
Intentionally omitted
|
124
|
Ex. #
|
|
Description
|
|
10.24.2*
|
|
Intentionally omitted
|
|
10.25*
|
|
Employment Agreement, dated as of May 14, 2002, between Stratex Networks, Inc. and Shaun McFall (incorporated by reference to Exhibit 10.25 to the Annual Report on Form 10-K for the fiscal year ended July 3, 2009 filed with the SEC on September 4, 2009, File No. 001-33278)
|
|
10.25.1*
|
|
Amendment, effective April 1, 2006, to Employment Agreement, dated May 14, 2002, between Stratex Networks, Inc. and Shaun McFall (incorporated by reference to Exhibit 10.25.1 to the Annual Report on Form 10-K for the fiscal year ended July 3, 2009 filed with the SEC on September 4, 2009, File No. 001-33278)
|
|
10.26*
|
|
Intentionally omitted
|
|
10.26.1*
|
|
Intentionally omitted
|
|
10.27*
|
|
Intentionally omitted
|
|
10.28*
|
|
Employment Agreement, dated July 18, 2011, between Aviat Networks, Inc. and Michael Pangia (incorporated by reference to the Current Report on Form 8-K filed with the SEC on July 20, 2011, File No. 001-33278)
|
|
10.29*
|
|
Employment Agreement, dated December 30, 2010, between Aviat Networks, Inc. and John Madigan (incorporated by reference to Exhibit 10.1 to the Current Report on Form 8-K filed with the SEC on January 4, 2011, File No. 001-33278)
|
|
|
||
|
10.31
|
|
Intentionally omitted
|
|
16
|
|
Letter from Ernst & Young LLP to the Securities and Exchange Commission dated September 12, 2012 (incorporated by reference to Exhibit 16.1 to the Current Report on Form 8-K filed with the Securities and Exchange Commission on September 12, 2012, File No.. 001-33278)
|
|
21
|
|
List of Subsidiaries of Aviat Networks, Inc.
|
|
23.1
|
|
Consent of KPMG LLP
|
|
23.2
|
Consent of Ernst & Young LLP
|
|
|
31.1
|
|
Rule 13a-14(a)/15d-14(a) Certification of Chief Executive Officer
|
|
31.2
|
|
Rule 13a-14(a)/15d-14(a) Certification of Chief Financial Officer
|
|
32.1
|
|
Section 1350 Certification of Chief Executive Officer
|
|
32.2
|
|
Section 1350 Certification of Chief Financial Officer
|
|
101.INS
|
|
XBRL Instance Document
|
|
101.SCH
|
|
XBRL Taxonomy Extension Schema Document
|
|
101.CAL
|
|
XBRL Taxonomy Extension Calculation Linkbase Document
|
|
101.DEF
|
|
XBRL Taxonomy Extension Definition Linkbase Document
|
|
101.LAB
|
|
XBRL Taxonomy Extension Label Linkbase Document
|
|
101.PRE
|
|
XBRL Taxonomy Extension Presentation Linkbase Document
|
______________________________
|
*
|
Management compensatory contract, arrangement or plan required to be filed as an exhibit pursuant to Item 15(b) of this report.
|
125
TABLE OF CONTENTS
Part IItem 1. BusinessItem 1A. Risk FactorsItem 1B. Unresolved Staff CommentsItem 2. PropertiesItem 3. Legal ProceedingsItem 4. Mine Safety DisclosuresPart IIItem 5. Market For Registrant S Common Equity, Related Stockholder Matters and Issuer Purchases Of Equity SecuritiesItem 6. Selected Financial DataItem 7. Management S Discussion and Analysis Of Financial Condition and Results Of OperationsItem 7A. Quantitative and Qualitative Disclosures About Market RiskItem 8. Financial Statements and Supplementary DataNote 1. The Company and Summary Of Significant Accounting PoliciesNote 2. Accumulated Other Comprehensive LossNote 3. Net Loss Per Share Of Common StockNote 4. Balance Sheet ComponentsNote 5. Fair Value Measurements Of Assets and LiabilitiesNote 6. Credit Facility and DebtNote 7. DivestitureNote 8. Goodwill and Identifiable Intangible AssetsNote 9. Restructuring ActivitiesNote 10. Stockholders EquityNote 11. Segment and Geographic InformationNote 12. Income TaxesNote 13. Commitments and ContingenciesNote 14. Quarterly Financial Data (unaudited)Item 9. Changes in and Disagreements with Accountants on Accounting and Financial DisclosureItem 9A. Controls and ProceduresItem 9B. Other InformationPart IIIItem 10. Directors, Executive Officers and Corporate GovernanceItem 11. Executive CompensationItem 12. Security Ownership Of Certain Beneficial Owners and Management and Related Stockholder MattersItem 13. Certain Relationships and Related Transactions, and Director IndependenceItem 14. Principal Accountant Fees and ServicesPart IVItem 15. Exhibits and Financial Statement Schedules